
| 2023-12-31 | 2023-09-30 | 2023-06-30 | 2023-03-31 | 2022-12-31 | 2022-09-30 | 2022-06-30 | 2022-03-31 | 2021-12-31 | 2021-09-30 | 2021-06-30 | 2021-03-31 | 2020-12-31 | 2020-09-30 | 2020-06-30 | 2020-03-31 | 2019-12-31 | 2019-09-30 | ||
|---|---|---|---|---|---|---|---|---|---|---|---|---|---|---|---|---|---|---|---|
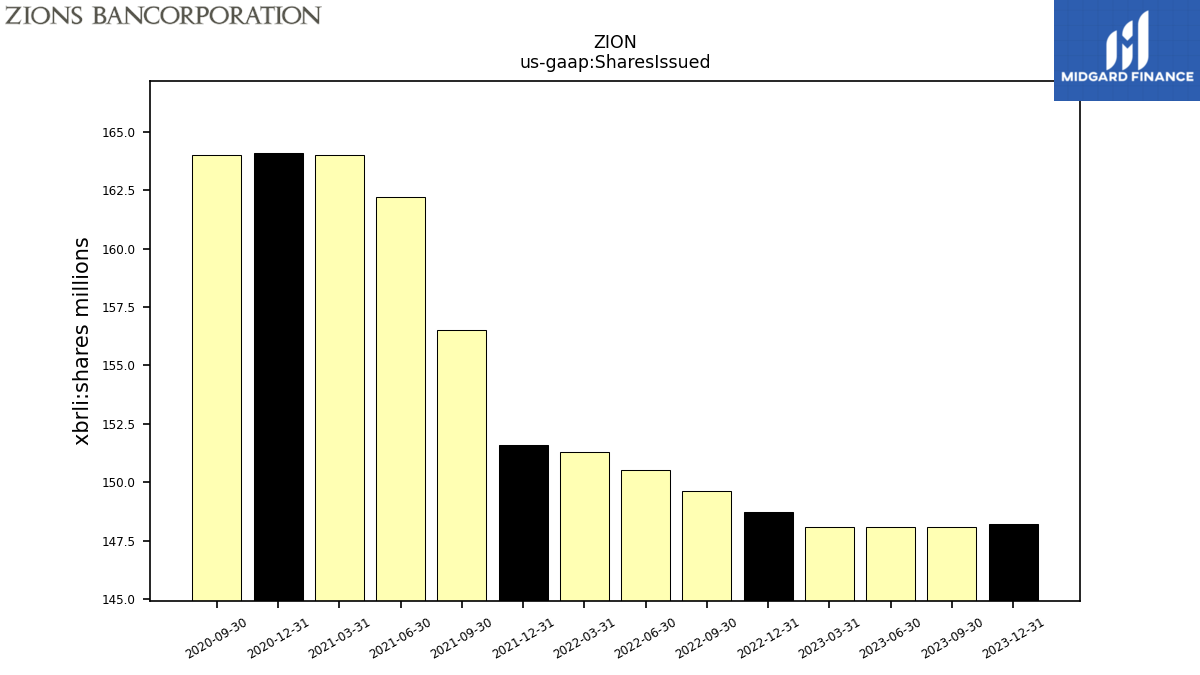
| Shares Issued | 148.20 | 148.10 | 148.10 | 148.10 | 148.70 | 149.60 | 150.50 | 151.30 | 151.60 | 156.50 | 162.20 | 164.00 | 164.10 | 164.00 | NA | NA | NA | NA | |
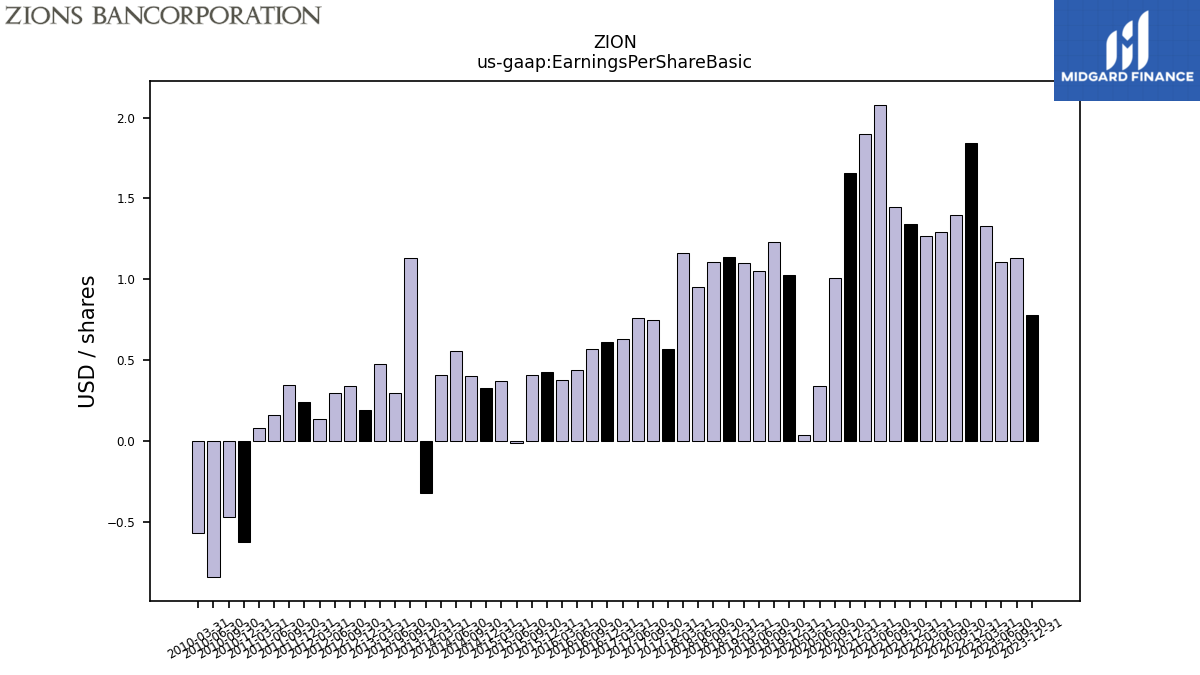
| Earnings Per Share Basic | 0.78 | 1.13 | 1.11 | 1.33 | 1.84 | 1.40 | 1.29 | 1.27 | 1.34 | 1.45 | 2.08 | 1.90 | 1.66 | 1.01 | 0.34 | 0.04 | 1.03 | 1.23 | |
| Earnings Per Share Diluted | 0.78 | 1.13 | 1.11 | 1.33 | 1.84 | 1.40 | 1.29 | 1.27 | 1.34 | 1.45 | 2.08 | 1.90 | 1.66 | 1.01 | 0.34 | 0.04 | 0.97 | 1.17 | |
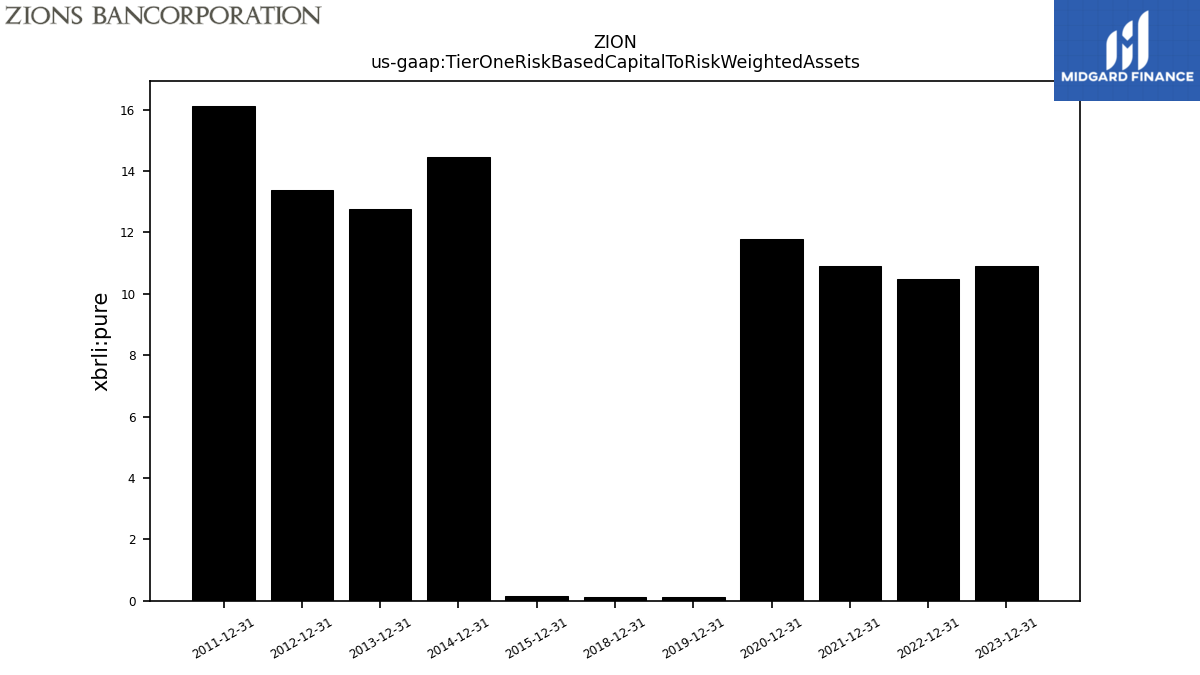
| Tier One Risk Based Capital To Risk Weighted Assets | 0.00 | NA | NA | NA | 0.00 | NA | NA | NA | 0.00 | NA | NA | NA | 0.00 | NA | NA | NA | 0.00 | NA | |
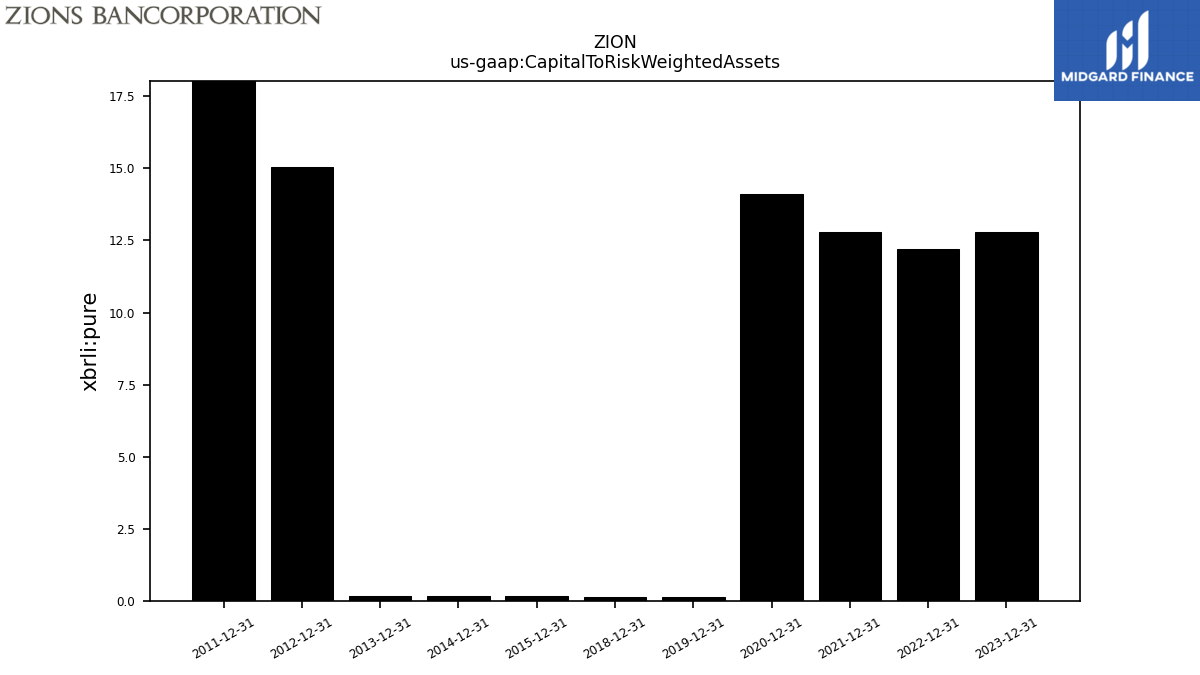
| Capital To Risk Weighted Assets | 0.00 | NA | NA | NA | 0.00 | NA | NA | NA | 0.00 | NA | NA | NA | 0.00 | NA | NA | NA | 0.00 | NA |
| 2023-12-31 | 2023-09-30 | 2023-06-30 | 2023-03-31 | 2022-12-31 | 2022-09-30 | 2022-06-30 | 2022-03-31 | 2021-12-31 | 2021-09-30 | 2021-06-30 | 2021-03-31 | 2020-12-31 | 2020-09-30 | 2020-06-30 | 2020-03-31 | 2019-12-31 | 2019-09-30 | ||
|---|---|---|---|---|---|---|---|---|---|---|---|---|---|---|---|---|---|---|---|
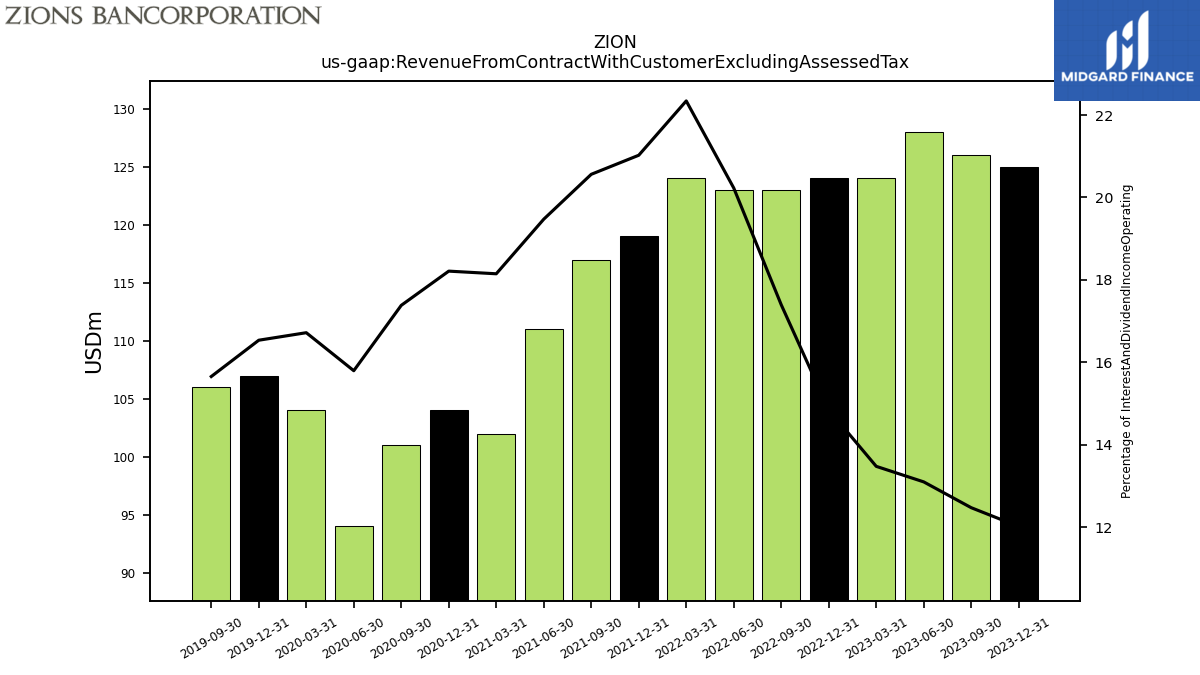
| Revenue From Contract With Customer Excluding Assessed Tax | 125.00 | 126.00 | 128.00 | 124.00 | 124.00 | 123.00 | 123.00 | 124.00 | 119.00 | 117.00 | 111.00 | 102.00 | 104.00 | 101.00 | 94.00 | 104.00 | 107.00 | 106.00 | |
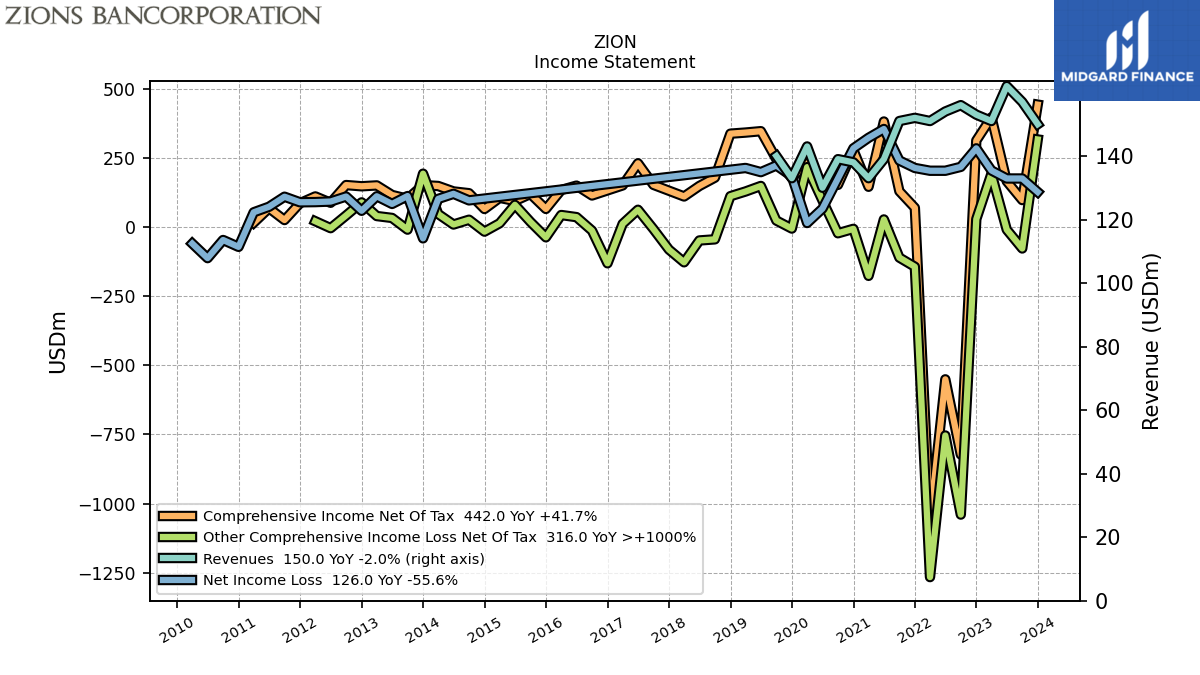
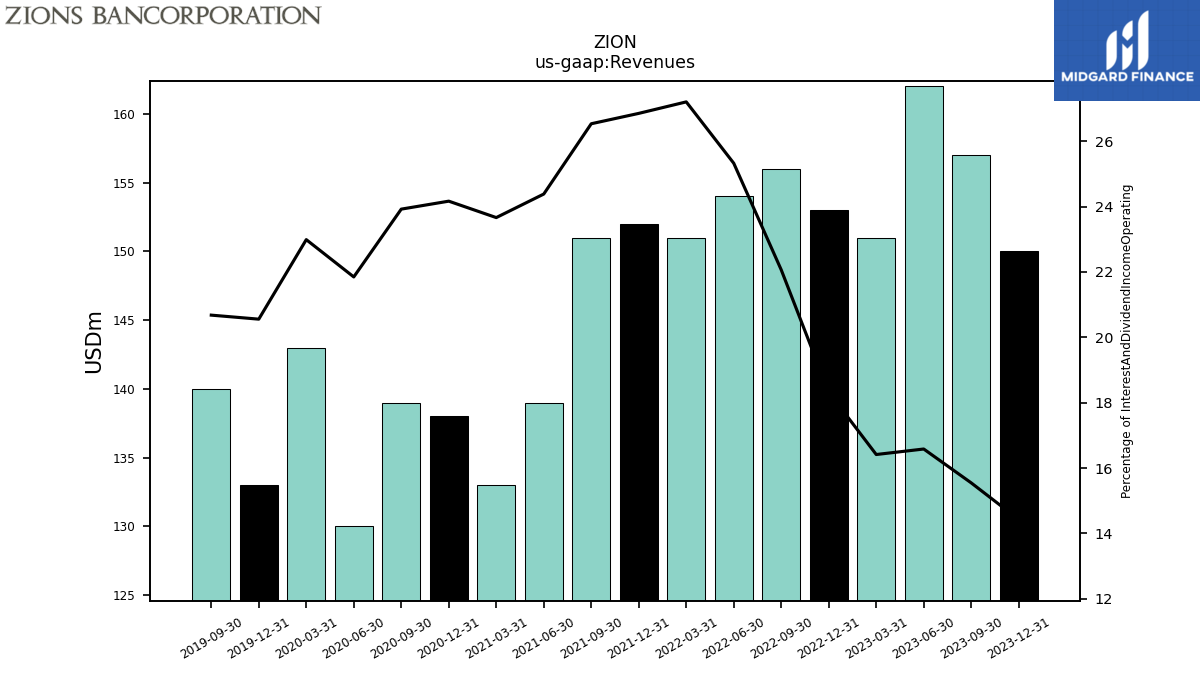
| Revenues | 150.00 | 157.00 | 162.00 | 151.00 | 153.00 | 156.00 | 154.00 | 151.00 | 152.00 | 151.00 | 139.00 | 133.00 | 138.00 | 139.00 | 130.00 | 143.00 | 133.00 | 140.00 | |
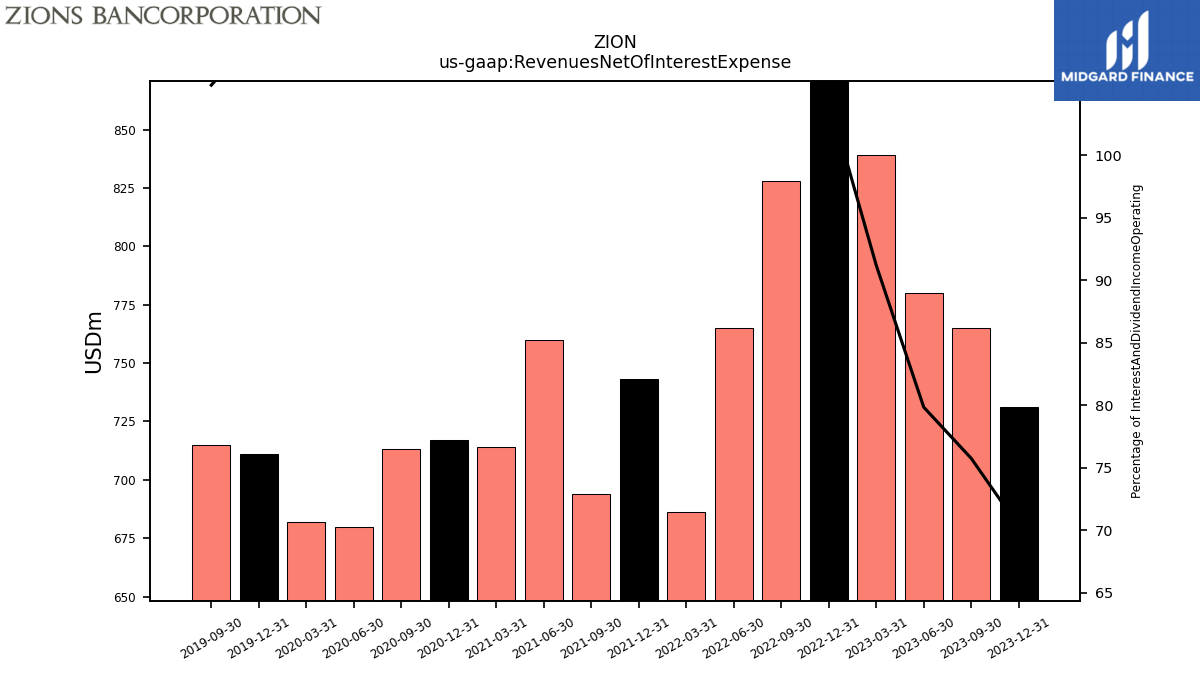
| Revenues Net Of Interest Expense | 731.00 | 765.00 | 780.00 | 839.00 | 873.00 | 828.00 | 765.00 | 686.00 | 743.00 | 694.00 | 760.00 | 714.00 | 717.00 | 713.00 | 680.00 | 682.00 | 711.00 | 715.00 | |
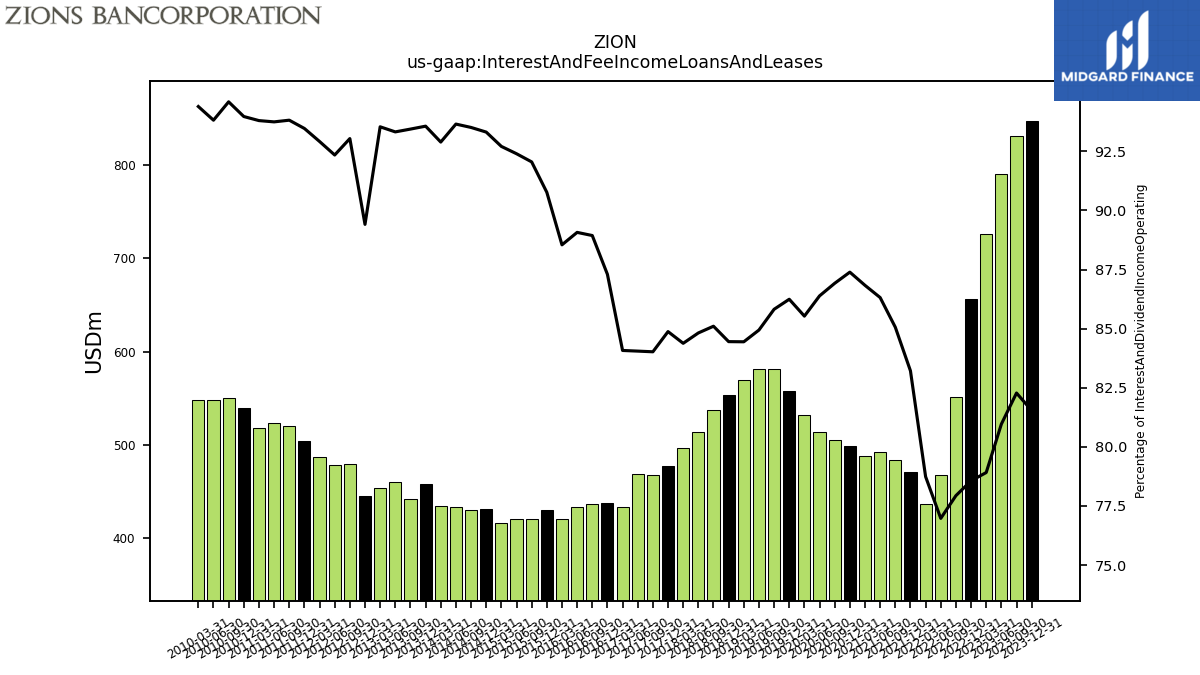
| Interest And Fee Income Loans And Leases | 848.00 | 831.00 | 791.00 | 726.00 | 656.00 | 551.00 | 468.00 | 437.00 | 471.00 | 484.00 | 492.00 | 488.00 | 499.00 | 505.00 | 514.00 | 532.00 | 558.00 | 581.00 | |
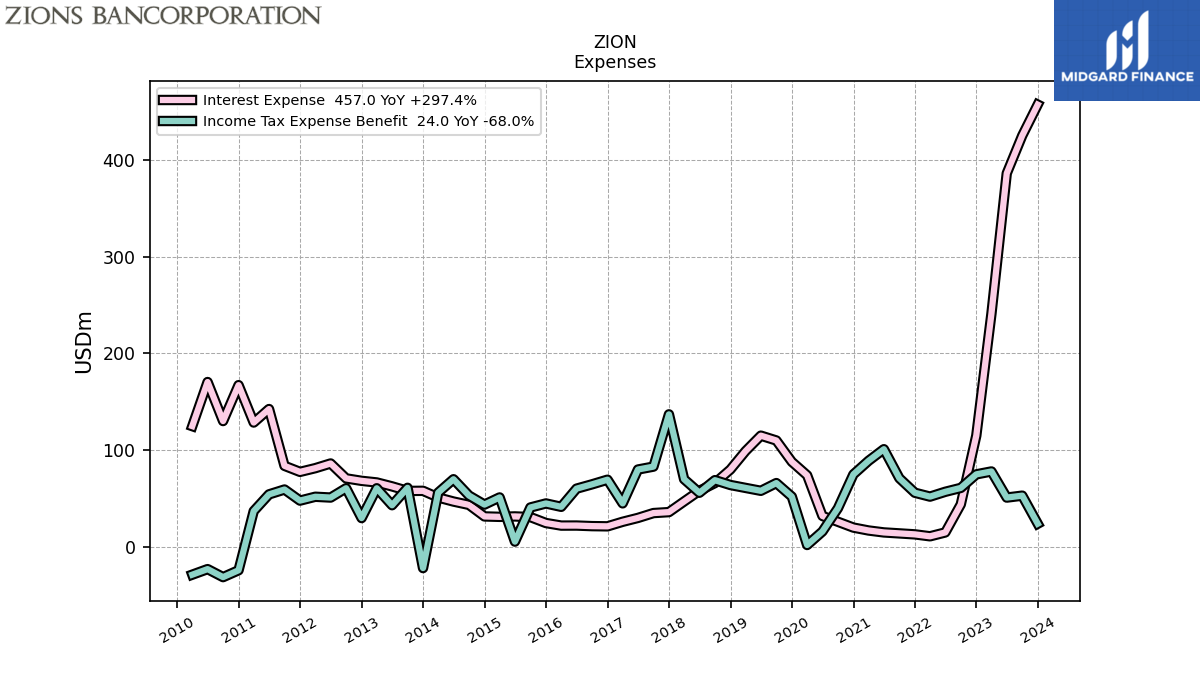
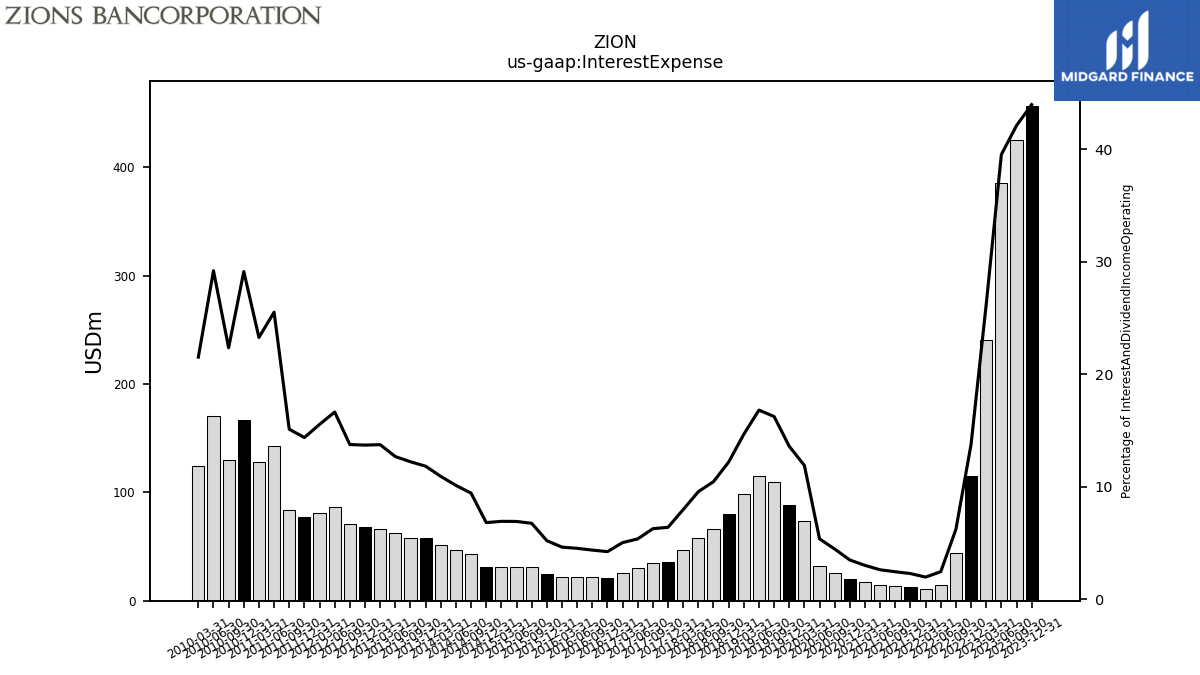
| Interest Expense | 457.00 | 425.00 | 386.00 | 241.00 | 115.00 | 44.00 | 15.00 | 11.00 | 13.00 | 14.00 | 15.00 | 17.00 | 20.00 | 26.00 | 32.00 | 74.00 | 88.00 | 110.00 | |
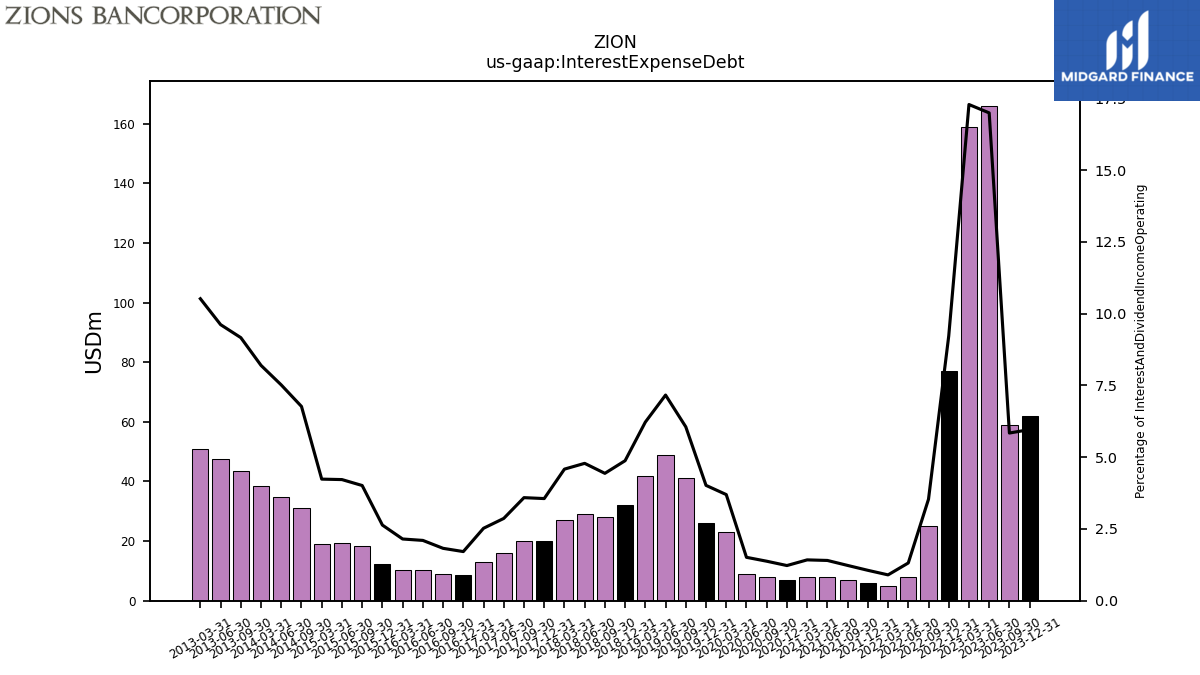
| Interest Expense Debt | 62.00 | 59.00 | 166.00 | 159.00 | 77.00 | 25.00 | 8.00 | 5.00 | 6.00 | 7.00 | 8.00 | 8.00 | 7.00 | 8.00 | 9.00 | 23.00 | 26.00 | 41.00 | |
| Interest Income Expense Net | 583.00 | 585.00 | 591.00 | 679.00 | 720.00 | 663.00 | 593.00 | 544.00 | 553.00 | 555.00 | 555.00 | 545.00 | 550.00 | 555.00 | 563.00 | 548.00 | 559.00 | 567.00 | |
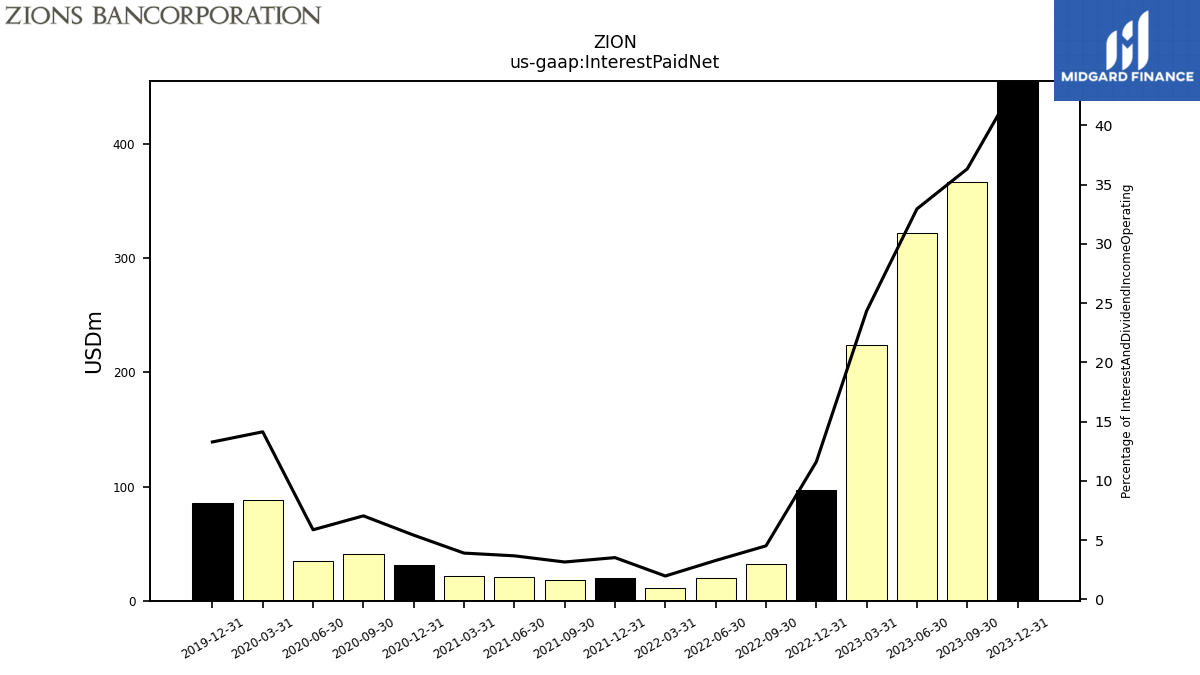
| Interest Paid Net | 455.00 | 367.00 | 322.00 | 224.00 | 97.00 | 32.00 | 20.00 | 11.00 | 20.00 | 18.00 | 21.00 | 22.00 | 31.00 | 41.00 | 35.00 | 88.00 | 86.00 | NA | |
| Income Loss From Continuing Operations Before Income Taxes Domestic | 150.00 | 228.00 | 226.00 | 282.00 | 359.00 | 278.00 | 260.00 | 255.00 | 269.00 | 311.00 | 455.00 | 411.00 | 359.00 | 215.00 | 82.00 | 16.00 | 235.00 | 288.00 | |
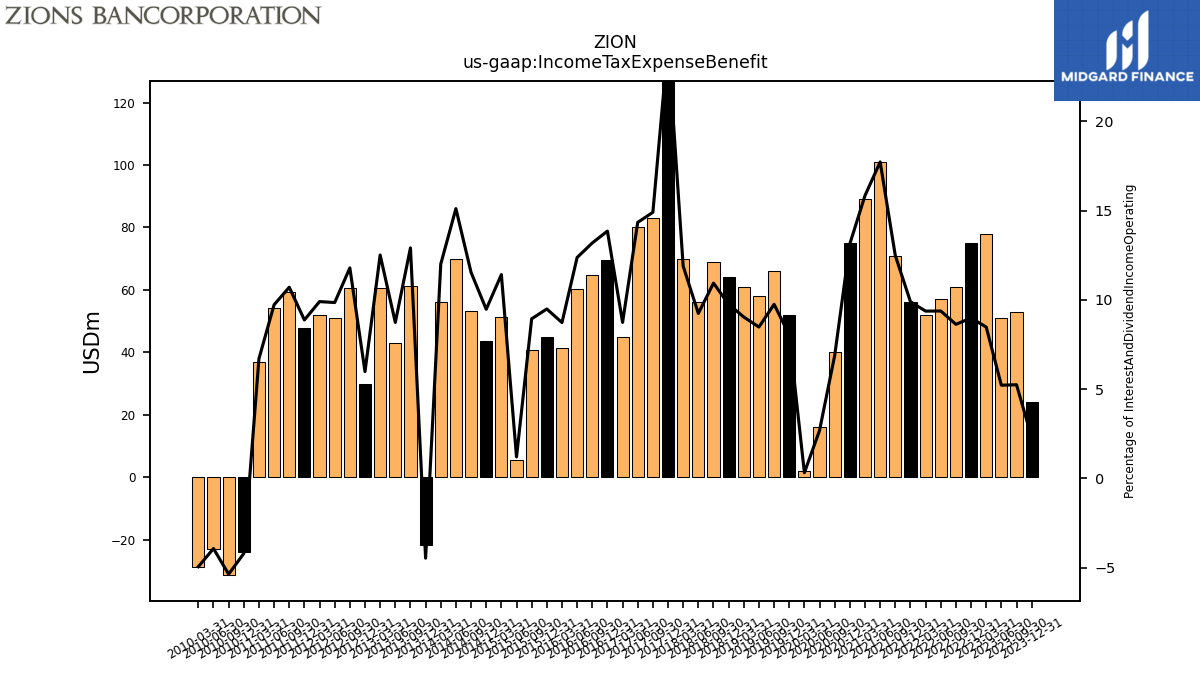
| Income Tax Expense Benefit | 24.00 | 53.00 | 51.00 | 78.00 | 75.00 | 61.00 | 57.00 | 52.00 | 56.00 | 71.00 | 101.00 | 89.00 | 75.00 | 40.00 | 16.00 | 2.00 | 52.00 | 66.00 | |
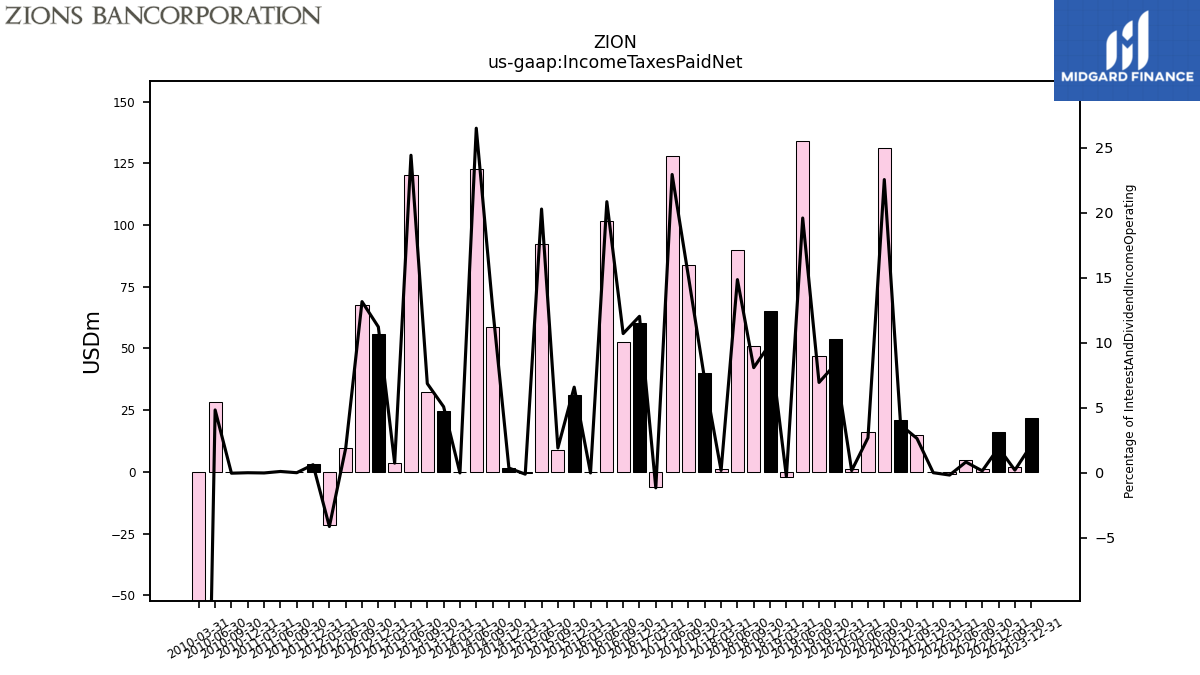
| Income Taxes Paid Net | 22.00 | 2.00 | NA | NA | 16.00 | 1.00 | 5.00 | -1.00 | 0.00 | 15.00 | NA | NA | 21.00 | 131.00 | 16.00 | 1.00 | 54.00 | 47.00 | |
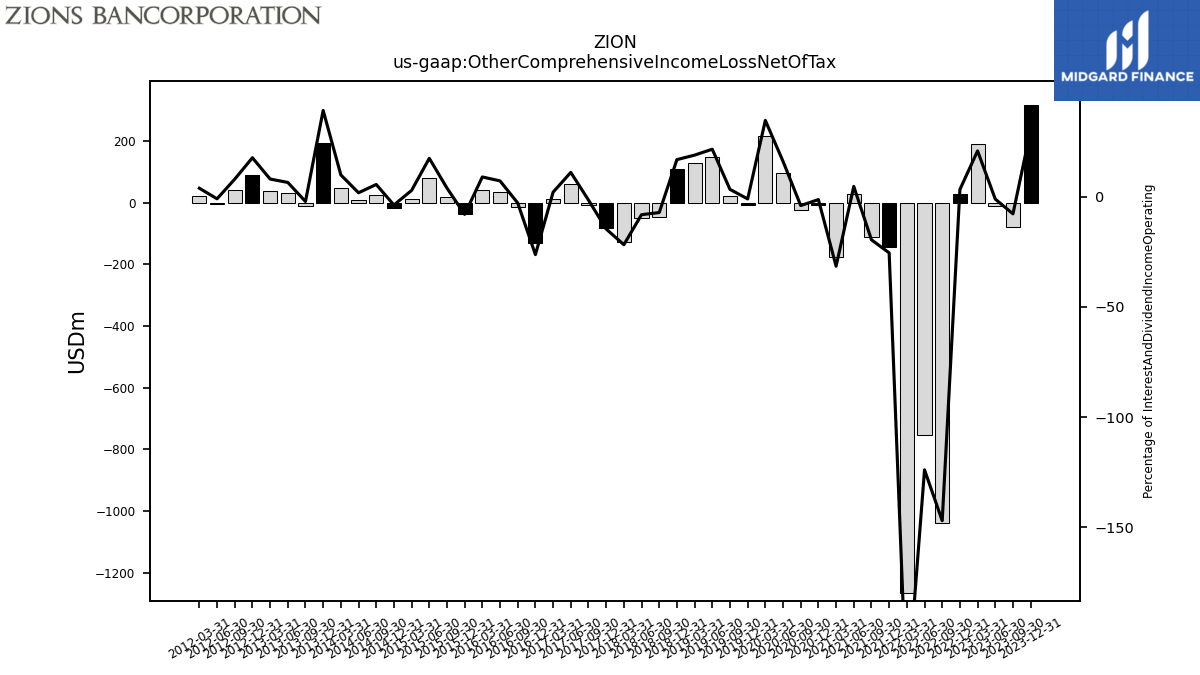
| Other Comprehensive Income Loss Net Of Tax | 316.00 | -78.00 | -10.00 | 192.00 | 28.00 | -1040.00 | -754.00 | -1266.00 | -144.00 | -111.00 | 27.00 | -177.00 | -7.00 | -23.00 | 96.00 | 216.00 | -6.00 | 23.00 | |
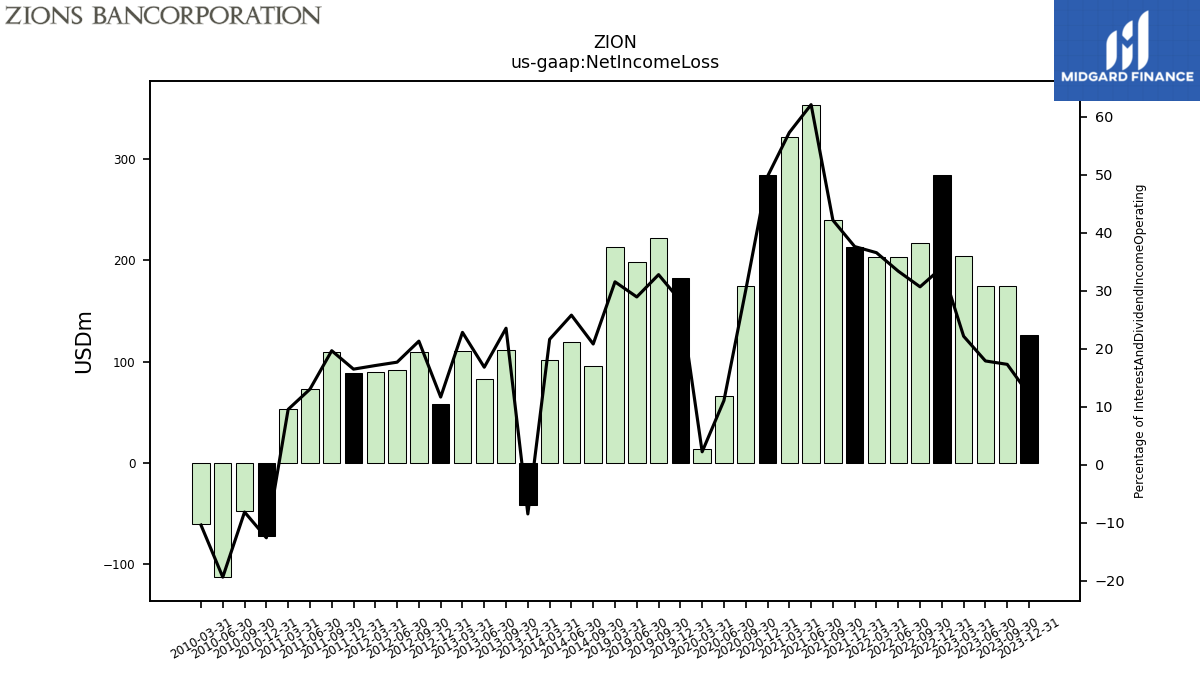
| Net Income Loss | 126.00 | 175.00 | 175.00 | 204.00 | 284.00 | 217.00 | 203.00 | 203.00 | 213.00 | 240.00 | 354.00 | 322.00 | 284.00 | 175.00 | 66.00 | 14.00 | 183.00 | 222.00 | |
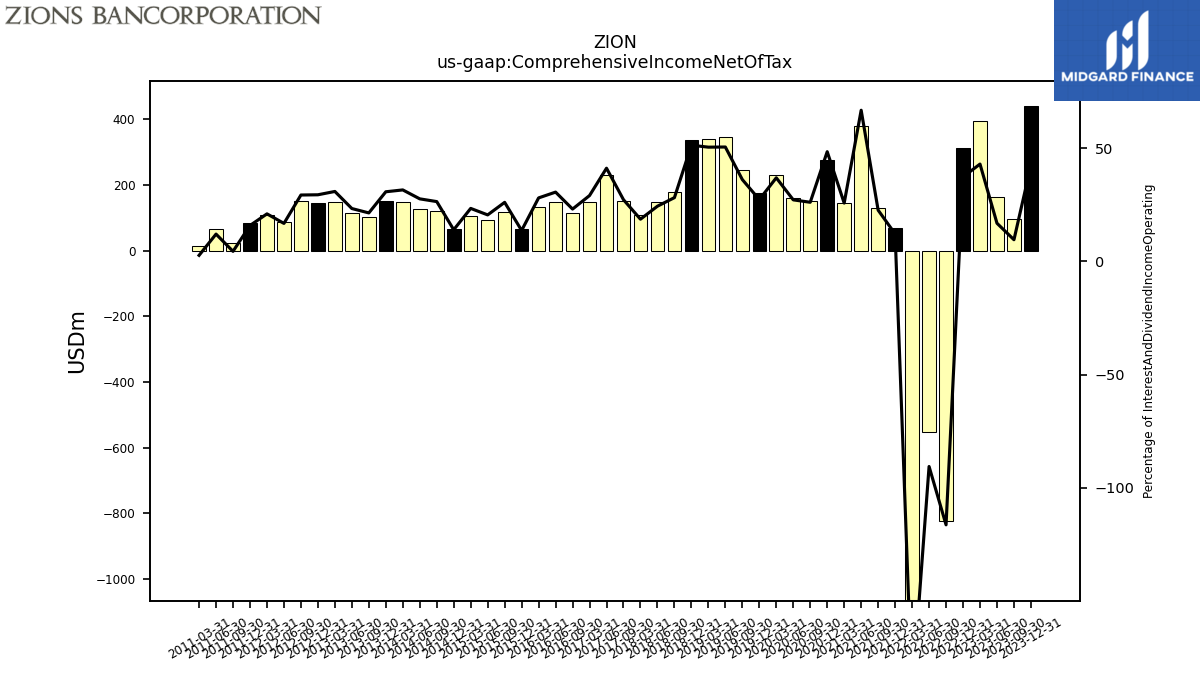
| Comprehensive Income Net Of Tax | 442.00 | 97.00 | 165.00 | 396.00 | 312.00 | -823.00 | -551.00 | -1063.00 | 69.00 | 129.00 | 381.00 | 145.00 | 277.00 | 152.00 | 162.00 | 230.00 | 177.00 | 245.00 | |
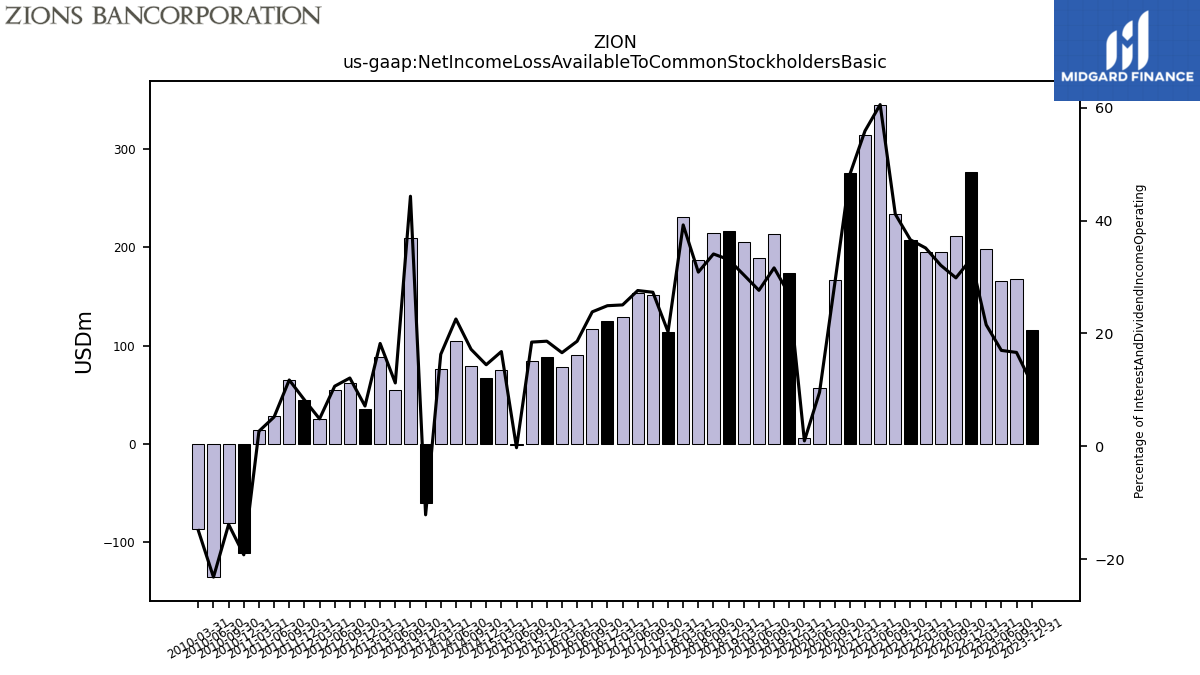
| Net Income Loss Available To Common Stockholders Basic | 116.00 | 168.00 | 166.00 | 198.00 | 277.00 | 211.00 | 195.00 | 195.00 | 207.00 | 234.00 | 345.00 | 314.00 | 275.00 | 167.00 | 57.00 | 6.00 | 174.00 | 214.00 | |
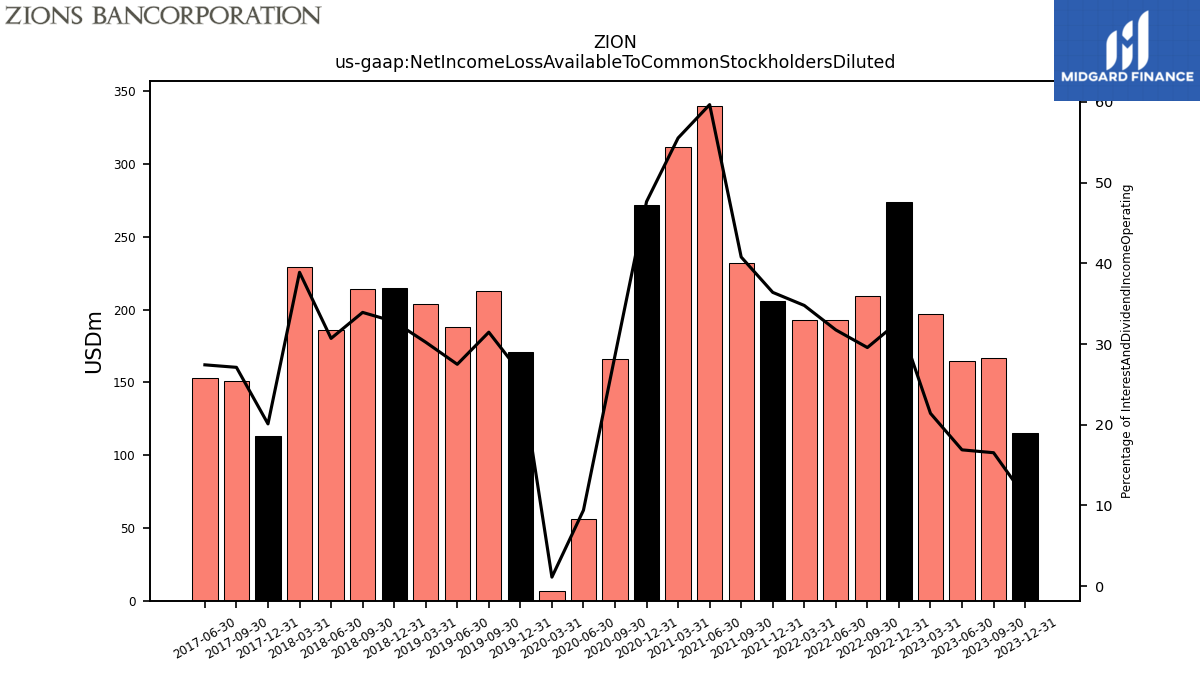
| Net Income Loss Available To Common Stockholders Diluted | 115.00 | 167.00 | 165.00 | 197.00 | 274.00 | 209.00 | 193.00 | 193.00 | 206.00 | 232.00 | 340.00 | 312.00 | 272.00 | 166.00 | 56.00 | 7.00 | 171.00 | 213.00 | |
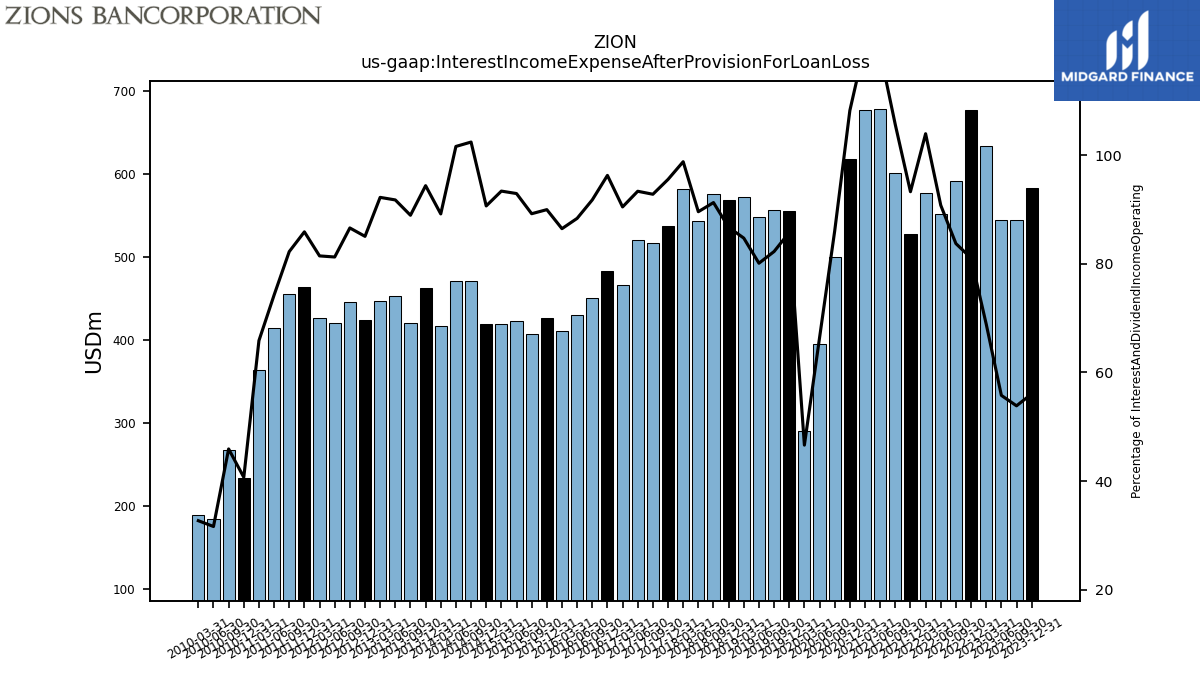
| Interest Income Expense After Provision For Loan Loss | 583.00 | 544.00 | 545.00 | 634.00 | 677.00 | 592.00 | 552.00 | 577.00 | 528.00 | 601.00 | 678.00 | 677.00 | 618.00 | 500.00 | 395.00 | 290.00 | 555.00 | 557.00 | |
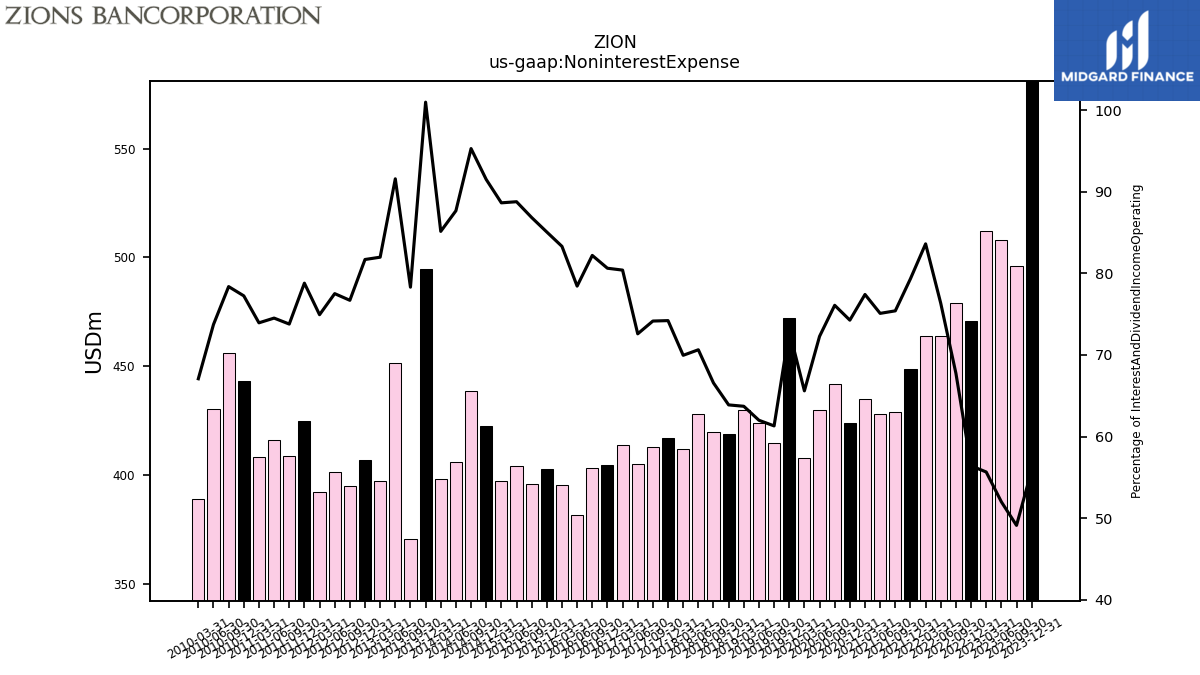
| Noninterest Expense | 581.00 | 496.00 | 508.00 | 512.00 | 471.00 | 479.00 | 464.00 | 464.00 | 449.00 | 429.00 | 428.00 | 435.00 | 424.00 | 442.00 | 430.00 | 408.00 | 472.00 | 415.00 | |
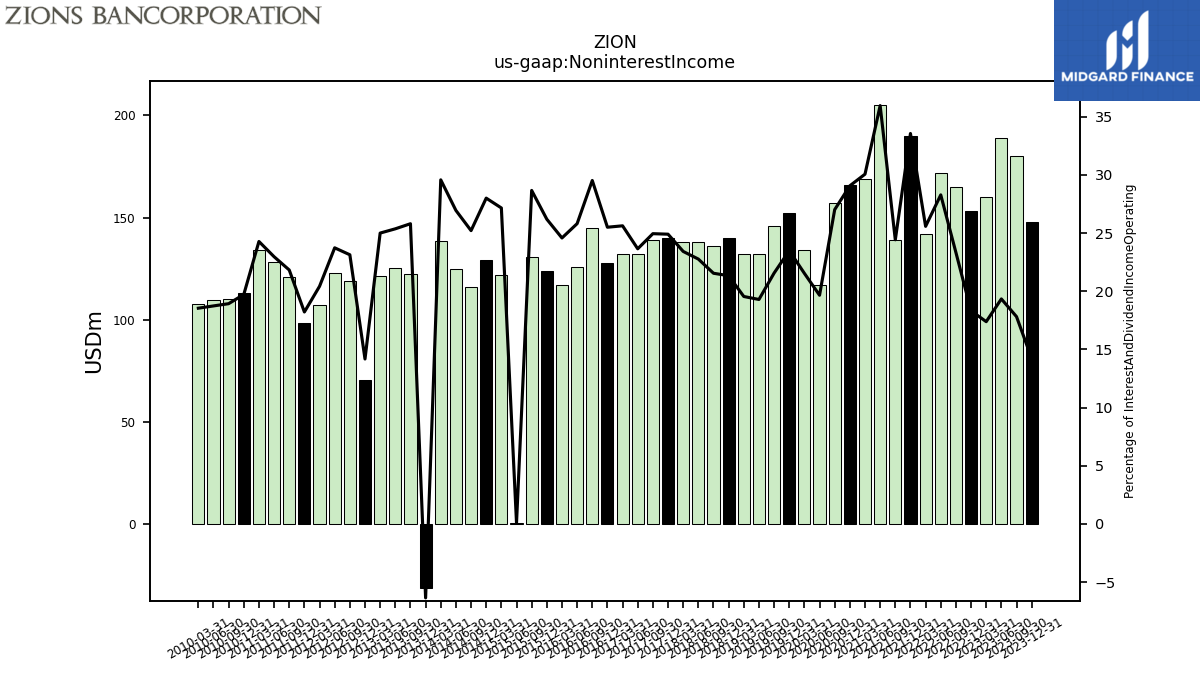
| Noninterest Income | 148.00 | 180.00 | 189.00 | 160.00 | 153.00 | 165.00 | 172.00 | 142.00 | 190.00 | 139.00 | 205.00 | 169.00 | 166.00 | 157.00 | 117.00 | 134.00 | 152.00 | 146.00 |
| 2023-12-31 | 2023-09-30 | 2023-06-30 | 2023-03-31 | 2022-12-31 | 2022-09-30 | 2022-06-30 | 2022-03-31 | 2021-12-31 | 2021-09-30 | 2021-06-30 | 2021-03-31 | 2020-12-31 | 2020-09-30 | 2020-06-30 | 2020-03-31 | 2019-12-31 | 2019-09-30 | ||
|---|---|---|---|---|---|---|---|---|---|---|---|---|---|---|---|---|---|---|---|
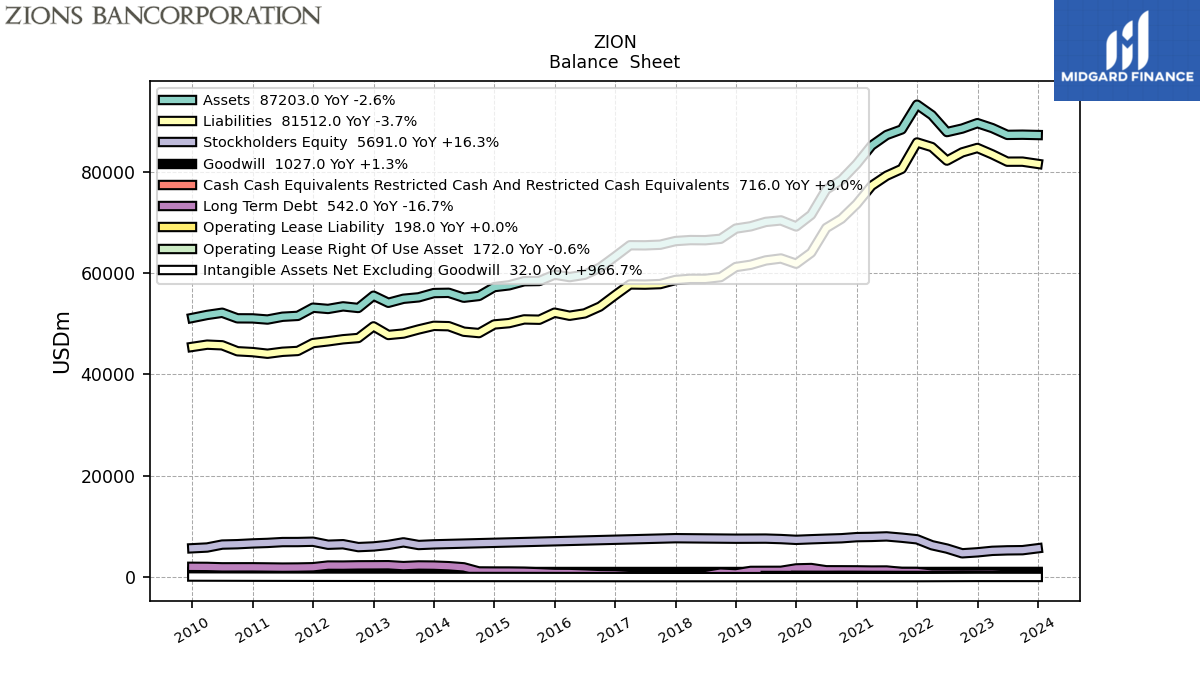
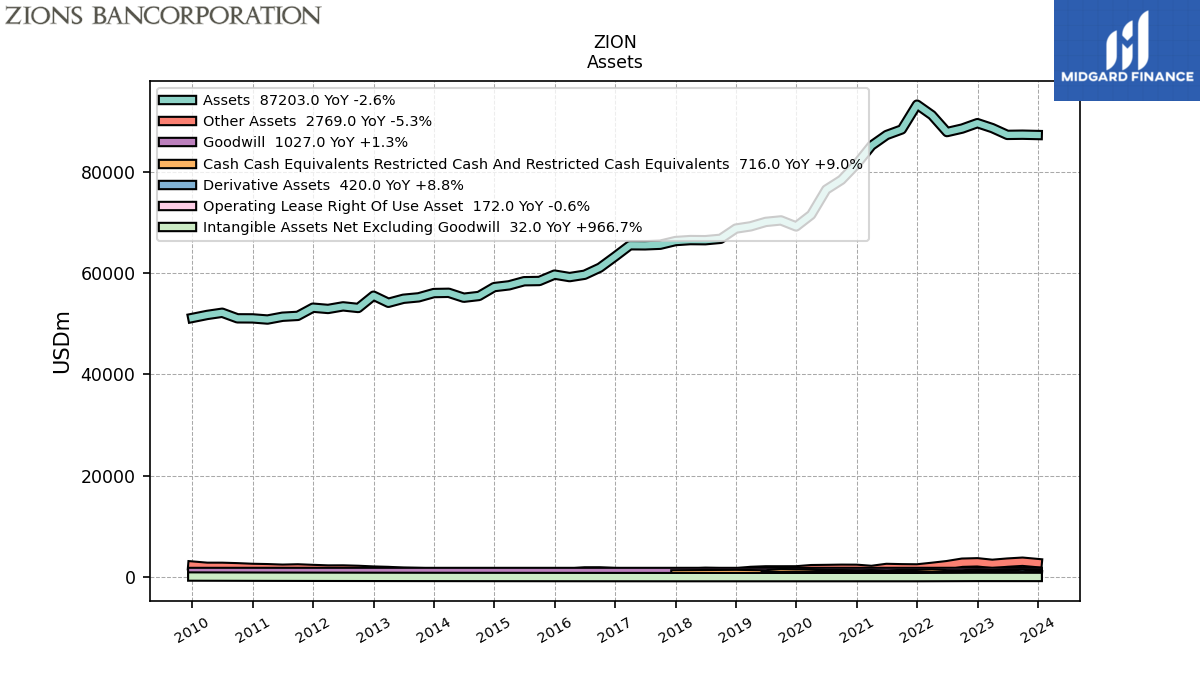
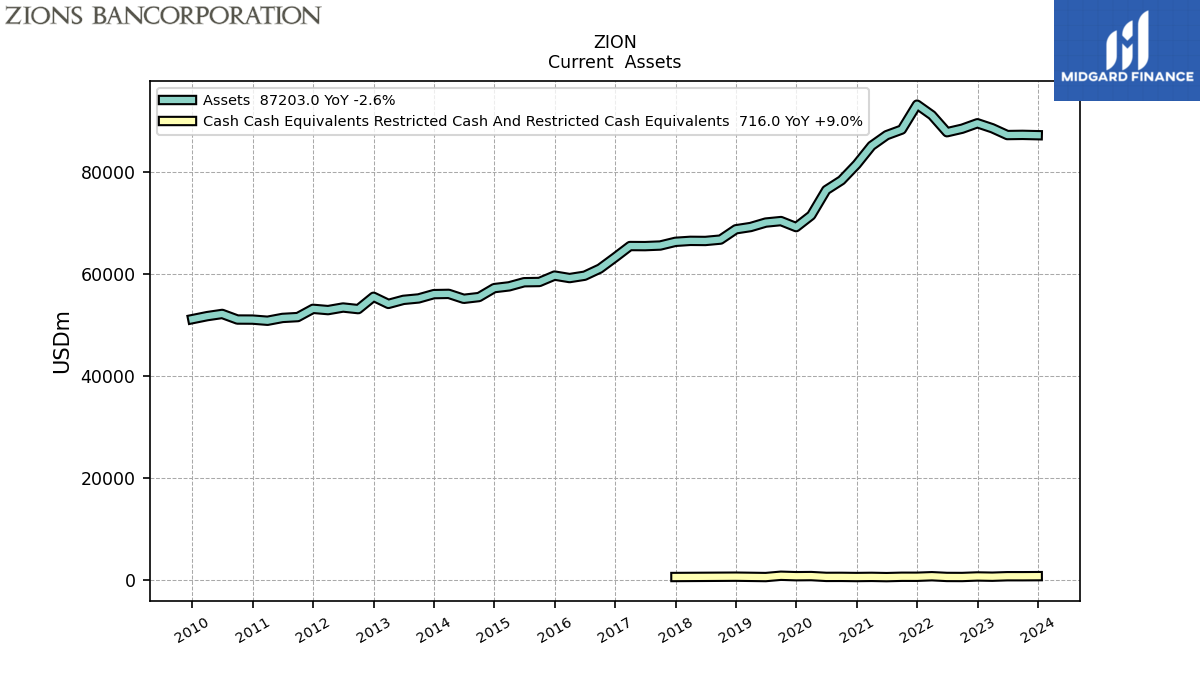
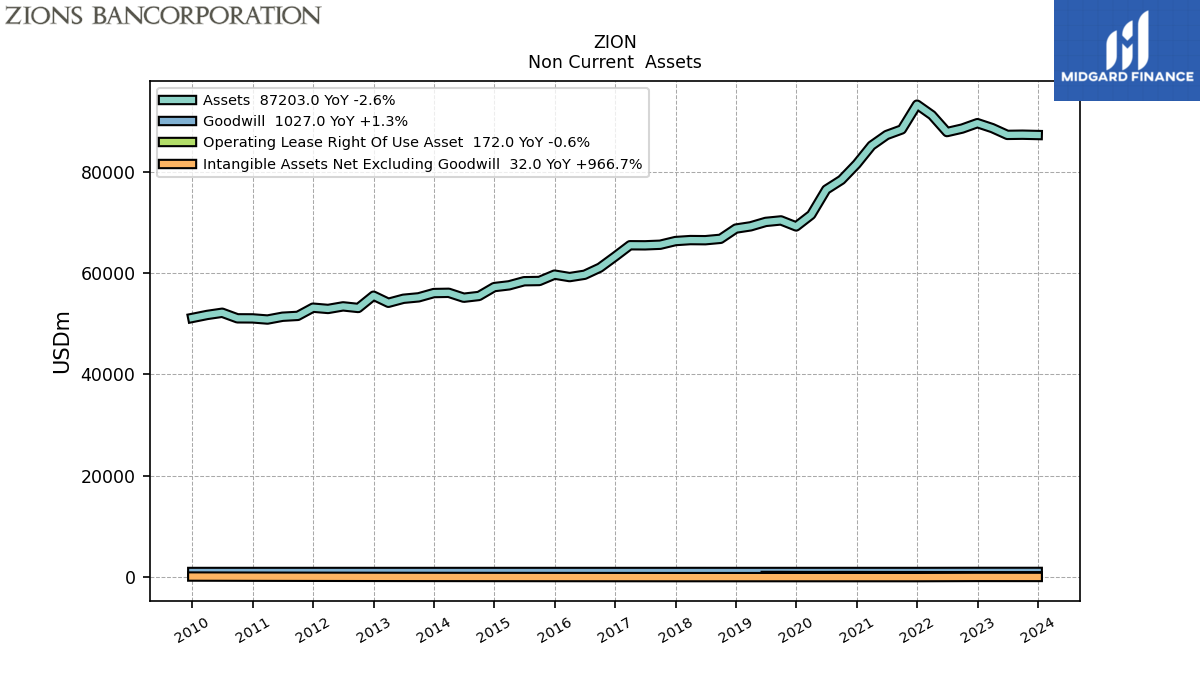
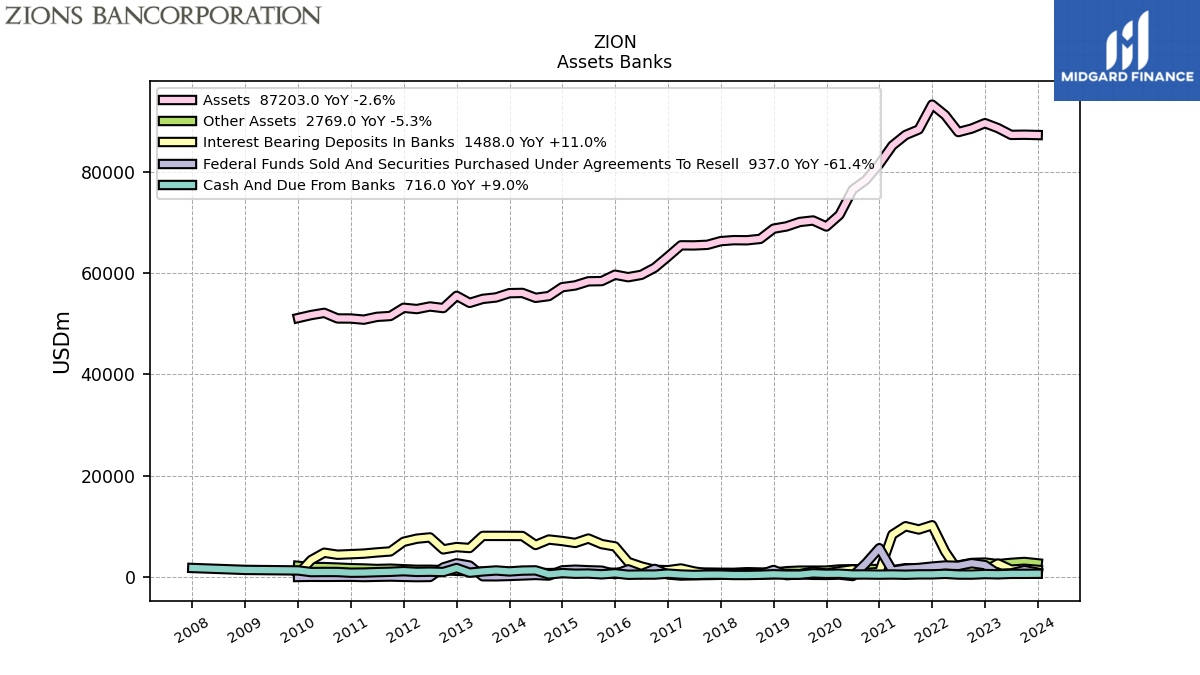
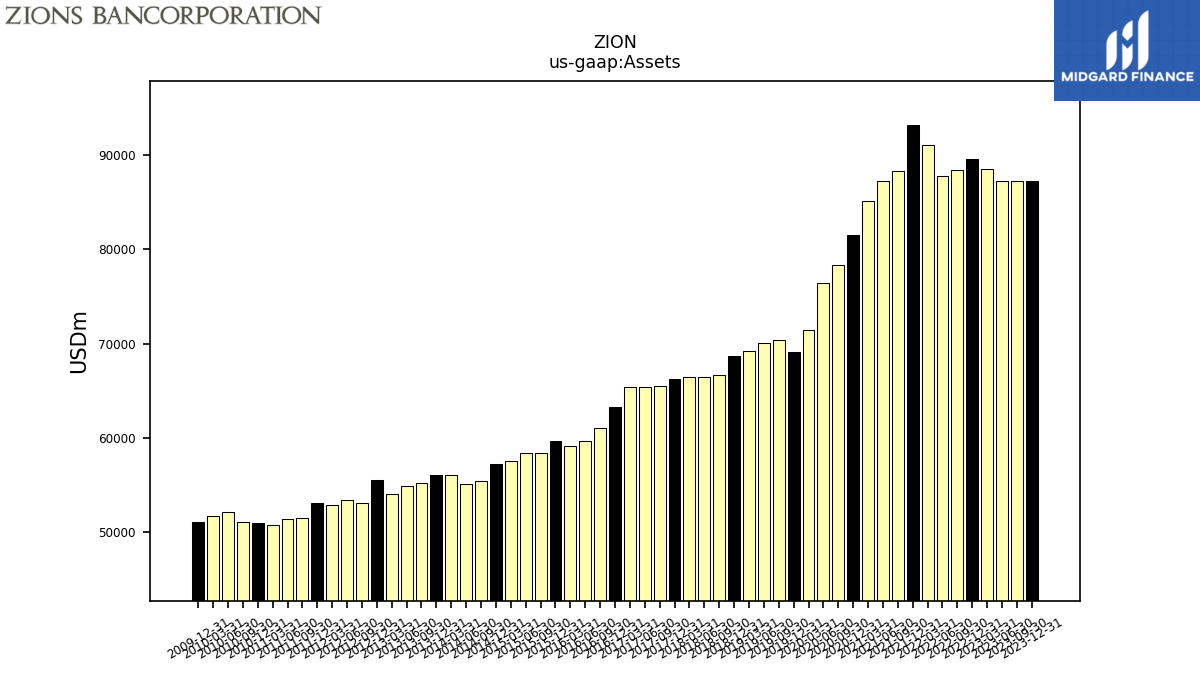
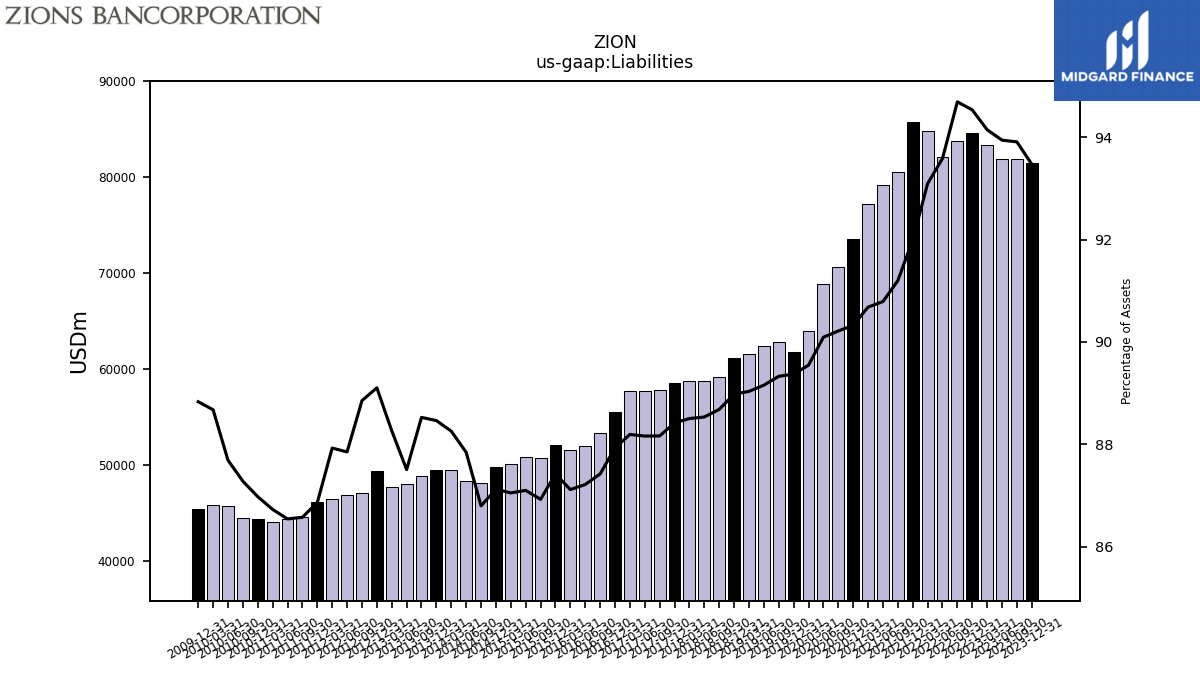
| Assets | 87203.00 | 87269.00 | 87230.00 | 88573.00 | 89545.00 | 88474.00 | 87784.00 | 91126.00 | 93200.00 | 88306.00 | 87208.00 | 85121.00 | 81479.00 | 78357.00 | 76447.00 | 71467.00 | 69172.00 | 70361.00 | |
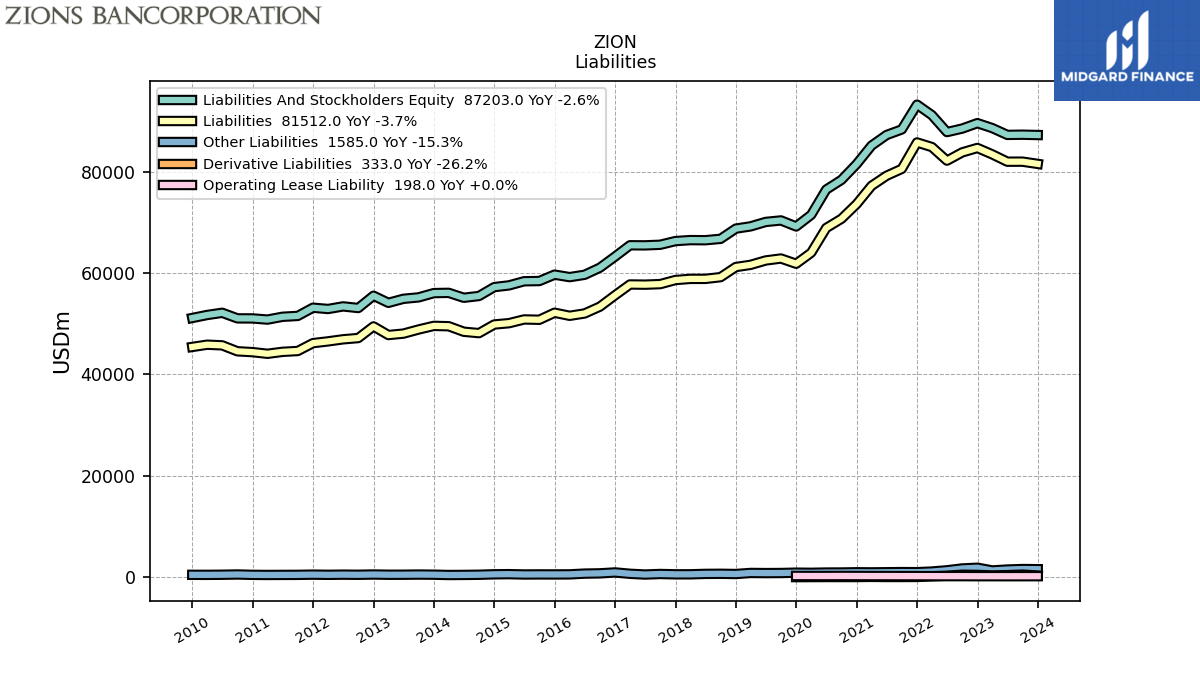
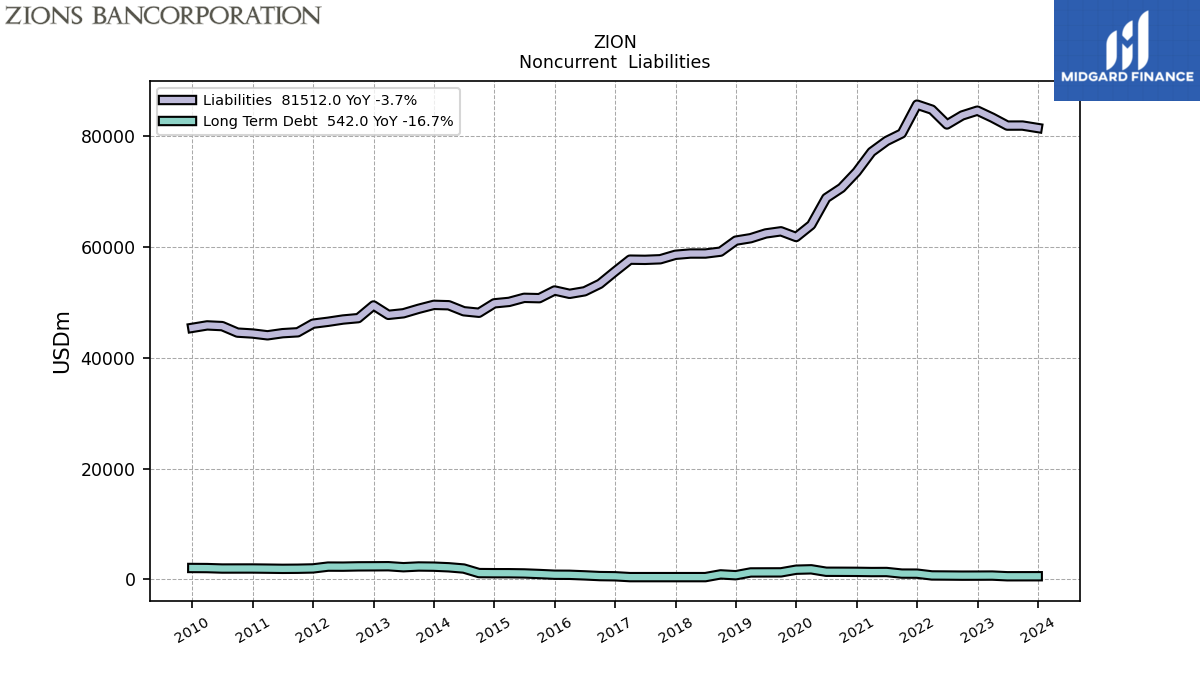
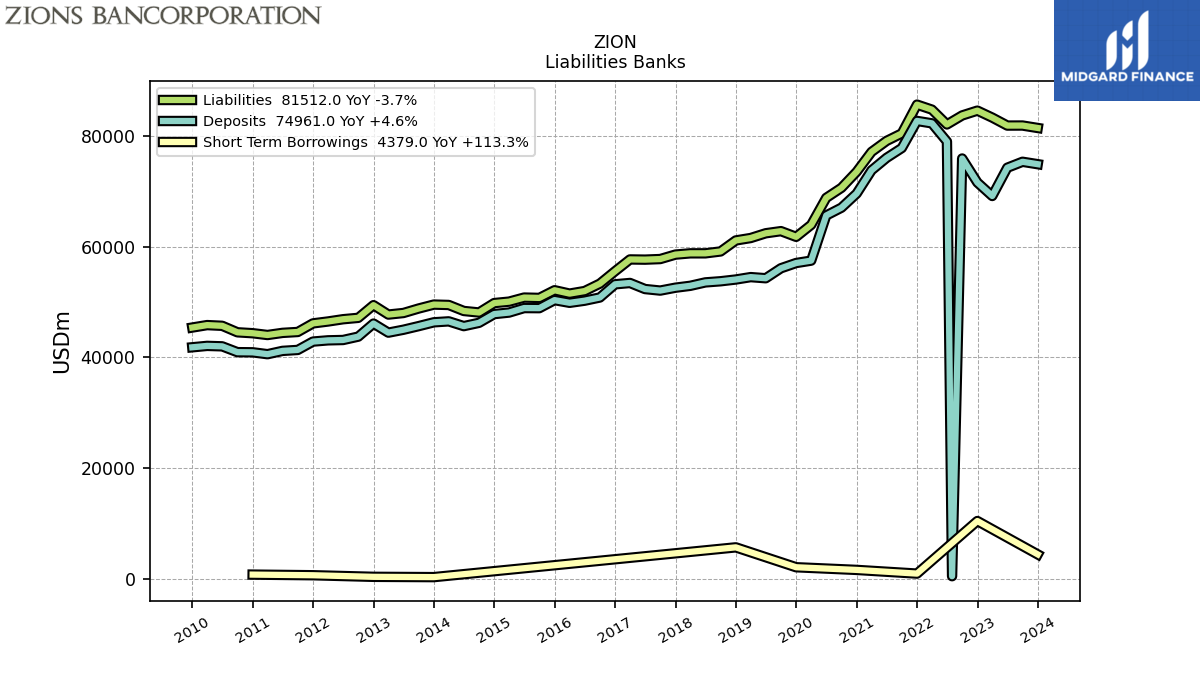
| Liabilities | 81512.00 | 81954.00 | 81947.00 | 83389.00 | 84652.00 | 83778.00 | 82152.00 | 84832.00 | 85737.00 | 80532.00 | 79175.00 | 77188.00 | 73593.00 | 70689.00 | 68872.00 | 63995.00 | 61819.00 | 62852.00 | |
| Liabilities And Stockholders Equity | 87203.00 | 87269.00 | 87230.00 | 88573.00 | 89545.00 | 88474.00 | 87784.00 | 91126.00 | 93200.00 | 88306.00 | 87208.00 | 85121.00 | 81479.00 | 78357.00 | 76447.00 | 71467.00 | 69172.00 | 70361.00 | |
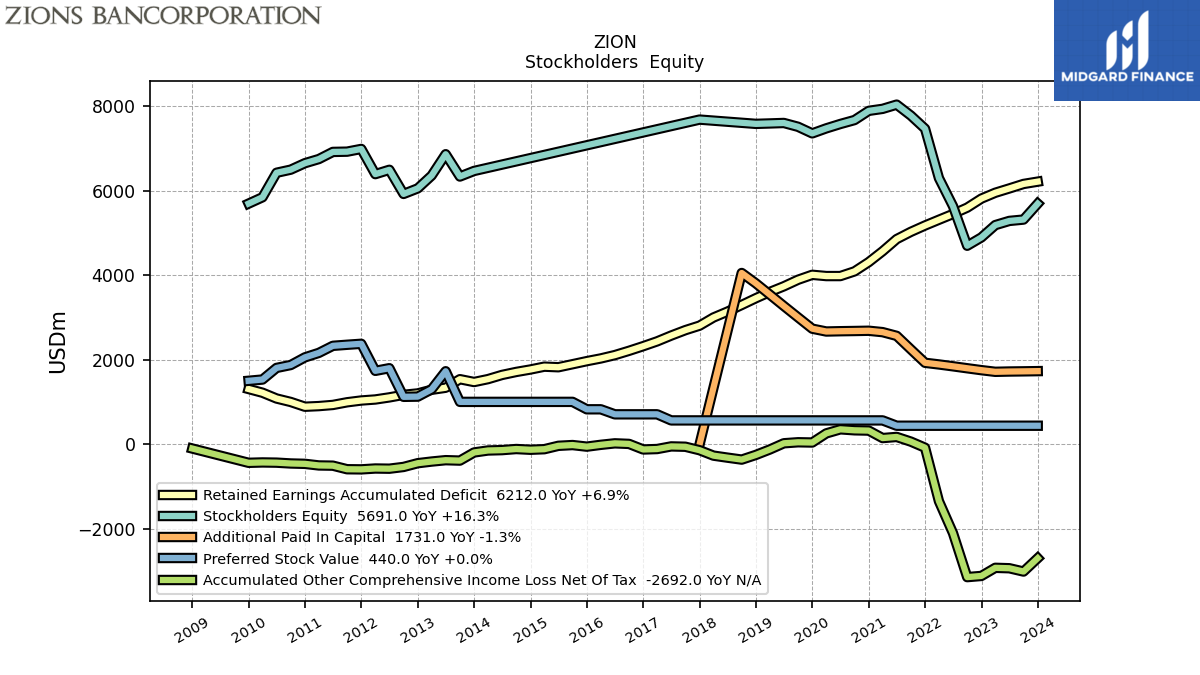
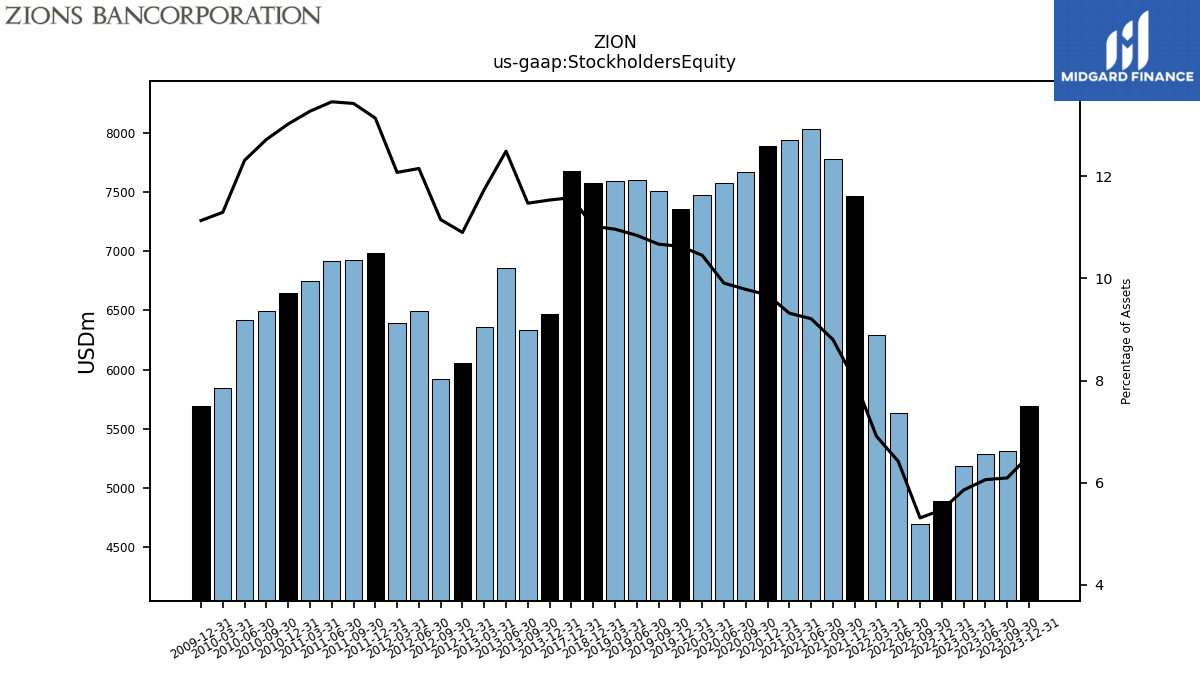
| Stockholders Equity | 5691.00 | 5315.00 | 5283.00 | 5184.00 | 4893.00 | 4696.00 | 5632.00 | 6294.00 | 7463.00 | 7774.00 | 8033.00 | 7933.00 | 7886.00 | 7668.00 | 7575.00 | 7472.00 | 7353.00 | 7509.00 | |
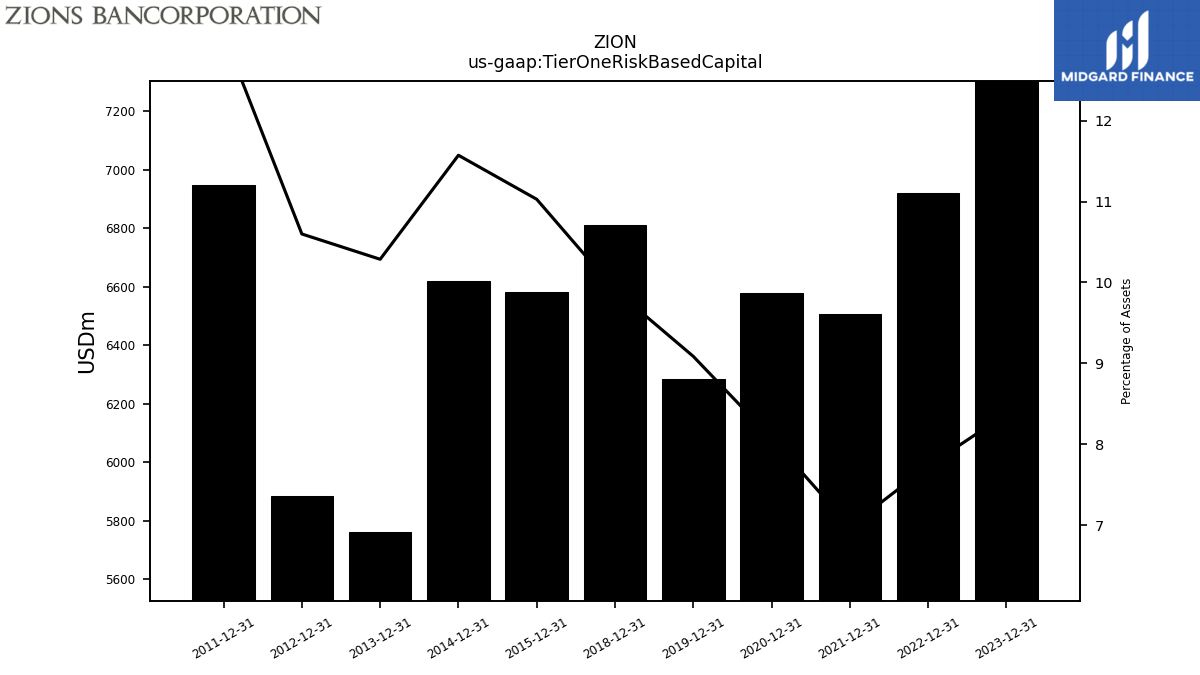
| Tier One Risk Based Capital | 7303.00 | NA | NA | NA | 6921.00 | NA | NA | NA | 6508.00 | NA | NA | NA | 6579.00 | NA | NA | NA | 6285.00 | NA |
| 2023-12-31 | 2023-09-30 | 2023-06-30 | 2023-03-31 | 2022-12-31 | 2022-09-30 | 2022-06-30 | 2022-03-31 | 2021-12-31 | 2021-09-30 | 2021-06-30 | 2021-03-31 | 2020-12-31 | 2020-09-30 | 2020-06-30 | 2020-03-31 | 2019-12-31 | 2019-09-30 | ||
|---|---|---|---|---|---|---|---|---|---|---|---|---|---|---|---|---|---|---|---|
| Cash Cash Equivalents Restricted Cash And Restricted Cash Equivalents | 716.00 | 700.00 | 701.00 | 607.00 | 657.00 | 549.00 | 559.00 | 700.00 | 595.00 | 597.00 | 525.00 | 576.00 | 543.00 | 576.00 | 570.00 | 730.00 | 705.00 | 796.00 | |
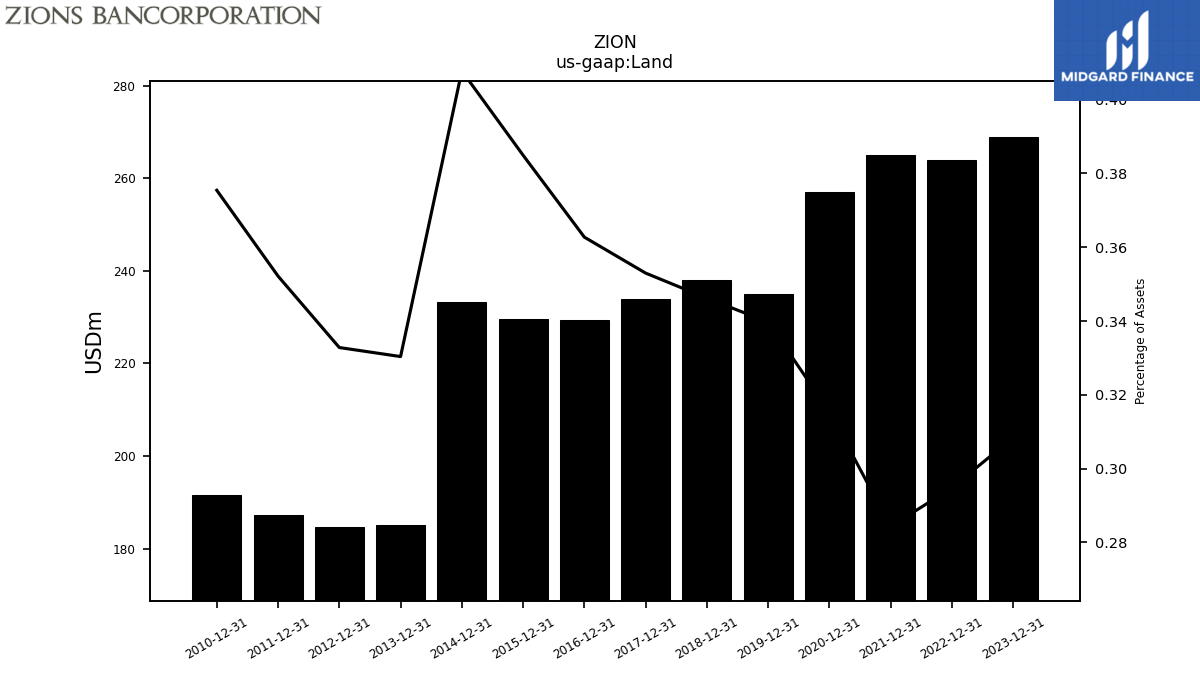
| Land | 269.00 | NA | NA | NA | 264.00 | NA | NA | NA | 265.00 | NA | NA | NA | 257.00 | NA | NA | NA | 235.00 | NA |
| 2023-12-31 | 2023-09-30 | 2023-06-30 | 2023-03-31 | 2022-12-31 | 2022-09-30 | 2022-06-30 | 2022-03-31 | 2021-12-31 | 2021-09-30 | 2021-06-30 | 2021-03-31 | 2020-12-31 | 2020-09-30 | 2020-06-30 | 2020-03-31 | 2019-12-31 | 2019-09-30 | ||
|---|---|---|---|---|---|---|---|---|---|---|---|---|---|---|---|---|---|---|---|
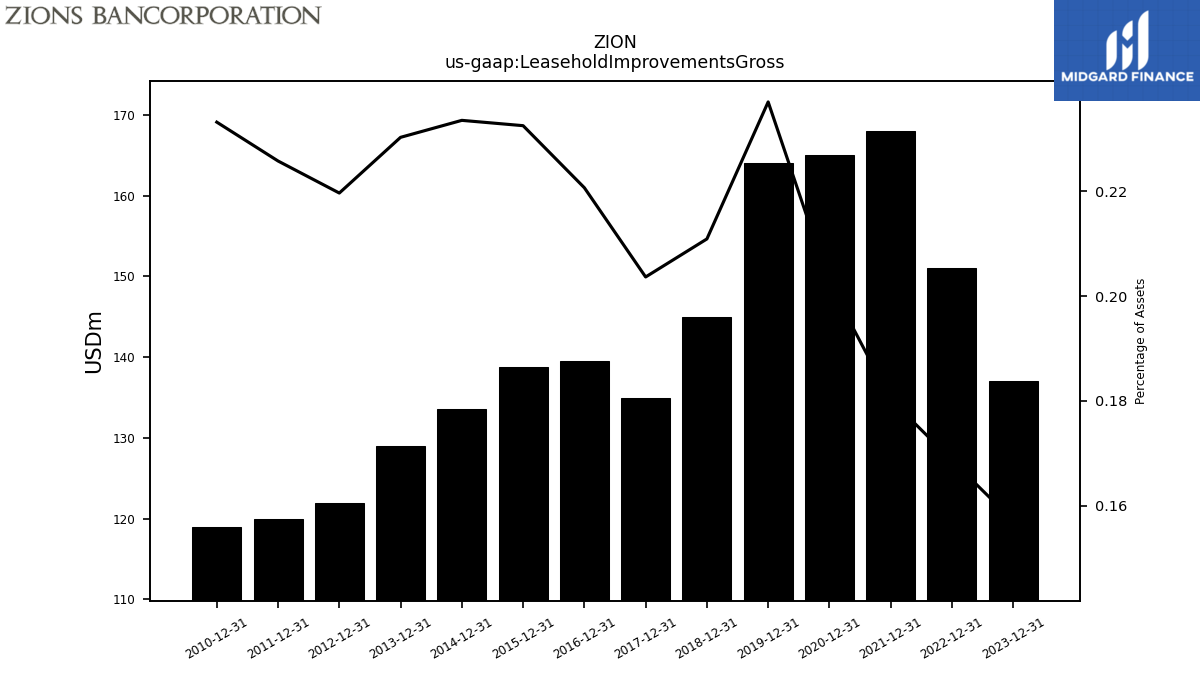
| Leasehold Improvements Gross | 137.00 | NA | NA | NA | 151.00 | NA | NA | NA | 168.00 | NA | NA | NA | 165.00 | NA | NA | NA | 164.00 | NA | |
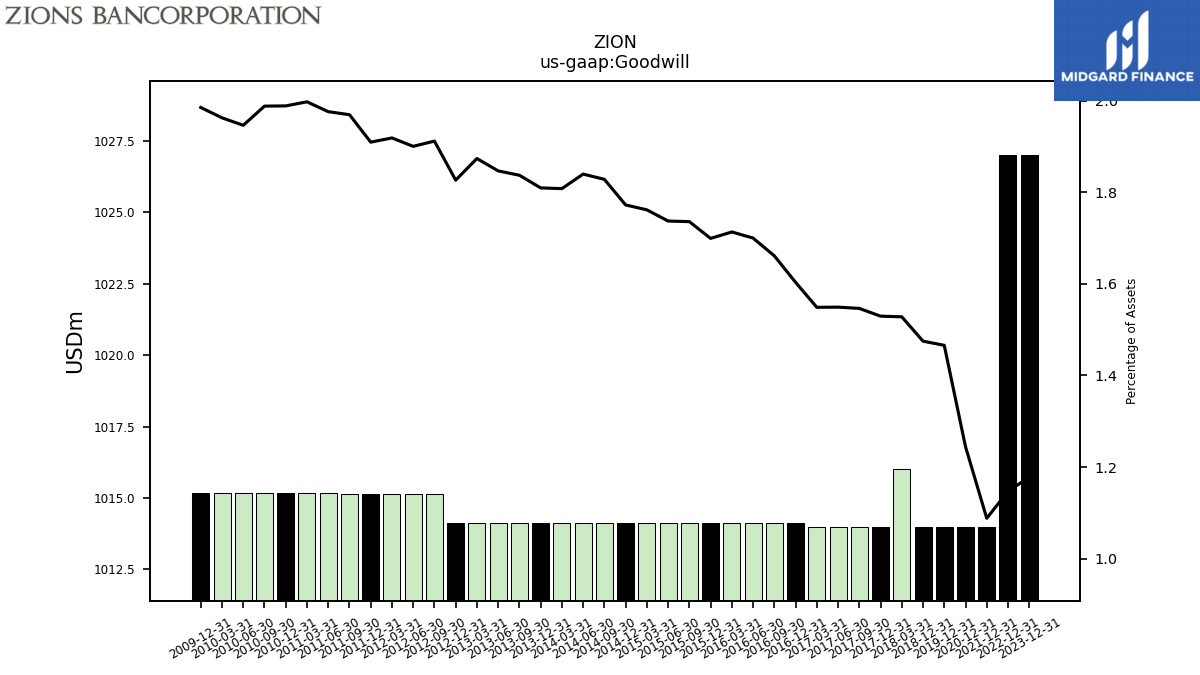
| Goodwill | 1027.00 | NA | NA | NA | 1027.00 | NA | NA | NA | 1014.00 | NA | NA | NA | 1014.00 | NA | NA | NA | 1014.00 | NA | |
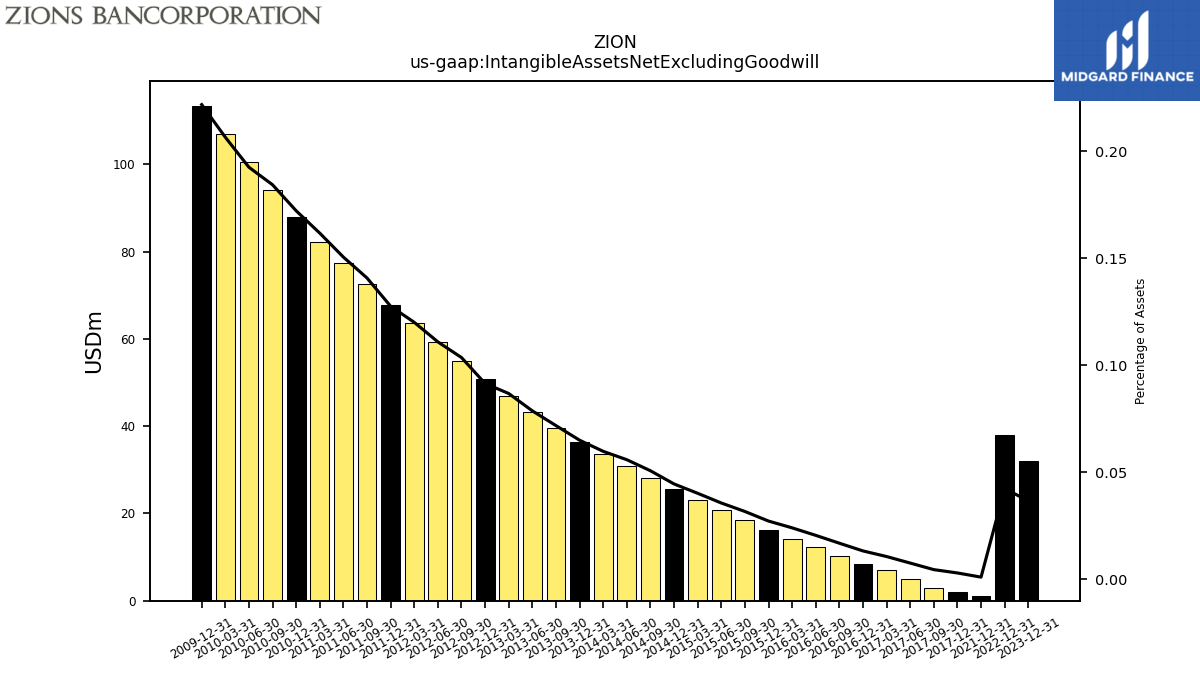
| Intangible Assets Net Excluding Goodwill | 32.00 | NA | NA | NA | 38.00 | NA | NA | NA | 1.00 | NA | NA | NA | NA | NA | NA | NA | NA | NA | |
| Intangible Assets Net Including Goodwill | 1059.00 | 1060.00 | 1062.00 | 1063.00 | 1065.00 | 1034.00 | 1015.00 | 1015.00 | 1015.00 | 1015.00 | 1015.00 | 1016.00 | 1016.00 | 1016.00 | 1014.00 | 1014.00 | 1014.00 | 1014.00 | |
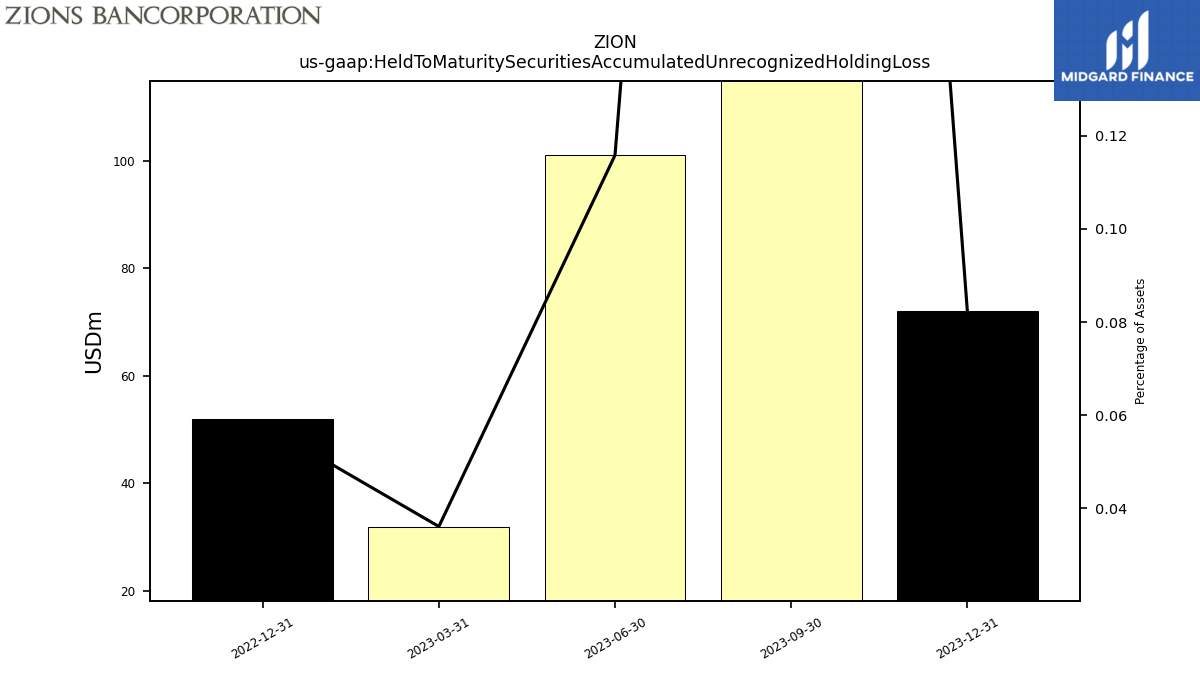
| Held To Maturity Securities Accumulated Unrecognized Holding Loss | 72.00 | 510.00 | 101.00 | 32.00 | 52.00 | NA | NA | NA | NA | NA | NA | NA | NA | NA | NA | NA | NA | NA | |
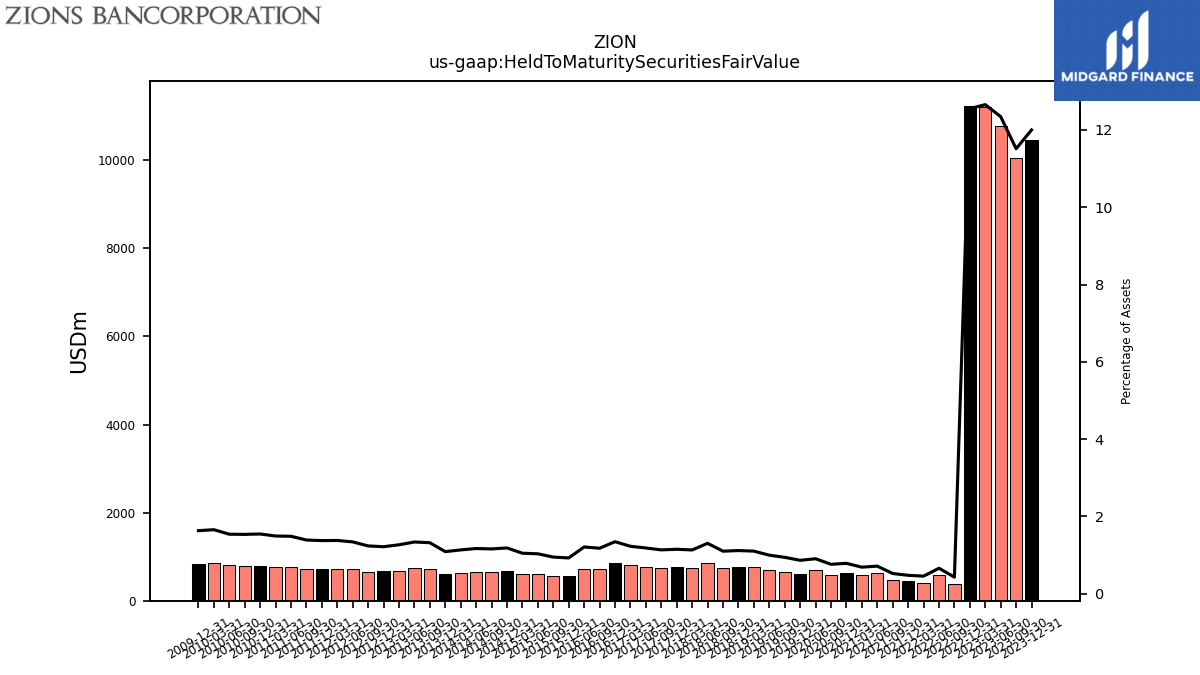
| Held To Maturity Securities Fair Value | 10466.00 | 10049.00 | 10768.00 | 11210.00 | 11239.00 | 379.00 | 578.00 | 414.00 | 443.00 | 461.00 | 622.00 | 584.00 | 640.00 | 596.00 | 691.00 | NA | 597.00 | 662.00 | |
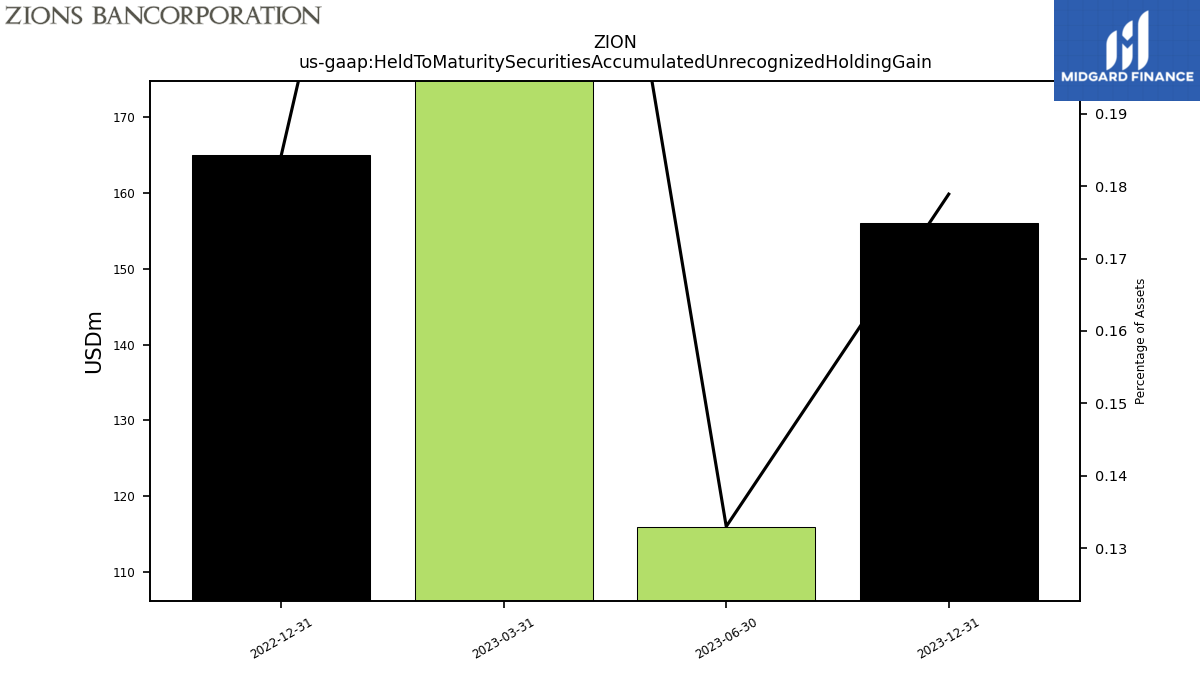
| Held To Maturity Securities Accumulated Unrecognized Holding Gain | 156.00 | NA | 116.00 | 281.00 | 165.00 | NA | NA | NA | NA | NA | NA | NA | NA | NA | NA | NA | NA | NA | |
| Held To Maturity Securities Accumulated Unrecognized Holding Loss | 72.00 | 510.00 | 101.00 | 32.00 | 52.00 | NA | NA | NA | NA | NA | NA | NA | NA | NA | NA | NA | NA | NA | |
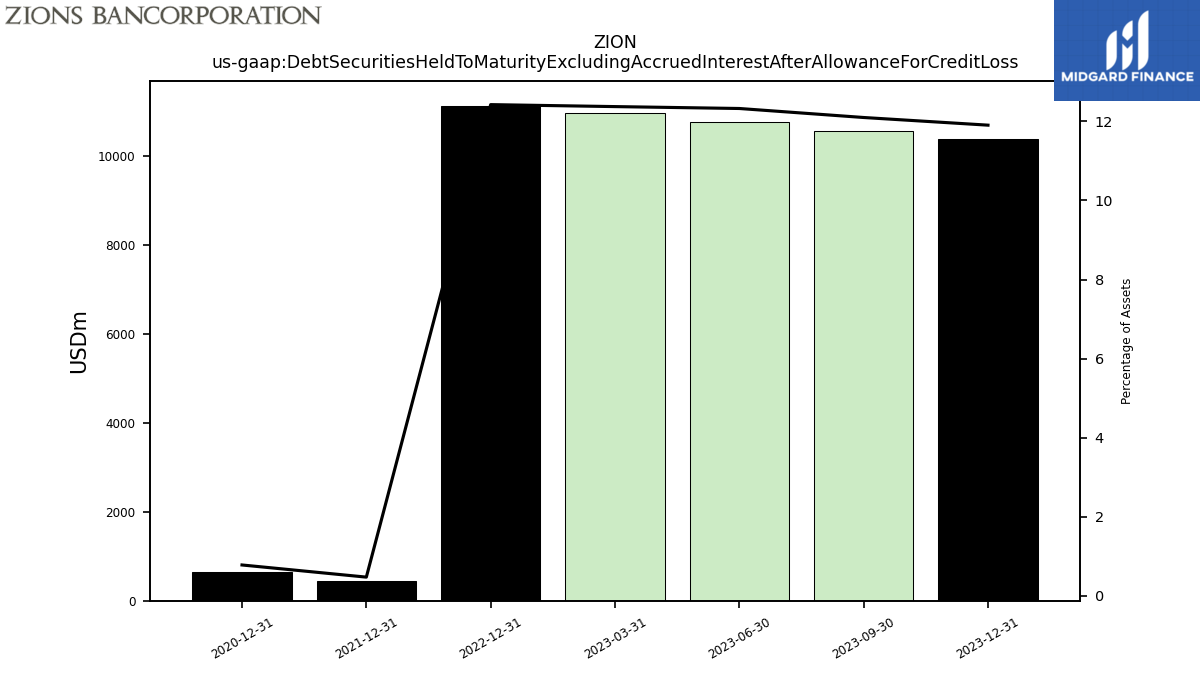
| Debt Securities Held To Maturity Excluding Accrued Interest After Allowance For Credit Loss | 10382.00 | 10559.00 | 10753.00 | 10961.00 | 11126.00 | NA | NA | NA | 441.00 | NA | NA | NA | 636.00 | NA | NA | NA | NA | NA |
| 2023-12-31 | 2023-09-30 | 2023-06-30 | 2023-03-31 | 2022-12-31 | 2022-09-30 | 2022-06-30 | 2022-03-31 | 2021-12-31 | 2021-09-30 | 2021-06-30 | 2021-03-31 | 2020-12-31 | 2020-09-30 | 2020-06-30 | 2020-03-31 | 2019-12-31 | 2019-09-30 | ||
|---|---|---|---|---|---|---|---|---|---|---|---|---|---|---|---|---|---|---|---|
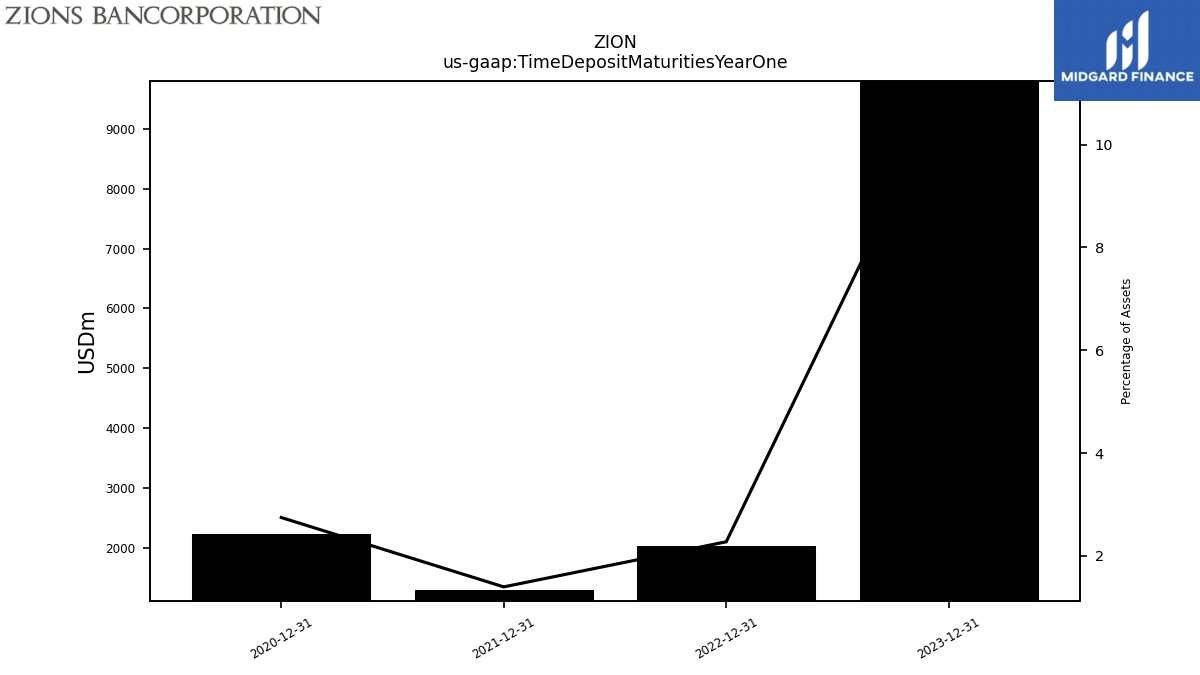
| Time Deposit Maturities Year One | 9798.00 | NA | NA | NA | 2038.00 | NA | NA | NA | 1304.00 | NA | NA | NA | 2239.00 | NA | NA | NA | NA | NA | |
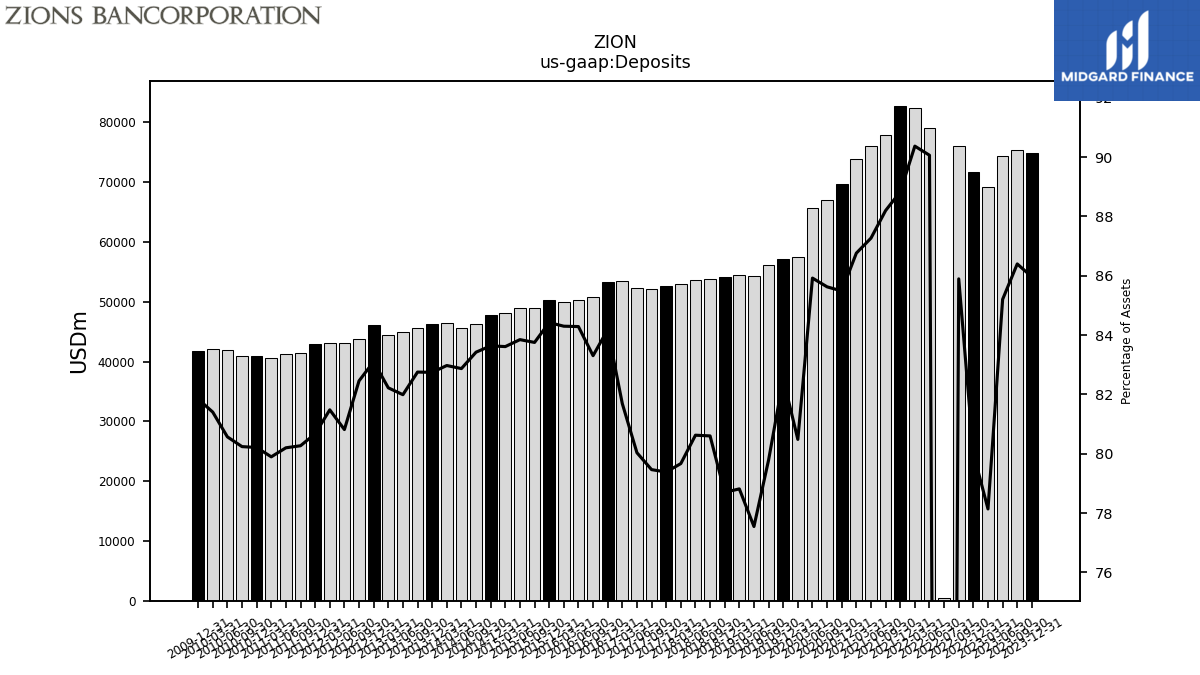
| Deposits | 74961.00 | 75399.00 | 74323.00 | 69208.00 | 71652.00 | 75995.00 | 79061.00 | 82351.00 | 82789.00 | 77884.00 | 76105.00 | 73853.00 | 69653.00 | 67094.00 | 65684.00 | 57518.00 | 57085.00 | 56139.00 |
| 2023-12-31 | 2023-09-30 | 2023-06-30 | 2023-03-31 | 2022-12-31 | 2022-09-30 | 2022-06-30 | 2022-03-31 | 2021-12-31 | 2021-09-30 | 2021-06-30 | 2021-03-31 | 2020-12-31 | 2020-09-30 | 2020-06-30 | 2020-03-31 | 2019-12-31 | 2019-09-30 | ||
|---|---|---|---|---|---|---|---|---|---|---|---|---|---|---|---|---|---|---|---|
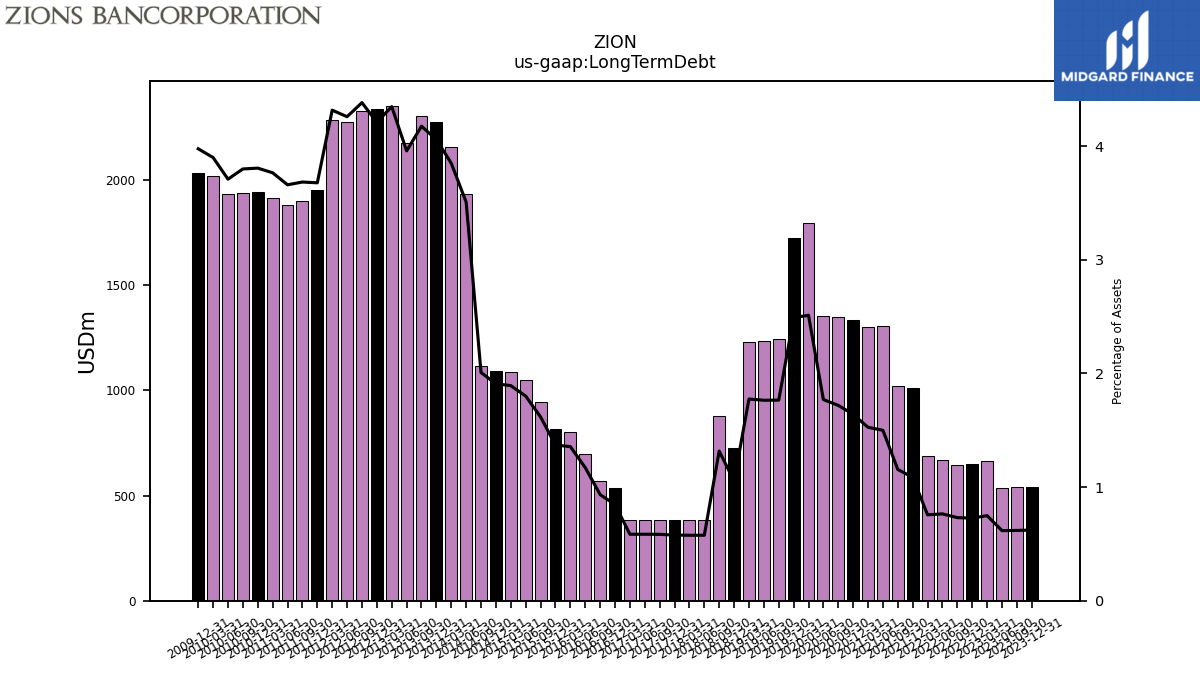
| Long Term Debt | 542.00 | 540.00 | 538.00 | 663.00 | 651.00 | 647.00 | 671.00 | 689.00 | 1012.00 | 1020.00 | 1308.00 | 1299.00 | 1336.00 | 1347.00 | 1353.00 | 1795.00 | 1723.00 | 1242.00 |
| 2023-12-31 | 2023-09-30 | 2023-06-30 | 2023-03-31 | 2022-12-31 | 2022-09-30 | 2022-06-30 | 2022-03-31 | 2021-12-31 | 2021-09-30 | 2021-06-30 | 2021-03-31 | 2020-12-31 | 2020-09-30 | 2020-06-30 | 2020-03-31 | 2019-12-31 | 2019-09-30 | ||
|---|---|---|---|---|---|---|---|---|---|---|---|---|---|---|---|---|---|---|---|
| Stockholders Equity | 5691.00 | 5315.00 | 5283.00 | 5184.00 | 4893.00 | 4696.00 | 5632.00 | 6294.00 | 7463.00 | 7774.00 | 8033.00 | 7933.00 | 7886.00 | 7668.00 | 7575.00 | 7472.00 | 7353.00 | 7509.00 | |
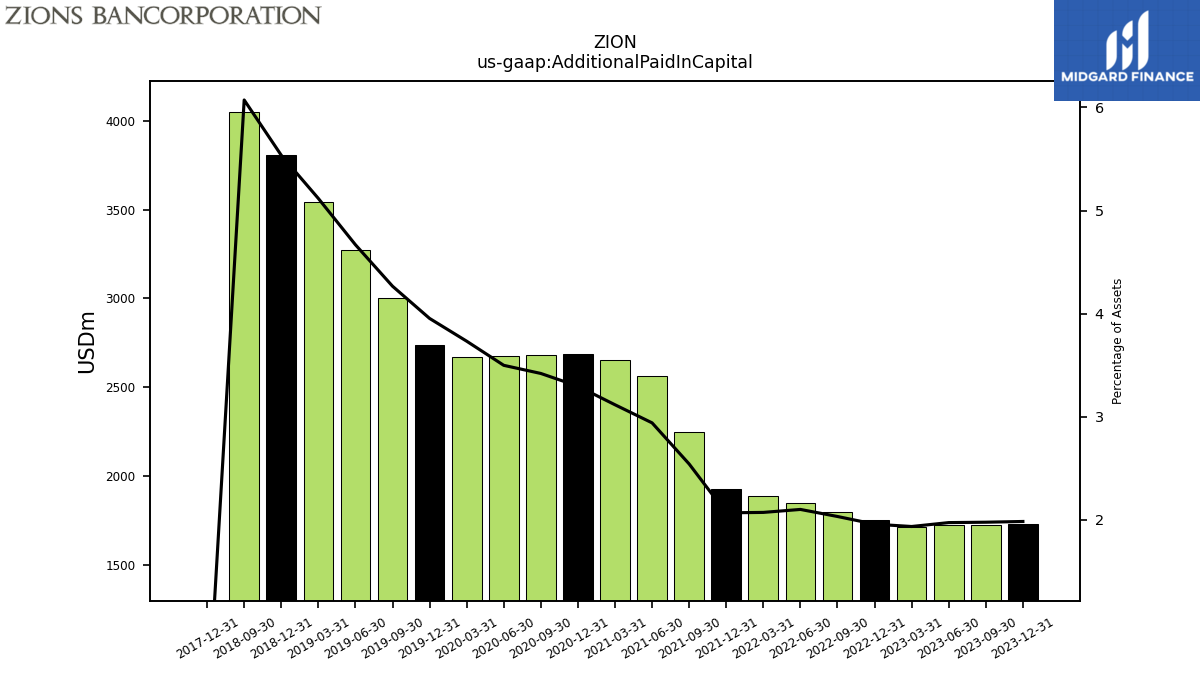
| Additional Paid In Capital | 1731.00 | 1726.00 | 1722.00 | 1715.00 | 1754.00 | 1799.00 | 1845.00 | 1889.00 | 1928.00 | 2245.00 | 2565.00 | 2653.00 | 2686.00 | 2680.00 | 2675.00 | 2668.00 | 2735.00 | 3002.00 | |
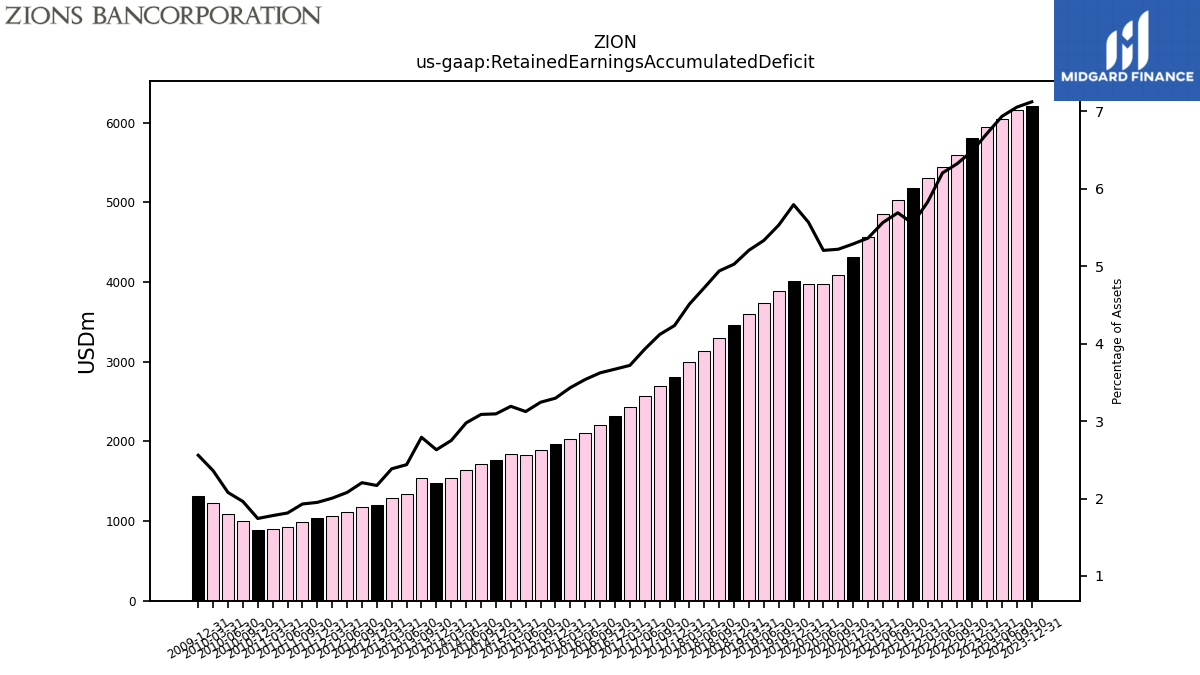
| Retained Earnings Accumulated Deficit | 6212.00 | 6157.00 | 6051.00 | 5949.00 | 5811.00 | 5597.00 | 5447.00 | 5311.00 | 5175.00 | 5025.00 | 4853.00 | 4566.00 | 4309.00 | 4090.00 | 3979.00 | 3979.00 | 4009.00 | 3892.00 | |
| Accumulated Other Comprehensive Income Loss Net Of Tax | -2692.00 | -3008.00 | -2930.00 | -2920.00 | -3112.00 | -3140.00 | -2100.00 | -1346.00 | -80.00 | 64.00 | 175.00 | 148.00 | 325.00 | 332.00 | 355.00 | 259.00 | 43.00 | 49.00 |
| 2023-12-31 | 2023-09-30 | 2023-06-30 | 2023-03-31 | 2022-12-31 | 2022-09-30 | 2022-06-30 | 2022-03-31 | 2021-12-31 | 2021-09-30 | 2021-06-30 | 2021-03-31 | 2020-12-31 | 2020-09-30 | 2020-06-30 | 2020-03-31 | 2019-12-31 | 2019-09-30 | ||
|---|---|---|---|---|---|---|---|---|---|---|---|---|---|---|---|---|---|---|---|
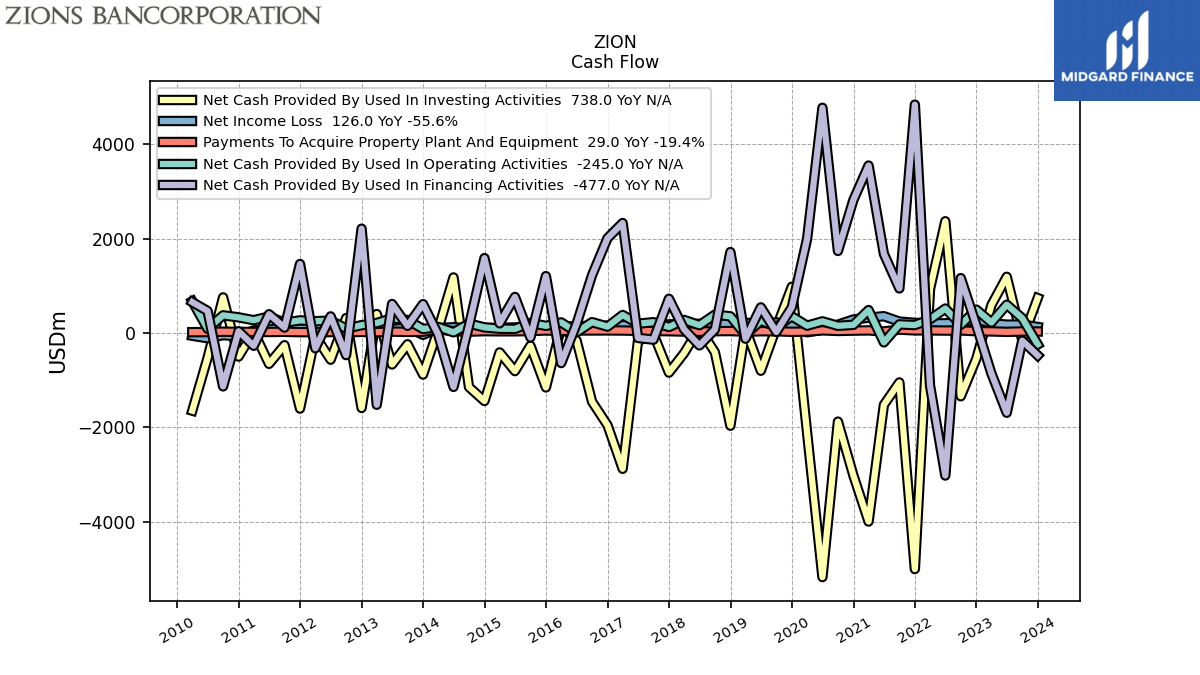
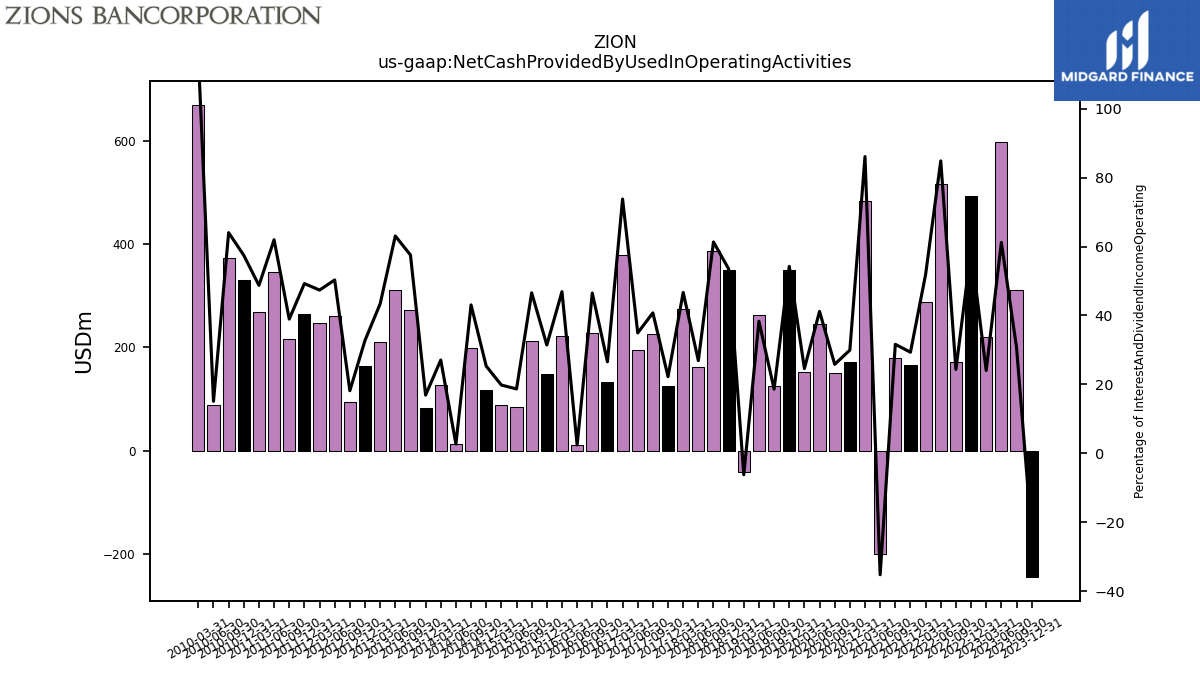
| Net Cash Provided By Used In Operating Activities | -245.00 | 311.00 | 598.00 | 221.00 | 494.00 | 172.00 | 516.00 | 288.00 | 166.00 | 180.00 | -201.00 | 484.00 | 171.00 | 150.00 | 245.00 | 153.00 | 351.00 | 126.00 | |
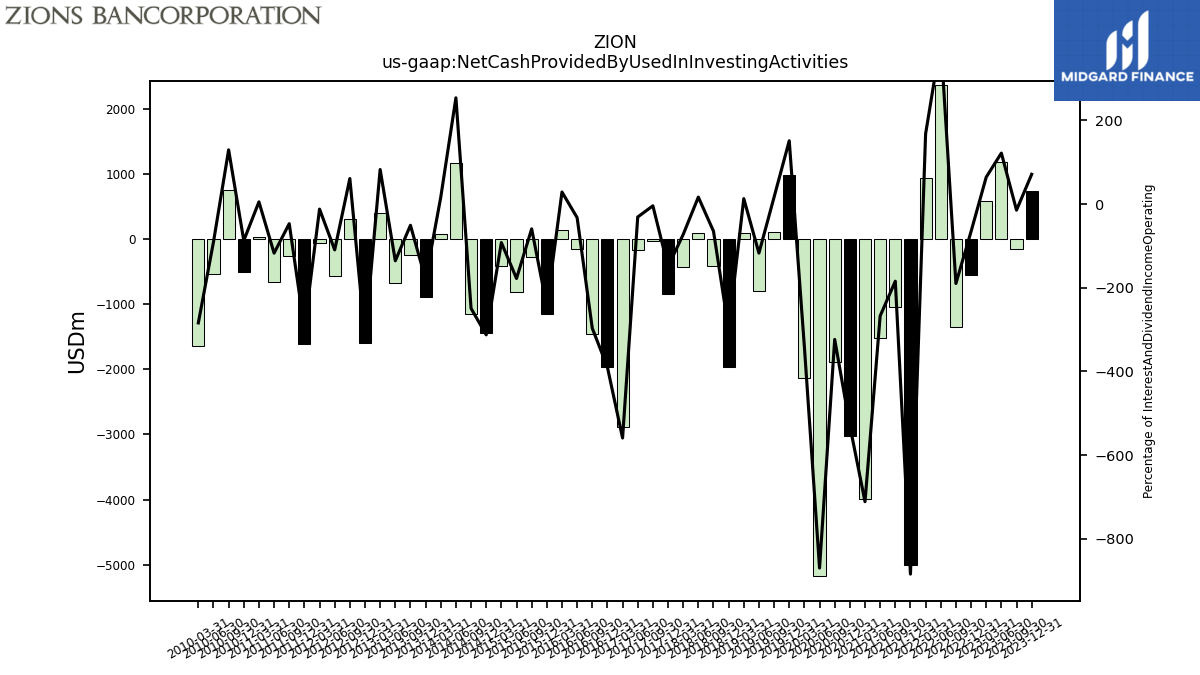
| Net Cash Provided By Used In Investing Activities | 738.00 | -148.00 | 1189.00 | 591.00 | -549.00 | -1343.00 | 2366.00 | 931.00 | -5006.00 | -1050.00 | -1525.00 | -3998.00 | -3023.00 | -1880.00 | -5176.00 | -2125.00 | 978.00 | 112.00 | |
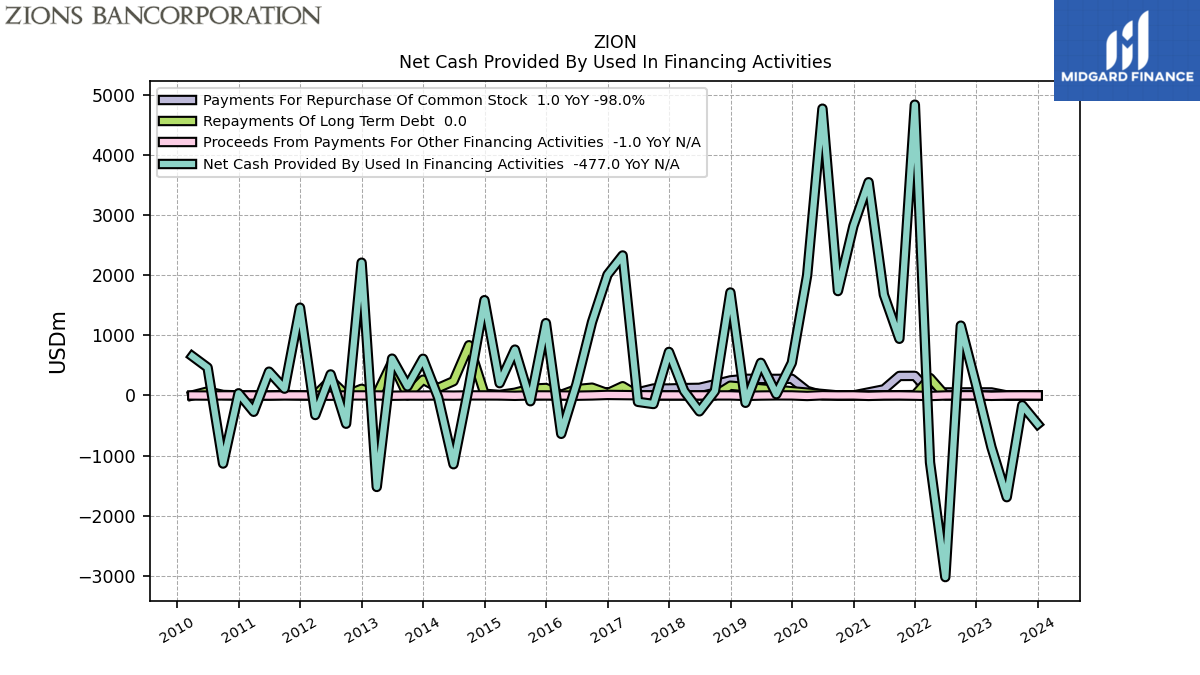
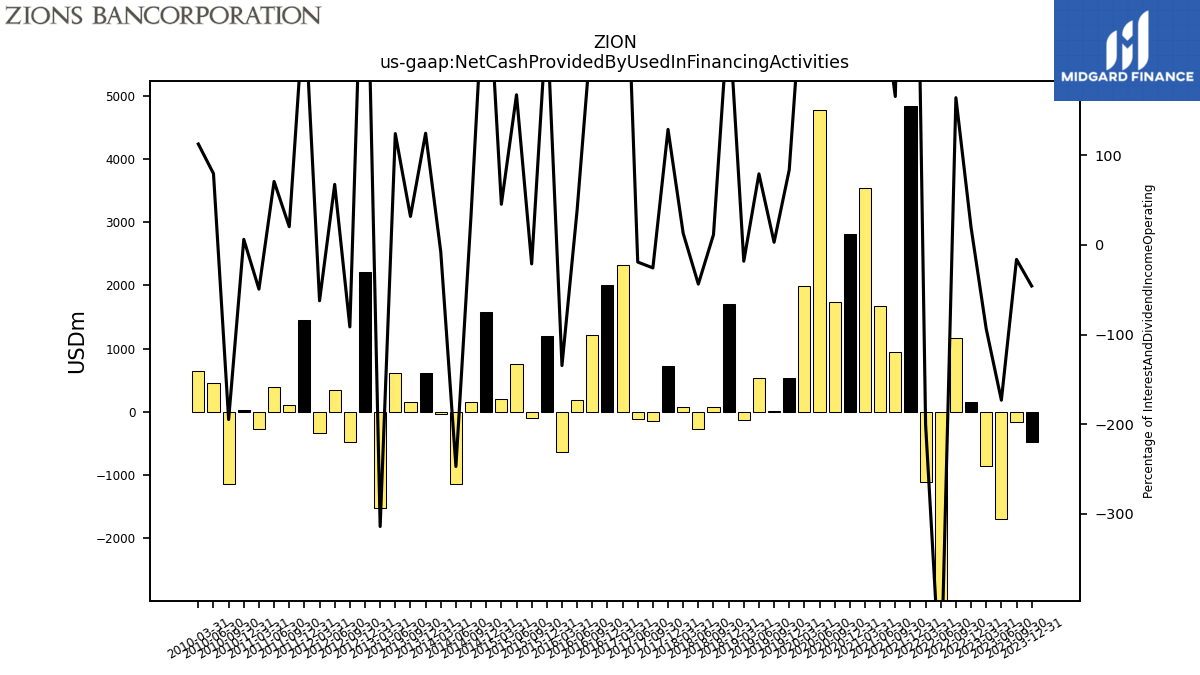
| Net Cash Provided By Used In Financing Activities | -477.00 | -164.00 | -1693.00 | -862.00 | 163.00 | 1161.00 | -3023.00 | -1114.00 | 4838.00 | 942.00 | 1675.00 | 3547.00 | 2819.00 | 1736.00 | 4771.00 | 1997.00 | 542.00 | 20.00 |
| 2023-12-31 | 2023-09-30 | 2023-06-30 | 2023-03-31 | 2022-12-31 | 2022-09-30 | 2022-06-30 | 2022-03-31 | 2021-12-31 | 2021-09-30 | 2021-06-30 | 2021-03-31 | 2020-12-31 | 2020-09-30 | 2020-06-30 | 2020-03-31 | 2019-12-31 | 2019-09-30 | ||
|---|---|---|---|---|---|---|---|---|---|---|---|---|---|---|---|---|---|---|---|
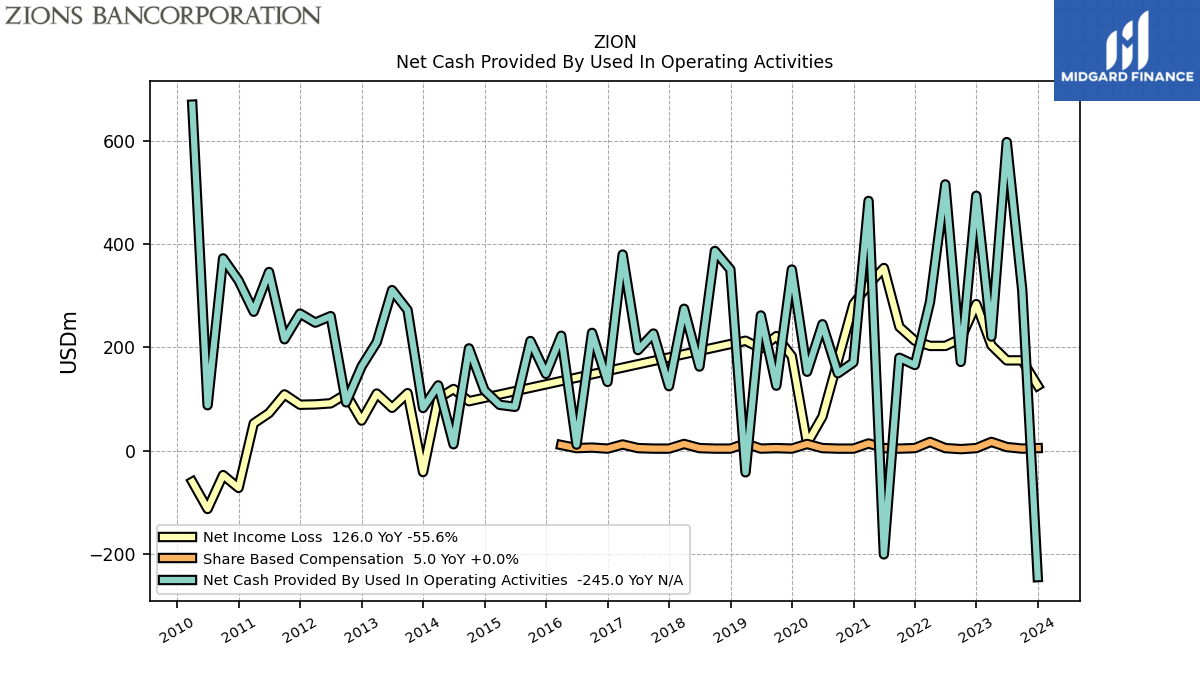
| Net Cash Provided By Used In Operating Activities | -245.00 | 311.00 | 598.00 | 221.00 | 494.00 | 172.00 | 516.00 | 288.00 | 166.00 | 180.00 | -201.00 | 484.00 | 171.00 | 150.00 | 245.00 | 153.00 | 351.00 | 126.00 | |
| Net Income Loss | 126.00 | 175.00 | 175.00 | 204.00 | 284.00 | 217.00 | 203.00 | 203.00 | 213.00 | 240.00 | 354.00 | 322.00 | 284.00 | 175.00 | 66.00 | 14.00 | 183.00 | 222.00 | |
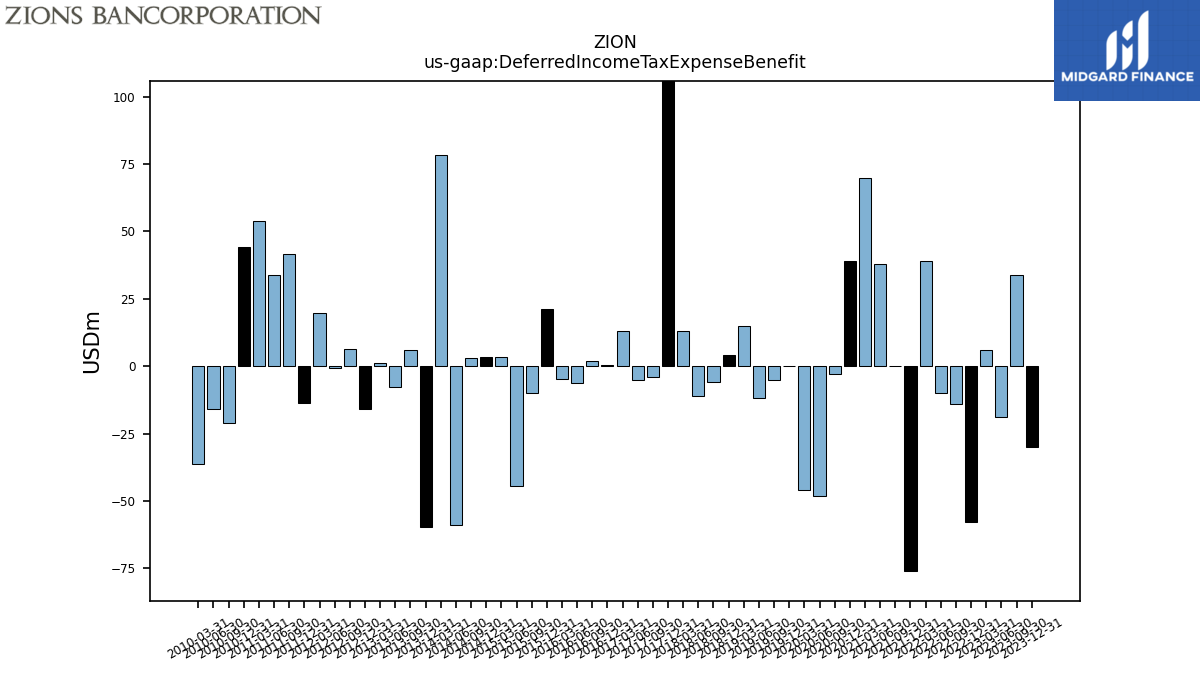
| Deferred Income Tax Expense Benefit | -30.00 | 34.00 | -19.00 | 6.00 | -58.00 | -14.00 | -10.00 | 39.00 | -76.00 | 0.00 | 38.00 | 70.00 | 39.00 | -3.00 | -48.00 | -46.00 | 0.00 | -5.00 | |
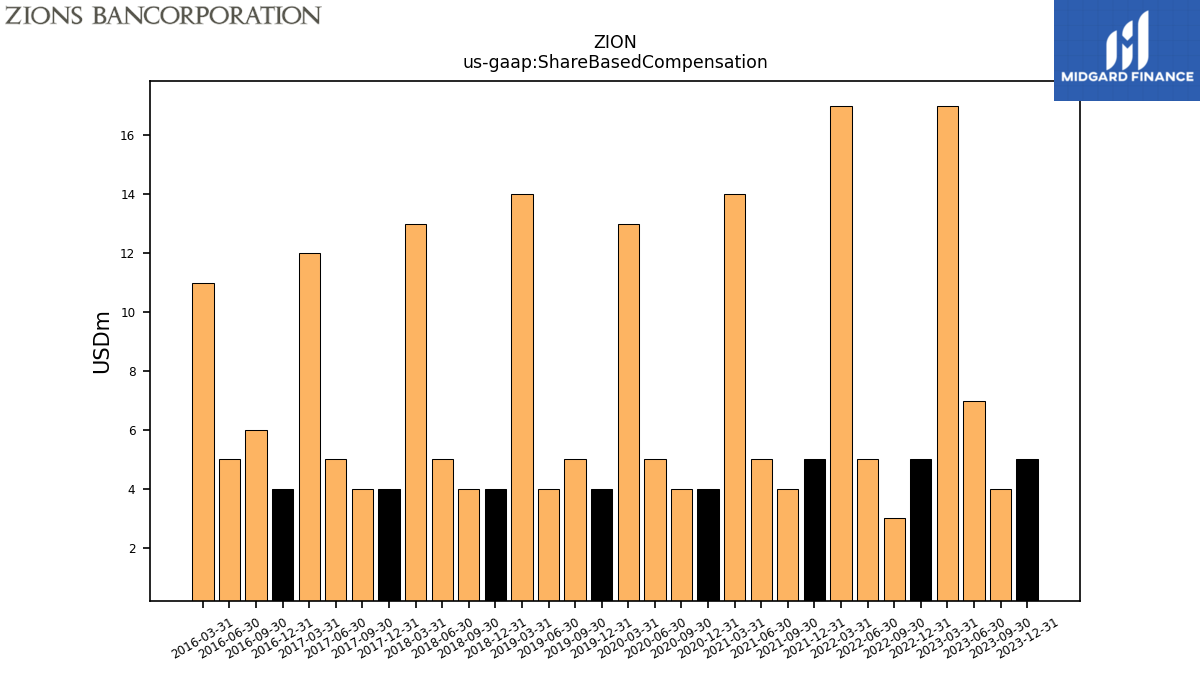
| Share Based Compensation | 5.00 | 4.00 | 7.00 | 17.00 | 5.00 | 3.00 | 5.00 | 17.00 | 5.00 | 4.00 | 5.00 | 14.00 | 4.00 | 4.00 | 5.00 | 13.00 | 4.00 | 5.00 |
| 2023-12-31 | 2023-09-30 | 2023-06-30 | 2023-03-31 | 2022-12-31 | 2022-09-30 | 2022-06-30 | 2022-03-31 | 2021-12-31 | 2021-09-30 | 2021-06-30 | 2021-03-31 | 2020-12-31 | 2020-09-30 | 2020-06-30 | 2020-03-31 | 2019-12-31 | 2019-09-30 | ||
|---|---|---|---|---|---|---|---|---|---|---|---|---|---|---|---|---|---|---|---|
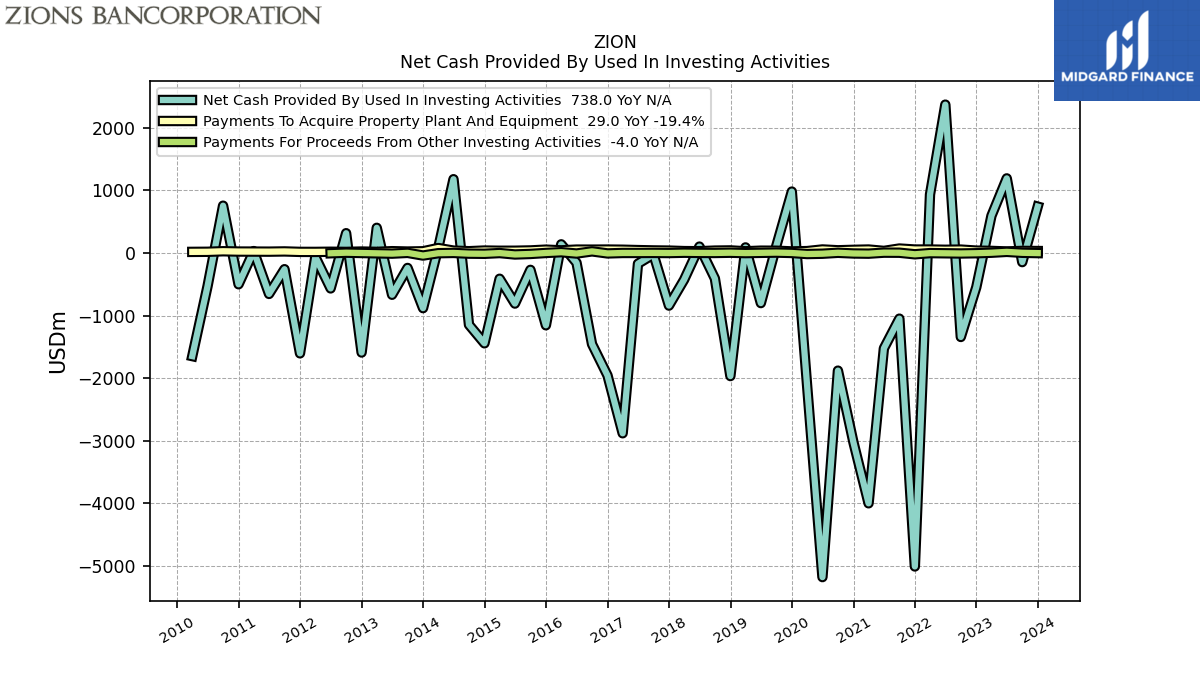
| Net Cash Provided By Used In Investing Activities | 738.00 | -148.00 | 1189.00 | 591.00 | -549.00 | -1343.00 | 2366.00 | 931.00 | -5006.00 | -1050.00 | -1525.00 | -3998.00 | -3023.00 | -1880.00 | -5176.00 | -2125.00 | 978.00 | 112.00 | |
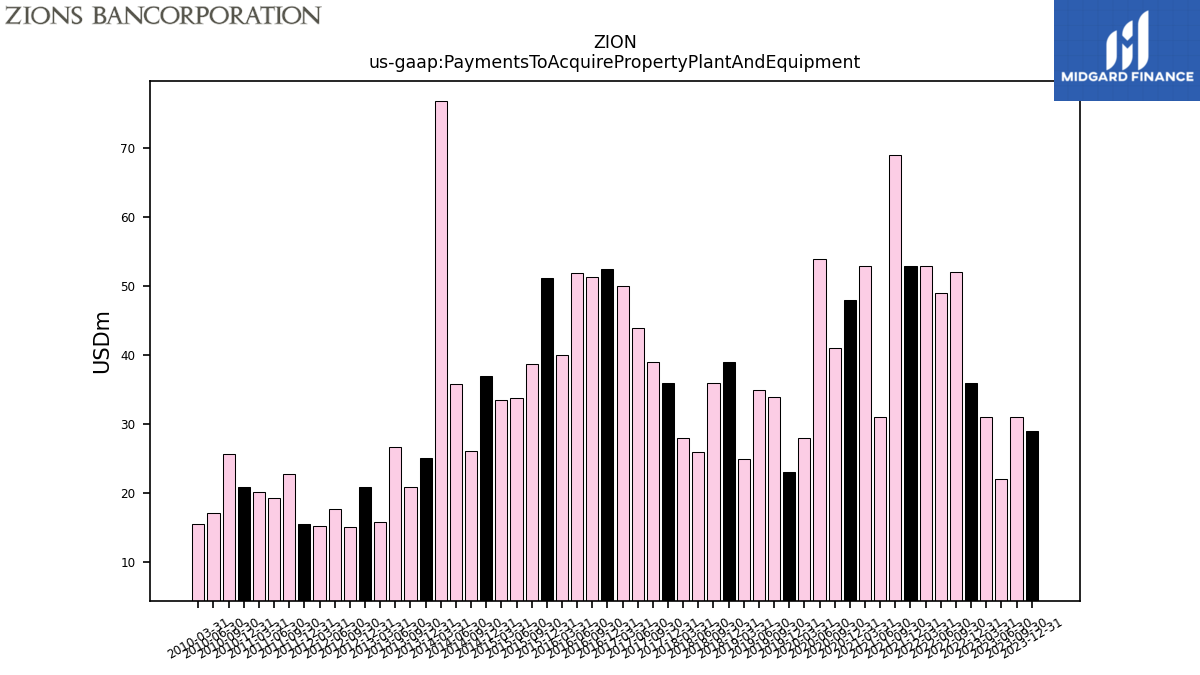
| Payments To Acquire Property Plant And Equipment | 29.00 | 31.00 | 22.00 | 31.00 | 36.00 | 52.00 | 49.00 | 53.00 | 53.00 | 69.00 | 31.00 | 53.00 | 48.00 | 41.00 | 54.00 | 28.00 | 23.00 | 34.00 |
| 2023-12-31 | 2023-09-30 | 2023-06-30 | 2023-03-31 | 2022-12-31 | 2022-09-30 | 2022-06-30 | 2022-03-31 | 2021-12-31 | 2021-09-30 | 2021-06-30 | 2021-03-31 | 2020-12-31 | 2020-09-30 | 2020-06-30 | 2020-03-31 | 2019-12-31 | 2019-09-30 | ||
|---|---|---|---|---|---|---|---|---|---|---|---|---|---|---|---|---|---|---|---|
| Net Cash Provided By Used In Financing Activities | -477.00 | -164.00 | -1693.00 | -862.00 | 163.00 | 1161.00 | -3023.00 | -1114.00 | 4838.00 | 942.00 | 1675.00 | 3547.00 | 2819.00 | 1736.00 | 4771.00 | 1997.00 | 542.00 | 20.00 | |
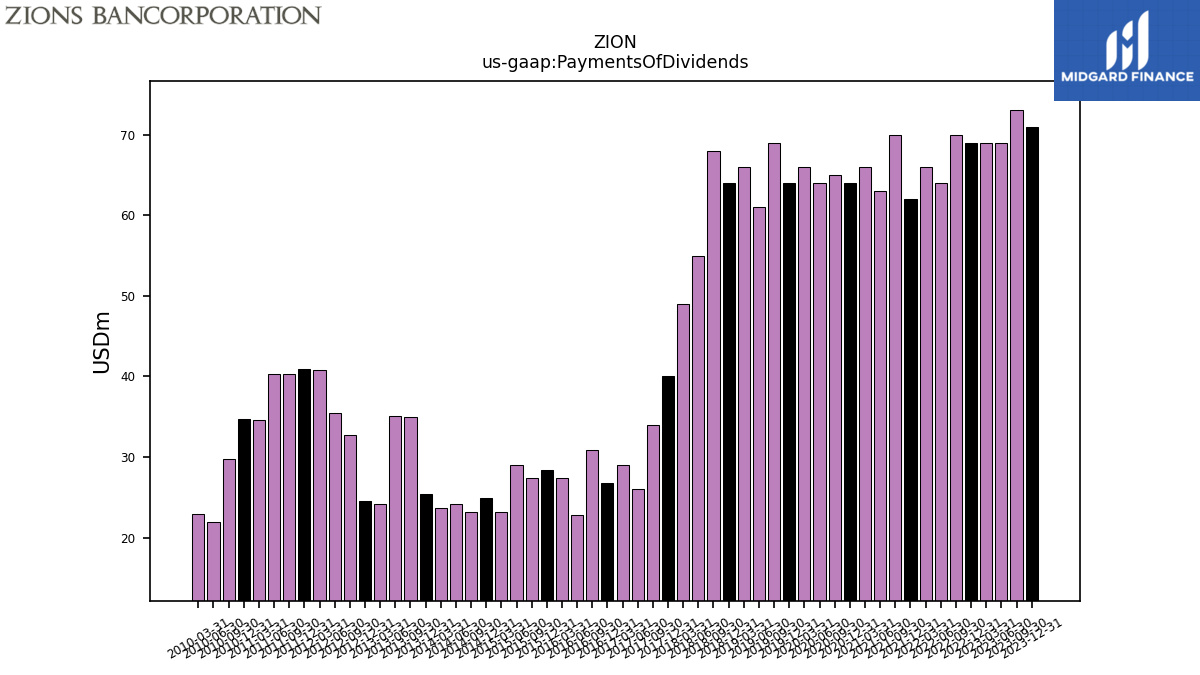
| Payments Of Dividends | 71.00 | 73.00 | 69.00 | 69.00 | 69.00 | 70.00 | 64.00 | 66.00 | 62.00 | 70.00 | 63.00 | 66.00 | 64.00 | 65.00 | 64.00 | 66.00 | 64.00 | 69.00 | |
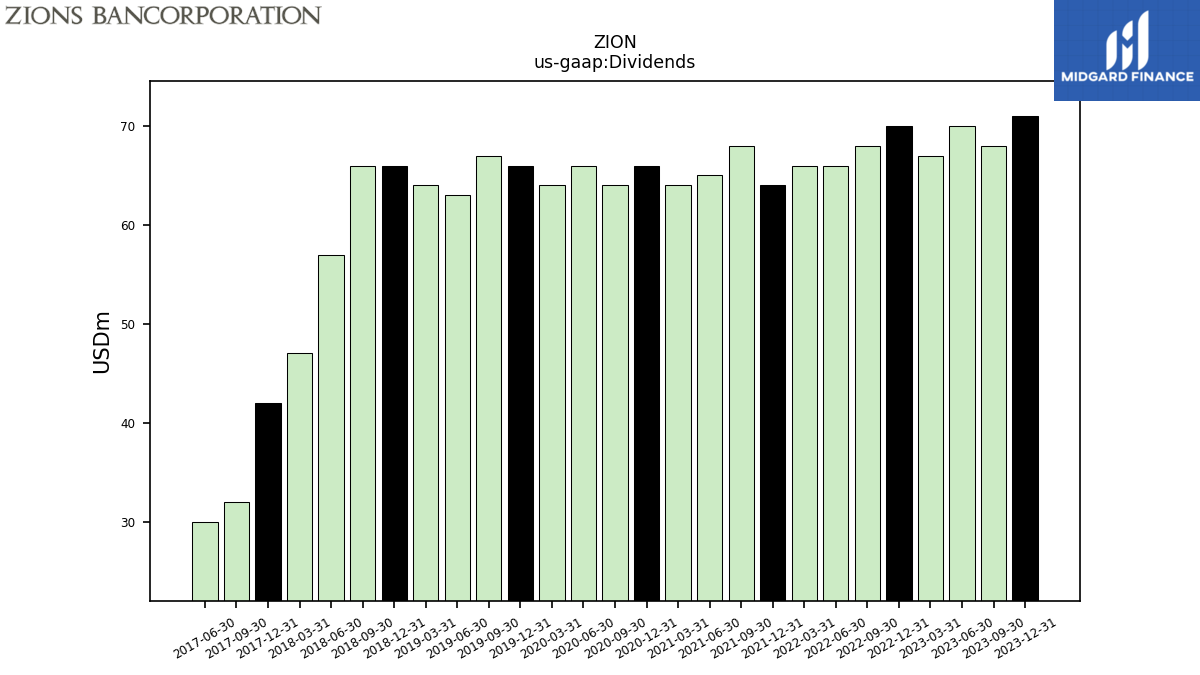
| Dividends | 71.00 | 68.00 | 70.00 | 67.00 | 70.00 | 68.00 | 66.00 | 66.00 | 64.00 | 68.00 | 65.00 | 64.00 | 66.00 | 64.00 | 66.00 | 64.00 | 66.00 | 67.00 | |
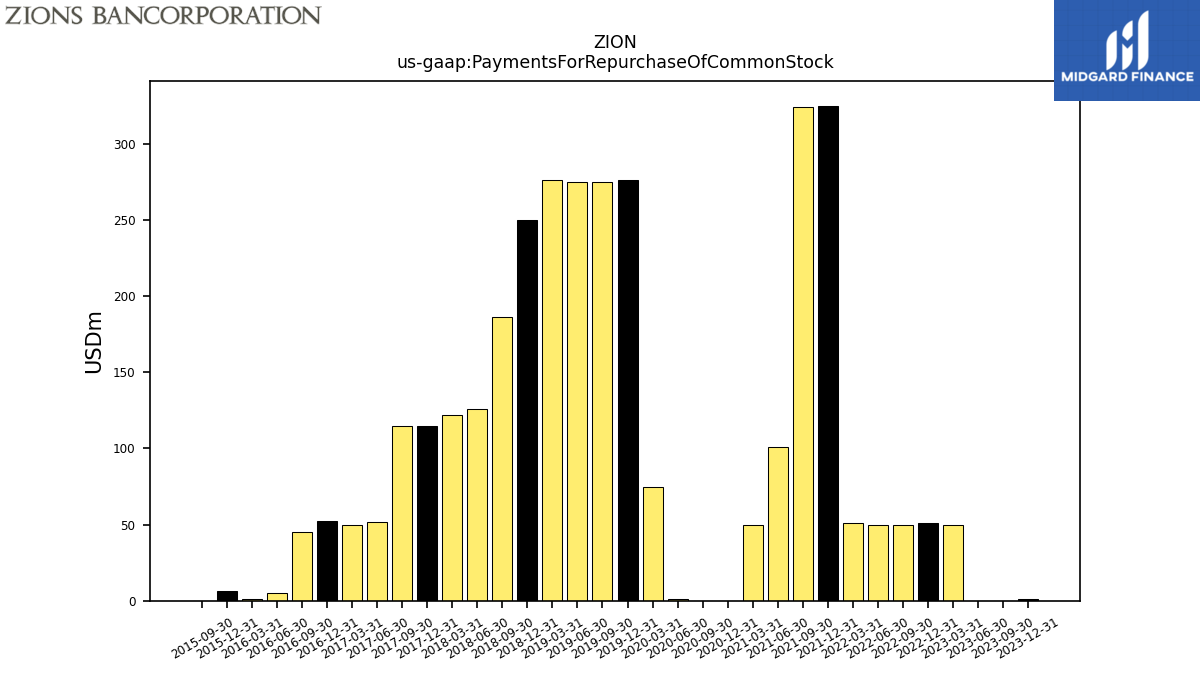
| Payments For Repurchase Of Common Stock | 1.00 | 0.00 | 0.00 | 50.00 | 51.00 | 50.00 | 50.00 | 51.00 | 325.00 | 324.00 | 101.00 | 50.00 | 0.00 | 0.00 | 1.00 | 75.00 | 276.00 | 275.00 |
| 2023-12-31 | 2023-09-30 | 2023-06-30 | 2023-03-31 | 2022-12-31 | 2022-09-30 | 2022-06-30 | 2022-03-31 | 2021-12-31 | 2021-09-30 | 2021-06-30 | 2021-03-31 | 2020-12-31 | 2020-09-30 | 2020-06-30 | 2020-03-31 | 2019-12-31 | 2019-09-30 | ||
|---|---|---|---|---|---|---|---|---|---|---|---|---|---|---|---|---|---|---|---|
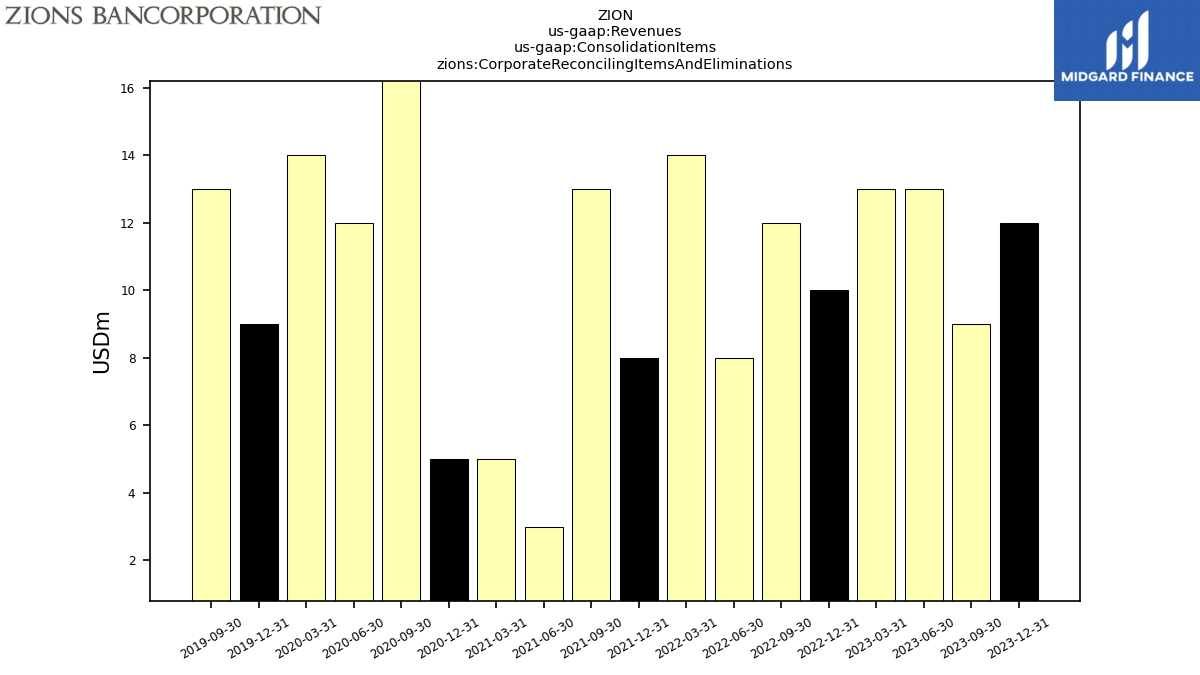
| Revenues | 150.00 | 157.00 | 162.00 | 151.00 | 153.00 | 156.00 | 154.00 | 151.00 | 152.00 | 151.00 | 139.00 | 133.00 | 138.00 | 139.00 | 130.00 | 143.00 | 133.00 | 140.00 | |
| Corporate Reconciling Items And Eliminations | 12.00 | 9.00 | 13.00 | 13.00 | 10.00 | 12.00 | 8.00 | 14.00 | 8.00 | 13.00 | 3.00 | 5.00 | 5.00 | 18.00 | 12.00 | 14.00 | 9.00 | 13.00 | |
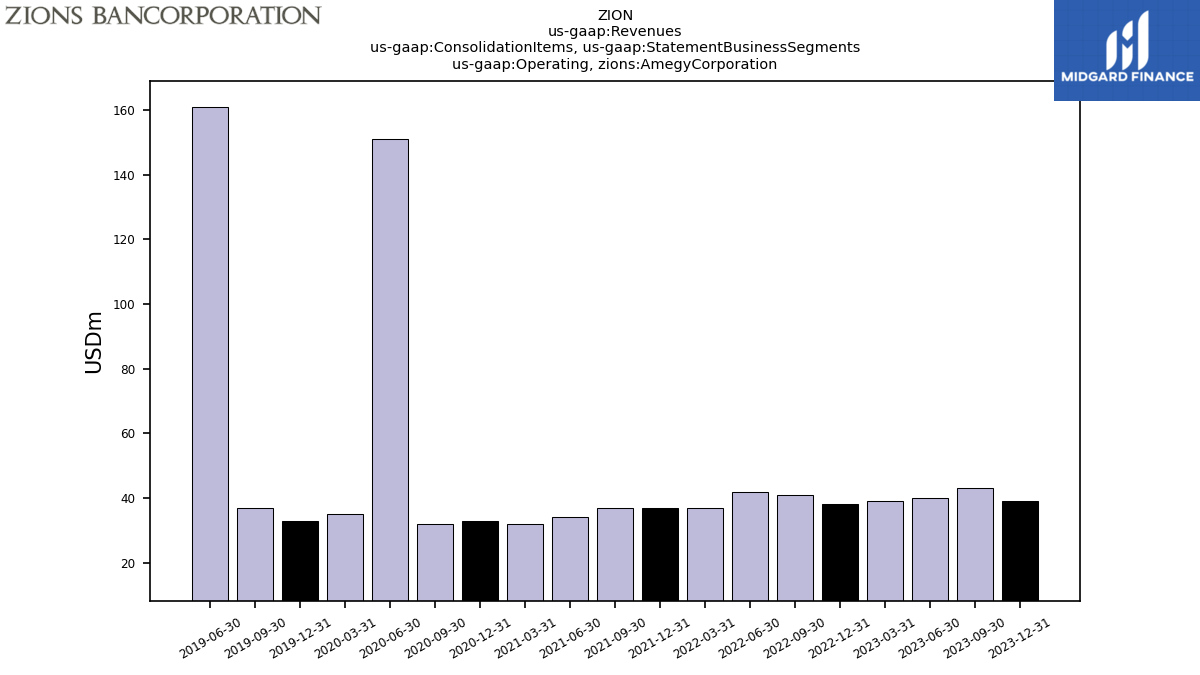
| Operating, Amegy Corporation | 39.00 | 43.00 | 40.00 | 39.00 | 38.00 | 41.00 | 42.00 | 37.00 | 37.00 | 37.00 | 34.00 | 32.00 | 33.00 | 32.00 | 151.00 | 35.00 | 33.00 | 37.00 | |
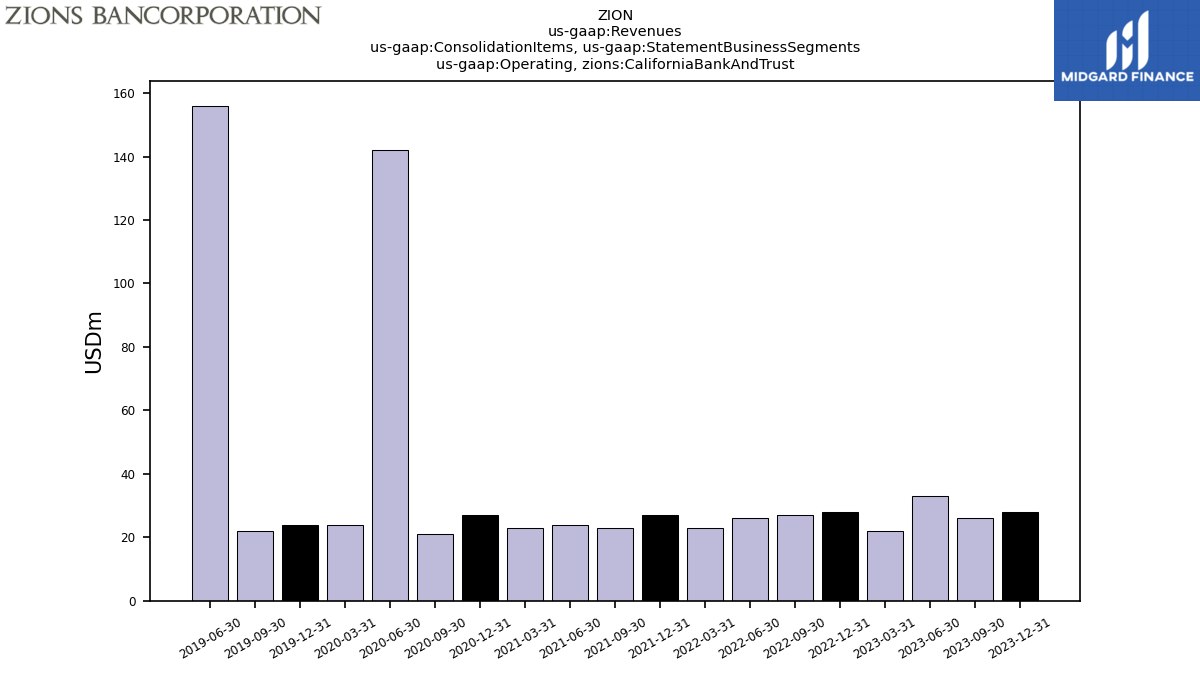
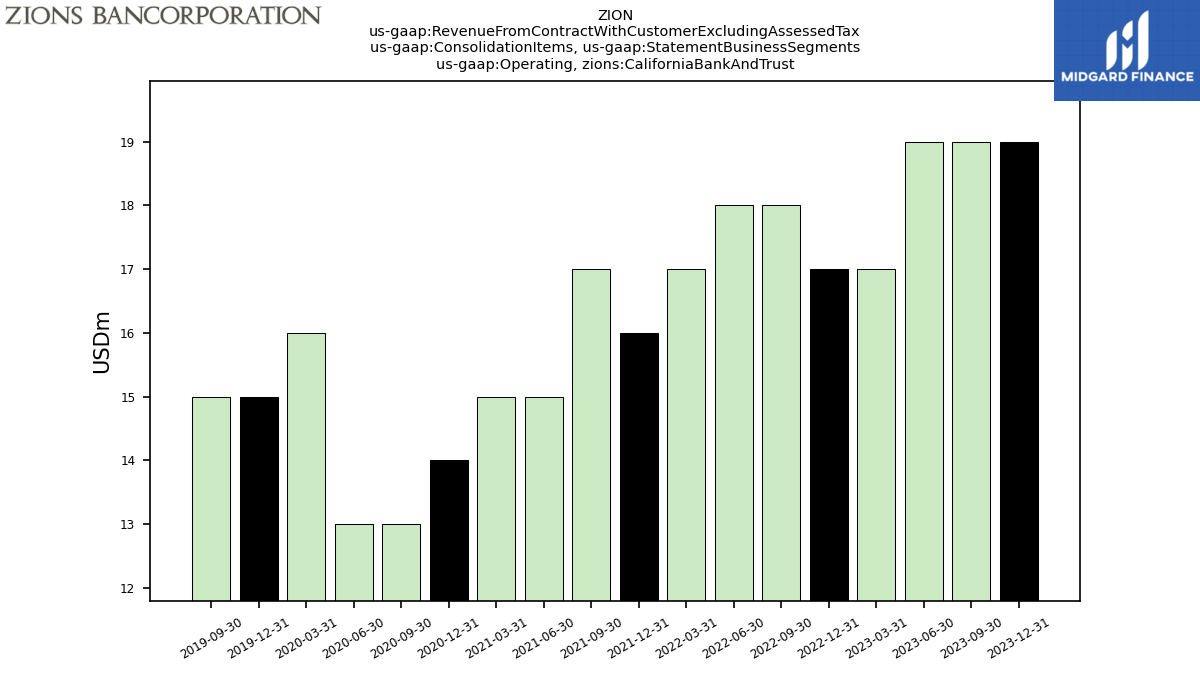
| Operating, California Bank And Trust | 28.00 | 26.00 | 33.00 | 22.00 | 28.00 | 27.00 | 26.00 | 23.00 | 27.00 | 23.00 | 24.00 | 23.00 | 27.00 | 21.00 | 142.00 | 24.00 | 24.00 | 22.00 | |
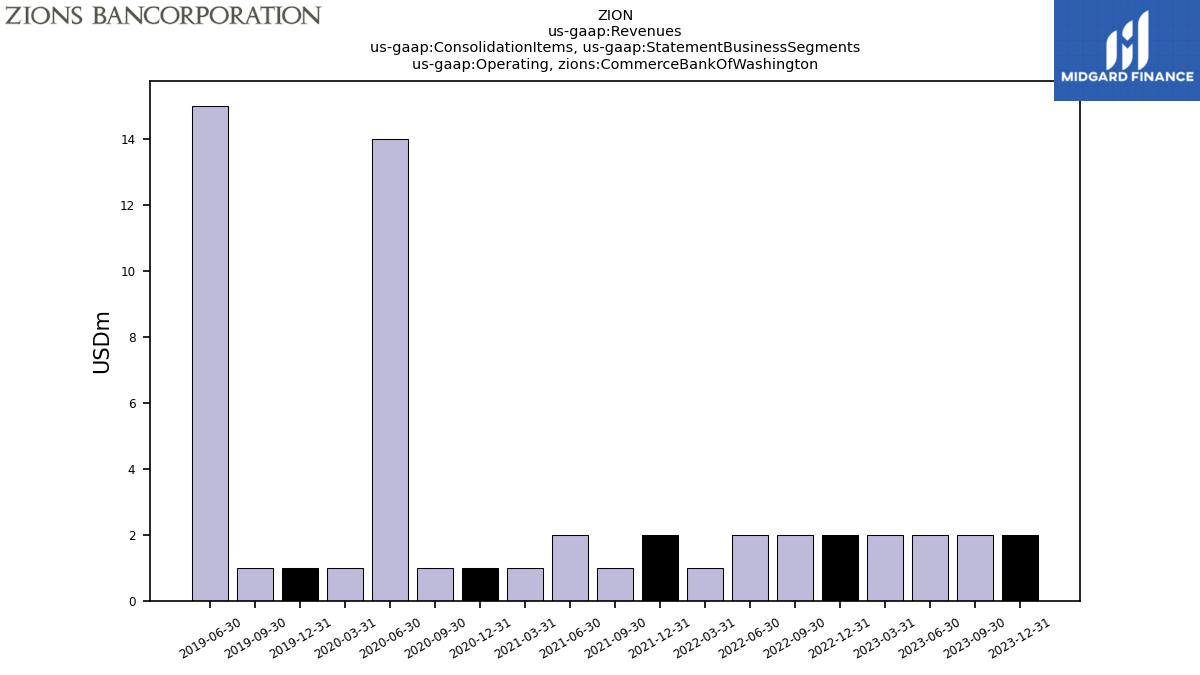
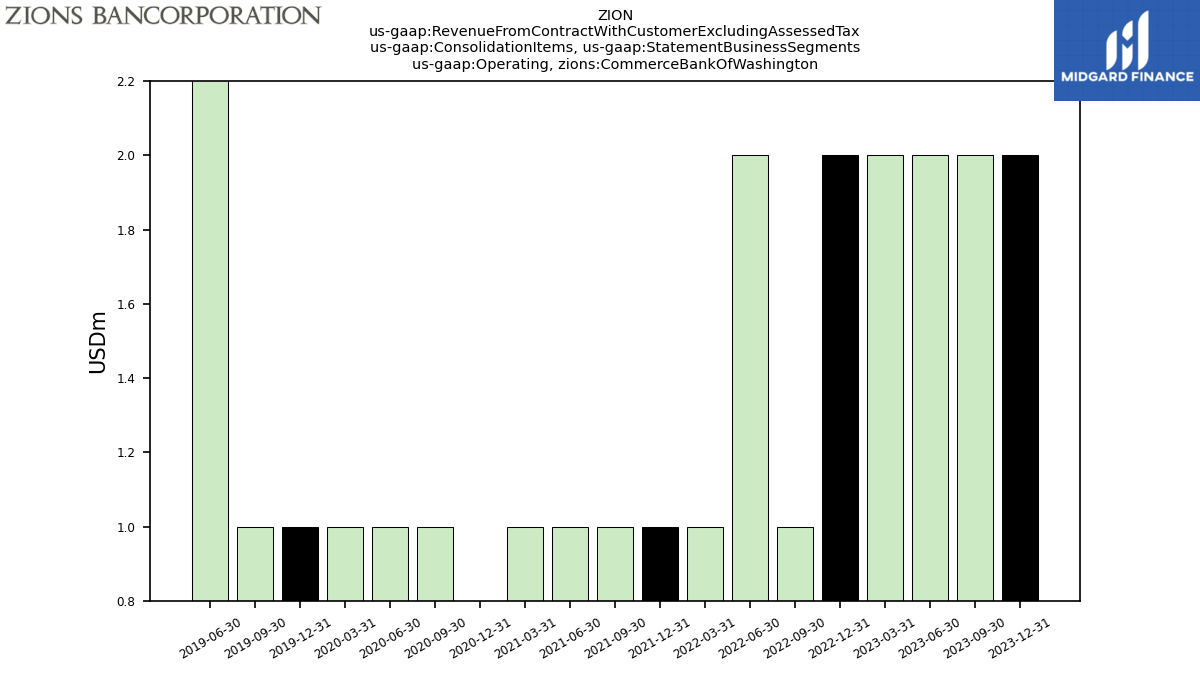
| Operating, Commerce Bank Of Washington | 2.00 | 2.00 | 2.00 | 2.00 | 2.00 | 2.00 | 2.00 | 1.00 | 2.00 | 1.00 | 2.00 | 1.00 | 1.00 | 1.00 | 14.00 | 1.00 | 1.00 | 1.00 | |
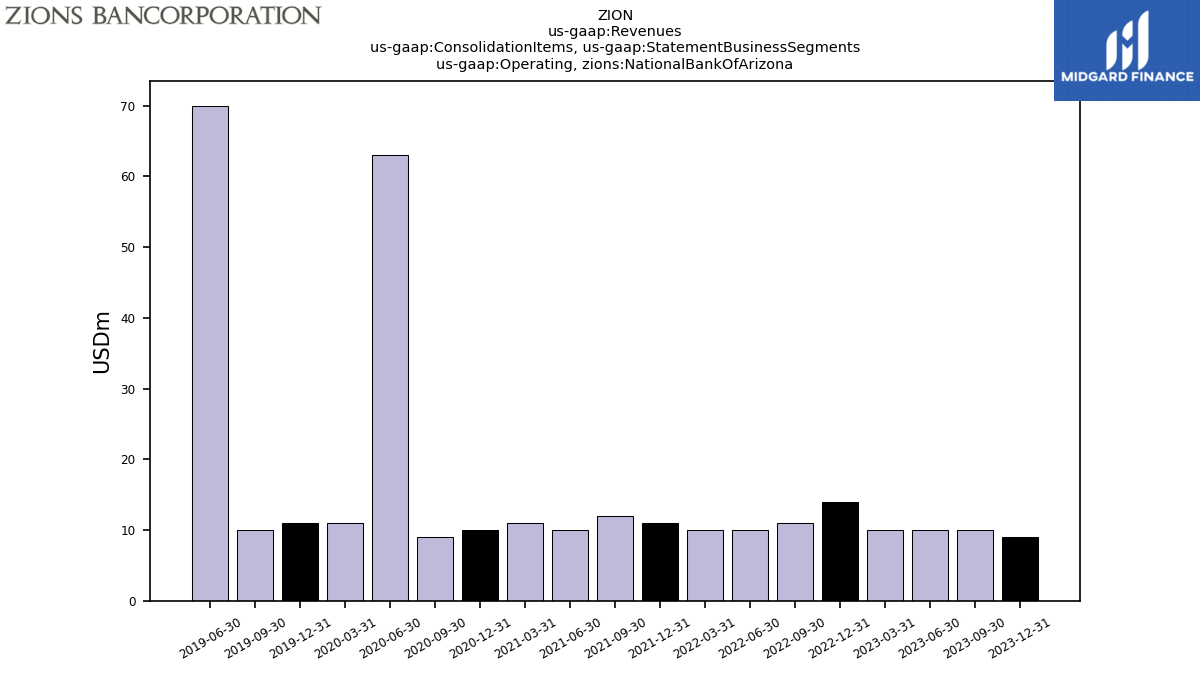
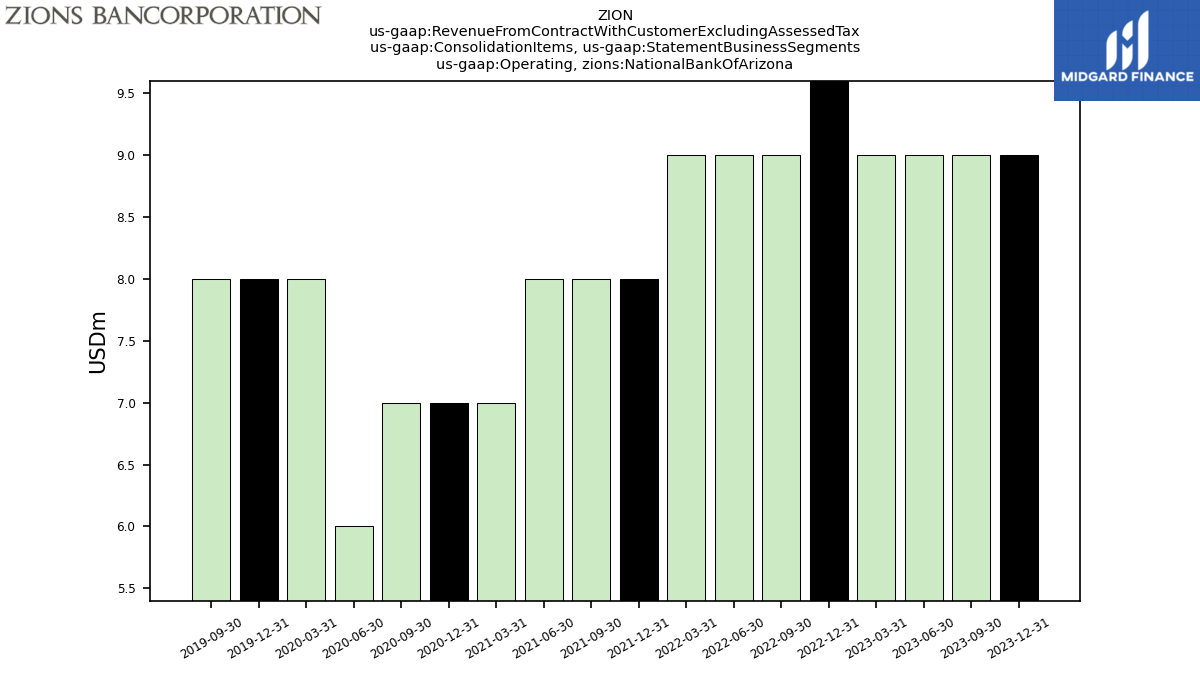
| Operating, National Bank Of Arizona | 9.00 | 10.00 | 10.00 | 10.00 | 14.00 | 11.00 | 10.00 | 10.00 | 11.00 | 12.00 | 10.00 | 11.00 | 10.00 | 9.00 | 63.00 | 11.00 | 11.00 | 10.00 | |
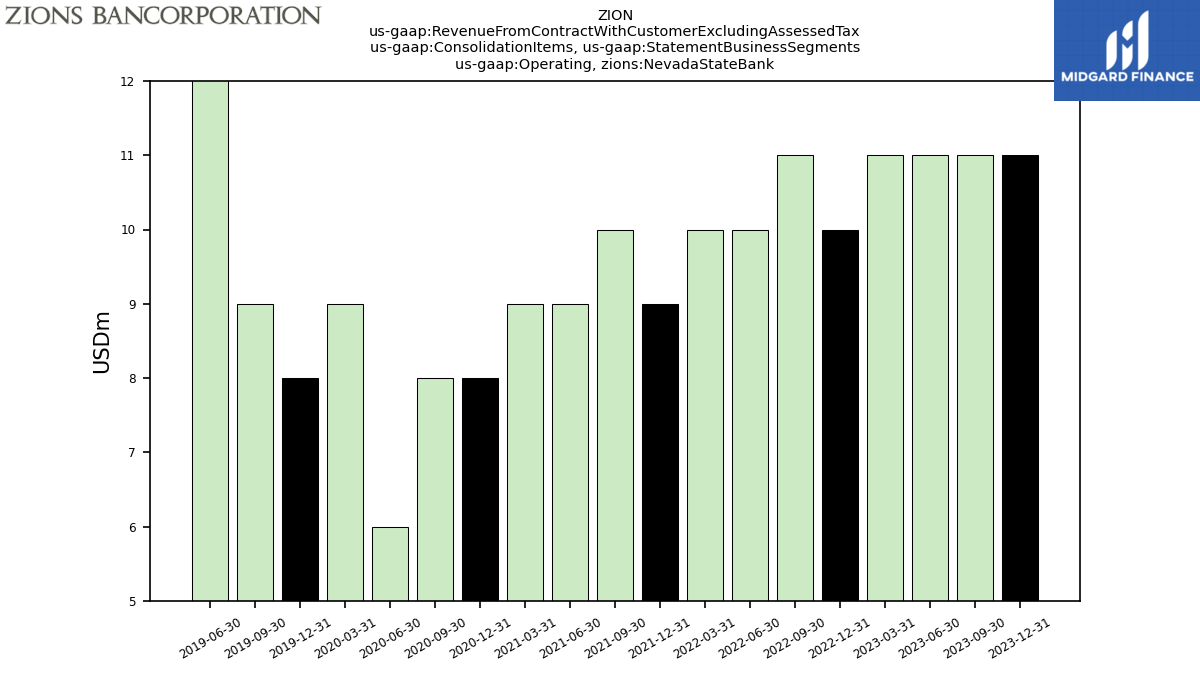
| Operating, Nevada State Bank | 11.00 | 12.00 | 11.00 | 11.00 | 11.00 | 12.00 | 12.00 | 12.00 | 12.00 | 13.00 | 12.00 | 13.00 | 12.00 | 10.00 | 45.00 | 11.00 | 11.00 | 11.00 | |
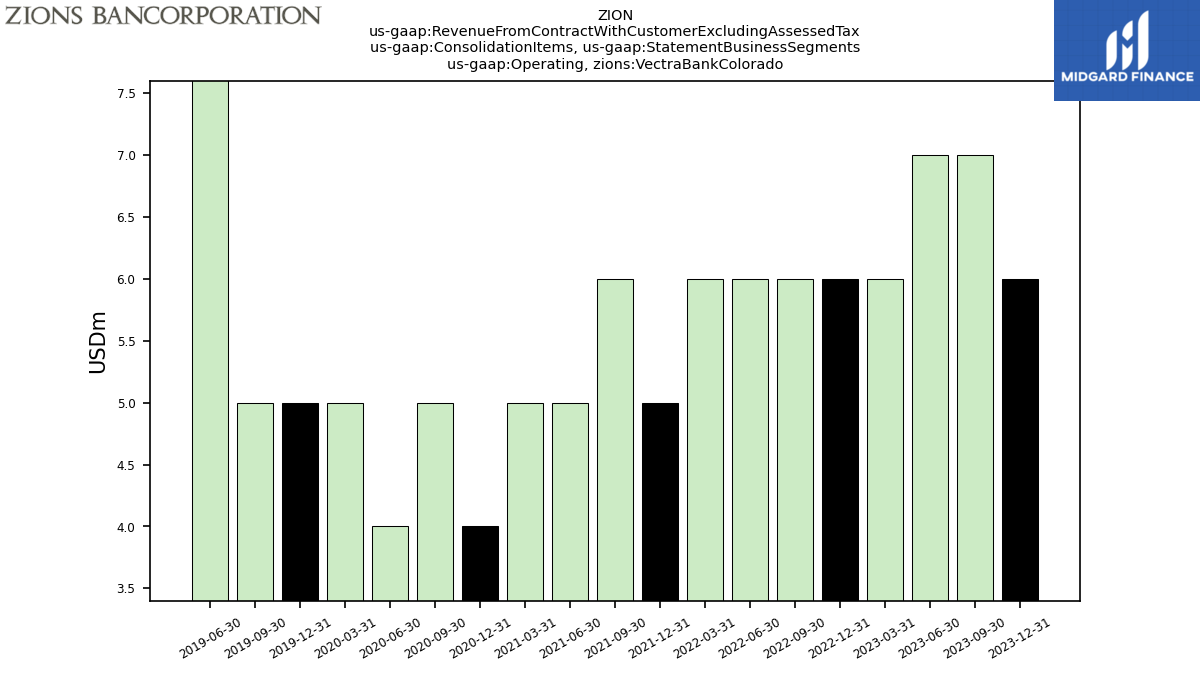
| Operating, Vectra Bank Colorado | 7.00 | 8.00 | 7.00 | 7.00 | 7.00 | 8.00 | 8.00 | 8.00 | 9.00 | 8.00 | 8.00 | 8.00 | 8.00 | 8.00 | 41.00 | 8.00 | 7.00 | 7.00 | |
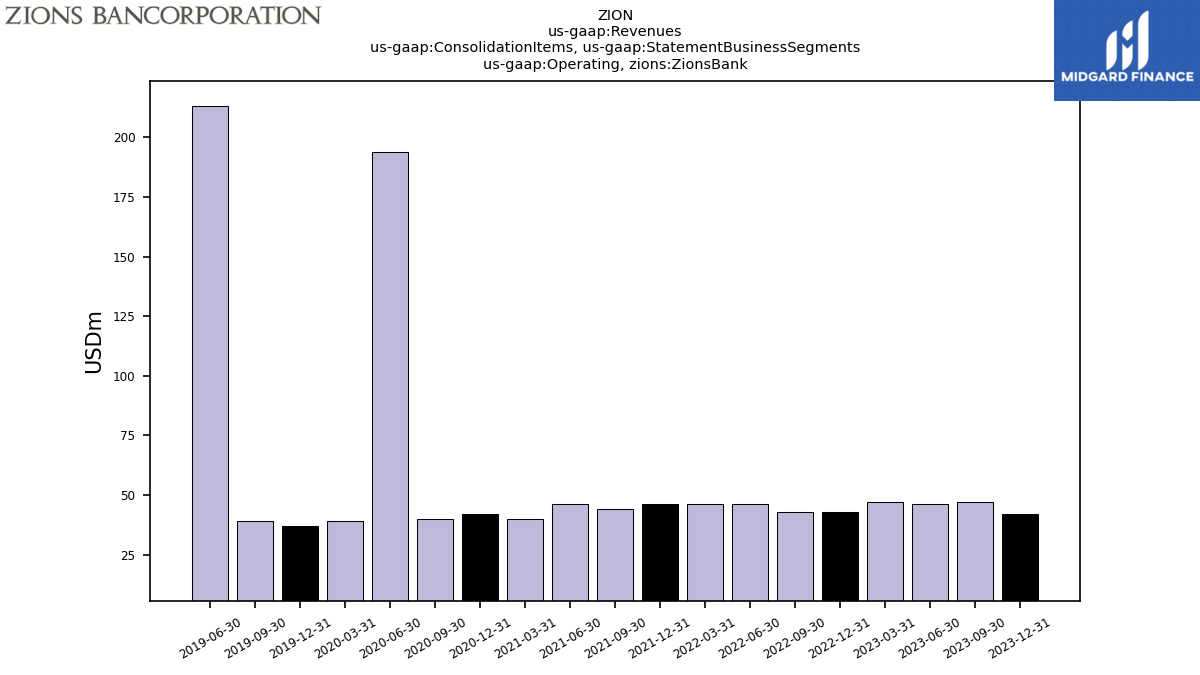
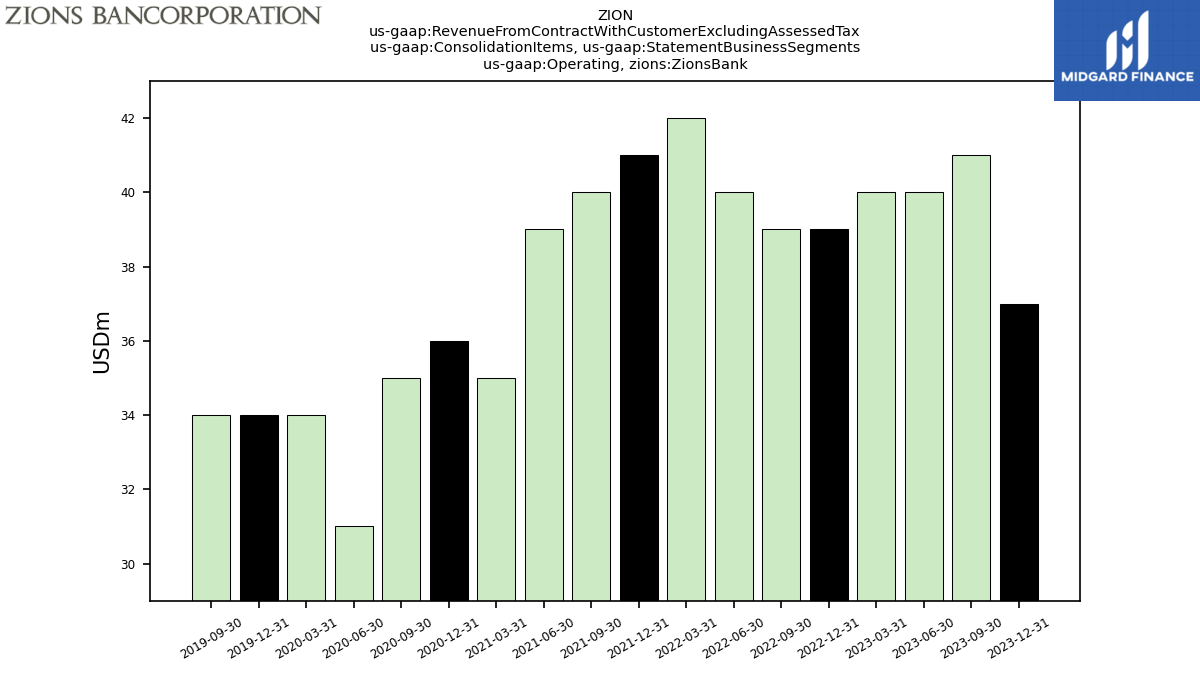
| Operating, Zions Bank | 42.00 | 47.00 | 46.00 | 47.00 | 43.00 | 43.00 | 46.00 | 46.00 | 46.00 | 44.00 | 46.00 | 40.00 | 42.00 | 40.00 | 194.00 | 39.00 | 37.00 | 39.00 | |
| Revenue From Contract With Customer Excluding Assessed Tax | 125.00 | 126.00 | 128.00 | 124.00 | 124.00 | 123.00 | 123.00 | 124.00 | 119.00 | 117.00 | 111.00 | 102.00 | 104.00 | 101.00 | 94.00 | 104.00 | 107.00 | 106.00 | |
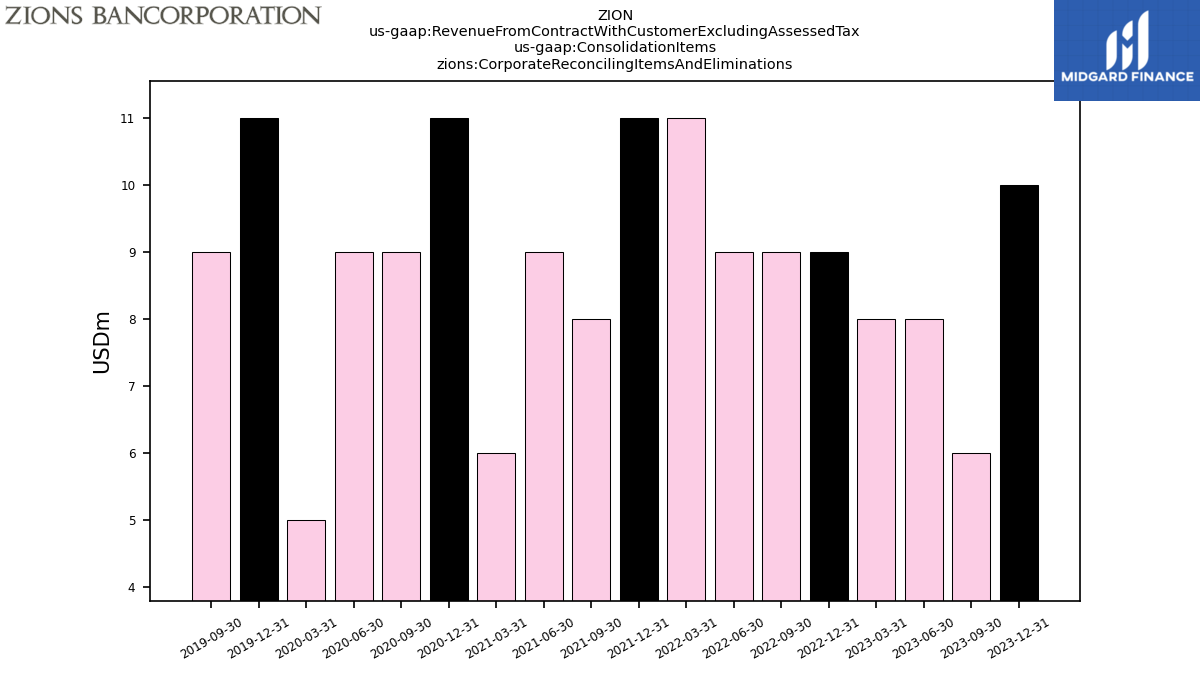
| Corporate Reconciling Items And Eliminations | 10.00 | 6.00 | 8.00 | 8.00 | 9.00 | 9.00 | 9.00 | 11.00 | 11.00 | 8.00 | 9.00 | 6.00 | 11.00 | 9.00 | 9.00 | 5.00 | 11.00 | 9.00 | |
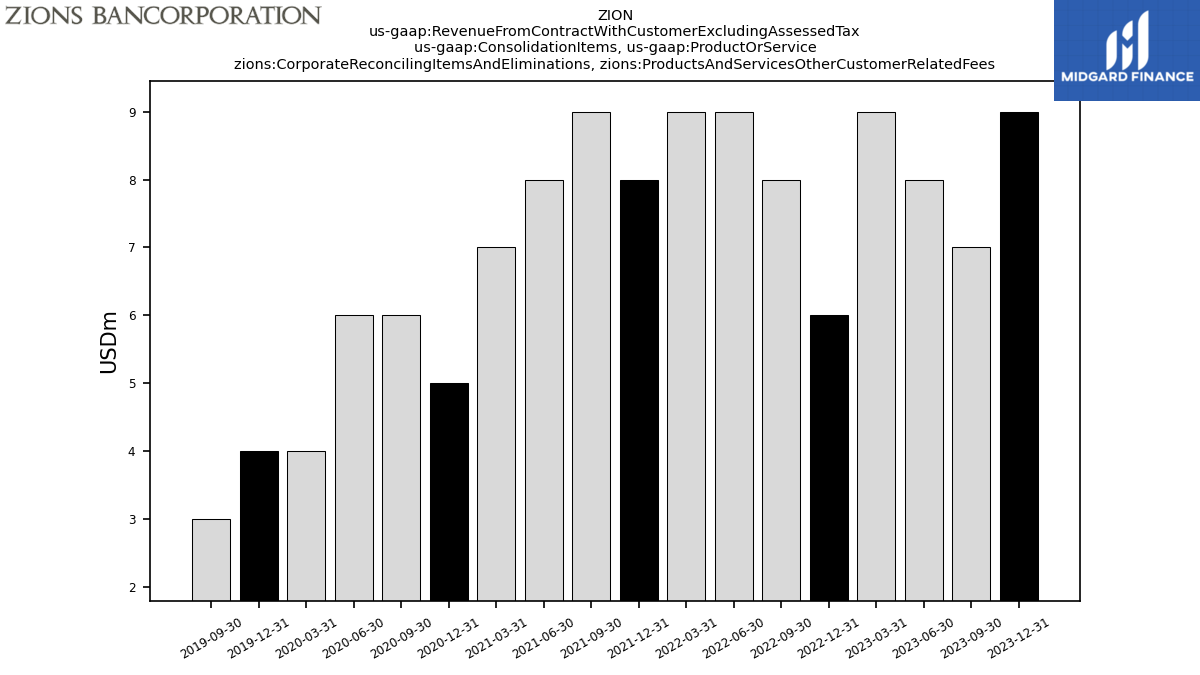
| Corporate Reconciling Items And Eliminations, Products And Services Other Customer Related Fees | 9.00 | 7.00 | 8.00 | 9.00 | 6.00 | 8.00 | 9.00 | 9.00 | 8.00 | 9.00 | 8.00 | 7.00 | 5.00 | 6.00 | 6.00 | 4.00 | 4.00 | 3.00 | |
| Corporate Reconciling Items And Eliminations, Products And Services Wealth Management Fees | 1.00 | -1.00 | NA | NA | NA | NA | NA | NA | -3.00 | 2.00 | NA | NA | 3.00 | -1.00 | 1.00 | NA | NA | NA | |
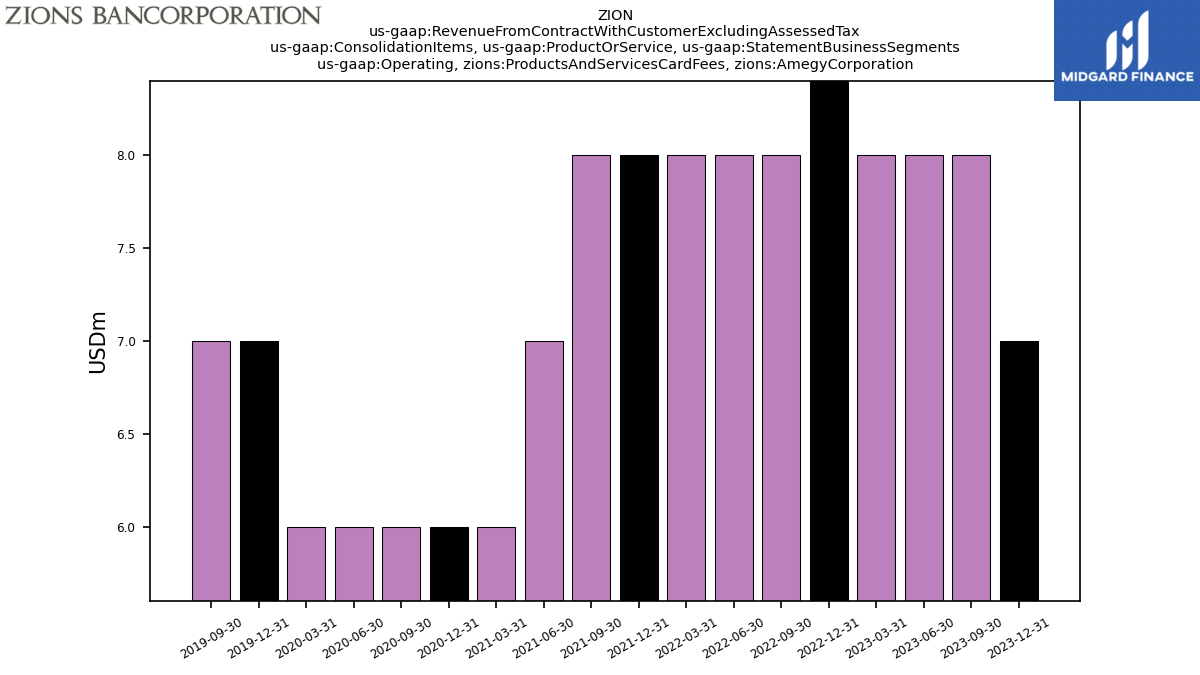
| Operating, Products And Services Card Fees, Amegy Corporation | 7.00 | 8.00 | 8.00 | 8.00 | 9.00 | 8.00 | 8.00 | 8.00 | 8.00 | 8.00 | 7.00 | 6.00 | 6.00 | 6.00 | 6.00 | 6.00 | 7.00 | 7.00 | |
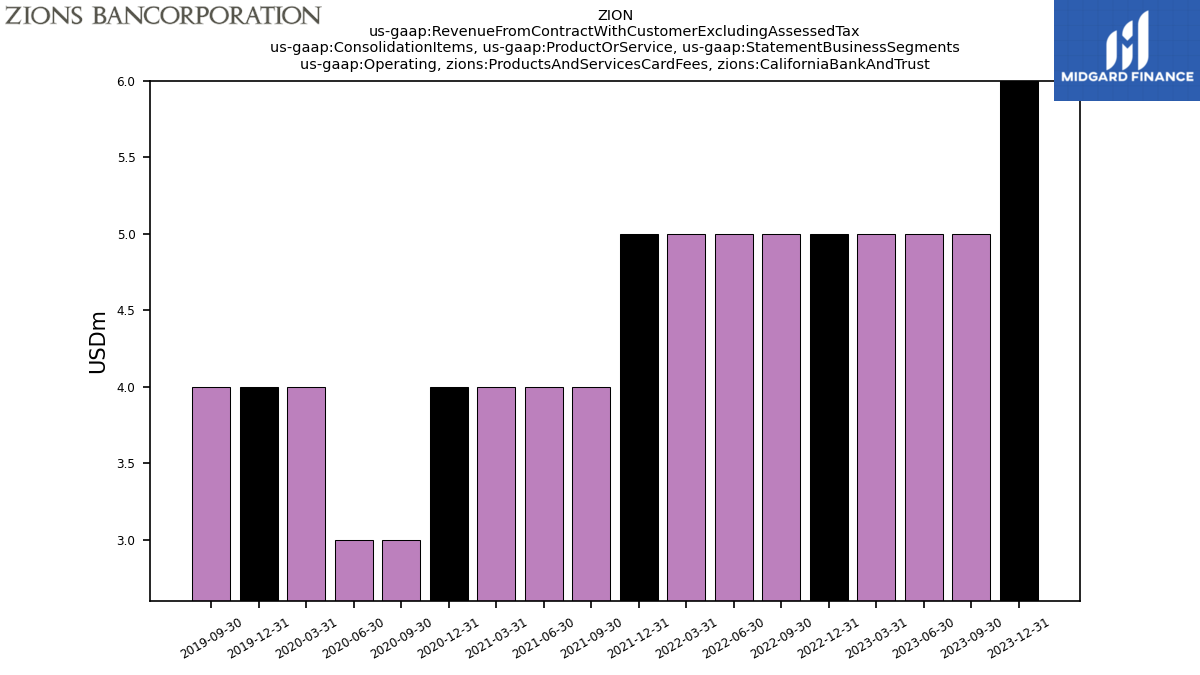
| Operating, Products And Services Card Fees, California Bank And Trust | 6.00 | 5.00 | 5.00 | 5.00 | 5.00 | 5.00 | 5.00 | 5.00 | 5.00 | 4.00 | 4.00 | 4.00 | 4.00 | 3.00 | 3.00 | 4.00 | 4.00 | 4.00 | |
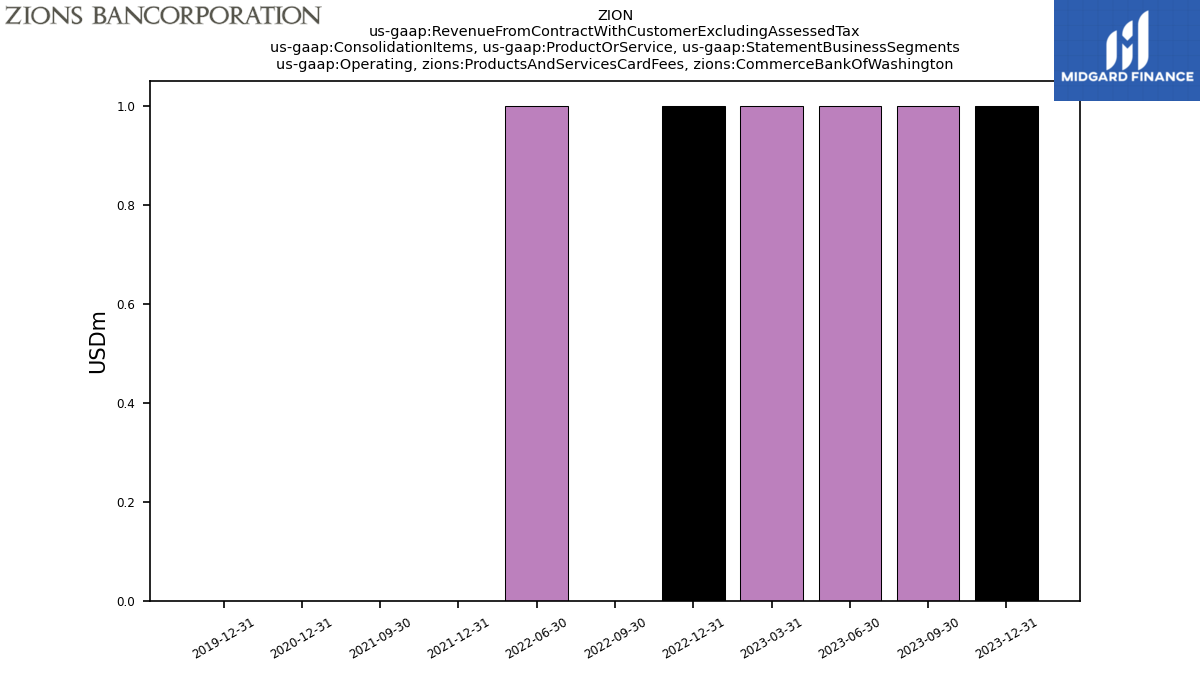
| Operating, Products And Services Card Fees, Commerce Bank Of Washington | 1.00 | 1.00 | 1.00 | 1.00 | 1.00 | 0.00 | 1.00 | NA | 0.00 | 0.00 | NA | NA | 0.00 | NA | NA | NA | 0.00 | NA | |
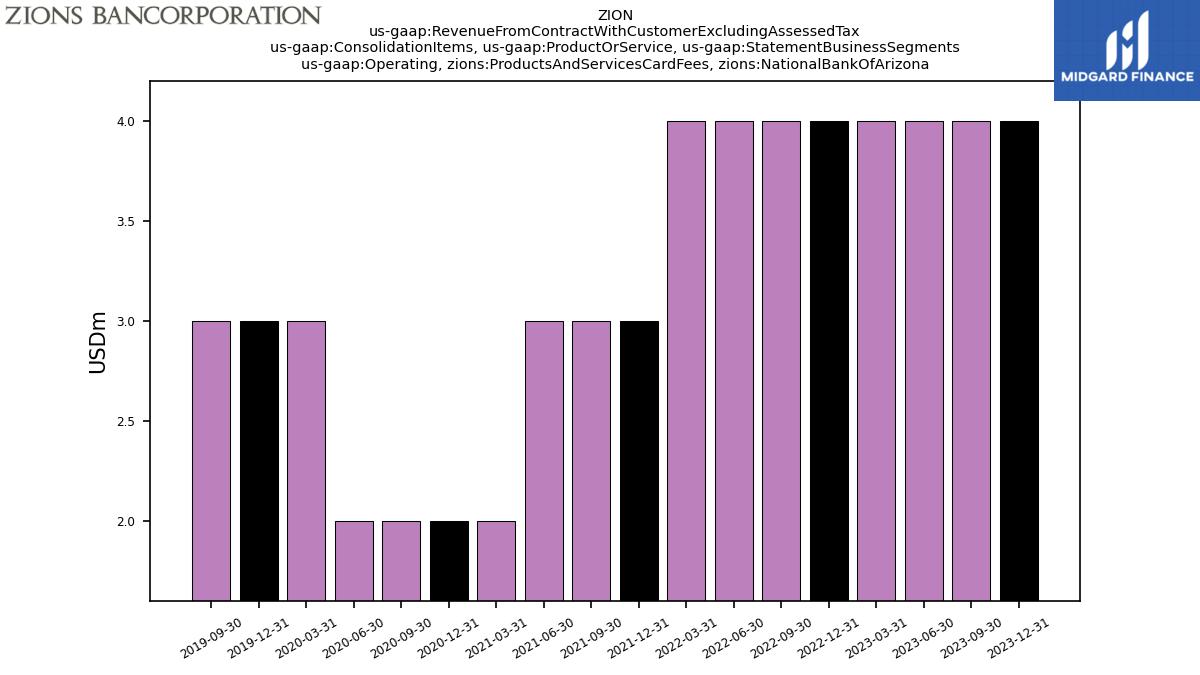
| Operating, Products And Services Card Fees, National Bank Of Arizona | 4.00 | 4.00 | 4.00 | 4.00 | 4.00 | 4.00 | 4.00 | 4.00 | 3.00 | 3.00 | 3.00 | 2.00 | 2.00 | 2.00 | 2.00 | 3.00 | 3.00 | 3.00 | |
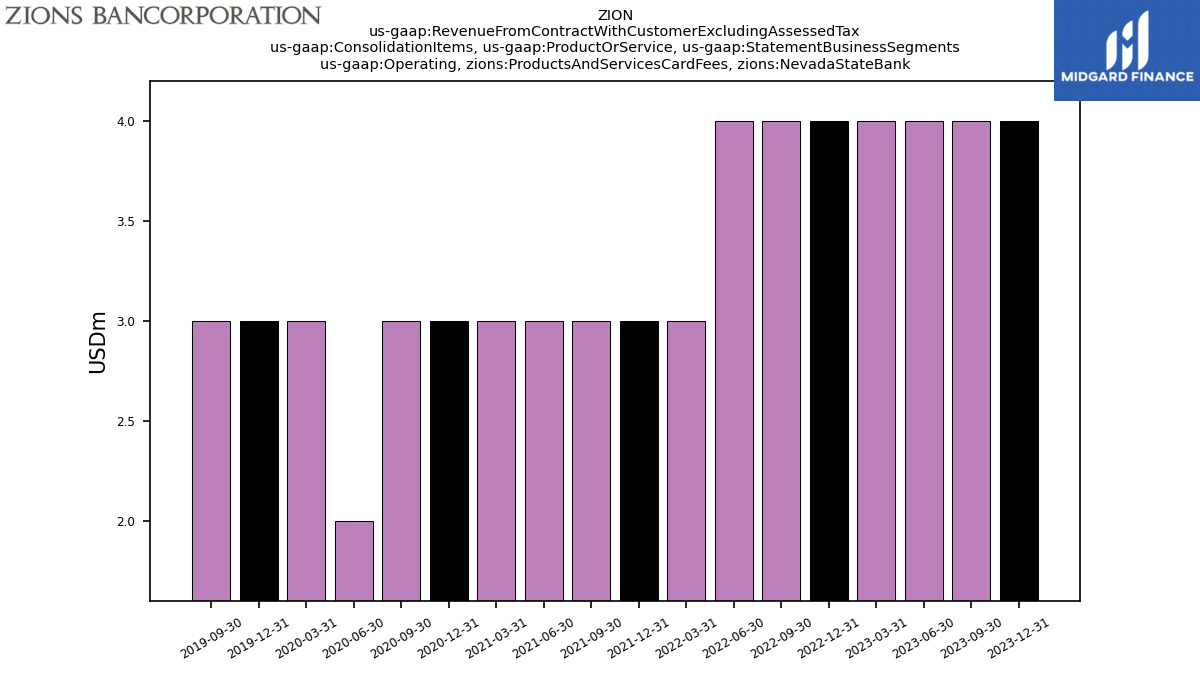
| Operating, Products And Services Card Fees, Nevada State Bank | 4.00 | 4.00 | 4.00 | 4.00 | 4.00 | 4.00 | 4.00 | 3.00 | 3.00 | 3.00 | 3.00 | 3.00 | 3.00 | 3.00 | 2.00 | 3.00 | 3.00 | 3.00 | |
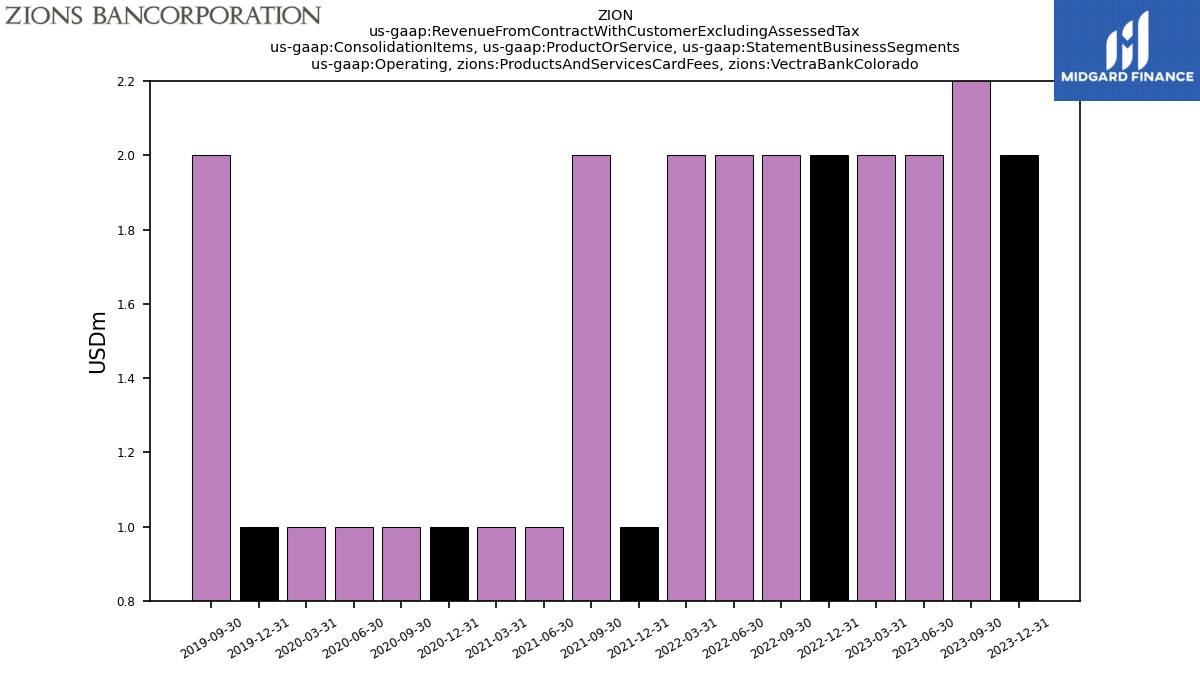
| Operating, Products And Services Card Fees, Vectra Bank Colorado | 2.00 | 3.00 | 2.00 | 2.00 | 2.00 | 2.00 | 2.00 | 2.00 | 1.00 | 2.00 | 1.00 | 1.00 | 1.00 | 1.00 | 1.00 | 1.00 | 1.00 | 2.00 | |
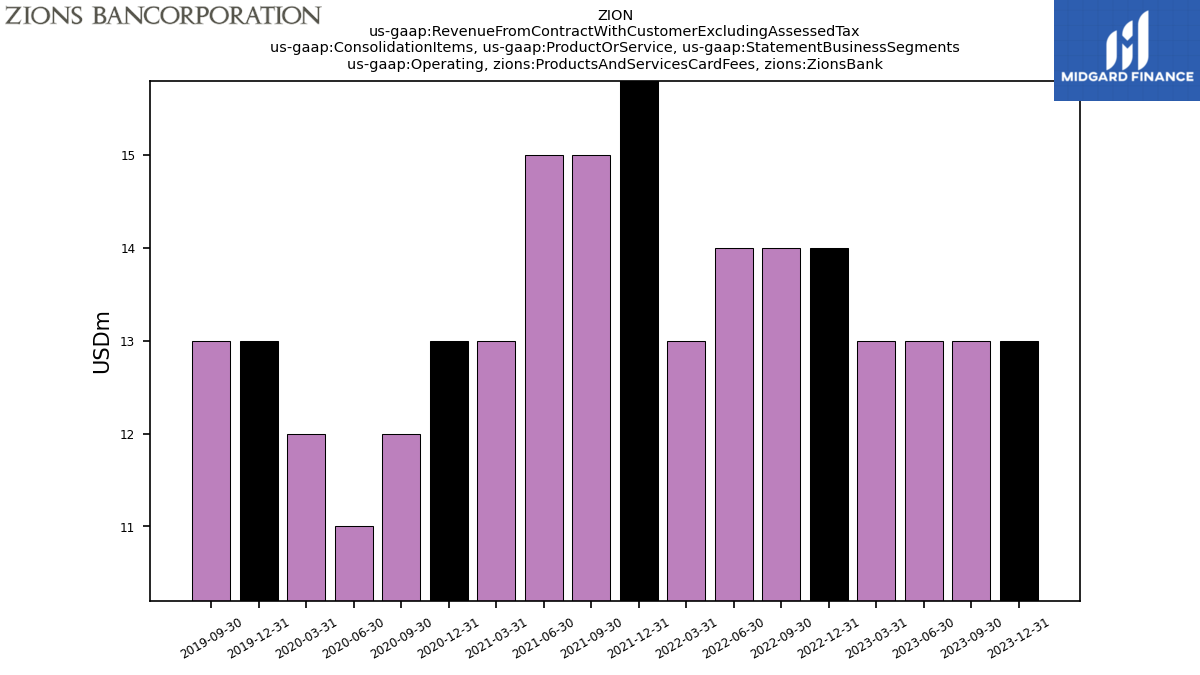
| Operating, Products And Services Card Fees, Zions Bank | 13.00 | 13.00 | 13.00 | 13.00 | 14.00 | 14.00 | 14.00 | 13.00 | 16.00 | 15.00 | 15.00 | 13.00 | 13.00 | 12.00 | 11.00 | 12.00 | 13.00 | 13.00 | |
| Operating, Products And Services Commercial Account Fees, Amegy Corporation | 14.00 | 14.00 | 14.00 | 14.00 | 13.00 | 12.00 | 11.00 | 11.00 | 10.00 | 10.00 | 10.00 | 9.00 | 9.00 | 9.00 | 10.00 | 9.00 | 9.00 | 8.00 | |
| Operating, Products And Services Commercial Account Fees, California Bank And Trust | 8.00 | 8.00 | 8.00 | 7.00 | 7.00 | 7.00 | 7.00 | 7.00 | 6.00 | 7.00 | 6.00 | 6.00 | 5.00 | 6.00 | 5.00 | 6.00 | 6.00 | 6.00 | |
| Operating, Products And Services Commercial Account Fees, Commerce Bank Of Washington | 0.00 | 1.00 | 1.00 | 1.00 | 1.00 | 1.00 | 1.00 | 1.00 | 1.00 | 1.00 | 1.00 | 1.00 | 0.00 | 0.00 | 1.00 | 1.00 | 1.00 | 1.00 | |
| Operating, Products And Services Commercial Account Fees, National Bank Of Arizona | 3.00 | 2.00 | 2.00 | 2.00 | 2.00 | 2.00 | 2.00 | 2.00 | 2.00 | 2.00 | 2.00 | 2.00 | 2.00 | 2.00 | 2.00 | 2.00 | 2.00 | 2.00 | |
| Operating, Products And Services Commercial Account Fees, Nevada State Bank | 3.00 | 3.00 | 3.00 | 3.00 | 3.00 | 3.00 | 2.00 | 3.00 | 2.00 | 3.00 | 2.00 | 2.00 | 2.00 | 2.00 | 1.00 | 2.00 | 2.00 | 2.00 | |
| Operating, Products And Services Commercial Account Fees, Vectra Bank Colorado | 2.00 | 2.00 | 2.00 | 2.00 | 2.00 | 2.00 | 2.00 | 2.00 | 2.00 | 2.00 | 2.00 | 2.00 | 1.00 | 2.00 | 1.00 | 2.00 | 1.00 | 2.00 | |
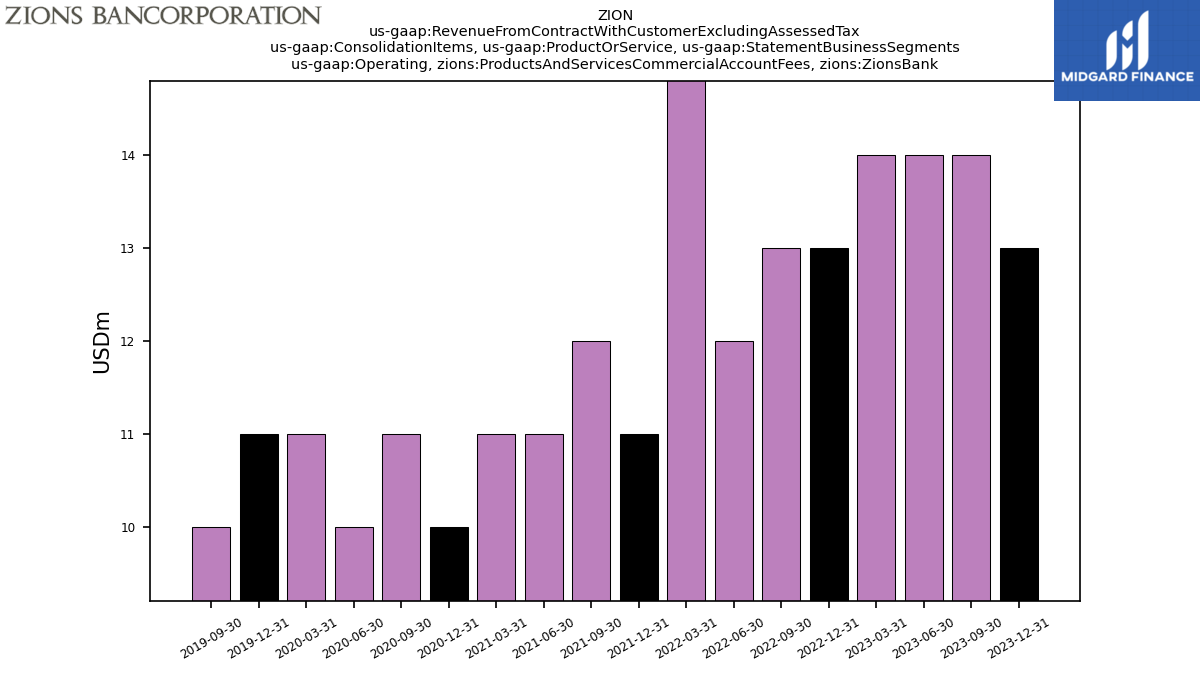
| Operating, Products And Services Commercial Account Fees, Zions Bank | 13.00 | 14.00 | 14.00 | 14.00 | 13.00 | 13.00 | 12.00 | 15.00 | 11.00 | 12.00 | 11.00 | 11.00 | 10.00 | 11.00 | 10.00 | 11.00 | 11.00 | 10.00 | |
| Operating, Products And Services Other Customer Related Fees, Amegy Corporation | 2.00 | 2.00 | 2.00 | 2.00 | 2.00 | 2.00 | 2.00 | 1.00 | 2.00 | 1.00 | 1.00 | 1.00 | 0.00 | 2.00 | 2.00 | 2.00 | 0.00 | NA | |
| Operating, Products And Services Other Customer Related Fees, California Bank And Trust | 1.00 | 2.00 | 2.00 | 1.00 | 2.00 | 2.00 | 2.00 | 1.00 | 1.00 | 1.00 | 1.00 | 1.00 | 0.00 | 1.00 | 1.00 | 2.00 | 1.00 | 1.00 | |
| Operating, Products And Services Other Customer Related Fees, National Bank Of Arizona | 0.00 | 0.00 | NA | NA | 1.00 | 0.00 | NA | NA | 0.00 | 0.00 | NA | NA | 0.00 | NA | NA | NA | 0.00 | NA | |
| Operating, Products And Services Other Customer Related Fees, Vectra Bank Colorado | 1.00 | 1.00 | 1.00 | 1.00 | 1.00 | 1.00 | 1.00 | 1.00 | 0.00 | 1.00 | 1.00 | 1.00 | 1.00 | 1.00 | 1.00 | 1.00 | NA | NA | |
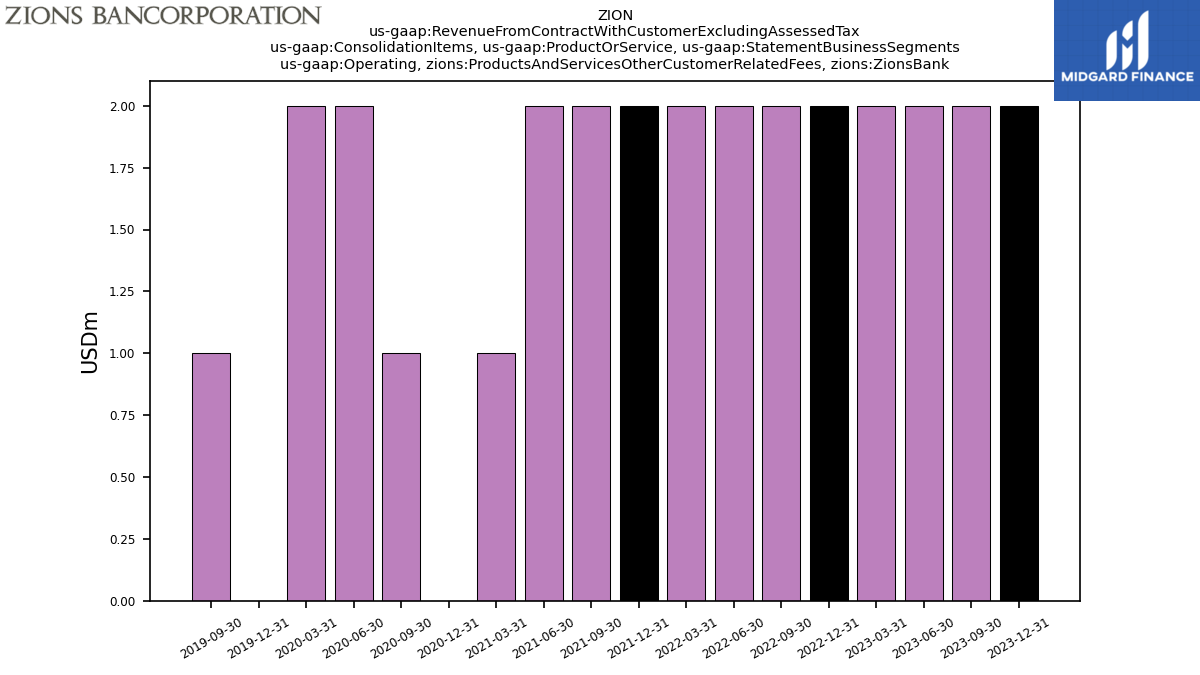
| Operating, Products And Services Other Customer Related Fees, Zions Bank | 2.00 | 2.00 | 2.00 | 2.00 | 2.00 | 2.00 | 2.00 | 2.00 | 2.00 | 2.00 | 2.00 | 1.00 | 0.00 | 1.00 | 2.00 | 2.00 | 0.00 | 1.00 | |
| Operating, Products And Services Retail And Business Banking Fees, Amegy Corporation | 4.00 | 3.00 | 4.00 | 3.00 | 4.00 | 4.00 | 4.00 | 4.00 | 4.00 | 4.00 | 4.00 | 4.00 | 4.00 | 4.00 | 3.00 | 4.00 | 4.00 | 5.00 | |
| Operating, Products And Services Retail And Business Banking Fees, California Bank And Trust | 3.00 | 3.00 | 3.00 | 3.00 | 2.00 | 3.00 | 3.00 | 3.00 | 3.00 | 3.00 | 3.00 | 3.00 | 3.00 | 3.00 | 3.00 | 3.00 | 3.00 | 3.00 | |
| Operating, Products And Services Retail And Business Banking Fees, Nevada State Bank | 3.00 | 3.00 | 3.00 | 3.00 | 2.00 | 3.00 | 3.00 | 3.00 | 2.00 | 3.00 | 3.00 | 3.00 | 2.00 | 2.00 | 2.00 | 3.00 | 3.00 | 3.00 | |
| Operating, Products And Services Retail And Business Banking Fees, Vectra Bank Colorado | 1.00 | 1.00 | 1.00 | 1.00 | 1.00 | 1.00 | 1.00 | 1.00 | 1.00 | 1.00 | 1.00 | 1.00 | 1.00 | 1.00 | 1.00 | 1.00 | 2.00 | 1.00 | |
| Operating, Products And Services Retail And Business Banking Fees, Zions Bank | 5.00 | 5.00 | 5.00 | 5.00 | 5.00 | 5.00 | 6.00 | 6.00 | 6.00 | 6.00 | 6.00 | 5.00 | 6.00 | 5.00 | 5.00 | 5.00 | 5.00 | 6.00 | |
| Operating, Products And Services Wealth Management Fees, Amegy Corporation | 4.00 | 4.00 | 4.00 | 4.00 | 3.00 | 4.00 | 4.00 | 4.00 | 4.00 | 3.00 | 3.00 | 3.00 | 2.00 | 2.00 | 2.00 | NA | NA | NA | |
| Operating, Products And Services Wealth Management Fees, California Bank And Trust | 1.00 | 1.00 | 1.00 | 1.00 | 1.00 | 1.00 | 1.00 | 1.00 | 1.00 | 2.00 | 1.00 | 1.00 | 1.00 | 1.00 | 1.00 | NA | NA | NA | |
| Operating, Products And Services Wealth Management Fees, National Bank Of Arizona | 0.00 | 1.00 | 1.00 | 1.00 | 1.00 | 1.00 | 1.00 | 1.00 | 1.00 | 1.00 | 1.00 | 1.00 | 0.00 | 1.00 | NA | NA | NA | NA | |
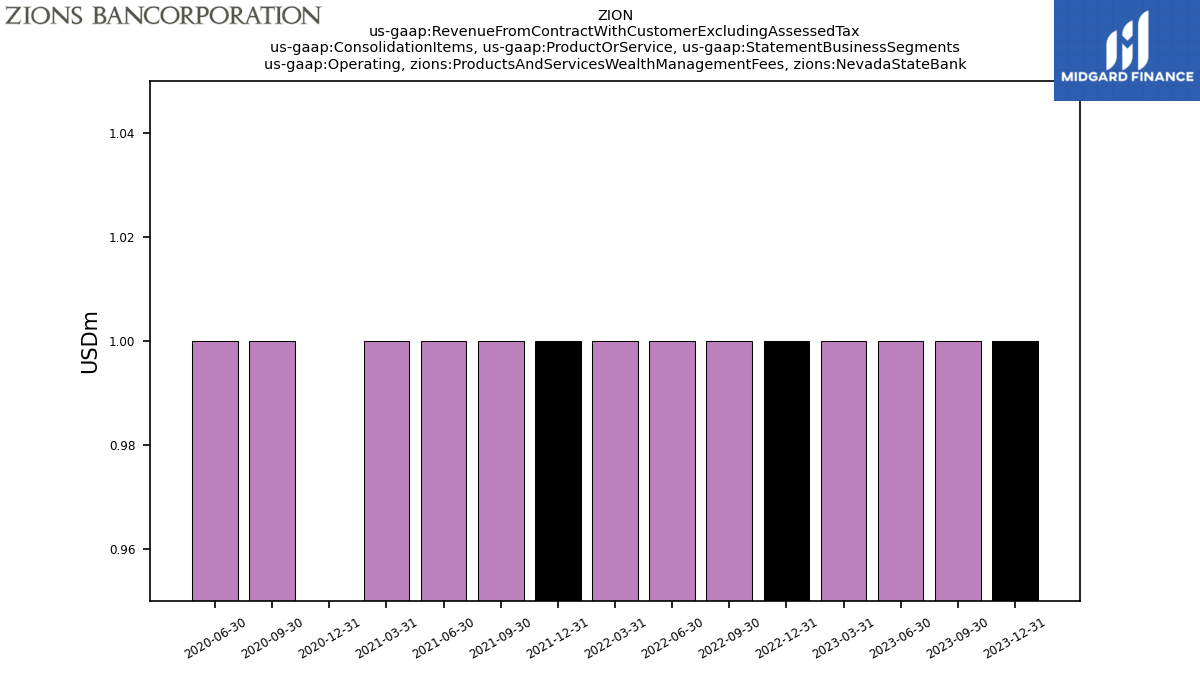
| Operating, Products And Services Wealth Management Fees, Nevada State Bank | 1.00 | 1.00 | 1.00 | 1.00 | 1.00 | 1.00 | 1.00 | 1.00 | 1.00 | 1.00 | 1.00 | 1.00 | 0.00 | 1.00 | 1.00 | NA | NA | NA | |
| Operating, Products And Services Wealth Management Fees, Vectra Bank Colorado | 0.00 | 0.00 | 1.00 | NA | 0.00 | 0.00 | NA | NA | 1.00 | 0.00 | NA | NA | 0.00 | 0.00 | NA | NA | NA | NA | |
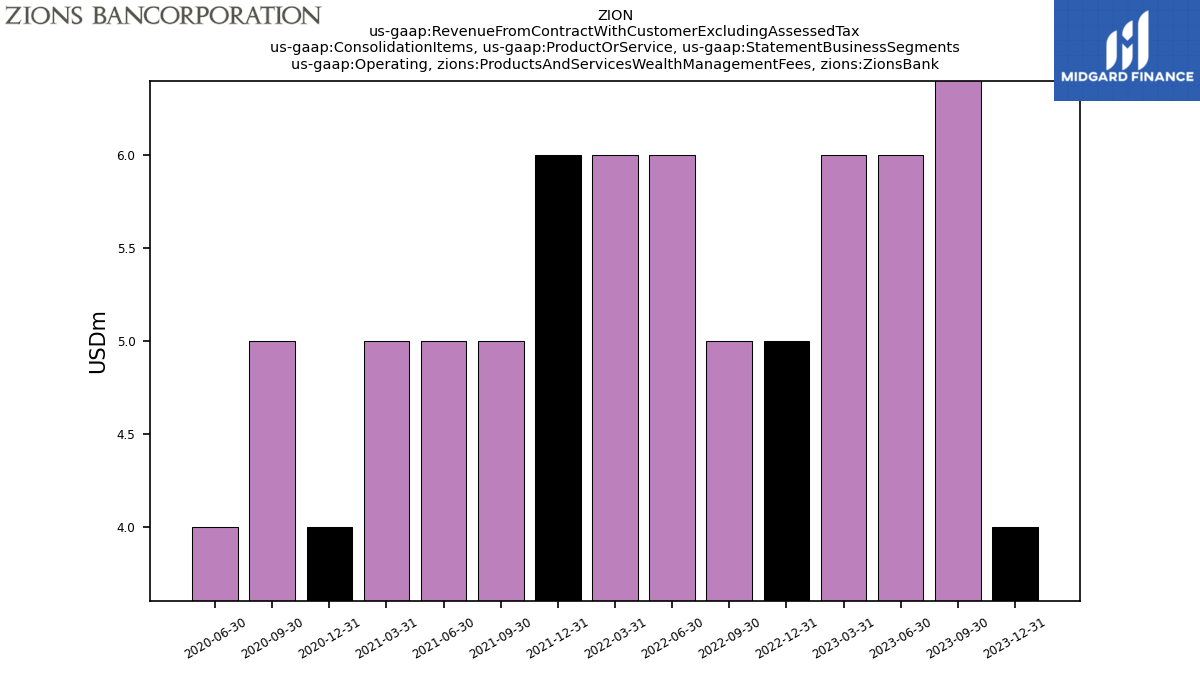
| Operating, Products And Services Wealth Management Fees, Zions Bank | 4.00 | 7.00 | 6.00 | 6.00 | 5.00 | 5.00 | 6.00 | 6.00 | 6.00 | 5.00 | 5.00 | 5.00 | 4.00 | 5.00 | 4.00 | NA | NA | NA | |
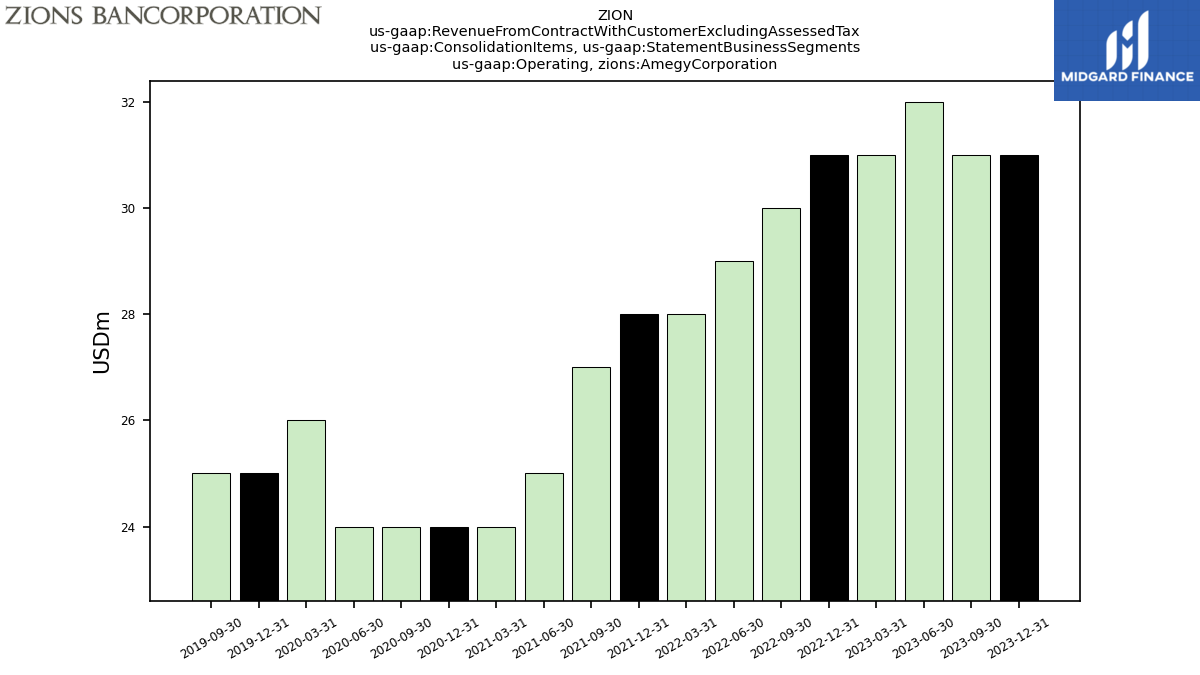
| Operating, Amegy Corporation | 31.00 | 31.00 | 32.00 | 31.00 | 31.00 | 30.00 | 29.00 | 28.00 | 28.00 | 27.00 | 25.00 | 24.00 | 24.00 | 24.00 | 24.00 | 26.00 | 25.00 | 25.00 | |
| Operating, California Bank And Trust | 19.00 | 19.00 | 19.00 | 17.00 | 17.00 | 18.00 | 18.00 | 17.00 | 16.00 | 17.00 | 15.00 | 15.00 | 14.00 | 13.00 | 13.00 | 16.00 | 15.00 | 15.00 | |
| Operating, Commerce Bank Of Washington | 2.00 | 2.00 | 2.00 | 2.00 | 2.00 | 1.00 | 2.00 | 1.00 | 1.00 | 1.00 | 1.00 | 1.00 | 0.00 | 1.00 | 1.00 | 1.00 | 1.00 | 1.00 | |
| Operating, National Bank Of Arizona | 9.00 | 9.00 | 9.00 | 9.00 | 10.00 | 9.00 | 9.00 | 9.00 | 8.00 | 8.00 | 8.00 | 7.00 | 7.00 | 7.00 | 6.00 | 8.00 | 8.00 | 8.00 | |
| Operating, Nevada State Bank | 11.00 | 11.00 | 11.00 | 11.00 | 10.00 | 11.00 | 10.00 | 10.00 | 9.00 | 10.00 | 9.00 | 9.00 | 8.00 | 8.00 | 6.00 | 9.00 | 8.00 | 9.00 | |
| Operating, Vectra Bank Colorado | 6.00 | 7.00 | 7.00 | 6.00 | 6.00 | 6.00 | 6.00 | 6.00 | 5.00 | 6.00 | 5.00 | 5.00 | 4.00 | 5.00 | 4.00 | 5.00 | 5.00 | 5.00 | |
| Operating, Zions Bank | 37.00 | 41.00 | 40.00 | 40.00 | 39.00 | 39.00 | 40.00 | 42.00 | 41.00 | 40.00 | 39.00 | 35.00 | 36.00 | 35.00 | 31.00 | 34.00 | 34.00 | 34.00 | |
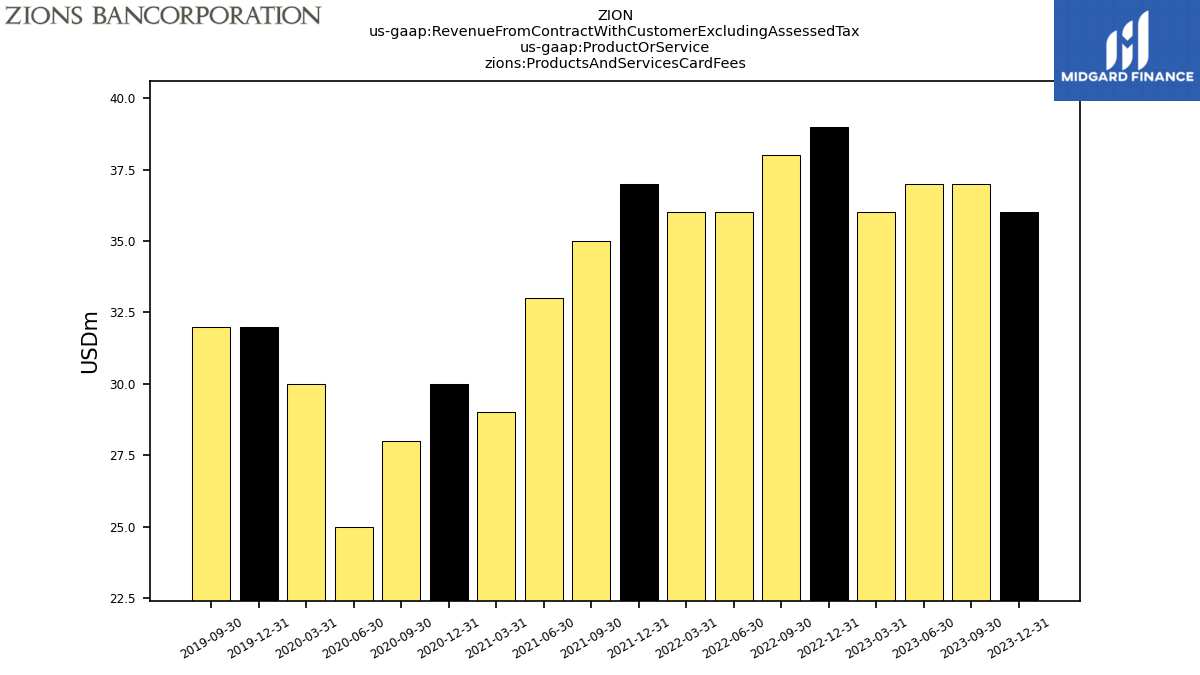
| Products And Services Card Fees | 36.00 | 37.00 | 37.00 | 36.00 | 39.00 | 38.00 | 36.00 | 36.00 | 37.00 | 35.00 | 33.00 | 29.00 | 30.00 | 28.00 | 25.00 | 30.00 | 32.00 | 32.00 | |
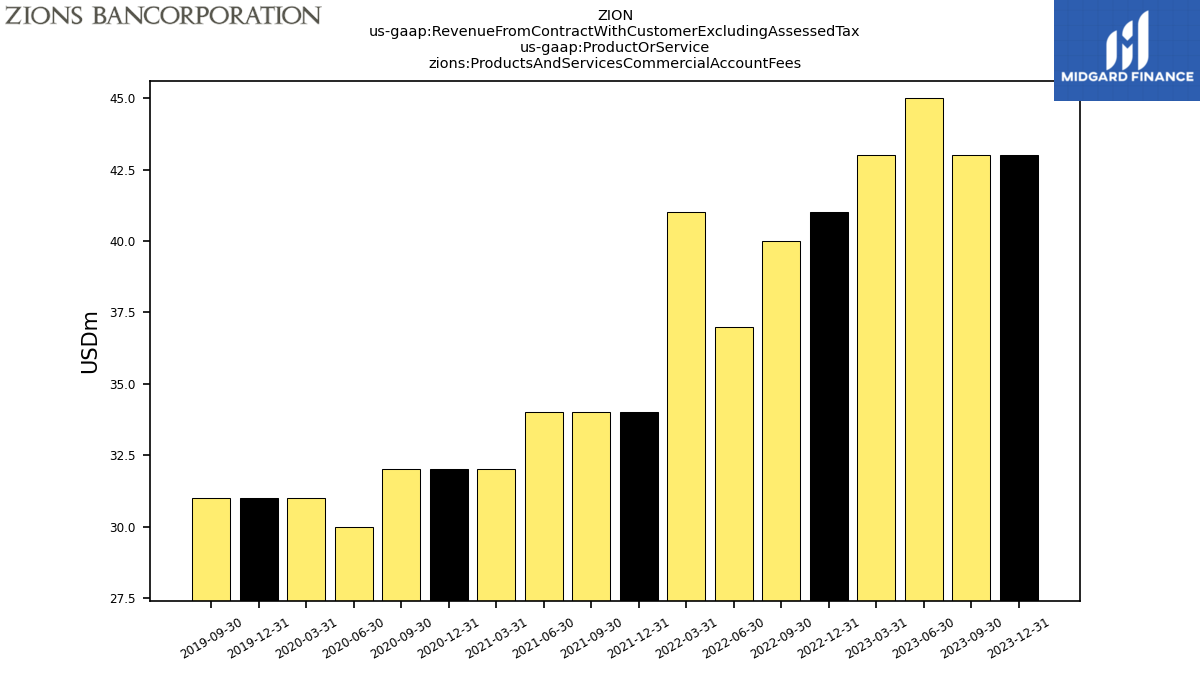
| Products And Services Commercial Account Fees | 43.00 | 43.00 | 45.00 | 43.00 | 41.00 | 40.00 | 37.00 | 41.00 | 34.00 | 34.00 | 34.00 | 32.00 | 32.00 | 32.00 | 30.00 | 31.00 | 31.00 | 31.00 | |
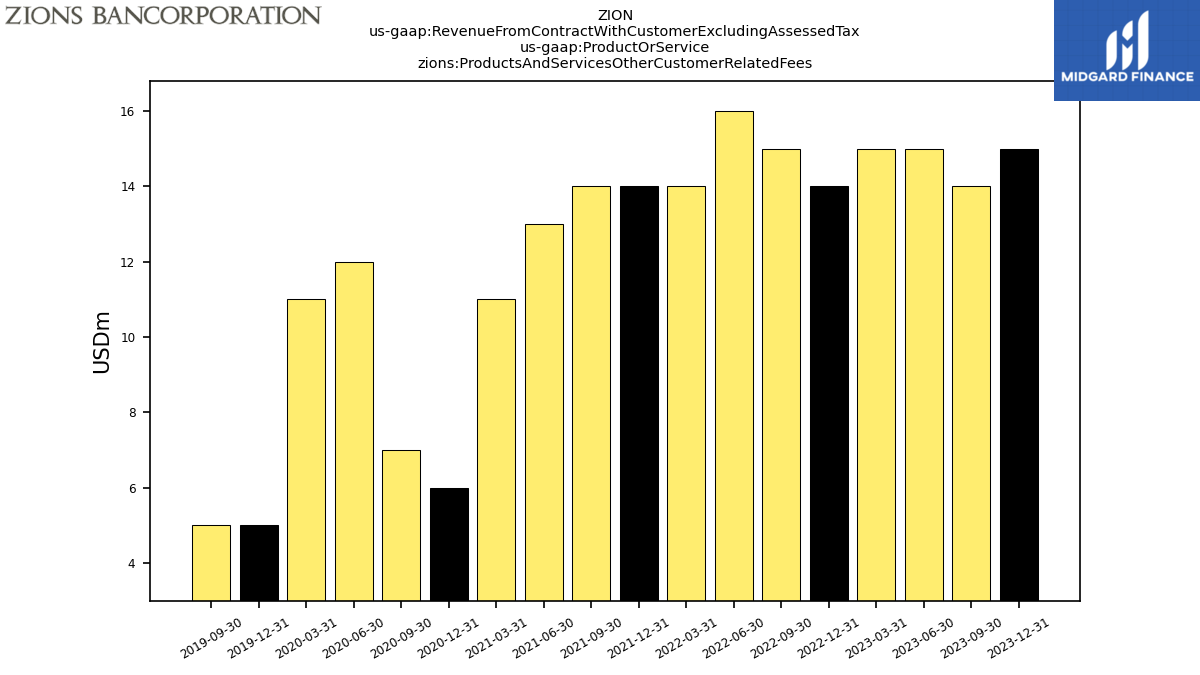
| Products And Services Other Customer Related Fees | 15.00 | 14.00 | 15.00 | 15.00 | 14.00 | 15.00 | 16.00 | 14.00 | 14.00 | 14.00 | 13.00 | 11.00 | 6.00 | 7.00 | 12.00 | 11.00 | 5.00 | 5.00 | |
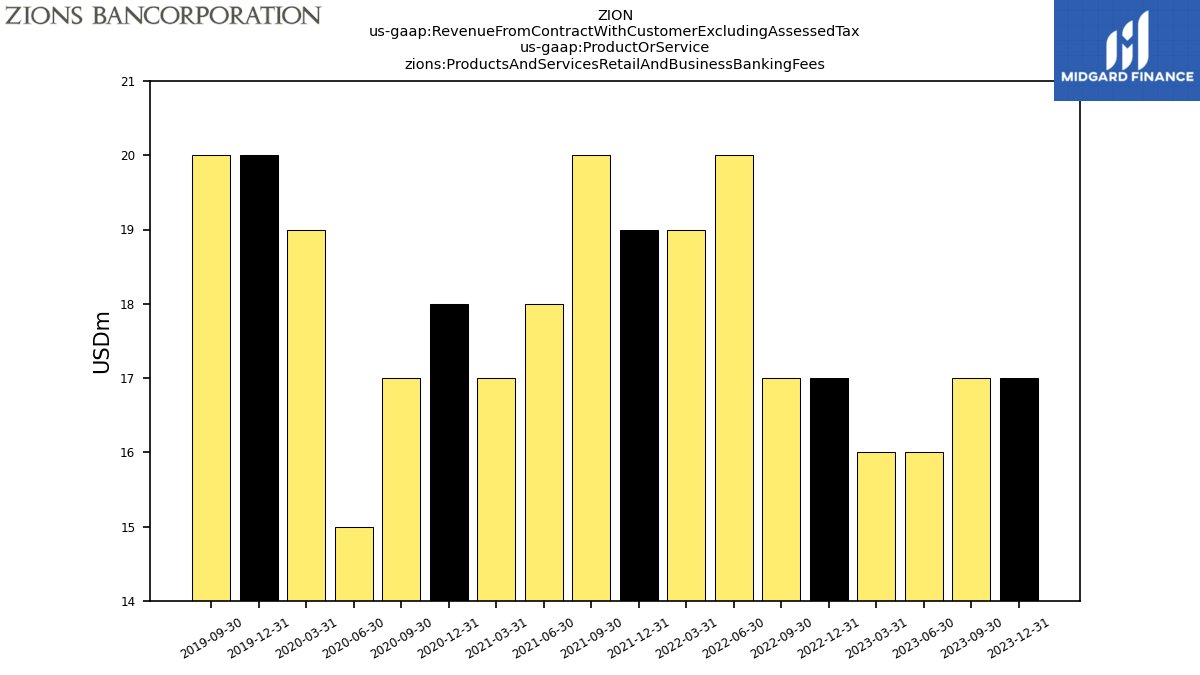
| Products And Services Retail And Business Banking Fees | 17.00 | 17.00 | 16.00 | 16.00 | 17.00 | 17.00 | 20.00 | 19.00 | 19.00 | 20.00 | 18.00 | 17.00 | 18.00 | 17.00 | 15.00 | 19.00 | 20.00 | 20.00 | |
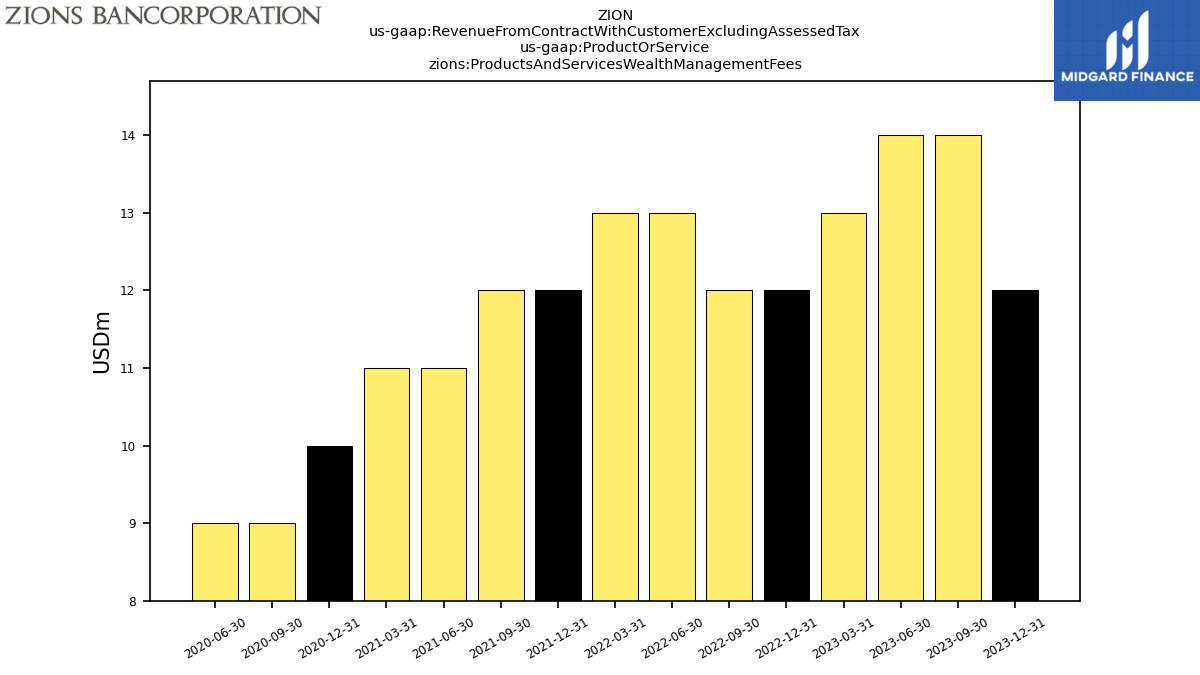
| Products And Services Wealth Management Fees | 12.00 | 14.00 | 14.00 | 13.00 | 12.00 | 12.00 | 13.00 | 13.00 | 12.00 | 12.00 | 11.00 | 11.00 | 10.00 | 9.00 | 9.00 | NA | NA | NA | |
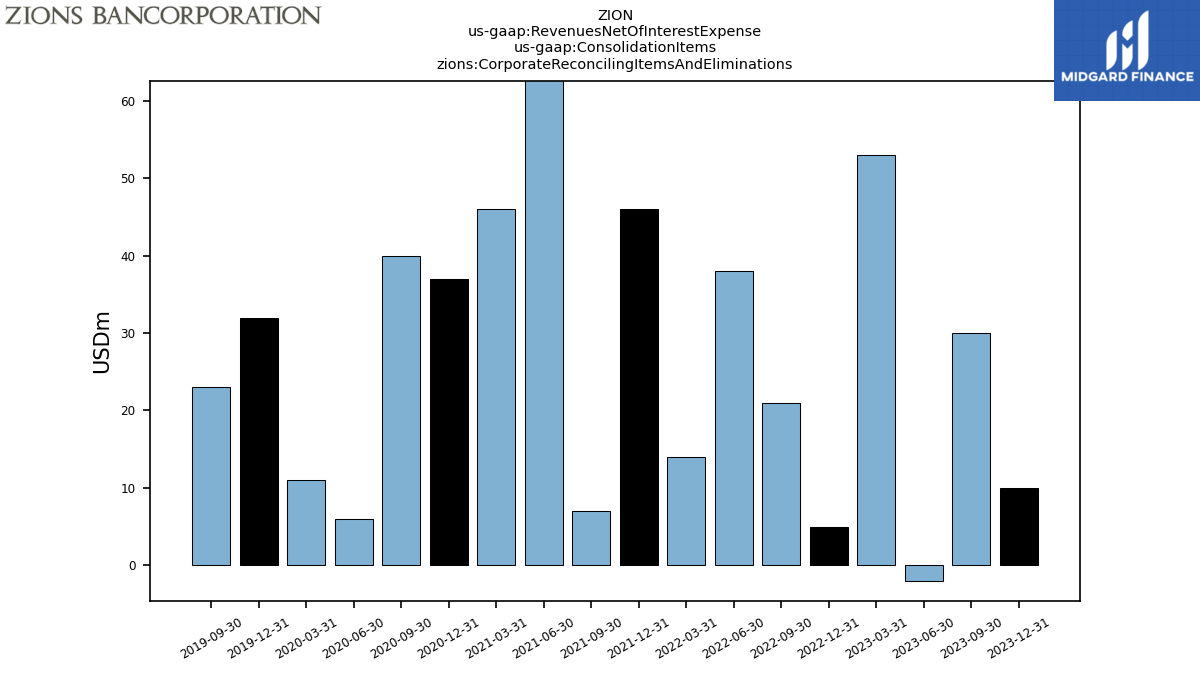
| Revenues Net Of Interest Expense | 731.00 | 765.00 | 780.00 | 839.00 | 873.00 | 828.00 | 765.00 | 686.00 | 743.00 | 694.00 | 760.00 | 714.00 | 717.00 | 713.00 | 680.00 | 682.00 | 711.00 | 715.00 | |
| Corporate Reconciling Items And Eliminations | 10.00 | 30.00 | -2.00 | 53.00 | 5.00 | 21.00 | 38.00 | 14.00 | 46.00 | 7.00 | 73.00 | 46.00 | 37.00 | 40.00 | 6.00 | 11.00 | 32.00 | 23.00 | |
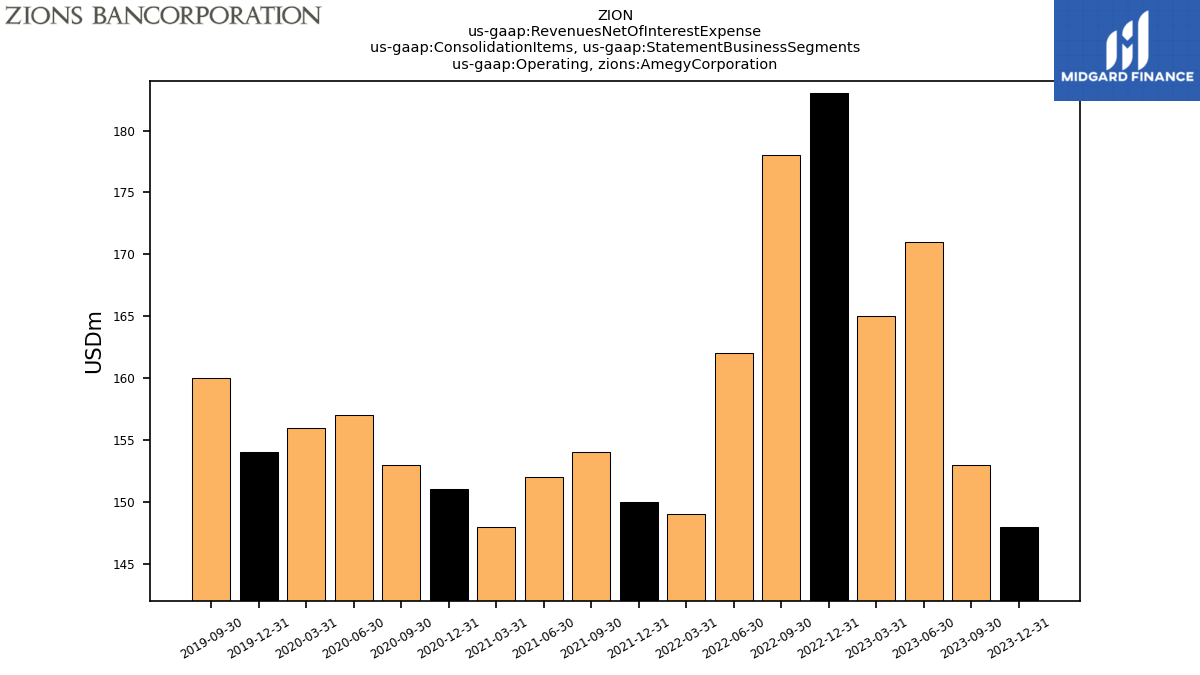
| Operating, Amegy Corporation | 148.00 | 153.00 | 171.00 | 165.00 | 183.00 | 178.00 | 162.00 | 149.00 | 150.00 | 154.00 | 152.00 | 148.00 | 151.00 | 153.00 | 157.00 | 156.00 | 154.00 | 160.00 | |
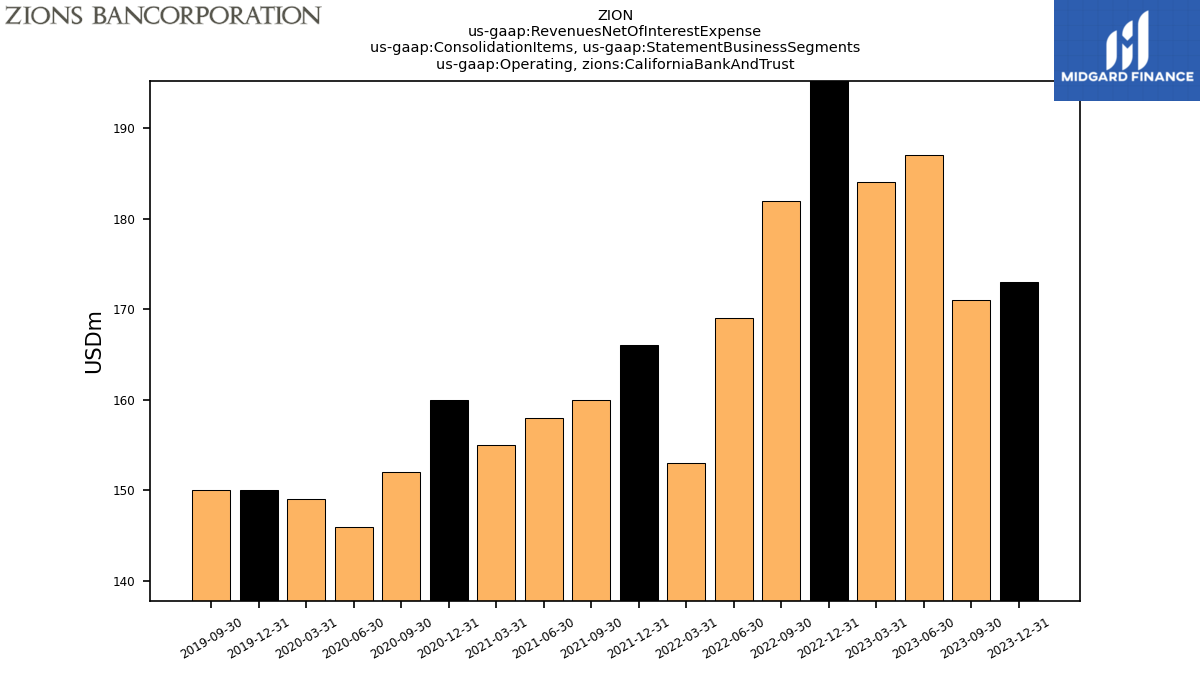
| Operating, California Bank And Trust | 173.00 | 171.00 | 187.00 | 184.00 | 199.00 | 182.00 | 169.00 | 153.00 | 166.00 | 160.00 | 158.00 | 155.00 | 160.00 | 152.00 | 146.00 | 149.00 | 150.00 | 150.00 | |
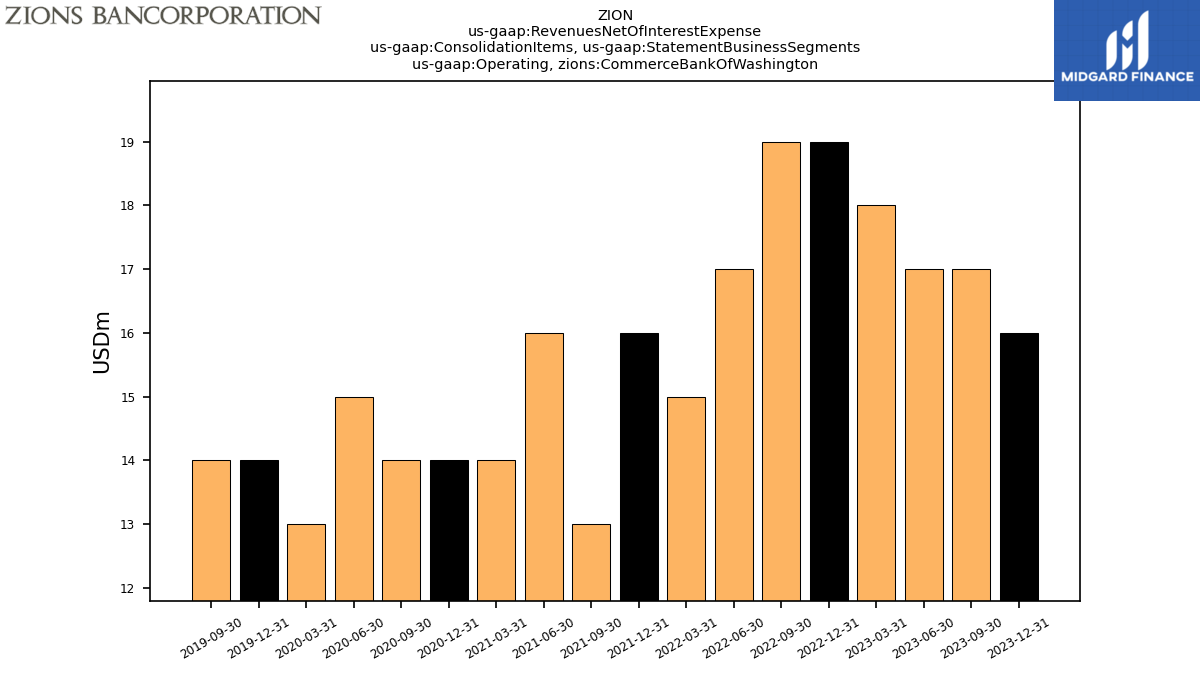
| Operating, Commerce Bank Of Washington | 16.00 | 17.00 | 17.00 | 18.00 | 19.00 | 19.00 | 17.00 | 15.00 | 16.00 | 13.00 | 16.00 | 14.00 | 14.00 | 14.00 | 15.00 | 13.00 | 14.00 | 14.00 | |
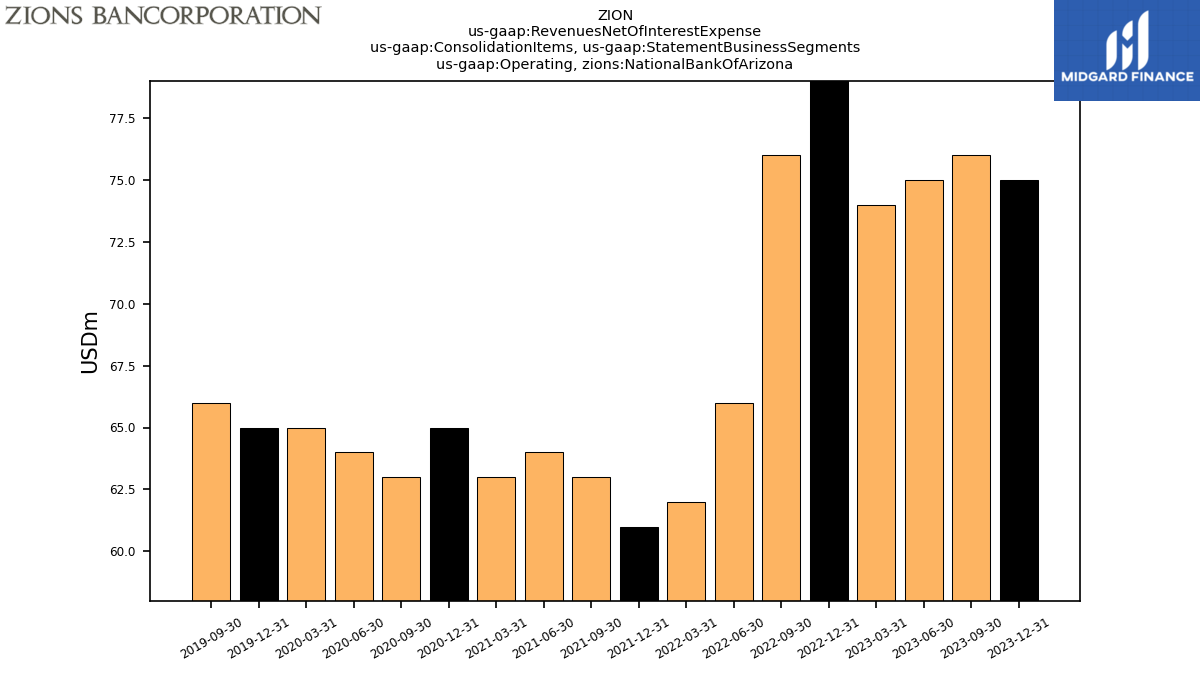
| Operating, National Bank Of Arizona | 75.00 | 76.00 | 75.00 | 74.00 | 85.00 | 76.00 | 66.00 | 62.00 | 61.00 | 63.00 | 64.00 | 63.00 | 65.00 | 63.00 | 64.00 | 65.00 | 65.00 | 66.00 | |
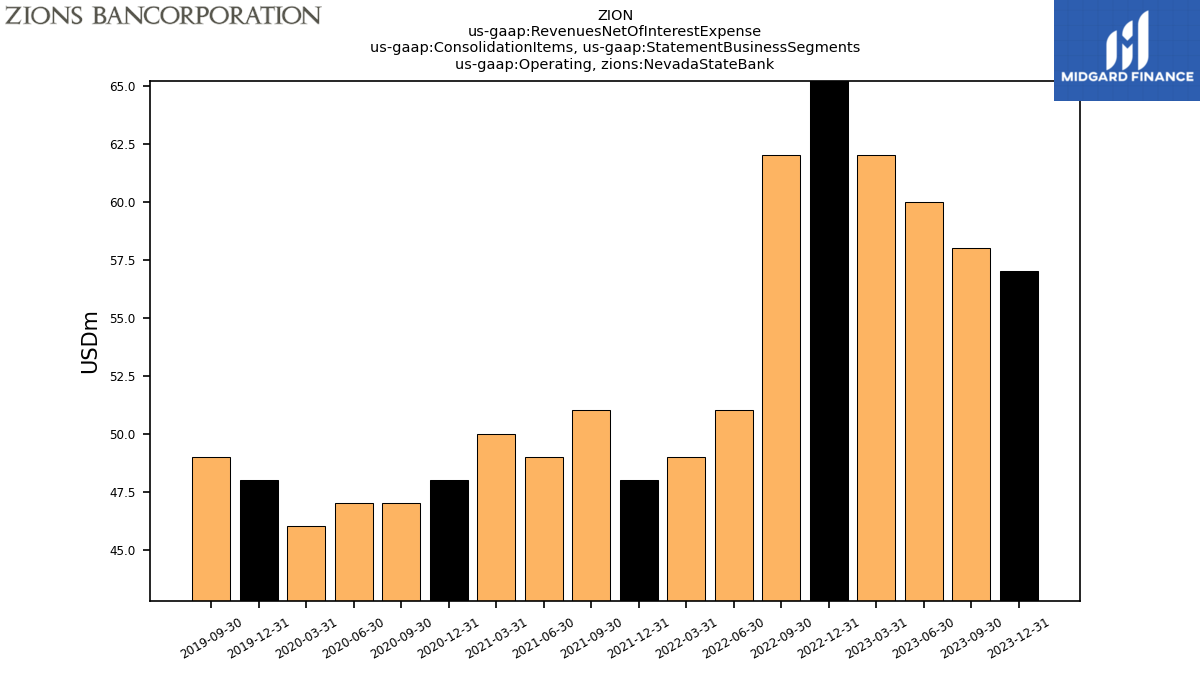
| Operating, Nevada State Bank | 57.00 | 58.00 | 60.00 | 62.00 | 68.00 | 62.00 | 51.00 | 49.00 | 48.00 | 51.00 | 49.00 | 50.00 | 48.00 | 47.00 | 47.00 | 46.00 | 48.00 | 49.00 | |
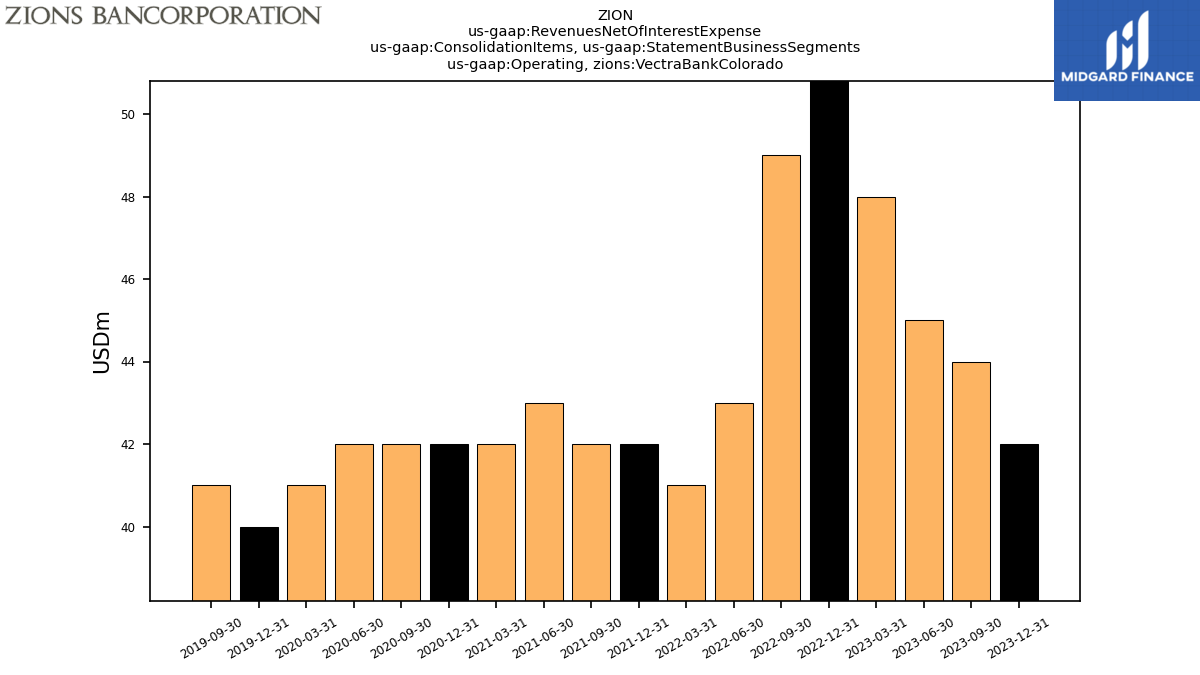
| Operating, Vectra Bank Colorado | 42.00 | 44.00 | 45.00 | 48.00 | 51.00 | 49.00 | 43.00 | 41.00 | 42.00 | 42.00 | 43.00 | 42.00 | 42.00 | 42.00 | 42.00 | 41.00 | 40.00 | 41.00 | |
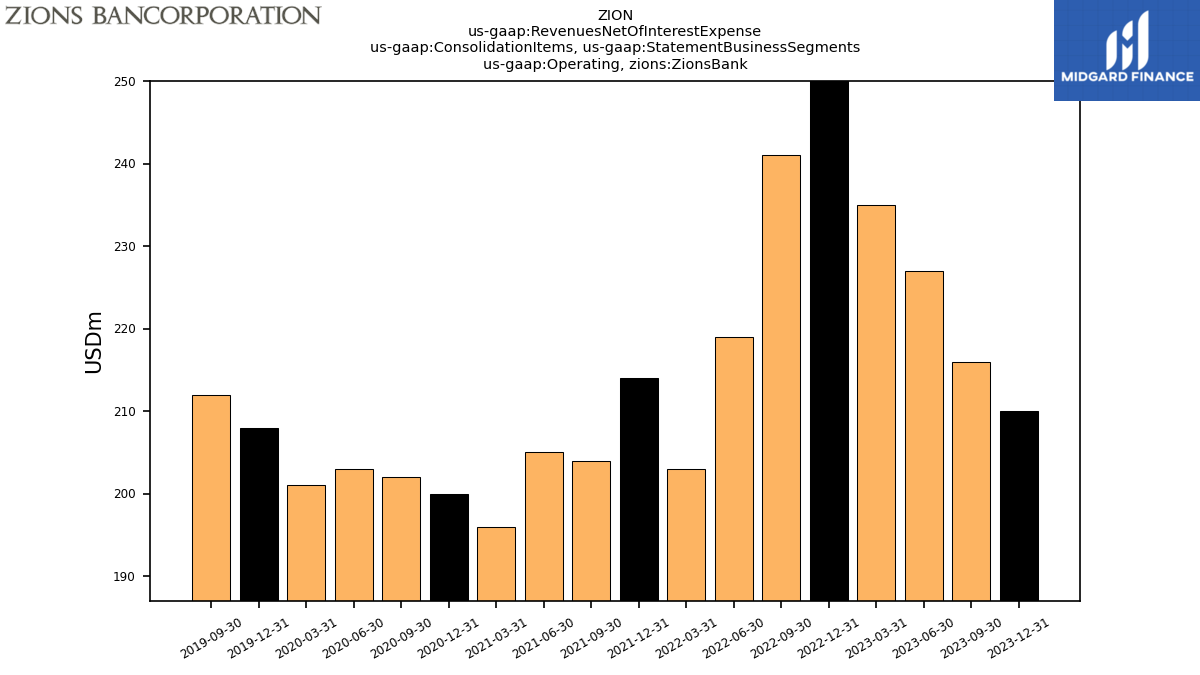
| Operating, Zions Bank | 210.00 | 216.00 | 227.00 | 235.00 | 263.00 | 241.00 | 219.00 | 203.00 | 214.00 | 204.00 | 205.00 | 196.00 | 200.00 | 202.00 | 203.00 | 201.00 | 208.00 | 212.00 |