
| 2023-12-31 | 2023-09-30 | 2023-06-30 | 2023-03-31 | 2022-12-31 | 2022-09-30 | 2022-06-30 | 2022-03-31 | 2021-12-31 | 2021-09-30 | 2021-06-30 | 2021-03-31 | 2020-12-31 | 2020-09-30 | 2020-06-30 | 2020-03-31 | 2019-12-31 | 2019-09-30 | 2019-06-30 | 2019-03-31 | 2018-12-31 | 2018-09-30 | 2018-06-30 | 2018-03-31 | 2017-12-31 | 2017-09-30 | 2017-06-30 | 2017-03-31 | 2016-12-31 | ||
|---|---|---|---|---|---|---|---|---|---|---|---|---|---|---|---|---|---|---|---|---|---|---|---|---|---|---|---|---|---|---|
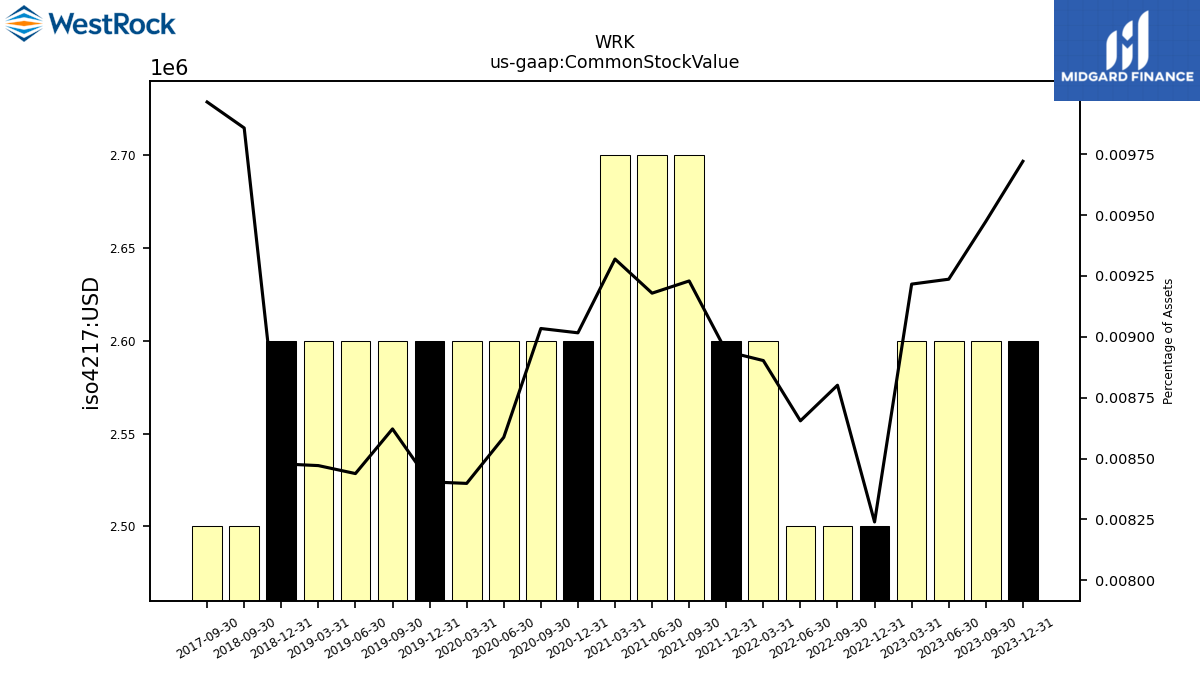
| Common Stock Value | 2.60 | 2.60 | 2.60 | 2.60 | 2.50 | 2.50 | 2.50 | 2.60 | 2.60 | 2.70 | 2.70 | 2.70 | 2.60 | 2.60 | 2.60 | 2.60 | 2.60 | 2.60 | 2.60 | 2.60 | 2.60 | 2.50 | NA | NA | NA | 2.50 | NA | NA | NA | |
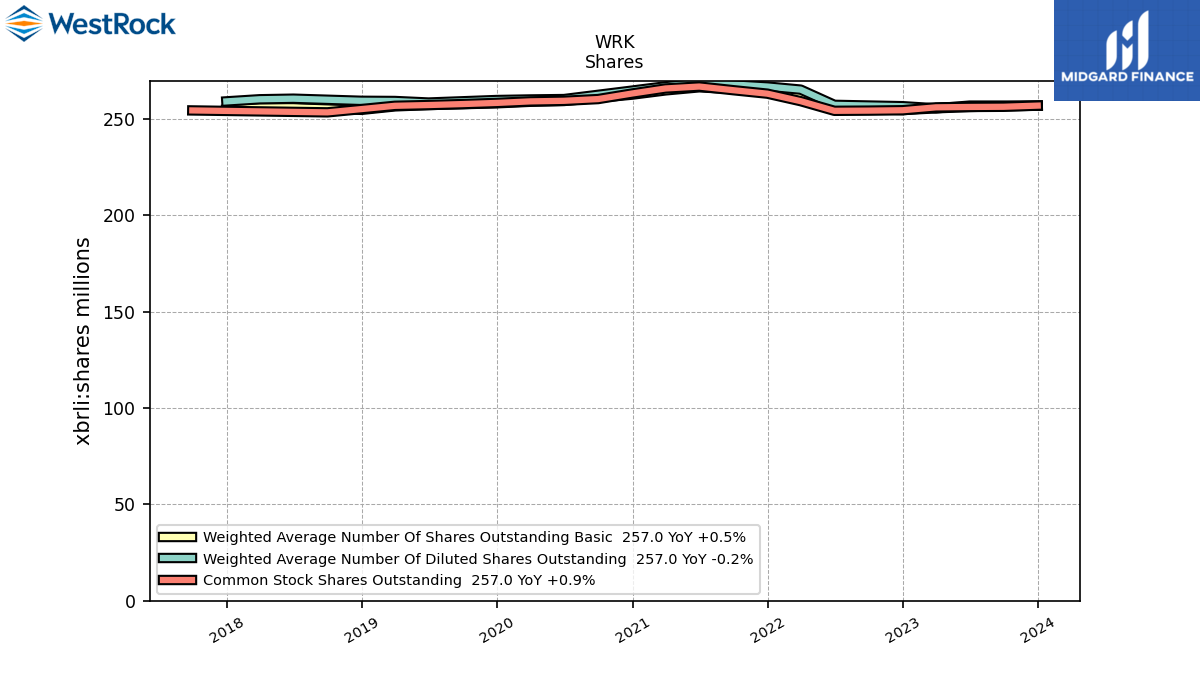
| Weighted Average Number Of Diluted Shares Outstanding | 257.00 | NA | 257.00 | 255.60 | 256.70 | NA | 257.40 | 265.30 | 266.90 | NA | 269.00 | 267.00 | 264.80 | NA | 260.40 | 260.20 | 259.90 | NA | 258.60 | 259.40 | 259.50 | NA | 260.60 | 260.30 | 259.20 | NA | NA | NA | NA | |
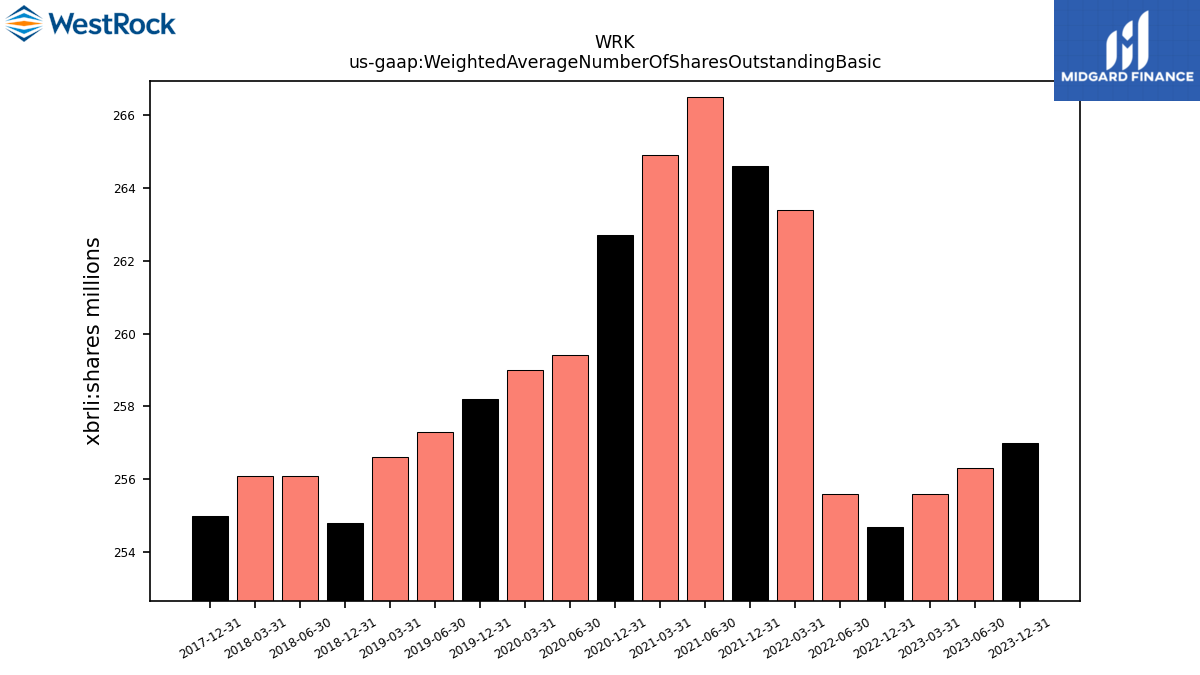
| Weighted Average Number Of Shares Outstanding Basic | 257.00 | NA | 256.30 | 255.60 | 254.70 | NA | 255.60 | 263.40 | 264.60 | NA | 266.50 | 264.90 | 262.70 | NA | 259.40 | 259.00 | 258.20 | NA | 257.30 | 256.60 | 254.80 | NA | 256.10 | 256.10 | 255.00 | NA | NA | NA | NA | |
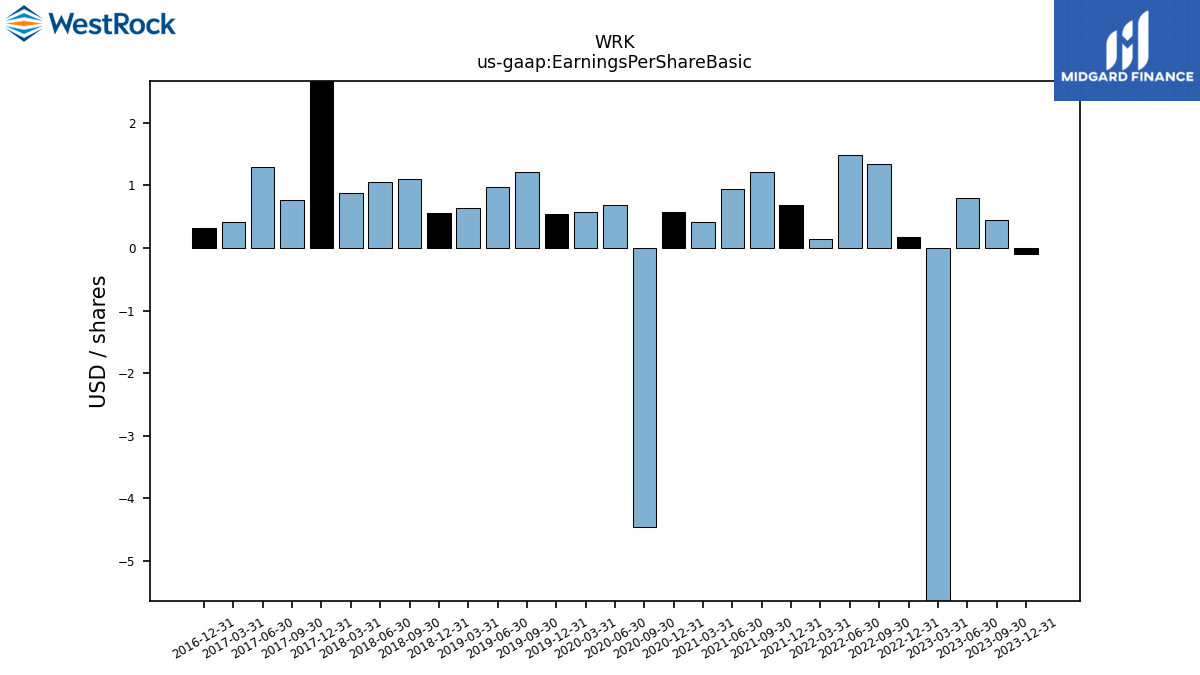
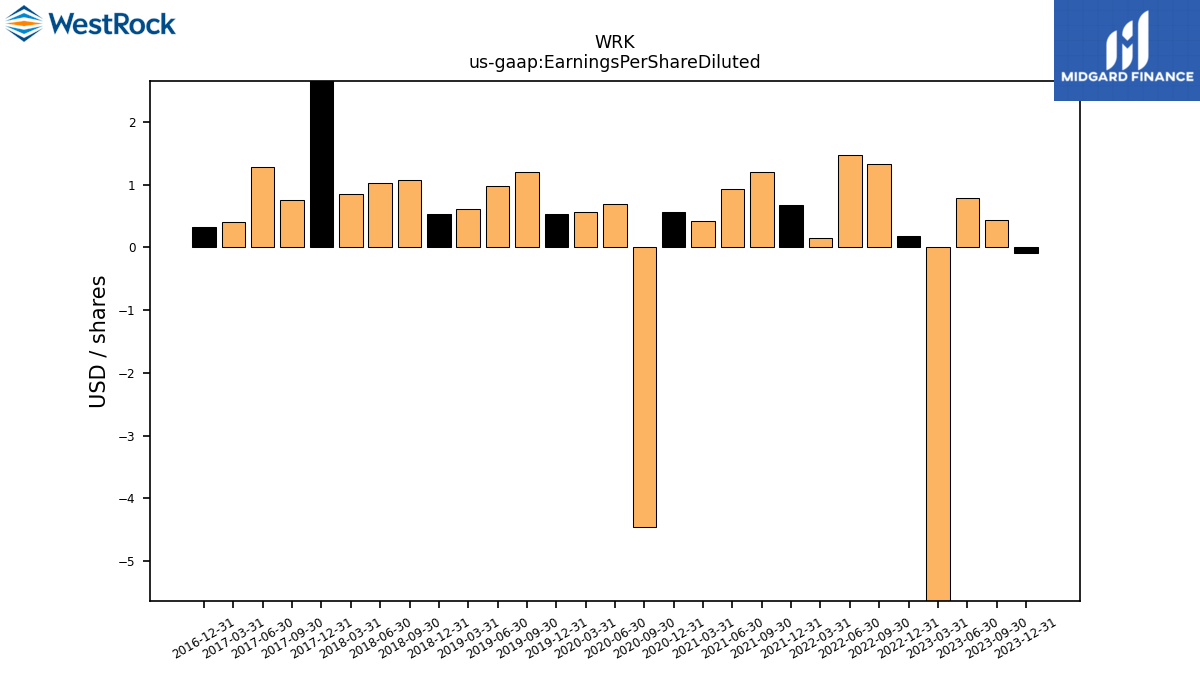
| Earnings Per Share Basic | -0.09 | 0.44 | 0.79 | -7.85 | 0.18 | 1.34 | 1.48 | 0.15 | 0.69 | 1.22 | 0.94 | 0.42 | 0.58 | -4.45 | 0.69 | 0.57 | 0.54 | 1.21 | 0.98 | 0.63 | 0.55 | 1.10 | 1.05 | 0.87 | 4.45 | 0.77 | 1.30 | 0.41 | 0.32 | |
| Earnings Per Share Diluted | -0.09 | 0.44 | 0.79 | -7.85 | 0.18 | 1.33 | 1.47 | 0.15 | 0.68 | 1.20 | 0.93 | 0.42 | 0.57 | -4.45 | 0.69 | 0.57 | 0.53 | 1.20 | 0.98 | 0.62 | 0.54 | 1.08 | 1.03 | 0.86 | 4.38 | 0.76 | 1.29 | 0.40 | 0.32 |
| 2023-12-31 | 2023-09-30 | 2023-06-30 | 2023-03-31 | 2022-12-31 | 2022-09-30 | 2022-06-30 | 2022-03-31 | 2021-12-31 | 2021-09-30 | 2021-06-30 | 2021-03-31 | 2020-12-31 | 2020-09-30 | 2020-06-30 | 2020-03-31 | 2019-12-31 | 2019-09-30 | 2019-06-30 | 2019-03-31 | 2018-12-31 | 2018-09-30 | 2018-06-30 | 2018-03-31 | 2017-12-31 | 2017-09-30 | 2017-06-30 | 2017-03-31 | 2016-12-31 | ||
|---|---|---|---|---|---|---|---|---|---|---|---|---|---|---|---|---|---|---|---|---|---|---|---|---|---|---|---|---|---|---|
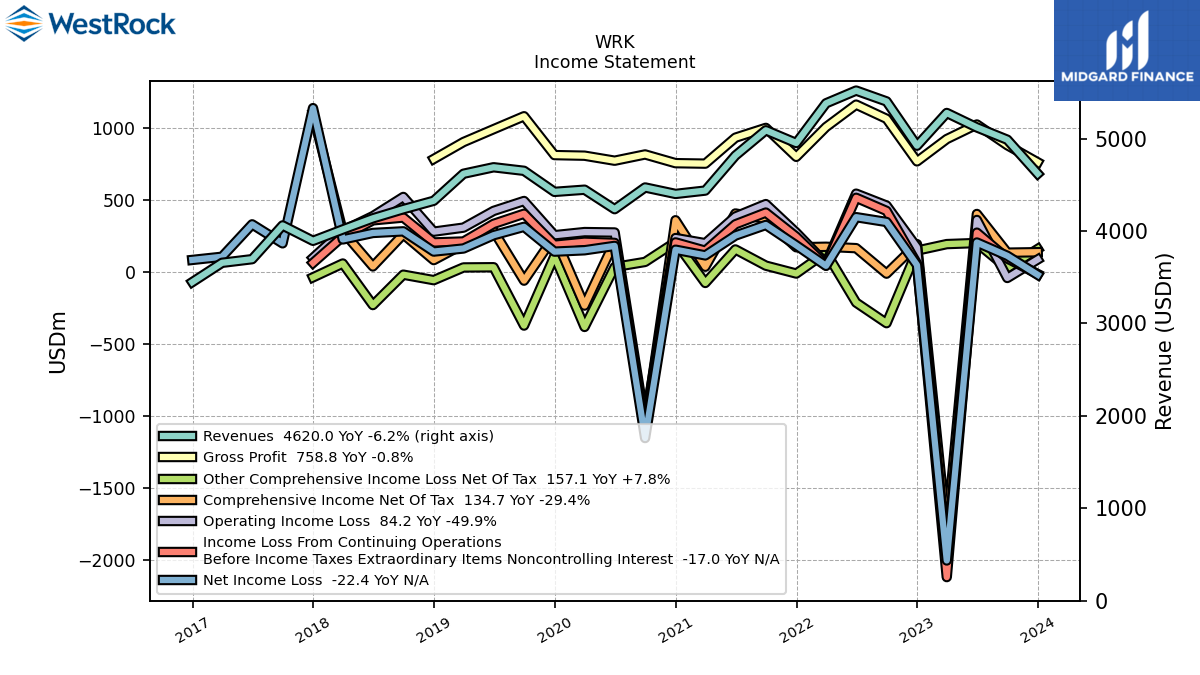
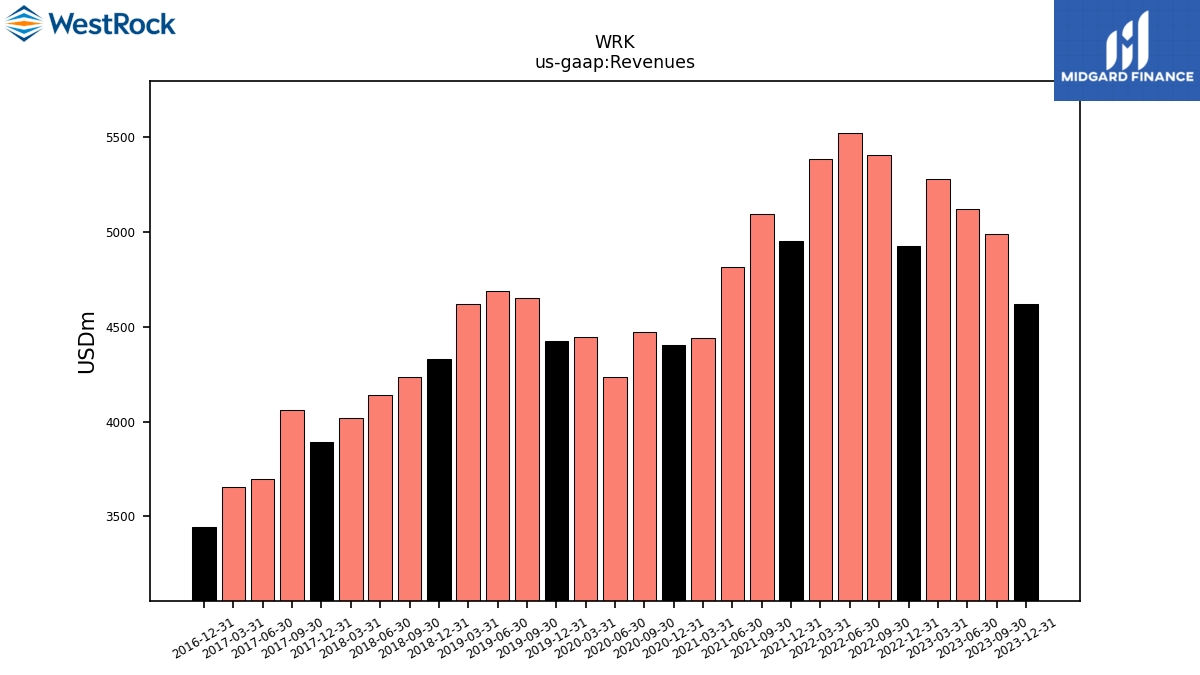
| Revenue From Contract With Customer Excluding Assessed Tax | 4620.00 | 4988.20 | 5121.10 | 5277.60 | 4923.10 | 5402.50 | 5519.70 | 5382.10 | 4952.20 | 5090.50 | 4816.30 | 4437.80 | 4401.50 | 4471.50 | 4236.30 | 4447.30 | 4423.70 | 4651.60 | 4690.00 | 4620.00 | 4327.40 | 4236.60 | 4137.50 | 4017.00 | 3894.00 | 4060.60 | 3695.60 | 3656.30 | 3447.20 | |
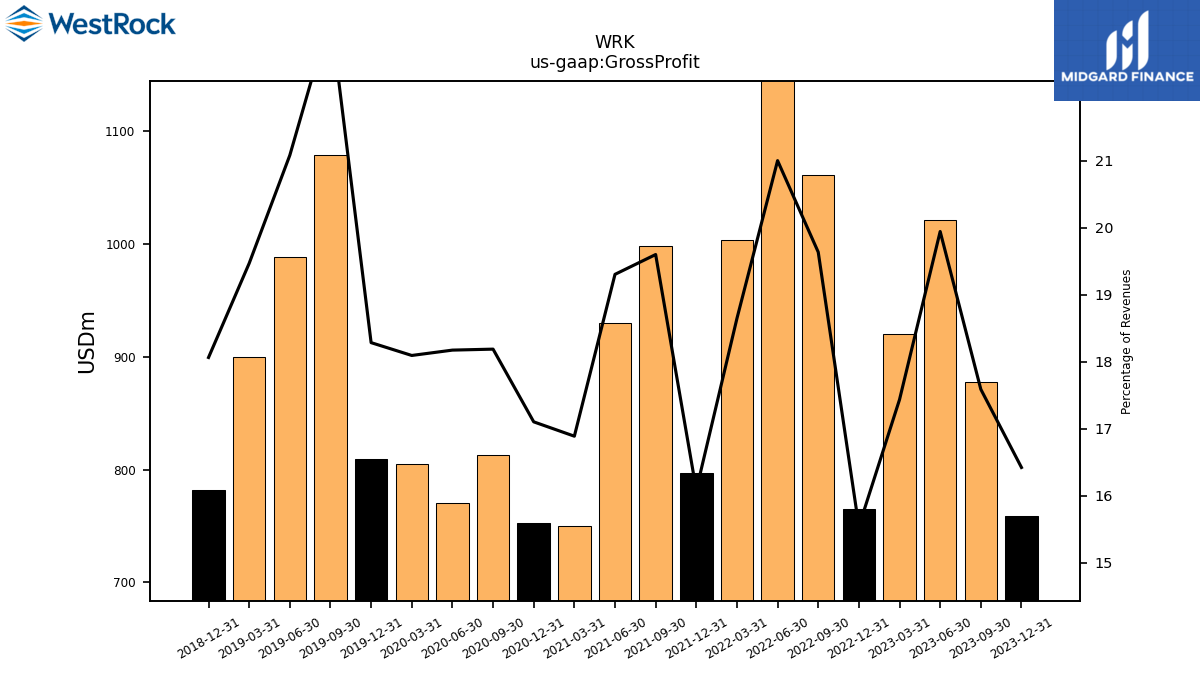
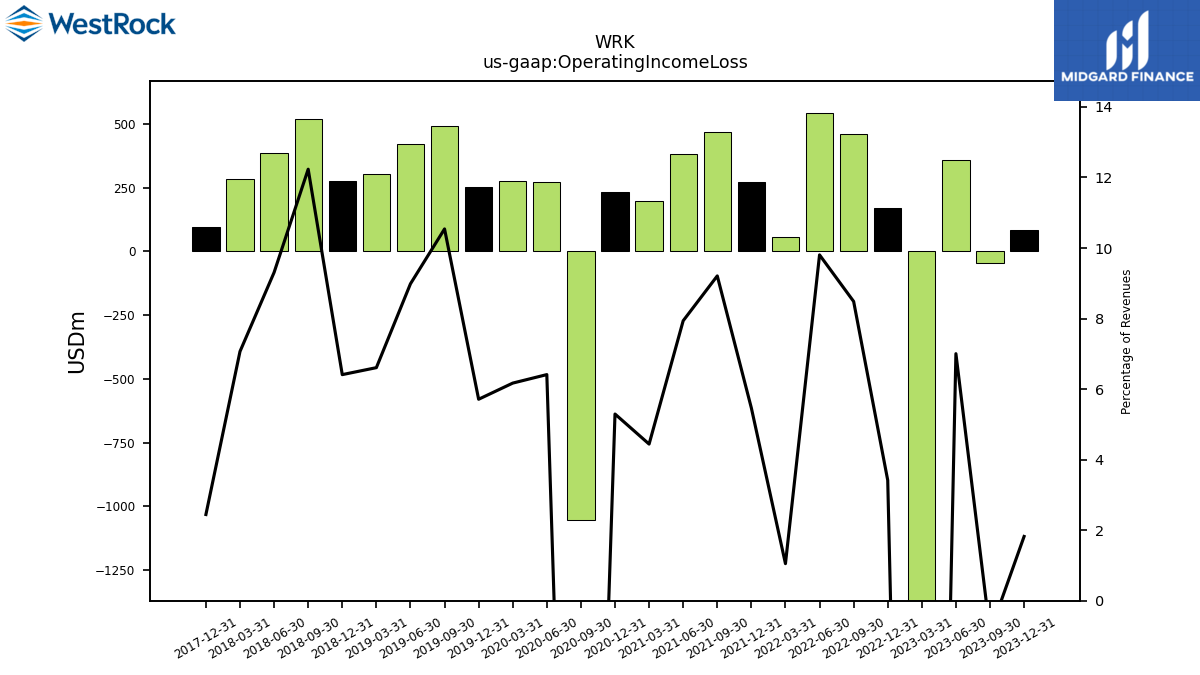
| Revenues | 4620.00 | 4988.20 | 5121.10 | 5277.60 | 4923.10 | 5402.50 | 5519.70 | 5382.10 | 4952.20 | 5090.50 | 4816.30 | 4437.80 | 4401.50 | 4471.50 | 4236.30 | 4447.30 | 4423.70 | 4651.60 | 4690.00 | 4620.00 | 4327.40 | 4236.60 | 4137.50 | 4017.00 | 3894.00 | 4060.60 | 3695.60 | 3656.30 | 3447.20 | |
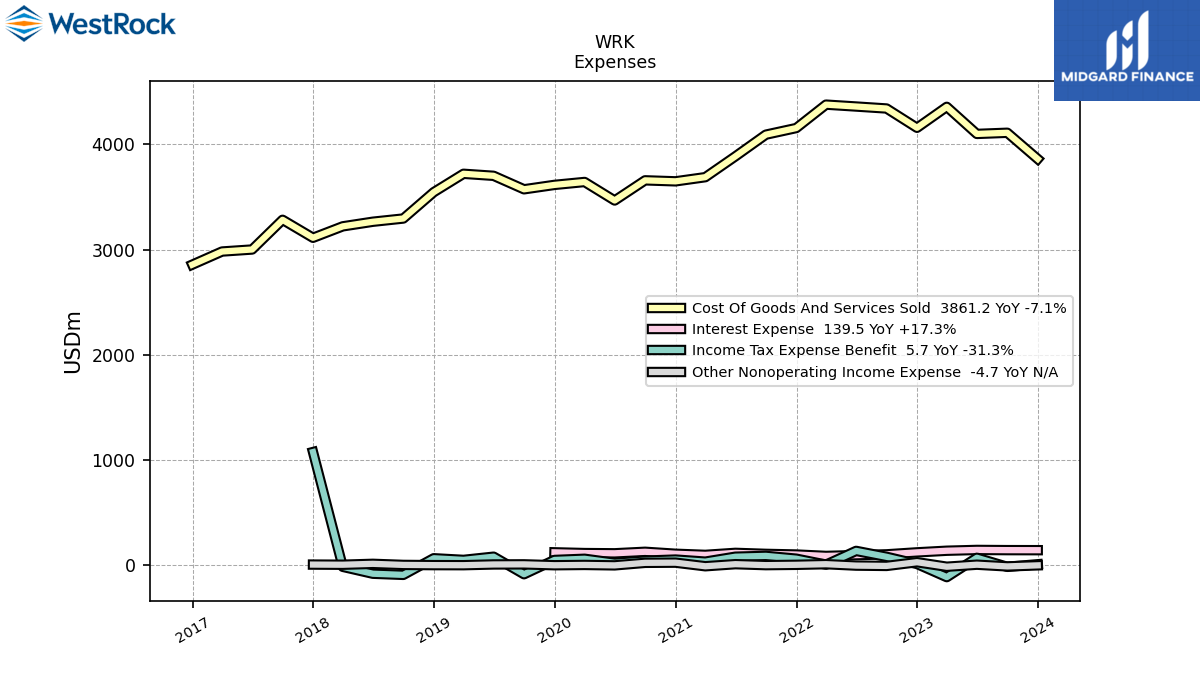
| Cost Of Goods And Services Sold | 3861.20 | 4110.70 | 4099.60 | 4357.30 | 4157.90 | 4341.50 | 4360.30 | 4378.40 | 4155.60 | 4092.60 | 3886.40 | 3688.20 | 3648.60 | 3658.10 | 3466.30 | 3642.50 | 3614.70 | 3572.90 | 3701.10 | 3720.40 | 3545.60 | 3294.90 | 3264.30 | 3220.40 | 3111.60 | 3282.60 | 3000.10 | 2980.90 | 2855.90 | |
| Gross Profit | 758.80 | 877.50 | 1021.50 | 920.30 | 765.20 | 1061.00 | 1159.40 | 1003.70 | 796.60 | 997.90 | 929.90 | 749.60 | 752.90 | 813.40 | 770.00 | 804.80 | 809.00 | 1078.70 | 988.90 | 899.60 | 781.80 | NA | NA | NA | NA | NA | NA | NA | NA | |
| Operating Income Loss | 84.20 | -44.50 | 358.70 | -1993.90 | 168.20 | 458.40 | 541.20 | 56.60 | 270.60 | 468.80 | 382.30 | 197.10 | 233.00 | -1054.90 | 271.60 | 274.40 | 252.70 | 490.30 | 421.40 | 305.30 | 277.40 | 518.30 | 385.10 | 283.90 | 95.20 | NA | NA | NA | NA | |
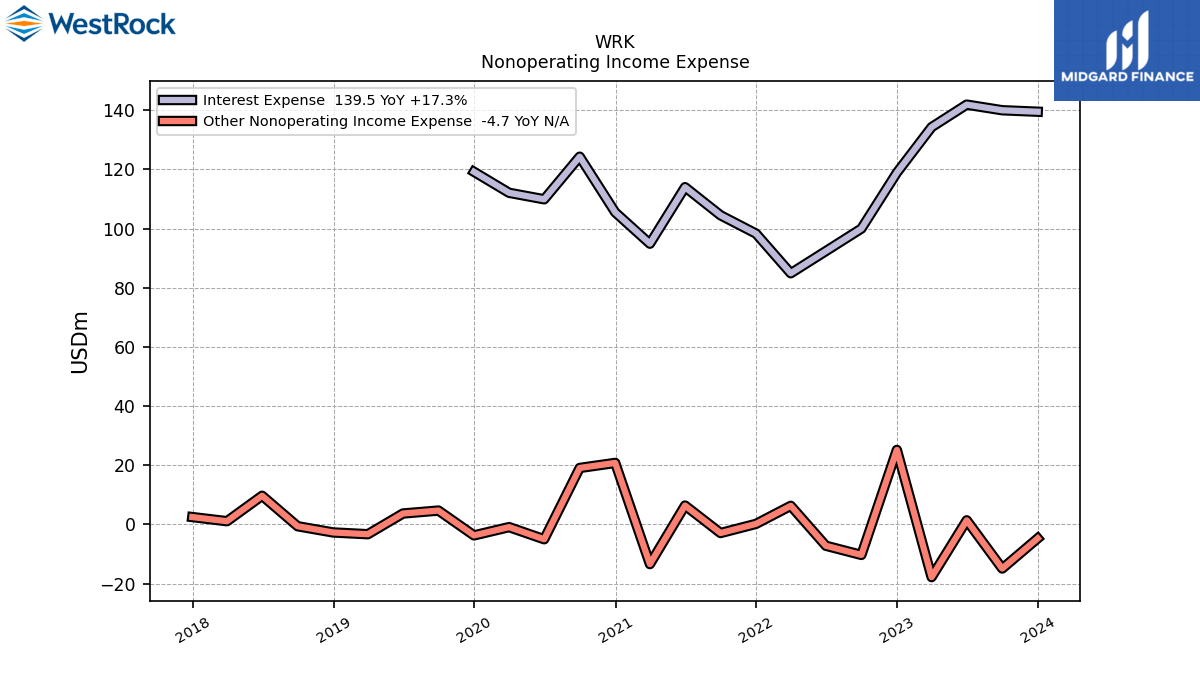
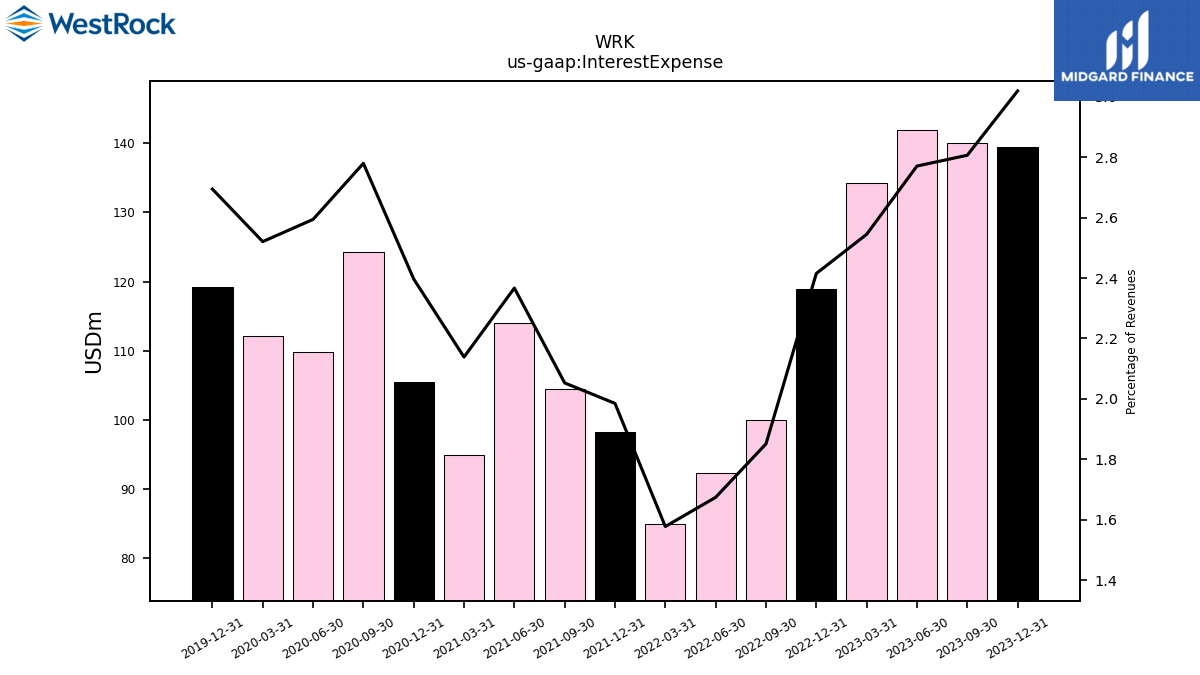
| Interest Expense | 139.50 | 140.00 | 141.90 | 134.30 | 118.90 | 100.00 | 92.40 | 84.90 | 98.30 | 104.50 | 114.00 | 94.90 | 105.50 | 124.30 | 109.90 | 112.10 | 119.20 | NA | NA | NA | NA | NA | NA | NA | NA | NA | NA | NA | NA | |
| Interest Paid Net | 93.20 | 146.10 | 92.60 | 145.40 | 68.10 | 125.80 | 62.10 | 119.20 | 56.80 | 171.90 | 38.10 | 132.70 | 42.00 | 144.00 | 47.00 | 151.30 | 53.10 | 162.60 | 47.00 | 177.90 | 25.00 | 133.20 | 16.10 | 107.90 | 27.20 | NA | NA | NA | NA | |
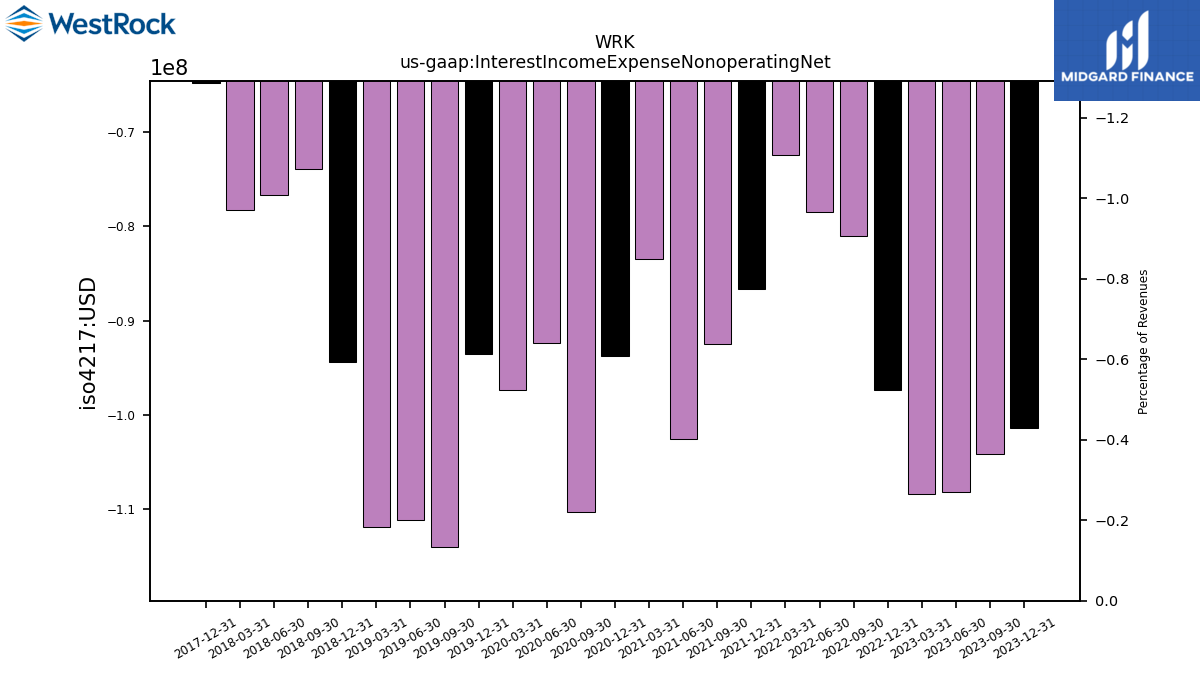
| Interest Income Expense Nonoperating Net | -101.40 | -104.10 | -108.10 | -108.40 | -97.30 | -81.10 | -78.50 | -72.50 | -86.70 | -92.50 | -102.50 | -83.50 | -93.80 | -110.30 | -92.40 | -97.30 | -93.50 | -114.00 | -111.10 | -111.80 | -94.40 | -74.00 | -76.70 | -78.30 | -64.80 | NA | NA | NA | NA | |
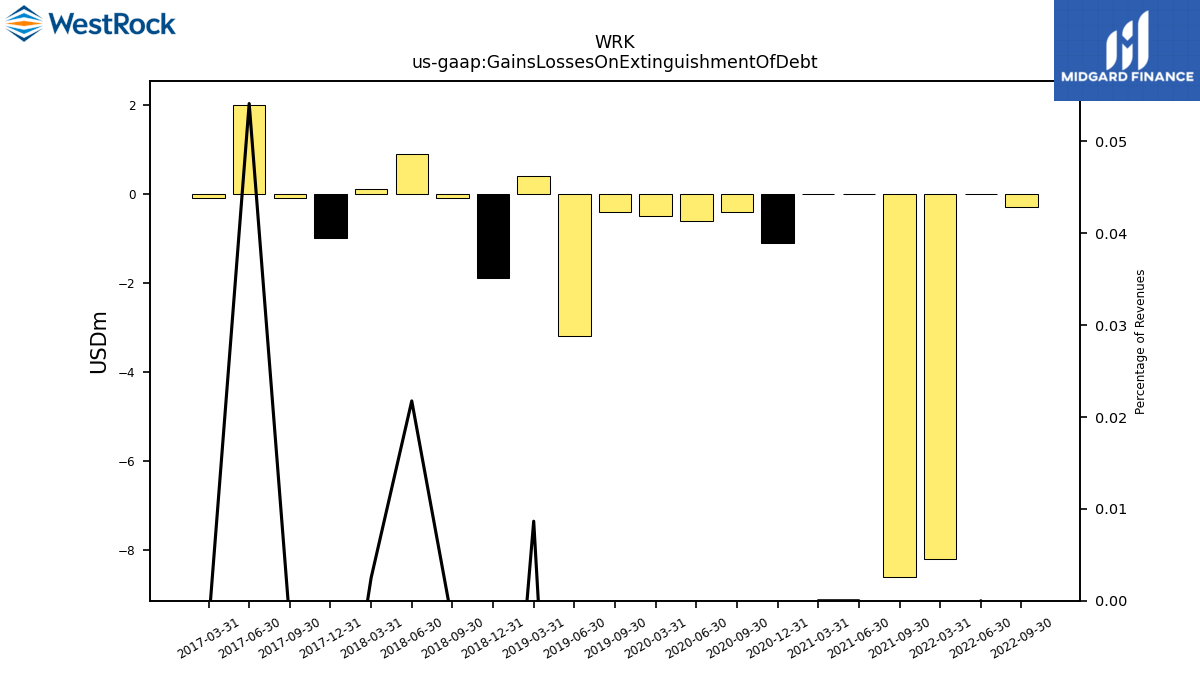
| Gains Losses On Extinguishment Of Debt | NA | NA | NA | NA | NA | -0.30 | 0.00 | -8.20 | NA | -8.60 | 0.00 | 0.00 | -1.10 | -0.40 | -0.60 | -0.50 | NA | -0.40 | -3.20 | 0.40 | -1.90 | -0.10 | 0.90 | 0.10 | -1.00 | -0.10 | 2.00 | -0.10 | NA | |
| Disposal Group Not Discontinued Operation Gain Loss On Disposal | 0.50 | NA | NA | NA | NA | NA | NA | NA | NA | NA | NA | NA | NA | NA | NA | NA | NA | NA | NA | NA | NA | NA | NA | NA | NA | NA | NA | NA | NA | |
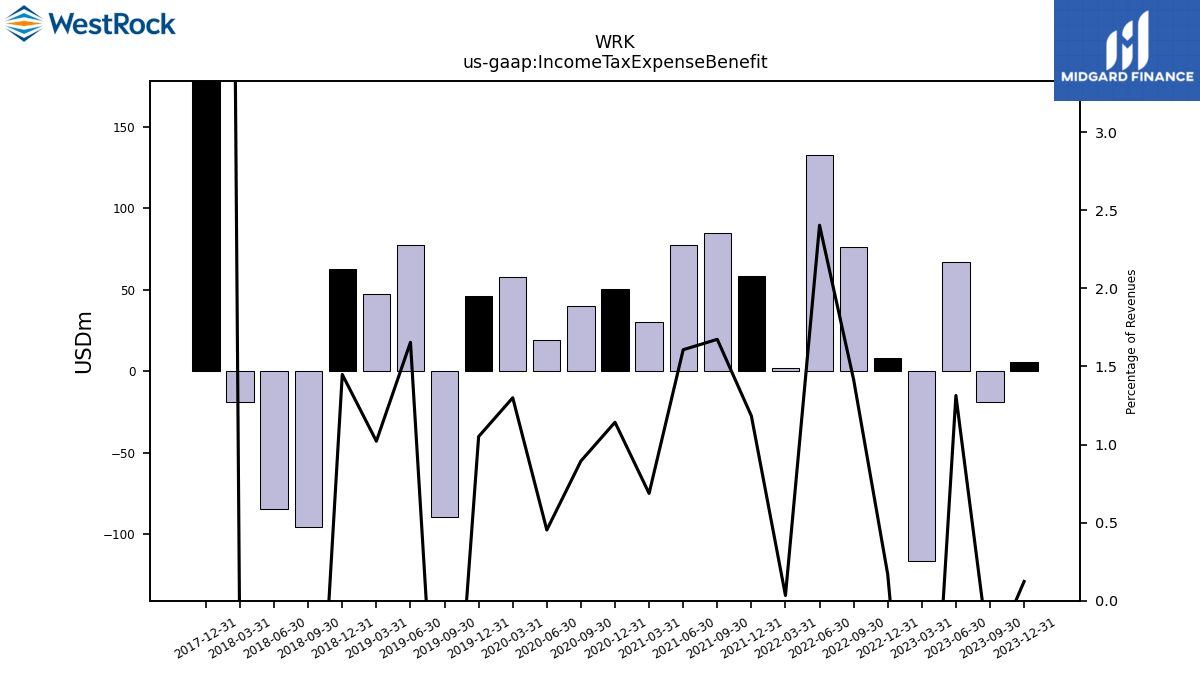
| Income Tax Expense Benefit | 5.70 | -19.20 | 67.30 | -116.80 | 8.30 | 76.50 | 132.70 | 1.80 | 58.60 | 85.20 | 77.40 | 30.50 | 50.30 | 40.00 | 19.20 | 57.80 | 46.50 | -89.30 | 77.60 | 47.20 | 62.70 | -95.40 | -84.50 | -18.80 | 1073.20 | NA | NA | NA | NA | |
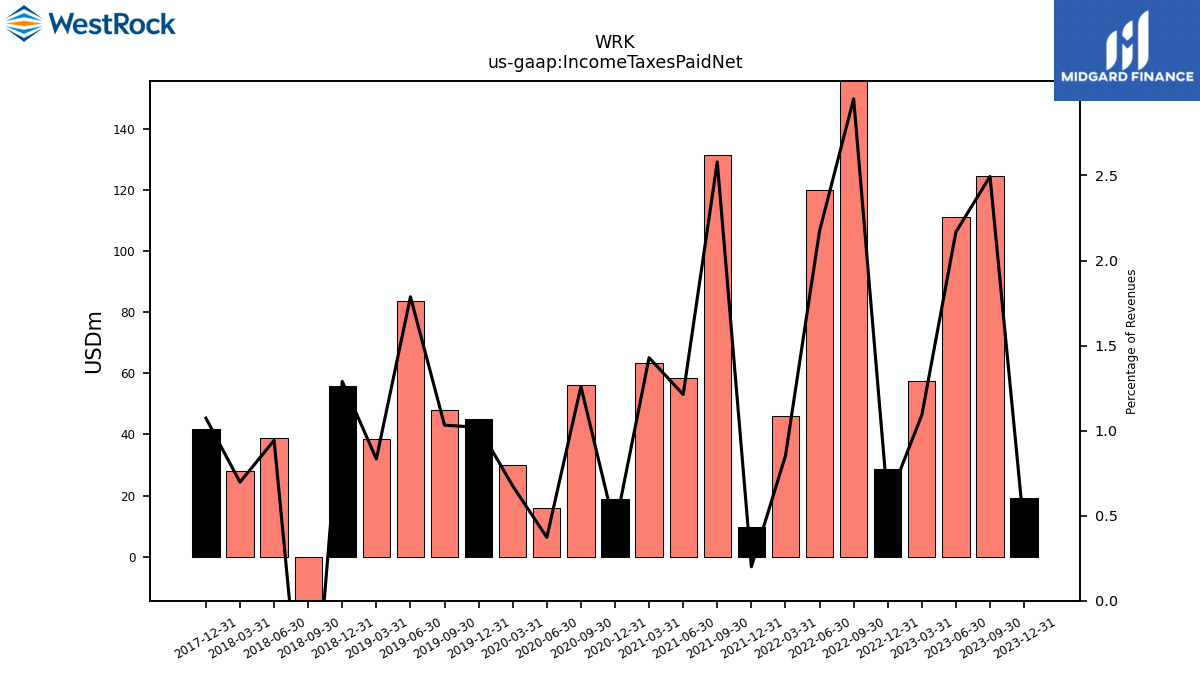
| Income Taxes Paid Net | 19.30 | 124.40 | 111.00 | 57.60 | 28.60 | 159.40 | 120.00 | 45.90 | 9.90 | 131.30 | 58.40 | 63.40 | 18.80 | 56.30 | 15.80 | 30.00 | 45.10 | 48.00 | 83.80 | 38.50 | 55.80 | -48.30 | 39.00 | 28.00 | 41.80 | NA | NA | NA | NA | |
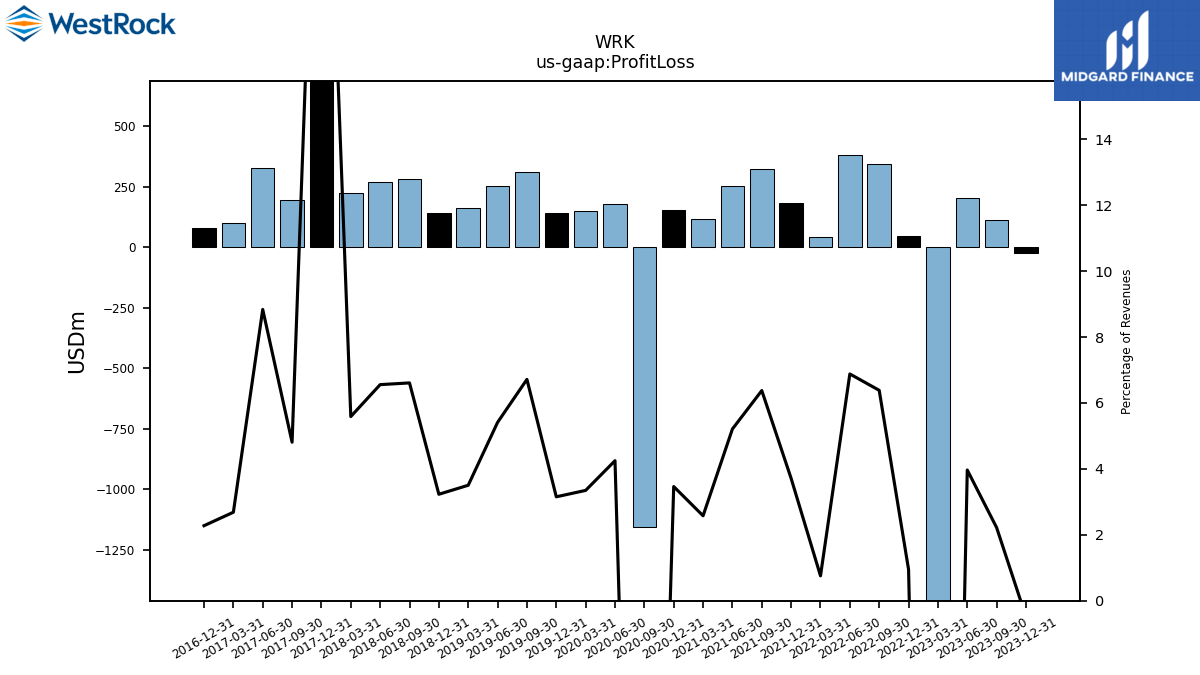
| Profit Loss | -22.70 | 110.70 | 203.10 | -2004.80 | 46.80 | 344.90 | 379.80 | 40.70 | 183.80 | 324.60 | 251.00 | 114.40 | 152.50 | -1154.50 | 180.00 | 148.90 | 139.50 | 312.40 | 253.80 | 161.90 | 139.80 | 280.00 | 271.30 | 224.50 | 1133.50 | 195.30 | 326.60 | 98.20 | 78.50 | |
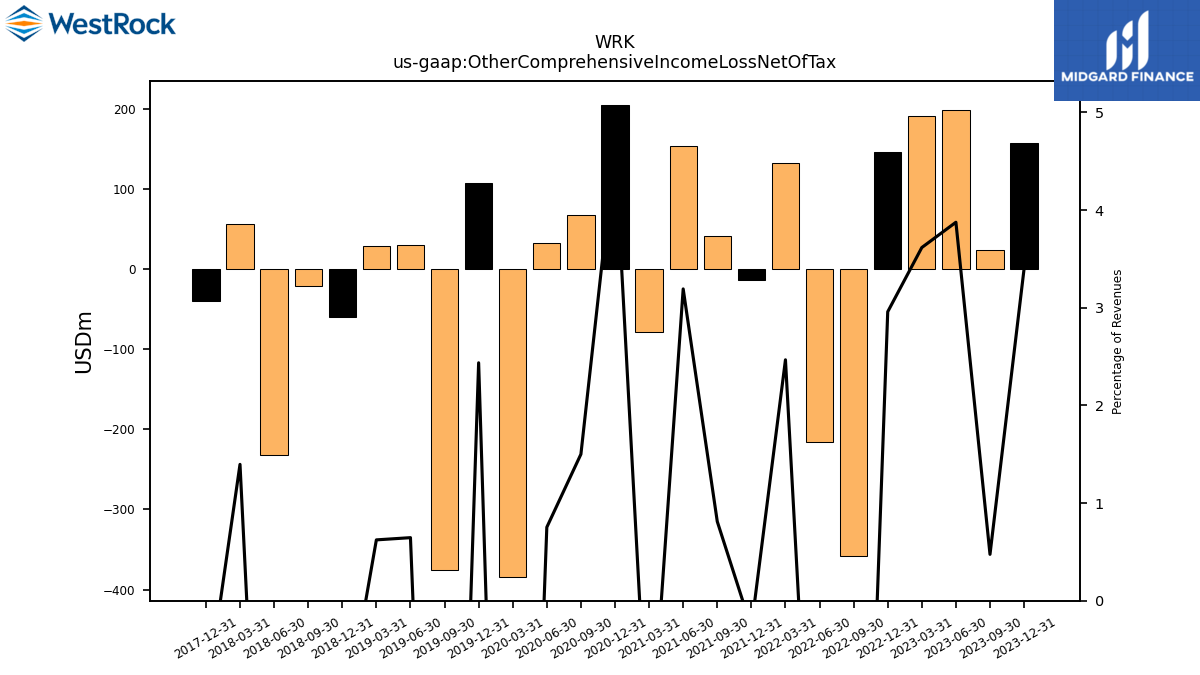
| Other Comprehensive Income Loss Net Of Tax | 157.10 | 23.70 | 198.50 | 190.90 | 145.70 | -358.20 | -215.40 | 132.80 | -13.60 | 41.30 | 153.80 | -79.00 | 205.00 | 67.10 | 31.90 | -384.40 | 107.80 | -374.90 | 30.30 | 28.80 | -59.50 | -21.40 | -232.60 | 56.10 | -40.10 | NA | NA | NA | NA | |
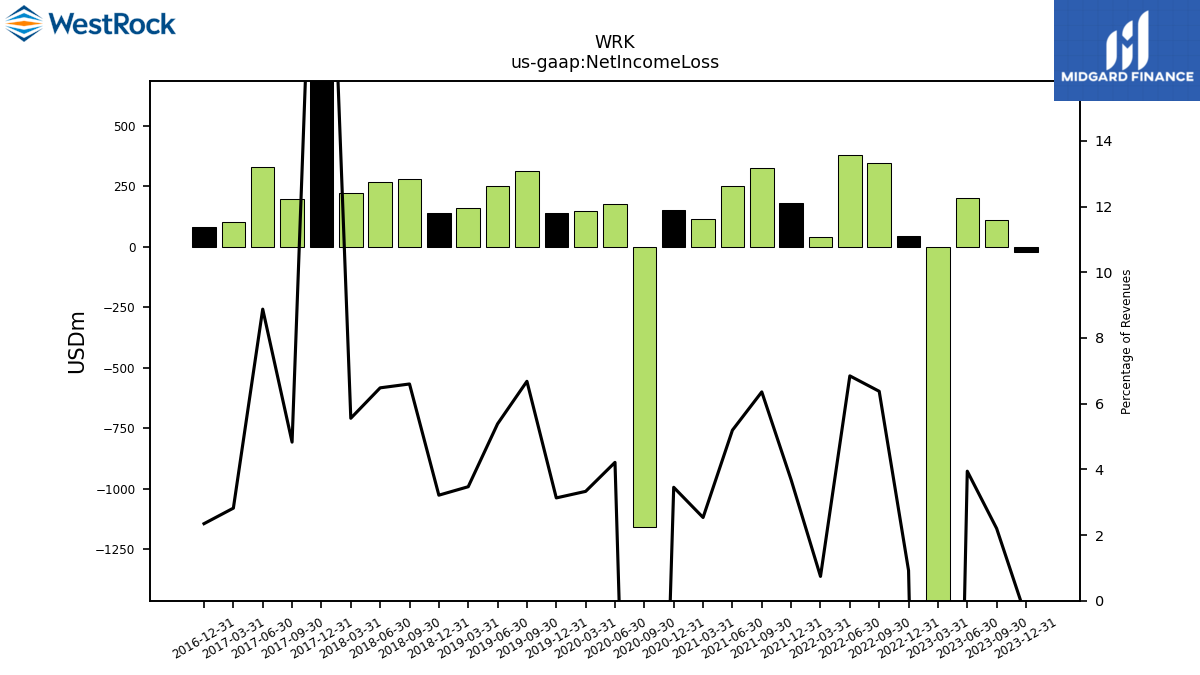
| Net Income Loss | -22.40 | 109.80 | 202.00 | -2006.10 | 45.30 | 344.50 | 377.90 | 39.90 | 182.30 | 323.70 | 250.10 | 112.50 | 152.00 | -1156.00 | 178.50 | 148.10 | 138.50 | 310.80 | 252.60 | 160.40 | 139.10 | 279.60 | 268.20 | 223.20 | 1135.10 | 196.10 | 328.10 | 103.10 | 80.90 | |
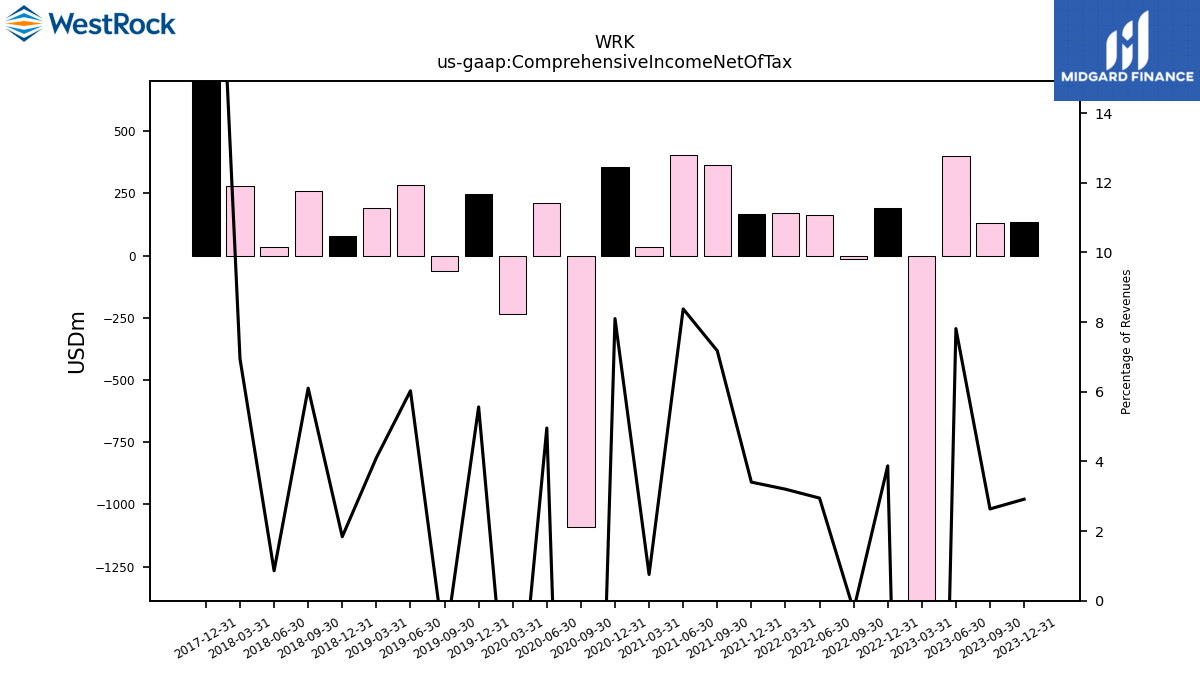
| Comprehensive Income Net Of Tax | 134.70 | 131.50 | 400.20 | -1815.70 | 190.70 | -14.40 | 162.70 | 172.40 | 168.70 | 365.40 | 403.60 | 33.50 | 356.60 | -1088.50 | 210.10 | -236.00 | 246.20 | -63.00 | 282.70 | 189.70 | 79.60 | 258.60 | 35.60 | 279.10 | 1094.80 | NA | NA | NA | NA | |
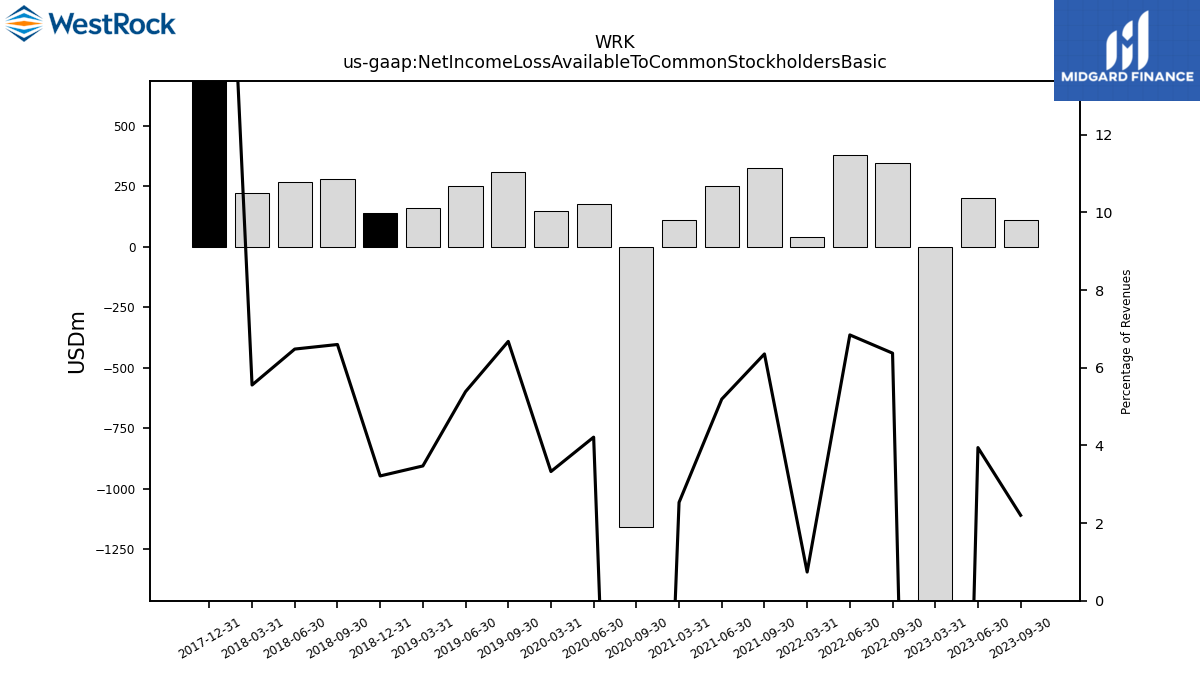
| Net Income Loss Available To Common Stockholders Basic | NA | 109.80 | 202.00 | -2006.10 | NA | 344.50 | 377.90 | 39.80 | NA | 323.60 | 250.10 | 112.40 | NA | -1156.00 | 178.50 | 148.00 | NA | 310.70 | 252.60 | 160.40 | 139.10 | 279.60 | 268.20 | 223.20 | 1134.90 | NA | NA | NA | NA | |
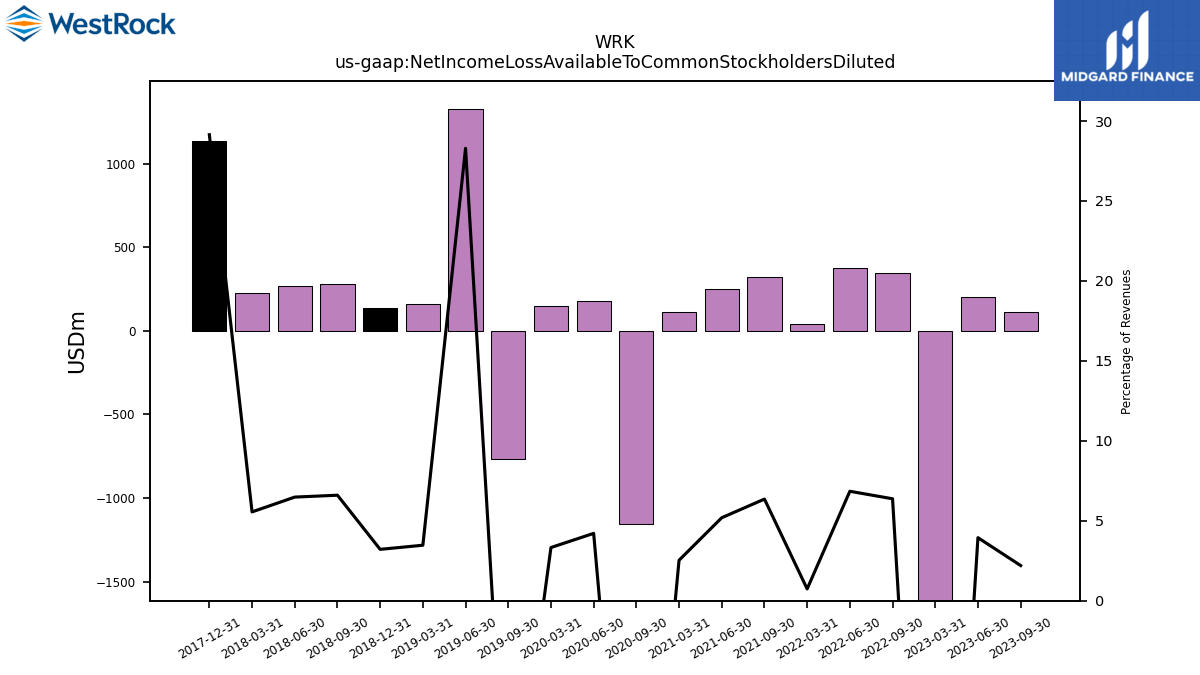
| Net Income Loss Available To Common Stockholders Diluted | NA | 109.80 | 202.00 | -2006.10 | NA | 344.50 | 377.90 | 39.80 | NA | 323.60 | 250.10 | 112.40 | NA | -1156.00 | 178.50 | 148.00 | NA | -763.70 | 1327.00 | 160.40 | 139.10 | 279.60 | 268.20 | 223.20 | 1134.90 | NA | NA | NA | NA | |
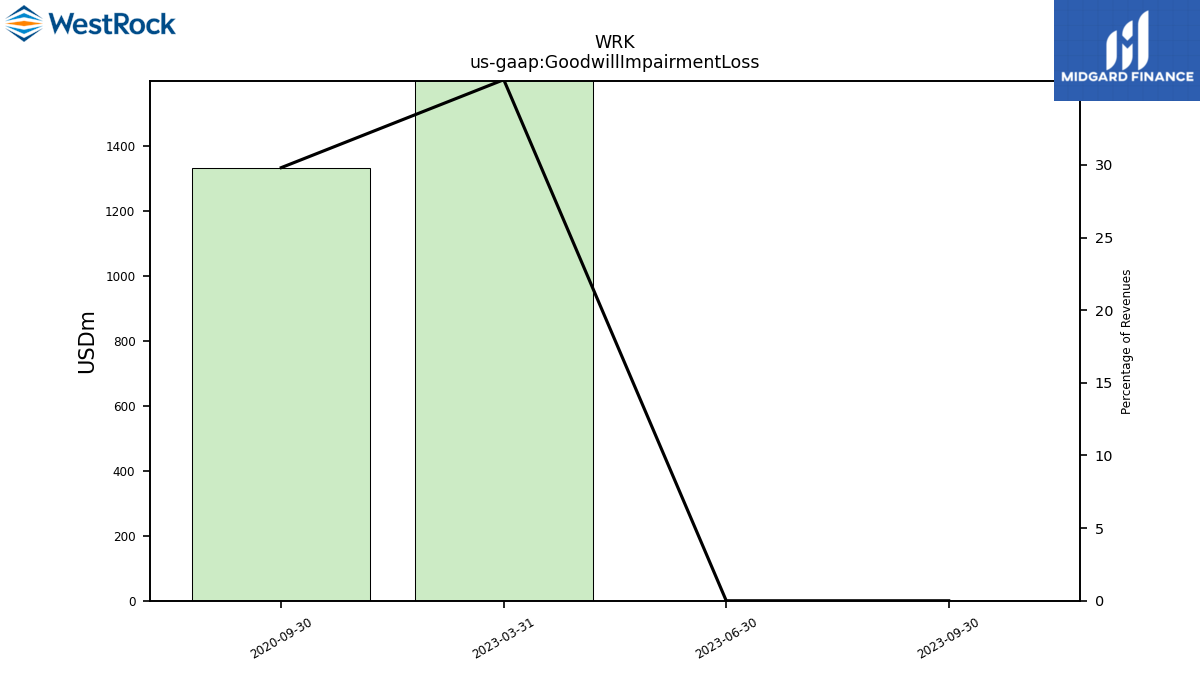
| Goodwill Impairment Loss | NA | 0.00 | 0.00 | 1893.00 | NA | NA | NA | NA | NA | NA | NA | NA | NA | 1333.20 | NA | NA | NA | NA | NA | NA | NA | NA | NA | NA | NA | NA | NA | NA | NA |
| 2023-12-31 | 2023-09-30 | 2023-06-30 | 2023-03-31 | 2022-12-31 | 2022-09-30 | 2022-06-30 | 2022-03-31 | 2021-12-31 | 2021-09-30 | 2021-06-30 | 2021-03-31 | 2020-12-31 | 2020-09-30 | 2020-06-30 | 2020-03-31 | 2019-12-31 | 2019-09-30 | 2019-06-30 | 2019-03-31 | 2018-12-31 | 2018-09-30 | 2018-06-30 | 2018-03-31 | 2017-12-31 | 2017-09-30 | 2017-06-30 | 2017-03-31 | 2016-12-31 | ||
|---|---|---|---|---|---|---|---|---|---|---|---|---|---|---|---|---|---|---|---|---|---|---|---|---|---|---|---|---|---|---|
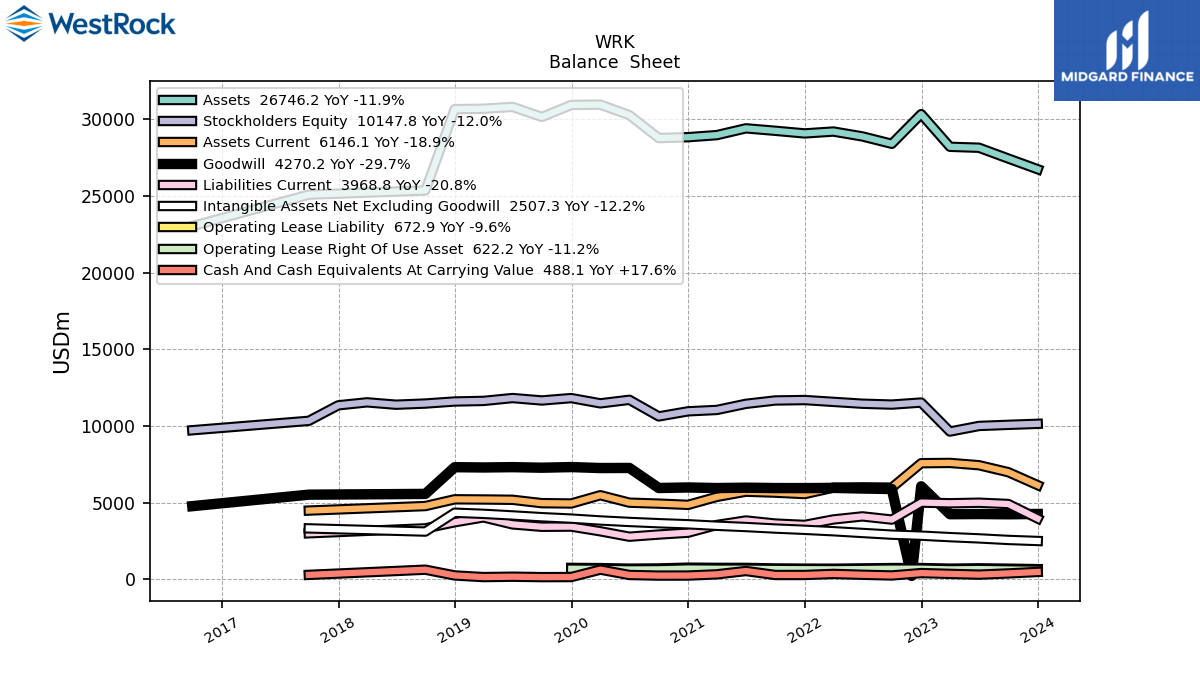
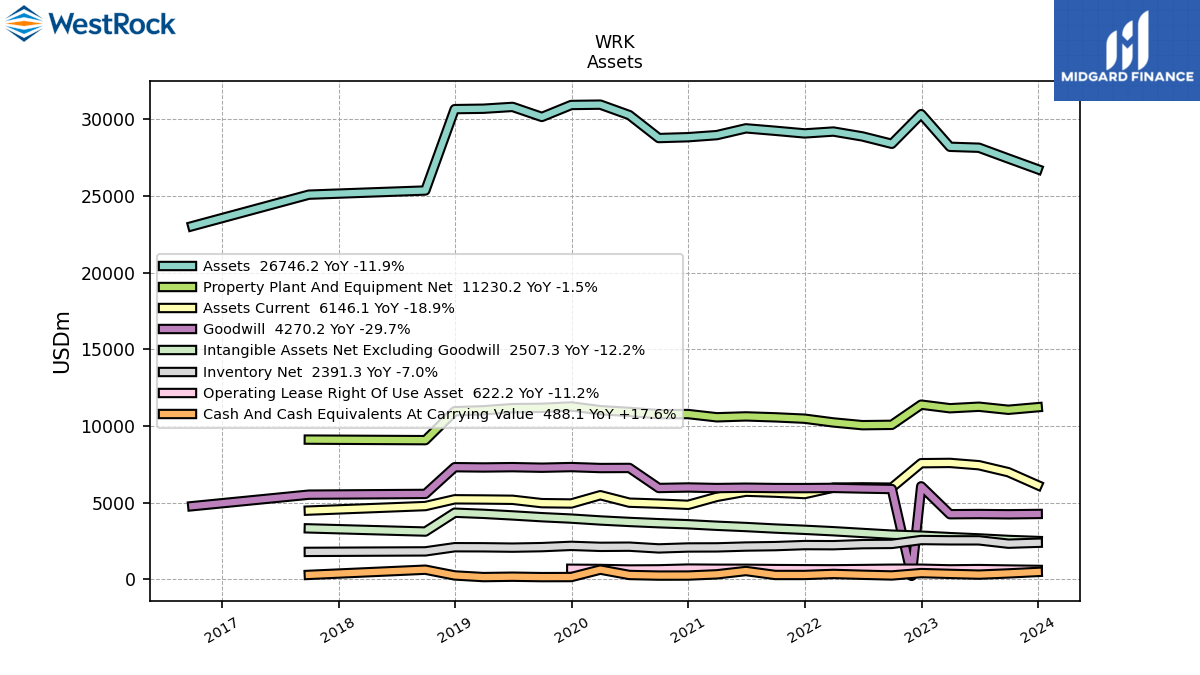
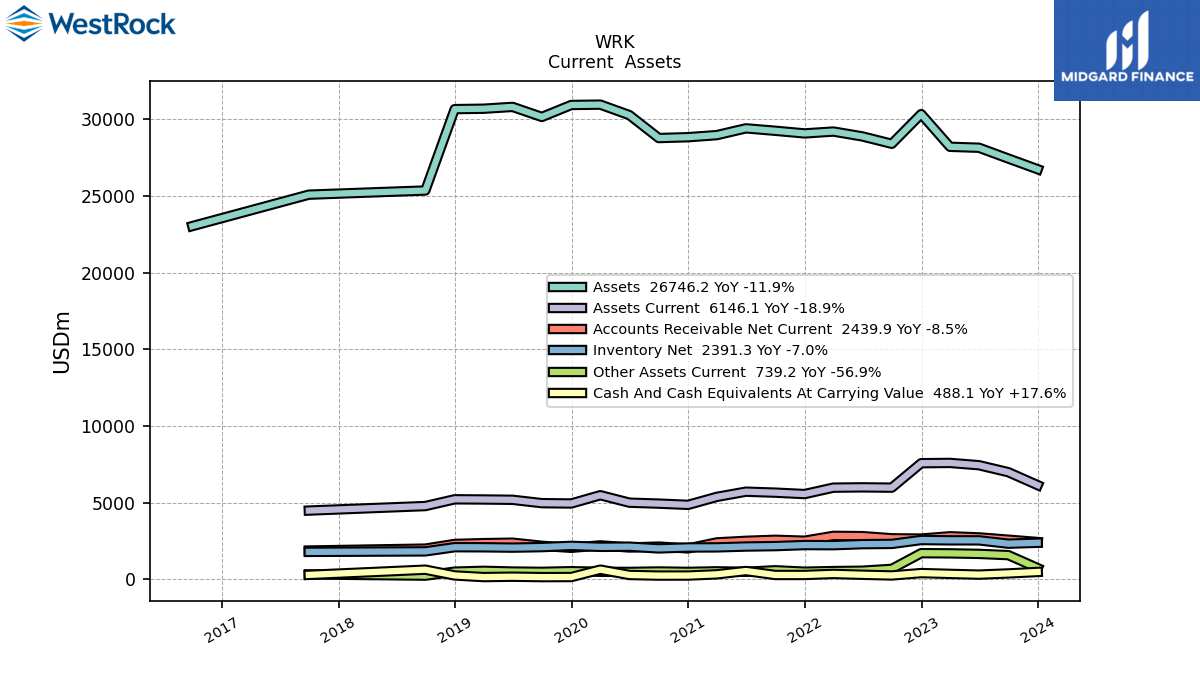
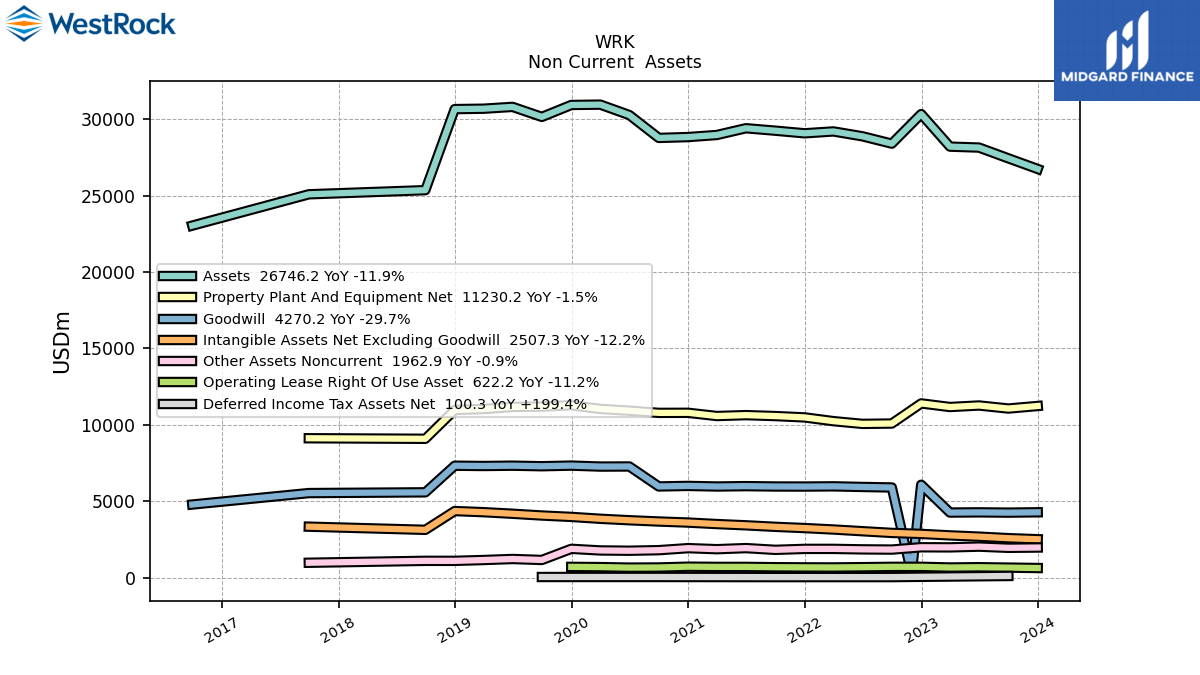
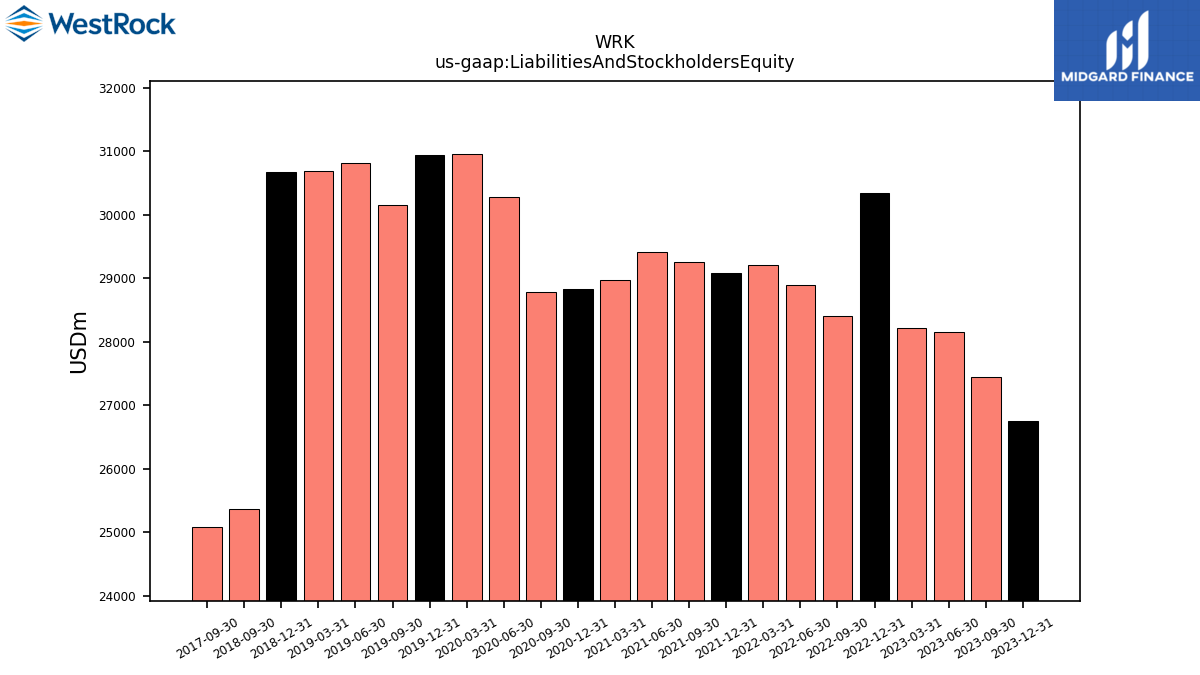
| Assets | 26746.20 | 27443.70 | 28148.90 | 28210.40 | 30341.70 | 28405.50 | 28885.70 | 29205.60 | 29082.50 | 29254.30 | 29414.10 | 28971.90 | 28836.40 | 28779.70 | 30277.60 | 30960.30 | 30936.80 | 30156.70 | 30812.10 | 30693.00 | 30666.90 | 25360.50 | NA | NA | NA | 25089.00 | NA | NA | NA | |
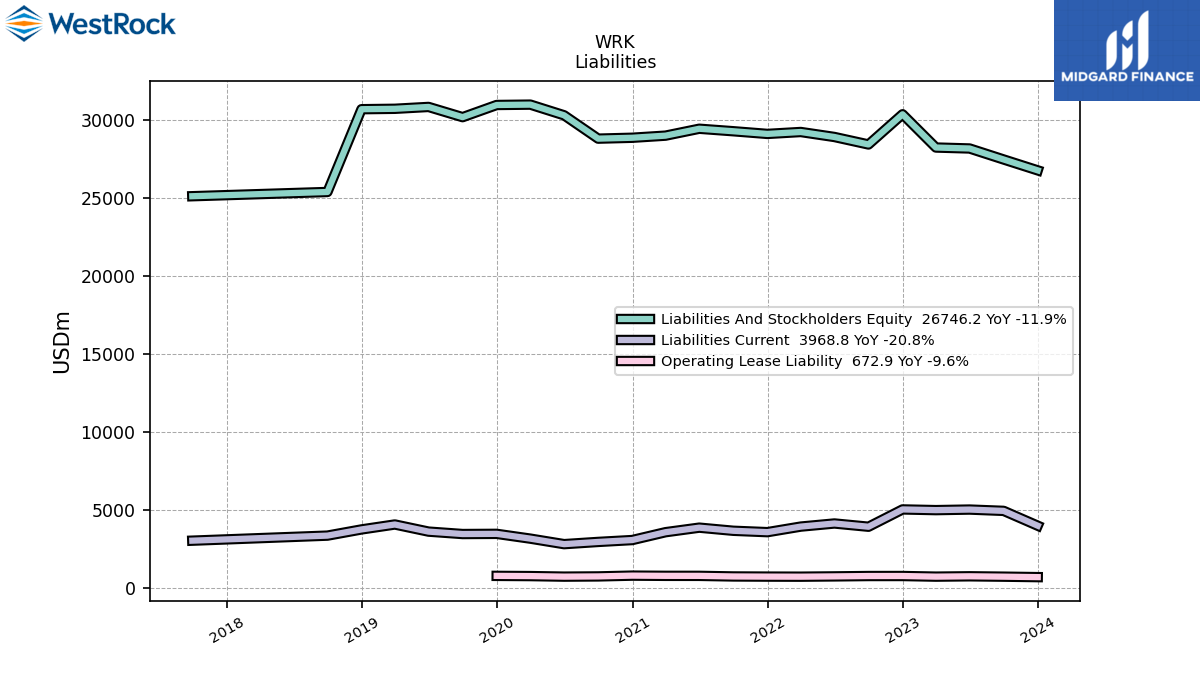
| Liabilities And Stockholders Equity | 26746.20 | 27443.70 | 28148.90 | 28210.40 | 30341.70 | 28405.50 | 28885.70 | 29205.60 | 29082.50 | 29254.30 | 29414.10 | 28971.90 | 28836.40 | 28779.70 | 30277.60 | 30960.30 | 30936.80 | 30156.70 | 30812.10 | 30693.00 | 30666.90 | 25360.50 | NA | NA | NA | 25089.00 | NA | NA | NA | |
| Stockholders Equity | 10147.80 | 10080.70 | 10007.80 | 9643.40 | 11534.50 | 11402.00 | 11457.90 | 11578.40 | 11697.20 | 11670.30 | 11451.10 | 11051.90 | 10963.00 | 10630.60 | 11713.10 | 11482.40 | 11825.20 | 11669.90 | 11827.70 | 11640.80 | 11603.70 | 11469.40 | 11393.60 | 11547.90 | 11353.40 | 10342.50 | NA | NA | NA |
| 2023-12-31 | 2023-09-30 | 2023-06-30 | 2023-03-31 | 2022-12-31 | 2022-09-30 | 2022-06-30 | 2022-03-31 | 2021-12-31 | 2021-09-30 | 2021-06-30 | 2021-03-31 | 2020-12-31 | 2020-09-30 | 2020-06-30 | 2020-03-31 | 2019-12-31 | 2019-09-30 | 2019-06-30 | 2019-03-31 | 2018-12-31 | 2018-09-30 | 2018-06-30 | 2018-03-31 | 2017-12-31 | 2017-09-30 | 2017-06-30 | 2017-03-31 | 2016-12-31 | ||
|---|---|---|---|---|---|---|---|---|---|---|---|---|---|---|---|---|---|---|---|---|---|---|---|---|---|---|---|---|---|---|
| Assets Current | 6146.10 | 6993.10 | 7448.00 | 7598.30 | 7580.10 | 5985.40 | 6004.70 | 5985.90 | 5567.90 | 5659.60 | 5723.70 | 5384.60 | 4863.80 | 4944.70 | 5005.90 | 5492.20 | 4952.60 | 4974.30 | 5193.70 | 5214.00 | 5226.00 | 4785.10 | NA | NA | NA | 4490.90 | NA | NA | NA | |
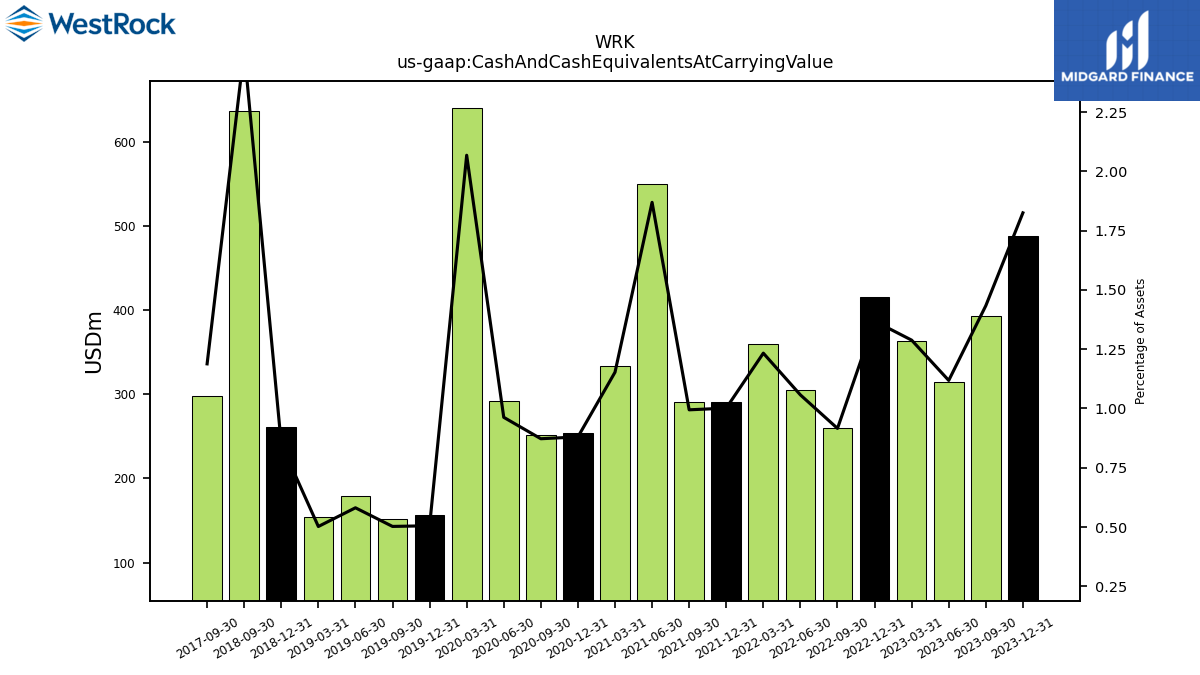
| Cash And Cash Equivalents At Carrying Value | 488.10 | 393.40 | 314.80 | 363.40 | 415.20 | 260.20 | 305.40 | 360.20 | 291.30 | 290.90 | 549.80 | 334.00 | 253.80 | 251.10 | 291.50 | 640.20 | 156.40 | 151.60 | 179.10 | 154.20 | 260.70 | 636.80 | NA | NA | NA | 298.10 | NA | NA | NA | |
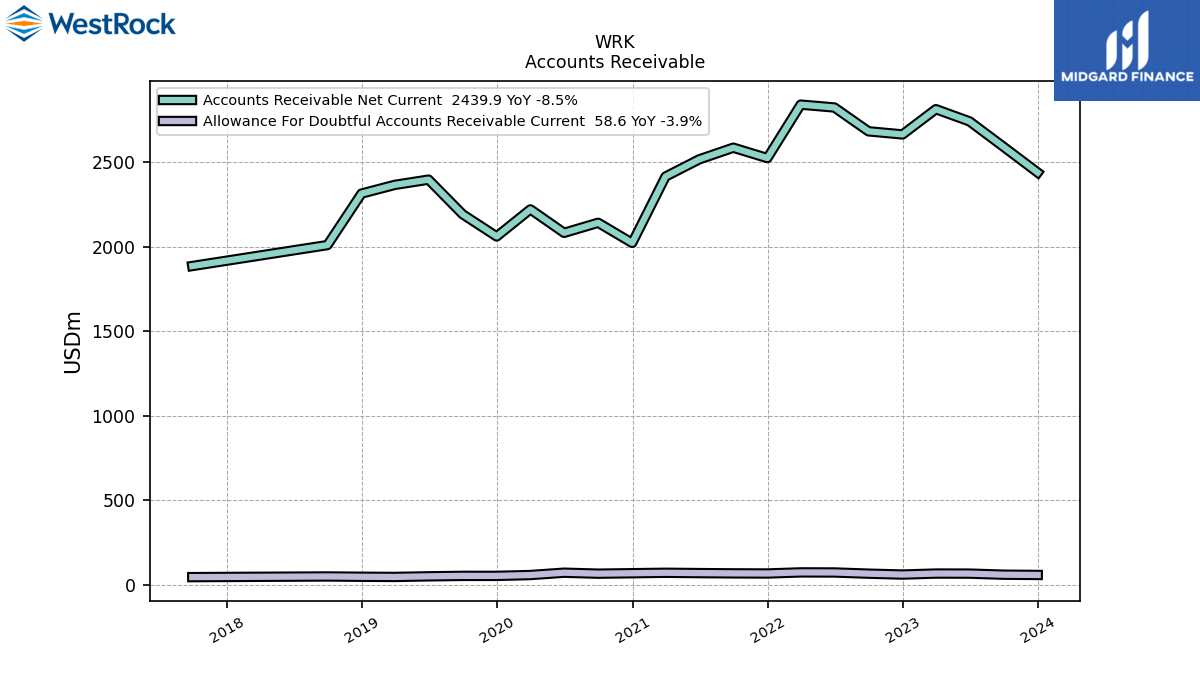
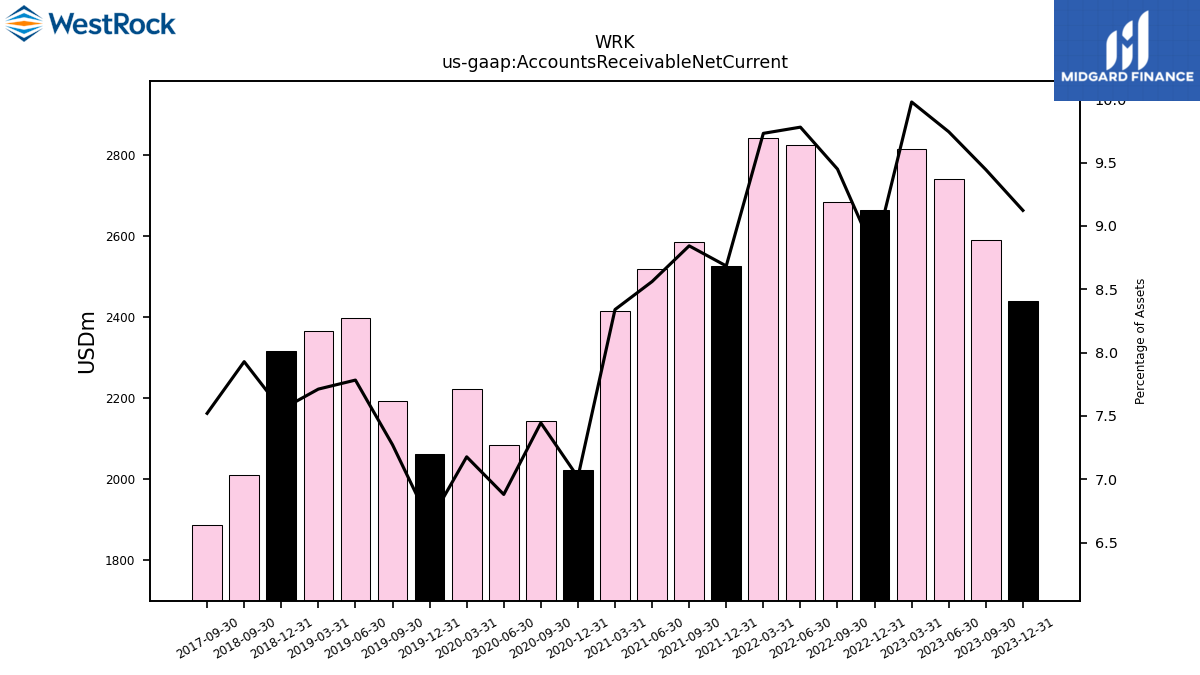
| Accounts Receivable Net Current | 2439.90 | 2591.90 | 2742.60 | 2814.90 | 2665.50 | 2683.90 | 2824.90 | 2841.90 | 2525.50 | 2586.90 | 2518.10 | 2416.20 | 2023.40 | 2142.70 | 2083.20 | 2222.10 | 2061.70 | 2193.20 | 2398.10 | 2367.00 | 2315.50 | 2010.70 | NA | NA | NA | 1886.80 | NA | NA | NA | |
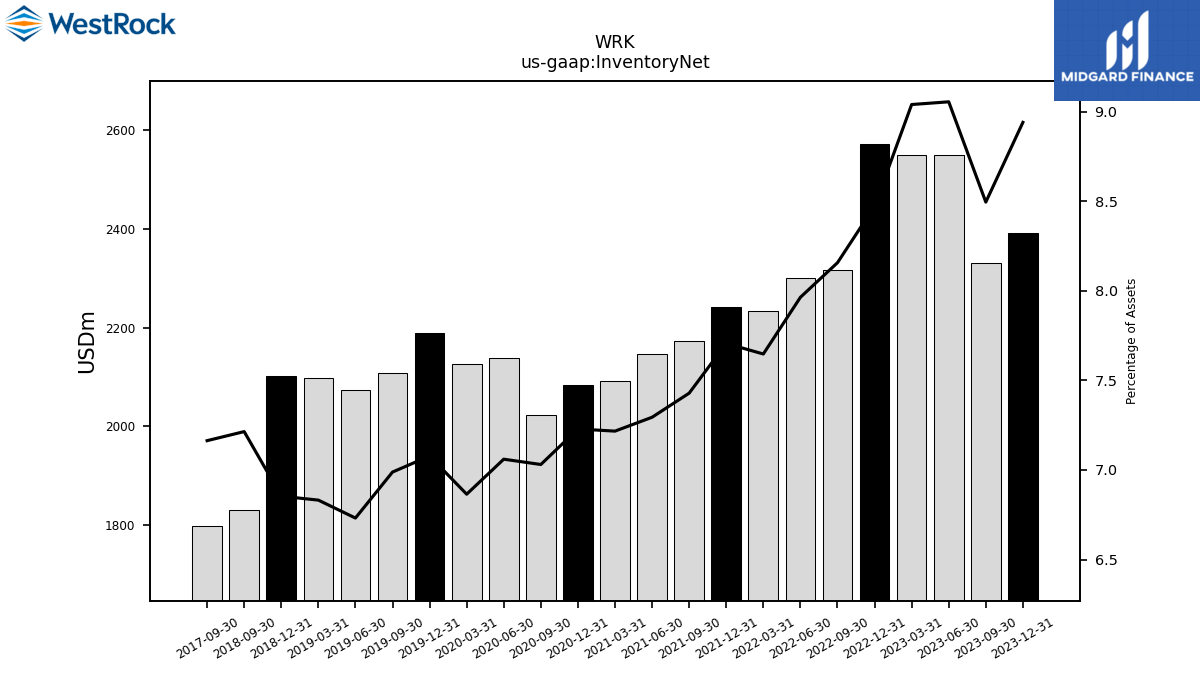
| Inventory Net | 2391.30 | 2331.50 | 2549.00 | 2550.30 | 2570.90 | 2317.10 | 2300.50 | 2233.50 | 2241.30 | 2173.30 | 2145.60 | 2090.90 | 2084.60 | 2023.40 | 2137.70 | 2125.40 | 2189.70 | 2107.50 | 2074.20 | 2096.90 | 2101.80 | 1829.60 | NA | NA | NA | 1797.30 | NA | NA | NA | |
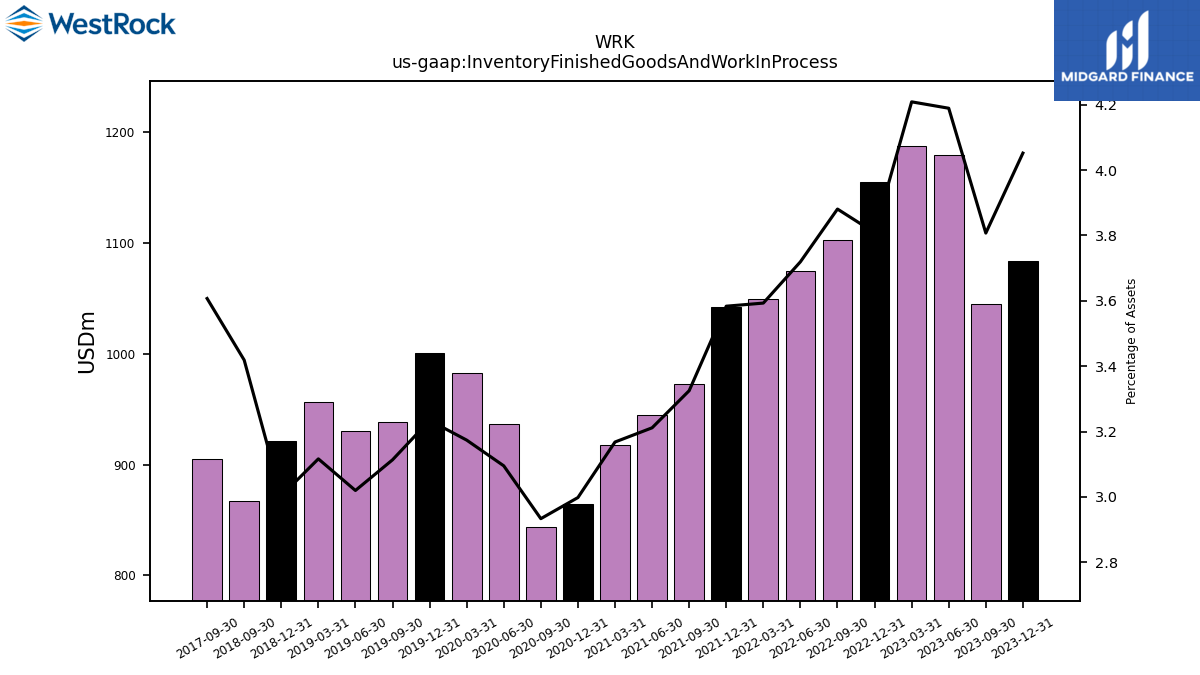
| Inventory Finished Goods And Work In Process | 1083.80 | 1044.90 | 1179.30 | 1187.40 | 1155.60 | 1102.40 | 1074.40 | 1049.40 | 1042.20 | 972.70 | 944.60 | 917.80 | 864.50 | 844.20 | 937.10 | 982.60 | 1000.50 | 938.90 | 930.40 | 956.50 | 921.00 | 867.00 | NA | NA | NA | 905.00 | NA | NA | NA | |
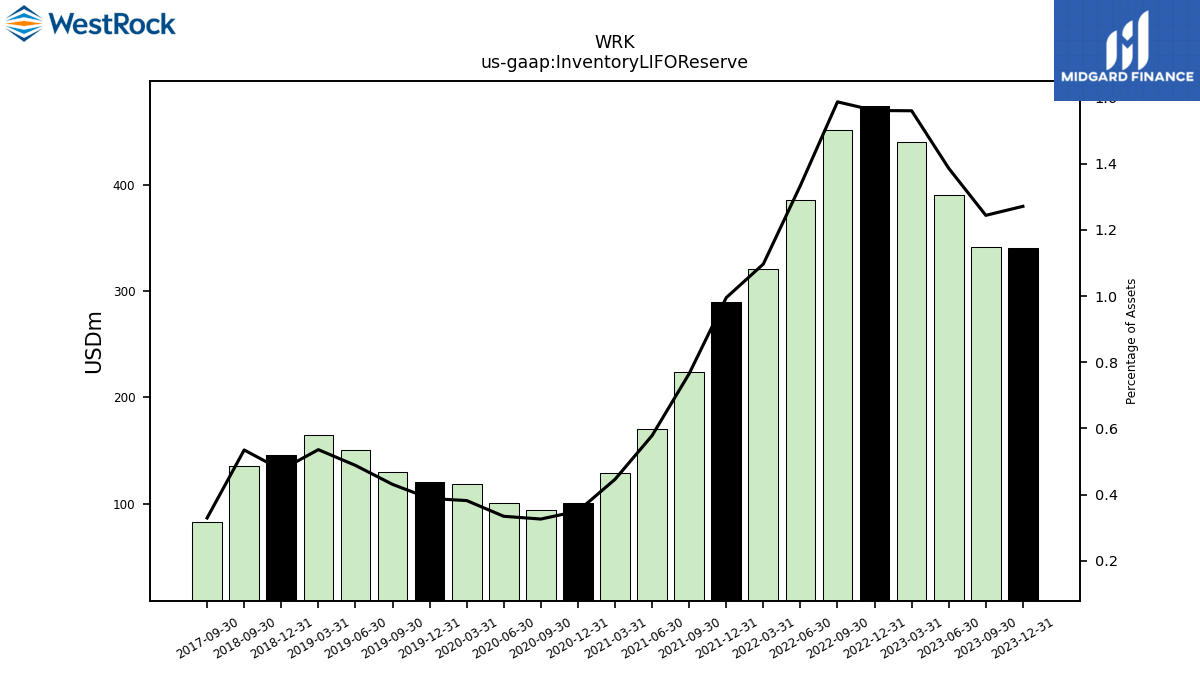
| Inventory L I F O Reserve | 340.00 | 341.40 | 390.20 | 440.10 | 473.60 | 450.80 | 385.40 | 320.30 | 289.40 | 223.90 | 170.10 | 129.20 | 100.90 | 93.80 | 101.20 | 118.20 | 120.10 | 129.90 | 150.40 | 164.40 | 145.60 | 135.60 | NA | NA | NA | 82.60 | NA | NA | NA | |
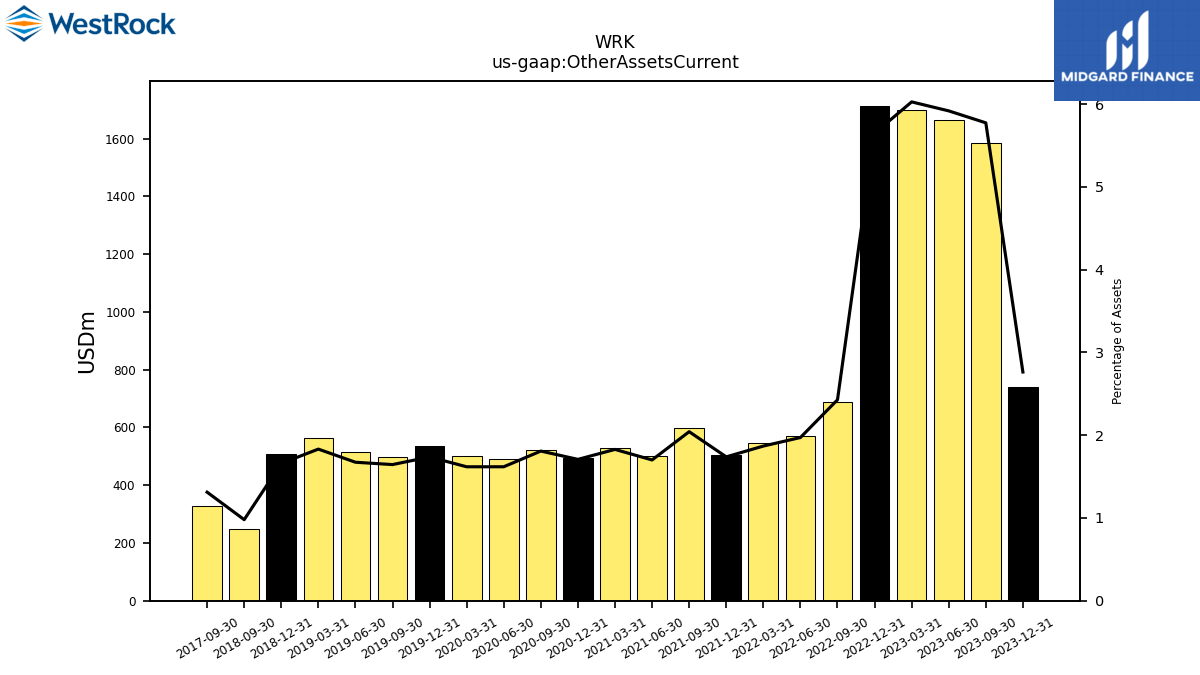
| Other Assets Current | 739.20 | 1584.80 | 1666.20 | 1700.50 | 1713.90 | 689.80 | 569.70 | 545.90 | 505.60 | 597.60 | 500.40 | 529.80 | 492.60 | 520.50 | 490.20 | 501.20 | 537.50 | 496.20 | 515.70 | 562.40 | 508.90 | 248.50 | NA | NA | NA | 329.20 | NA | NA | NA |
| 2023-12-31 | 2023-09-30 | 2023-06-30 | 2023-03-31 | 2022-12-31 | 2022-09-30 | 2022-06-30 | 2022-03-31 | 2021-12-31 | 2021-09-30 | 2021-06-30 | 2021-03-31 | 2020-12-31 | 2020-09-30 | 2020-06-30 | 2020-03-31 | 2019-12-31 | 2019-09-30 | 2019-06-30 | 2019-03-31 | 2018-12-31 | 2018-09-30 | 2018-06-30 | 2018-03-31 | 2017-12-31 | 2017-09-30 | 2017-06-30 | 2017-03-31 | 2016-12-31 | ||
|---|---|---|---|---|---|---|---|---|---|---|---|---|---|---|---|---|---|---|---|---|---|---|---|---|---|---|---|---|---|---|
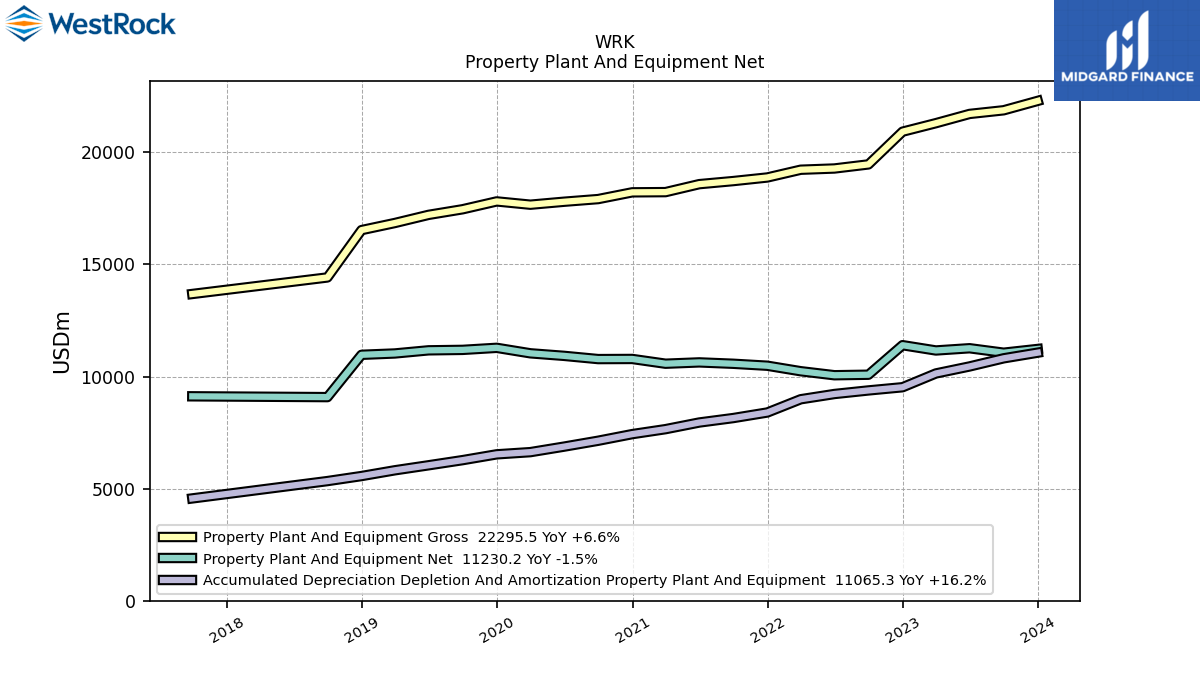
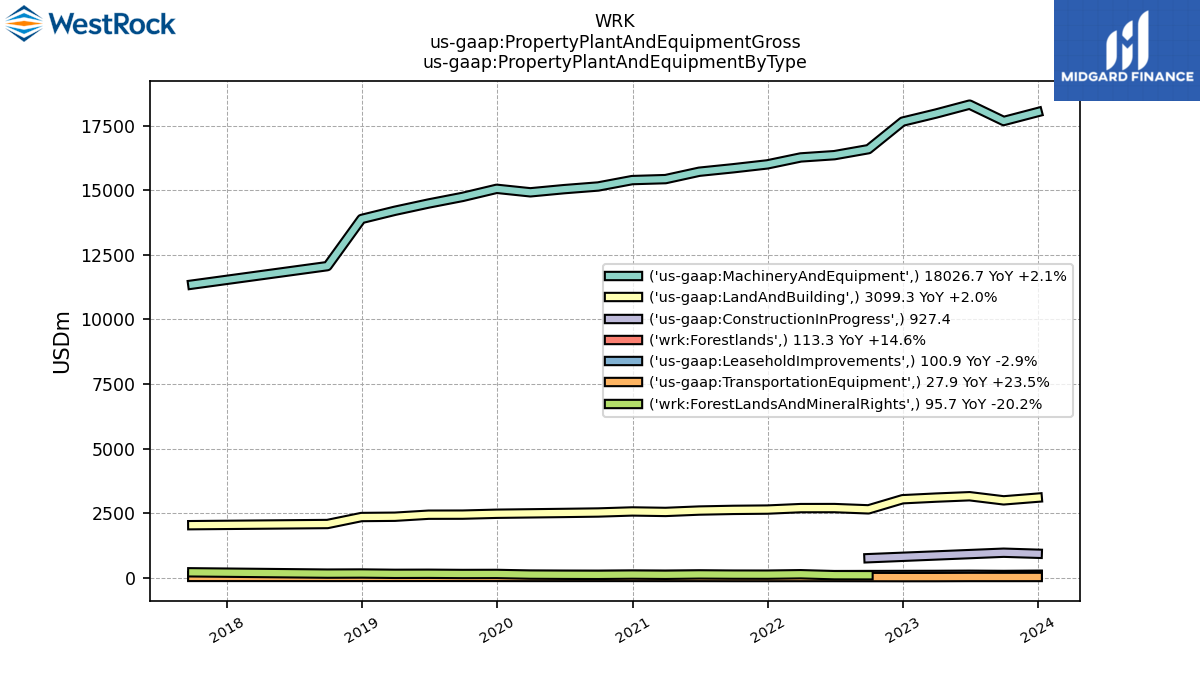
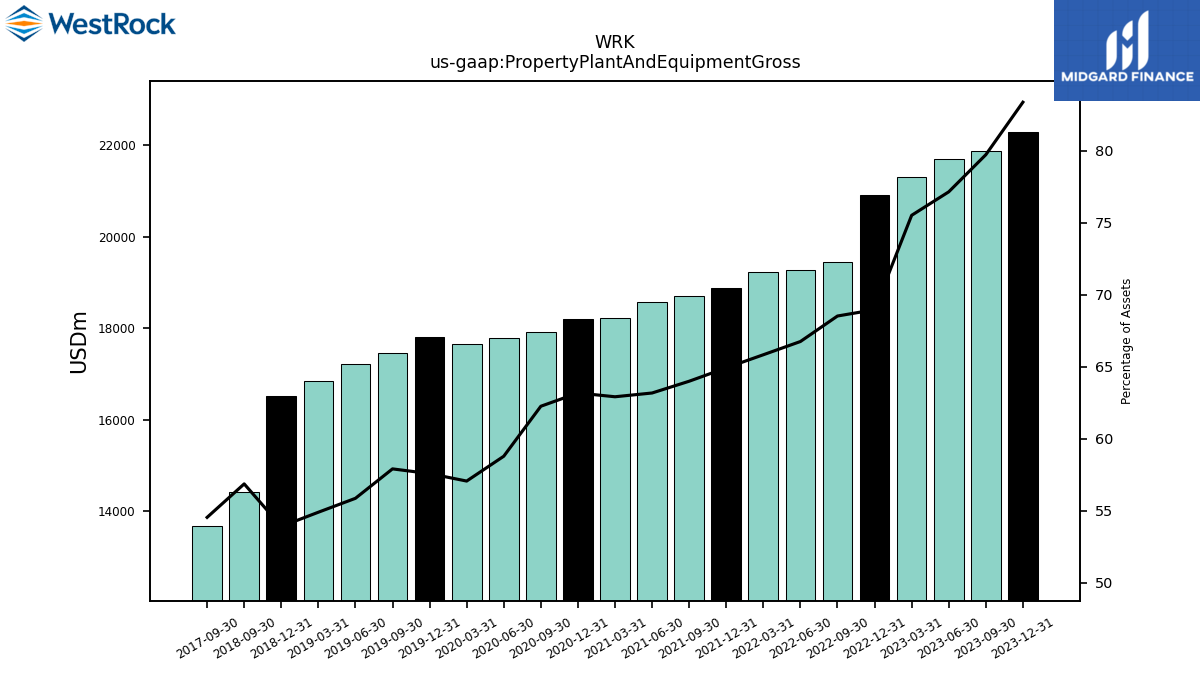
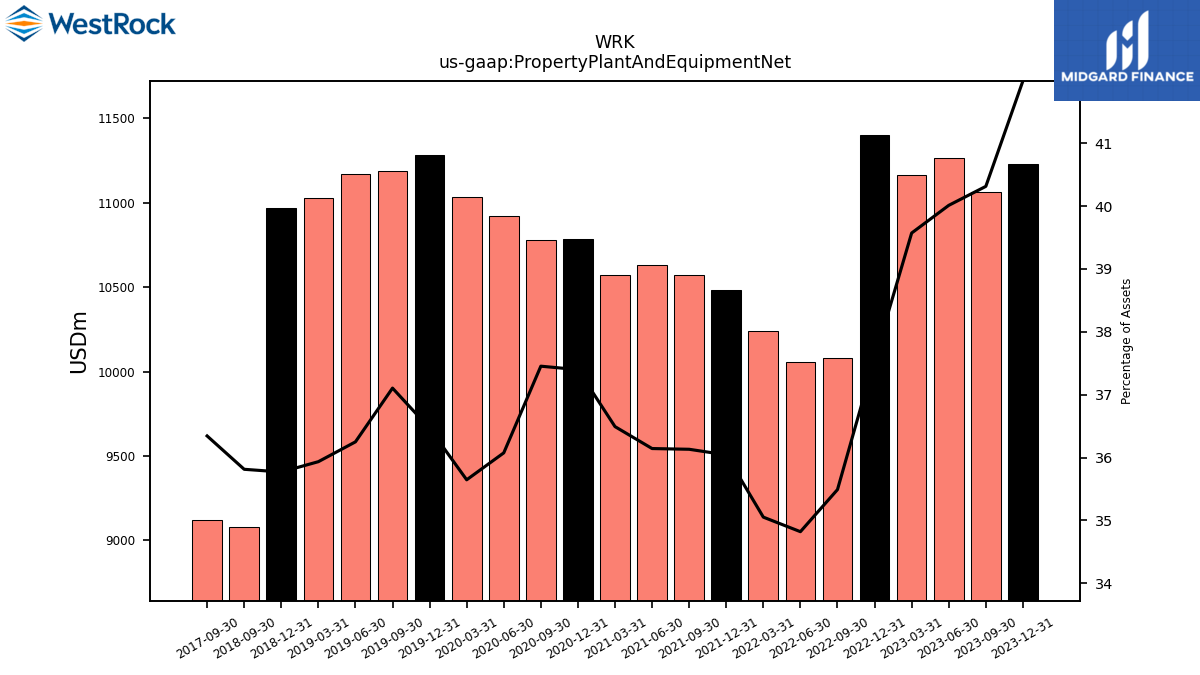
| Property Plant And Equipment Gross | 22295.50 | 21876.20 | 21713.00 | 21300.80 | 20922.10 | 19462.20 | 19279.60 | 19224.80 | 18879.30 | 18719.10 | 18581.10 | 18226.00 | 18216.30 | 17915.50 | 17797.20 | 17664.80 | 17811.50 | 17461.30 | 17211.20 | 16848.10 | 16531.80 | 14419.90 | NA | NA | NA | 13682.50 | NA | NA | NA | |
| Accumulated Depreciation Depletion And Amortization Property Plant And Equipment | 11065.30 | 10813.00 | 10450.50 | 10137.80 | 9523.40 | 9380.80 | 9221.20 | 8987.40 | 8397.20 | 8149.00 | 7949.80 | 7653.50 | 7432.00 | 7136.60 | 6874.60 | 6628.50 | 6530.40 | 6271.80 | 6041.90 | 5818.70 | 5562.10 | 5337.40 | NA | NA | NA | 4564.20 | NA | NA | NA | |
| Property Plant And Equipment Net | 11230.20 | 11063.20 | 11262.50 | 11163.00 | 11398.70 | 10081.40 | 10058.40 | 10237.40 | 10482.10 | 10570.10 | 10631.30 | 10572.50 | 10784.30 | 10778.90 | 10922.60 | 11036.30 | 11281.10 | 11189.50 | 11169.30 | 11029.40 | 10969.70 | 9082.50 | NA | NA | NA | 9118.30 | NA | NA | NA | |
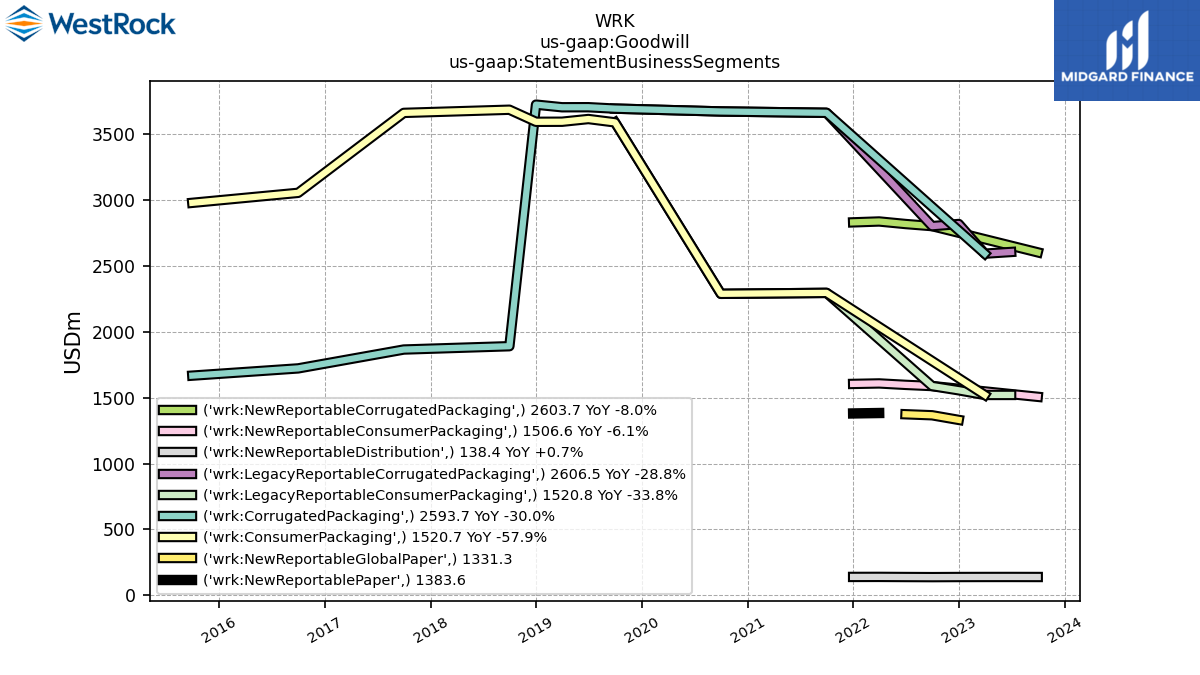
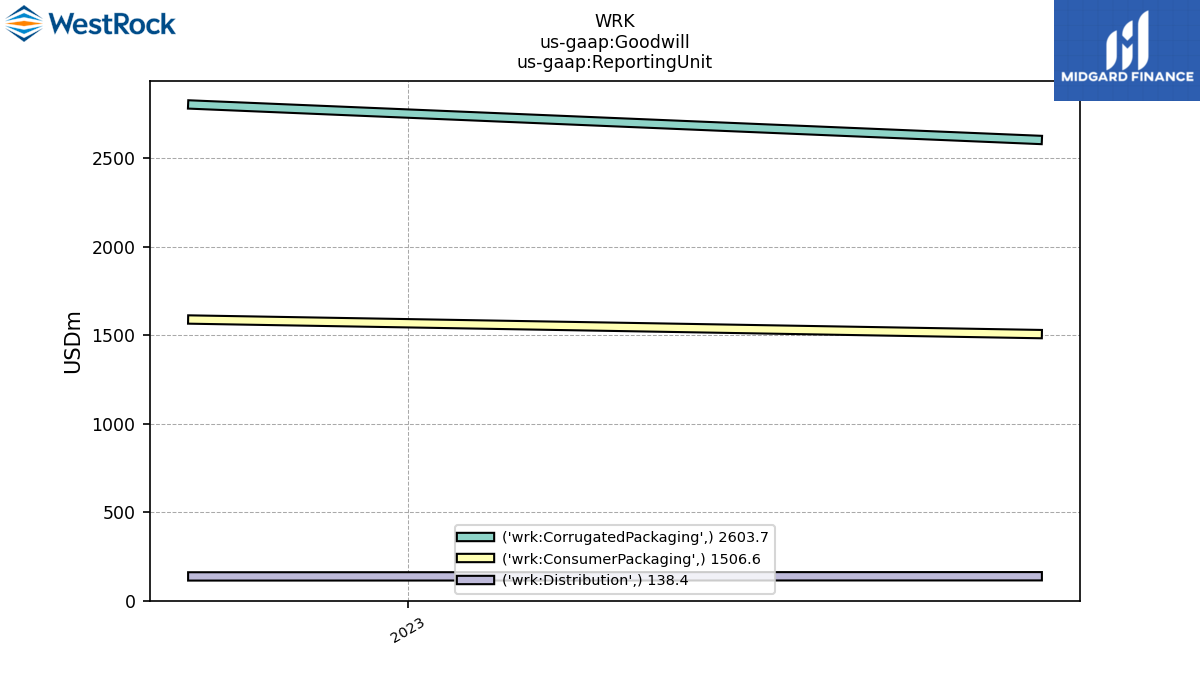
| Goodwill | 4270.20 | 4248.70 | 4266.00 | 4253.00 | 6073.40 | 5895.20 | 5928.80 | 5969.30 | 5955.40 | 5959.20 | 5982.70 | 5959.10 | 5997.00 | 5962.20 | 7270.50 | 7264.00 | 7327.00 | 7285.60 | 7321.90 | 7300.90 | 7320.30 | 5577.60 | NA | NA | NA | 5528.30 | NA | NA | NA | |
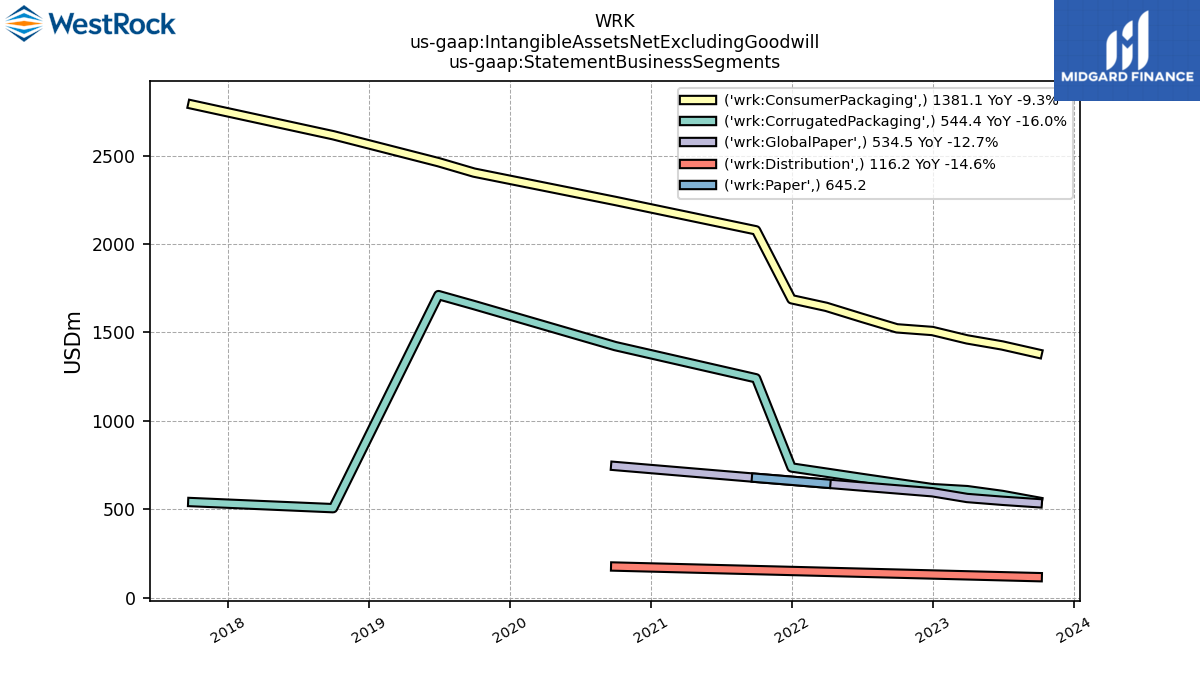
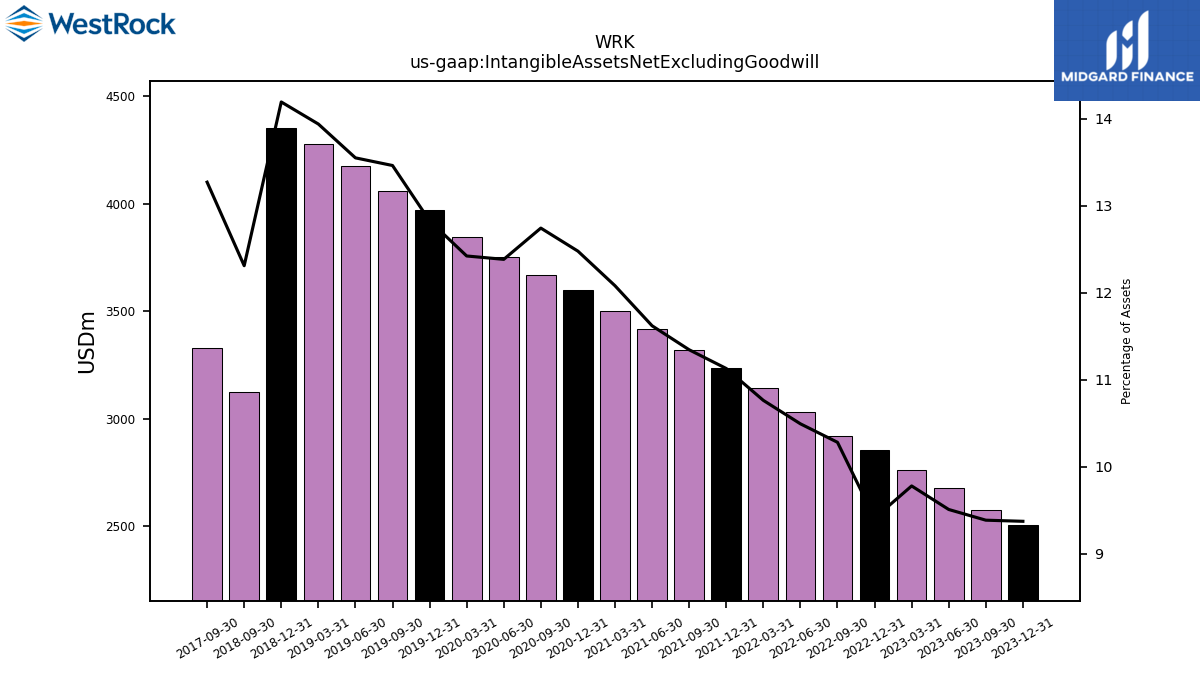
| Intangible Assets Net Excluding Goodwill | 2507.30 | 2576.20 | 2677.00 | 2759.10 | 2855.40 | 2920.60 | 3031.30 | 3143.60 | 3236.80 | 3318.80 | 3418.00 | 3499.90 | 3598.10 | 3667.20 | 3749.40 | 3845.90 | 3968.00 | 4059.50 | 4174.80 | 4277.90 | 4352.00 | 3122.00 | NA | NA | NA | 3329.30 | NA | NA | NA | |
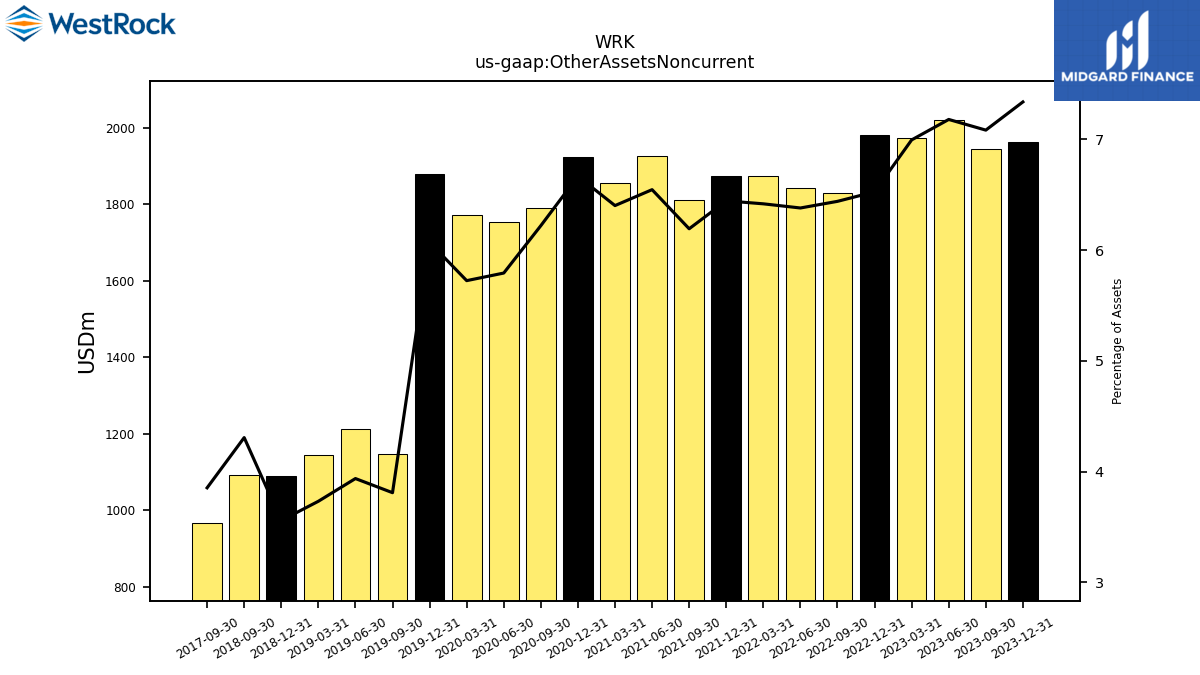
| Other Assets Noncurrent | 1962.90 | 1944.20 | 2021.30 | 1973.60 | 1980.40 | 1829.60 | 1843.20 | 1874.60 | 1874.50 | 1811.80 | 1925.60 | 1855.00 | 1922.70 | 1790.50 | 1754.10 | 1772.40 | 1878.20 | 1148.80 | 1213.10 | 1145.40 | 1091.10 | 1092.30 | NA | NA | NA | 966.80 | NA | NA | NA |
| 2023-12-31 | 2023-09-30 | 2023-06-30 | 2023-03-31 | 2022-12-31 | 2022-09-30 | 2022-06-30 | 2022-03-31 | 2021-12-31 | 2021-09-30 | 2021-06-30 | 2021-03-31 | 2020-12-31 | 2020-09-30 | 2020-06-30 | 2020-03-31 | 2019-12-31 | 2019-09-30 | 2019-06-30 | 2019-03-31 | 2018-12-31 | 2018-09-30 | 2018-06-30 | 2018-03-31 | 2017-12-31 | 2017-09-30 | 2017-06-30 | 2017-03-31 | 2016-12-31 | ||
|---|---|---|---|---|---|---|---|---|---|---|---|---|---|---|---|---|---|---|---|---|---|---|---|---|---|---|---|---|---|---|
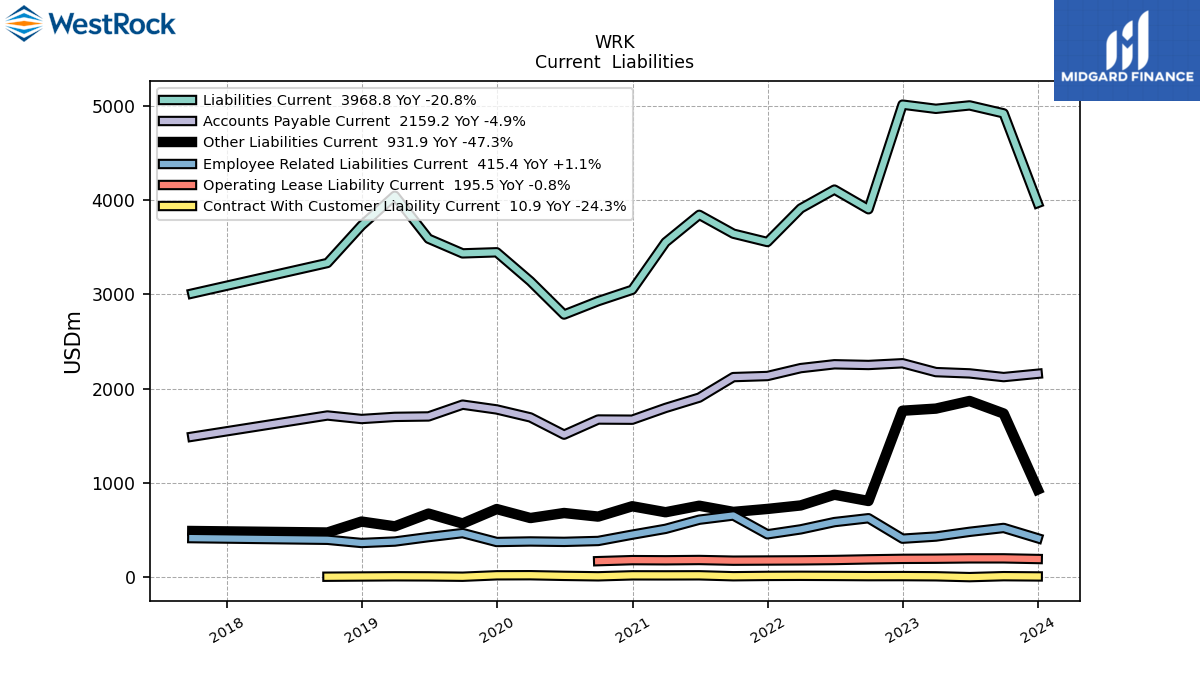
| Liabilities Current | 3968.80 | 4919.40 | 5003.70 | 4967.50 | 5012.00 | 3902.80 | 4111.40 | 3911.80 | 3555.50 | 3644.10 | 3844.00 | 3552.70 | 3049.10 | 2928.90 | 2786.90 | 3139.80 | 3446.80 | 3435.10 | 3590.50 | 4046.60 | 3729.90 | 3333.30 | NA | NA | NA | 3009.80 | NA | NA | NA | |
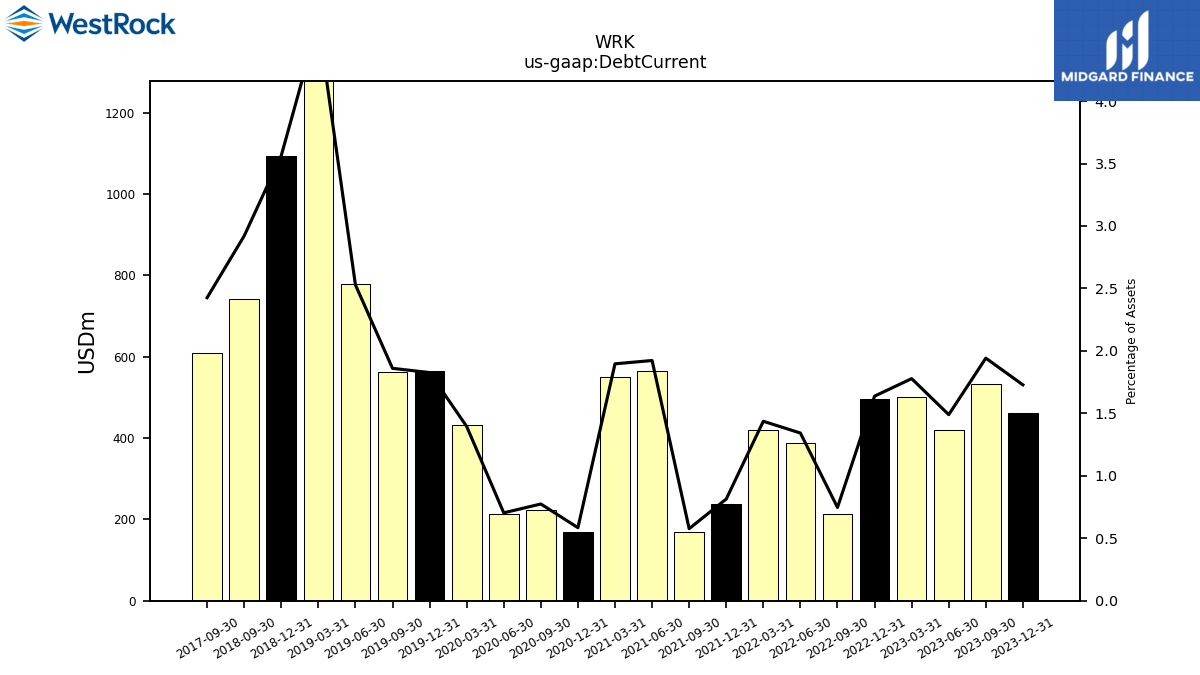
| Debt Current | 462.30 | 533.00 | 419.40 | 501.60 | 497.00 | 212.20 | 387.80 | 419.60 | 236.80 | 168.80 | 565.70 | 549.50 | 168.70 | 222.90 | 213.10 | 432.00 | 565.10 | 561.10 | 779.10 | 1422.40 | 1092.80 | 740.70 | NA | NA | NA | 608.70 | NA | NA | NA | |
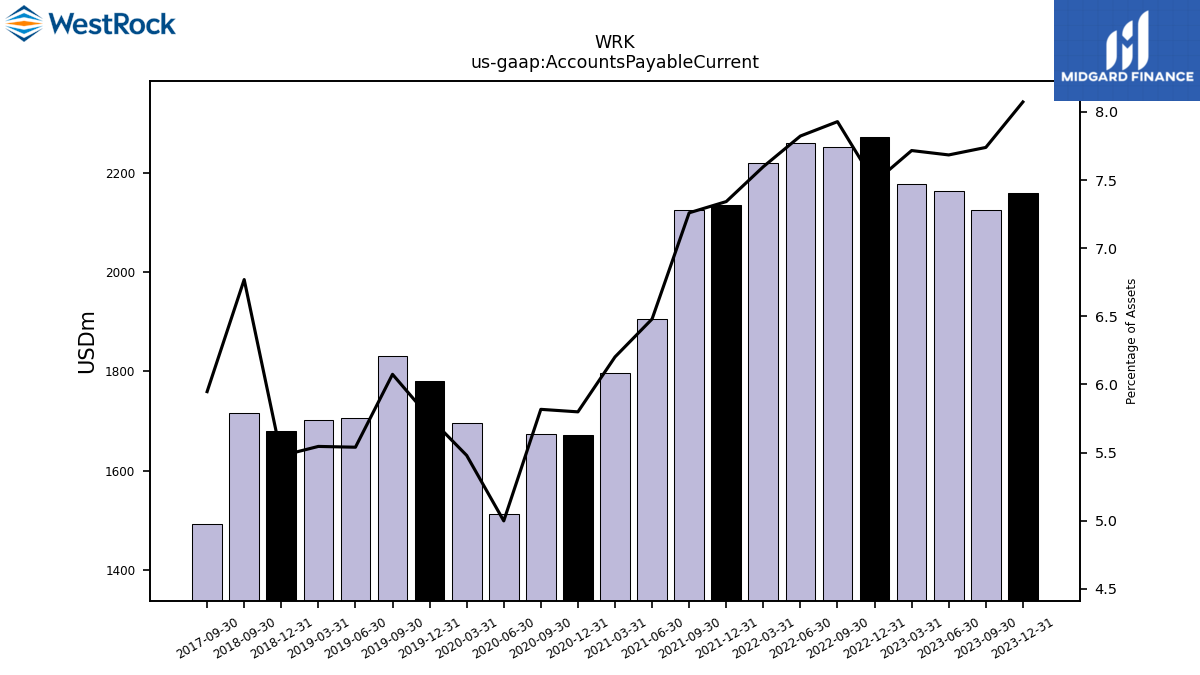
| Accounts Payable Current | 2159.20 | 2123.90 | 2163.00 | 2176.80 | 2270.60 | 2252.10 | 2259.70 | 2219.00 | 2135.20 | 2123.70 | 1906.10 | 1796.80 | 1672.20 | 1674.20 | 1513.50 | 1696.40 | 1781.00 | 1831.80 | 1706.80 | 1702.00 | 1679.50 | 1716.80 | NA | NA | NA | 1492.10 | NA | NA | NA | |
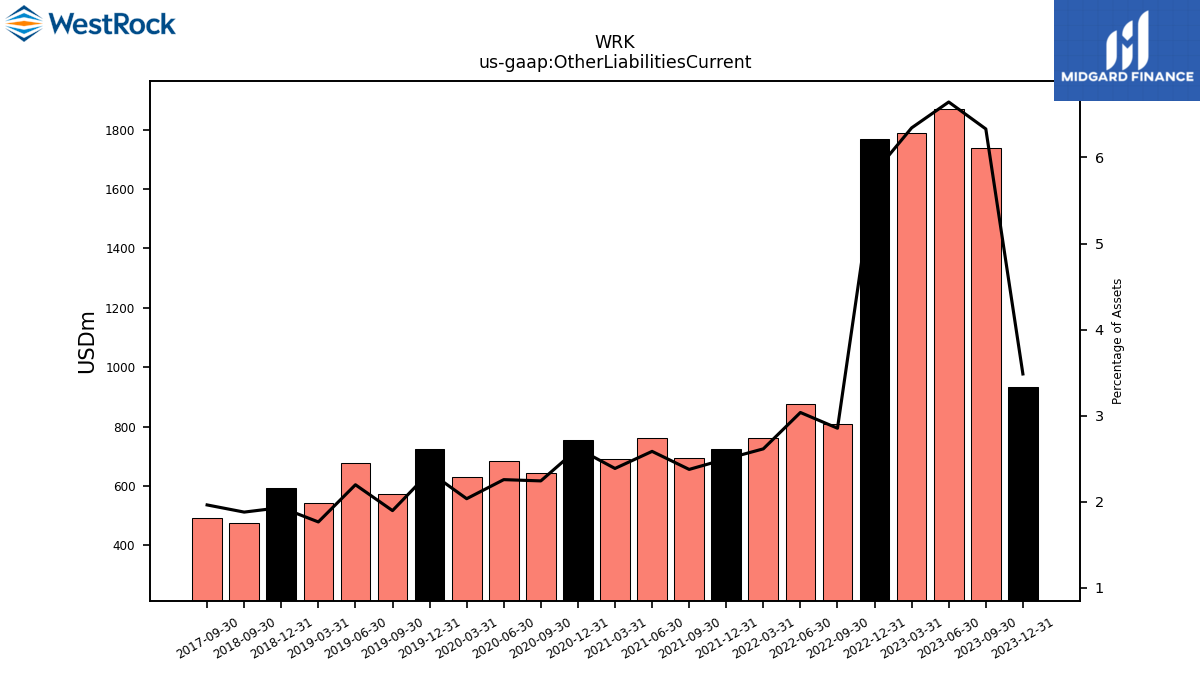
| Other Liabilities Current | 931.90 | 1737.60 | 1870.40 | 1789.70 | 1767.40 | 810.60 | 877.10 | 763.40 | 726.20 | 694.80 | 760.20 | 691.30 | 754.60 | 645.10 | 683.10 | 629.90 | 725.00 | 571.80 | 676.80 | 541.60 | 592.40 | 476.50 | NA | NA | NA | 492.30 | NA | NA | NA | |
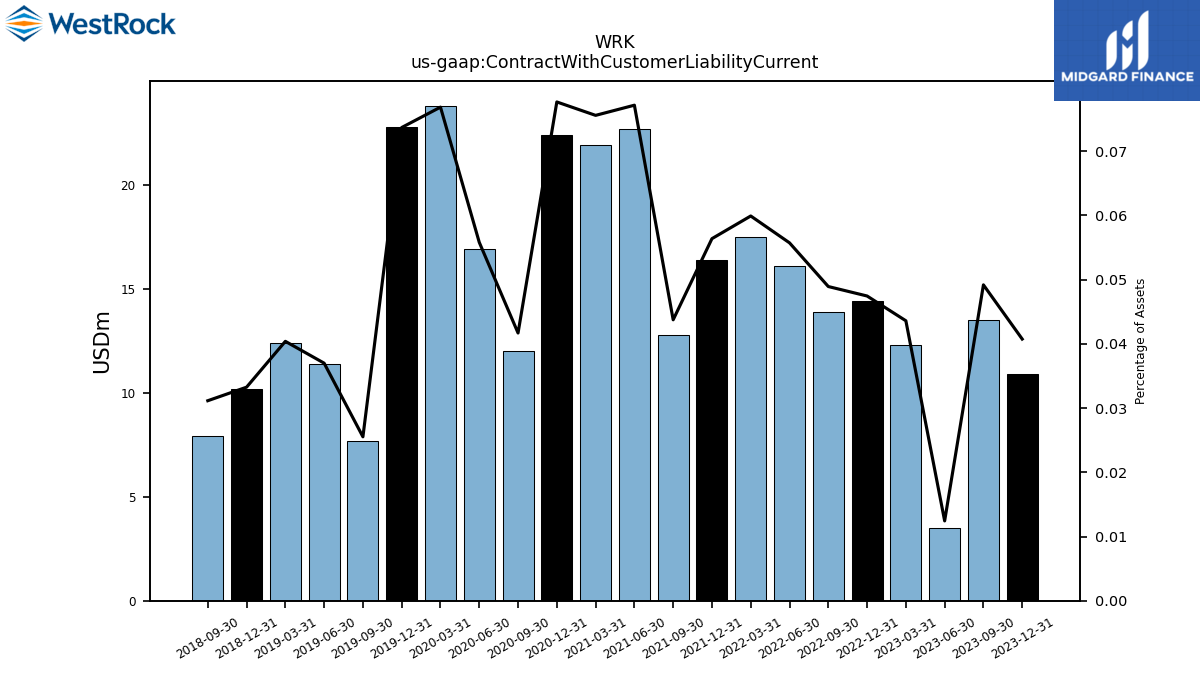
| Contract With Customer Liability Current | 10.90 | 13.50 | 3.50 | 12.30 | 14.40 | 13.90 | 16.10 | 17.50 | 16.40 | 12.80 | 22.70 | 21.90 | 22.40 | 12.00 | 16.90 | 23.80 | 22.80 | 7.70 | 11.40 | 12.40 | 10.20 | 7.90 | NA | NA | NA | NA | NA | NA | NA |
| 2023-12-31 | 2023-09-30 | 2023-06-30 | 2023-03-31 | 2022-12-31 | 2022-09-30 | 2022-06-30 | 2022-03-31 | 2021-12-31 | 2021-09-30 | 2021-06-30 | 2021-03-31 | 2020-12-31 | 2020-09-30 | 2020-06-30 | 2020-03-31 | 2019-12-31 | 2019-09-30 | 2019-06-30 | 2019-03-31 | 2018-12-31 | 2018-09-30 | 2018-06-30 | 2018-03-31 | 2017-12-31 | 2017-09-30 | 2017-06-30 | 2017-03-31 | 2016-12-31 | ||
|---|---|---|---|---|---|---|---|---|---|---|---|---|---|---|---|---|---|---|---|---|---|---|---|---|---|---|---|---|---|---|
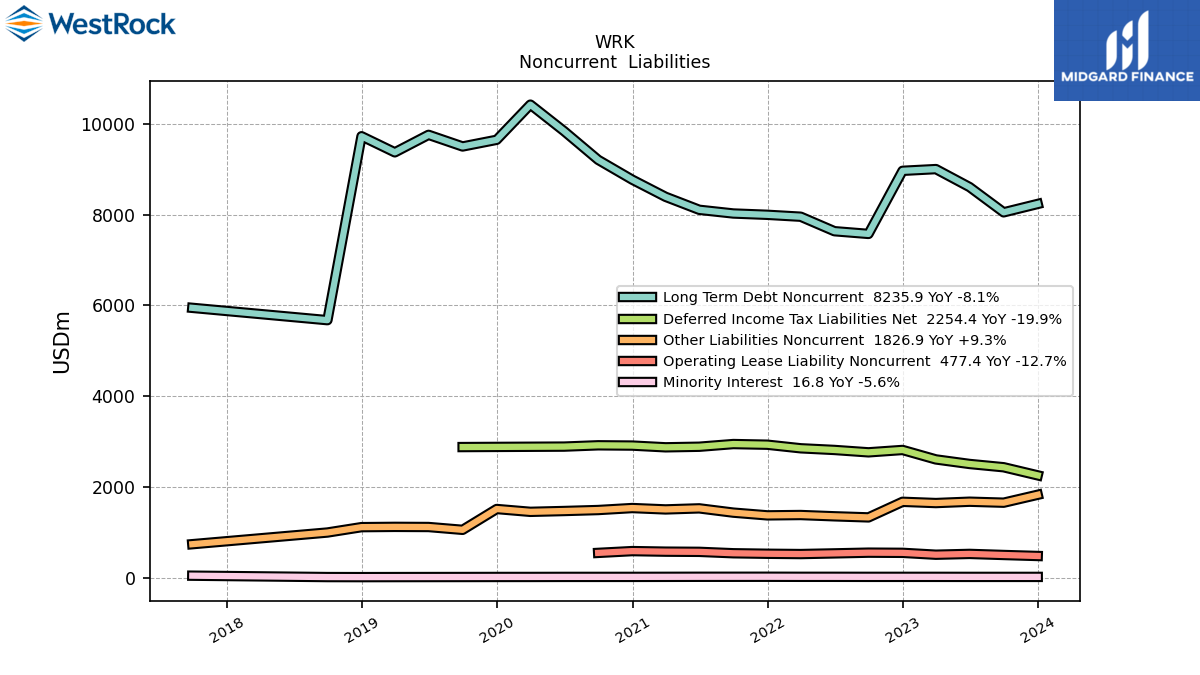
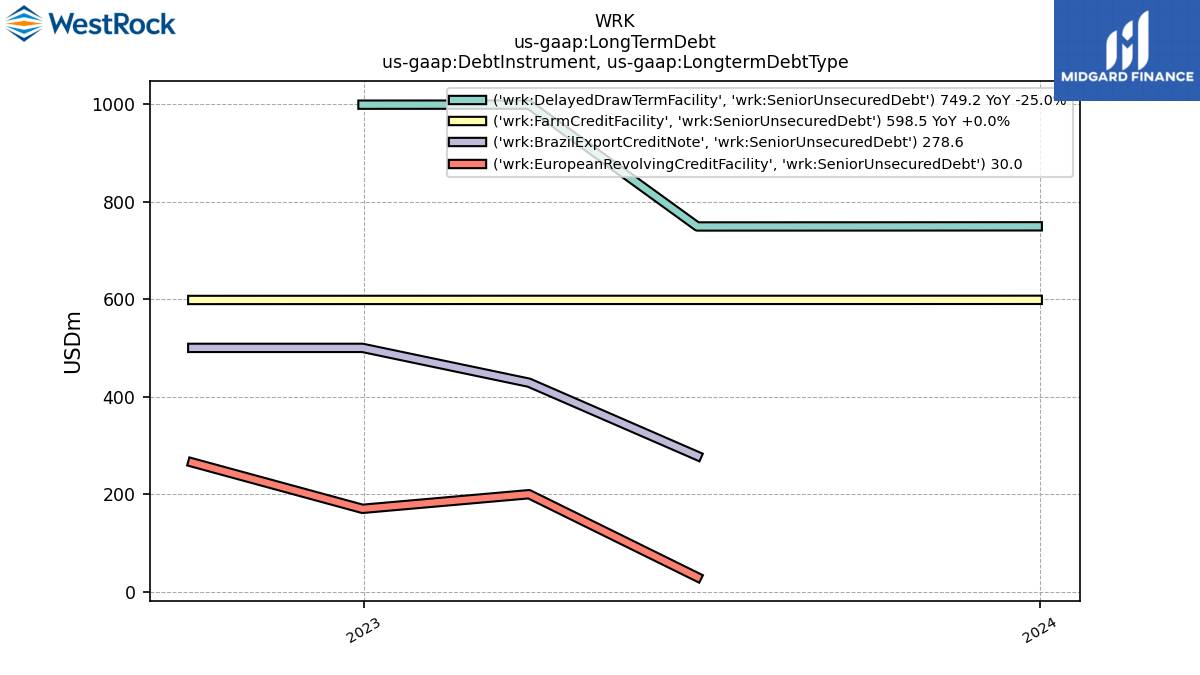
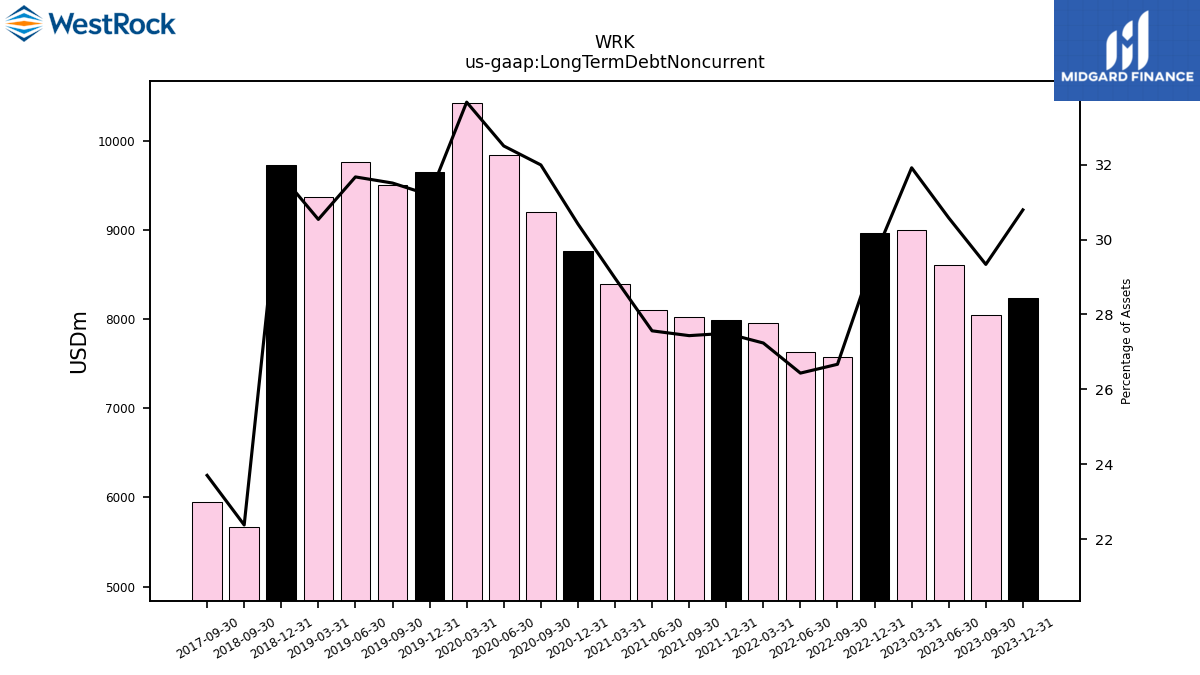
| Long Term Debt Noncurrent | 8235.90 | 8050.90 | 8607.60 | 9004.00 | 8965.80 | 7575.00 | 7635.10 | 7954.40 | 7996.40 | 8025.30 | 8106.90 | 8393.10 | 8771.10 | 9207.70 | 9840.30 | 10424.60 | 9649.30 | 9502.30 | 9759.10 | 9373.10 | 9728.00 | 5674.50 | NA | NA | NA | 5946.10 | NA | NA | NA | |
| Long Term Debt And Capital Lease Obligations | 8235.90 | 8050.90 | 8607.60 | 9004.00 | 8965.80 | 7575.00 | 7635.10 | 7954.40 | 7996.40 | 8025.30 | 8106.90 | 8393.10 | 8771.10 | 9207.70 | 9840.30 | 10424.60 | 9649.30 | 9502.30 | 9759.10 | 9373.10 | 9728.00 | 5674.50 | NA | NA | NA | 5946.10 | NA | NA | NA | |
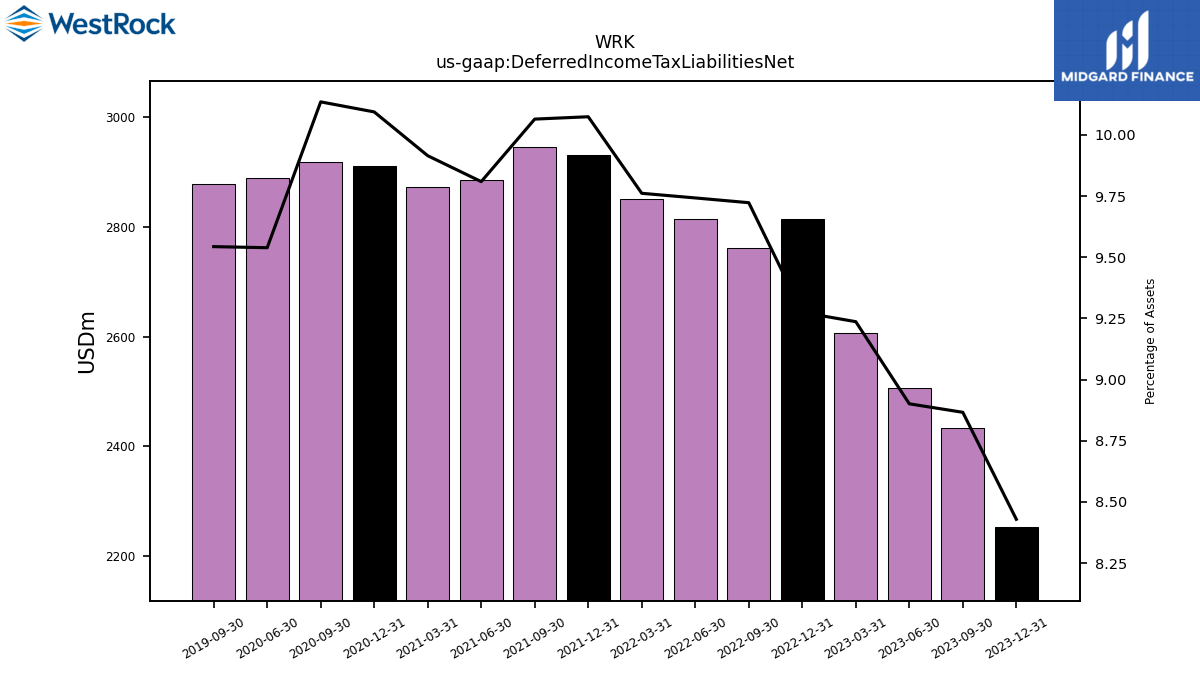
| Deferred Income Tax Liabilities Net | 2254.40 | 2433.20 | 2505.50 | 2605.70 | 2814.10 | 2761.90 | 2814.20 | 2850.90 | 2929.90 | 2944.40 | 2885.30 | 2872.60 | 2910.80 | 2916.90 | 2888.20 | NA | NA | 2878.00 | NA | NA | NA | NA | NA | NA | NA | NA | NA | NA | NA | |
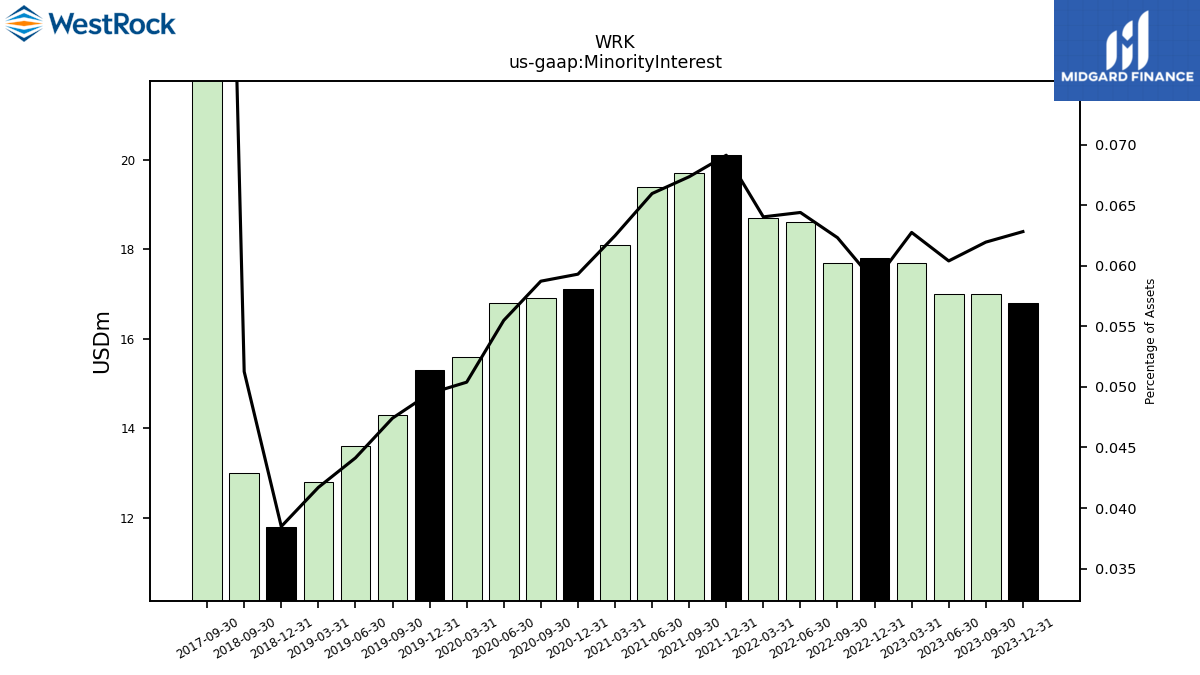
| Minority Interest | 16.80 | 17.00 | 17.00 | 17.70 | 17.80 | 17.70 | 18.60 | 18.70 | 20.10 | 19.70 | 19.40 | 18.10 | 17.10 | 16.90 | 16.80 | 15.60 | 15.30 | 14.30 | 13.60 | 12.80 | 11.80 | 13.00 | NA | NA | NA | 43.60 | NA | NA | NA | |
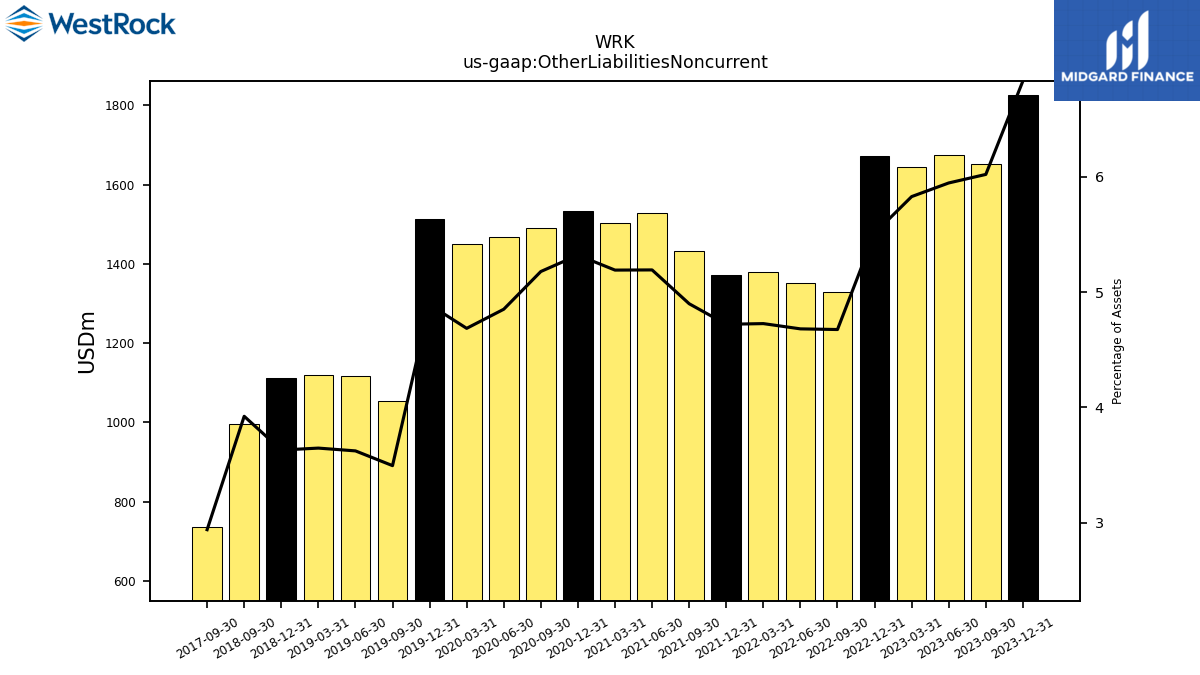
| Other Liabilities Noncurrent | 1826.90 | 1652.20 | 1673.80 | 1644.10 | 1671.80 | 1328.00 | 1352.10 | 1380.40 | 1372.80 | 1433.10 | 1527.20 | 1503.80 | 1534.10 | 1490.30 | 1468.80 | 1450.60 | 1513.00 | 1053.90 | 1116.20 | 1119.30 | 1113.20 | 994.80 | NA | NA | NA | 737.40 | NA | NA | NA | |
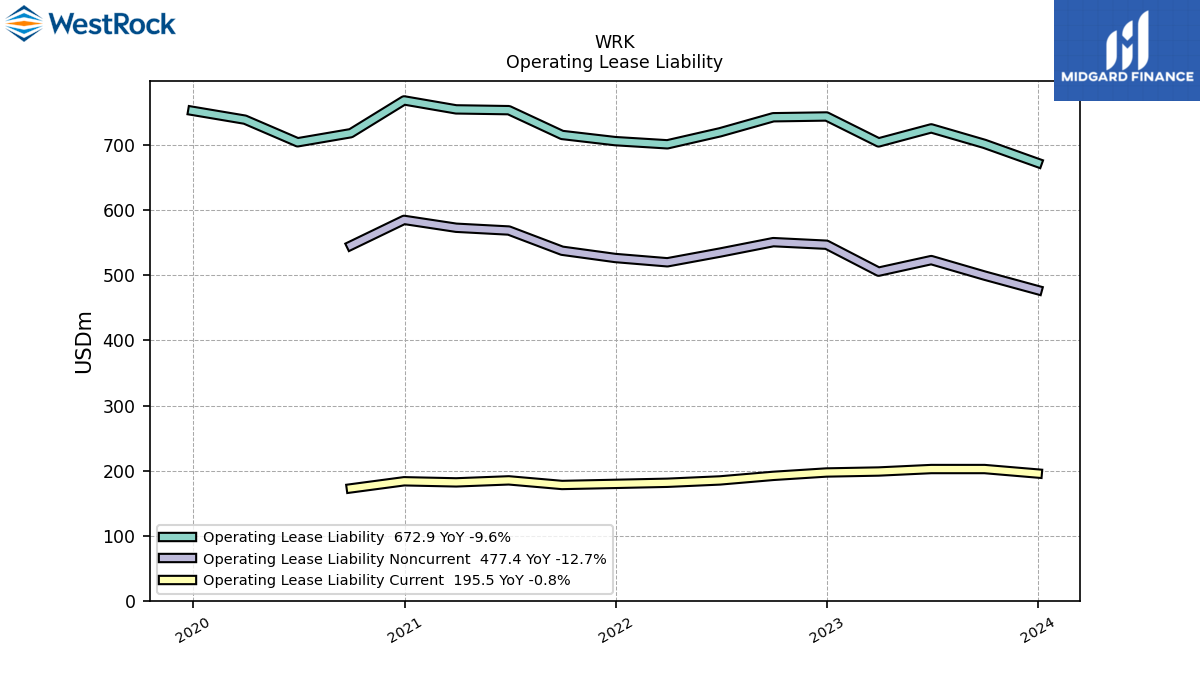
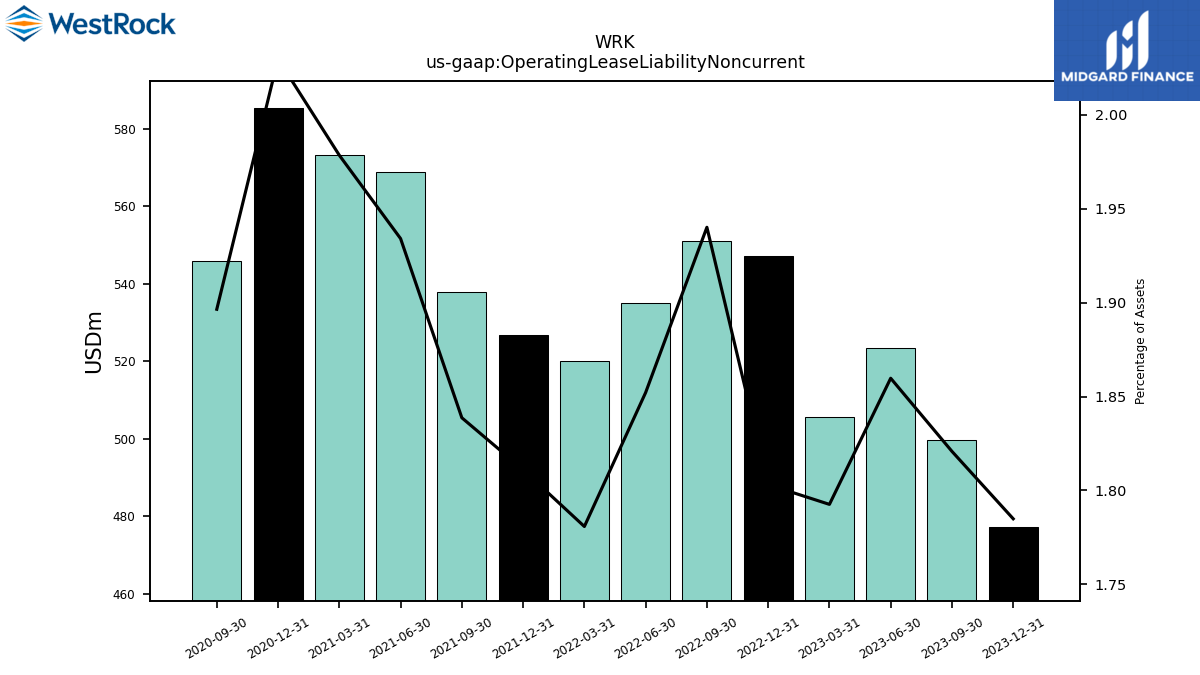
| Operating Lease Liability Noncurrent | 477.40 | 499.70 | 523.50 | 505.70 | 547.10 | 551.10 | 535.00 | 520.10 | 526.70 | 537.90 | 568.90 | 573.20 | 585.30 | 545.80 | NA | NA | NA | NA | NA | NA | NA | NA | NA | NA | NA | NA | NA | NA | NA |
| 2023-12-31 | 2023-09-30 | 2023-06-30 | 2023-03-31 | 2022-12-31 | 2022-09-30 | 2022-06-30 | 2022-03-31 | 2021-12-31 | 2021-09-30 | 2021-06-30 | 2021-03-31 | 2020-12-31 | 2020-09-30 | 2020-06-30 | 2020-03-31 | 2019-12-31 | 2019-09-30 | 2019-06-30 | 2019-03-31 | 2018-12-31 | 2018-09-30 | 2018-06-30 | 2018-03-31 | 2017-12-31 | 2017-09-30 | 2017-06-30 | 2017-03-31 | 2016-12-31 | ||
|---|---|---|---|---|---|---|---|---|---|---|---|---|---|---|---|---|---|---|---|---|---|---|---|---|---|---|---|---|---|---|
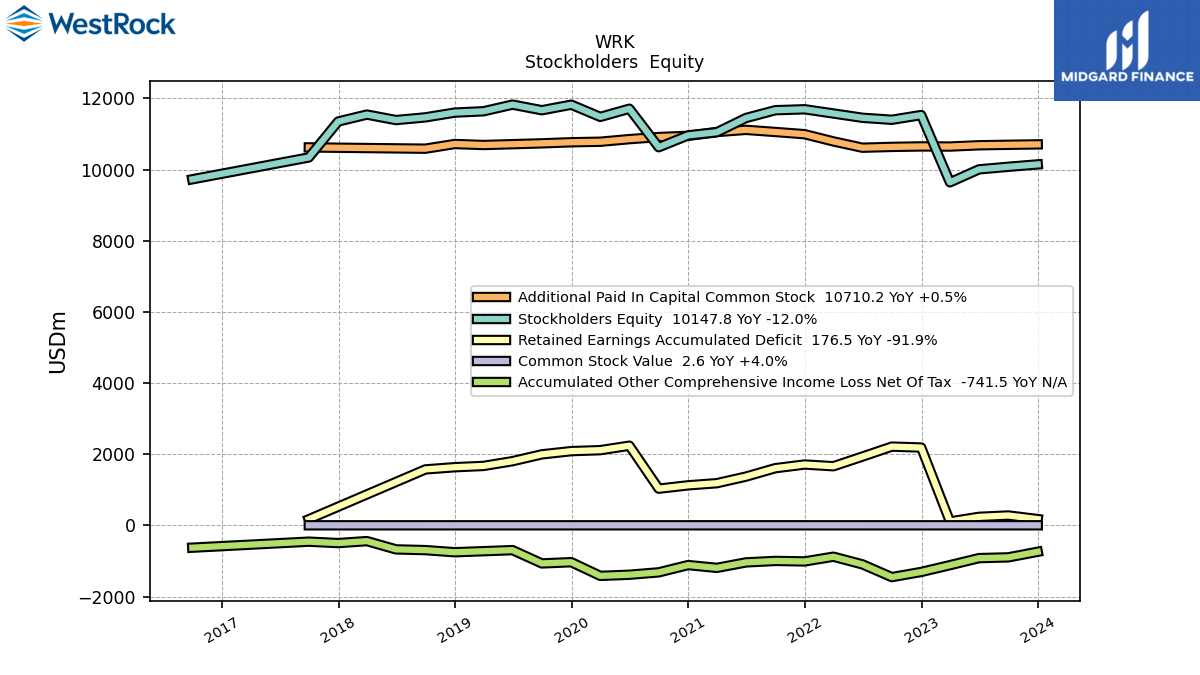
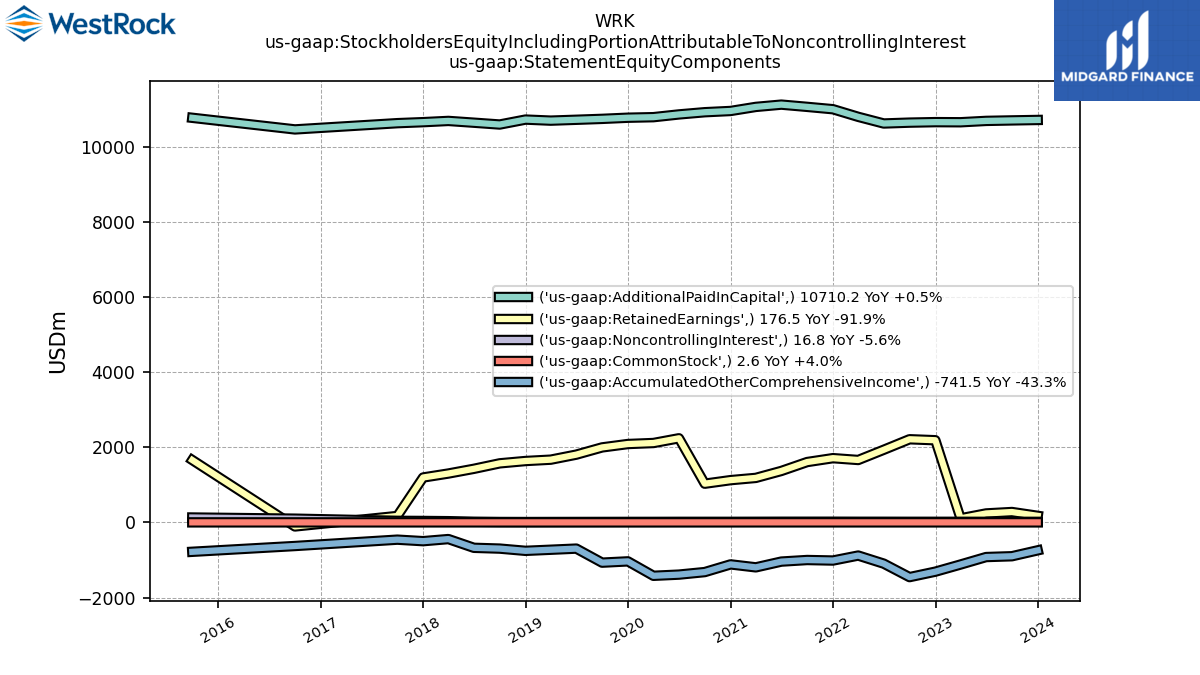
| Stockholders Equity | 10147.80 | 10080.70 | 10007.80 | 9643.40 | 11534.50 | 11402.00 | 11457.90 | 11578.40 | 11697.20 | 11670.30 | 11451.10 | 11051.90 | 10963.00 | 10630.60 | 11713.10 | 11482.40 | 11825.20 | 11669.90 | 11827.70 | 11640.80 | 11603.70 | 11469.40 | 11393.60 | 11547.90 | 11353.40 | 10342.50 | NA | NA | NA | |
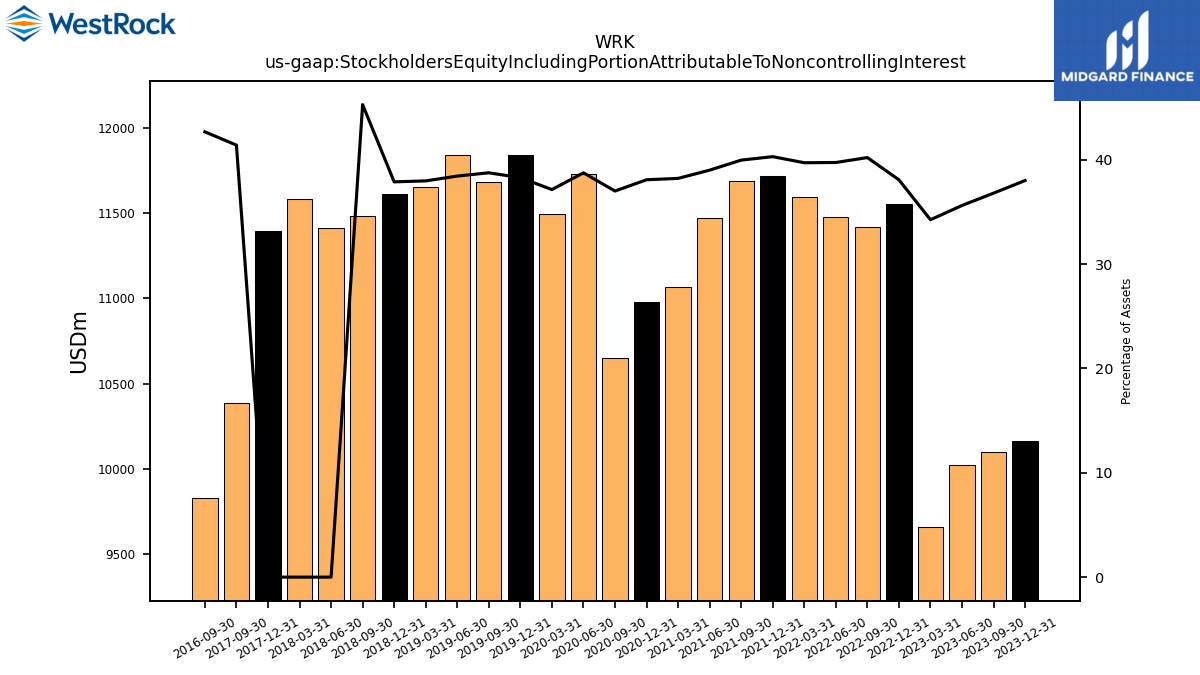
| Stockholders Equity Including Portion Attributable To Noncontrolling Interest | 10164.60 | 10097.70 | 10024.80 | 9661.10 | 11552.30 | 11419.70 | 11476.50 | 11597.10 | 11717.30 | 11690.00 | 11470.50 | 11070.00 | 10980.10 | 10647.50 | 11729.90 | 11498.00 | 11840.50 | 11684.20 | 11841.30 | 11653.60 | 11615.50 | 11482.40 | 11412.80 | 11582.20 | 11393.60 | 10386.10 | NA | NA | NA | |
| Common Stock Value | 2.60 | 2.60 | 2.60 | 2.60 | 2.50 | 2.50 | 2.50 | 2.60 | 2.60 | 2.70 | 2.70 | 2.70 | 2.60 | 2.60 | 2.60 | 2.60 | 2.60 | 2.60 | 2.60 | 2.60 | 2.60 | 2.50 | NA | NA | NA | 2.50 | NA | NA | NA | |
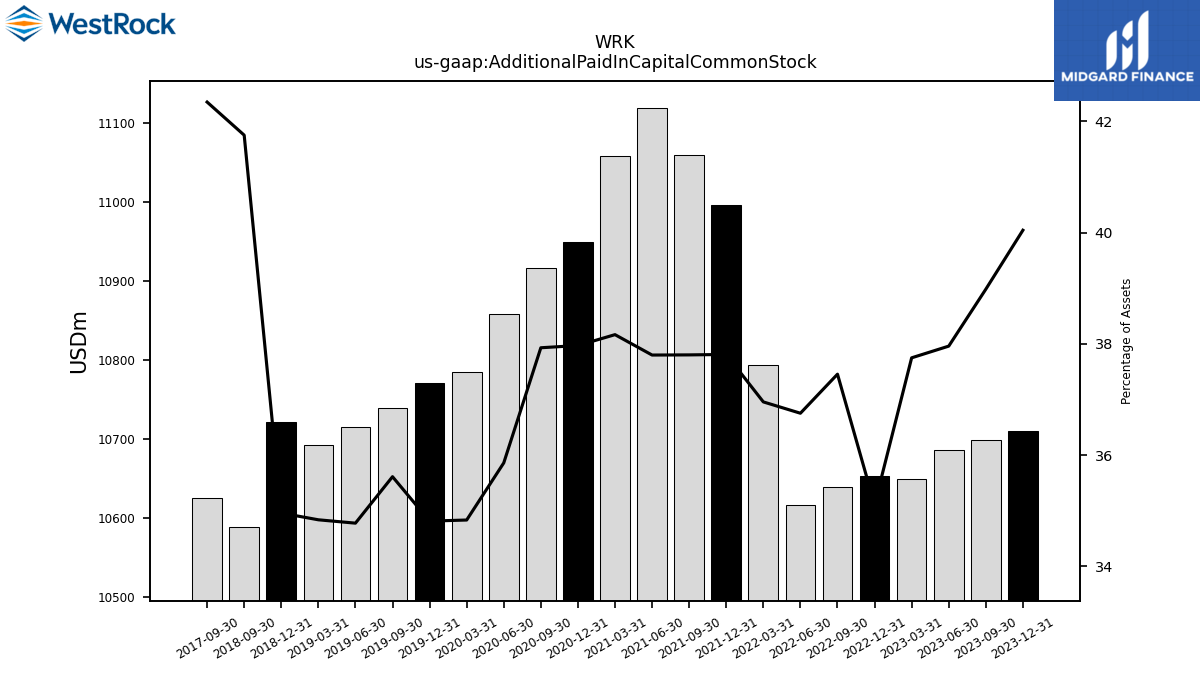
| Additional Paid In Capital Common Stock | 10710.20 | 10698.50 | 10685.30 | 10649.30 | 10652.60 | 10639.40 | 10616.40 | 10793.50 | 10996.10 | 11058.80 | 11118.40 | 11057.50 | 10949.40 | 10916.30 | 10857.60 | 10784.40 | 10770.00 | 10739.40 | 10715.40 | 10692.50 | 10720.60 | 10588.90 | NA | NA | NA | 10624.90 | NA | NA | NA | |
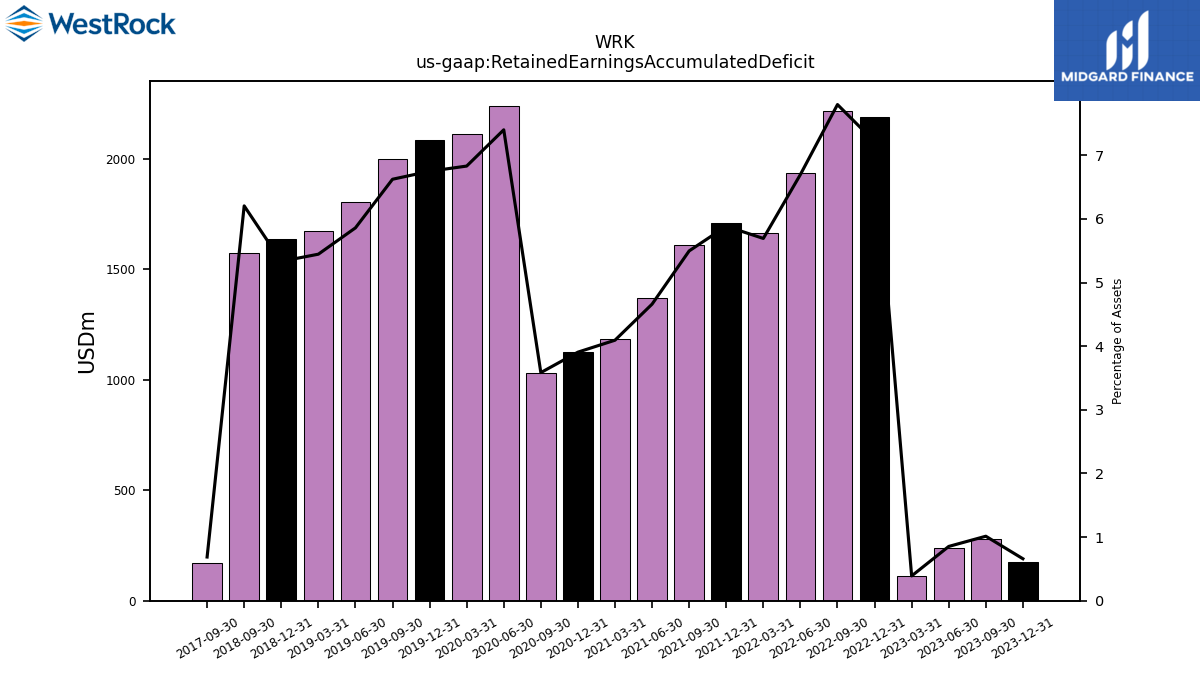
| Retained Earnings Accumulated Deficit | 176.50 | 278.20 | 240.20 | 110.00 | 2188.30 | 2214.40 | 1934.40 | 1662.50 | 1711.20 | 1607.90 | 1370.80 | 1186.00 | 1126.30 | 1031.60 | 2240.30 | 2114.40 | 2087.50 | 1997.10 | 1805.10 | 1671.20 | 1635.30 | 1573.30 | NA | NA | NA | 172.40 | NA | NA | NA | |
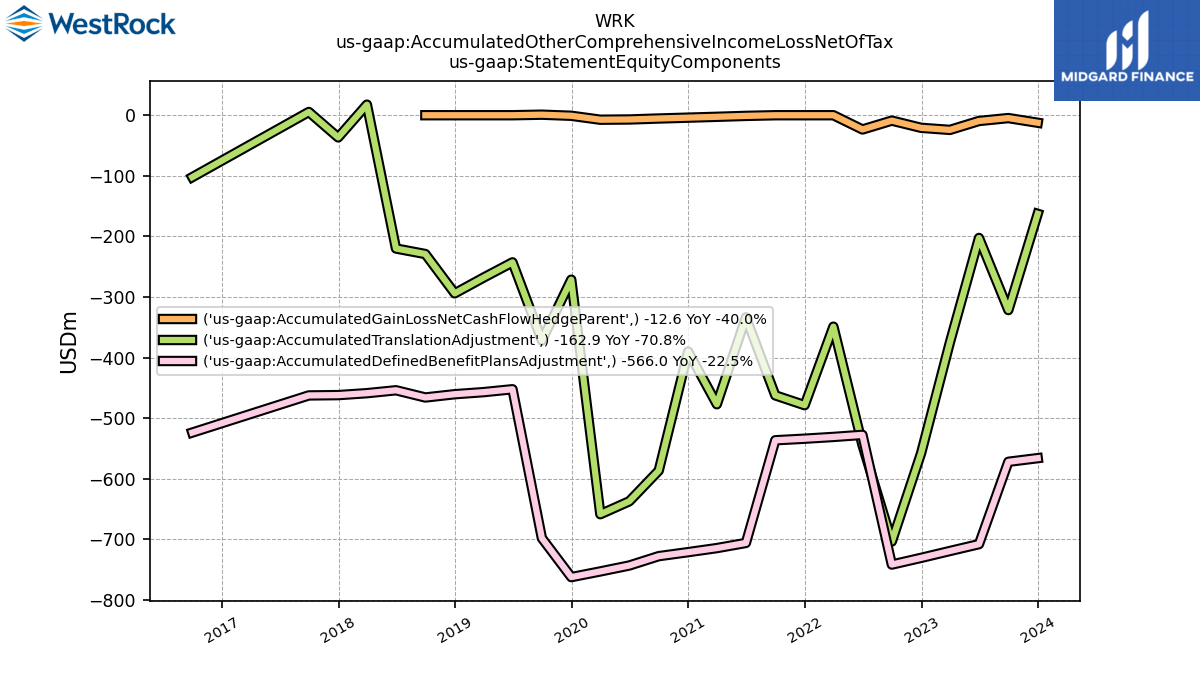
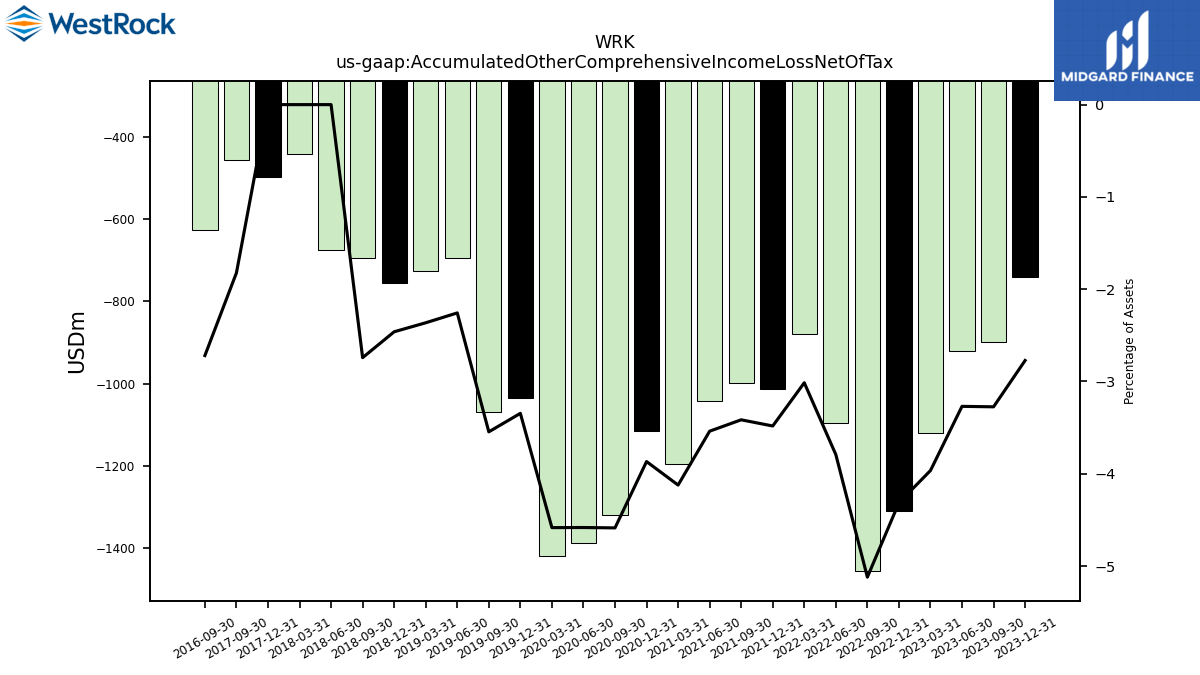
| Accumulated Other Comprehensive Income Loss Net Of Tax | -741.50 | -898.60 | -920.30 | -1118.50 | -1308.90 | -1454.30 | -1095.40 | -880.20 | -1012.70 | -999.10 | -1040.80 | -1194.30 | -1115.30 | -1319.90 | -1387.40 | -1419.00 | -1034.90 | -1069.20 | -695.40 | -725.50 | -754.80 | -695.30 | -674.30 | -441.70 | -497.60 | -457.30 | NA | NA | NA | |
| Minority Interest | 16.80 | 17.00 | 17.00 | 17.70 | 17.80 | 17.70 | 18.60 | 18.70 | 20.10 | 19.70 | 19.40 | 18.10 | 17.10 | 16.90 | 16.80 | 15.60 | 15.30 | 14.30 | 13.60 | 12.80 | 11.80 | 13.00 | NA | NA | NA | 43.60 | NA | NA | NA |
| 2023-12-31 | 2023-09-30 | 2023-06-30 | 2023-03-31 | 2022-12-31 | 2022-09-30 | 2022-06-30 | 2022-03-31 | 2021-12-31 | 2021-09-30 | 2021-06-30 | 2021-03-31 | 2020-12-31 | 2020-09-30 | 2020-06-30 | 2020-03-31 | 2019-12-31 | 2019-09-30 | 2019-06-30 | 2019-03-31 | 2018-12-31 | 2018-09-30 | 2018-06-30 | 2018-03-31 | 2017-12-31 | 2017-09-30 | 2017-06-30 | 2017-03-31 | 2016-12-31 | ||
|---|---|---|---|---|---|---|---|---|---|---|---|---|---|---|---|---|---|---|---|---|---|---|---|---|---|---|---|---|---|---|
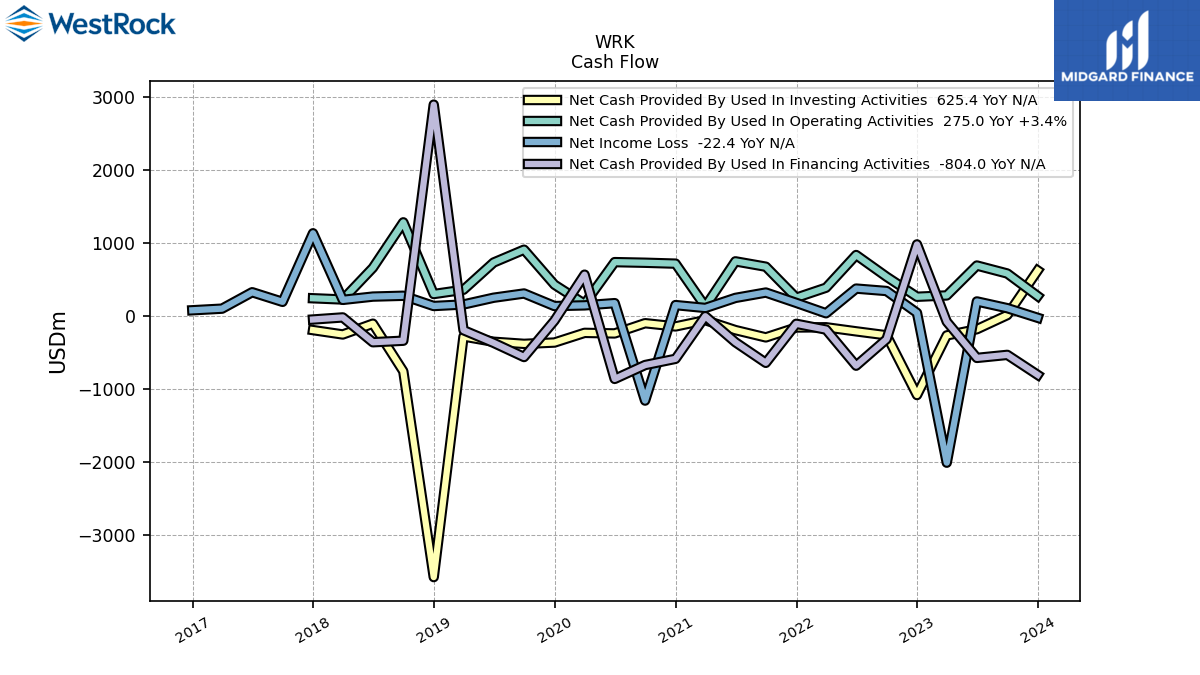
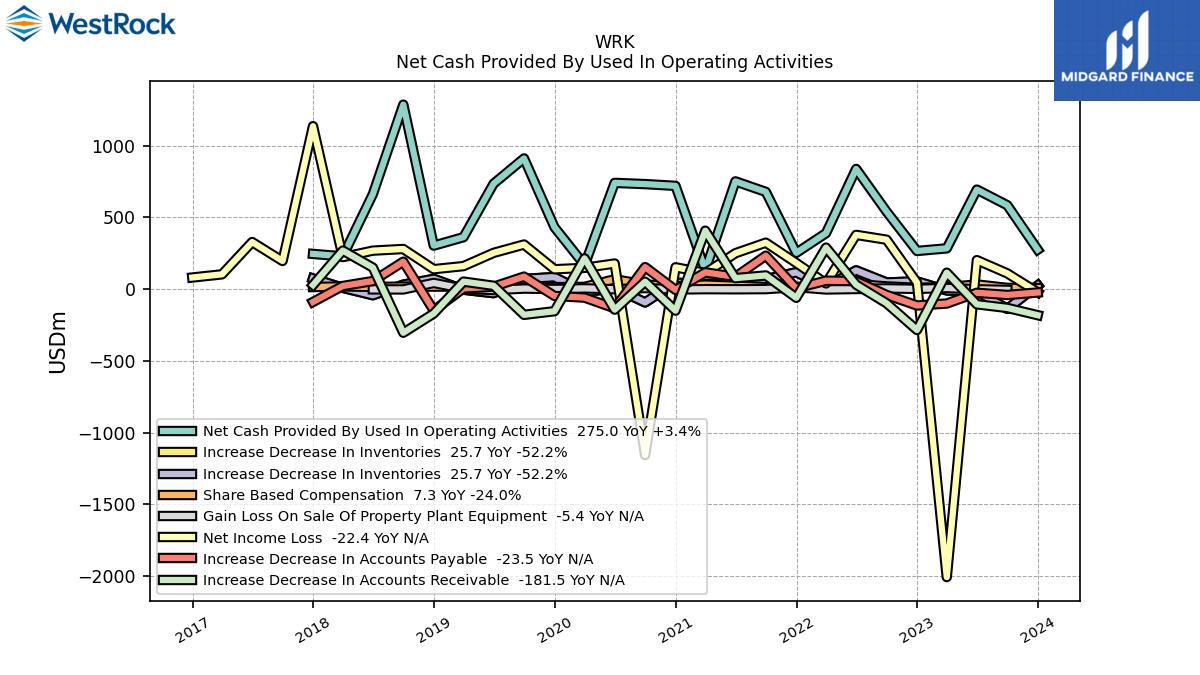
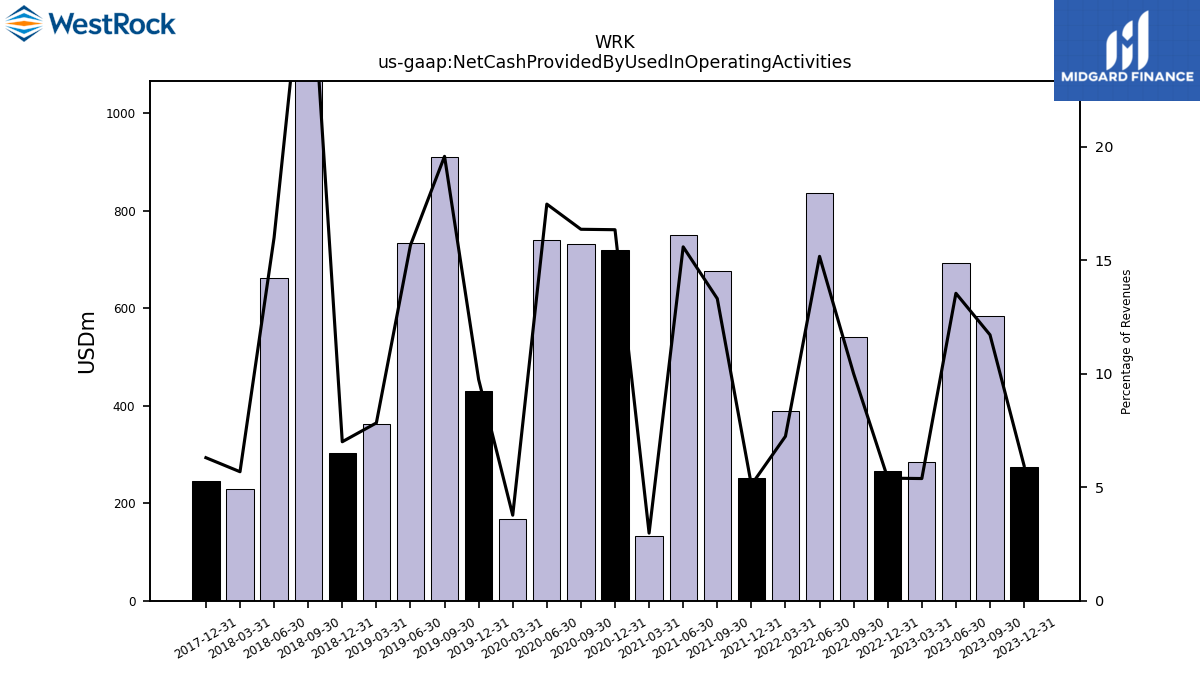
| Net Cash Provided By Used In Operating Activities | 275.00 | 584.30 | 693.60 | 284.10 | 265.90 | 540.30 | 837.40 | 389.90 | 252.80 | 677.50 | 750.80 | 132.20 | 719.40 | 731.70 | 740.20 | 167.60 | 431.20 | 910.60 | 734.60 | 361.90 | 303.10 | 1285.30 | 661.90 | 228.30 | 245.40 | NA | NA | NA | NA | |
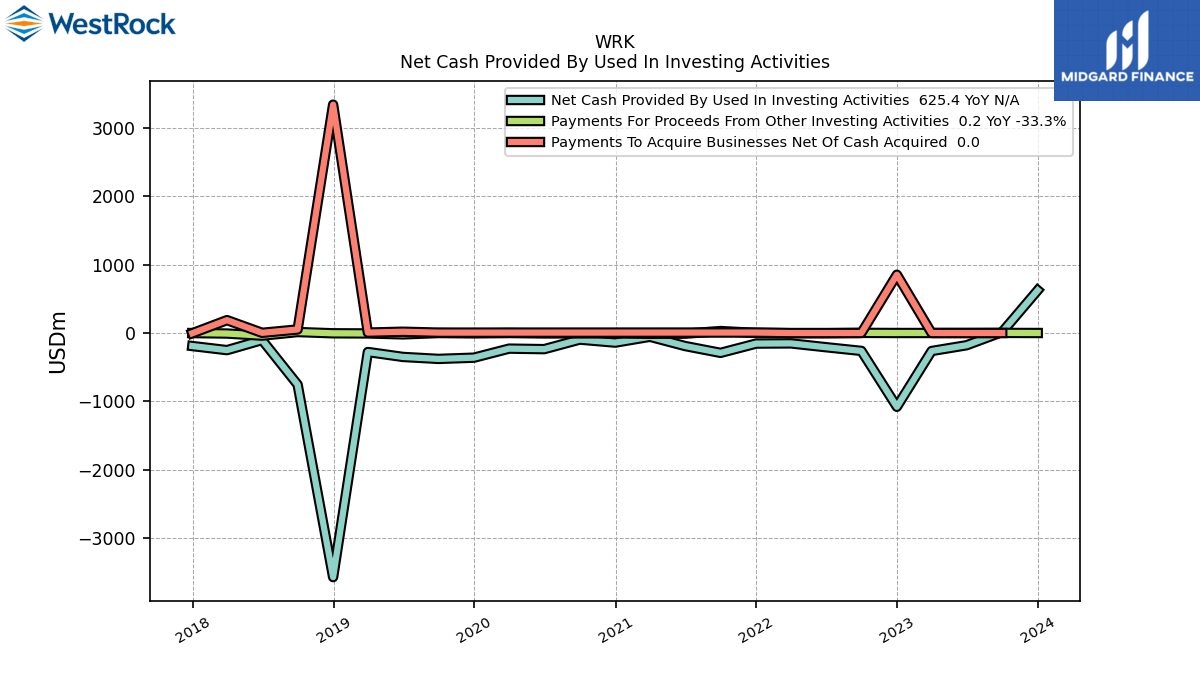
| Net Cash Provided By Used In Investing Activities | 625.40 | 14.80 | -178.50 | -263.30 | -1080.20 | -261.80 | -207.60 | -151.80 | -154.80 | -290.50 | -190.30 | -54.80 | -140.40 | -96.10 | -236.10 | -228.40 | -360.90 | -378.90 | -350.10 | -277.80 | -3572.80 | -755.10 | -102.70 | -250.50 | -190.60 | NA | NA | NA | NA | |
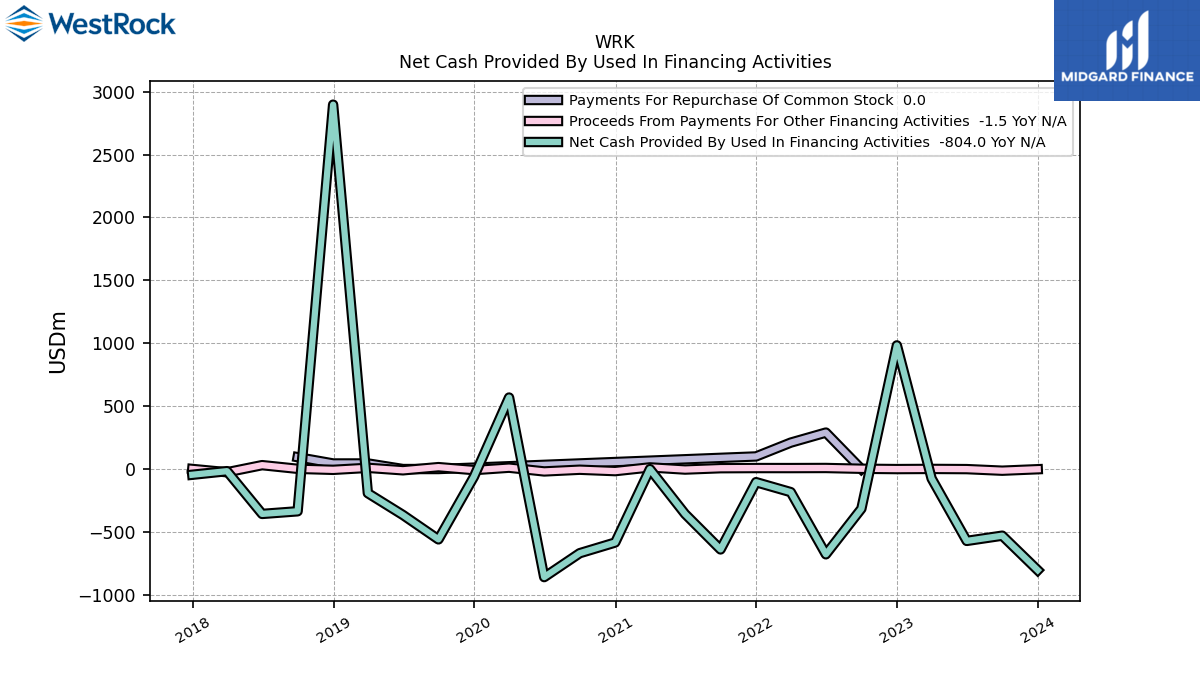
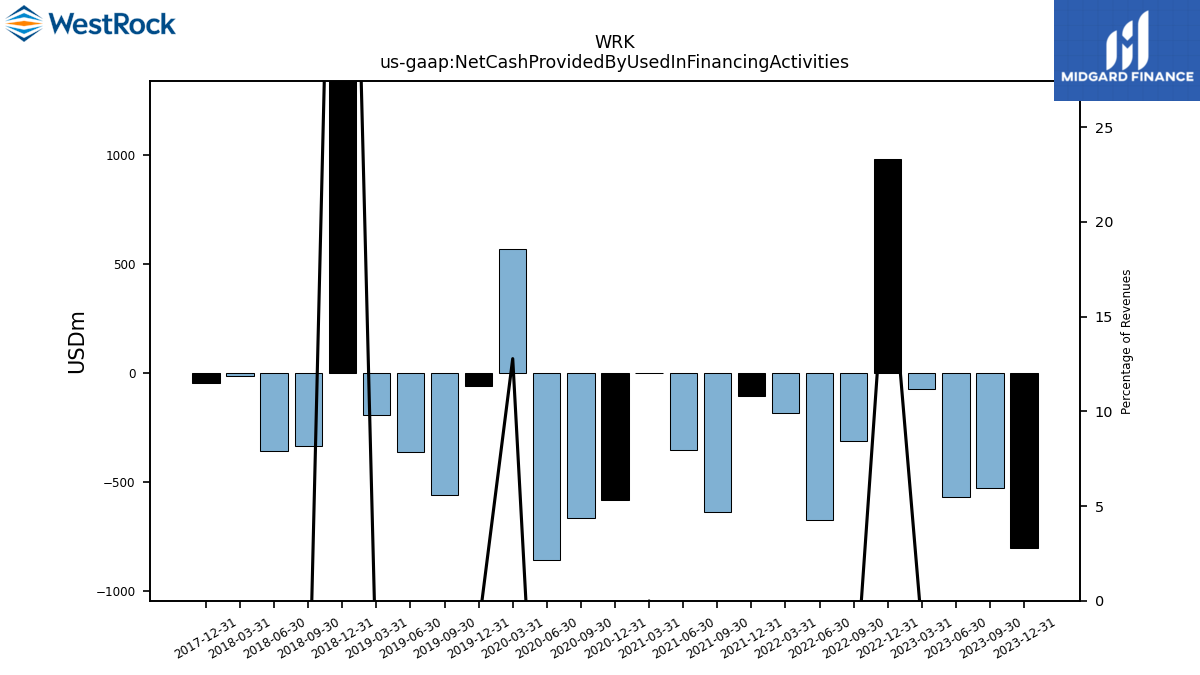
| Net Cash Provided By Used In Financing Activities | -804.00 | -529.70 | -571.40 | -75.30 | 982.90 | -315.50 | -678.00 | -183.50 | -104.30 | -639.10 | -356.70 | -0.50 | -584.10 | -669.00 | -859.20 | 568.40 | -61.30 | -559.30 | -365.30 | -191.80 | 2896.60 | -335.90 | -356.90 | -16.80 | -45.50 | NA | NA | NA | NA |
| 2023-12-31 | 2023-09-30 | 2023-06-30 | 2023-03-31 | 2022-12-31 | 2022-09-30 | 2022-06-30 | 2022-03-31 | 2021-12-31 | 2021-09-30 | 2021-06-30 | 2021-03-31 | 2020-12-31 | 2020-09-30 | 2020-06-30 | 2020-03-31 | 2019-12-31 | 2019-09-30 | 2019-06-30 | 2019-03-31 | 2018-12-31 | 2018-09-30 | 2018-06-30 | 2018-03-31 | 2017-12-31 | 2017-09-30 | 2017-06-30 | 2017-03-31 | 2016-12-31 | ||
|---|---|---|---|---|---|---|---|---|---|---|---|---|---|---|---|---|---|---|---|---|---|---|---|---|---|---|---|---|---|---|
| Net Cash Provided By Used In Operating Activities | 275.00 | 584.30 | 693.60 | 284.10 | 265.90 | 540.30 | 837.40 | 389.90 | 252.80 | 677.50 | 750.80 | 132.20 | 719.40 | 731.70 | 740.20 | 167.60 | 431.20 | 910.60 | 734.60 | 361.90 | 303.10 | 1285.30 | 661.90 | 228.30 | 245.40 | NA | NA | NA | NA | |
| Net Income Loss | -22.40 | 109.80 | 202.00 | -2006.10 | 45.30 | 344.50 | 377.90 | 39.90 | 182.30 | 323.70 | 250.10 | 112.50 | 152.00 | -1156.00 | 178.50 | 148.10 | 138.50 | 310.80 | 252.60 | 160.40 | 139.10 | 279.60 | 268.20 | 223.20 | 1135.10 | 196.10 | 328.10 | 103.10 | 80.90 | |
| Profit Loss | -22.70 | 110.70 | 203.10 | -2004.80 | 46.80 | 344.90 | 379.80 | 40.70 | 183.80 | 324.60 | 251.00 | 114.40 | 152.50 | -1154.50 | 180.00 | 148.90 | 139.50 | 312.40 | 253.80 | 161.90 | 139.80 | 280.00 | 271.30 | 224.50 | 1133.50 | 195.30 | 326.60 | 98.20 | 78.50 | |
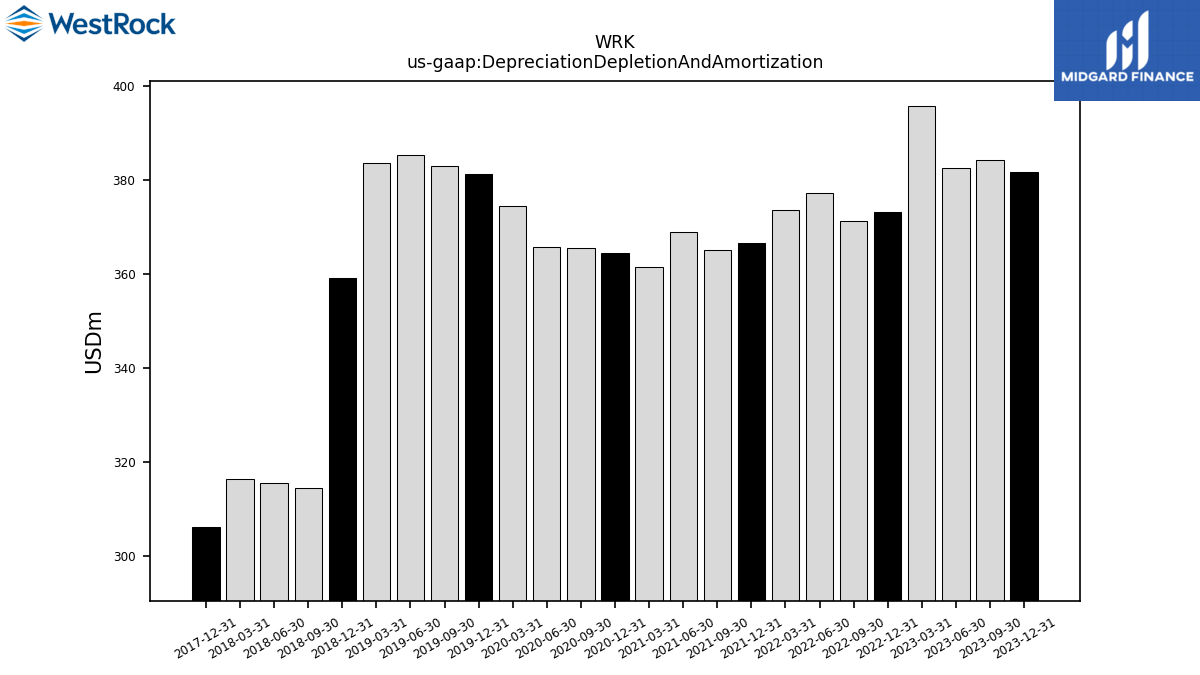
| Depreciation Depletion And Amortization | 381.80 | 384.30 | 382.50 | 395.80 | 373.20 | 371.20 | 377.30 | 373.60 | 366.50 | 365.10 | 369.00 | 361.40 | 364.50 | 365.60 | 365.70 | 374.50 | 381.20 | 383.10 | 385.30 | 383.70 | 359.10 | 314.30 | 315.40 | 316.30 | 306.20 | NA | NA | NA | NA | |
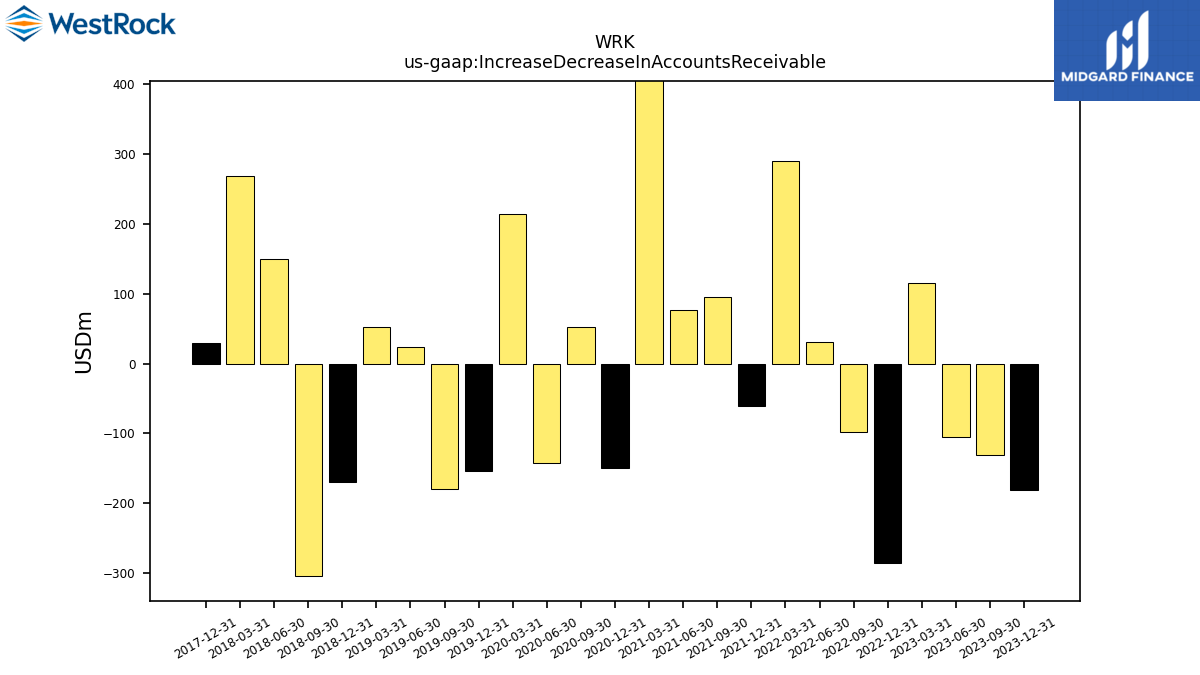
| Increase Decrease In Accounts Receivable | -181.50 | -131.00 | -105.80 | 114.60 | -284.90 | -98.50 | 30.90 | 289.50 | -60.40 | 95.50 | 76.40 | 407.20 | -150.20 | 51.90 | -142.80 | 214.30 | -153.90 | -179.00 | 23.40 | 52.40 | -169.70 | -304.00 | 149.90 | 268.60 | 28.90 | NA | NA | NA | NA | |
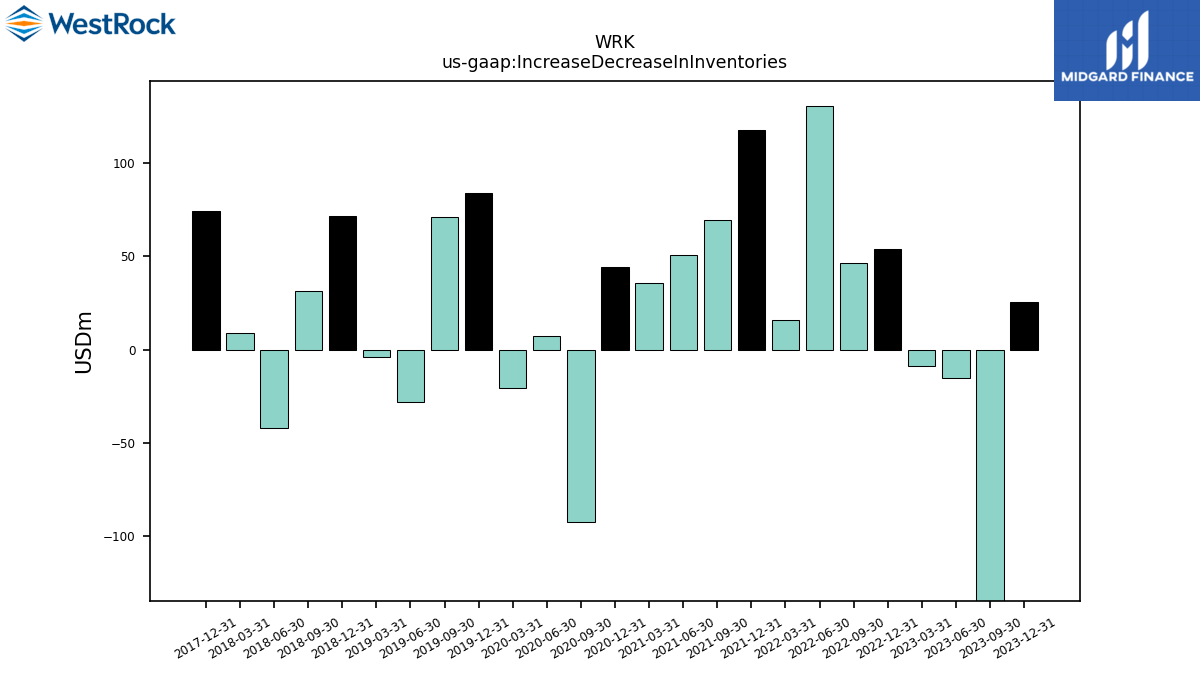
| Increase Decrease In Inventories | 25.70 | -137.20 | -15.40 | -9.00 | 53.80 | 46.50 | 130.50 | 15.90 | 117.50 | 69.20 | 50.90 | 35.60 | 44.30 | -92.50 | 7.50 | -20.70 | 83.90 | 71.00 | -28.00 | -3.90 | 71.40 | 31.30 | -42.20 | 9.00 | 74.00 | NA | NA | NA | NA | |
| Increase Decrease In Accounts Payable | -23.50 | -40.60 | -25.40 | -100.40 | -113.90 | -40.50 | 55.70 | 58.90 | 5.40 | 233.10 | 85.70 | 116.90 | -5.40 | 153.70 | -133.40 | -59.20 | -47.50 | 87.20 | 17.10 | 5.10 | -148.50 | 191.30 | 56.30 | 22.10 | -89.40 | NA | NA | NA | NA | |
| Deferred Income Tax Expense Benefit | -23.30 | -125.90 | -109.70 | -220.10 | -19.50 | 16.20 | -14.40 | -86.00 | -14.00 | 15.30 | 1.00 | -35.00 | -19.60 | 26.90 | 4.70 | 8.30 | 3.10 | 0.70 | -3.20 | 25.30 | 14.30 | 93.30 | 60.00 | 11.90 | -1234.60 | NA | NA | NA | NA | |
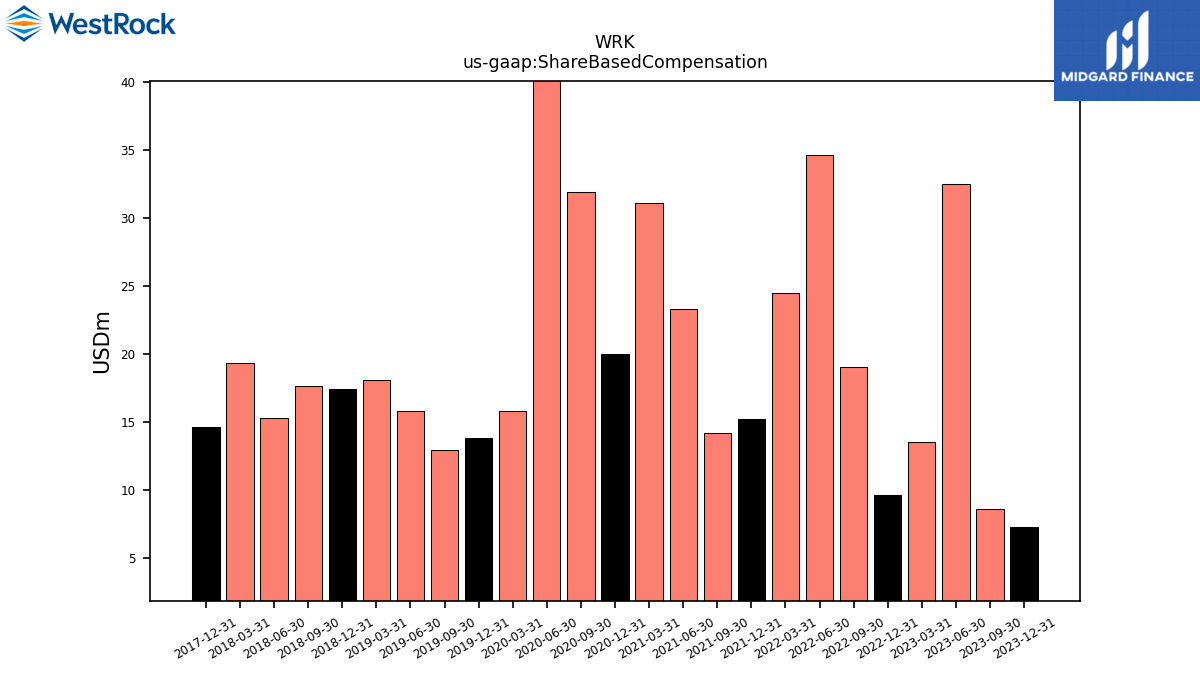
| Share Based Compensation | 7.30 | 8.60 | 32.50 | 13.50 | 9.60 | 19.00 | 34.60 | 24.50 | 15.20 | 14.20 | 23.30 | 31.10 | 20.00 | 31.90 | 68.80 | 15.80 | 13.80 | 12.90 | 15.80 | 18.10 | 17.40 | 17.60 | 15.30 | 19.30 | 14.60 | NA | NA | NA | NA |
| 2023-12-31 | 2023-09-30 | 2023-06-30 | 2023-03-31 | 2022-12-31 | 2022-09-30 | 2022-06-30 | 2022-03-31 | 2021-12-31 | 2021-09-30 | 2021-06-30 | 2021-03-31 | 2020-12-31 | 2020-09-30 | 2020-06-30 | 2020-03-31 | 2019-12-31 | 2019-09-30 | 2019-06-30 | 2019-03-31 | 2018-12-31 | 2018-09-30 | 2018-06-30 | 2018-03-31 | 2017-12-31 | 2017-09-30 | 2017-06-30 | 2017-03-31 | 2016-12-31 | ||
|---|---|---|---|---|---|---|---|---|---|---|---|---|---|---|---|---|---|---|---|---|---|---|---|---|---|---|---|---|---|---|
| Net Cash Provided By Used In Investing Activities | 625.40 | 14.80 | -178.50 | -263.30 | -1080.20 | -261.80 | -207.60 | -151.80 | -154.80 | -290.50 | -190.30 | -54.80 | -140.40 | -96.10 | -236.10 | -228.40 | -360.90 | -378.90 | -350.10 | -277.80 | -3572.80 | -755.10 | -102.70 | -250.50 | -190.60 | NA | NA | NA | NA | |
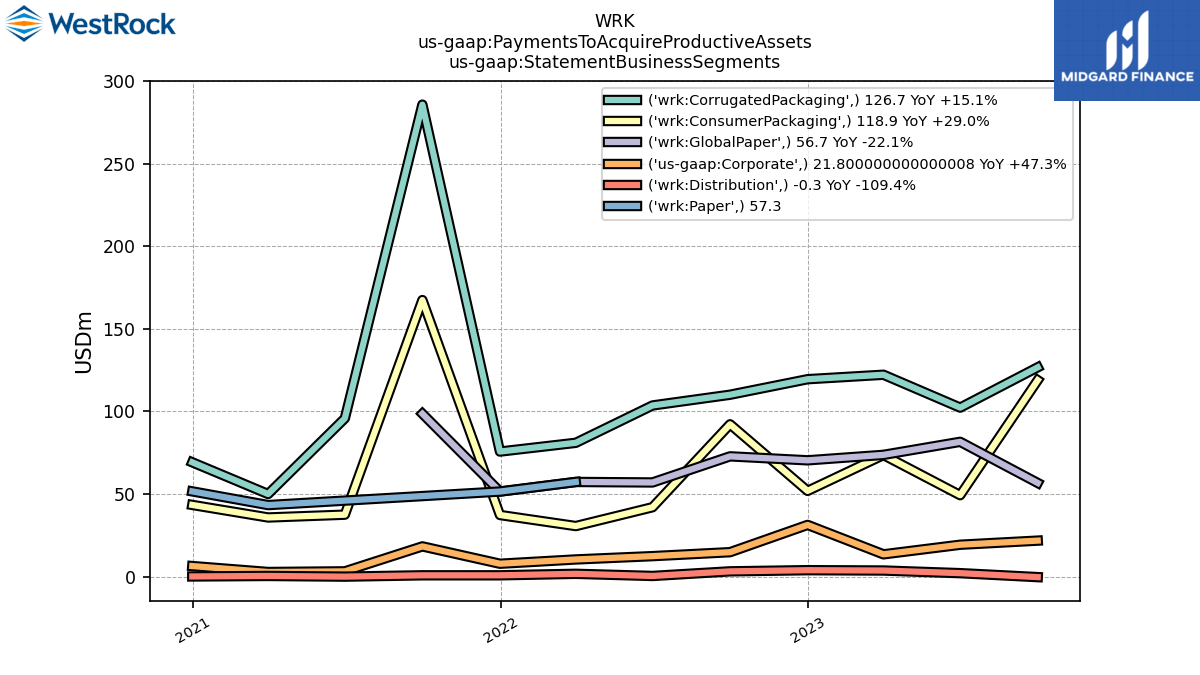
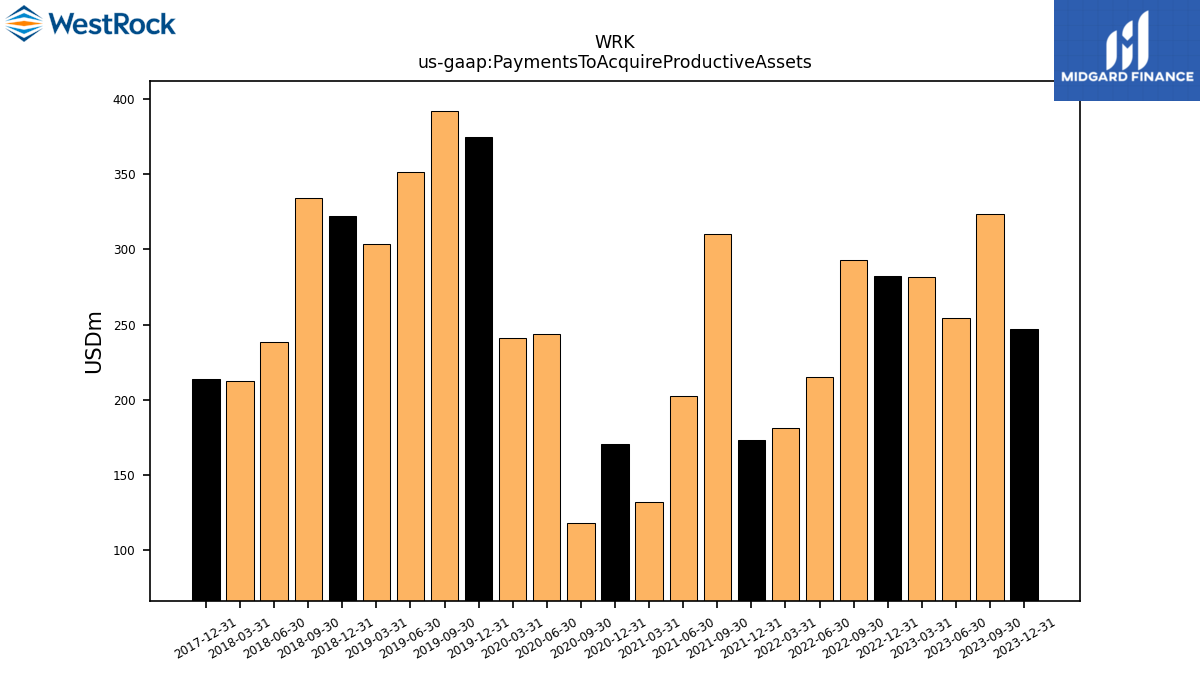
| Payments To Acquire Productive Assets | 247.30 | 323.80 | 254.60 | 281.50 | 282.20 | 293.10 | 215.40 | 181.00 | 173.10 | 310.10 | 202.40 | 132.30 | 170.70 | 117.90 | 244.00 | 241.40 | 374.80 | 392.30 | 351.40 | 303.40 | 322.00 | 334.40 | 238.80 | 212.60 | 214.10 | NA | NA | NA | NA |
| 2023-12-31 | 2023-09-30 | 2023-06-30 | 2023-03-31 | 2022-12-31 | 2022-09-30 | 2022-06-30 | 2022-03-31 | 2021-12-31 | 2021-09-30 | 2021-06-30 | 2021-03-31 | 2020-12-31 | 2020-09-30 | 2020-06-30 | 2020-03-31 | 2019-12-31 | 2019-09-30 | 2019-06-30 | 2019-03-31 | 2018-12-31 | 2018-09-30 | 2018-06-30 | 2018-03-31 | 2017-12-31 | 2017-09-30 | 2017-06-30 | 2017-03-31 | 2016-12-31 | ||
|---|---|---|---|---|---|---|---|---|---|---|---|---|---|---|---|---|---|---|---|---|---|---|---|---|---|---|---|---|---|---|
| Net Cash Provided By Used In Financing Activities | -804.00 | -529.70 | -571.40 | -75.30 | 982.90 | -315.50 | -678.00 | -183.50 | -104.30 | -639.10 | -356.70 | -0.50 | -584.10 | -669.00 | -859.20 | 568.40 | -61.30 | -559.30 | -365.30 | -191.80 | 2896.60 | -335.90 | -356.90 | -16.80 | -45.50 | NA | NA | NA | NA | |
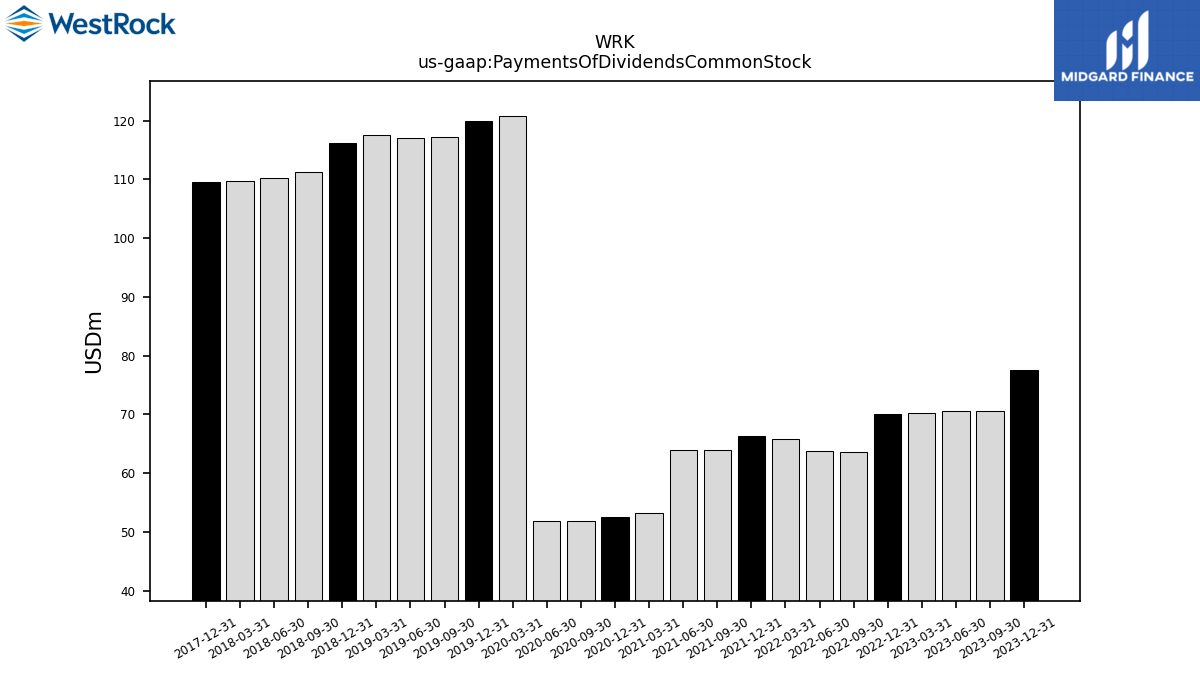
| Payments Of Dividends Common Stock | 77.60 | 70.50 | 70.50 | 70.30 | 70.00 | 63.60 | 63.80 | 65.80 | 66.30 | 64.00 | 64.00 | 53.20 | 52.60 | 51.90 | 51.90 | 120.70 | 120.00 | 117.20 | 117.00 | 117.60 | 116.10 | 111.20 | 110.30 | 109.80 | 109.60 | NA | NA | NA | NA | |
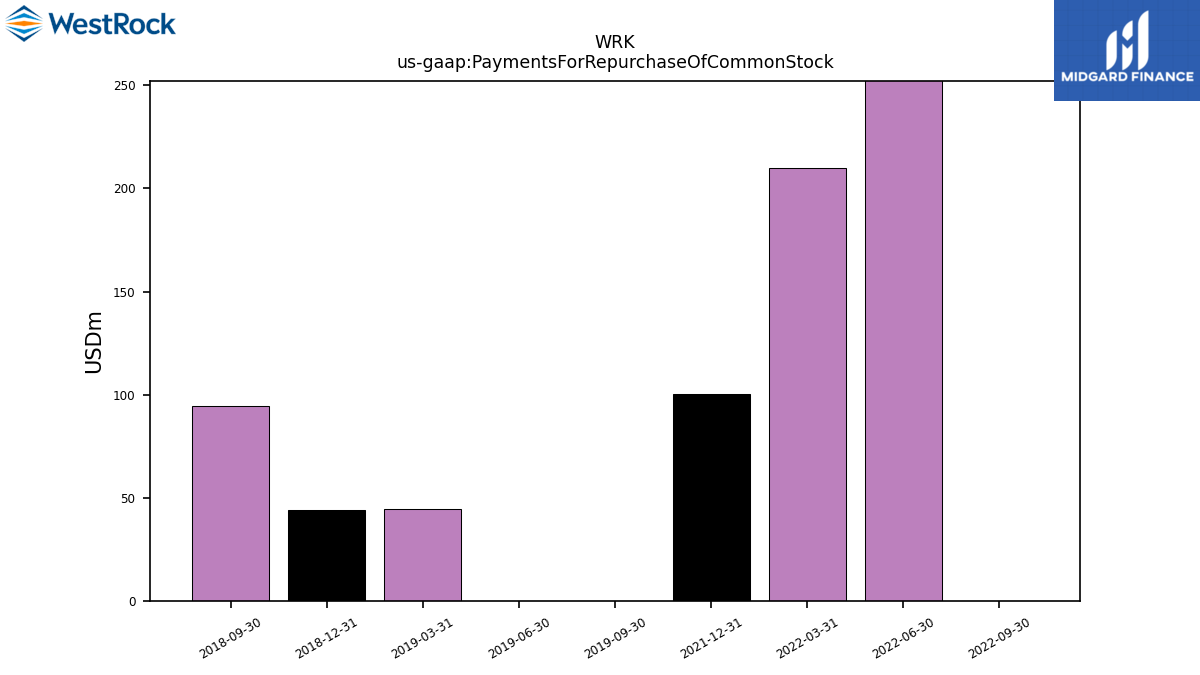
| Payments For Repurchase Of Common Stock | NA | NA | NA | NA | NA | 0.00 | 289.80 | 210.10 | 100.10 | NA | NA | NA | NA | NA | NA | NA | NA | 0.00 | 0.00 | 44.40 | 44.20 | 94.30 | NA | NA | NA | NA | NA | NA | NA |
| 2023-12-31 | 2023-09-30 | 2023-06-30 | 2023-03-31 | 2022-12-31 | 2022-09-30 | 2022-06-30 | 2022-03-31 | 2021-12-31 | 2021-09-30 | 2021-06-30 | 2021-03-31 | 2020-12-31 | 2020-09-30 | 2020-06-30 | 2020-03-31 | 2019-12-31 | 2019-09-30 | 2019-06-30 | 2019-03-31 | 2018-12-31 | 2018-09-30 | 2018-06-30 | 2018-03-31 | 2017-12-31 | 2017-09-30 | 2017-06-30 | 2017-03-31 | 2016-12-31 | ||
|---|---|---|---|---|---|---|---|---|---|---|---|---|---|---|---|---|---|---|---|---|---|---|---|---|---|---|---|---|---|---|
| Revenues | 4620.00 | 4988.20 | 5121.10 | 5277.60 | 4923.10 | 5402.50 | 5519.70 | 5382.10 | 4952.20 | 5090.50 | 4816.30 | 4437.80 | 4401.50 | 4471.50 | 4236.30 | 4447.30 | 4423.70 | 4651.60 | 4690.00 | 4620.00 | 4327.40 | 4236.60 | 4137.50 | 4017.00 | 3894.00 | 4060.60 | 3695.60 | 3656.30 | 3447.20 | |
| Revenue From Contract With Customer Excluding Assessed Tax | 4620.00 | 4988.20 | 5121.10 | 5277.60 | 4923.10 | 5402.50 | 5519.70 | 5382.10 | 4952.20 | 5090.50 | 4816.30 | 4437.80 | 4401.50 | 4471.50 | 4236.30 | 4447.30 | 4423.70 | 4651.60 | 4690.00 | 4620.00 | 4327.40 | 4236.60 | 4137.50 | 4017.00 | 3894.00 | 4060.60 | 3695.60 | 3656.30 | 3447.20 | |
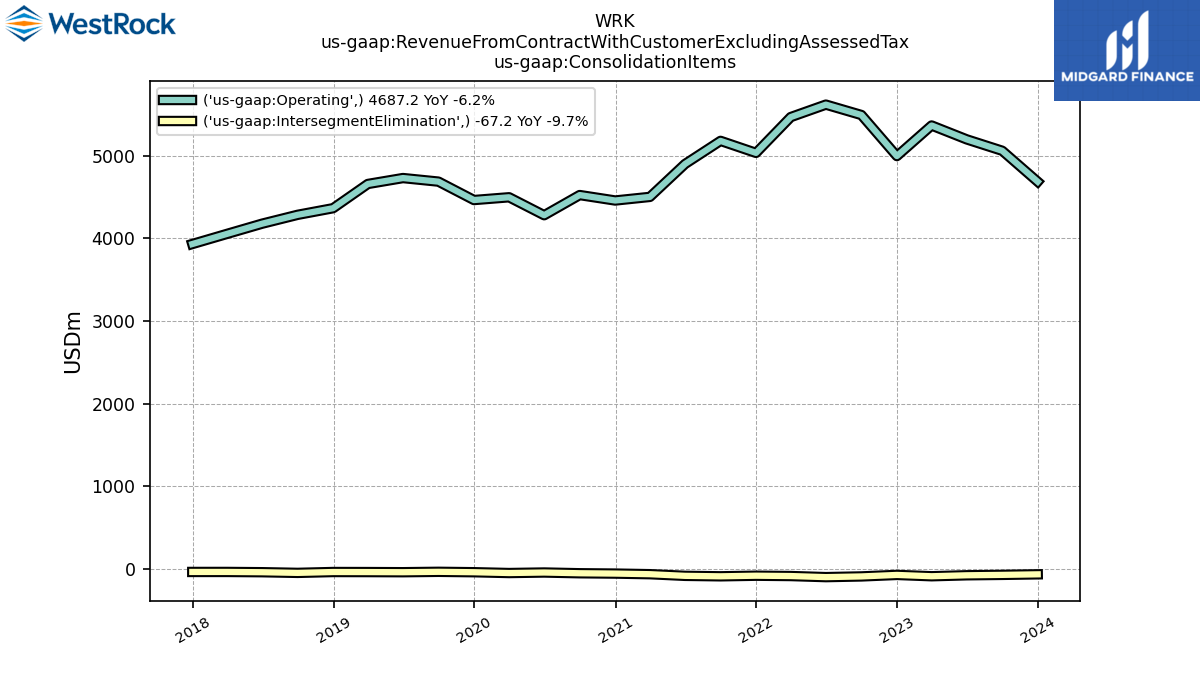
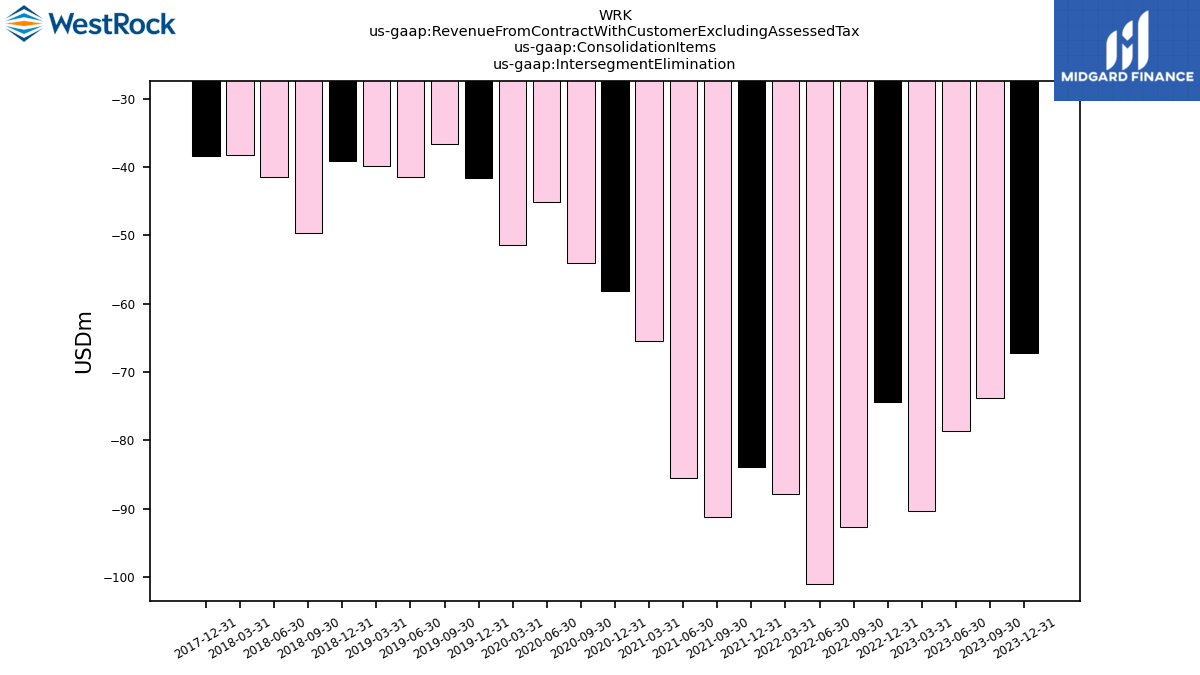
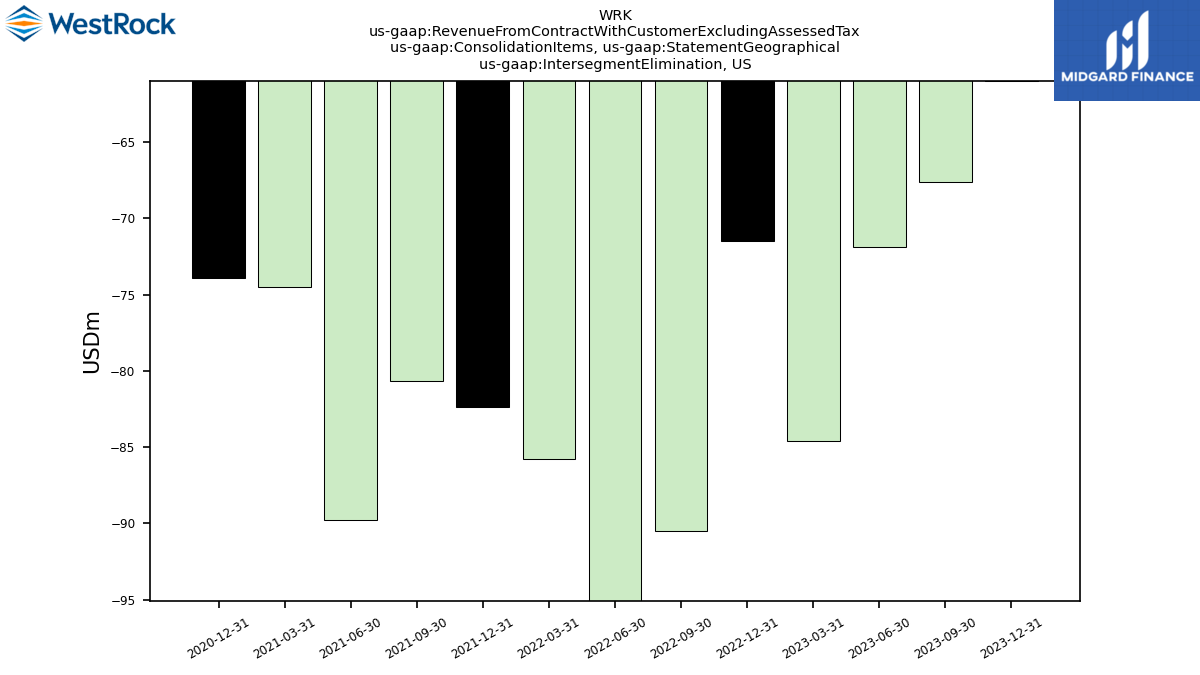
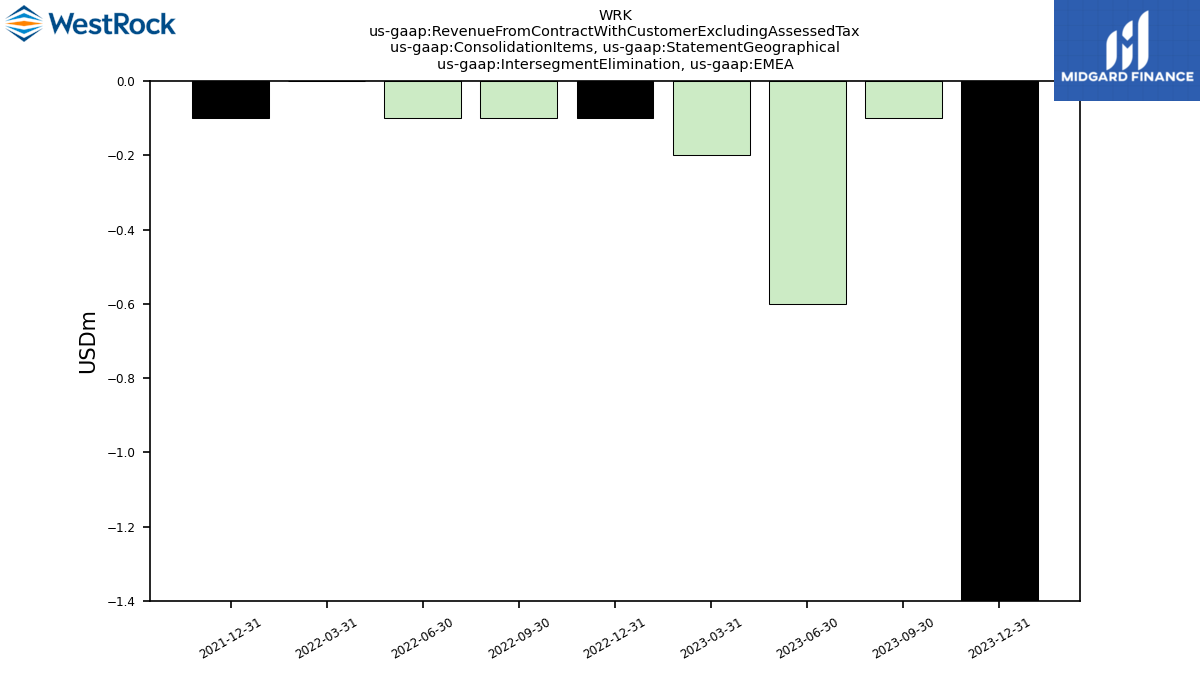
| Intersegment Elimination | -67.20 | -73.80 | -78.70 | -90.40 | -74.40 | -92.60 | -101.00 | -87.90 | -83.90 | -91.20 | -85.50 | -65.50 | -58.10 | -54.10 | -45.10 | -51.50 | -41.60 | -36.70 | -41.50 | -39.80 | -39.10 | -49.60 | -41.50 | -38.30 | -38.40 | NA | NA | NA | NA | |
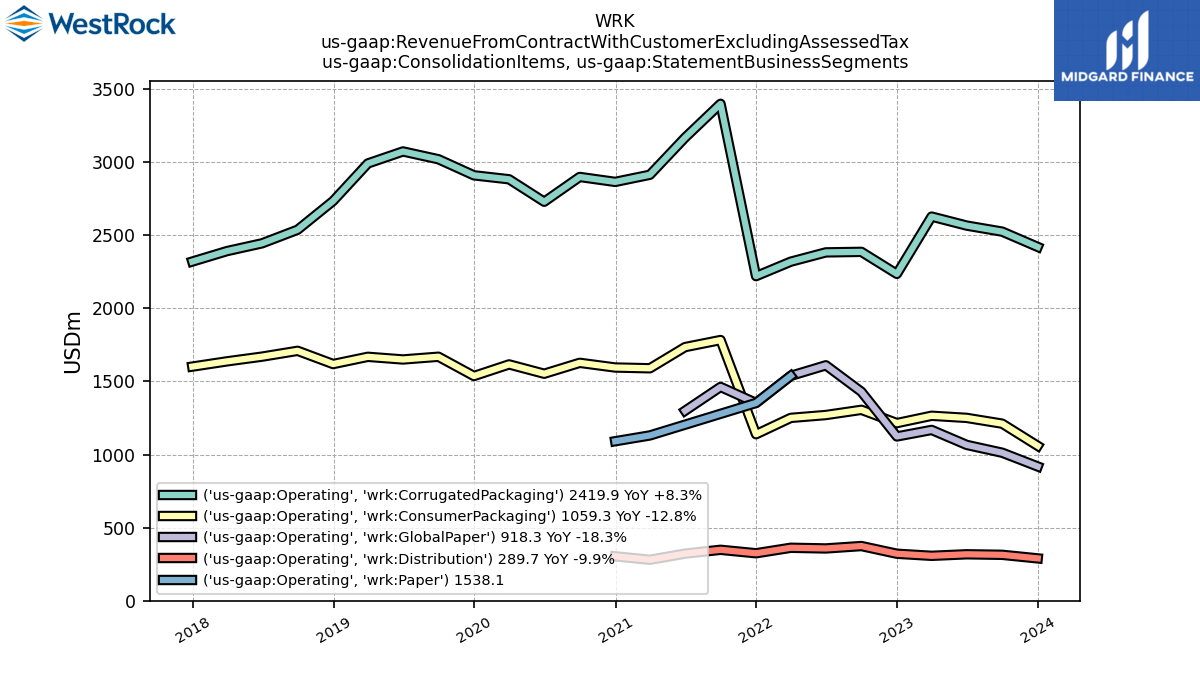
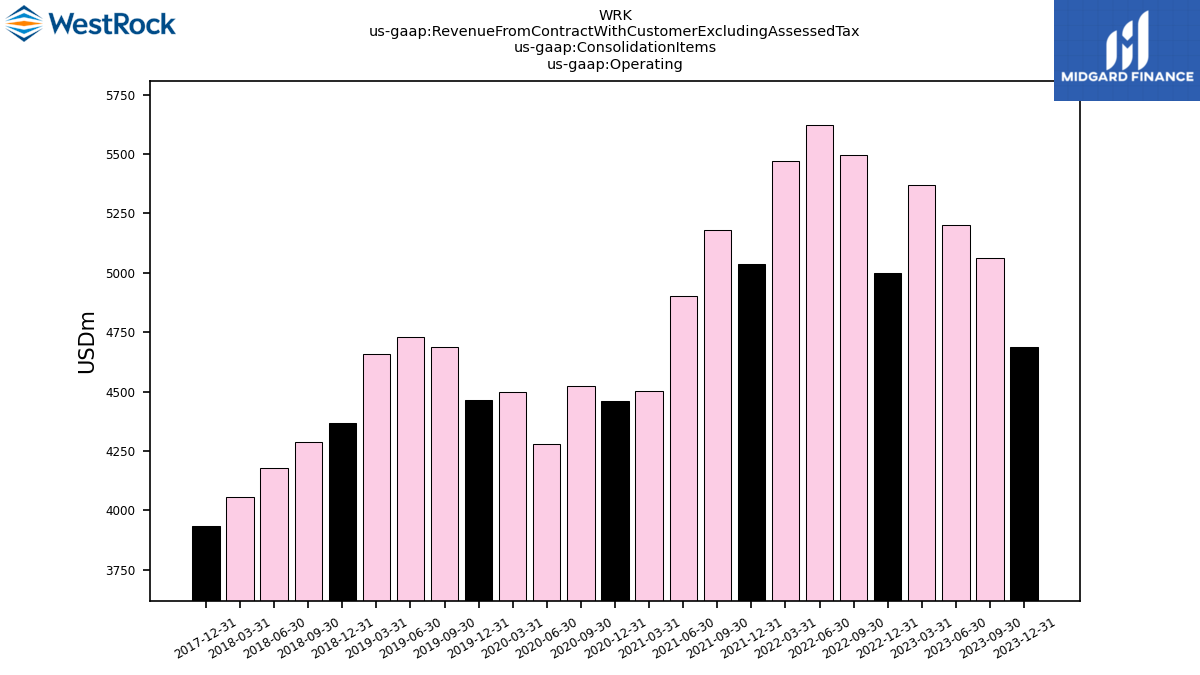
| Operating | 4687.20 | 5062.00 | 5199.80 | 5368.00 | 4997.50 | 5495.10 | 5620.70 | 5470.00 | 5036.10 | 5181.70 | 4901.80 | 4503.30 | 4459.60 | 4525.60 | 4281.40 | 4498.80 | 4465.30 | 4688.30 | 4731.50 | 4659.80 | 4366.50 | 4286.20 | 4179.00 | 4055.30 | 3932.40 | NA | NA | NA | NA | |
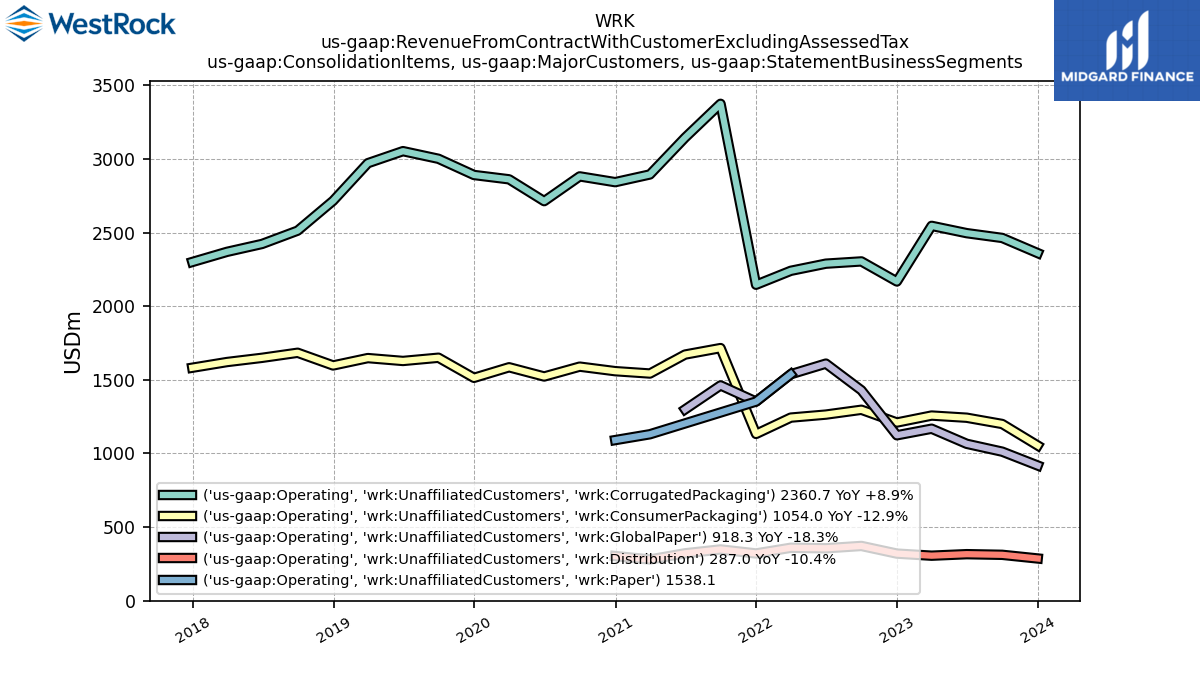
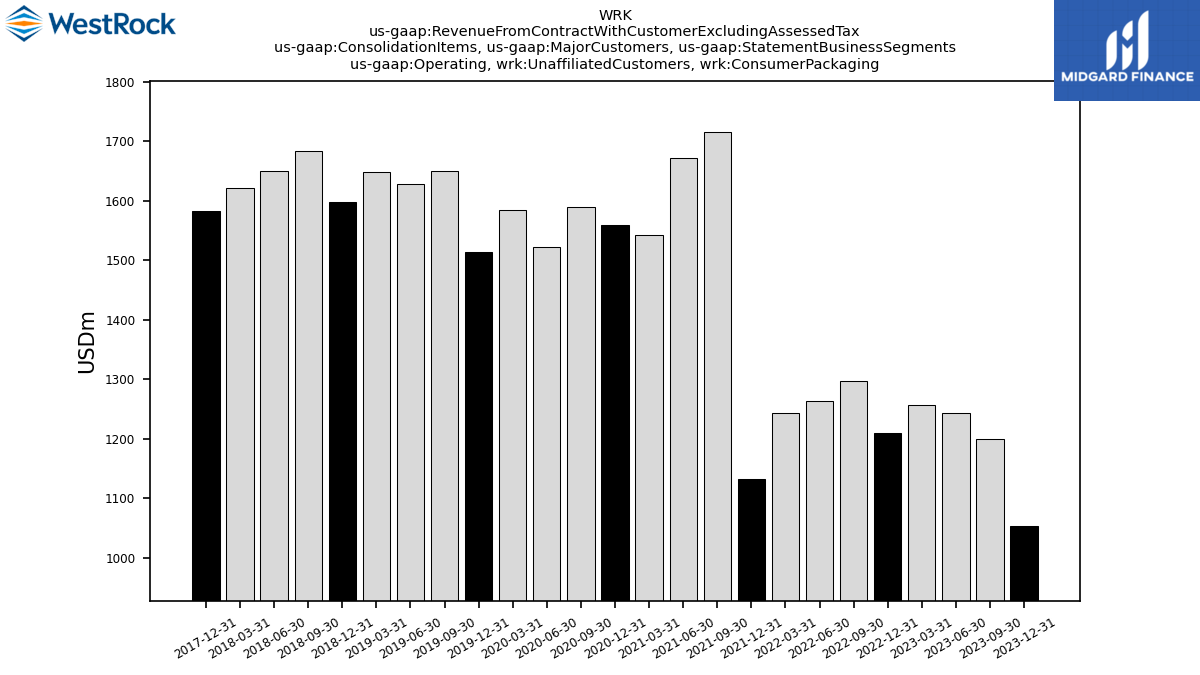
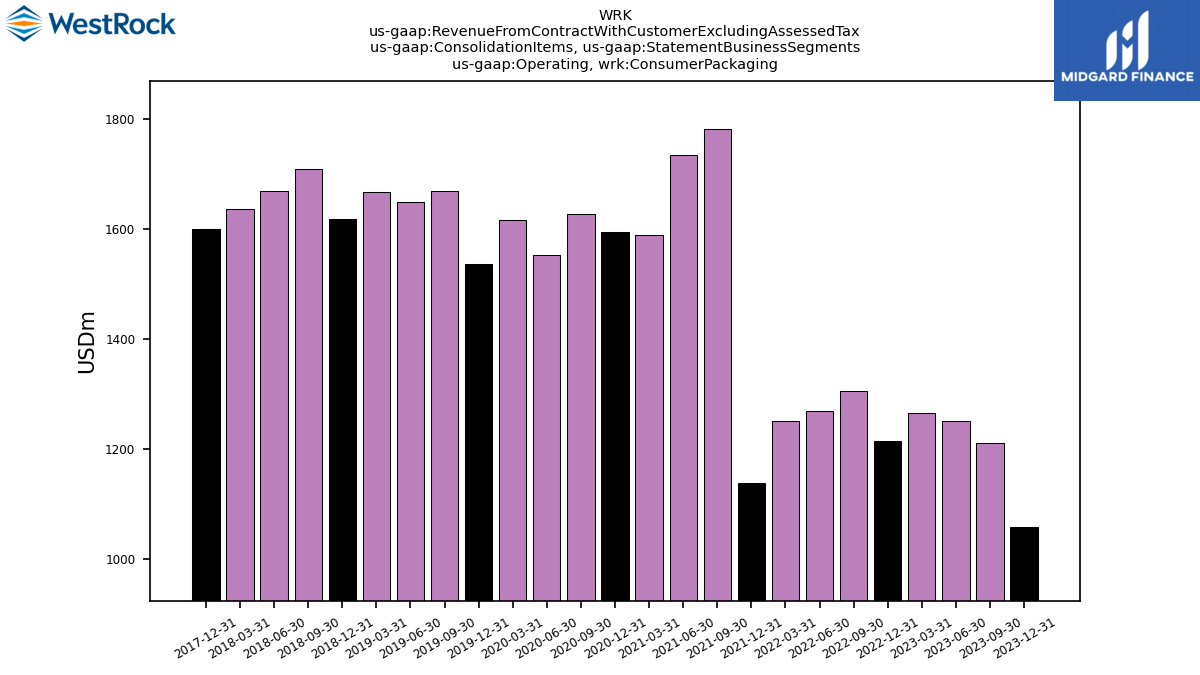
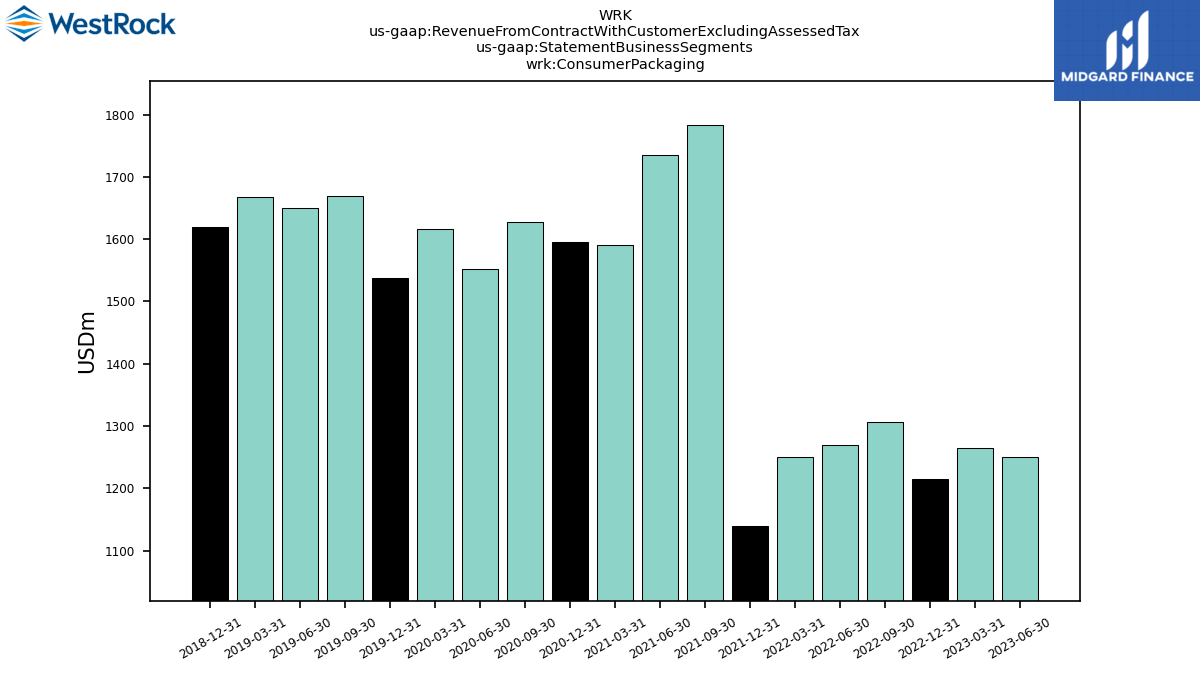
| Operating, Unaffiliated Customers, Consumer Packaging | 1054.00 | 1200.30 | 1242.90 | 1257.60 | 1210.30 | 1296.90 | 1264.10 | 1243.70 | 1132.70 | 1715.80 | 1671.80 | 1543.00 | 1559.00 | 1589.80 | 1522.80 | 1585.50 | 1513.60 | 1650.30 | 1628.30 | 1647.90 | 1597.70 | 1684.00 | 1649.70 | 1621.00 | 1582.30 | NA | NA | NA | NA | |
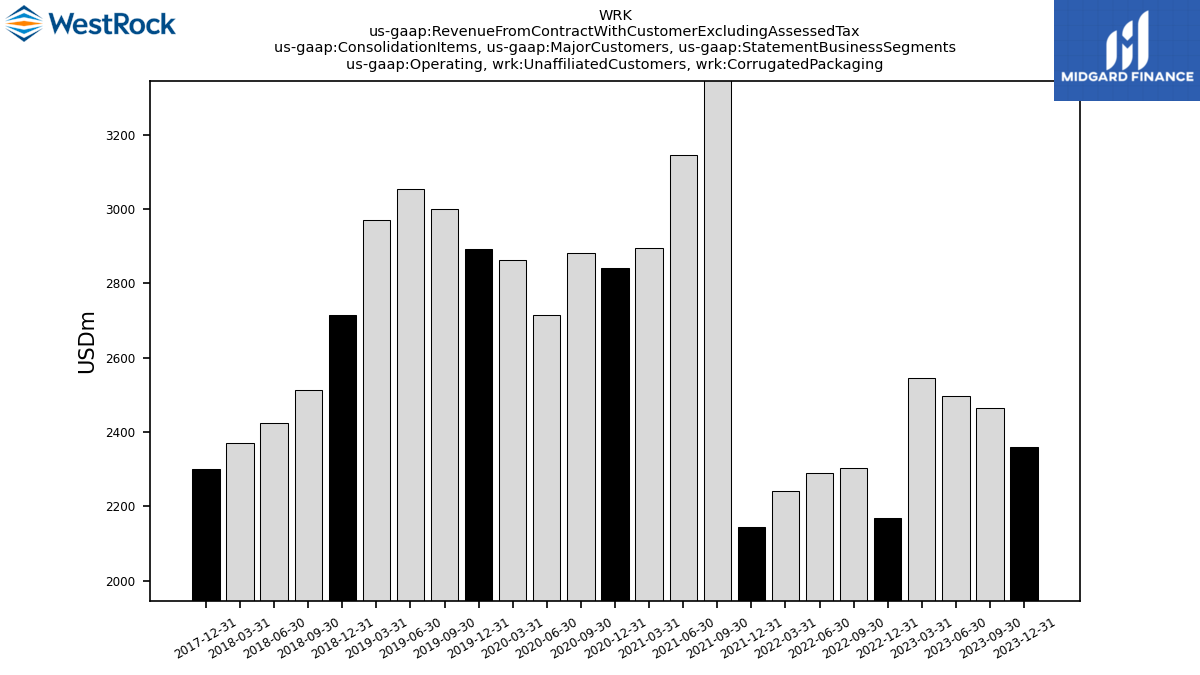
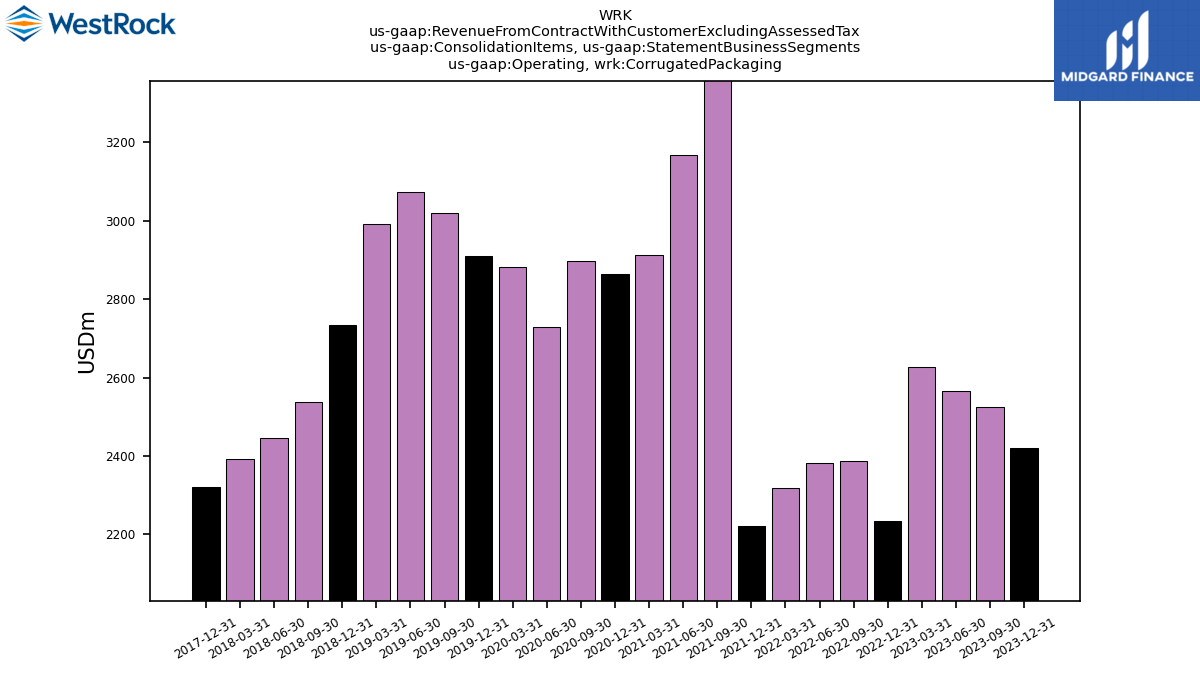
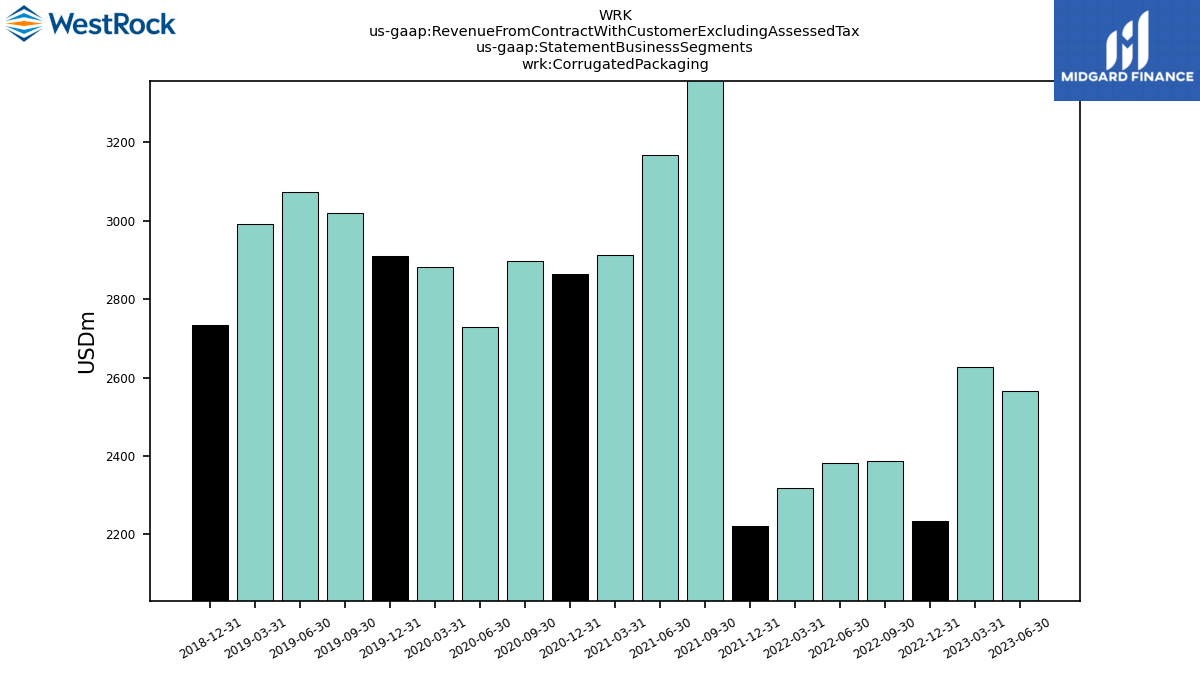
| Operating, Unaffiliated Customers, Corrugated Packaging | 2360.70 | 2463.60 | 2496.20 | 2545.80 | 2168.00 | 2304.30 | 2289.00 | 2240.50 | 2145.80 | 3374.70 | 3144.50 | 2894.80 | 2842.50 | 2881.70 | 2713.50 | 2861.80 | 2891.20 | 3001.20 | 3053.10 | 2971.30 | 2715.80 | 2513.10 | 2423.00 | 2369.30 | 2300.30 | NA | NA | NA | NA | |
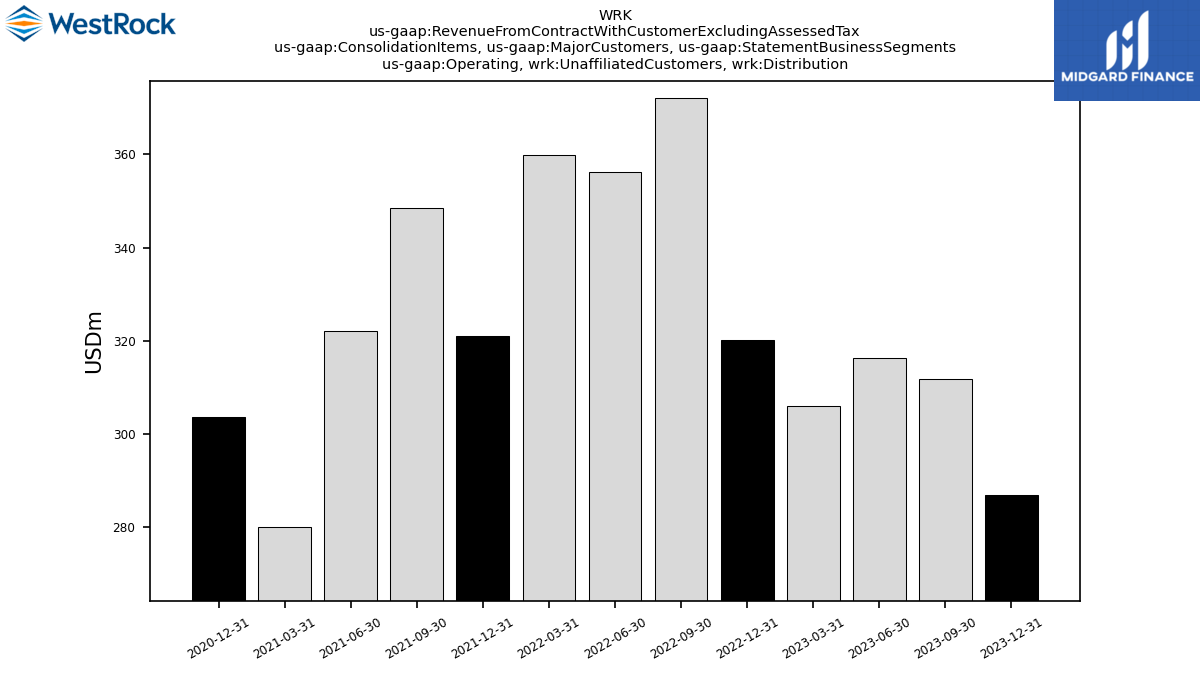
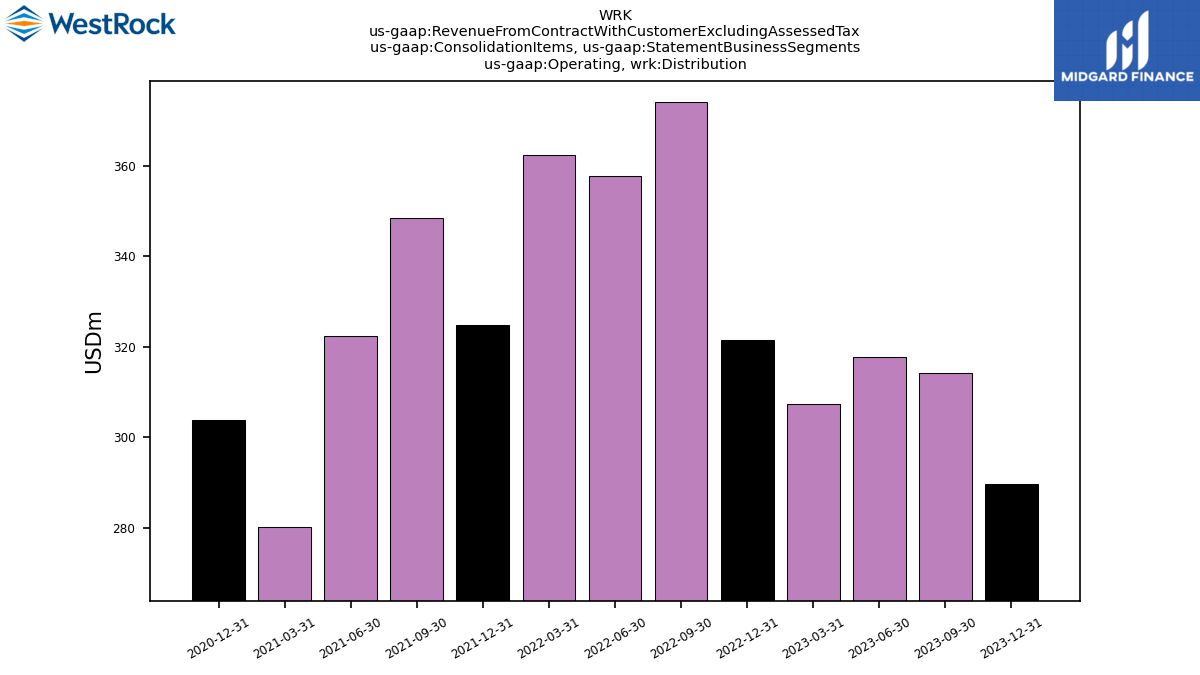
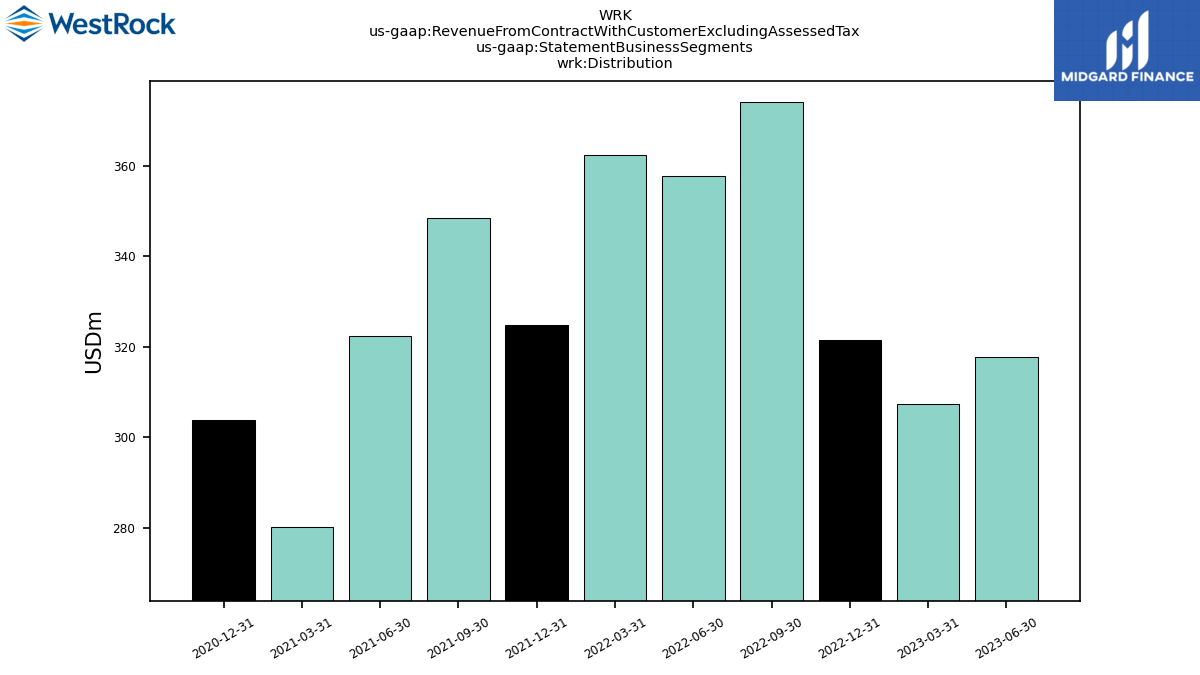
| Operating, Unaffiliated Customers, Distribution | 287.00 | 311.90 | 316.30 | 306.00 | 320.20 | 372.10 | 356.30 | 359.80 | 321.10 | 348.40 | 322.10 | 280.20 | 303.60 | NA | NA | NA | NA | NA | NA | NA | NA | NA | NA | NA | NA | NA | NA | NA | NA | |
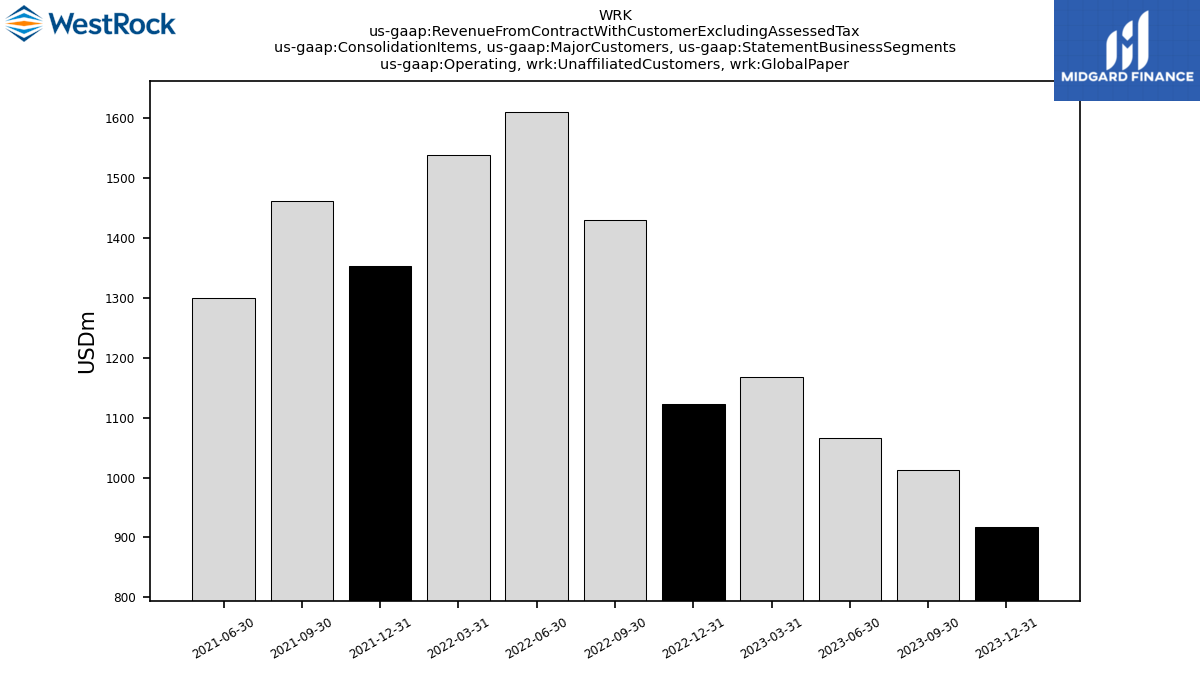
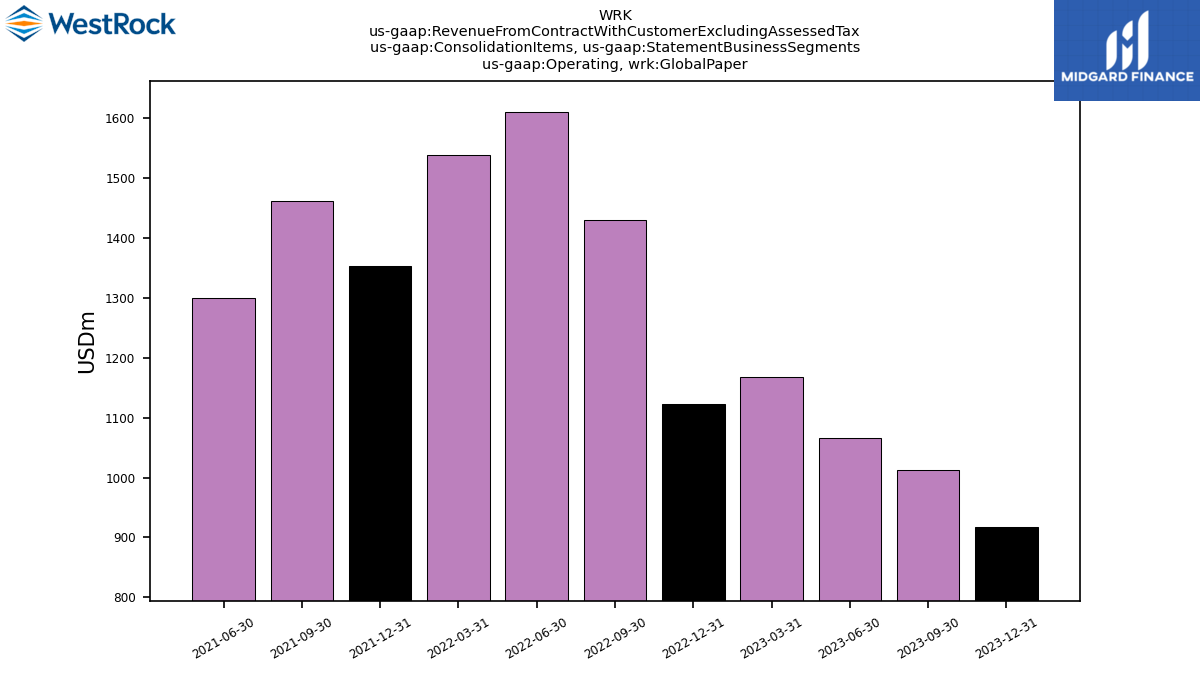
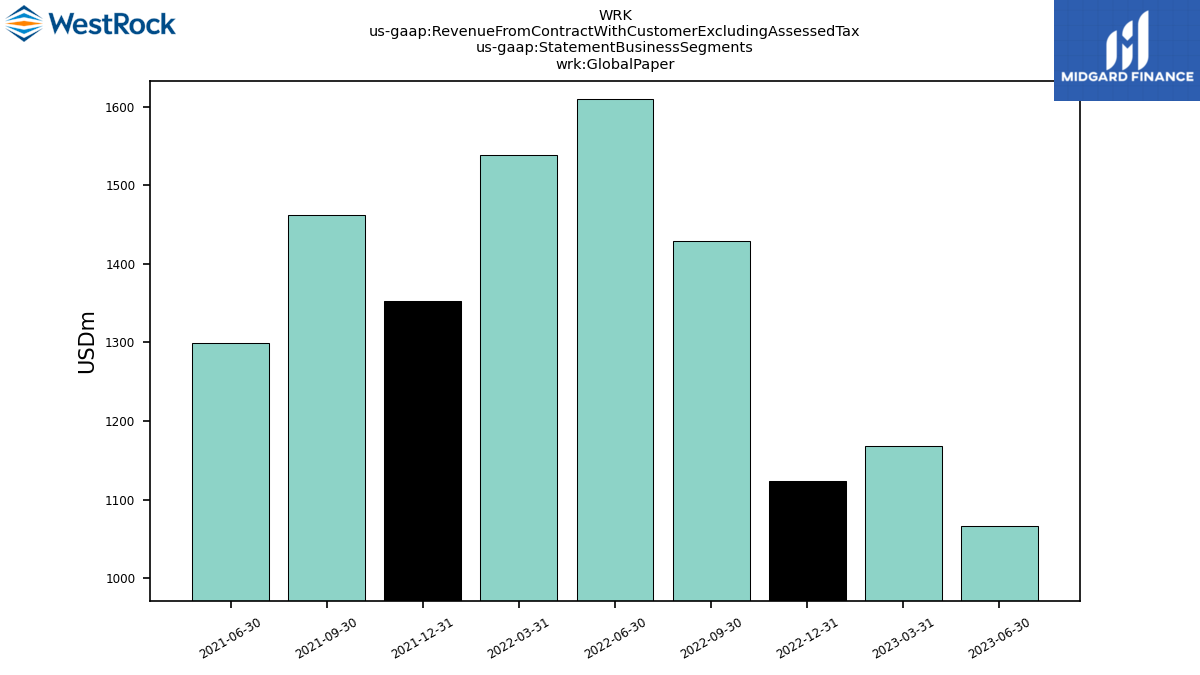
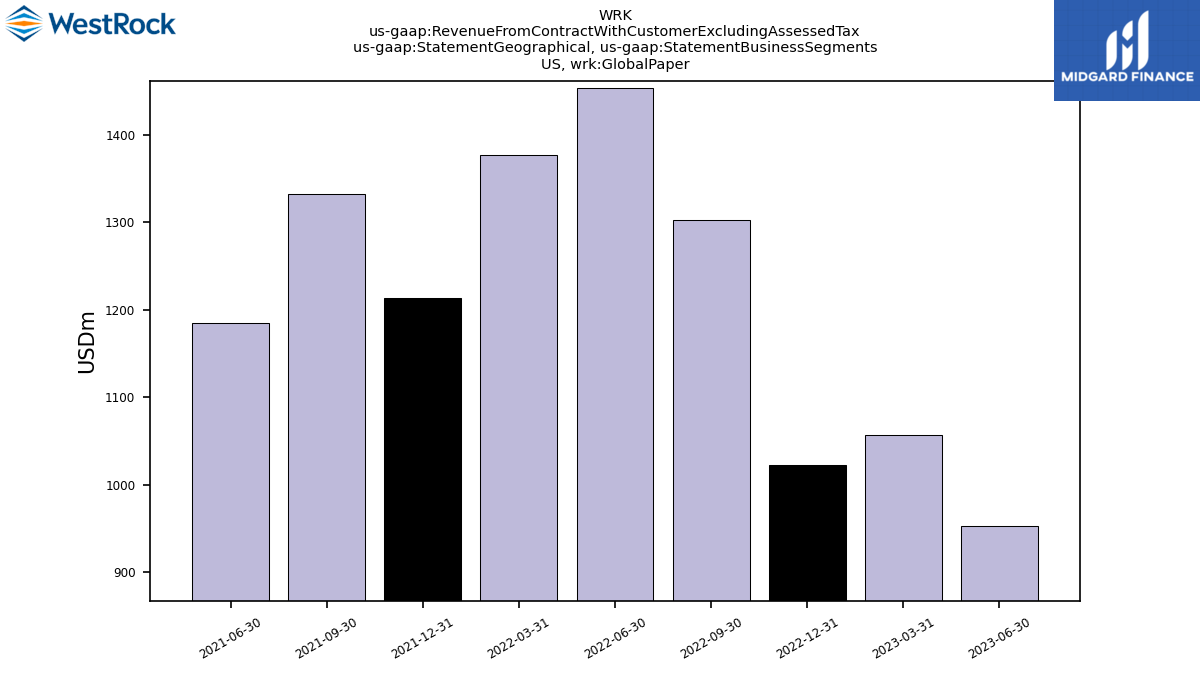
| Operating, Unaffiliated Customers, Global Paper | 918.30 | 1012.40 | 1065.70 | 1168.20 | 1123.60 | 1429.20 | 1610.30 | 1538.10 | 1352.60 | 1462.30 | 1299.20 | NA | NA | NA | NA | NA | NA | NA | NA | NA | NA | NA | NA | NA | NA | NA | NA | NA | NA | |
| Operating, Unaffiliated Customers, Other Unallocated | NA | NA | NA | NA | 101.00 | NA | NA | NA | NA | NA | NA | NA | NA | NA | NA | NA | NA | NA | NA | NA | NA | NA | NA | NA | NA | NA | NA | NA | NA | |
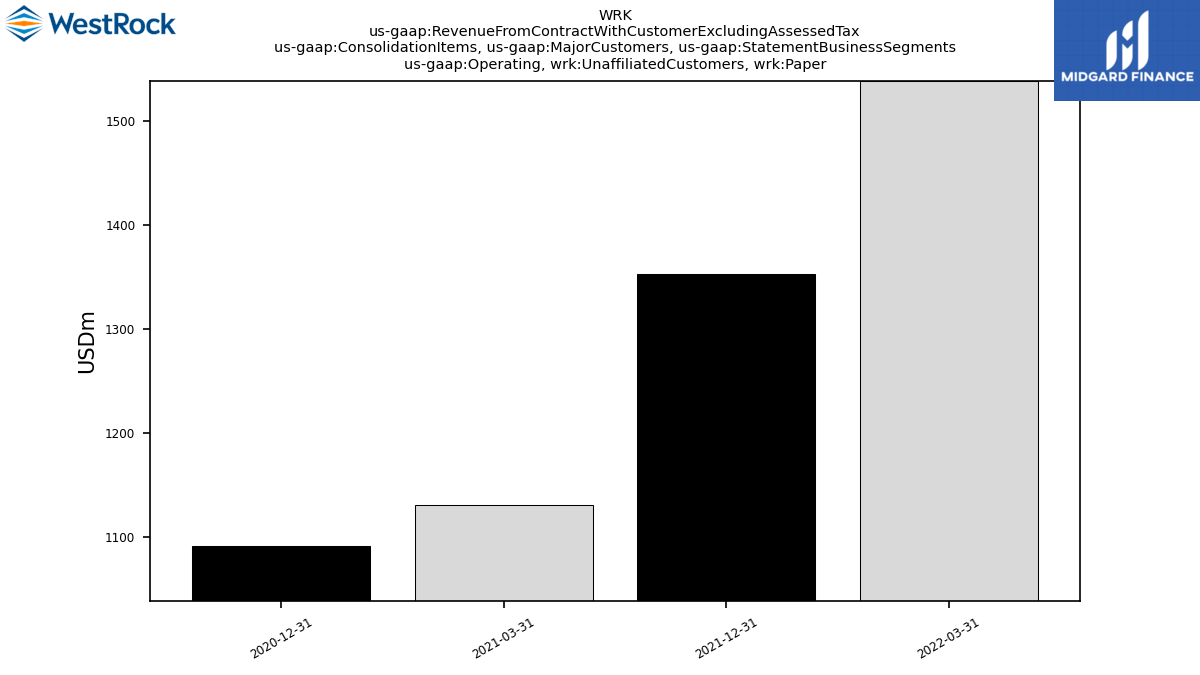
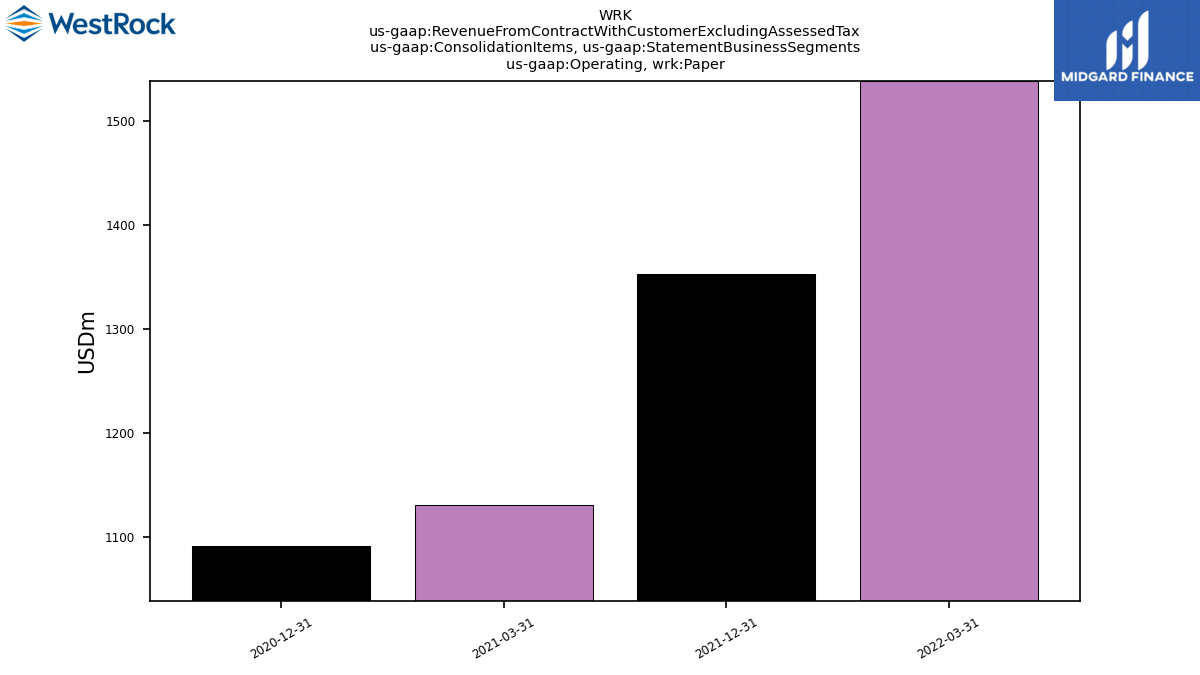
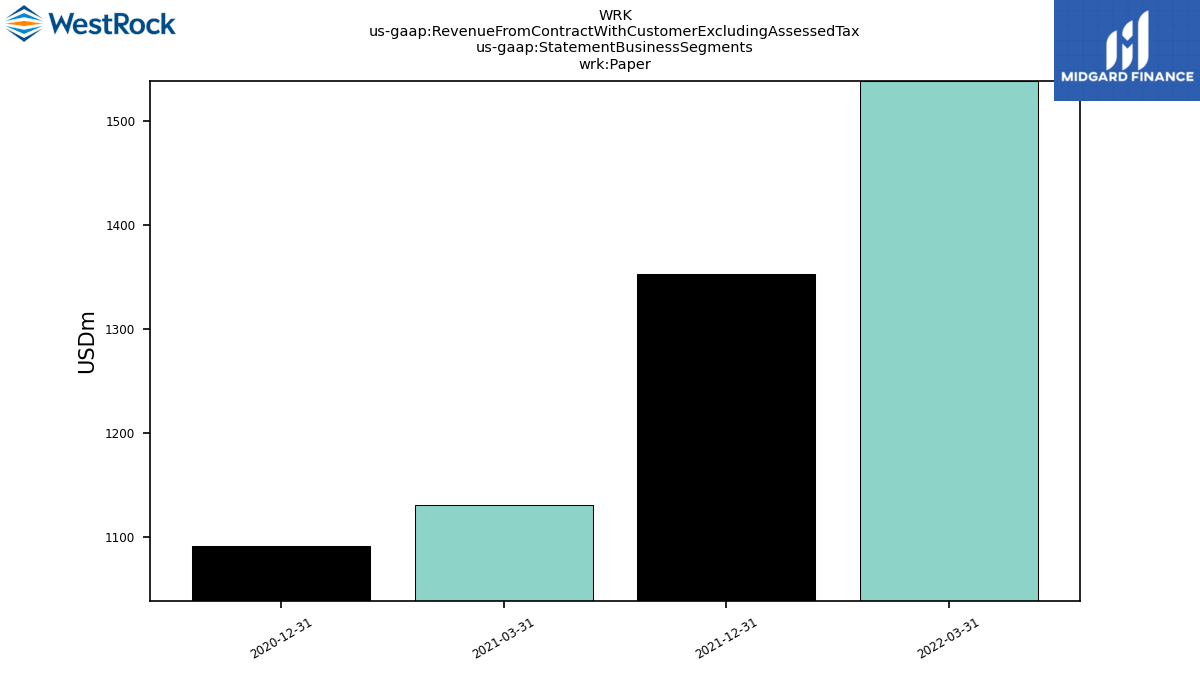
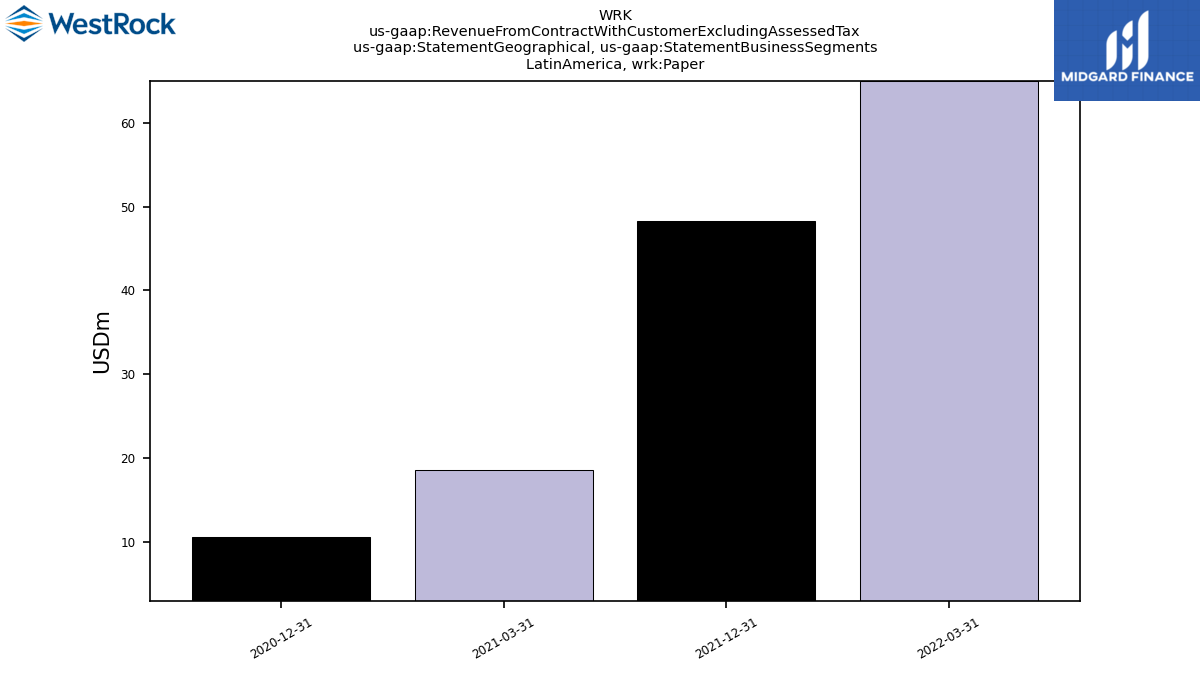
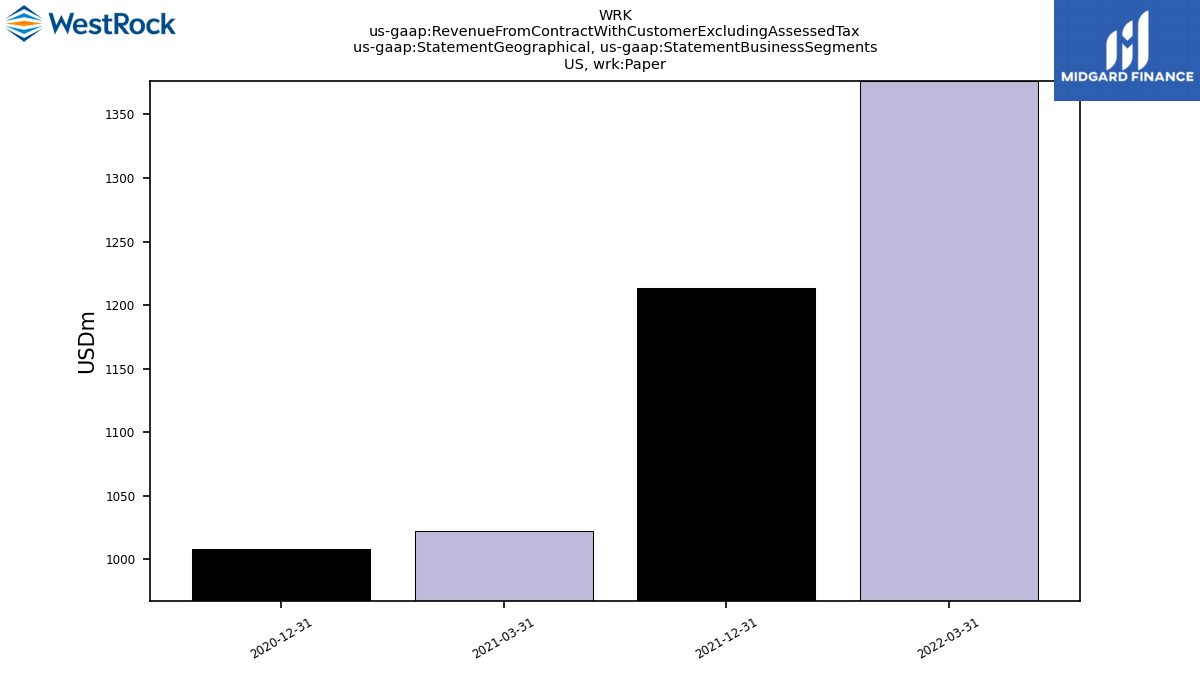
| Operating, Unaffiliated Customers, Paper | NA | NA | NA | NA | NA | NA | NA | 1538.10 | 1352.60 | NA | NA | 1130.60 | 1090.90 | NA | NA | NA | NA | NA | NA | NA | NA | NA | NA | NA | NA | NA | NA | NA | NA | |
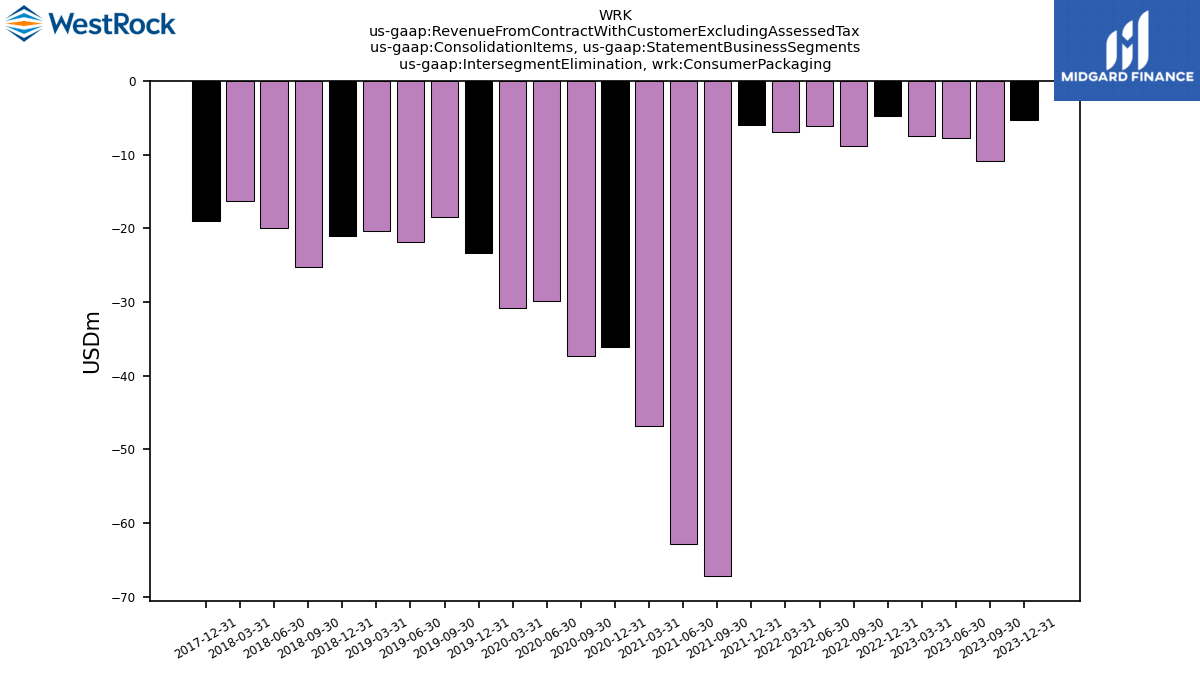
| Intersegment Elimination, Consumer Packaging | -5.30 | -10.80 | -7.70 | -7.50 | -4.70 | -8.80 | -6.10 | -6.90 | -6.00 | -67.20 | -62.90 | -46.90 | -36.10 | -37.40 | -29.80 | -30.80 | -23.30 | -18.50 | -21.80 | -20.40 | -21.10 | -25.30 | -19.90 | -16.30 | -19.00 | NA | NA | NA | NA | |
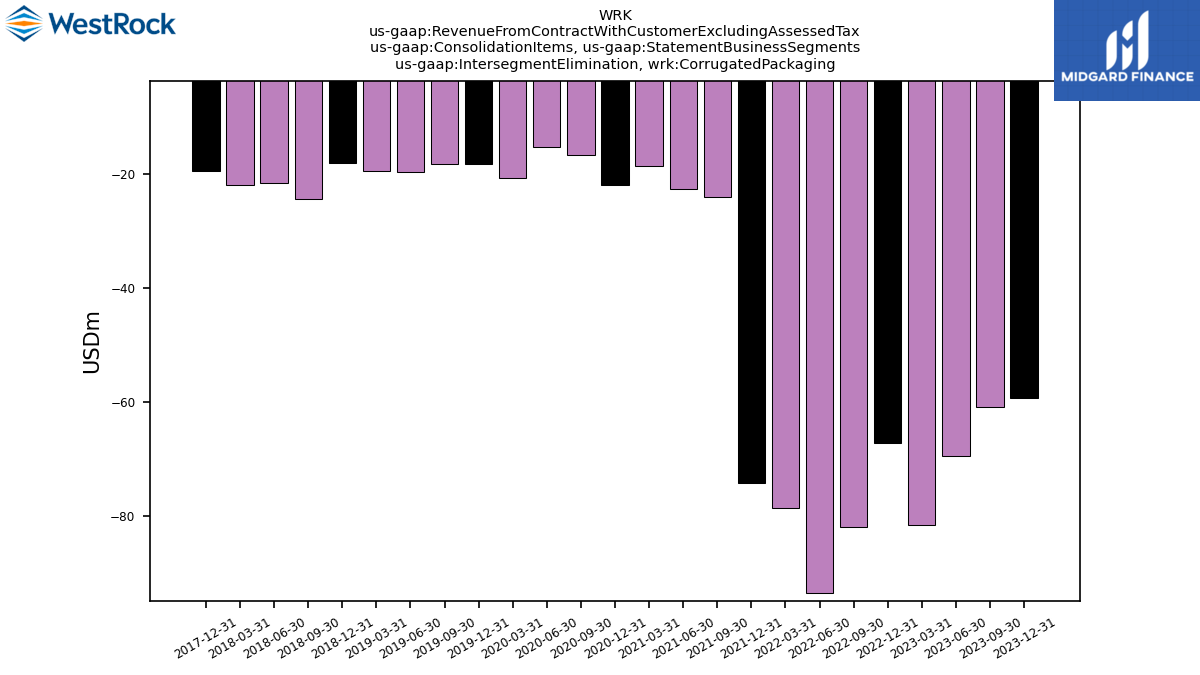
| Intersegment Elimination, Corrugated Packaging | -59.20 | -60.80 | -69.50 | -81.60 | -67.20 | -81.80 | -93.50 | -78.50 | -74.20 | -24.00 | -22.60 | -18.60 | -22.00 | -16.70 | -15.30 | -20.70 | -18.30 | -18.20 | -19.70 | -19.40 | -18.00 | -24.30 | -21.60 | -22.00 | -19.40 | NA | NA | NA | NA | |
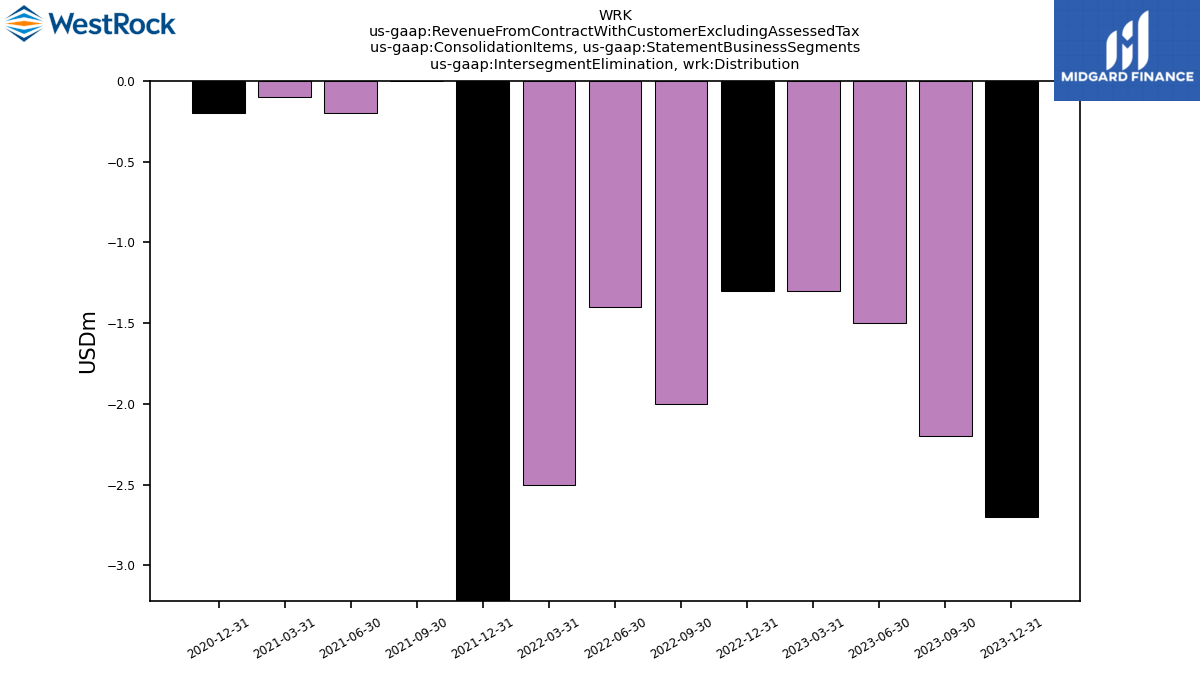
| Intersegment Elimination, Distribution | -2.70 | -2.20 | -1.50 | -1.30 | -1.30 | -2.00 | -1.40 | -2.50 | -3.70 | 0.00 | -0.20 | -0.10 | -0.20 | NA | NA | NA | NA | NA | NA | NA | NA | NA | NA | NA | NA | NA | NA | NA | NA | |
| Intersegment Elimination, Other Unallocated | NA | NA | NA | NA | -1.20 | NA | NA | NA | NA | NA | NA | NA | NA | NA | NA | NA | NA | NA | NA | NA | NA | NA | NA | NA | NA | NA | NA | NA | NA | |
| Operating, Consumer Packaging | 1059.30 | 1211.10 | 1250.60 | 1265.10 | 1215.00 | 1305.70 | 1270.20 | 1250.60 | 1138.70 | 1783.00 | 1734.70 | 1589.90 | 1595.10 | 1627.20 | 1552.60 | 1616.30 | 1536.90 | 1668.80 | 1650.10 | 1668.30 | 1618.80 | 1709.30 | 1669.60 | 1637.30 | 1601.30 | NA | NA | NA | NA | |
| Operating, Corrugated Packaging | 2419.90 | 2524.40 | 2565.70 | 2627.40 | 2235.20 | 2386.10 | 2382.50 | 2319.00 | 2220.00 | 3398.70 | 3167.10 | 2913.40 | 2864.50 | 2898.40 | 2728.80 | 2882.50 | 2909.50 | 3019.40 | 3072.80 | 2990.70 | 2733.80 | 2537.40 | 2444.60 | 2391.30 | 2319.70 | NA | NA | NA | NA | |
| Operating, Distribution | 289.70 | 314.10 | 317.80 | 307.30 | 321.50 | 374.10 | 357.70 | 362.30 | 324.80 | 348.40 | 322.30 | 280.30 | 303.80 | NA | NA | NA | NA | NA | NA | NA | NA | NA | NA | NA | NA | NA | NA | NA | NA | |
| Operating, Global Paper | 918.30 | 1012.40 | 1065.70 | 1168.20 | 1123.60 | 1429.20 | 1610.30 | 1538.10 | 1352.60 | 1462.30 | 1299.20 | NA | NA | NA | NA | NA | NA | NA | NA | NA | NA | NA | NA | NA | NA | NA | NA | NA | NA | |
| Operating, Other Unallocated | NA | NA | NA | NA | 102.20 | NA | NA | NA | NA | NA | NA | NA | NA | NA | NA | NA | NA | NA | NA | NA | NA | NA | NA | NA | NA | NA | NA | NA | NA | |
| Operating, Paper | NA | NA | NA | NA | NA | NA | NA | 1538.10 | 1352.60 | NA | NA | 1130.60 | 1090.90 | NA | NA | NA | NA | NA | NA | NA | NA | NA | NA | NA | NA | NA | NA | NA | NA | |
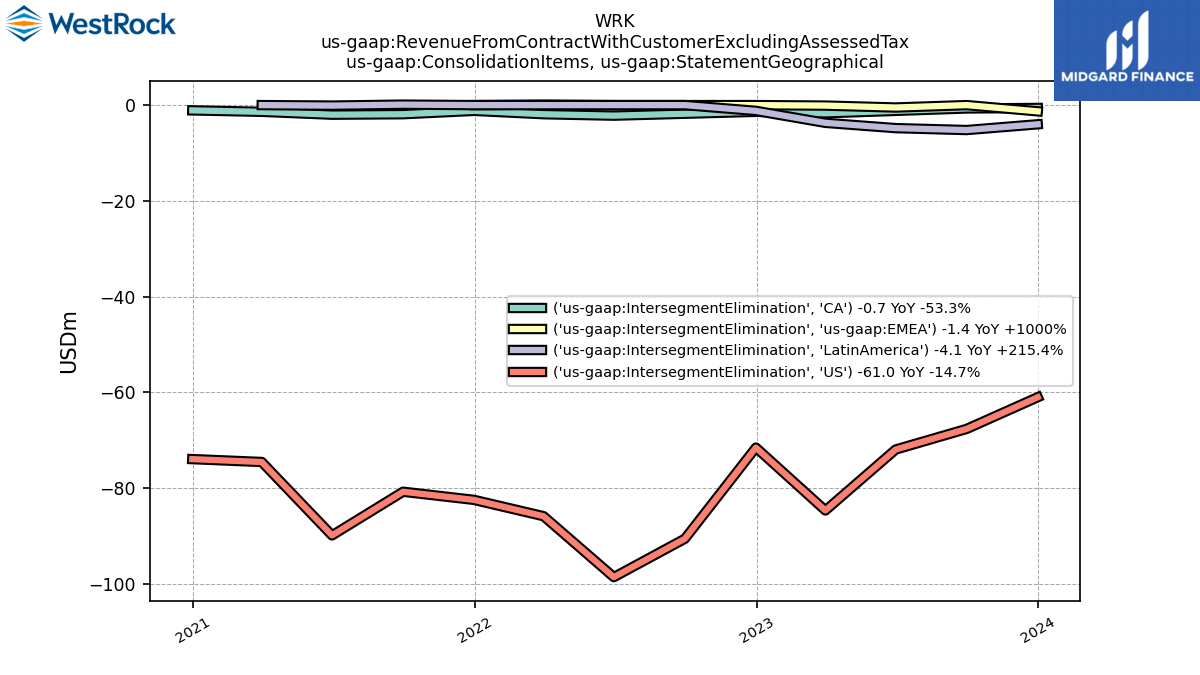
| Intersegment Elimination, | -0.70 | -0.80 | -1.30 | -1.80 | -1.50 | -1.90 | -2.30 | -2.00 | -1.30 | -2.00 | -2.10 | -1.50 | -1.20 | NA | NA | NA | NA | NA | NA | NA | NA | NA | NA | NA | NA | NA | NA | NA | NA | |
| Intersegment Elimination, | -4.10 | -5.30 | -4.90 | -3.80 | -1.30 | -0.10 | -0.10 | -0.10 | -0.10 | 0.00 | -0.20 | -0.10 | NA | NA | NA | NA | NA | NA | NA | NA | NA | NA | NA | NA | NA | NA | NA | NA | NA | |
| Intersegment Elimination,US | -61.00 | -67.60 | -71.90 | -84.60 | -71.50 | -90.50 | -98.50 | -85.80 | -82.40 | -80.70 | -89.80 | -74.50 | -73.90 | NA | NA | NA | NA | NA | NA | NA | NA | NA | NA | NA | NA | NA | NA | NA | NA | |
| Intersegment Elimination,EMEA | -1.40 | -0.10 | -0.60 | -0.20 | -0.10 | -0.10 | -0.10 | 0.00 | -0.10 | NA | NA | NA | NA | NA | NA | NA | NA | NA | NA | NA | NA | NA | NA | NA | NA | NA | NA | NA | NA | |
| Operating,, Consumer Packaging | 71.80 | NA | NA | NA | 76.70 | NA | NA | NA | NA | NA | NA | NA | NA | NA | NA | NA | NA | NA | NA | NA | NA | NA | NA | NA | NA | NA | NA | NA | NA | |
| Operating,, Global Paper | 11.30 | NA | NA | NA | 10.70 | NA | NA | NA | NA | NA | NA | NA | NA | NA | NA | NA | NA | NA | NA | NA | NA | NA | NA | NA | NA | NA | NA | NA | NA | |
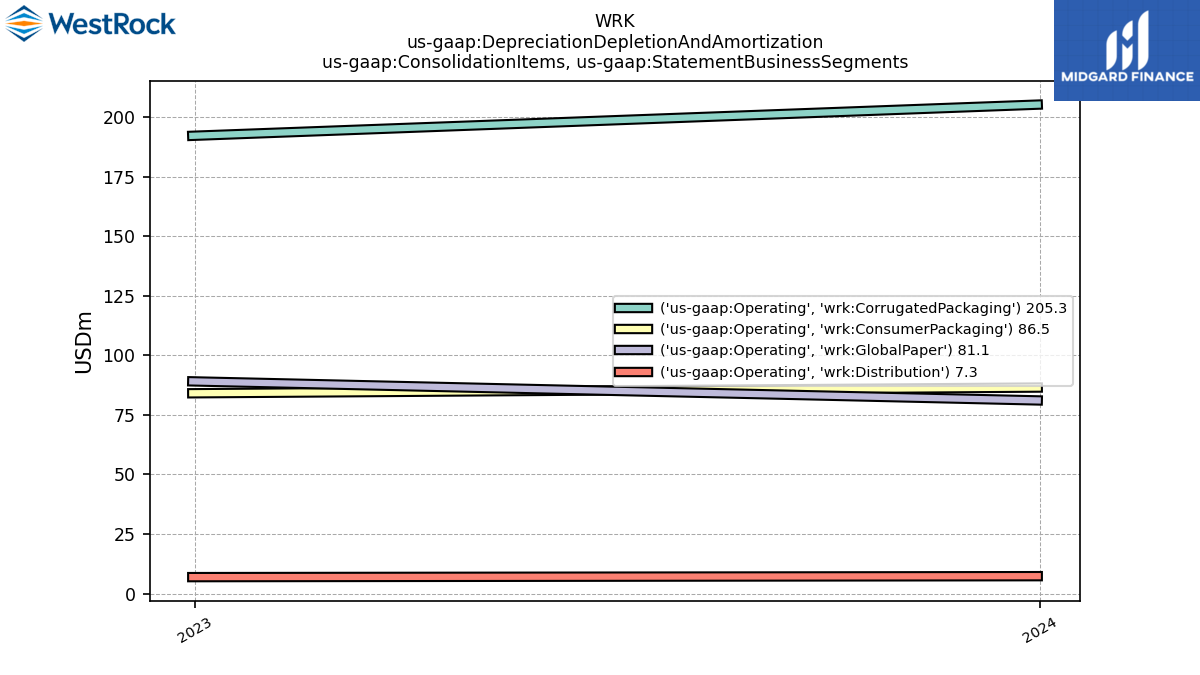
| Operating,, Consumer Packaging | 116.70 | NA | NA | NA | 123.70 | NA | NA | NA | NA | NA | NA | NA | NA | NA | NA | NA | NA | NA | NA | NA | NA | NA | NA | NA | NA | NA | NA | NA | NA | |
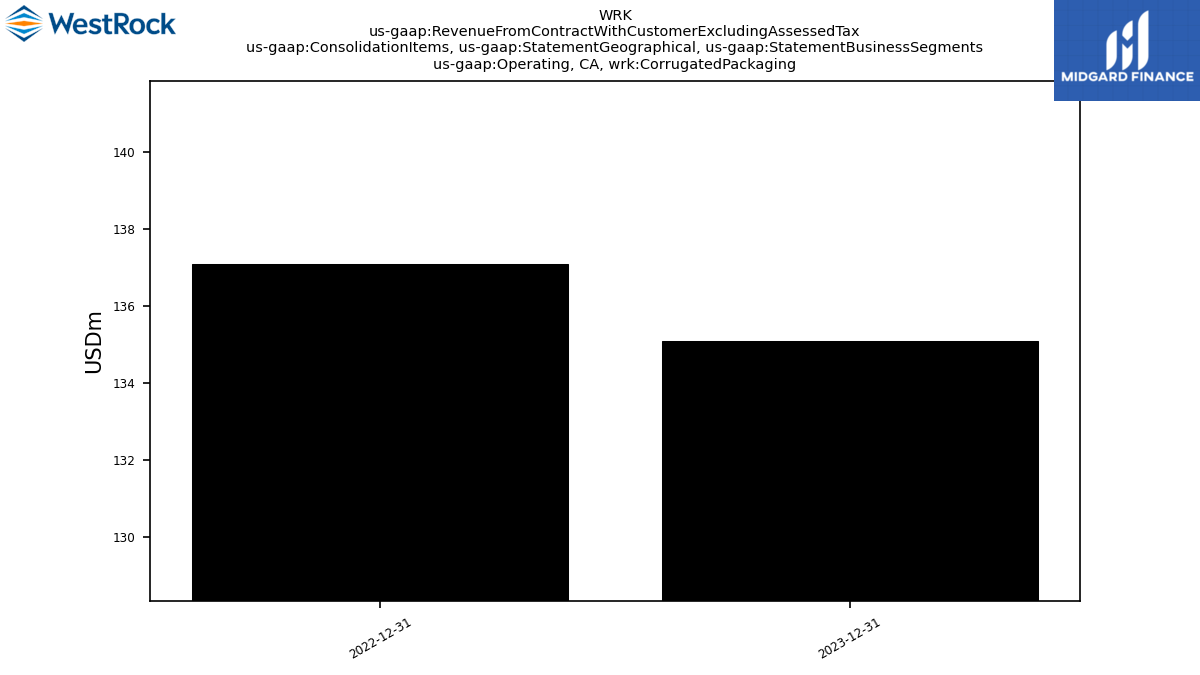
| Operating,, Corrugated Packaging | 135.10 | NA | NA | NA | 137.10 | NA | NA | NA | NA | NA | NA | NA | NA | NA | NA | NA | NA | NA | NA | NA | NA | NA | NA | NA | NA | NA | NA | NA | NA | |
| Operating,, Distribution | 1.20 | NA | NA | NA | 3.40 | NA | NA | NA | NA | NA | NA | NA | NA | NA | NA | NA | NA | NA | NA | NA | NA | NA | NA | NA | NA | NA | NA | NA | NA | |
| Operating,, Global Paper | 51.10 | NA | NA | NA | 45.50 | NA | NA | NA | NA | NA | NA | NA | NA | NA | NA | NA | NA | NA | NA | NA | NA | NA | NA | NA | NA | NA | NA | NA | NA | |
| Operating,, Consumer Packaging | 6.10 | NA | NA | NA | 51.70 | NA | NA | NA | NA | NA | NA | NA | NA | NA | NA | NA | NA | NA | NA | NA | NA | NA | NA | NA | NA | NA | NA | NA | NA | |
| Operating,, Corrugated Packaging | 485.40 | NA | NA | NA | 225.50 | NA | NA | NA | NA | NA | NA | NA | NA | NA | NA | NA | NA | NA | NA | NA | NA | NA | NA | NA | NA | NA | NA | NA | NA | |
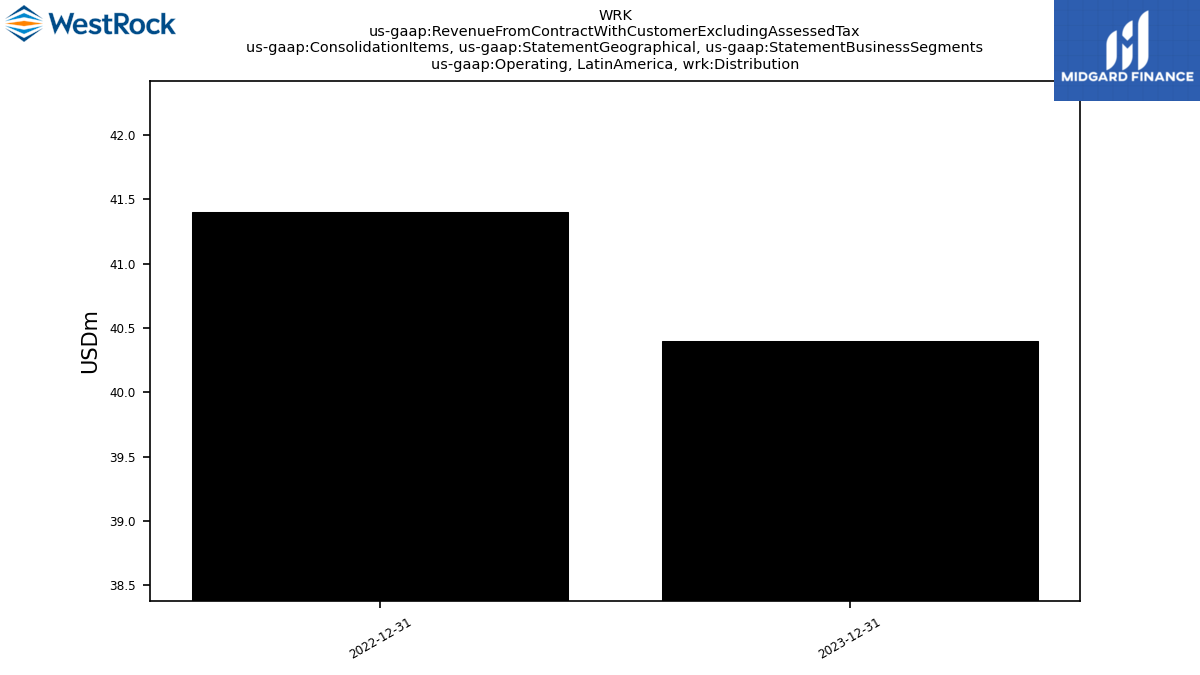
| Operating,, Distribution | 40.40 | NA | NA | NA | 41.40 | NA | NA | NA | NA | NA | NA | NA | NA | NA | NA | NA | NA | NA | NA | NA | NA | NA | NA | NA | NA | NA | NA | NA | NA | |
| Operating,, Global Paper | 23.50 | NA | NA | NA | 33.60 | NA | NA | NA | NA | NA | NA | NA | NA | NA | NA | NA | NA | NA | NA | NA | NA | NA | NA | NA | NA | NA | NA | NA | NA | |
| Operating,US, Consumer Packaging | 593.80 | NA | NA | NA | 703.00 | NA | NA | NA | NA | NA | NA | NA | NA | NA | NA | NA | NA | NA | NA | NA | NA | NA | NA | NA | NA | NA | NA | NA | NA | |
| Operating,US, Corrugated Packaging | 1796.40 | NA | NA | NA | 1973.50 | NA | NA | NA | NA | NA | NA | NA | NA | NA | NA | NA | NA | NA | NA | NA | NA | NA | NA | NA | NA | NA | NA | NA | NA | |
| Operating,US, Distribution | 248.10 | NA | NA | NA | 276.70 | NA | NA | NA | NA | NA | NA | NA | NA | NA | NA | NA | NA | NA | NA | NA | NA | NA | NA | NA | NA | NA | NA | NA | NA | |
| Operating,US, Global Paper | 820.50 | NA | NA | NA | 1022.70 | NA | NA | NA | NA | NA | NA | NA | NA | NA | NA | NA | NA | NA | NA | NA | NA | NA | NA | NA | NA | NA | NA | NA | NA | |
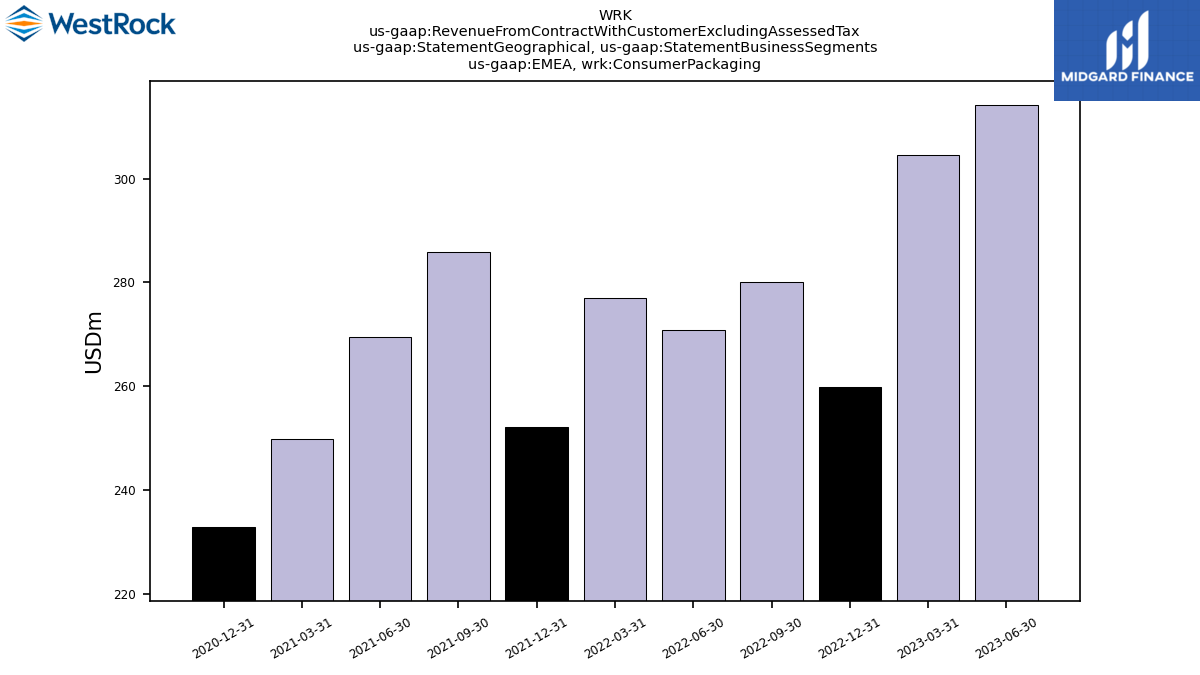
| Operating,EMEA, Consumer Packaging | 270.90 | NA | NA | NA | 259.90 | NA | NA | NA | NA | NA | NA | NA | NA | NA | NA | NA | NA | NA | NA | NA | NA | NA | NA | NA | NA | NA | NA | NA | NA | |
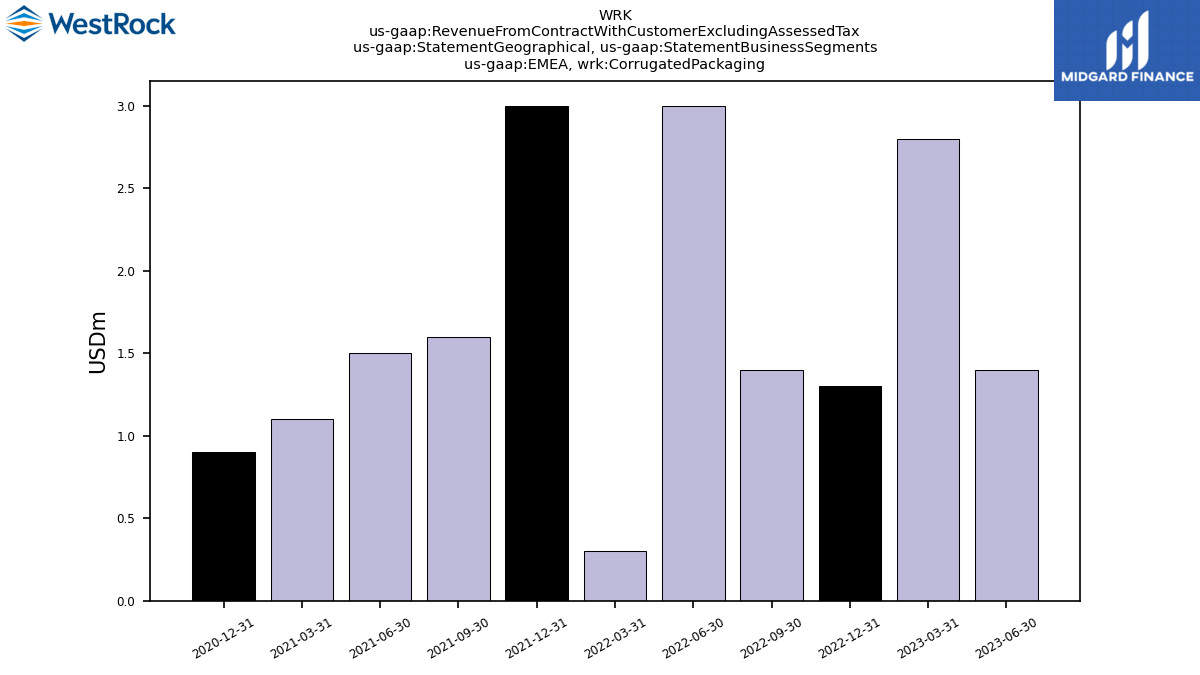
| Operating,EMEA, Corrugated Packaging | 3.00 | NA | NA | NA | 1.30 | NA | NA | NA | NA | NA | NA | NA | NA | NA | NA | NA | NA | NA | NA | NA | NA | NA | NA | NA | NA | NA | NA | NA | NA | |
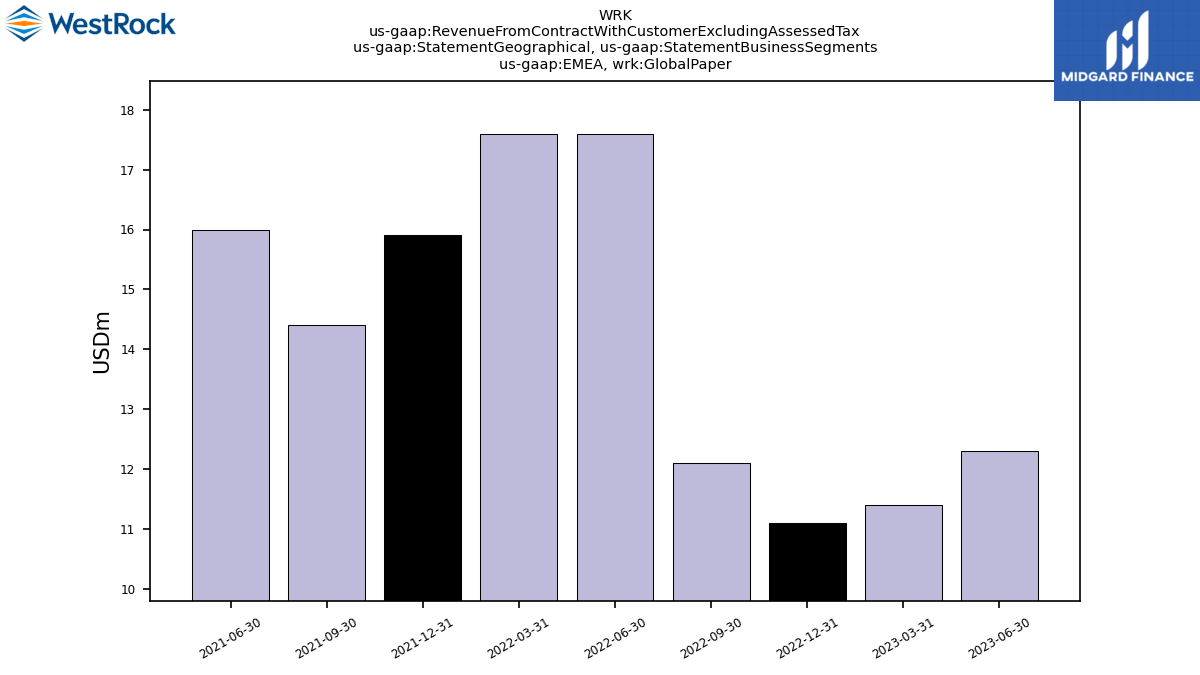
| Operating,EMEA, Global Paper | 11.90 | NA | NA | NA | 11.10 | NA | NA | NA | NA | NA | NA | NA | NA | NA | NA | NA | NA | NA | NA | NA | NA | NA | NA | NA | NA | NA | NA | NA | NA | |
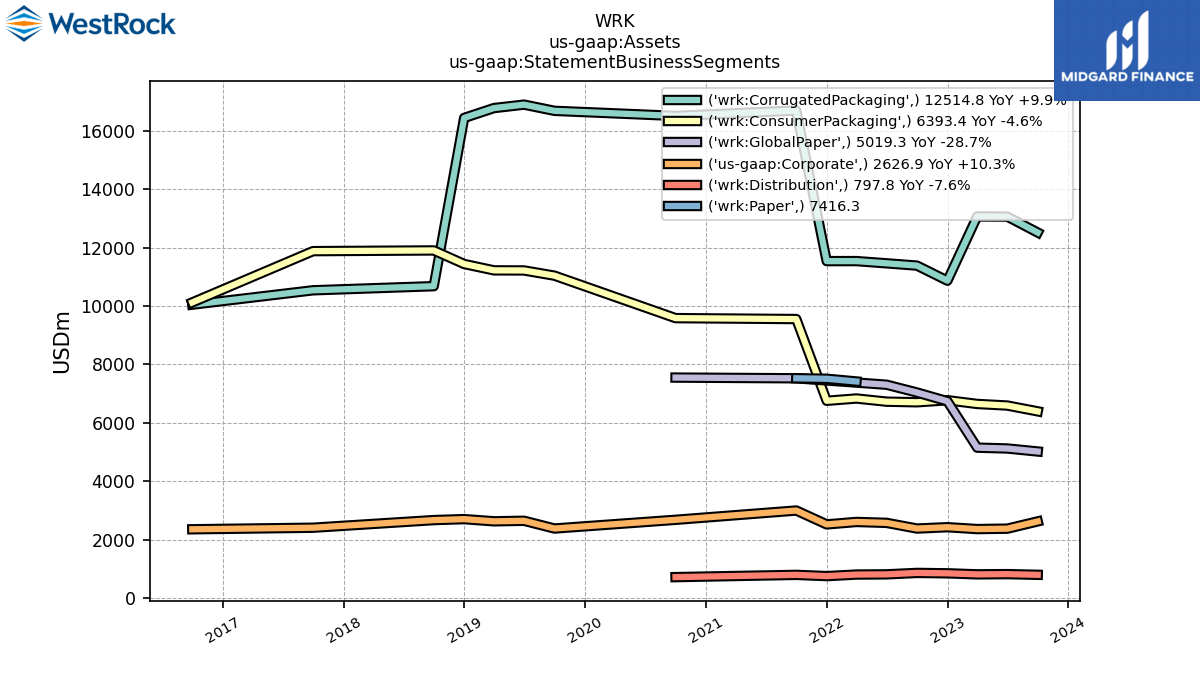
| Consumer Packaging | NA | NA | 1250.60 | 1265.10 | 1215.00 | 1305.70 | 1270.20 | 1250.60 | 1138.70 | 1783.00 | 1734.70 | 1589.90 | 1595.10 | 1627.20 | 1552.60 | 1616.30 | 1536.90 | 1668.80 | 1650.10 | 1668.30 | 1618.80 | NA | NA | NA | NA | NA | NA | NA | NA | |
| Corrugated Packaging | NA | NA | 2565.70 | 2627.40 | 2235.20 | 2386.10 | 2382.50 | 2319.00 | 2220.00 | 3398.70 | 3167.10 | 2913.40 | 2864.50 | 2898.40 | 2728.80 | 2882.50 | 2909.50 | 3019.40 | 3072.80 | 2990.70 | 2733.80 | NA | NA | NA | NA | NA | NA | NA | NA | |
| Distribution | NA | NA | 317.80 | 307.30 | 321.50 | 374.10 | 357.70 | 362.30 | 324.80 | 348.40 | 322.30 | 280.30 | 303.80 | NA | NA | NA | NA | NA | NA | NA | NA | NA | NA | NA | NA | NA | NA | NA | NA | |
| Global Paper | NA | NA | 1065.70 | 1168.20 | 1123.60 | 1429.20 | 1610.30 | 1538.10 | 1352.60 | 1462.30 | 1299.20 | NA | NA | NA | NA | NA | NA | NA | NA | NA | NA | NA | NA | NA | NA | NA | NA | NA | NA | |
| Other Unallocated | NA | NA | NA | NA | 102.20 | NA | NA | NA | NA | NA | NA | NA | NA | NA | NA | NA | NA | NA | NA | NA | NA | NA | NA | NA | NA | NA | NA | NA | NA | |
| Paper | NA | NA | NA | NA | NA | NA | NA | 1538.10 | 1352.60 | NA | NA | 1130.60 | 1090.90 | NA | NA | NA | NA | NA | NA | NA | NA | NA | NA | NA | NA | NA | NA | NA | NA | |
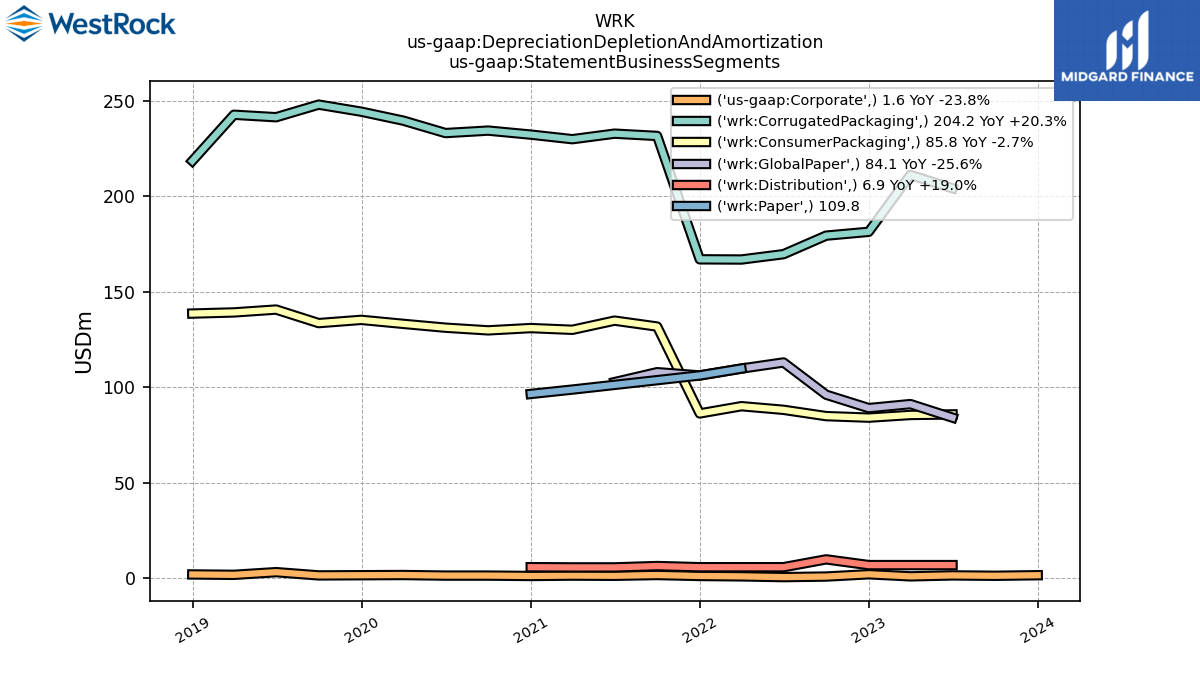
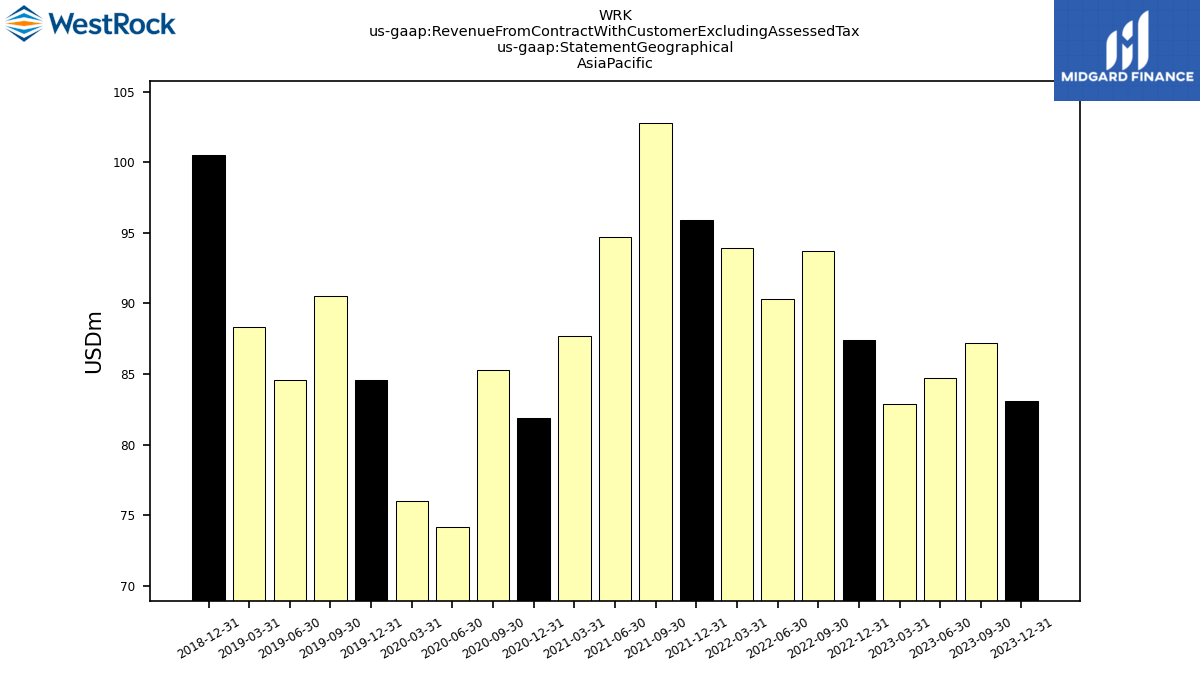
| 83.10 | 87.20 | 84.70 | 82.90 | 87.40 | 93.70 | 90.30 | 93.90 | 95.90 | 102.80 | 94.70 | 87.70 | 81.90 | 85.30 | 74.20 | 76.00 | 84.60 | 90.50 | 84.60 | 88.30 | 100.50 | NA | NA | NA | NA | NA | NA | NA | NA | ||
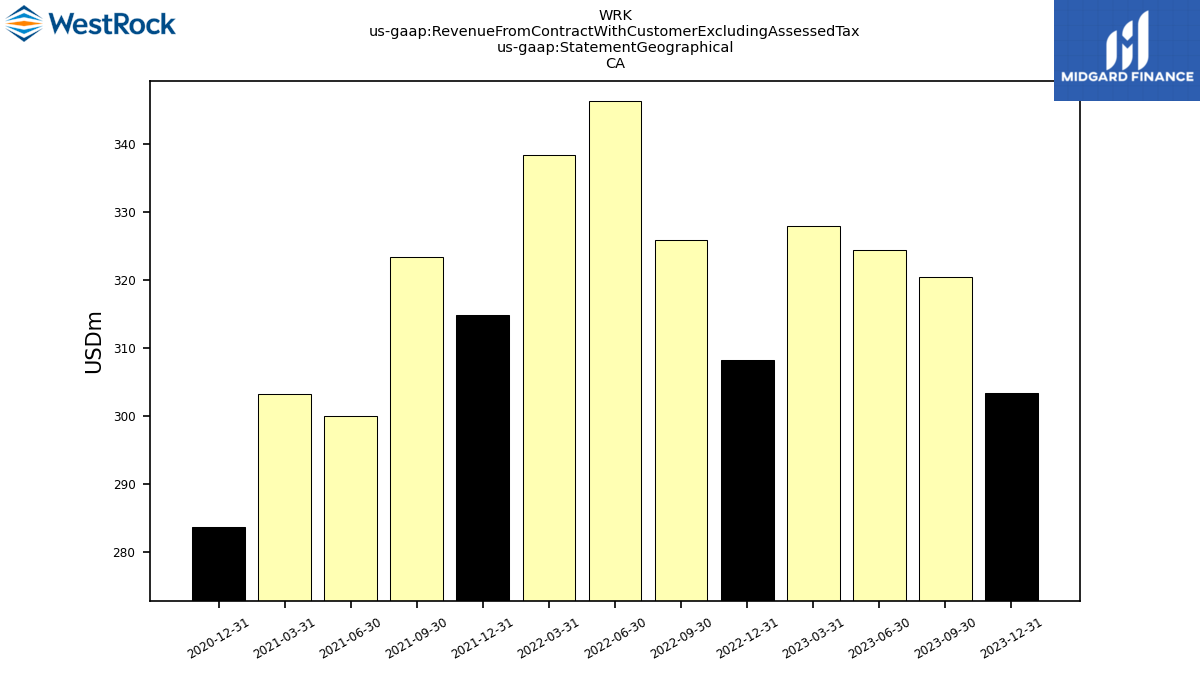
| 303.40 | 320.50 | 324.40 | 327.90 | 308.20 | 325.80 | 346.20 | 338.30 | 314.80 | 323.30 | 300.00 | 303.30 | 283.80 | NA | NA | NA | NA | NA | NA | NA | NA | NA | NA | NA | NA | NA | NA | NA | NA | ||
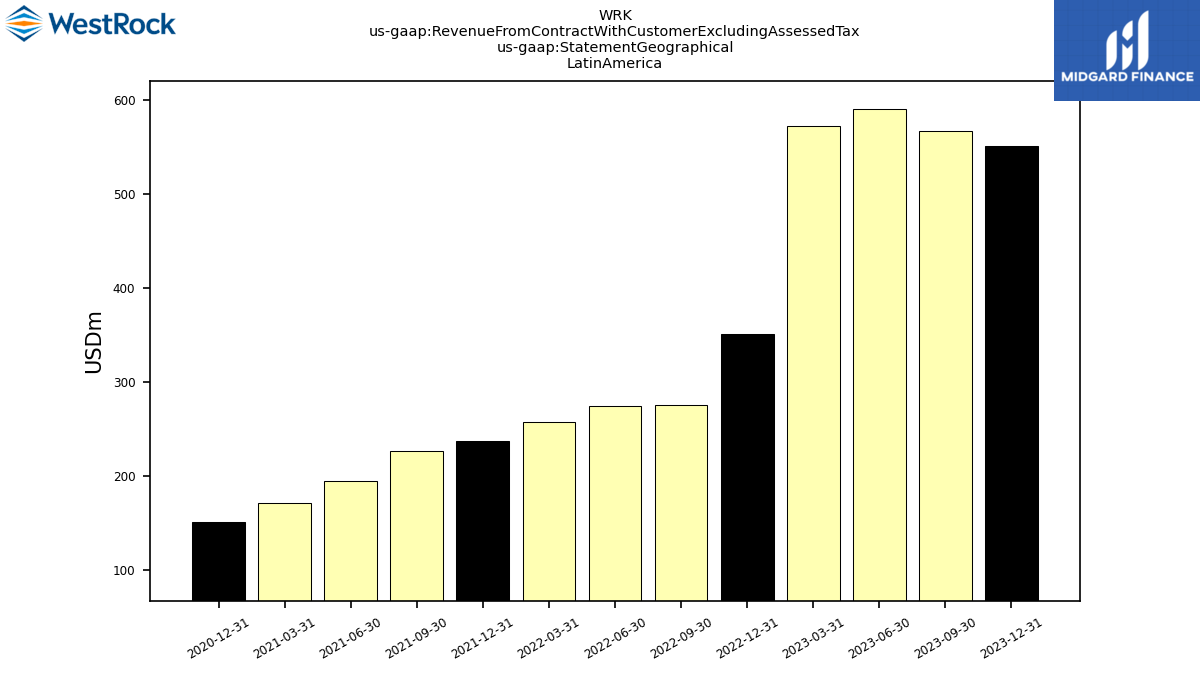
| 551.30 | 567.10 | 590.80 | 573.00 | 350.90 | 275.70 | 274.60 | 257.30 | 238.00 | 226.60 | 195.10 | 171.80 | 151.90 | NA | NA | NA | NA | NA | NA | NA | NA | NA | NA | NA | NA | NA | NA | NA | NA | ||
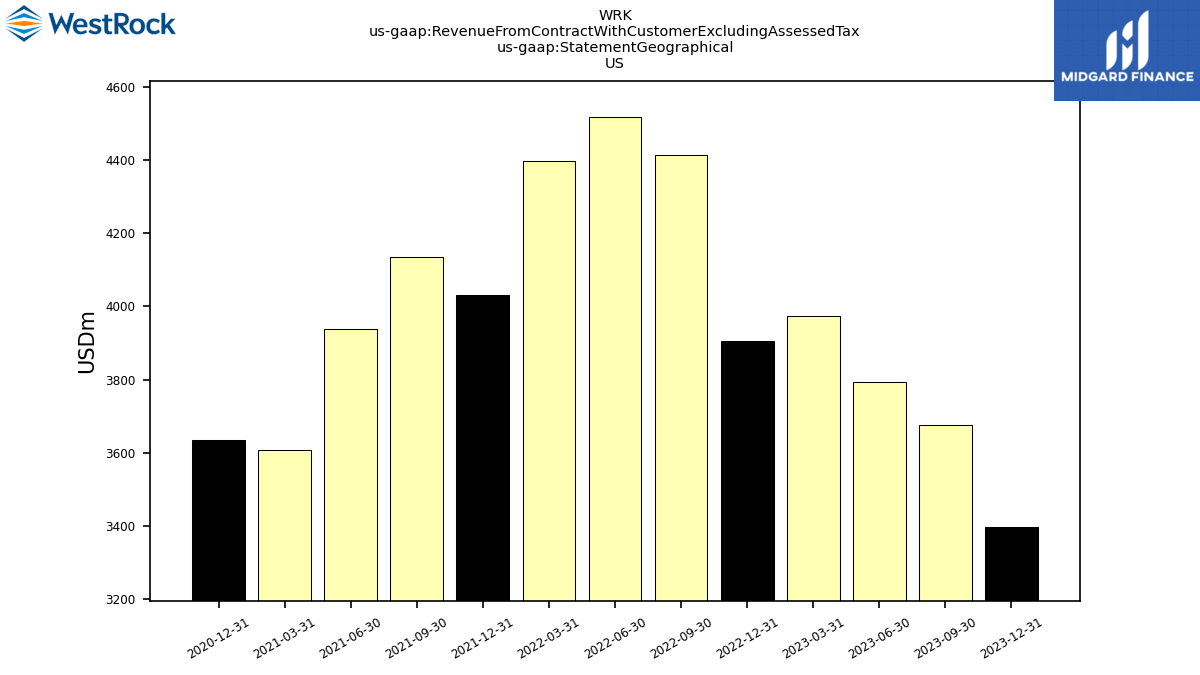
| US | 3397.80 | 3675.20 | 3794.00 | 3975.30 | 3904.40 | 4413.90 | 4517.30 | 4397.70 | 4032.60 | 4135.90 | 3939.50 | 3608.00 | 3633.80 | NA | NA | NA | NA | NA | NA | NA | NA | NA | NA | NA | NA | NA | NA | NA | NA | |
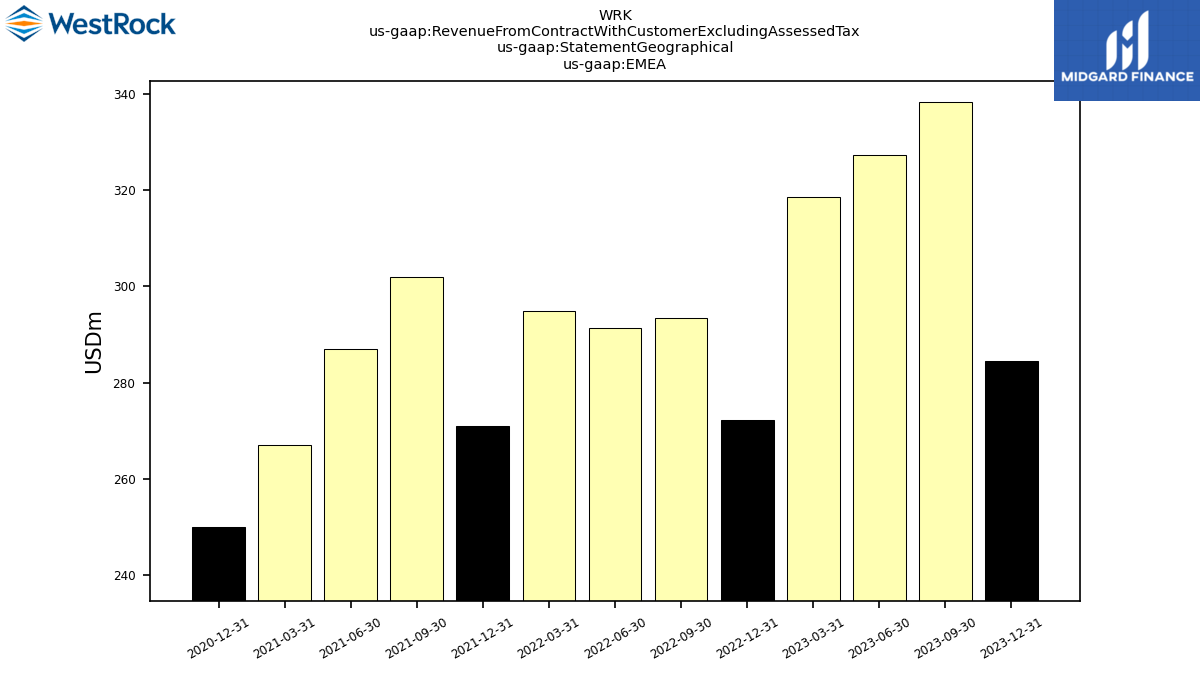
| EMEA | 284.40 | 338.20 | 327.20 | 318.50 | 272.20 | 293.40 | 291.30 | 294.90 | 270.90 | 301.90 | 287.00 | 267.00 | 250.10 | NA | NA | NA | NA | NA | NA | NA | NA | NA | NA | NA | NA | NA | NA | NA | NA | |
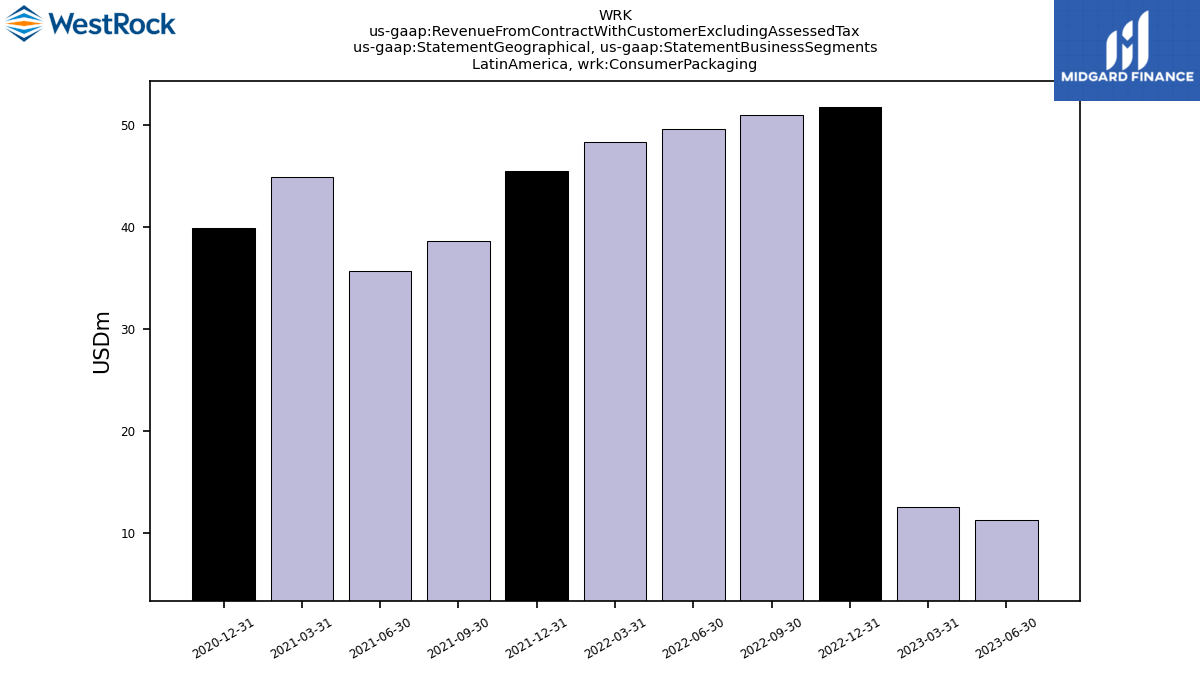
| , Consumer Packaging | NA | NA | 72.40 | 71.90 | 76.70 | 78.80 | 75.80 | 76.90 | 78.50 | 84.40 | 77.50 | 69.20 | 69.60 | 76.00 | 66.30 | 62.50 | 73.50 | 76.60 | 70.00 | 72.50 | 83.00 | NA | NA | NA | NA | NA | NA | NA | NA | |
| , Global Paper | NA | NA | 12.30 | 11.00 | 10.70 | 14.90 | 14.50 | 17.00 | 17.40 | 18.60 | 17.60 | NA | NA | NA | NA | NA | NA | NA | NA | NA | NA | NA | NA | NA | NA | NA | NA | NA | NA | |
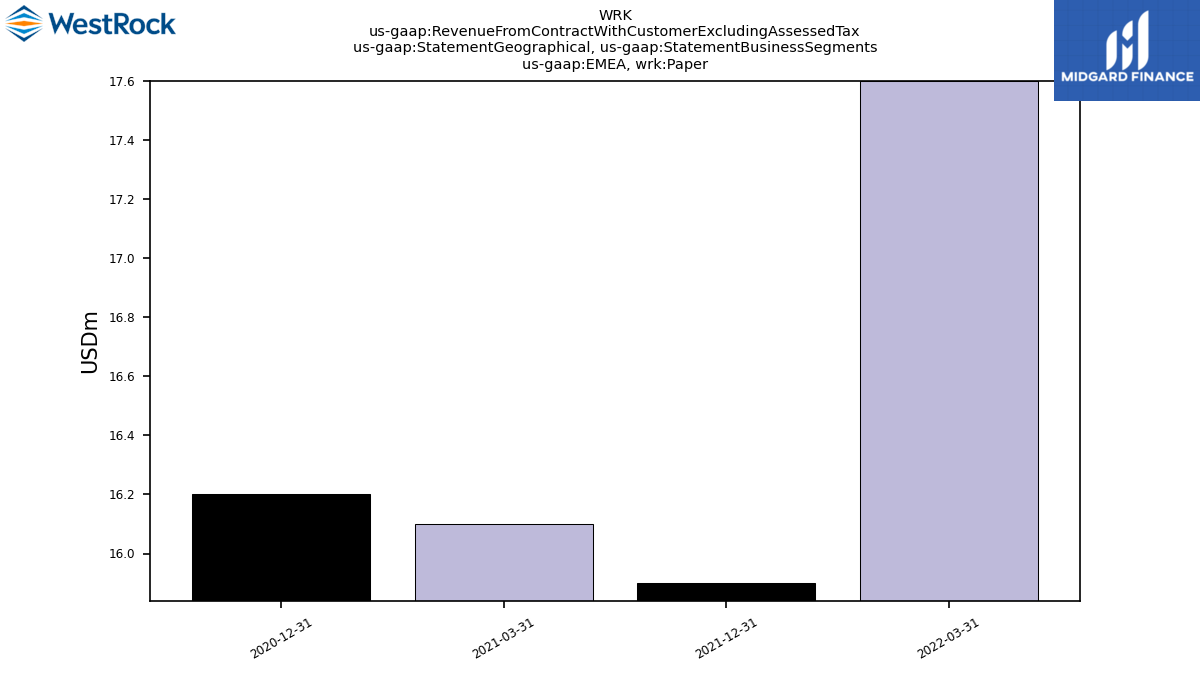
| , Paper | NA | NA | NA | NA | NA | NA | NA | 17.00 | 17.40 | NA | NA | 18.70 | 12.40 | NA | NA | NA | NA | NA | NA | NA | NA | NA | NA | NA | NA | NA | NA | NA | NA | |
| , Consumer Packaging | NA | NA | 131.40 | 134.50 | 123.70 | 133.80 | 133.50 | 128.40 | 114.30 | 120.60 | 119.60 | 119.40 | 113.40 | NA | NA | NA | NA | NA | NA | NA | NA | NA | NA | NA | NA | NA | NA | NA | NA | |
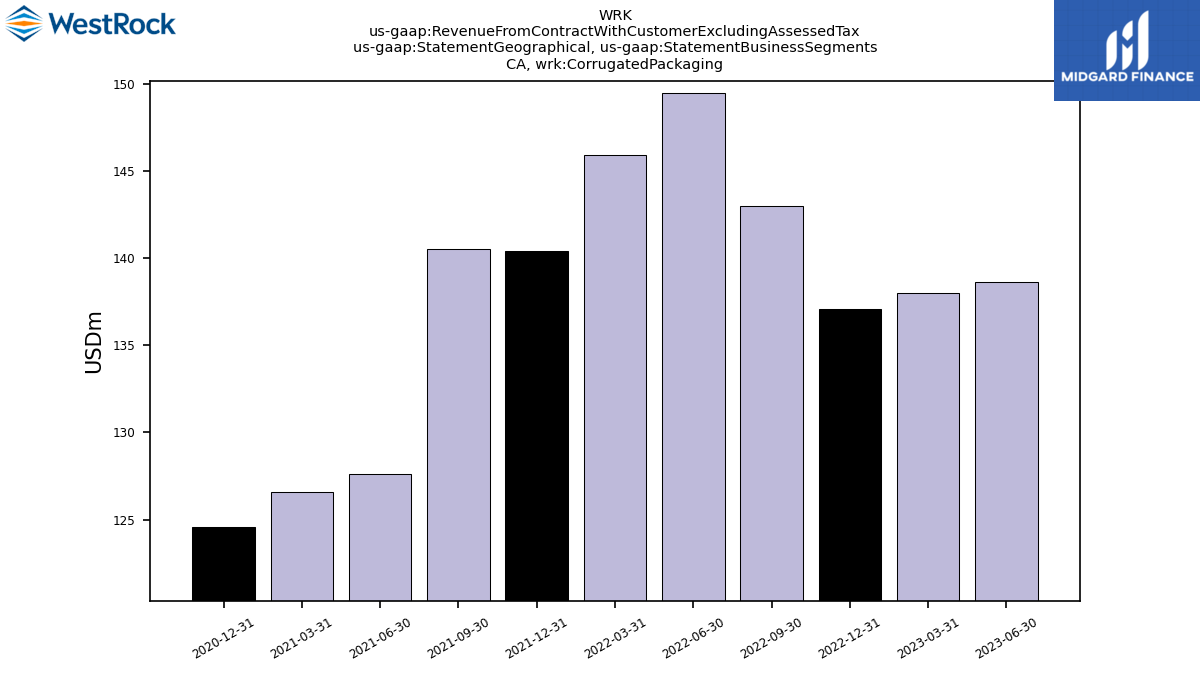
| , Corrugated Packaging | NA | NA | 138.60 | 138.00 | 137.10 | 143.00 | 149.50 | 145.90 | 140.40 | 140.50 | 127.60 | 126.60 | 124.60 | NA | NA | NA | NA | NA | NA | NA | NA | NA | NA | NA | NA | NA | NA | NA | NA | |
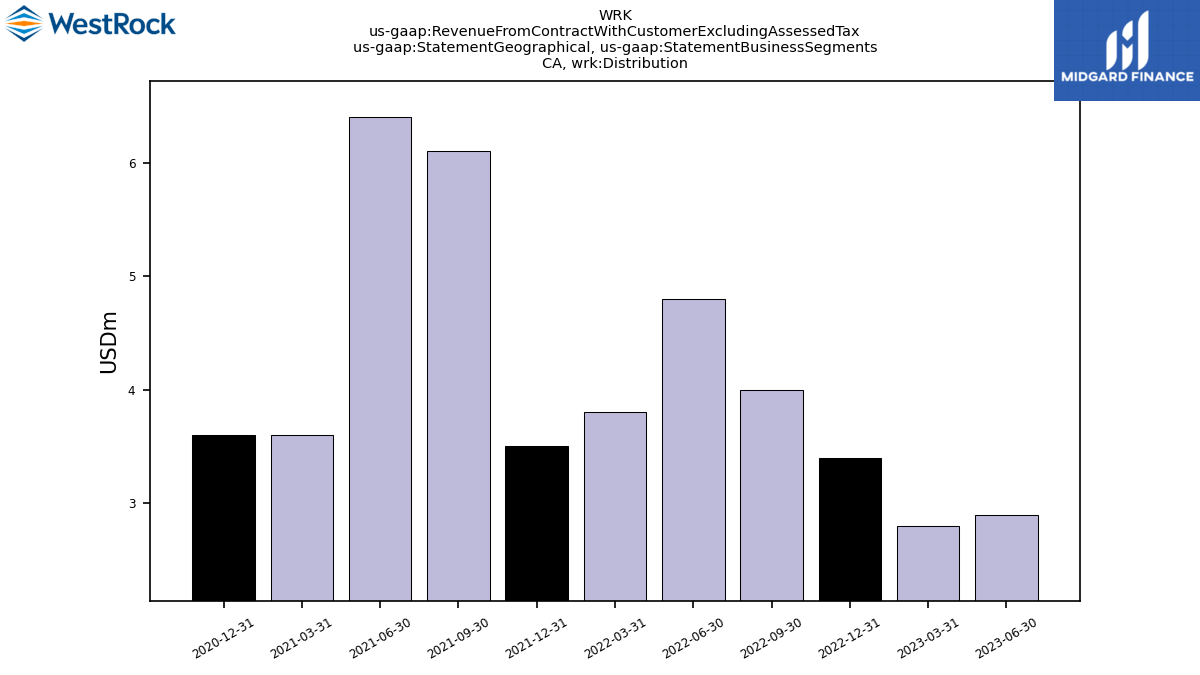
| , Distribution | NA | NA | 2.90 | 2.80 | 3.40 | 4.00 | 4.80 | 3.80 | 3.50 | 6.10 | 6.40 | 3.60 | 3.60 | NA | NA | NA | NA | NA | NA | NA | NA | NA | NA | NA | NA | NA | NA | NA | NA | |
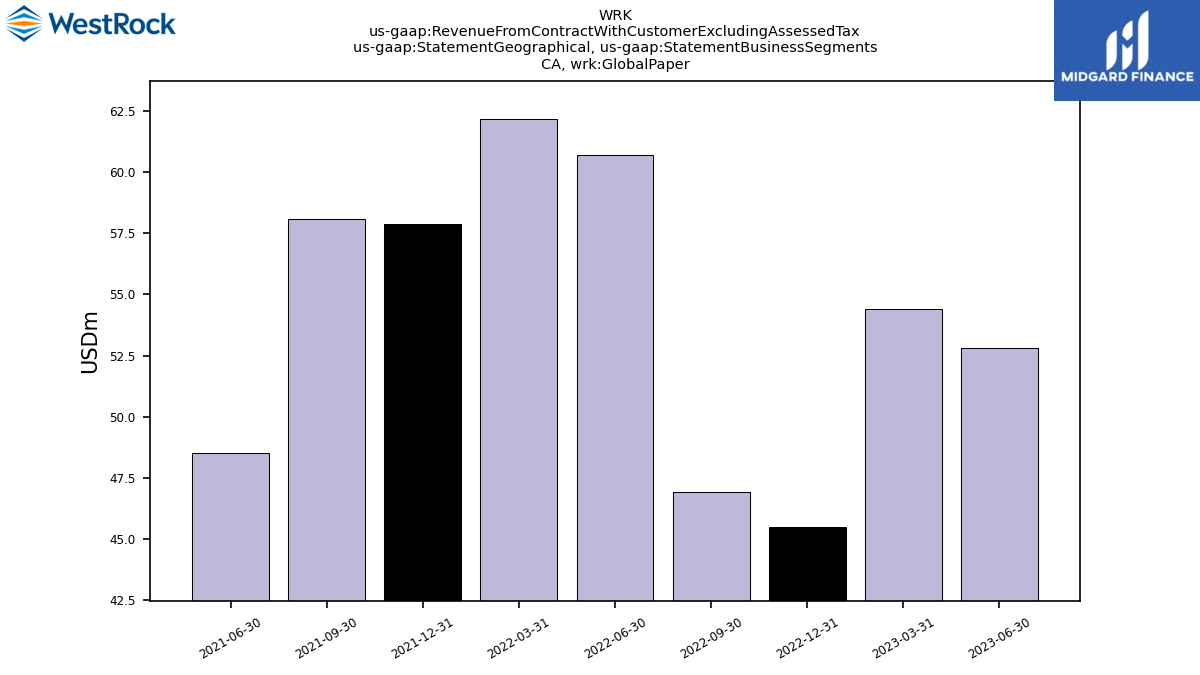
| , Global Paper | NA | NA | 52.80 | 54.40 | 45.50 | 46.90 | 60.70 | 62.20 | 57.90 | 58.10 | 48.50 | NA | NA | NA | NA | NA | NA | NA | NA | NA | NA | NA | NA | NA | NA | NA | NA | NA | NA | |
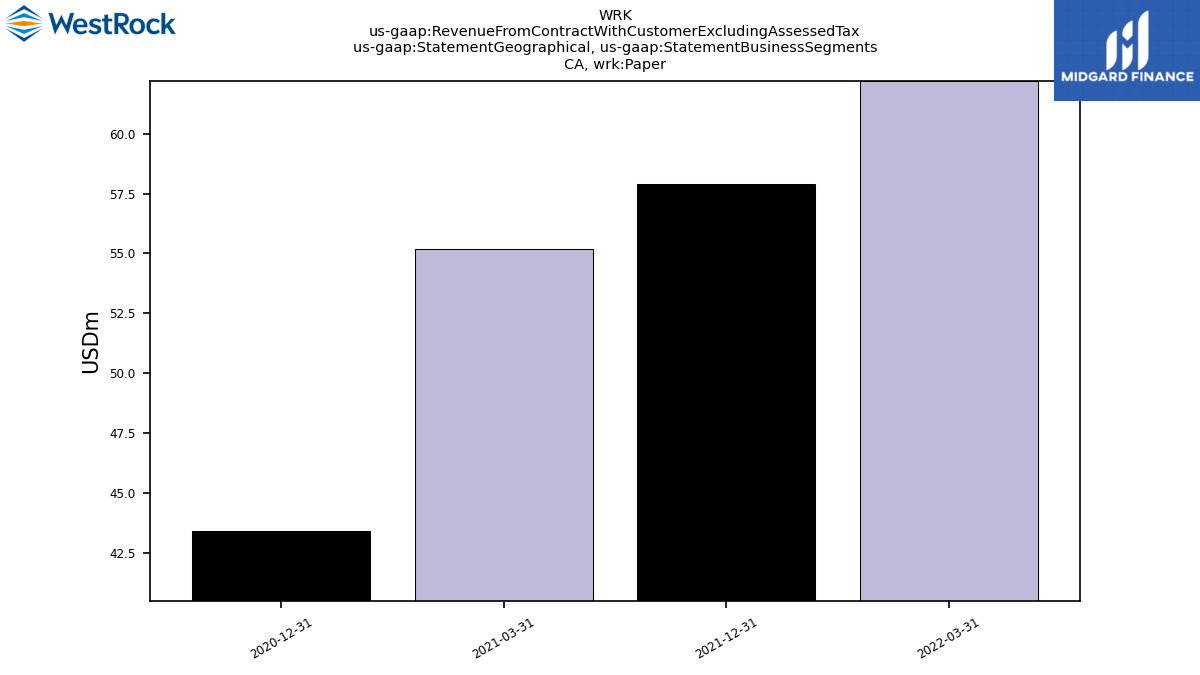
| , Paper | NA | NA | NA | NA | NA | NA | NA | 62.20 | 57.90 | NA | NA | 55.20 | 43.40 | NA | NA | NA | NA | NA | NA | NA | NA | NA | NA | NA | NA | NA | NA | NA | NA | |
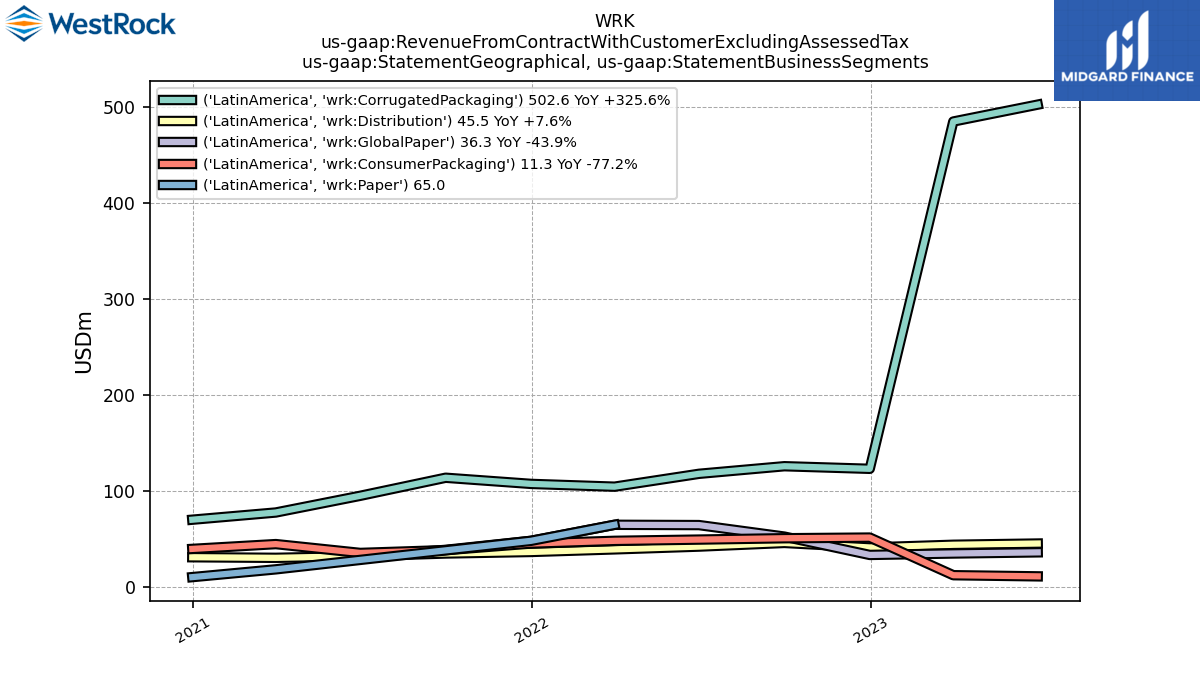
| , Consumer Packaging | NA | NA | 11.30 | 12.50 | 51.70 | 51.00 | 49.60 | 48.30 | 45.50 | 38.60 | 35.70 | 44.90 | 39.90 | NA | NA | NA | NA | NA | NA | NA | NA | NA | NA | NA | NA | NA | NA | NA | NA | |
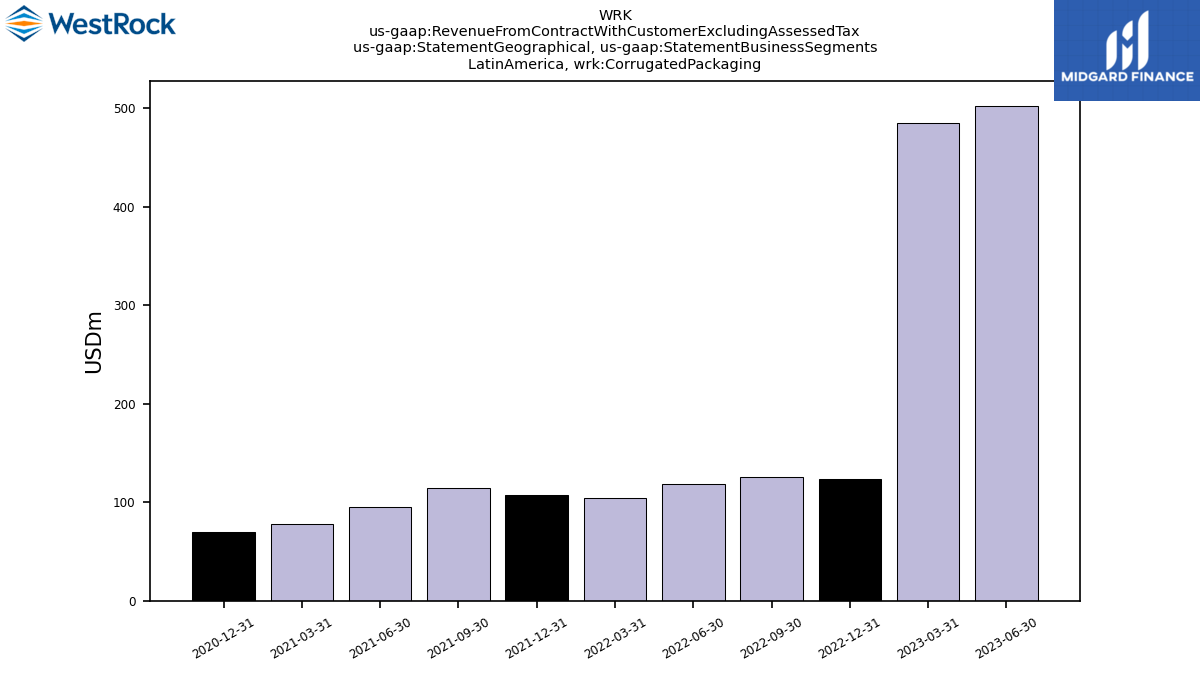
| , Corrugated Packaging | NA | NA | 502.60 | 485.00 | 123.30 | 126.00 | 118.10 | 104.70 | 107.60 | 114.00 | 95.20 | 77.80 | 70.30 | NA | NA | NA | NA | NA | NA | NA | NA | NA | NA | NA | NA | NA | NA | NA | NA | |
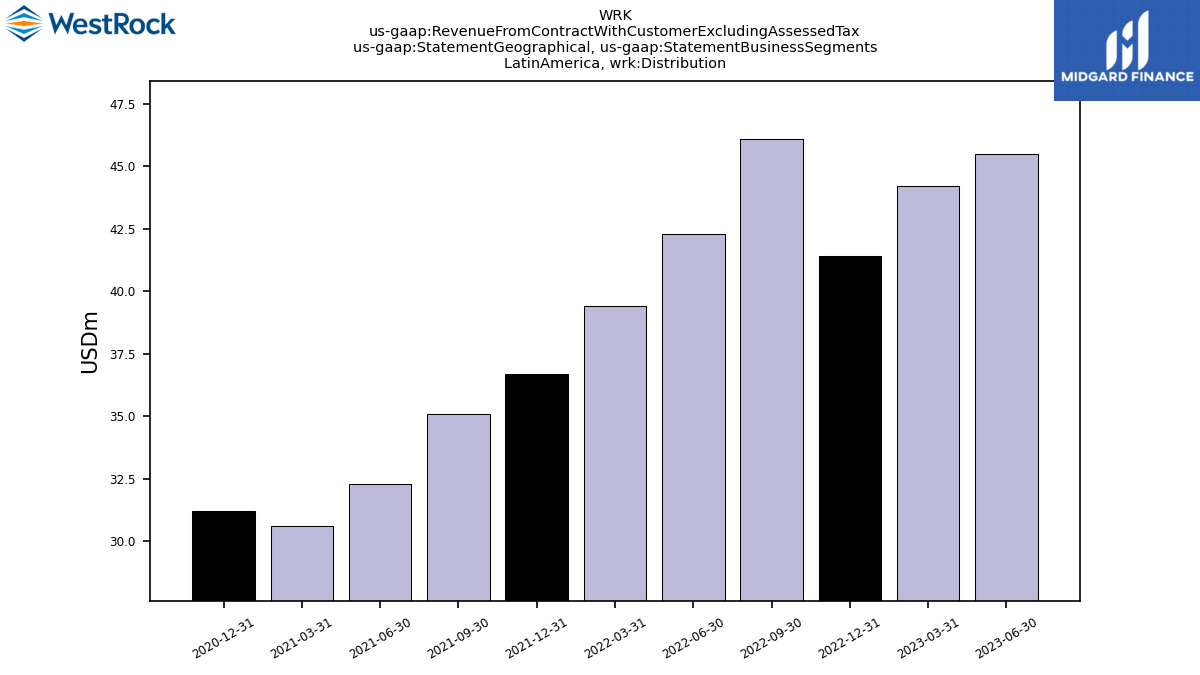
| , Distribution | NA | NA | 45.50 | 44.20 | 41.40 | 46.10 | 42.30 | 39.40 | 36.70 | 35.10 | 32.30 | 30.60 | 31.20 | NA | NA | NA | NA | NA | NA | NA | NA | NA | NA | NA | NA | NA | NA | NA | NA | |
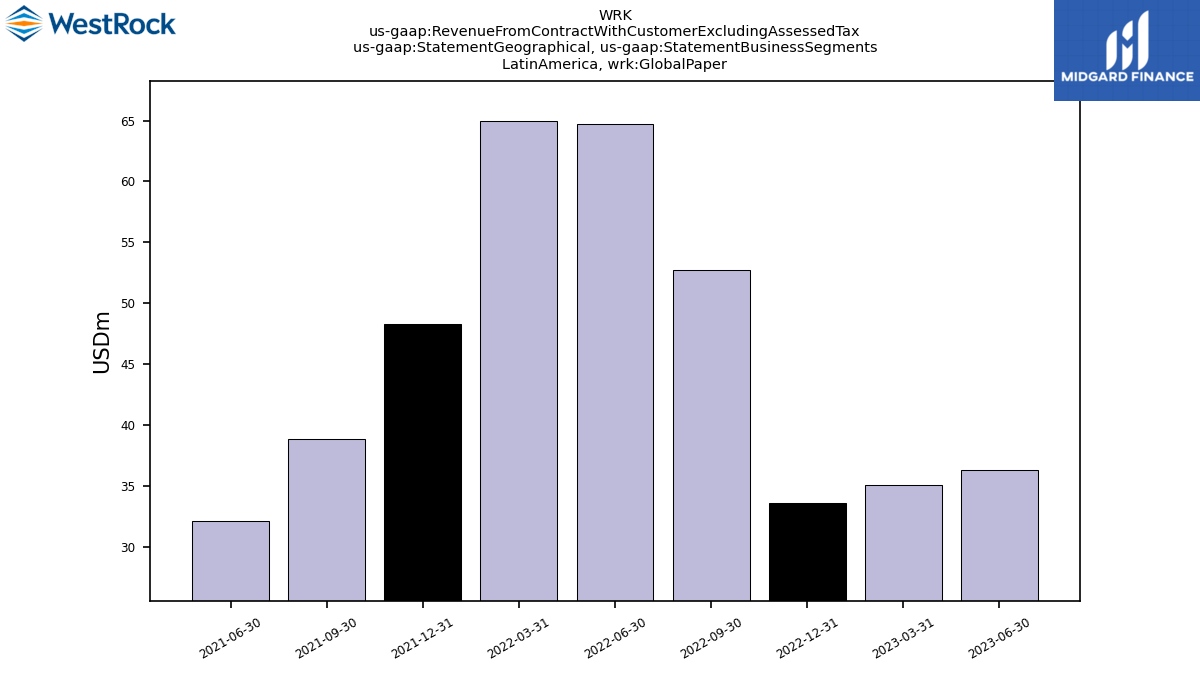
| , Global Paper | NA | NA | 36.30 | 35.10 | 33.60 | 52.70 | 64.70 | 65.00 | 48.30 | 38.90 | 32.10 | NA | NA | NA | NA | NA | NA | NA | NA | NA | NA | NA | NA | NA | NA | NA | NA | NA | NA | |
| , Other Unallocated | NA | NA | NA | NA | 102.20 | NA | NA | NA | NA | NA | NA | NA | NA | NA | NA | NA | NA | NA | NA | NA | NA | NA | NA | NA | NA | NA | NA | NA | NA | |
| , Paper | NA | NA | NA | NA | NA | NA | NA | 65.00 | 48.30 | NA | NA | 18.60 | 10.50 | NA | NA | NA | NA | NA | NA | NA | NA | NA | NA | NA | NA | NA | NA | NA | NA | |
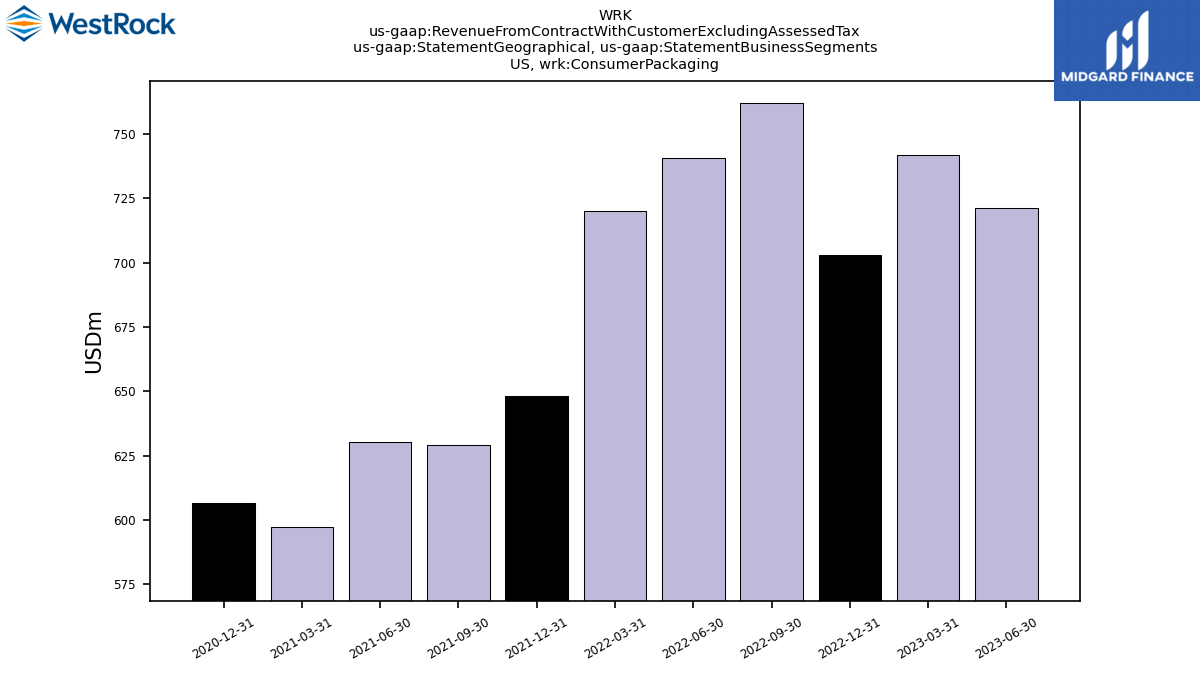
| US, Consumer Packaging | NA | NA | 721.40 | 741.70 | 703.00 | 762.10 | 740.50 | 720.00 | 648.30 | 629.30 | 630.30 | 597.50 | 606.60 | NA | NA | NA | NA | NA | NA | NA | NA | NA | NA | NA | NA | NA | NA | NA | NA | |
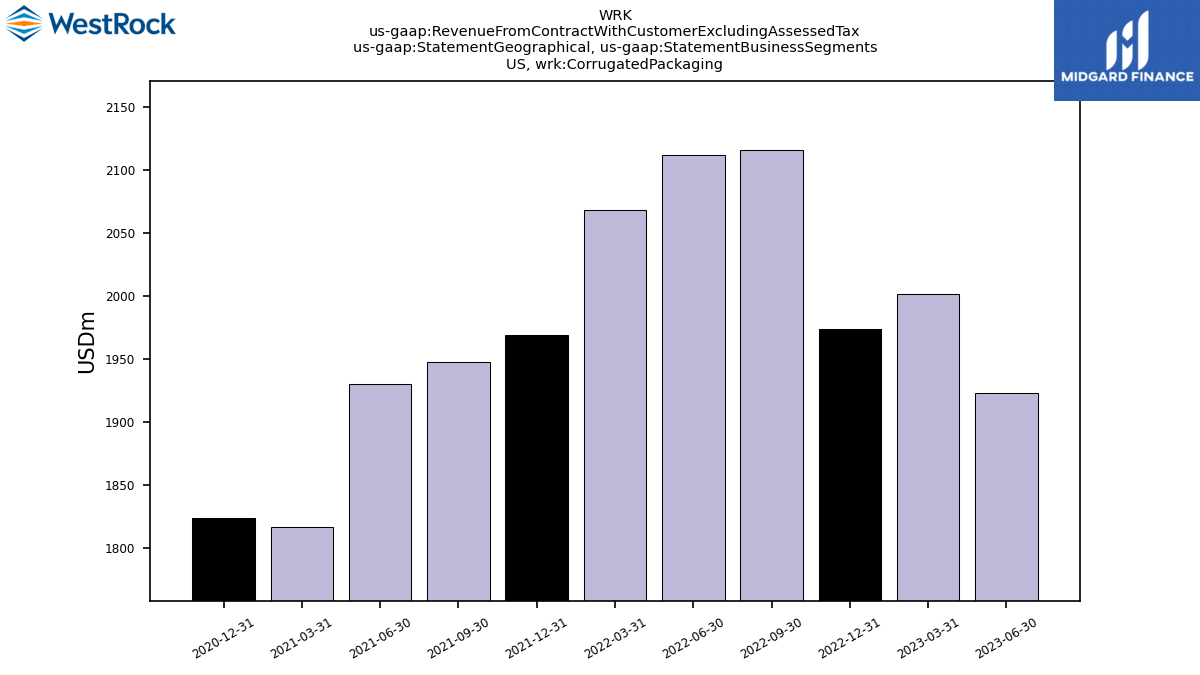
| US, Corrugated Packaging | NA | NA | 1923.10 | 2001.60 | 1973.50 | 2115.70 | 2111.90 | 2068.10 | 1969.00 | 1947.80 | 1930.40 | 1816.90 | 1823.70 | NA | NA | NA | NA | NA | NA | NA | NA | NA | NA | NA | NA | NA | NA | NA | NA | |
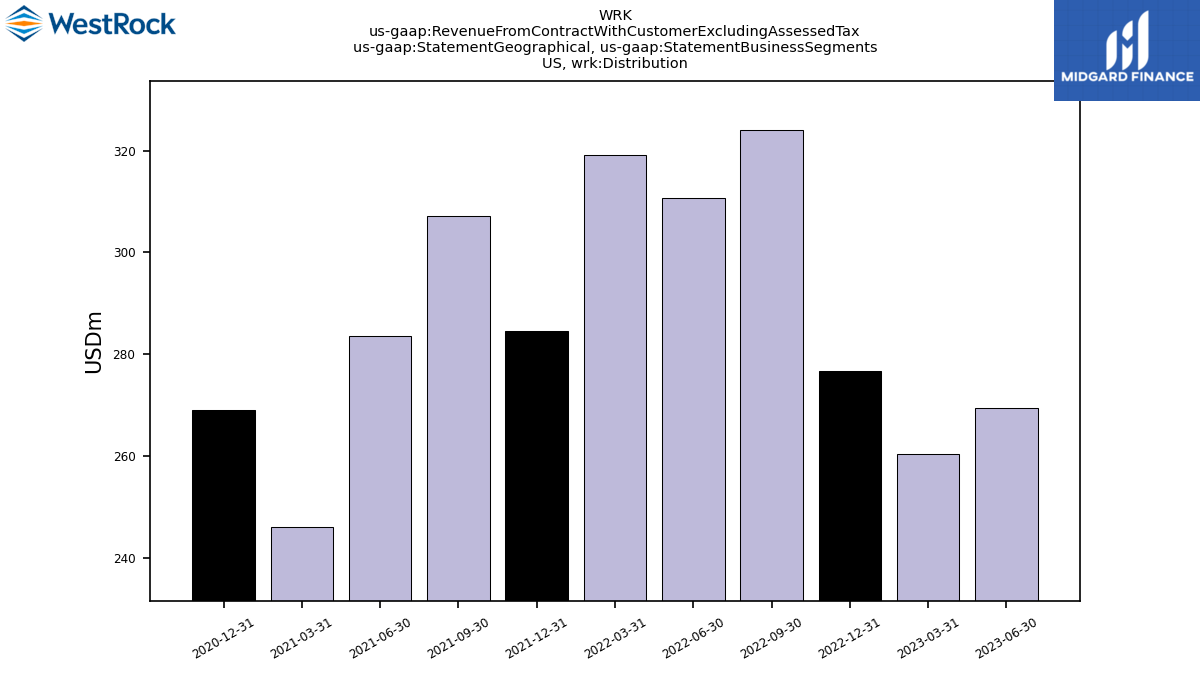
| US, Distribution | NA | NA | 269.40 | 260.30 | 276.70 | 324.00 | 310.60 | 319.10 | 284.60 | 307.20 | 283.60 | 246.10 | 269.00 | NA | NA | NA | NA | NA | NA | NA | NA | NA | NA | NA | NA | NA | NA | NA | NA | |
| US, Global Paper | NA | NA | 952.00 | 1056.30 | 1022.70 | 1302.60 | 1452.80 | 1376.30 | 1213.10 | 1332.30 | 1185.00 | NA | NA | NA | NA | NA | NA | NA | NA | NA | NA | NA | NA | NA | NA | NA | NA | NA | NA | |
| US, Paper | NA | NA | NA | NA | NA | NA | NA | 1376.30 | 1213.10 | NA | NA | 1022.00 | 1008.40 | NA | NA | NA | NA | NA | NA | NA | NA | NA | NA | NA | NA | NA | NA | NA | NA | |
| EMEA, Consumer Packaging | NA | NA | 314.10 | 304.50 | 259.90 | 280.00 | 270.80 | 277.00 | 252.10 | 285.90 | 269.50 | 249.80 | 233.00 | NA | NA | NA | NA | NA | NA | NA | NA | NA | NA | NA | NA | NA | NA | NA | NA | |
| EMEA, Corrugated Packaging | NA | NA | 1.40 | 2.80 | 1.30 | 1.40 | 3.00 | 0.30 | 3.00 | 1.60 | 1.50 | 1.10 | 0.90 | NA | NA | NA | NA | NA | NA | NA | NA | NA | NA | NA | NA | NA | NA | NA | NA | |
| EMEA, Global Paper | NA | NA | 12.30 | 11.40 | 11.10 | 12.10 | 17.60 | 17.60 | 15.90 | 14.40 | 16.00 | NA | NA | NA | NA | NA | NA | NA | NA | NA | NA | NA | NA | NA | NA | NA | NA | NA | NA | |
| EMEA, Paper | NA | NA | NA | NA | NA | NA | NA | 17.60 | 15.90 | NA | NA | 16.10 | 16.20 | NA | NA | NA | NA | NA | NA | NA | NA | NA | NA | NA | NA | NA | NA | NA | NA |


