
| 2024-02-03 | 2023-10-28 | 2023-07-29 | 2023-04-29 | 2023-01-28 | 2022-10-29 | 2022-07-30 | 2022-04-30 | 2022-01-29 | 2021-10-30 | 2021-07-31 | 2021-05-01 | 2021-01-30 | 2020-10-31 | 2020-08-01 | 2020-05-02 | 2020-02-01 | 2019-11-02 | 2019-08-03 | 2019-05-04 | 2019-02-02 | 2018-11-03 | 2018-08-04 | 2018-05-05 | 2018-02-03 | 2017-10-28 | 2017-07-29 | 2017-04-29 | 2017-01-28 | 2016-10-29 | 2016-07-30 | 2016-04-30 | 2016-01-30 | 2015-10-31 | 2015-08-01 | 2015-05-02 | 2015-01-31 | 2014-11-01 | 2014-08-02 | 2014-05-03 | 2014-02-01 | 2013-11-02 | 2013-08-03 | 2013-05-04 | 2013-02-02 | 2012-10-27 | 2012-07-28 | 2012-04-28 | 2012-01-28 | 2011-10-29 | 2011-07-30 | 2011-04-30 | 2011-01-29 | 2010-10-30 | 2010-07-31 | 2010-05-01 | 2010-01-30 | ||
|---|---|---|---|---|---|---|---|---|---|---|---|---|---|---|---|---|---|---|---|---|---|---|---|---|---|---|---|---|---|---|---|---|---|---|---|---|---|---|---|---|---|---|---|---|---|---|---|---|---|---|---|---|---|---|---|---|---|---|
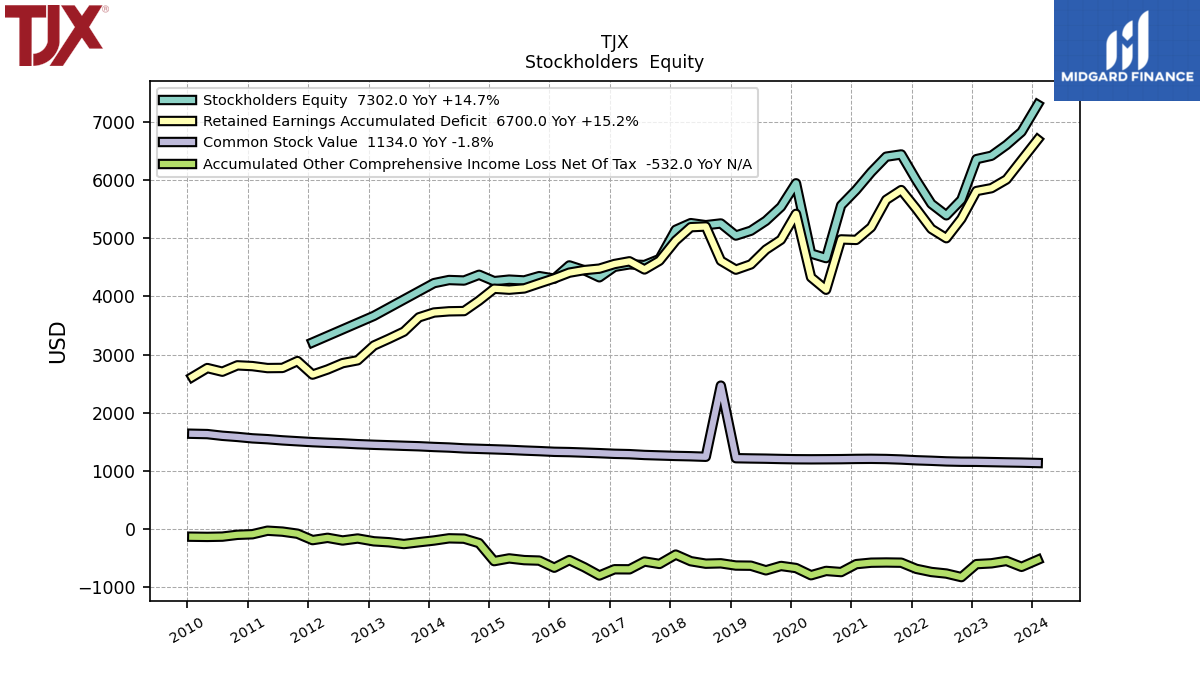
| Common Stock Value | 1134.00 | 1141.00 | 1145.00 | 1150.00 | 1155.00 | 1156.26 | 1161.89 | 1172.71 | 1181.19 | 1194.26 | 1202.98 | 1206.39 | 1204.70 | 1200.63 | 1199.06 | 1197.88 | 1199.10 | 1203.18 | 1208.93 | 1212.67 | 1217.18 | 2466.29 | 1241.53 | 1250.41 | 1256.02 | 1264.61 | 1272.55 | 1286.55 | 1292.64 | 1303.80 | 1313.29 | 1322.17 | 1326.99 | 1339.06 | 1348.74 | 1360.77 | 1369.47 | 1377.80 | 1385.88 | 1400.62 | 1410.03 | 1422.40 | 1430.47 | 1439.55 | 1447.80 | 1458.51 | 1472.20 | 1481.90 | 1493.40 | 1508.56 | 1523.92 | 1544.43 | 1558.63 | 1583.21 | 1602.64 | 1631.92 | 1637.54 |
| 2024-02-03 | 2023-10-28 | 2023-07-29 | 2023-04-29 | 2023-01-28 | 2022-10-29 | 2022-07-30 | 2022-04-30 | 2022-01-29 | 2021-10-30 | 2021-07-31 | 2021-05-01 | 2021-01-30 | 2020-10-31 | 2020-08-01 | 2020-05-02 | 2020-02-01 | 2019-11-02 | 2019-08-03 | 2019-05-04 | 2019-02-02 | 2018-11-03 | 2018-08-04 | 2018-05-05 | 2018-02-03 | 2017-10-28 | 2017-07-29 | 2017-04-29 | 2017-01-28 | 2016-10-29 | 2016-07-30 | 2016-04-30 | 2016-01-30 | 2015-10-31 | 2015-08-01 | 2015-05-02 | 2015-01-31 | 2014-11-01 | 2014-08-02 | 2014-05-03 | 2014-02-01 | 2013-11-02 | 2013-08-03 | 2013-05-04 | 2013-02-02 | 2012-10-27 | 2012-07-28 | 2012-04-28 | 2012-01-28 | 2011-10-29 | 2011-07-30 | 2011-04-30 | 2011-01-29 | 2010-10-30 | 2010-07-31 | 2010-05-01 | 2010-01-30 | ||
|---|---|---|---|---|---|---|---|---|---|---|---|---|---|---|---|---|---|---|---|---|---|---|---|---|---|---|---|---|---|---|---|---|---|---|---|---|---|---|---|---|---|---|---|---|---|---|---|---|---|---|---|---|---|---|---|---|---|---|
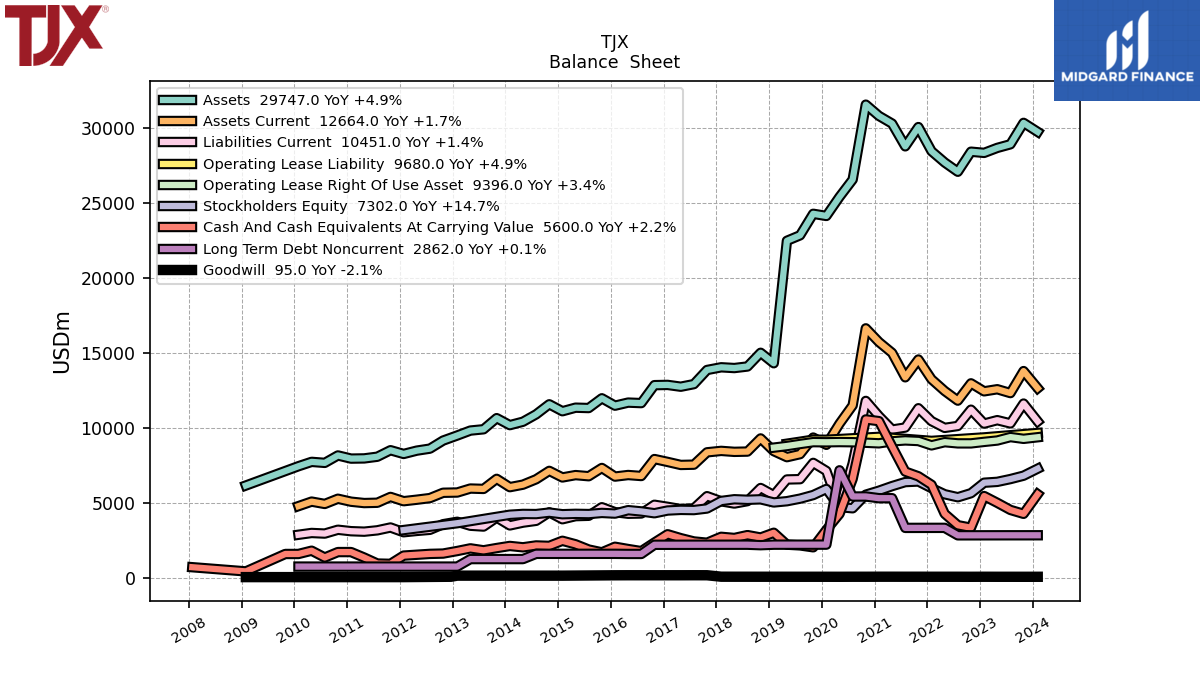
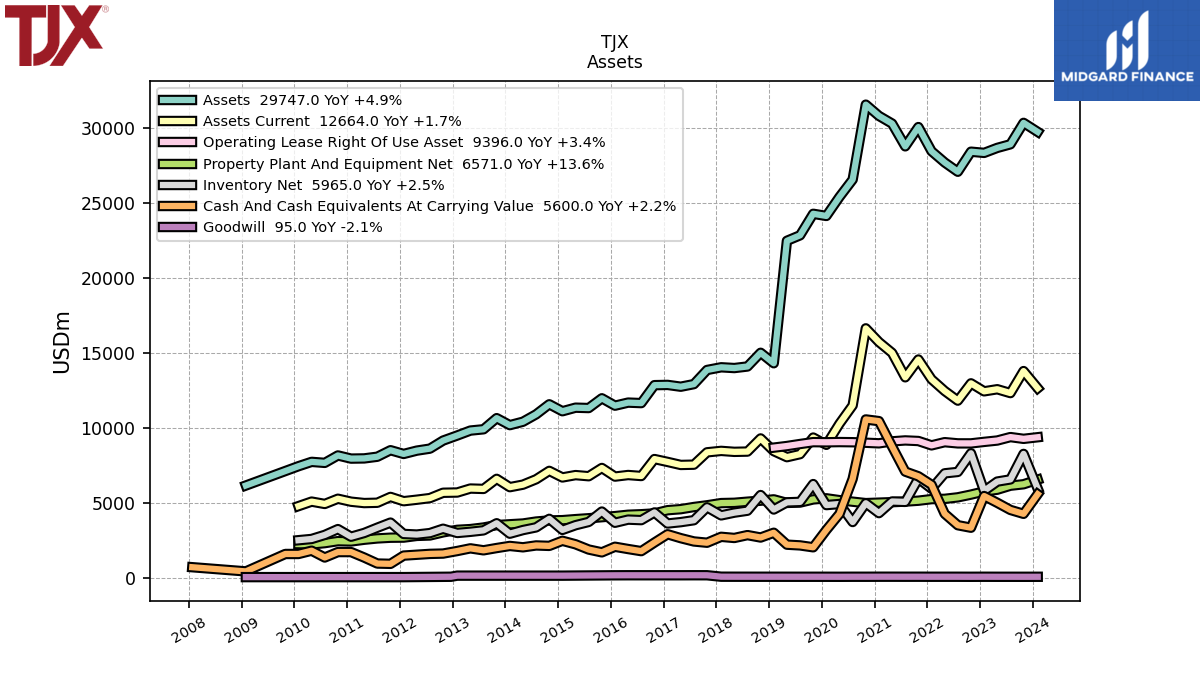
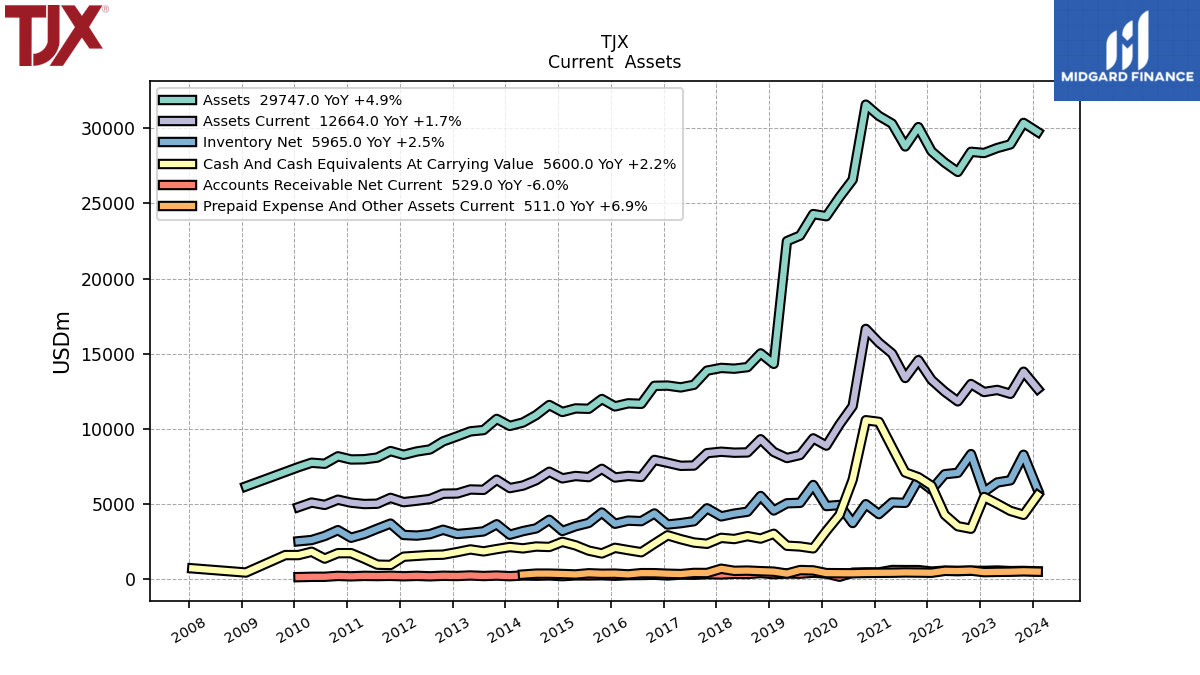
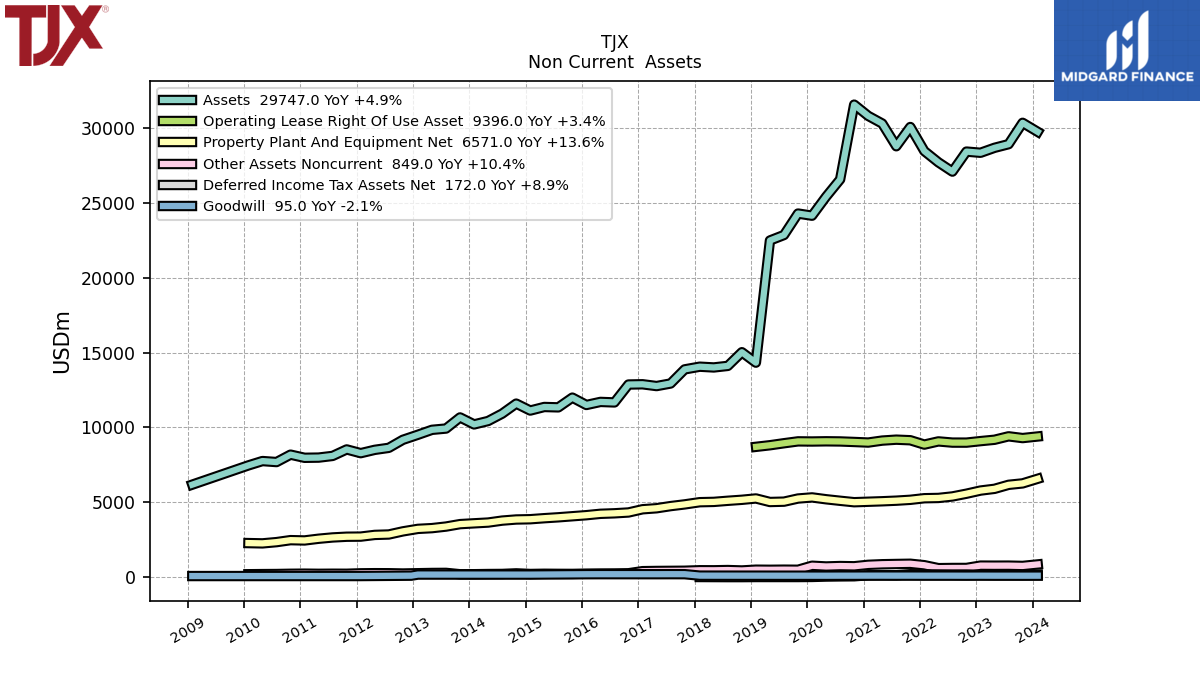
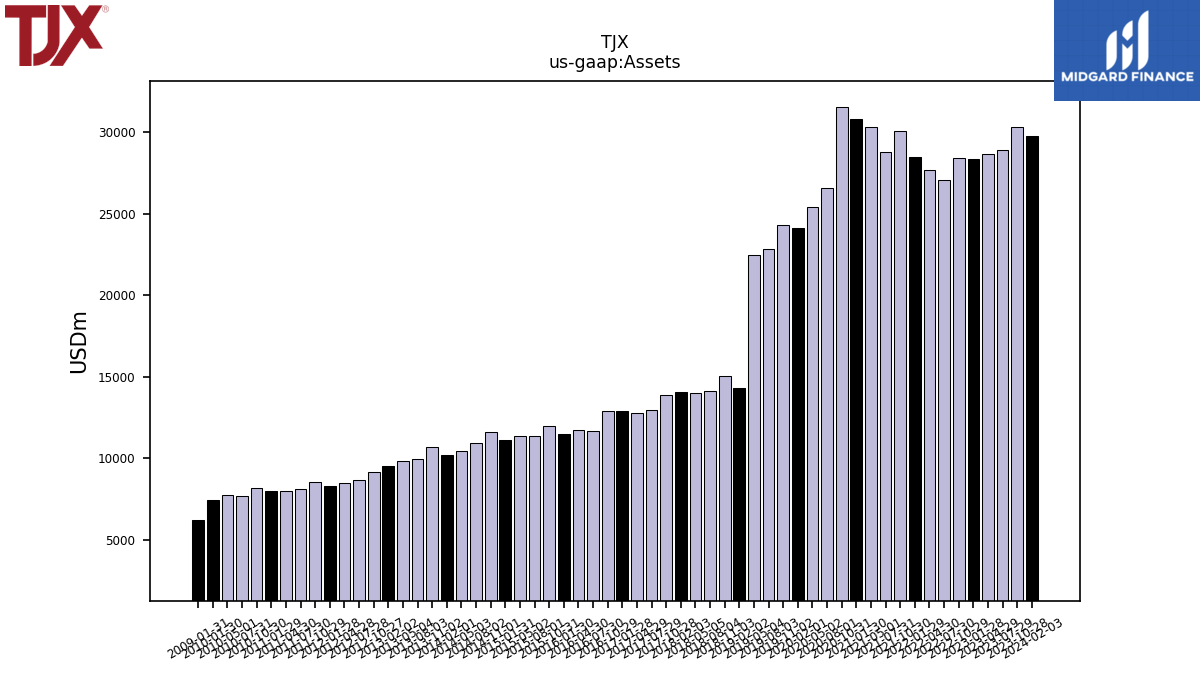
| Assets | 29747.00 | 30351.00 | 28922.00 | 28681.00 | 28349.00 | 28428.45 | 27090.61 | 27709.90 | 28461.46 | 30070.99 | 28783.45 | 30301.43 | 30813.56 | 31565.50 | 26568.40 | 25415.24 | 24145.00 | 24288.70 | 22854.98 | 22489.06 | 14326.03 | 15025.24 | 14111.43 | 14007.12 | 14058.01 | 13877.69 | 12935.61 | 12763.48 | 12883.81 | 12866.84 | 11670.65 | 11704.72 | 11499.48 | 11992.43 | 11341.04 | 11365.95 | 11128.38 | 11592.05 | 10922.00 | 10429.94 | 10201.02 | 10669.24 | 9926.04 | 9840.36 | 9511.85 | 9172.09 | 8636.64 | 8503.08 | 8281.60 | 8530.98 | 8097.13 | 7984.47 | 7971.76 | 8182.15 | 7686.71 | 7754.51 | 7463.98 | |
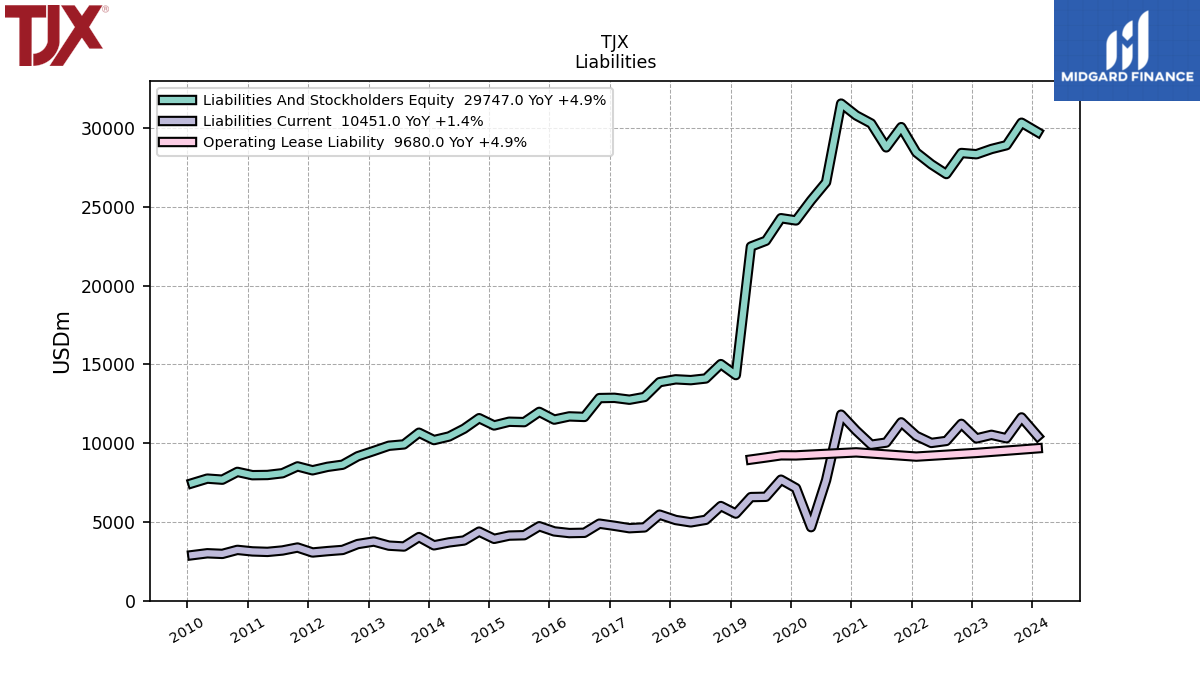
| Liabilities And Stockholders Equity | 29747.00 | 30351.00 | 28922.00 | 28681.00 | 28349.00 | 28428.45 | 27090.61 | 27709.90 | 28461.46 | 30070.99 | 28783.45 | 30301.43 | 30813.56 | 31565.50 | 26568.40 | 25415.24 | 24145.00 | 24288.70 | 22854.98 | 22489.06 | 14326.03 | 15025.24 | 14111.43 | 14007.12 | 14058.01 | 13877.69 | 12935.61 | 12763.48 | 12883.81 | 12866.84 | 11670.65 | 11704.72 | 11499.48 | 11992.43 | 11341.04 | 11365.95 | 11128.38 | 11592.05 | 10922.00 | 10429.94 | 10201.02 | 10669.24 | 9926.04 | 9840.36 | 9511.85 | 9172.09 | 8636.64 | 8503.08 | 8281.60 | 8530.98 | 8097.13 | 7984.47 | 7971.76 | 8182.15 | 7686.71 | 7754.51 | 7463.98 | |
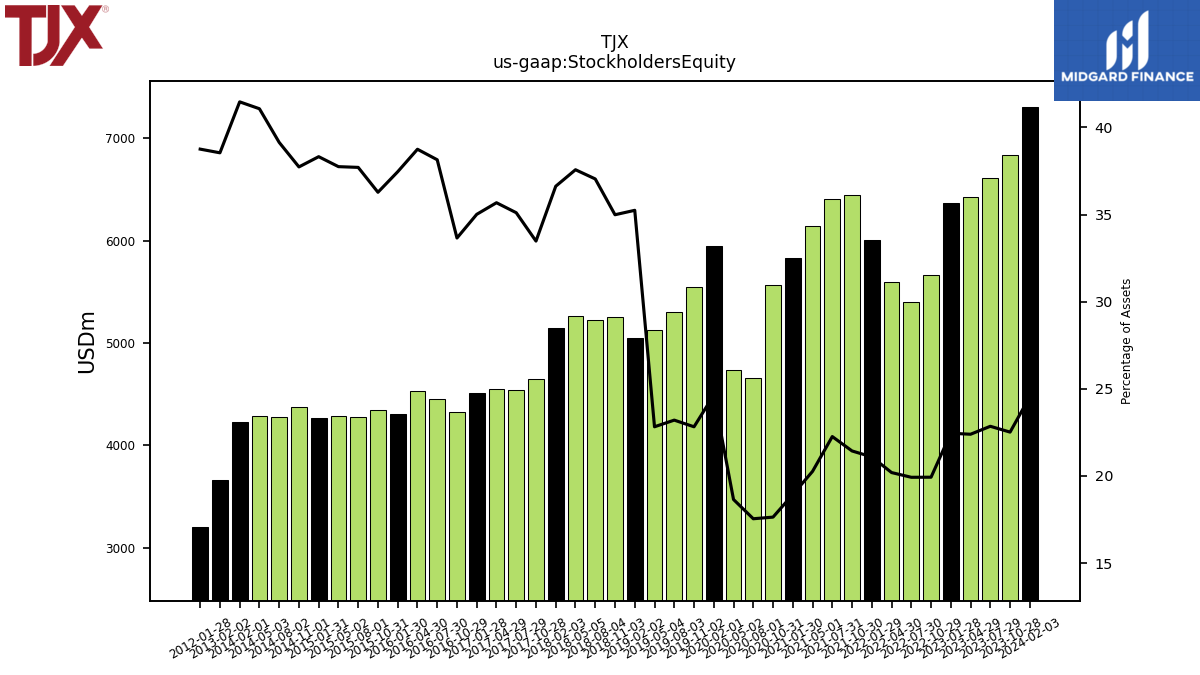
| Stockholders Equity | 7302.00 | 6833.00 | 6608.00 | 6422.00 | 6364.00 | 5664.68 | 5396.65 | 5595.44 | 6002.99 | 6444.77 | 6406.38 | 6139.21 | 5832.68 | 5566.76 | 4660.57 | 4739.22 | 5948.21 | 5542.53 | 5302.61 | 5131.90 | 5048.61 | 5256.87 | 5227.07 | 5262.41 | 5148.31 | 4645.61 | 4540.80 | 4553.52 | 4510.60 | 4329.81 | 4451.36 | 4534.97 | 4307.07 | 4350.46 | 4276.07 | 4290.29 | 4264.23 | 4373.81 | 4274.65 | 4283.49 | 4229.89 | NA | NA | NA | 3665.94 | NA | NA | NA | 3209.29 | NA | NA | NA | NA | NA | NA | NA | NA |
| 2024-02-03 | 2023-10-28 | 2023-07-29 | 2023-04-29 | 2023-01-28 | 2022-10-29 | 2022-07-30 | 2022-04-30 | 2022-01-29 | 2021-10-30 | 2021-07-31 | 2021-05-01 | 2021-01-30 | 2020-10-31 | 2020-08-01 | 2020-05-02 | 2020-02-01 | 2019-11-02 | 2019-08-03 | 2019-05-04 | 2019-02-02 | 2018-11-03 | 2018-08-04 | 2018-05-05 | 2018-02-03 | 2017-10-28 | 2017-07-29 | 2017-04-29 | 2017-01-28 | 2016-10-29 | 2016-07-30 | 2016-04-30 | 2016-01-30 | 2015-10-31 | 2015-08-01 | 2015-05-02 | 2015-01-31 | 2014-11-01 | 2014-08-02 | 2014-05-03 | 2014-02-01 | 2013-11-02 | 2013-08-03 | 2013-05-04 | 2013-02-02 | 2012-10-27 | 2012-07-28 | 2012-04-28 | 2012-01-28 | 2011-10-29 | 2011-07-30 | 2011-04-30 | 2011-01-29 | 2010-10-30 | 2010-07-31 | 2010-05-01 | 2010-01-30 | ||
|---|---|---|---|---|---|---|---|---|---|---|---|---|---|---|---|---|---|---|---|---|---|---|---|---|---|---|---|---|---|---|---|---|---|---|---|---|---|---|---|---|---|---|---|---|---|---|---|---|---|---|---|---|---|---|---|---|---|---|
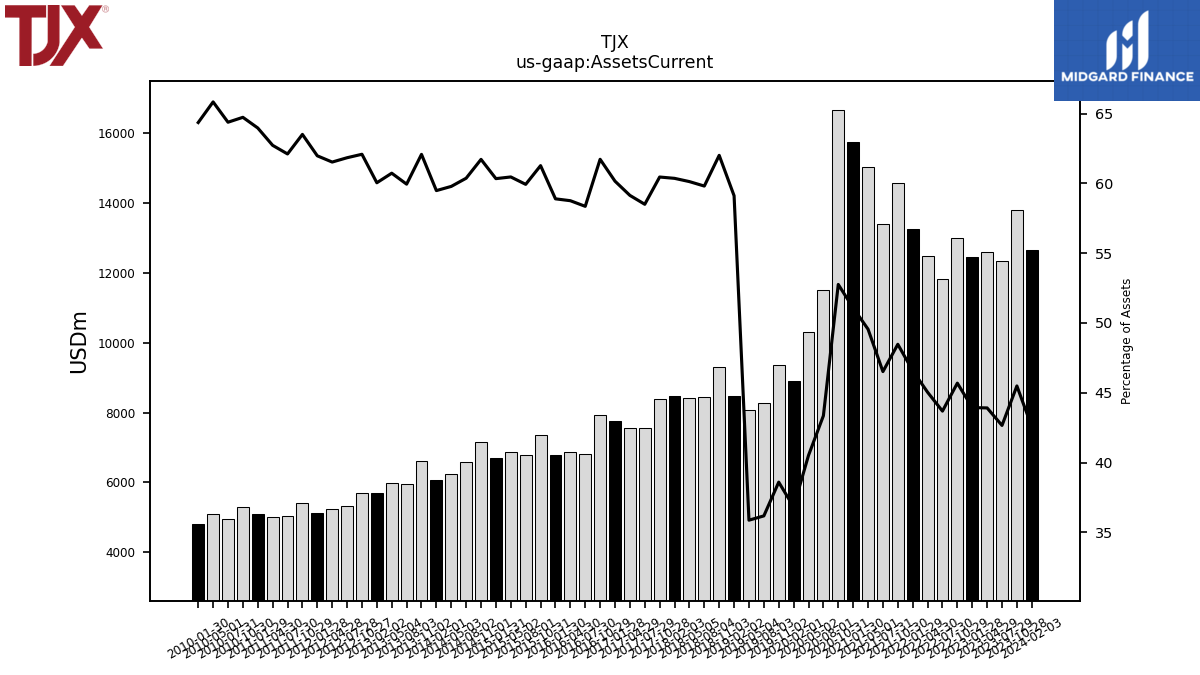
| Assets Current | 12664.00 | 13806.00 | 12338.00 | 12595.00 | 12456.00 | 12988.79 | 11834.76 | 12480.22 | 13258.60 | 14576.11 | 13389.03 | 15016.05 | 15739.34 | 16653.91 | 11517.95 | 10296.25 | 8890.62 | 9374.61 | 8268.60 | 8067.21 | 8469.22 | 9317.01 | 8439.97 | 8422.27 | 8485.73 | 8390.03 | 7567.78 | 7548.50 | 7750.77 | 7942.33 | 6810.67 | 6877.70 | 6772.56 | 7348.16 | 6796.84 | 6872.09 | 6715.06 | 7154.62 | 6593.76 | 6235.55 | 6068.00 | 6623.57 | 5950.24 | 5976.14 | 5711.54 | 5694.66 | 5340.79 | 5231.82 | 5132.63 | 5418.05 | 5029.07 | 5008.42 | 5099.53 | 5296.64 | 4948.92 | 5105.42 | 4803.86 | |
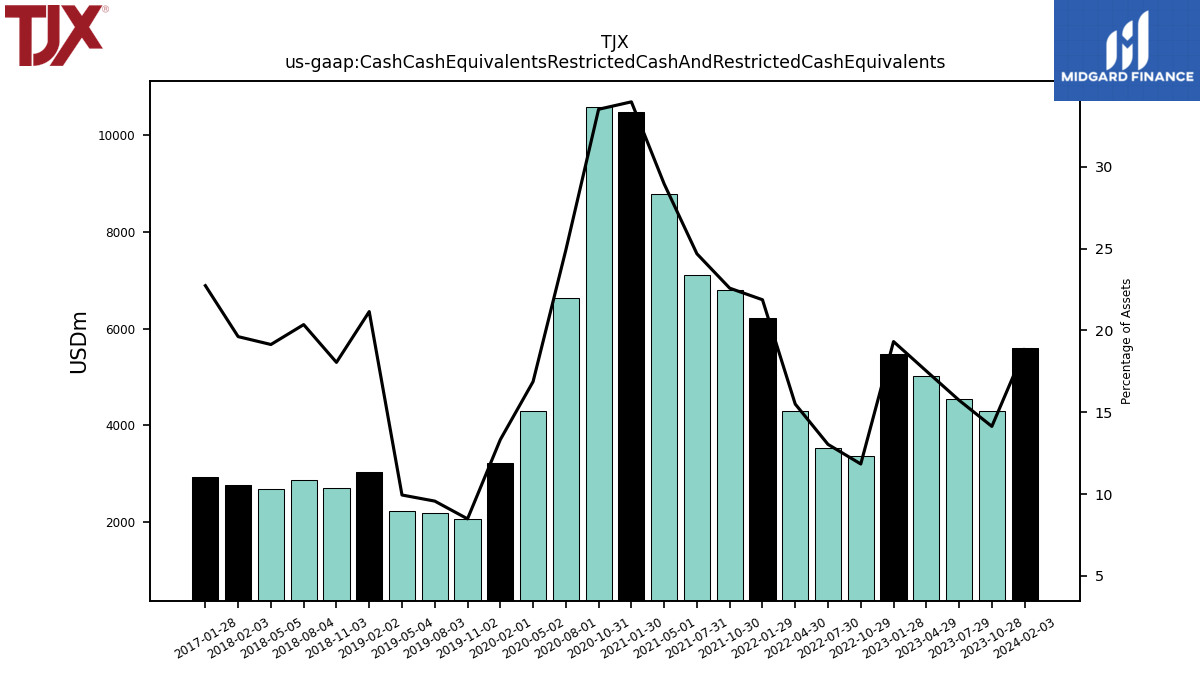
| Cash And Cash Equivalents At Carrying Value | 5600.00 | 4290.00 | 4550.00 | 5025.00 | 5477.00 | 3364.68 | 3531.21 | 4295.07 | 6226.77 | 6791.60 | 7106.02 | 8775.49 | 10469.57 | 10581.99 | 6620.41 | 4287.84 | 3216.75 | 2060.18 | 2186.38 | 2235.06 | 3030.23 | 2711.77 | 2872.72 | 2681.11 | 2758.48 | 2364.24 | 2449.30 | 2669.49 | 2929.85 | 2375.53 | 1803.65 | 1944.15 | 2095.47 | 1723.34 | 1910.77 | 2259.97 | 2493.78 | 2153.62 | 2183.33 | 2059.30 | 2149.75 | 2010.75 | 1858.80 | 1989.84 | 1811.96 | 1641.91 | 1620.40 | 1563.69 | 1507.11 | 956.93 | 977.76 | 1377.15 | 1741.75 | 1741.75 | 1380.17 | 1833.27 | 1614.61 | |
| Cash Cash Equivalents Restricted Cash And Restricted Cash Equivalents | 5600.00 | 4290.00 | 4550.00 | 5025.00 | 5477.00 | 3364.68 | 3531.21 | 4295.07 | 6226.77 | 6791.60 | 7106.02 | 8775.49 | 10469.57 | 10581.99 | 6620.41 | 4287.84 | 3216.75 | 2060.18 | 2186.38 | 2235.06 | 3030.23 | 2711.77 | 2872.72 | 2681.11 | 2758.48 | NA | NA | NA | 2929.85 | NA | NA | NA | NA | NA | NA | NA | NA | NA | NA | NA | NA | NA | NA | NA | NA | NA | NA | NA | NA | NA | NA | NA | NA | NA | NA | NA | NA | |
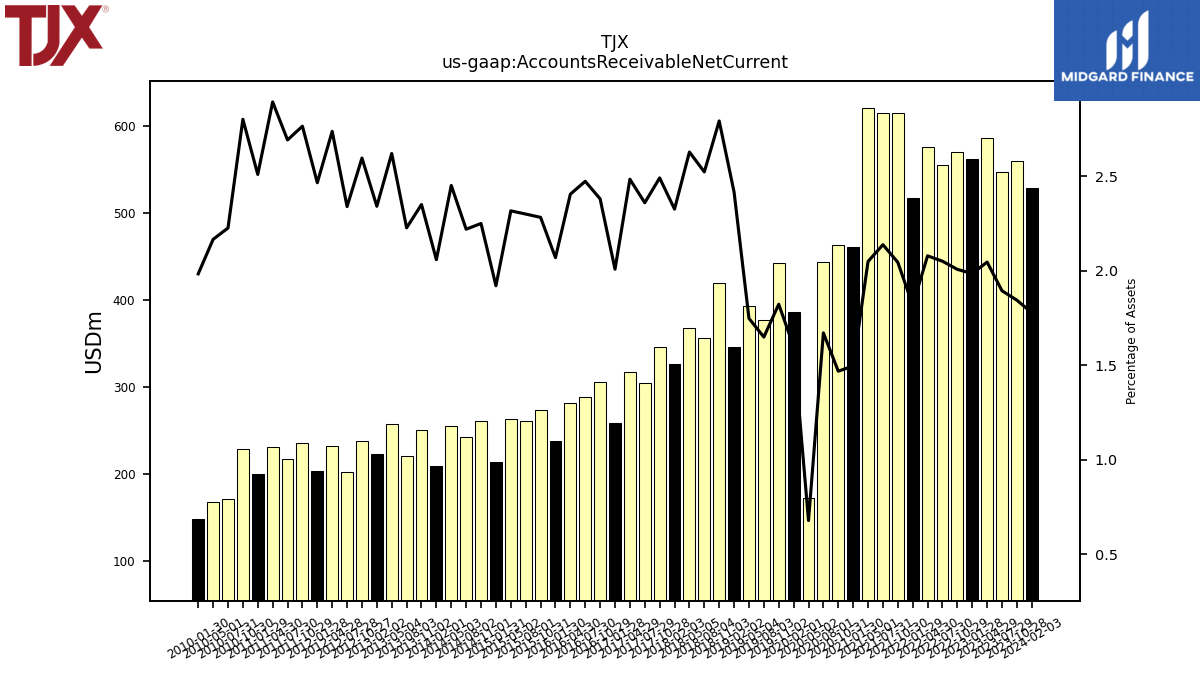
| Accounts Receivable Net Current | 529.00 | 560.00 | 548.00 | 587.00 | 563.00 | 570.87 | 555.69 | 576.30 | 517.62 | 615.12 | 615.63 | 621.18 | 461.14 | 463.73 | 444.23 | 172.46 | 386.26 | 442.88 | 377.06 | 393.28 | 346.30 | 419.79 | 356.18 | 368.31 | 327.17 | 345.87 | 305.40 | 317.22 | 258.83 | 306.43 | 288.78 | 281.63 | 238.07 | 273.86 | 260.95 | 263.47 | 213.82 | 260.94 | 242.55 | 255.78 | 210.09 | 250.89 | 221.16 | 257.99 | 222.79 | 238.25 | 202.14 | 232.88 | 204.30 | 235.97 | 218.08 | 231.12 | 200.15 | 229.32 | 171.20 | 168.04 | 148.13 | |
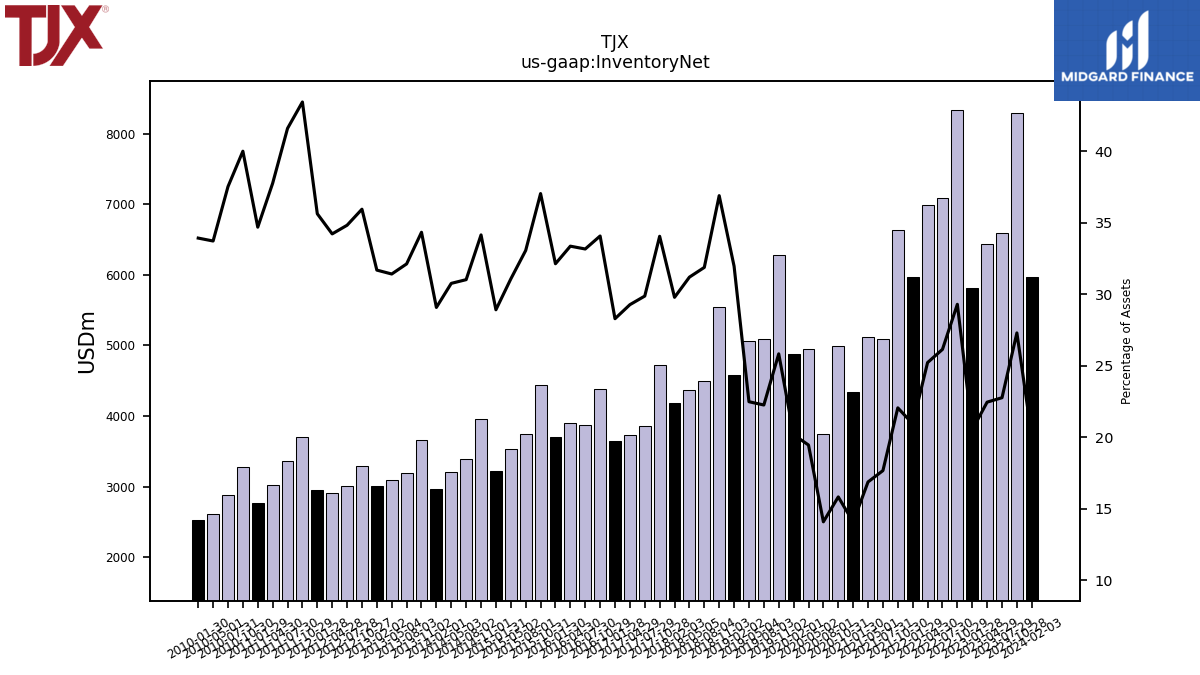
| Inventory Net | 5965.00 | 8285.00 | 6585.00 | 6441.00 | 5819.00 | 8328.68 | 7083.26 | 6989.79 | 5961.57 | 6633.33 | 5086.63 | 5114.64 | 4337.39 | 4997.51 | 3744.06 | 4945.72 | 4872.59 | 6274.78 | 5087.05 | 5057.20 | 4579.03 | 5543.41 | 4498.52 | 4369.89 | 4187.24 | 4725.85 | 3864.45 | 3736.11 | 3644.96 | 4384.17 | 3870.61 | 3904.99 | 3695.11 | 4441.99 | 3749.64 | 3531.60 | 3217.92 | 3958.65 | 3388.18 | 3208.46 | 2966.49 | 3663.17 | 3188.49 | 3091.47 | 3014.21 | 3297.12 | 3007.73 | 2909.80 | 2950.52 | 3706.02 | 3368.08 | 3014.81 | 2765.46 | 3272.96 | 2884.60 | 2615.08 | 2532.32 | |
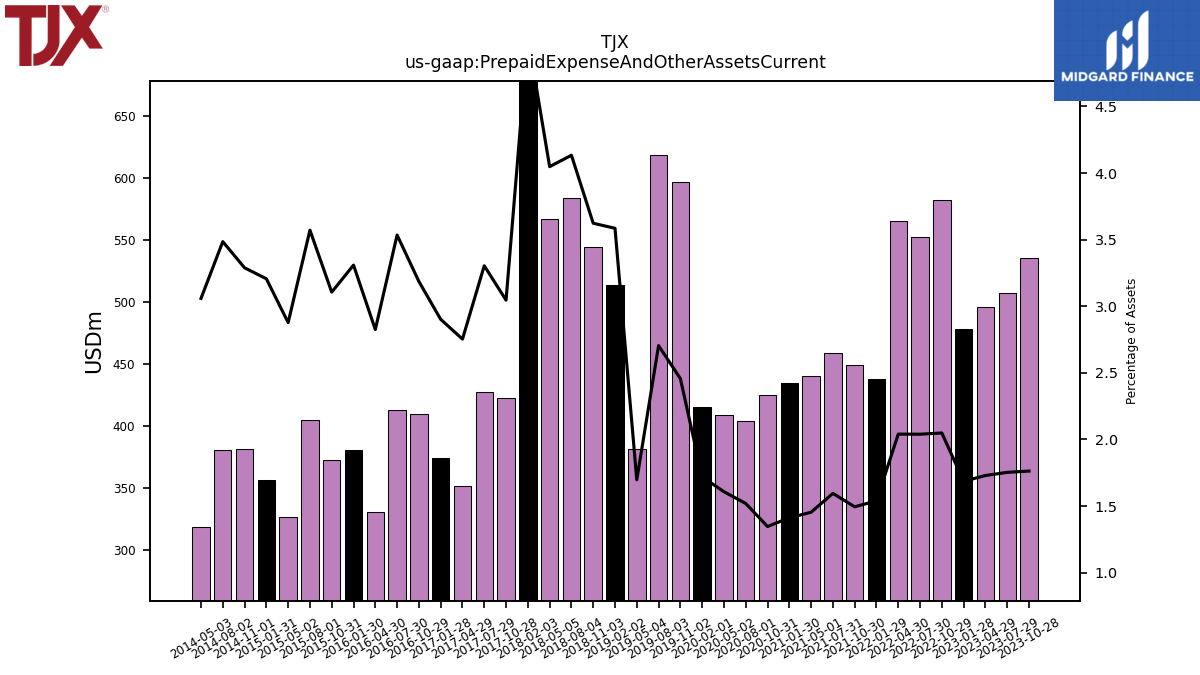
| Prepaid Expense And Other Assets Current | 511.00 | 535.00 | 507.00 | 496.00 | 478.00 | 582.39 | 552.48 | 565.35 | 438.10 | 449.38 | 459.05 | 440.53 | 434.98 | 425.03 | 403.62 | 408.59 | 415.02 | 596.78 | 618.12 | 381.68 | 513.66 | 544.43 | 583.35 | 567.06 | 706.68 | 422.72 | 427.43 | 351.44 | 373.89 | 409.99 | 412.53 | 330.71 | 380.53 | 372.51 | 405.03 | 327.06 | 356.82 | 381.24 | 380.67 | 319.02 | NA | NA | NA | NA | NA | NA | NA | NA | NA | NA | NA | NA | NA | NA | NA | NA | NA |
| 2024-02-03 | 2023-10-28 | 2023-07-29 | 2023-04-29 | 2023-01-28 | 2022-10-29 | 2022-07-30 | 2022-04-30 | 2022-01-29 | 2021-10-30 | 2021-07-31 | 2021-05-01 | 2021-01-30 | 2020-10-31 | 2020-08-01 | 2020-05-02 | 2020-02-01 | 2019-11-02 | 2019-08-03 | 2019-05-04 | 2019-02-02 | 2018-11-03 | 2018-08-04 | 2018-05-05 | 2018-02-03 | 2017-10-28 | 2017-07-29 | 2017-04-29 | 2017-01-28 | 2016-10-29 | 2016-07-30 | 2016-04-30 | 2016-01-30 | 2015-10-31 | 2015-08-01 | 2015-05-02 | 2015-01-31 | 2014-11-01 | 2014-08-02 | 2014-05-03 | 2014-02-01 | 2013-11-02 | 2013-08-03 | 2013-05-04 | 2013-02-02 | 2012-10-27 | 2012-07-28 | 2012-04-28 | 2012-01-28 | 2011-10-29 | 2011-07-30 | 2011-04-30 | 2011-01-29 | 2010-10-30 | 2010-07-31 | 2010-05-01 | 2010-01-30 | ||
|---|---|---|---|---|---|---|---|---|---|---|---|---|---|---|---|---|---|---|---|---|---|---|---|---|---|---|---|---|---|---|---|---|---|---|---|---|---|---|---|---|---|---|---|---|---|---|---|---|---|---|---|---|---|---|---|---|---|---|
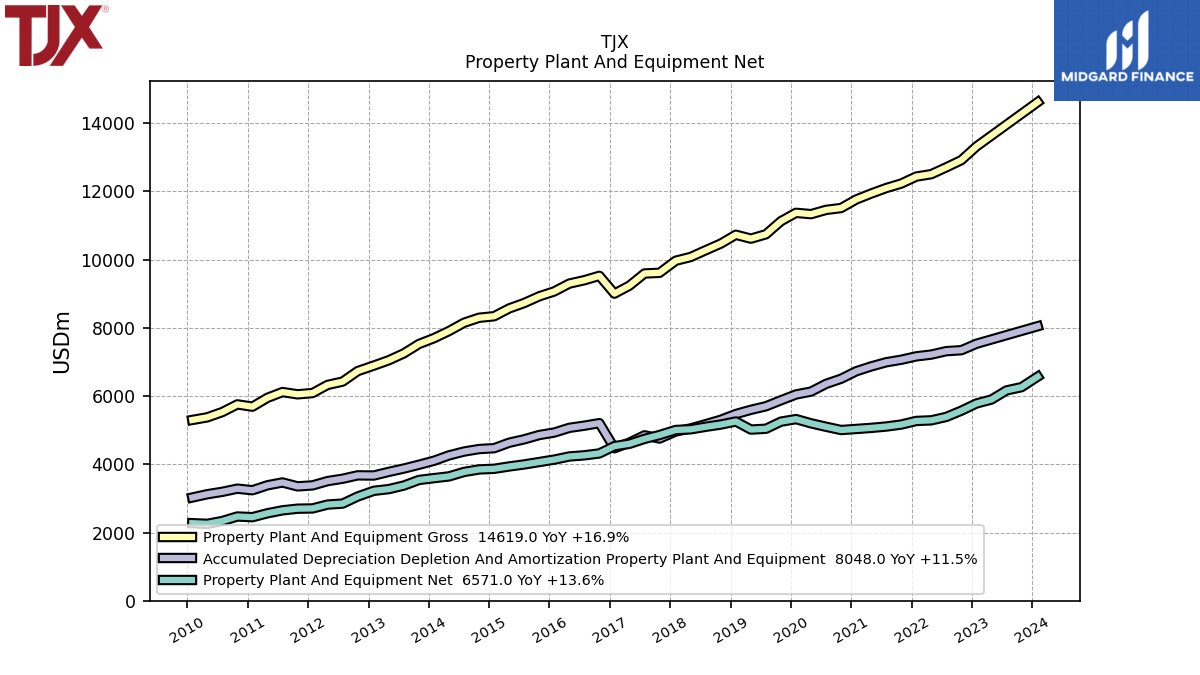
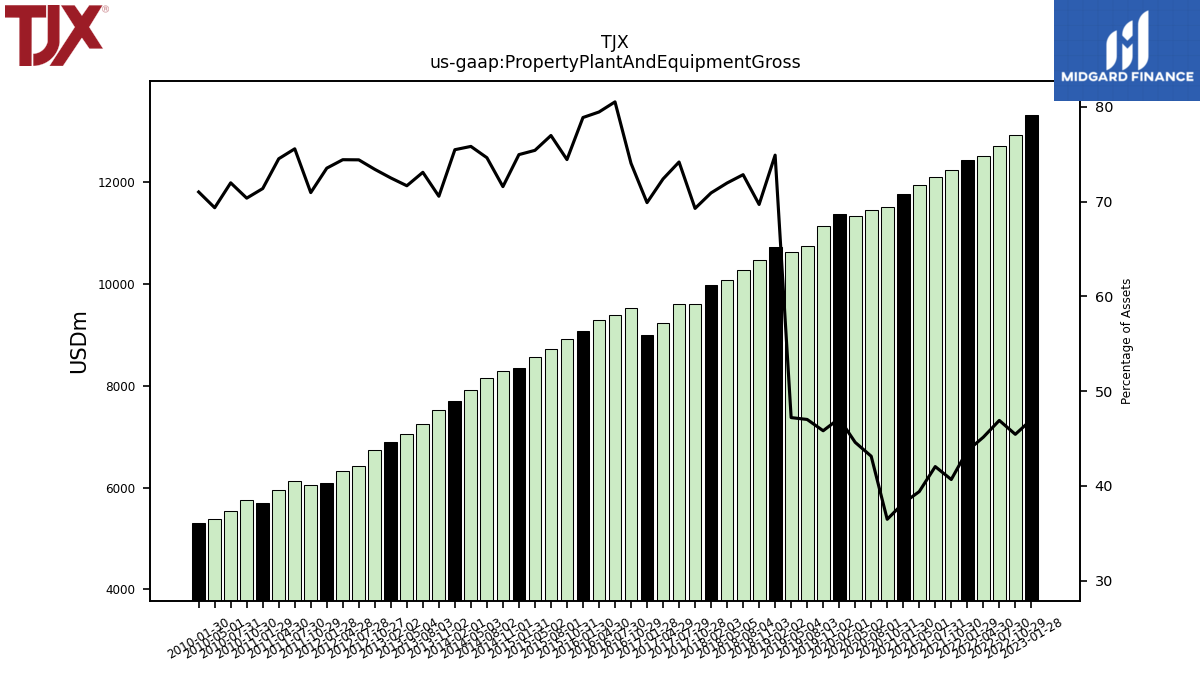
| Property Plant And Equipment Gross | 14619.00 | NA | NA | NA | 13317.00 | 12917.63 | 12707.37 | 12506.28 | 12435.63 | 12230.78 | 12098.98 | 11937.75 | 11762.83 | 11513.40 | 11458.47 | 11333.45 | 11372.28 | 11128.13 | 10743.41 | 10615.74 | 10729.12 | 10471.21 | 10277.50 | 10078.80 | 9968.31 | 9613.40 | 9594.32 | 9238.16 | 9003.40 | 9525.16 | 9396.32 | 9298.67 | 9068.67 | 8925.23 | 8728.57 | 8569.73 | 8340.54 | 8296.62 | 8150.12 | 7907.31 | 7698.25 | 7527.59 | 7254.02 | 7051.95 | 6894.76 | 6731.67 | 6425.33 | 6327.24 | 6088.56 | 6051.85 | 6118.19 | 5949.31 | 5689.23 | 5756.62 | 5532.24 | 5377.35 | 5299.92 | |
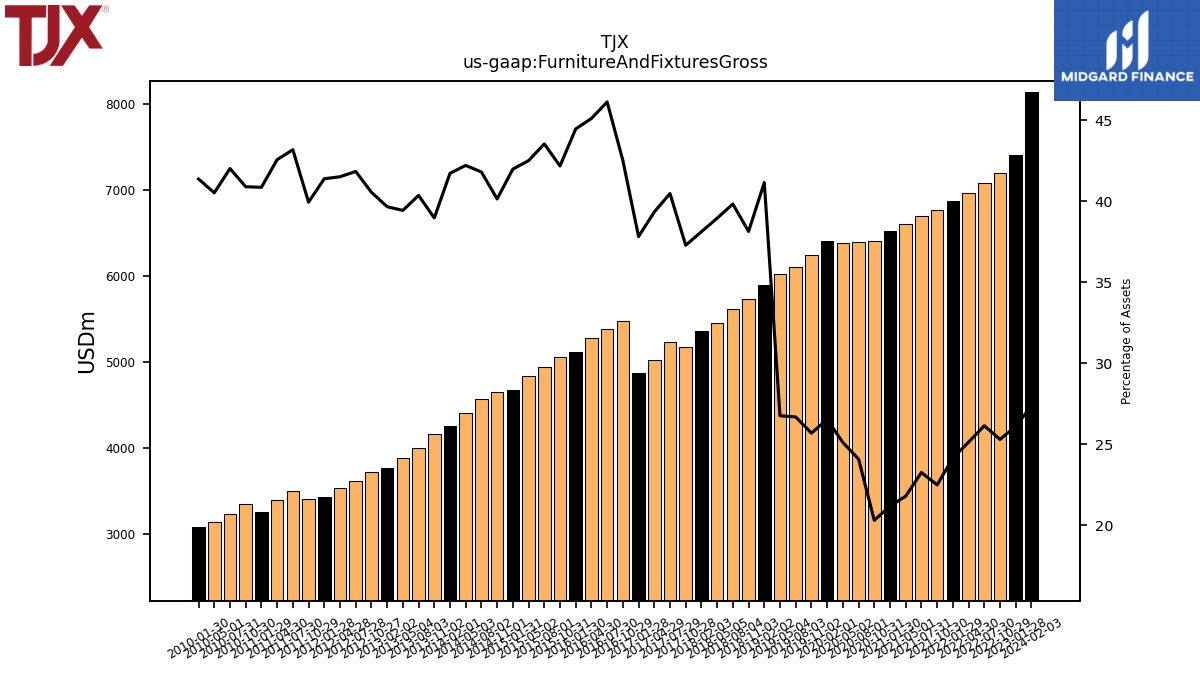
| Furniture And Fixtures Gross | 8134.00 | NA | NA | NA | 7400.00 | 7189.81 | 7080.32 | 6961.56 | 6871.78 | 6761.78 | 6692.12 | 6602.76 | 6525.61 | 6406.05 | 6397.23 | 6379.72 | 6404.64 | 6236.53 | 6096.88 | 6016.59 | 5894.24 | 5728.83 | 5619.20 | 5455.04 | 5357.70 | 5172.49 | 5234.35 | 5019.75 | 4871.76 | 5469.65 | 5382.65 | 5278.63 | 5112.23 | 5056.95 | 4936.61 | 4830.22 | 4671.03 | 4652.21 | 4564.88 | 4401.72 | 4255.21 | 4156.96 | 4005.10 | 3879.63 | 3772.00 | 3718.98 | 3612.55 | 3528.97 | 3426.97 | 3406.79 | 3495.35 | 3398.23 | 3256.45 | 3345.50 | 3229.12 | 3141.44 | 3087.42 | |
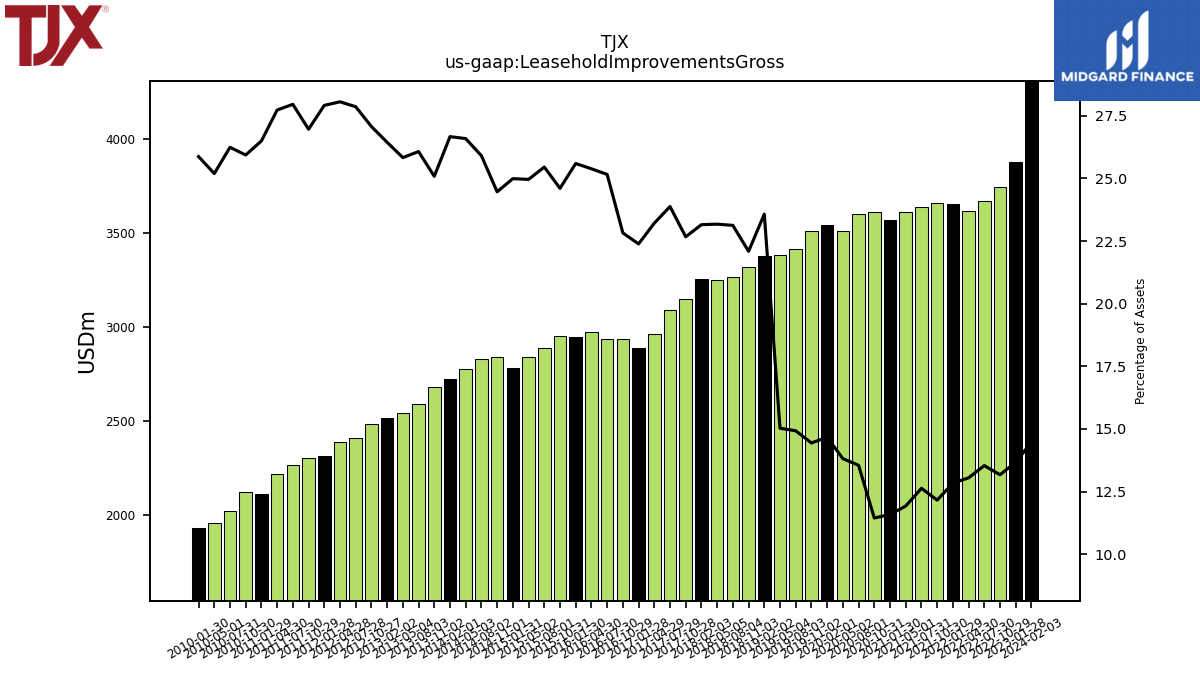
| Leasehold Improvements Gross | 4306.00 | NA | NA | NA | 3874.00 | 3743.92 | 3666.57 | 3615.20 | 3652.28 | 3655.74 | 3634.96 | 3611.94 | 3568.83 | 3611.90 | 3599.36 | 3510.39 | 3541.41 | 3506.78 | 3410.86 | 3379.54 | 3377.05 | 3318.86 | 3263.27 | 3245.90 | 3254.83 | 3145.92 | 3088.78 | 2962.70 | 2884.05 | 2936.78 | 2936.11 | 2971.10 | 2943.19 | 2950.64 | 2886.57 | 2837.02 | 2780.93 | 2836.06 | 2829.34 | 2773.14 | 2720.39 | 2676.28 | 2587.99 | 2541.76 | 2515.00 | 2482.84 | 2406.26 | 2385.74 | 2311.81 | 2300.19 | 2263.63 | 2214.03 | 2112.15 | 2121.96 | 2017.06 | 1953.61 | 1930.98 | |
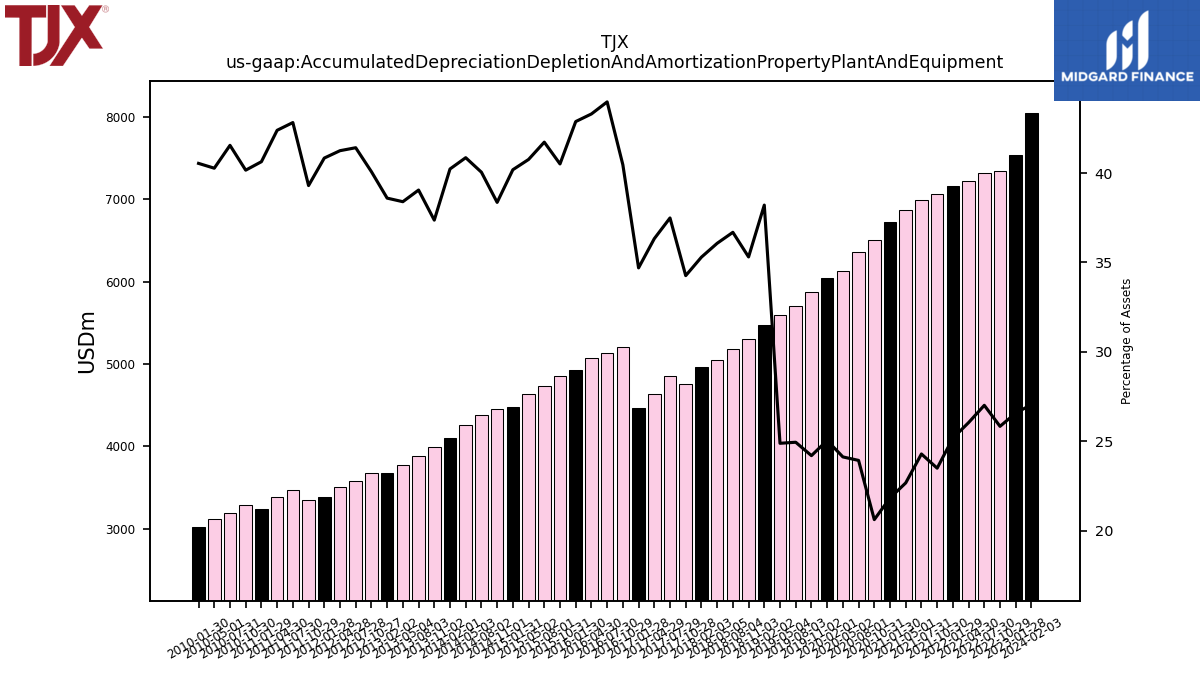
| Accumulated Depreciation Depletion And Amortization Property Plant And Equipment | 8048.00 | NA | NA | NA | 7534.00 | 7344.91 | 7317.64 | 7217.12 | 7164.80 | 7065.53 | 6991.64 | 6869.93 | 6726.73 | 6508.63 | 6358.06 | 6131.76 | 6047.23 | 5877.16 | 5701.53 | 5597.14 | 5473.91 | 5305.34 | 5177.04 | 5052.70 | 4962.26 | 4755.12 | 4849.63 | 4637.12 | 4470.51 | 5206.33 | 5132.94 | 5068.96 | 4931.09 | 4858.24 | 4732.59 | 4632.99 | 4472.18 | 4446.82 | 4374.08 | 4261.74 | 4103.74 | 3987.06 | 3876.18 | 3778.63 | 3671.51 | 3676.00 | 3577.14 | 3507.71 | 3382.18 | 3352.88 | 3467.62 | 3384.84 | 3239.43 | 3286.19 | 3193.96 | 3122.97 | 3026.04 | |
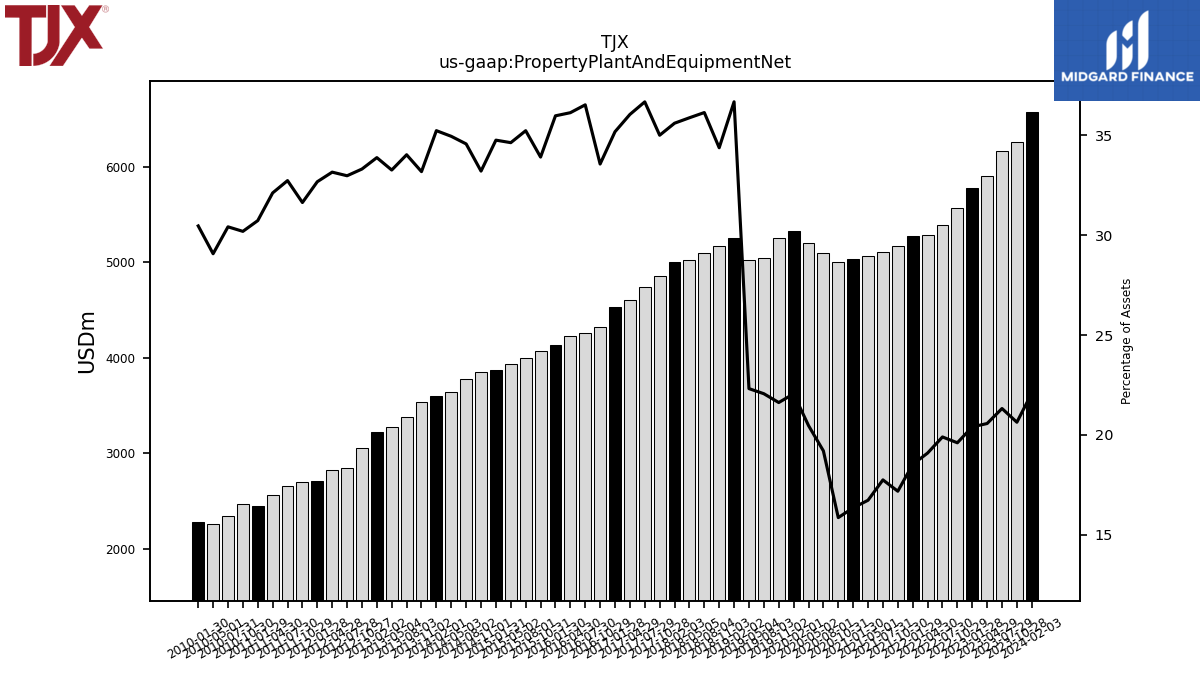
| Property Plant And Equipment Net | 6571.00 | 6262.00 | 6166.00 | 5899.00 | 5783.00 | 5572.72 | 5389.73 | 5289.16 | 5270.83 | 5165.25 | 5107.35 | 5067.82 | 5036.10 | 5004.77 | 5100.41 | 5201.70 | 5325.05 | 5250.97 | 5041.88 | 5018.60 | 5255.21 | 5165.88 | 5100.45 | 5026.09 | 5006.05 | 4858.28 | 4744.69 | 4601.04 | 4532.89 | 4318.83 | 4263.38 | 4229.70 | 4137.57 | 4066.99 | 3995.98 | 3936.73 | 3868.36 | 3849.80 | 3776.04 | 3645.57 | 3594.50 | 3540.53 | 3377.84 | 3273.32 | 3223.24 | 3055.67 | 2848.20 | 2819.54 | 2706.38 | 2698.98 | 2650.57 | 2564.47 | 2449.80 | 2470.43 | 2338.28 | 2254.38 | 2273.88 | |
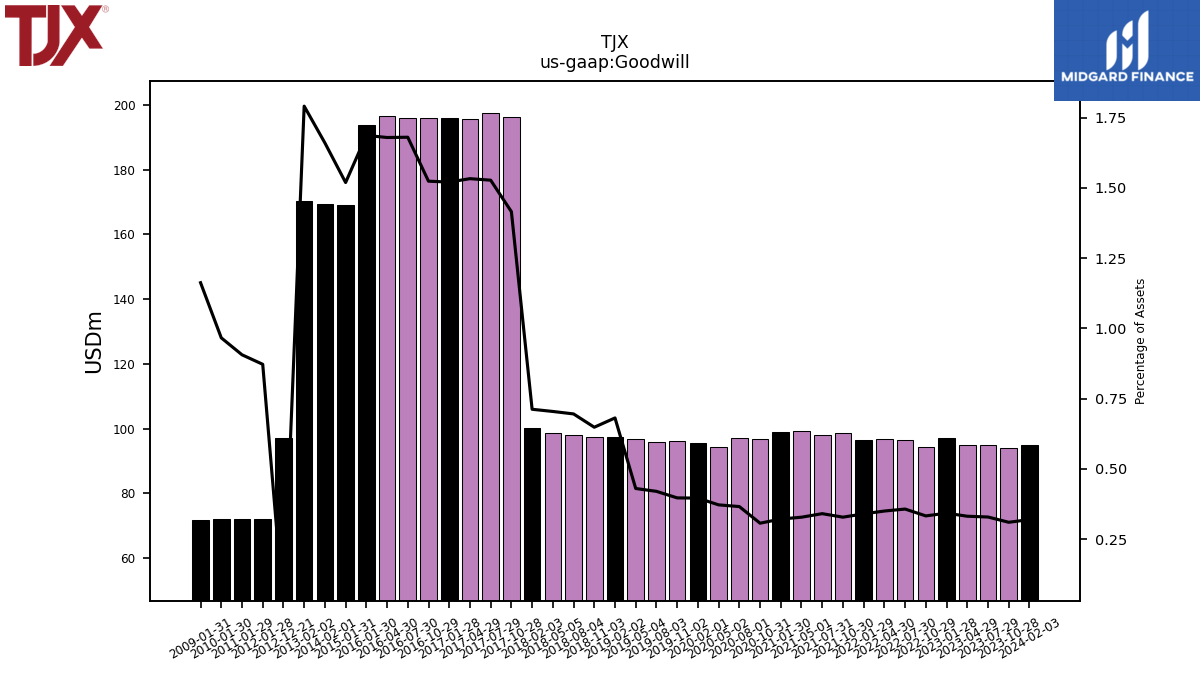
| Goodwill | 95.00 | 94.00 | 95.00 | 95.00 | 97.00 | 94.50 | 96.65 | 96.91 | 96.66 | 98.60 | 97.97 | 99.32 | 99.00 | 96.73 | 97.13 | 94.47 | 95.55 | 96.31 | 95.94 | 96.69 | 97.55 | 97.35 | 98.11 | 98.61 | 100.07 | 196.37 | 197.52 | 195.59 | 195.87 | 196.01 | 196.05 | 196.51 | 193.91 | NA | NA | NA | 169.00 | NA | NA | NA | 169.30 | NA | NA | NA | 170.30 | NA | NA | NA | 72.20 | NA | NA | NA | 72.20 | NA | NA | NA | 72.10 | |
| Other Assets Noncurrent | 849.00 | 748.00 | 768.00 | 765.00 | 769.00 | 613.28 | 611.05 | 599.32 | 796.47 | 893.61 | 878.36 | 860.84 | 821.93 | 725.26 | 740.46 | 712.19 | 761.32 | 492.18 | 498.62 | 490.40 | 497.58 | 445.01 | 472.89 | 456.96 | 459.61 | 426.36 | 419.12 | 412.00 | 398.08 | 258.22 | 244.89 | 240.76 | 231.72 | 215.33 | 218.24 | 224.82 | 210.54 | 251.08 | 213.05 | 207.14 | 194.33 | 191.67 | 283.85 | 277.95 | 260.80 | 241.81 | 260.09 | 263.55 | 253.91 | 224.69 | 227.58 | 221.09 | 231.52 | 223.64 | 207.53 | 202.16 | 193.23 |
| 2024-02-03 | 2023-10-28 | 2023-07-29 | 2023-04-29 | 2023-01-28 | 2022-10-29 | 2022-07-30 | 2022-04-30 | 2022-01-29 | 2021-10-30 | 2021-07-31 | 2021-05-01 | 2021-01-30 | 2020-10-31 | 2020-08-01 | 2020-05-02 | 2020-02-01 | 2019-11-02 | 2019-08-03 | 2019-05-04 | 2019-02-02 | 2018-11-03 | 2018-08-04 | 2018-05-05 | 2018-02-03 | 2017-10-28 | 2017-07-29 | 2017-04-29 | 2017-01-28 | 2016-10-29 | 2016-07-30 | 2016-04-30 | 2016-01-30 | 2015-10-31 | 2015-08-01 | 2015-05-02 | 2015-01-31 | 2014-11-01 | 2014-08-02 | 2014-05-03 | 2014-02-01 | 2013-11-02 | 2013-08-03 | 2013-05-04 | 2013-02-02 | 2012-10-27 | 2012-07-28 | 2012-04-28 | 2012-01-28 | 2011-10-29 | 2011-07-30 | 2011-04-30 | 2011-01-29 | 2010-10-30 | 2010-07-31 | 2010-05-01 | 2010-01-30 | ||
|---|---|---|---|---|---|---|---|---|---|---|---|---|---|---|---|---|---|---|---|---|---|---|---|---|---|---|---|---|---|---|---|---|---|---|---|---|---|---|---|---|---|---|---|---|---|---|---|---|---|---|---|---|---|---|---|---|---|---|
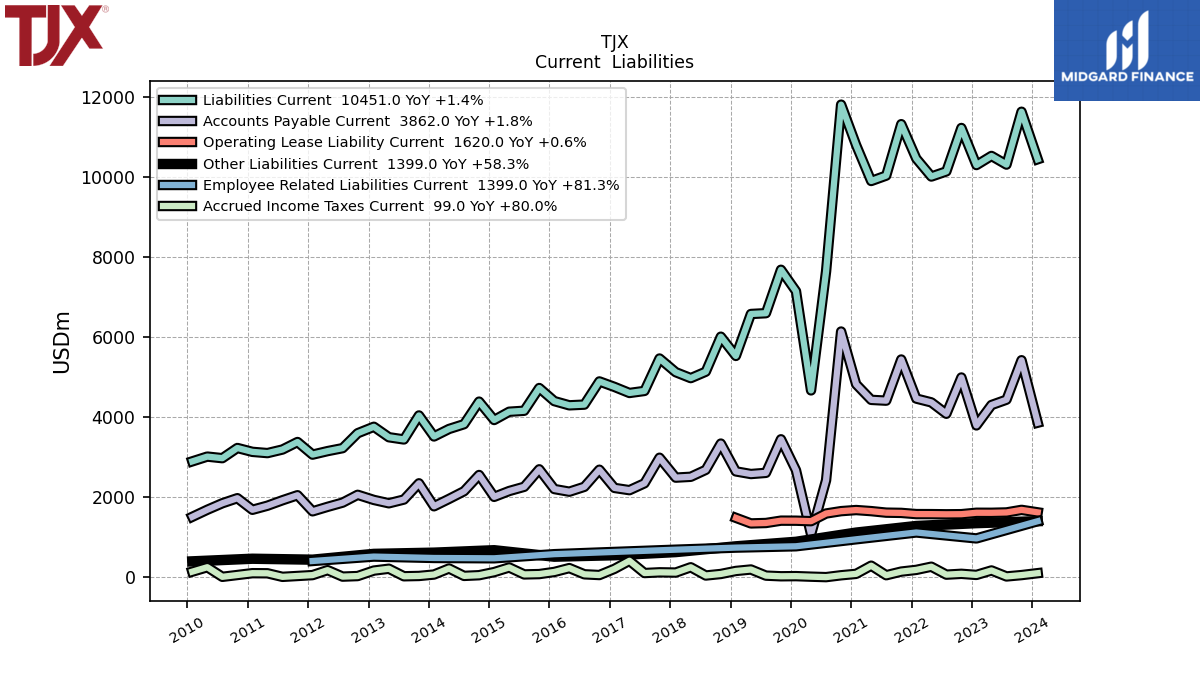
| Liabilities Current | 10451.00 | 11640.00 | 10317.00 | 10534.00 | 10305.00 | 11233.63 | 10147.12 | 10018.52 | 10468.14 | 11328.73 | 10042.06 | 9906.96 | 10803.67 | 11817.19 | 7647.25 | 4669.55 | 7150.25 | 7687.14 | 6600.74 | 6581.02 | 5531.37 | 6013.82 | 5137.82 | 4976.86 | 5125.54 | 5467.98 | 4656.53 | 4605.39 | 4757.66 | 4894.51 | 4314.20 | 4296.73 | 4402.23 | 4730.08 | 4160.86 | 4136.54 | 3929.63 | 4389.58 | 3824.93 | 3705.26 | 3517.84 | 4043.74 | 3442.88 | 3498.62 | 3760.60 | 3598.99 | 3225.49 | 3151.72 | 3063.42 | 3379.50 | 3191.34 | 3101.86 | 3133.12 | 3229.95 | 2974.62 | 3014.64 | 2894.99 | |
| Accounts Payable Current | 3862.00 | 5425.00 | 4438.00 | 4304.00 | 3794.00 | 4993.27 | 4085.48 | 4370.56 | 4465.43 | 5443.01 | 4413.32 | 4433.30 | 4823.40 | 6142.55 | 2422.14 | 1071.19 | 2672.56 | 3447.44 | 2607.65 | 2578.37 | 2644.14 | 3340.60 | 2683.28 | 2509.09 | 2488.37 | 2986.37 | 2346.55 | 2174.73 | 2230.90 | 2686.84 | 2258.25 | 2136.75 | 2203.05 | 2696.60 | 2259.00 | 2153.30 | 2007.51 | 2554.42 | 2148.43 | 1956.38 | 1771.29 | 2346.37 | 1940.24 | 1846.57 | 1930.57 | 2059.20 | 1863.11 | 1757.87 | 1645.32 | 2048.36 | 1922.31 | 1786.42 | 1683.93 | 1974.27 | 1847.55 | 1684.96 | 1507.89 | |
| Accrued Income Taxes Current | 99.00 | 51.00 | 17.00 | 167.00 | 55.00 | 82.78 | 61.88 | 260.79 | 181.16 | 138.59 | 47.17 | 286.45 | 81.52 | 46.43 | 0.00 | 11.18 | 24.70 | 21.21 | 37.52 | 190.82 | 154.16 | 78.67 | 40.35 | 246.93 | 114.20 | 120.19 | 101.97 | 408.94 | 206.29 | 52.08 | 70.70 | 226.25 | 129.52 | 76.09 | 67.71 | 241.81 | 126.00 | 47.94 | 30.52 | 216.28 | 64.72 | 28.97 | 21.43 | 209.97 | 163.81 | 26.75 | 12.76 | 175.16 | 50.42 | NA | 6.91 | 96.09 | 98.51 | NA | 7.42 | 247.79 | 136.74 | |
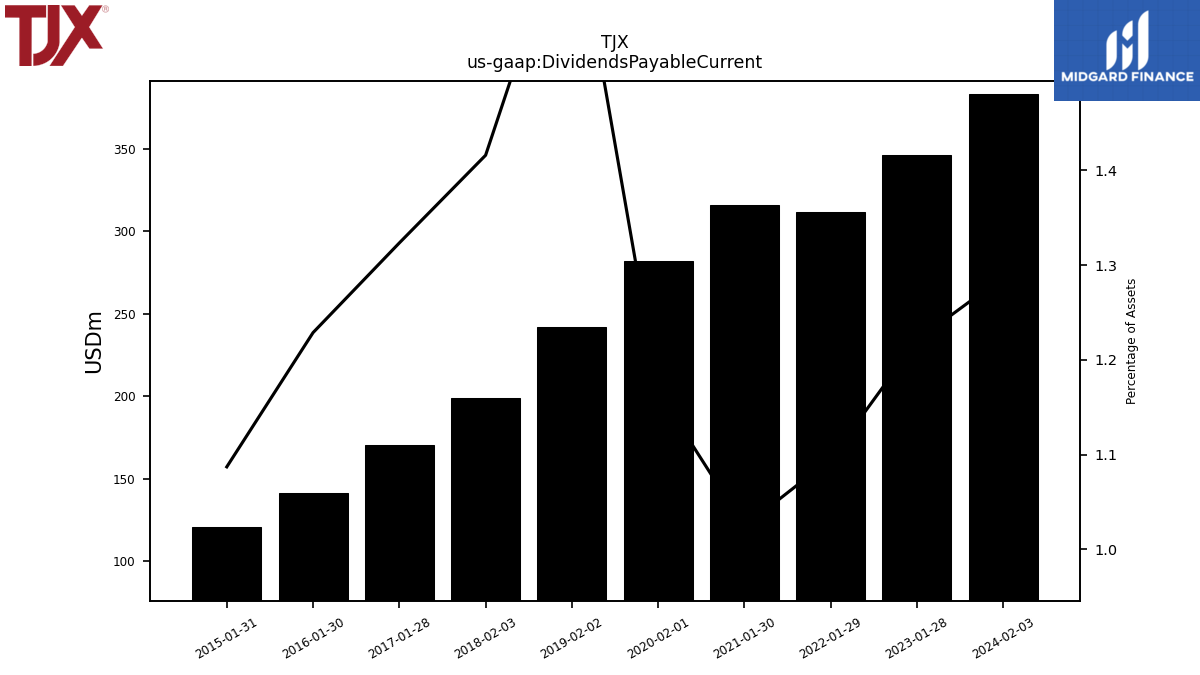
| Dividends Payable Current | 383.00 | NA | NA | NA | 346.00 | NA | NA | NA | 311.81 | NA | NA | NA | 315.60 | NA | NA | NA | 281.70 | NA | NA | NA | 241.97 | NA | NA | NA | 199.03 | NA | NA | NA | 170.49 | NA | NA | NA | 141.29 | NA | NA | NA | 120.98 | NA | NA | NA | NA | NA | NA | NA | NA | NA | NA | NA | NA | NA | NA | NA | NA | NA | NA | NA | NA | |
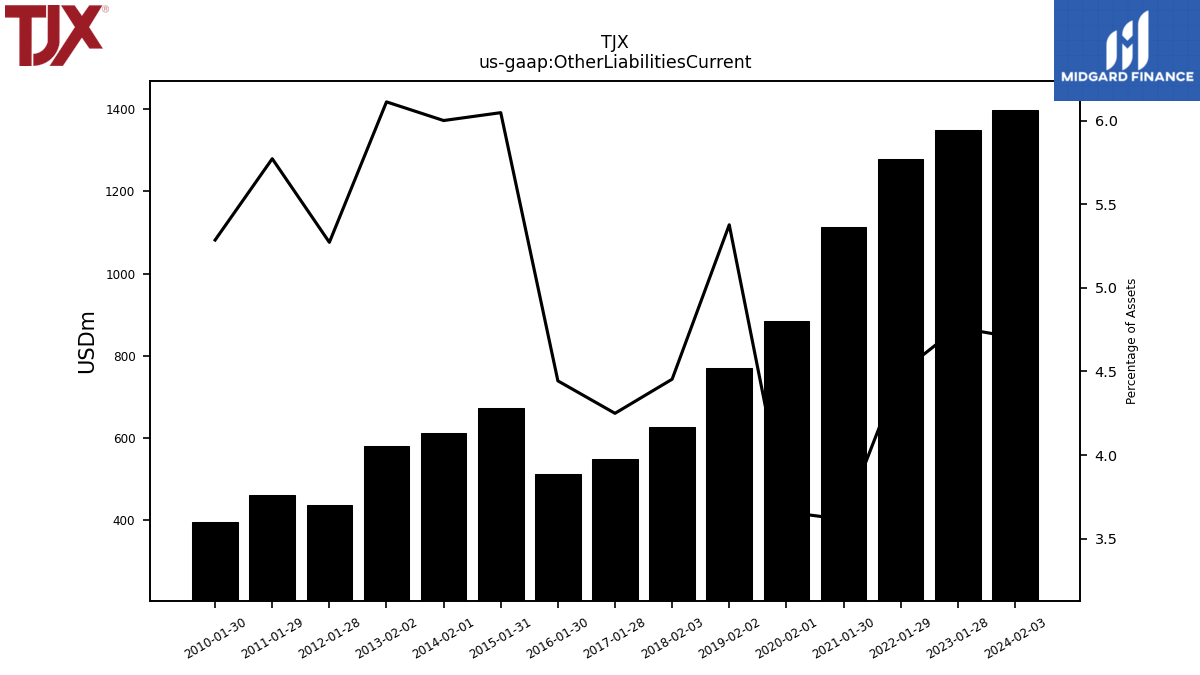
| Other Liabilities Current | 1399.00 | NA | NA | NA | 1350.00 | NA | NA | NA | 1278.88 | NA | NA | NA | 1114.07 | NA | NA | NA | 883.68 | NA | NA | NA | 770.27 | NA | NA | NA | 626.09 | NA | NA | NA | 547.52 | NA | NA | NA | 511.01 | NA | NA | NA | 672.94 | NA | NA | NA | 612.06 | NA | NA | NA | 581.32 | NA | NA | NA | 436.60 | NA | NA | NA | 460.11 | NA | NA | NA | 394.52 |
| 2024-02-03 | 2023-10-28 | 2023-07-29 | 2023-04-29 | 2023-01-28 | 2022-10-29 | 2022-07-30 | 2022-04-30 | 2022-01-29 | 2021-10-30 | 2021-07-31 | 2021-05-01 | 2021-01-30 | 2020-10-31 | 2020-08-01 | 2020-05-02 | 2020-02-01 | 2019-11-02 | 2019-08-03 | 2019-05-04 | 2019-02-02 | 2018-11-03 | 2018-08-04 | 2018-05-05 | 2018-02-03 | 2017-10-28 | 2017-07-29 | 2017-04-29 | 2017-01-28 | 2016-10-29 | 2016-07-30 | 2016-04-30 | 2016-01-30 | 2015-10-31 | 2015-08-01 | 2015-05-02 | 2015-01-31 | 2014-11-01 | 2014-08-02 | 2014-05-03 | 2014-02-01 | 2013-11-02 | 2013-08-03 | 2013-05-04 | 2013-02-02 | 2012-10-27 | 2012-07-28 | 2012-04-28 | 2012-01-28 | 2011-10-29 | 2011-07-30 | 2011-04-30 | 2011-01-29 | 2010-10-30 | 2010-07-31 | 2010-05-01 | 2010-01-30 | ||
|---|---|---|---|---|---|---|---|---|---|---|---|---|---|---|---|---|---|---|---|---|---|---|---|---|---|---|---|---|---|---|---|---|---|---|---|---|---|---|---|---|---|---|---|---|---|---|---|---|---|---|---|---|---|---|---|---|---|---|
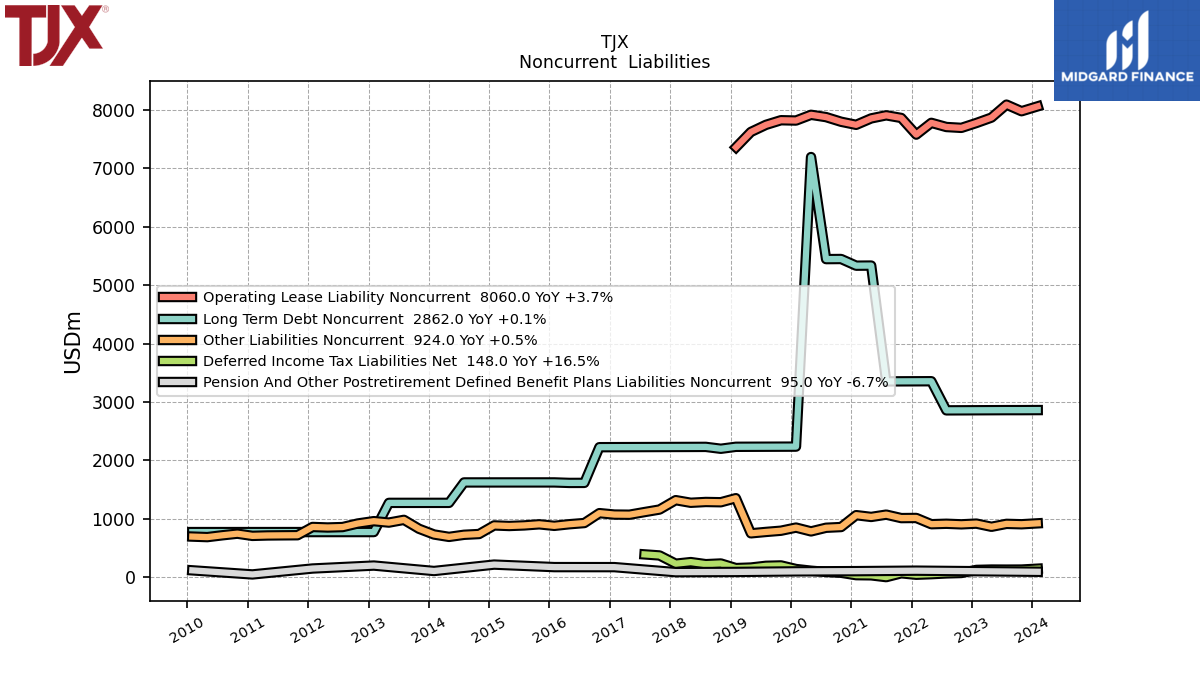
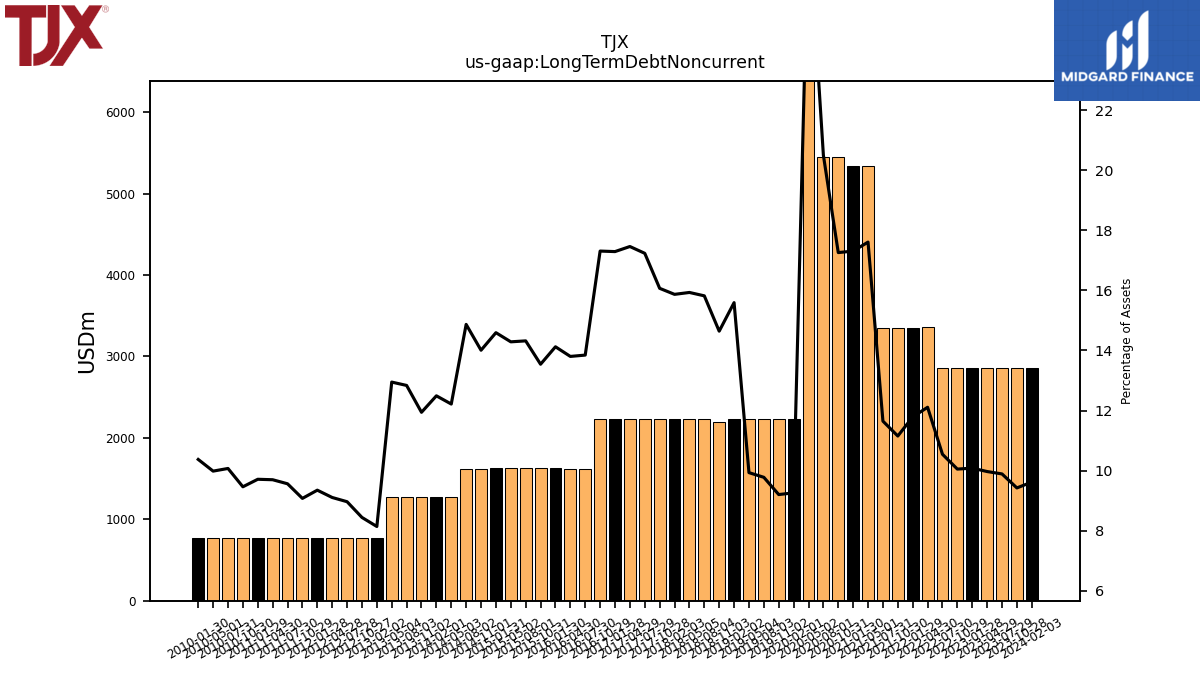
| Long Term Debt Noncurrent | 2862.00 | 2861.00 | 2861.00 | 2860.00 | 2859.00 | 2858.00 | 2857.14 | 3355.82 | 3354.84 | 3353.87 | 3352.89 | 5334.86 | 5332.92 | 5447.21 | 5445.32 | 7192.41 | 2236.62 | 2235.87 | 2235.12 | 2234.37 | 2233.62 | 2200.00 | 2232.11 | 2231.36 | 2230.61 | 2229.86 | 2229.10 | 2228.35 | 2227.60 | 2226.91 | 1615.95 | 1615.48 | 1624.05 | 1624.01 | 1623.96 | 1623.91 | 1623.86 | 1623.82 | 1623.77 | 1274.24 | 1274.22 | 1274.19 | 1274.16 | 1274.13 | 774.55 | 774.53 | 774.51 | 774.50 | 774.48 | 774.46 | 774.44 | 774.42 | 774.40 | 774.38 | 774.36 | 774.34 | 774.33 | |
| Deferred Income Tax Liabilities Net | 148.00 | 133.00 | 132.00 | 133.00 | 127.00 | 74.18 | 67.03 | 54.06 | 44.17 | 69.05 | 3.45 | 33.93 | 37.16 | 78.01 | 91.77 | 113.23 | 142.17 | 203.51 | 196.99 | 167.28 | 158.19 | 236.77 | 225.07 | 260.65 | 233.06 | 374.28 | 392.65 | NA | NA | NA | NA | NA | NA | NA | NA | NA | NA | NA | NA | NA | NA | NA | NA | NA | NA | NA | NA | NA | NA | NA | NA | NA | NA | NA | NA | NA | NA | |
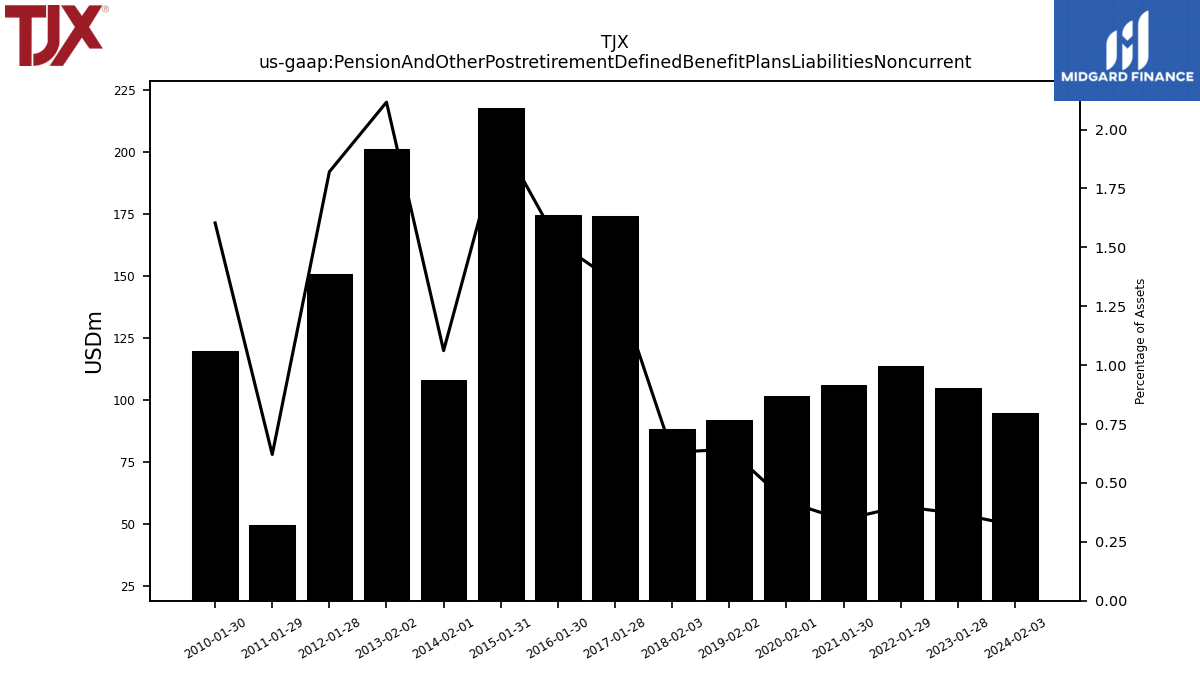
| Pension And Other Postretirement Defined Benefit Plans Liabilities Noncurrent | 95.00 | NA | NA | NA | 105.00 | NA | NA | NA | 114.00 | NA | NA | NA | 106.00 | NA | NA | NA | 101.80 | NA | NA | NA | 92.10 | NA | NA | NA | 88.60 | NA | NA | NA | 174.40 | NA | NA | NA | 174.90 | NA | NA | NA | 217.90 | NA | NA | NA | 108.30 | NA | NA | NA | 201.30 | NA | NA | NA | 150.80 | NA | NA | NA | 49.50 | NA | NA | NA | 119.70 | |
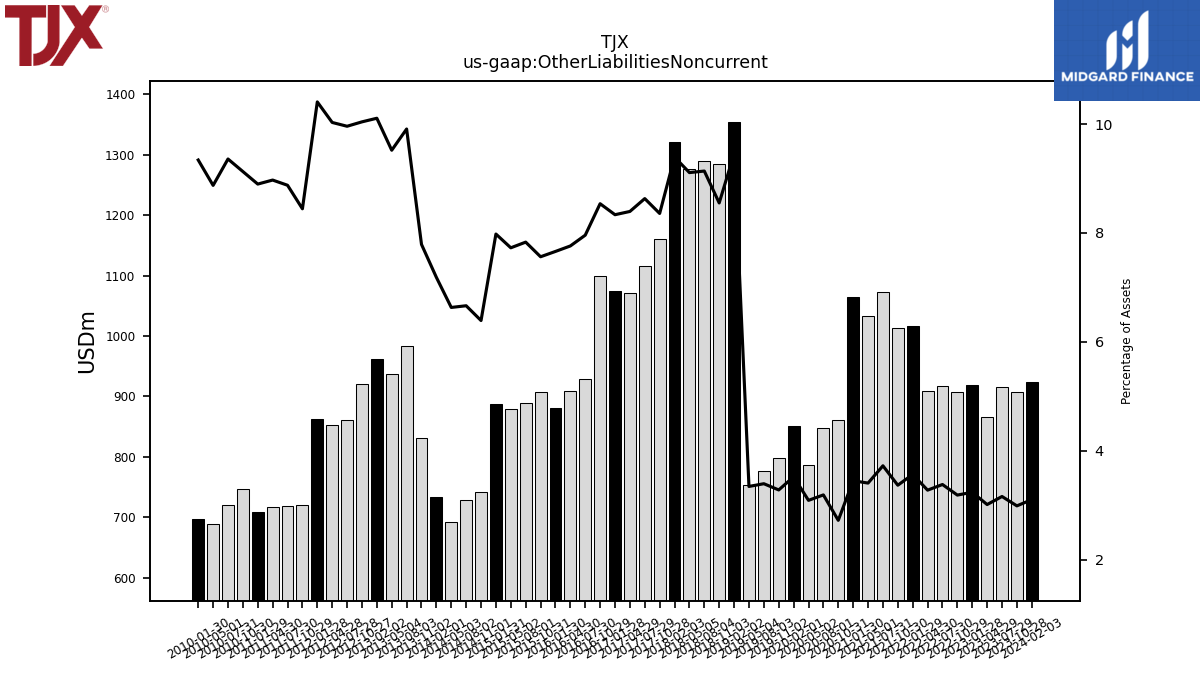
| Other Liabilities Noncurrent | 924.00 | 908.00 | 915.00 | 865.00 | 919.00 | 906.74 | 916.66 | 908.91 | 1015.72 | 1013.54 | 1072.85 | 1033.24 | 1063.90 | 860.50 | 848.25 | 786.01 | 851.12 | 797.57 | 776.65 | 752.97 | 1354.24 | 1284.91 | 1289.35 | 1275.84 | 1320.51 | 1159.97 | 1116.52 | 1071.53 | 1073.95 | 1098.49 | 928.96 | 908.54 | 881.02 | 907.09 | 888.28 | 878.39 | 888.14 | 741.10 | 727.91 | 691.87 | 733.00 | 831.23 | 983.51 | 936.71 | 961.28 | 920.86 | 860.14 | 852.76 | 861.77 | 720.40 | 718.72 | 716.33 | 709.32 | 746.86 | 719.33 | 688.12 | 697.10 | |
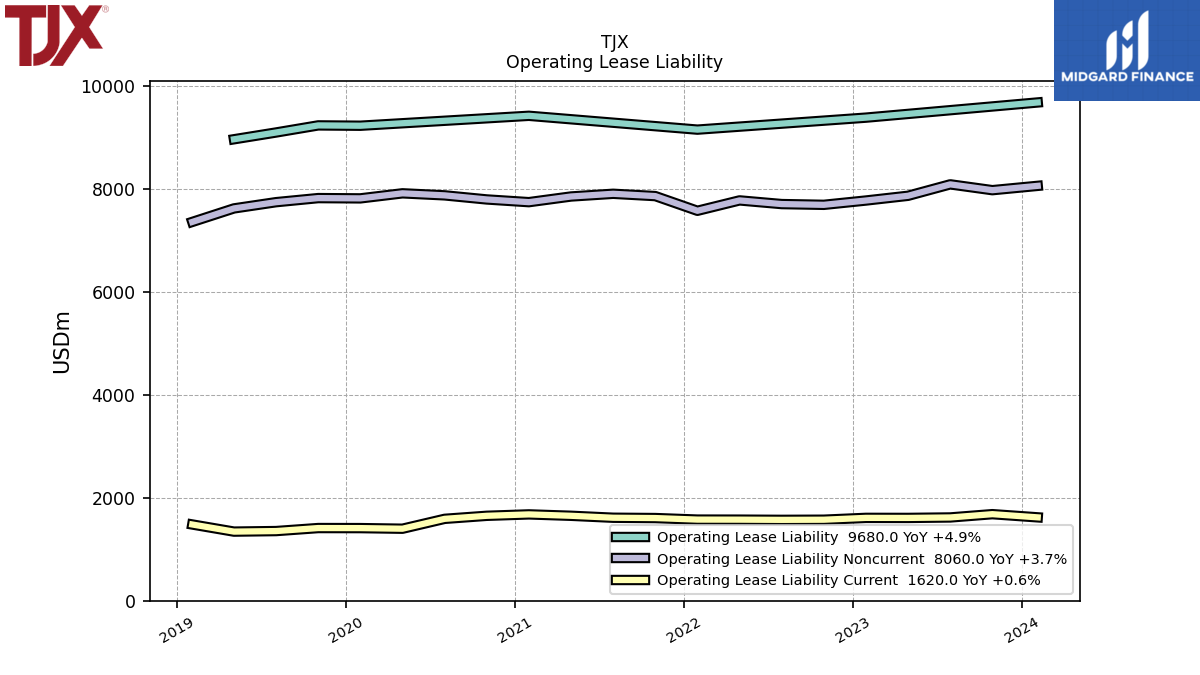
| Operating Lease Liability Noncurrent | 8060.00 | 7976.00 | 8089.00 | 7867.00 | 7775.00 | 7691.23 | 7706.00 | 7777.16 | 7575.59 | 7861.02 | 7905.81 | 7853.23 | 7743.22 | 7795.84 | 7875.23 | 7914.82 | 7816.63 | 7822.07 | 7742.87 | 7621.53 | NA | NA | NA | NA | NA | NA | NA | NA | NA | NA | NA | NA | NA | NA | NA | NA | NA | NA | NA | NA | NA | NA | NA | NA | NA | NA | NA | NA | NA | NA | NA | NA | NA | NA | NA | NA | NA |
| 2024-02-03 | 2023-10-28 | 2023-07-29 | 2023-04-29 | 2023-01-28 | 2022-10-29 | 2022-07-30 | 2022-04-30 | 2022-01-29 | 2021-10-30 | 2021-07-31 | 2021-05-01 | 2021-01-30 | 2020-10-31 | 2020-08-01 | 2020-05-02 | 2020-02-01 | 2019-11-02 | 2019-08-03 | 2019-05-04 | 2019-02-02 | 2018-11-03 | 2018-08-04 | 2018-05-05 | 2018-02-03 | 2017-10-28 | 2017-07-29 | 2017-04-29 | 2017-01-28 | 2016-10-29 | 2016-07-30 | 2016-04-30 | 2016-01-30 | 2015-10-31 | 2015-08-01 | 2015-05-02 | 2015-01-31 | 2014-11-01 | 2014-08-02 | 2014-05-03 | 2014-02-01 | 2013-11-02 | 2013-08-03 | 2013-05-04 | 2013-02-02 | 2012-10-27 | 2012-07-28 | 2012-04-28 | 2012-01-28 | 2011-10-29 | 2011-07-30 | 2011-04-30 | 2011-01-29 | 2010-10-30 | 2010-07-31 | 2010-05-01 | 2010-01-30 | ||
|---|---|---|---|---|---|---|---|---|---|---|---|---|---|---|---|---|---|---|---|---|---|---|---|---|---|---|---|---|---|---|---|---|---|---|---|---|---|---|---|---|---|---|---|---|---|---|---|---|---|---|---|---|---|---|---|---|---|---|
| Stockholders Equity | 7302.00 | 6833.00 | 6608.00 | 6422.00 | 6364.00 | 5664.68 | 5396.65 | 5595.44 | 6002.99 | 6444.77 | 6406.38 | 6139.21 | 5832.68 | 5566.76 | 4660.57 | 4739.22 | 5948.21 | 5542.53 | 5302.61 | 5131.90 | 5048.61 | 5256.87 | 5227.07 | 5262.41 | 5148.31 | 4645.61 | 4540.80 | 4553.52 | 4510.60 | 4329.81 | 4451.36 | 4534.97 | 4307.07 | 4350.46 | 4276.07 | 4290.29 | 4264.23 | 4373.81 | 4274.65 | 4283.49 | 4229.89 | NA | NA | NA | 3665.94 | NA | NA | NA | 3209.29 | NA | NA | NA | NA | NA | NA | NA | NA | |
| Common Stock Value | 1134.00 | 1141.00 | 1145.00 | 1150.00 | 1155.00 | 1156.26 | 1161.89 | 1172.71 | 1181.19 | 1194.26 | 1202.98 | 1206.39 | 1204.70 | 1200.63 | 1199.06 | 1197.88 | 1199.10 | 1203.18 | 1208.93 | 1212.67 | 1217.18 | 2466.29 | 1241.53 | 1250.41 | 1256.02 | 1264.61 | 1272.55 | 1286.55 | 1292.64 | 1303.80 | 1313.29 | 1322.17 | 1326.99 | 1339.06 | 1348.74 | 1360.77 | 1369.47 | 1377.80 | 1385.88 | 1400.62 | 1410.03 | 1422.40 | 1430.47 | 1439.55 | 1447.80 | 1458.51 | 1472.20 | 1481.90 | 1493.40 | 1508.56 | 1523.92 | 1544.43 | 1558.63 | 1583.21 | 1602.64 | 1631.92 | 1637.54 | |
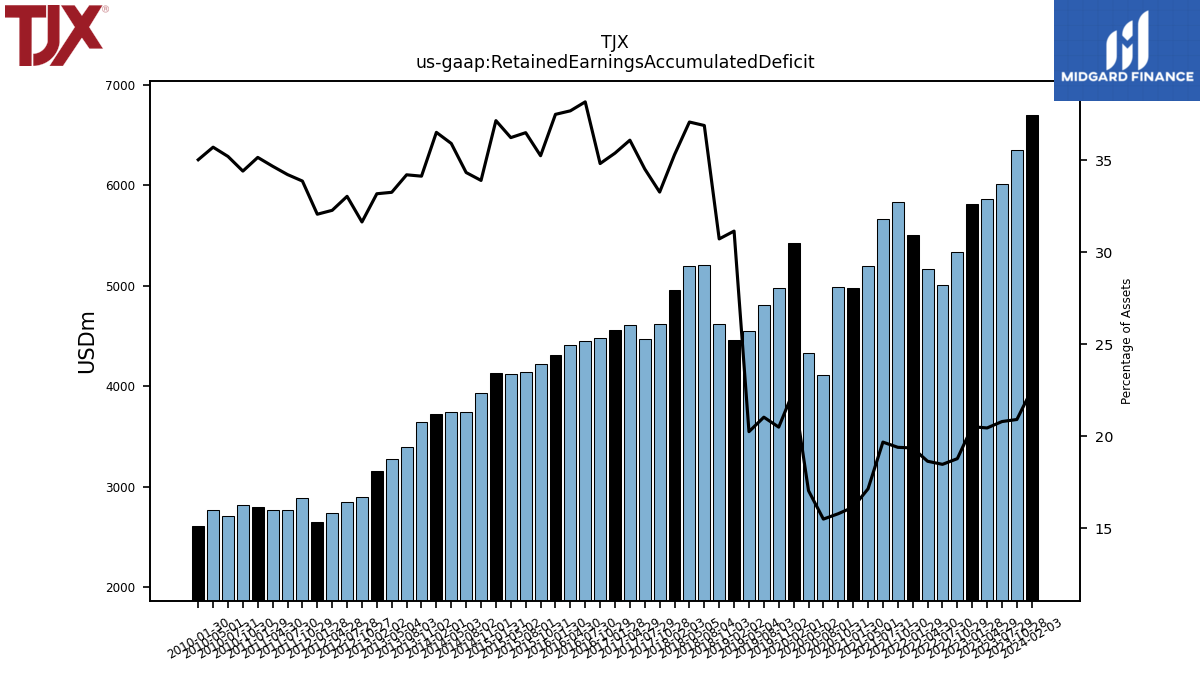
| Retained Earnings Accumulated Deficit | 6700.00 | 6345.00 | 6014.00 | 5864.00 | 5815.00 | 5338.02 | 5002.90 | 5163.71 | 5508.95 | 5831.72 | 5663.49 | 5192.54 | 4973.54 | 4982.57 | 4115.92 | 4330.56 | 5422.28 | 4976.76 | 4806.50 | 4552.51 | 4461.74 | 4615.57 | 5204.70 | 5192.73 | 4962.16 | 4616.22 | 4465.26 | 4605.68 | 4558.51 | 4479.47 | 4454.39 | 4410.30 | 4311.05 | 4226.11 | 4138.64 | 4117.30 | 4133.88 | 3929.38 | 3749.20 | 3745.01 | 3724.41 | 3641.34 | 3395.01 | 3272.14 | 3155.43 | 2902.05 | 2852.90 | 2744.16 | 2655.16 | 2888.87 | 2770.48 | 2768.09 | 2802.00 | 2815.01 | 2705.75 | 2768.70 | 2614.01 | |
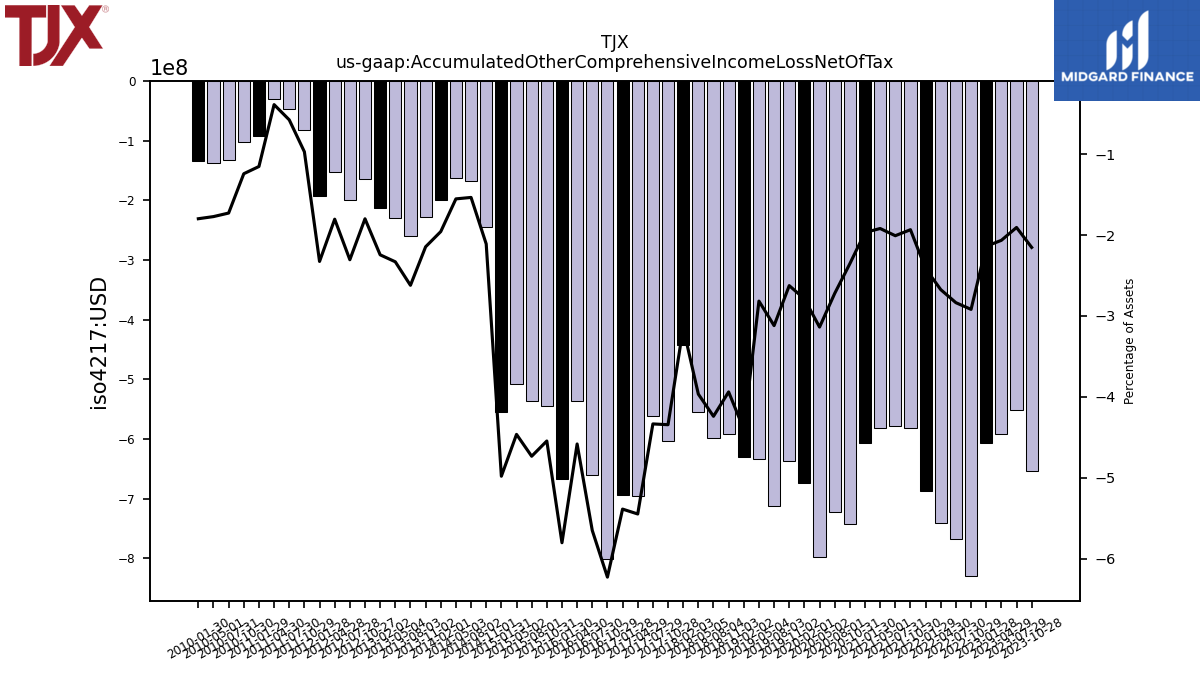
| Accumulated Other Comprehensive Income Loss Net Of Tax | -532.00 | -653.00 | -551.00 | -592.00 | -606.00 | -829.60 | -768.14 | -740.98 | -687.15 | -581.21 | -577.69 | -581.18 | -606.07 | -742.86 | -722.94 | -797.32 | -673.17 | -637.41 | -712.83 | -633.28 | -630.32 | -591.85 | -598.40 | -555.53 | -441.86 | -602.92 | -560.73 | -695.43 | -694.23 | -801.56 | -659.68 | -536.41 | -667.47 | -545.17 | -536.95 | -507.39 | -554.38 | -244.47 | -167.50 | -161.82 | -199.53 | -228.77 | -260.10 | -229.25 | -213.39 | -164.91 | -198.98 | -153.29 | -192.57 | -82.69 | -46.47 | -30.80 | -91.75 | -101.49 | -132.73 | -137.30 | -134.12 |