
| 2023-12-31 | 2023-09-30 | 2023-06-30 | 2023-03-31 | 2022-12-31 | 2022-09-30 | 2022-06-30 | 2022-03-31 | 2021-12-31 | 2021-09-30 | 2021-06-30 | 2021-03-31 | 2020-12-31 | 2020-09-30 | 2020-06-30 | 2020-03-31 | 2019-12-31 | 2019-09-30 | 2019-06-30 | 2019-03-31 | 2018-12-31 | 2018-09-30 | 2018-06-30 | 2018-03-31 | ||
|---|---|---|---|---|---|---|---|---|---|---|---|---|---|---|---|---|---|---|---|---|---|---|---|---|---|
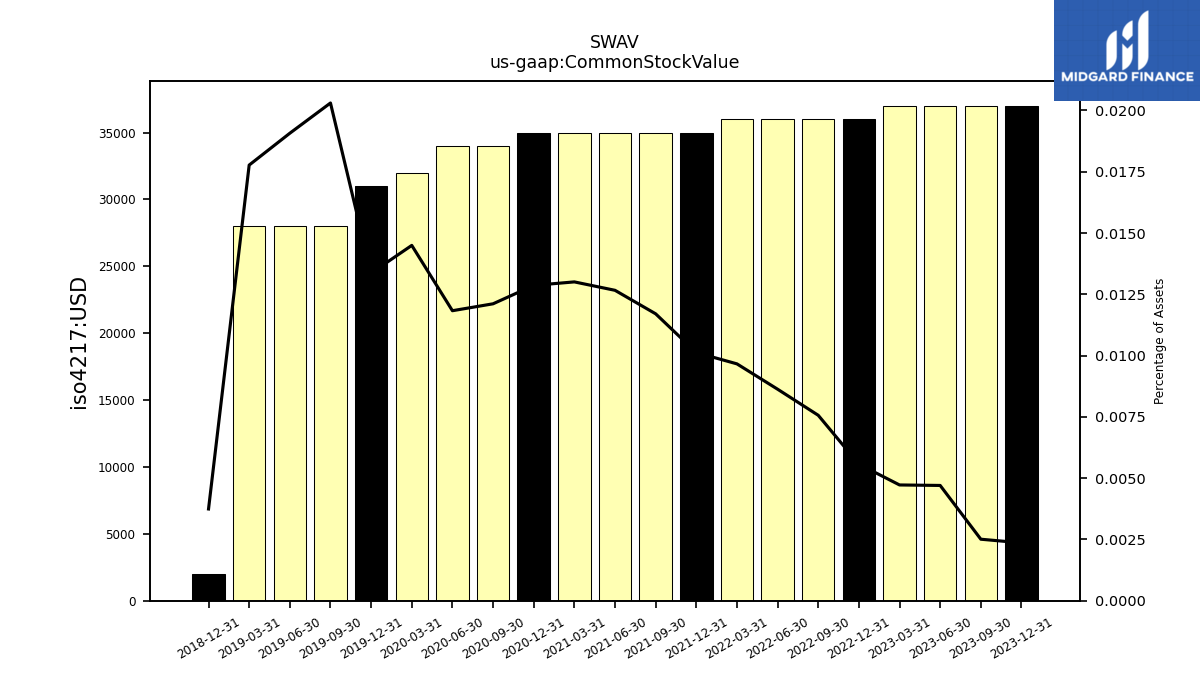
| Common Stock Value | 0.04 | 0.04 | 0.04 | 0.04 | 0.04 | 0.04 | 0.04 | 0.04 | 0.04 | 0.04 | 0.04 | 0.04 | 0.04 | 0.03 | 0.03 | 0.03 | 0.03 | 0.03 | 0.03 | 0.03 | 0.00 | NA | NA | NA | |
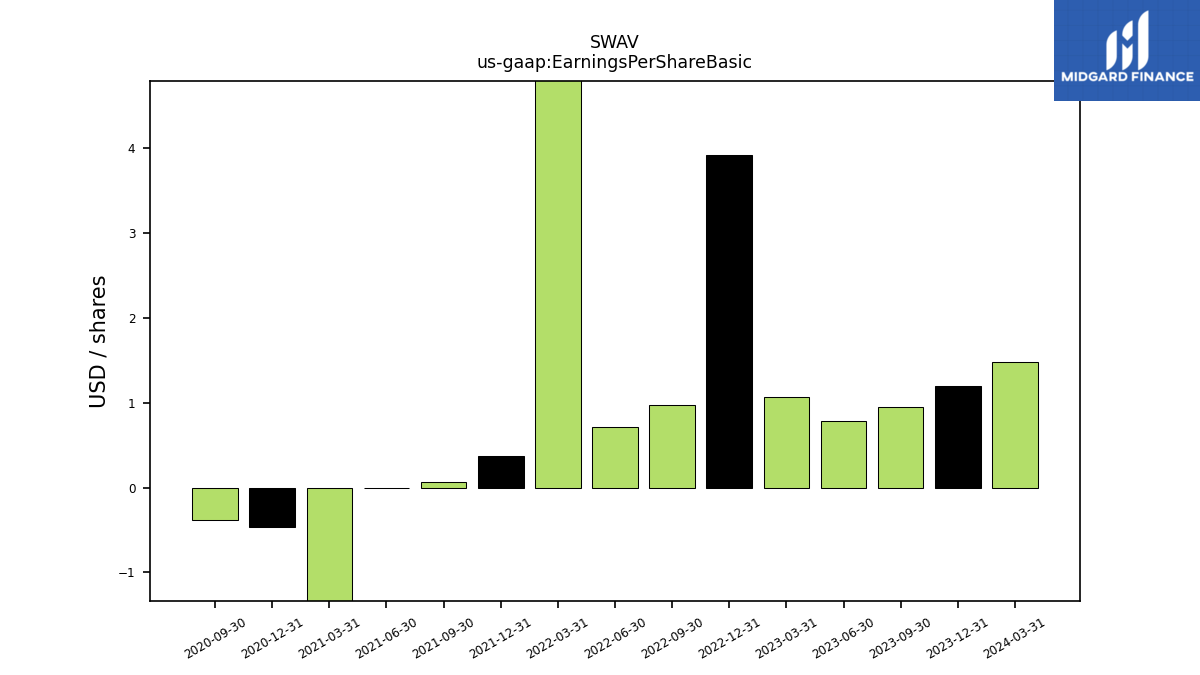
| Earnings Per Share Basic | 1.20 | 0.95 | 0.79 | 1.07 | 3.92 | 0.97 | 0.71 | 410.00 | 0.37 | 0.06 | -0.01 | -680.00 | -0.46 | -0.38 | NA | NA | NA | NA | NA | NA | NA | NA | NA | NA | |
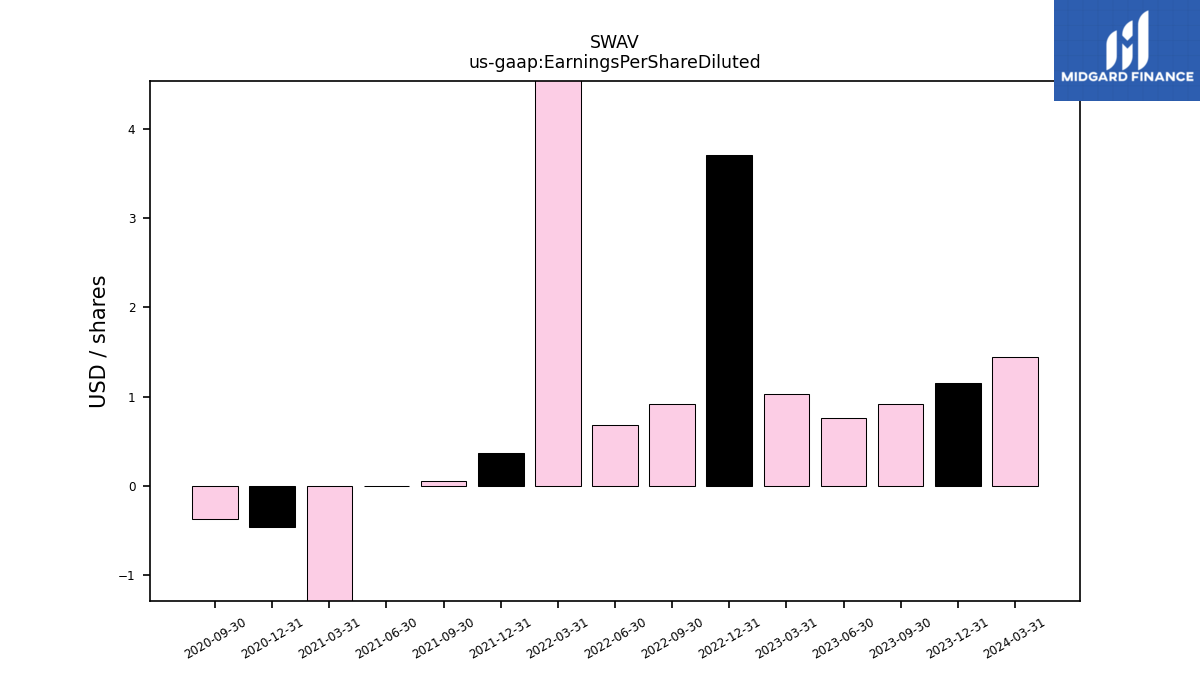
| Earnings Per Share Diluted | 1.15 | 0.92 | 0.76 | 1.03 | 3.71 | 0.92 | 0.68 | 390.00 | 0.37 | 0.05 | -0.01 | -680.00 | -0.46 | -0.38 | NA | NA | NA | NA | NA | NA | NA | NA | NA | NA |
| 2023-12-31 | 2023-09-30 | 2023-06-30 | 2023-03-31 | 2022-12-31 | 2022-09-30 | 2022-06-30 | 2022-03-31 | 2021-12-31 | 2021-09-30 | 2021-06-30 | 2021-03-31 | 2020-12-31 | 2020-09-30 | 2020-06-30 | 2020-03-31 | 2019-12-31 | 2019-09-30 | 2019-06-30 | 2019-03-31 | 2018-12-31 | 2018-09-30 | 2018-06-30 | 2018-03-31 | ||
|---|---|---|---|---|---|---|---|---|---|---|---|---|---|---|---|---|---|---|---|---|---|---|---|---|---|
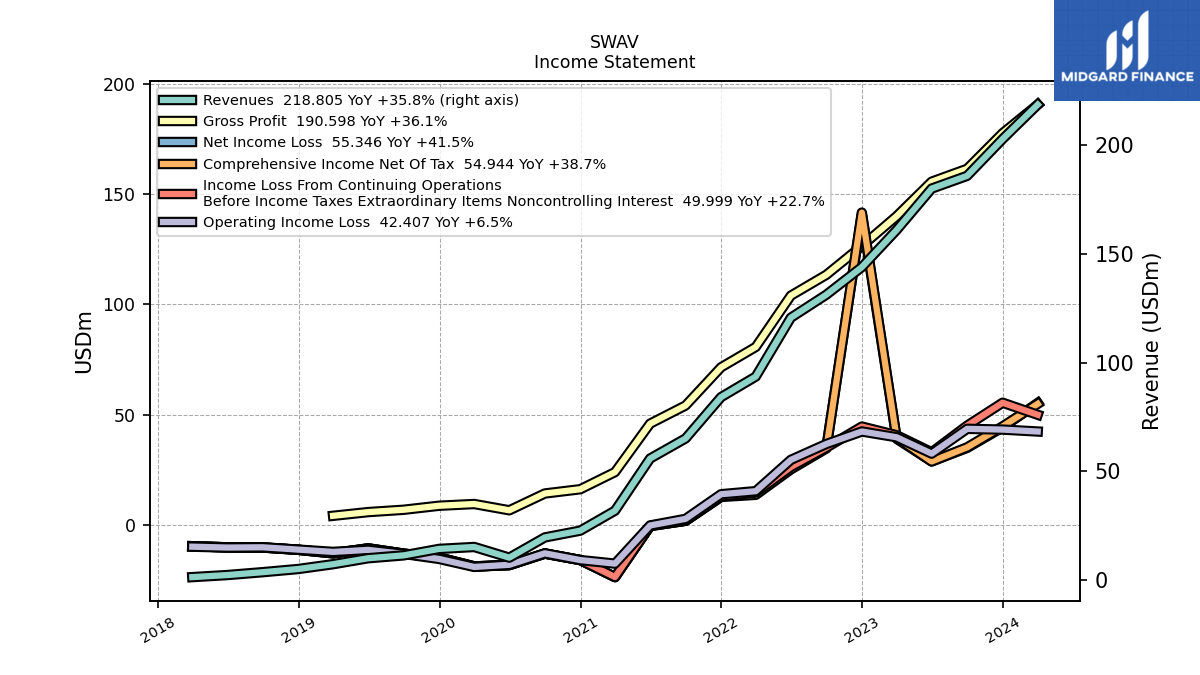
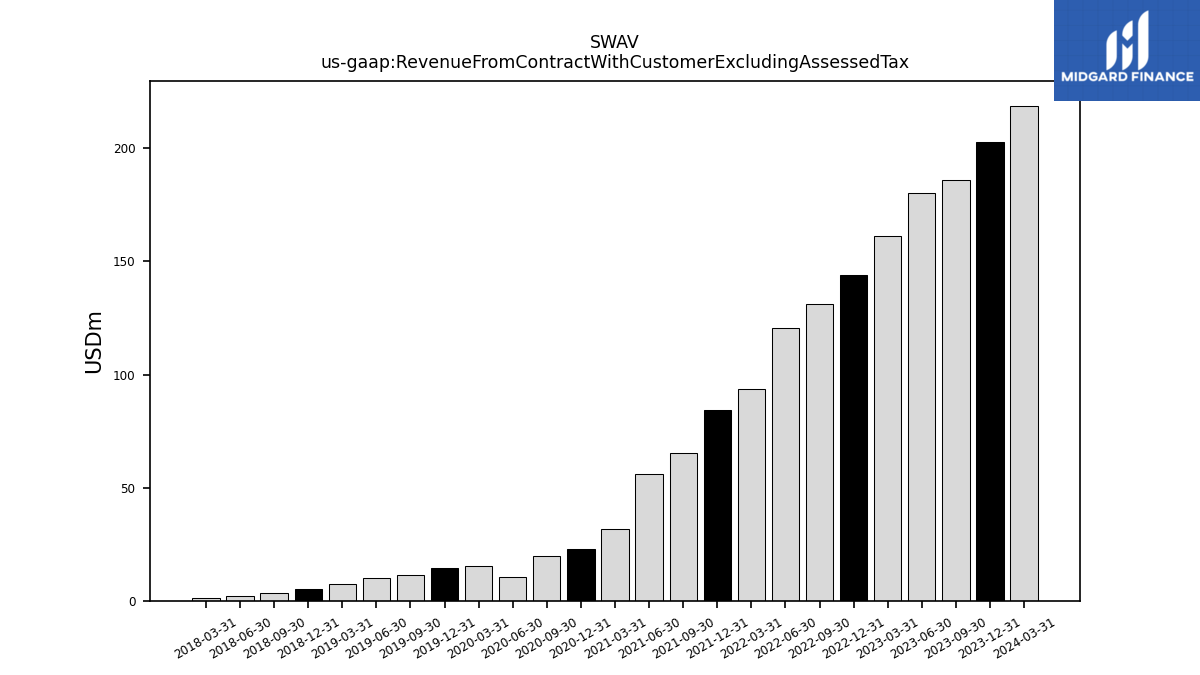
| Revenue From Contract With Customer Excluding Assessed Tax | 202.98 | 186.02 | 180.16 | 161.07 | 144.03 | 131.33 | 120.75 | 93.63 | 84.18 | 65.16 | 55.91 | 31.90 | 22.72 | 19.59 | 10.29 | 15.20 | 14.31 | 11.33 | 10.01 | 7.27 | 5.06 | 3.60 | 2.28 | 1.32 | |
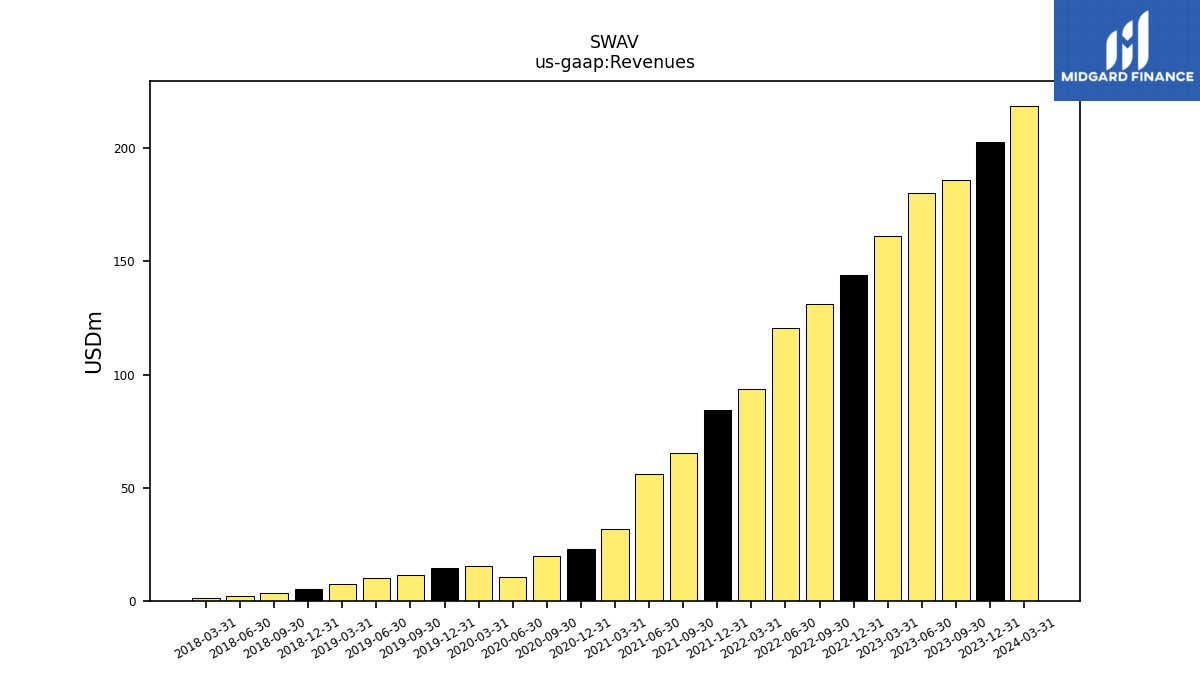
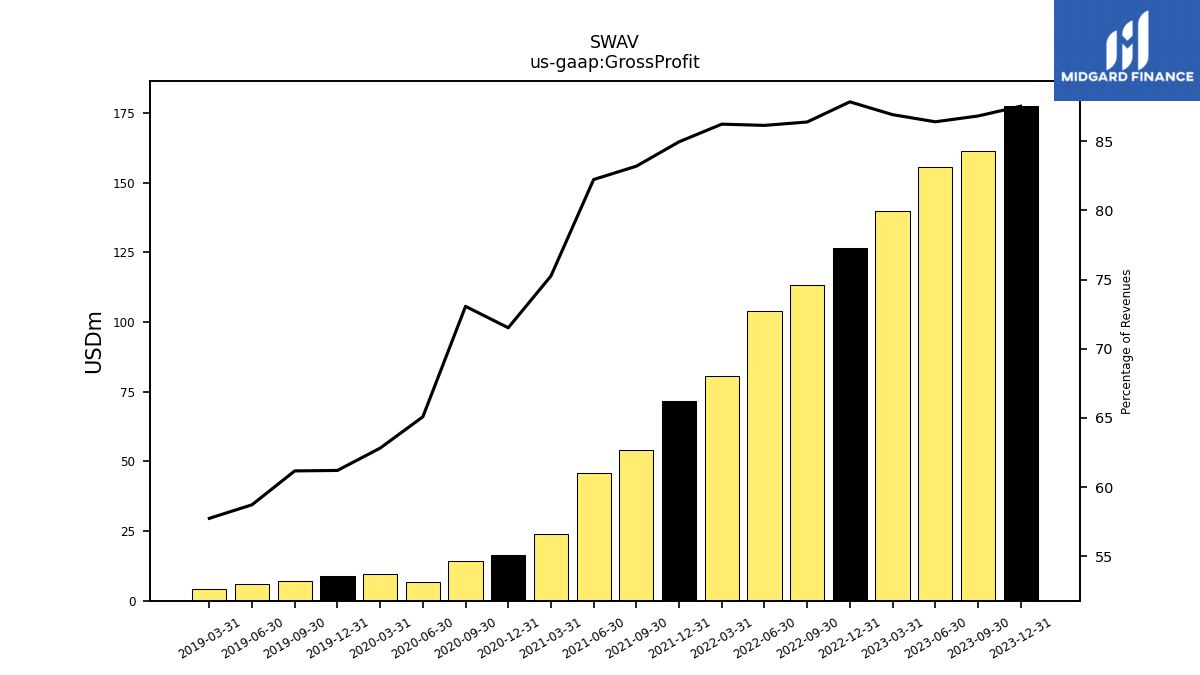
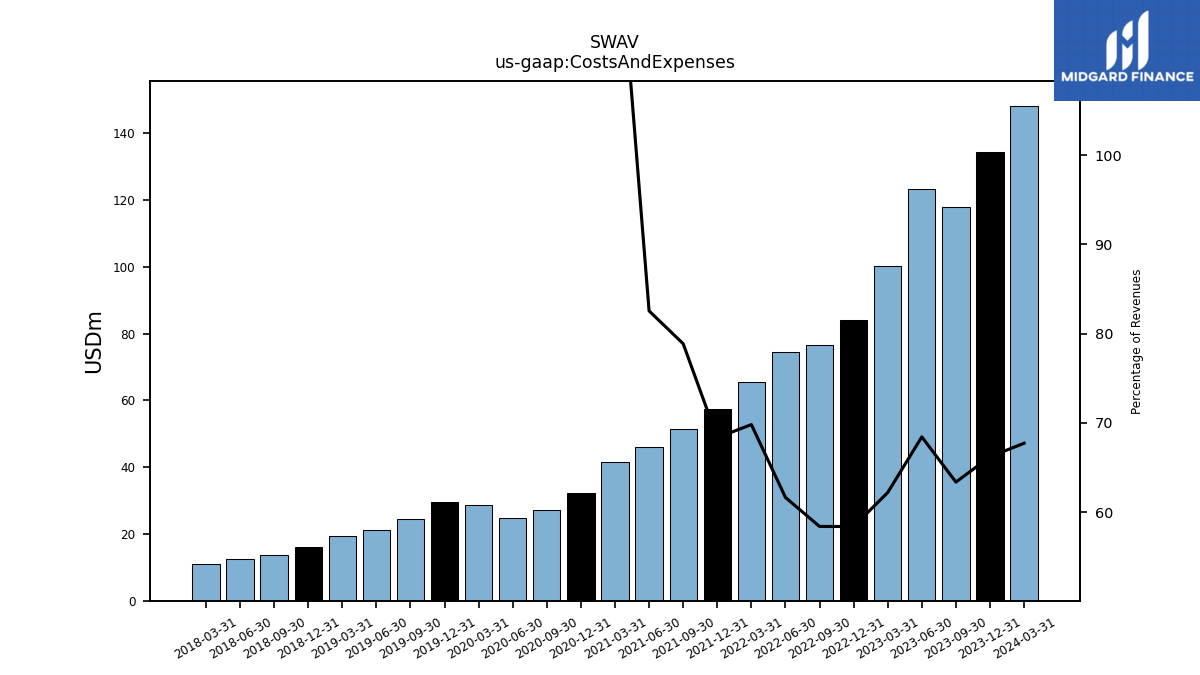
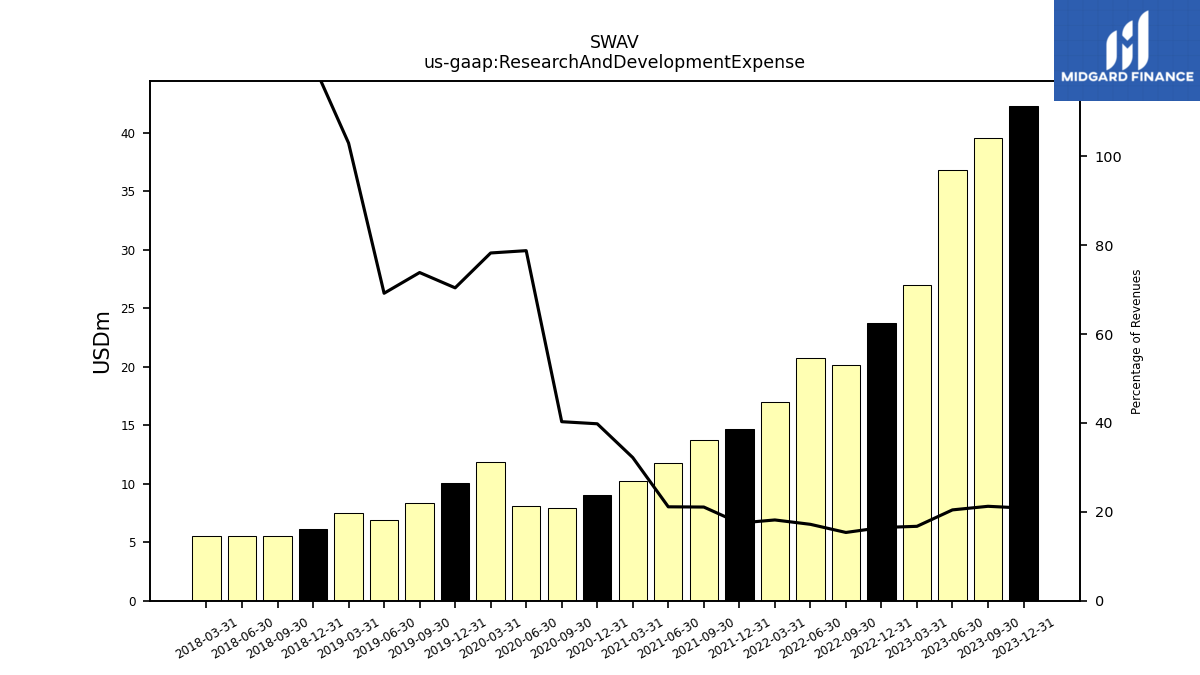
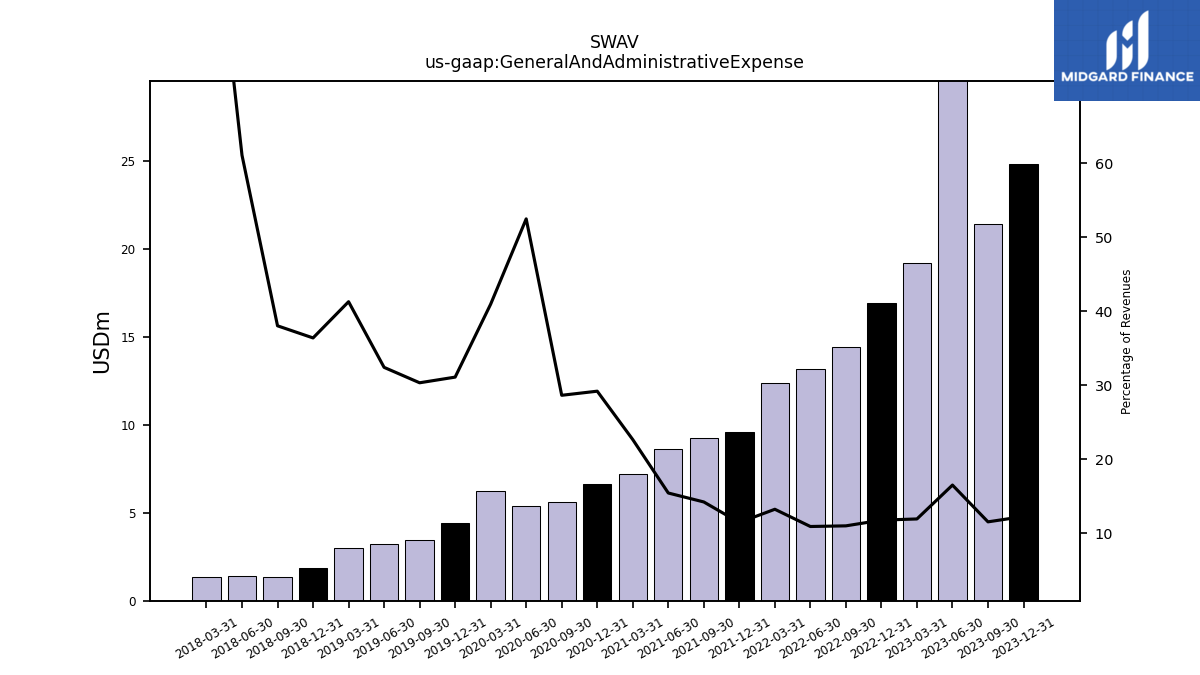
| Revenues | 202.98 | 186.02 | 180.16 | 161.07 | 144.03 | 131.33 | 120.75 | 93.63 | 84.18 | 65.16 | 55.91 | 31.90 | 22.72 | 19.59 | 10.29 | 15.20 | 14.31 | 11.33 | 10.01 | 7.27 | 5.06 | 3.60 | 2.28 | 1.32 | |
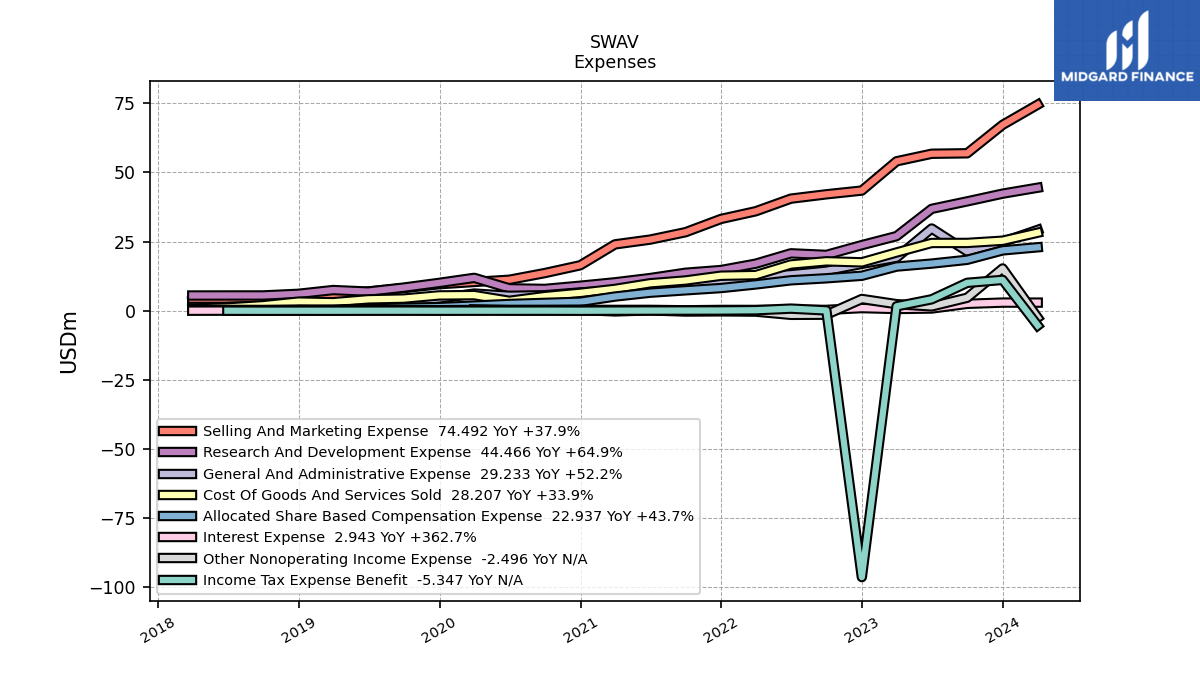
| Cost Of Goods And Services Sold | 25.32 | 24.51 | 24.49 | 21.07 | 17.50 | 17.87 | 16.73 | 12.89 | 12.66 | 10.95 | 9.93 | 7.89 | 6.47 | 5.28 | 3.59 | 5.65 | 5.55 | 4.40 | 4.13 | 3.07 | 3.30 | 1.97 | 1.18 | 0.79 | |
| Gross Profit | 177.66 | 161.51 | 155.67 | 140.00 | 126.52 | 113.46 | 104.02 | 80.74 | 71.52 | 54.21 | 45.97 | 24.01 | 16.25 | 14.31 | 6.69 | 9.55 | 8.76 | 6.93 | 5.88 | 4.20 | NA | NA | NA | NA | |
| Costs And Expenses | 134.38 | 117.88 | 123.30 | 100.19 | 84.10 | 76.69 | 74.44 | 65.37 | 57.54 | 51.39 | 46.15 | 41.49 | 32.11 | 27.12 | 24.70 | 28.52 | 29.68 | 24.40 | 21.27 | 19.43 | 16.19 | 13.68 | 12.47 | 11.12 | |
| Research And Development Expense | 42.32 | 39.53 | 36.83 | 26.97 | 23.72 | 20.18 | 20.76 | 17.02 | 14.72 | 13.73 | 11.81 | 10.28 | 9.04 | 7.89 | 8.10 | 11.89 | 10.07 | 8.37 | 6.93 | 7.48 | 6.12 | 5.53 | 5.53 | 5.52 | |
| General And Administrative Expense | 24.88 | 21.45 | 29.73 | 19.20 | 16.94 | 14.43 | 13.16 | 12.39 | 9.63 | 9.27 | 8.63 | 7.23 | 6.63 | 5.61 | 5.40 | 6.22 | 4.45 | 3.44 | 3.25 | 3.00 | 1.84 | 1.37 | 1.39 | 1.38 | |
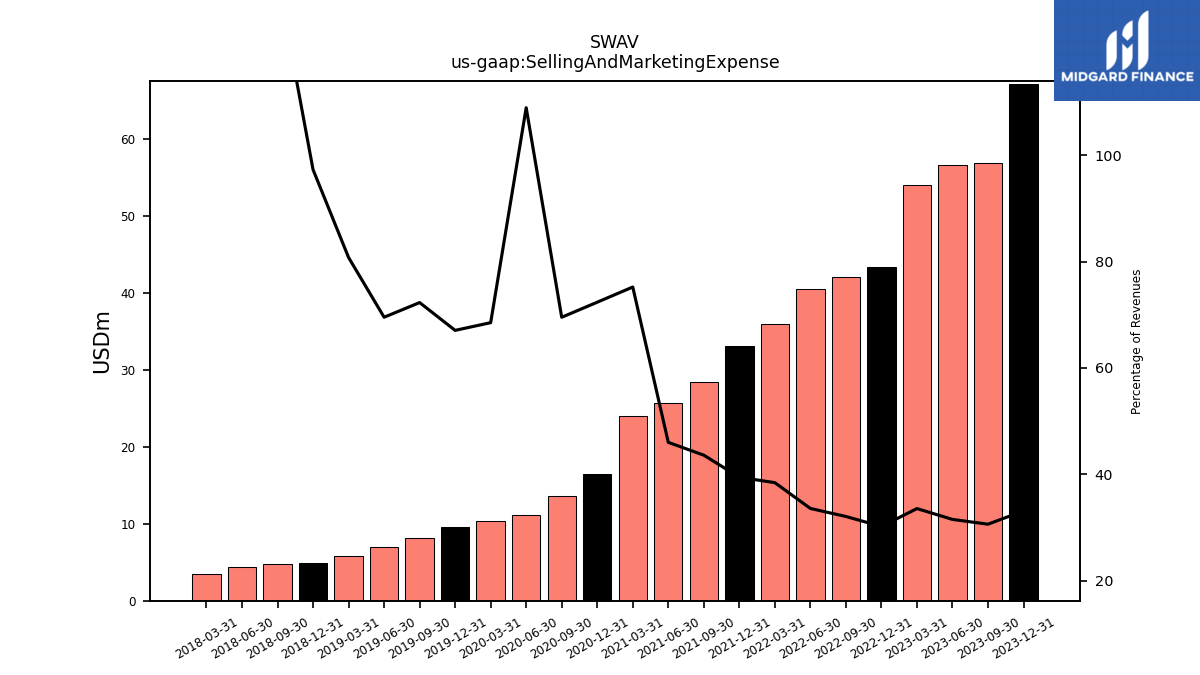
| Selling And Marketing Expense | 67.18 | 56.91 | 56.74 | 54.01 | 43.44 | 42.08 | 40.52 | 35.96 | 33.19 | 28.39 | 25.71 | 23.99 | 16.44 | 13.62 | 11.21 | 10.41 | 9.60 | 8.19 | 6.96 | 5.87 | 4.92 | 4.80 | 4.37 | 3.44 | |
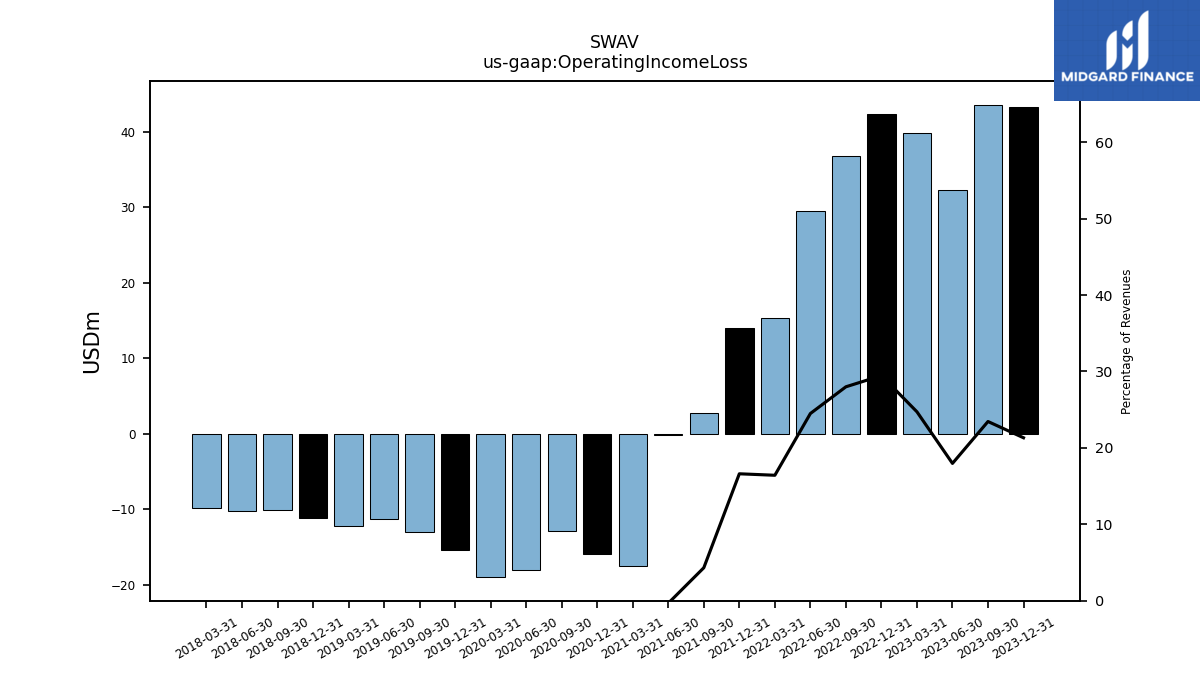
| Operating Income Loss | 43.28 | 43.62 | 32.37 | 39.81 | 42.42 | 36.76 | 29.58 | 15.37 | 13.98 | 2.81 | -0.18 | -17.49 | -15.87 | -12.81 | -18.01 | -18.98 | -15.36 | -13.06 | -11.25 | -12.16 | -11.13 | -10.08 | -10.19 | -9.80 | |
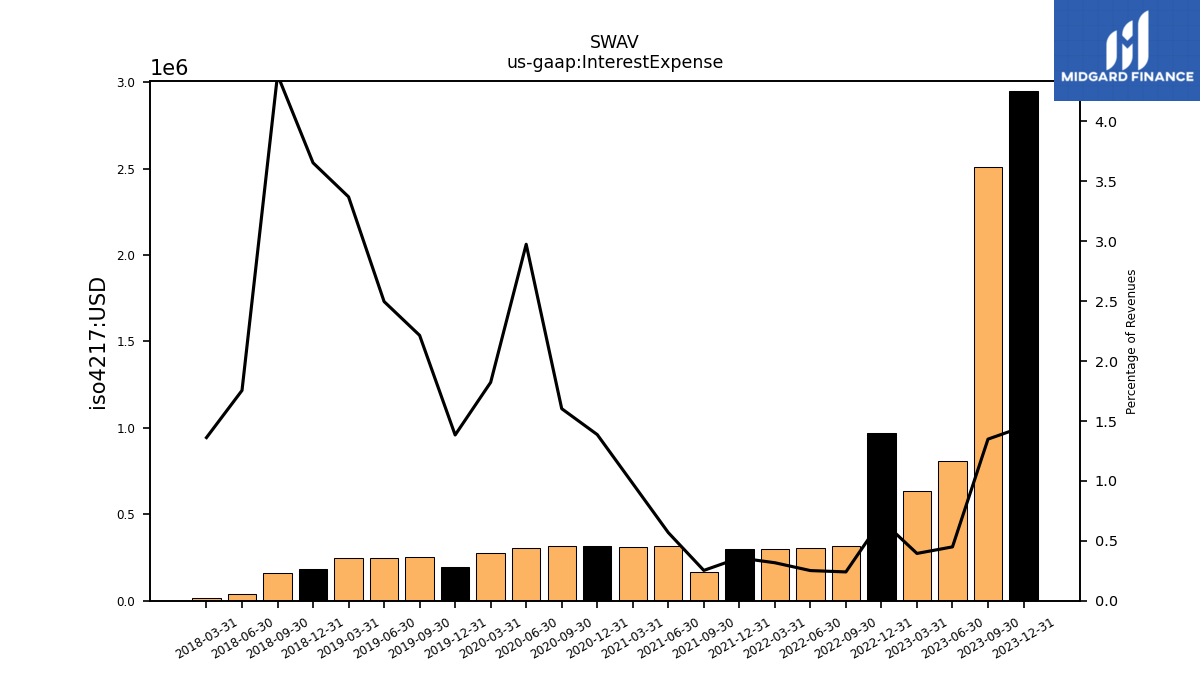
| Interest Expense | 2.95 | 2.51 | 0.81 | 0.64 | 0.97 | 0.32 | 0.30 | 0.30 | 0.30 | 0.17 | 0.32 | 0.31 | 0.32 | 0.31 | 0.31 | 0.28 | 0.20 | 0.25 | 0.25 | 0.24 | 0.18 | 0.16 | 0.04 | 0.02 | |
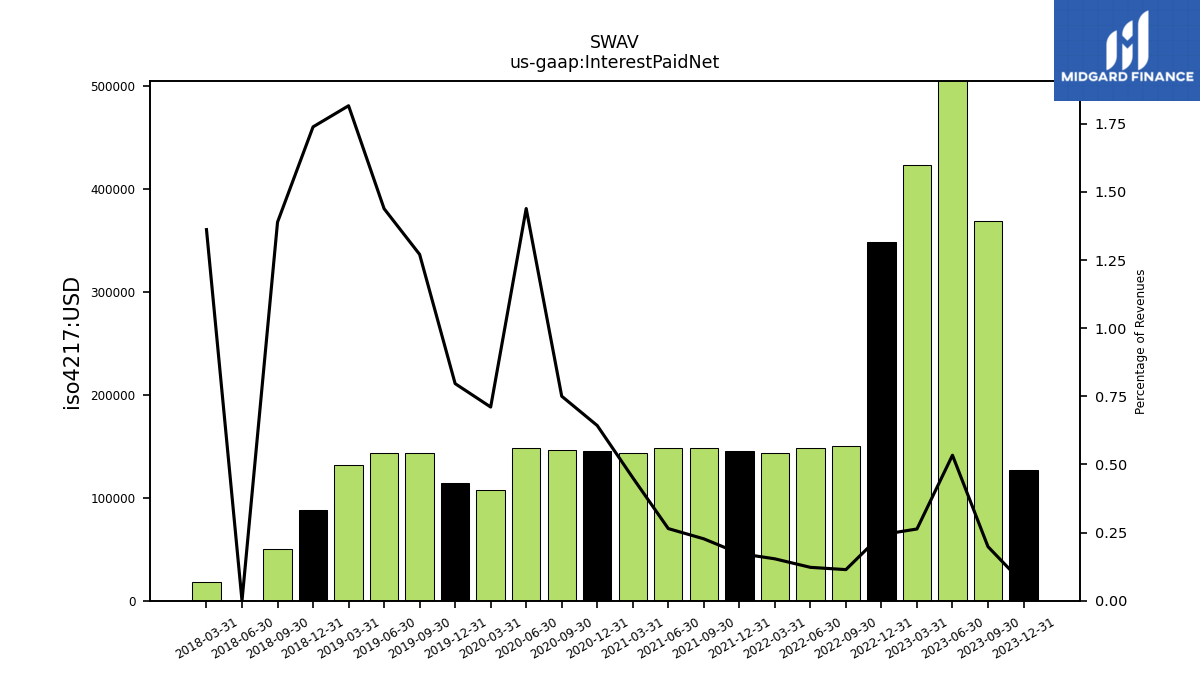
| Interest Paid Net | 0.13 | 0.37 | 0.96 | 0.42 | 0.35 | 0.15 | 0.15 | 0.14 | 0.15 | 0.15 | 0.15 | 0.14 | 0.15 | 0.15 | 0.15 | 0.11 | 0.11 | 0.14 | 0.14 | 0.13 | 0.09 | 0.05 | 0.00 | 0.02 | |
| Gains Losses On Extinguishment Of Debt | 0.00 | 0.70 | NA | NA | NA | NA | NA | NA | NA | NA | NA | NA | NA | NA | NA | NA | NA | NA | NA | NA | NA | NA | NA | NA | |
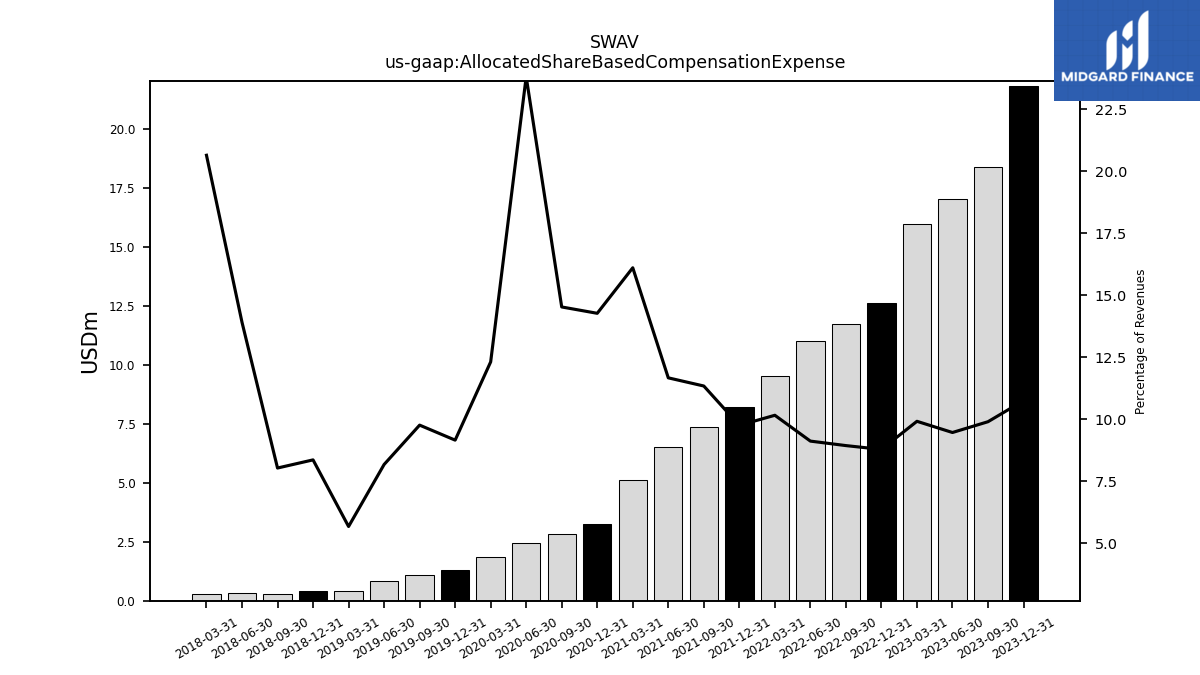
| Allocated Share Based Compensation Expense | 21.81 | 18.41 | 17.05 | 15.97 | 12.64 | 11.73 | 11.01 | 9.51 | 8.21 | 7.39 | 6.52 | 5.14 | 3.24 | 2.85 | 2.45 | 1.87 | 1.31 | 1.11 | 0.82 | 0.41 | 0.42 | 0.29 | 0.32 | 0.27 | |
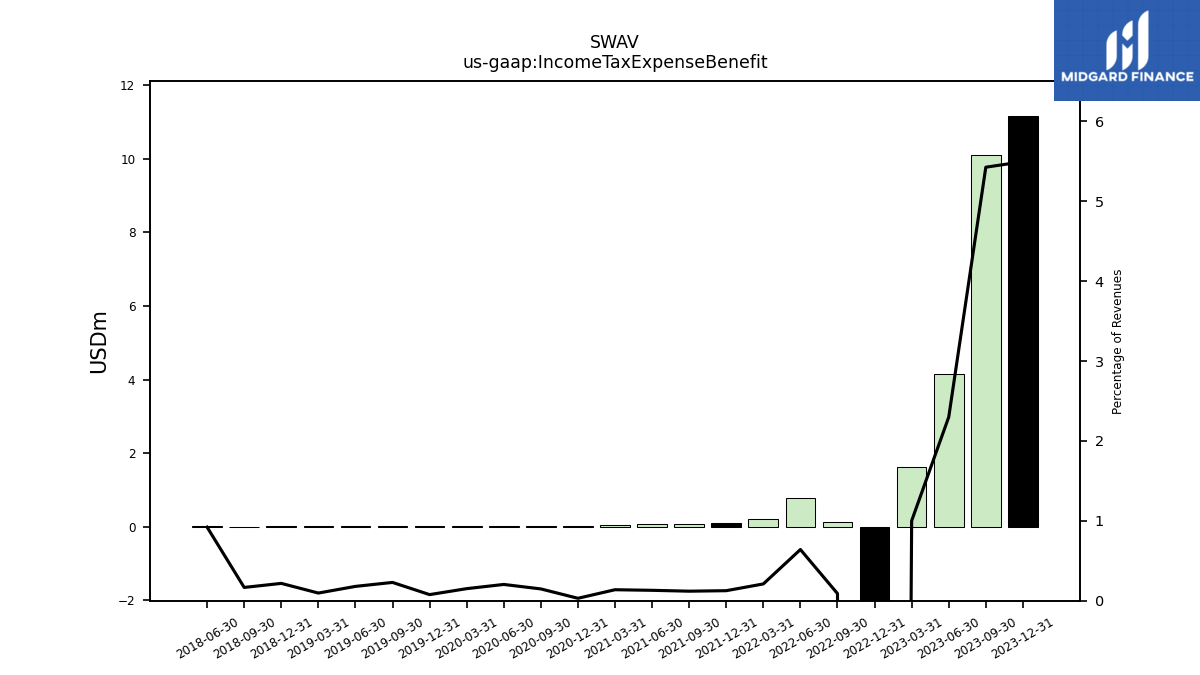
| Income Tax Expense Benefit | 11.15 | 10.09 | 4.14 | 1.61 | -96.26 | 0.12 | 0.77 | 0.20 | 0.11 | 0.08 | 0.07 | 0.04 | 0.01 | 0.03 | 0.02 | 0.02 | 0.01 | 0.03 | 0.02 | 0.01 | 0.01 | 0.01 | 0.02 | NA | |
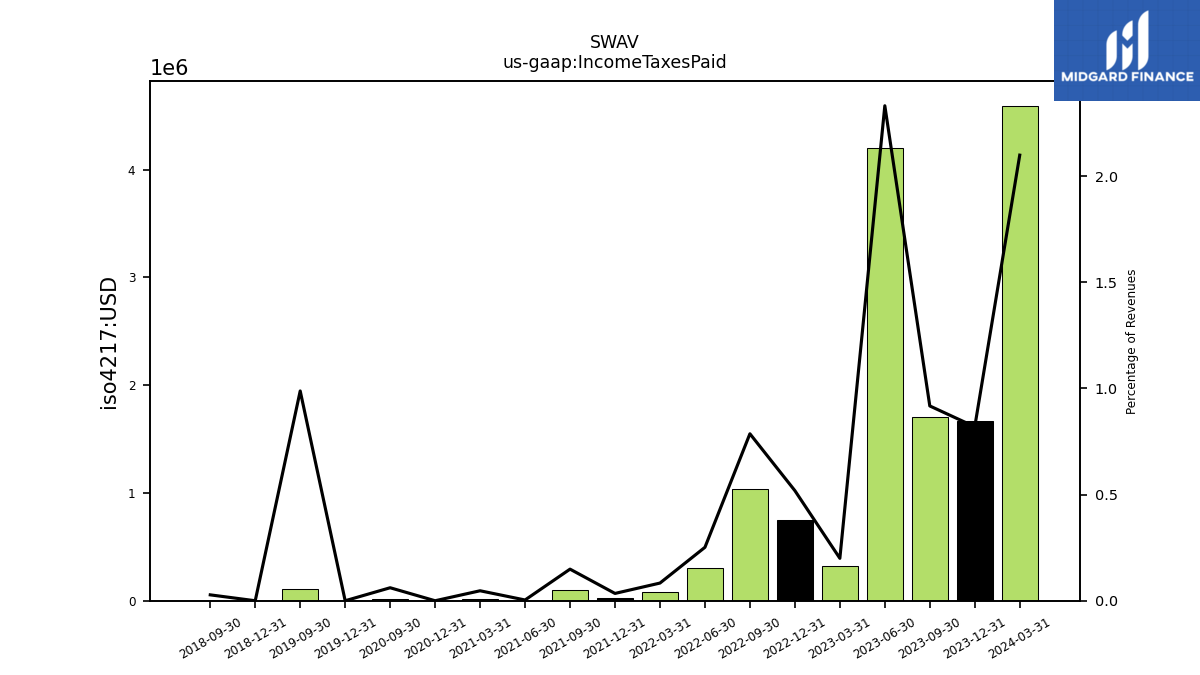
| Income Taxes Paid | 1.66 | 1.71 | 4.20 | 0.32 | 0.75 | 1.03 | 0.30 | 0.08 | 0.03 | 0.10 | 0.00 | 0.01 | 0.00 | 0.01 | NA | NA | 0.00 | 0.11 | NA | NA | 0.00 | 0.00 | NA | NA | |
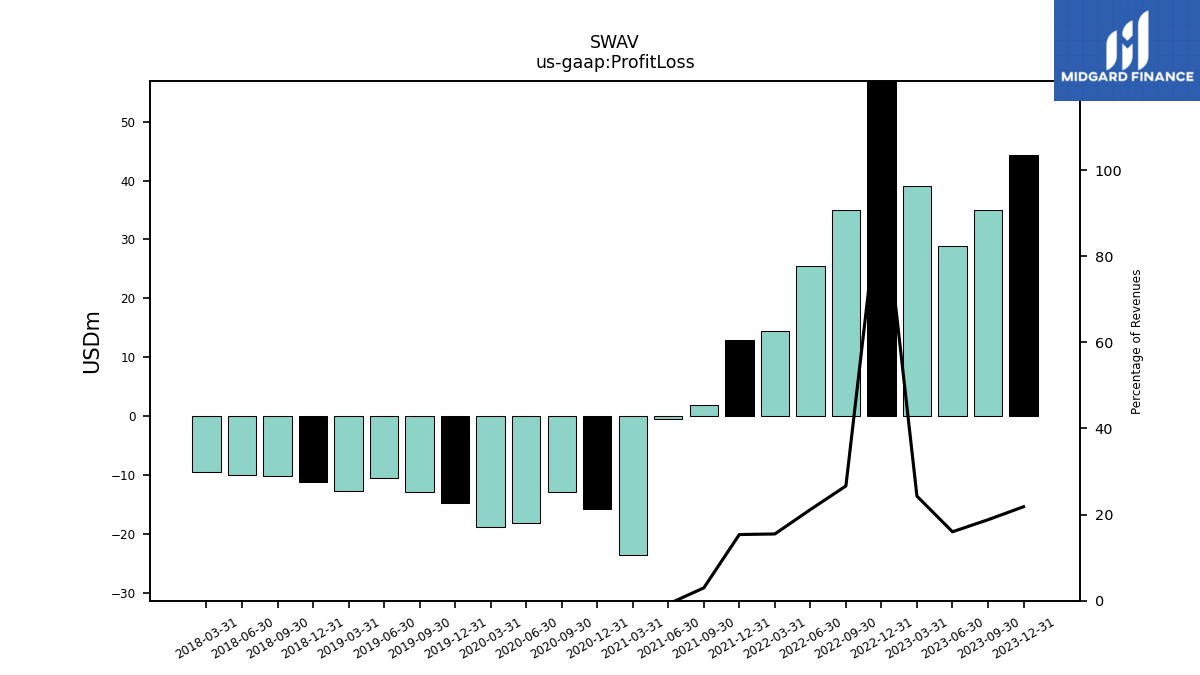
| Profit Loss | 44.30 | 34.99 | 28.86 | 39.12 | 140.91 | 35.00 | 25.56 | 14.52 | 12.94 | 1.95 | -0.42 | -23.60 | -15.87 | -12.93 | -18.12 | -18.77 | -14.74 | -12.96 | -10.61 | -12.80 | -11.22 | -10.18 | -10.11 | -9.59 | |
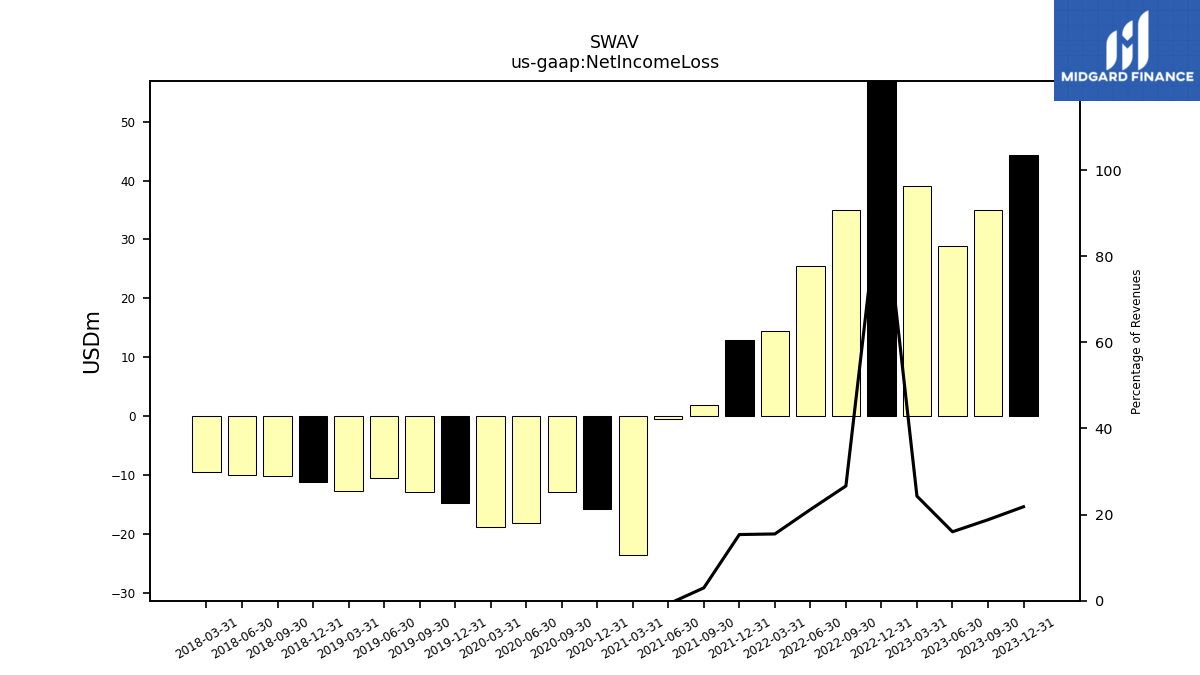
| Net Income Loss | 44.30 | 34.99 | 28.86 | 39.12 | 140.91 | 35.00 | 25.56 | 14.52 | 12.94 | 1.95 | -0.42 | -23.60 | -15.87 | -12.93 | -18.12 | -18.77 | -14.74 | -12.96 | -10.61 | -12.80 | -11.22 | -10.18 | -10.11 | -9.59 | |
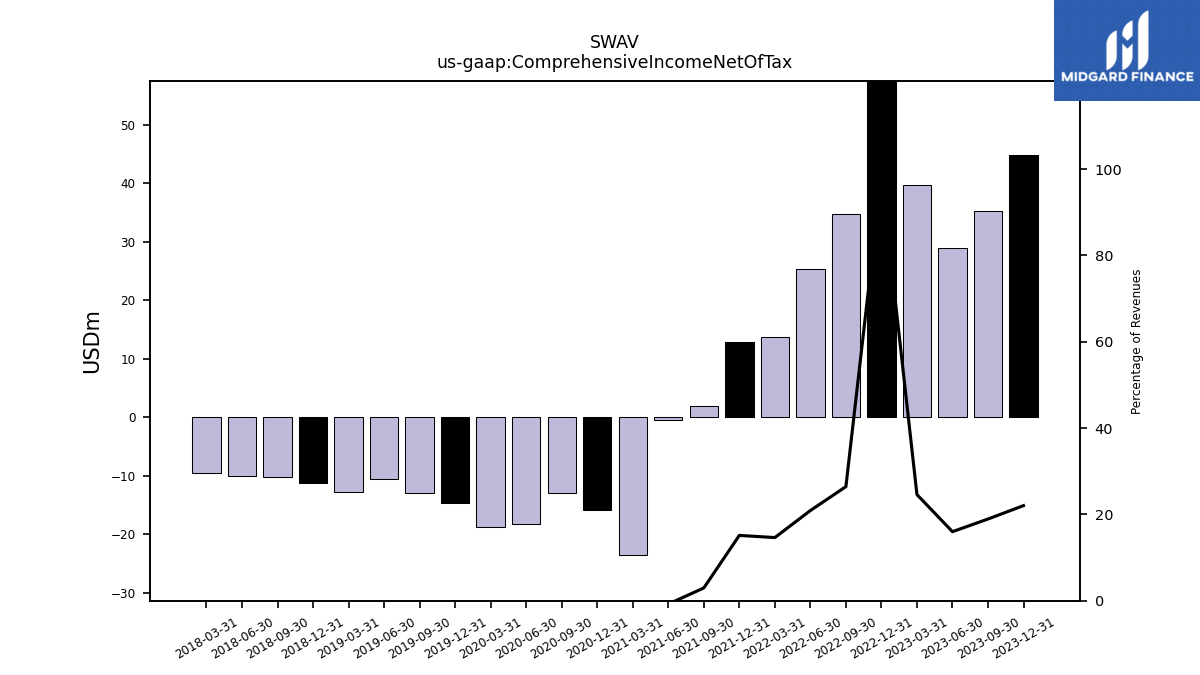
| Comprehensive Income Net Of Tax | 44.75 | 35.23 | 28.84 | 39.62 | 141.66 | 34.73 | 25.24 | 13.71 | 12.75 | 1.93 | -0.43 | -23.59 | -15.87 | -12.95 | -18.20 | -18.71 | -14.77 | -12.97 | -10.53 | -12.80 | -11.22 | -10.18 | -10.11 | -9.59 |
| 2023-12-31 | 2023-09-30 | 2023-06-30 | 2023-03-31 | 2022-12-31 | 2022-09-30 | 2022-06-30 | 2022-03-31 | 2021-12-31 | 2021-09-30 | 2021-06-30 | 2021-03-31 | 2020-12-31 | 2020-09-30 | 2020-06-30 | 2020-03-31 | 2019-12-31 | 2019-09-30 | 2019-06-30 | 2019-03-31 | 2018-12-31 | 2018-09-30 | 2018-06-30 | 2018-03-31 | ||
|---|---|---|---|---|---|---|---|---|---|---|---|---|---|---|---|---|---|---|---|---|---|---|---|---|---|
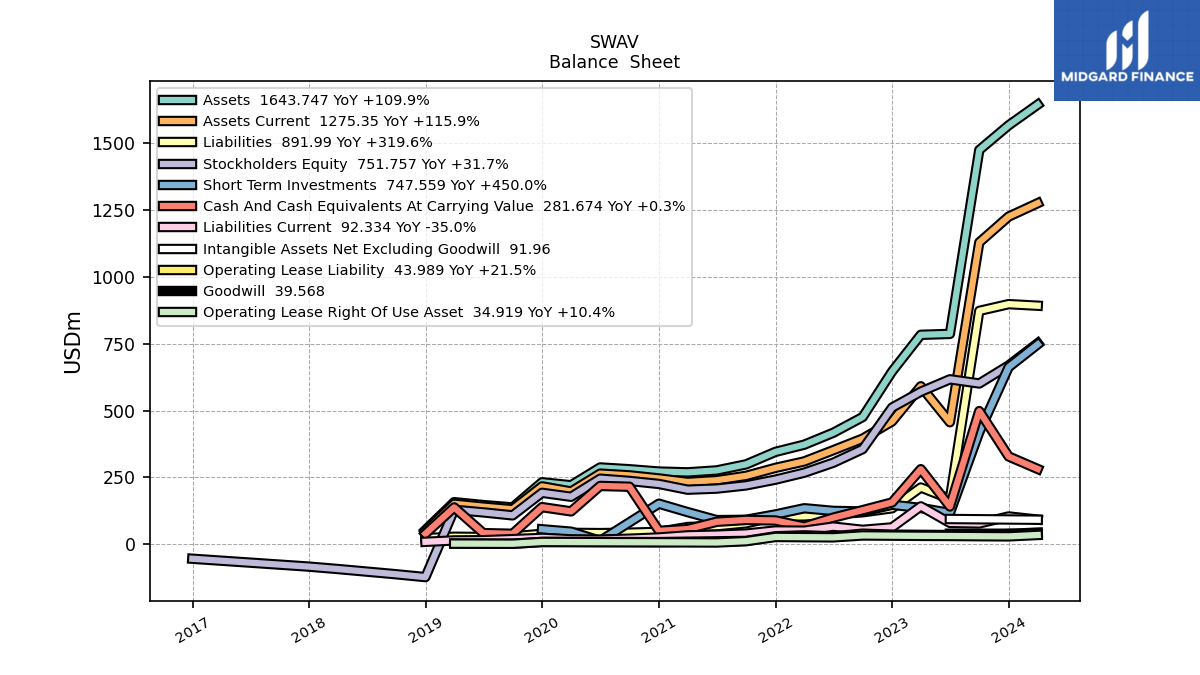
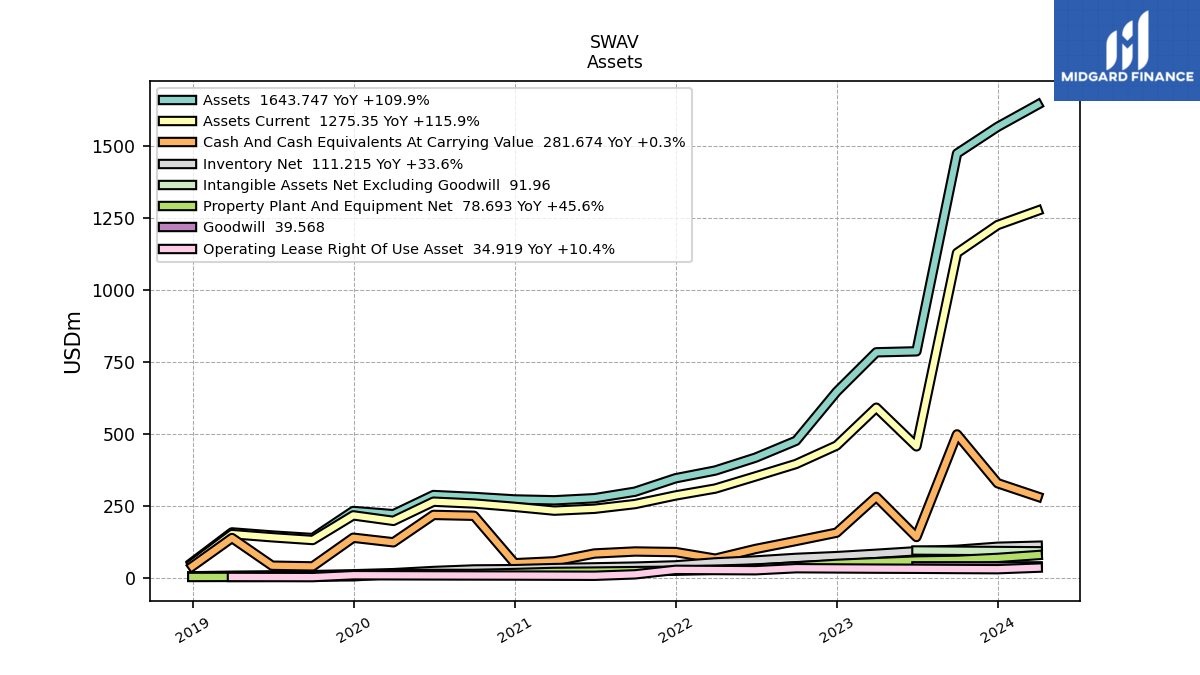
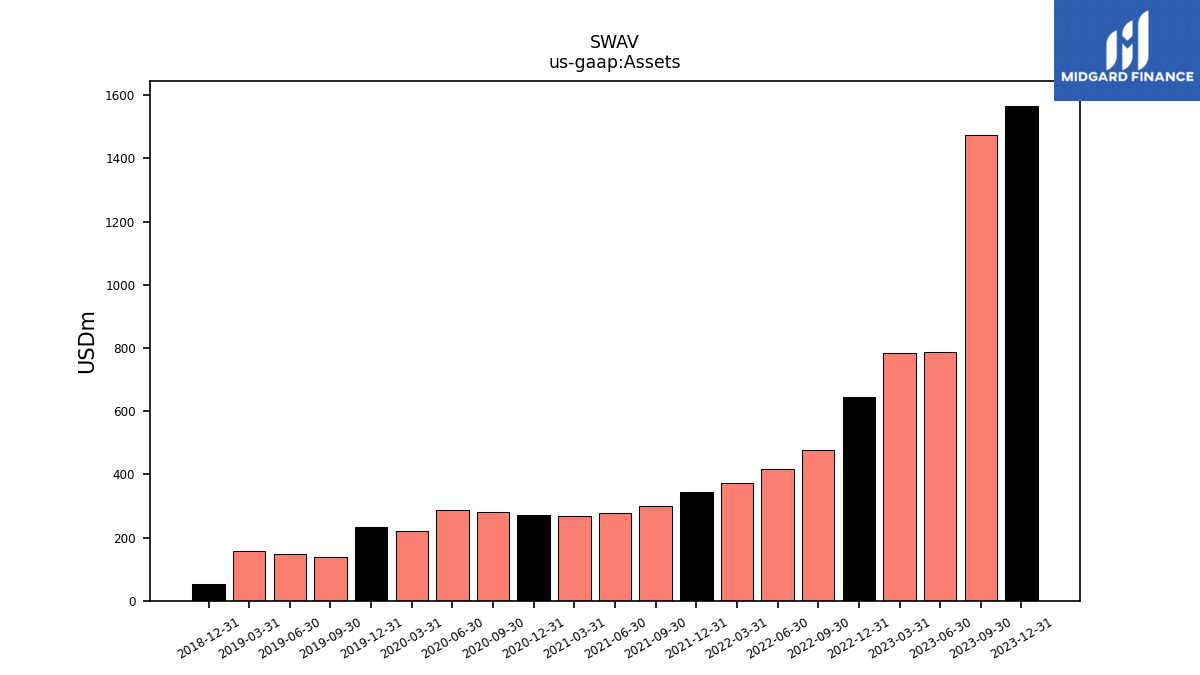
| Assets | 1566.56 | 1473.96 | 786.60 | 783.25 | 646.09 | 475.81 | 417.14 | 372.52 | 345.68 | 299.00 | 276.36 | 269.07 | 272.04 | 280.66 | 287.35 | 220.74 | 231.94 | 137.89 | 146.81 | 157.54 | 53.42 | NA | NA | NA | |
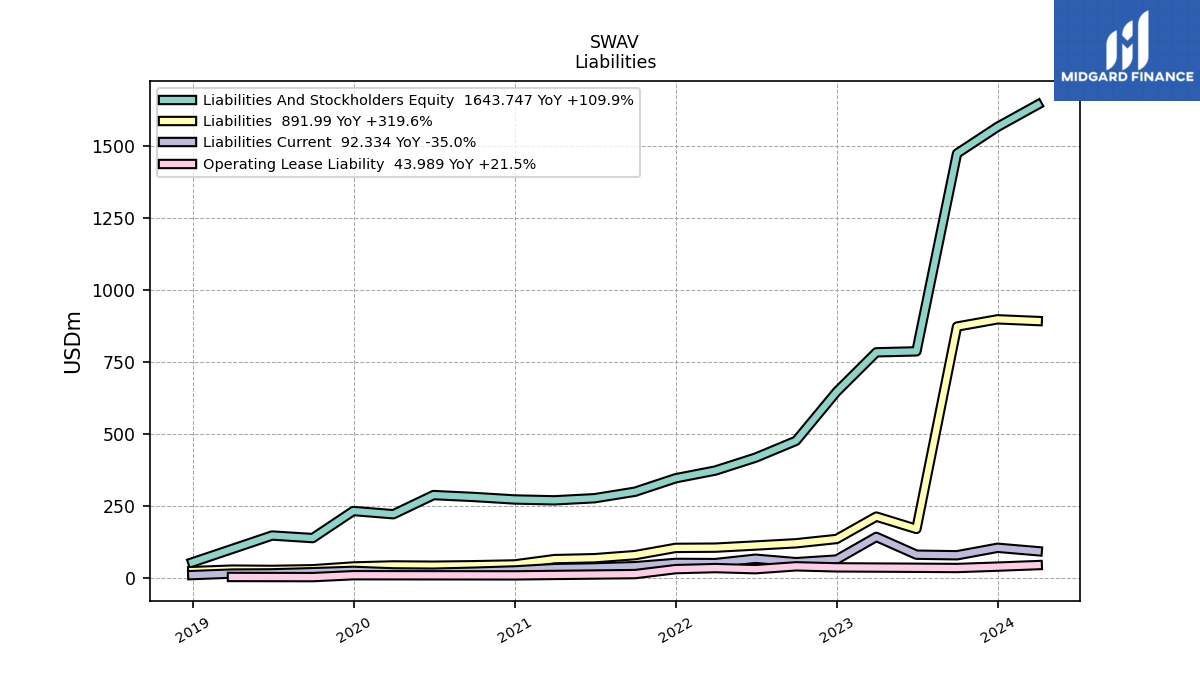
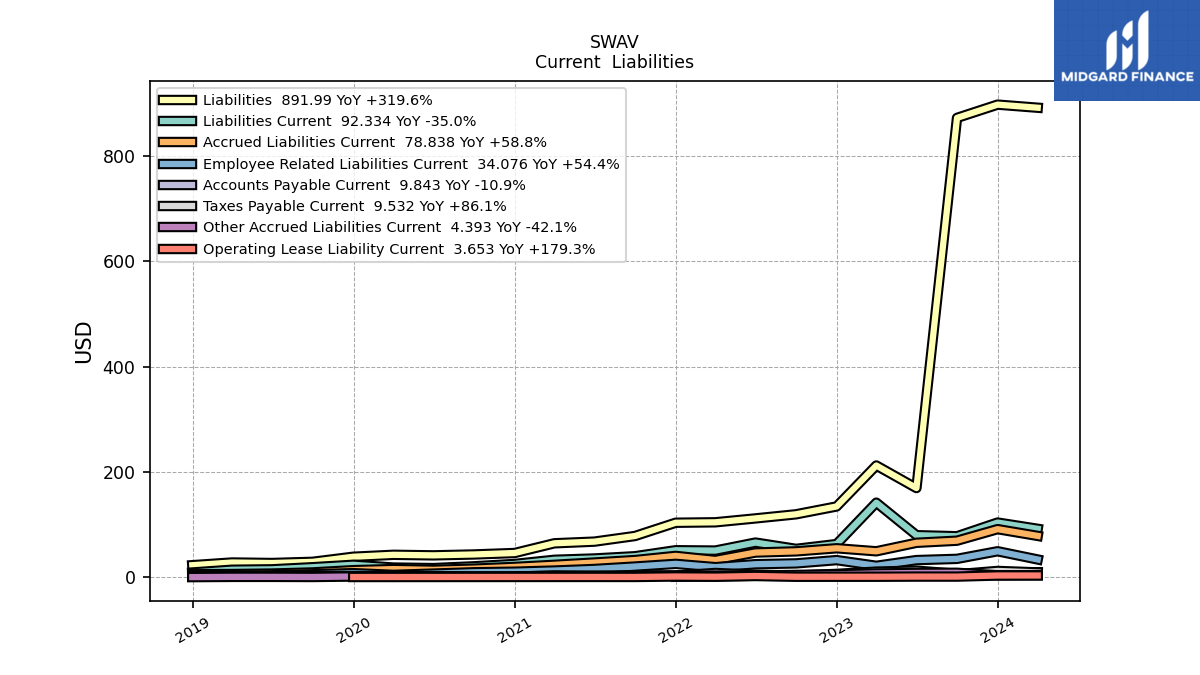
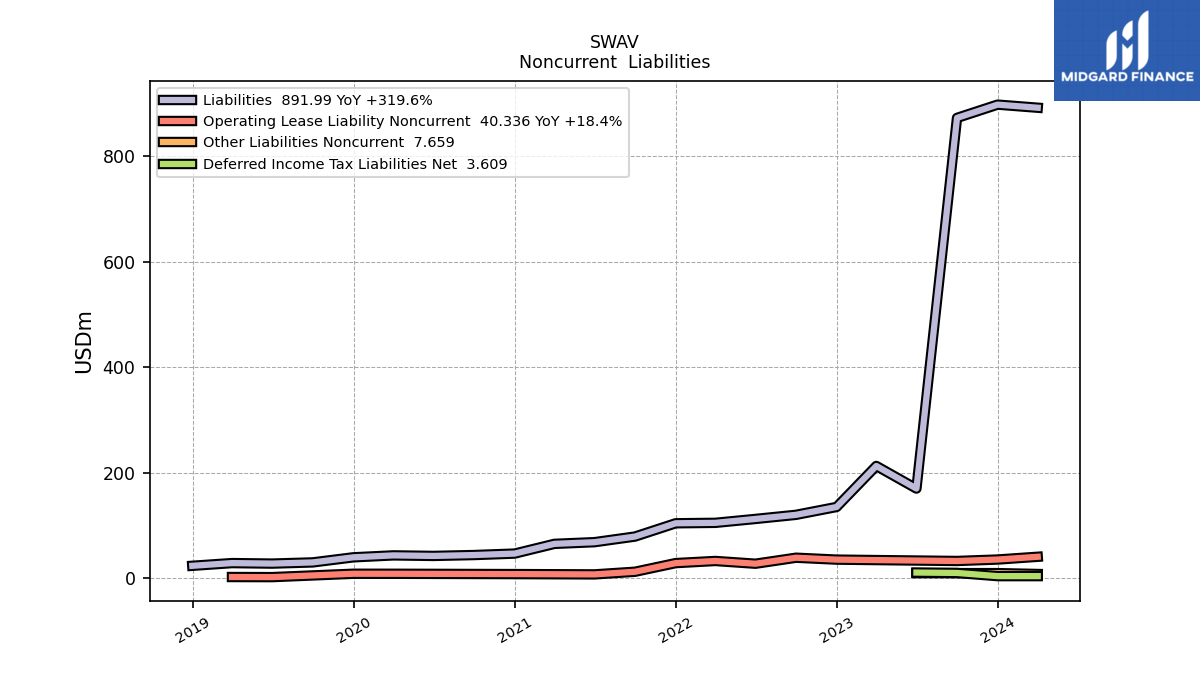
| Liabilities | 897.89 | 872.71 | 169.69 | 212.56 | 134.77 | 119.88 | 112.08 | 104.70 | 103.85 | 78.70 | 68.01 | 64.82 | 46.39 | 43.61 | 41.93 | 42.97 | 39.28 | 29.64 | 27.39 | 28.35 | 23.20 | NA | NA | NA | |
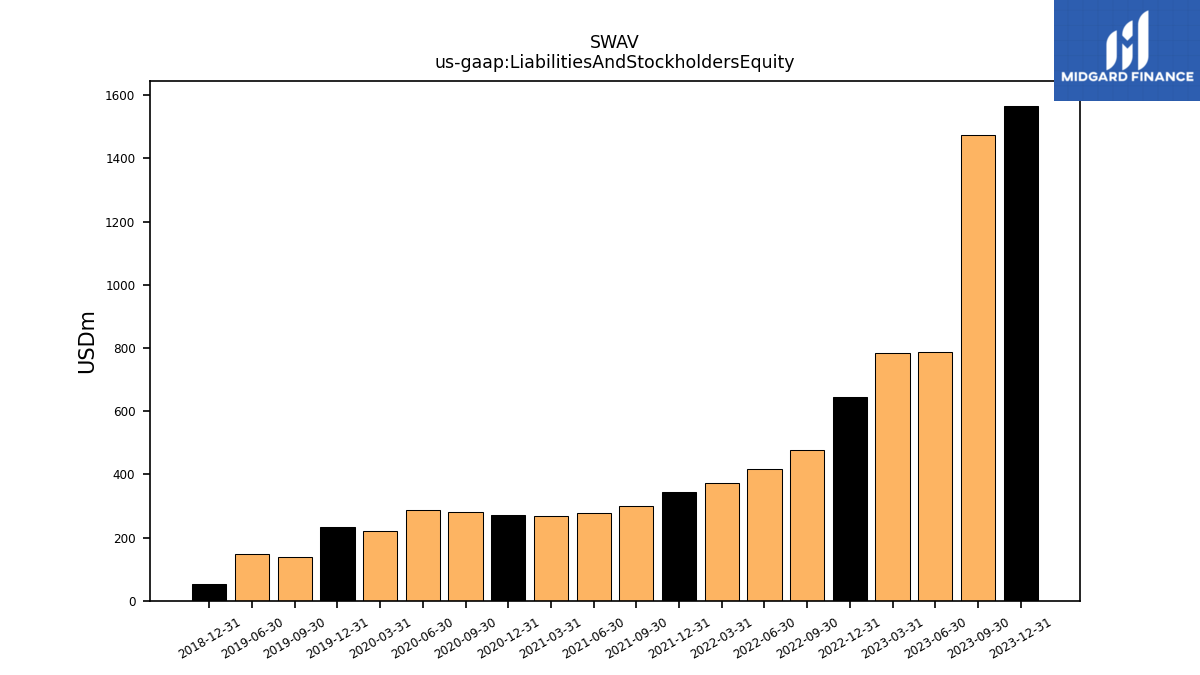
| Liabilities And Stockholders Equity | 1566.56 | 1473.96 | 786.60 | 783.25 | 646.09 | 475.81 | 417.14 | 372.52 | 345.68 | 299.00 | 276.36 | 269.07 | 272.04 | 280.66 | 287.35 | 220.74 | 231.94 | 137.89 | 146.81 | NA | 53.42 | NA | NA | NA | |
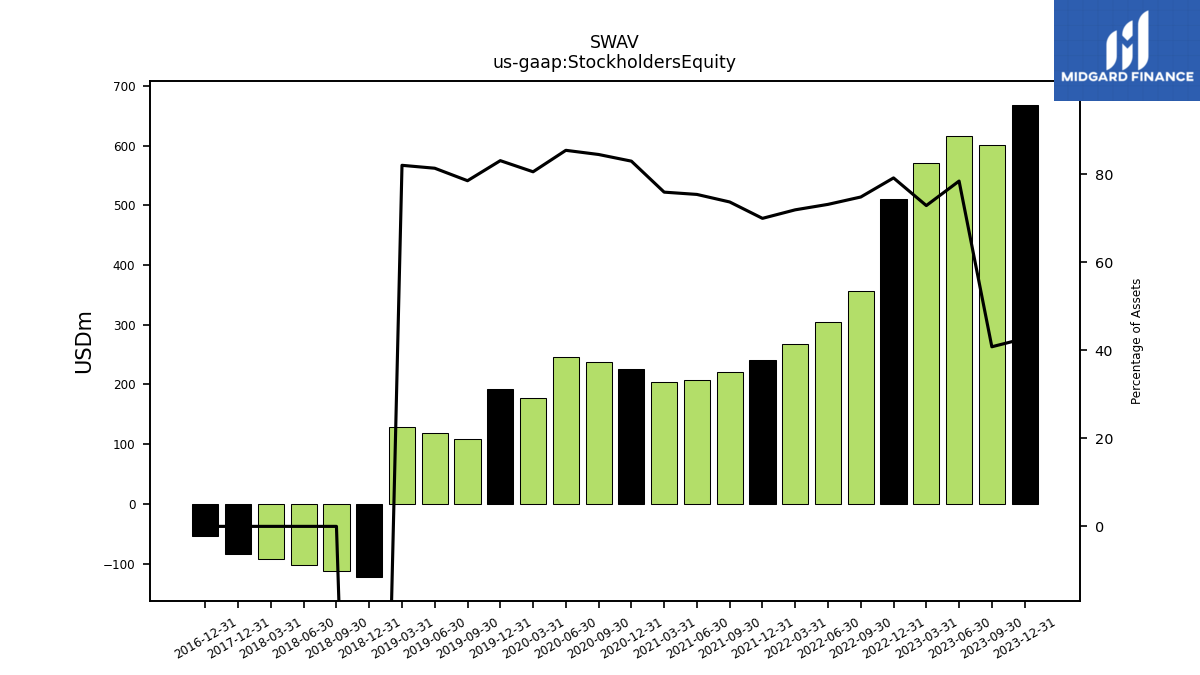
| Stockholders Equity | 668.68 | 601.25 | 616.91 | 570.69 | 511.32 | 355.93 | 305.07 | 267.82 | 241.83 | 220.29 | 208.35 | 204.25 | 225.65 | 237.05 | 245.42 | 177.77 | 192.65 | 108.25 | 119.41 | 129.19 | -122.59 | -111.83 | -101.99 | -92.27 |
| 2023-12-31 | 2023-09-30 | 2023-06-30 | 2023-03-31 | 2022-12-31 | 2022-09-30 | 2022-06-30 | 2022-03-31 | 2021-12-31 | 2021-09-30 | 2021-06-30 | 2021-03-31 | 2020-12-31 | 2020-09-30 | 2020-06-30 | 2020-03-31 | 2019-12-31 | 2019-09-30 | 2019-06-30 | 2019-03-31 | 2018-12-31 | 2018-09-30 | 2018-06-30 | 2018-03-31 | ||
|---|---|---|---|---|---|---|---|---|---|---|---|---|---|---|---|---|---|---|---|---|---|---|---|---|---|
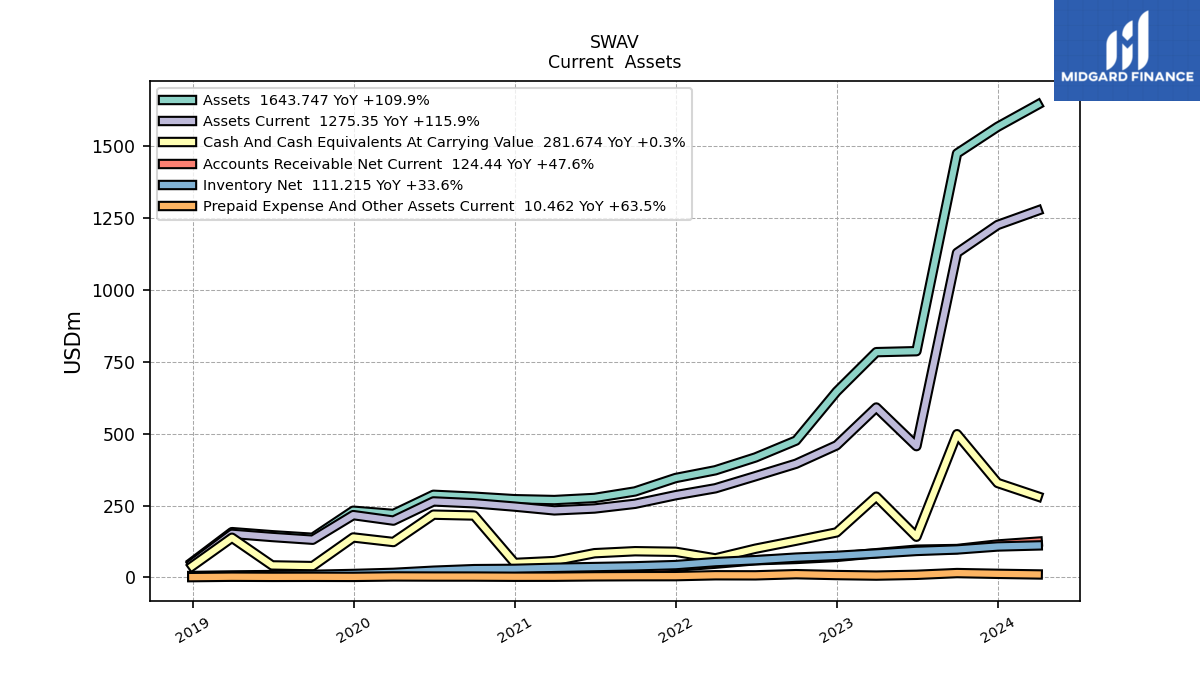
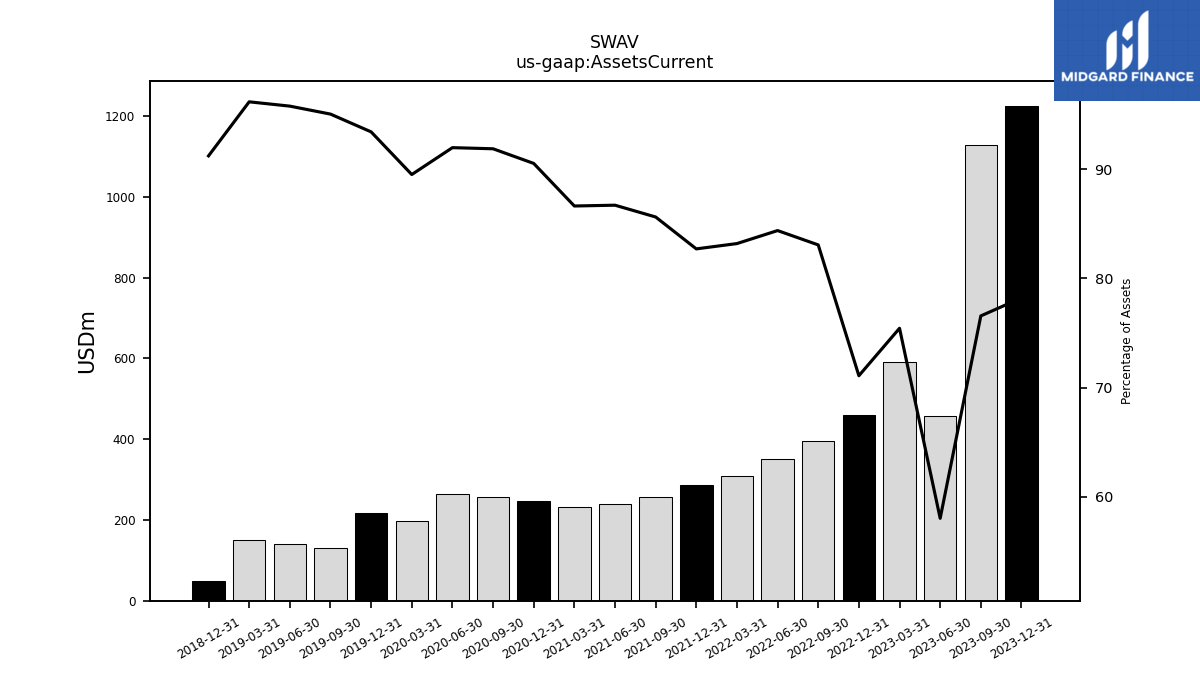
| Assets Current | 1225.26 | 1128.54 | 456.36 | 590.83 | 459.26 | 395.26 | 352.01 | 309.91 | 285.90 | 256.03 | 239.63 | 233.11 | 246.30 | 257.87 | 264.31 | 197.61 | 216.70 | 131.07 | 140.62 | 151.53 | 48.74 | NA | NA | NA | |
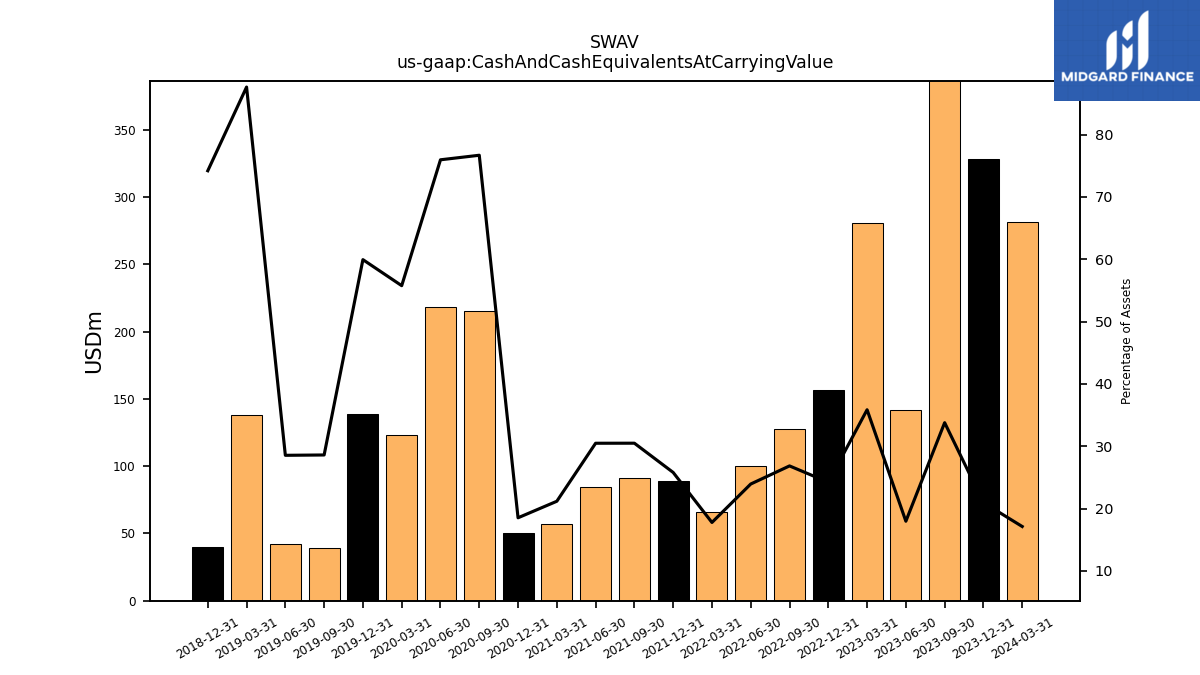
| Cash And Cash Equivalents At Carrying Value | 328.42 | 498.11 | 141.46 | 280.93 | 156.59 | 127.78 | 99.91 | 66.25 | 89.21 | 91.19 | 84.27 | 57.01 | 50.42 | 215.26 | 218.30 | 123.11 | 139.04 | 39.45 | 41.92 | 138.06 | 39.64 | NA | NA | NA | |
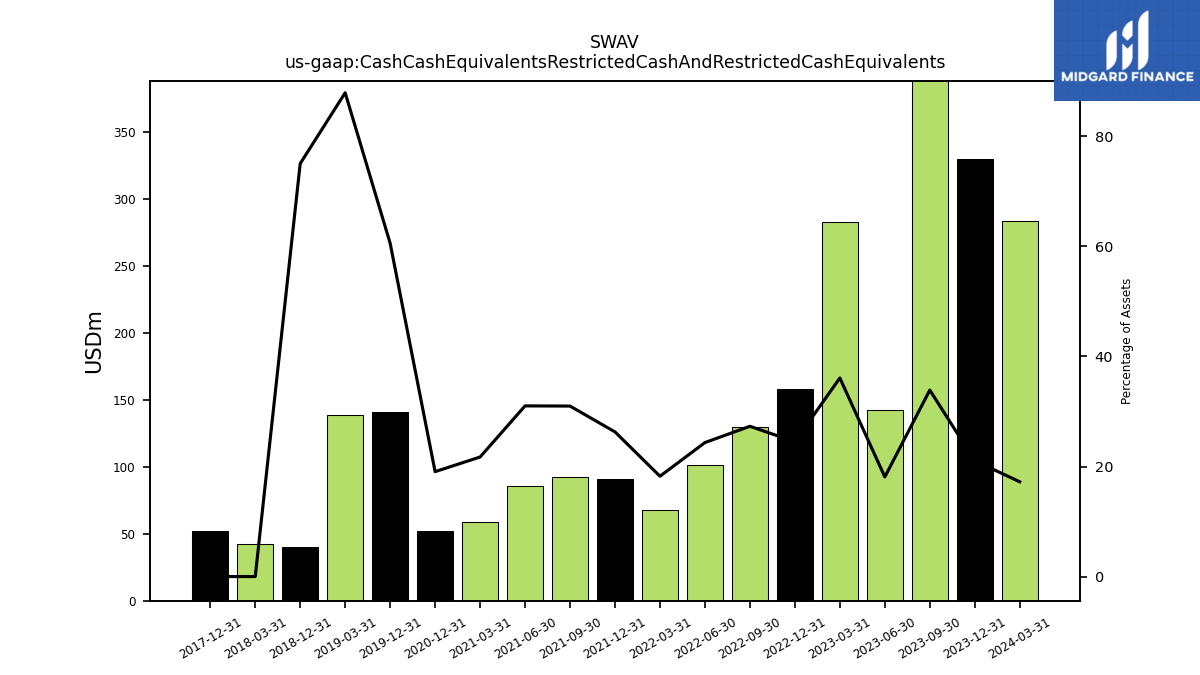
| Cash Cash Equivalents Restricted Cash And Restricted Cash Equivalents | 329.83 | 499.45 | 142.45 | 282.65 | 158.30 | 129.94 | 101.58 | 67.92 | 90.87 | 92.64 | 85.72 | 58.46 | 51.87 | NA | NA | NA | 140.50 | NA | NA | 138.51 | 40.09 | NA | NA | 42.45 | |
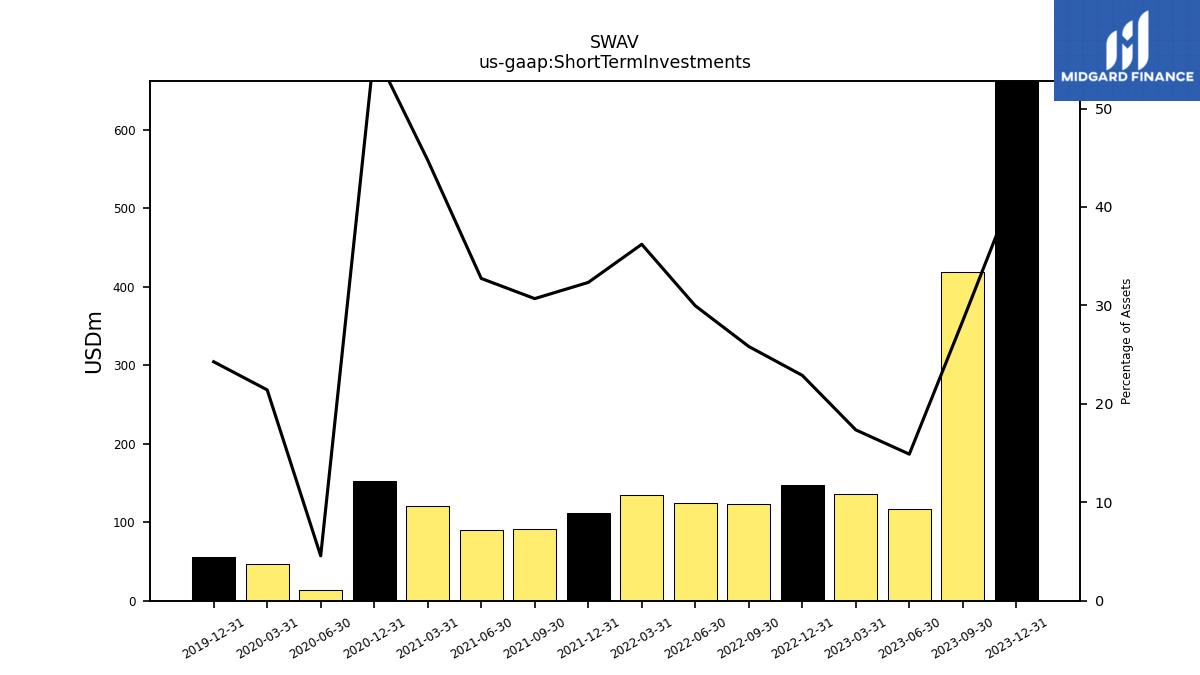
| Short Term Investments | 662.13 | 419.23 | 117.13 | 135.93 | 147.91 | 122.89 | 124.99 | 134.88 | 111.77 | 91.76 | 90.48 | 120.42 | 151.93 | NA | 13.11 | 47.28 | 56.30 | NA | NA | NA | NA | NA | NA | NA | |
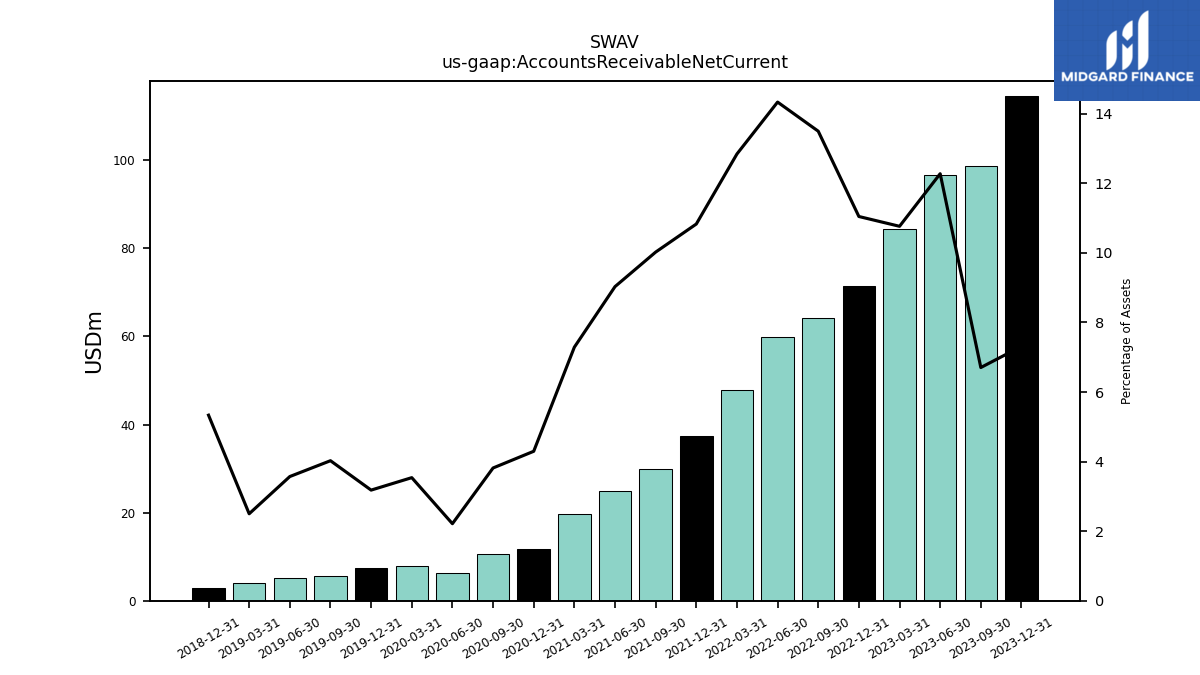
| Accounts Receivable Net Current | 114.55 | 98.82 | 96.56 | 84.31 | 71.37 | 64.22 | 59.80 | 47.84 | 37.44 | 29.97 | 24.95 | 19.61 | 11.69 | 10.71 | 6.37 | 7.81 | 7.38 | 5.55 | 5.24 | 3.94 | 2.85 | NA | NA | NA | |
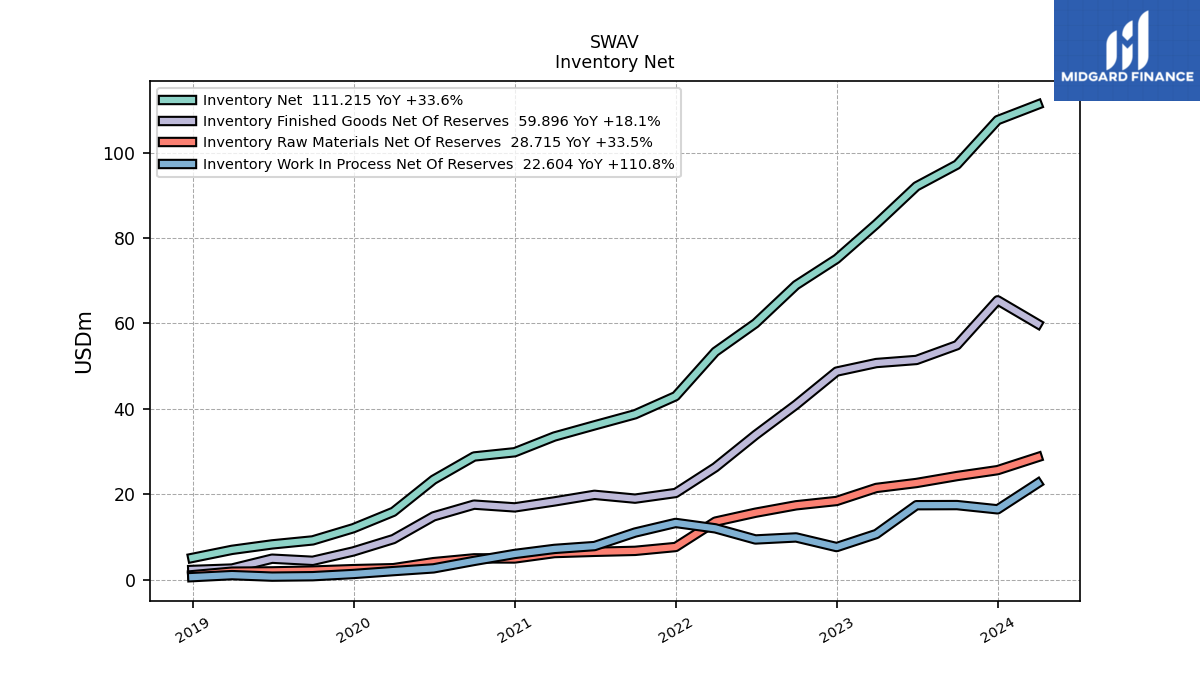
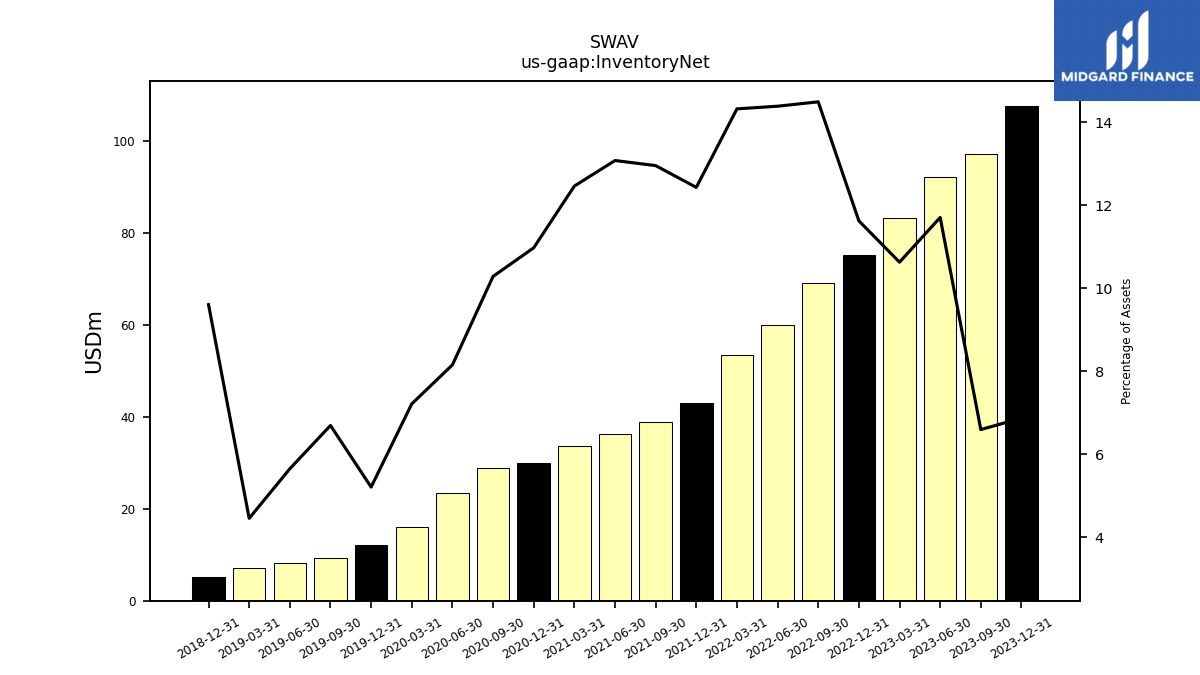
| Inventory Net | 107.59 | 97.18 | 92.09 | 83.26 | 75.11 | 68.97 | 60.03 | 53.37 | 42.98 | 38.74 | 36.15 | 33.54 | 29.86 | 28.87 | 23.43 | 15.92 | 12.07 | 9.23 | 8.29 | 7.01 | 5.13 | NA | NA | NA | |
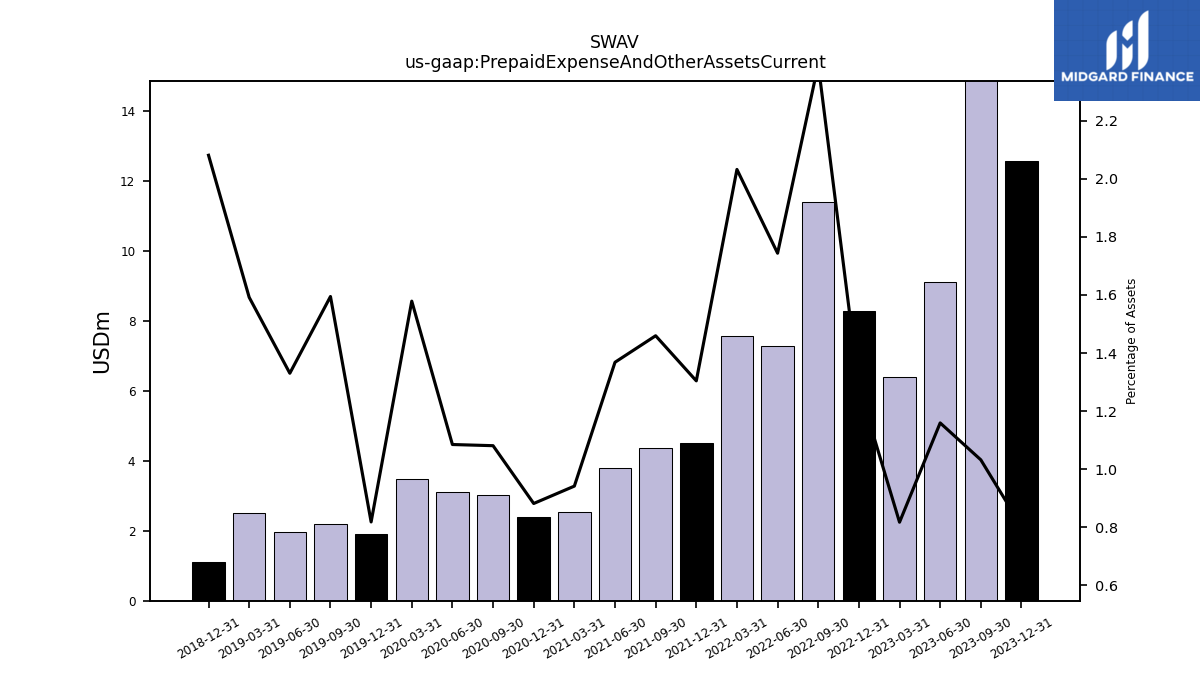
| Prepaid Expense And Other Assets Current | 12.57 | 15.21 | 9.12 | 6.40 | 8.29 | 11.39 | 7.28 | 7.57 | 4.51 | 4.36 | 3.78 | 2.53 | 2.40 | 3.03 | 3.12 | 3.48 | 1.90 | 2.20 | 1.95 | 2.51 | 1.11 | NA | NA | NA |
| 2023-12-31 | 2023-09-30 | 2023-06-30 | 2023-03-31 | 2022-12-31 | 2022-09-30 | 2022-06-30 | 2022-03-31 | 2021-12-31 | 2021-09-30 | 2021-06-30 | 2021-03-31 | 2020-12-31 | 2020-09-30 | 2020-06-30 | 2020-03-31 | 2019-12-31 | 2019-09-30 | 2019-06-30 | 2019-03-31 | 2018-12-31 | 2018-09-30 | 2018-06-30 | 2018-03-31 | ||
|---|---|---|---|---|---|---|---|---|---|---|---|---|---|---|---|---|---|---|---|---|---|---|---|---|---|
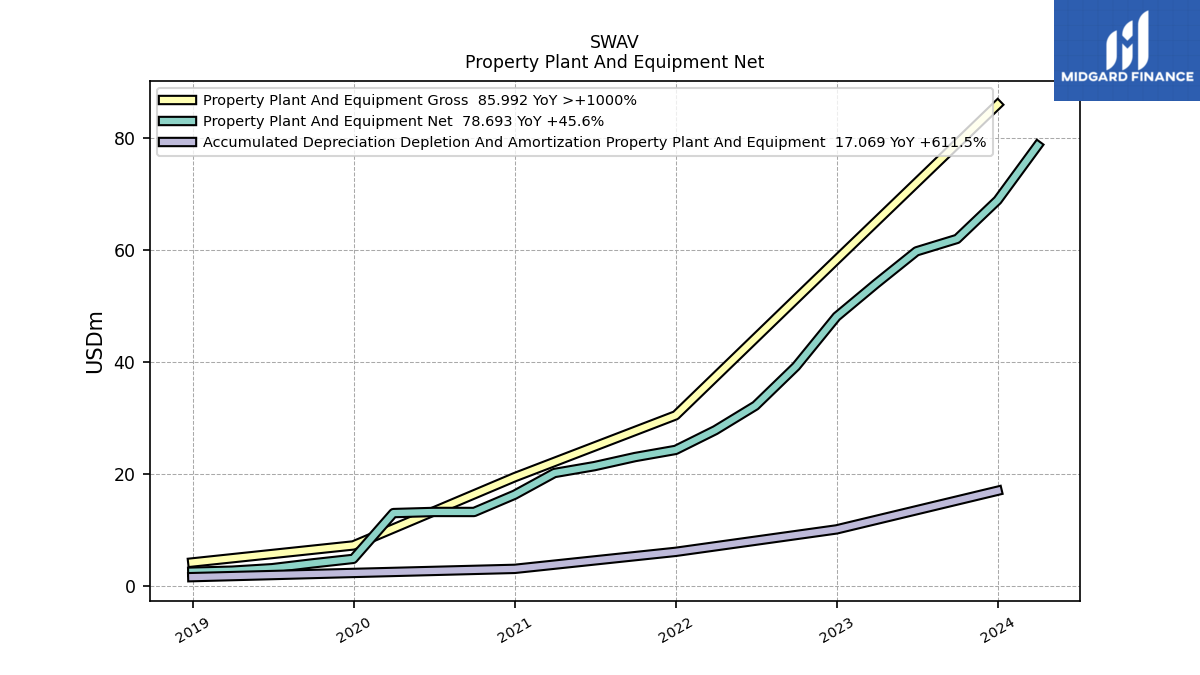
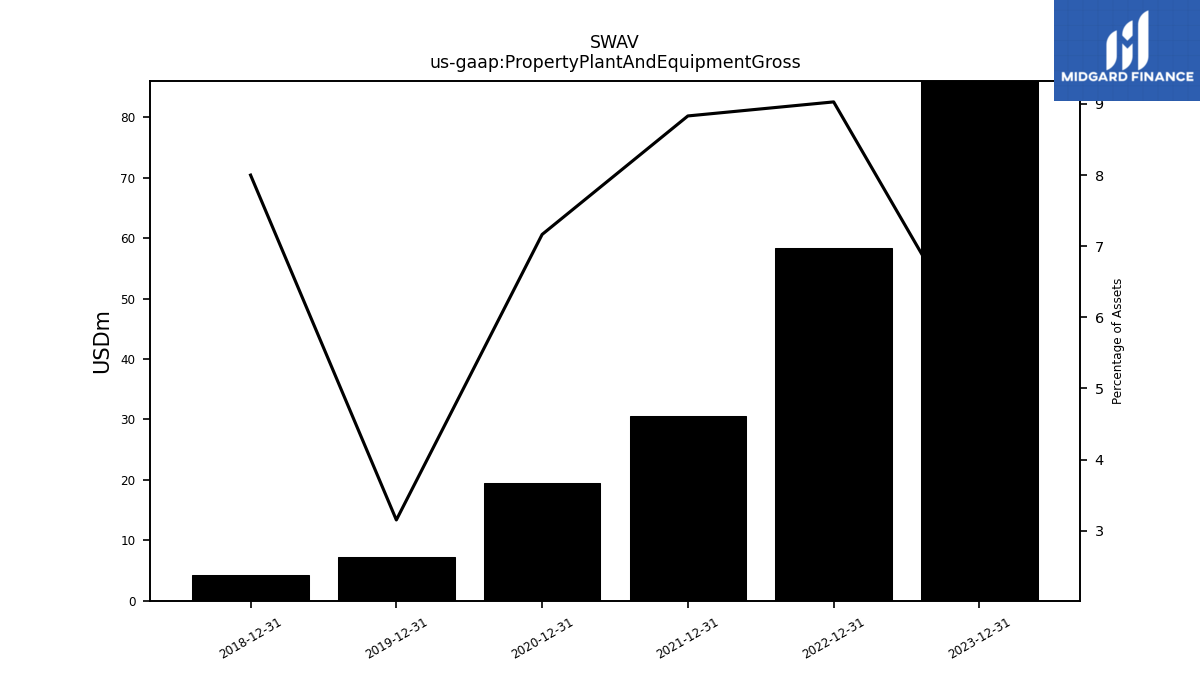
| Property Plant And Equipment Gross | 85.99 | NA | NA | NA | 58.33 | NA | NA | NA | 30.52 | NA | NA | NA | 19.49 | NA | NA | NA | 7.31 | NA | NA | NA | 4.27 | NA | NA | NA | |
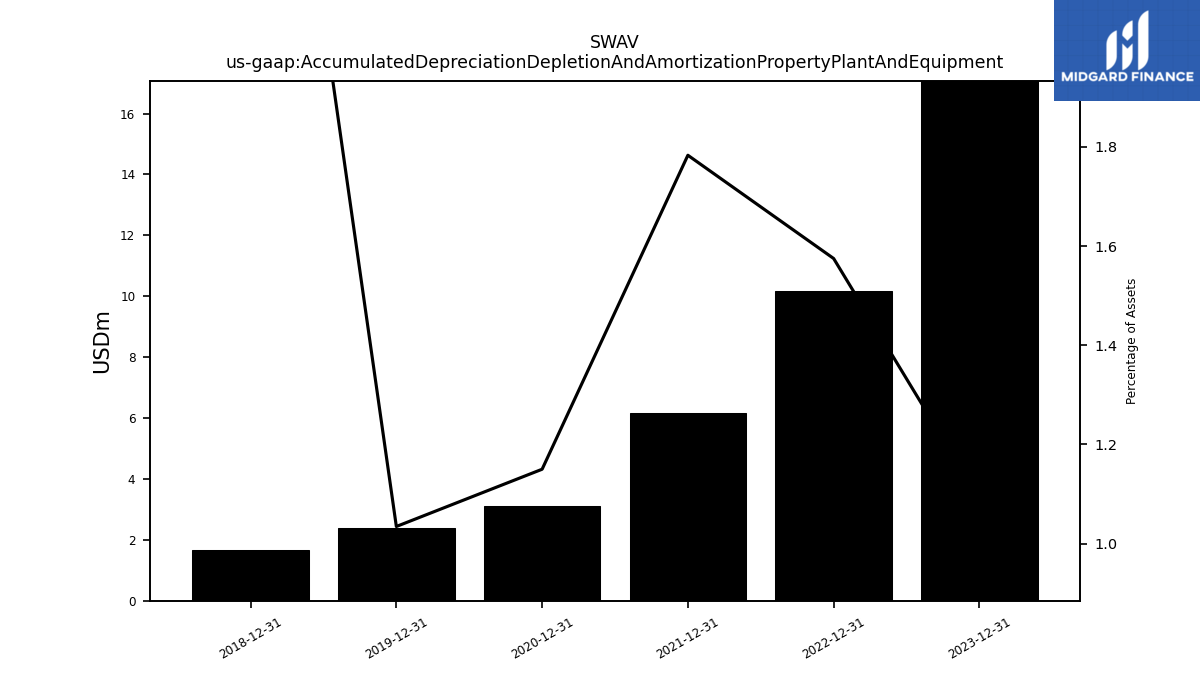
| Accumulated Depreciation Depletion And Amortization Property Plant And Equipment | 17.07 | NA | NA | NA | 10.18 | NA | NA | NA | 6.16 | NA | NA | NA | 3.13 | NA | NA | NA | 2.40 | NA | NA | NA | 1.65 | NA | NA | NA | |
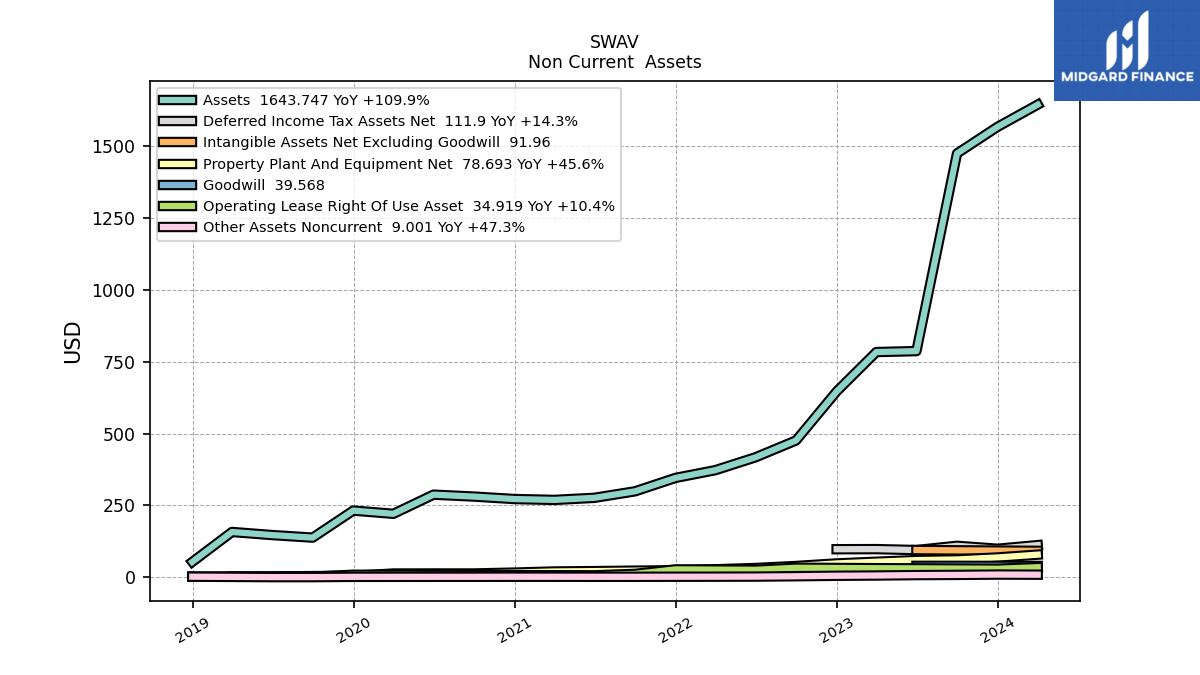
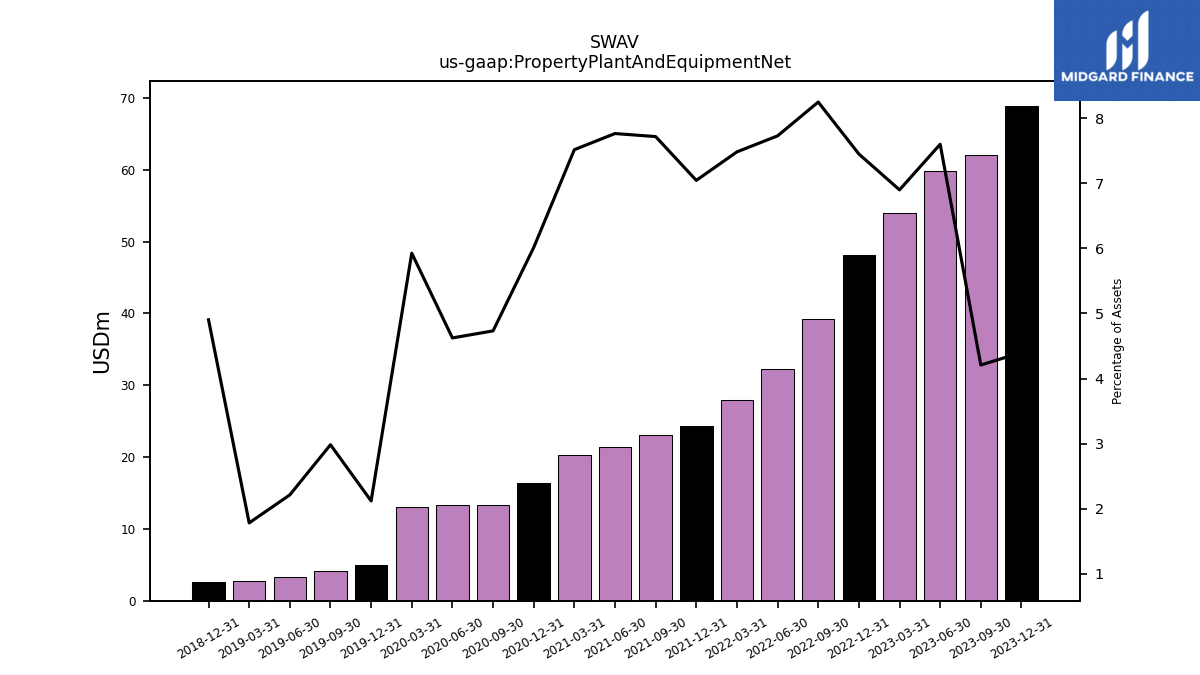
| Property Plant And Equipment Net | 68.92 | 62.02 | 59.80 | 54.06 | 48.15 | 39.27 | 32.25 | 27.89 | 24.36 | 23.09 | 21.47 | 20.23 | 16.36 | 13.28 | 13.29 | 13.08 | 4.91 | 4.11 | 3.24 | 2.80 | 2.62 | NA | NA | NA | |
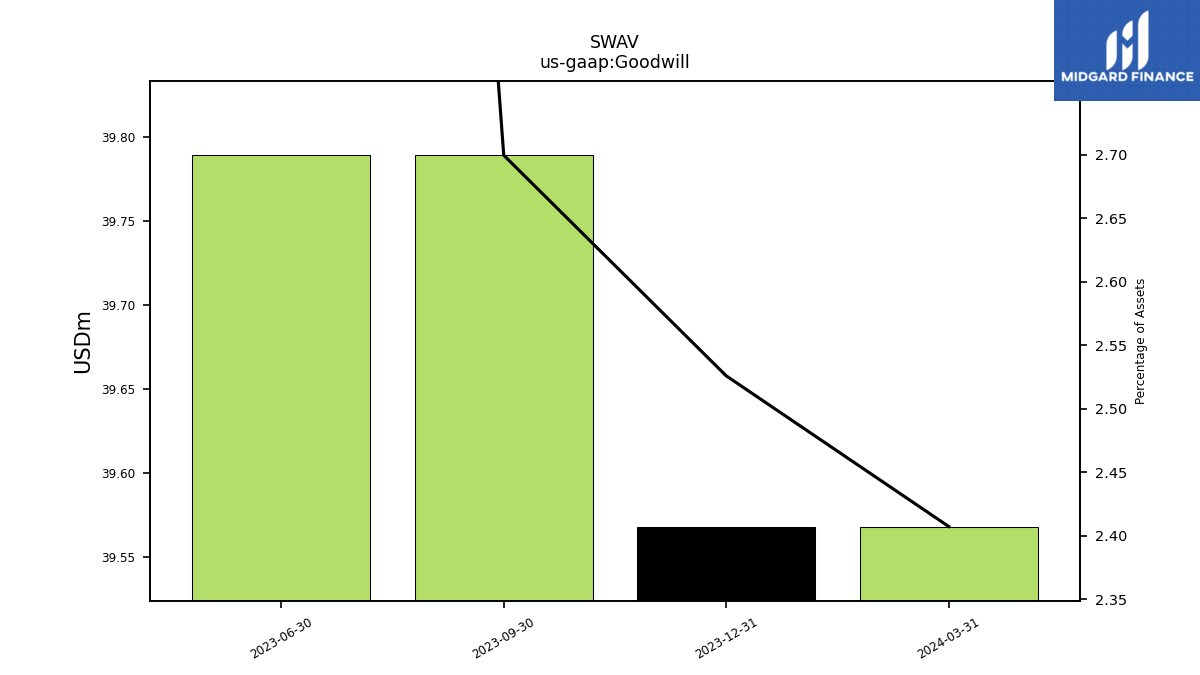
| Goodwill | 39.57 | 39.79 | 39.79 | NA | NA | NA | NA | NA | NA | NA | NA | NA | NA | NA | NA | NA | NA | NA | NA | NA | NA | NA | NA | NA | |
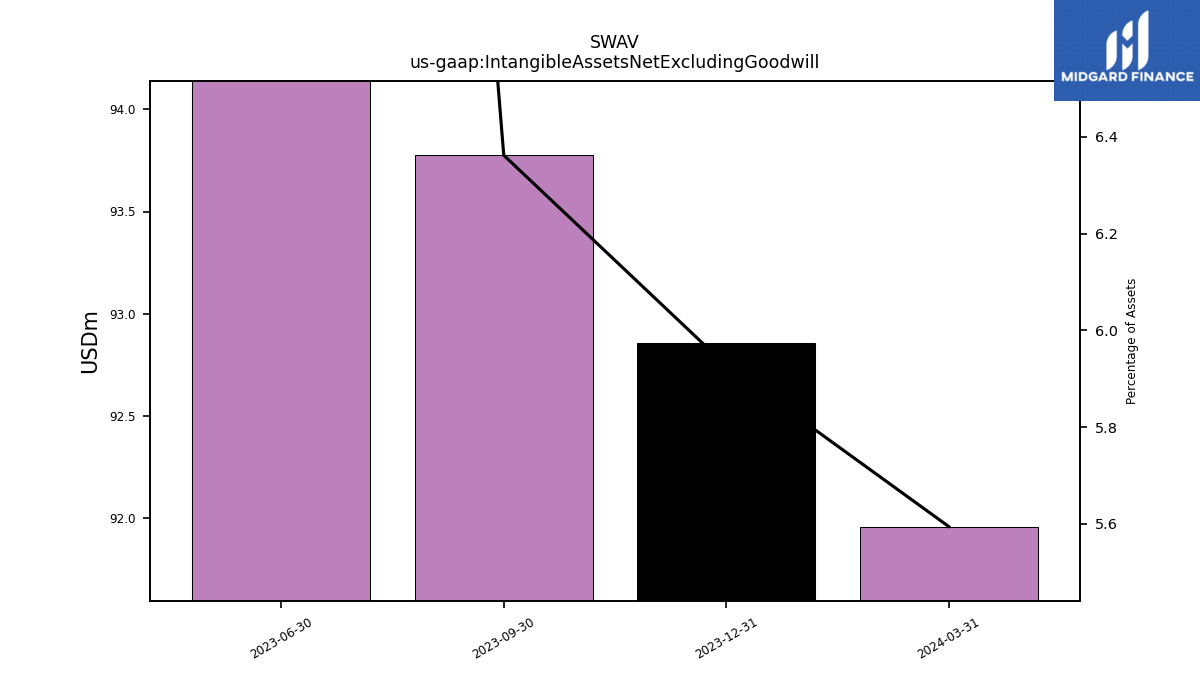
| Intangible Assets Net Excluding Goodwill | 92.86 | 93.78 | 94.69 | NA | NA | NA | NA | NA | NA | NA | NA | NA | NA | NA | NA | NA | NA | NA | NA | NA | NA | NA | NA | NA | |
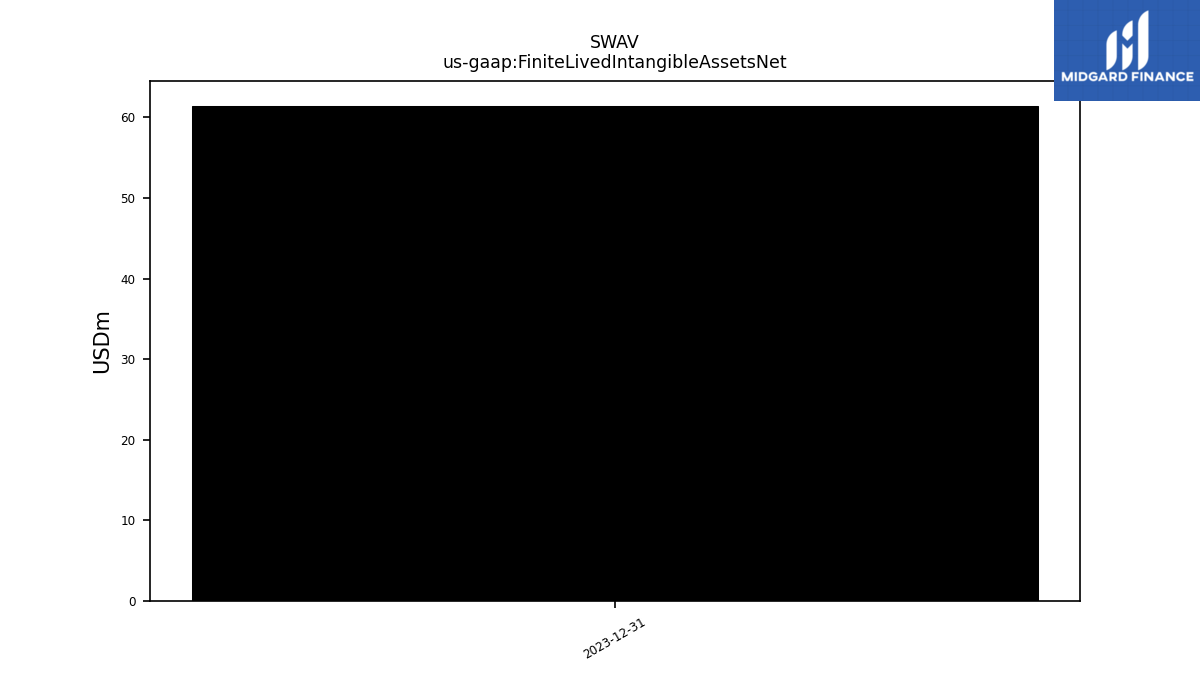
| Finite Lived Intangible Assets Net | 61.46 | NA | NA | NA | NA | NA | NA | NA | NA | NA | NA | NA | NA | NA | NA | NA | NA | NA | NA | NA | NA | NA | NA | NA | |
| Other Assets Noncurrent | 9.44 | 8.23 | 7.60 | 6.11 | 5.23 | 3.61 | 2.37 | 2.06 | 1.94 | 1.68 | 1.69 | 1.76 | 1.81 | 1.67 | 1.62 | 1.55 | 1.51 | 0.55 | 0.54 | NA | 2.07 | NA | NA | NA |
| 2023-12-31 | 2023-09-30 | 2023-06-30 | 2023-03-31 | 2022-12-31 | 2022-09-30 | 2022-06-30 | 2022-03-31 | 2021-12-31 | 2021-09-30 | 2021-06-30 | 2021-03-31 | 2020-12-31 | 2020-09-30 | 2020-06-30 | 2020-03-31 | 2019-12-31 | 2019-09-30 | 2019-06-30 | 2019-03-31 | 2018-12-31 | 2018-09-30 | 2018-06-30 | 2018-03-31 | ||
|---|---|---|---|---|---|---|---|---|---|---|---|---|---|---|---|---|---|---|---|---|---|---|---|---|---|
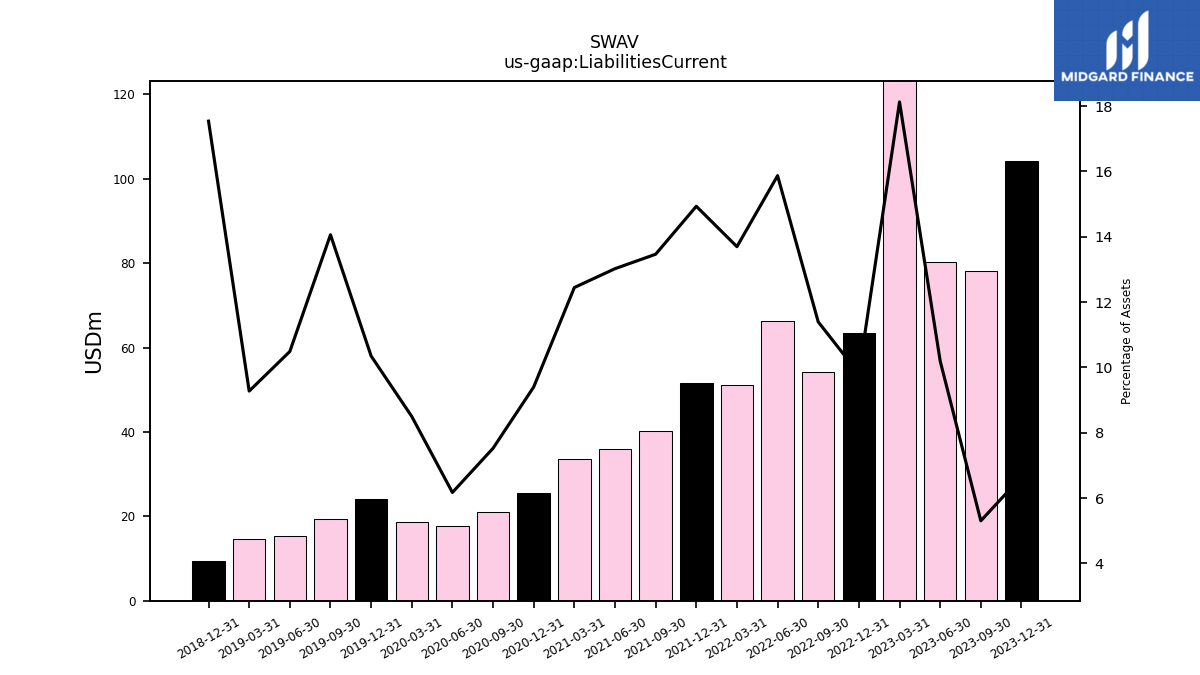
| Liabilities Current | 104.20 | 78.20 | 80.22 | 142.00 | 63.37 | 54.22 | 66.21 | 51.03 | 51.63 | 40.27 | 35.99 | 33.49 | 25.58 | 21.12 | 17.74 | 18.76 | 24.01 | 19.39 | 15.40 | 14.62 | 9.37 | NA | NA | NA | |
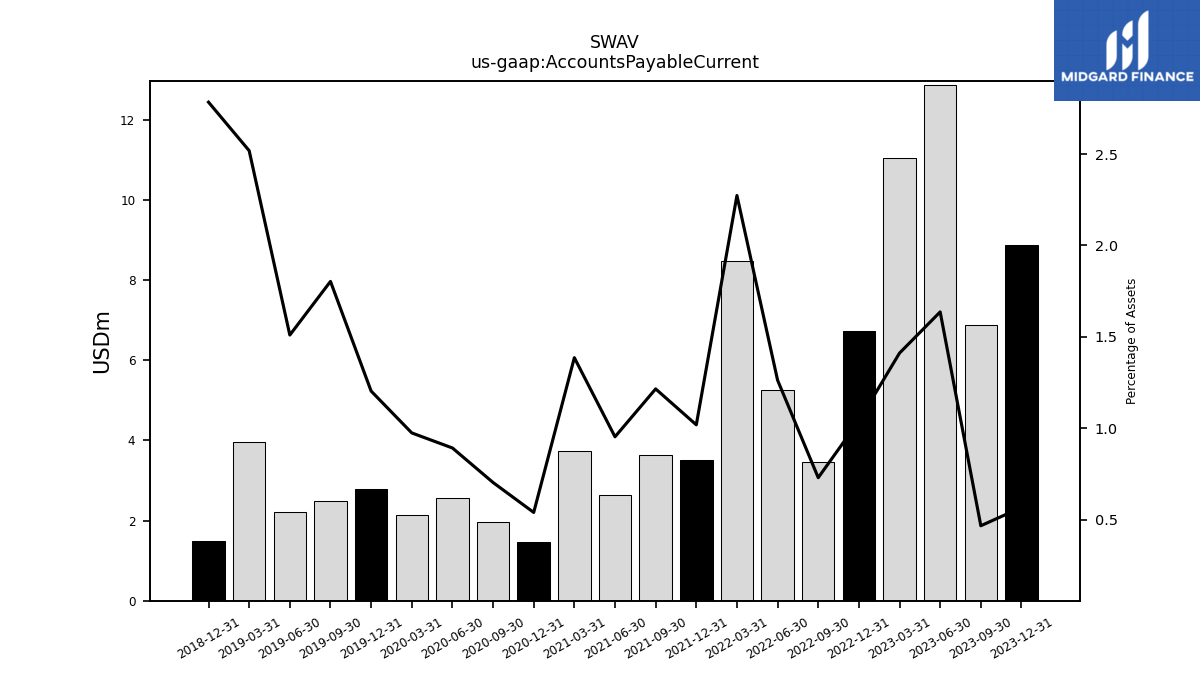
| Accounts Payable Current | 8.87 | 6.87 | 12.87 | 11.05 | 6.72 | 3.47 | 5.27 | 8.47 | 3.52 | 3.63 | 2.63 | 3.73 | 1.47 | 1.97 | 2.56 | 2.15 | 2.79 | 2.49 | 2.22 | 3.97 | 1.49 | NA | NA | NA | |
| Other Accrued Liabilities Current | 4.00 | 8.84 | 8.46 | 7.58 | 5.80 | 4.79 | 3.85 | 3.50 | 3.78 | 3.19 | 3.34 | 2.77 | 2.15 | 1.47 | 1.56 | 1.15 | 1.74 | 0.81 | 1.05 | 1.02 | 0.58 | NA | NA | NA | |
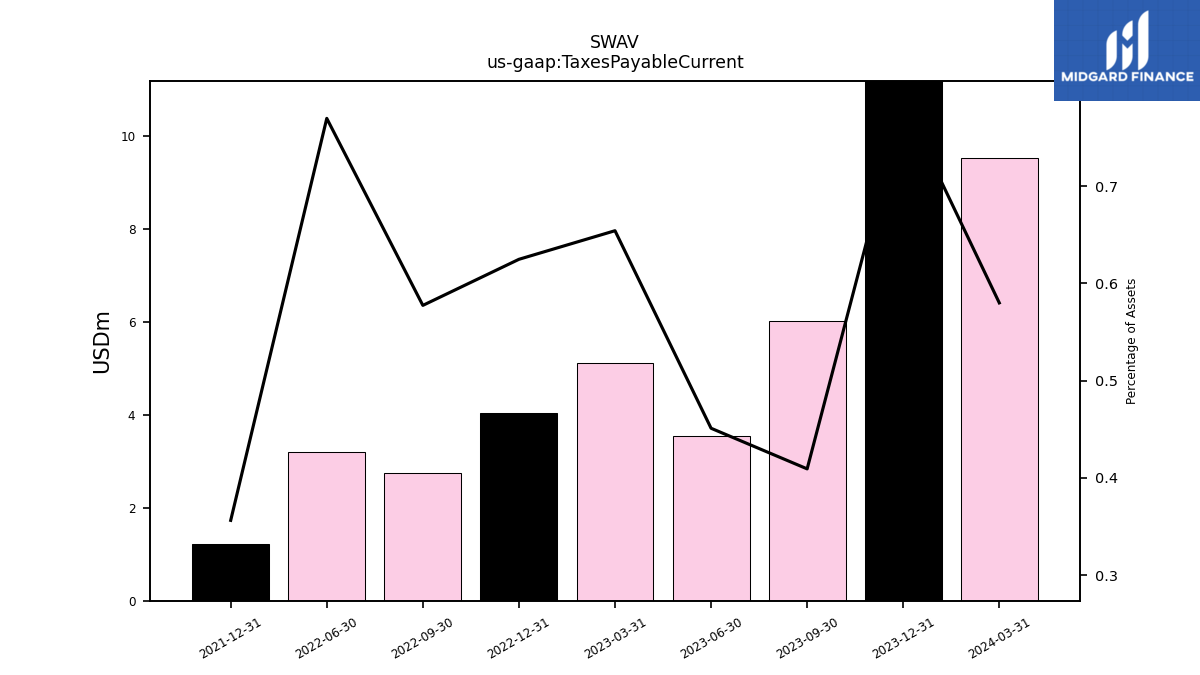
| Taxes Payable Current | 12.32 | 6.03 | 3.55 | 5.12 | 4.04 | 2.75 | 3.21 | NA | 1.23 | NA | NA | NA | NA | NA | NA | NA | NA | NA | NA | NA | NA | NA | NA | NA | |
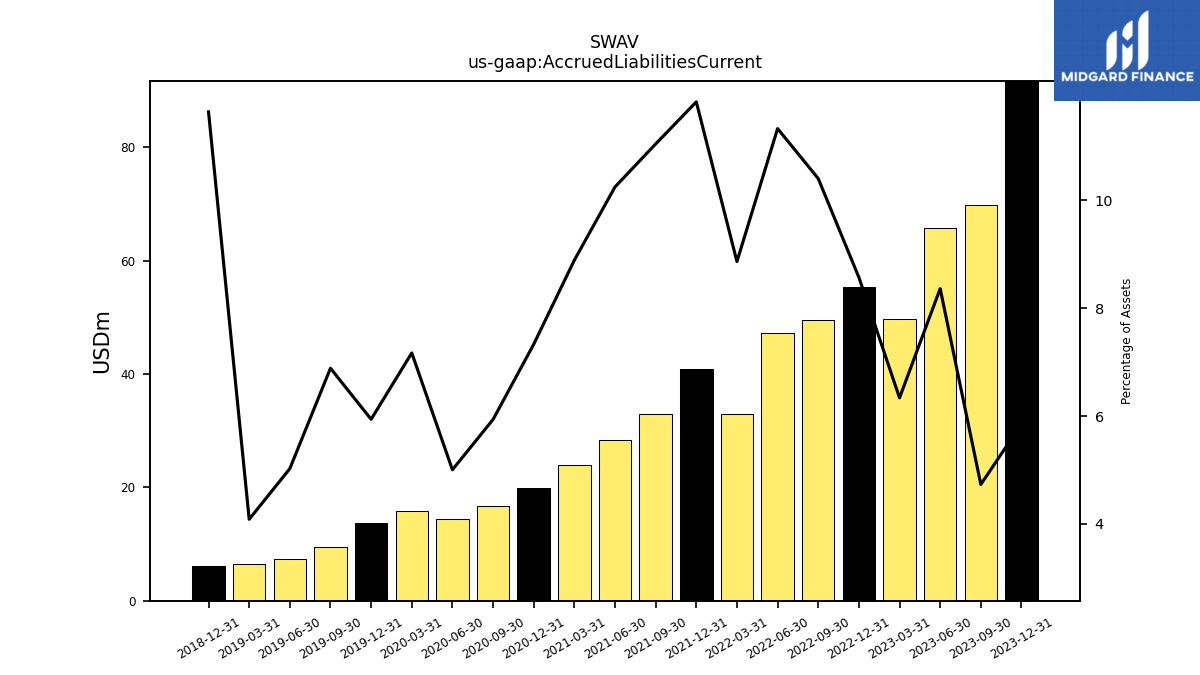
| Accrued Liabilities Current | 91.70 | 69.76 | 65.77 | 49.64 | 55.38 | 49.49 | 47.25 | 33.02 | 40.87 | 33.02 | 28.32 | 23.92 | 19.94 | 16.66 | 14.38 | 15.83 | 13.78 | 9.50 | 7.38 | 6.44 | 6.22 | NA | NA | NA |
| 2023-12-31 | 2023-09-30 | 2023-06-30 | 2023-03-31 | 2022-12-31 | 2022-09-30 | 2022-06-30 | 2022-03-31 | 2021-12-31 | 2021-09-30 | 2021-06-30 | 2021-03-31 | 2020-12-31 | 2020-09-30 | 2020-06-30 | 2020-03-31 | 2019-12-31 | 2019-09-30 | 2019-06-30 | 2019-03-31 | 2018-12-31 | 2018-09-30 | 2018-06-30 | 2018-03-31 | ||
|---|---|---|---|---|---|---|---|---|---|---|---|---|---|---|---|---|---|---|---|---|---|---|---|---|---|
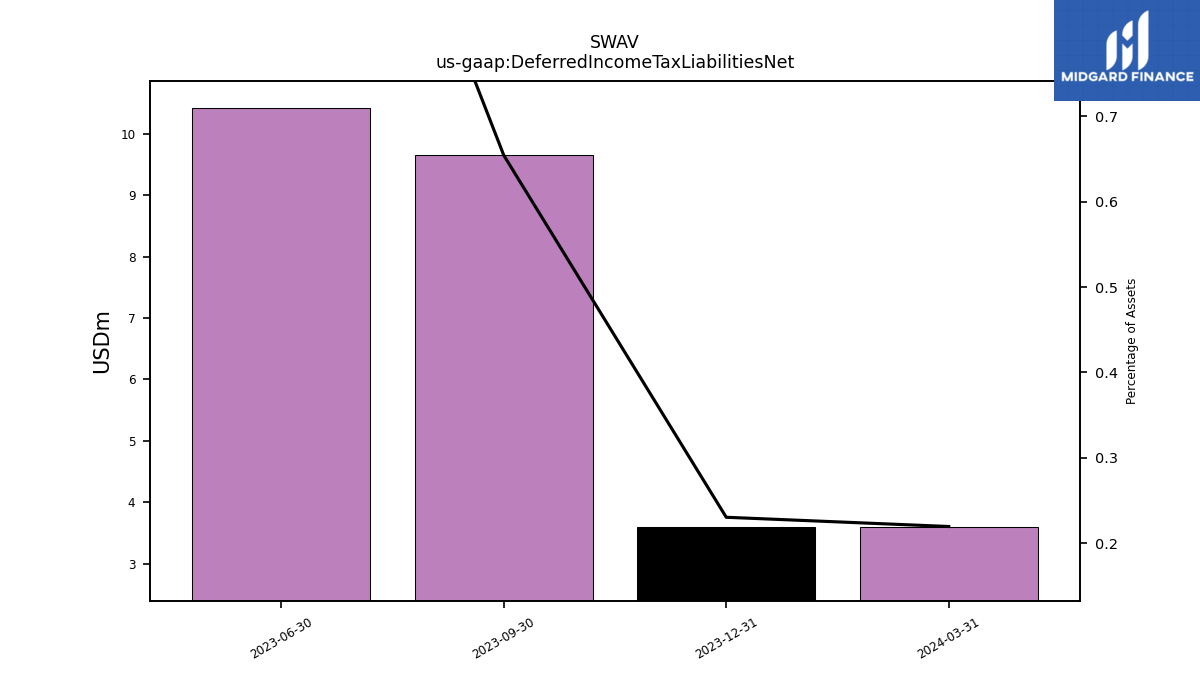
| Deferred Income Tax Liabilities Net | 3.61 | 9.65 | 10.42 | NA | NA | NA | NA | NA | NA | NA | NA | NA | NA | NA | NA | NA | NA | NA | NA | NA | NA | NA | NA | NA | |
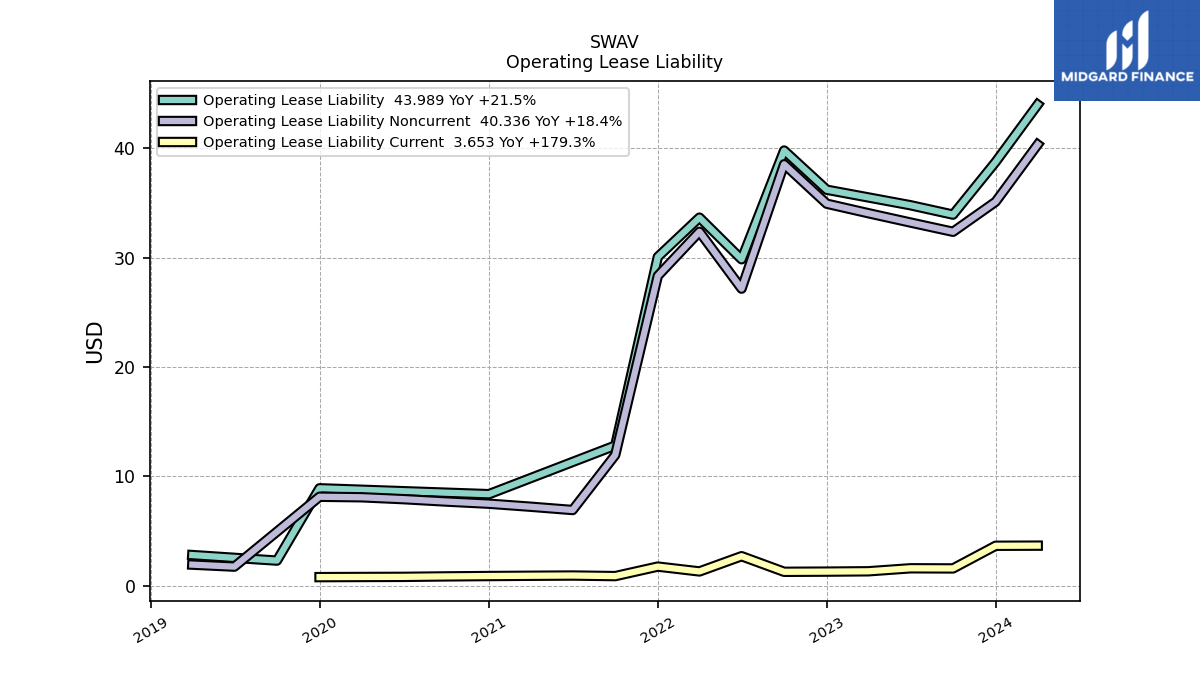
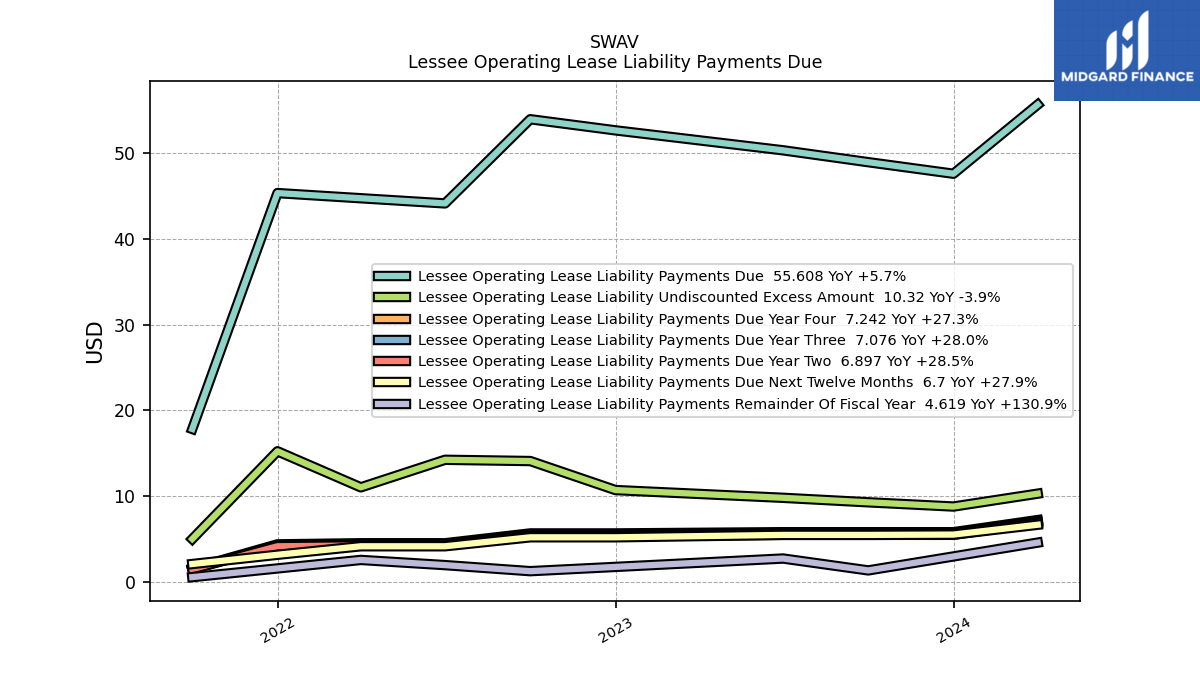
| Operating Lease Liability Noncurrent | 35.10 | 32.36 | 33.20 | 34.06 | 34.93 | 38.53 | 27.16 | 32.36 | 28.32 | 11.94 | 6.91 | 7.21 | 7.49 | 7.68 | 7.90 | 8.08 | 8.12 | NA | 1.73 | 1.92 | NA | NA | NA | NA |
| 2023-12-31 | 2023-09-30 | 2023-06-30 | 2023-03-31 | 2022-12-31 | 2022-09-30 | 2022-06-30 | 2022-03-31 | 2021-12-31 | 2021-09-30 | 2021-06-30 | 2021-03-31 | 2020-12-31 | 2020-09-30 | 2020-06-30 | 2020-03-31 | 2019-12-31 | 2019-09-30 | 2019-06-30 | 2019-03-31 | 2018-12-31 | 2018-09-30 | 2018-06-30 | 2018-03-31 | ||
|---|---|---|---|---|---|---|---|---|---|---|---|---|---|---|---|---|---|---|---|---|---|---|---|---|---|
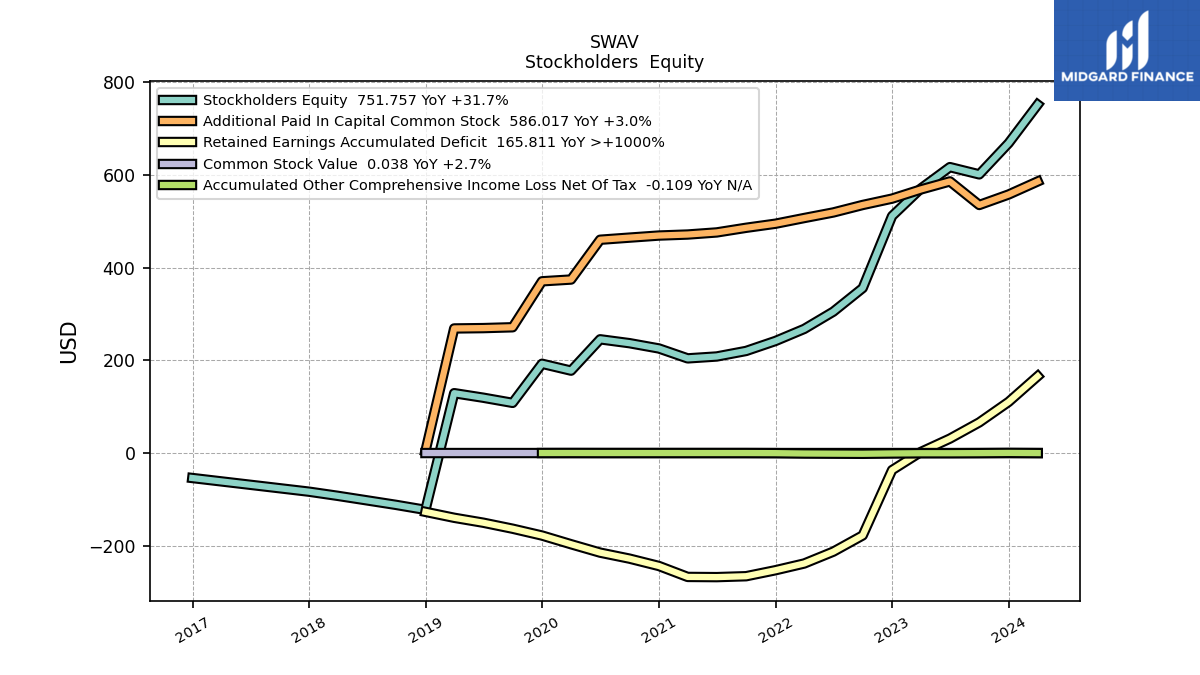
| Stockholders Equity | 668.68 | 601.25 | 616.91 | 570.69 | 511.32 | 355.93 | 305.07 | 267.82 | 241.83 | 220.29 | 208.35 | 204.25 | 225.65 | 237.05 | 245.42 | 177.77 | 192.65 | 108.25 | 119.41 | 129.19 | -122.59 | -111.83 | -101.99 | -92.27 | |
| Common Stock Value | 0.04 | 0.04 | 0.04 | 0.04 | 0.04 | 0.04 | 0.04 | 0.04 | 0.04 | 0.04 | 0.04 | 0.04 | 0.04 | 0.03 | 0.03 | 0.03 | 0.03 | 0.03 | 0.03 | 0.03 | 0.00 | NA | NA | NA | |
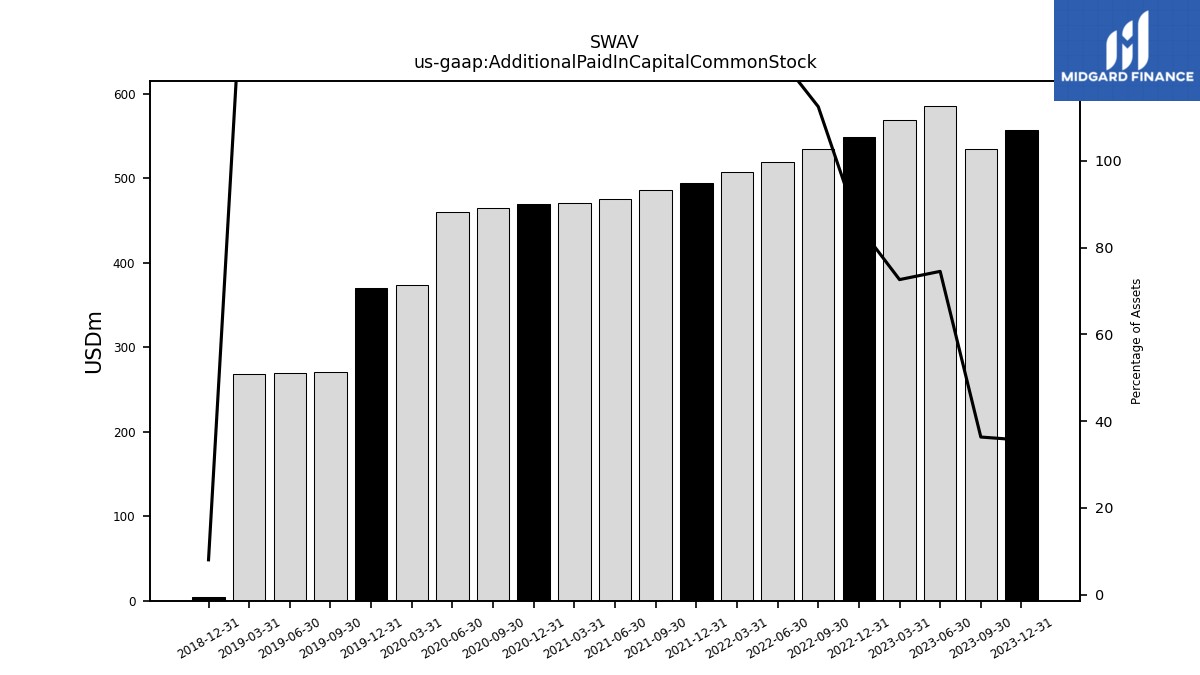
| Additional Paid In Capital Common Stock | 557.88 | 535.20 | 586.09 | 568.71 | 548.96 | 535.23 | 519.10 | 507.09 | 494.81 | 486.01 | 476.00 | 471.48 | 469.28 | 464.81 | 460.24 | 374.39 | 370.56 | 271.39 | 269.58 | 268.82 | 4.28 | NA | NA | NA | |
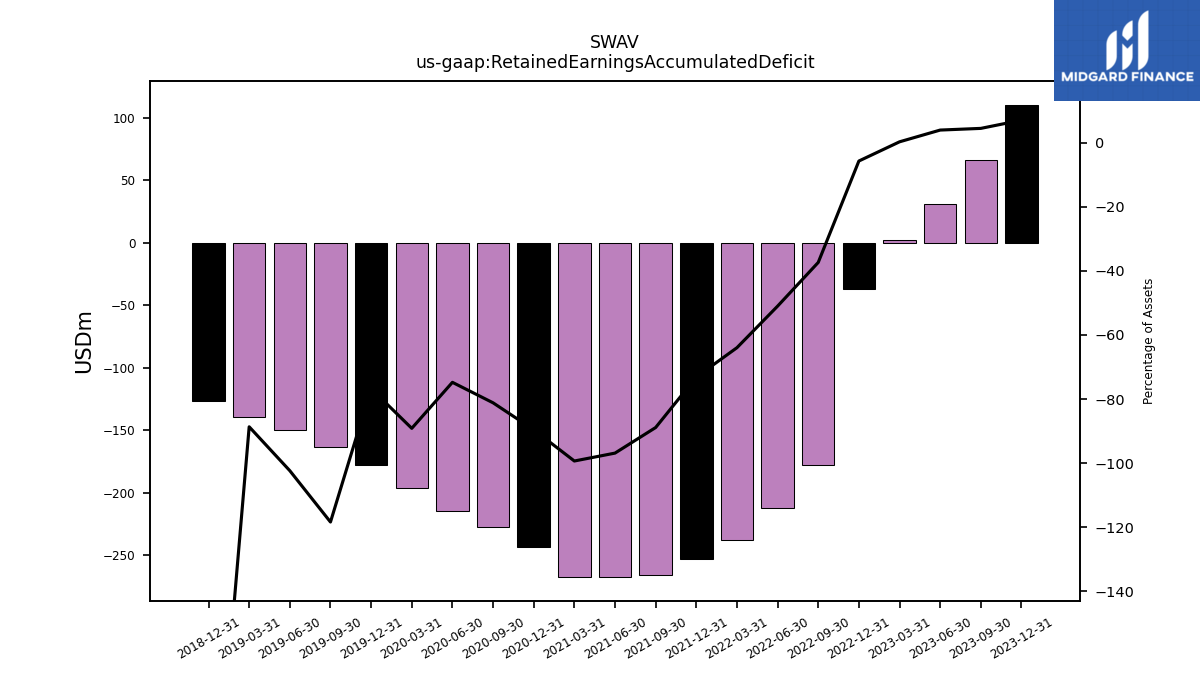
| Retained Earnings Accumulated Deficit | 110.47 | 66.16 | 31.17 | 2.31 | -36.81 | -177.72 | -212.73 | -238.29 | -252.81 | -265.75 | -267.70 | -267.27 | -243.67 | -227.80 | -214.87 | -196.75 | -177.97 | -163.23 | -150.27 | -139.66 | -126.86 | NA | NA | NA | |
| Accumulated Other Comprehensive Income Loss Net Of Tax | 0.29 | -0.15 | -0.39 | -0.37 | -0.87 | -1.61 | -1.34 | -1.02 | -0.20 | -0.01 | 0.01 | 0.02 | 0.01 | NA | 0.02 | 0.10 | 0.04 | NA | NA | NA | NA | NA | NA | NA |
| 2023-12-31 | 2023-09-30 | 2023-06-30 | 2023-03-31 | 2022-12-31 | 2022-09-30 | 2022-06-30 | 2022-03-31 | 2021-12-31 | 2021-09-30 | 2021-06-30 | 2021-03-31 | 2020-12-31 | 2020-09-30 | 2020-06-30 | 2020-03-31 | 2019-12-31 | 2019-09-30 | 2019-06-30 | 2019-03-31 | 2018-12-31 | 2018-09-30 | 2018-06-30 | 2018-03-31 | ||
|---|---|---|---|---|---|---|---|---|---|---|---|---|---|---|---|---|---|---|---|---|---|---|---|---|---|
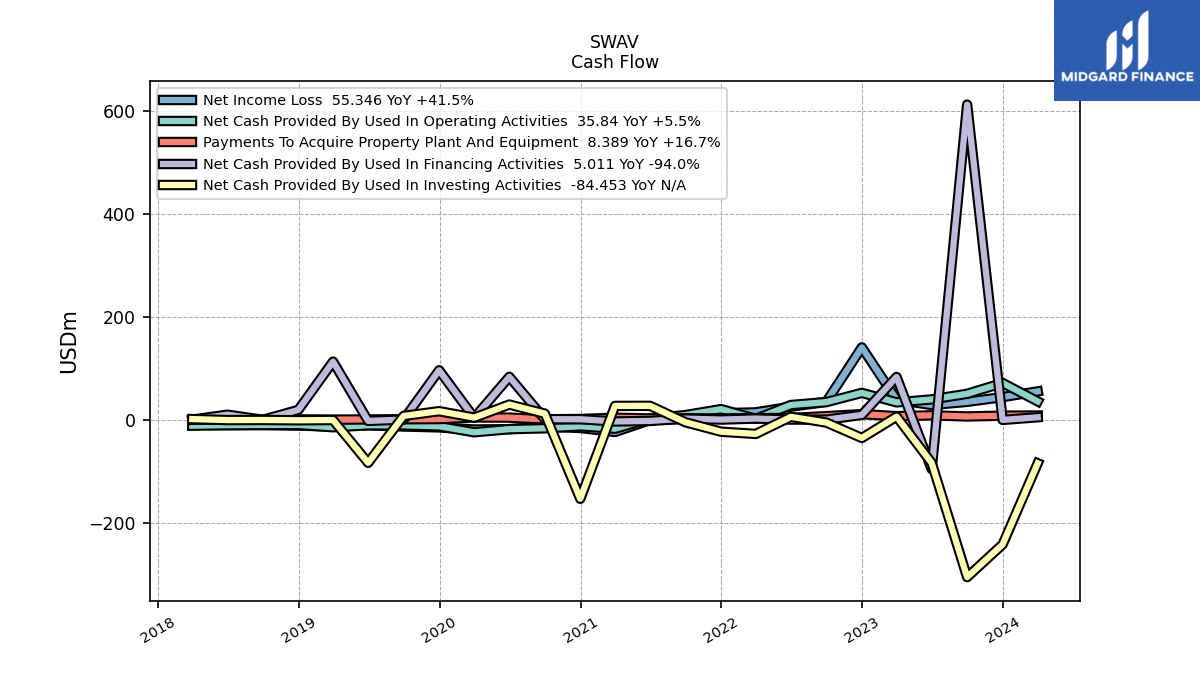
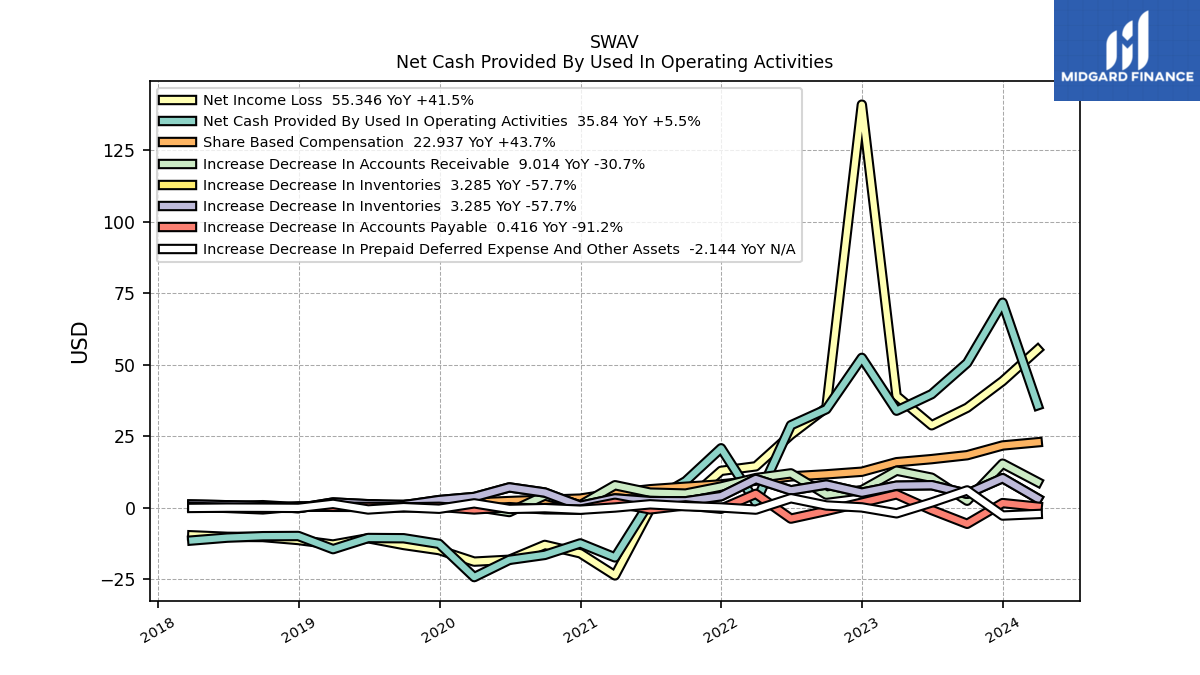
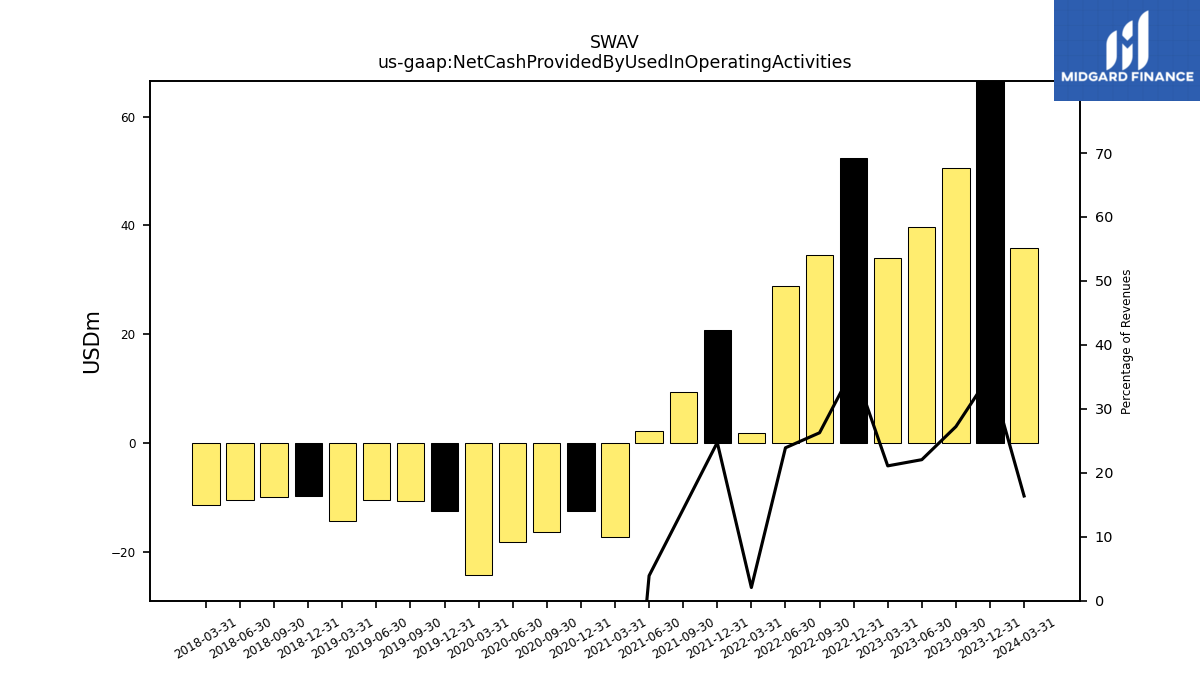
| Net Cash Provided By Used In Operating Activities | 71.70 | 50.65 | 39.74 | 33.96 | 52.44 | 34.49 | 28.87 | 1.94 | 20.83 | 9.32 | 2.19 | -17.30 | -12.40 | -16.43 | -18.17 | -24.19 | -12.57 | -10.60 | -10.52 | -14.41 | -9.81 | -9.88 | -10.39 | -11.38 | |
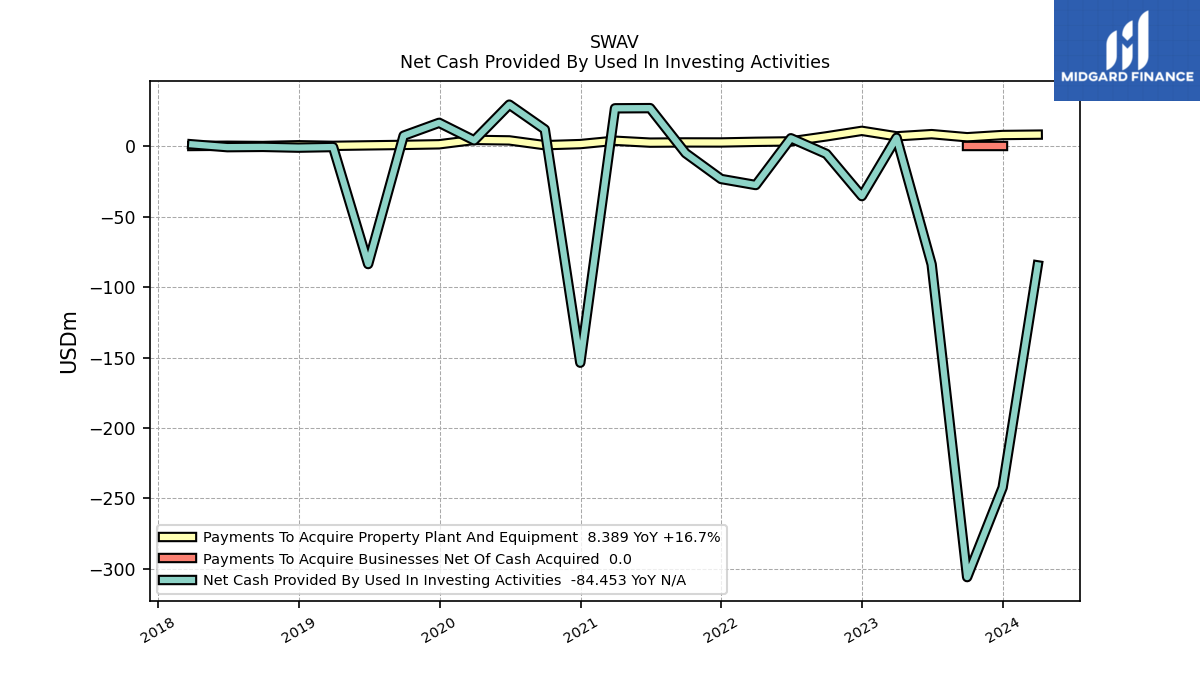
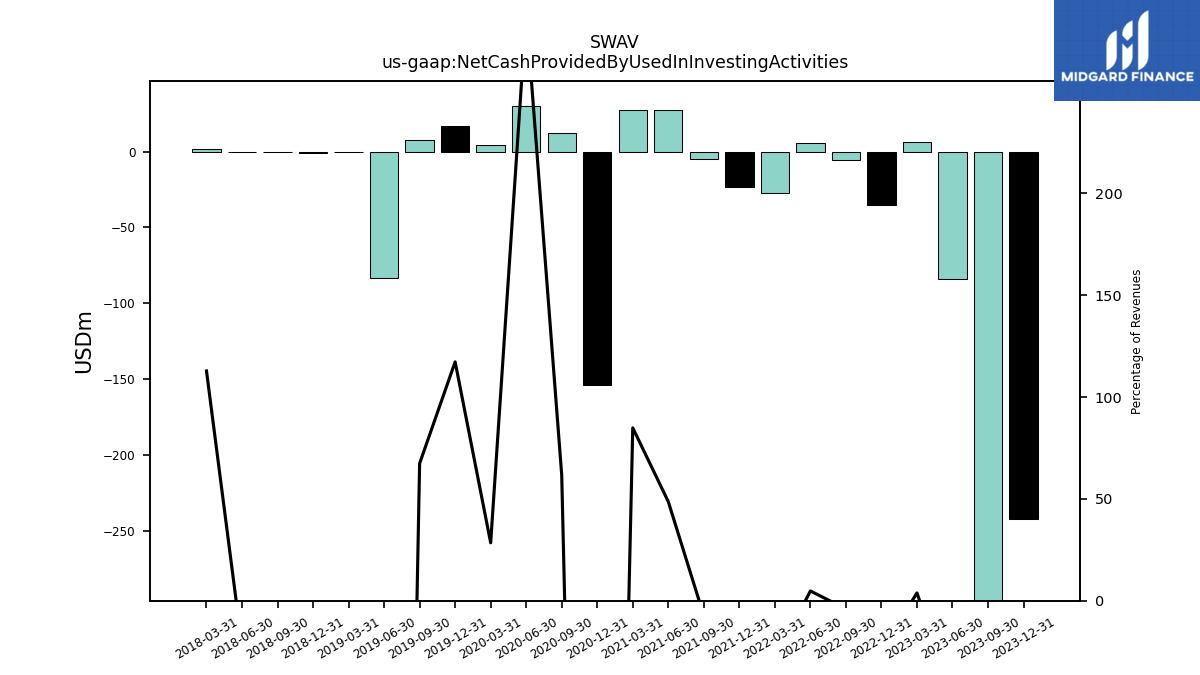
| Net Cash Provided By Used In Investing Activities | -242.26 | -305.88 | -83.77 | 6.18 | -35.28 | -5.28 | 5.82 | -27.41 | -23.10 | -4.78 | 27.21 | 27.09 | -153.61 | 12.11 | 29.70 | 4.33 | 16.79 | 7.64 | -83.56 | -0.42 | -0.85 | -0.31 | -0.51 | 1.49 | |
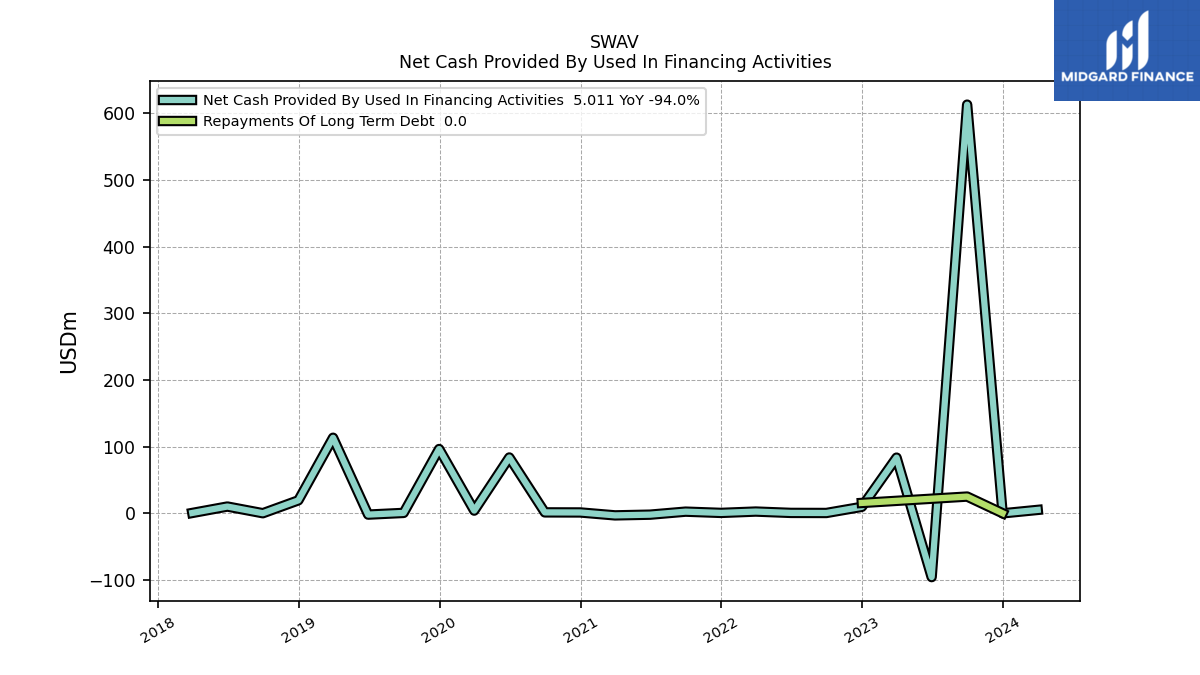
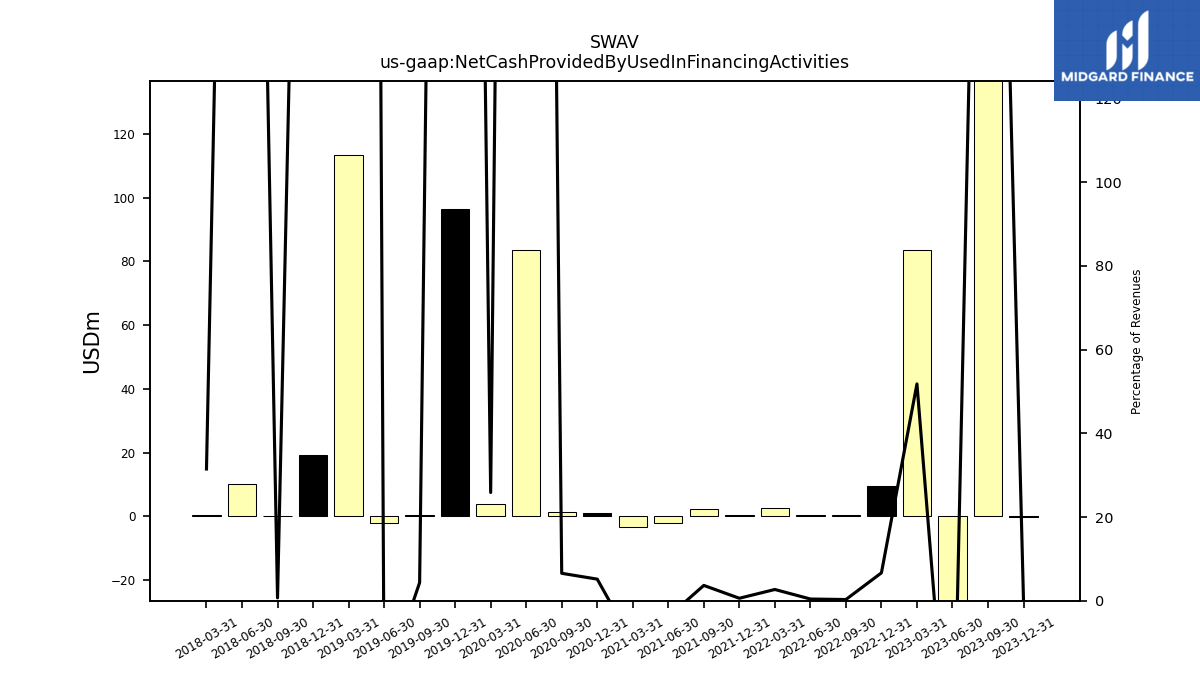
| Net Cash Provided By Used In Financing Activities | -0.16 | 613.00 | -95.84 | 83.41 | 9.60 | 0.38 | 0.50 | 2.52 | 0.50 | 2.39 | -2.14 | -3.20 | 1.17 | 1.28 | 83.65 | 3.93 | 96.37 | 0.49 | -2.07 | 113.26 | 19.32 | 0.03 | 10.05 | 0.42 |
| 2023-12-31 | 2023-09-30 | 2023-06-30 | 2023-03-31 | 2022-12-31 | 2022-09-30 | 2022-06-30 | 2022-03-31 | 2021-12-31 | 2021-09-30 | 2021-06-30 | 2021-03-31 | 2020-12-31 | 2020-09-30 | 2020-06-30 | 2020-03-31 | 2019-12-31 | 2019-09-30 | 2019-06-30 | 2019-03-31 | 2018-12-31 | 2018-09-30 | 2018-06-30 | 2018-03-31 | ||
|---|---|---|---|---|---|---|---|---|---|---|---|---|---|---|---|---|---|---|---|---|---|---|---|---|---|
| Net Cash Provided By Used In Operating Activities | 71.70 | 50.65 | 39.74 | 33.96 | 52.44 | 34.49 | 28.87 | 1.94 | 20.83 | 9.32 | 2.19 | -17.30 | -12.40 | -16.43 | -18.17 | -24.19 | -12.57 | -10.60 | -10.52 | -14.41 | -9.81 | -9.88 | -10.39 | -11.38 | |
| Net Income Loss | 44.30 | 34.99 | 28.86 | 39.12 | 140.91 | 35.00 | 25.56 | 14.52 | 12.94 | 1.95 | -0.42 | -23.60 | -15.87 | -12.93 | -18.12 | -18.77 | -14.74 | -12.96 | -10.61 | -12.80 | -11.22 | -10.18 | -10.11 | -9.59 | |
| Profit Loss | 44.30 | 34.99 | 28.86 | 39.12 | 140.91 | 35.00 | 25.56 | 14.52 | 12.94 | 1.95 | -0.42 | -23.60 | -15.87 | -12.93 | -18.12 | -18.77 | -14.74 | -12.96 | -10.61 | -12.80 | -11.22 | -10.18 | -10.11 | -9.59 | |
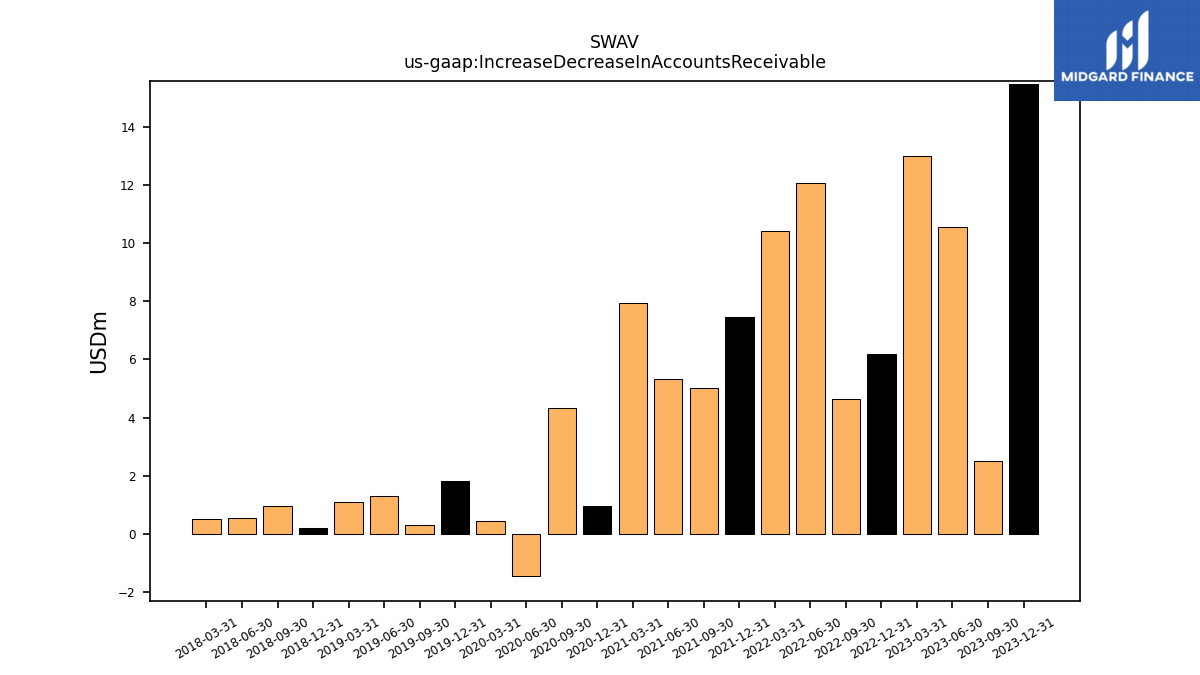
| Increase Decrease In Accounts Receivable | 15.47 | 2.50 | 10.56 | 13.00 | 6.20 | 4.64 | 12.07 | 10.41 | 7.47 | 5.01 | 5.34 | 7.92 | 0.98 | 4.35 | -1.45 | 0.43 | 1.83 | 0.31 | 1.30 | 1.09 | 0.20 | 0.95 | 0.56 | 0.50 | |
| Increase Decrease In Inventories | 10.39 | 4.93 | 7.93 | 7.76 | 5.34 | 8.15 | 6.13 | 10.09 | 4.09 | 2.31 | 2.37 | 3.31 | 0.72 | 5.37 | 7.16 | 3.81 | 2.73 | 0.94 | 1.28 | 1.88 | -0.08 | 0.59 | 0.92 | 1.17 | |
| Increase Decrease In Accounts Payable | 1.69 | -5.57 | -0.74 | 4.73 | 1.84 | -1.05 | -3.75 | 4.91 | -0.30 | 0.90 | -0.51 | 1.78 | -0.62 | -0.49 | 0.26 | -0.54 | 0.39 | 0.17 | 0.34 | 0.37 | 0.55 | -0.53 | -0.01 | 0.35 | |
| Share Based Compensation | 21.81 | 18.41 | 17.05 | 15.97 | 12.64 | 11.73 | 11.01 | 9.51 | 8.21 | 7.39 | 6.52 | 5.14 | 3.24 | 2.85 | 2.39 | 1.87 | 1.31 | 1.11 | 0.82 | 0.41 | 0.42 | 0.29 | 0.31 | 0.27 | |
| Amortization Of Financing Costs | 0.94 | 0.49 | 0.04 | 0.03 | 0.06 | 0.16 | 0.16 | 0.15 | 0.15 | 0.02 | 0.17 | 0.17 | 0.17 | 0.17 | 0.16 | 0.15 | 0.11 | 0.11 | 0.11 | 0.10 | 0.10 | 0.09 | NA | NA |
| 2023-12-31 | 2023-09-30 | 2023-06-30 | 2023-03-31 | 2022-12-31 | 2022-09-30 | 2022-06-30 | 2022-03-31 | 2021-12-31 | 2021-09-30 | 2021-06-30 | 2021-03-31 | 2020-12-31 | 2020-09-30 | 2020-06-30 | 2020-03-31 | 2019-12-31 | 2019-09-30 | 2019-06-30 | 2019-03-31 | 2018-12-31 | 2018-09-30 | 2018-06-30 | 2018-03-31 | ||
|---|---|---|---|---|---|---|---|---|---|---|---|---|---|---|---|---|---|---|---|---|---|---|---|---|---|
| Net Cash Provided By Used In Investing Activities | -242.26 | -305.88 | -83.77 | 6.18 | -35.28 | -5.28 | 5.82 | -27.41 | -23.10 | -4.78 | 27.21 | 27.09 | -153.61 | 12.11 | 29.70 | 4.33 | 16.79 | 7.64 | -83.56 | -0.42 | -0.85 | -0.31 | -0.51 | 1.49 | |
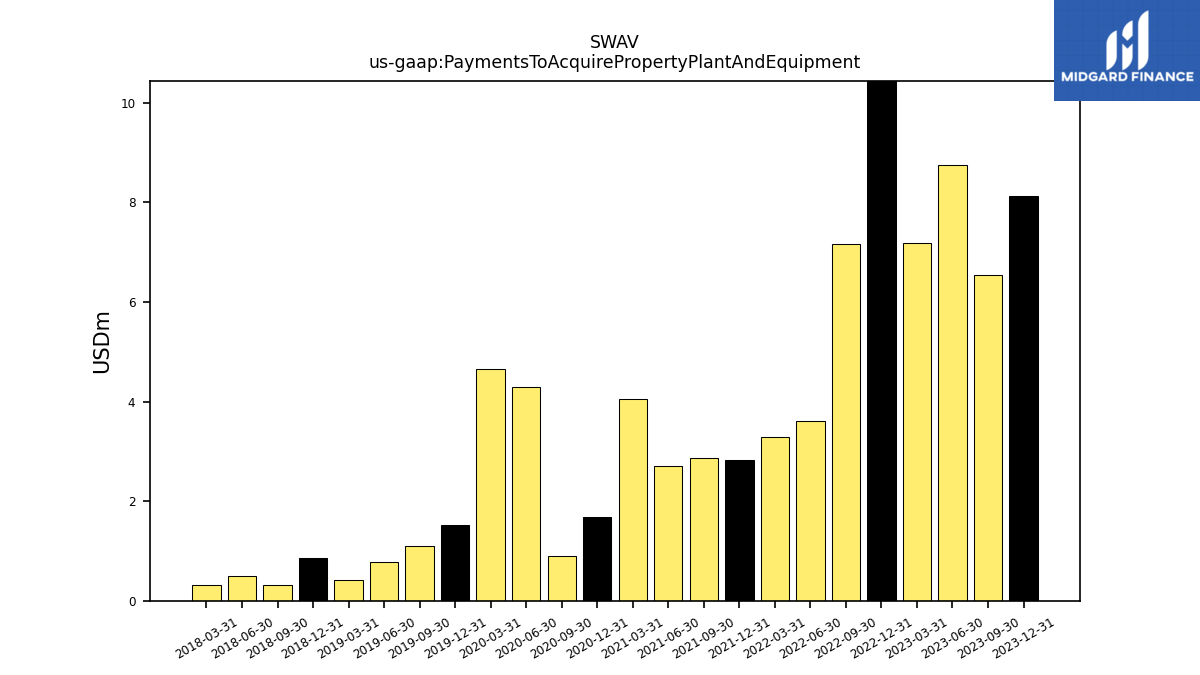
| Payments To Acquire Property Plant And Equipment | 8.12 | 6.54 | 8.75 | 7.19 | 11.08 | 7.16 | 3.60 | 3.29 | 2.82 | 2.86 | 2.71 | 4.05 | 1.67 | 0.89 | 4.30 | 4.66 | 1.53 | 1.10 | 0.77 | 0.42 | 0.85 | 0.31 | 0.51 | 0.32 |
| 2023-12-31 | 2023-09-30 | 2023-06-30 | 2023-03-31 | 2022-12-31 | 2022-09-30 | 2022-06-30 | 2022-03-31 | 2021-12-31 | 2021-09-30 | 2021-06-30 | 2021-03-31 | 2020-12-31 | 2020-09-30 | 2020-06-30 | 2020-03-31 | 2019-12-31 | 2019-09-30 | 2019-06-30 | 2019-03-31 | 2018-12-31 | 2018-09-30 | 2018-06-30 | 2018-03-31 | ||
|---|---|---|---|---|---|---|---|---|---|---|---|---|---|---|---|---|---|---|---|---|---|---|---|---|---|
| Net Cash Provided By Used In Financing Activities | -0.16 | 613.00 | -95.84 | 83.41 | 9.60 | 0.38 | 0.50 | 2.52 | 0.50 | 2.39 | -2.14 | -3.20 | 1.17 | 1.28 | 83.65 | 3.93 | 96.37 | 0.49 | -2.07 | 113.26 | 19.32 | 0.03 | 10.05 | 0.42 |
| 2023-12-31 | 2023-09-30 | 2023-06-30 | 2023-03-31 | 2022-12-31 | 2022-09-30 | 2022-06-30 | 2022-03-31 | 2021-12-31 | 2021-09-30 | 2021-06-30 | 2021-03-31 | 2020-12-31 | 2020-09-30 | 2020-06-30 | 2020-03-31 | 2019-12-31 | 2019-09-30 | 2019-06-30 | 2019-03-31 | 2018-12-31 | 2018-09-30 | 2018-06-30 | 2018-03-31 | ||
|---|---|---|---|---|---|---|---|---|---|---|---|---|---|---|---|---|---|---|---|---|---|---|---|---|---|
| Revenues | 202.98 | 186.02 | 180.16 | 161.07 | 144.03 | 131.33 | 120.75 | 93.63 | 84.18 | 65.16 | 55.91 | 31.90 | 22.72 | 19.59 | 10.29 | 15.20 | 14.31 | 11.33 | 10.01 | 7.27 | 5.06 | 3.60 | 2.28 | 1.32 | |
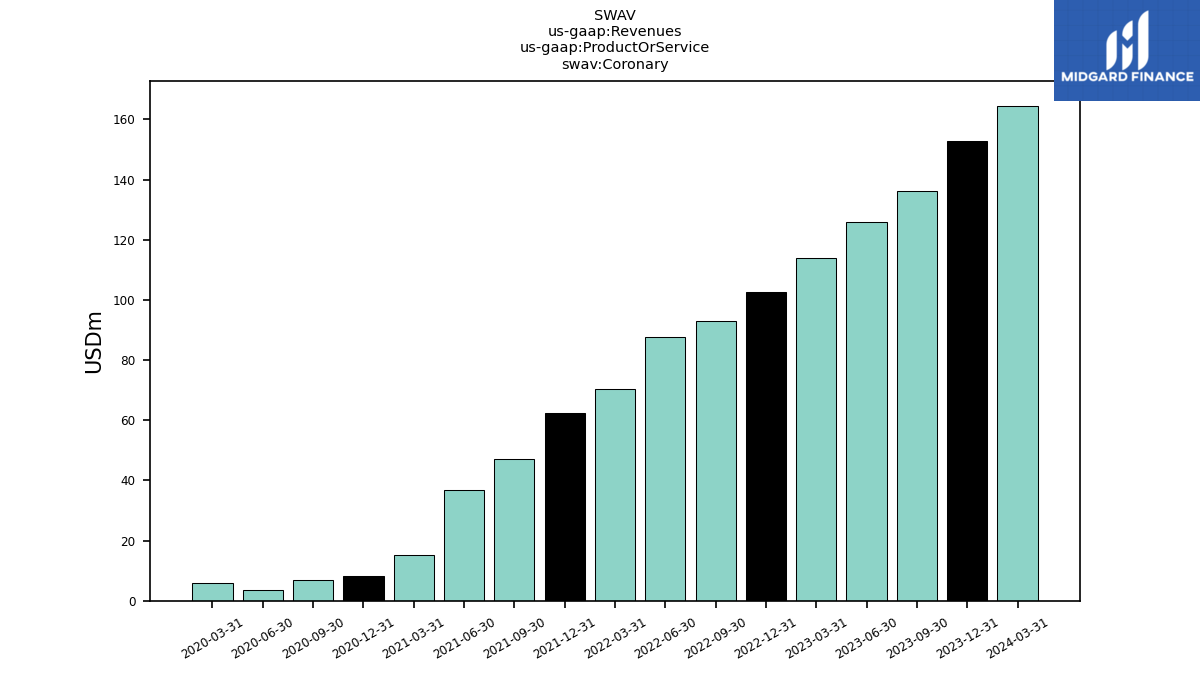
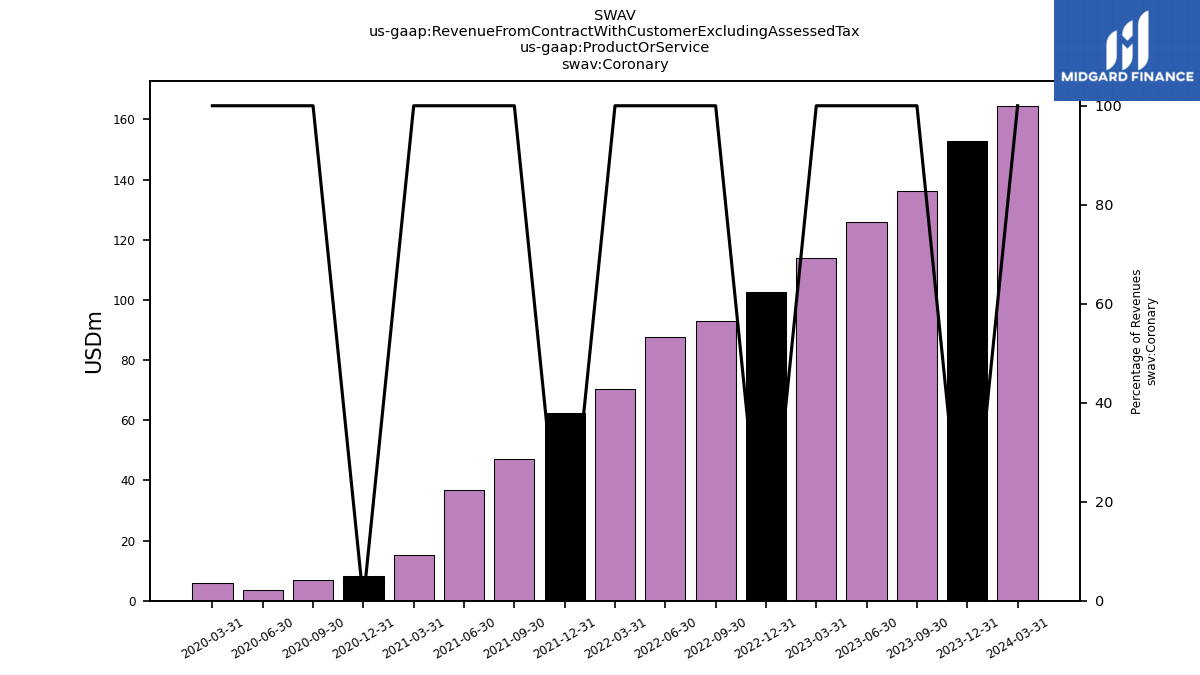
| Coronary | 152.87 | 136.32 | 125.78 | 113.88 | 102.65 | 93.04 | 87.83 | 70.34 | 62.29 | 47.16 | 36.70 | 15.31 | 8.18 | 6.98 | 3.65 | 5.77 | NA | NA | NA | NA | NA | NA | NA | NA | |
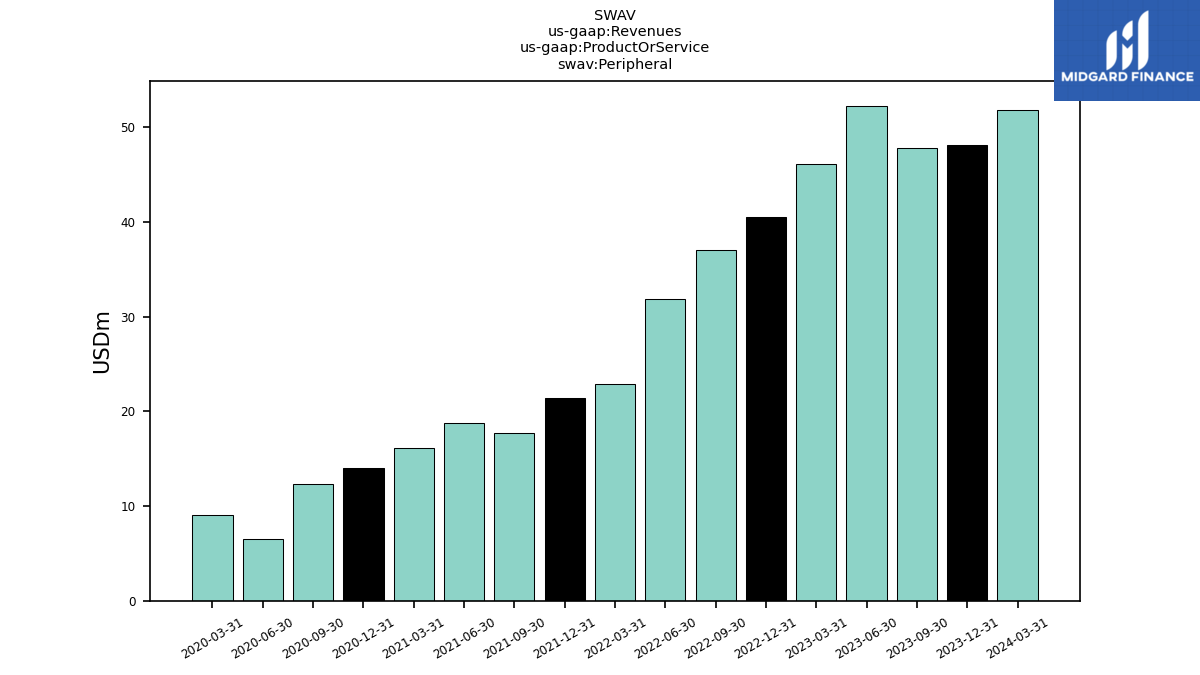
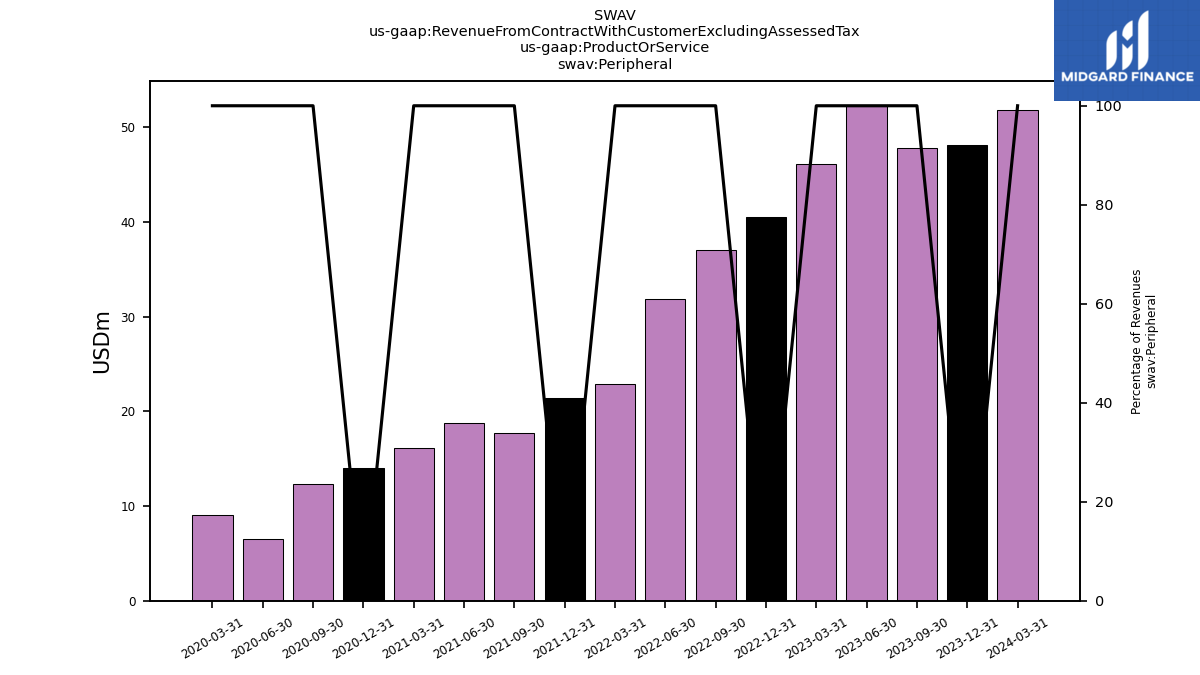
| Peripheral | 48.12 | 47.84 | 52.26 | 46.13 | 40.50 | 37.05 | 31.89 | 22.85 | 21.41 | 17.73 | 18.79 | 16.14 | 14.07 | 12.34 | 6.51 | 9.08 | NA | NA | NA | NA | NA | NA | NA | NA | |
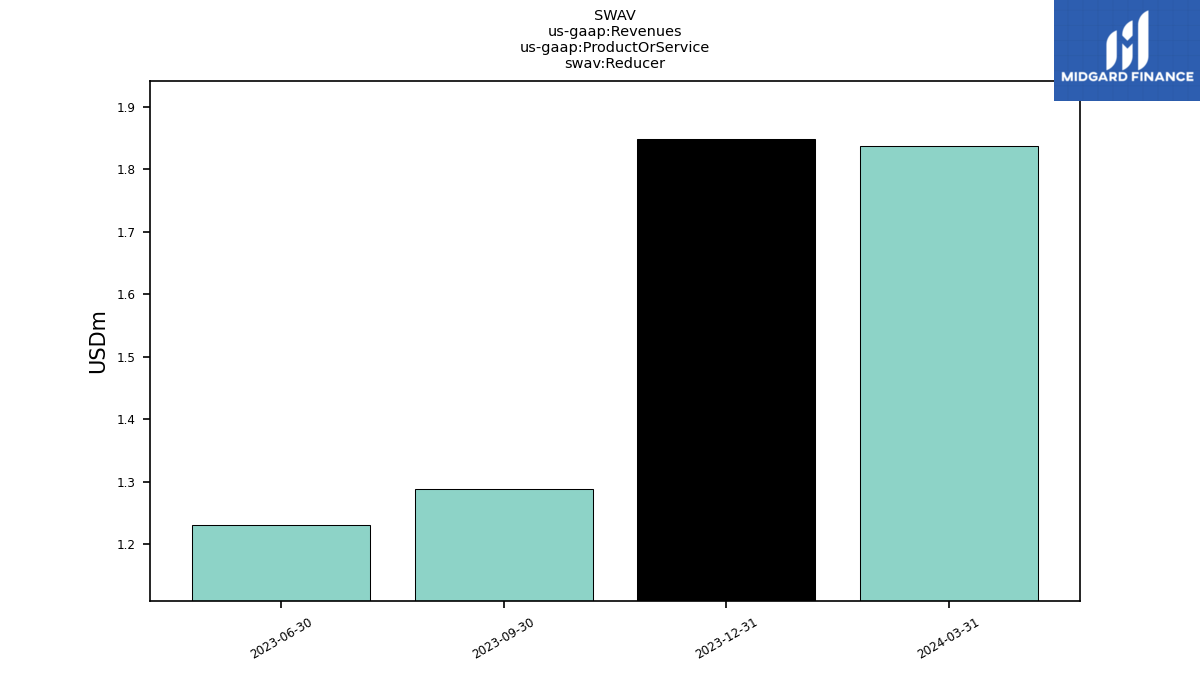
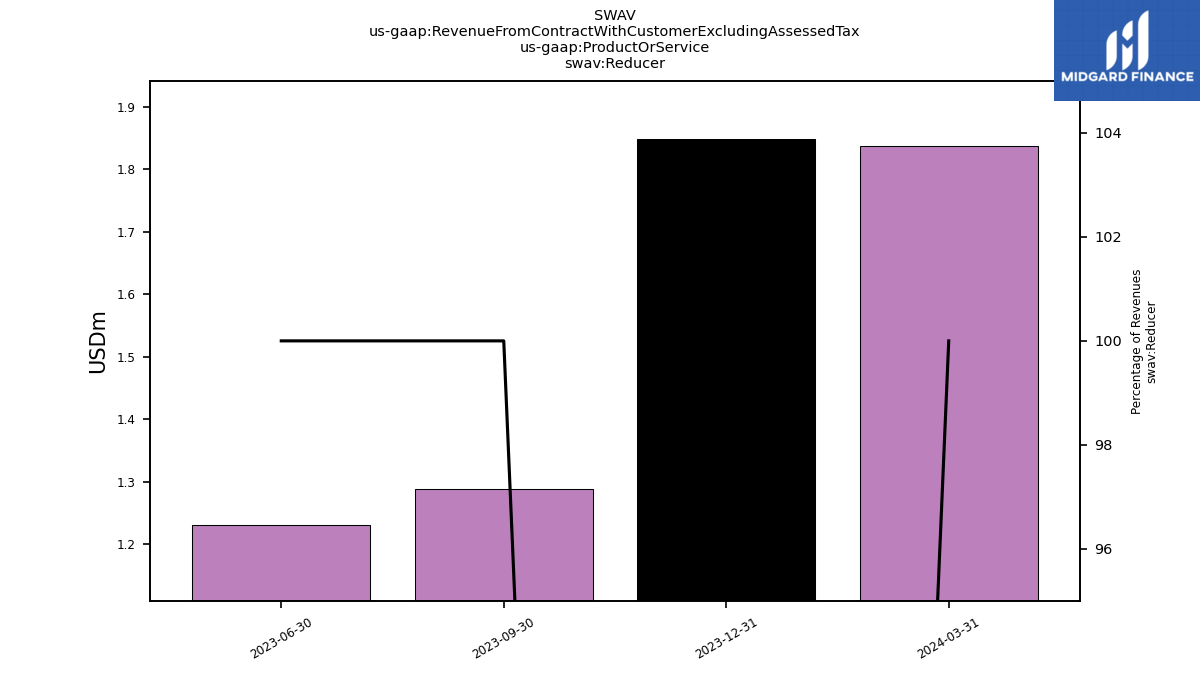
| Reducer | 1.85 | 1.29 | 1.23 | NA | NA | NA | NA | NA | NA | NA | NA | NA | NA | NA | NA | NA | NA | NA | NA | NA | NA | NA | NA | NA | |
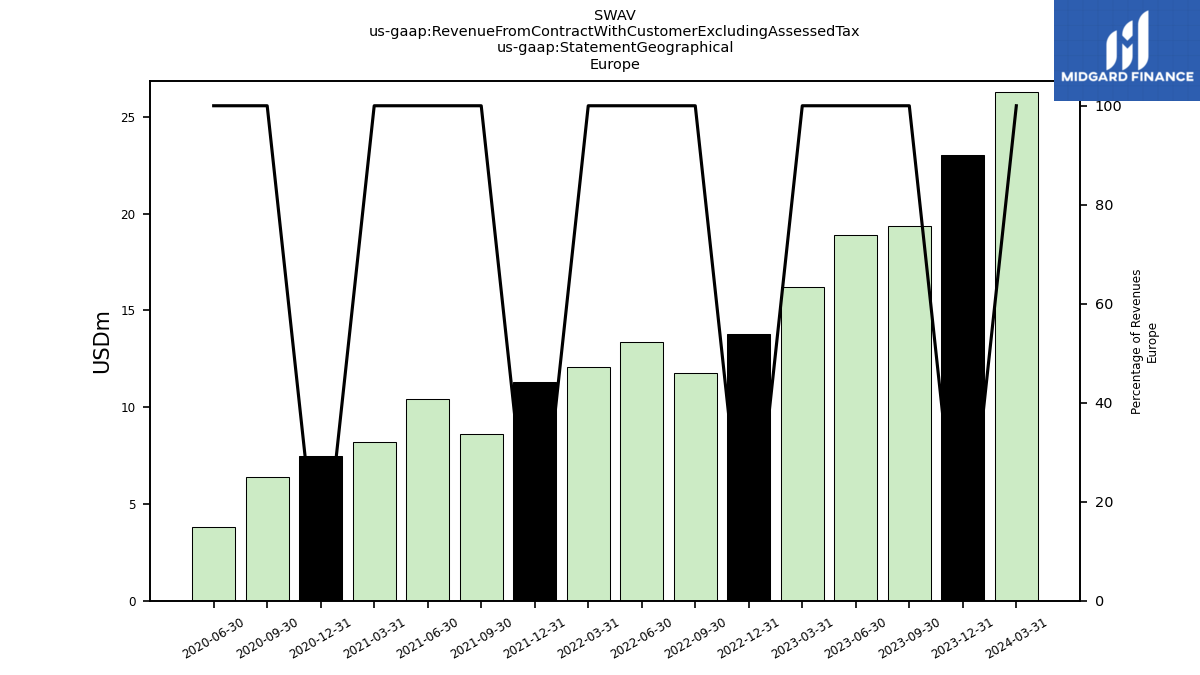
| 23.01 | 19.35 | 18.91 | 16.23 | 13.79 | 11.76 | 13.39 | 12.07 | 11.30 | 8.62 | 10.42 | 8.22 | 7.49 | 6.37 | 3.82 | NA | NA | NA | NA | NA | NA | NA | NA | NA | ||
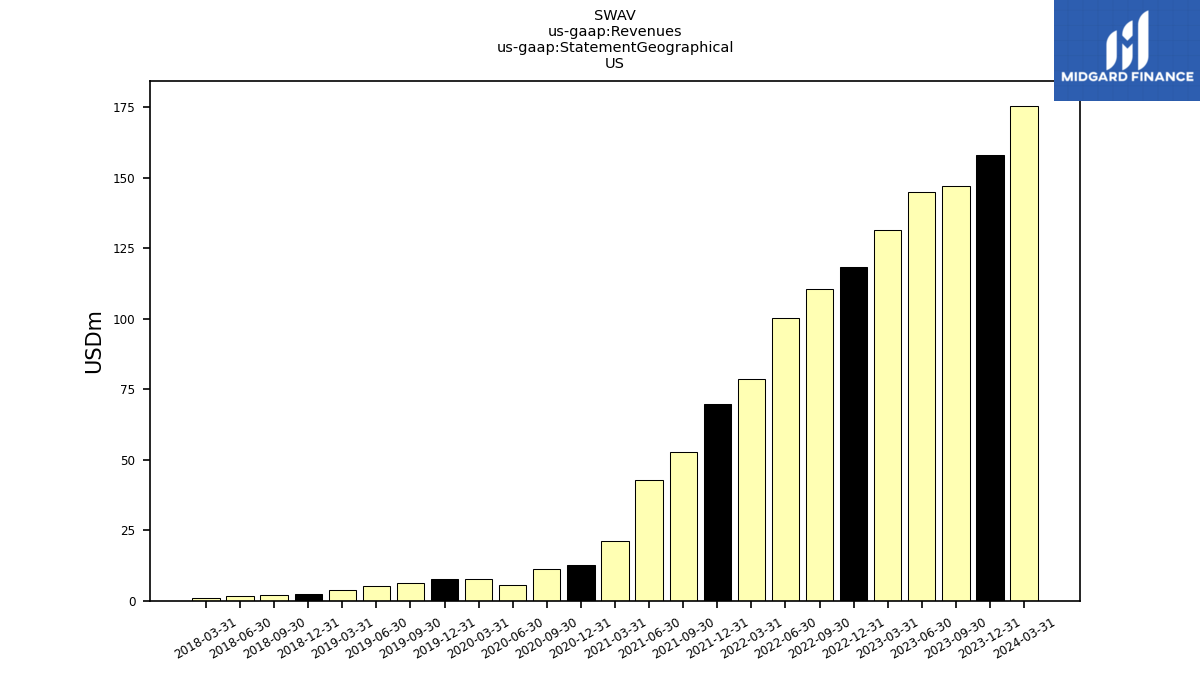
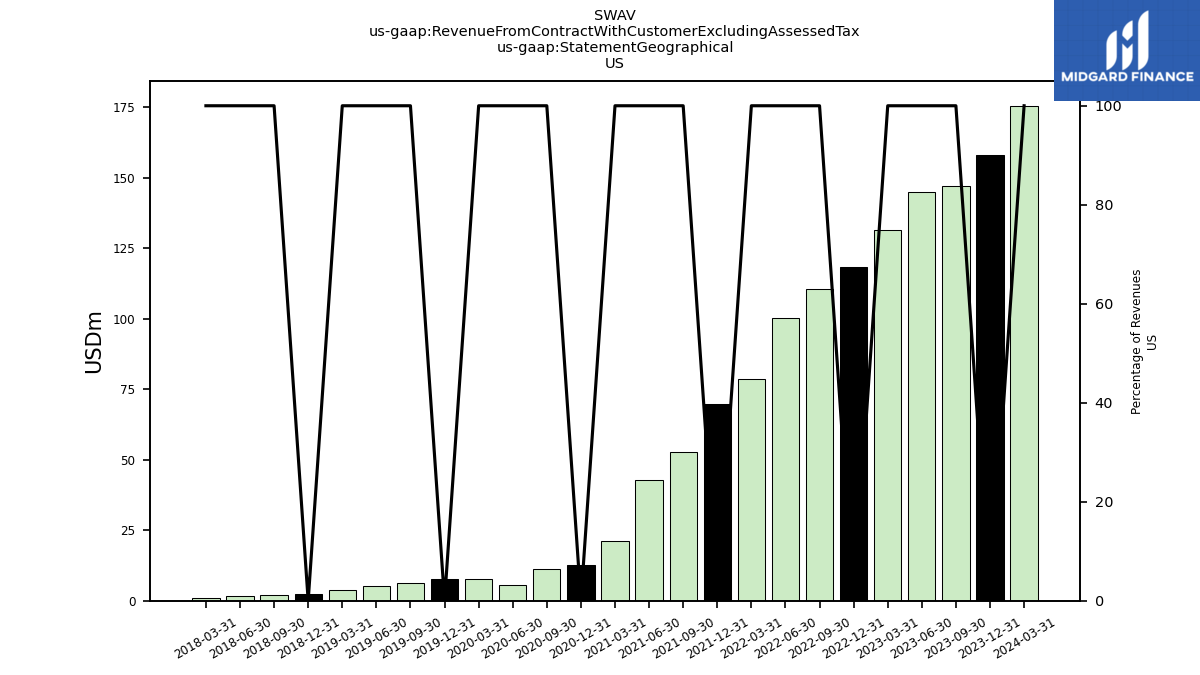
| US | 158.09 | 146.90 | 144.94 | 131.62 | 118.31 | 110.50 | 100.10 | 78.52 | 69.59 | 52.77 | 42.91 | 21.05 | 12.67 | 11.14 | 5.54 | 7.77 | 7.64 | 6.25 | 5.17 | 3.64 | 2.55 | 2.05 | 1.53 | 0.90 | |
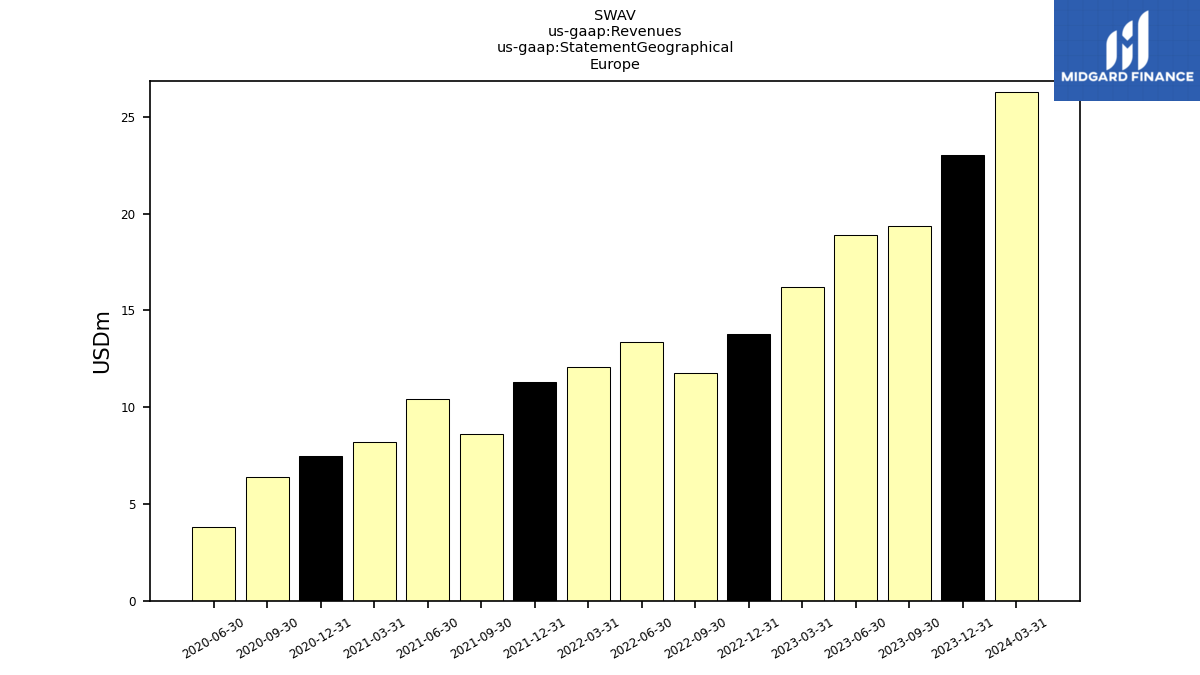
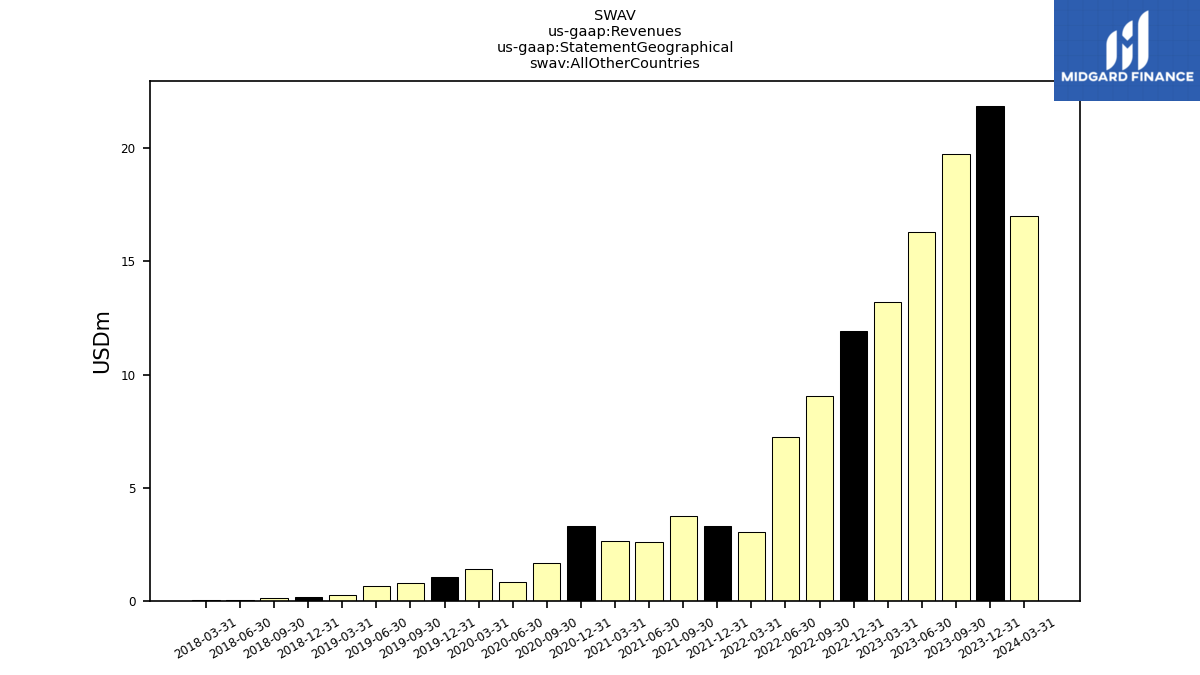
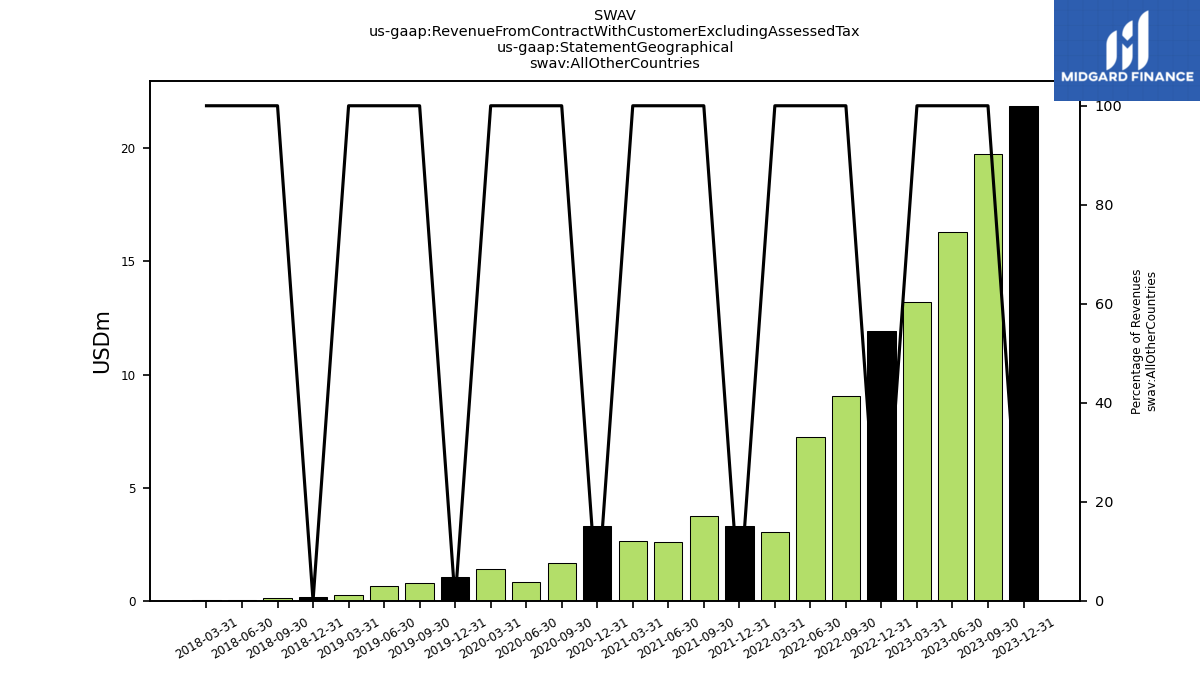
| All Other Countries | 21.88 | 19.77 | 16.31 | 13.21 | 11.93 | 9.07 | 7.26 | 3.04 | 3.28 | 3.76 | 2.58 | 2.63 | 3.32 | 1.67 | 0.82 | 1.41 | 1.03 | 0.79 | 0.66 | 0.25 | 0.16 | 0.11 | 0.01 | 0.04 | |
| Revenue From Contract With Customer Excluding Assessed Tax | 202.98 | 186.02 | 180.16 | 161.07 | 144.03 | 131.33 | 120.75 | 93.63 | 84.18 | 65.16 | 55.91 | 31.90 | 22.72 | 19.59 | 10.29 | 15.20 | 14.31 | 11.33 | 10.01 | 7.27 | 5.06 | 3.60 | 2.28 | 1.32 | |
| Coronary | 152.87 | 136.32 | 125.78 | 113.88 | 102.65 | 93.04 | 87.83 | 70.34 | 62.29 | 47.16 | 36.70 | 15.31 | 8.18 | 6.98 | 3.65 | 5.77 | NA | NA | NA | NA | NA | NA | NA | NA | |
| Peripheral | 48.12 | 47.84 | 52.26 | 46.13 | 40.50 | 37.05 | 31.89 | 22.85 | 21.41 | 17.73 | 18.79 | 16.14 | 14.07 | 12.34 | 6.51 | 9.08 | NA | NA | NA | NA | NA | NA | NA | NA | |
| Reducer | 1.85 | 1.29 | 1.23 | NA | NA | NA | NA | NA | NA | NA | NA | NA | NA | NA | NA | NA | NA | NA | NA | NA | NA | NA | NA | NA | |
| 23.01 | 19.35 | 18.91 | 16.23 | 13.79 | 11.76 | 13.39 | 12.07 | 11.30 | 8.62 | 10.42 | 8.22 | 7.49 | 6.37 | 3.82 | NA | NA | NA | NA | NA | NA | NA | NA | NA | ||
| US | 158.09 | 146.90 | 144.94 | 131.62 | 118.31 | 110.50 | 100.10 | 78.52 | 69.59 | 52.77 | 42.91 | 21.05 | 12.67 | 11.14 | 5.54 | 7.77 | 7.64 | 6.25 | 5.17 | 3.64 | 2.55 | 2.05 | 1.53 | 0.90 | |
| All Other Countries | 21.88 | 19.77 | 16.31 | 13.21 | 11.93 | 9.07 | 7.26 | 3.04 | 3.28 | 3.76 | 2.58 | 2.63 | 3.32 | 1.67 | 0.82 | 1.41 | 1.03 | 0.79 | 0.66 | 0.25 | 0.16 | 0.11 | 0.01 | 0.04 |