
| 2023-12-31 | 2023-09-30 | 2023-06-30 | 2023-03-31 | 2022-12-31 | 2022-09-30 | 2022-06-30 | 2022-03-31 | 2021-12-31 | 2021-09-30 | 2021-06-30 | 2021-03-31 | 2020-12-31 | 2020-09-30 | 2020-06-30 | 2020-03-31 | 2019-12-31 | 2019-09-30 | 2019-06-30 | 2019-03-31 | 2018-12-31 | 2018-09-30 | 2018-06-30 | 2018-03-31 | 2017-12-31 | 2017-09-30 | 2017-06-30 | ||
|---|---|---|---|---|---|---|---|---|---|---|---|---|---|---|---|---|---|---|---|---|---|---|---|---|---|---|---|---|
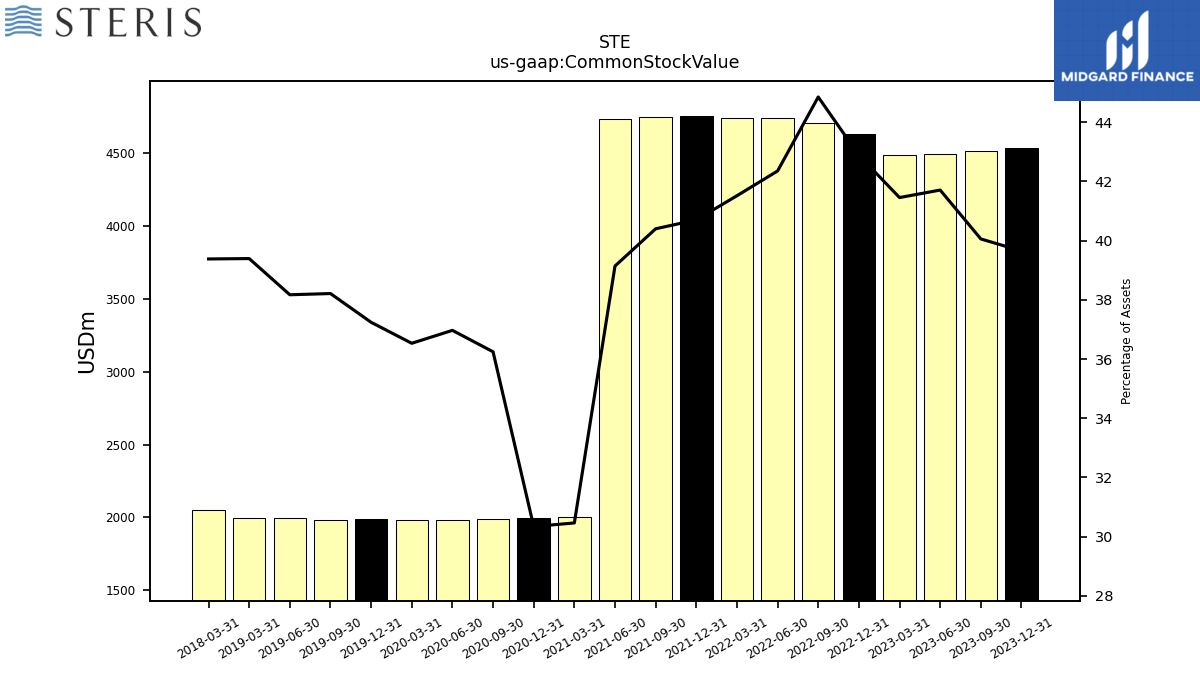
| Common Stock Value | 4534.26 | 4518.91 | 4498.21 | 4486.38 | 4631.70 | 4705.12 | 4738.75 | 4742.92 | 4758.20 | 4748.18 | 4736.84 | 2002.83 | 1996.84 | 1990.88 | 1983.05 | 1982.16 | 1987.11 | 1981.66 | 1996.35 | 1998.56 | NA | NA | NA | 2048.04 | NA | NA | NA | |
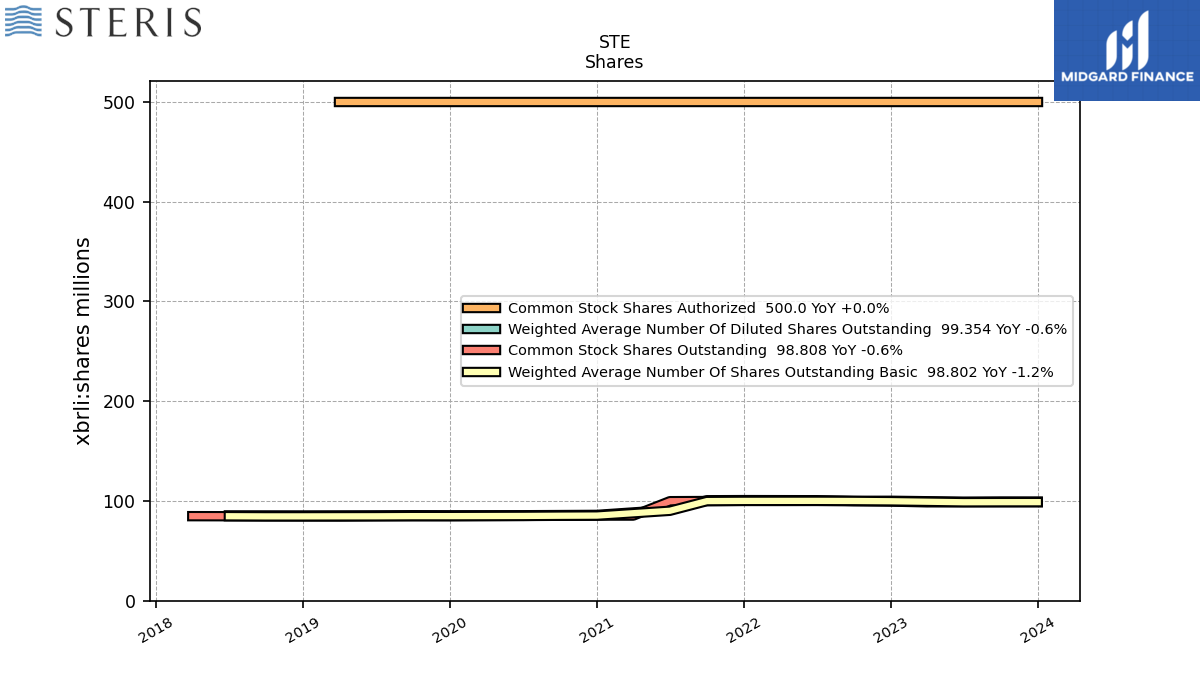
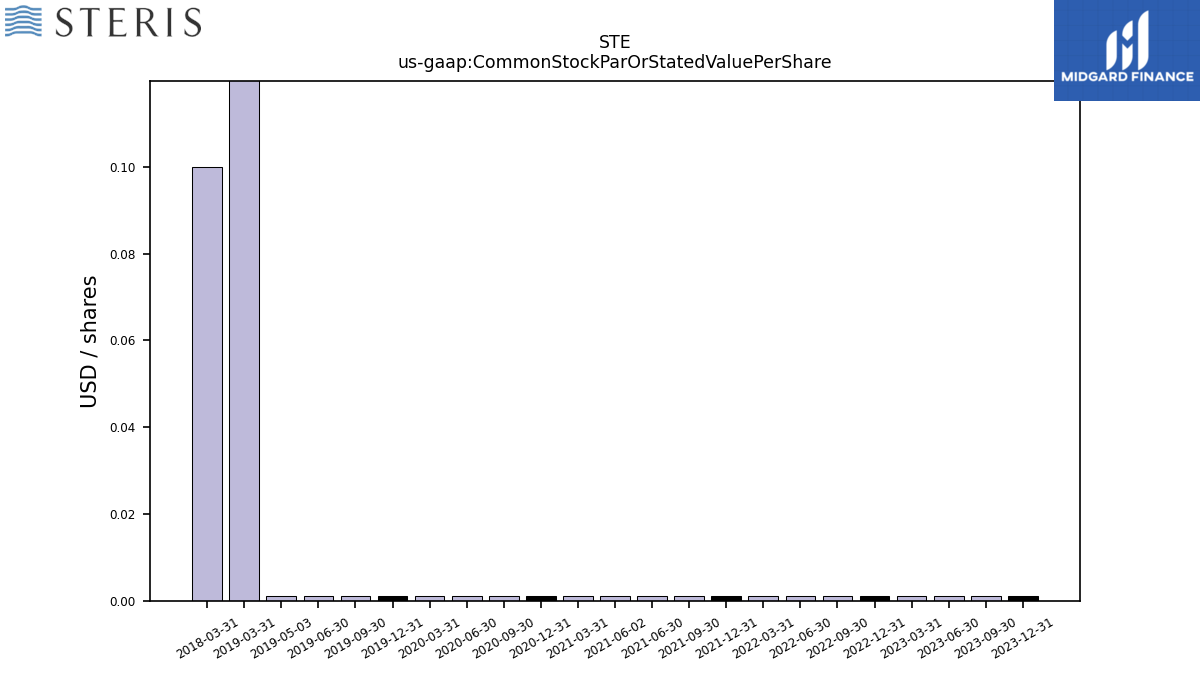
| Common Stock Par Or Stated Value Per Share | 0.00 | 0.00 | 0.00 | 0.00 | 0.00 | 0.00 | 0.00 | 0.00 | 0.00 | 0.00 | 0.00 | 0.00 | 0.00 | 0.00 | 0.00 | 0.00 | 0.00 | 0.00 | 0.00 | 0.00 | NA | NA | NA | 0.00 | NA | NA | NA | |
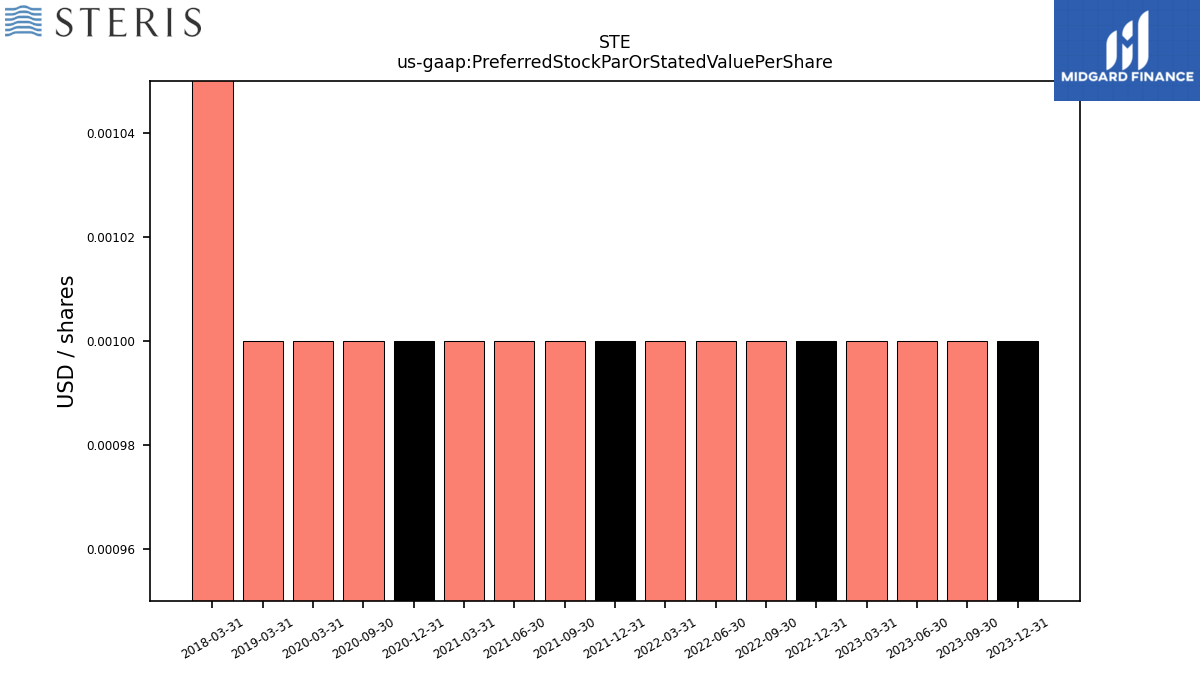
| Preferred Stock Par Or Stated Value Per Share | 0.00 | 0.00 | 0.00 | 0.00 | 0.00 | 0.00 | 0.00 | 0.00 | 0.00 | 0.00 | 0.00 | 0.00 | 0.00 | 0.00 | NA | 0.00 | NA | NA | NA | 0.00 | NA | NA | NA | 0.00 | NA | NA | NA | |
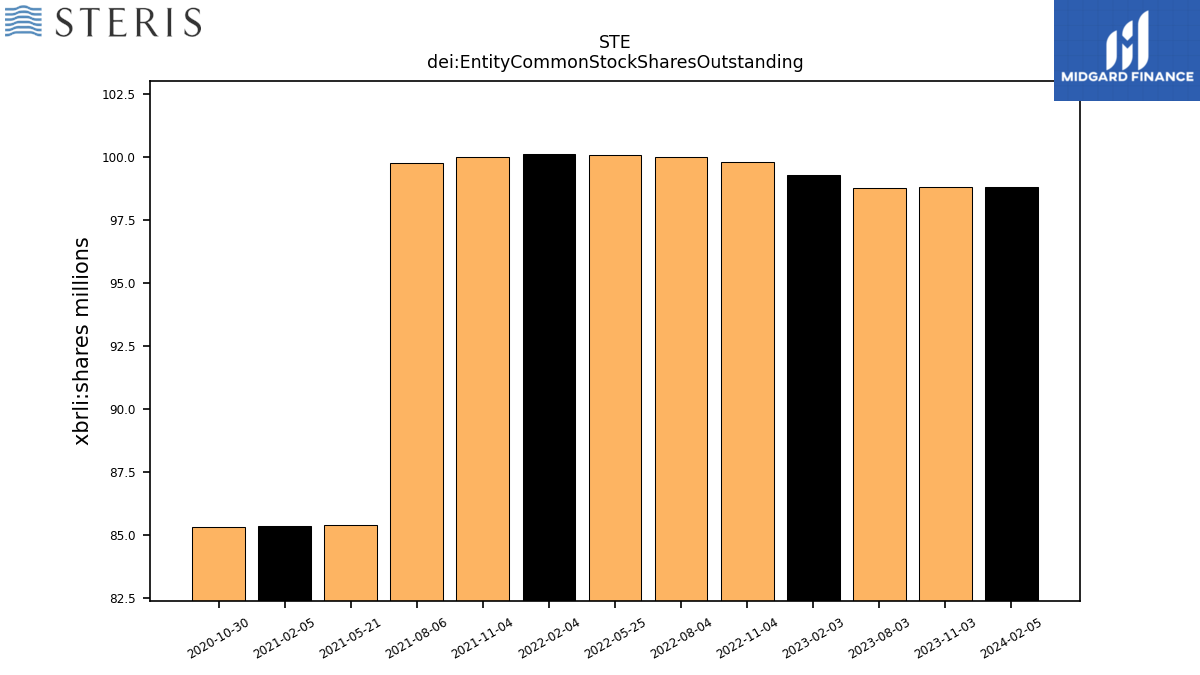
| dei: Entity Common Stock Shares Outstanding | NA | NA | NA | NA | NA | NA | NA | NA | NA | NA | NA | NA | NA | NA | NA | NA | NA | NA | NA | NA | NA | NA | NA | NA | NA | NA | NA | |
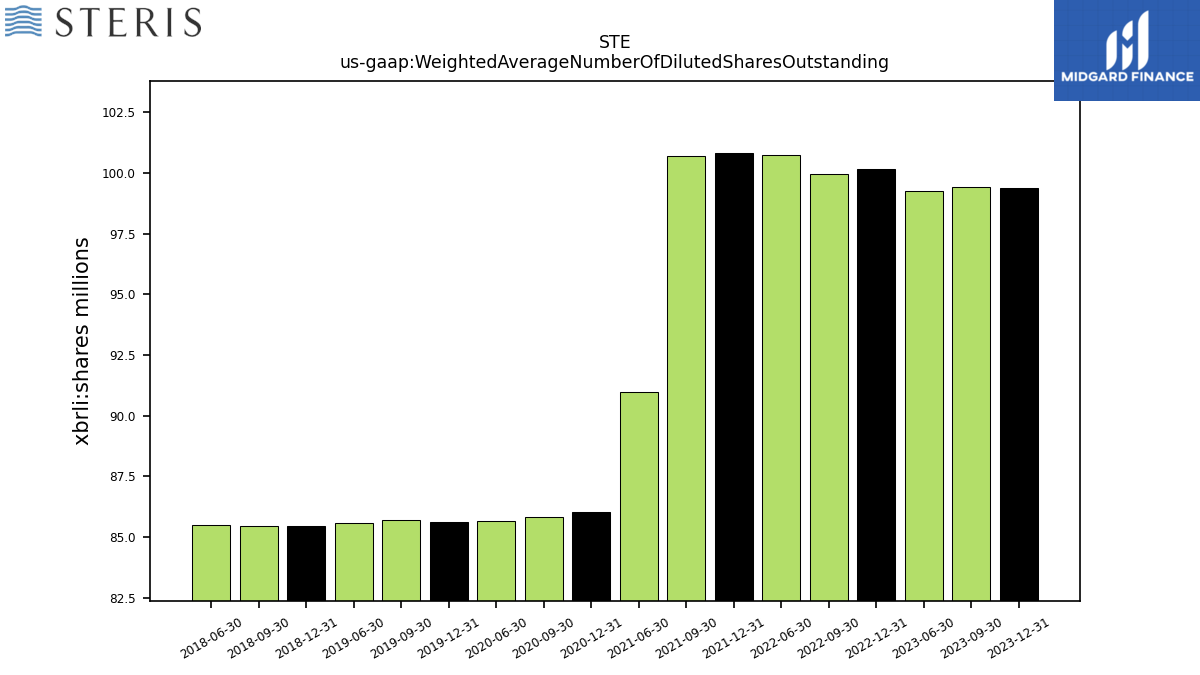
| Weighted Average Number Of Diluted Shares Outstanding | 99.35 | 99.41 | 99.24 | NA | 100.17 | 99.97 | 100.72 | NA | 100.83 | 100.69 | 90.99 | NA | 86.03 | 85.84 | 85.68 | NA | 85.63 | 85.69 | 85.57 | NA | 85.44 | 85.48 | 85.51 | NA | NA | NA | NA | |
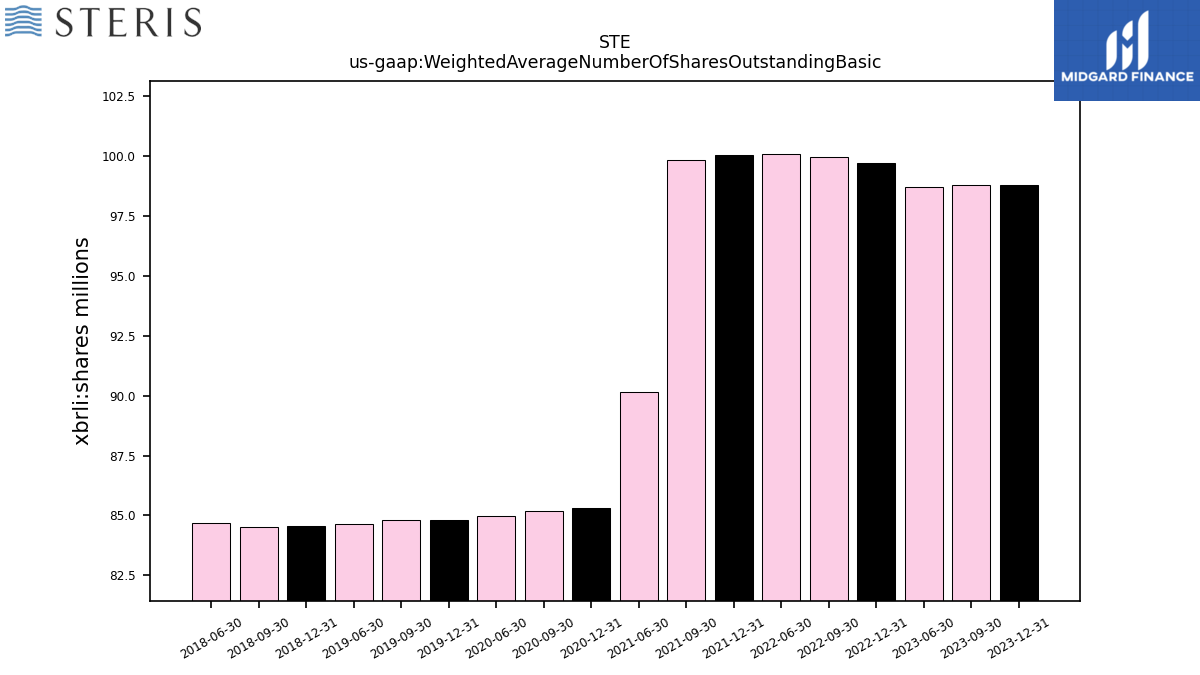
| Weighted Average Number Of Shares Outstanding Basic | 98.80 | 98.78 | 98.71 | NA | 99.72 | 99.97 | 100.08 | NA | 100.04 | 99.85 | 90.15 | NA | 85.33 | 85.17 | 84.96 | NA | 84.79 | 84.80 | 84.64 | NA | 84.54 | 84.54 | 84.69 | NA | NA | NA | NA | |
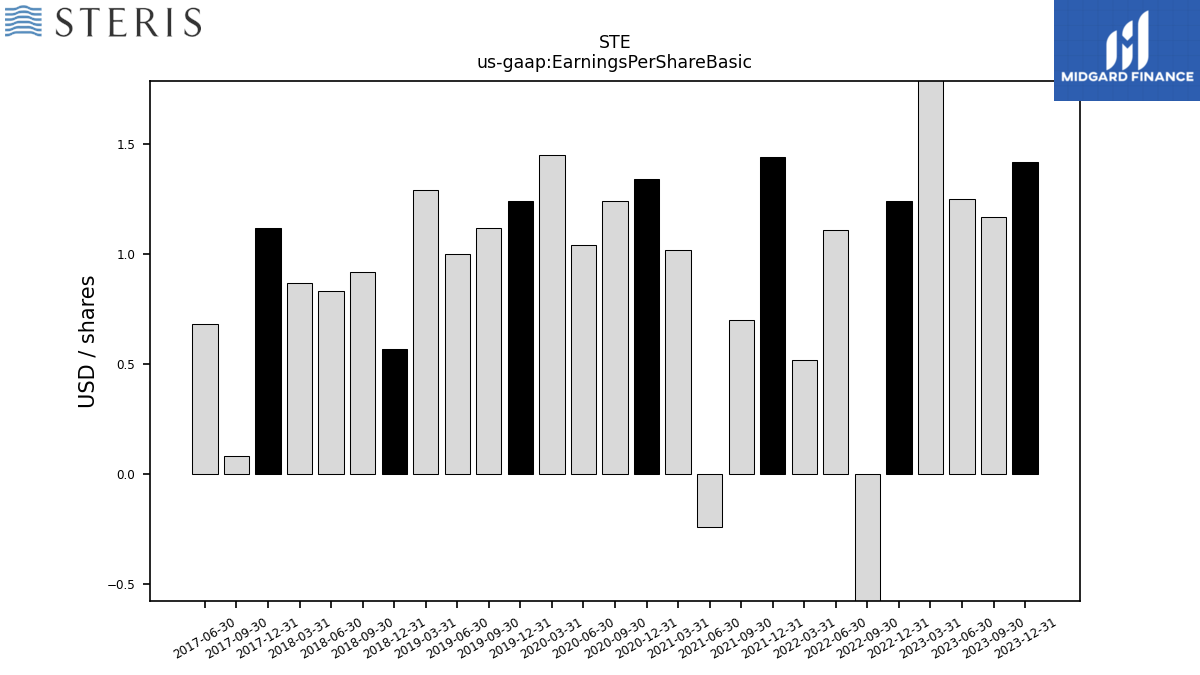
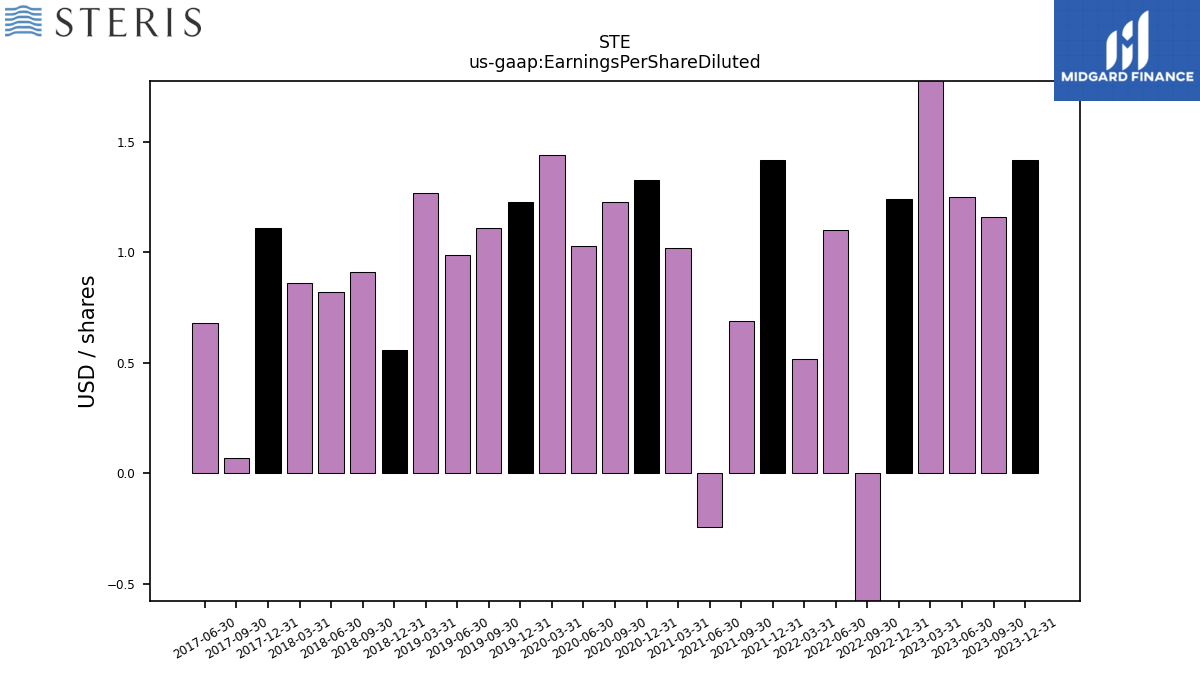
| Earnings Per Share Basic | 1.42 | 1.17 | 1.25 | 1.87 | 1.24 | -3.15 | 1.11 | 0.52 | 1.44 | 0.70 | -0.24 | 1.02 | 1.34 | 1.24 | 1.04 | 1.45 | 1.24 | 1.12 | 1.00 | 1.29 | 0.57 | 0.92 | 0.83 | 0.87 | 1.12 | 0.08 | 0.68 | |
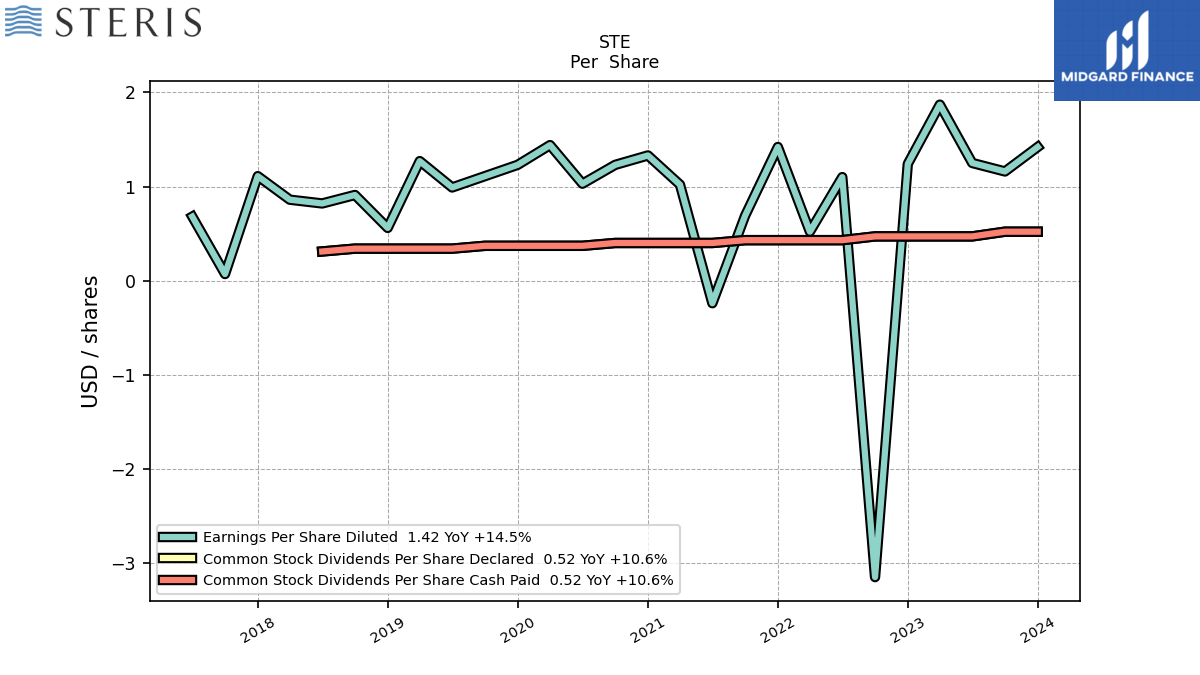
| Earnings Per Share Diluted | 1.42 | 1.16 | 1.25 | 1.87 | 1.24 | -3.15 | 1.10 | 0.52 | 1.42 | 0.69 | -0.24 | 1.02 | 1.33 | 1.23 | 1.03 | 1.44 | 1.23 | 1.11 | 0.99 | 1.27 | 0.56 | 0.91 | 0.82 | 0.86 | 1.11 | 0.07 | 0.68 |
| 2023-12-31 | 2023-09-30 | 2023-06-30 | 2023-03-31 | 2022-12-31 | 2022-09-30 | 2022-06-30 | 2022-03-31 | 2021-12-31 | 2021-09-30 | 2021-06-30 | 2021-03-31 | 2020-12-31 | 2020-09-30 | 2020-06-30 | 2020-03-31 | 2019-12-31 | 2019-09-30 | 2019-06-30 | 2019-03-31 | 2018-12-31 | 2018-09-30 | 2018-06-30 | 2018-03-31 | 2017-12-31 | 2017-09-30 | 2017-06-30 | ||
|---|---|---|---|---|---|---|---|---|---|---|---|---|---|---|---|---|---|---|---|---|---|---|---|---|---|---|---|---|
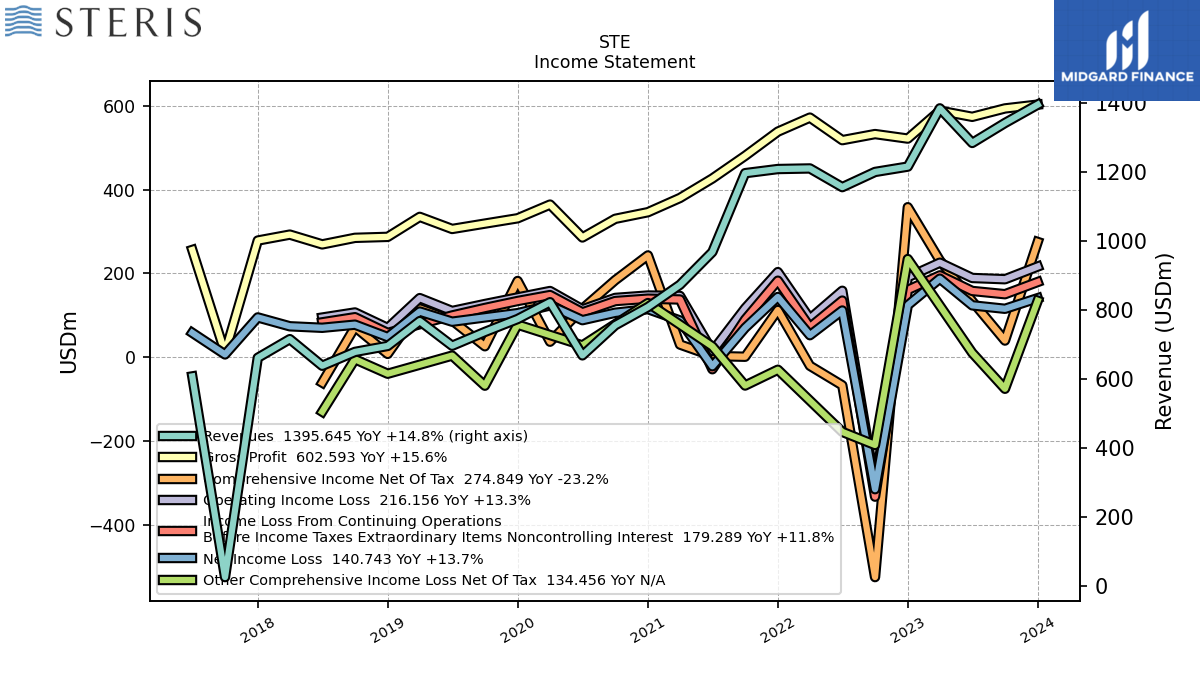
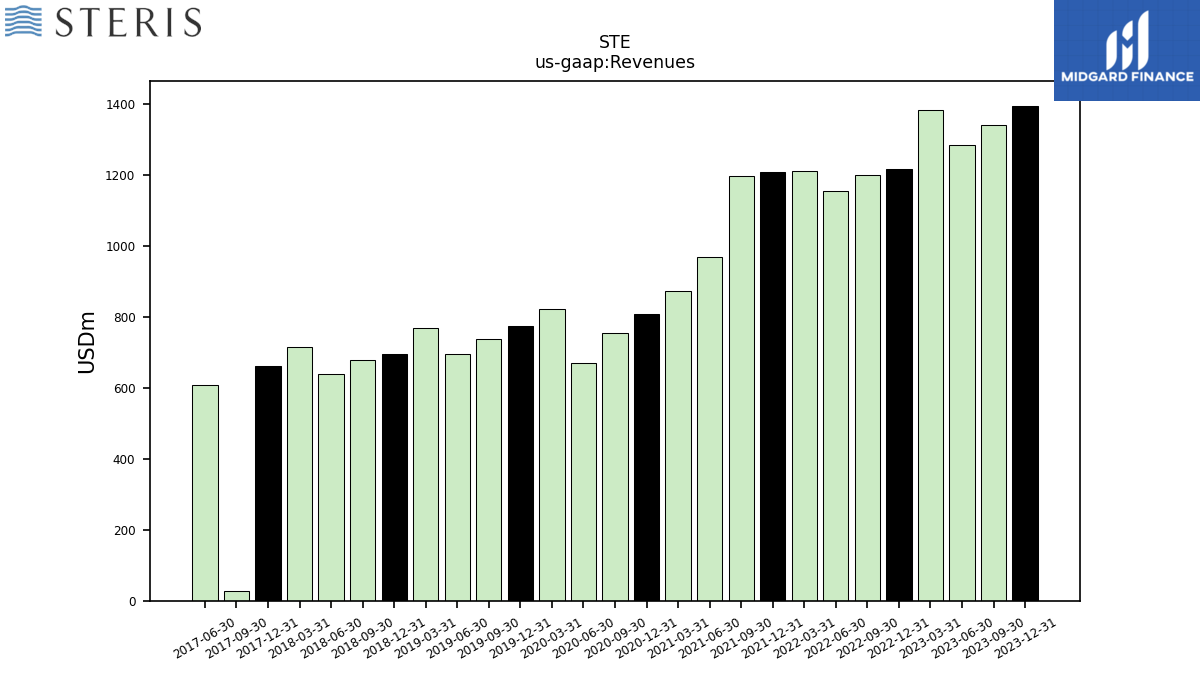
| Revenues | 1395.64 | 1342.36 | 1284.54 | 1384.84 | 1215.99 | 1200.52 | 1156.49 | 1210.69 | 1208.97 | 1196.98 | 968.42 | 873.53 | 808.92 | 756.13 | 668.93 | 822.99 | 774.26 | 736.84 | 696.80 | 768.21 | 696.24 | 678.96 | 638.76 | 715.97 | 661.90 | 26.20 | 607.96 | |
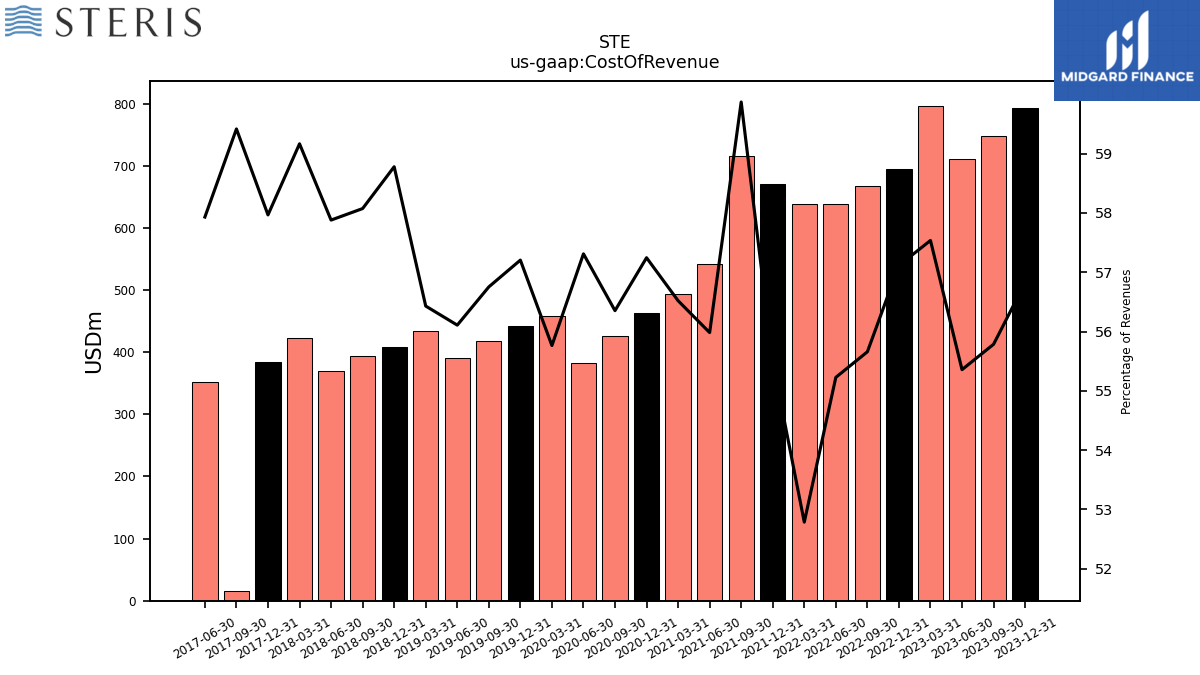
| Cost Of Revenue | 793.05 | 748.83 | 711.08 | 796.77 | 694.50 | 668.18 | 638.69 | 639.06 | 670.86 | 716.64 | 542.14 | 493.71 | 463.06 | 426.10 | 383.36 | 458.93 | 442.91 | 418.17 | 390.96 | 433.50 | 409.24 | 394.30 | 369.71 | 423.61 | 383.68 | 15.56 | 352.20 | |
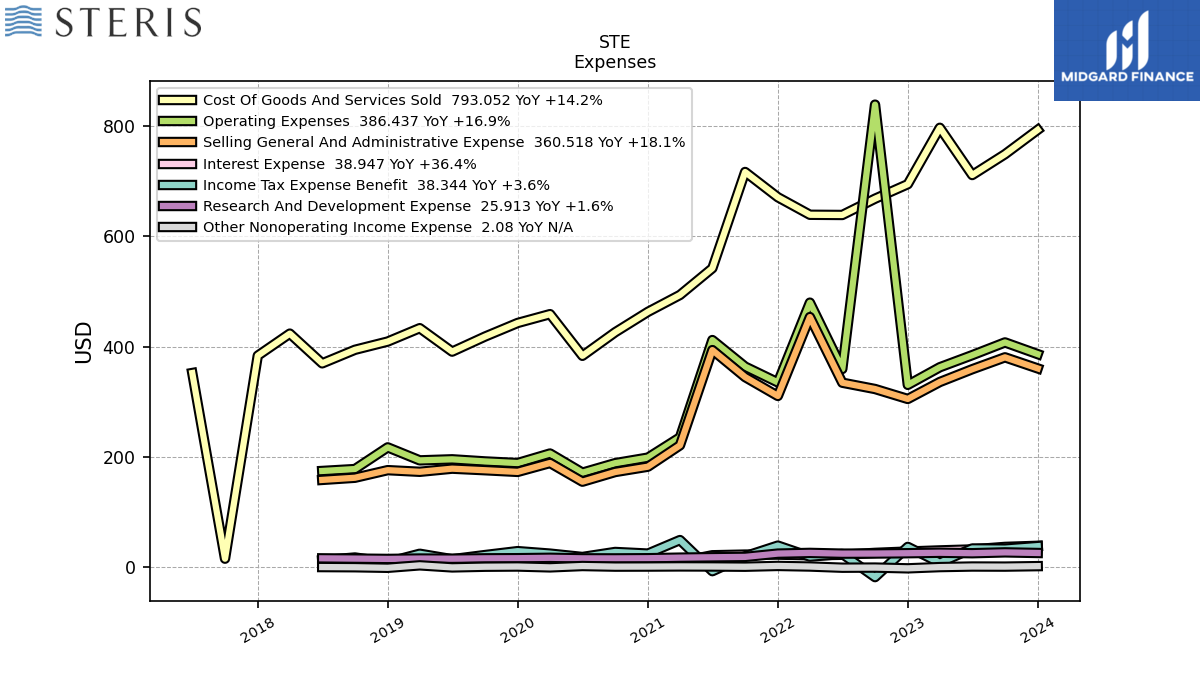
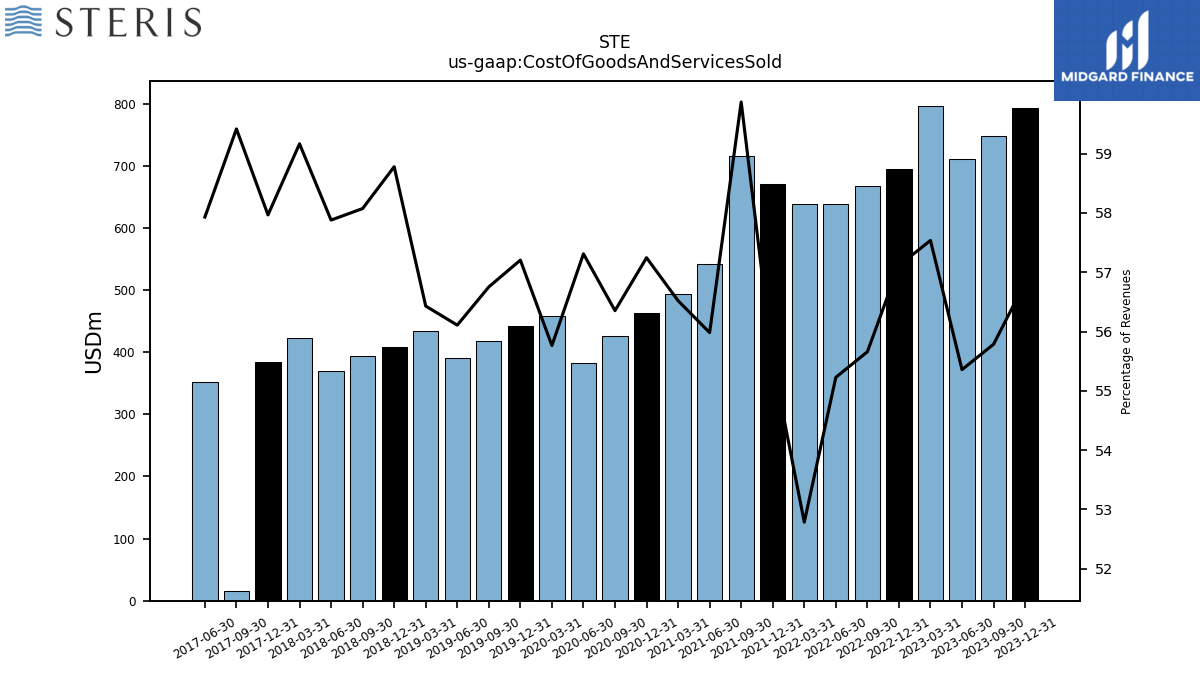
| Cost Of Goods And Services Sold | 793.05 | 748.83 | 711.08 | 796.77 | 694.50 | 668.18 | 638.69 | 639.06 | 670.86 | 716.64 | 542.14 | 493.71 | 463.06 | 426.10 | 383.36 | 458.93 | 442.91 | 418.17 | 390.96 | 433.50 | 409.24 | 394.30 | 369.71 | 423.61 | 383.68 | 15.56 | 352.20 | |
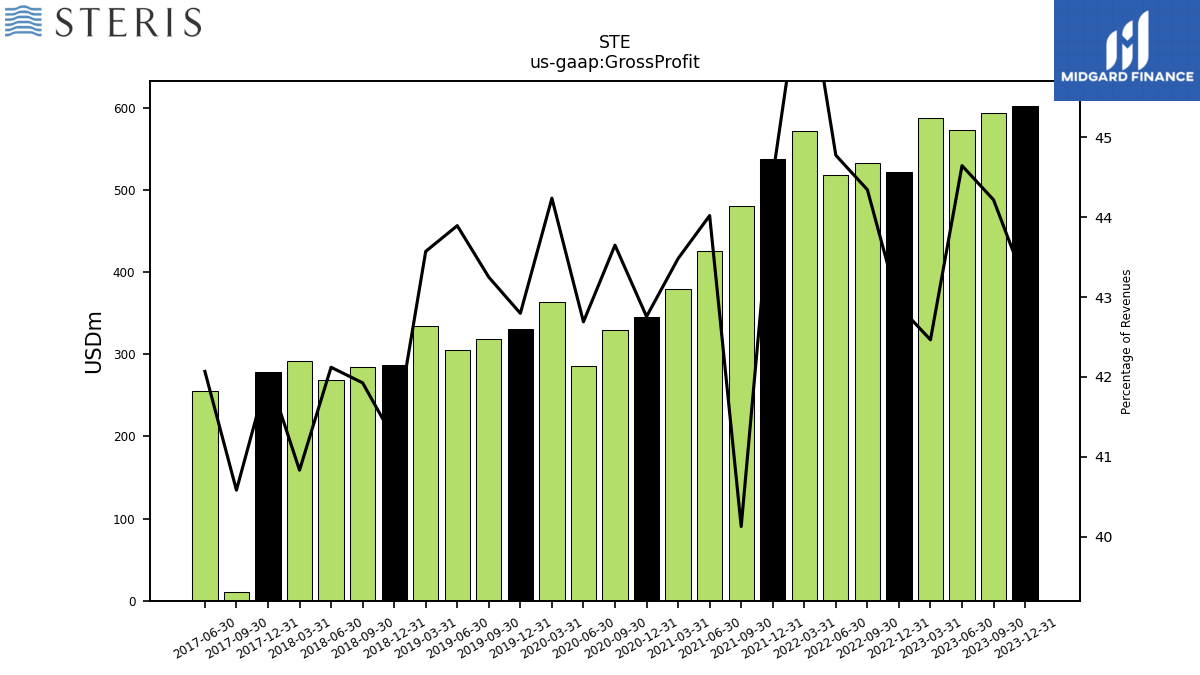
| Gross Profit | 602.59 | 593.53 | 573.46 | 588.06 | 521.50 | 532.34 | 517.80 | 571.62 | 538.11 | 480.34 | 426.28 | 379.82 | 345.86 | 330.04 | 285.57 | 364.06 | 331.35 | 318.67 | 305.84 | 334.72 | 287.00 | 284.66 | 269.05 | 292.37 | 278.22 | 10.63 | 255.77 | |
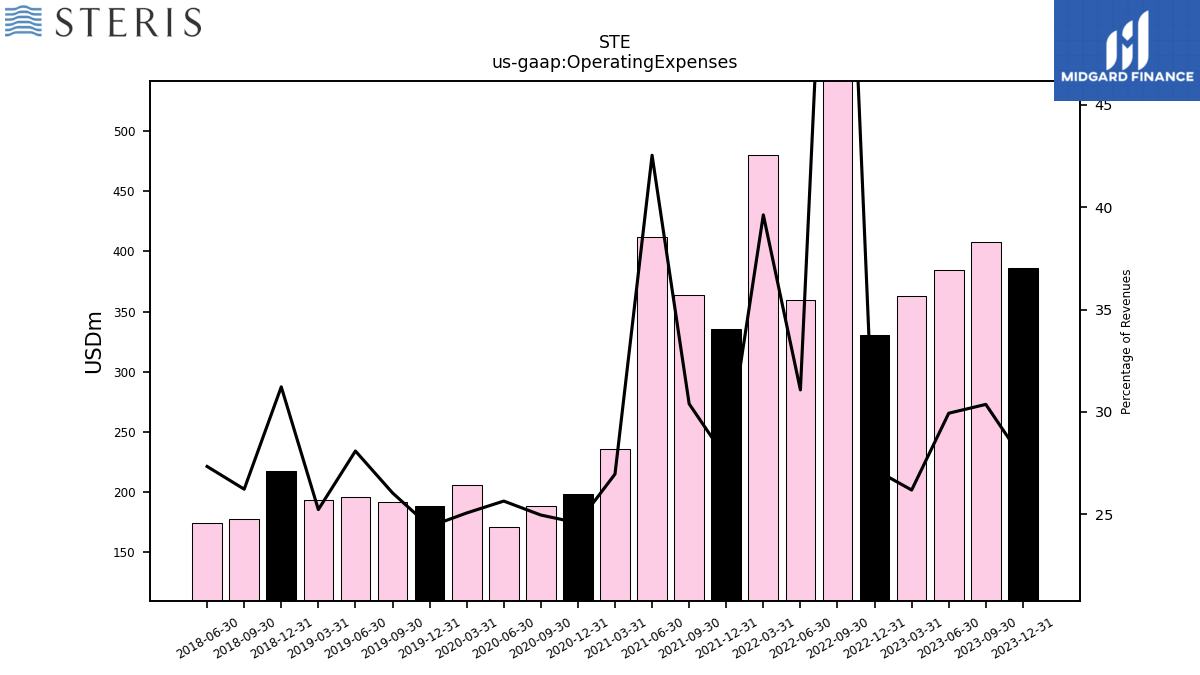
| Operating Expenses | 386.44 | 407.67 | 384.58 | 362.66 | 330.69 | 838.75 | 359.40 | 479.76 | 335.18 | 363.84 | 411.96 | 235.56 | 198.83 | 188.77 | 171.57 | 206.29 | 188.97 | 191.93 | 195.75 | 193.84 | 217.41 | 178.09 | 174.63 | NA | NA | NA | NA | |
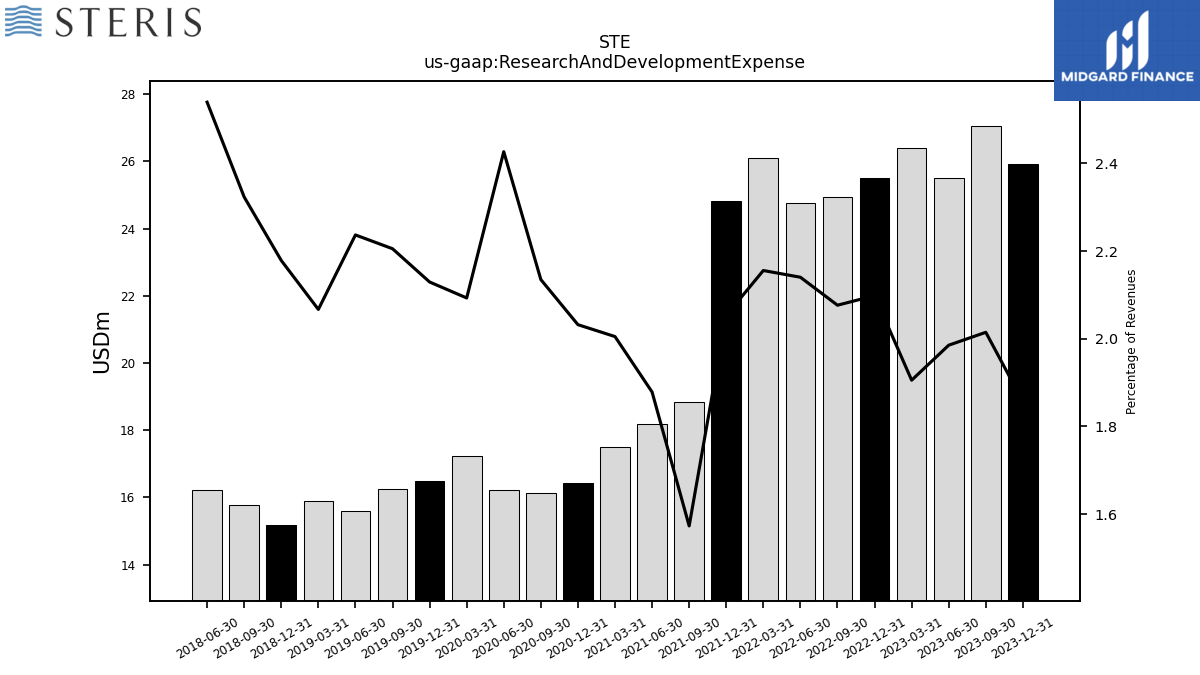
| Research And Development Expense | 25.91 | 27.04 | 25.50 | 26.39 | 25.51 | 24.93 | 24.75 | 26.10 | 24.82 | 18.83 | 18.19 | 17.51 | 16.44 | 16.14 | 16.23 | 17.23 | 16.49 | 16.25 | 15.59 | 15.88 | 15.17 | 15.77 | 16.22 | NA | NA | NA | NA | |
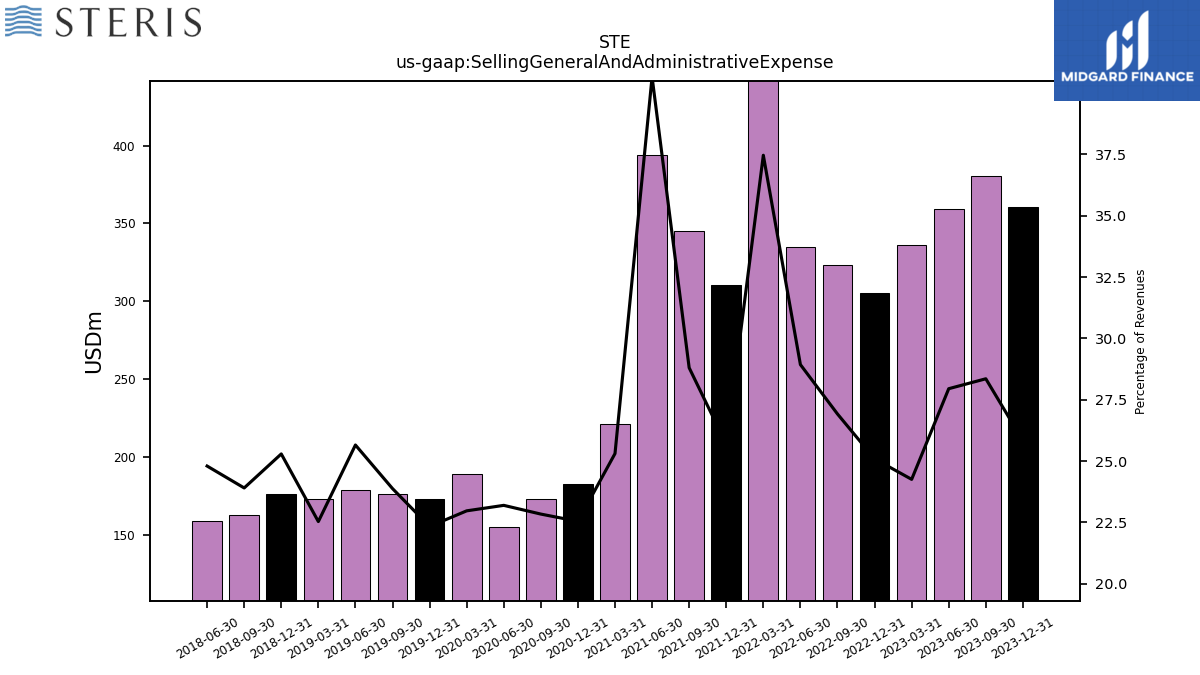
| Selling General And Administrative Expense | 360.52 | 380.65 | 359.06 | 335.91 | 305.14 | 323.19 | 334.63 | 453.64 | 310.56 | 344.80 | 393.75 | 221.07 | 182.37 | 172.71 | 155.17 | 189.06 | 172.93 | 175.96 | 178.78 | 173.12 | 176.10 | 162.31 | 158.41 | NA | NA | NA | NA | |
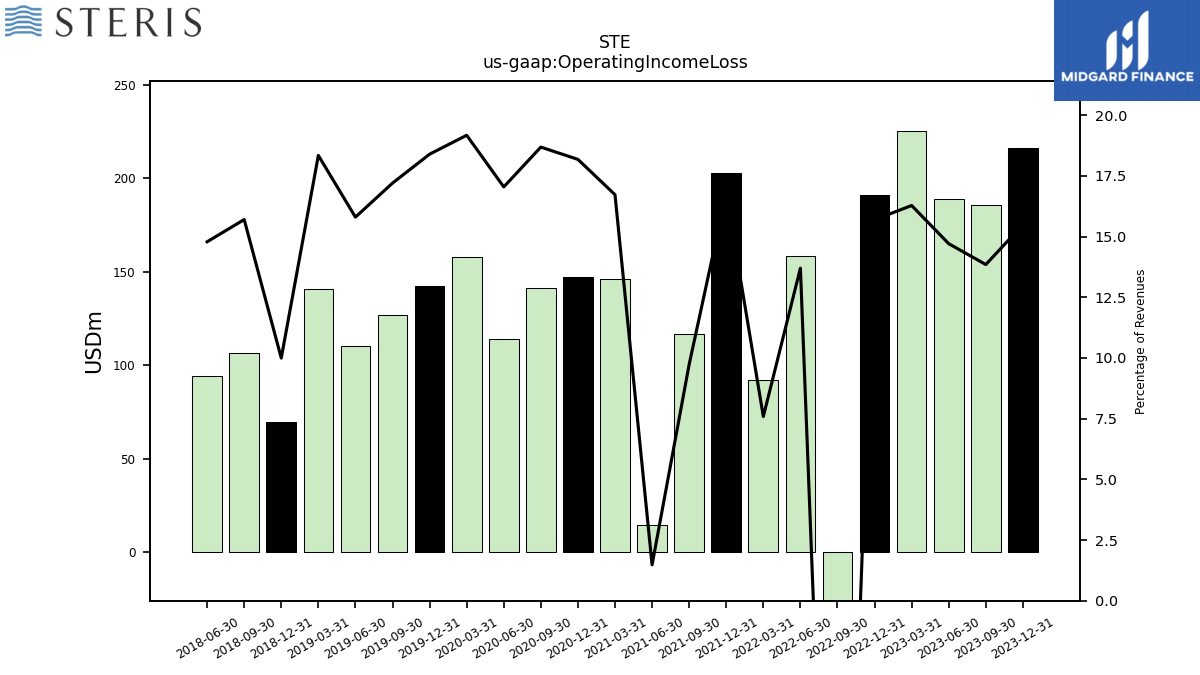
| Operating Income Loss | 216.16 | 185.86 | 188.88 | 225.40 | 190.80 | -306.42 | 158.40 | 91.86 | 202.93 | 116.50 | 14.32 | 146.07 | 147.03 | 141.26 | 114.00 | 157.76 | 142.39 | 126.73 | 110.09 | 140.88 | 69.58 | 106.58 | 94.42 | NA | NA | NA | NA | |
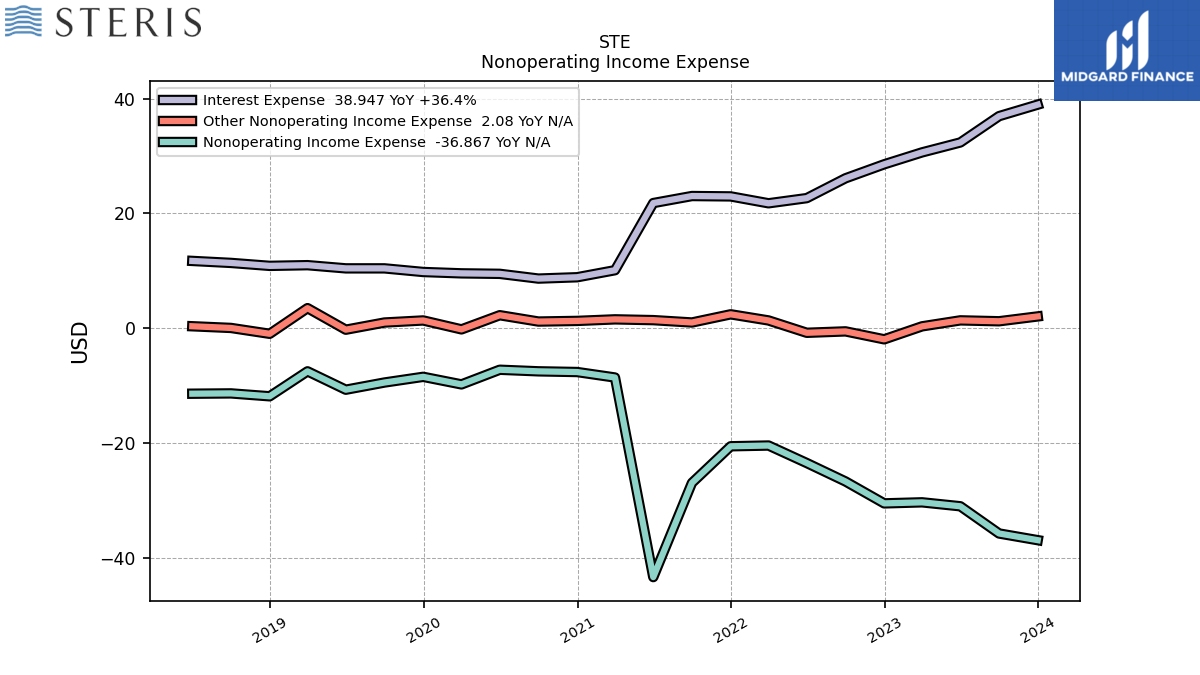
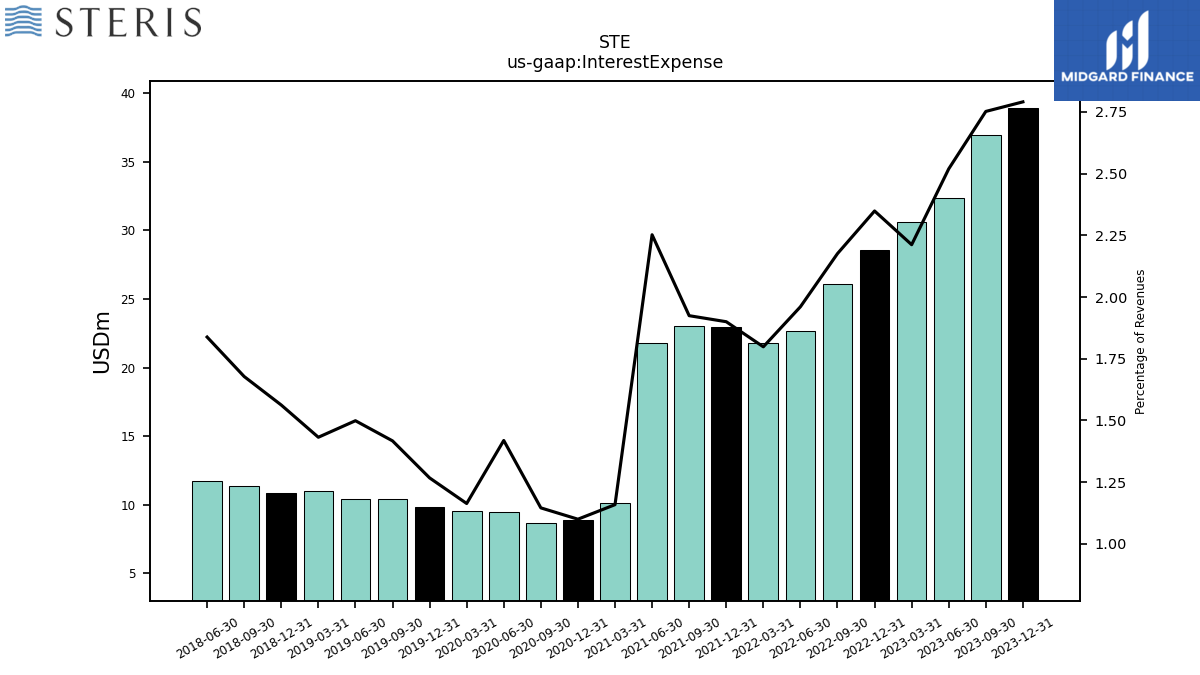
| Interest Expense | 38.95 | 36.94 | 32.36 | 30.63 | 28.56 | 26.12 | 22.67 | 21.77 | 22.97 | 23.04 | 21.81 | 10.12 | 8.90 | 8.66 | 9.49 | 9.58 | 9.81 | 10.44 | 10.45 | 11.00 | 10.88 | 11.39 | 11.74 | NA | NA | NA | NA | |
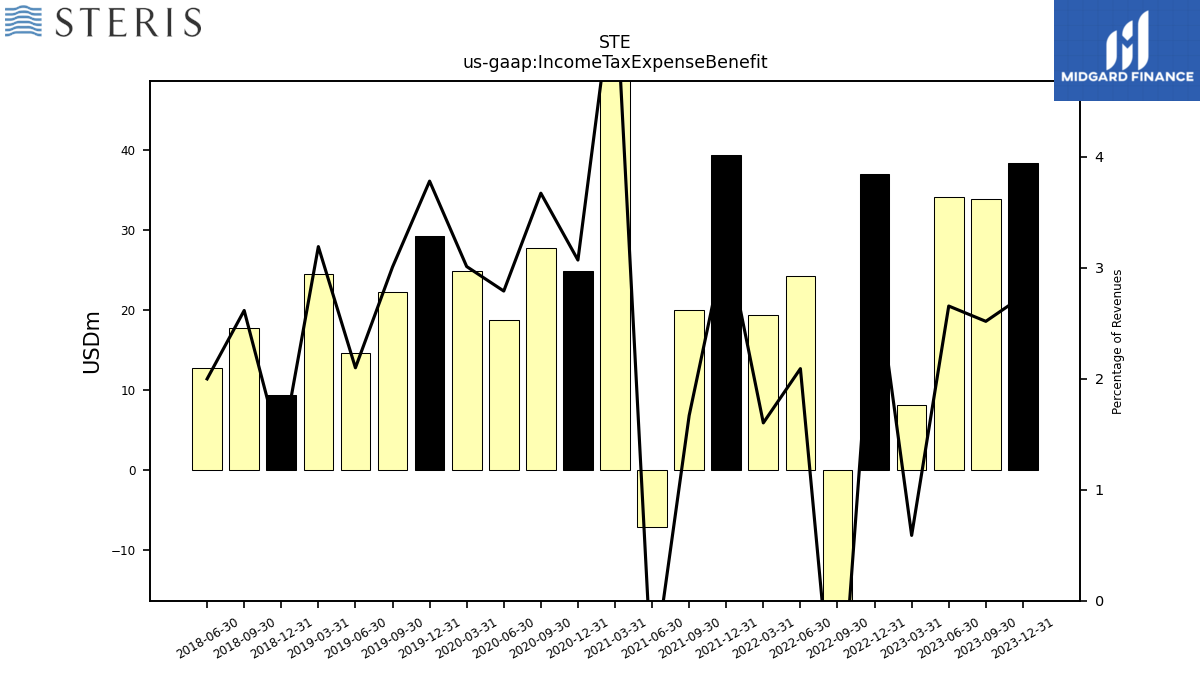
| Income Tax Expense Benefit | 38.34 | 33.81 | 34.12 | 8.16 | 37.01 | -17.83 | 24.20 | 19.41 | 39.31 | 19.98 | -7.08 | 49.37 | 24.84 | 27.78 | 18.67 | 24.79 | 29.29 | 22.16 | 14.63 | 24.52 | 9.33 | 17.76 | 12.77 | NA | NA | NA | NA | |
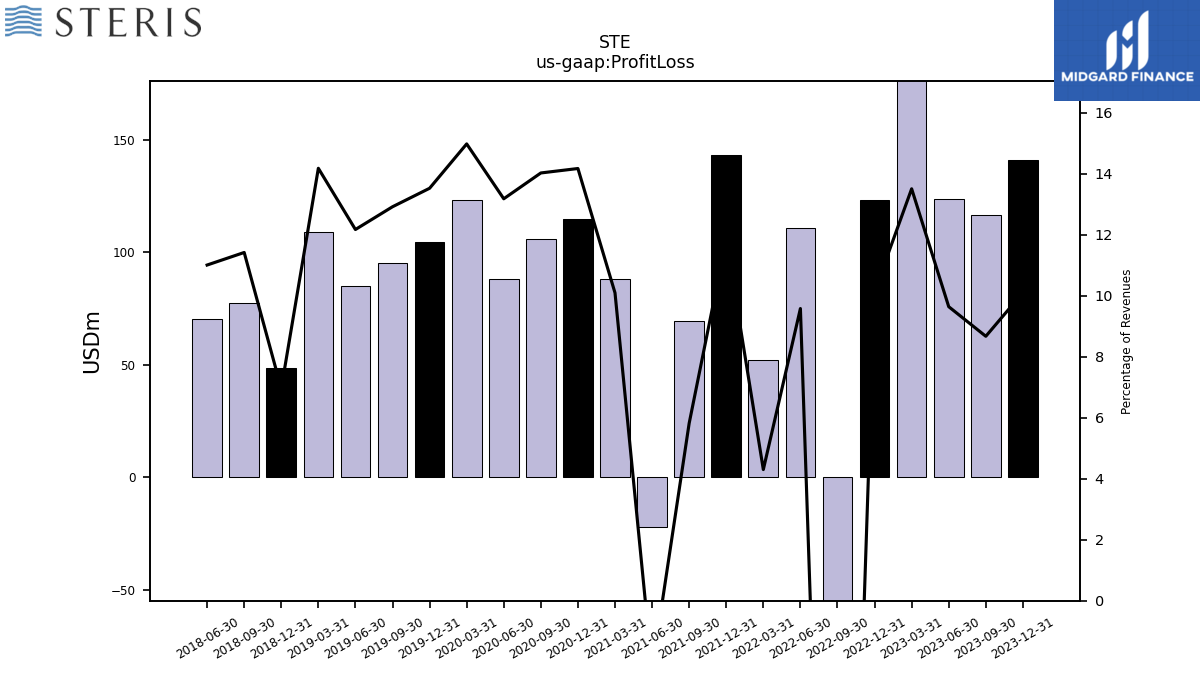
| Profit Loss | 140.94 | 116.35 | 123.79 | 186.96 | 123.33 | -315.23 | 110.75 | 52.05 | 143.09 | 69.62 | -21.90 | 88.15 | 114.59 | 106.01 | 88.12 | 123.22 | 104.67 | 95.14 | 84.78 | 108.88 | 48.43 | 77.50 | 70.28 | NA | NA | NA | NA | |
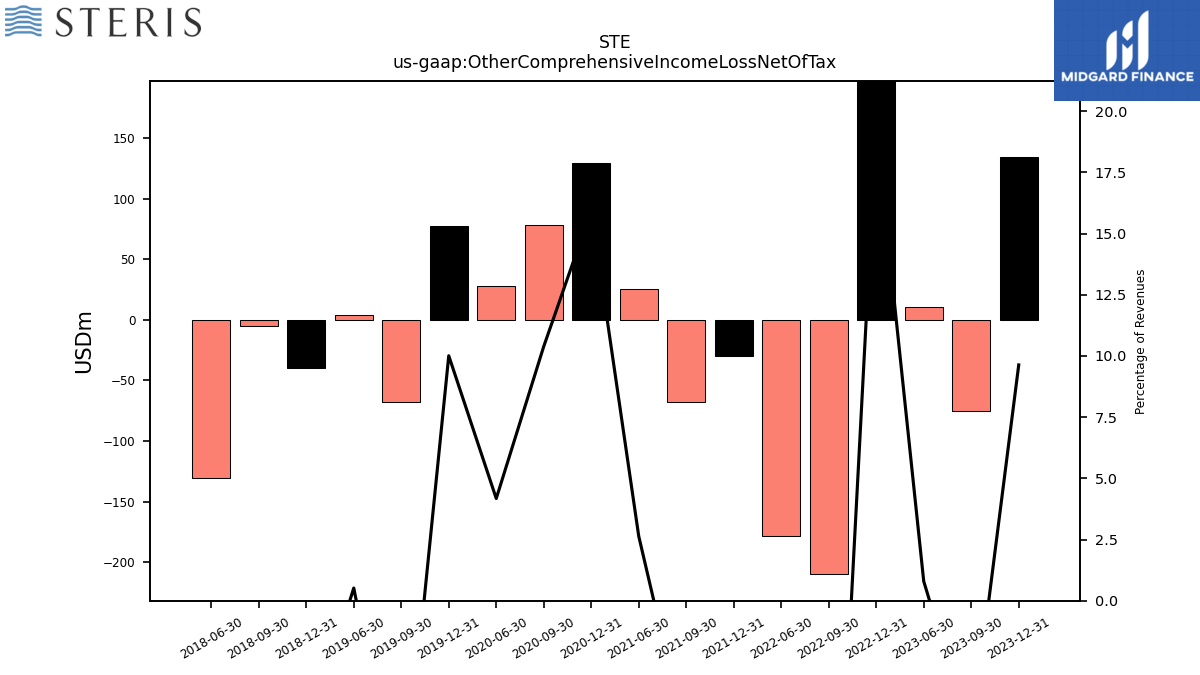
| Other Comprehensive Income Loss Net Of Tax | 134.46 | -75.60 | 10.21 | NA | 234.10 | -209.65 | -178.44 | NA | -30.06 | -67.82 | 25.52 | NA | 129.06 | 78.58 | 27.94 | NA | 77.49 | -68.18 | 3.63 | NA | -39.68 | -5.12 | -130.25 | NA | NA | NA | NA | |
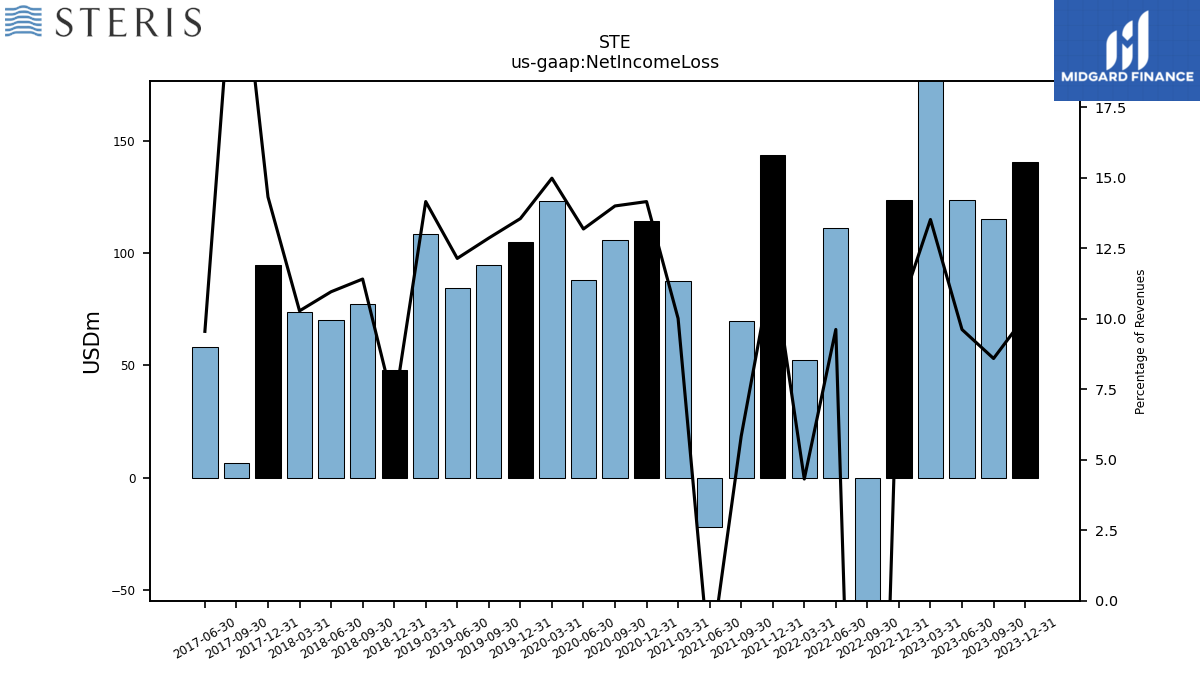
| Net Income Loss | 140.74 | 115.32 | 123.55 | 187.22 | 123.83 | -315.29 | 111.26 | 52.26 | 143.62 | 69.81 | -21.81 | 87.44 | 114.50 | 105.86 | 88.19 | 123.32 | 104.93 | 94.77 | 84.59 | 108.75 | 47.86 | 77.46 | 69.99 | 73.60 | 94.78 | 6.38 | 58.08 | |
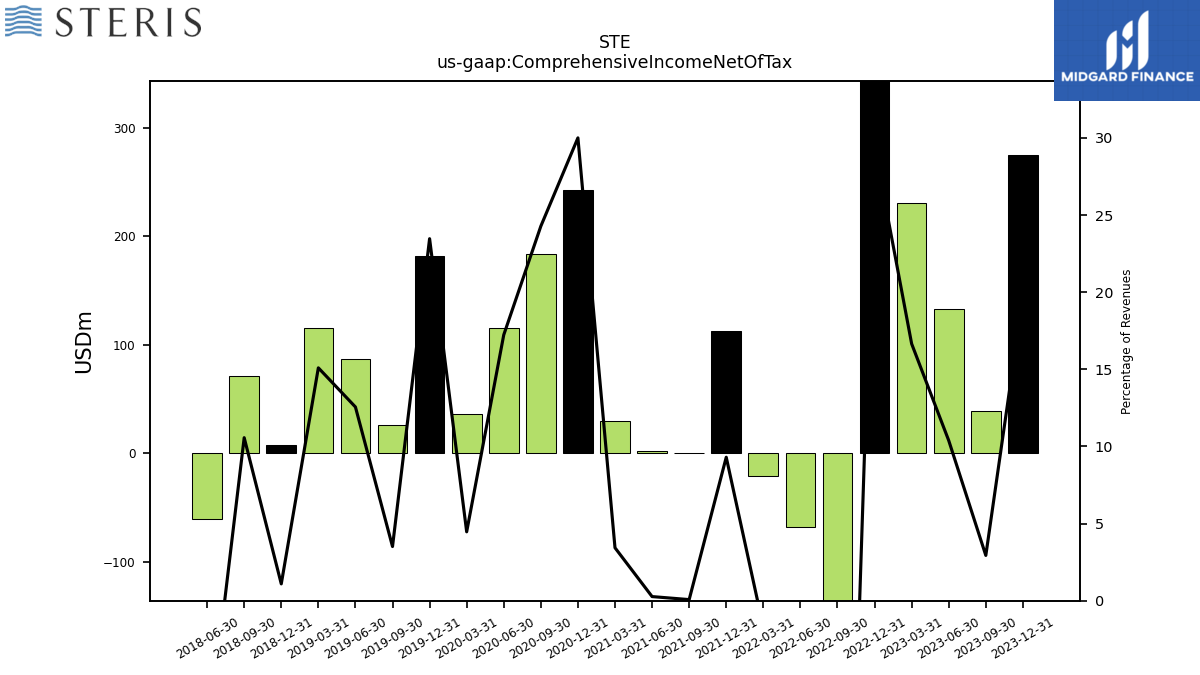
| Comprehensive Income Net Of Tax | 274.85 | 39.44 | 133.41 | 230.68 | 357.81 | -525.06 | -67.30 | -20.67 | 112.48 | 0.90 | 2.62 | 29.99 | 242.73 | 183.60 | 115.30 | 36.77 | 181.72 | 25.90 | 87.52 | 115.99 | 7.61 | 71.77 | -60.82 | NA | NA | NA | NA |
| 2023-12-31 | 2023-09-30 | 2023-06-30 | 2023-03-31 | 2022-12-31 | 2022-09-30 | 2022-06-30 | 2022-03-31 | 2021-12-31 | 2021-09-30 | 2021-06-30 | 2021-03-31 | 2020-12-31 | 2020-09-30 | 2020-06-30 | 2020-03-31 | 2019-12-31 | 2019-09-30 | 2019-06-30 | 2019-03-31 | 2018-12-31 | 2018-09-30 | 2018-06-30 | 2018-03-31 | 2017-12-31 | 2017-09-30 | 2017-06-30 | ||
|---|---|---|---|---|---|---|---|---|---|---|---|---|---|---|---|---|---|---|---|---|---|---|---|---|---|---|---|---|
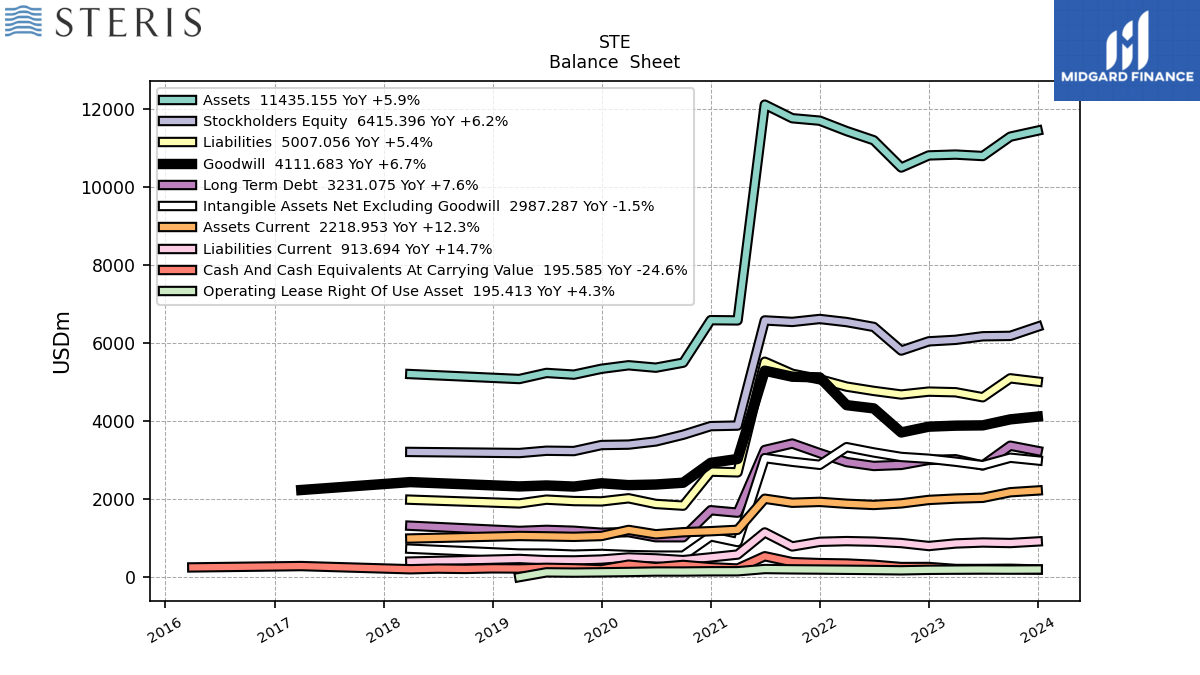
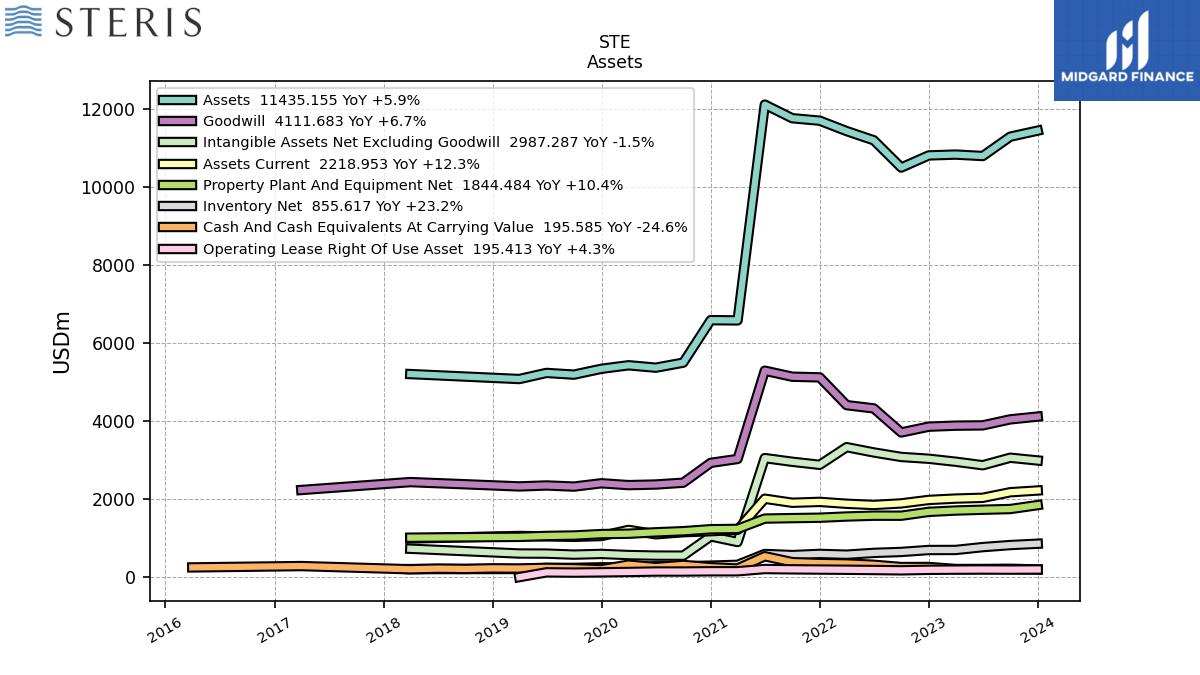
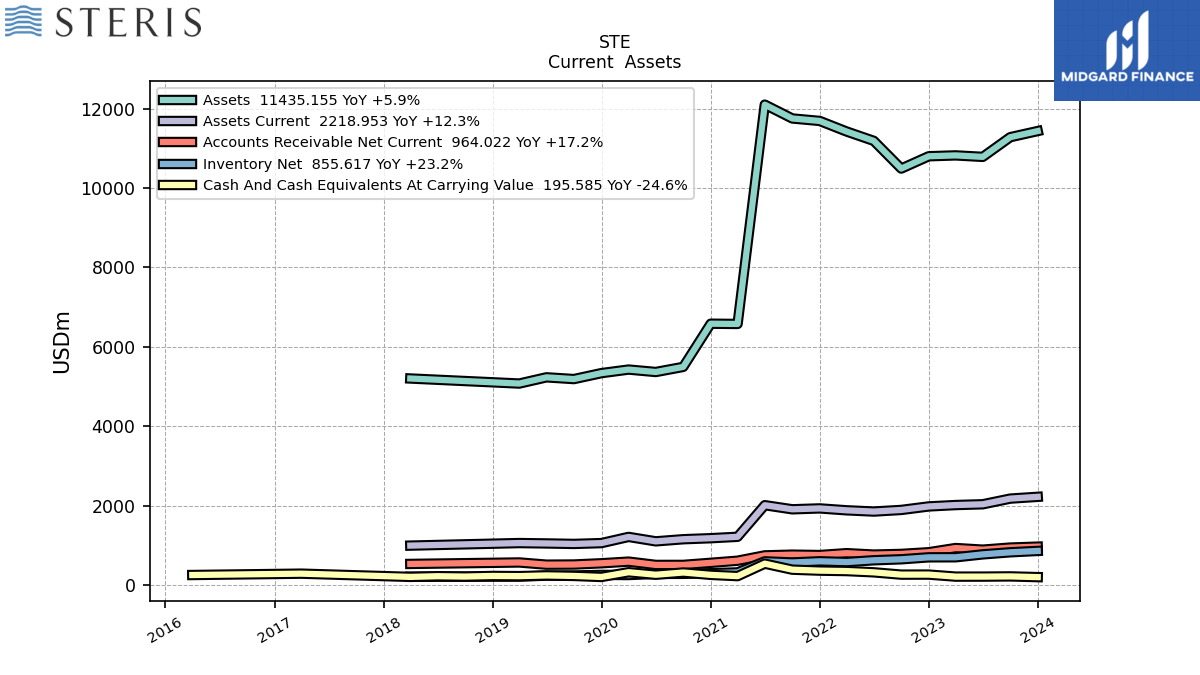
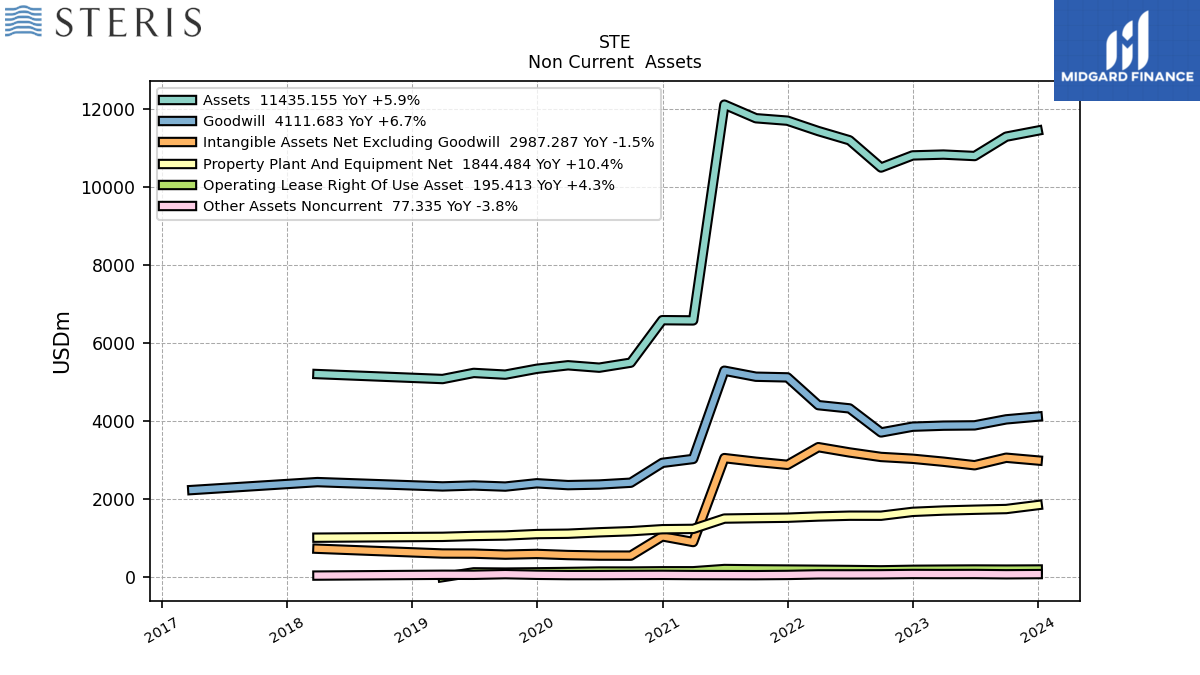
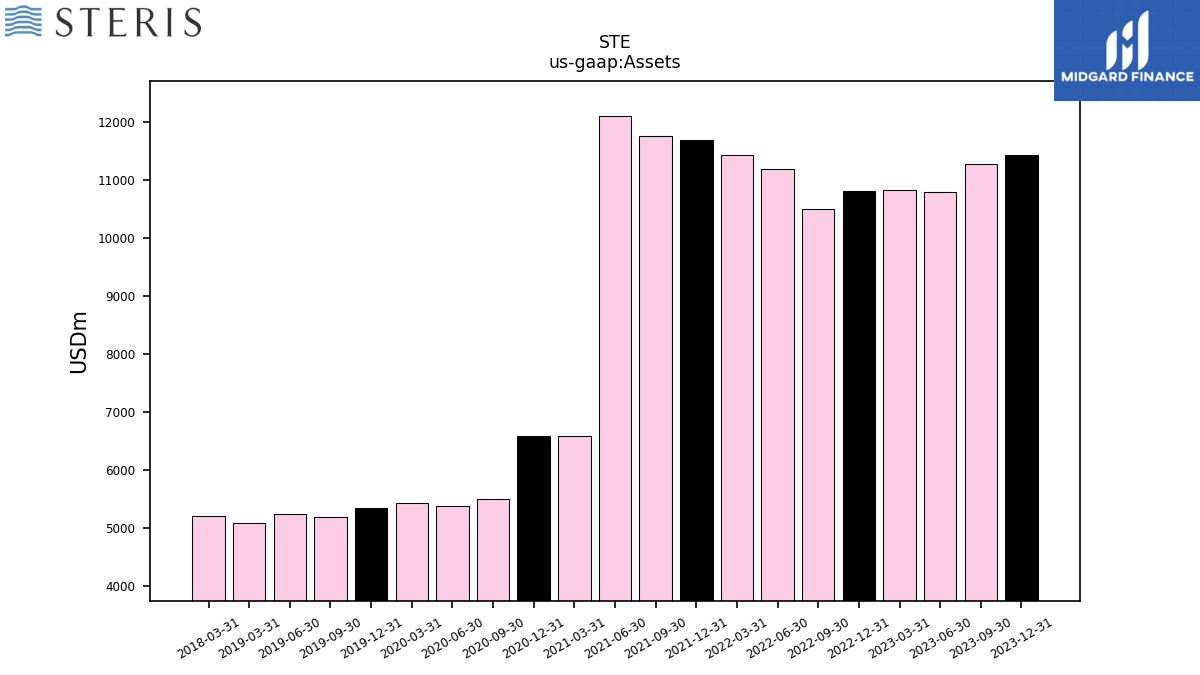
| Assets | 11435.16 | 11280.64 | 10784.38 | 10821.84 | 10799.92 | 10489.64 | 11188.01 | 11423.59 | 11689.97 | 11752.45 | 12101.01 | 6574.47 | 6580.78 | 5492.57 | 5363.93 | 5425.58 | 5335.58 | 5185.72 | 5229.72 | 5073.07 | NA | NA | NA | 5200.33 | NA | NA | NA | |
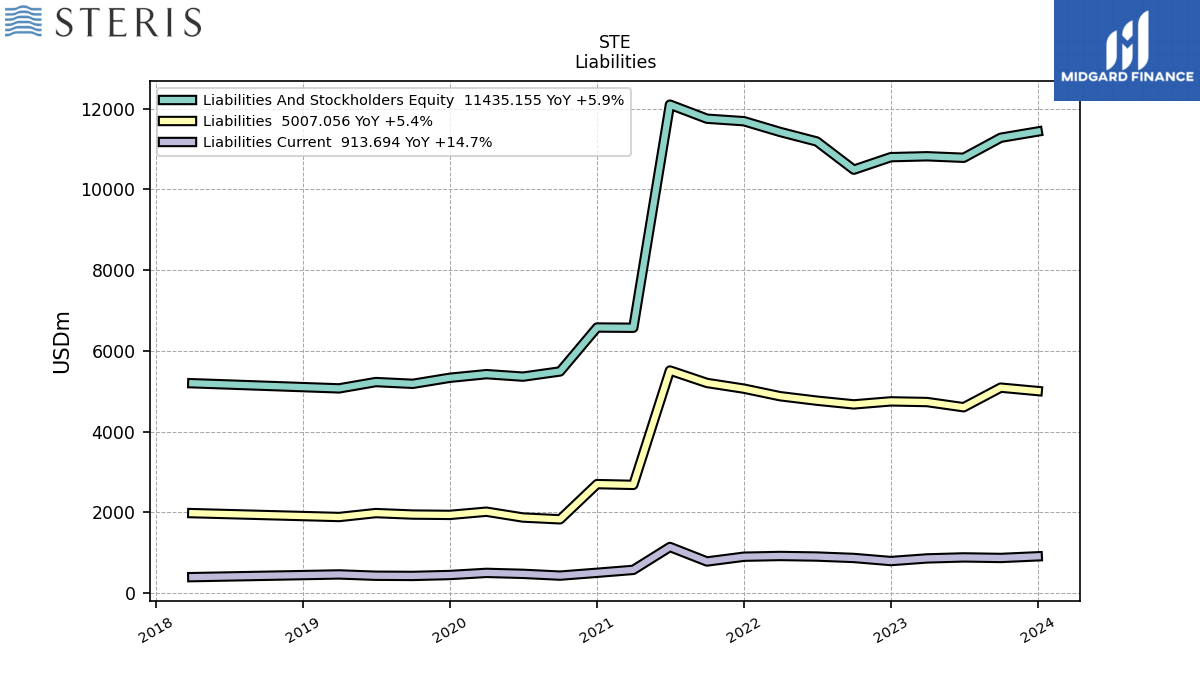
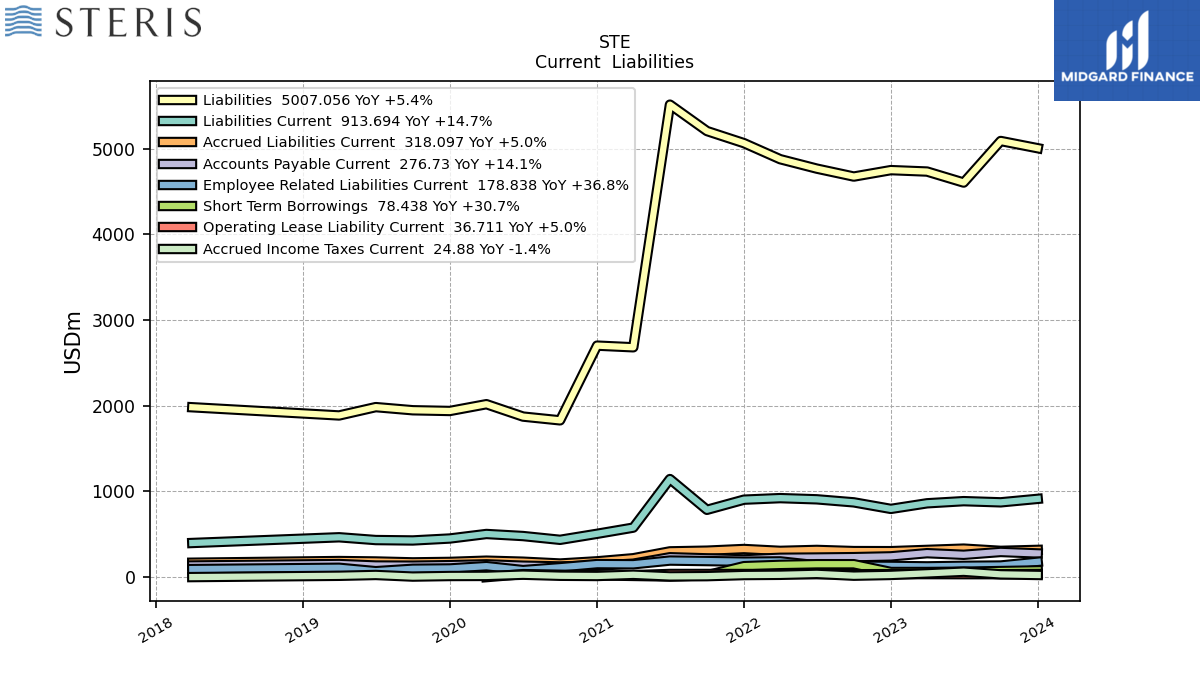
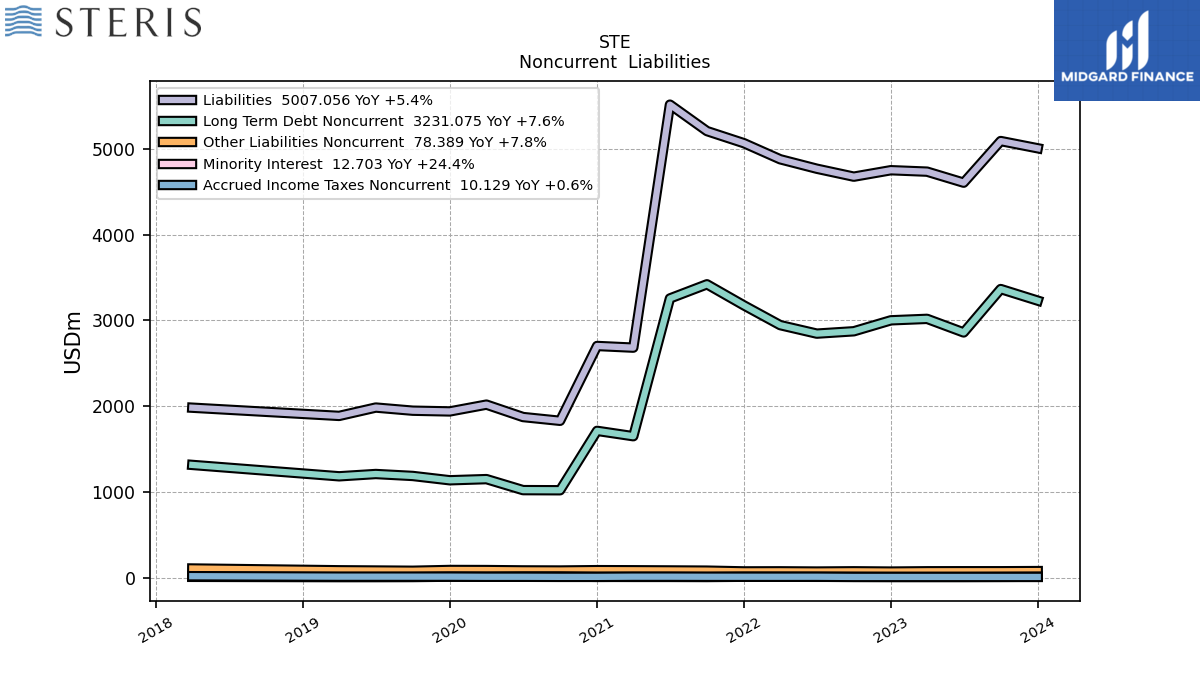
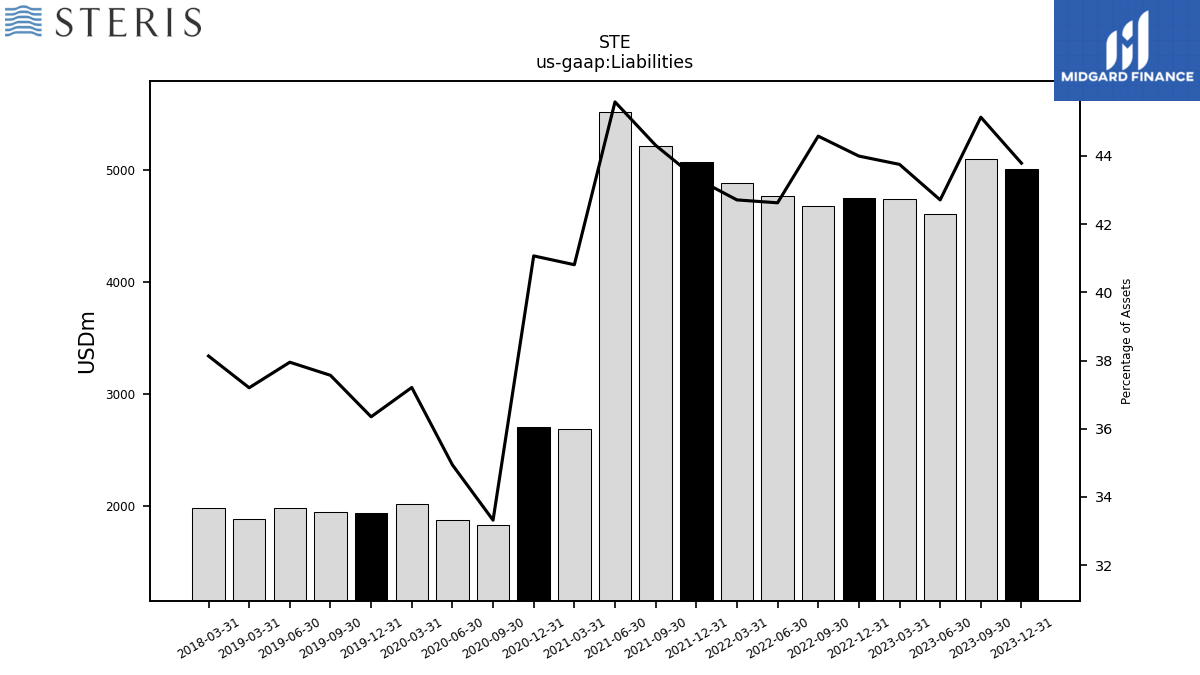
| Liabilities | 5007.06 | 5091.47 | 4606.01 | 4734.67 | 4751.40 | 4676.19 | 4768.88 | 4878.96 | 5066.30 | 5207.52 | 5515.99 | 2683.00 | 2702.59 | 1830.11 | 1874.21 | 2018.86 | 1939.52 | 1948.07 | 1984.72 | 1887.27 | NA | NA | NA | 1983.03 | NA | NA | NA | |
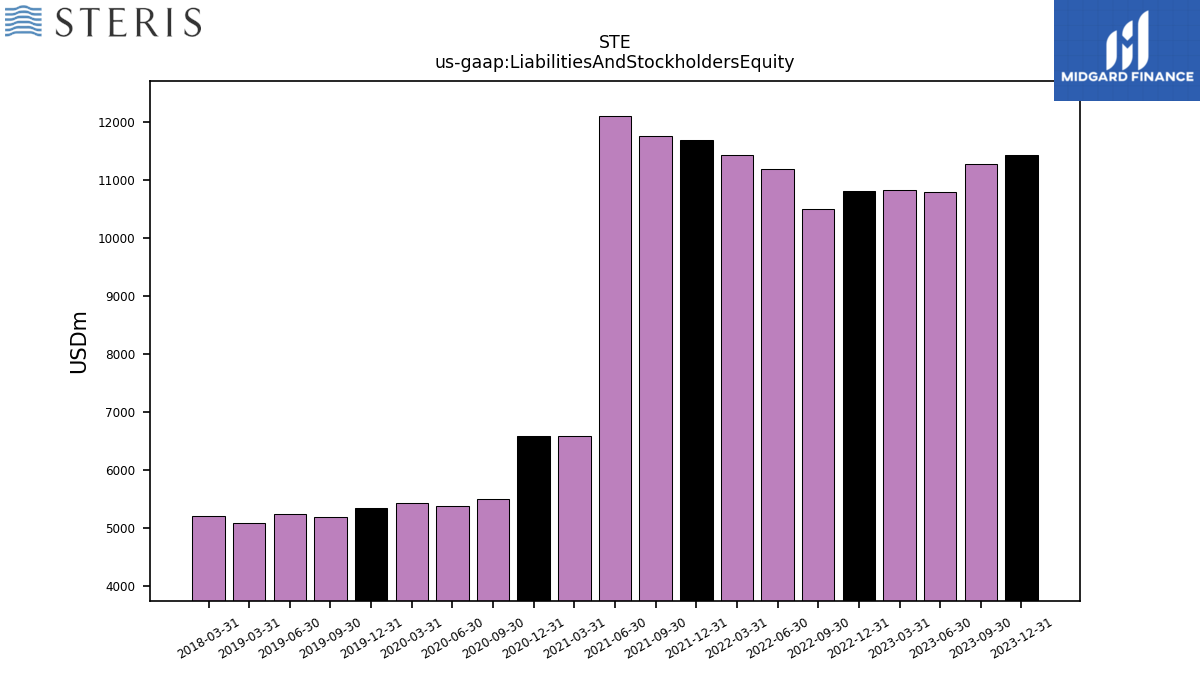
| Liabilities And Stockholders Equity | 11435.16 | 11280.64 | 10784.38 | 10821.84 | 10799.92 | 10489.64 | 11188.01 | 11423.59 | 11689.97 | 11752.45 | 12101.01 | 6574.47 | 6580.78 | 5492.57 | 5363.93 | 5425.58 | 5335.58 | 5185.72 | 5229.72 | 5073.07 | NA | NA | NA | 5200.33 | NA | NA | NA | |
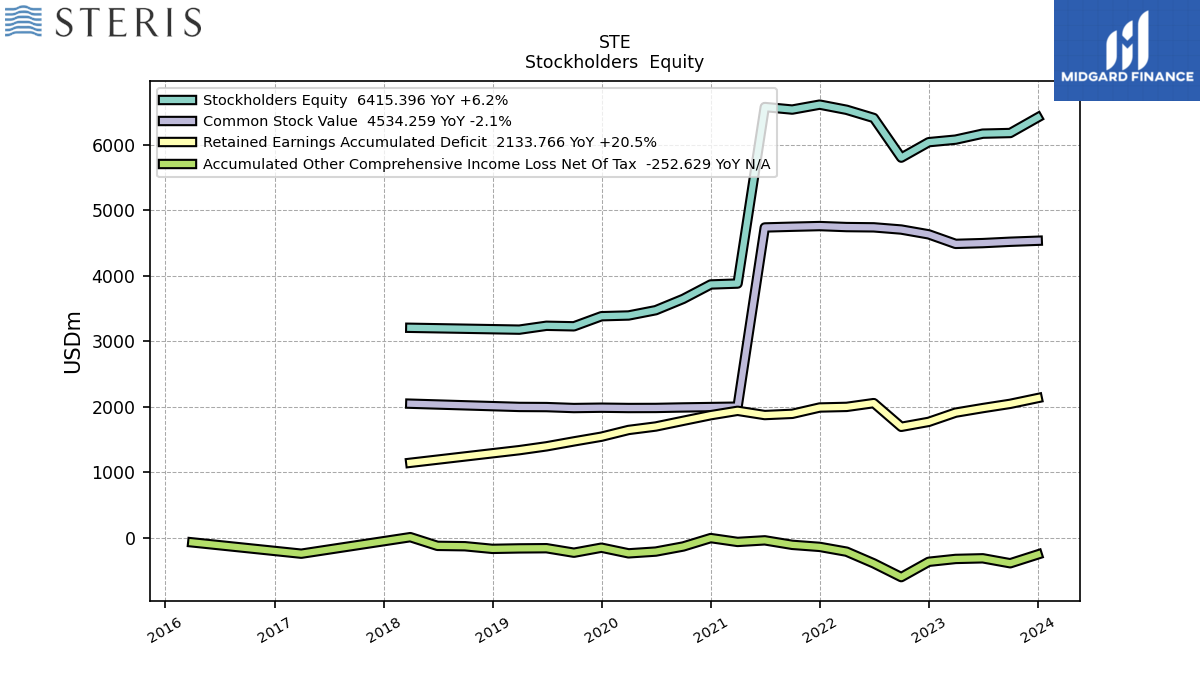
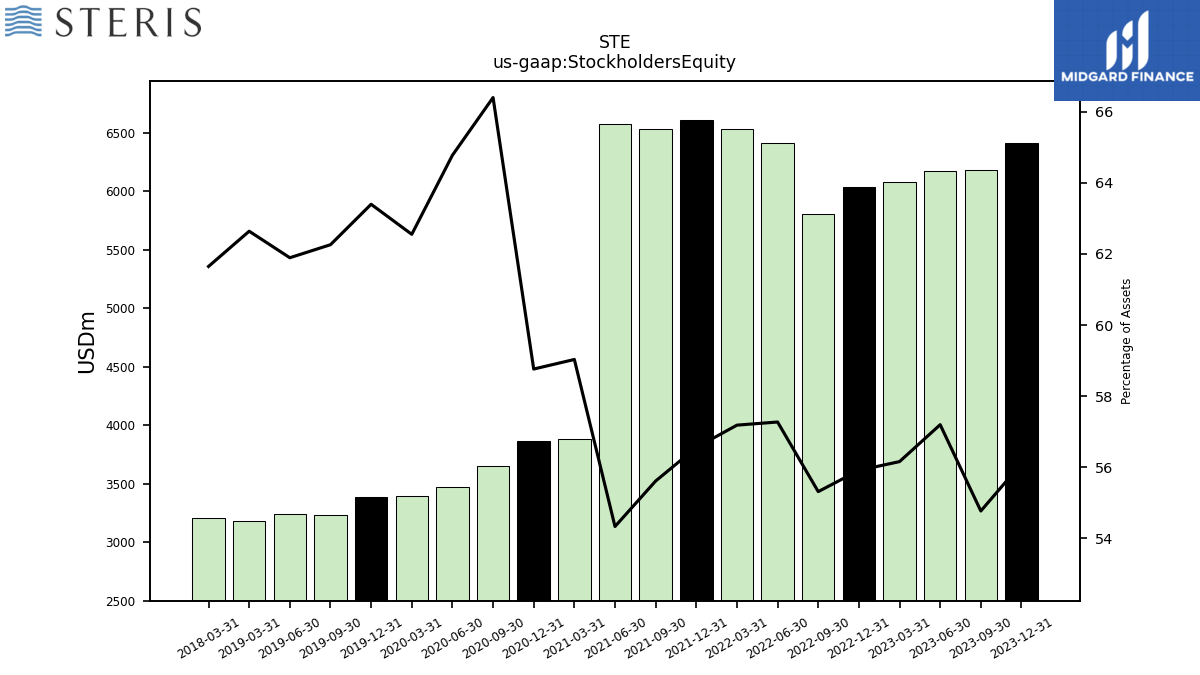
| Stockholders Equity | 6415.40 | 6178.07 | 6168.29 | 6077.20 | 6038.31 | 5802.06 | 6407.55 | 6532.36 | 6611.19 | 6535.64 | 6574.58 | 3880.99 | 3866.99 | 3647.14 | 3474.66 | 3393.88 | 3382.68 | 3228.67 | 3236.90 | 3177.81 | NA | NA | NA | 3205.96 | NA | NA | NA |
| 2023-12-31 | 2023-09-30 | 2023-06-30 | 2023-03-31 | 2022-12-31 | 2022-09-30 | 2022-06-30 | 2022-03-31 | 2021-12-31 | 2021-09-30 | 2021-06-30 | 2021-03-31 | 2020-12-31 | 2020-09-30 | 2020-06-30 | 2020-03-31 | 2019-12-31 | 2019-09-30 | 2019-06-30 | 2019-03-31 | 2018-12-31 | 2018-09-30 | 2018-06-30 | 2018-03-31 | 2017-12-31 | 2017-09-30 | 2017-06-30 | ||
|---|---|---|---|---|---|---|---|---|---|---|---|---|---|---|---|---|---|---|---|---|---|---|---|---|---|---|---|---|
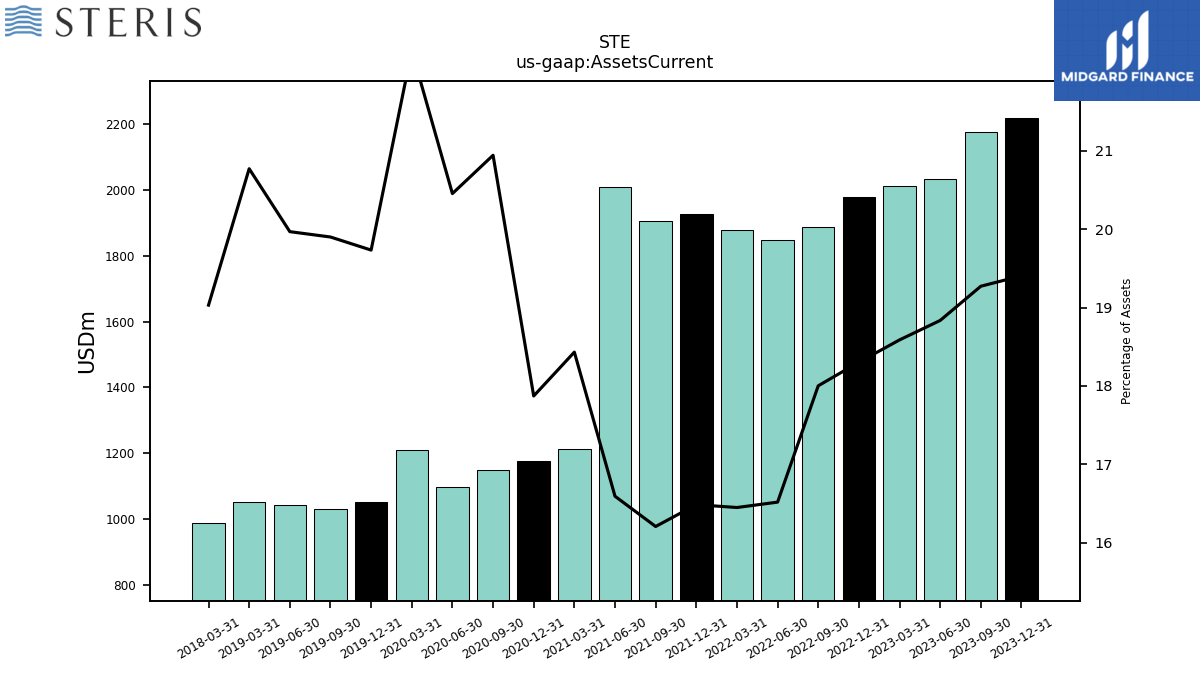
| Assets Current | 2218.95 | 2173.98 | 2031.26 | 2011.44 | 1976.63 | 1888.30 | 1847.95 | 1879.00 | 1927.09 | 1904.63 | 2007.86 | 1211.75 | 1176.08 | 1150.31 | 1097.13 | 1208.75 | 1052.87 | 1031.95 | 1044.28 | 1053.73 | NA | NA | NA | 989.66 | NA | NA | NA | |
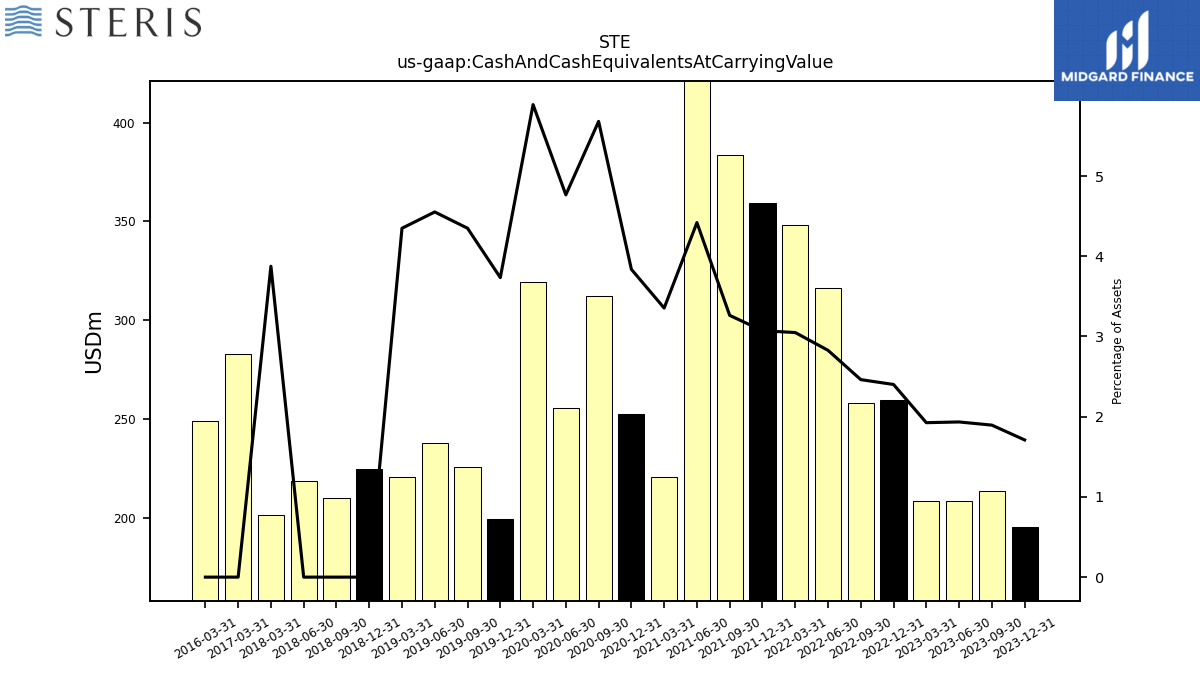
| Cash And Cash Equivalents At Carrying Value | 195.59 | 213.76 | 208.61 | 208.36 | 259.37 | 258.26 | 316.33 | 348.32 | 359.09 | 383.49 | 534.77 | 220.53 | 252.50 | 312.03 | 255.63 | 319.58 | 199.23 | 225.54 | 238.07 | 220.63 | 224.91 | 209.92 | 218.52 | 201.53 | NA | NA | NA | |
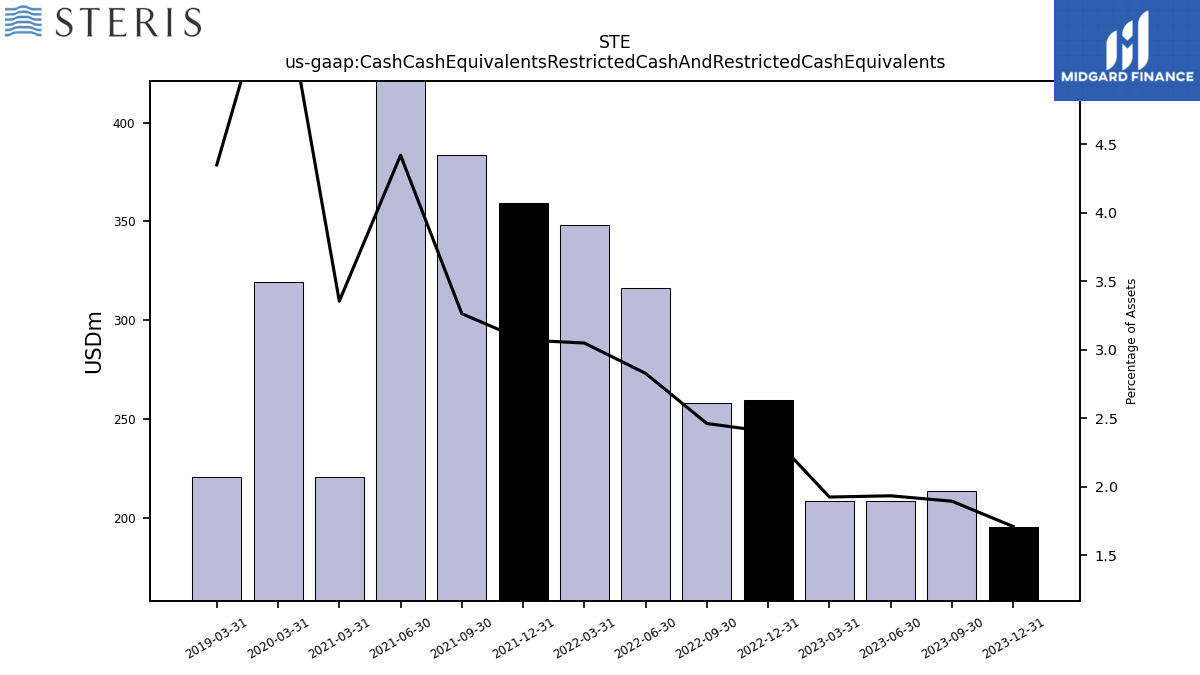
| Cash Cash Equivalents Restricted Cash And Restricted Cash Equivalents | 195.59 | 213.76 | 208.61 | 208.36 | 259.37 | 258.26 | 316.33 | 348.32 | 359.09 | 383.49 | 534.77 | 220.53 | NA | NA | NA | 319.58 | NA | NA | NA | 220.63 | NA | NA | NA | NA | NA | NA | NA | |
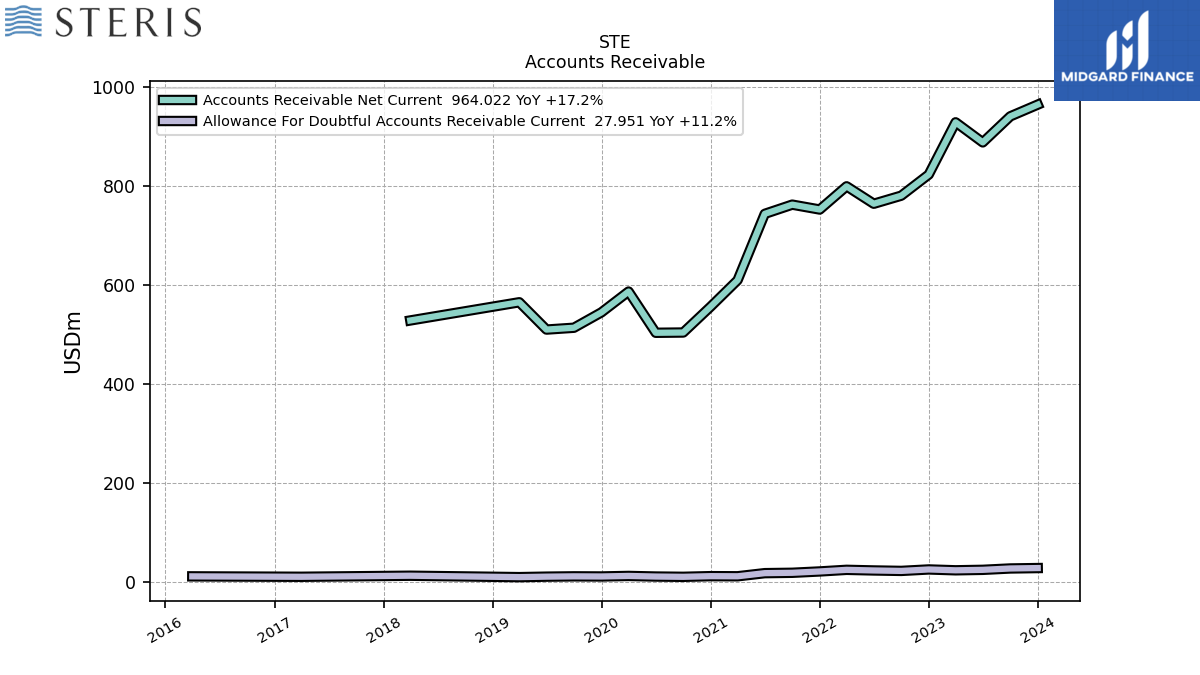
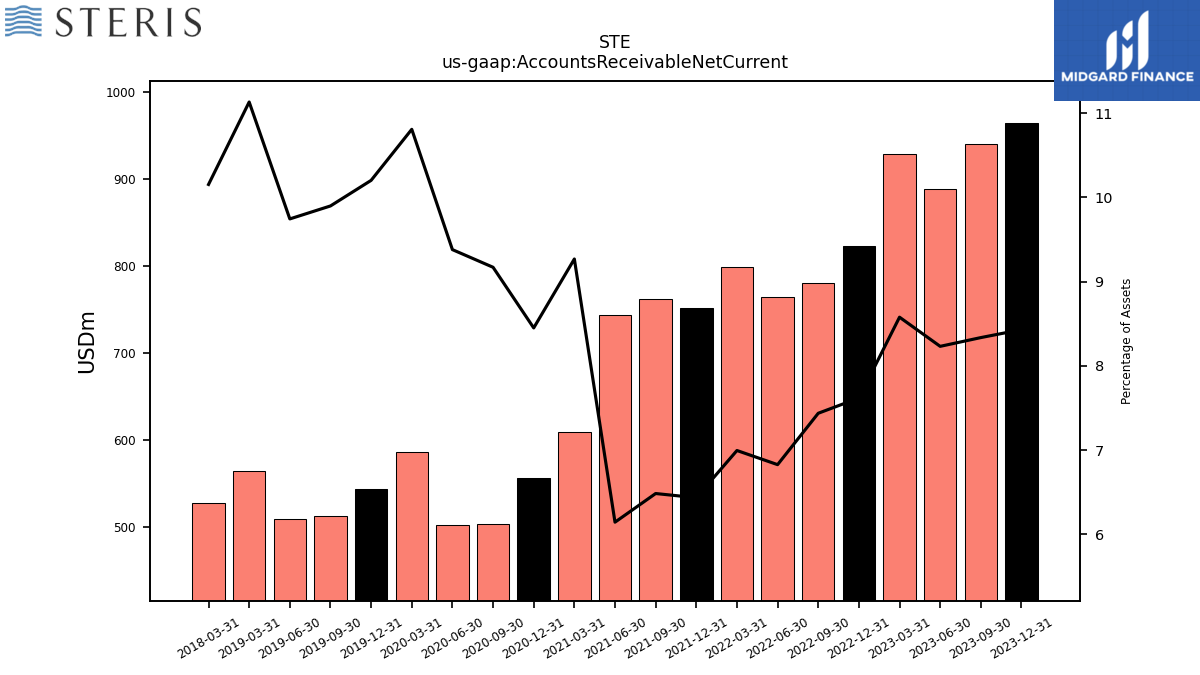
| Accounts Receivable Net Current | 964.02 | 940.33 | 887.76 | 928.32 | 822.76 | 780.11 | 763.79 | 799.04 | 752.13 | 762.00 | 743.42 | 609.41 | 556.12 | 503.72 | 503.17 | 586.48 | 544.40 | 513.35 | 509.65 | 564.83 | NA | NA | NA | 528.07 | NA | NA | NA | |
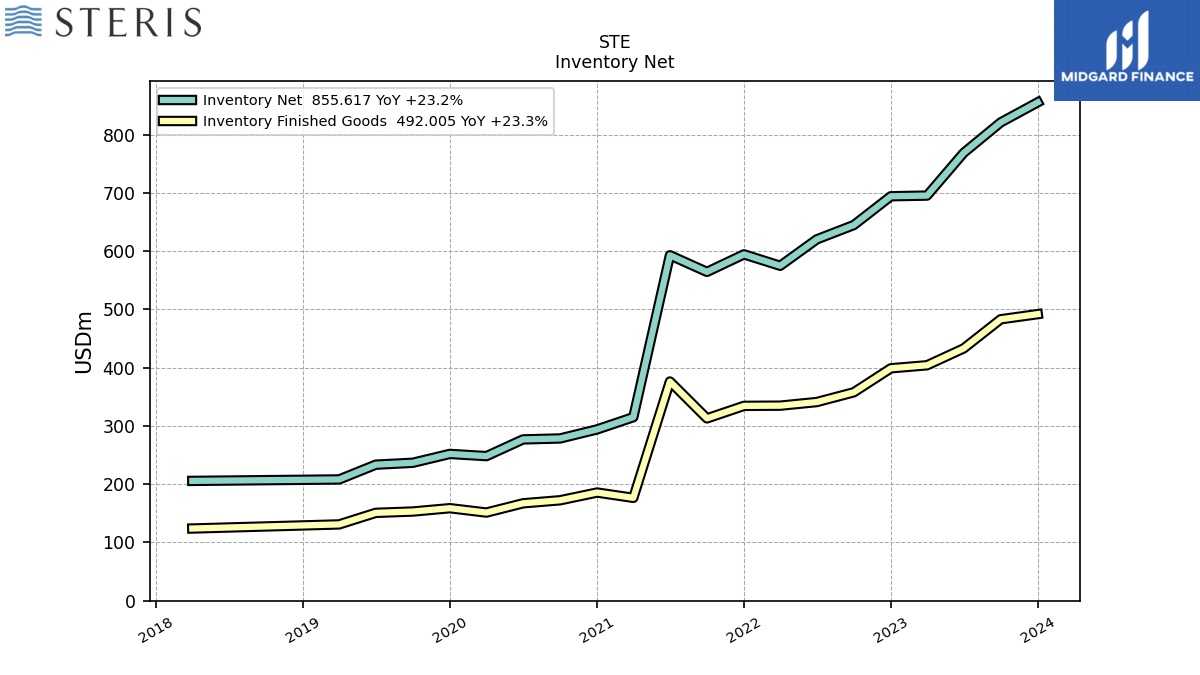
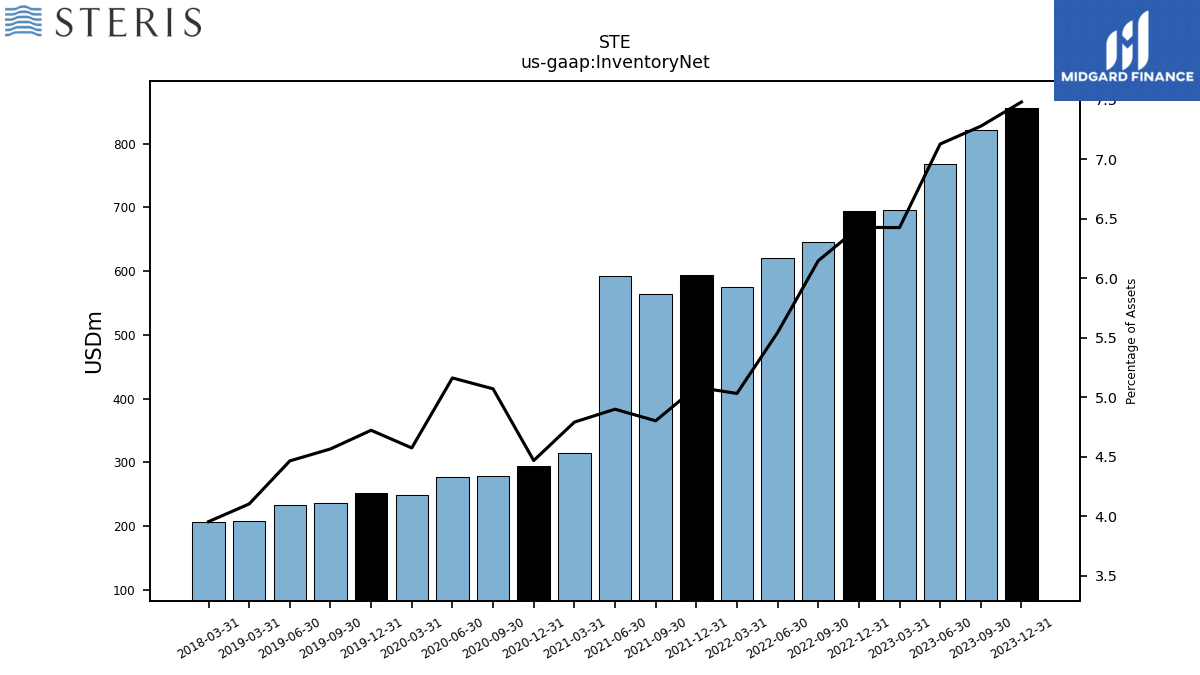
| Inventory Net | 855.62 | 821.13 | 768.84 | 695.49 | 694.36 | 644.94 | 620.40 | 575.00 | 594.60 | 564.53 | 593.07 | 315.07 | 294.13 | 278.59 | 276.97 | 248.26 | 252.05 | 236.84 | 233.59 | 208.24 | NA | NA | NA | 205.73 | NA | NA | NA | |
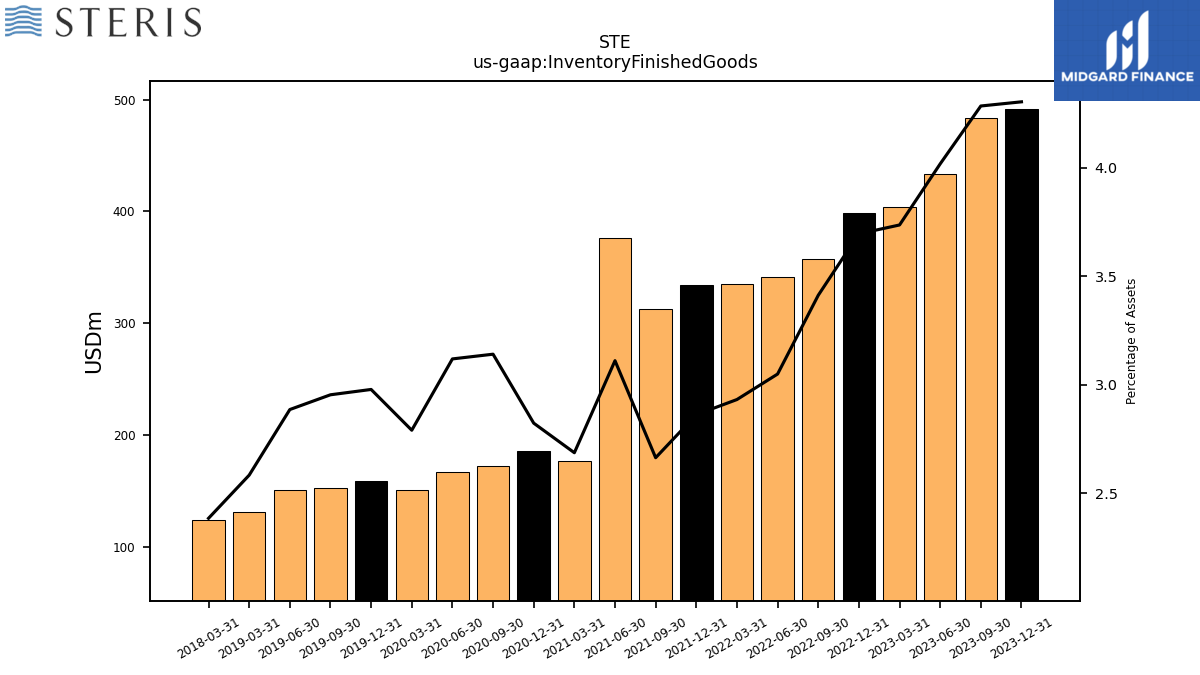
| Inventory Finished Goods | 492.00 | 483.19 | 433.19 | 404.24 | 399.03 | 357.85 | 341.11 | 334.88 | 334.53 | 313.03 | 376.38 | 176.62 | 185.76 | 172.48 | 167.28 | 151.38 | 158.89 | 153.15 | 150.90 | 131.05 | NA | NA | NA | 124.00 | NA | NA | NA | |
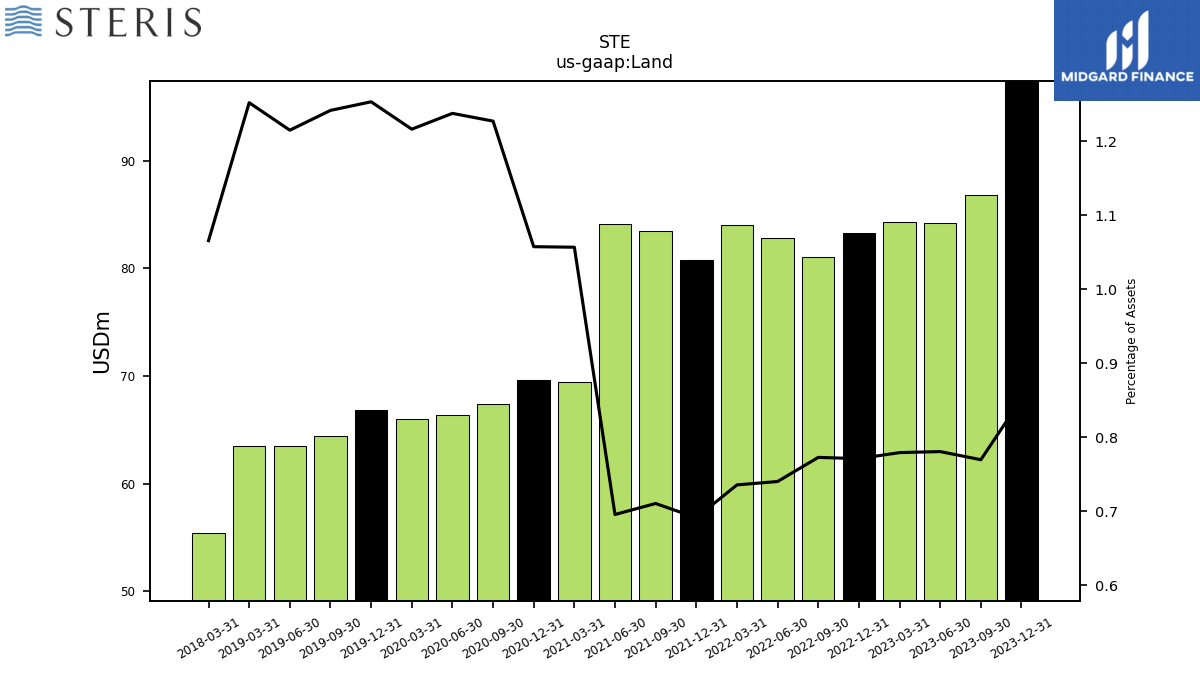
| Land | 97.38 | 86.80 | 84.17 | 84.31 | 83.26 | 81.05 | 82.80 | 84.02 | 80.78 | 83.48 | 84.15 | 69.48 | 69.59 | 67.41 | 66.39 | 65.99 | 66.87 | 64.39 | 63.54 | 63.52 | NA | NA | NA | 55.42 | NA | NA | NA | |
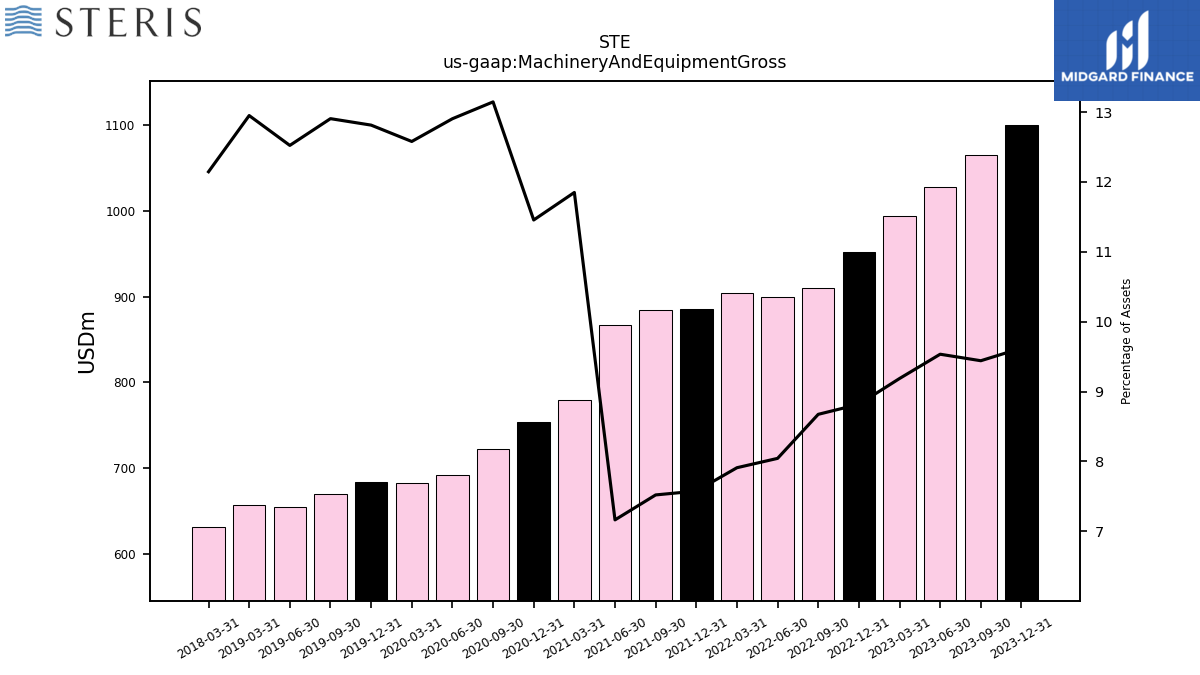
| Machinery And Equipment Gross | 1100.27 | 1065.05 | 1028.24 | 994.19 | 952.35 | 909.92 | 899.97 | 903.65 | 885.66 | 883.90 | 866.90 | 779.04 | 753.85 | 722.02 | 692.19 | 682.49 | 683.66 | 669.25 | 654.90 | 656.96 | NA | NA | NA | 631.62 | NA | NA | NA |
| 2023-12-31 | 2023-09-30 | 2023-06-30 | 2023-03-31 | 2022-12-31 | 2022-09-30 | 2022-06-30 | 2022-03-31 | 2021-12-31 | 2021-09-30 | 2021-06-30 | 2021-03-31 | 2020-12-31 | 2020-09-30 | 2020-06-30 | 2020-03-31 | 2019-12-31 | 2019-09-30 | 2019-06-30 | 2019-03-31 | 2018-12-31 | 2018-09-30 | 2018-06-30 | 2018-03-31 | 2017-12-31 | 2017-09-30 | 2017-06-30 | ||
|---|---|---|---|---|---|---|---|---|---|---|---|---|---|---|---|---|---|---|---|---|---|---|---|---|---|---|---|---|
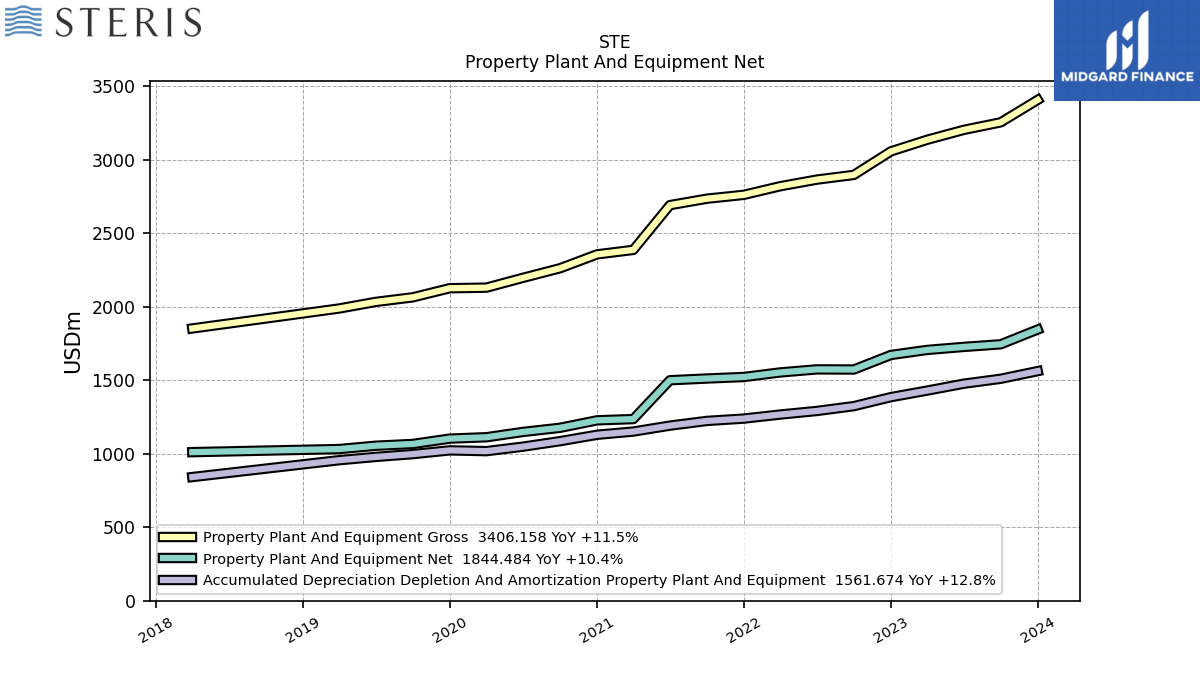
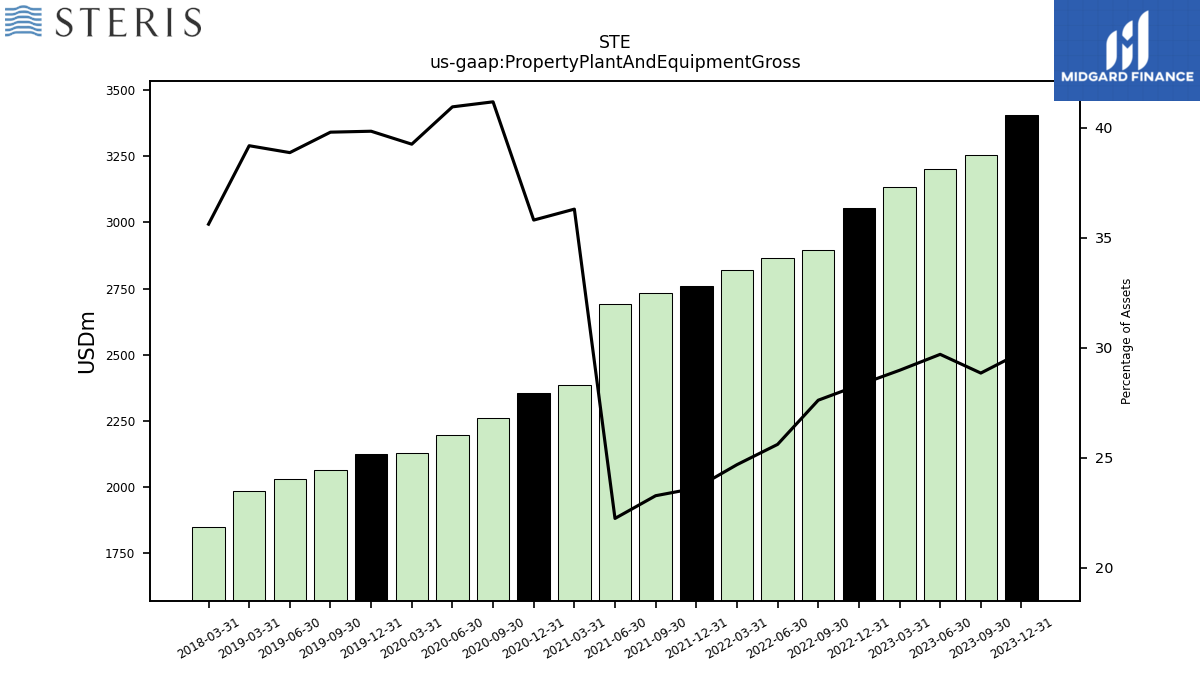
| Property Plant And Equipment Gross | 3406.16 | 3253.28 | 3201.92 | 3134.54 | 3055.69 | 2895.77 | 2863.85 | 2818.79 | 2760.40 | 2734.14 | 2690.30 | 2385.94 | 2355.51 | 2261.21 | 2196.01 | 2129.18 | 2125.28 | 2063.37 | 2032.29 | 1987.32 | NA | NA | NA | 1851.65 | NA | NA | NA | |
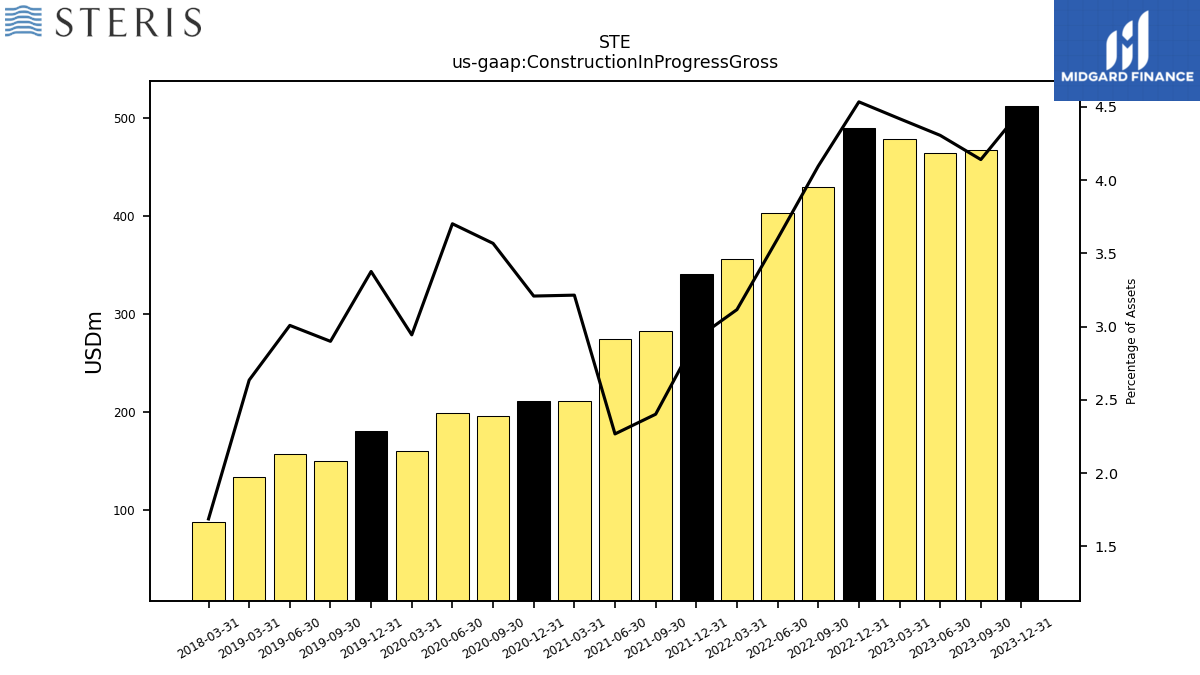
| Construction In Progress Gross | 512.37 | 467.13 | 464.41 | 478.32 | 489.77 | 429.68 | 402.80 | 356.01 | 341.04 | 282.31 | 274.41 | 211.38 | 211.18 | 196.02 | 198.60 | 159.73 | 180.17 | 150.38 | 157.34 | 133.69 | NA | NA | NA | 87.75 | NA | NA | NA | |
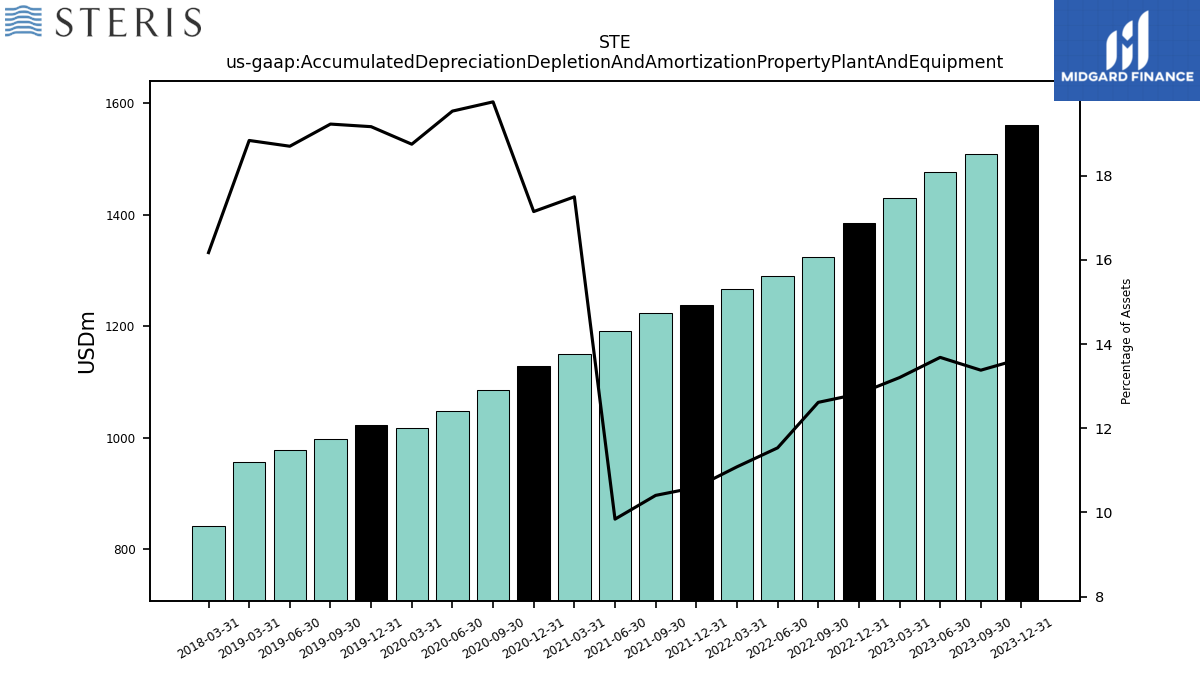
| Accumulated Depreciation Depletion And Amortization Property Plant And Equipment | 1561.67 | 1509.42 | 1475.83 | 1429.03 | 1384.53 | 1323.37 | 1290.51 | 1266.21 | 1238.82 | 1222.89 | 1190.85 | 1150.54 | 1128.62 | 1085.15 | 1047.95 | 1017.33 | 1022.68 | 997.15 | 978.08 | 955.74 | NA | NA | NA | 841.12 | NA | NA | NA | |
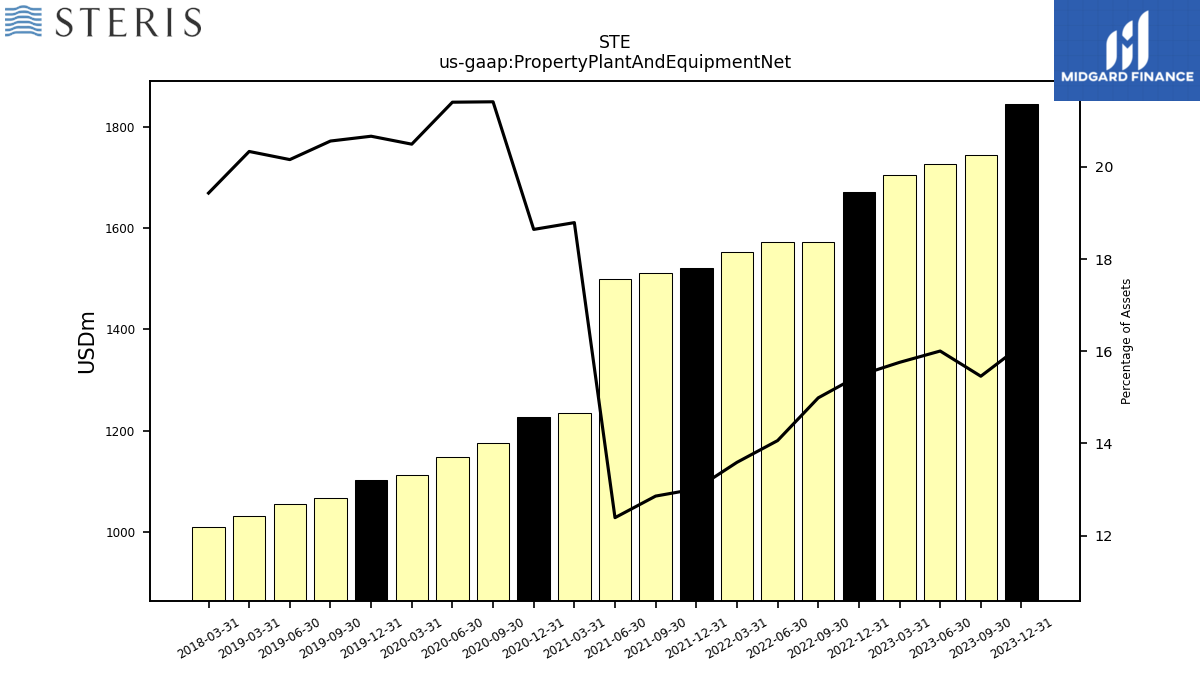
| Property Plant And Equipment Net | 1844.48 | 1743.86 | 1726.09 | 1705.51 | 1671.16 | 1572.40 | 1573.34 | 1552.58 | 1521.59 | 1511.26 | 1499.45 | 1235.40 | 1226.89 | 1176.07 | 1148.05 | 1111.86 | 1102.60 | 1066.22 | 1054.22 | 1031.58 | NA | NA | NA | 1010.52 | NA | NA | NA | |
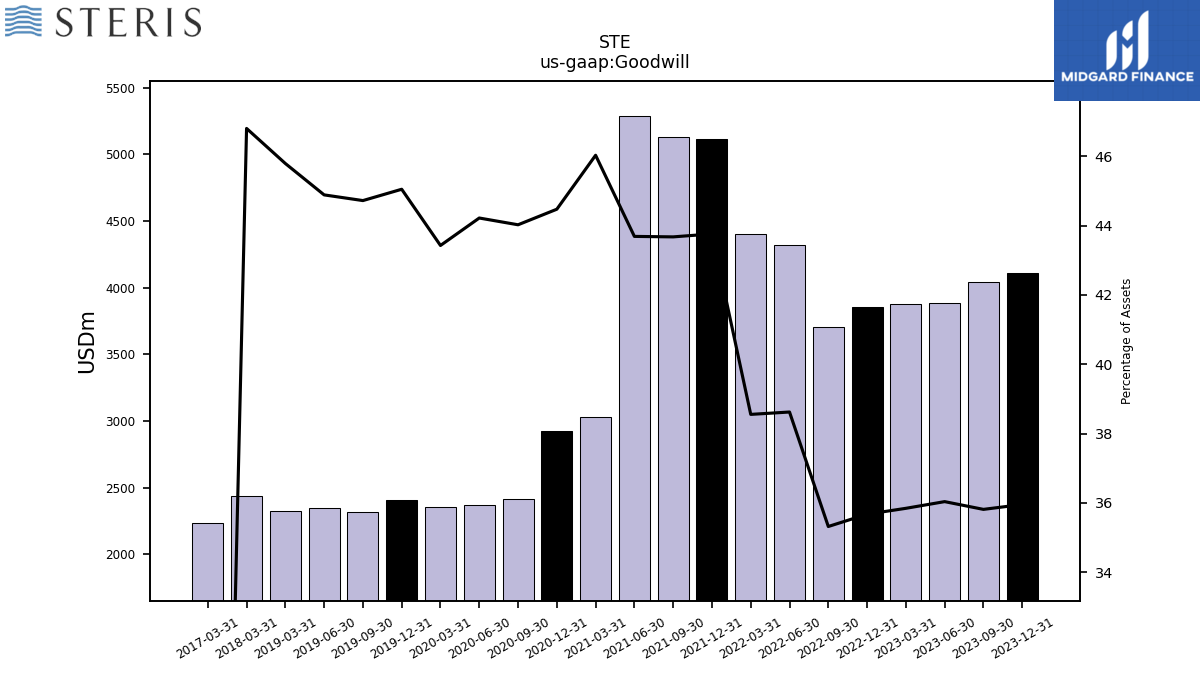
| Goodwill | 4111.68 | 4040.24 | 3886.60 | 3879.22 | 3853.01 | 3705.14 | 4321.18 | 4404.34 | 5115.32 | 5132.70 | 5286.59 | 3026.05 | 2926.55 | 2417.96 | 2371.79 | 2356.09 | 2403.50 | 2319.06 | 2347.33 | 2322.93 | NA | NA | NA | 2433.78 | NA | NA | NA | |
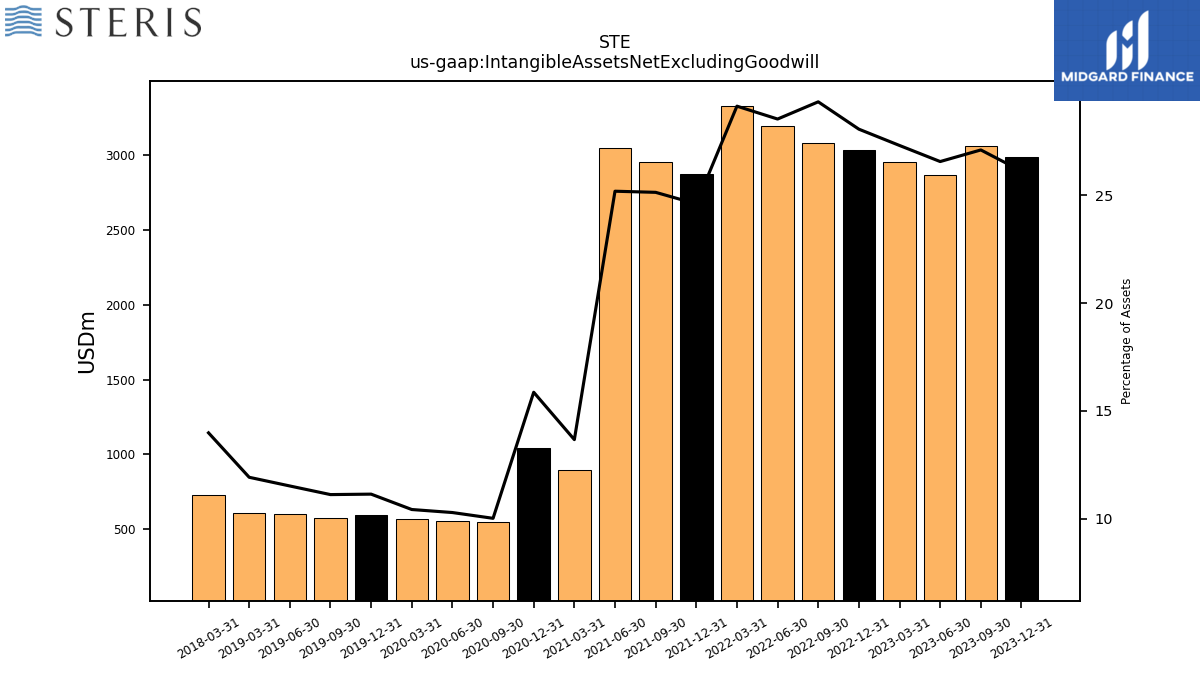
| Intangible Assets Net Excluding Goodwill | 2987.29 | 3057.71 | 2865.11 | 2955.78 | 3031.46 | 3077.49 | 3193.03 | 3328.54 | 2876.04 | 2954.42 | 3048.32 | 898.41 | 1043.90 | 550.02 | 551.53 | 565.47 | 594.17 | 576.38 | 602.18 | 604.61 | NA | NA | NA | 726.98 | NA | NA | NA | |
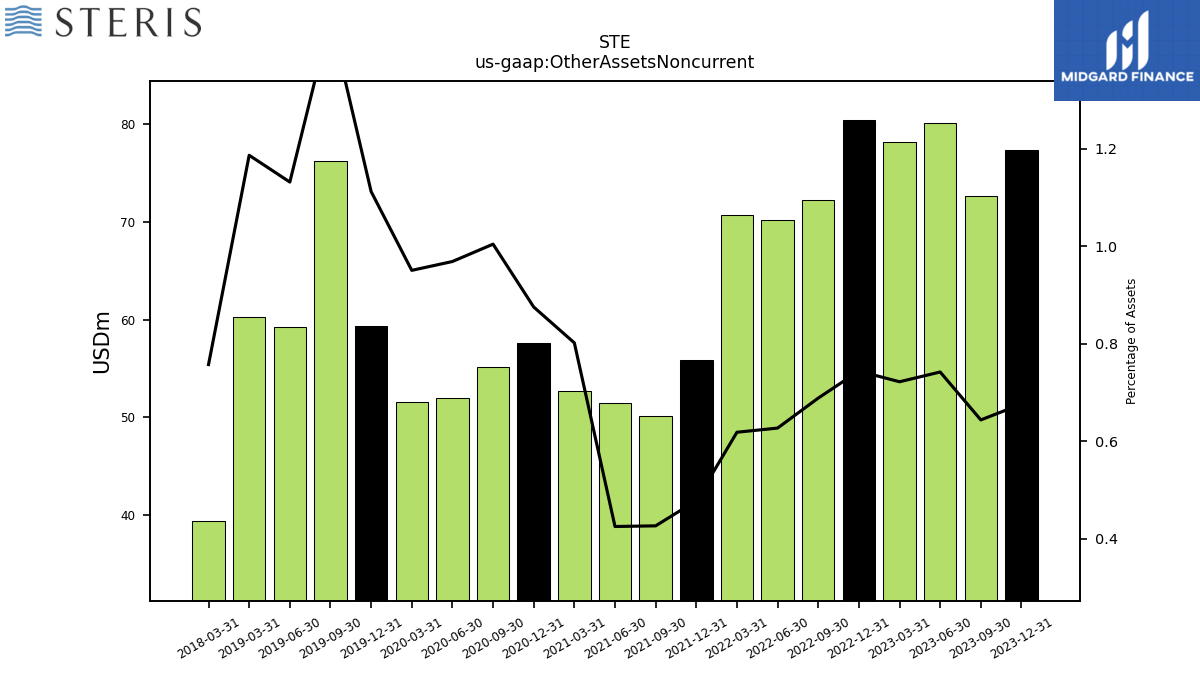
| Other Assets Noncurrent | 77.33 | 72.63 | 80.04 | 78.14 | 80.36 | 72.23 | 70.16 | 70.66 | 55.90 | 50.12 | 51.45 | 52.72 | 57.61 | 55.17 | 51.97 | 51.58 | 59.36 | 76.17 | 59.20 | 60.21 | NA | NA | NA | 39.39 | NA | NA | NA |
| 2023-12-31 | 2023-09-30 | 2023-06-30 | 2023-03-31 | 2022-12-31 | 2022-09-30 | 2022-06-30 | 2022-03-31 | 2021-12-31 | 2021-09-30 | 2021-06-30 | 2021-03-31 | 2020-12-31 | 2020-09-30 | 2020-06-30 | 2020-03-31 | 2019-12-31 | 2019-09-30 | 2019-06-30 | 2019-03-31 | 2018-12-31 | 2018-09-30 | 2018-06-30 | 2018-03-31 | 2017-12-31 | 2017-09-30 | 2017-06-30 | ||
|---|---|---|---|---|---|---|---|---|---|---|---|---|---|---|---|---|---|---|---|---|---|---|---|---|---|---|---|---|
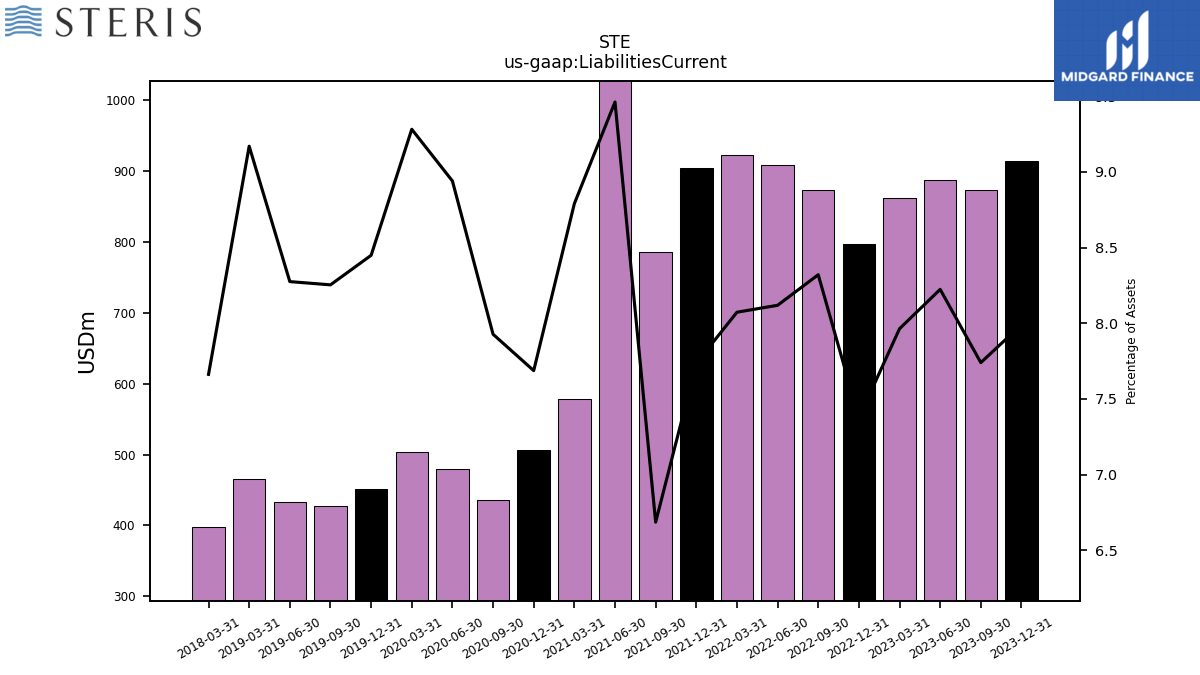
| Liabilities Current | 913.69 | 873.12 | 886.91 | 861.84 | 796.46 | 872.82 | 908.32 | 922.22 | 904.31 | 785.70 | 1145.03 | 577.92 | 505.87 | 435.42 | 479.55 | 503.61 | 450.81 | 428.02 | 432.77 | 465.20 | NA | NA | NA | 398.46 | NA | NA | NA | |
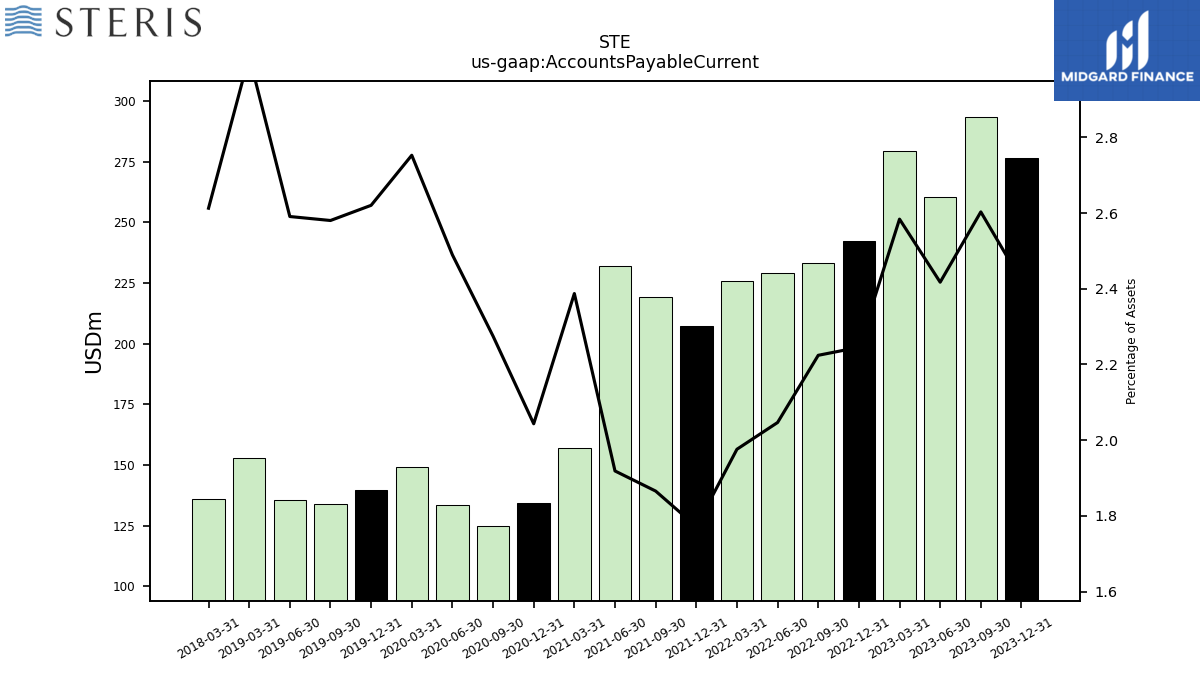
| Accounts Payable Current | 276.73 | 293.63 | 260.69 | 279.62 | 242.49 | 233.31 | 228.99 | 225.74 | 207.15 | 219.25 | 232.19 | 156.95 | 134.47 | 124.94 | 133.53 | 149.34 | 139.81 | 133.80 | 135.49 | 152.91 | NA | NA | NA | 135.87 | NA | NA | NA | |
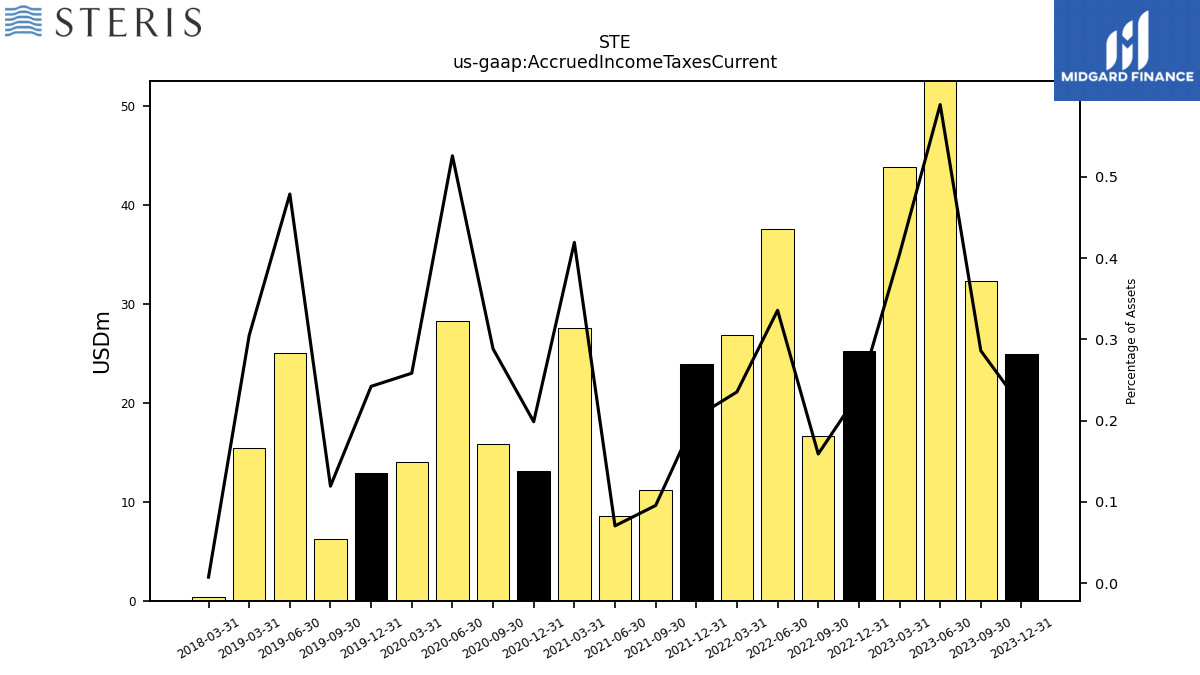
| Accrued Income Taxes Current | 24.88 | 32.25 | 63.50 | 43.80 | 25.23 | 16.66 | 37.55 | 26.87 | 23.88 | 11.22 | 8.52 | 27.56 | 13.07 | 15.83 | 28.20 | 14.01 | 12.92 | 6.19 | 25.04 | 15.46 | NA | NA | NA | 0.38 | NA | NA | NA | |
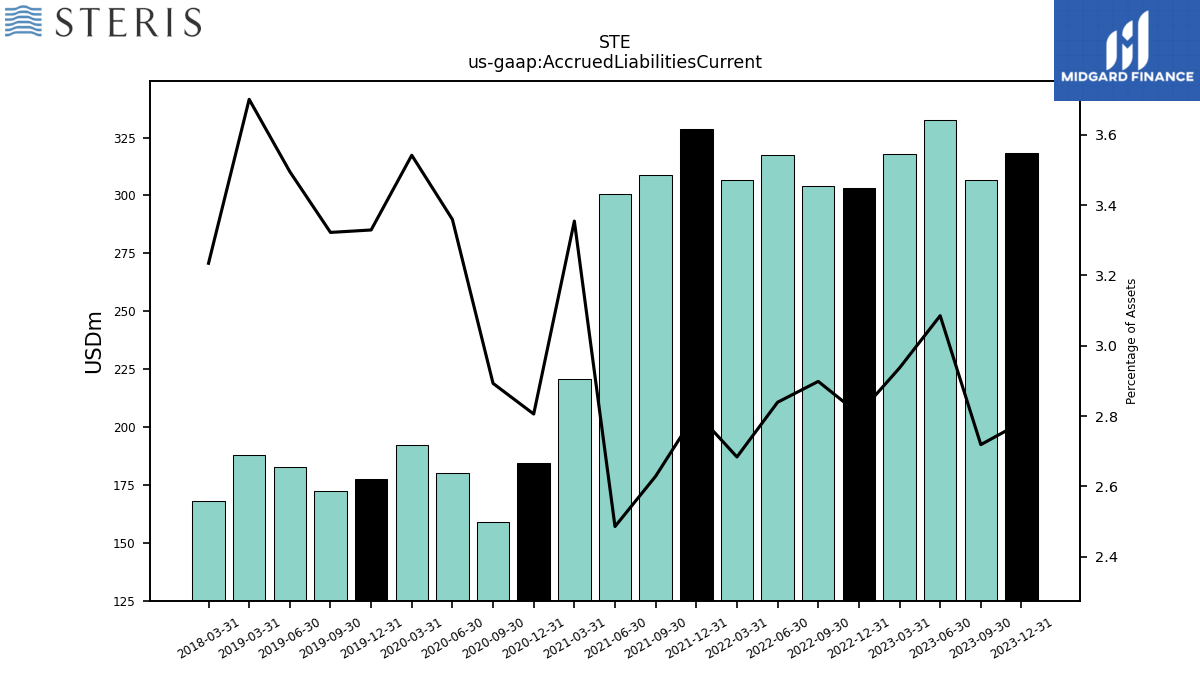
| Accrued Liabilities Current | 318.10 | 306.66 | 332.76 | 317.82 | 303.05 | 304.04 | 317.64 | 306.54 | 328.46 | 308.94 | 300.77 | 220.56 | 184.63 | 158.89 | 180.20 | 192.18 | 177.65 | 172.30 | 182.80 | 187.76 | NA | NA | NA | 168.22 | NA | NA | NA |
| 2023-12-31 | 2023-09-30 | 2023-06-30 | 2023-03-31 | 2022-12-31 | 2022-09-30 | 2022-06-30 | 2022-03-31 | 2021-12-31 | 2021-09-30 | 2021-06-30 | 2021-03-31 | 2020-12-31 | 2020-09-30 | 2020-06-30 | 2020-03-31 | 2019-12-31 | 2019-09-30 | 2019-06-30 | 2019-03-31 | 2018-12-31 | 2018-09-30 | 2018-06-30 | 2018-03-31 | 2017-12-31 | 2017-09-30 | 2017-06-30 | ||
|---|---|---|---|---|---|---|---|---|---|---|---|---|---|---|---|---|---|---|---|---|---|---|---|---|---|---|---|---|
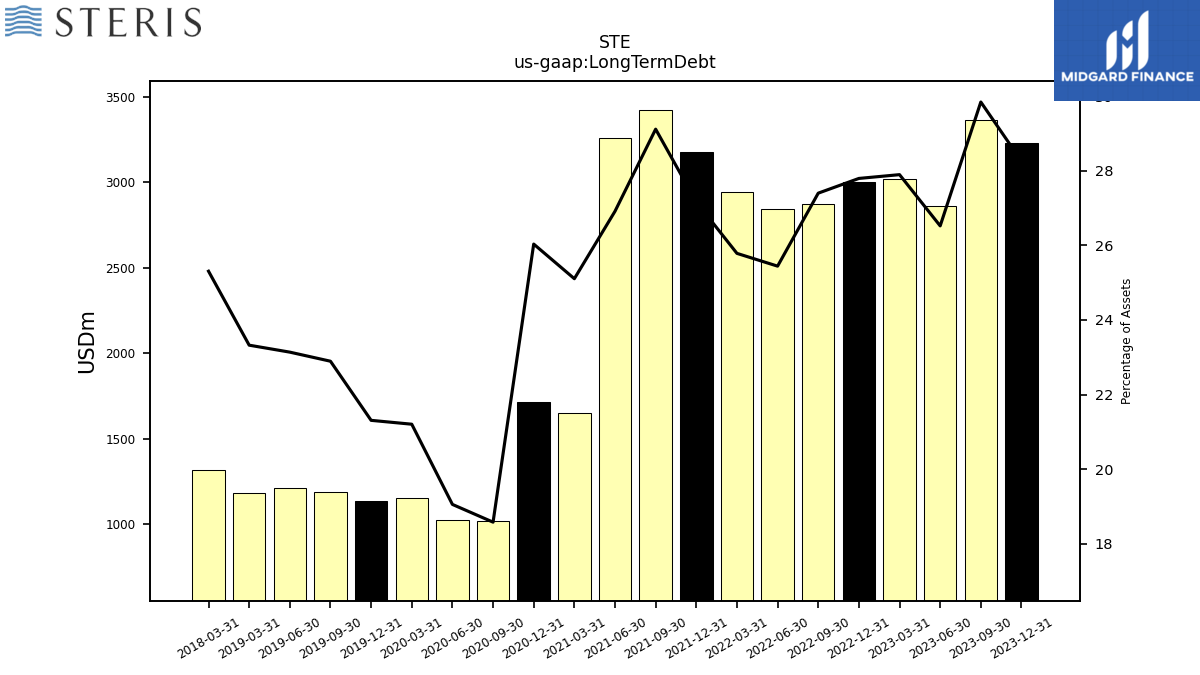
| Long Term Debt | 3231.07 | 3366.24 | 2860.12 | 3018.66 | 3001.57 | 2873.94 | 2846.45 | 2945.48 | 3175.32 | 3421.51 | 3256.71 | 1650.54 | 1713.20 | 1020.55 | 1022.16 | 1150.52 | 1136.96 | 1187.19 | 1210.00 | 1183.23 | NA | NA | NA | 1316.00 | NA | NA | NA | |
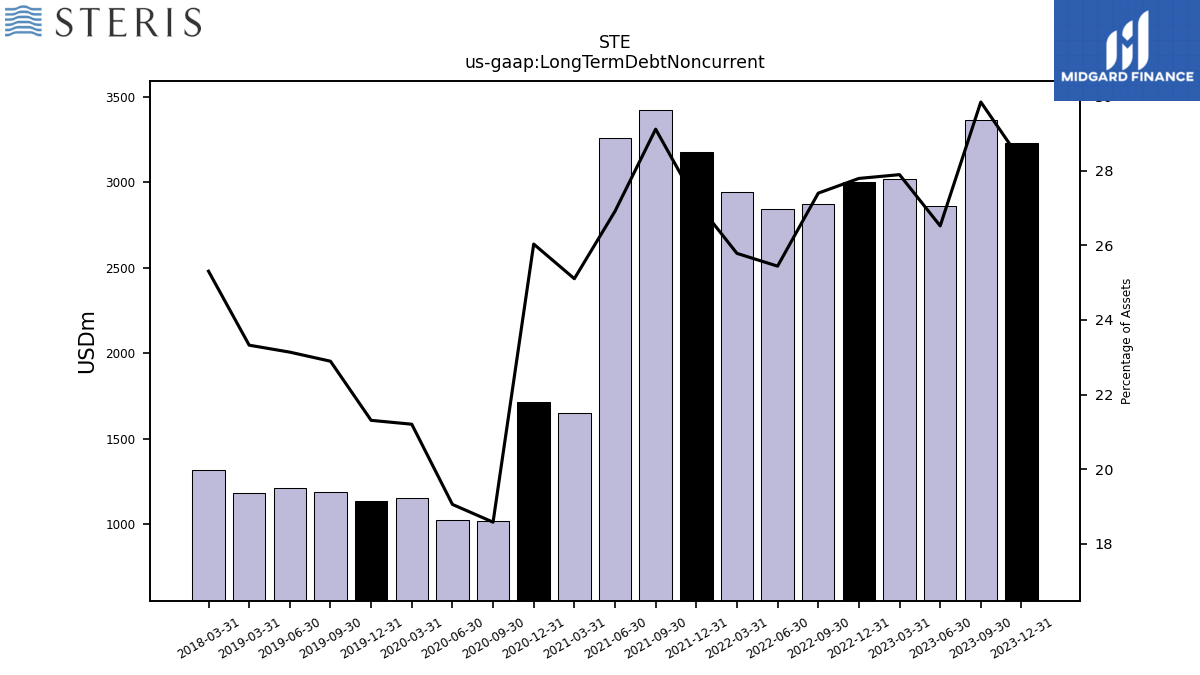
| Long Term Debt Noncurrent | 3231.07 | 3366.24 | 2860.12 | 3018.66 | 3001.57 | 2873.94 | 2846.45 | 2945.48 | 3175.32 | 3421.51 | 3256.71 | 1650.54 | 1713.20 | 1020.55 | 1022.16 | 1150.52 | 1136.96 | 1187.19 | 1210.00 | 1183.23 | NA | NA | NA | 1316.00 | NA | NA | NA | |
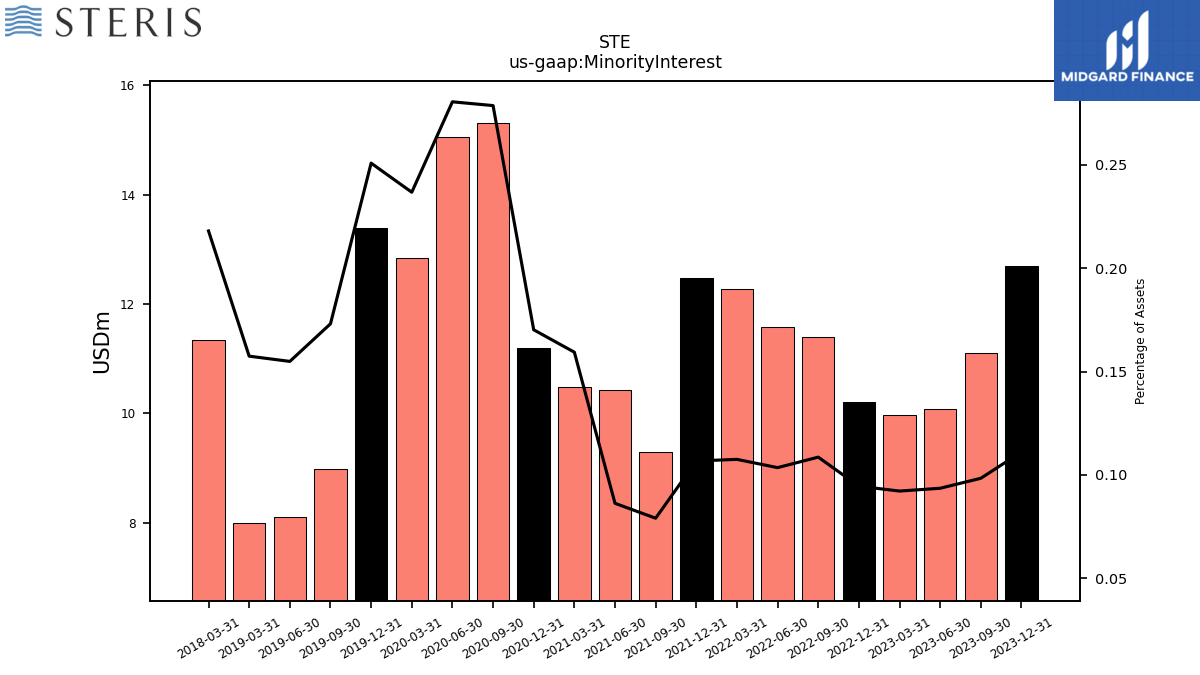
| Minority Interest | 12.70 | 11.10 | 10.09 | 9.97 | 10.21 | 11.39 | 11.58 | 12.28 | 12.48 | 9.29 | 10.44 | 10.48 | 11.20 | 15.31 | 15.05 | 12.85 | 13.39 | 8.98 | 8.10 | 7.99 | NA | NA | NA | 11.34 | NA | NA | NA | |
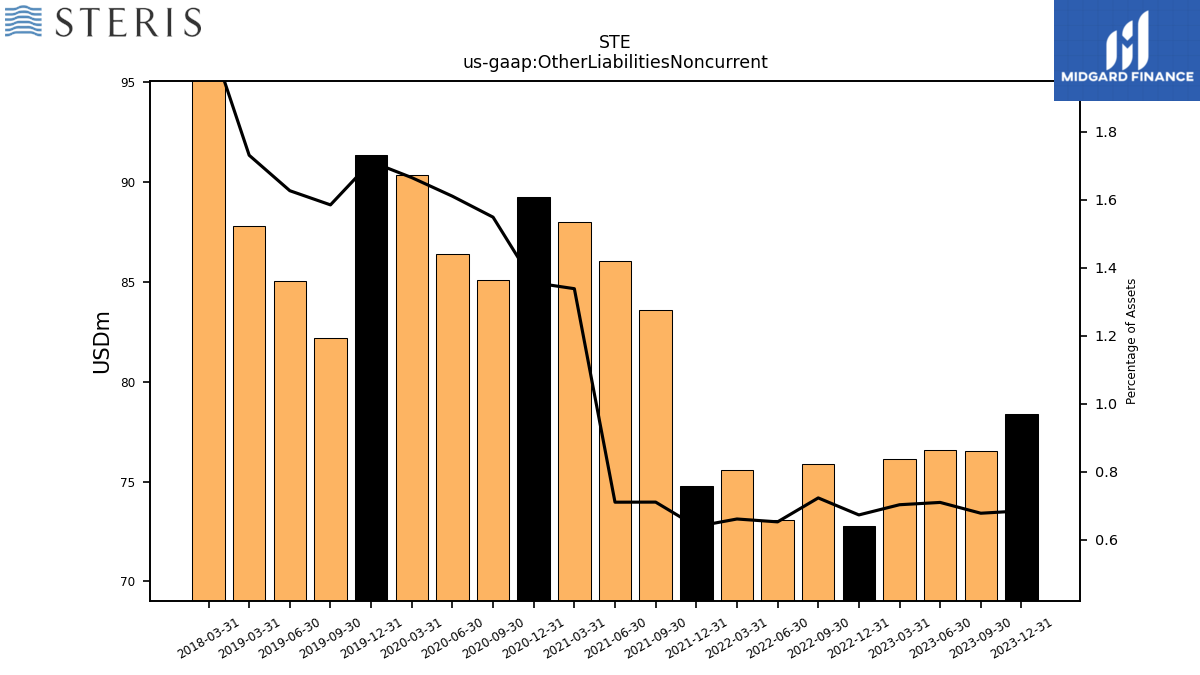
| Other Liabilities Noncurrent | 78.39 | 76.55 | 76.60 | 76.14 | 72.75 | 75.90 | 73.08 | 75.58 | 74.76 | 83.59 | 86.04 | 88.01 | 89.26 | 85.08 | 86.39 | 90.35 | 91.35 | 82.20 | 85.07 | 87.81 | NA | NA | NA | 108.60 | NA | NA | NA |
| 2023-12-31 | 2023-09-30 | 2023-06-30 | 2023-03-31 | 2022-12-31 | 2022-09-30 | 2022-06-30 | 2022-03-31 | 2021-12-31 | 2021-09-30 | 2021-06-30 | 2021-03-31 | 2020-12-31 | 2020-09-30 | 2020-06-30 | 2020-03-31 | 2019-12-31 | 2019-09-30 | 2019-06-30 | 2019-03-31 | 2018-12-31 | 2018-09-30 | 2018-06-30 | 2018-03-31 | 2017-12-31 | 2017-09-30 | 2017-06-30 | ||
|---|---|---|---|---|---|---|---|---|---|---|---|---|---|---|---|---|---|---|---|---|---|---|---|---|---|---|---|---|
| Stockholders Equity | 6415.40 | 6178.07 | 6168.29 | 6077.20 | 6038.31 | 5802.06 | 6407.55 | 6532.36 | 6611.19 | 6535.64 | 6574.58 | 3880.99 | 3866.99 | 3647.14 | 3474.66 | 3393.88 | 3382.68 | 3228.67 | 3236.90 | 3177.81 | NA | NA | NA | 3205.96 | NA | NA | NA | |
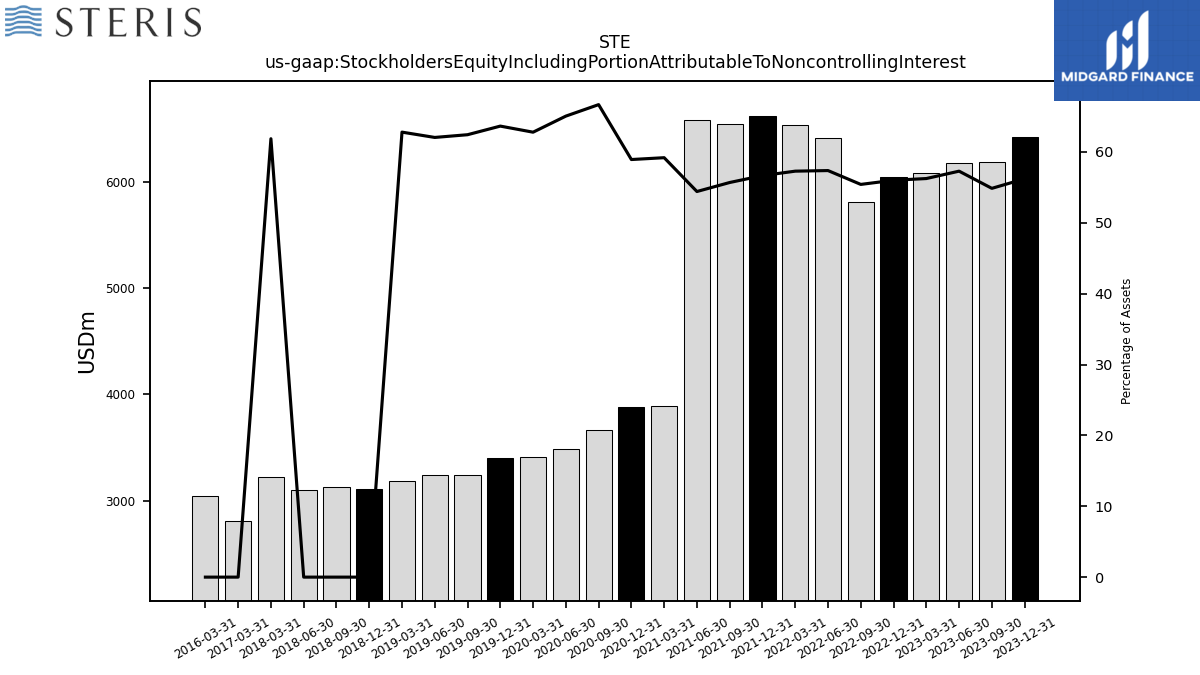
| Stockholders Equity Including Portion Attributable To Noncontrolling Interest | 6428.10 | 6189.17 | 6178.37 | 6087.17 | 6048.52 | 5813.45 | 6419.13 | 6544.64 | 6623.67 | 6544.93 | 6585.02 | 3891.47 | 3878.19 | 3662.45 | 3489.71 | 3406.72 | 3396.07 | 3237.64 | 3245.00 | 3185.80 | 3112.31 | 3124.98 | 3099.19 | 3217.30 | NA | NA | NA | |
| Common Stock Value | 4534.26 | 4518.91 | 4498.21 | 4486.38 | 4631.70 | 4705.12 | 4738.75 | 4742.92 | 4758.20 | 4748.18 | 4736.84 | 2002.83 | 1996.84 | 1990.88 | 1983.05 | 1982.16 | 1987.11 | 1981.66 | 1996.35 | 1998.56 | NA | NA | NA | 2048.04 | NA | NA | NA | |
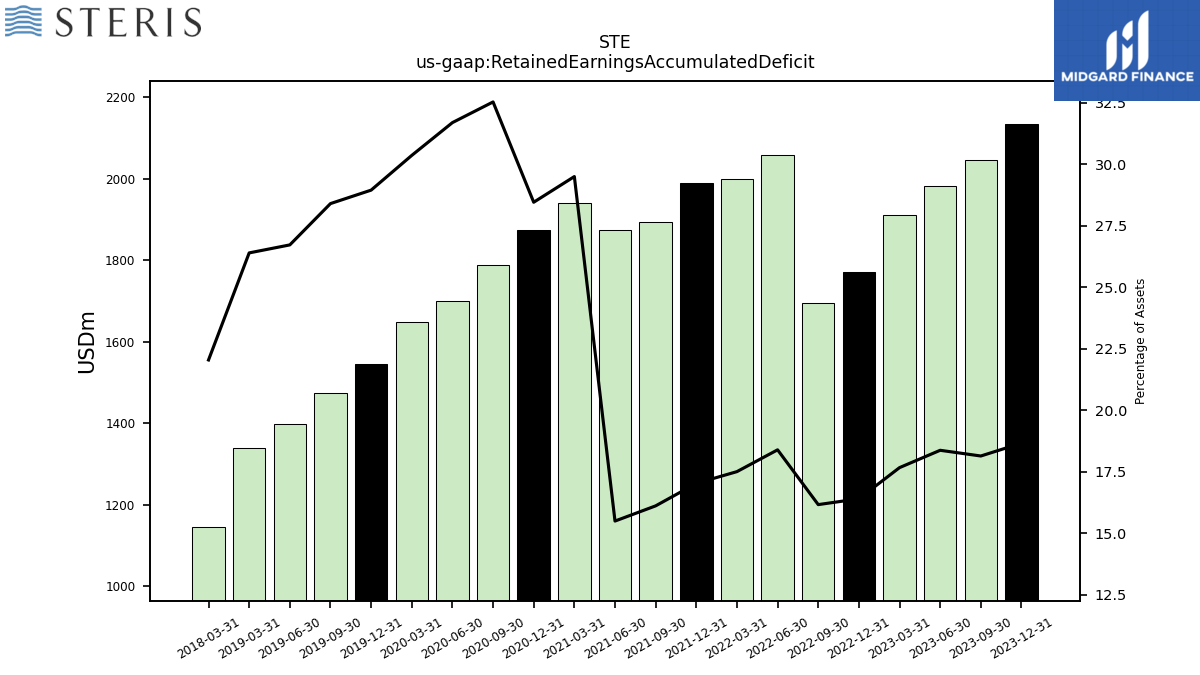
| Retained Earnings Accumulated Deficit | 2133.77 | 2045.90 | 1980.93 | 1911.53 | 1770.77 | 1695.09 | 2057.18 | 1999.24 | 1989.87 | 1893.20 | 1874.56 | 1939.41 | 1872.53 | 1786.88 | 1699.97 | 1647.17 | 1544.49 | 1472.72 | 1397.39 | 1339.02 | NA | NA | NA | 1146.22 | NA | NA | NA | |
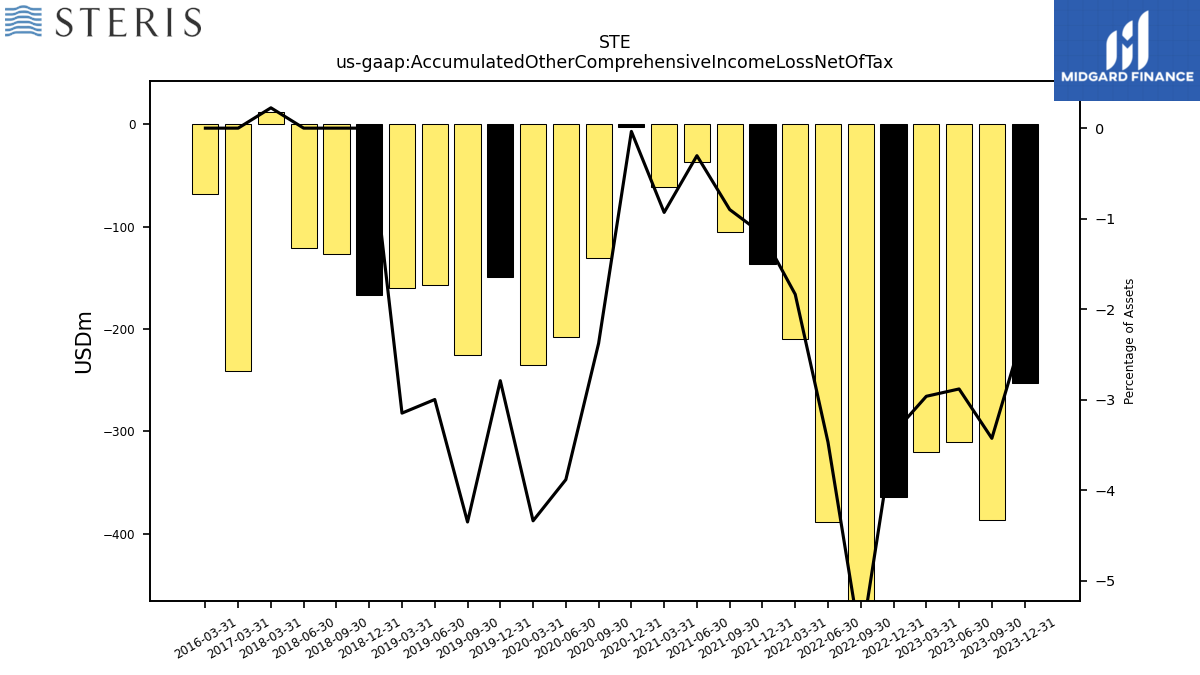
| Accumulated Other Comprehensive Income Loss Net Of Tax | -252.63 | -386.74 | -310.86 | -320.71 | -364.16 | -598.15 | -388.37 | -209.81 | -136.88 | -105.73 | -36.82 | -61.24 | -2.39 | -130.61 | -208.35 | -235.46 | -148.92 | -225.72 | -156.84 | -159.78 | -167.03 | -126.78 | -121.10 | 11.69 | NA | NA | NA | |
| Minority Interest | 12.70 | 11.10 | 10.09 | 9.97 | 10.21 | 11.39 | 11.58 | 12.28 | 12.48 | 9.29 | 10.44 | 10.48 | 11.20 | 15.31 | 15.05 | 12.85 | 13.39 | 8.98 | 8.10 | 7.99 | NA | NA | NA | 11.34 | NA | NA | NA | |
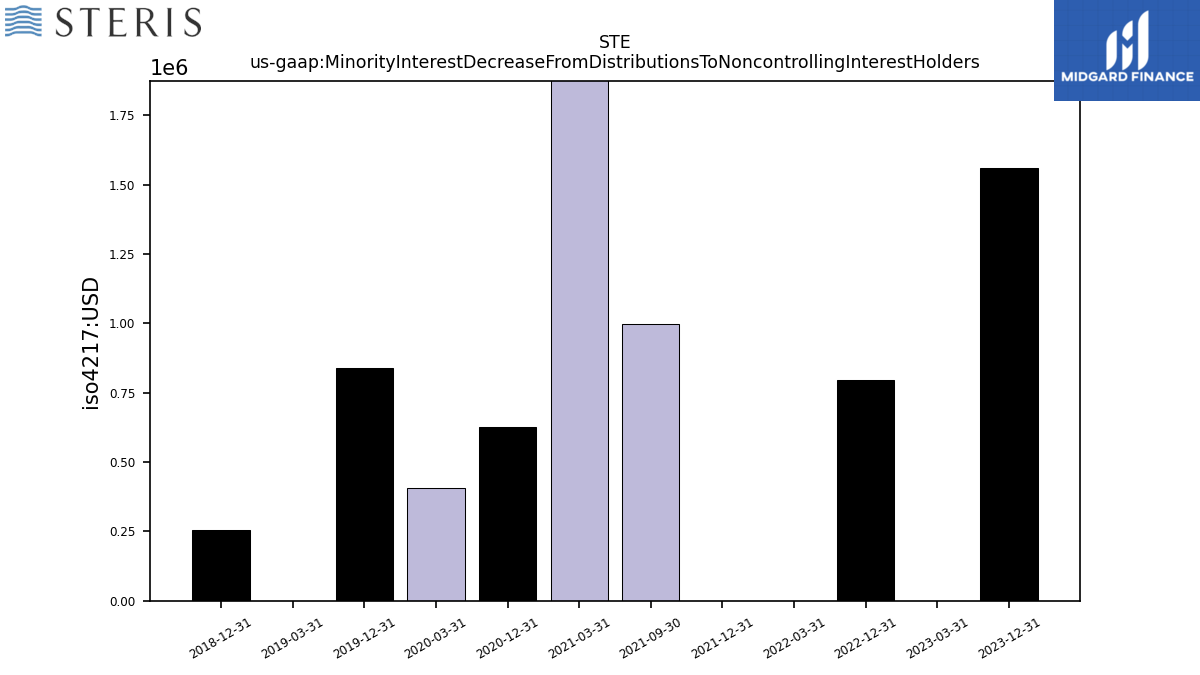
| Minority Interest Decrease From Distributions To Noncontrolling Interest Holders | 1.56 | NA | NA | 0.00 | 0.79 | NA | NA | 0.00 | 0.00 | 1.00 | NA | 3.55 | 0.63 | NA | NA | 0.41 | 0.84 | NA | NA | 0.00 | 0.26 | NA | NA | NA | NA | NA | NA |
| 2023-12-31 | 2023-09-30 | 2023-06-30 | 2023-03-31 | 2022-12-31 | 2022-09-30 | 2022-06-30 | 2022-03-31 | 2021-12-31 | 2021-09-30 | 2021-06-30 | 2021-03-31 | 2020-12-31 | 2020-09-30 | 2020-06-30 | 2020-03-31 | 2019-12-31 | 2019-09-30 | 2019-06-30 | 2019-03-31 | 2018-12-31 | 2018-09-30 | 2018-06-30 | 2018-03-31 | 2017-12-31 | 2017-09-30 | 2017-06-30 | ||
|---|---|---|---|---|---|---|---|---|---|---|---|---|---|---|---|---|---|---|---|---|---|---|---|---|---|---|---|---|
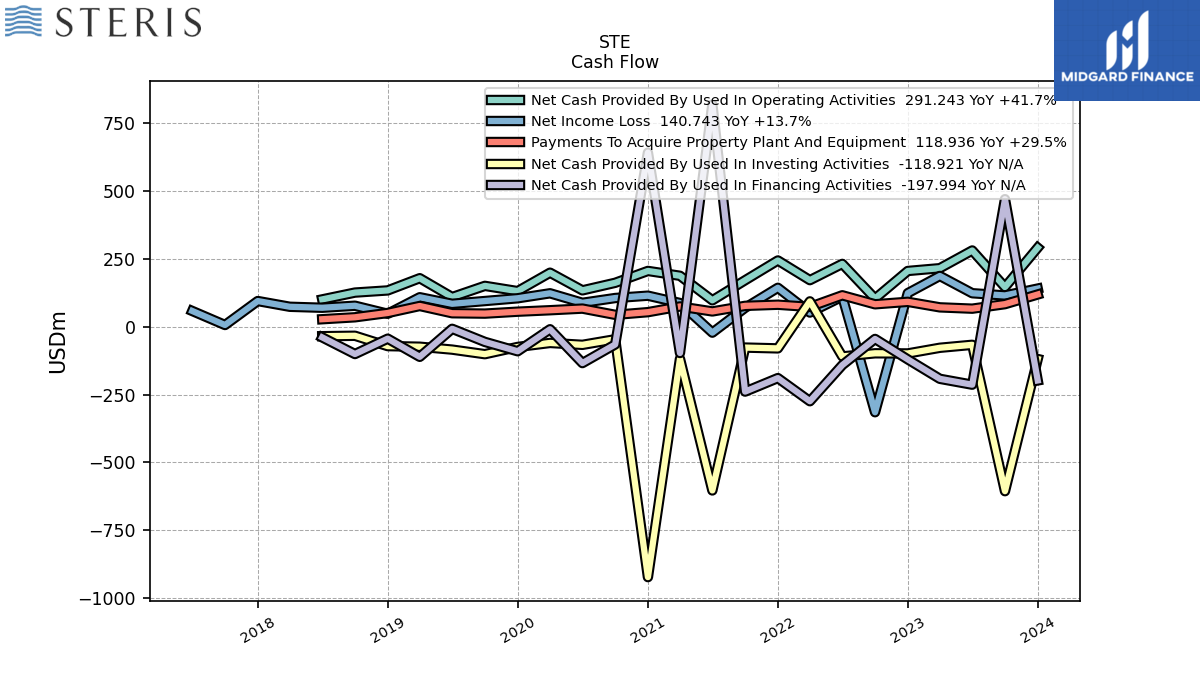
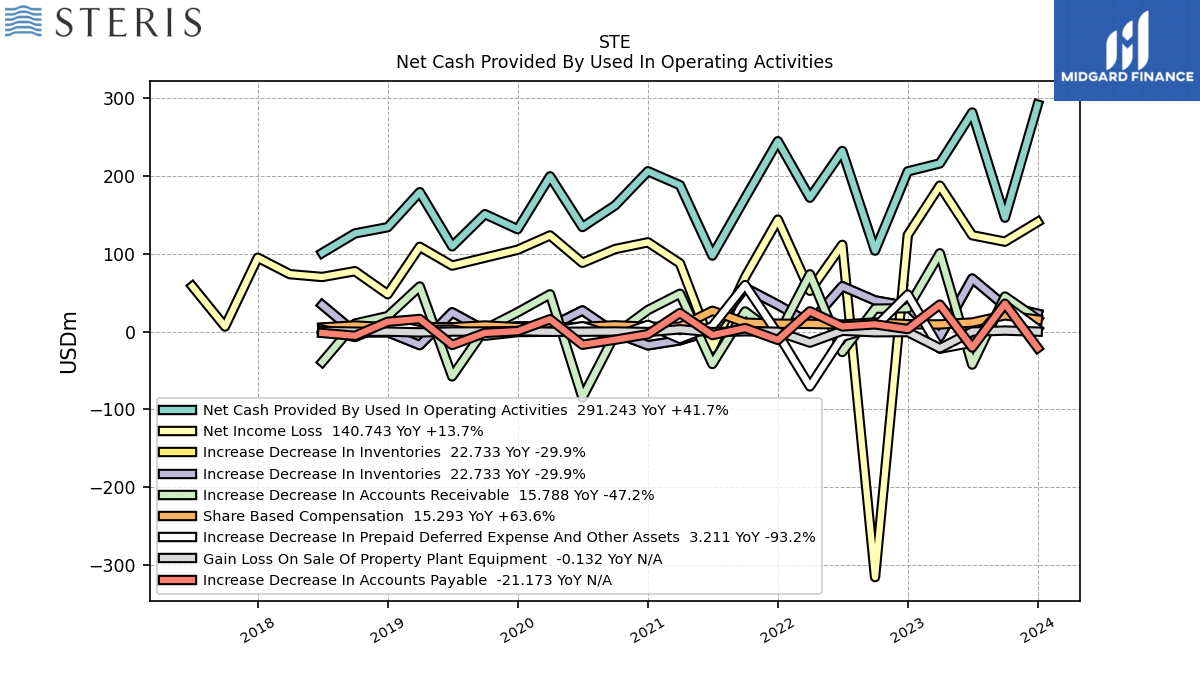
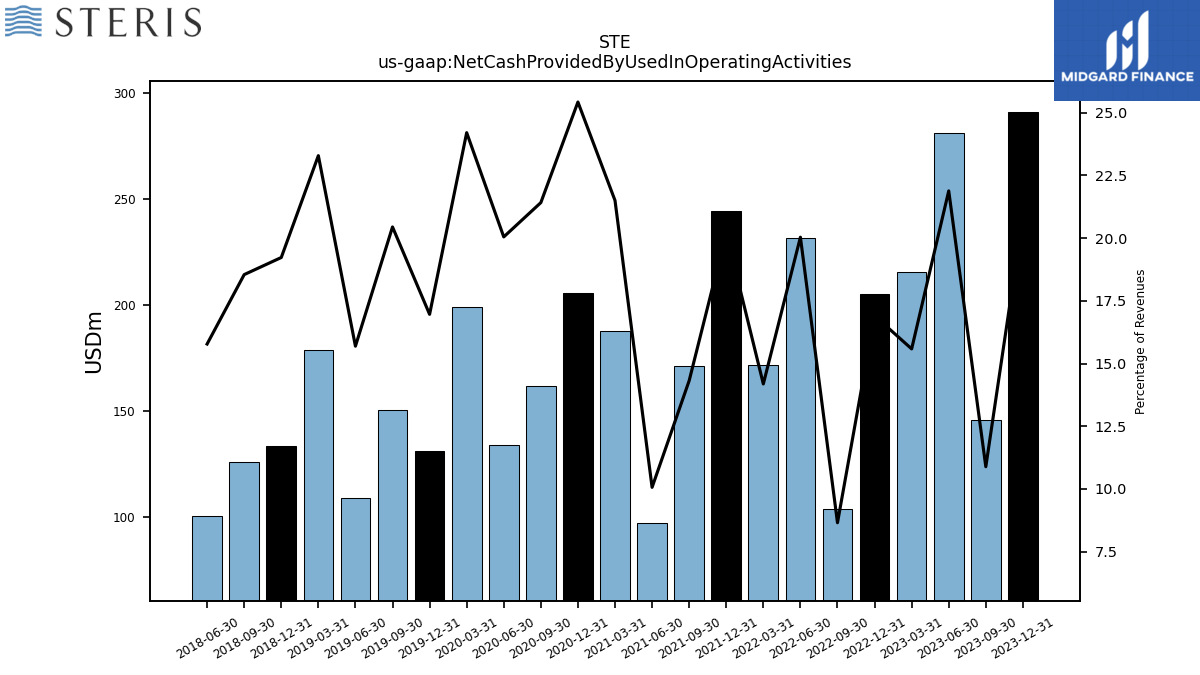
| Net Cash Provided By Used In Operating Activities | 291.24 | 146.09 | 281.13 | 215.80 | 205.58 | 103.82 | 231.75 | 171.73 | 244.31 | 171.34 | 97.43 | 187.85 | 205.71 | 161.95 | 134.12 | 199.23 | 131.33 | 150.66 | 109.34 | 178.93 | 133.88 | 125.92 | 100.78 | NA | NA | NA | NA | |
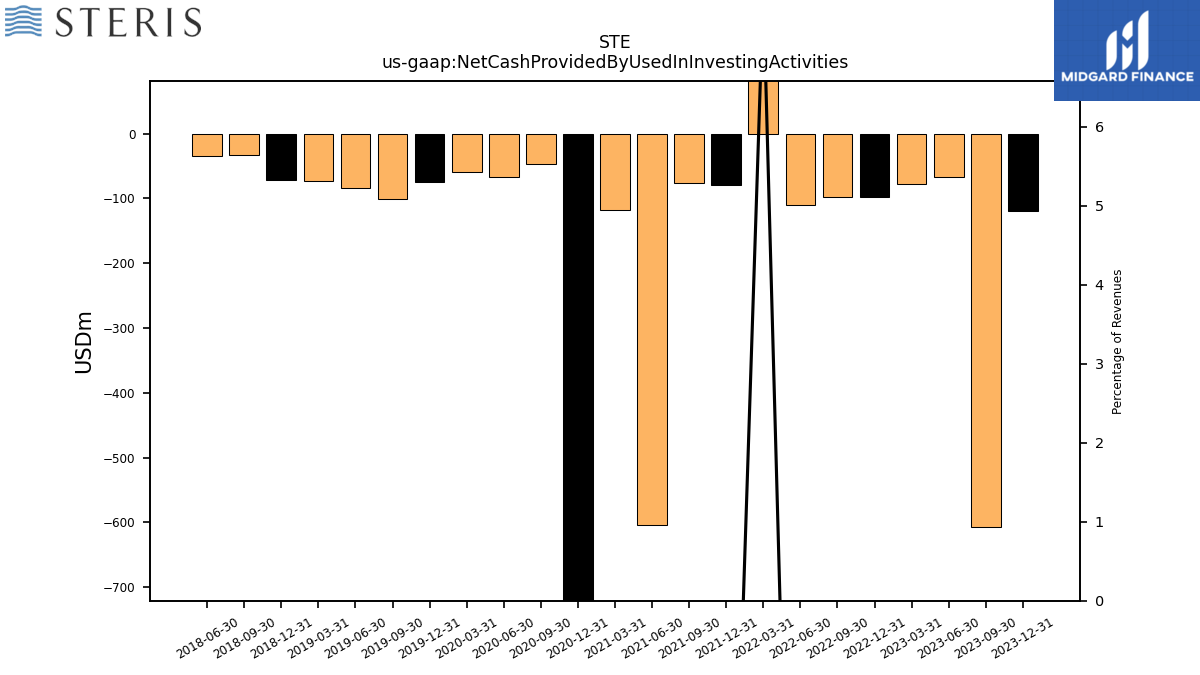
| Net Cash Provided By Used In Investing Activities | -118.92 | -606.24 | -66.60 | -77.58 | -98.41 | -97.92 | -109.42 | 93.58 | -79.80 | -76.80 | -603.53 | -118.26 | -923.04 | -46.14 | -66.72 | -59.75 | -74.53 | -101.15 | -84.31 | -73.66 | -71.41 | -33.29 | -34.87 | NA | NA | NA | NA | |
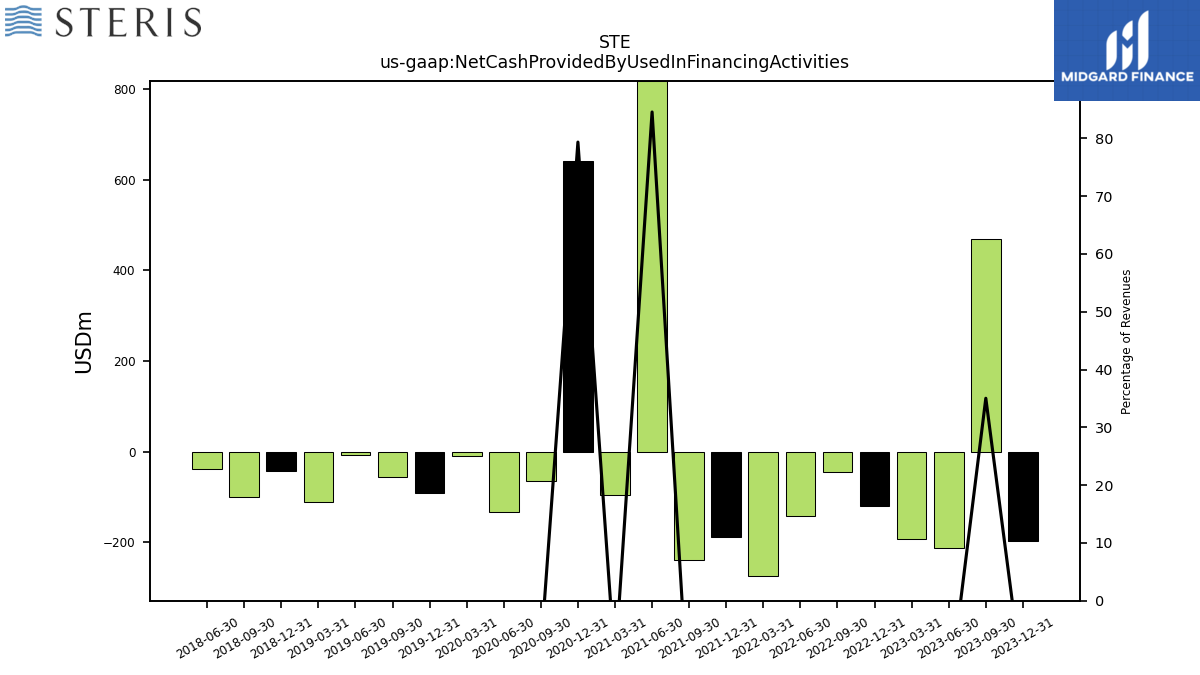
| Net Cash Provided By Used In Financing Activities | -197.99 | 470.21 | -213.64 | -191.95 | -120.41 | -44.95 | -141.41 | -274.61 | -189.26 | -239.11 | 818.81 | -96.91 | 641.85 | -65.32 | -134.00 | -9.27 | -90.34 | -55.92 | -7.61 | -110.98 | -43.95 | -100.65 | -39.21 | NA | NA | NA | NA |
| 2023-12-31 | 2023-09-30 | 2023-06-30 | 2023-03-31 | 2022-12-31 | 2022-09-30 | 2022-06-30 | 2022-03-31 | 2021-12-31 | 2021-09-30 | 2021-06-30 | 2021-03-31 | 2020-12-31 | 2020-09-30 | 2020-06-30 | 2020-03-31 | 2019-12-31 | 2019-09-30 | 2019-06-30 | 2019-03-31 | 2018-12-31 | 2018-09-30 | 2018-06-30 | 2018-03-31 | 2017-12-31 | 2017-09-30 | 2017-06-30 | ||
|---|---|---|---|---|---|---|---|---|---|---|---|---|---|---|---|---|---|---|---|---|---|---|---|---|---|---|---|---|
| Net Cash Provided By Used In Operating Activities | 291.24 | 146.09 | 281.13 | 215.80 | 205.58 | 103.82 | 231.75 | 171.73 | 244.31 | 171.34 | 97.43 | 187.85 | 205.71 | 161.95 | 134.12 | 199.23 | 131.33 | 150.66 | 109.34 | 178.93 | 133.88 | 125.92 | 100.78 | NA | NA | NA | NA | |
| Net Income Loss | 140.74 | 115.32 | 123.55 | 187.22 | 123.83 | -315.29 | 111.26 | 52.26 | 143.62 | 69.81 | -21.81 | 87.44 | 114.50 | 105.86 | 88.19 | 123.32 | 104.93 | 94.77 | 84.59 | 108.75 | 47.86 | 77.46 | 69.99 | 73.60 | 94.78 | 6.38 | 58.08 | |
| Profit Loss | 140.94 | 116.35 | 123.79 | 186.96 | 123.33 | -315.23 | 110.75 | 52.05 | 143.09 | 69.62 | -21.90 | 88.15 | 114.59 | 106.01 | 88.12 | 123.22 | 104.67 | 95.14 | 84.78 | 108.88 | 48.43 | 77.50 | 70.28 | NA | NA | NA | NA | |
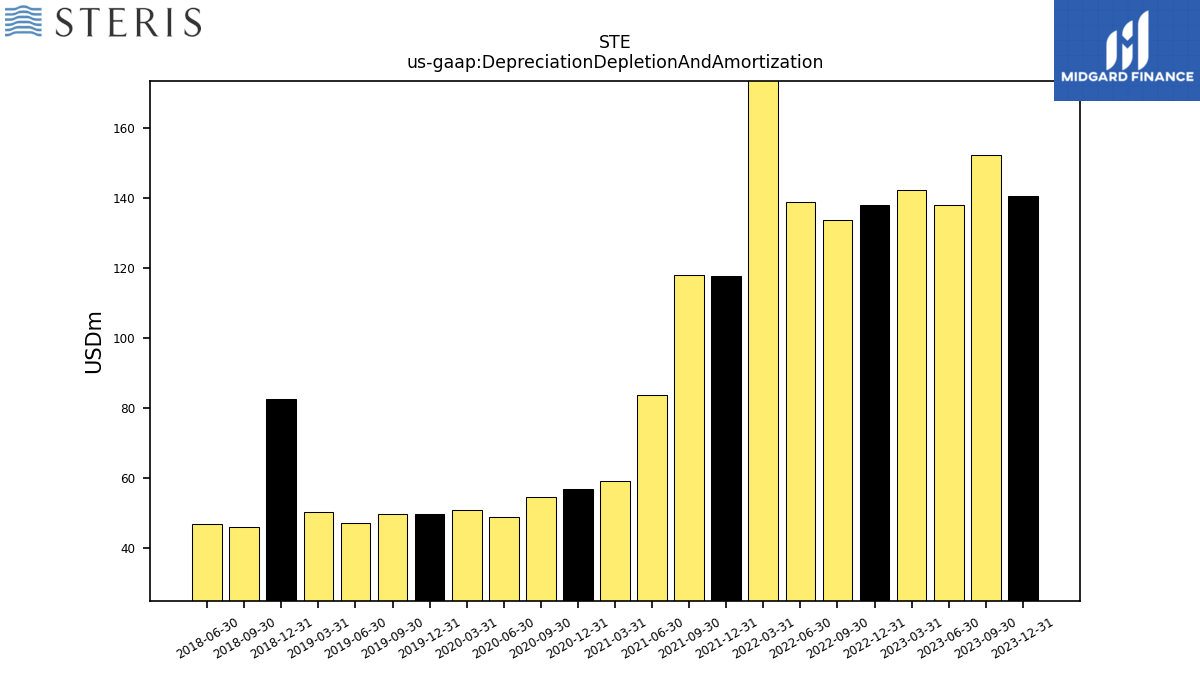
| Depreciation Depletion And Amortization | 140.63 | 152.25 | 137.93 | 142.20 | 137.95 | 133.88 | 138.86 | 233.83 | 117.61 | 118.04 | 83.62 | 59.04 | 56.82 | 54.42 | 48.95 | 50.94 | 49.56 | 49.63 | 47.10 | 50.26 | 82.69 | 46.12 | 46.85 | NA | NA | NA | NA | |
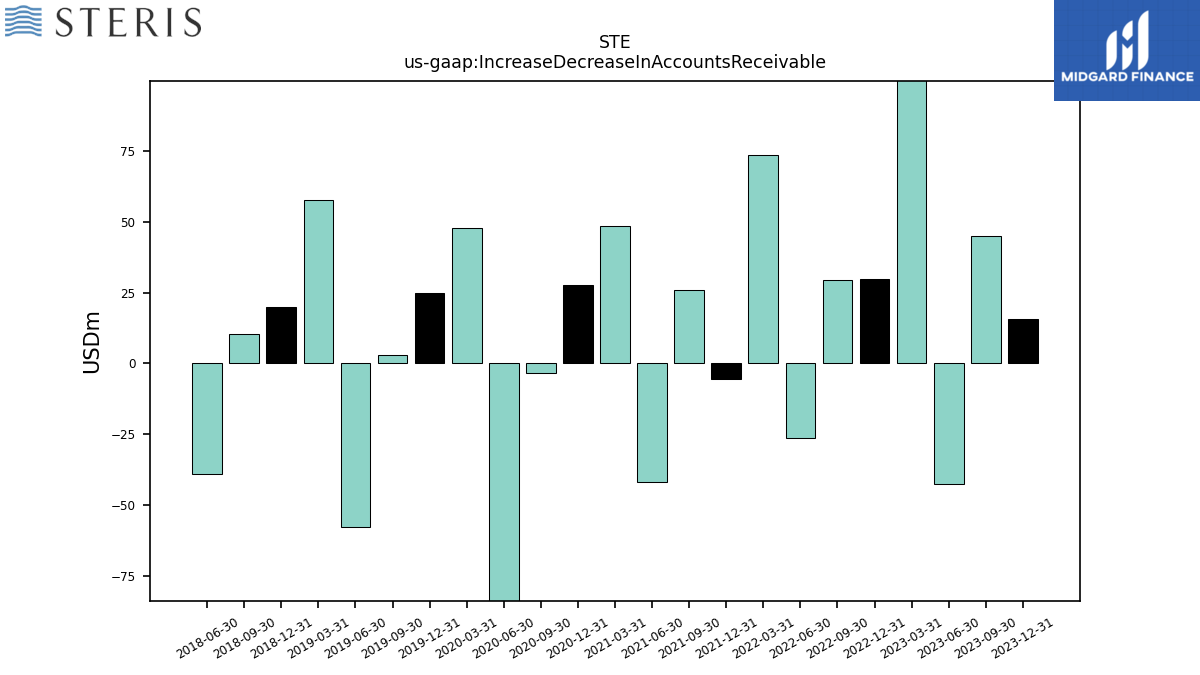
| Increase Decrease In Accounts Receivable | 15.79 | 44.91 | -42.45 | 100.43 | 29.90 | 29.31 | -26.34 | 73.46 | -5.56 | 25.80 | -41.73 | 48.50 | 27.56 | -3.47 | -84.67 | 47.73 | 24.69 | 3.07 | -57.62 | 57.80 | 19.71 | 10.20 | -39.23 | NA | NA | NA | NA | |
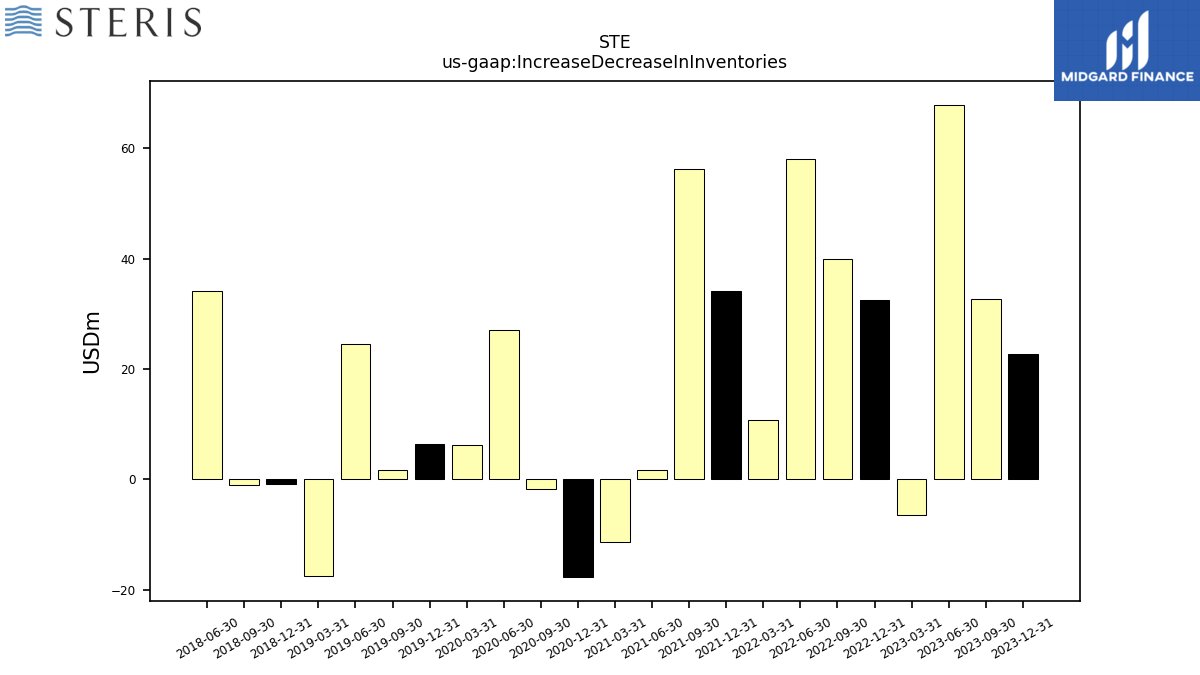
| Increase Decrease In Inventories | 22.73 | 32.66 | 67.96 | -6.51 | 32.45 | 39.91 | 58.08 | 10.78 | 34.24 | 56.24 | 1.66 | -11.29 | -17.75 | -1.75 | 27.02 | 6.25 | 6.49 | 1.71 | 24.62 | -17.47 | -0.87 | -1.11 | 34.06 | NA | NA | NA | NA | |
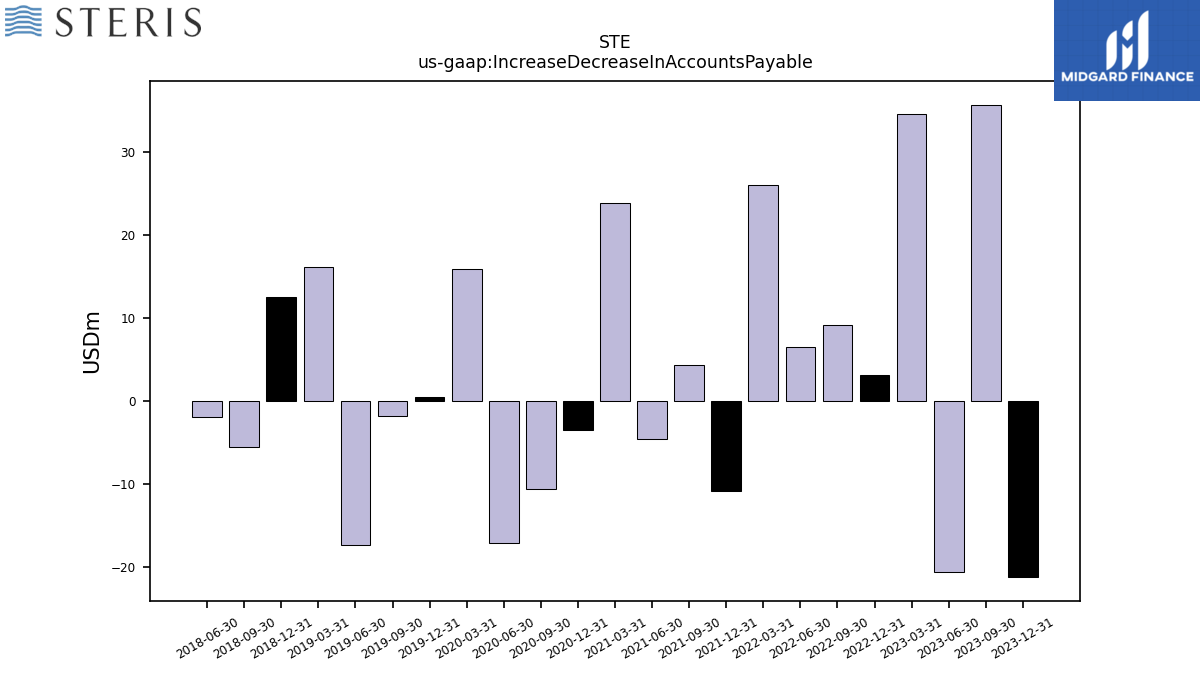
| Increase Decrease In Accounts Payable | -21.17 | 35.65 | -20.57 | 34.52 | 3.14 | 9.18 | 6.49 | 25.94 | -10.79 | 4.35 | -4.61 | 23.76 | -3.43 | -10.53 | -17.01 | 15.83 | 0.45 | -1.78 | -17.28 | 16.12 | 12.50 | -5.50 | -1.88 | NA | NA | NA | NA | |
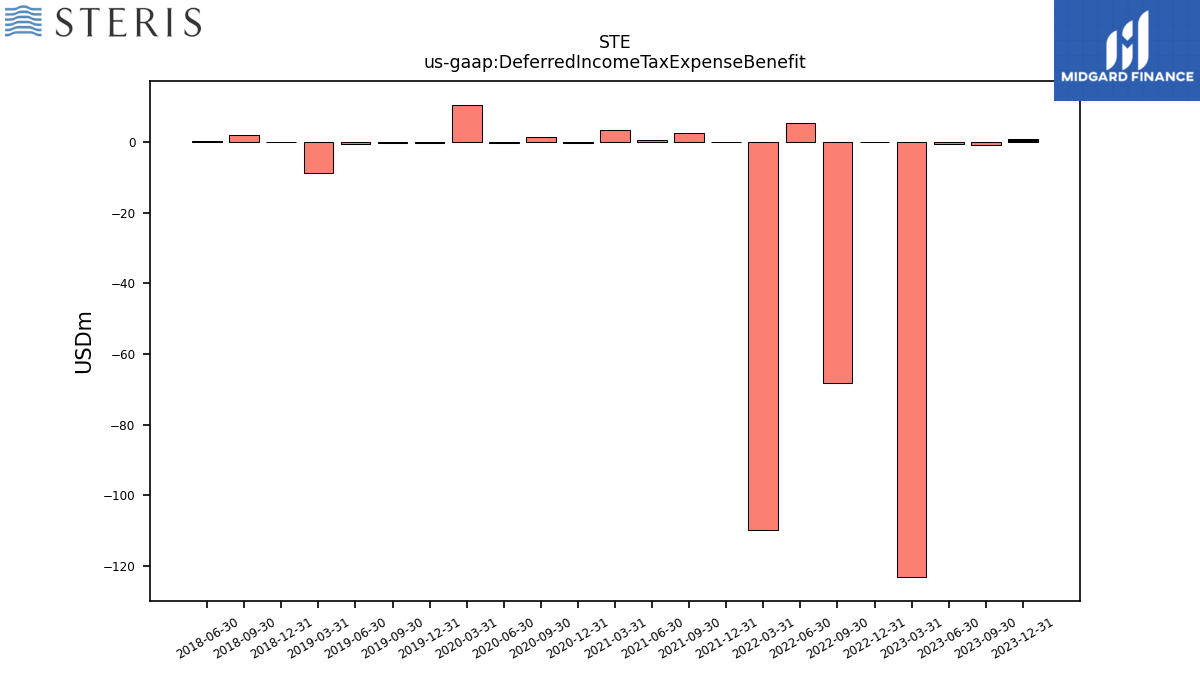
| Deferred Income Tax Expense Benefit | 0.81 | -0.87 | -0.45 | -123.12 | 0.10 | -68.20 | 5.30 | -109.76 | 0.01 | 2.67 | 0.46 | 3.46 | -0.32 | 1.29 | -0.19 | 10.56 | -0.37 | -0.15 | -0.61 | -8.73 | -0.02 | 2.02 | 0.23 | NA | NA | NA | NA | |
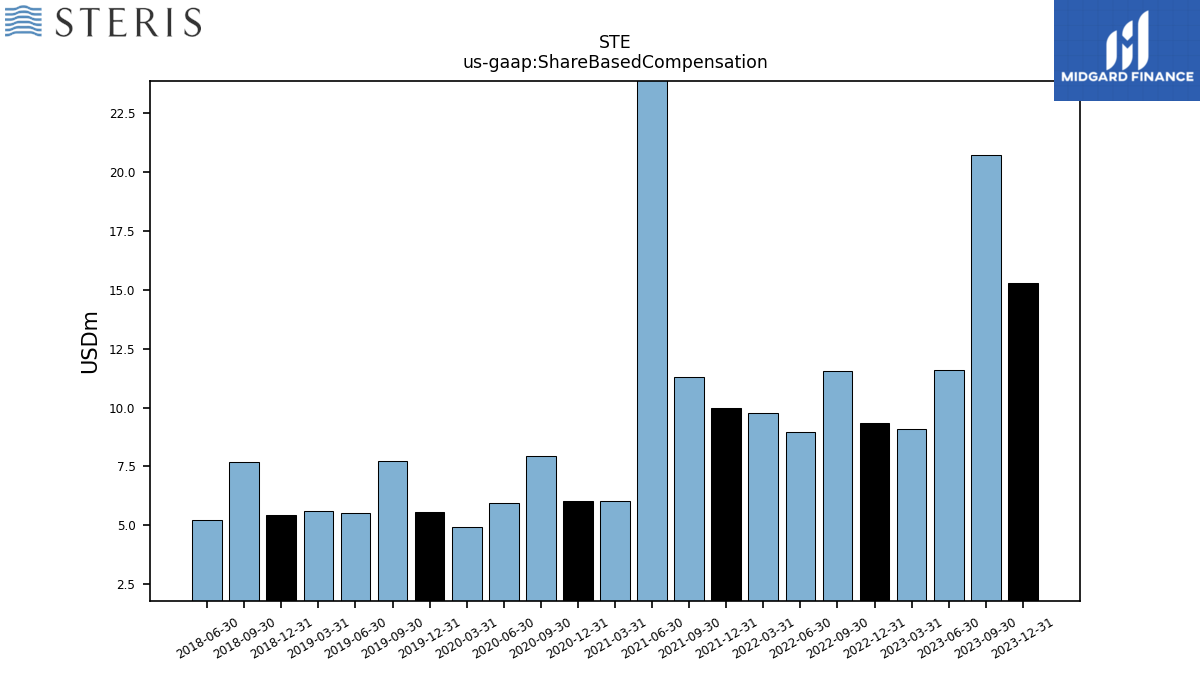
| Share Based Compensation | 15.29 | 20.72 | 11.58 | 9.09 | 9.35 | 11.55 | 8.96 | 9.75 | 10.00 | 11.31 | 26.60 | 6.04 | 6.02 | 7.94 | 5.96 | 4.95 | 5.59 | 7.74 | 5.54 | 5.61 | 5.42 | 7.70 | 5.24 | NA | NA | NA | NA |
| 2023-12-31 | 2023-09-30 | 2023-06-30 | 2023-03-31 | 2022-12-31 | 2022-09-30 | 2022-06-30 | 2022-03-31 | 2021-12-31 | 2021-09-30 | 2021-06-30 | 2021-03-31 | 2020-12-31 | 2020-09-30 | 2020-06-30 | 2020-03-31 | 2019-12-31 | 2019-09-30 | 2019-06-30 | 2019-03-31 | 2018-12-31 | 2018-09-30 | 2018-06-30 | 2018-03-31 | 2017-12-31 | 2017-09-30 | 2017-06-30 | ||
|---|---|---|---|---|---|---|---|---|---|---|---|---|---|---|---|---|---|---|---|---|---|---|---|---|---|---|---|---|
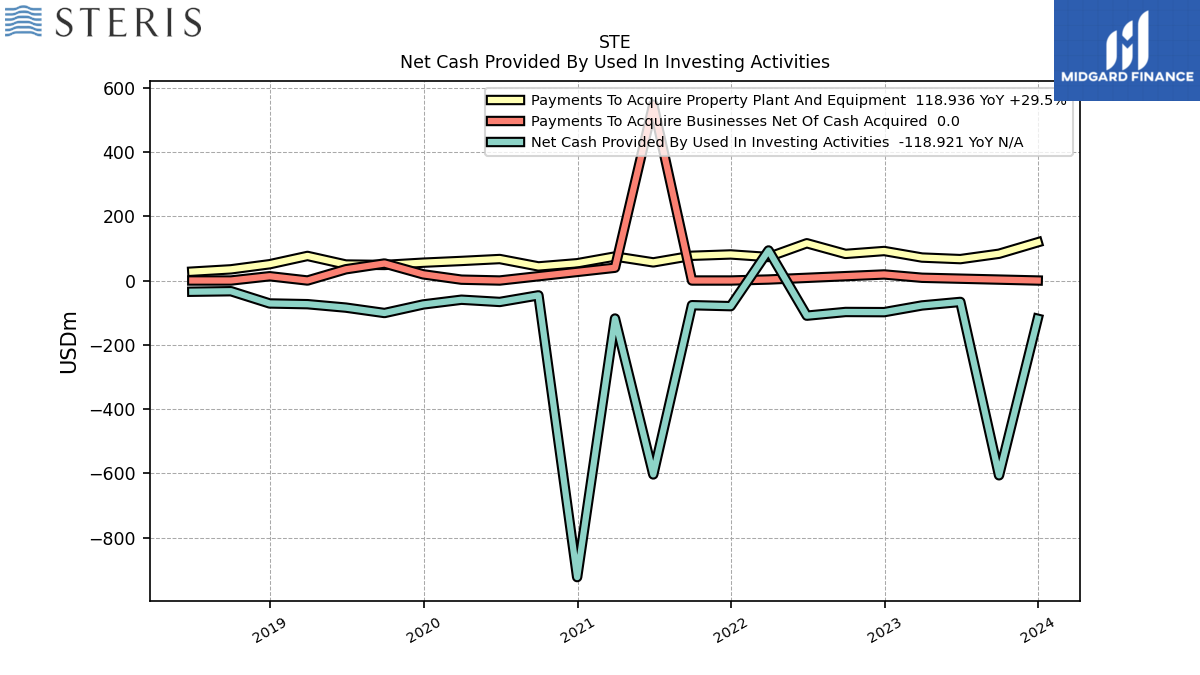
| Net Cash Provided By Used In Investing Activities | -118.92 | -606.24 | -66.60 | -77.58 | -98.41 | -97.92 | -109.42 | 93.58 | -79.80 | -76.80 | -603.53 | -118.26 | -923.04 | -46.14 | -66.72 | -59.75 | -74.53 | -101.15 | -84.31 | -73.66 | -71.41 | -33.29 | -34.87 | NA | NA | NA | NA | |
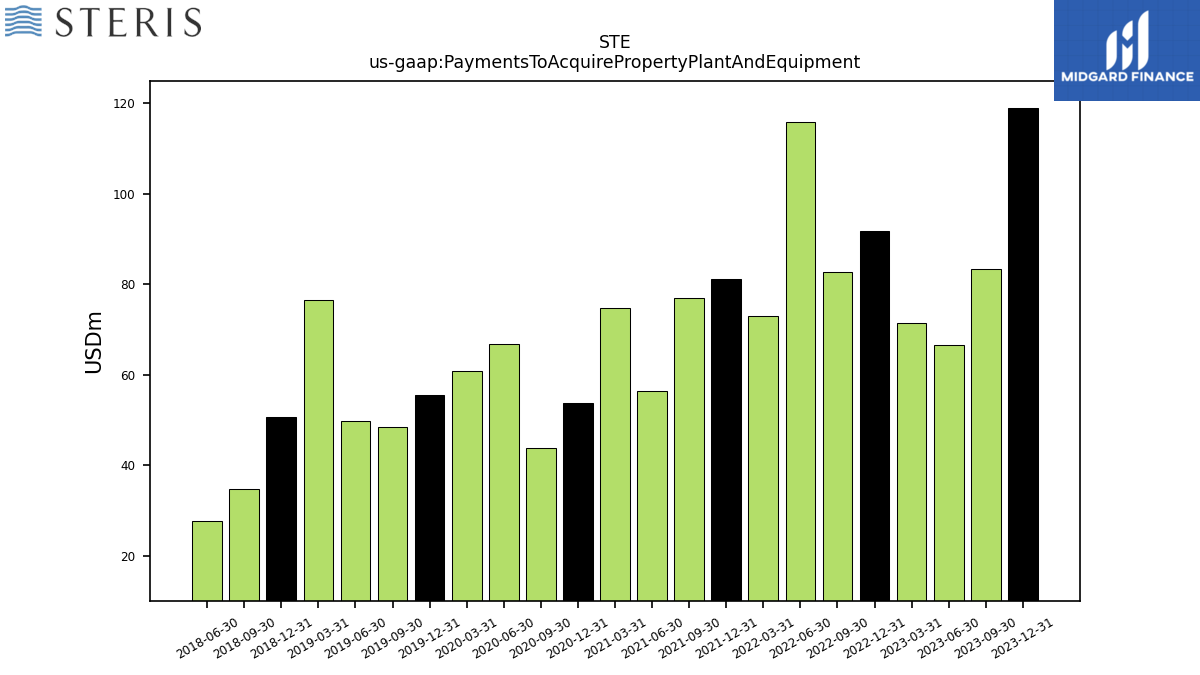
| Payments To Acquire Property Plant And Equipment | 118.94 | 83.29 | 66.60 | 71.45 | 91.82 | 82.77 | 115.93 | 73.07 | 81.12 | 76.97 | 56.40 | 74.77 | 53.75 | 43.88 | 66.86 | 60.87 | 55.48 | 48.37 | 49.79 | 76.48 | 50.69 | 34.82 | 27.73 | NA | NA | NA | NA |
| 2023-12-31 | 2023-09-30 | 2023-06-30 | 2023-03-31 | 2022-12-31 | 2022-09-30 | 2022-06-30 | 2022-03-31 | 2021-12-31 | 2021-09-30 | 2021-06-30 | 2021-03-31 | 2020-12-31 | 2020-09-30 | 2020-06-30 | 2020-03-31 | 2019-12-31 | 2019-09-30 | 2019-06-30 | 2019-03-31 | 2018-12-31 | 2018-09-30 | 2018-06-30 | 2018-03-31 | 2017-12-31 | 2017-09-30 | 2017-06-30 | ||
|---|---|---|---|---|---|---|---|---|---|---|---|---|---|---|---|---|---|---|---|---|---|---|---|---|---|---|---|---|
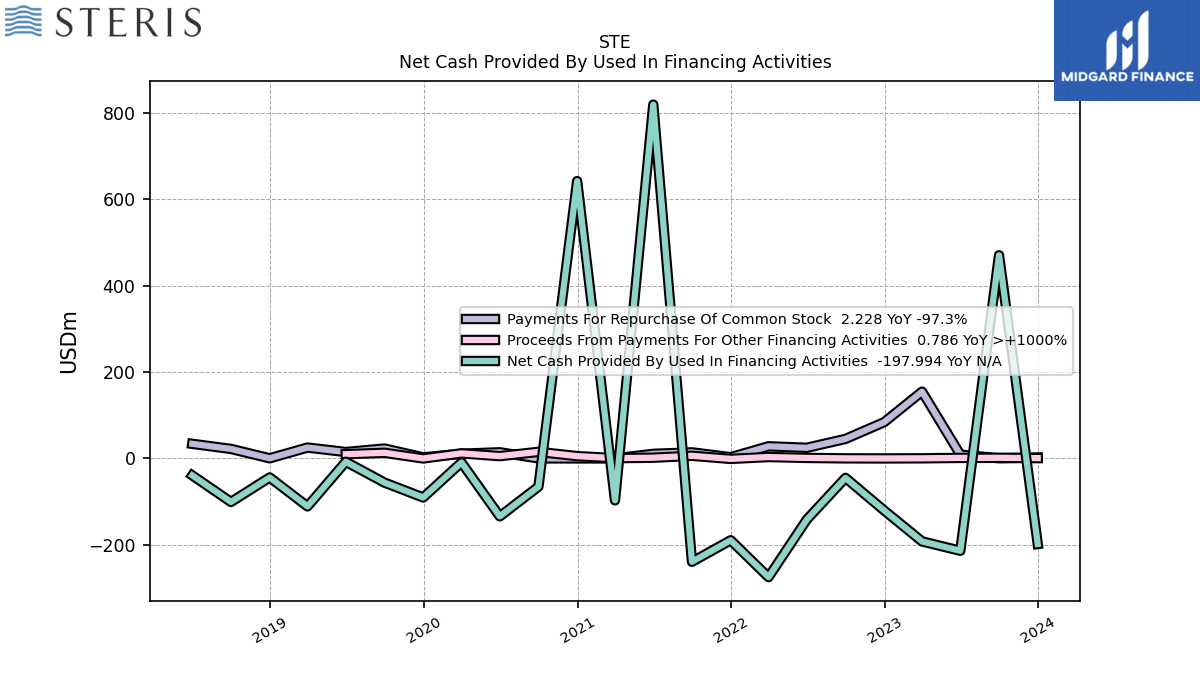
| Net Cash Provided By Used In Financing Activities | -197.99 | 470.21 | -213.64 | -191.95 | -120.41 | -44.95 | -141.41 | -274.61 | -189.26 | -239.11 | 818.81 | -96.91 | 641.85 | -65.32 | -134.00 | -9.27 | -90.34 | -55.92 | -7.61 | -110.98 | -43.95 | -100.65 | -39.21 | NA | NA | NA | NA | |
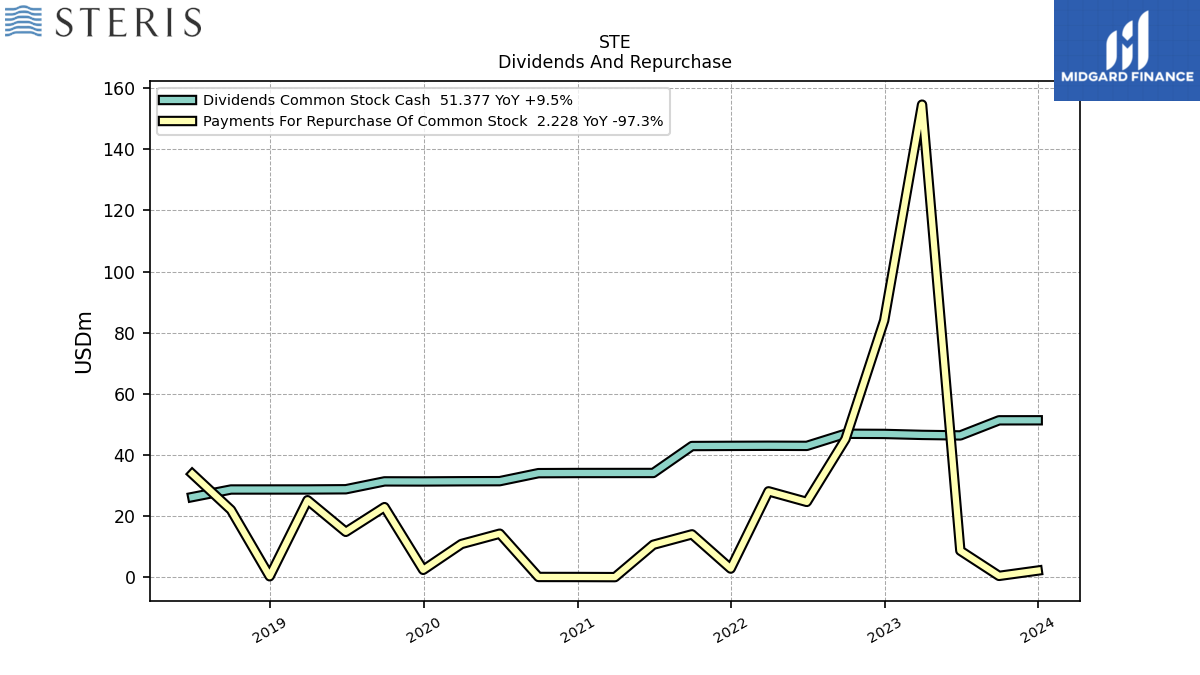
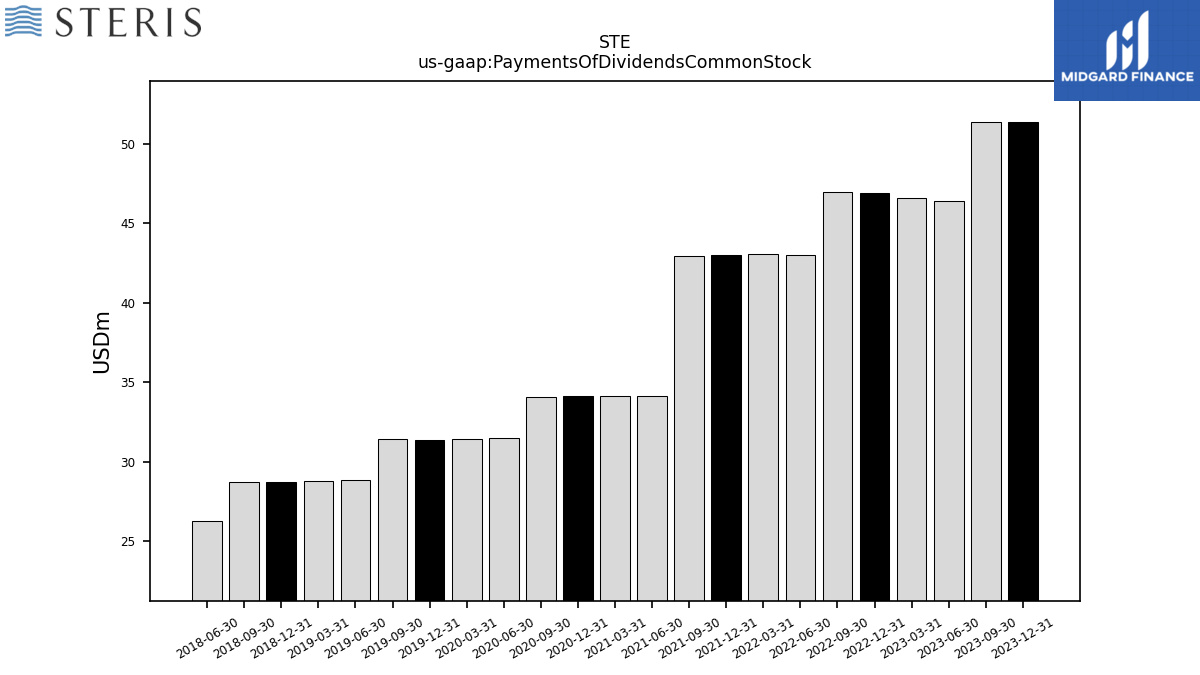
| Payments Of Dividends Common Stock | 51.38 | 51.37 | 46.43 | 46.60 | 46.92 | 46.97 | 43.01 | 43.05 | 43.01 | 42.96 | 34.15 | 34.14 | 34.14 | 34.09 | 31.47 | 31.44 | 31.38 | 31.40 | 28.82 | 28.75 | 28.75 | 28.74 | 26.27 | NA | NA | NA | NA | |
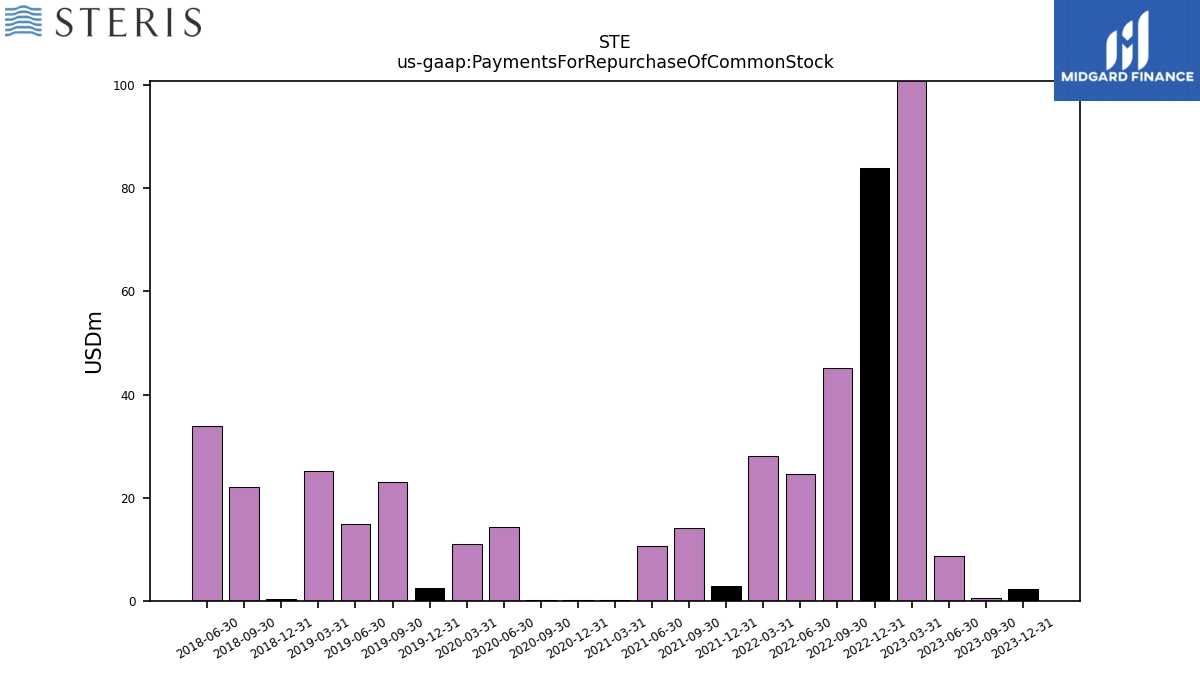
| Payments For Repurchase Of Common Stock | 2.23 | 0.49 | 8.72 | 154.61 | 84.03 | 45.24 | 24.68 | 28.15 | 2.88 | 14.08 | 10.67 | 0.09 | 0.13 | 0.14 | 14.30 | 10.92 | 2.45 | 22.98 | 14.89 | 25.24 | 0.35 | 22.06 | 33.84 | NA | NA | NA | NA |
| 2023-12-31 | 2023-09-30 | 2023-06-30 | 2023-03-31 | 2022-12-31 | 2022-09-30 | 2022-06-30 | 2022-03-31 | 2021-12-31 | 2021-09-30 | 2021-06-30 | 2021-03-31 | 2020-12-31 | 2020-09-30 | 2020-06-30 | 2020-03-31 | 2019-12-31 | 2019-09-30 | 2019-06-30 | 2019-03-31 | 2018-12-31 | 2018-09-30 | 2018-06-30 | 2018-03-31 | 2017-12-31 | 2017-09-30 | 2017-06-30 | ||
|---|---|---|---|---|---|---|---|---|---|---|---|---|---|---|---|---|---|---|---|---|---|---|---|---|---|---|---|---|
| Revenues | 1395.64 | 1342.36 | 1284.54 | 1384.84 | 1215.99 | 1200.52 | 1156.49 | 1210.69 | 1208.97 | 1196.98 | 968.42 | 873.53 | 808.92 | 756.13 | 668.93 | 822.99 | 774.26 | 736.84 | 696.80 | 768.21 | 696.24 | 678.96 | 638.76 | 715.97 | 661.90 | 26.20 | 607.96 | |
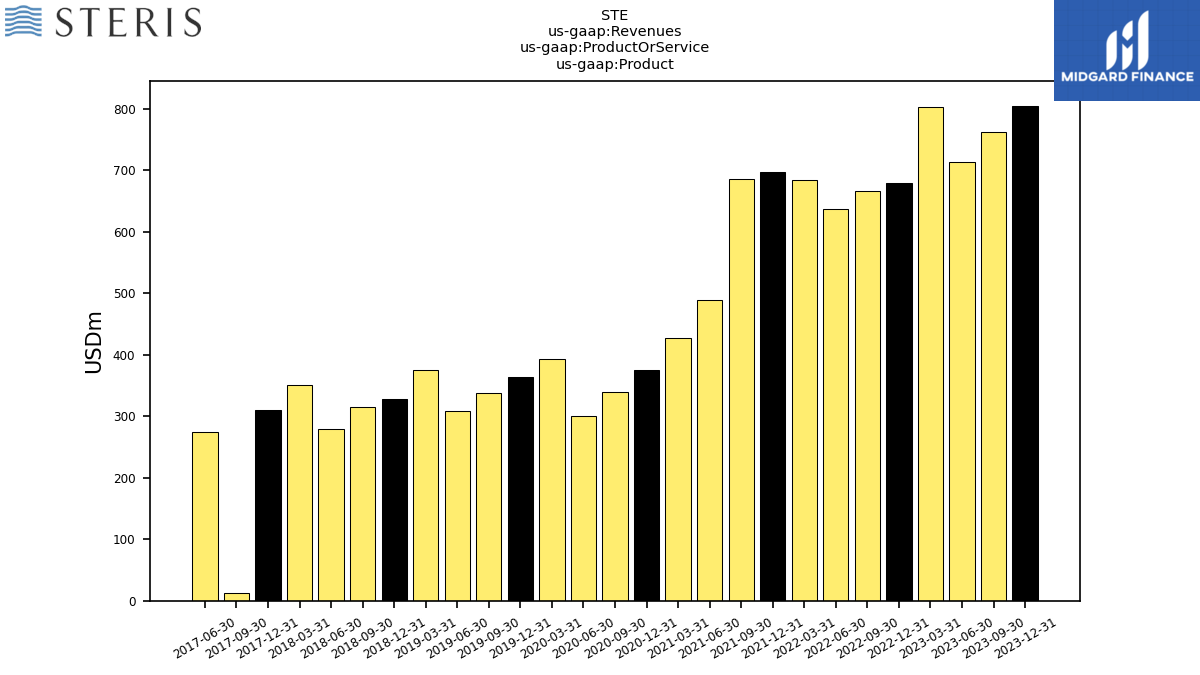
| Product | 804.76 | 762.34 | 713.86 | 802.82 | 679.04 | 666.39 | 637.08 | 684.51 | 697.26 | 685.24 | 489.28 | 427.61 | 375.31 | 339.50 | 301.11 | 393.59 | 363.80 | 337.67 | 307.74 | 374.94 | 327.64 | 314.66 | 278.79 | 351.01 | 309.46 | 12.95 | 273.61 | |
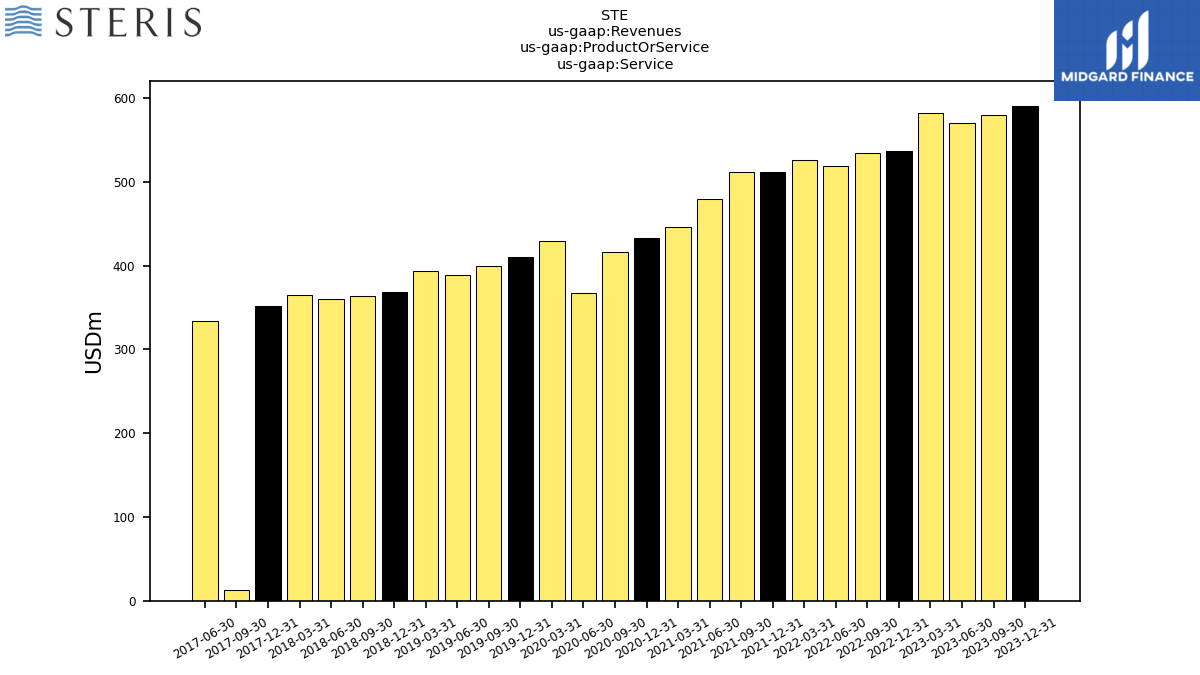
| Service | 590.89 | 580.02 | 570.68 | 582.02 | 536.95 | 534.12 | 519.41 | 526.18 | 511.71 | 511.75 | 479.14 | 445.92 | 433.61 | 416.63 | 367.82 | 429.40 | 410.47 | 399.17 | 389.07 | 393.28 | 368.60 | 364.30 | 359.97 | 364.96 | 352.44 | 13.24 | 334.36 | |
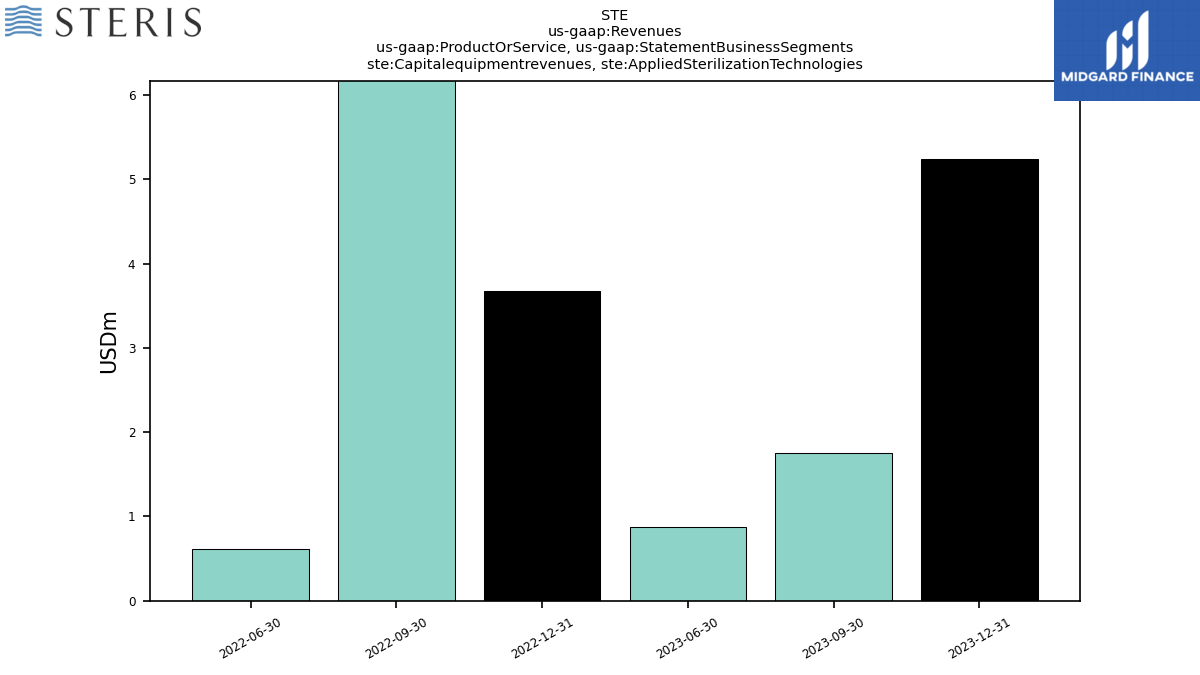
| Capitalequipmentrevenues, Applied Sterilization Technologies | 5.24 | 1.75 | 0.87 | NA | 3.68 | 10.48 | 0.62 | NA | NA | NA | NA | NA | NA | NA | NA | NA | NA | NA | NA | NA | NA | NA | NA | NA | NA | NA | NA | |
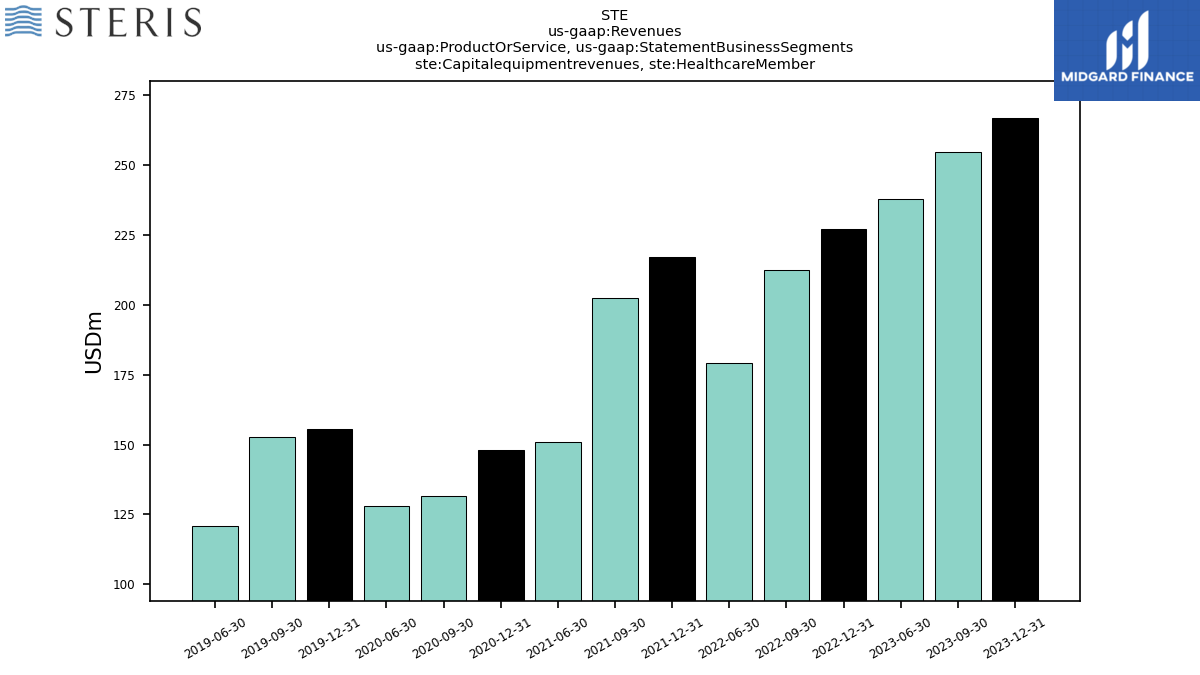
| Capitalequipmentrevenues, Healthcare Member | 266.84 | 254.91 | 238.10 | NA | 227.23 | 212.48 | 179.13 | NA | 217.21 | 202.41 | 150.89 | NA | 147.85 | 131.67 | 128.08 | NA | 155.41 | 152.63 | 120.86 | NA | NA | NA | NA | NA | NA | NA | NA | |
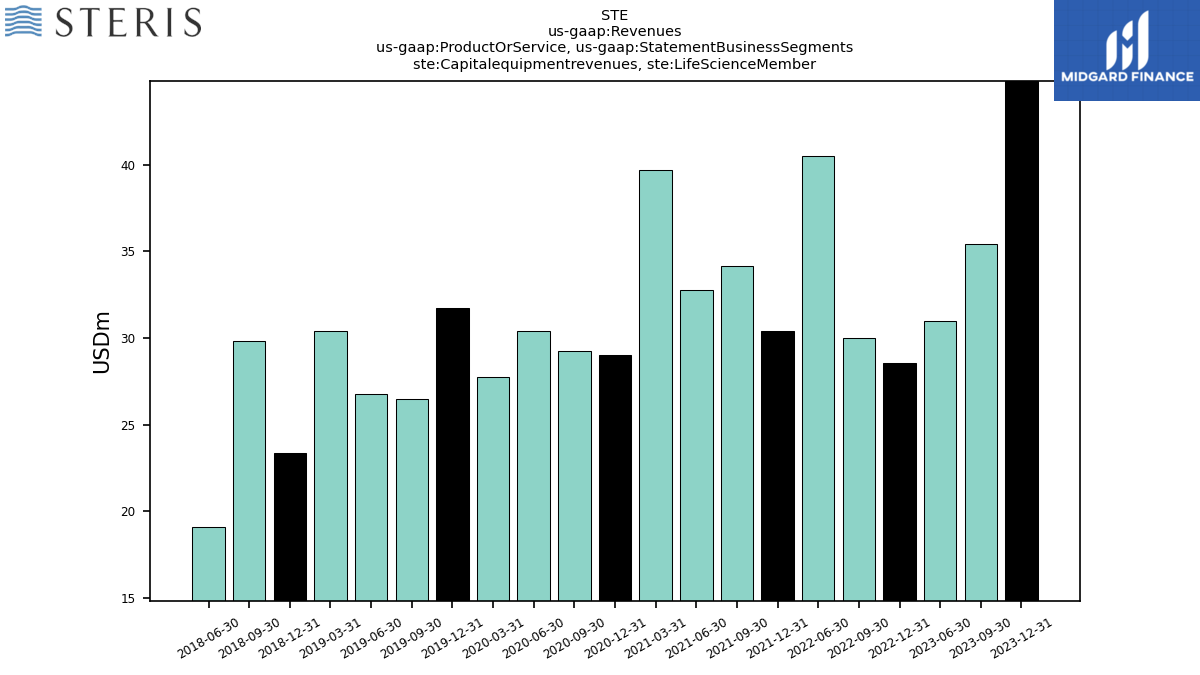
| Capitalequipmentrevenues, Life Science Member | 44.84 | 35.44 | 30.99 | NA | 28.58 | 30.02 | 40.50 | NA | 30.41 | 34.19 | 32.74 | 39.69 | 28.99 | 29.24 | 30.43 | 27.75 | 31.76 | 26.46 | 26.77 | 30.43 | 23.36 | 29.81 | 19.11 | NA | NA | NA | NA | |
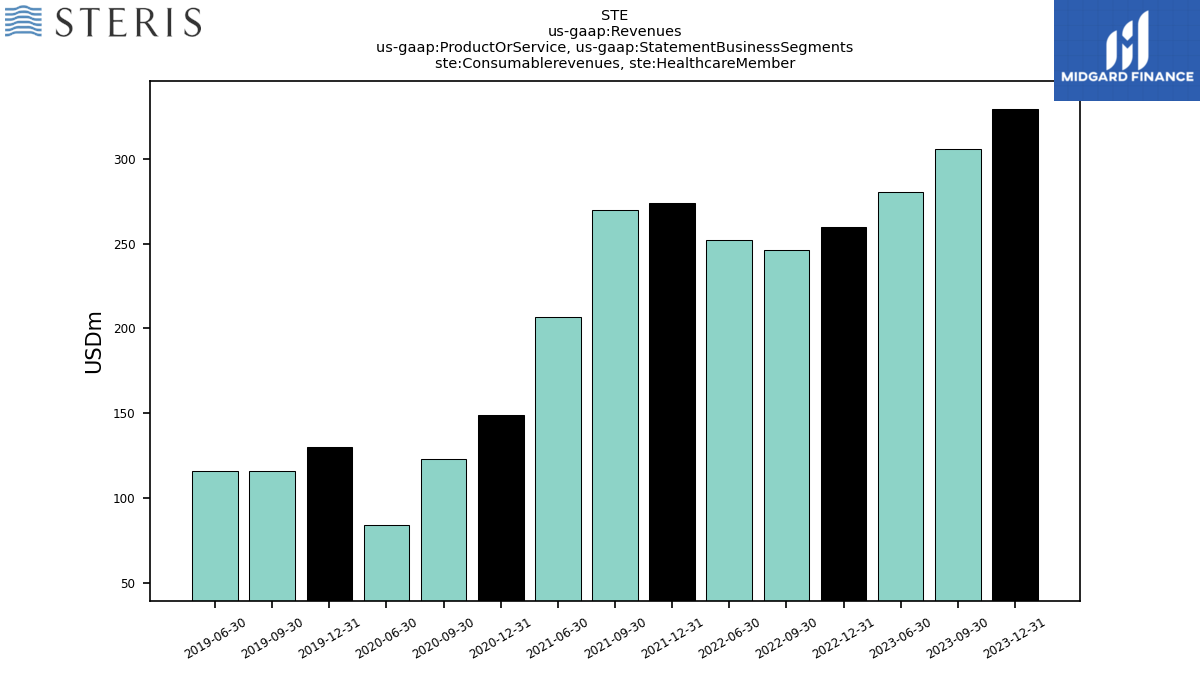
| Consumablerevenues, Healthcare Member | 329.44 | 306.02 | 280.28 | NA | 259.81 | 246.05 | 252.03 | NA | 273.75 | 270.09 | 206.69 | NA | 148.84 | 122.80 | 83.75 | NA | 130.25 | 116.03 | 116.08 | NA | NA | NA | NA | NA | NA | NA | NA | |
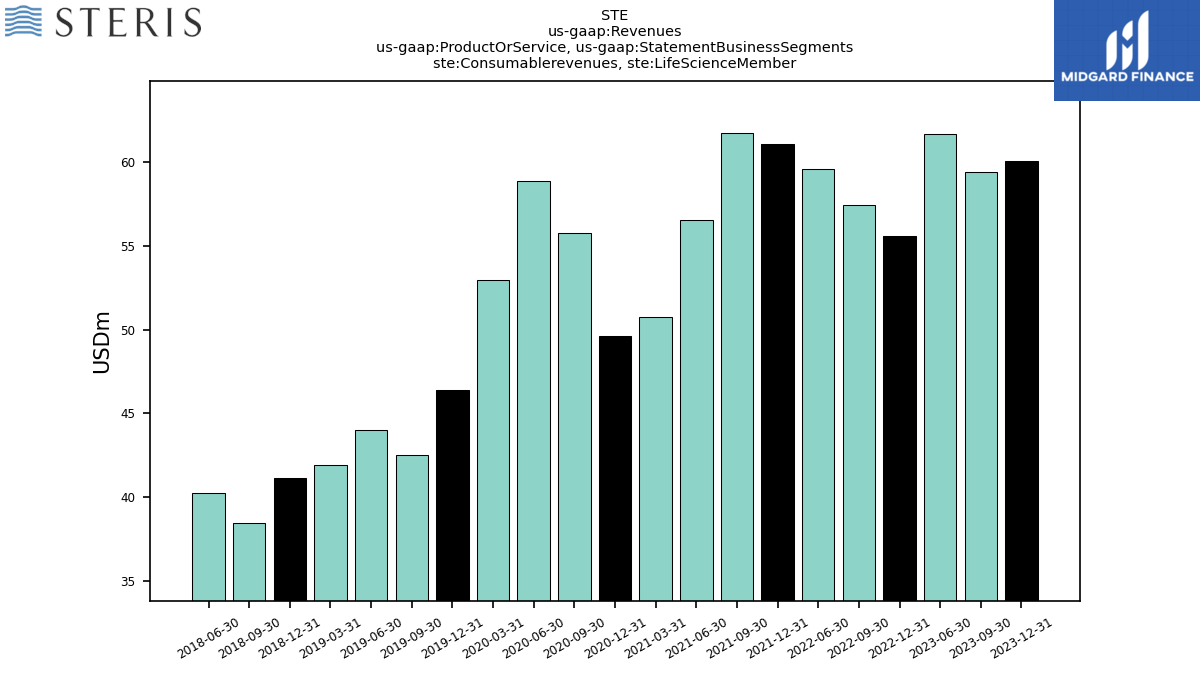
| Consumablerevenues, Life Science Member | 60.07 | 59.41 | 61.70 | NA | 55.61 | 57.42 | 59.56 | NA | 61.10 | 61.75 | 56.54 | 50.74 | 49.63 | 55.79 | 58.84 | 52.97 | 46.37 | 42.54 | 44.03 | 41.94 | 41.16 | 38.47 | 40.22 | NA | NA | NA | NA | |
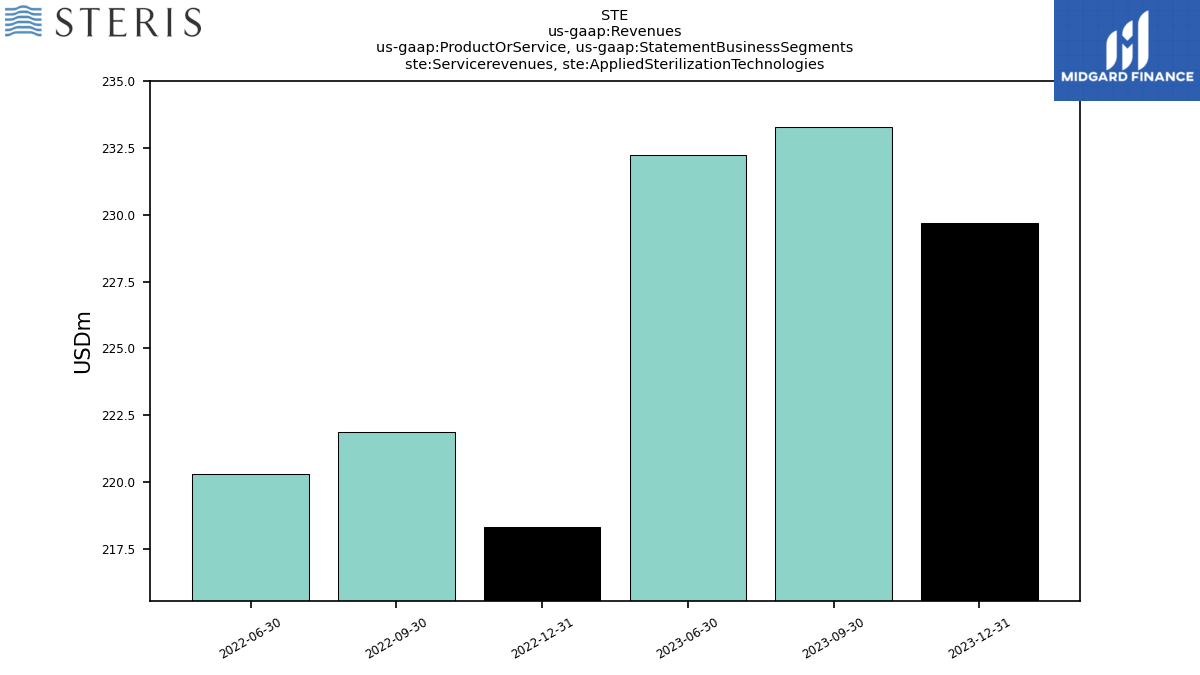
| Servicerevenues, Applied Sterilization Technologies | 229.69 | 233.30 | 232.22 | NA | 218.34 | 221.87 | 220.29 | NA | NA | NA | NA | NA | NA | NA | NA | NA | NA | NA | NA | NA | NA | NA | NA | NA | NA | NA | NA | |
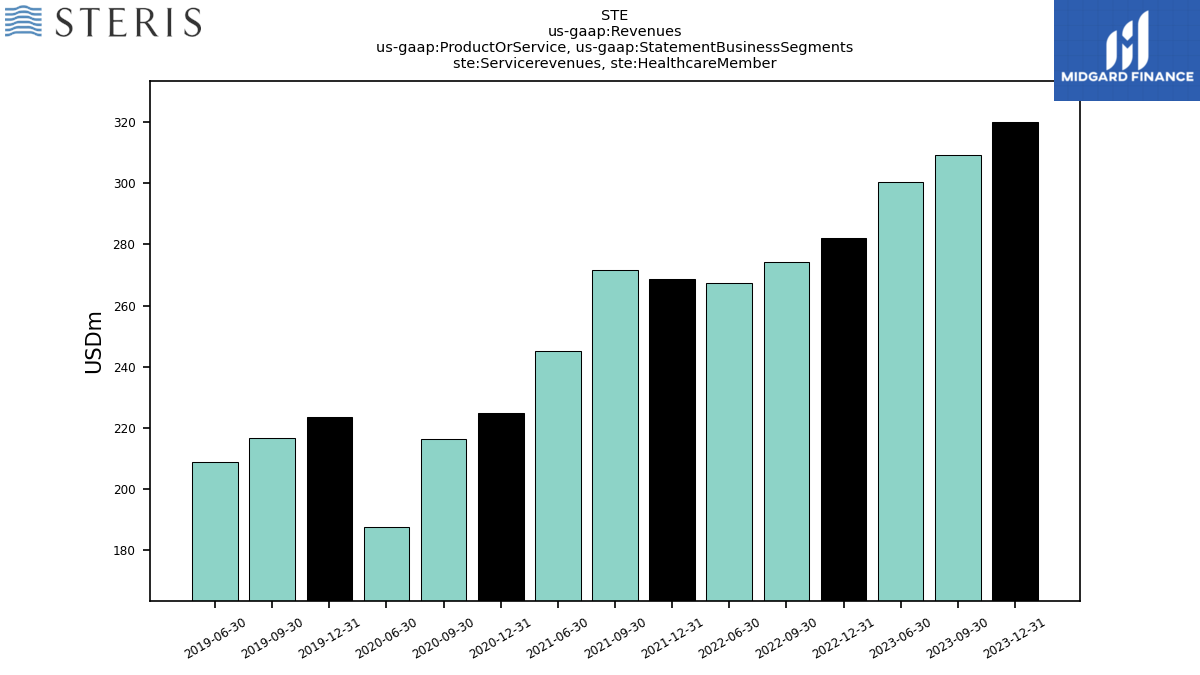
| Servicerevenues, Healthcare Member | 319.95 | 309.13 | 300.49 | NA | 282.11 | 274.28 | 267.36 | NA | 268.71 | 271.64 | 245.24 | NA | 224.97 | 216.46 | 187.82 | NA | 223.56 | 216.62 | 208.79 | NA | NA | NA | NA | NA | NA | NA | NA | |
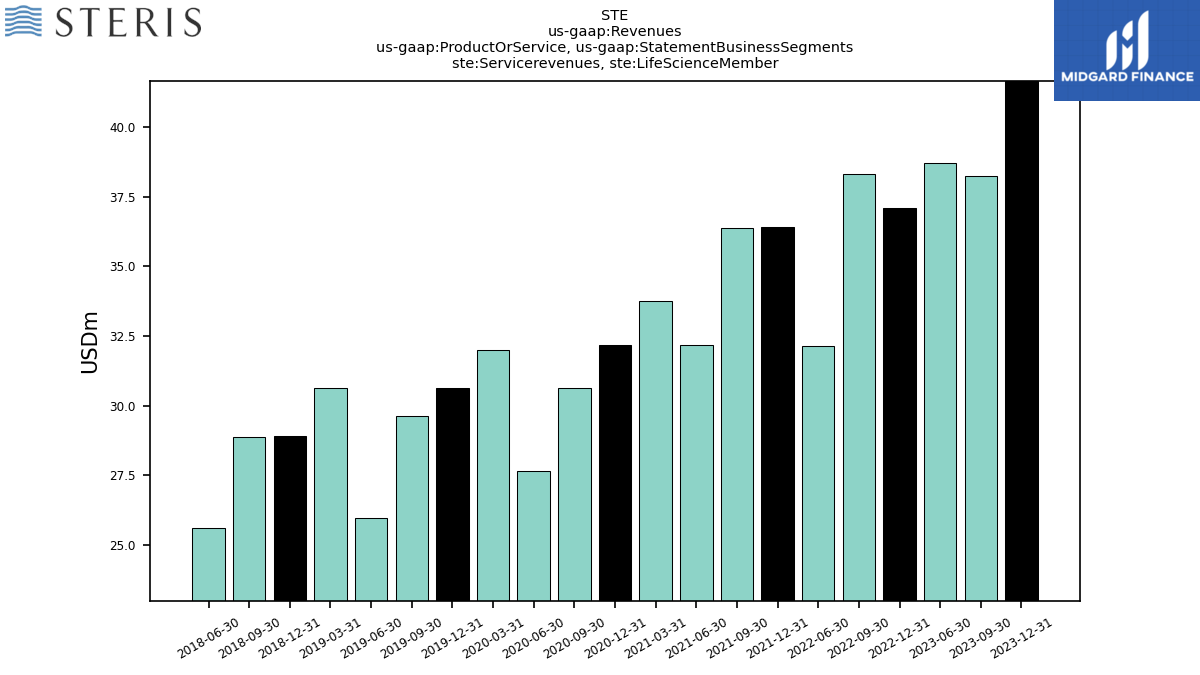
| Servicerevenues, Life Science Member | 41.66 | 38.25 | 38.72 | NA | 37.08 | 38.33 | 32.15 | NA | 36.40 | 36.39 | 32.19 | 33.75 | 32.18 | 30.62 | 27.64 | 32.01 | 30.64 | 29.65 | 25.99 | 30.63 | 28.93 | 28.89 | 25.62 | NA | NA | NA | NA | |
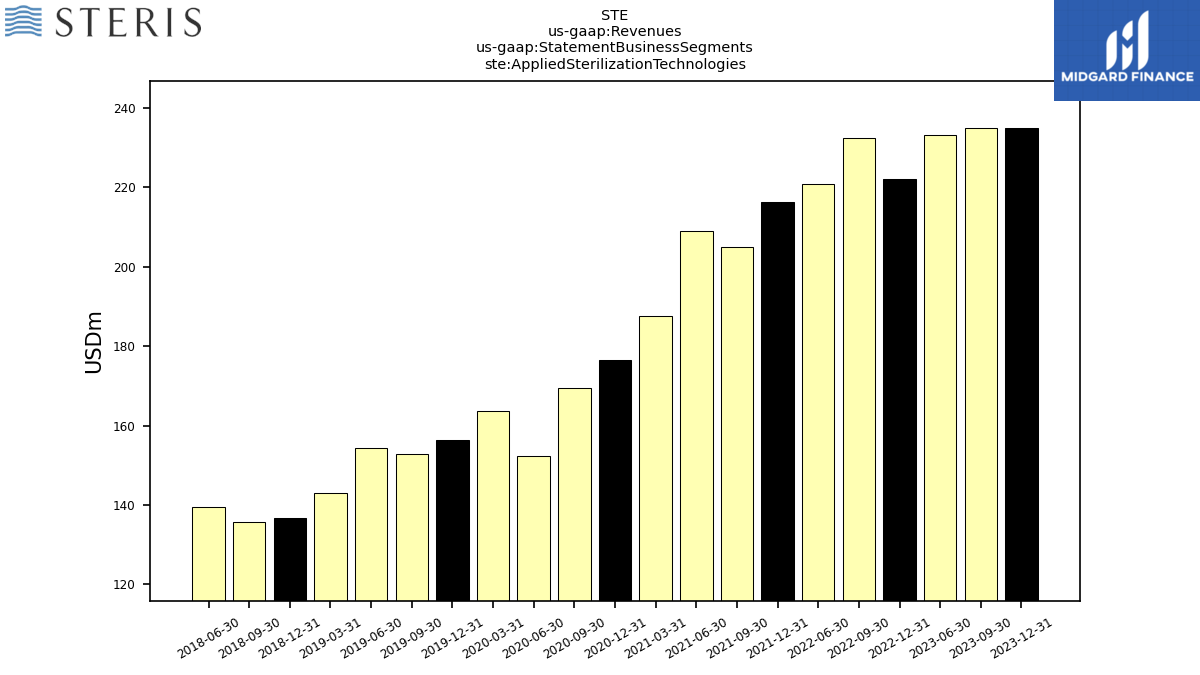
| Applied Sterilization Technologies | 234.93 | 235.05 | 233.10 | NA | 222.01 | 232.36 | 220.91 | NA | 216.30 | 204.89 | 208.90 | 187.54 | 176.46 | 169.55 | 152.36 | 163.69 | 156.27 | 152.91 | 154.29 | 143.08 | 136.76 | 135.74 | 139.54 | NA | NA | NA | NA | |
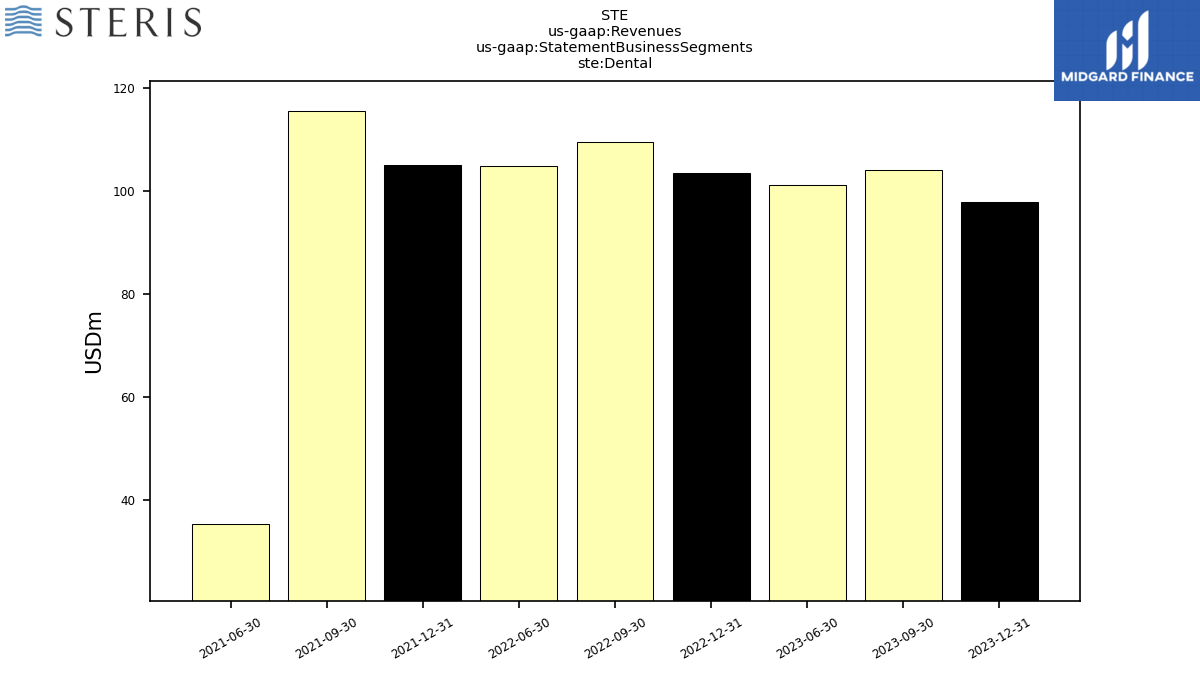
| Dental | 97.92 | 104.16 | 101.16 | NA | 103.56 | 109.58 | 104.85 | NA | 105.09 | 115.63 | 35.23 | NA | NA | NA | NA | NA | NA | NA | NA | NA | NA | NA | NA | NA | NA | NA | NA | |
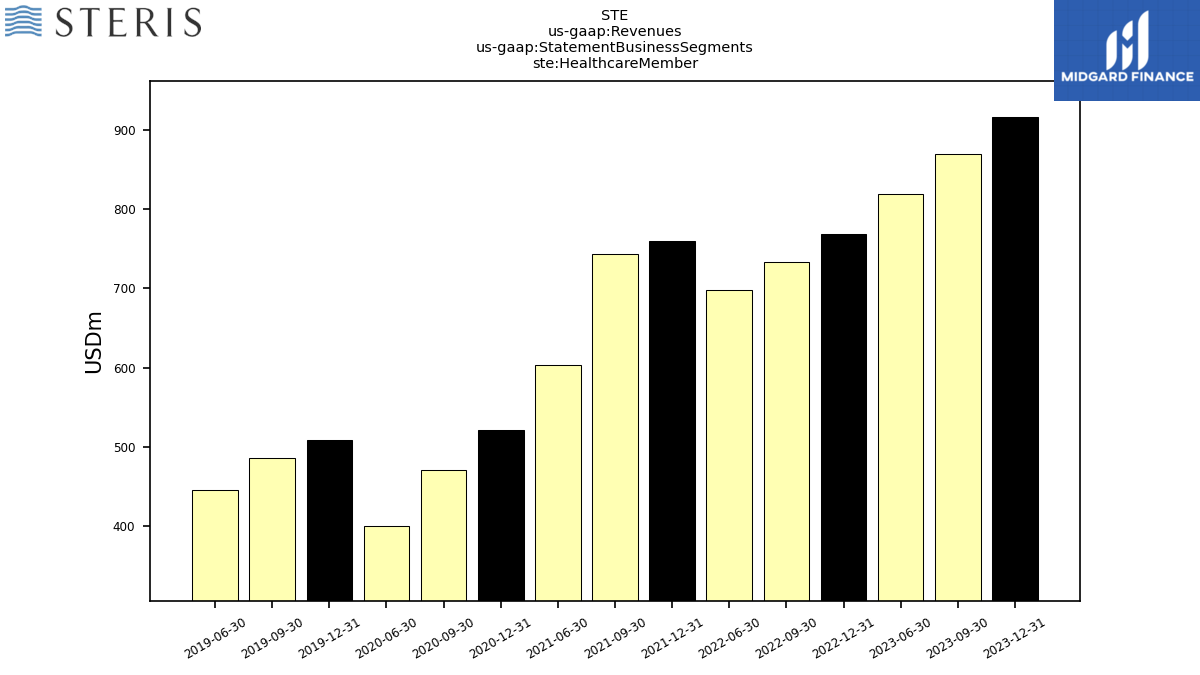
| Healthcare Member | 916.23 | 870.06 | 818.87 | NA | 769.14 | 732.81 | 698.53 | NA | 759.67 | 744.13 | 602.82 | NA | 521.66 | 470.93 | 399.66 | NA | 509.22 | 485.28 | 445.73 | NA | NA | NA | NA | NA | NA | NA | NA | |
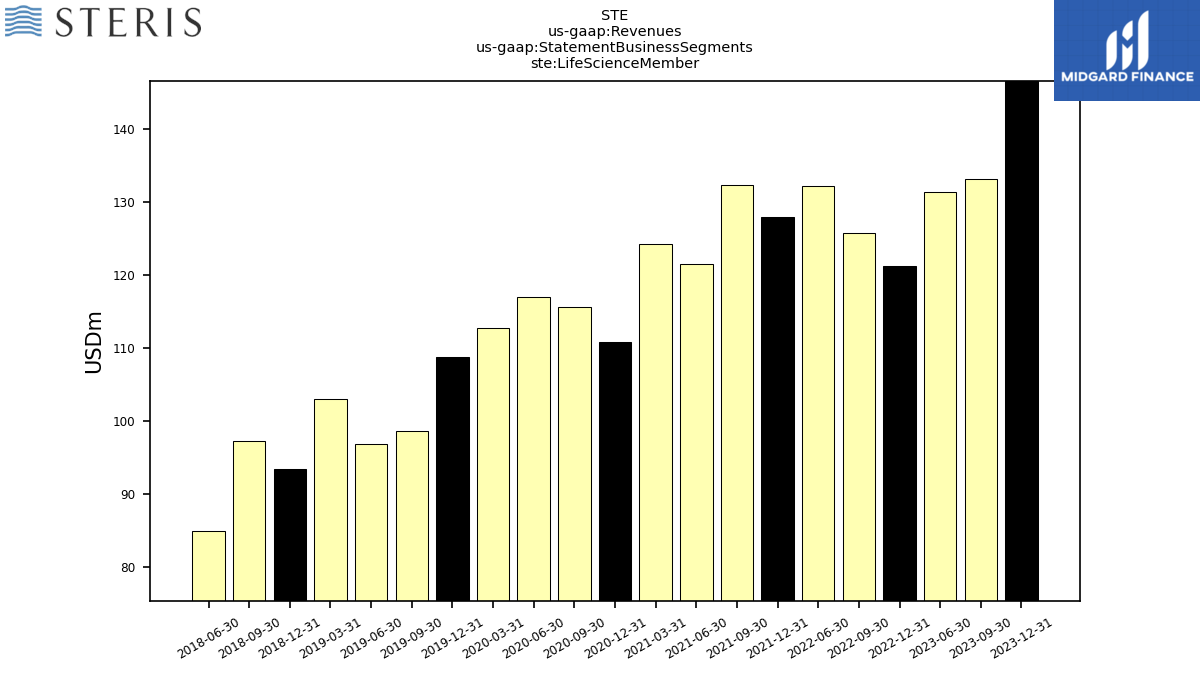
| Life Science Member | 146.57 | 133.09 | 131.41 | NA | 121.27 | 125.77 | 132.21 | NA | 127.91 | 132.33 | 121.47 | 124.18 | 110.80 | 115.66 | 116.91 | 112.73 | 108.77 | 98.65 | 96.78 | 102.99 | 93.45 | 97.17 | 84.95 | NA | NA | NA | NA | |
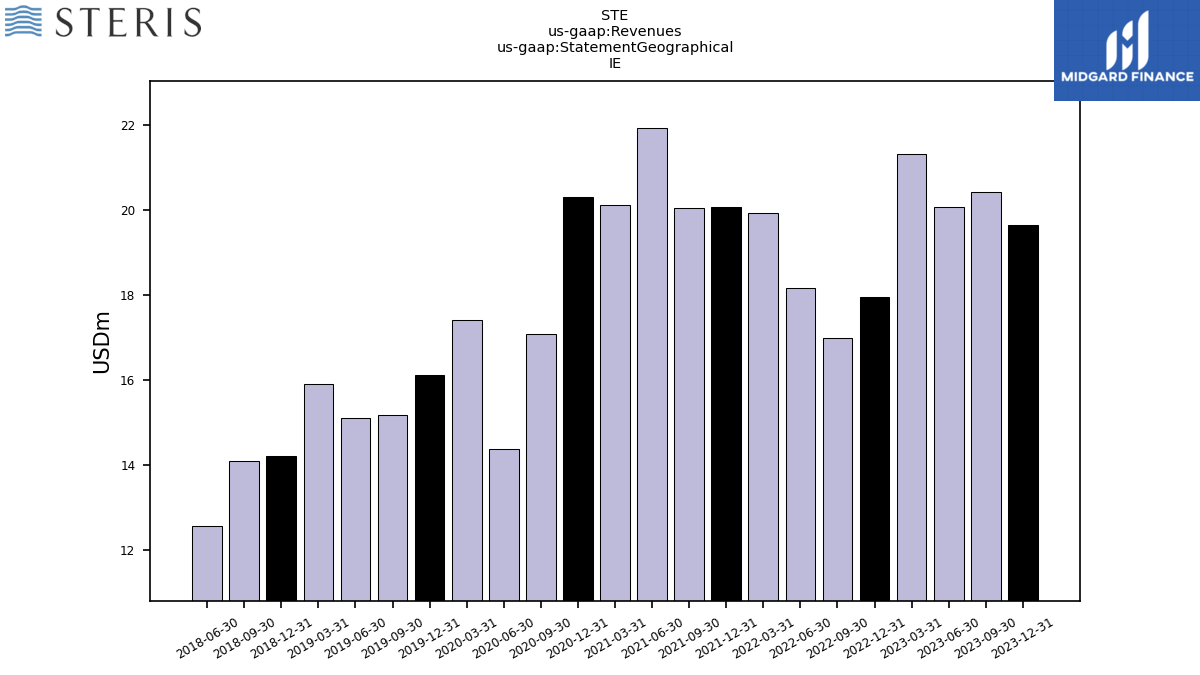
| 19.65 | 20.44 | 20.09 | 21.33 | 17.96 | 17.00 | 18.18 | 19.93 | 20.09 | 20.05 | 21.95 | 20.13 | 20.32 | 17.09 | 14.37 | 17.42 | 16.13 | 15.17 | 15.11 | 15.91 | 14.21 | 14.10 | 12.56 | NA | NA | NA | NA | ||
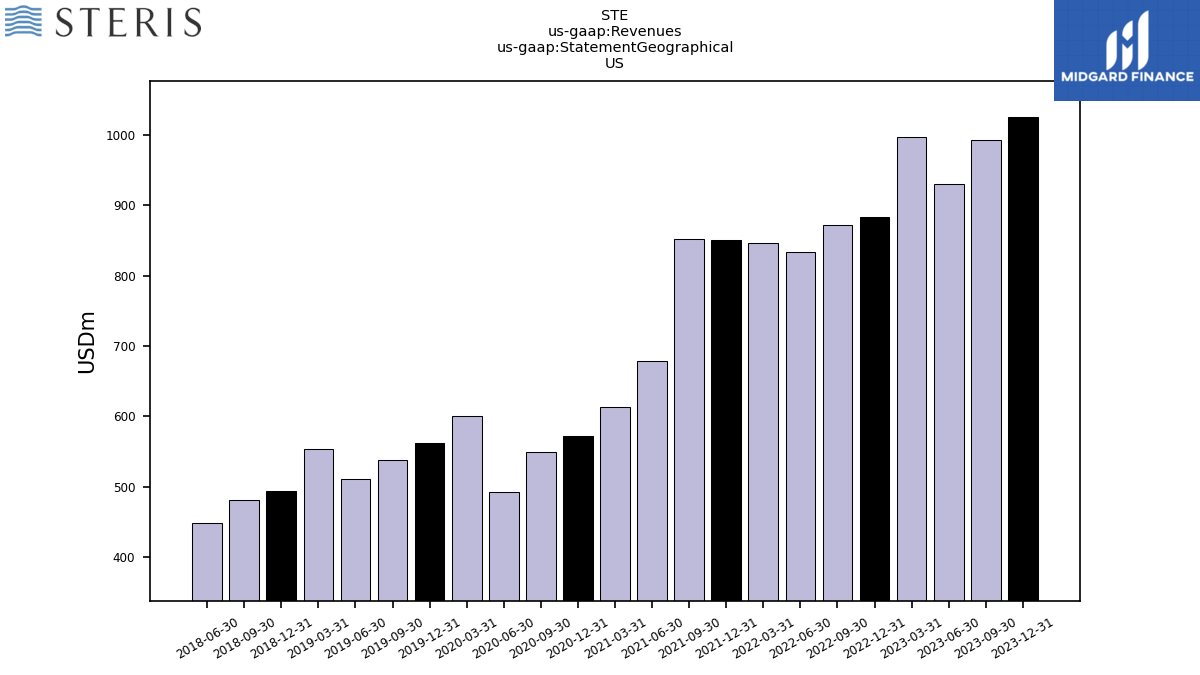
| US | 1025.46 | 992.88 | 930.54 | 997.01 | 883.39 | 871.98 | 834.10 | 845.83 | 851.29 | 852.50 | 679.25 | 613.48 | 572.40 | 549.45 | 491.71 | 599.97 | 562.50 | 538.10 | 511.15 | 553.71 | 494.33 | 481.23 | 447.54 | NA | NA | NA | NA | |
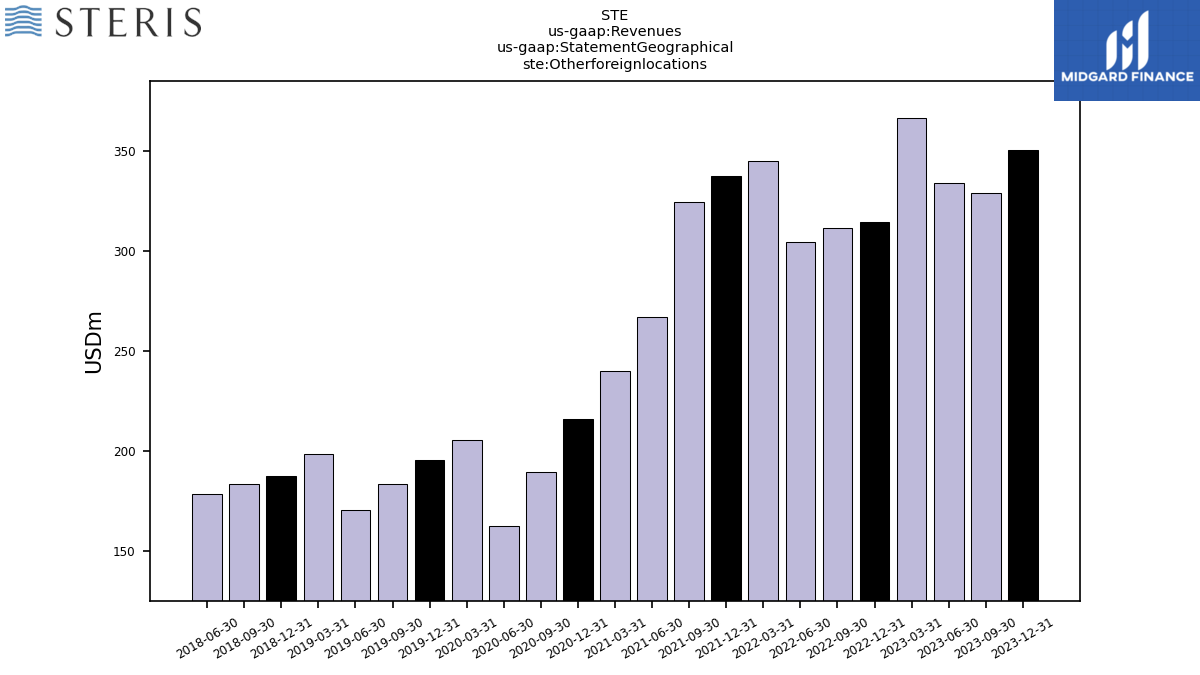
| Otherforeignlocations | 350.54 | 329.04 | 333.92 | 366.49 | 314.64 | 311.54 | 304.21 | 344.93 | 337.59 | 324.44 | 267.23 | 239.92 | 216.21 | 189.59 | 162.85 | 205.61 | 195.63 | 183.57 | 170.54 | 198.59 | 187.69 | 183.63 | 178.66 | NA | NA | NA | NA |