
| 2024-03-30 | 2023-12-30 | 2023-09-30 | 2023-07-01 | 2023-04-01 | 2022-12-31 | 2022-10-01 | 2022-07-02 | 2022-04-02 | 2022-01-01 | 2021-10-02 | 2021-07-03 | 2021-04-03 | 2020-09-26 | 2020-06-27 | 2020-03-28 | 2019-12-28 | 2019-09-28 | 2019-06-29 | 2019-03-30 | 2018-12-29 | 2018-09-29 | 2018-06-30 | 2018-03-31 | 2017-12-30 | 2017-09-30 | 2017-07-01 | 2017-04-01 | 2016-12-31 | 2016-10-01 | 2016-07-02 | 2016-04-02 | 2016-01-02 | 2015-10-03 | 2015-07-04 | 2015-04-04 | 2015-01-03 | 2014-09-27 | 2014-06-28 | 2014-03-29 | 2013-12-28 | 2013-09-28 | 2013-06-29 | 2013-03-30 | 2012-12-29 | 2012-09-29 | 2012-06-30 | 2012-03-31 | 2011-12-31 | 2011-10-01 | 2011-07-02 | 2011-04-02 | 2011-01-01 | 2010-10-02 | 2010-07-03 | 2010-04-03 | ||
|---|---|---|---|---|---|---|---|---|---|---|---|---|---|---|---|---|---|---|---|---|---|---|---|---|---|---|---|---|---|---|---|---|---|---|---|---|---|---|---|---|---|---|---|---|---|---|---|---|---|---|---|---|---|---|---|---|---|
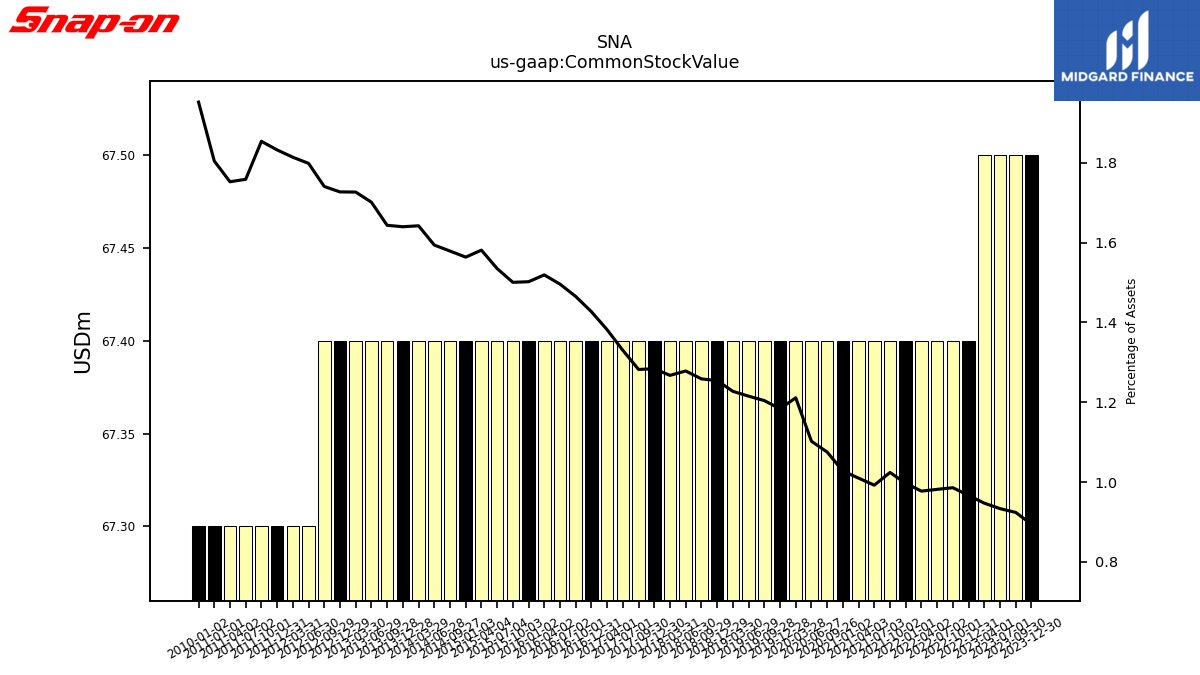
| Common Stock Value | 67.50 | 67.50 | 67.50 | 67.50 | 67.50 | 67.40 | 67.40 | 67.40 | 67.40 | 67.40 | 67.40 | 67.40 | 67.40 | 67.40 | 67.40 | 67.40 | 67.40 | 67.40 | 67.40 | 67.40 | 67.40 | 67.40 | 67.40 | 67.40 | 67.40 | 67.40 | 67.40 | 67.40 | 67.40 | 67.40 | 67.40 | 67.40 | 67.40 | 67.40 | 67.40 | 67.40 | 67.40 | 67.40 | 67.40 | 67.40 | 67.40 | 67.40 | 67.40 | 67.40 | 67.40 | 67.40 | 67.30 | 67.30 | 67.30 | 67.30 | 67.30 | 67.30 | 67.30 | NA | NA | NA | |
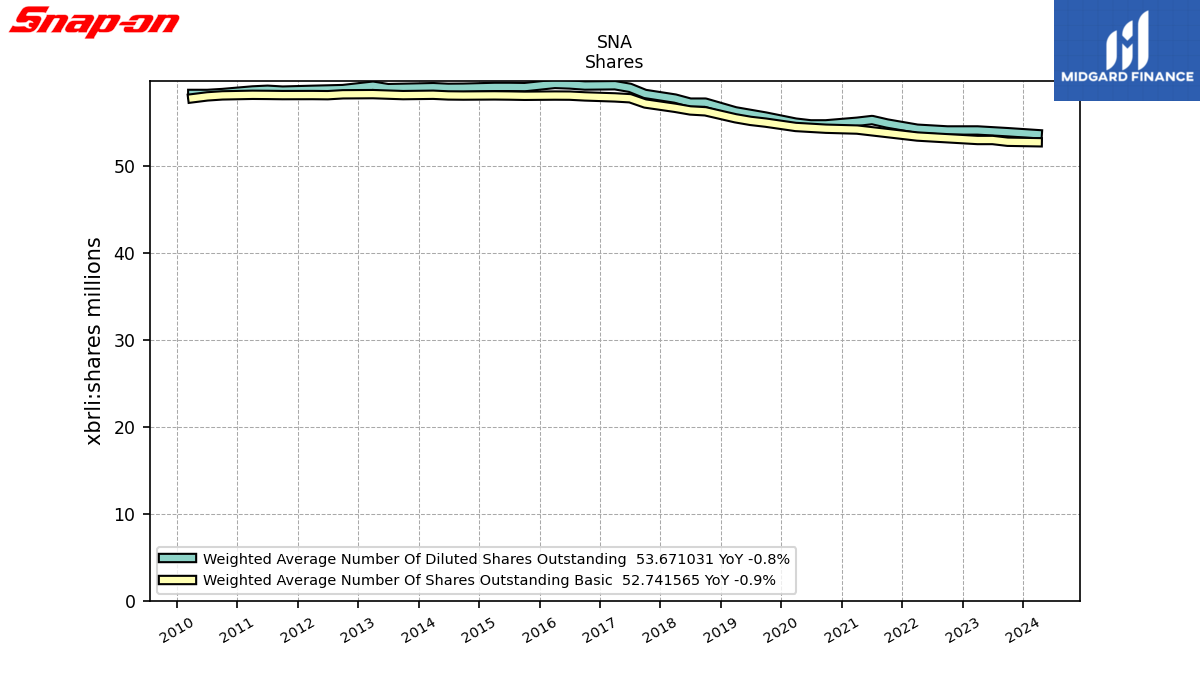
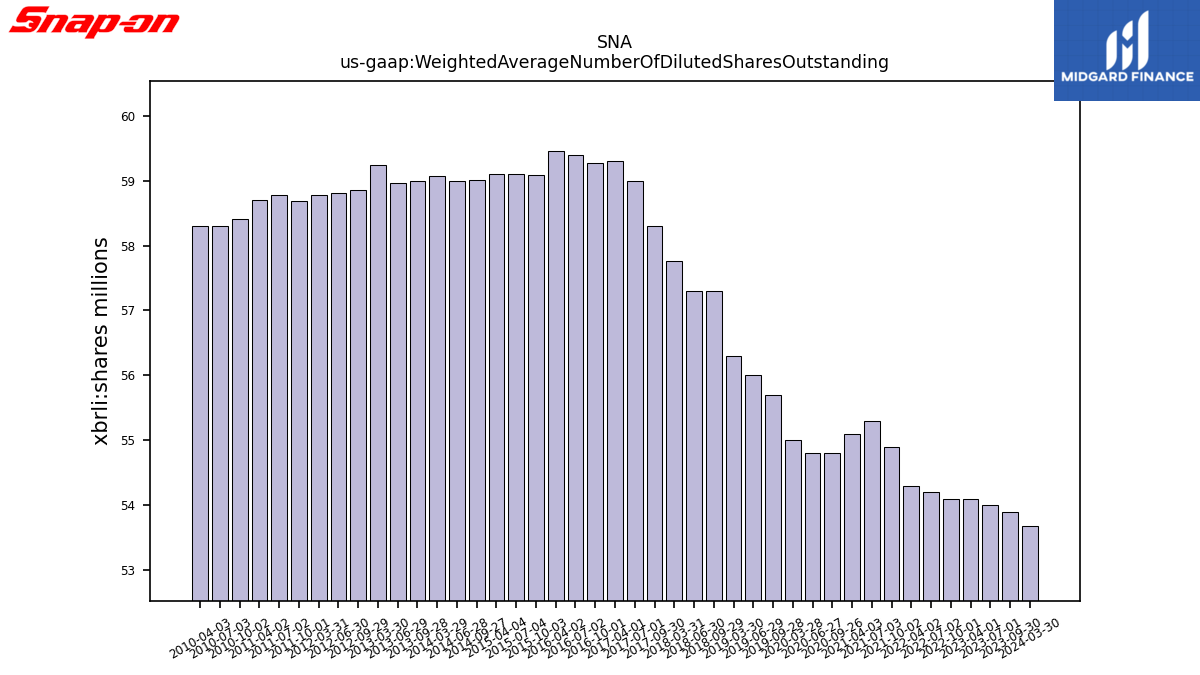
| Weighted Average Number Of Diluted Shares Outstanding | 53.67 | NA | 53.90 | 54.00 | 54.10 | NA | 54.10 | 54.20 | 54.30 | NA | 54.90 | 55.30 | 55.10 | 54.80 | 54.80 | 55.00 | NA | 55.70 | 56.00 | 56.30 | NA | 57.30 | 57.30 | 57.77 | NA | 58.30 | 59.00 | 59.30 | NA | 59.26 | 59.39 | 59.45 | NA | 59.08 | 59.11 | 59.11 | NA | 59.01 | 59.00 | 59.08 | NA | 59.00 | 58.96 | 59.24 | NA | 58.86 | 58.81 | 58.77 | NA | 58.68 | 58.78 | 58.70 | NA | 58.40 | 58.30 | 58.30 | |
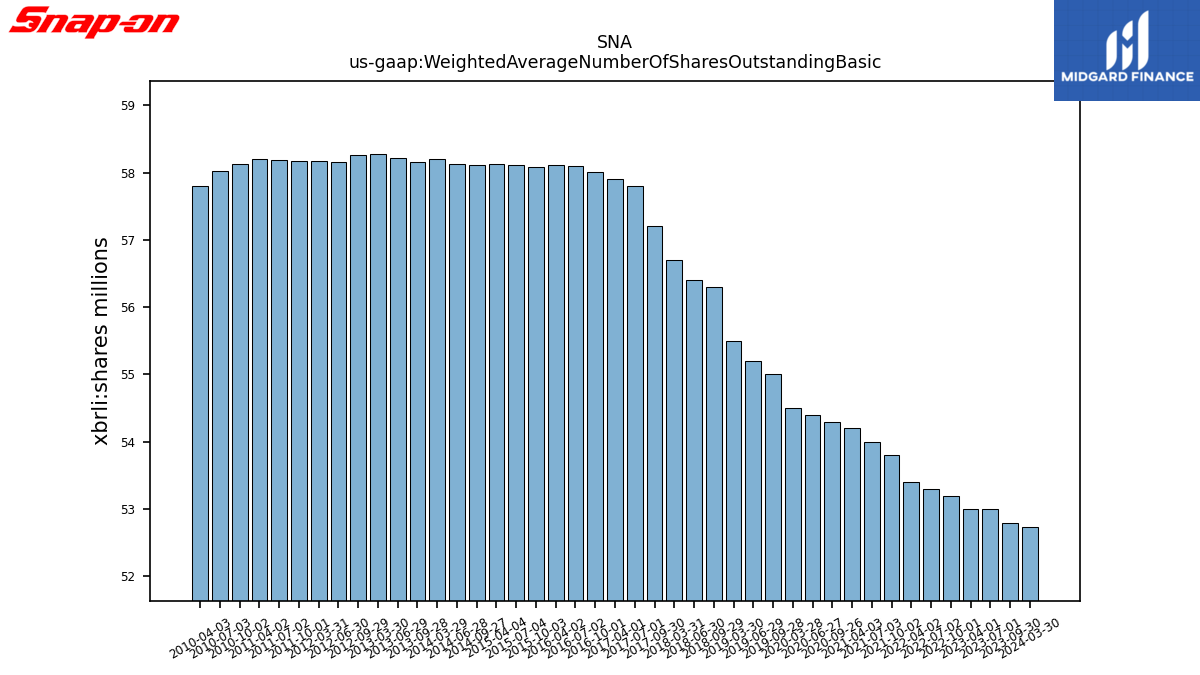
| Weighted Average Number Of Shares Outstanding Basic | 52.74 | NA | 52.80 | 53.00 | 53.00 | NA | 53.20 | 53.30 | 53.40 | NA | 53.80 | 54.00 | 54.20 | 54.30 | 54.40 | 54.50 | NA | 55.00 | 55.20 | 55.50 | NA | 56.30 | 56.40 | 56.70 | NA | 57.20 | 57.80 | 57.90 | NA | 58.01 | 58.10 | 58.11 | NA | 58.08 | 58.11 | 58.13 | NA | 58.11 | 58.13 | 58.21 | NA | 58.16 | 58.22 | 58.28 | NA | 58.26 | 58.16 | 58.17 | NA | 58.17 | 58.19 | 58.20 | NA | 58.13 | 58.02 | 57.80 | |
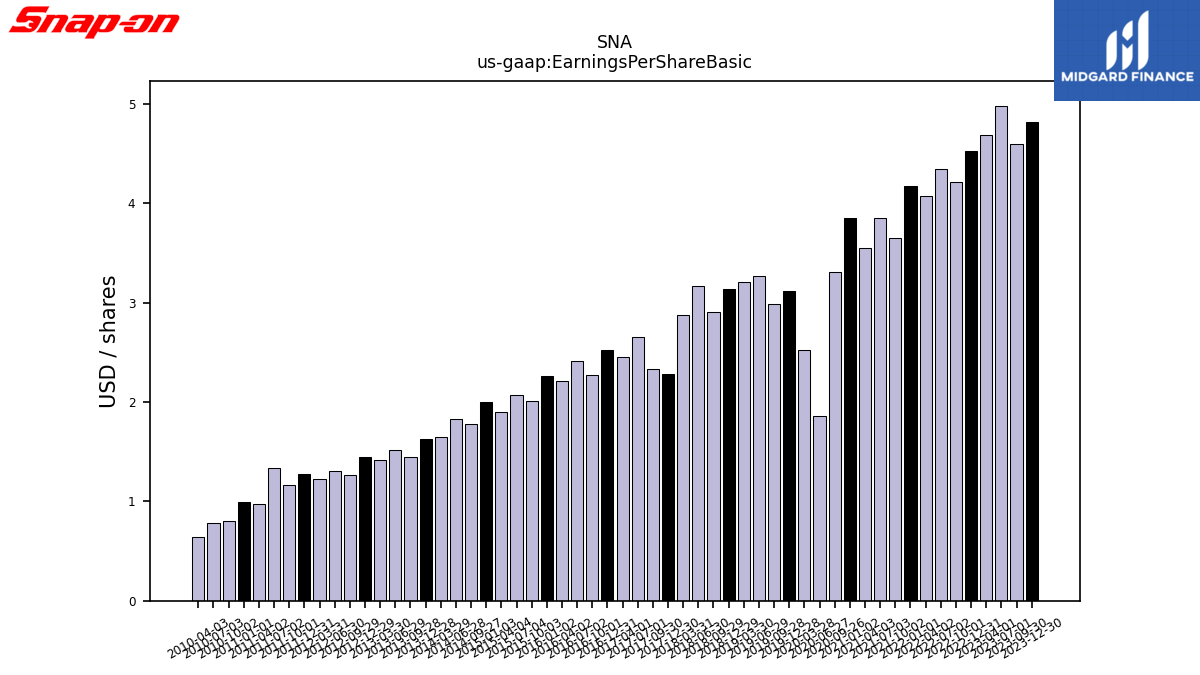
| Earnings Per Share Basic | 4.99 | 4.82 | 4.60 | 4.98 | 4.69 | 4.52 | 4.21 | 4.34 | 4.07 | 4.17 | 3.65 | 3.85 | 3.55 | 3.31 | 1.86 | 2.52 | 3.12 | 2.99 | 3.27 | 3.21 | 3.14 | 2.90 | 3.17 | 2.87 | 2.28 | 2.33 | 2.65 | 2.45 | 2.52 | 2.27 | 2.41 | 2.21 | 2.26 | 2.01 | 2.07 | 1.90 | 2.00 | 1.78 | 1.83 | 1.65 | 1.63 | 1.45 | 1.52 | 1.42 | 1.45 | 1.27 | 1.31 | 1.22 | 1.28 | 1.16 | 1.34 | 0.97 | 0.99 | 0.80 | 0.78 | 0.64 | |
| Earnings Per Share Diluted | 4.91 | 4.76 | 4.51 | 4.89 | 4.60 | 4.41 | 4.14 | 4.27 | 4.00 | 4.09 | 3.57 | 3.76 | 3.50 | 3.28 | 1.85 | 2.49 | 3.08 | 2.96 | 3.22 | 3.16 | 3.09 | 2.85 | 3.12 | 2.82 | 2.24 | 2.29 | 2.60 | 2.39 | 2.47 | 2.22 | 2.36 | 2.16 | 2.22 | 1.98 | 2.03 | 1.87 | 1.97 | 1.76 | 1.80 | 1.62 | 1.60 | 1.43 | 1.50 | 1.40 | 1.43 | 1.26 | 1.30 | 1.21 | 1.27 | 1.16 | 1.33 | 0.96 | 0.99 | 0.80 | 0.78 | 0.63 |
| 2024-03-30 | 2023-12-30 | 2023-09-30 | 2023-07-01 | 2023-04-01 | 2022-12-31 | 2022-10-01 | 2022-07-02 | 2022-04-02 | 2022-01-01 | 2021-10-02 | 2021-07-03 | 2021-04-03 | 2020-09-26 | 2020-06-27 | 2020-03-28 | 2019-12-28 | 2019-09-28 | 2019-06-29 | 2019-03-30 | 2018-12-29 | 2018-09-29 | 2018-06-30 | 2018-03-31 | 2017-12-30 | 2017-09-30 | 2017-07-01 | 2017-04-01 | 2016-12-31 | 2016-10-01 | 2016-07-02 | 2016-04-02 | 2016-01-02 | 2015-10-03 | 2015-07-04 | 2015-04-04 | 2015-01-03 | 2014-09-27 | 2014-06-28 | 2014-03-29 | 2013-12-28 | 2013-09-28 | 2013-06-29 | 2013-03-30 | 2012-12-29 | 2012-09-29 | 2012-06-30 | 2012-03-31 | 2011-12-31 | 2011-10-01 | 2011-07-02 | 2011-04-02 | 2011-01-01 | 2010-10-02 | 2010-07-03 | 2010-04-03 | ||
|---|---|---|---|---|---|---|---|---|---|---|---|---|---|---|---|---|---|---|---|---|---|---|---|---|---|---|---|---|---|---|---|---|---|---|---|---|---|---|---|---|---|---|---|---|---|---|---|---|---|---|---|---|---|---|---|---|---|
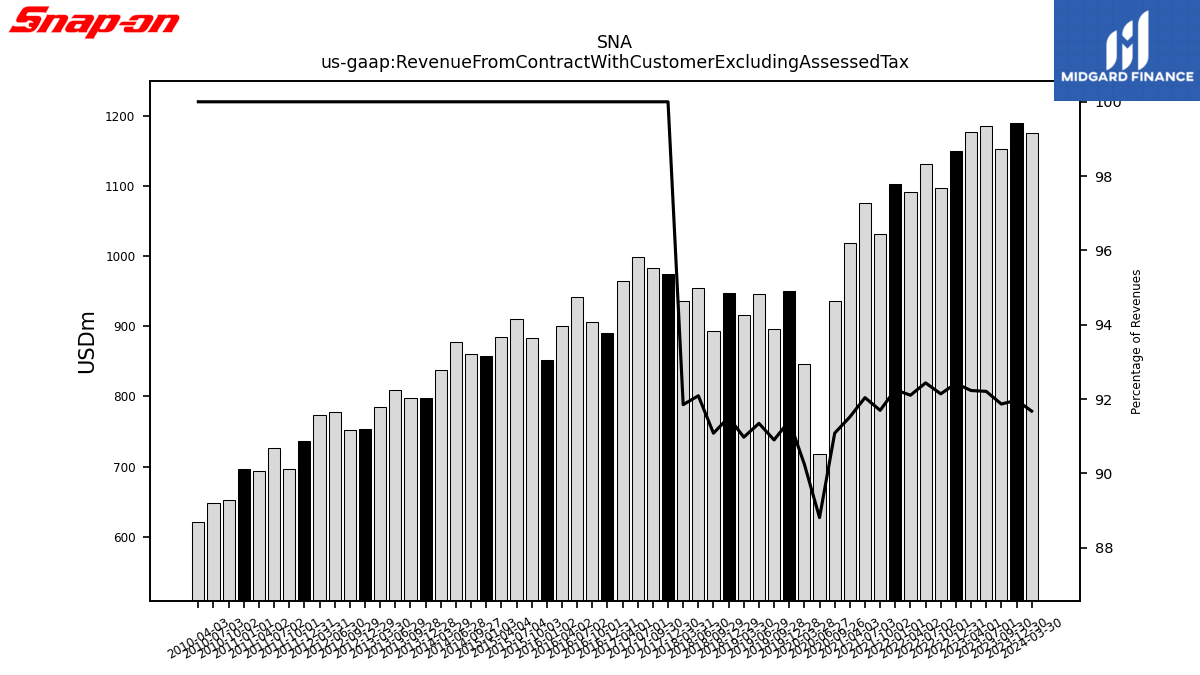
| Revenue From Contract With Customer Excluding Assessed Tax | 1175.20 | 1189.90 | 1152.20 | 1184.60 | 1176.50 | 1149.90 | 1096.30 | 1130.50 | 1091.90 | 1102.60 | 1031.60 | 1075.30 | 1018.80 | 935.80 | 718.40 | 846.60 | 949.90 | 896.20 | 945.80 | 916.40 | 947.30 | 892.70 | 954.60 | 935.50 | 974.60 | 982.80 | 999.10 | 963.90 | 889.80 | 905.70 | 941.60 | 900.50 | 851.70 | 882.60 | 910.50 | 885.20 | 857.40 | 859.90 | 878.20 | 837.70 | 797.50 | 798.30 | 808.60 | 785.70 | 753.20 | 752.10 | 777.80 | 773.20 | 736.60 | 697.20 | 726.70 | 693.70 | 696.90 | 653.10 | 647.60 | 621.60 | |
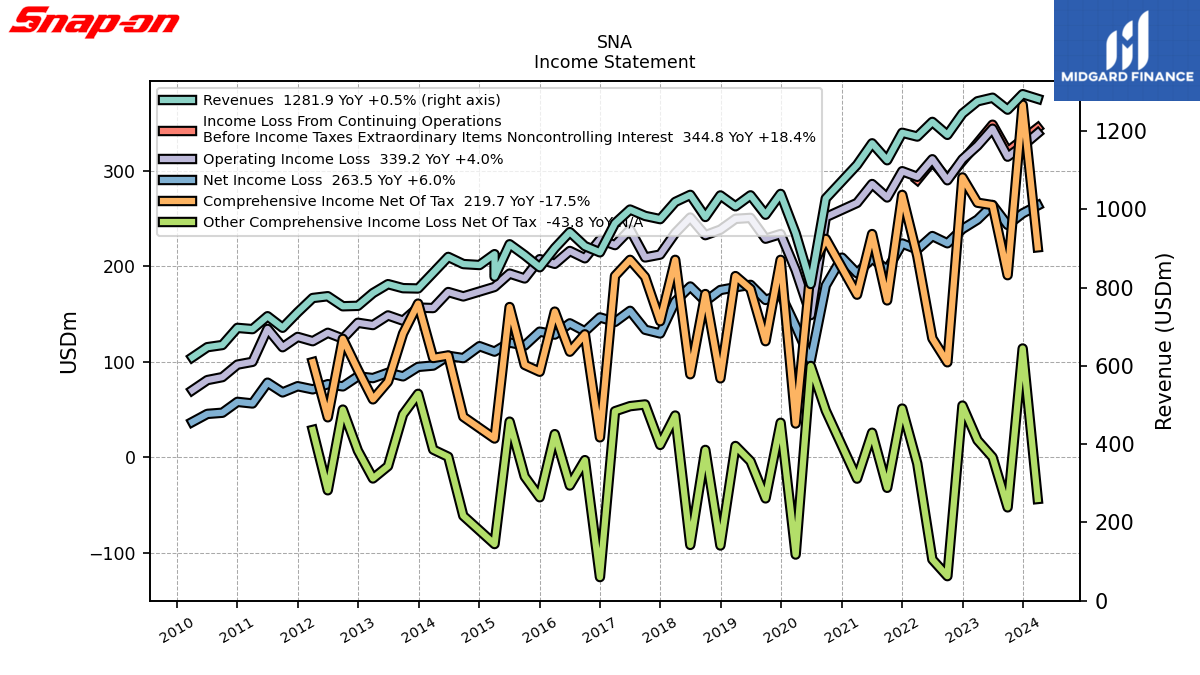
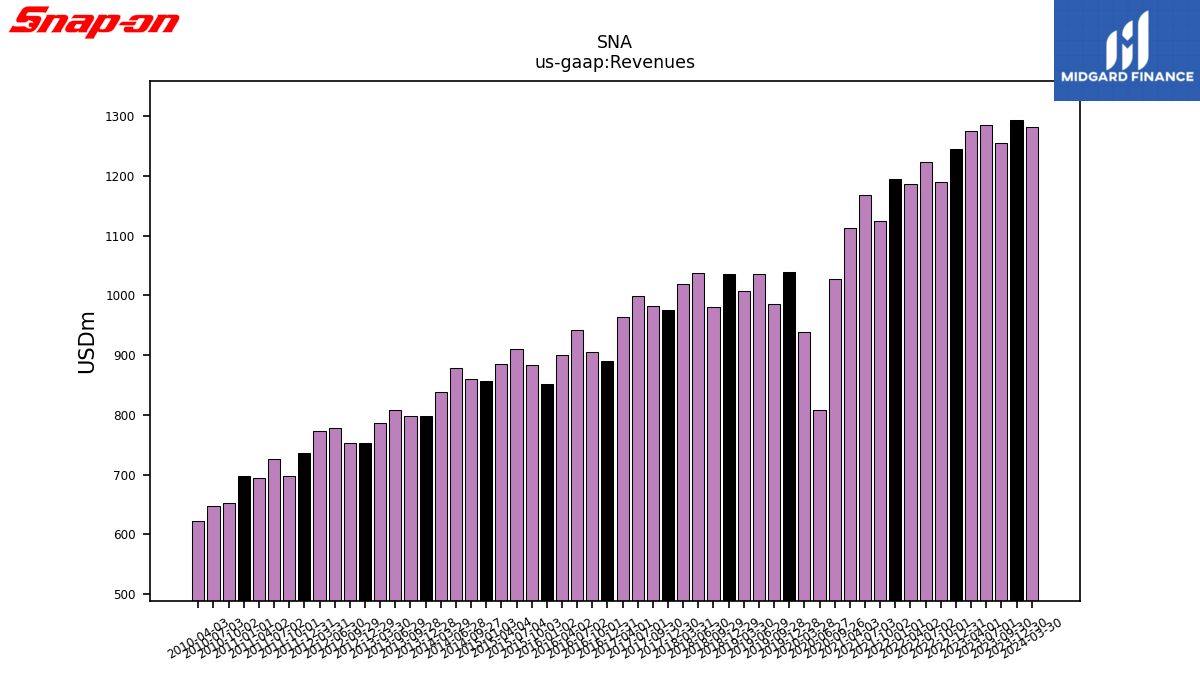
| Revenues | 1281.90 | 1293.80 | 1254.20 | 1284.70 | 1275.60 | 1244.20 | 1189.80 | 1223.00 | 1185.50 | 1195.20 | 1125.00 | 1168.30 | 1113.20 | 1027.40 | 808.90 | 938.10 | 1039.10 | 985.90 | 1035.40 | 1007.30 | 1035.20 | 980.10 | 1036.60 | 1018.50 | 974.60 | 982.80 | 999.10 | 963.90 | 889.80 | 905.70 | 941.60 | 900.50 | 851.70 | 882.60 | 910.50 | 885.20 | 857.40 | 859.90 | 878.20 | 837.70 | 797.50 | 798.30 | 808.60 | 785.70 | 753.20 | 752.10 | 777.80 | 773.20 | 736.60 | 697.20 | 726.70 | 693.70 | 696.90 | 653.10 | 647.60 | 621.60 | |
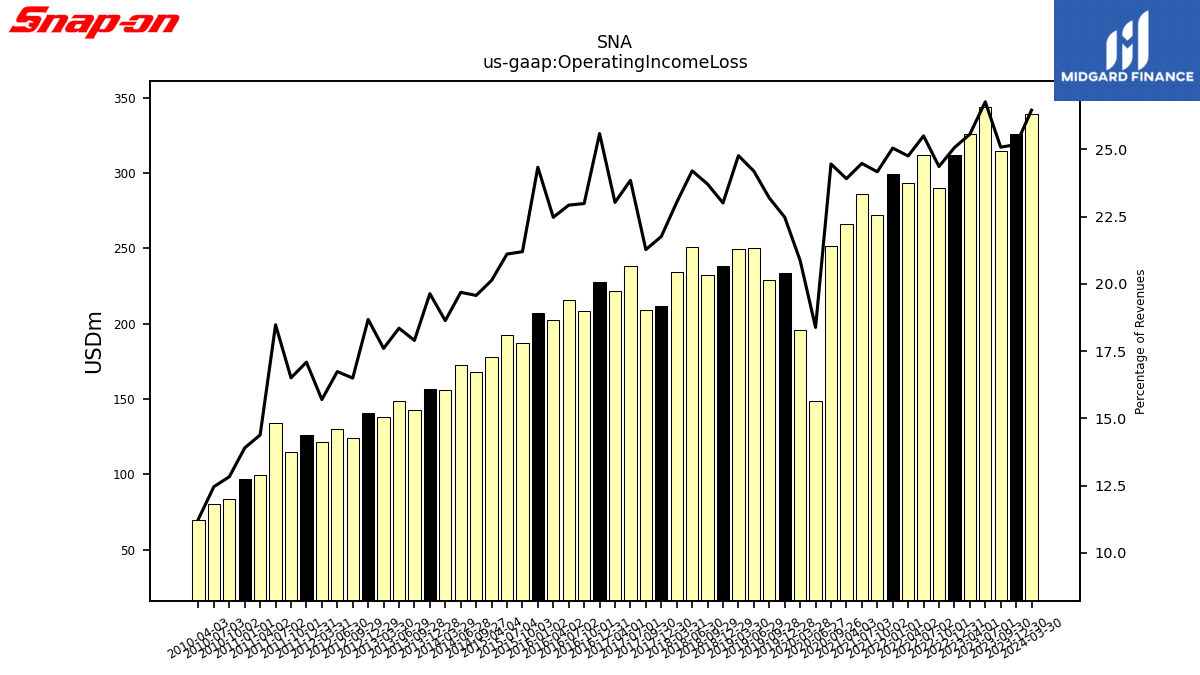
| Operating Income Loss | 339.20 | 325.80 | 314.60 | 343.90 | 326.10 | 311.90 | 289.90 | 311.90 | 293.50 | 299.40 | 271.90 | 286.00 | 266.20 | 251.30 | 148.70 | 195.80 | 233.60 | 228.70 | 250.50 | 249.50 | 238.20 | 232.40 | 250.90 | 234.60 | 212.10 | 209.10 | 238.30 | 222.00 | 227.70 | 208.20 | 215.90 | 202.40 | 207.30 | 187.10 | 192.20 | 178.20 | NA | 168.30 | 172.90 | 156.10 | 156.60 | 142.90 | 148.40 | 138.30 | 140.70 | 124.10 | 130.20 | 121.40 | 125.90 | 115.10 | 134.30 | 99.80 | 96.90 | 83.80 | 80.70 | 70.00 | |
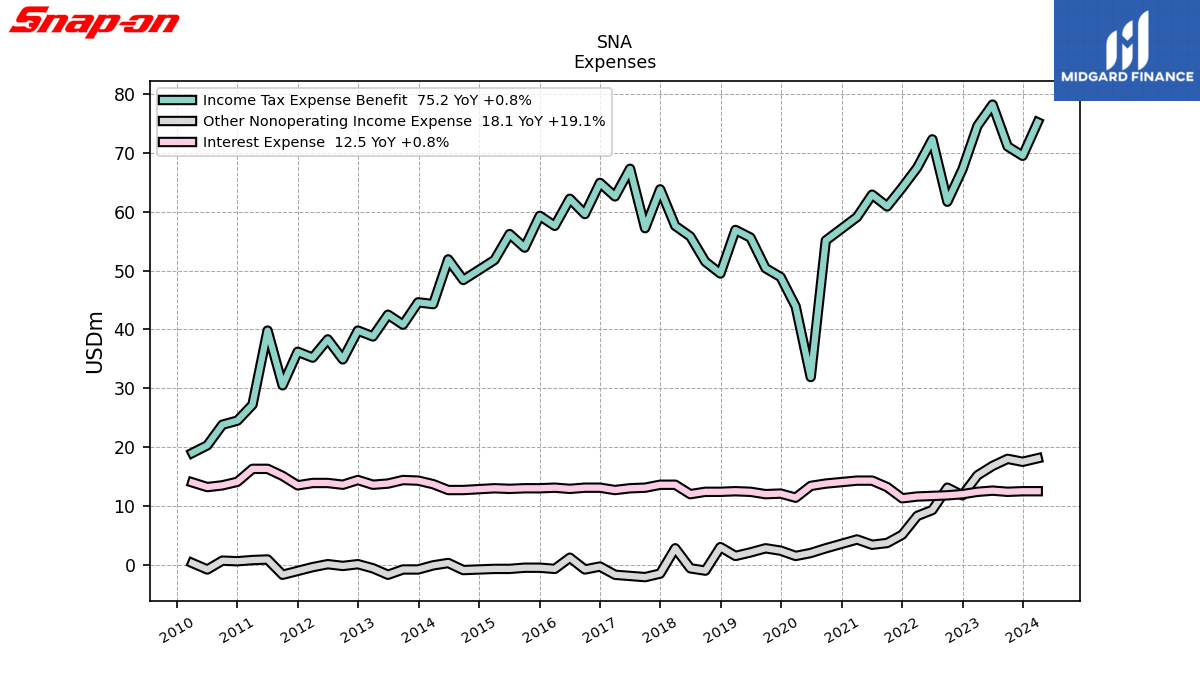
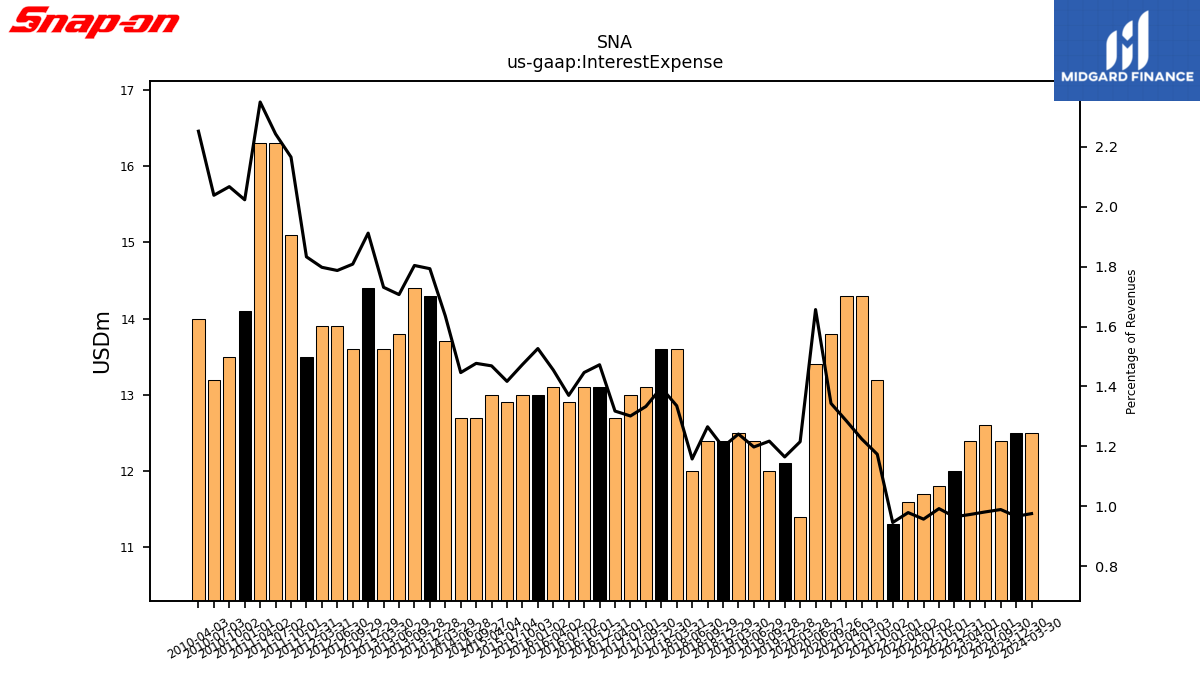
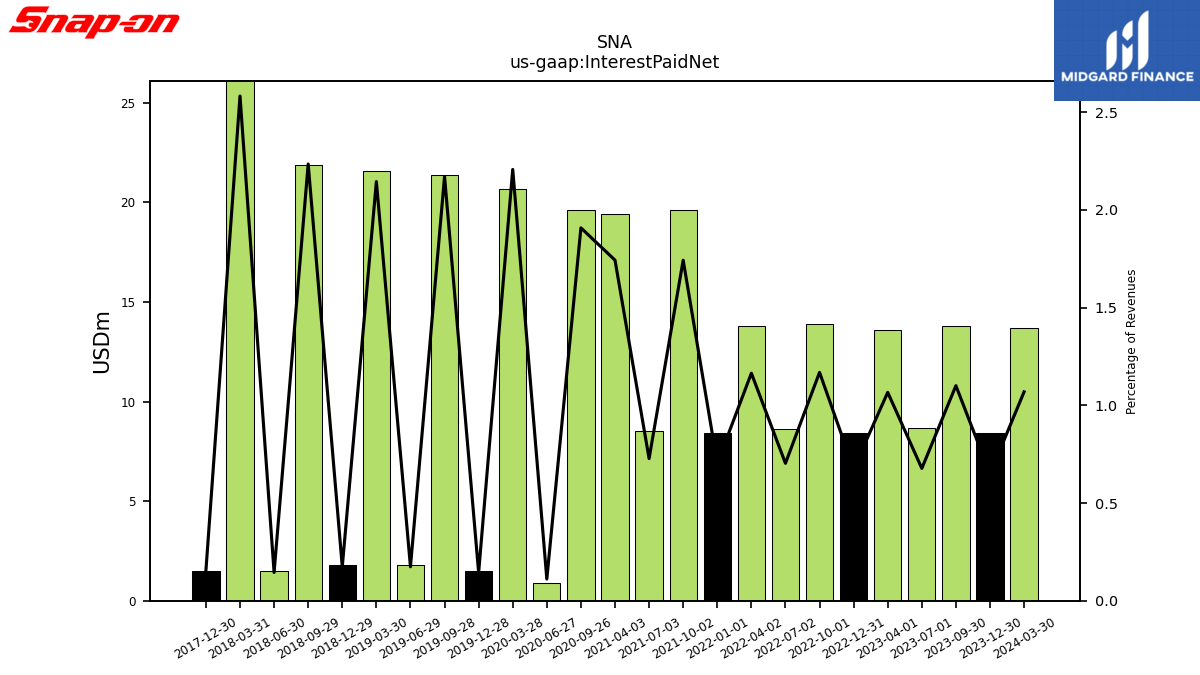
| Interest Expense | 12.50 | 12.50 | 12.40 | 12.60 | 12.40 | 12.00 | 11.80 | 11.70 | 11.60 | 11.30 | 13.20 | 14.30 | 14.30 | 13.80 | 13.40 | 11.40 | 12.10 | 12.00 | 12.40 | 12.50 | 12.40 | 12.40 | 12.00 | 13.60 | 13.60 | 13.10 | 13.00 | 12.70 | 13.10 | 13.10 | 12.90 | 13.10 | 13.00 | 13.00 | 12.90 | 13.00 | NA | 12.70 | 12.70 | 13.70 | 14.30 | 14.40 | 13.80 | 13.60 | 14.40 | 13.60 | 13.90 | 13.90 | 13.50 | 15.10 | 16.30 | 16.30 | 14.10 | 13.50 | 13.20 | 14.00 | |
| Interest Paid Net | 13.70 | 8.40 | 13.80 | 8.70 | 13.60 | 8.40 | 13.90 | 8.60 | 13.80 | 8.40 | 19.60 | 8.50 | 19.40 | 19.60 | 0.90 | 20.70 | 1.50 | 21.40 | 1.80 | 21.60 | 1.80 | 21.90 | 1.50 | 26.30 | 1.50 | NA | NA | NA | NA | NA | NA | NA | NA | NA | NA | NA | NA | NA | NA | NA | NA | NA | NA | NA | NA | NA | NA | NA | NA | NA | NA | NA | NA | NA | NA | NA | |
| Income Tax Expense Benefit | 75.20 | 69.50 | 71.10 | 78.20 | 74.60 | 67.20 | 61.70 | 72.30 | 67.50 | 64.10 | 60.90 | 62.90 | 59.10 | 55.10 | 31.90 | 43.90 | 48.90 | 50.40 | 55.60 | 56.90 | 49.50 | 51.50 | 55.80 | 57.60 | 63.80 | 57.20 | 67.30 | 62.60 | 64.90 | 59.60 | 62.20 | 57.60 | 59.30 | 53.90 | 56.20 | 51.80 | NA | 48.40 | 51.90 | 44.30 | 44.60 | 40.80 | 42.50 | 38.80 | 39.80 | 34.90 | 38.30 | 35.20 | 36.20 | 30.50 | 39.80 | 27.20 | 24.50 | 23.80 | 20.30 | 19.00 | |
| Income Taxes Paid Net | 14.70 | 76.40 | 76.80 | 134.40 | 13.30 | 73.80 | 58.20 | 111.20 | 18.00 | 61.80 | 60.60 | 110.70 | 15.90 | 104.50 | 12.30 | 15.10 | 50.70 | 48.30 | 73.80 | 18.40 | 39.90 | 50.70 | 86.00 | 11.40 | 59.80 | 68.50 | 85.80 | 14.00 | 71.60 | 69.20 | 88.80 | 17.70 | 67.70 | 57.80 | 45.70 | 20.70 | NA | 48.00 | 71.20 | 16.70 | 45.50 | 196.90 | -57.90 | -21.60 | -33.80 | -20.70 | -46.00 | 6.90 | 20.00 | -36.90 | 63.20 | 8.70 | 24.70 | 40.90 | 42.50 | 10.20 | |
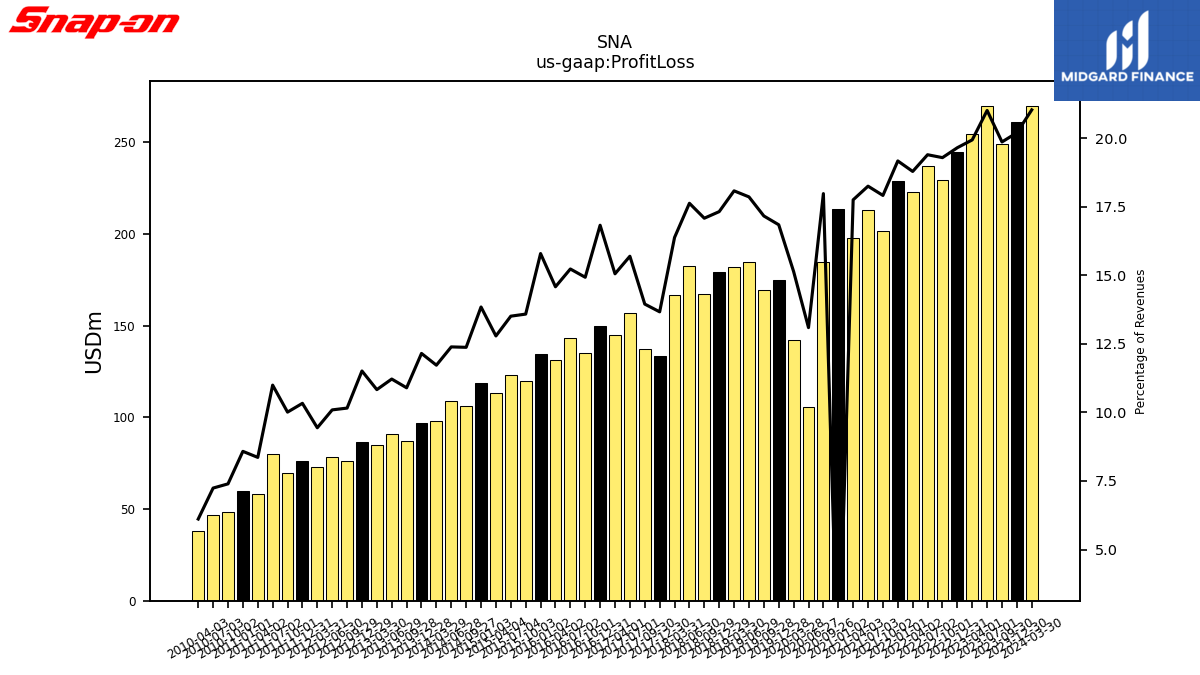
| Profit Loss | 269.60 | 261.30 | 249.10 | 269.90 | 254.30 | 244.50 | 229.50 | 237.20 | 222.70 | 229.10 | 201.50 | 213.20 | 197.60 | 184.70 | 105.90 | 142.00 | 175.00 | 169.20 | 184.90 | 182.10 | 179.30 | 167.40 | 182.70 | 166.80 | 133.20 | 137.10 | 156.80 | 145.10 | 149.70 | 135.20 | 143.40 | 131.30 | 134.50 | 119.90 | 123.00 | 113.20 | 118.70 | 106.40 | 108.80 | 98.20 | 96.90 | 87.00 | 90.70 | 85.10 | 86.70 | 76.40 | 78.50 | 73.00 | 76.10 | 69.80 | 79.90 | 58.00 | 59.80 | 48.30 | 46.90 | 38.00 | |
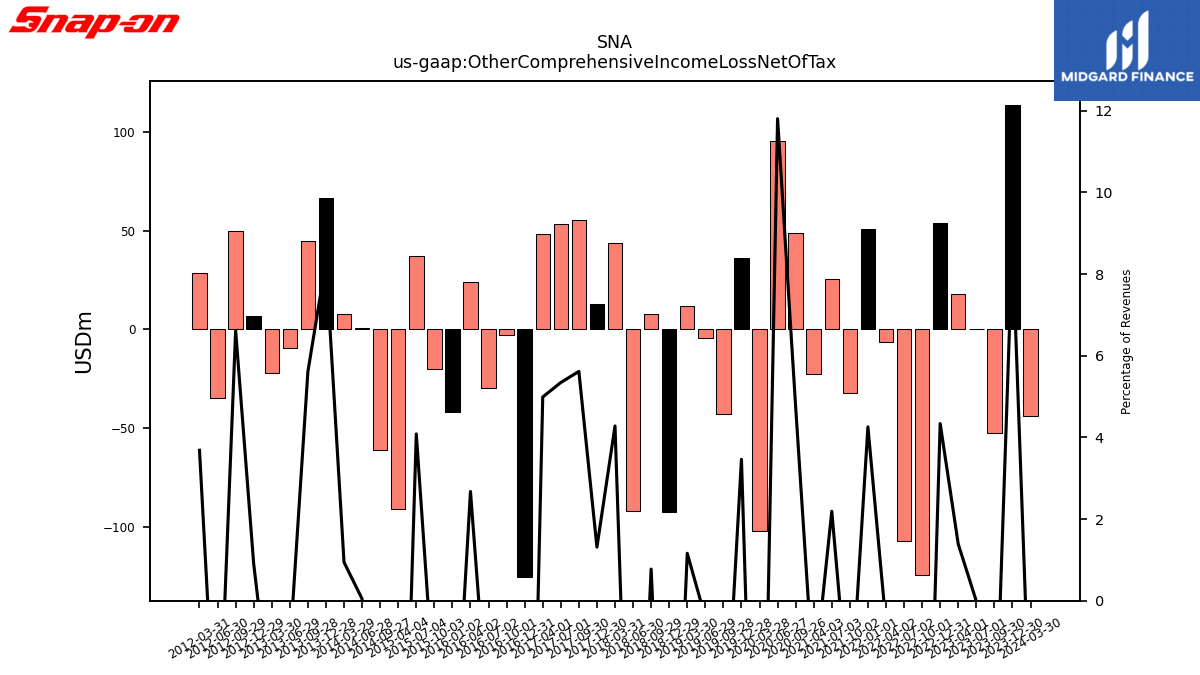
| Other Comprehensive Income Loss Net Of Tax | -43.80 | 113.80 | -52.60 | -0.10 | 17.70 | 54.00 | -124.60 | -107.10 | -6.70 | 50.90 | -32.10 | 25.60 | -22.50 | 48.80 | 95.50 | -102.00 | 36.00 | -43.20 | -4.30 | 11.70 | -92.50 | 7.60 | -91.90 | 43.60 | 12.80 | 55.20 | 53.40 | 48.10 | -125.60 | -3.10 | -29.70 | 24.10 | -42.00 | -20.20 | 37.20 | -91.00 | NA | -61.40 | 0.40 | 7.90 | 66.30 | 44.80 | -9.40 | -22.30 | 6.80 | 49.80 | -34.70 | 28.50 | NA | NA | NA | NA | NA | NA | NA | NA | |
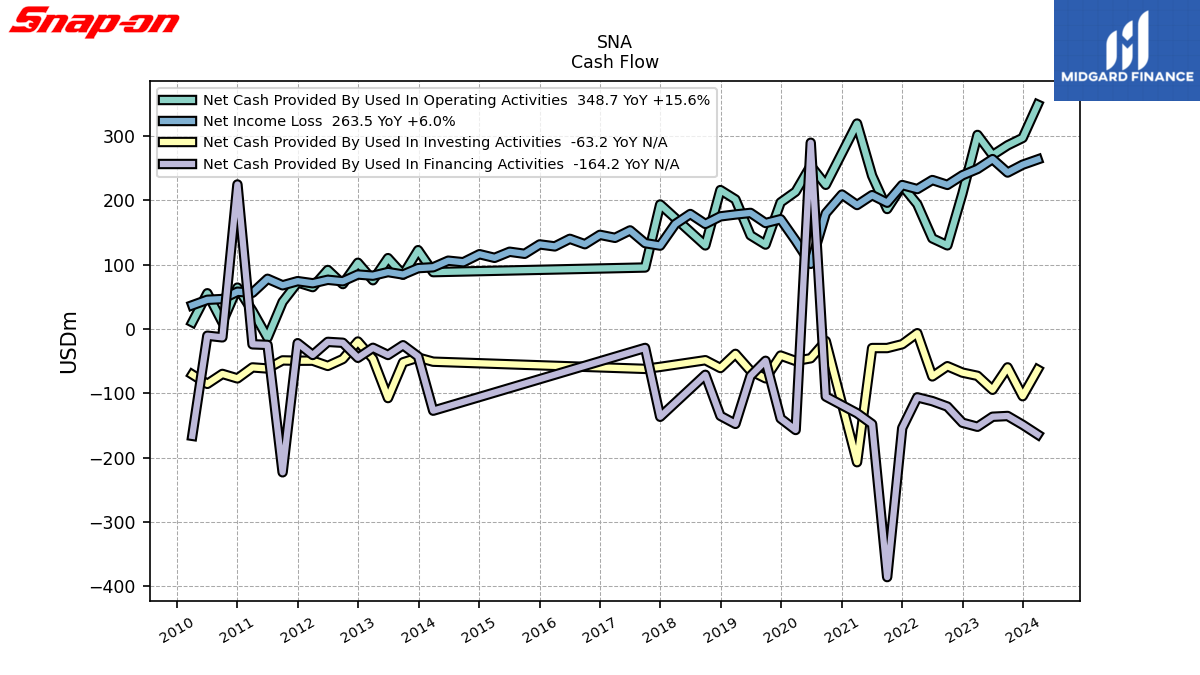
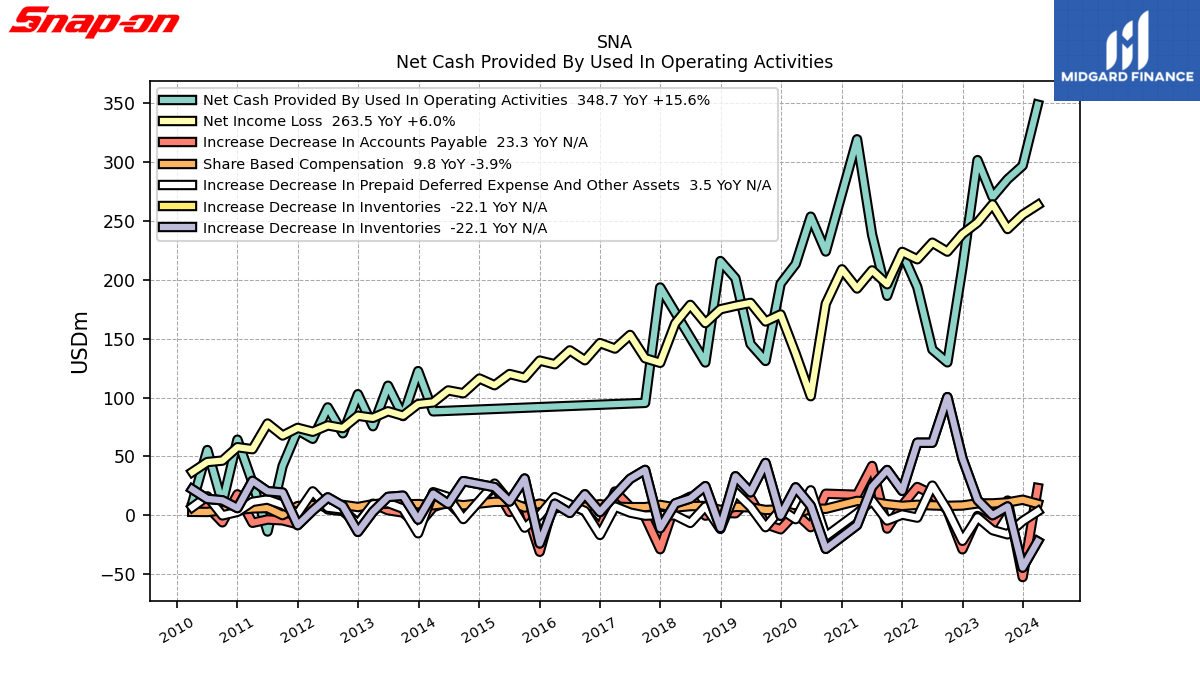
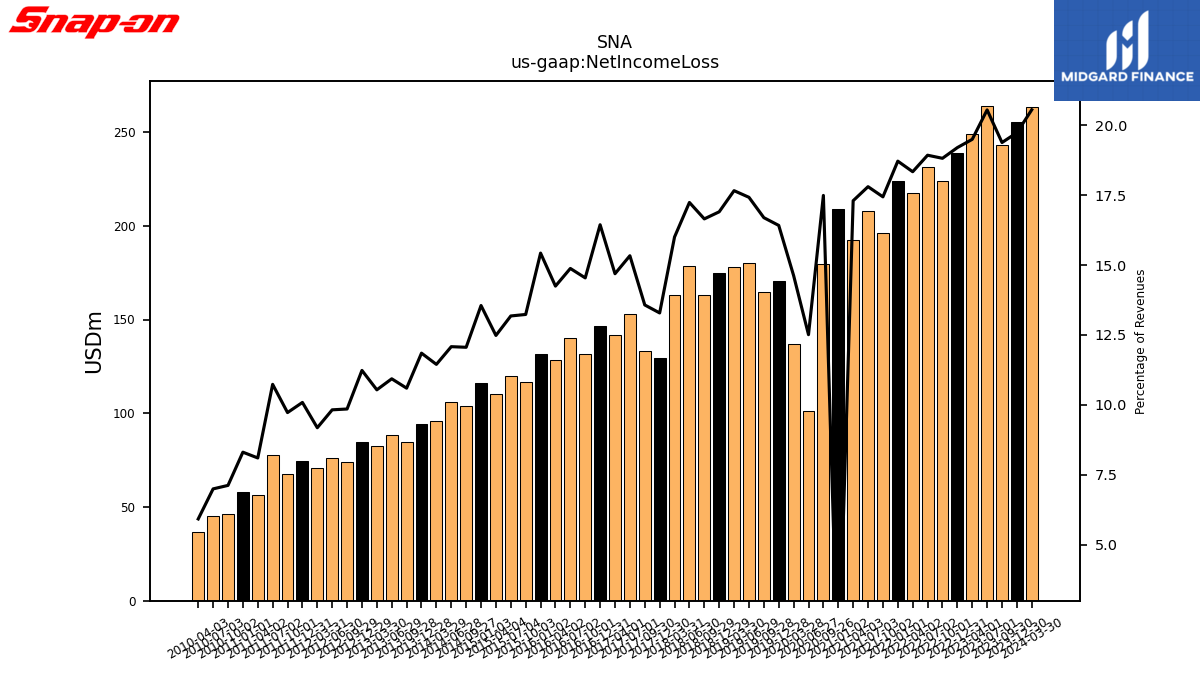
| Net Income Loss | 263.50 | 255.30 | 243.10 | 264.00 | 248.70 | 238.90 | 223.90 | 231.50 | 217.40 | 223.70 | 196.20 | 208.00 | 192.60 | 179.70 | 101.20 | 137.20 | 170.60 | 164.60 | 180.40 | 177.90 | 175.00 | 163.20 | 178.70 | 163.00 | 129.50 | 133.40 | 153.20 | 141.60 | 146.30 | 131.70 | 140.10 | 128.30 | 131.40 | 116.80 | 120.00 | 110.50 | 116.20 | 103.70 | 106.10 | 95.90 | 94.50 | 84.60 | 88.40 | 82.80 | 84.60 | 74.10 | 76.40 | 71.00 | 74.30 | 67.80 | 78.00 | 56.20 | 57.90 | 46.50 | 45.30 | 36.80 | |
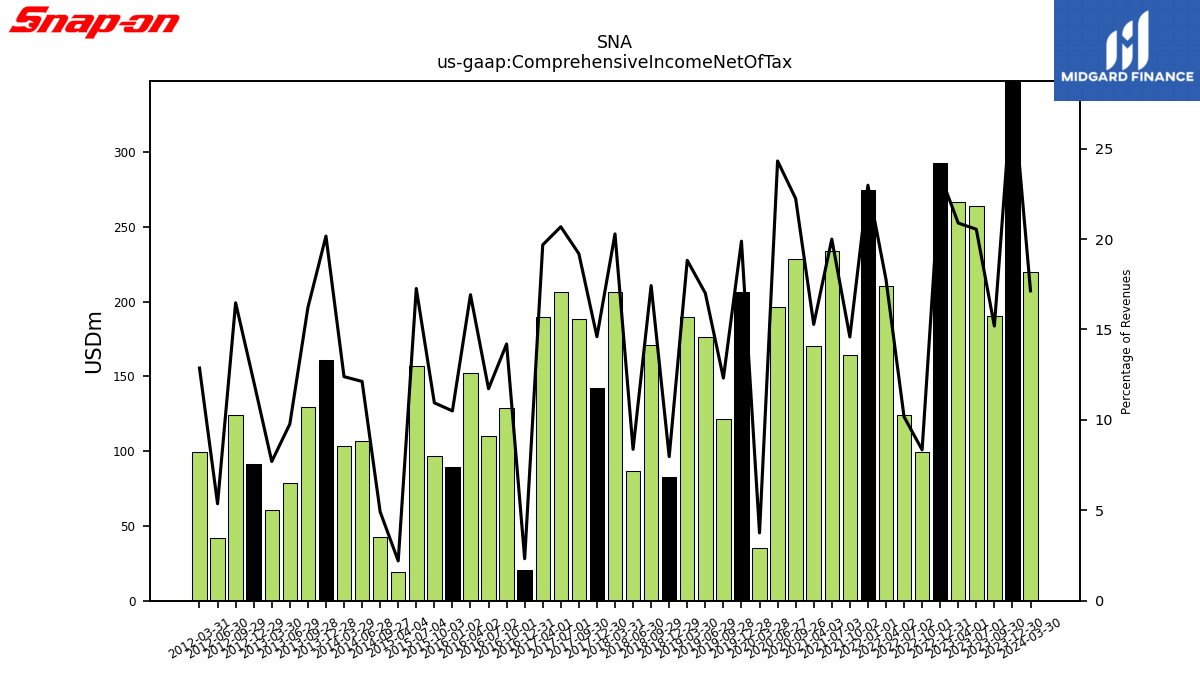
| Comprehensive Income Net Of Tax | 219.70 | 369.10 | 190.50 | 263.90 | 266.40 | 292.90 | 99.30 | 124.40 | 210.70 | 274.60 | 164.10 | 233.60 | 170.10 | 228.50 | 196.70 | 35.20 | 206.60 | 121.40 | 176.10 | 189.60 | 82.50 | 170.80 | 86.80 | 206.60 | 142.30 | 188.60 | 206.60 | 189.70 | 20.70 | 128.60 | 110.40 | 152.40 | 89.40 | 96.60 | 157.20 | 19.50 | NA | 42.30 | 106.50 | 103.80 | 160.80 | 129.40 | 79.00 | 60.50 | 91.40 | 123.90 | 41.70 | 99.50 | NA | NA | NA | NA | NA | NA | NA | NA |
| 2024-03-30 | 2023-12-30 | 2023-09-30 | 2023-07-01 | 2023-04-01 | 2022-12-31 | 2022-10-01 | 2022-07-02 | 2022-04-02 | 2022-01-01 | 2021-10-02 | 2021-07-03 | 2021-04-03 | 2020-09-26 | 2020-06-27 | 2020-03-28 | 2019-12-28 | 2019-09-28 | 2019-06-29 | 2019-03-30 | 2018-12-29 | 2018-09-29 | 2018-06-30 | 2018-03-31 | 2017-12-30 | 2017-09-30 | 2017-07-01 | 2017-04-01 | 2016-12-31 | 2016-10-01 | 2016-07-02 | 2016-04-02 | 2016-01-02 | 2015-10-03 | 2015-07-04 | 2015-04-04 | 2015-01-03 | 2014-09-27 | 2014-06-28 | 2014-03-29 | 2013-12-28 | 2013-09-28 | 2013-06-29 | 2013-03-30 | 2012-12-29 | 2012-09-29 | 2012-06-30 | 2012-03-31 | 2011-12-31 | 2011-10-01 | 2011-07-02 | 2011-04-02 | 2011-01-01 | 2010-10-02 | 2010-07-03 | 2010-04-03 | ||
|---|---|---|---|---|---|---|---|---|---|---|---|---|---|---|---|---|---|---|---|---|---|---|---|---|---|---|---|---|---|---|---|---|---|---|---|---|---|---|---|---|---|---|---|---|---|---|---|---|---|---|---|---|---|---|---|---|---|
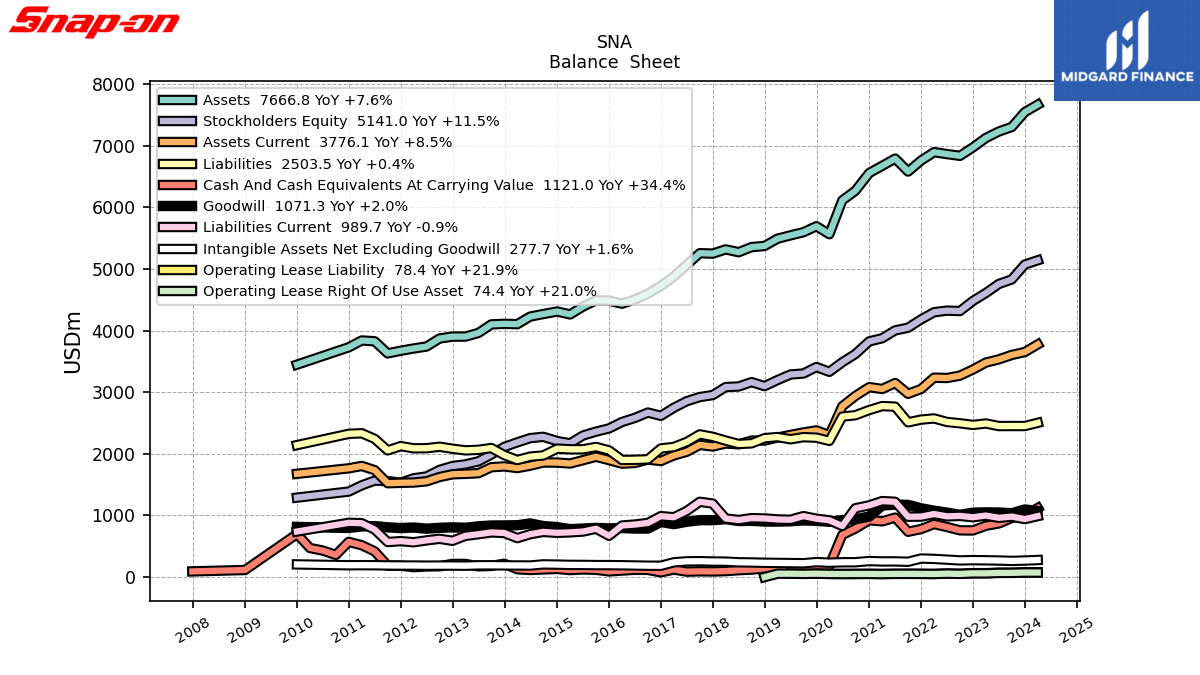
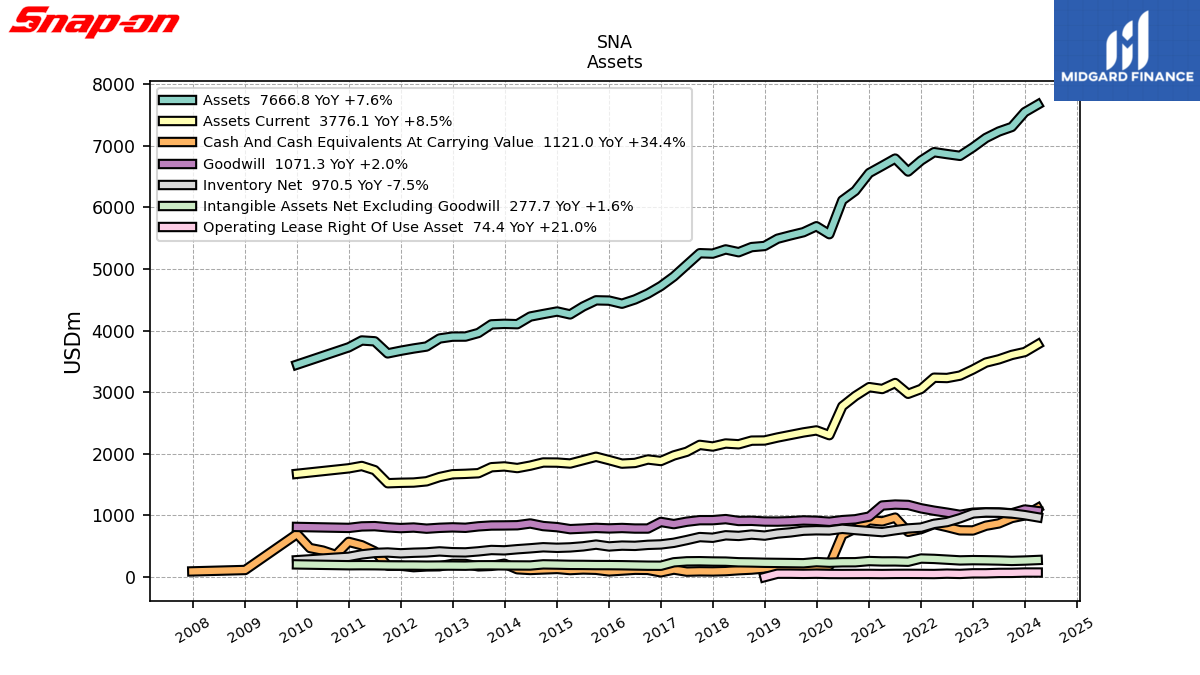
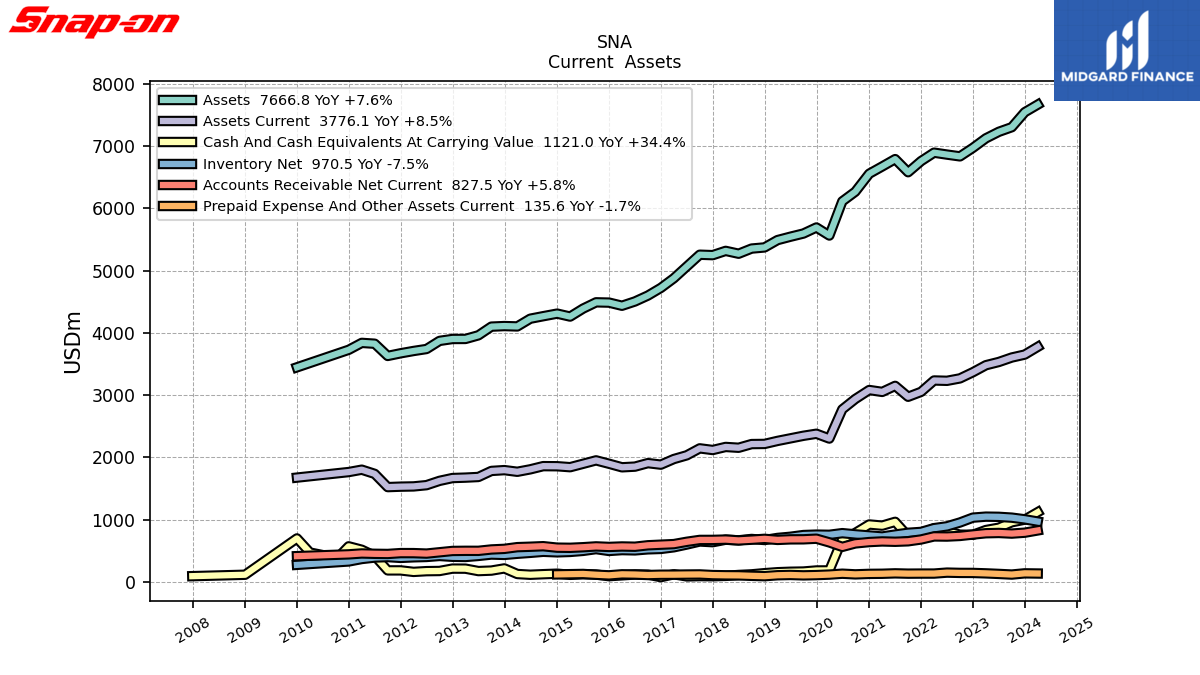
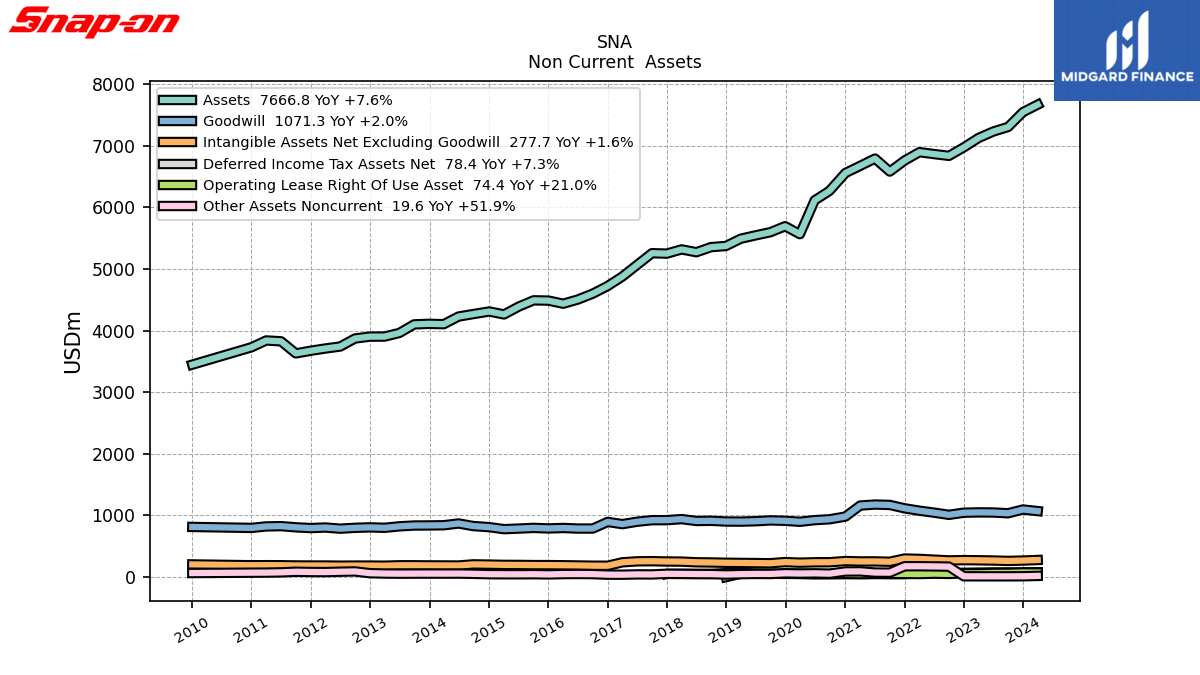
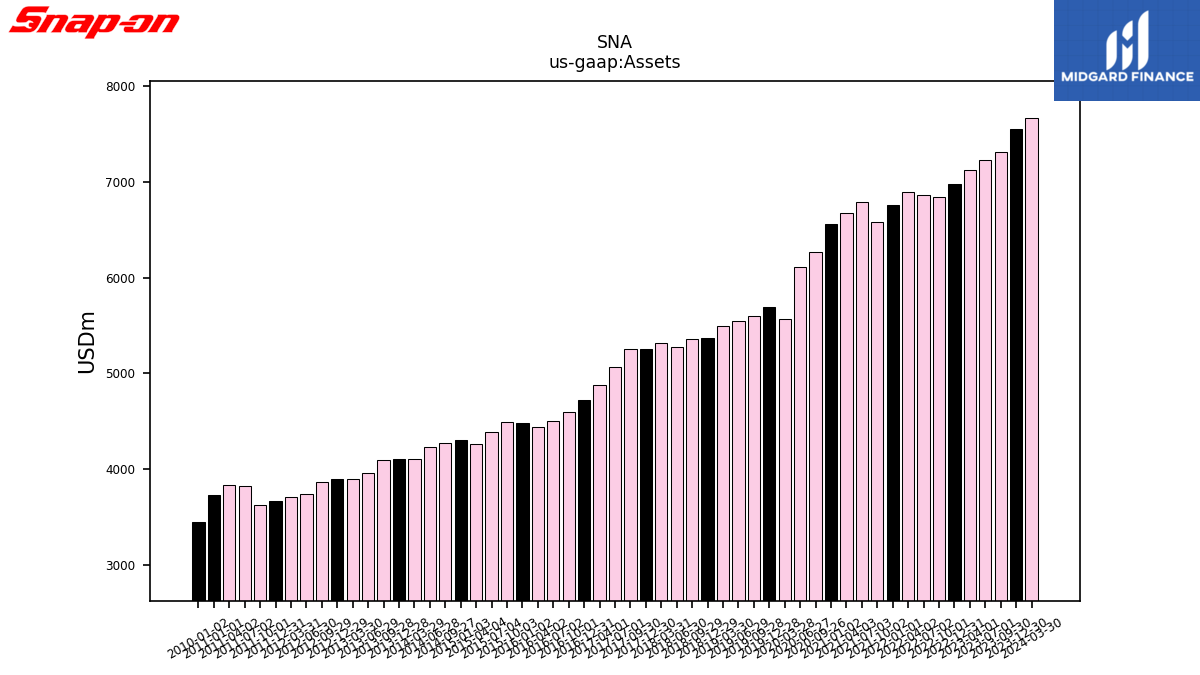
| Assets | 7666.80 | 7544.90 | 7304.30 | 7230.40 | 7125.60 | 6972.80 | 6835.50 | 6864.30 | 6895.20 | 6759.70 | 6580.90 | 6791.60 | 6673.50 | 6267.60 | 6113.50 | 5564.30 | 5693.50 | 5596.40 | 5545.40 | 5490.90 | 5373.10 | 5354.80 | 5272.00 | 5317.60 | 5249.10 | 5256.20 | 5067.10 | 4877.80 | 4723.20 | 4600.10 | 4505.10 | 4436.40 | 4486.90 | 4491.40 | 4390.70 | 4262.40 | 4310.10 | 4268.50 | 4228.30 | 4104.10 | 4110.00 | 4101.00 | 3961.50 | 3903.20 | 3902.30 | 3871.90 | 3741.70 | 3709.90 | 3672.90 | 3630.10 | 3826.50 | 3840.00 | 3729.40 | NA | NA | NA | |
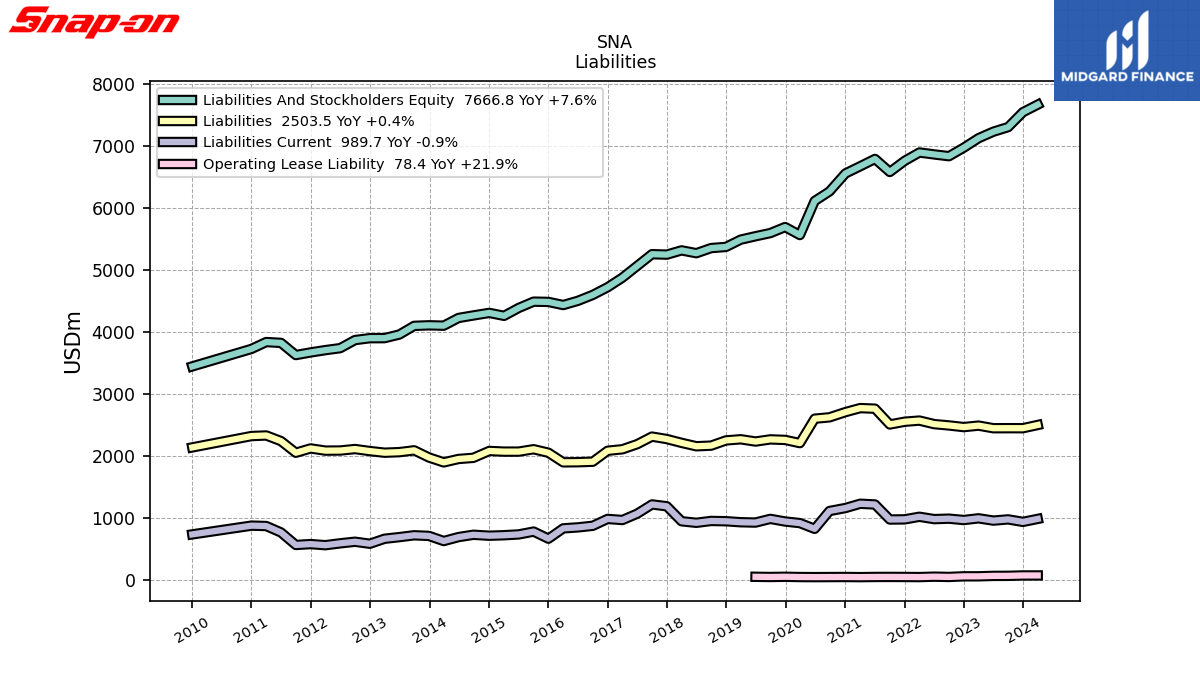
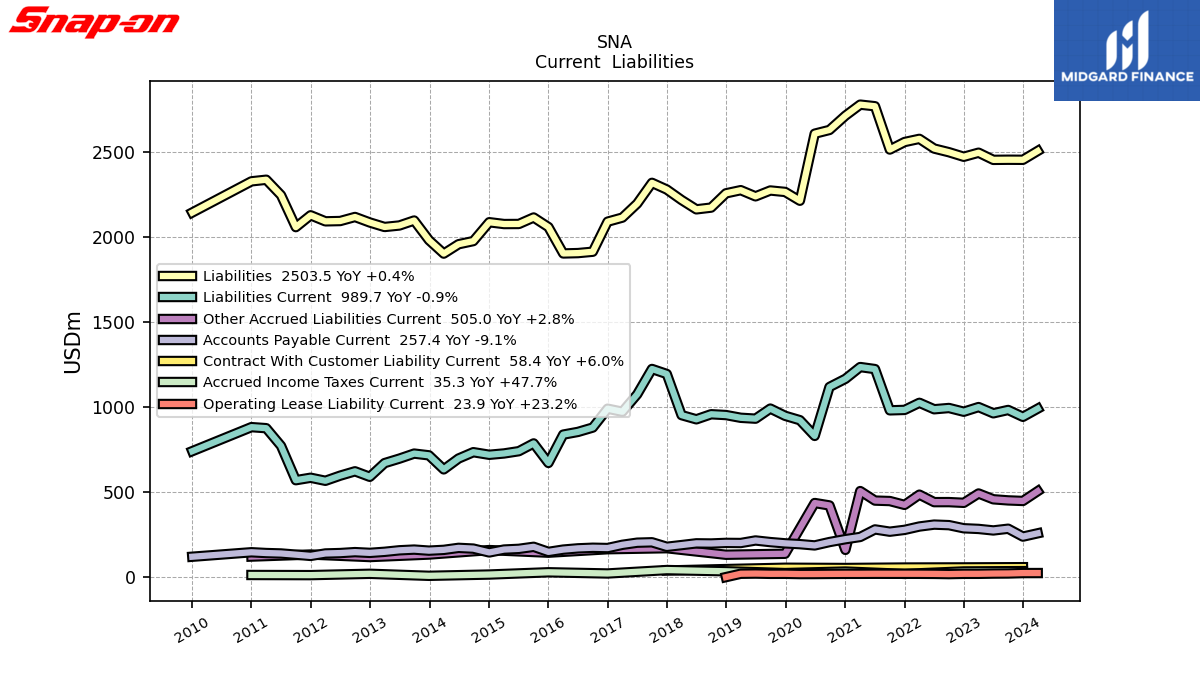
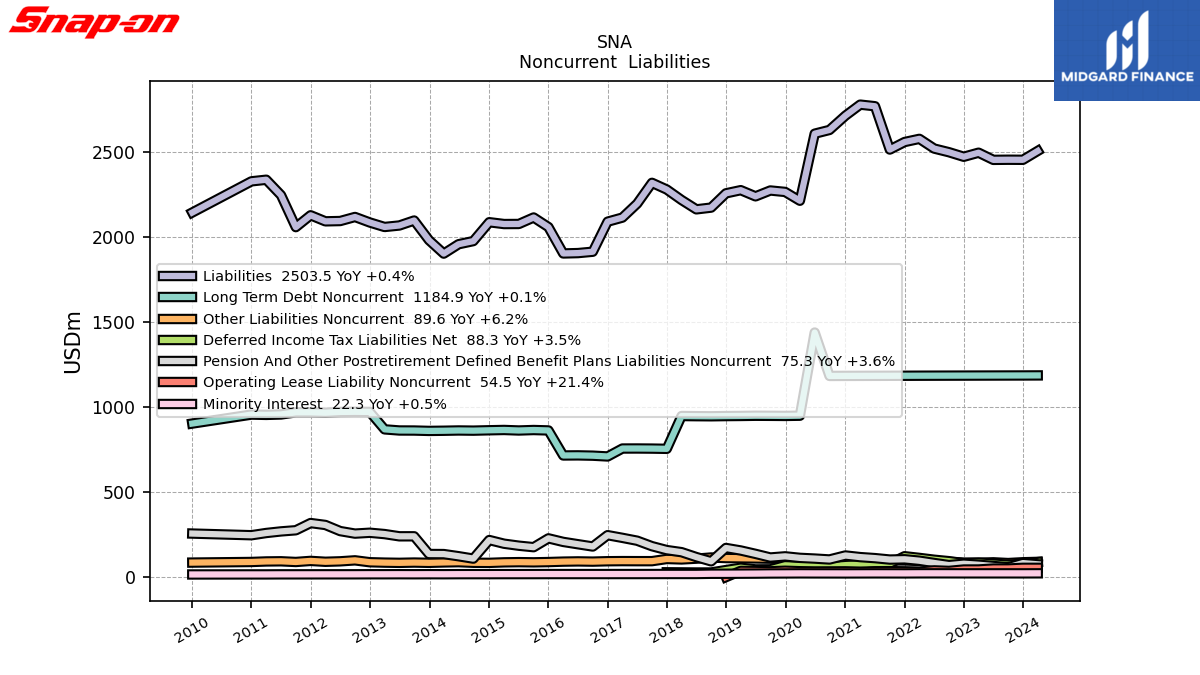
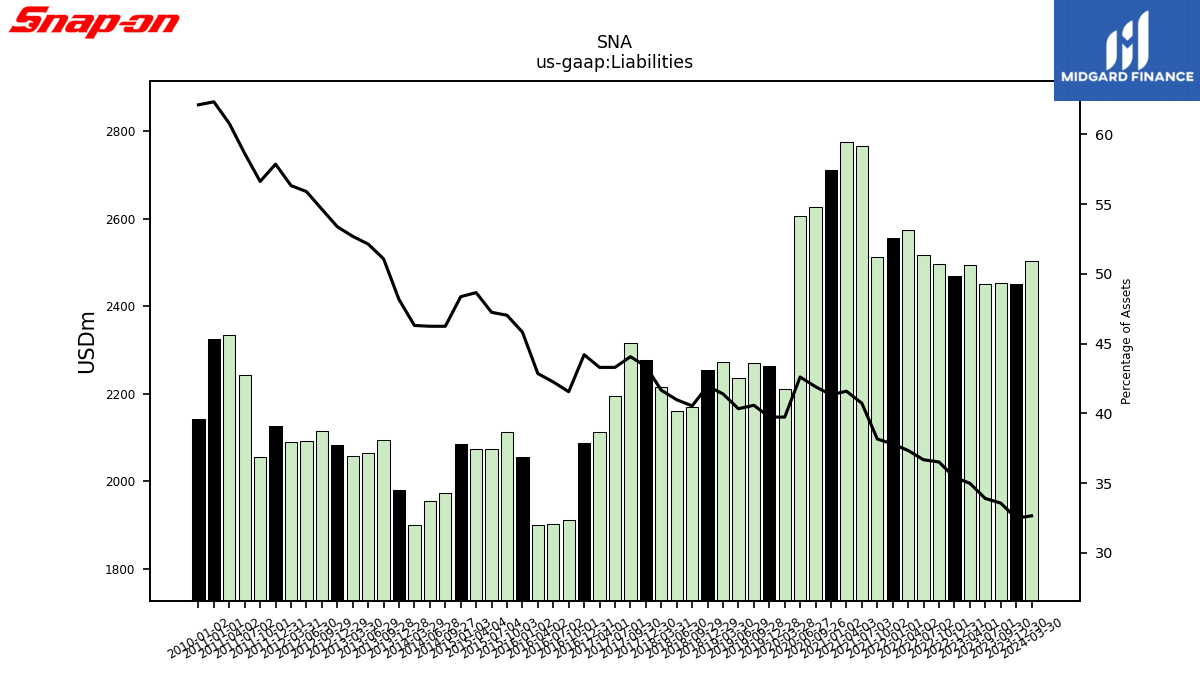
| Liabilities | 2503.50 | 2451.50 | 2451.90 | 2451.10 | 2493.20 | 2469.30 | 2496.00 | 2517.50 | 2574.60 | 2555.90 | 2511.60 | 2766.10 | 2775.60 | 2626.80 | 2604.90 | 2210.90 | 2262.70 | 2271.20 | 2236.70 | 2273.10 | 2254.50 | 2170.70 | 2160.40 | 2215.30 | 2276.80 | 2316.20 | 2194.10 | 2112.00 | 2088.00 | 1911.50 | 1903.50 | 1901.30 | 2056.20 | 2112.60 | 2074.50 | 2074.10 | 2084.80 | 1974.00 | 1955.50 | 1900.40 | 1979.60 | 2094.90 | 2065.60 | 2056.80 | 2083.30 | 2115.60 | 2091.80 | 2090.00 | 2125.60 | 2055.90 | 2243.60 | 2334.40 | 2325.00 | NA | NA | NA | |
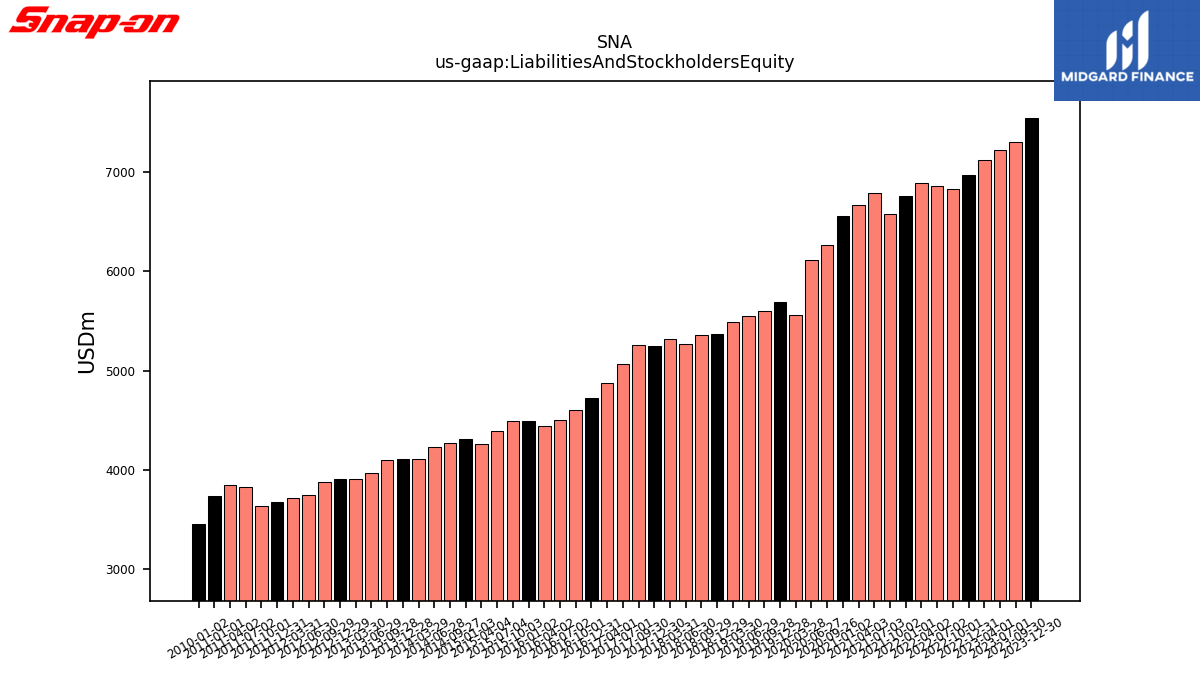
| Liabilities And Stockholders Equity | 7666.80 | 7544.90 | 7304.30 | 7230.40 | 7125.60 | 6972.80 | 6835.50 | 6864.30 | 6895.20 | 6759.70 | 6580.90 | 6791.60 | 6673.50 | 6267.60 | 6113.50 | 5564.30 | 5693.50 | 5596.40 | 5545.40 | 5490.90 | 5373.10 | 5354.80 | 5272.00 | 5317.60 | 5249.10 | 5256.20 | 5067.10 | 4877.80 | 4723.20 | 4600.10 | 4505.10 | 4436.40 | 4486.90 | 4491.40 | 4390.70 | 4262.40 | 4310.10 | 4268.50 | 4228.30 | 4104.10 | 4110.00 | 4101.00 | 3961.50 | 3903.20 | 3902.30 | 3871.90 | 3741.70 | 3709.90 | 3672.90 | 3630.10 | 3826.50 | 3840.00 | 3729.40 | NA | NA | NA | |
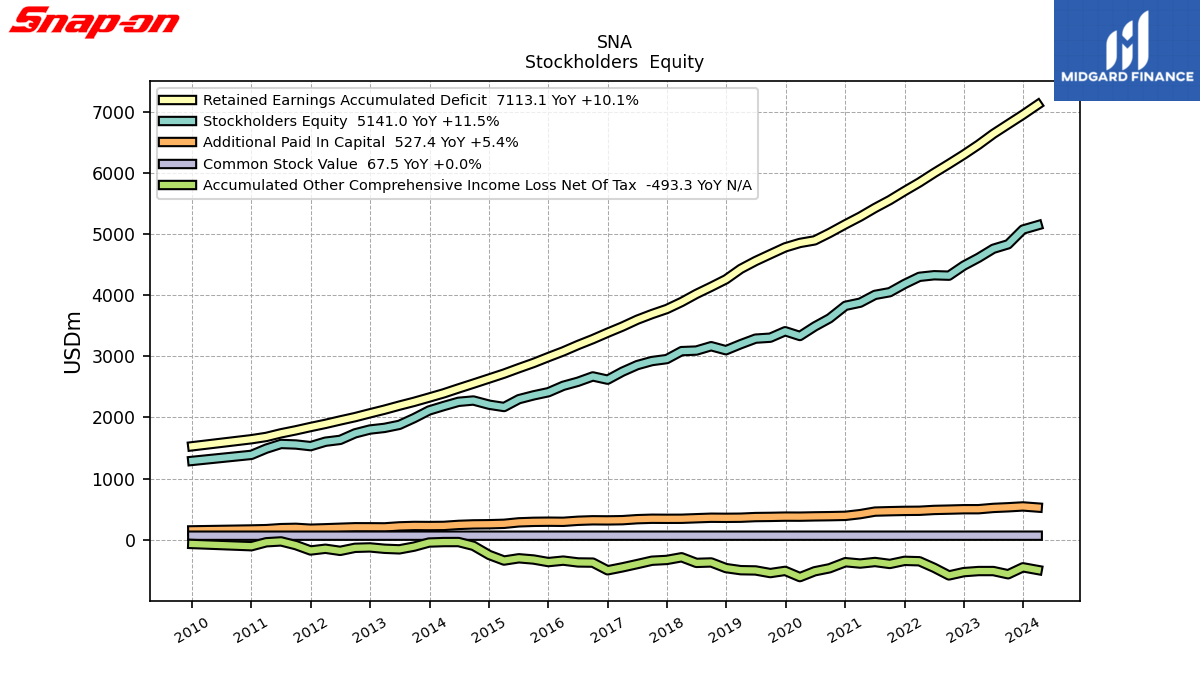
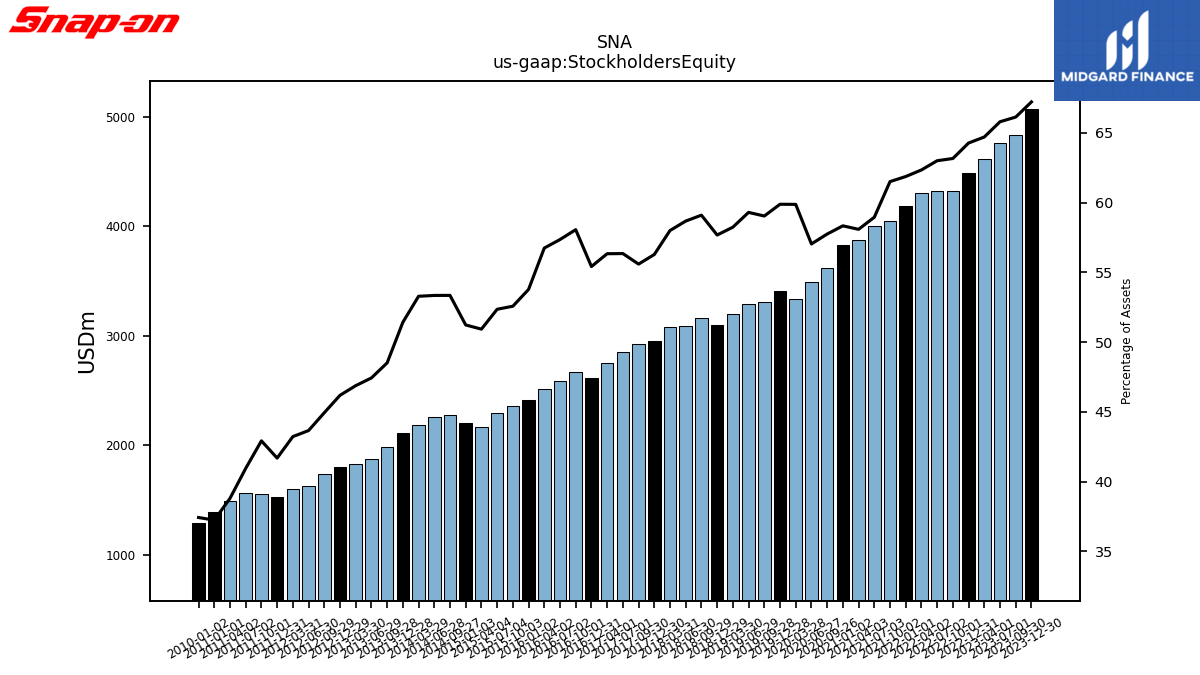
| Stockholders Equity | 5141.00 | 5071.30 | 4830.20 | 4757.10 | 4610.20 | 4481.30 | 4317.20 | 4324.40 | 4298.30 | 4181.90 | 4047.30 | 4003.40 | 3876.00 | 3619.00 | 3486.70 | 3331.30 | 3409.10 | 3303.80 | 3288.10 | 3197.60 | 3098.80 | 3164.40 | 3093.20 | 3083.90 | 2953.90 | 2921.80 | 2854.90 | 2747.70 | 2617.20 | 2670.60 | 2583.60 | 2517.10 | 2412.70 | 2361.00 | 2298.50 | 2170.60 | 2207.80 | 2277.00 | 2255.40 | 2186.70 | 2113.20 | 1989.20 | 1878.80 | 1829.50 | 1802.10 | 1739.70 | 1633.40 | 1603.40 | 1530.90 | 1557.90 | 1566.60 | 1489.70 | 1388.50 | NA | NA | NA |
| 2024-03-30 | 2023-12-30 | 2023-09-30 | 2023-07-01 | 2023-04-01 | 2022-12-31 | 2022-10-01 | 2022-07-02 | 2022-04-02 | 2022-01-01 | 2021-10-02 | 2021-07-03 | 2021-04-03 | 2020-09-26 | 2020-06-27 | 2020-03-28 | 2019-12-28 | 2019-09-28 | 2019-06-29 | 2019-03-30 | 2018-12-29 | 2018-09-29 | 2018-06-30 | 2018-03-31 | 2017-12-30 | 2017-09-30 | 2017-07-01 | 2017-04-01 | 2016-12-31 | 2016-10-01 | 2016-07-02 | 2016-04-02 | 2016-01-02 | 2015-10-03 | 2015-07-04 | 2015-04-04 | 2015-01-03 | 2014-09-27 | 2014-06-28 | 2014-03-29 | 2013-12-28 | 2013-09-28 | 2013-06-29 | 2013-03-30 | 2012-12-29 | 2012-09-29 | 2012-06-30 | 2012-03-31 | 2011-12-31 | 2011-10-01 | 2011-07-02 | 2011-04-02 | 2011-01-01 | 2010-10-02 | 2010-07-03 | 2010-04-03 | ||
|---|---|---|---|---|---|---|---|---|---|---|---|---|---|---|---|---|---|---|---|---|---|---|---|---|---|---|---|---|---|---|---|---|---|---|---|---|---|---|---|---|---|---|---|---|---|---|---|---|---|---|---|---|---|---|---|---|---|
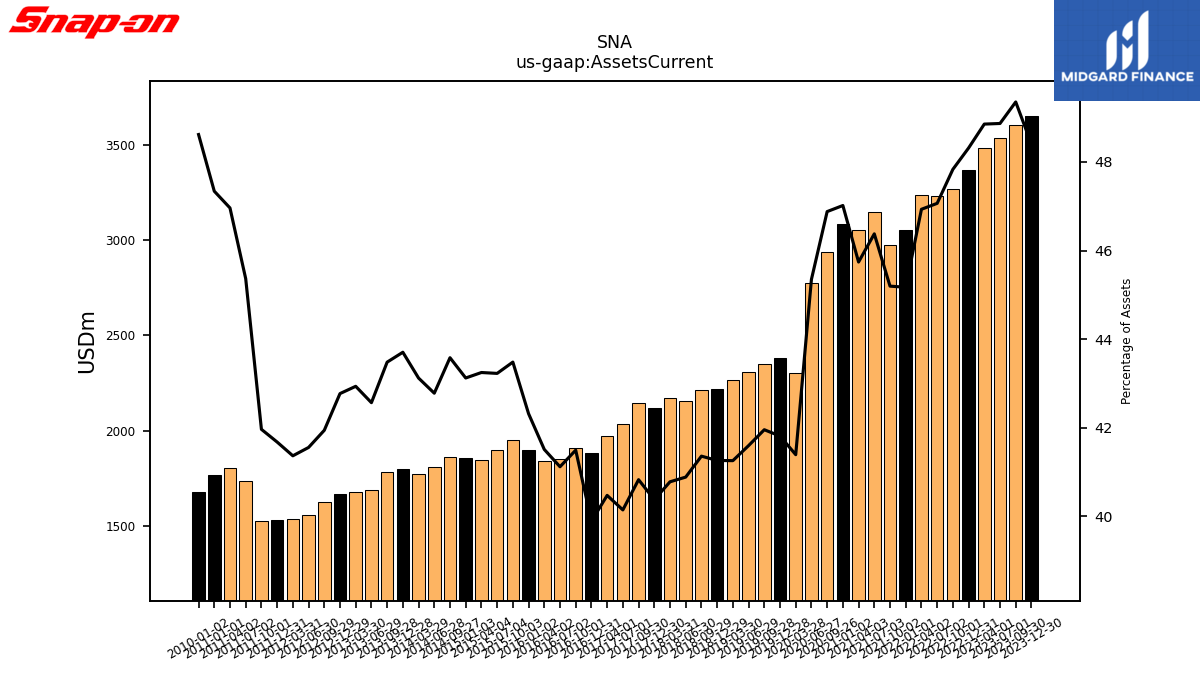
| Assets Current | 3776.10 | 3652.00 | 3605.00 | 3533.40 | 3481.20 | 3368.90 | 3269.60 | 3230.70 | 3236.00 | 3053.40 | 2974.30 | 3149.70 | 3052.50 | 2938.20 | 2772.40 | 2303.10 | 2380.50 | 2347.90 | 2306.60 | 2265.30 | 2216.90 | 2214.60 | 2155.40 | 2168.40 | 2119.30 | 2145.90 | 2034.10 | 1974.10 | 1884.00 | 1908.70 | 1852.40 | 1841.50 | 1898.70 | 1952.90 | 1897.90 | 1843.30 | 1858.60 | 1860.20 | 1808.80 | 1769.70 | 1796.20 | 1783.10 | 1686.20 | 1675.80 | 1669.00 | 1623.90 | 1554.80 | 1534.60 | 1530.70 | 1523.30 | 1735.90 | 1803.30 | 1765.50 | NA | NA | NA | |
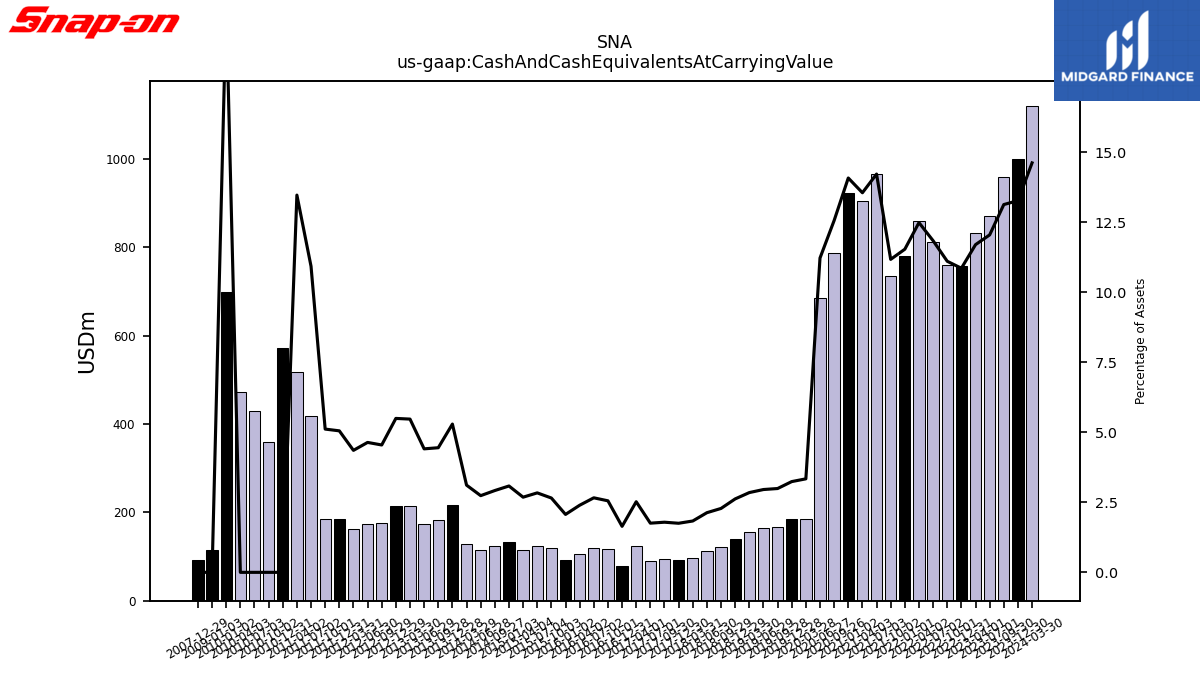
| Cash And Cash Equivalents At Carrying Value | 1121.00 | 1001.50 | 959.30 | 871.30 | 833.80 | 757.20 | 759.30 | 812.90 | 861.10 | 780.00 | 735.50 | 965.90 | 904.60 | 787.50 | 686.20 | 185.80 | 184.50 | 167.50 | 164.00 | 156.40 | 140.90 | 122.20 | 112.30 | 97.50 | 92.00 | 94.10 | 89.00 | 123.00 | 77.60 | 117.50 | 119.90 | 106.30 | 92.80 | 119.20 | 124.60 | 114.40 | 132.90 | 124.70 | 115.80 | 127.80 | 217.60 | 182.50 | 174.70 | 213.60 | 214.50 | 176.10 | 173.60 | 161.60 | 185.60 | 185.70 | 418.20 | 517.30 | NA | 359.90 | 430.80 | 472.30 | |
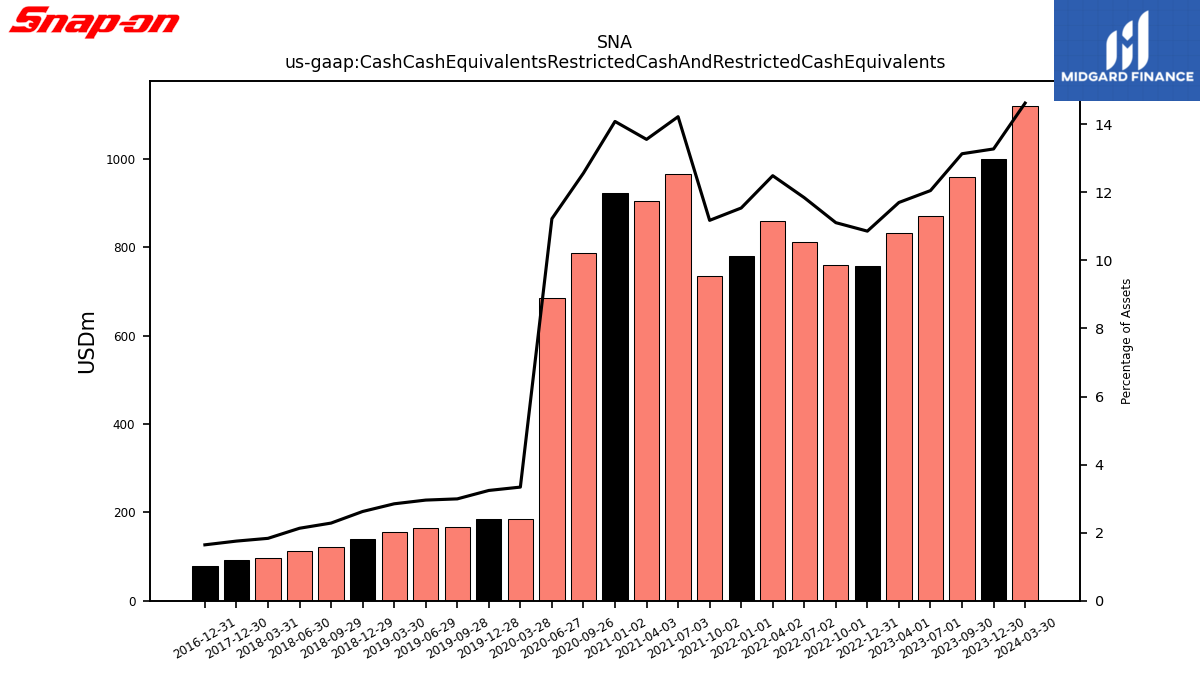
| Cash Cash Equivalents Restricted Cash And Restricted Cash Equivalents | 1121.00 | 1001.50 | 959.30 | 871.30 | 833.80 | 757.20 | 759.30 | 812.90 | 861.10 | 780.00 | 735.50 | 965.90 | 904.60 | 787.50 | 686.20 | 185.80 | 184.50 | 167.50 | 164.00 | 156.40 | 140.90 | 122.20 | 112.30 | 97.50 | 92.00 | NA | NA | NA | 77.60 | NA | NA | NA | NA | NA | NA | NA | NA | NA | NA | NA | NA | NA | NA | NA | NA | NA | NA | NA | NA | NA | NA | NA | NA | NA | NA | NA | |
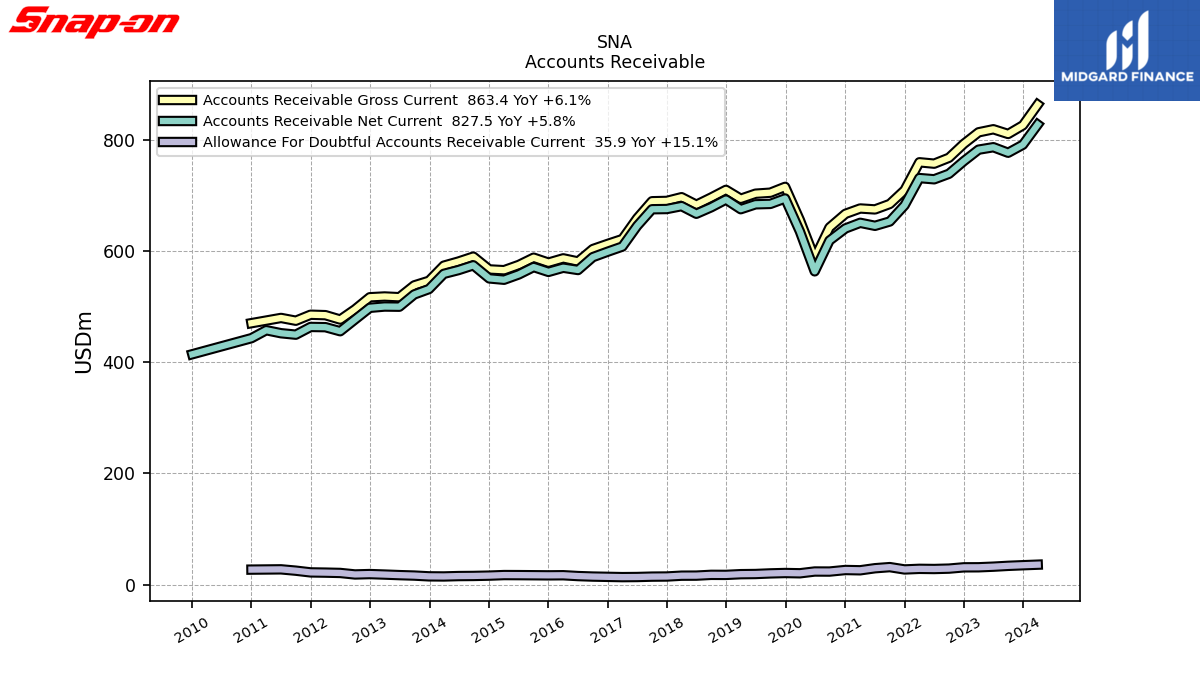
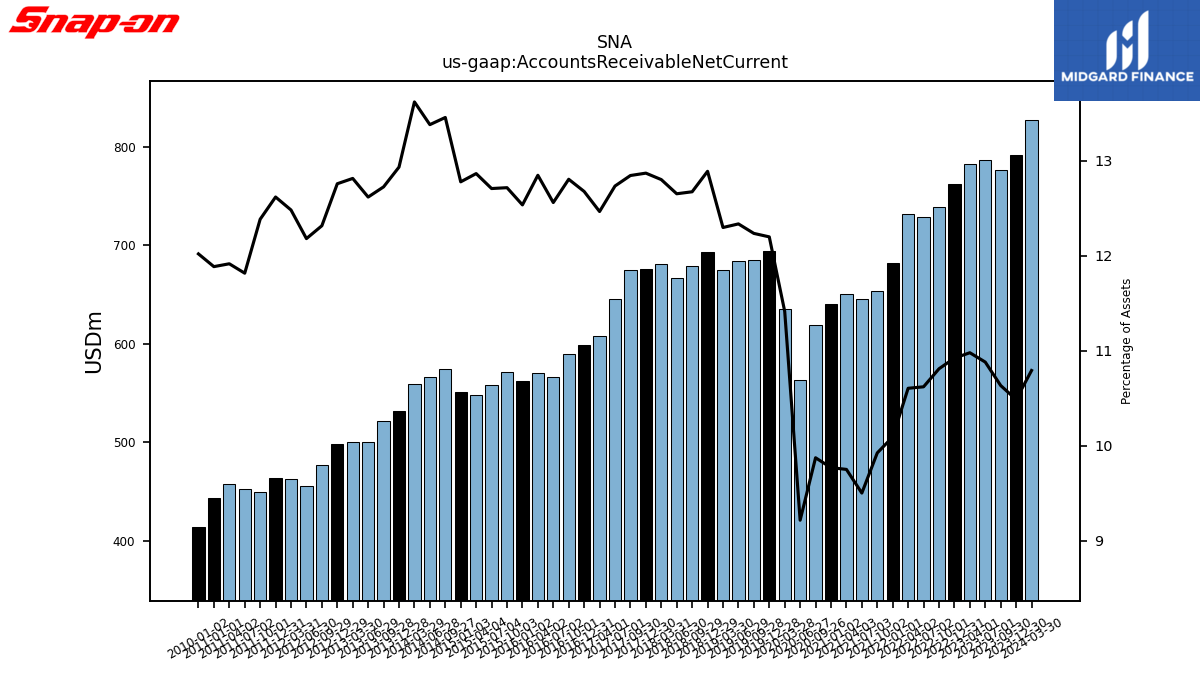
| Accounts Receivable Net Current | 827.50 | 791.30 | 776.80 | 786.80 | 782.40 | 761.70 | 739.00 | 729.10 | 731.30 | 682.30 | 653.20 | 645.40 | 650.80 | 618.90 | 563.50 | 635.20 | 694.60 | 684.80 | 684.10 | 675.30 | 692.60 | 678.70 | 667.10 | 680.80 | 675.60 | 675.20 | 645.30 | 608.10 | 598.80 | 589.10 | 565.90 | 570.00 | 562.50 | 571.20 | 558.00 | 548.40 | 550.80 | 574.40 | 565.80 | 559.00 | 531.60 | 521.90 | 499.90 | 500.20 | 497.90 | 476.90 | 455.80 | 463.10 | 463.50 | 449.60 | 452.20 | 457.60 | 443.30 | NA | NA | NA | |
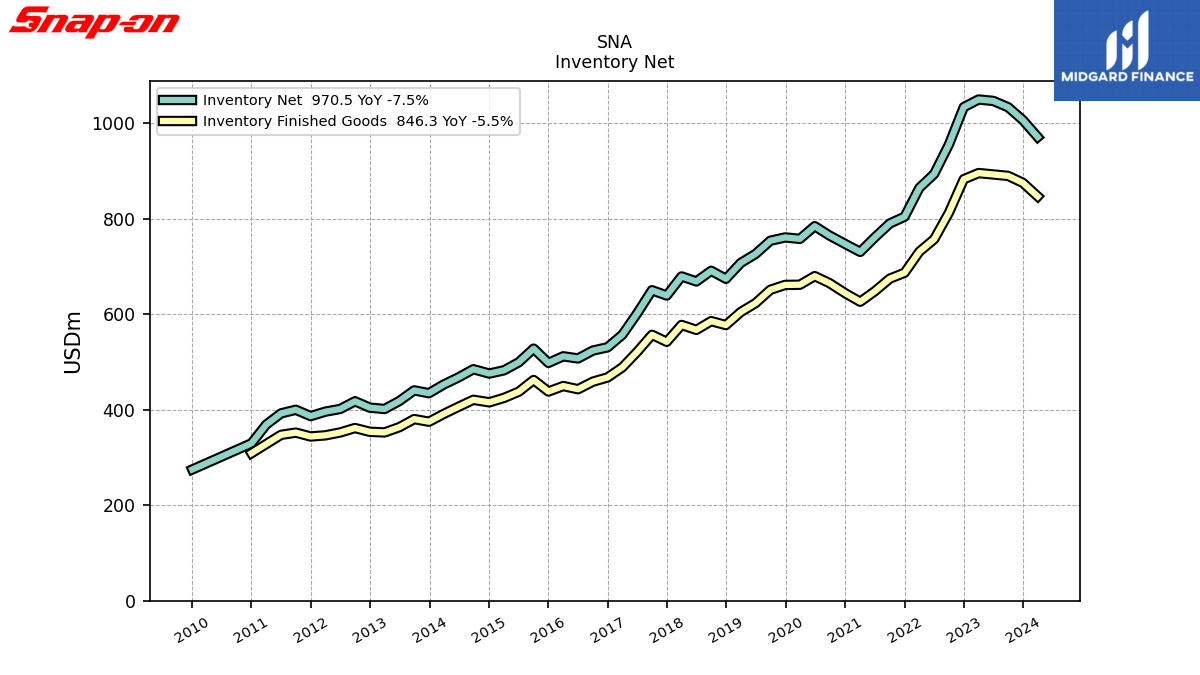
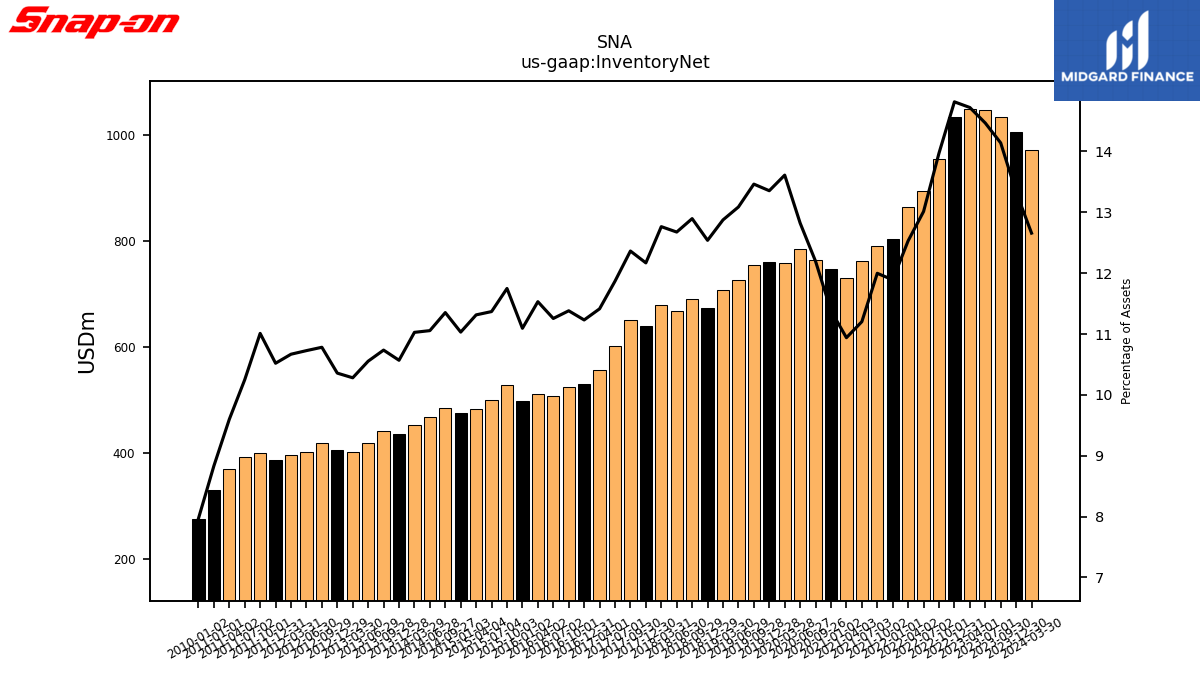
| Inventory Net | 970.50 | 1005.90 | 1032.90 | 1046.10 | 1049.10 | 1033.10 | 955.10 | 893.30 | 864.10 | 803.80 | 789.60 | 760.90 | 730.10 | 764.40 | 784.00 | 757.40 | 760.40 | 753.50 | 725.80 | 707.00 | 673.80 | 690.60 | 668.30 | 678.80 | 638.80 | 649.90 | 601.40 | 556.80 | 530.50 | 523.60 | 507.10 | 511.60 | 497.80 | 527.70 | 499.20 | 482.30 | 475.50 | 484.60 | 467.50 | 452.60 | 434.40 | 440.30 | 418.10 | 401.30 | 404.20 | 417.50 | 401.40 | 395.80 | 386.40 | 399.70 | 392.20 | 368.60 | 329.40 | NA | NA | NA | |
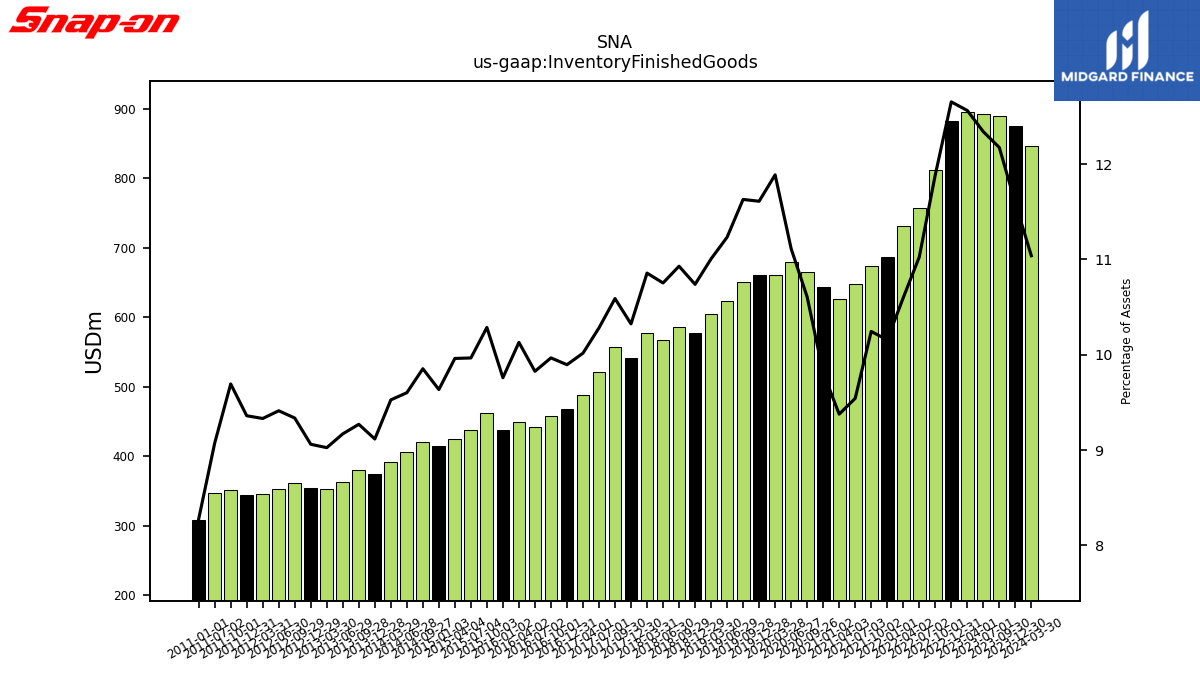
| Inventory Finished Goods | 846.30 | 874.60 | 889.20 | 892.20 | 895.10 | 882.20 | 812.40 | 756.70 | 730.70 | 686.50 | 674.20 | 648.10 | 625.80 | 664.80 | 679.40 | 661.40 | 661.00 | 650.80 | 622.90 | 604.30 | 577.00 | 585.20 | 566.90 | 577.30 | 541.90 | 556.60 | 521.00 | 488.60 | 467.40 | 458.50 | 442.70 | 449.40 | 437.90 | 462.00 | 437.60 | 424.60 | 415.30 | 420.60 | 406.00 | 391.00 | 374.70 | 380.20 | 363.30 | 352.30 | 353.60 | 361.50 | 352.20 | 346.20 | 343.80 | 351.90 | 347.20 | NA | 308.70 | NA | NA | NA | |
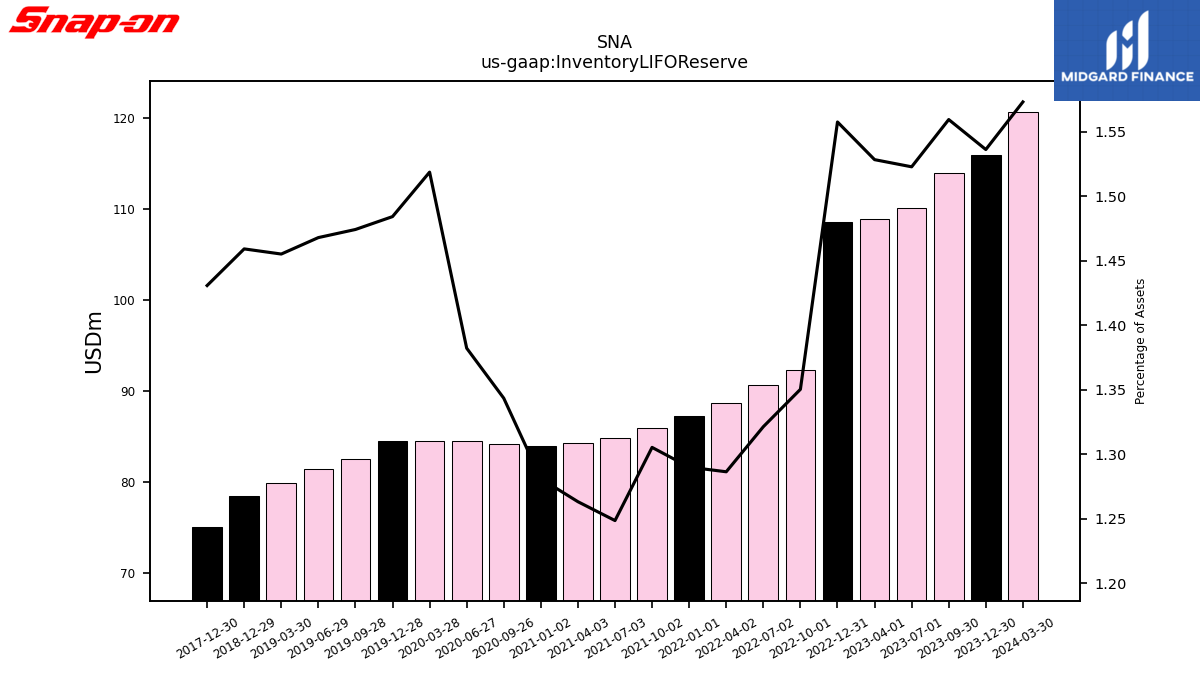
| Inventory L I F O Reserve | 120.60 | 115.90 | 113.90 | 110.10 | 108.90 | 108.60 | 92.30 | 90.70 | 88.70 | 87.20 | 85.90 | 84.80 | 84.30 | 84.20 | 84.50 | 84.50 | 84.50 | 82.50 | 81.40 | 79.90 | 78.40 | NA | NA | NA | 75.10 | NA | NA | NA | NA | NA | NA | NA | NA | NA | NA | NA | NA | NA | NA | NA | NA | NA | NA | NA | NA | NA | NA | NA | NA | NA | NA | NA | NA | NA | NA | NA | |
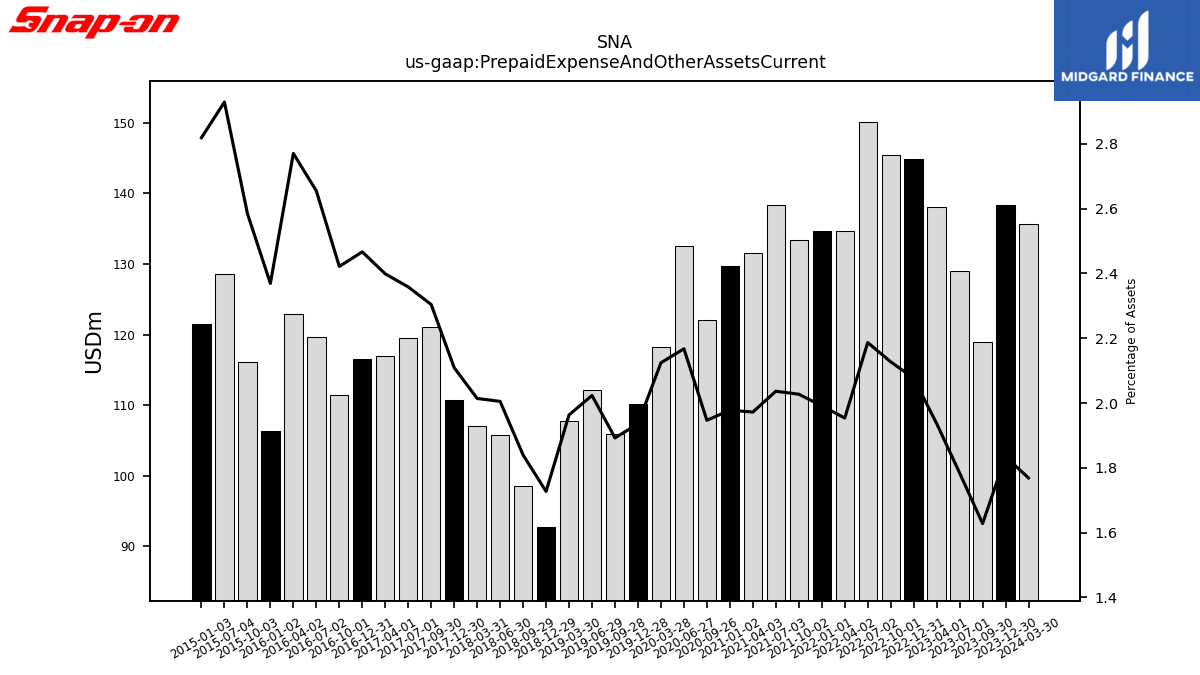
| Prepaid Expense And Other Assets Current | 135.60 | 138.40 | 118.90 | 129.00 | 138.00 | 144.80 | 145.40 | 150.10 | 134.70 | 134.60 | 133.40 | 138.30 | 131.60 | 122.00 | 132.50 | 118.20 | 110.20 | 105.90 | 112.20 | 107.80 | 92.80 | 98.50 | 105.70 | 107.10 | 110.70 | 121.10 | 119.50 | 117.00 | 116.50 | 111.40 | 119.60 | 122.90 | 106.30 | 116.10 | 128.60 | NA | 121.50 | NA | NA | NA | NA | NA | NA | NA | NA | NA | NA | NA | NA | NA | NA | NA | NA | NA | NA | NA |
| 2024-03-30 | 2023-12-30 | 2023-09-30 | 2023-07-01 | 2023-04-01 | 2022-12-31 | 2022-10-01 | 2022-07-02 | 2022-04-02 | 2022-01-01 | 2021-10-02 | 2021-07-03 | 2021-04-03 | 2020-09-26 | 2020-06-27 | 2020-03-28 | 2019-12-28 | 2019-09-28 | 2019-06-29 | 2019-03-30 | 2018-12-29 | 2018-09-29 | 2018-06-30 | 2018-03-31 | 2017-12-30 | 2017-09-30 | 2017-07-01 | 2017-04-01 | 2016-12-31 | 2016-10-01 | 2016-07-02 | 2016-04-02 | 2016-01-02 | 2015-10-03 | 2015-07-04 | 2015-04-04 | 2015-01-03 | 2014-09-27 | 2014-06-28 | 2014-03-29 | 2013-12-28 | 2013-09-28 | 2013-06-29 | 2013-03-30 | 2012-12-29 | 2012-09-29 | 2012-06-30 | 2012-03-31 | 2011-12-31 | 2011-10-01 | 2011-07-02 | 2011-04-02 | 2011-01-01 | 2010-10-02 | 2010-07-03 | 2010-04-03 | ||
|---|---|---|---|---|---|---|---|---|---|---|---|---|---|---|---|---|---|---|---|---|---|---|---|---|---|---|---|---|---|---|---|---|---|---|---|---|---|---|---|---|---|---|---|---|---|---|---|---|---|---|---|---|---|---|---|---|---|
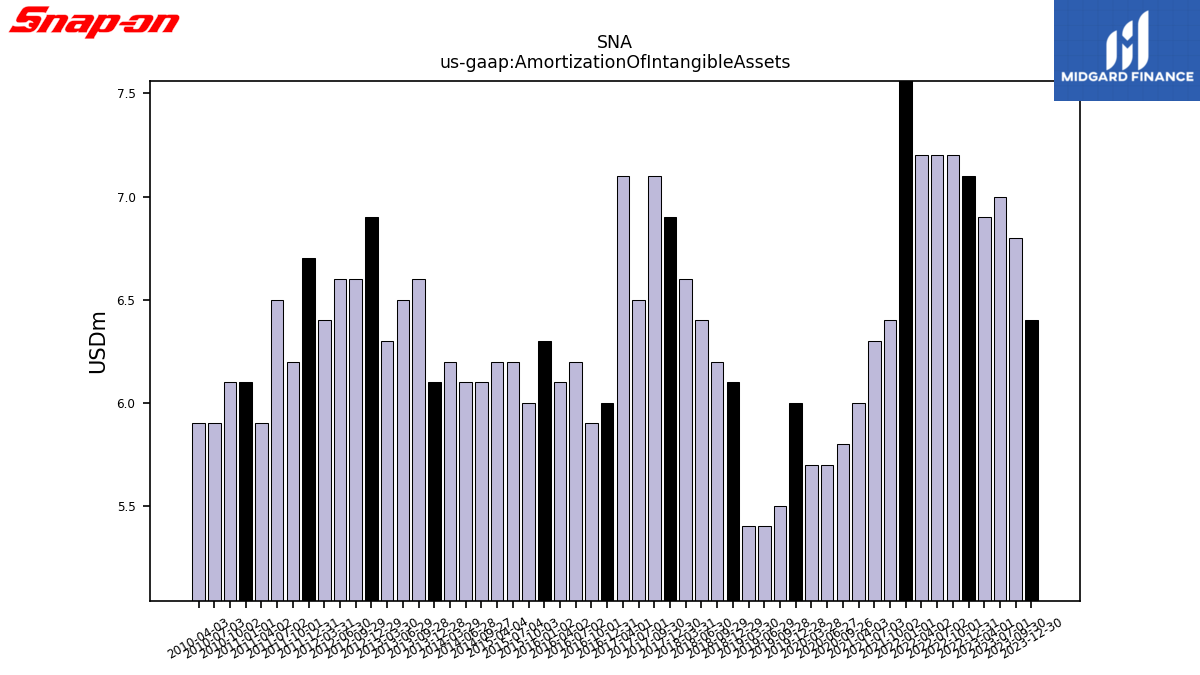
| Amortization Of Intangible Assets | 6.30 | 6.40 | 6.80 | 7.00 | 6.90 | 7.10 | 7.20 | 7.20 | 7.20 | 10.50 | 6.40 | 6.30 | 6.00 | 5.80 | 5.70 | 5.70 | 6.00 | 5.50 | 5.40 | 5.40 | 6.10 | 6.20 | 6.40 | 6.60 | 6.90 | 7.10 | 6.50 | 7.10 | 6.00 | 5.90 | 6.20 | 6.10 | 6.30 | 6.00 | 6.20 | 6.20 | NA | 6.10 | 6.10 | 6.20 | 6.10 | 6.60 | 6.50 | 6.30 | 6.90 | 6.60 | 6.60 | 6.40 | 6.70 | 6.20 | 6.50 | 5.90 | 6.10 | 6.10 | 5.90 | 5.90 | |
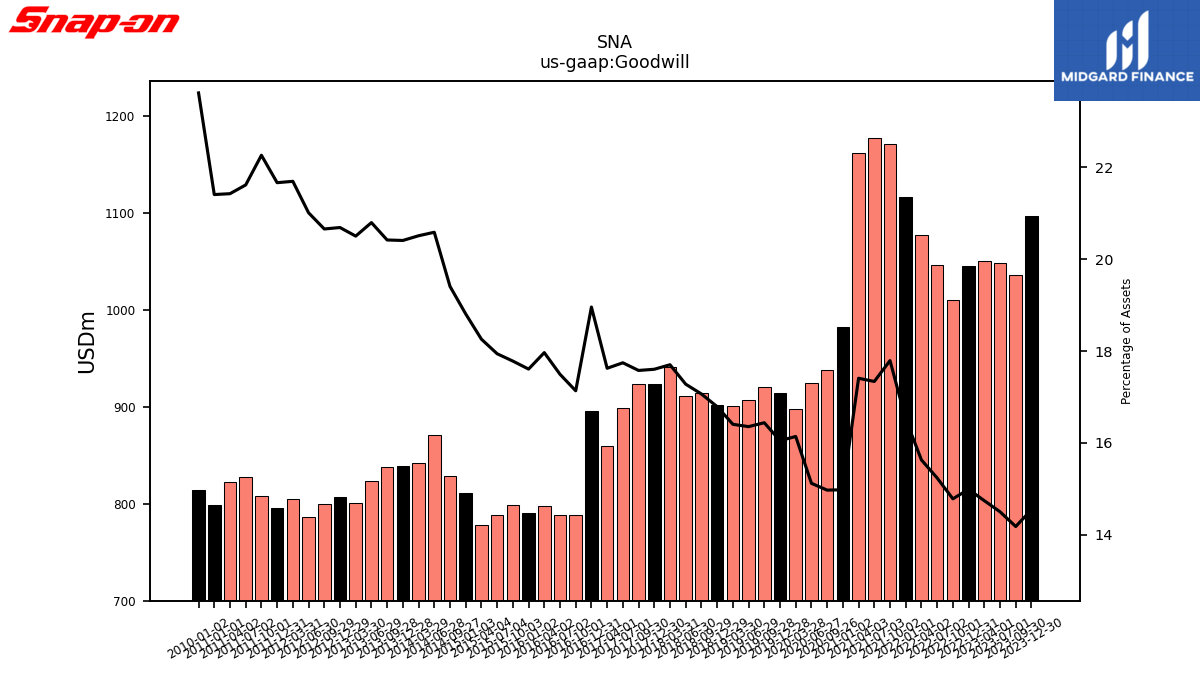
| Goodwill | 1071.30 | 1097.40 | 1035.90 | 1048.60 | 1050.60 | 1045.30 | 1010.60 | 1046.00 | 1077.80 | 1116.50 | 1171.00 | 1177.60 | 1161.80 | 938.50 | 924.50 | 898.20 | 913.80 | 920.10 | 907.00 | 900.90 | 902.20 | 913.90 | 911.00 | 941.40 | 924.10 | 924.00 | 899.20 | 859.80 | 895.50 | 788.30 | 788.20 | 797.10 | 790.10 | 798.70 | 787.80 | 778.30 | 810.70 | 828.50 | 870.50 | 841.80 | 838.80 | 837.40 | 823.90 | 800.30 | 807.40 | 799.90 | 786.20 | 804.90 | 795.80 | 808.20 | 827.20 | 822.80 | 798.40 | NA | NA | NA | |
| Intangible Assets Net Excluding Goodwill | 277.70 | 268.90 | 263.00 | 269.50 | 273.30 | 275.60 | 271.30 | 283.50 | 295.50 | 301.70 | 249.60 | 255.20 | 254.60 | 241.60 | 241.00 | 234.30 | 243.90 | 225.20 | 227.90 | 230.50 | 232.90 | 237.80 | 240.90 | 251.70 | 253.70 | 258.30 | 256.30 | 240.40 | 184.60 | 185.50 | 189.20 | 192.90 | 195.00 | 195.40 | 198.00 | 198.80 | 203.30 | 207.10 | 188.60 | 189.60 | 190.50 | 192.50 | 192.20 | 185.50 | 187.20 | 187.50 | 186.00 | 188.40 | 188.30 | 189.80 | 193.00 | 194.00 | 192.80 | NA | NA | NA | |
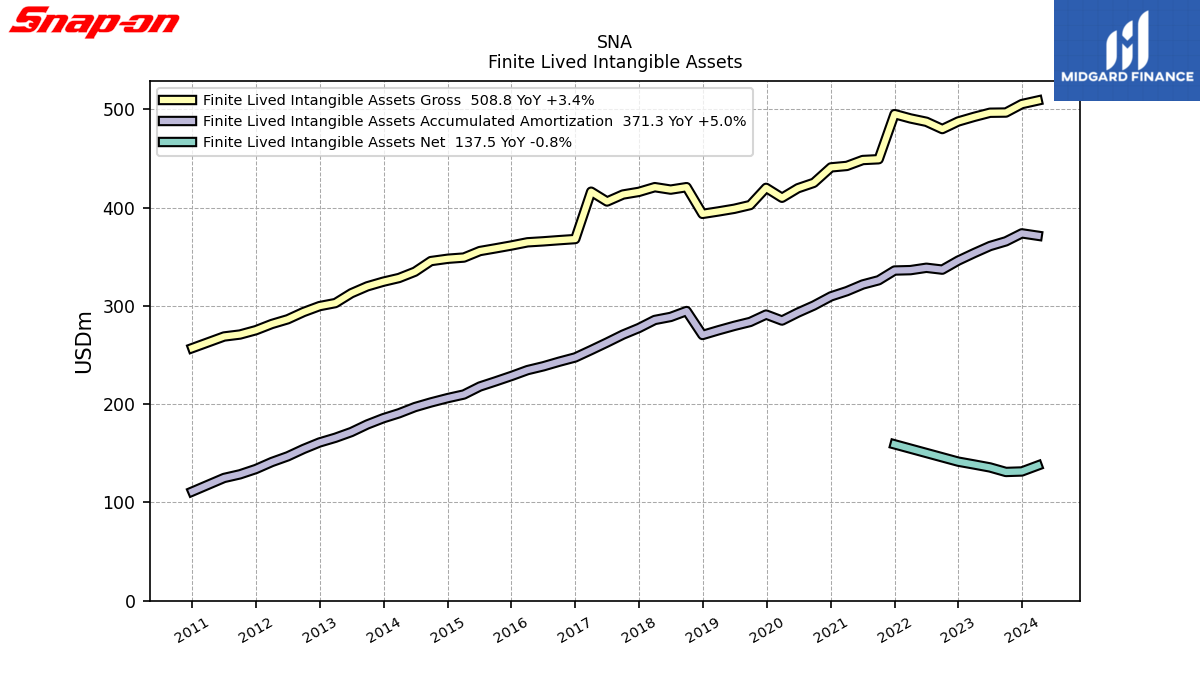
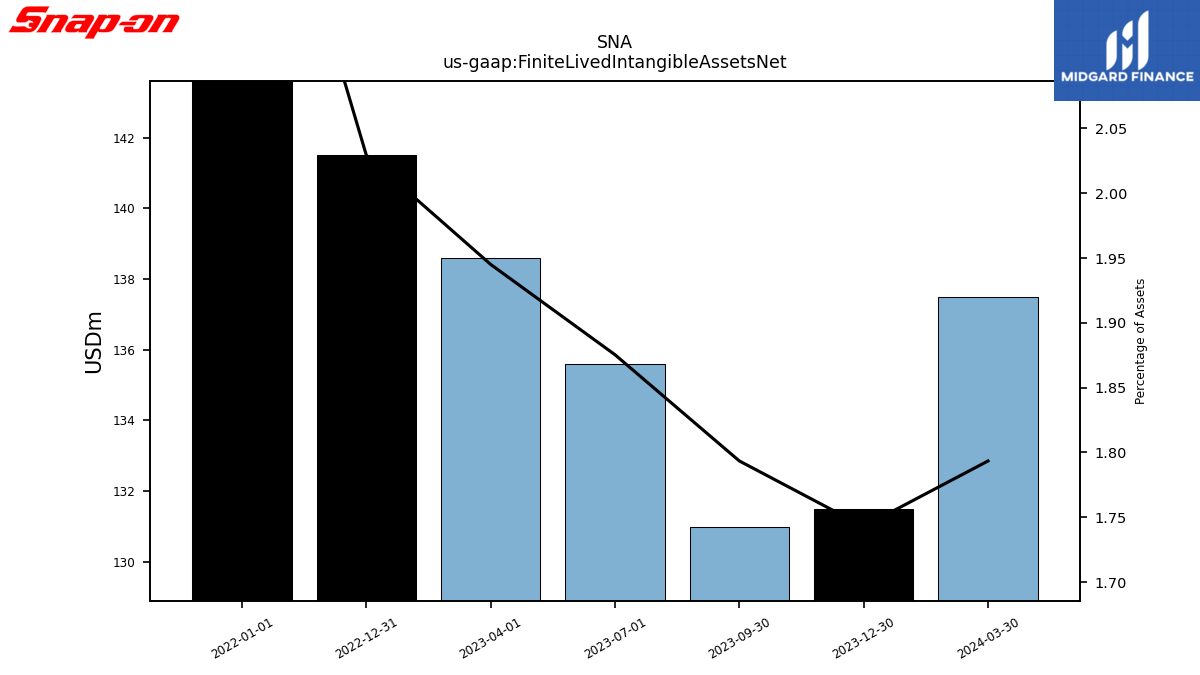
| Finite Lived Intangible Assets Net | 137.50 | 131.50 | 131.00 | 135.60 | 138.60 | 141.50 | NA | NA | NA | 159.10 | NA | NA | NA | NA | NA | NA | NA | NA | NA | NA | NA | NA | NA | NA | NA | NA | NA | NA | NA | NA | NA | NA | NA | NA | NA | NA | NA | NA | NA | NA | NA | NA | NA | NA | NA | NA | NA | NA | NA | NA | NA | NA | NA | NA | NA | NA | |
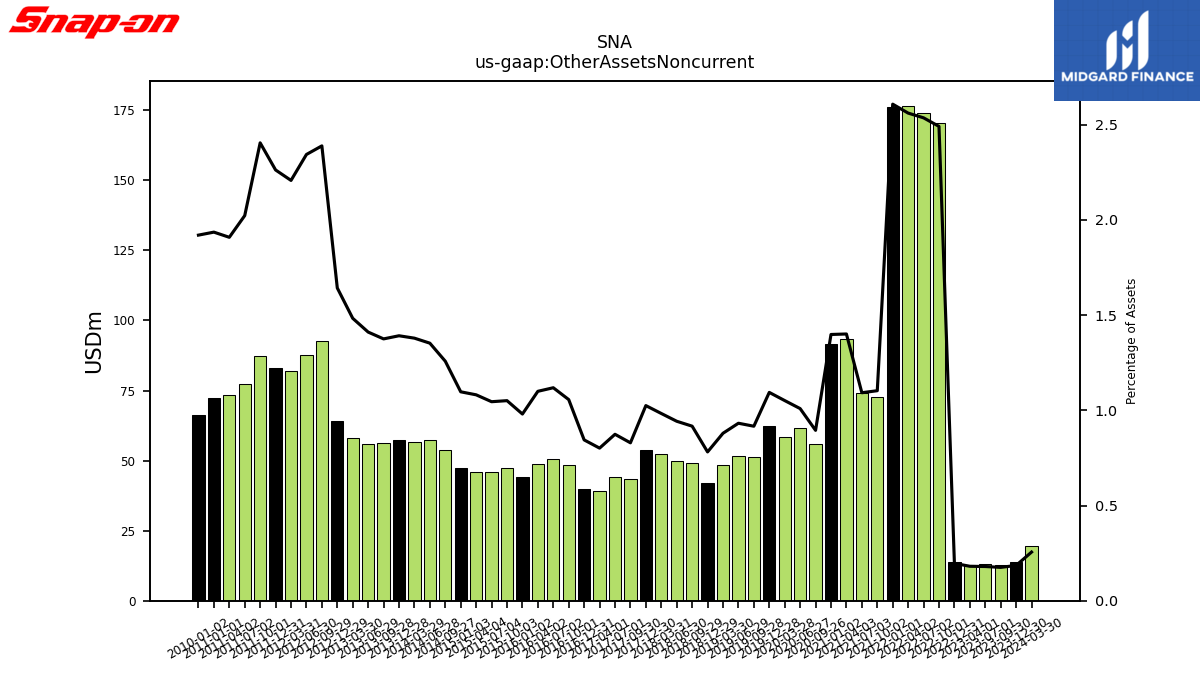
| Other Assets Noncurrent | 19.60 | 14.00 | 12.80 | 13.00 | 12.90 | 13.70 | 170.30 | 174.10 | 176.60 | 176.30 | 72.60 | 74.20 | 93.50 | 56.10 | 61.70 | 58.50 | 62.30 | 51.30 | 51.70 | 48.30 | 42.00 | 49.10 | 49.70 | 52.30 | 53.80 | 43.60 | 44.30 | 39.10 | 39.90 | 48.60 | 50.40 | 48.80 | 44.00 | 47.20 | 45.90 | 46.10 | 47.30 | 53.70 | 57.20 | 56.60 | 57.20 | 56.40 | 55.90 | 57.90 | 64.10 | 92.50 | 87.70 | 81.90 | 83.10 | 87.30 | 77.40 | 73.30 | 72.20 | NA | NA | NA |
| 2024-03-30 | 2023-12-30 | 2023-09-30 | 2023-07-01 | 2023-04-01 | 2022-12-31 | 2022-10-01 | 2022-07-02 | 2022-04-02 | 2022-01-01 | 2021-10-02 | 2021-07-03 | 2021-04-03 | 2020-09-26 | 2020-06-27 | 2020-03-28 | 2019-12-28 | 2019-09-28 | 2019-06-29 | 2019-03-30 | 2018-12-29 | 2018-09-29 | 2018-06-30 | 2018-03-31 | 2017-12-30 | 2017-09-30 | 2017-07-01 | 2017-04-01 | 2016-12-31 | 2016-10-01 | 2016-07-02 | 2016-04-02 | 2016-01-02 | 2015-10-03 | 2015-07-04 | 2015-04-04 | 2015-01-03 | 2014-09-27 | 2014-06-28 | 2014-03-29 | 2013-12-28 | 2013-09-28 | 2013-06-29 | 2013-03-30 | 2012-12-29 | 2012-09-29 | 2012-06-30 | 2012-03-31 | 2011-12-31 | 2011-10-01 | 2011-07-02 | 2011-04-02 | 2011-01-01 | 2010-10-02 | 2010-07-03 | 2010-04-03 | ||
|---|---|---|---|---|---|---|---|---|---|---|---|---|---|---|---|---|---|---|---|---|---|---|---|---|---|---|---|---|---|---|---|---|---|---|---|---|---|---|---|---|---|---|---|---|---|---|---|---|---|---|---|---|---|---|---|---|---|
| Liabilities Current | 989.70 | 941.60 | 981.90 | 962.30 | 999.00 | 971.60 | 993.50 | 986.10 | 1024.10 | 982.20 | 979.70 | 1222.10 | 1234.10 | 1117.00 | 829.40 | 921.90 | 947.60 | 990.10 | 930.80 | 936.00 | 952.00 | 956.80 | 927.00 | 951.60 | 1193.30 | 1222.80 | 1073.80 | 971.50 | 989.50 | 878.60 | 853.10 | 837.20 | 670.50 | 785.50 | 739.80 | 726.50 | 718.70 | 733.90 | 696.70 | 632.90 | 715.40 | 725.70 | 696.10 | 669.70 | 589.20 | 621.60 | 596.10 | 565.90 | 583.80 | 569.40 | 771.00 | 874.90 | 881.10 | NA | NA | NA | |
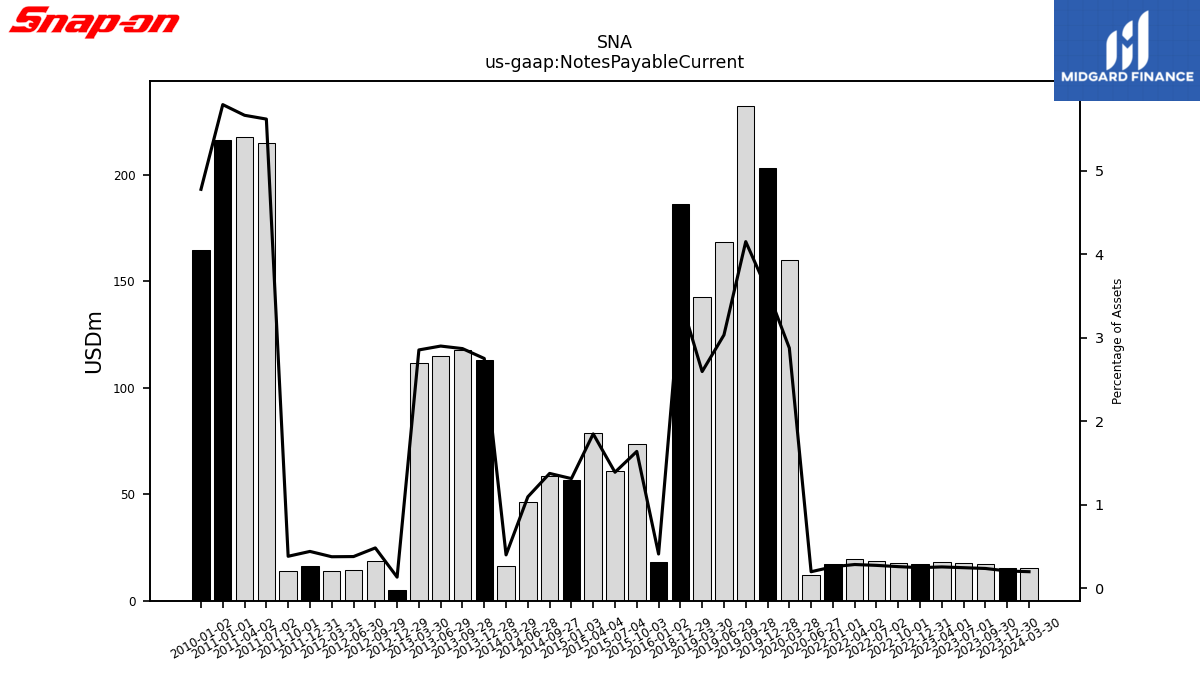
| Notes Payable Current | 15.20 | 15.60 | 17.30 | 17.80 | 18.20 | 17.20 | 17.70 | 18.80 | 19.60 | 17.40 | NA | NA | NA | NA | 12.10 | 160.10 | 202.90 | 232.30 | 168.20 | 142.50 | 186.30 | NA | NA | NA | NA | NA | NA | NA | NA | NA | NA | NA | 18.40 | 73.60 | 61.00 | 78.80 | 56.60 | 58.70 | 46.30 | 16.40 | 113.10 | 117.70 | 114.90 | 111.40 | 5.20 | 18.70 | 14.20 | 14.00 | 16.20 | 13.90 | 215.00 | 217.50 | 216.00 | NA | NA | NA | |
| Accounts Payable Current | 257.40 | 238.00 | 284.30 | 274.20 | 283.10 | 287.00 | 305.30 | 308.50 | 297.30 | 277.60 | 266.90 | 280.20 | 235.90 | 206.00 | 186.20 | 193.70 | 198.50 | 205.80 | 215.30 | 200.40 | 201.10 | 197.60 | 198.50 | 188.20 | 178.20 | 204.70 | 202.30 | 189.90 | 170.90 | 172.60 | 169.10 | 161.70 | 148.30 | 178.10 | 166.10 | 162.00 | 145.00 | 167.60 | 171.90 | 160.10 | 155.60 | 161.80 | 157.60 | 148.70 | 142.50 | 146.90 | 141.40 | 139.00 | 124.60 | 132.00 | 139.00 | 141.50 | 146.10 | NA | NA | NA | |
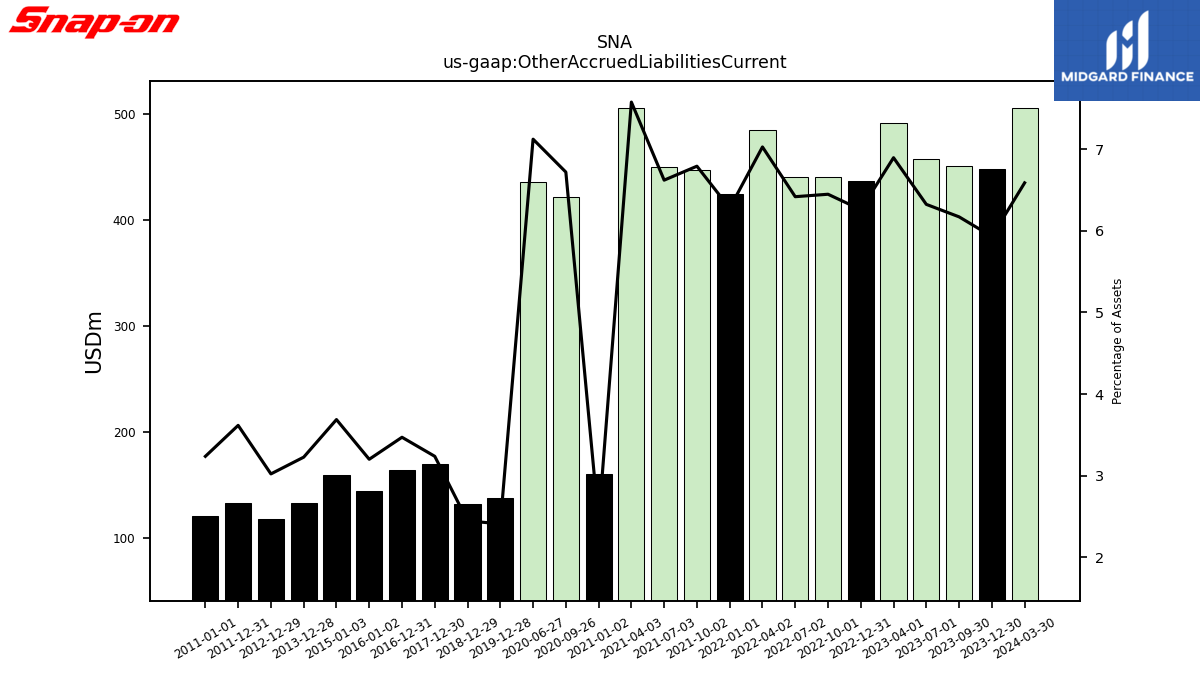
| Other Accrued Liabilities Current | 505.00 | 447.40 | 450.70 | 457.20 | 491.30 | 436.40 | 440.70 | 440.50 | 484.50 | 424.30 | 446.90 | 449.60 | 505.60 | 421.10 | 435.40 | NA | 137.20 | NA | NA | NA | 131.40 | NA | NA | NA | 169.90 | NA | NA | NA | 163.90 | NA | NA | NA | 143.60 | NA | NA | NA | 158.90 | NA | NA | NA | 132.60 | NA | NA | NA | 117.90 | NA | NA | NA | 132.80 | NA | NA | NA | 120.70 | NA | NA | NA | |
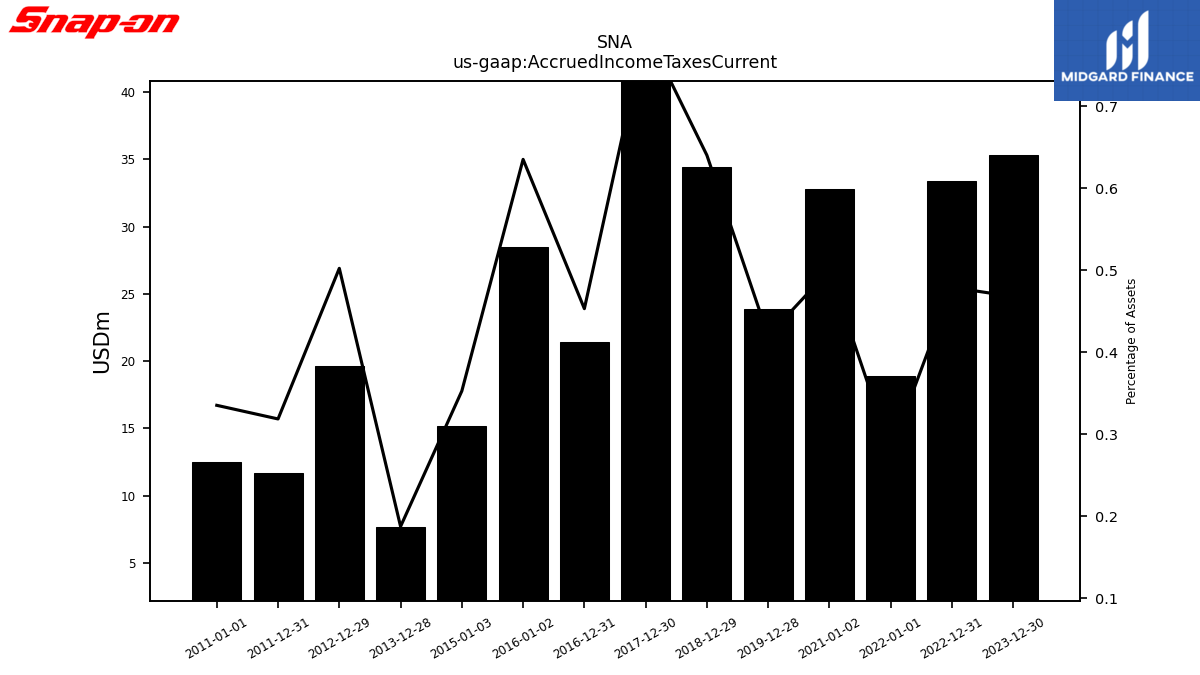
| Accrued Income Taxes Current | NA | 35.30 | NA | NA | NA | 33.40 | NA | NA | NA | 18.90 | NA | NA | NA | NA | NA | NA | 23.90 | NA | NA | NA | 34.40 | NA | NA | NA | 41.60 | NA | NA | NA | 21.40 | NA | NA | NA | 28.50 | NA | NA | NA | 15.20 | NA | NA | NA | 7.70 | NA | NA | NA | 19.60 | NA | NA | NA | 11.70 | NA | NA | NA | 12.50 | NA | NA | NA | |
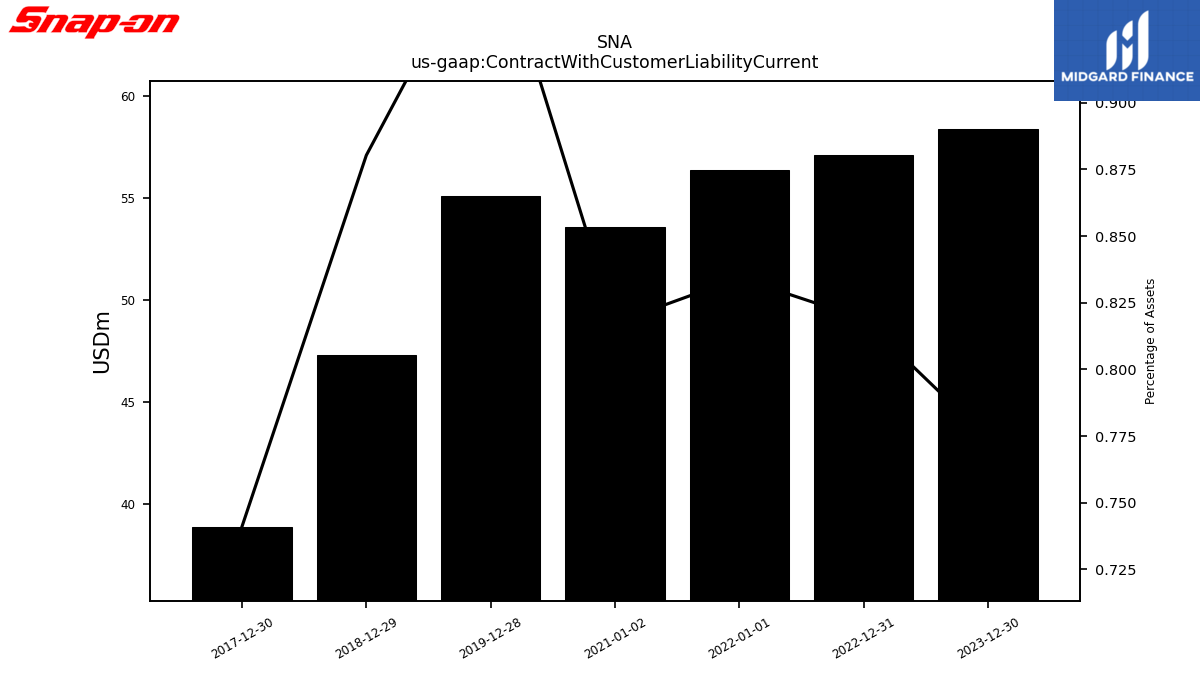
| Contract With Customer Liability Current | NA | 58.40 | NA | NA | NA | 57.10 | NA | NA | NA | 56.40 | NA | NA | NA | NA | NA | NA | 55.10 | NA | NA | NA | 47.30 | NA | NA | NA | 38.90 | NA | NA | NA | NA | NA | NA | NA | NA | NA | NA | NA | NA | NA | NA | NA | NA | NA | NA | NA | NA | NA | NA | NA | NA | NA | NA | NA | NA | NA | NA | NA |
| 2024-03-30 | 2023-12-30 | 2023-09-30 | 2023-07-01 | 2023-04-01 | 2022-12-31 | 2022-10-01 | 2022-07-02 | 2022-04-02 | 2022-01-01 | 2021-10-02 | 2021-07-03 | 2021-04-03 | 2020-09-26 | 2020-06-27 | 2020-03-28 | 2019-12-28 | 2019-09-28 | 2019-06-29 | 2019-03-30 | 2018-12-29 | 2018-09-29 | 2018-06-30 | 2018-03-31 | 2017-12-30 | 2017-09-30 | 2017-07-01 | 2017-04-01 | 2016-12-31 | 2016-10-01 | 2016-07-02 | 2016-04-02 | 2016-01-02 | 2015-10-03 | 2015-07-04 | 2015-04-04 | 2015-01-03 | 2014-09-27 | 2014-06-28 | 2014-03-29 | 2013-12-28 | 2013-09-28 | 2013-06-29 | 2013-03-30 | 2012-12-29 | 2012-09-29 | 2012-06-30 | 2012-03-31 | 2011-12-31 | 2011-10-01 | 2011-07-02 | 2011-04-02 | 2011-01-01 | 2010-10-02 | 2010-07-03 | 2010-04-03 | ||
|---|---|---|---|---|---|---|---|---|---|---|---|---|---|---|---|---|---|---|---|---|---|---|---|---|---|---|---|---|---|---|---|---|---|---|---|---|---|---|---|---|---|---|---|---|---|---|---|---|---|---|---|---|---|---|---|---|---|
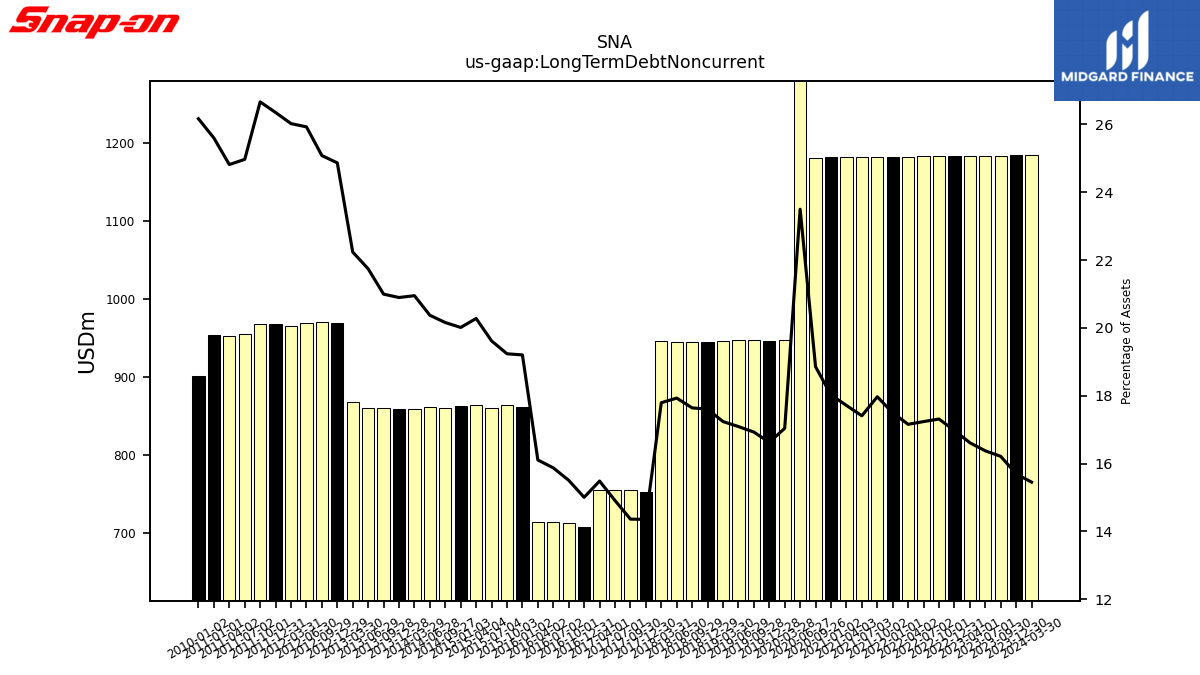
| Long Term Debt Noncurrent | 1184.90 | 1184.60 | 1184.40 | 1184.20 | 1184.00 | 1183.80 | 1183.60 | 1183.40 | 1183.20 | 1182.90 | 1182.70 | 1182.50 | 1182.30 | 1181.80 | 1436.70 | 948.20 | 946.90 | 947.50 | 947.90 | 946.70 | 946.00 | 944.80 | 945.40 | 946.30 | 753.60 | 755.00 | 755.60 | 755.40 | 708.80 | 713.40 | 715.20 | 714.60 | 861.70 | 864.10 | 861.40 | 864.40 | 862.70 | 860.50 | 861.50 | 859.90 | 858.90 | 861.10 | 861.40 | 868.00 | 970.40 | 971.20 | 970.20 | 965.50 | 967.90 | 968.00 | 955.50 | 953.00 | 954.80 | NA | NA | NA | |
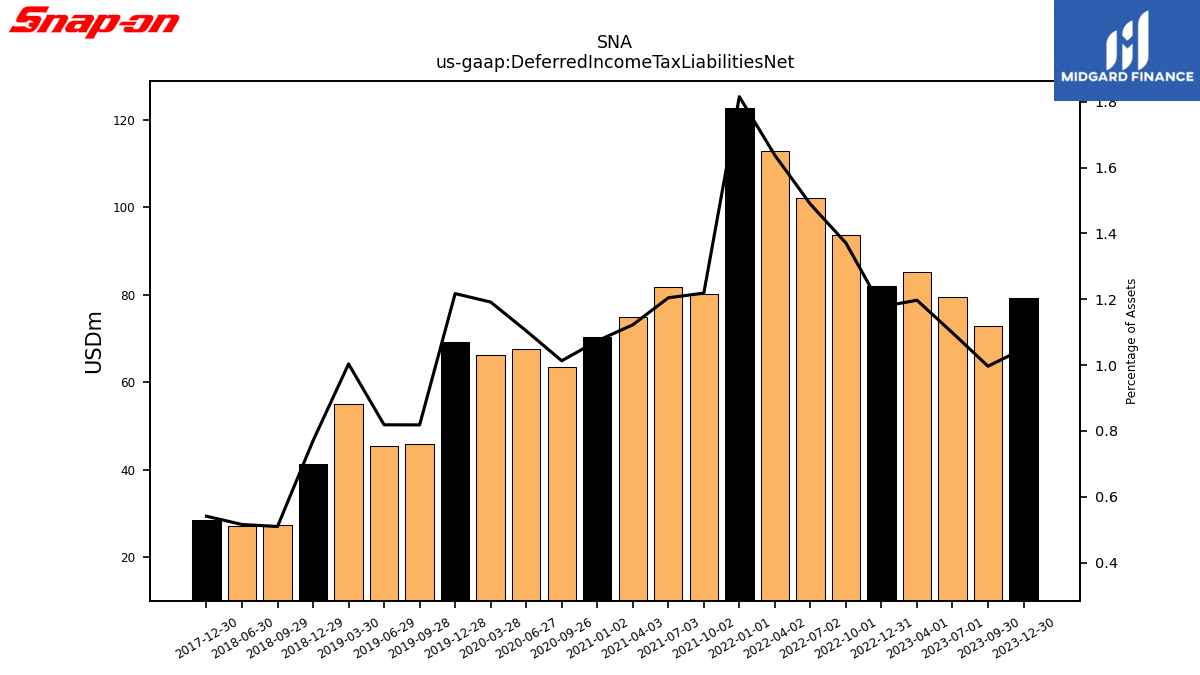
| Deferred Income Tax Liabilities Net | 88.30 | 79.20 | 72.80 | 79.40 | 85.30 | 82.10 | 93.70 | 102.20 | 112.90 | 122.70 | 80.20 | 81.80 | 74.90 | 63.50 | 67.50 | 66.30 | 69.30 | 45.80 | 45.40 | 55.10 | 41.40 | 27.30 | 27.20 | NA | 28.40 | NA | NA | NA | NA | NA | NA | NA | NA | NA | NA | NA | NA | NA | NA | NA | NA | NA | NA | NA | NA | NA | NA | NA | NA | NA | NA | NA | NA | NA | NA | NA | |
| Pension And Other Postretirement Defined Benefit Plans Liabilities Noncurrent | 75.30 | 82.30 | 57.70 | 65.40 | 72.70 | 78.60 | 70.50 | 83.10 | 96.40 | 104.90 | 103.20 | 111.60 | 117.60 | 103.70 | 109.00 | 113.20 | 122.10 | 115.30 | 136.60 | 156.50 | 171.30 | 92.80 | 117.80 | 146.60 | 158.90 | 181.80 | 213.90 | 230.70 | 246.50 | 179.80 | 193.20 | 206.90 | 227.80 | 175.90 | 184.60 | 196.30 | 217.90 | 108.70 | 122.80 | 135.40 | 135.80 | 239.80 | 239.70 | 252.90 | 260.70 | 255.60 | 270.40 | 306.30 | 317.70 | 275.30 | 268.60 | 259.20 | 246.10 | NA | NA | NA | |
| Minority Interest | 22.30 | 22.10 | 22.20 | 22.20 | 22.20 | 22.20 | 22.30 | 22.40 | 22.30 | 21.90 | 22.00 | 22.10 | 21.90 | 21.80 | 21.90 | 22.10 | 21.70 | 21.40 | 20.60 | 20.20 | 19.80 | 19.70 | 18.40 | 18.40 | 18.40 | 18.20 | 18.10 | 18.10 | 18.00 | 18.00 | 18.00 | 18.00 | 18.00 | 17.80 | 17.70 | 17.70 | 17.50 | 17.50 | 17.40 | 17.00 | 17.20 | 16.90 | 17.10 | 16.90 | 16.90 | 16.60 | 16.50 | 16.50 | 16.40 | 16.30 | 16.30 | 15.90 | 15.90 | NA | NA | NA | |
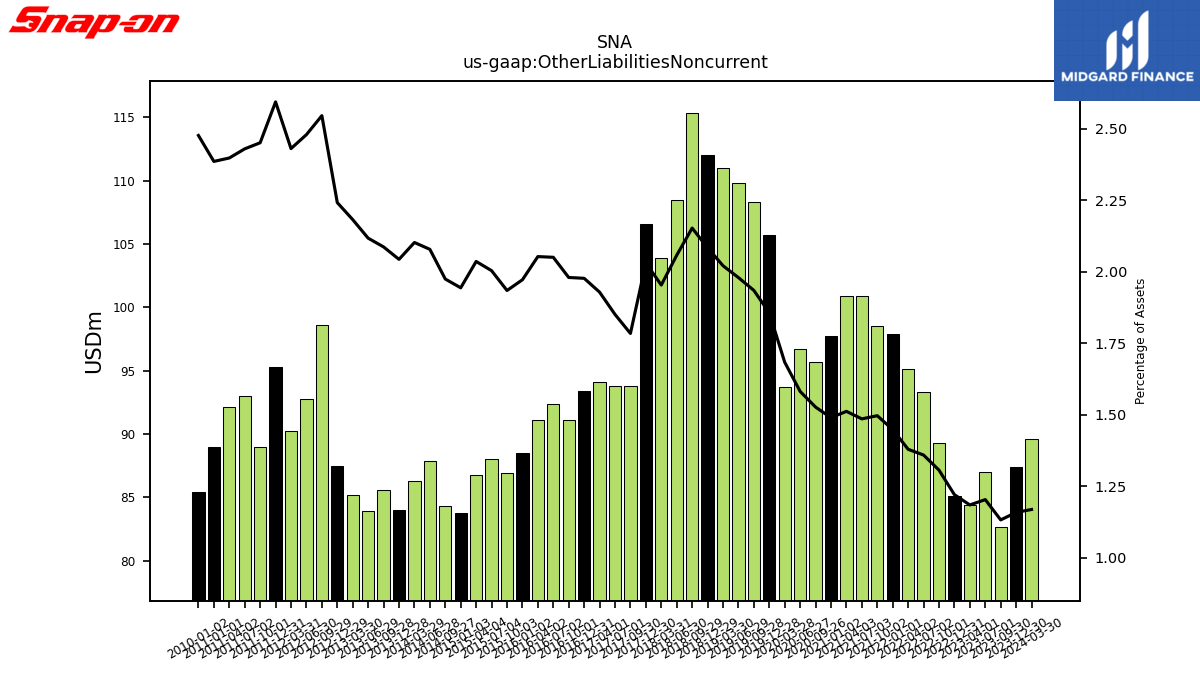
| Other Liabilities Noncurrent | 89.60 | 87.40 | 82.70 | 87.00 | 84.40 | 85.10 | 89.30 | 93.30 | 95.10 | 97.90 | 98.50 | 100.90 | 100.90 | 95.70 | 96.70 | 93.70 | 105.70 | 108.30 | 109.80 | 111.00 | 112.00 | 115.30 | 108.50 | 103.90 | 106.60 | 93.80 | 93.80 | 94.10 | 93.40 | 91.10 | 92.40 | 91.10 | 88.50 | 86.90 | 88.00 | 86.80 | 83.80 | 84.30 | 87.90 | 86.30 | 84.00 | 85.60 | 83.90 | 85.20 | 87.50 | 98.60 | 92.80 | 90.20 | 95.30 | 89.00 | 93.00 | 92.10 | 89.00 | NA | NA | NA | |
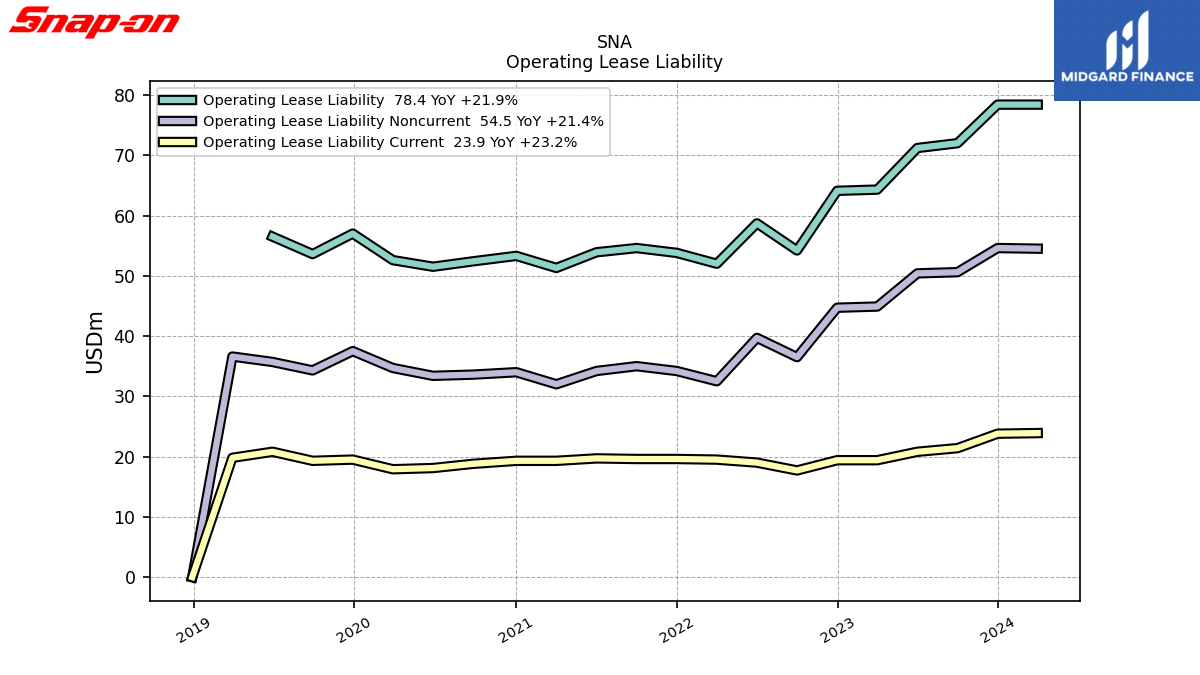
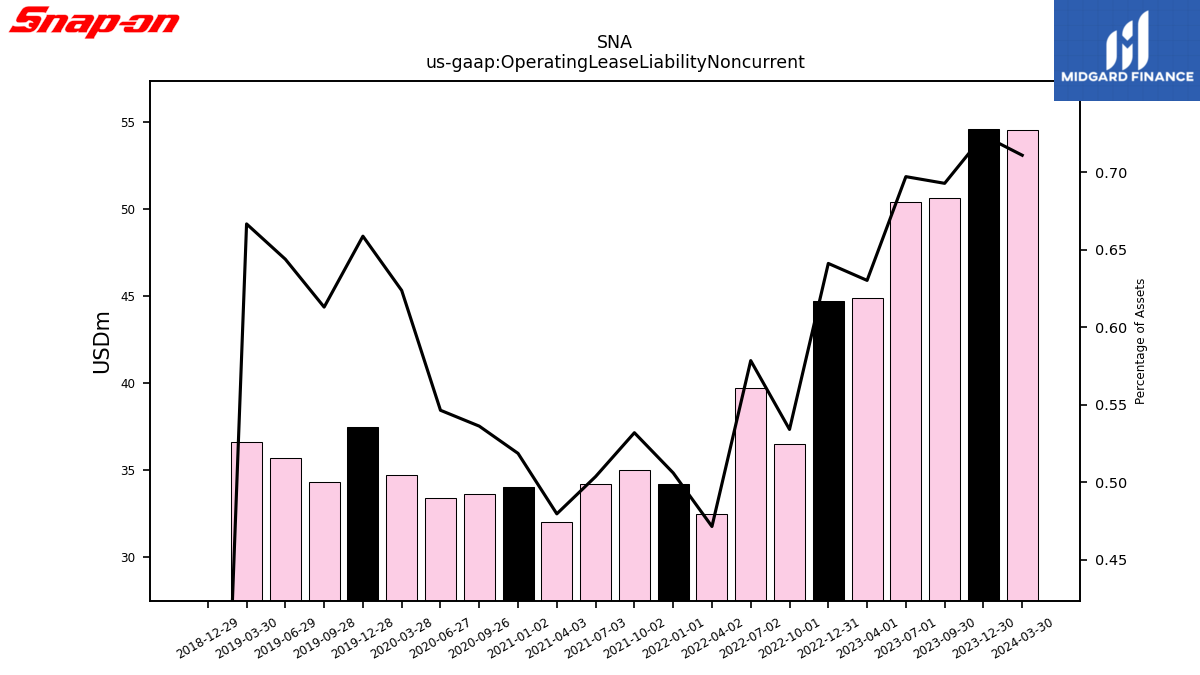
| Operating Lease Liability Noncurrent | 54.50 | 54.60 | 50.60 | 50.40 | 44.90 | 44.70 | 36.50 | 39.70 | 32.50 | 34.20 | 35.00 | 34.20 | 32.00 | 33.60 | 33.40 | 34.70 | 37.50 | 34.30 | 35.70 | 36.60 | 0.00 | NA | NA | NA | NA | NA | NA | NA | NA | NA | NA | NA | NA | NA | NA | NA | NA | NA | NA | NA | NA | NA | NA | NA | NA | NA | NA | NA | NA | NA | NA | NA | NA | NA | NA | NA |
| 2024-03-30 | 2023-12-30 | 2023-09-30 | 2023-07-01 | 2023-04-01 | 2022-12-31 | 2022-10-01 | 2022-07-02 | 2022-04-02 | 2022-01-01 | 2021-10-02 | 2021-07-03 | 2021-04-03 | 2020-09-26 | 2020-06-27 | 2020-03-28 | 2019-12-28 | 2019-09-28 | 2019-06-29 | 2019-03-30 | 2018-12-29 | 2018-09-29 | 2018-06-30 | 2018-03-31 | 2017-12-30 | 2017-09-30 | 2017-07-01 | 2017-04-01 | 2016-12-31 | 2016-10-01 | 2016-07-02 | 2016-04-02 | 2016-01-02 | 2015-10-03 | 2015-07-04 | 2015-04-04 | 2015-01-03 | 2014-09-27 | 2014-06-28 | 2014-03-29 | 2013-12-28 | 2013-09-28 | 2013-06-29 | 2013-03-30 | 2012-12-29 | 2012-09-29 | 2012-06-30 | 2012-03-31 | 2011-12-31 | 2011-10-01 | 2011-07-02 | 2011-04-02 | 2011-01-01 | 2010-10-02 | 2010-07-03 | 2010-04-03 | ||
|---|---|---|---|---|---|---|---|---|---|---|---|---|---|---|---|---|---|---|---|---|---|---|---|---|---|---|---|---|---|---|---|---|---|---|---|---|---|---|---|---|---|---|---|---|---|---|---|---|---|---|---|---|---|---|---|---|---|
| Stockholders Equity | 5141.00 | 5071.30 | 4830.20 | 4757.10 | 4610.20 | 4481.30 | 4317.20 | 4324.40 | 4298.30 | 4181.90 | 4047.30 | 4003.40 | 3876.00 | 3619.00 | 3486.70 | 3331.30 | 3409.10 | 3303.80 | 3288.10 | 3197.60 | 3098.80 | 3164.40 | 3093.20 | 3083.90 | 2953.90 | 2921.80 | 2854.90 | 2747.70 | 2617.20 | 2670.60 | 2583.60 | 2517.10 | 2412.70 | 2361.00 | 2298.50 | 2170.60 | 2207.80 | 2277.00 | 2255.40 | 2186.70 | 2113.20 | 1989.20 | 1878.80 | 1829.50 | 1802.10 | 1739.70 | 1633.40 | 1603.40 | 1530.90 | 1557.90 | 1566.60 | 1489.70 | 1388.50 | NA | NA | NA | |
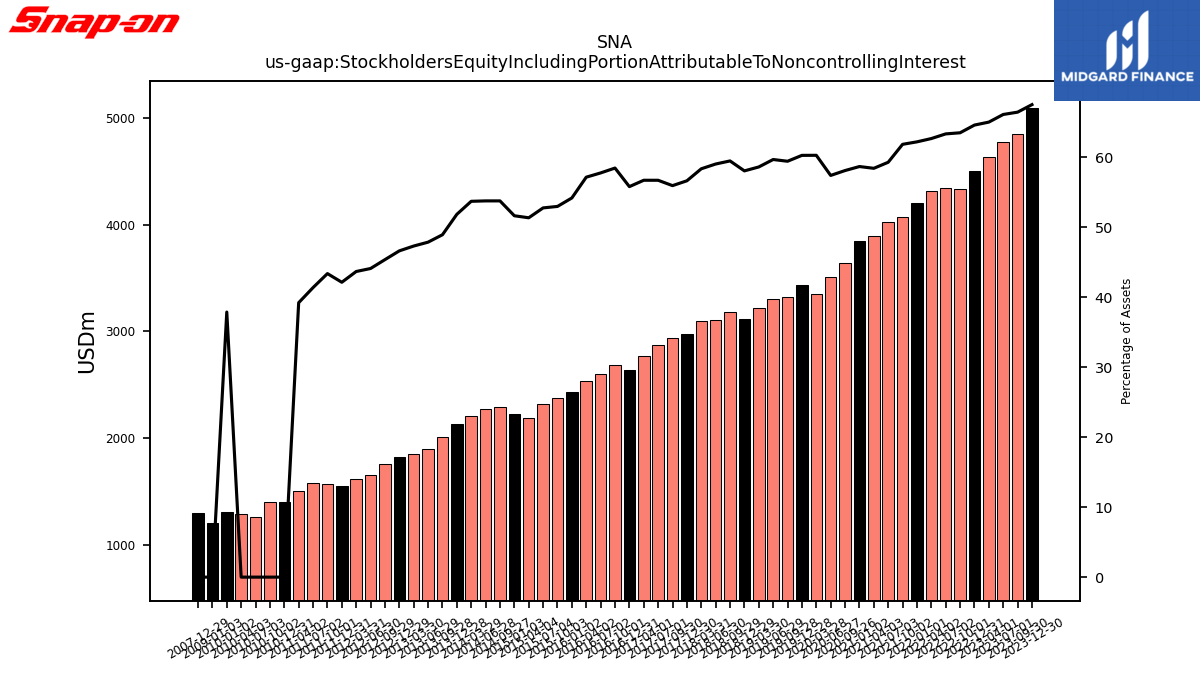
| Stockholders Equity Including Portion Attributable To Noncontrolling Interest | 5163.30 | 5093.40 | 4852.40 | 4779.30 | 4632.40 | 4503.50 | 4339.50 | 4346.80 | 4320.60 | 4203.80 | 4069.30 | 4025.50 | 3897.90 | 3640.80 | 3508.60 | 3353.40 | 3430.80 | 3325.20 | 3308.70 | 3217.80 | 3118.60 | 3184.10 | 3111.60 | 3102.30 | 2972.30 | 2940.00 | 2873.00 | 2765.80 | 2635.20 | 2688.60 | 2601.60 | 2535.10 | 2430.70 | 2378.80 | 2316.20 | 2188.30 | 2225.30 | 2294.50 | 2272.80 | 2203.70 | 2130.40 | 2006.10 | 1895.90 | 1846.40 | 1819.00 | 1756.30 | 1649.90 | 1619.90 | 1547.30 | 1574.20 | 1582.90 | 1505.60 | NA | 1396.90 | 1264.30 | 1287.40 | |
| Common Stock Value | 67.50 | 67.50 | 67.50 | 67.50 | 67.50 | 67.40 | 67.40 | 67.40 | 67.40 | 67.40 | 67.40 | 67.40 | 67.40 | 67.40 | 67.40 | 67.40 | 67.40 | 67.40 | 67.40 | 67.40 | 67.40 | 67.40 | 67.40 | 67.40 | 67.40 | 67.40 | 67.40 | 67.40 | 67.40 | 67.40 | 67.40 | 67.40 | 67.40 | 67.40 | 67.40 | 67.40 | 67.40 | 67.40 | 67.40 | 67.40 | 67.40 | 67.40 | 67.40 | 67.40 | 67.40 | 67.40 | 67.30 | 67.30 | 67.30 | 67.30 | 67.30 | 67.30 | 67.30 | NA | NA | NA | |
| Additional Paid In Capital | 527.40 | 545.50 | 531.70 | 521.10 | 500.20 | 499.90 | 493.60 | 488.10 | 474.70 | 472.70 | 467.70 | 461.10 | 419.70 | 386.30 | 383.10 | 378.40 | 379.10 | 374.50 | 371.70 | 361.30 | 359.40 | 360.90 | 352.60 | 343.90 | 343.20 | 344.40 | 337.10 | 320.80 | 317.30 | 319.10 | 311.10 | 294.20 | 296.30 | 293.70 | 285.50 | 261.50 | 254.70 | 252.10 | 243.70 | 227.10 | 225.10 | 226.60 | 219.60 | 203.10 | 204.60 | 205.00 | 196.90 | 188.50 | 181.40 | 195.60 | 190.60 | 174.50 | 169.20 | NA | NA | NA | |
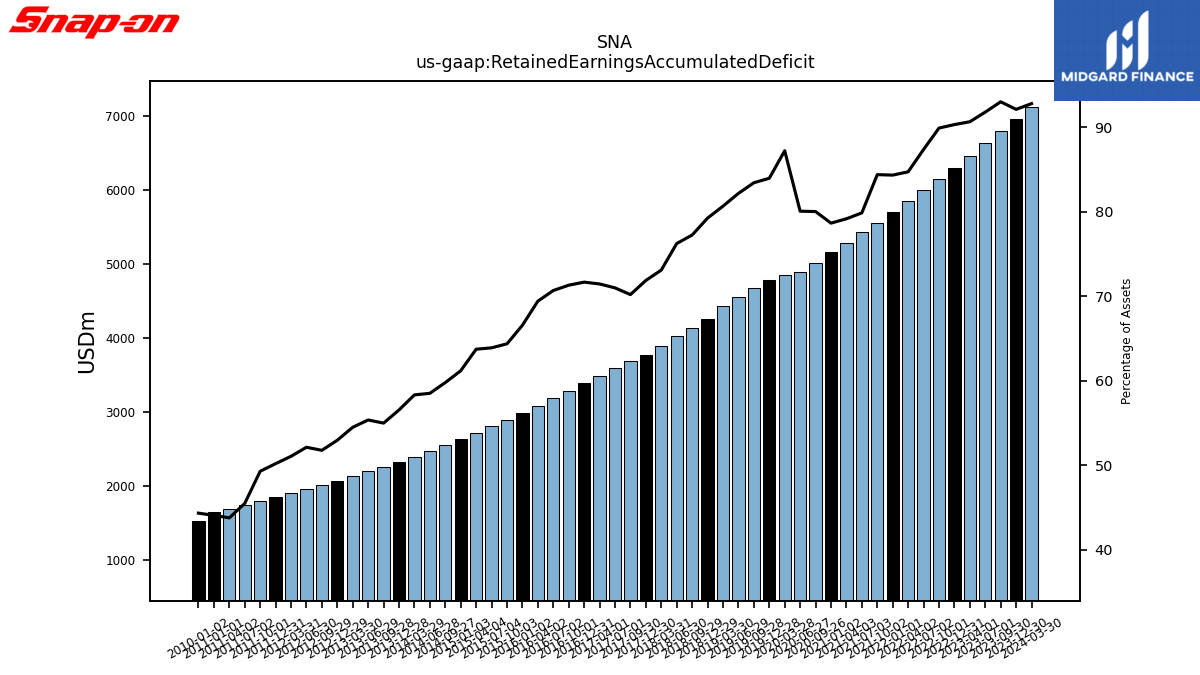
| Retained Earnings Accumulated Deficit | 7113.10 | 6948.50 | 6792.30 | 6635.60 | 6458.10 | 6296.20 | 6144.00 | 5996.20 | 5841.00 | 5699.90 | 5552.80 | 5423.50 | 5282.50 | 5014.90 | 4894.20 | 4852.00 | 4779.70 | 4668.30 | 4556.10 | 4428.40 | 4257.60 | 4135.80 | 4018.90 | 3886.70 | 3772.30 | 3689.50 | 3597.00 | 3485.20 | 3384.90 | 3280.00 | 3183.90 | 3079.60 | 2986.90 | 2891.20 | 2805.50 | 2716.60 | 2637.20 | 2552.10 | 2474.30 | 2394.10 | 2324.10 | 2255.40 | 2193.20 | 2127.30 | 2067.00 | 2004.80 | 1950.90 | 1894.60 | 1843.70 | 1789.60 | 1740.80 | 1681.40 | 1644.10 | NA | NA | NA | |
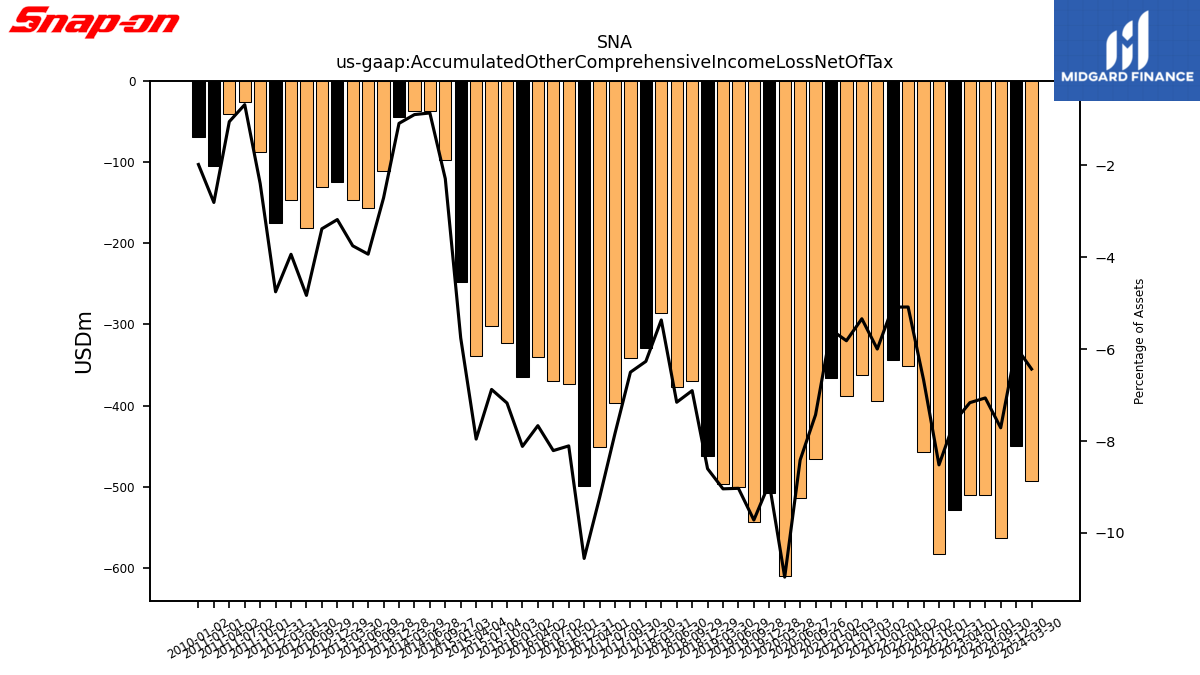
| Accumulated Other Comprehensive Income Loss Net Of Tax | -493.30 | -449.50 | -563.30 | -510.70 | -510.60 | -528.30 | -582.30 | -457.70 | -350.60 | -343.90 | -394.80 | -362.70 | -388.30 | -465.60 | -514.40 | -609.90 | -507.90 | -543.90 | -500.70 | -496.40 | -462.20 | -369.70 | -377.30 | -285.40 | -329.00 | -341.80 | -397.00 | -450.40 | -498.50 | -372.90 | -369.80 | -340.10 | -364.20 | -322.20 | -302.00 | -339.20 | -248.20 | -97.90 | -36.50 | -36.90 | -44.80 | -111.10 | -155.90 | -146.50 | -124.20 | -131.00 | -180.80 | -146.10 | -174.60 | -87.00 | -26.10 | -40.40 | -104.80 | NA | NA | NA | |
| Minority Interest | 22.30 | 22.10 | 22.20 | 22.20 | 22.20 | 22.20 | 22.30 | 22.40 | 22.30 | 21.90 | 22.00 | 22.10 | 21.90 | 21.80 | 21.90 | 22.10 | 21.70 | 21.40 | 20.60 | 20.20 | 19.80 | 19.70 | 18.40 | 18.40 | 18.40 | 18.20 | 18.10 | 18.10 | 18.00 | 18.00 | 18.00 | 18.00 | 18.00 | 17.80 | 17.70 | 17.70 | 17.50 | 17.50 | 17.40 | 17.00 | 17.20 | 16.90 | 17.10 | 16.90 | 16.90 | 16.60 | 16.50 | 16.50 | 16.40 | 16.30 | 16.30 | 15.90 | 15.90 | NA | NA | NA |
| 2024-03-30 | 2023-12-30 | 2023-09-30 | 2023-07-01 | 2023-04-01 | 2022-12-31 | 2022-10-01 | 2022-07-02 | 2022-04-02 | 2022-01-01 | 2021-10-02 | 2021-07-03 | 2021-04-03 | 2020-09-26 | 2020-06-27 | 2020-03-28 | 2019-12-28 | 2019-09-28 | 2019-06-29 | 2019-03-30 | 2018-12-29 | 2018-09-29 | 2018-06-30 | 2018-03-31 | 2017-12-30 | 2017-09-30 | 2017-07-01 | 2017-04-01 | 2016-12-31 | 2016-10-01 | 2016-07-02 | 2016-04-02 | 2016-01-02 | 2015-10-03 | 2015-07-04 | 2015-04-04 | 2015-01-03 | 2014-09-27 | 2014-06-28 | 2014-03-29 | 2013-12-28 | 2013-09-28 | 2013-06-29 | 2013-03-30 | 2012-12-29 | 2012-09-29 | 2012-06-30 | 2012-03-31 | 2011-12-31 | 2011-10-01 | 2011-07-02 | 2011-04-02 | 2011-01-01 | 2010-10-02 | 2010-07-03 | 2010-04-03 | ||
|---|---|---|---|---|---|---|---|---|---|---|---|---|---|---|---|---|---|---|---|---|---|---|---|---|---|---|---|---|---|---|---|---|---|---|---|---|---|---|---|---|---|---|---|---|---|---|---|---|---|---|---|---|---|---|---|---|---|
| Net Cash Provided By Used In Operating Activities | 348.70 | 296.90 | 285.40 | 270.30 | 301.60 | 210.60 | 129.90 | 140.80 | 193.90 | 222.70 | 186.40 | 238.20 | 319.30 | 224.00 | 253.60 | 213.40 | 196.70 | 131.10 | 145.50 | 201.30 | 215.90 | 129.80 | NA | NA | 193.50 | 95.50 | NA | NA | NA | NA | NA | NA | NA | NA | NA | NA | NA | NA | NA | 88.30 | 122.50 | 84.30 | 110.10 | 75.70 | 102.90 | 69.70 | 91.70 | 65.00 | 72.30 | 42.00 | -13.70 | 27.90 | 64.30 | 10.20 | 55.50 | 10.40 | |
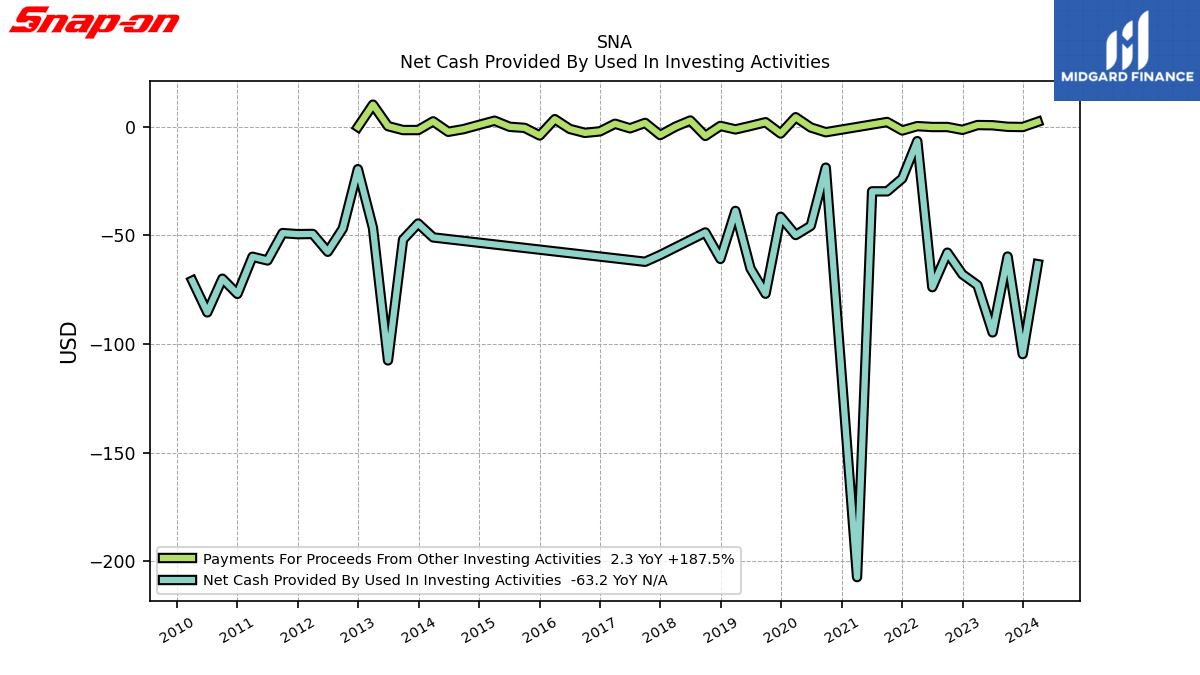
| Net Cash Provided By Used In Investing Activities | -63.20 | -104.60 | -59.70 | -94.60 | -72.90 | -67.90 | -57.90 | -73.80 | -6.60 | -23.80 | -29.70 | -29.70 | -207.20 | -18.80 | -45.60 | -49.80 | -41.40 | -76.80 | -65.20 | -38.70 | -60.80 | -48.60 | NA | NA | -59.00 | -62.10 | NA | NA | NA | NA | NA | NA | NA | NA | NA | NA | NA | NA | NA | -50.90 | -44.50 | -51.90 | -107.50 | -46.50 | -19.50 | -46.80 | -57.50 | -49.30 | -49.40 | -48.90 | -61.50 | -59.80 | -76.90 | -69.90 | -85.40 | -70.80 | |
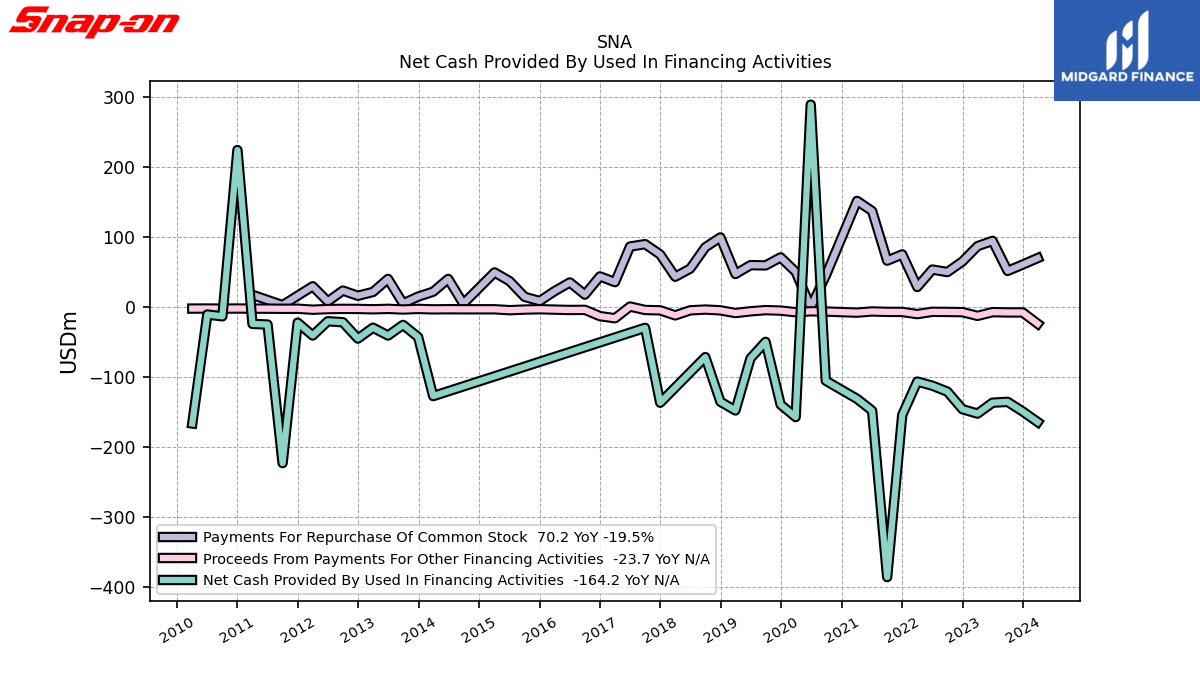
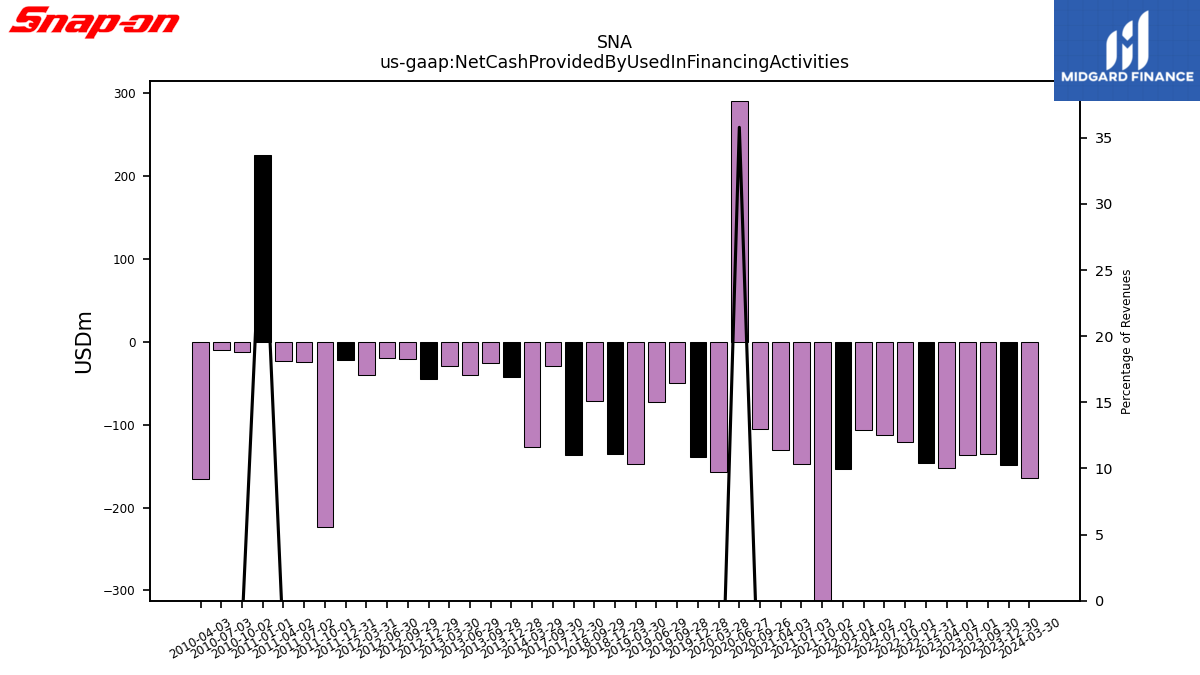
| Net Cash Provided By Used In Financing Activities | -164.20 | -149.00 | -135.30 | -136.50 | -152.10 | -145.80 | -120.70 | -112.20 | -106.30 | -154.10 | -385.80 | -147.90 | -131.00 | -105.10 | 289.50 | -157.10 | -139.20 | -49.50 | -73.10 | -147.60 | -135.10 | -71.30 | NA | NA | -136.60 | -29.50 | NA | NA | NA | NA | NA | NA | NA | NA | NA | NA | NA | NA | NA | -127.10 | -42.70 | -25.30 | -40.50 | -29.30 | -44.90 | -21.50 | -20.10 | -40.50 | -22.10 | -222.90 | -24.80 | -23.90 | 224.60 | -13.10 | -10.50 | -166.20 |
| 2024-03-30 | 2023-12-30 | 2023-09-30 | 2023-07-01 | 2023-04-01 | 2022-12-31 | 2022-10-01 | 2022-07-02 | 2022-04-02 | 2022-01-01 | 2021-10-02 | 2021-07-03 | 2021-04-03 | 2020-09-26 | 2020-06-27 | 2020-03-28 | 2019-12-28 | 2019-09-28 | 2019-06-29 | 2019-03-30 | 2018-12-29 | 2018-09-29 | 2018-06-30 | 2018-03-31 | 2017-12-30 | 2017-09-30 | 2017-07-01 | 2017-04-01 | 2016-12-31 | 2016-10-01 | 2016-07-02 | 2016-04-02 | 2016-01-02 | 2015-10-03 | 2015-07-04 | 2015-04-04 | 2015-01-03 | 2014-09-27 | 2014-06-28 | 2014-03-29 | 2013-12-28 | 2013-09-28 | 2013-06-29 | 2013-03-30 | 2012-12-29 | 2012-09-29 | 2012-06-30 | 2012-03-31 | 2011-12-31 | 2011-10-01 | 2011-07-02 | 2011-04-02 | 2011-01-01 | 2010-10-02 | 2010-07-03 | 2010-04-03 | ||
|---|---|---|---|---|---|---|---|---|---|---|---|---|---|---|---|---|---|---|---|---|---|---|---|---|---|---|---|---|---|---|---|---|---|---|---|---|---|---|---|---|---|---|---|---|---|---|---|---|---|---|---|---|---|---|---|---|---|
| Net Cash Provided By Used In Operating Activities | 348.70 | 296.90 | 285.40 | 270.30 | 301.60 | 210.60 | 129.90 | 140.80 | 193.90 | 222.70 | 186.40 | 238.20 | 319.30 | 224.00 | 253.60 | 213.40 | 196.70 | 131.10 | 145.50 | 201.30 | 215.90 | 129.80 | NA | NA | 193.50 | 95.50 | NA | NA | NA | NA | NA | NA | NA | NA | NA | NA | NA | NA | NA | 88.30 | 122.50 | 84.30 | 110.10 | 75.70 | 102.90 | 69.70 | 91.70 | 65.00 | 72.30 | 42.00 | -13.70 | 27.90 | 64.30 | 10.20 | 55.50 | 10.40 | |
| Net Income Loss | 263.50 | 255.30 | 243.10 | 264.00 | 248.70 | 238.90 | 223.90 | 231.50 | 217.40 | 223.70 | 196.20 | 208.00 | 192.60 | 179.70 | 101.20 | 137.20 | 170.60 | 164.60 | 180.40 | 177.90 | 175.00 | 163.20 | 178.70 | 163.00 | 129.50 | 133.40 | 153.20 | 141.60 | 146.30 | 131.70 | 140.10 | 128.30 | 131.40 | 116.80 | 120.00 | 110.50 | 116.20 | 103.70 | 106.10 | 95.90 | 94.50 | 84.60 | 88.40 | 82.80 | 84.60 | 74.10 | 76.40 | 71.00 | 74.30 | 67.80 | 78.00 | 56.20 | 57.90 | 46.50 | 45.30 | 36.80 | |
| Profit Loss | 269.60 | 261.30 | 249.10 | 269.90 | 254.30 | 244.50 | 229.50 | 237.20 | 222.70 | 229.10 | 201.50 | 213.20 | 197.60 | 184.70 | 105.90 | 142.00 | 175.00 | 169.20 | 184.90 | 182.10 | 179.30 | 167.40 | 182.70 | 166.80 | 133.20 | 137.10 | 156.80 | 145.10 | 149.70 | 135.20 | 143.40 | 131.30 | 134.50 | 119.90 | 123.00 | 113.20 | 118.70 | 106.40 | 108.80 | 98.20 | 96.90 | 87.00 | 90.70 | 85.10 | 86.70 | 76.40 | 78.50 | 73.00 | 76.10 | 69.80 | 79.90 | 58.00 | 59.80 | 48.30 | 46.90 | 38.00 | |
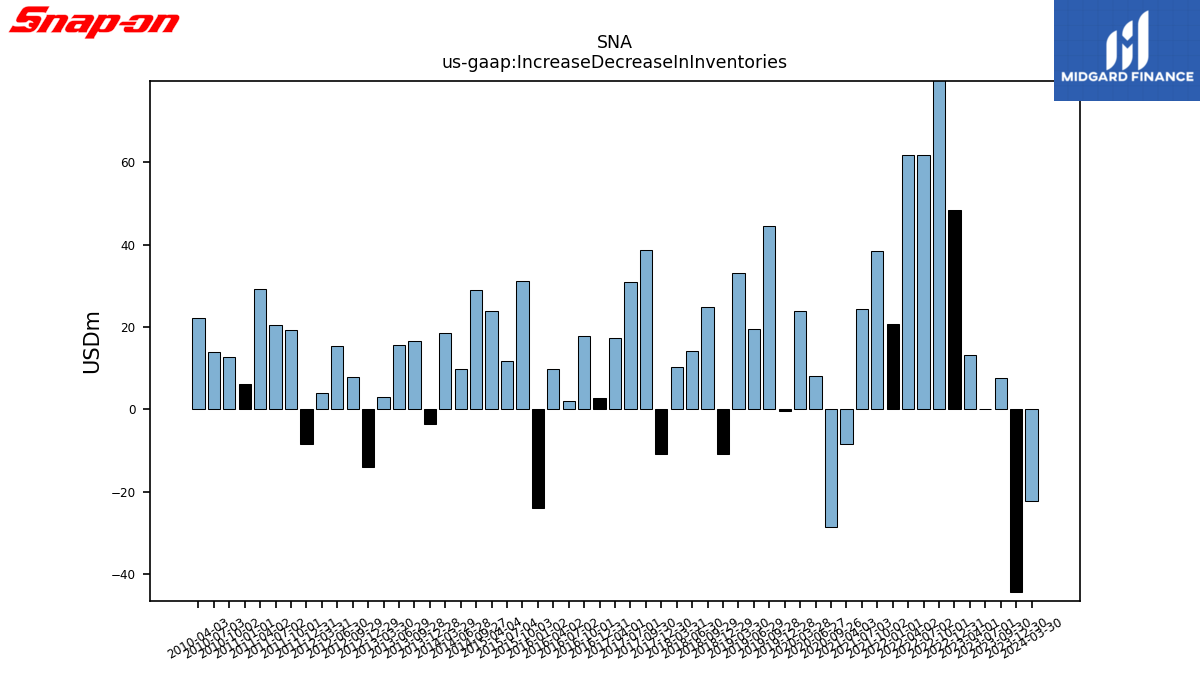
| Increase Decrease In Inventories | -22.10 | -44.30 | 7.60 | 0.20 | 13.20 | 48.30 | 100.40 | 61.70 | 61.70 | 20.80 | 38.50 | 24.40 | -8.30 | -28.40 | 8.20 | 23.80 | -0.30 | 44.50 | 19.60 | 33.20 | -10.70 | 24.80 | 14.30 | 10.20 | -10.90 | 38.60 | 31.00 | 17.30 | 2.80 | 17.90 | 2.10 | 9.90 | -23.80 | 31.30 | 11.80 | 24.00 | NA | 29.10 | 9.90 | 18.50 | -3.50 | 16.70 | 15.70 | 3.10 | -14.00 | 8.00 | 15.30 | 4.10 | -8.30 | 19.40 | 20.50 | 29.30 | 6.20 | 12.80 | 14.00 | 22.20 | |
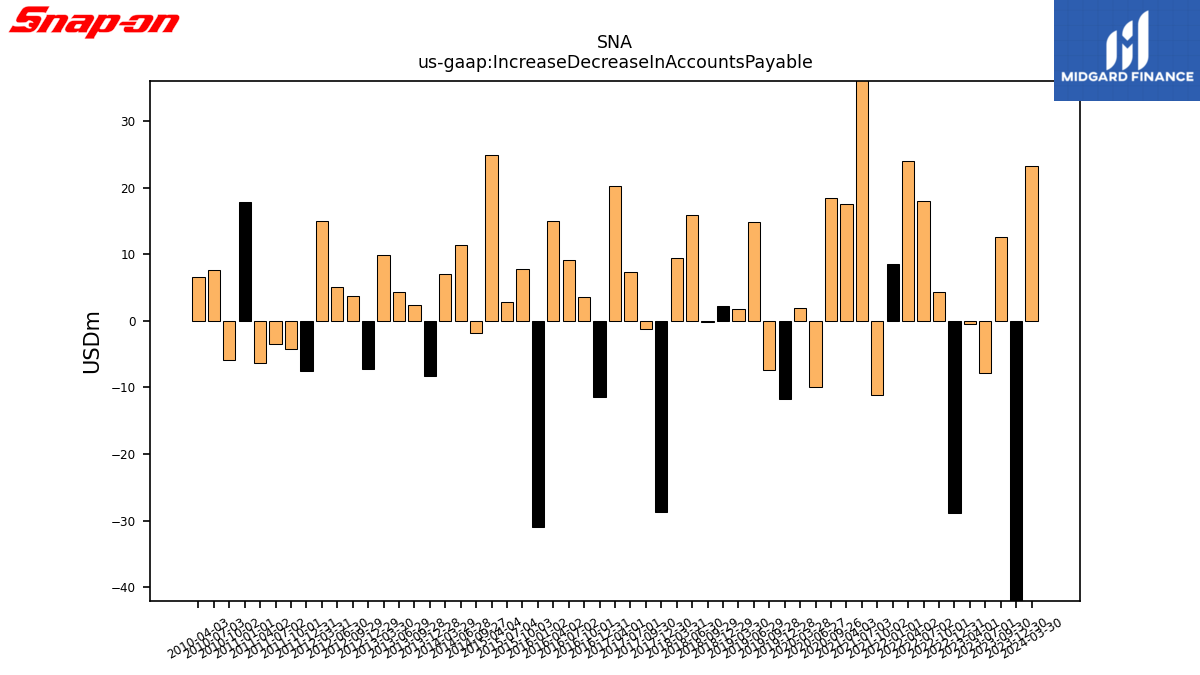
| Increase Decrease In Accounts Payable | 23.30 | -52.40 | 12.60 | -7.80 | -0.50 | -28.80 | 4.40 | 18.00 | 24.10 | 8.50 | -11.20 | 42.00 | 17.50 | 18.40 | -10.00 | 1.90 | -11.80 | -7.40 | 14.80 | 1.80 | 2.30 | -0.20 | 15.90 | 9.50 | -28.70 | -1.20 | 7.40 | 20.30 | -11.40 | 3.60 | 9.10 | 15.00 | -30.90 | 7.80 | 2.90 | 24.90 | NA | -1.80 | 11.40 | 7.00 | -8.30 | 2.40 | 4.40 | 9.90 | -7.20 | 3.70 | 5.10 | 15.00 | -7.50 | -4.20 | -3.50 | -6.30 | 17.90 | -5.90 | 7.60 | 6.60 | |
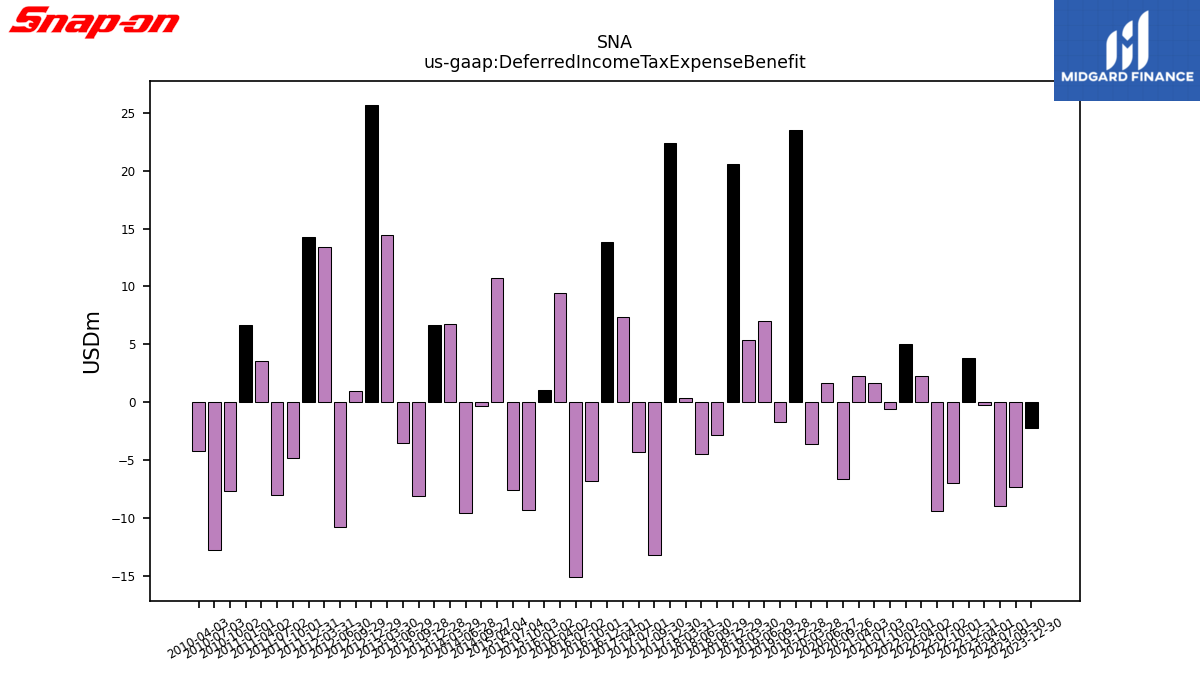
| Deferred Income Tax Expense Benefit | 1.60 | -2.20 | -7.30 | -9.00 | -0.20 | 3.80 | -7.00 | -9.40 | 2.30 | 5.00 | -0.60 | 1.70 | 2.30 | -6.60 | 1.70 | -3.60 | 23.50 | -1.70 | 7.00 | 5.40 | 20.60 | -2.80 | -4.50 | 0.40 | 22.40 | -13.20 | -4.30 | 7.40 | 13.80 | -6.80 | -15.10 | 9.40 | 1.10 | -9.30 | -7.60 | 10.70 | NA | -0.30 | -9.60 | 6.80 | 6.70 | -8.10 | -3.50 | 14.40 | 25.70 | 1.00 | -10.80 | 13.40 | 14.30 | -4.80 | -8.00 | 3.60 | 6.70 | -7.70 | -12.80 | -4.20 | |
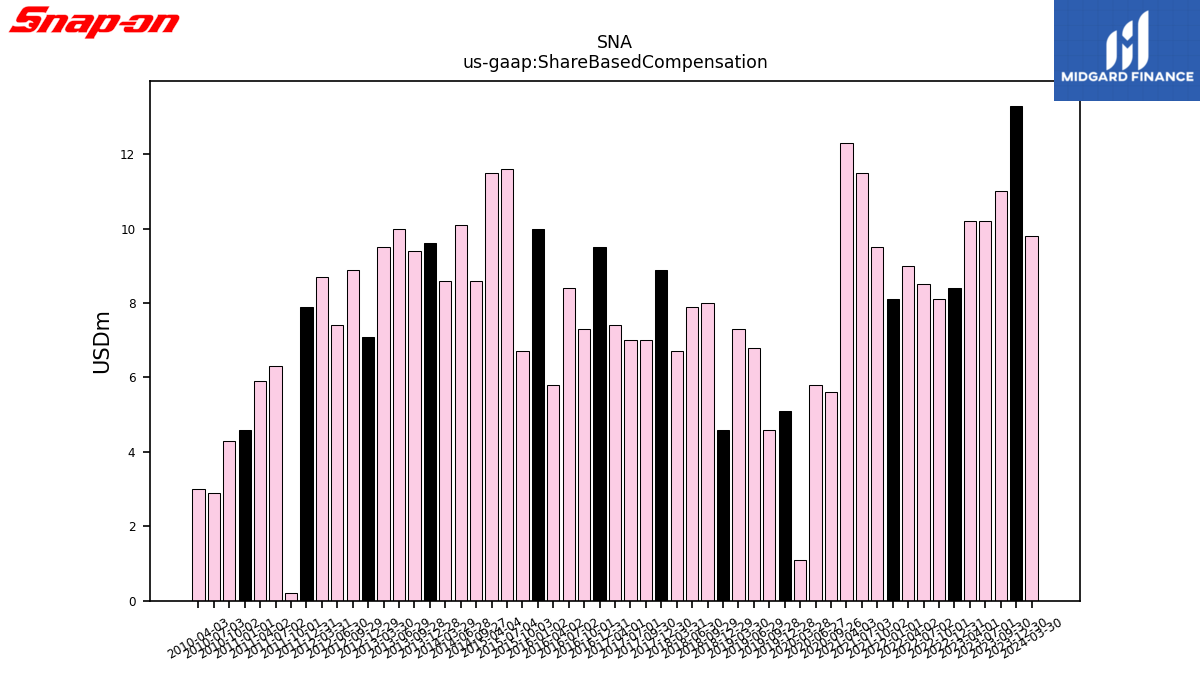
| Share Based Compensation | 9.80 | 13.30 | 11.00 | 10.20 | 10.20 | 8.40 | 8.10 | 8.50 | 9.00 | 8.10 | 9.50 | 11.50 | 12.30 | 5.60 | 5.80 | 1.10 | 5.10 | 4.60 | 6.80 | 7.30 | 4.60 | 8.00 | 7.90 | 6.70 | 8.90 | 7.00 | 7.00 | 7.40 | 9.50 | 7.30 | 8.40 | 5.80 | 10.00 | 6.70 | 11.60 | 11.50 | NA | 8.60 | 10.10 | 8.60 | 9.60 | 9.40 | 10.00 | 9.50 | 7.10 | 8.90 | 7.40 | 8.70 | 7.90 | 0.20 | 6.30 | 5.90 | 4.60 | 4.30 | 2.90 | 3.00 |
| 2024-03-30 | 2023-12-30 | 2023-09-30 | 2023-07-01 | 2023-04-01 | 2022-12-31 | 2022-10-01 | 2022-07-02 | 2022-04-02 | 2022-01-01 | 2021-10-02 | 2021-07-03 | 2021-04-03 | 2020-09-26 | 2020-06-27 | 2020-03-28 | 2019-12-28 | 2019-09-28 | 2019-06-29 | 2019-03-30 | 2018-12-29 | 2018-09-29 | 2018-06-30 | 2018-03-31 | 2017-12-30 | 2017-09-30 | 2017-07-01 | 2017-04-01 | 2016-12-31 | 2016-10-01 | 2016-07-02 | 2016-04-02 | 2016-01-02 | 2015-10-03 | 2015-07-04 | 2015-04-04 | 2015-01-03 | 2014-09-27 | 2014-06-28 | 2014-03-29 | 2013-12-28 | 2013-09-28 | 2013-06-29 | 2013-03-30 | 2012-12-29 | 2012-09-29 | 2012-06-30 | 2012-03-31 | 2011-12-31 | 2011-10-01 | 2011-07-02 | 2011-04-02 | 2011-01-01 | 2010-10-02 | 2010-07-03 | 2010-04-03 | ||
|---|---|---|---|---|---|---|---|---|---|---|---|---|---|---|---|---|---|---|---|---|---|---|---|---|---|---|---|---|---|---|---|---|---|---|---|---|---|---|---|---|---|---|---|---|---|---|---|---|---|---|---|---|---|---|---|---|---|
| Net Cash Provided By Used In Investing Activities | -63.20 | -104.60 | -59.70 | -94.60 | -72.90 | -67.90 | -57.90 | -73.80 | -6.60 | -23.80 | -29.70 | -29.70 | -207.20 | -18.80 | -45.60 | -49.80 | -41.40 | -76.80 | -65.20 | -38.70 | -60.80 | -48.60 | NA | NA | -59.00 | -62.10 | NA | NA | NA | NA | NA | NA | NA | NA | NA | NA | NA | NA | NA | -50.90 | -44.50 | -51.90 | -107.50 | -46.50 | -19.50 | -46.80 | -57.50 | -49.30 | -49.40 | -48.90 | -61.50 | -59.80 | -76.90 | -69.90 | -85.40 | -70.80 |
| 2024-03-30 | 2023-12-30 | 2023-09-30 | 2023-07-01 | 2023-04-01 | 2022-12-31 | 2022-10-01 | 2022-07-02 | 2022-04-02 | 2022-01-01 | 2021-10-02 | 2021-07-03 | 2021-04-03 | 2020-09-26 | 2020-06-27 | 2020-03-28 | 2019-12-28 | 2019-09-28 | 2019-06-29 | 2019-03-30 | 2018-12-29 | 2018-09-29 | 2018-06-30 | 2018-03-31 | 2017-12-30 | 2017-09-30 | 2017-07-01 | 2017-04-01 | 2016-12-31 | 2016-10-01 | 2016-07-02 | 2016-04-02 | 2016-01-02 | 2015-10-03 | 2015-07-04 | 2015-04-04 | 2015-01-03 | 2014-09-27 | 2014-06-28 | 2014-03-29 | 2013-12-28 | 2013-09-28 | 2013-06-29 | 2013-03-30 | 2012-12-29 | 2012-09-29 | 2012-06-30 | 2012-03-31 | 2011-12-31 | 2011-10-01 | 2011-07-02 | 2011-04-02 | 2011-01-01 | 2010-10-02 | 2010-07-03 | 2010-04-03 | ||
|---|---|---|---|---|---|---|---|---|---|---|---|---|---|---|---|---|---|---|---|---|---|---|---|---|---|---|---|---|---|---|---|---|---|---|---|---|---|---|---|---|---|---|---|---|---|---|---|---|---|---|---|---|---|---|---|---|---|
| Net Cash Provided By Used In Financing Activities | -164.20 | -149.00 | -135.30 | -136.50 | -152.10 | -145.80 | -120.70 | -112.20 | -106.30 | -154.10 | -385.80 | -147.90 | -131.00 | -105.10 | 289.50 | -157.10 | -139.20 | -49.50 | -73.10 | -147.60 | -135.10 | -71.30 | NA | NA | -136.60 | -29.50 | NA | NA | NA | NA | NA | NA | NA | NA | NA | NA | NA | NA | NA | -127.10 | -42.70 | -25.30 | -40.50 | -29.30 | -44.90 | -21.50 | -20.10 | -40.50 | -22.10 | -222.90 | -24.80 | -23.90 | 224.60 | -13.10 | -10.50 | -166.20 | |
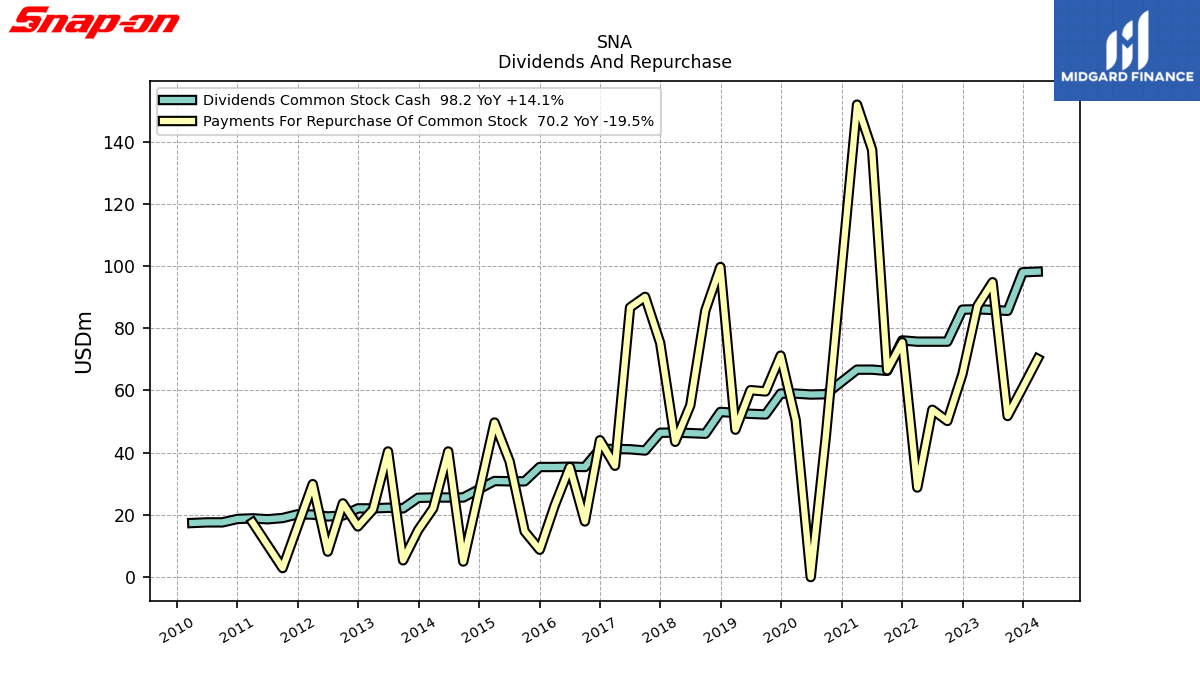
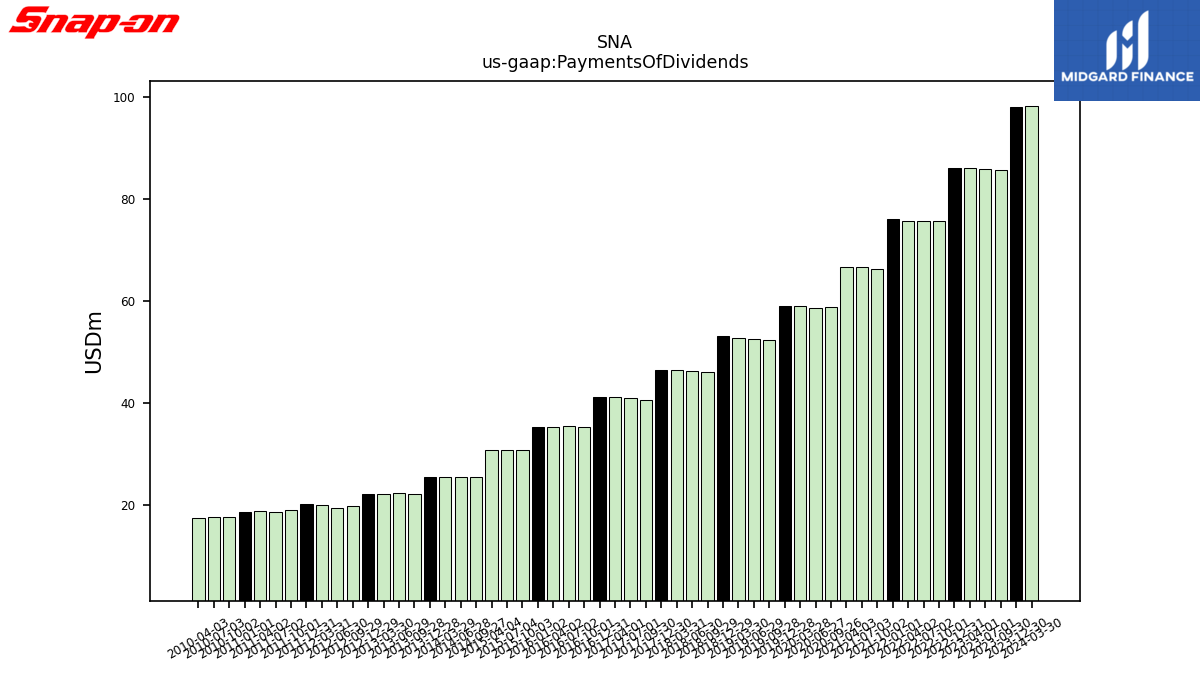
| Payments Of Dividends | 98.20 | 98.00 | 85.60 | 85.90 | 86.10 | 86.00 | 75.70 | 75.70 | 75.70 | 76.10 | 66.30 | 66.70 | 66.70 | 58.80 | 58.70 | 59.00 | 59.00 | 52.30 | 52.50 | 52.80 | 53.10 | 46.10 | 46.30 | 46.50 | 46.40 | 40.70 | 41.10 | 41.20 | 41.20 | 35.40 | 35.50 | 35.40 | 35.40 | 30.80 | 30.80 | 30.90 | NA | 25.60 | 25.60 | 25.60 | 25.50 | 22.10 | 22.30 | 22.10 | 22.10 | 19.80 | 19.50 | 20.10 | 20.20 | 19.00 | 18.60 | 18.90 | 18.70 | 17.60 | 17.60 | 17.40 | |
| Payments For Repurchase Of Common Stock | 70.20 | 60.90 | 51.80 | 94.80 | 87.20 | 65.30 | 50.20 | 53.80 | 28.80 | 75.50 | 66.50 | 137.40 | 151.90 | 45.10 | 0.00 | 50.50 | 71.20 | 59.70 | 60.10 | 47.40 | 99.70 | 85.70 | 55.20 | 43.50 | 75.30 | 90.10 | 86.70 | 35.80 | 44.00 | 17.90 | 35.40 | 23.10 | 8.80 | 14.70 | 37.20 | 49.70 | NA | 5.00 | 40.40 | 22.10 | 15.10 | 5.40 | 40.40 | 21.70 | 16.30 | 23.70 | 8.20 | 29.90 | NA | 2.90 | NA | 17.60 | NA | NA | NA | NA |
| 2024-03-30 | 2023-12-30 | 2023-09-30 | 2023-07-01 | 2023-04-01 | 2022-12-31 | 2022-10-01 | 2022-07-02 | 2022-04-02 | 2022-01-01 | 2021-10-02 | 2021-07-03 | 2021-04-03 | 2020-09-26 | 2020-06-27 | 2020-03-28 | 2019-12-28 | 2019-09-28 | 2019-06-29 | 2019-03-30 | 2018-12-29 | 2018-09-29 | 2018-06-30 | 2018-03-31 | 2017-12-30 | 2017-09-30 | 2017-07-01 | 2017-04-01 | 2016-12-31 | 2016-10-01 | 2016-07-02 | 2016-04-02 | 2016-01-02 | 2015-10-03 | 2015-07-04 | 2015-04-04 | 2015-01-03 | 2014-09-27 | 2014-06-28 | 2014-03-29 | 2013-12-28 | 2013-09-28 | 2013-06-29 | 2013-03-30 | 2012-12-29 | 2012-09-29 | 2012-06-30 | 2012-03-31 | 2011-12-31 | 2011-10-01 | 2011-07-02 | 2011-04-02 | 2011-01-01 | 2010-10-02 | 2010-07-03 | 2010-04-03 | ||
|---|---|---|---|---|---|---|---|---|---|---|---|---|---|---|---|---|---|---|---|---|---|---|---|---|---|---|---|---|---|---|---|---|---|---|---|---|---|---|---|---|---|---|---|---|---|---|---|---|---|---|---|---|---|---|---|---|---|
| Revenues | 1281.90 | 1293.80 | 1254.20 | 1284.70 | 1275.60 | 1244.20 | 1189.80 | 1223.00 | 1185.50 | 1195.20 | 1125.00 | 1168.30 | 1113.20 | 1027.40 | 808.90 | 938.10 | 1039.10 | 985.90 | 1035.40 | 1007.30 | 1035.20 | 980.10 | 1036.60 | 1018.50 | 974.60 | 982.80 | 999.10 | 963.90 | 889.80 | 905.70 | 941.60 | 900.50 | 851.70 | 882.60 | 910.50 | 885.20 | 857.40 | 859.90 | 878.20 | 837.70 | 797.50 | 798.30 | 808.60 | 785.70 | 753.20 | 752.10 | 777.80 | 773.20 | 736.60 | 697.20 | 726.70 | 693.70 | 696.90 | 653.10 | 647.60 | 621.60 | |
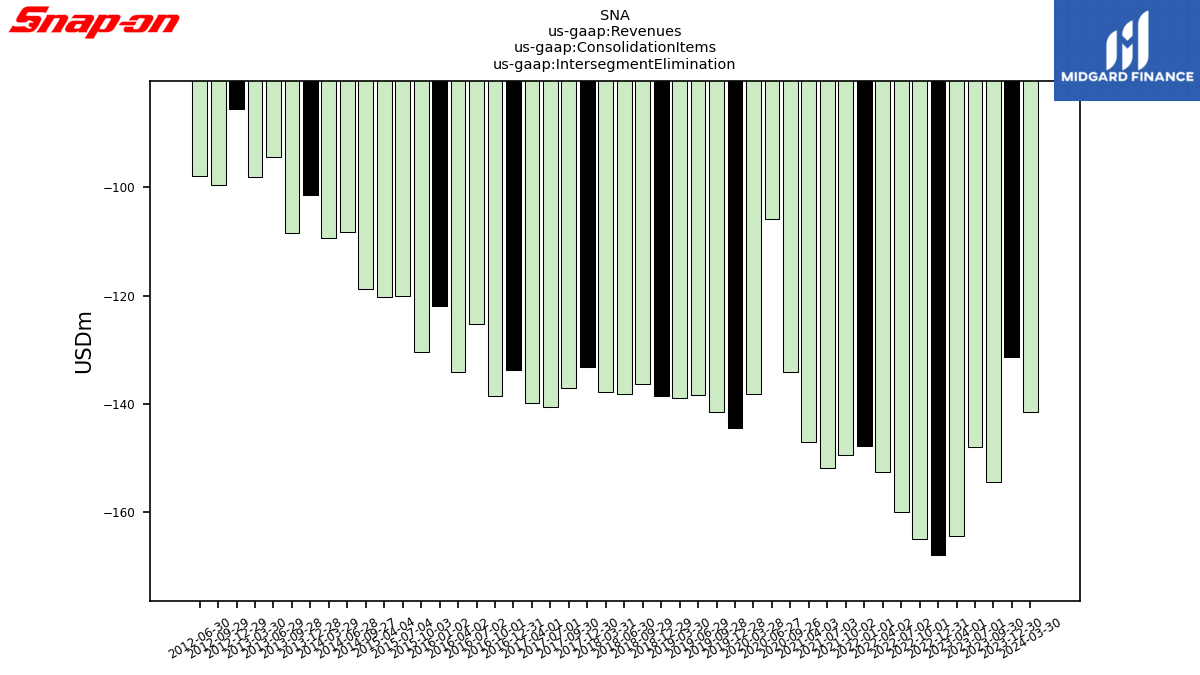
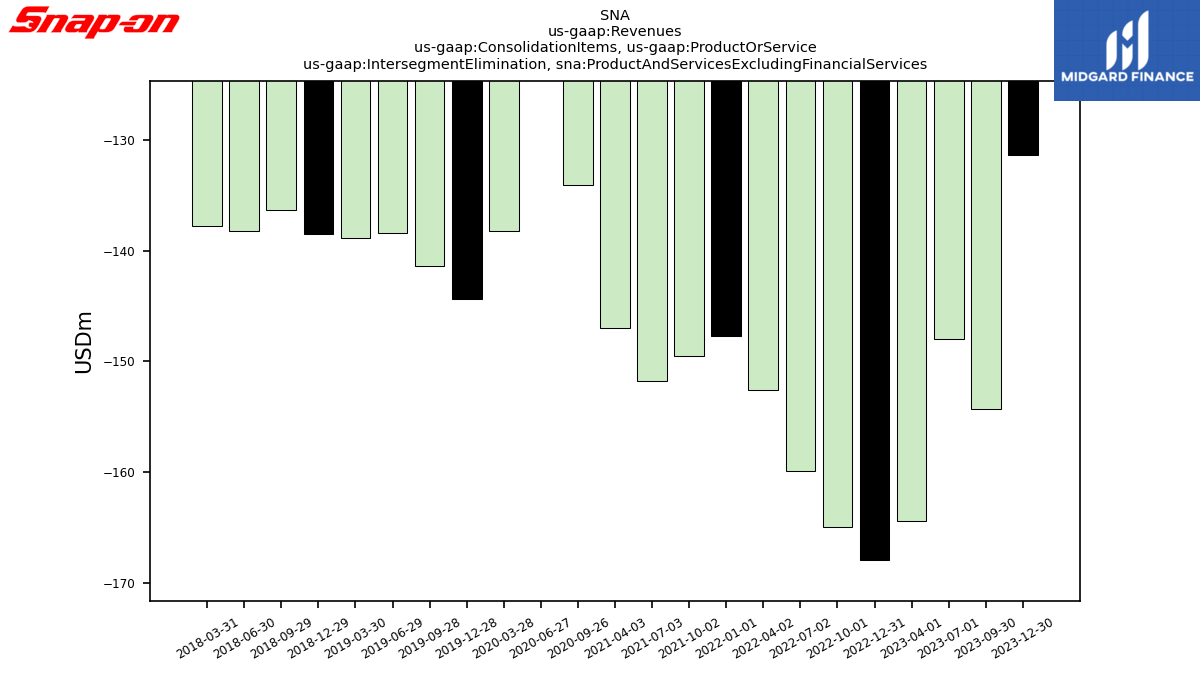
| Intersegment Elimination | -141.50 | -131.40 | -154.30 | -148.00 | -164.40 | -167.90 | -164.90 | -159.90 | -152.60 | -147.70 | -149.50 | -151.80 | -147.00 | -134.10 | -105.90 | -138.20 | -144.40 | -141.40 | -138.40 | -138.90 | -138.50 | -136.30 | -138.20 | -137.80 | -133.10 | -137.00 | -140.50 | -139.80 | -133.80 | -138.50 | -125.30 | -134.10 | -121.90 | -130.50 | -120.10 | -120.20 | NA | -118.70 | -108.30 | -109.40 | -101.40 | -108.50 | -94.50 | -98.10 | -85.60 | -99.60 | -97.90 | NA | NA | NA | NA | NA | NA | NA | NA | NA | |
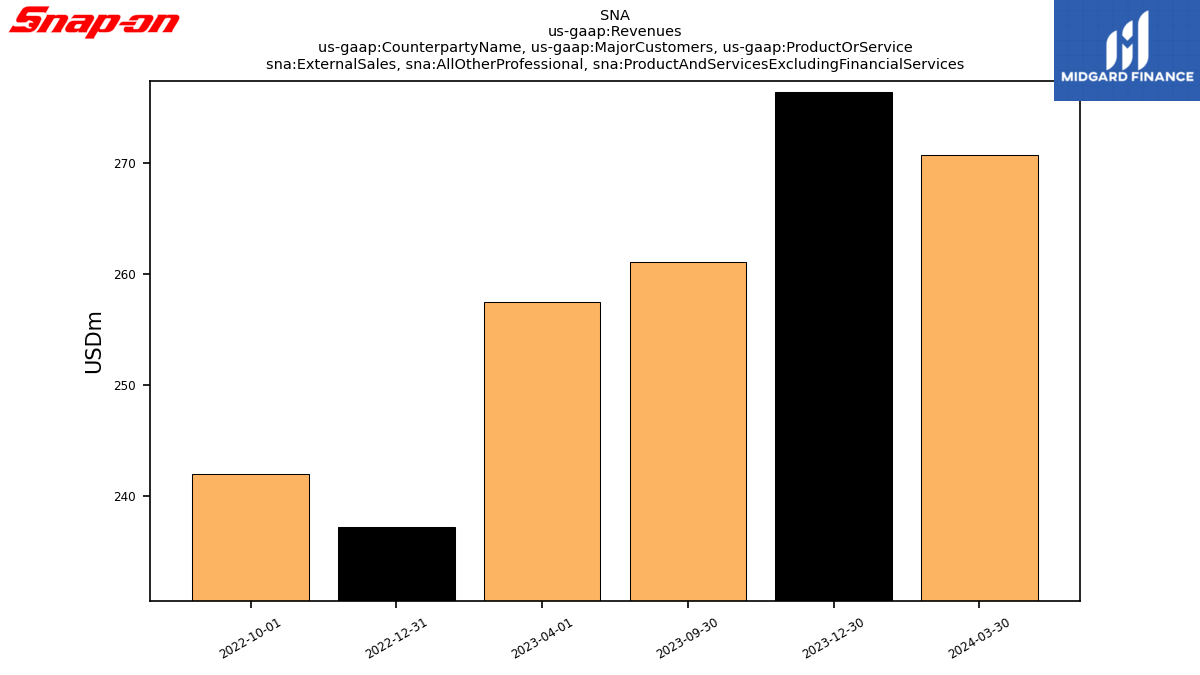
| Operating, External Sales, All Other Professional, Product And Services Excluding Financial Services, Commercial And Industrial Group | 270.70 | 276.40 | 261.10 | NA | 257.50 | 237.30 | 242.00 | NA | NA | NA | NA | NA | NA | NA | NA | NA | NA | NA | NA | NA | NA | NA | NA | NA | NA | NA | NA | NA | NA | NA | NA | NA | NA | NA | NA | NA | NA | NA | NA | NA | NA | NA | NA | NA | NA | NA | NA | NA | NA | NA | NA | NA | NA | NA | NA | NA | |
| Operating, External Sales, Vehicle Service Professionals, Product And Services Excluding Financial Services, Commercial And Industrial Group | 20.30 | 20.30 | 19.40 | NA | 21.10 | 20.90 | 20.80 | NA | NA | NA | NA | NA | NA | NA | NA | NA | NA | NA | NA | NA | NA | NA | NA | NA | NA | NA | NA | NA | NA | NA | NA | NA | NA | NA | NA | NA | NA | NA | NA | NA | NA | NA | NA | NA | NA | NA | NA | NA | NA | NA | NA | NA | NA | NA | NA | NA | |
| Operating, External Sales, Vehicle Service Professionals, Product And Services Excluding Financial Services, Repair Systems And Information Group | 391.20 | 386.60 | 363.40 | NA | 367.40 | 355.00 | 343.10 | NA | NA | NA | NA | NA | NA | NA | NA | NA | NA | NA | NA | NA | NA | NA | NA | NA | NA | NA | NA | NA | NA | NA | NA | NA | NA | NA | NA | NA | NA | NA | NA | NA | NA | NA | NA | NA | NA | NA | NA | NA | NA | NA | NA | NA | NA | NA | NA | NA | |
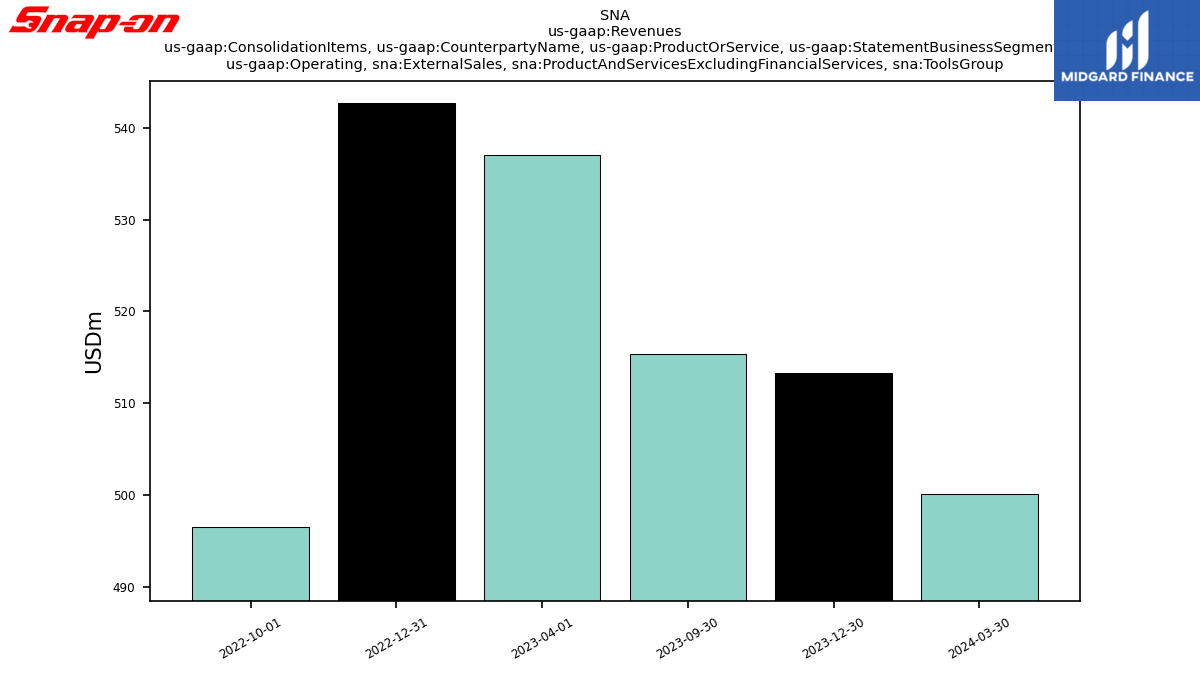
| Operating, External Sales, Vehicle Service Professionals, Product And Services Excluding Financial Services, Tools Group | 500.10 | 513.30 | 515.40 | NA | 537.00 | 542.70 | 496.60 | NA | NA | NA | NA | NA | NA | NA | NA | NA | NA | NA | NA | NA | NA | NA | NA | NA | NA | NA | NA | NA | NA | NA | NA | NA | NA | NA | NA | NA | NA | NA | NA | NA | NA | NA | NA | NA | NA | NA | NA | NA | NA | NA | NA | NA | NA | NA | NA | NA | |
| Operating, External Sales, Product And Services Excluding Financial Services, Commercial And Industrial Group | 291.00 | 296.70 | 280.50 | NA | 278.60 | 258.20 | 262.80 | NA | NA | NA | NA | NA | NA | NA | NA | NA | NA | NA | NA | NA | NA | NA | NA | NA | NA | NA | NA | NA | NA | NA | NA | NA | NA | NA | NA | NA | NA | NA | NA | NA | NA | NA | NA | NA | NA | NA | NA | NA | NA | NA | NA | NA | NA | NA | NA | NA | |
| Operating, External Sales, Product And Services Excluding Financial Services, Repair Systems And Information Group | 391.20 | 386.60 | 363.40 | NA | 367.40 | 355.00 | 343.10 | NA | NA | NA | NA | NA | NA | NA | NA | NA | NA | NA | NA | NA | NA | NA | NA | NA | NA | NA | NA | NA | NA | NA | NA | NA | NA | NA | NA | NA | NA | NA | NA | NA | NA | NA | NA | NA | NA | NA | NA | NA | NA | NA | NA | NA | NA | NA | NA | NA | |
| Operating, External Sales, Product And Services Excluding Financial Services, Tools Group | 500.10 | 513.30 | 515.40 | NA | 537.00 | 542.70 | 496.60 | NA | NA | NA | NA | NA | NA | NA | NA | NA | NA | NA | NA | NA | NA | NA | NA | NA | NA | NA | NA | NA | NA | NA | NA | NA | NA | NA | NA | NA | NA | NA | NA | NA | NA | NA | NA | NA | NA | NA | NA | NA | NA | NA | NA | NA | NA | NA | NA | NA | |
| Operating, External Sales, Product And Services Excluding Financial Services,, Commercial And Industrial Group | 81.00 | 75.60 | 69.60 | NA | 75.00 | 68.00 | 62.00 | NA | NA | NA | NA | NA | NA | NA | NA | NA | NA | NA | NA | NA | NA | NA | NA | NA | NA | NA | NA | NA | NA | NA | NA | NA | NA | NA | NA | NA | NA | NA | NA | NA | NA | NA | NA | NA | NA | NA | NA | NA | NA | NA | NA | NA | NA | NA | NA | NA | |
| Operating, External Sales, Product And Services Excluding Financial Services,, Repair Systems And Information Group | 62.10 | 62.70 | 54.00 | NA | 63.20 | 53.30 | 51.90 | NA | NA | NA | NA | NA | NA | NA | NA | NA | NA | NA | NA | NA | NA | NA | NA | NA | NA | NA | NA | NA | NA | NA | NA | NA | NA | NA | NA | NA | NA | NA | NA | NA | NA | NA | NA | NA | NA | NA | NA | NA | NA | NA | NA | NA | NA | NA | NA | NA | |
| Operating, External Sales, Product And Services Excluding Financial Services,, Tools Group | 39.60 | 37.50 | 37.50 | NA | 35.70 | 31.60 | 29.80 | NA | NA | NA | NA | NA | NA | NA | NA | NA | NA | NA | NA | NA | NA | NA | NA | NA | NA | NA | NA | NA | NA | NA | NA | NA | NA | NA | NA | NA | NA | NA | NA | NA | NA | NA | NA | NA | NA | NA | NA | NA | NA | NA | NA | NA | NA | NA | NA | NA | |
| Operating, External Sales, Product And Services Excluding Financial Services,, Commercial And Industrial Group | 148.60 | 152.20 | 146.40 | NA | 137.60 | 127.70 | 128.20 | NA | NA | NA | NA | NA | NA | NA | NA | NA | NA | NA | NA | NA | NA | NA | NA | NA | NA | NA | NA | NA | NA | NA | NA | NA | NA | NA | NA | NA | NA | NA | NA | NA | NA | NA | NA | NA | NA | NA | NA | NA | NA | NA | NA | NA | NA | NA | NA | NA | |
| Operating, External Sales, Product And Services Excluding Financial Services,, Repair Systems And Information Group | 302.10 | 296.80 | 282.00 | NA | 281.80 | 279.80 | 268.80 | NA | NA | NA | NA | NA | NA | NA | NA | NA | NA | NA | NA | NA | NA | NA | NA | NA | NA | NA | NA | NA | NA | NA | NA | NA | NA | NA | NA | NA | NA | NA | NA | NA | NA | NA | NA | NA | NA | NA | NA | NA | NA | NA | NA | NA | NA | NA | NA | NA | |
| Operating, External Sales, Product And Services Excluding Financial Services,, Tools Group | 433.30 | 454.60 | 451.40 | NA | 473.90 | 491.60 | 440.60 | NA | NA | NA | NA | NA | NA | NA | NA | NA | NA | NA | NA | NA | NA | NA | NA | NA | NA | NA | NA | NA | NA | NA | NA | NA | NA | NA | NA | NA | NA | NA | NA | NA | NA | NA | NA | NA | NA | NA | NA | NA | NA | NA | NA | NA | NA | NA | NA | NA | |
| Operating, External Sales, Product And Services Excluding Financial Services, Other Geographical Areas, Commercial And Industrial Group | 61.40 | 68.90 | 64.50 | NA | 66.00 | 62.50 | 72.60 | NA | NA | NA | NA | NA | NA | NA | NA | NA | NA | NA | NA | NA | NA | NA | NA | NA | NA | NA | NA | NA | NA | NA | NA | NA | NA | NA | NA | NA | NA | NA | NA | NA | NA | NA | NA | NA | NA | NA | NA | NA | NA | NA | NA | NA | NA | NA | NA | NA | |
| Operating, External Sales, Product And Services Excluding Financial Services, Other Geographical Areas, Repair Systems And Information Group | 27.00 | 27.10 | 27.40 | NA | 22.40 | 21.90 | 22.40 | NA | NA | NA | NA | NA | NA | NA | NA | NA | NA | NA | NA | NA | NA | NA | NA | NA | NA | NA | NA | NA | NA | NA | NA | NA | NA | NA | NA | NA | NA | NA | NA | NA | NA | NA | NA | NA | NA | NA | NA | NA | NA | NA | NA | NA | NA | NA | NA | NA | |
| Operating, External Sales, Product And Services Excluding Financial Services, Other Geographical Areas, Tools Group | 27.20 | 21.20 | 26.50 | NA | 27.40 | 19.50 | 26.20 | NA | NA | NA | NA | NA | NA | NA | NA | NA | NA | NA | NA | NA | NA | NA | NA | NA | NA | NA | NA | NA | NA | NA | NA | NA | NA | NA | NA | NA | NA | NA | NA | NA | NA | NA | NA | NA | NA | NA | NA | NA | NA | NA | NA | NA | NA | NA | NA | NA | |
| Intersegment Elimination, Product And Services Excluding Financial Services | -141.50 | -131.40 | -154.30 | -148.00 | -164.40 | -167.90 | -164.90 | -159.90 | -152.60 | -147.70 | -149.50 | -151.80 | -147.00 | -134.10 | -105.90 | -138.20 | -144.40 | -141.40 | -138.40 | -138.90 | -138.50 | -136.30 | -138.20 | -137.80 | NA | NA | NA | NA | NA | NA | NA | NA | NA | NA | NA | NA | NA | NA | NA | NA | NA | NA | NA | NA | NA | NA | NA | NA | NA | NA | NA | NA | NA | NA | NA | NA | |
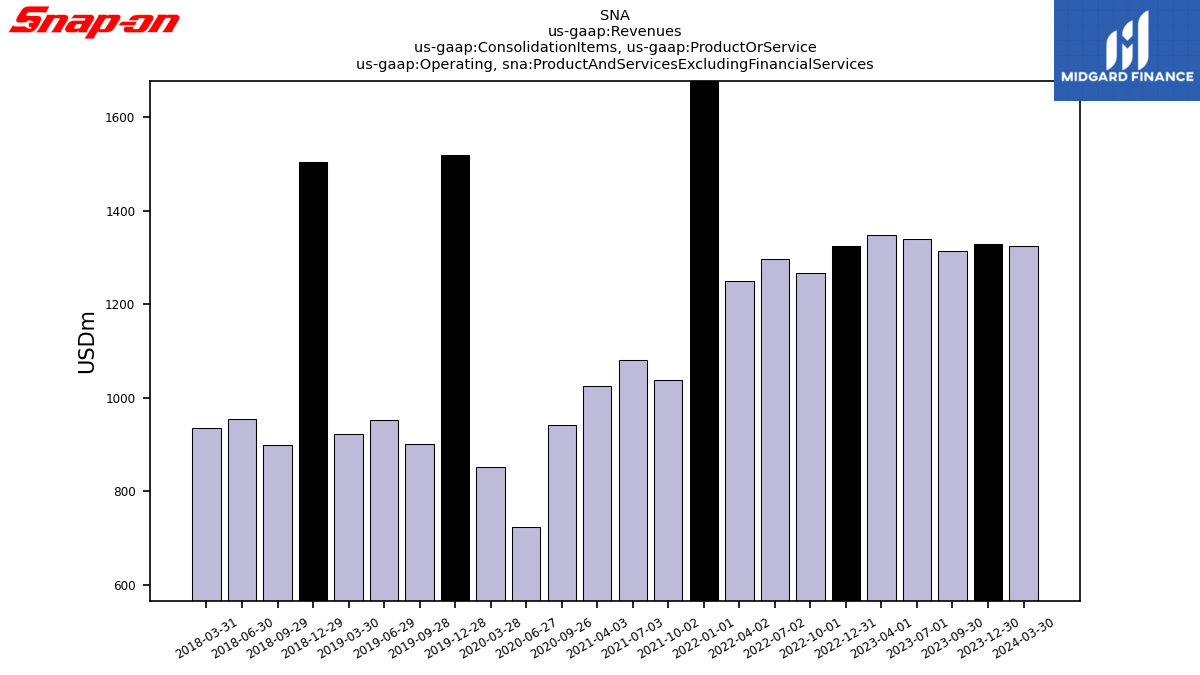
| Operating, Product And Services Excluding Financial Services | 1323.80 | 1328.00 | 1313.60 | 1339.30 | 1347.40 | 1323.80 | 1267.40 | 1296.50 | 1250.40 | 1704.30 | 1037.70 | 1081.40 | 1024.60 | 941.60 | 724.30 | 852.20 | 1518.30 | 901.80 | 951.30 | 921.70 | 1503.30 | 898.10 | 954.60 | 935.50 | NA | NA | NA | NA | NA | NA | NA | NA | NA | NA | NA | NA | NA | NA | NA | NA | NA | NA | NA | NA | NA | NA | NA | NA | NA | NA | NA | NA | NA | NA | NA | NA | |
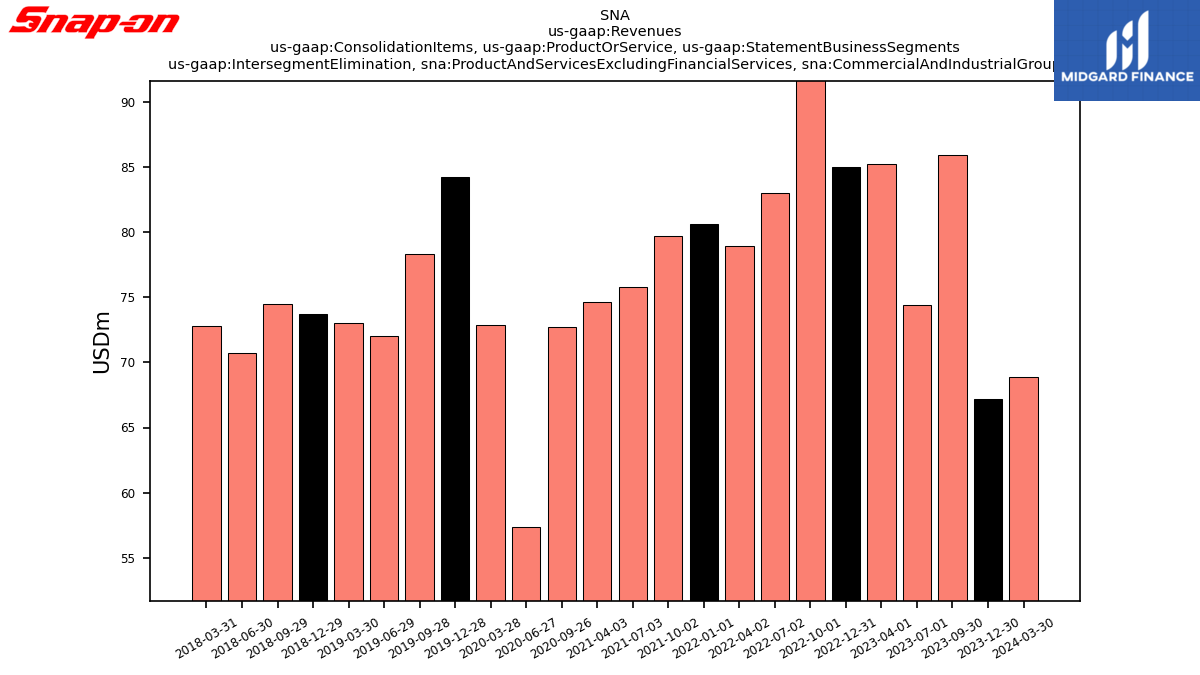
| Intersegment Elimination, Product And Services Excluding Financial Services, Commercial And Industrial Group | 68.90 | 67.20 | 85.90 | 74.40 | 85.20 | 85.00 | 94.00 | 83.00 | 78.90 | 80.60 | 79.70 | 75.80 | 74.60 | 72.70 | 57.40 | 72.90 | 84.20 | 78.30 | 72.00 | 73.00 | 73.70 | 74.50 | 70.70 | 72.80 | NA | NA | NA | NA | NA | NA | NA | NA | NA | NA | NA | NA | NA | NA | NA | NA | NA | NA | NA | NA | NA | NA | NA | NA | NA | NA | NA | NA | NA | NA | NA | NA | |
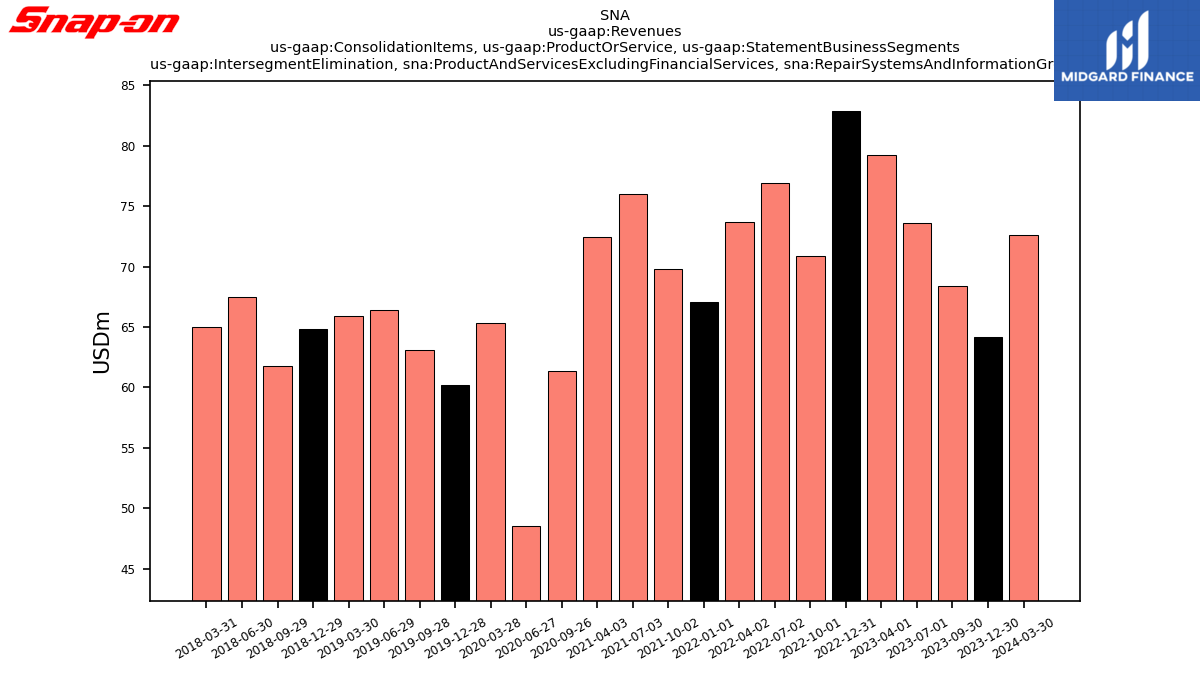
| Intersegment Elimination, Product And Services Excluding Financial Services, Repair Systems And Information Group | 72.60 | 64.20 | 68.40 | 73.60 | 79.20 | 82.90 | 70.90 | 76.90 | 73.70 | 67.10 | 69.80 | 76.00 | 72.40 | 61.40 | 48.50 | 65.30 | 60.20 | 63.10 | 66.40 | 65.90 | 64.80 | 61.80 | 67.50 | 65.00 | NA | NA | NA | NA | NA | NA | NA | NA | NA | NA | NA | NA | NA | NA | NA | NA | NA | NA | NA | NA | NA | NA | NA | NA | NA | NA | NA | NA | NA | NA | NA | NA | |
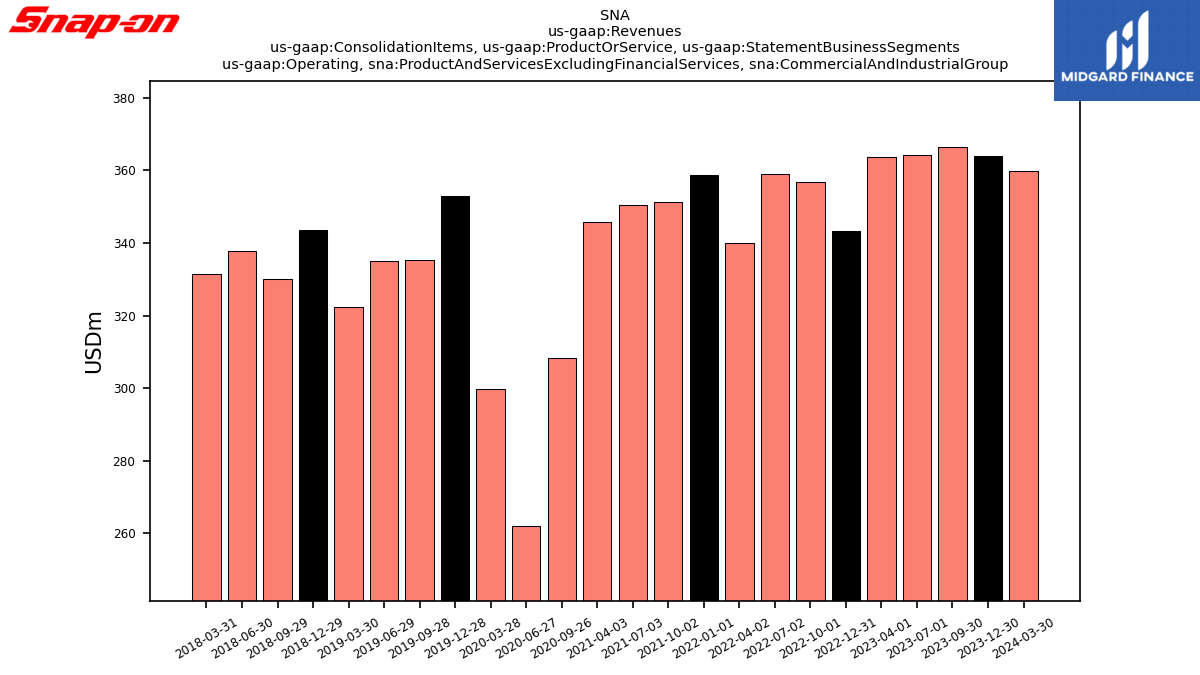
| Operating, Product And Services Excluding Financial Services, Commercial And Industrial Group | 359.90 | 363.90 | 366.40 | 364.20 | 363.80 | 343.20 | 356.80 | 359.10 | 340.10 | 358.70 | 351.40 | 350.50 | 345.70 | 308.40 | 261.90 | 299.90 | 352.90 | 335.30 | 335.00 | 322.50 | 343.70 | 330.20 | 337.80 | 331.60 | NA | NA | NA | NA | NA | NA | NA | NA | NA | NA | NA | NA | NA | NA | NA | NA | NA | NA | NA | NA | NA | NA | NA | NA | NA | NA | NA | NA | NA | NA | NA | NA | |
| Operating, Product And Services Excluding Financial Services, Repair Systems And Information Group | 463.80 | 450.80 | 431.80 | 452.00 | 446.60 | 437.90 | 414.00 | 416.80 | 398.20 | 392.50 | 364.40 | 398.60 | 347.60 | 317.50 | 245.00 | 314.60 | 335.00 | 322.70 | 348.90 | 327.90 | 339.90 | 314.40 | 343.10 | 337.00 | NA | NA | NA | NA | NA | NA | NA | NA | NA | NA | NA | NA | NA | NA | NA | NA | NA | NA | NA | NA | NA | NA | NA | NA | NA | NA | NA | NA | NA | NA | NA | NA | |
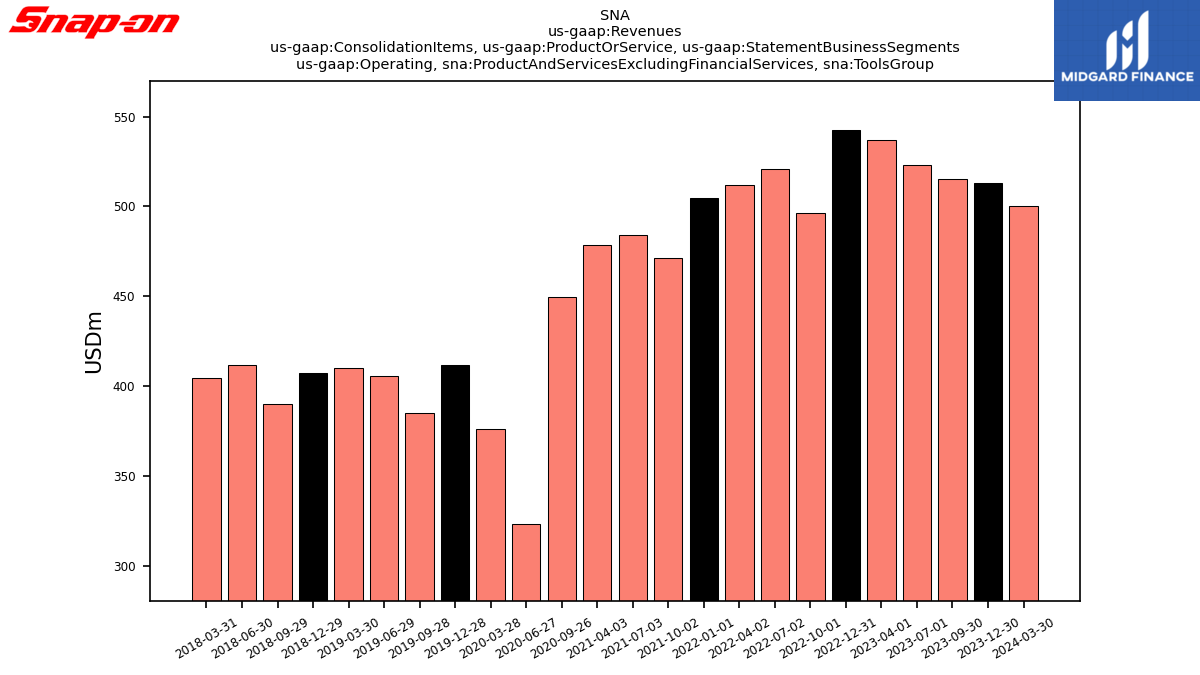
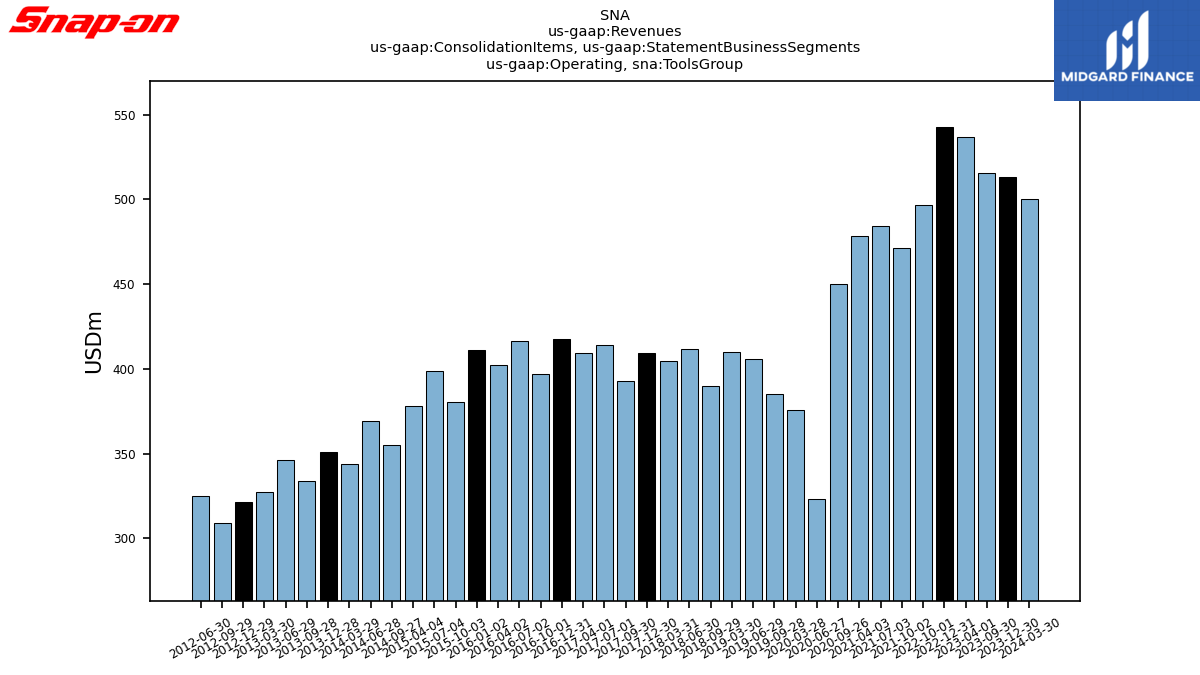
| Operating, Product And Services Excluding Financial Services, Tools Group | 500.10 | 513.30 | 515.40 | 523.10 | 537.00 | 542.70 | 496.60 | 520.60 | 512.10 | 504.80 | 471.40 | 484.10 | 478.30 | 449.80 | 323.30 | 375.90 | 411.70 | 385.20 | 405.80 | 410.20 | 407.40 | 389.80 | 411.90 | 404.70 | NA | NA | NA | NA | NA | NA | NA | NA | NA | NA | NA | NA | NA | NA | NA | NA | NA | NA | NA | NA | NA | NA | NA | NA | NA | NA | NA | NA | NA | NA | NA | NA | |
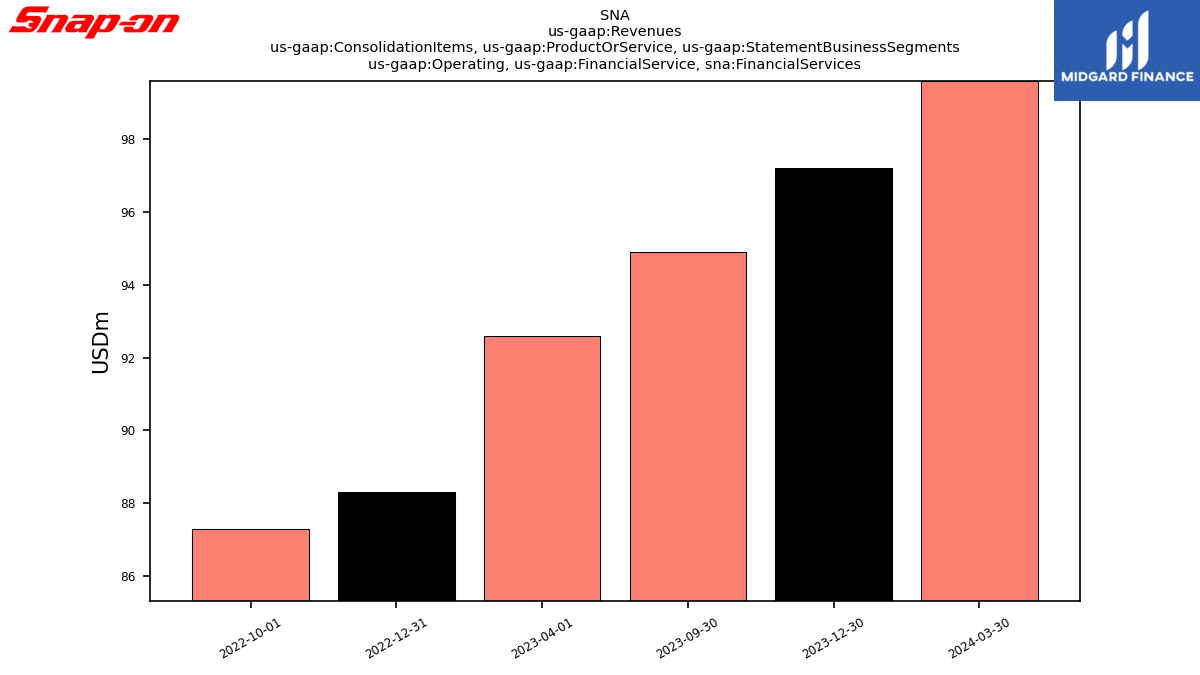
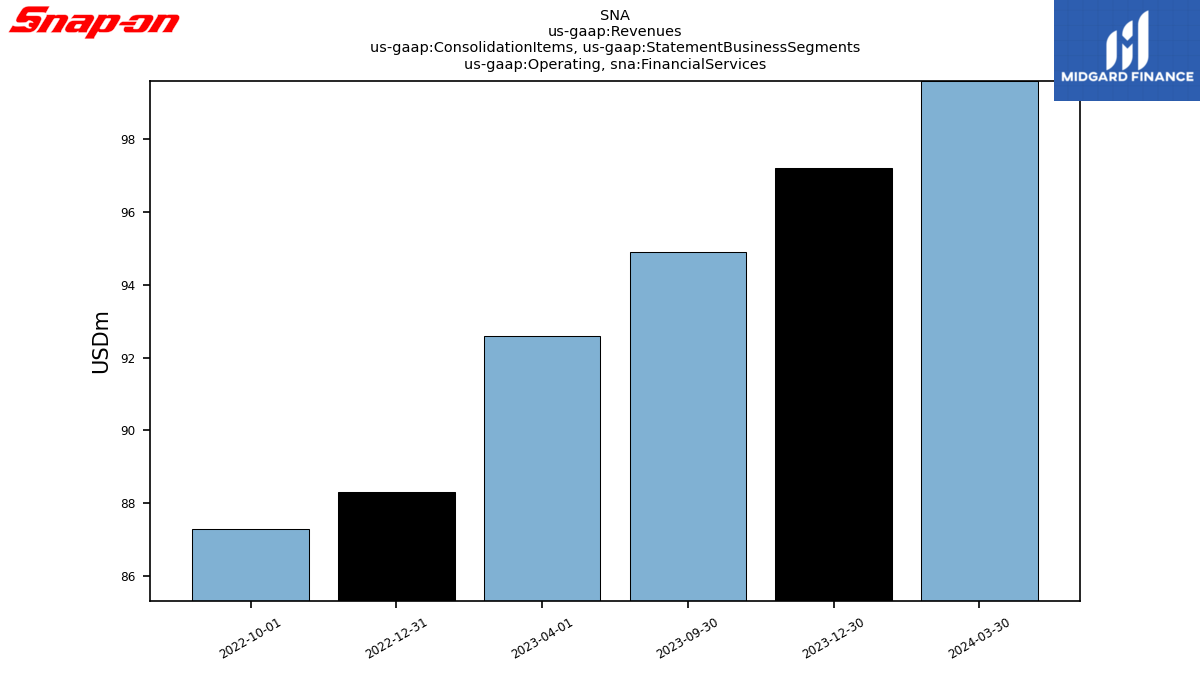
| Operating, Financial Service, Financial Services | 99.60 | 97.20 | 94.90 | NA | 92.60 | 88.30 | 87.30 | NA | NA | NA | NA | NA | NA | NA | NA | NA | NA | NA | NA | NA | NA | NA | NA | NA | NA | NA | NA | NA | NA | NA | NA | NA | NA | NA | NA | NA | NA | NA | NA | NA | NA | NA | NA | NA | NA | NA | NA | NA | NA | NA | NA | NA | NA | NA | NA | NA | |
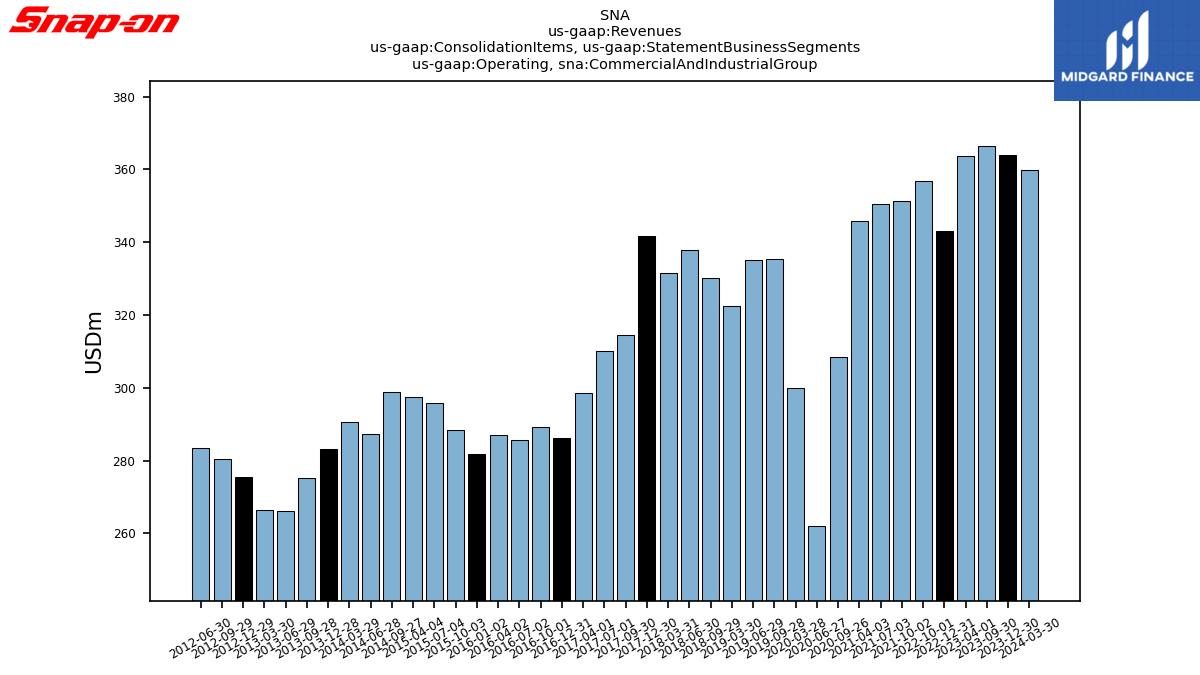
| Operating, Commercial And Industrial Group | 359.90 | 363.90 | 366.40 | NA | 363.80 | 343.20 | 356.80 | NA | NA | NA | 351.40 | 350.50 | 345.70 | 308.40 | 261.90 | 299.90 | NA | 335.30 | 335.00 | 322.50 | NA | 330.20 | 337.80 | 331.60 | 341.70 | 314.60 | 310.00 | 298.70 | 286.30 | 289.30 | 285.70 | 287.00 | 281.80 | 288.50 | 295.80 | 297.50 | NA | 298.80 | 287.20 | 290.60 | 283.20 | 275.20 | 266.20 | 266.40 | 275.60 | 280.40 | 283.40 | NA | NA | NA | NA | NA | NA | NA | NA | NA | |
| Operating, Financial Services | 99.60 | 97.20 | 94.90 | NA | 92.60 | 88.30 | 87.30 | NA | NA | NA | NA | NA | NA | NA | NA | NA | NA | NA | NA | NA | NA | NA | NA | NA | NA | NA | NA | NA | NA | NA | NA | NA | NA | NA | NA | NA | NA | NA | NA | NA | NA | NA | NA | NA | NA | NA | NA | NA | NA | NA | NA | NA | NA | NA | NA | NA | |
| Operating, Repair Systems And Information Group | 463.80 | 450.80 | 431.80 | NA | 446.60 | 437.90 | 414.00 | NA | NA | NA | 364.40 | 398.60 | 347.60 | 317.50 | 245.00 | 314.60 | NA | 322.70 | 348.90 | 327.90 | NA | 314.40 | 343.10 | 337.00 | 356.80 | 333.50 | 338.10 | 318.80 | 319.80 | 286.10 | 295.20 | 278.80 | 280.60 | 282.90 | 277.40 | 272.30 | NA | 271.20 | 278.50 | 262.70 | 264.60 | 252.70 | 246.20 | 246.10 | 241.60 | 222.00 | 227.40 | NA | NA | NA | NA | NA | NA | NA | NA | NA | |
| Operating, Tools Group | 500.10 | 513.30 | 515.40 | NA | 537.00 | 542.70 | 496.60 | NA | NA | NA | 471.40 | 484.10 | 478.30 | 449.80 | 323.30 | 375.90 | NA | 385.20 | 405.80 | 410.20 | NA | 389.80 | 411.90 | 404.70 | 409.20 | 392.70 | 413.80 | 409.40 | 417.50 | 397.20 | 416.70 | 402.50 | 411.20 | 380.60 | 398.70 | 378.20 | NA | 355.00 | 369.10 | 343.60 | 351.10 | 333.80 | 346.20 | 327.30 | 321.60 | 308.80 | 325.00 | NA | NA | NA | NA | NA | NA | NA | NA | NA | |
| External Sales, All Other Professional, Product And Services Excluding Financial Services | 270.70 | 276.40 | 261.10 | NA | 257.50 | 237.30 | 242.00 | NA | NA | NA | NA | NA | NA | NA | NA | NA | NA | NA | NA | NA | NA | NA | NA | NA | NA | NA | NA | NA | NA | NA | NA | NA | NA | NA | NA | NA | NA | NA | NA | NA | NA | NA | NA | NA | NA | NA | NA | NA | NA | NA | NA | NA | NA | NA | NA | NA | |
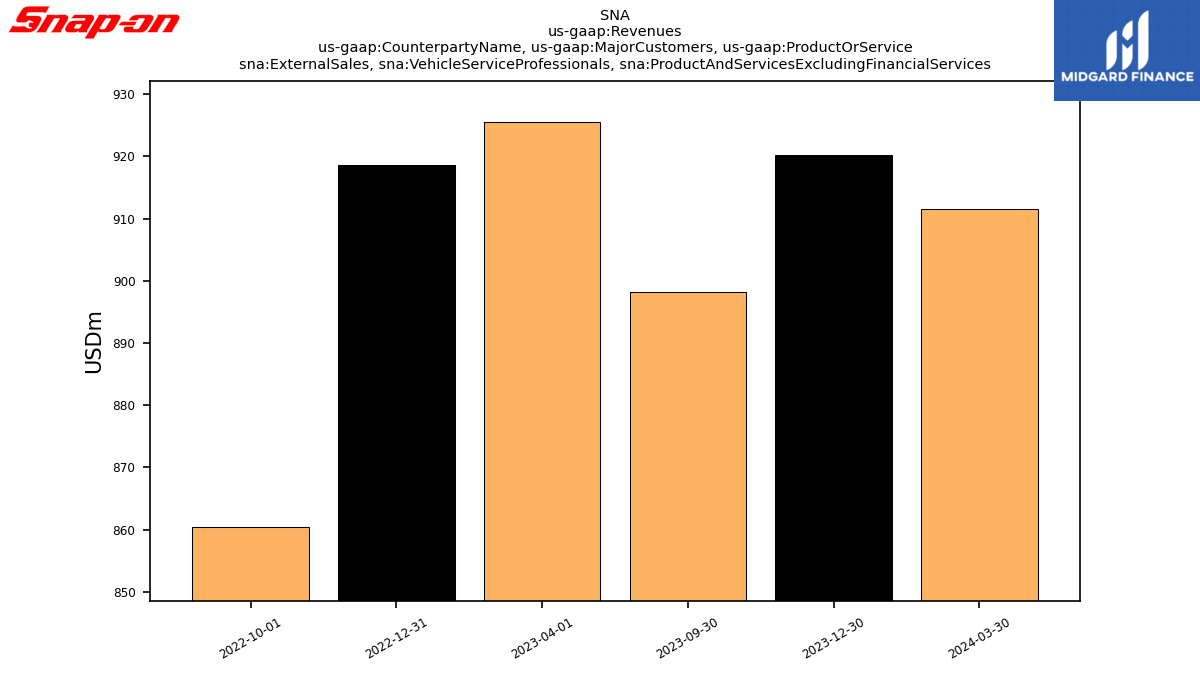
| External Sales, Vehicle Service Professionals, Product And Services Excluding Financial Services | 911.60 | 920.20 | 898.20 | NA | 925.50 | 918.60 | 860.50 | NA | NA | NA | NA | NA | NA | NA | NA | NA | NA | NA | NA | NA | NA | NA | NA | NA | NA | NA | NA | NA | NA | NA | NA | NA | NA | NA | NA | NA | NA | NA | NA | NA | NA | NA | NA | NA | NA | NA | NA | NA | NA | NA | NA | NA | NA | NA | NA | NA | |
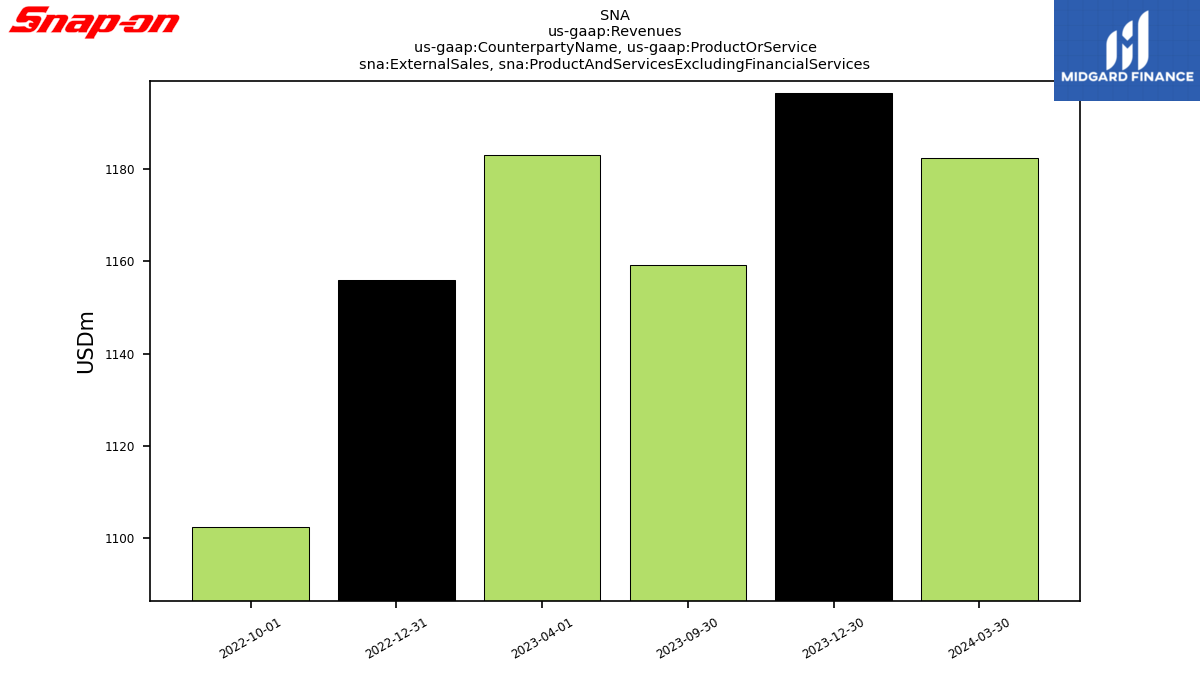
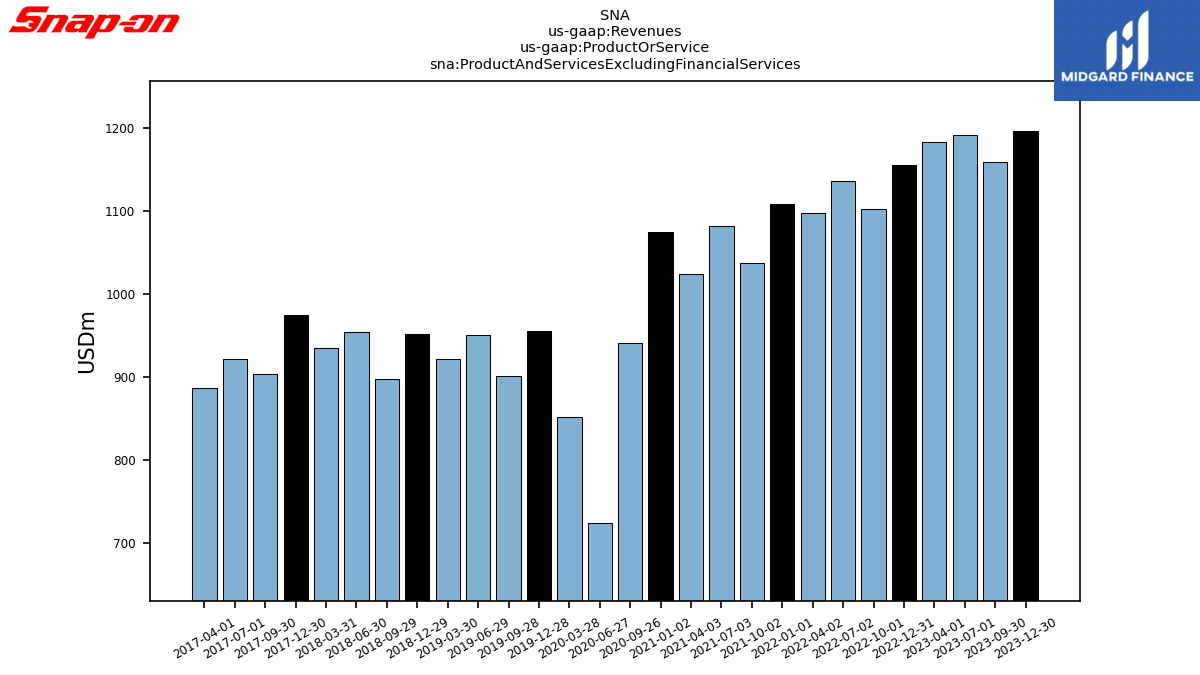
| External Sales, Product And Services Excluding Financial Services | 1182.30 | 1196.60 | 1159.30 | NA | 1183.00 | 1155.90 | 1102.50 | NA | NA | NA | NA | NA | NA | NA | NA | NA | NA | NA | NA | NA | NA | NA | NA | NA | NA | NA | NA | NA | NA | NA | NA | NA | NA | NA | NA | NA | NA | NA | NA | NA | NA | NA | NA | NA | NA | NA | NA | NA | NA | NA | NA | NA | NA | NA | NA | NA | |
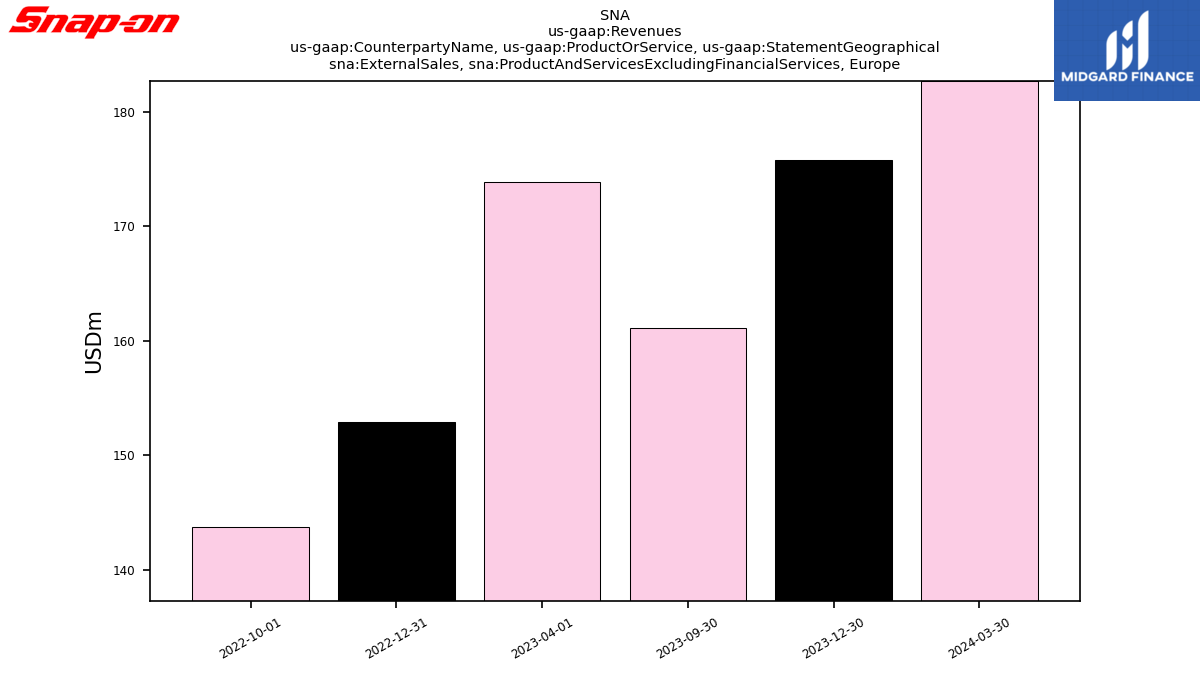
| External Sales, Product And Services Excluding Financial Services, | 182.70 | 175.80 | 161.10 | NA | 173.90 | 152.90 | 143.70 | NA | NA | NA | NA | NA | NA | NA | NA | NA | NA | NA | NA | NA | NA | NA | NA | NA | NA | NA | NA | NA | NA | NA | NA | NA | NA | NA | NA | NA | NA | NA | NA | NA | NA | NA | NA | NA | NA | NA | NA | NA | NA | NA | NA | NA | NA | NA | NA | NA | |
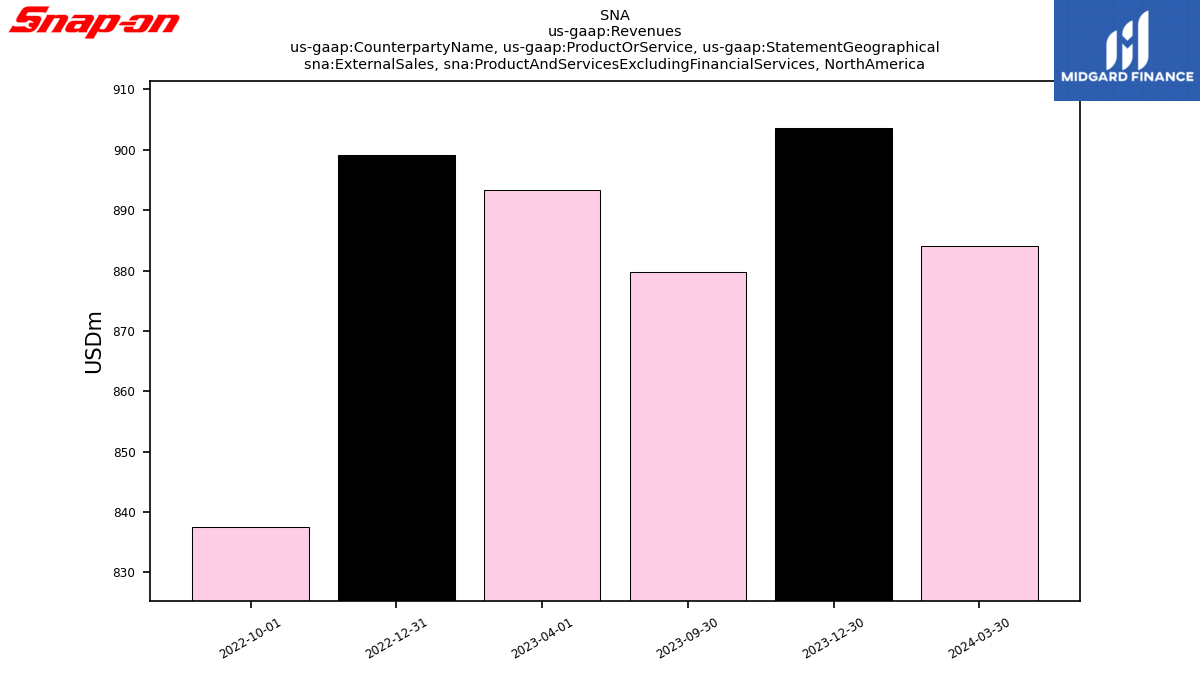
| External Sales, Product And Services Excluding Financial Services, | 884.00 | 903.60 | 879.80 | NA | 893.30 | 899.10 | 837.60 | NA | NA | NA | NA | NA | NA | NA | NA | NA | NA | NA | NA | NA | NA | NA | NA | NA | NA | NA | NA | NA | NA | NA | NA | NA | NA | NA | NA | NA | NA | NA | NA | NA | NA | NA | NA | NA | NA | NA | NA | NA | NA | NA | NA | NA | NA | NA | NA | NA | |
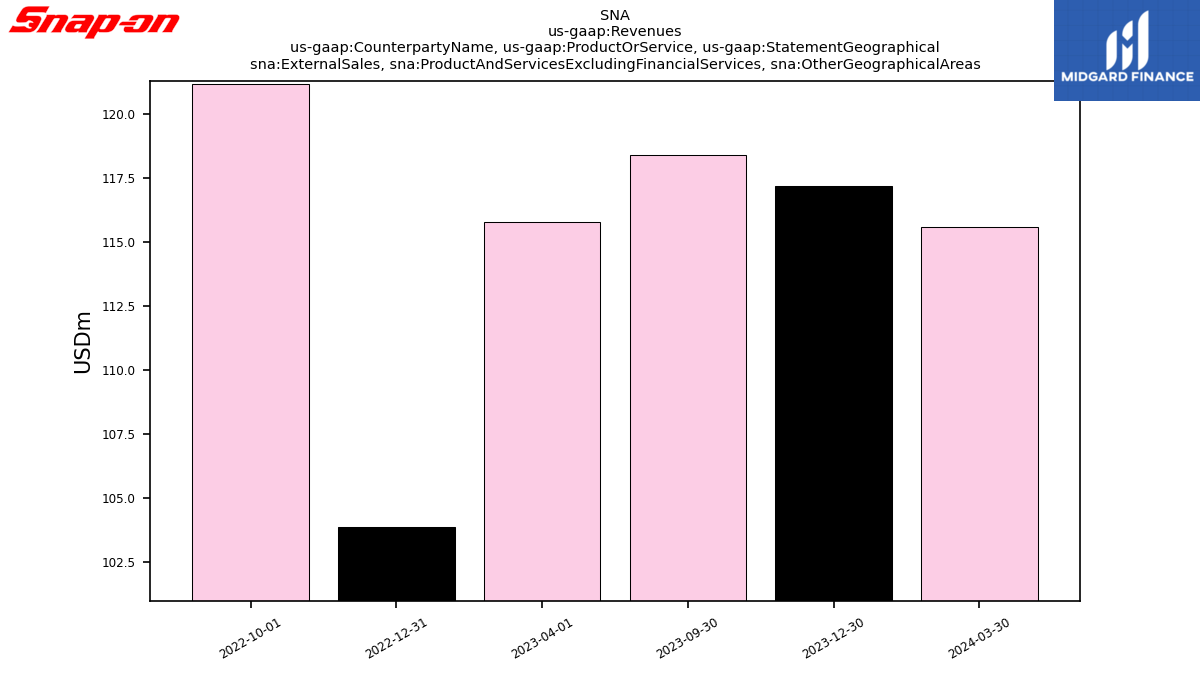
| External Sales, Product And Services Excluding Financial Services, Other Geographical Areas | 115.60 | 117.20 | 118.40 | NA | 115.80 | 103.90 | 121.20 | NA | NA | NA | NA | NA | NA | NA | NA | NA | NA | NA | NA | NA | NA | NA | NA | NA | NA | NA | NA | NA | NA | NA | NA | NA | NA | NA | NA | NA | NA | NA | NA | NA | NA | NA | NA | NA | NA | NA | NA | NA | NA | NA | NA | NA | NA | NA | NA | NA | |
| Product And Services Excluding Financial Services | 1182.30 | 1196.60 | 1159.30 | 1191.30 | 1183.00 | 1155.90 | 1102.50 | 1136.60 | 1097.80 | 1108.30 | 1037.70 | 1081.40 | 1024.60 | 941.60 | 724.30 | 852.20 | 955.20 | 901.80 | 951.30 | 921.70 | 952.50 | 898.10 | 954.60 | 935.50 | 974.60 | 903.80 | 921.40 | 887.10 | NA | NA | NA | NA | NA | NA | NA | NA | NA | NA | NA | NA | NA | NA | NA | NA | NA | NA | NA | NA | NA | NA | NA | NA | NA | NA | NA | NA | |
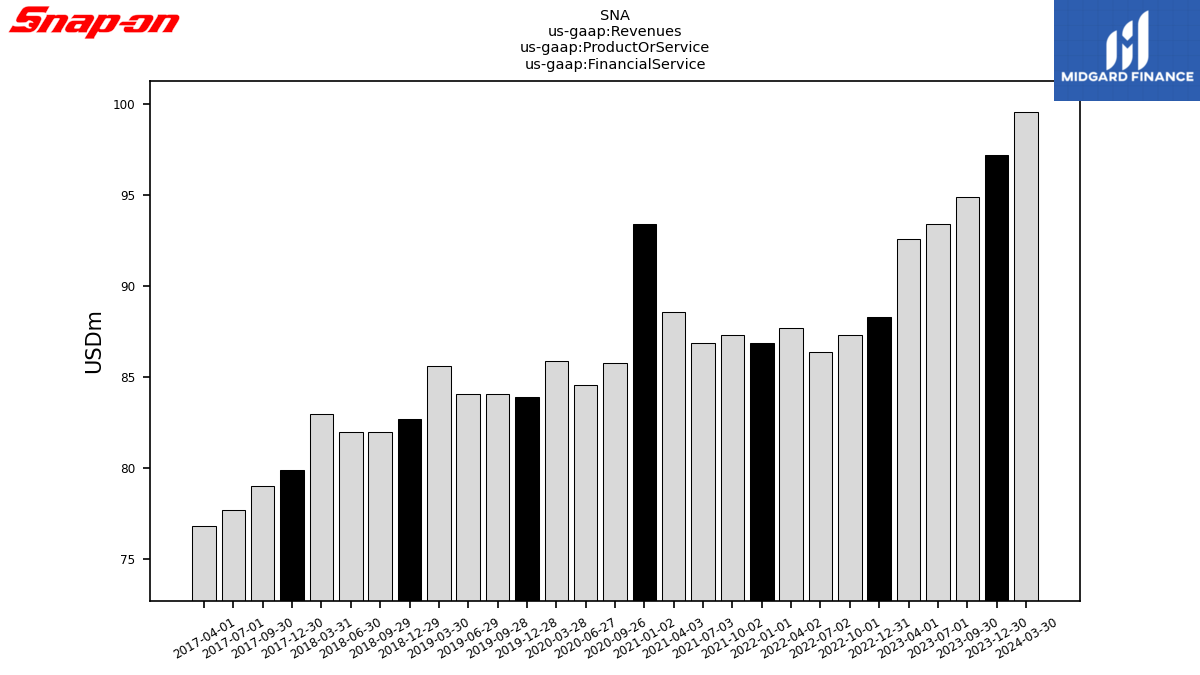
| Financial Service | 99.60 | 97.20 | 94.90 | 93.40 | 92.60 | 88.30 | 87.30 | 86.40 | 87.70 | 86.90 | 87.30 | 86.90 | 88.60 | 85.80 | 84.60 | 85.90 | 83.90 | 84.10 | 84.10 | 85.60 | 82.70 | 82.00 | 82.00 | 83.00 | 79.90 | 79.00 | 77.70 | 76.80 | NA | NA | NA | NA | NA | NA | NA | NA | NA | NA | NA | NA | NA | NA | NA | NA | NA | NA | NA | NA | NA | NA | NA | NA | NA | NA | NA | NA | |
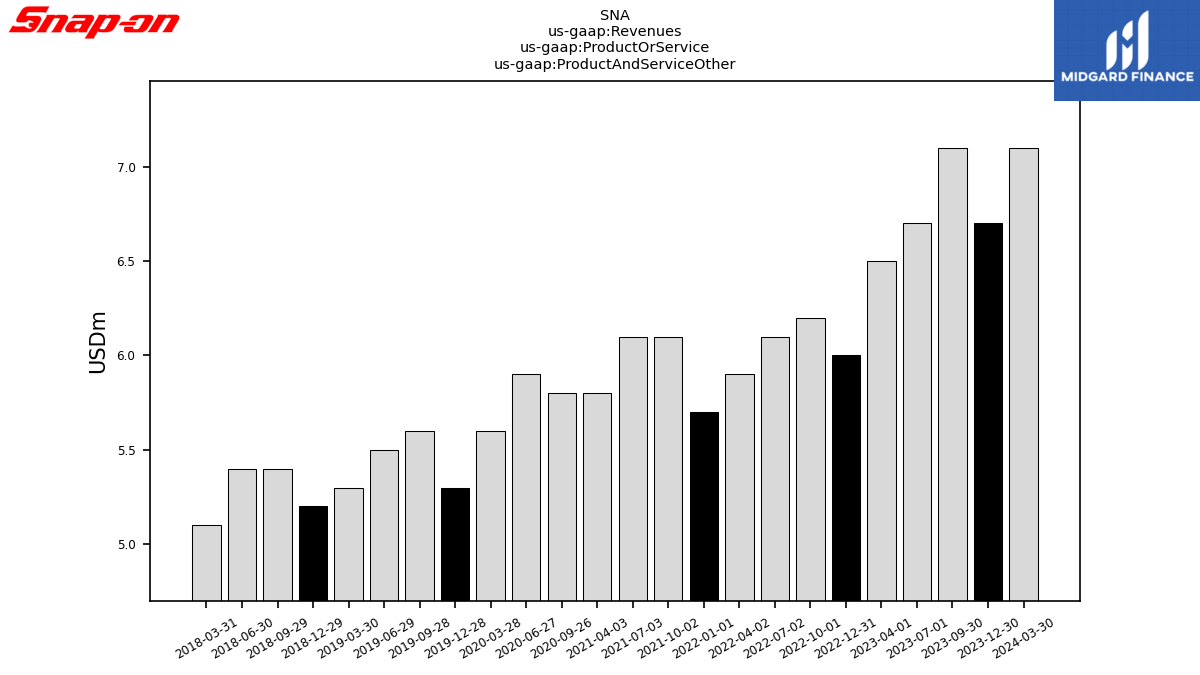
| Product And Service Other | 7.10 | 6.70 | 7.10 | 6.70 | 6.50 | 6.00 | 6.20 | 6.10 | 5.90 | 5.70 | 6.10 | 6.10 | 5.80 | 5.80 | 5.90 | 5.60 | 5.30 | 5.60 | 5.50 | 5.30 | 5.20 | 5.40 | 5.40 | 5.10 | NA | NA | NA | NA | NA | NA | NA | NA | NA | NA | NA | NA | NA | NA | NA | NA | NA | NA | NA | NA | NA | NA | NA | NA | NA | NA | NA | NA | NA | NA | NA | NA | |
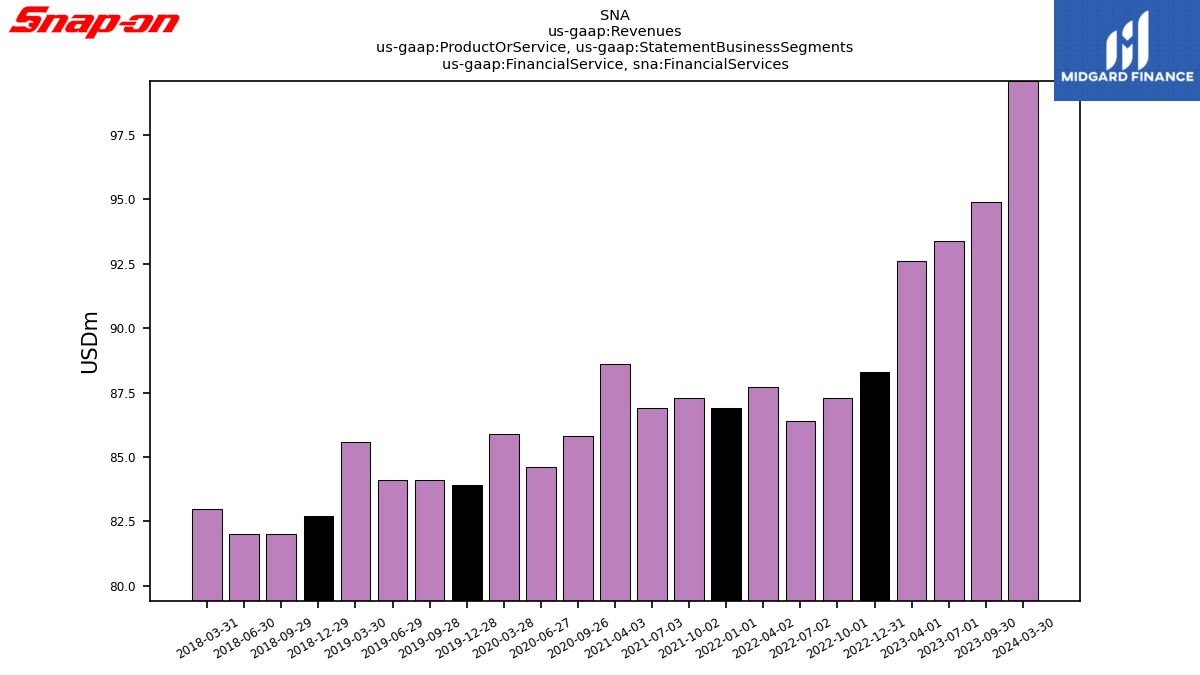
| Financial Service, Financial Services | 99.60 | NA | 94.90 | 93.40 | 92.60 | 88.30 | 87.30 | 86.40 | 87.70 | 86.90 | 87.30 | 86.90 | 88.60 | 85.80 | 84.60 | 85.90 | 83.90 | 84.10 | 84.10 | 85.60 | 82.70 | 82.00 | 82.00 | 83.00 | NA | NA | NA | NA | NA | NA | NA | NA | NA | NA | NA | NA | NA | NA | NA | NA | NA | NA | NA | NA | NA | NA | NA | NA | NA | NA | NA | NA | NA | NA | NA | NA | |
| Revenue From Contract With Customer Excluding Assessed Tax | 1175.20 | 1189.90 | 1152.20 | 1184.60 | 1176.50 | 1149.90 | 1096.30 | 1130.50 | 1091.90 | 1102.60 | 1031.60 | 1075.30 | 1018.80 | 935.80 | 718.40 | 846.60 | 949.90 | 896.20 | 945.80 | 916.40 | 947.30 | 892.70 | 954.60 | 935.50 | 974.60 | 982.80 | 999.10 | 963.90 | 889.80 | 905.70 | 941.60 | 900.50 | 851.70 | 882.60 | 910.50 | 885.20 | 857.40 | 859.90 | 878.20 | 837.70 | 797.50 | 798.30 | 808.60 | 785.70 | 753.20 | 752.10 | 777.80 | 773.20 | 736.60 | 697.20 | 726.70 | 693.70 | 696.90 | 653.10 | 647.60 | 621.60 |
