
| 2022-12-31 | 2022-09-30 | 2022-06-30 | 2022-03-31 | 2021-12-31 | 2021-09-30 | 2021-06-30 | 2021-03-31 | 2020-12-31 | 2020-09-30 | 2020-06-30 | 2020-03-31 | 2019-12-31 | 2019-09-30 | 2019-06-30 | 2019-03-31 | 2018-12-31 | 2018-09-30 | 2018-06-30 | 2018-03-31 | 2017-12-31 | 2017-09-30 | 2017-06-30 | 2017-03-31 | 2016-12-31 | 2016-09-30 | 2016-06-30 | 2016-03-31 | 2015-12-31 | 2015-09-30 | 2015-06-30 | ||
|---|---|---|---|---|---|---|---|---|---|---|---|---|---|---|---|---|---|---|---|---|---|---|---|---|---|---|---|---|---|---|---|---|
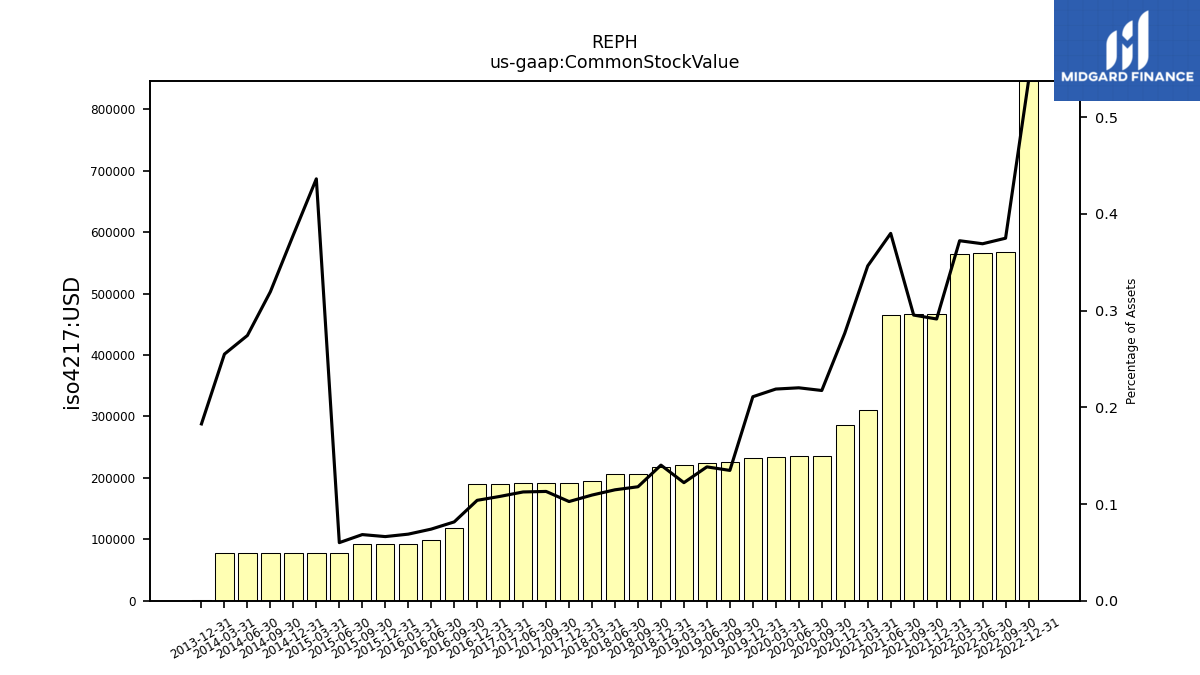
| Common Stock Value | 0.85 | 0.57 | 0.57 | 0.56 | 0.47 | 0.47 | 0.47 | 0.31 | 0.29 | 0.24 | 0.24 | 0.23 | 0.23 | 0.23 | 0.22 | 0.22 | 0.22 | 0.21 | 0.21 | 0.20 | 0.19 | 0.19 | 0.19 | 0.19 | 0.19 | 0.12 | 0.10 | 0.09 | 0.09 | 0.09 | 0.08 | |
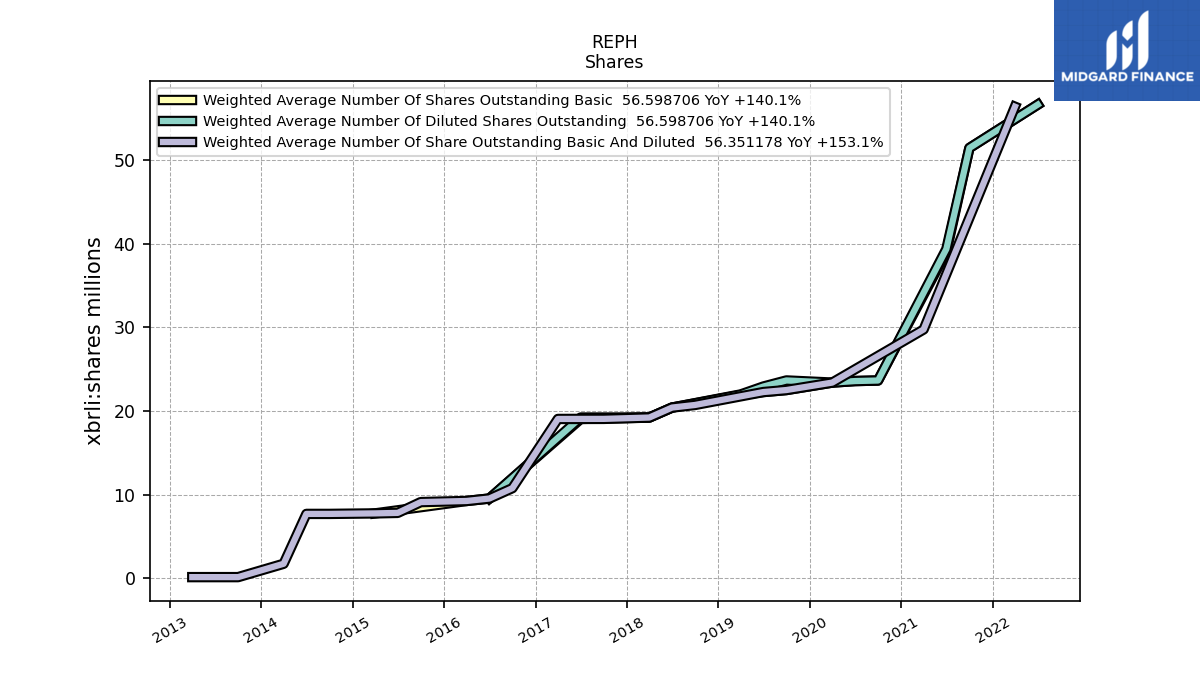
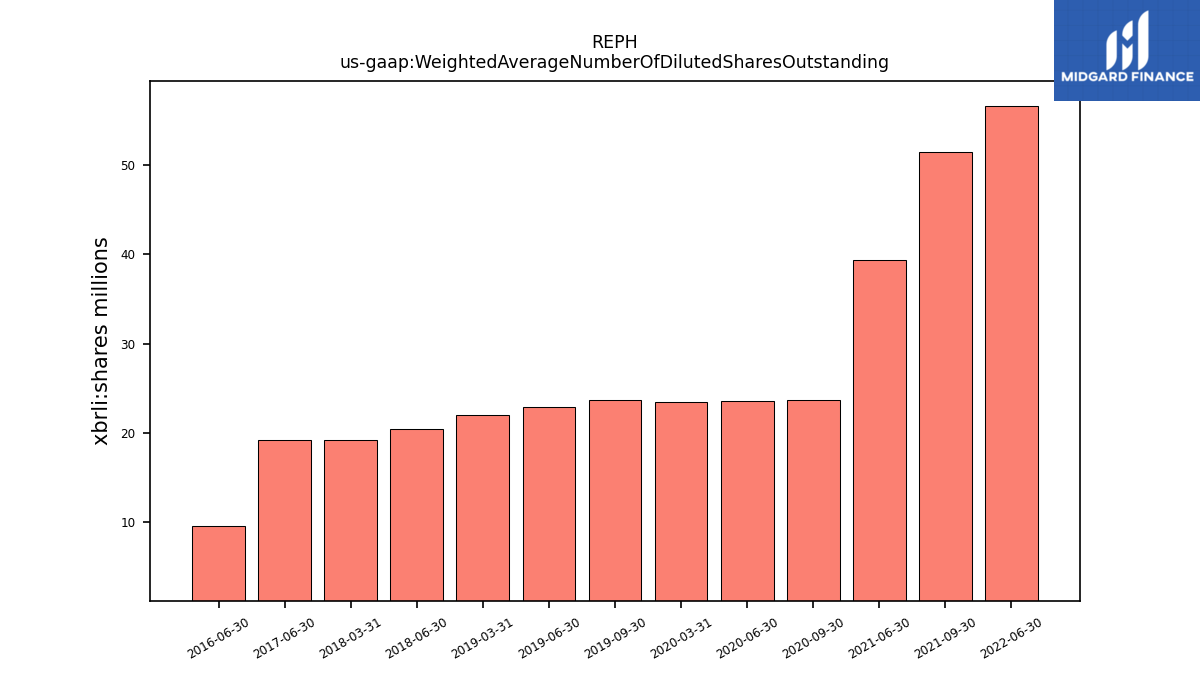
| Weighted Average Number Of Diluted Shares Outstanding | NA | NA | 56.60 | NA | NA | 51.42 | 39.35 | NA | NA | 23.64 | 23.58 | 23.39 | NA | 23.65 | 22.93 | 21.98 | NA | NA | 20.41 | 19.22 | NA | NA | 19.22 | NA | NA | NA | 9.54 | NA | NA | NA | NA | |
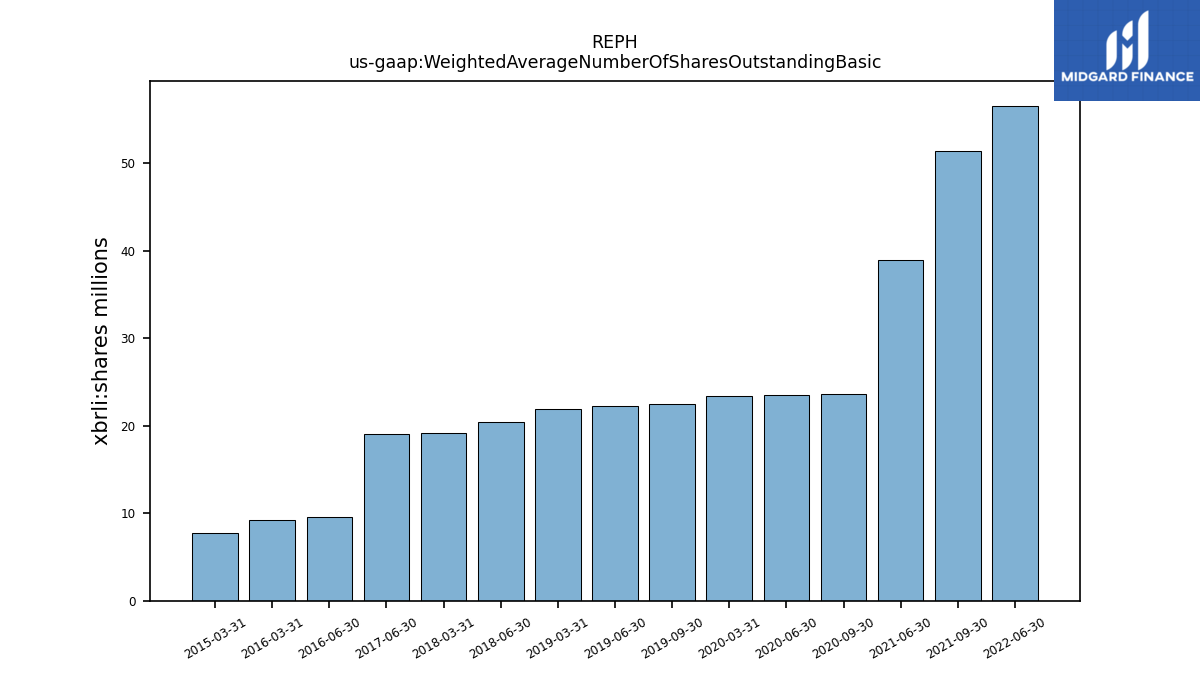
| Weighted Average Number Of Shares Outstanding Basic | NA | NA | 56.60 | NA | NA | 51.42 | 39.02 | NA | NA | 23.64 | 23.58 | 23.39 | NA | 22.51 | 22.27 | 21.92 | NA | NA | 20.41 | 19.22 | NA | NA | 19.05 | NA | NA | NA | 9.54 | 9.25 | NA | NA | NA | |
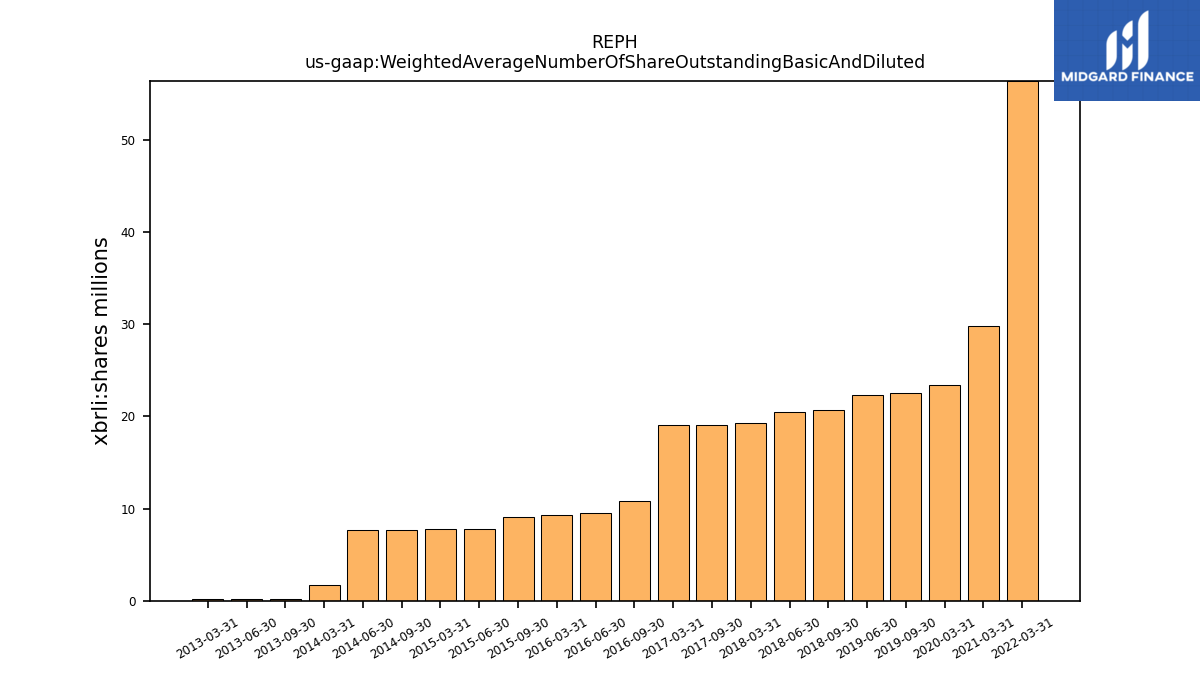
| Weighted Average Number Of Share Outstanding Basic And Diluted | NA | NA | NA | 56.35 | NA | NA | NA | 29.74 | NA | NA | NA | 23.39 | NA | 22.51 | 22.27 | NA | NA | 20.72 | 20.41 | 19.22 | NA | 19.06 | NA | 19.05 | NA | 10.78 | 9.54 | 9.25 | NA | 9.12 | 7.83 | |
| Earnings Per Share Basic | 0.53 | -0.06 | -0.06 | NA | -0.04 | -0.07 | 0.03 | NA | -0.49 | -0.09 | -0.25 | -0.33 | -0.42 | -0.19 | -0.13 | -0.09 | NA | NA | -0.62 | -0.65 | NA | NA | -0.46 | NA | NA | NA | -0.83 | NA | NA | NA | NA | |
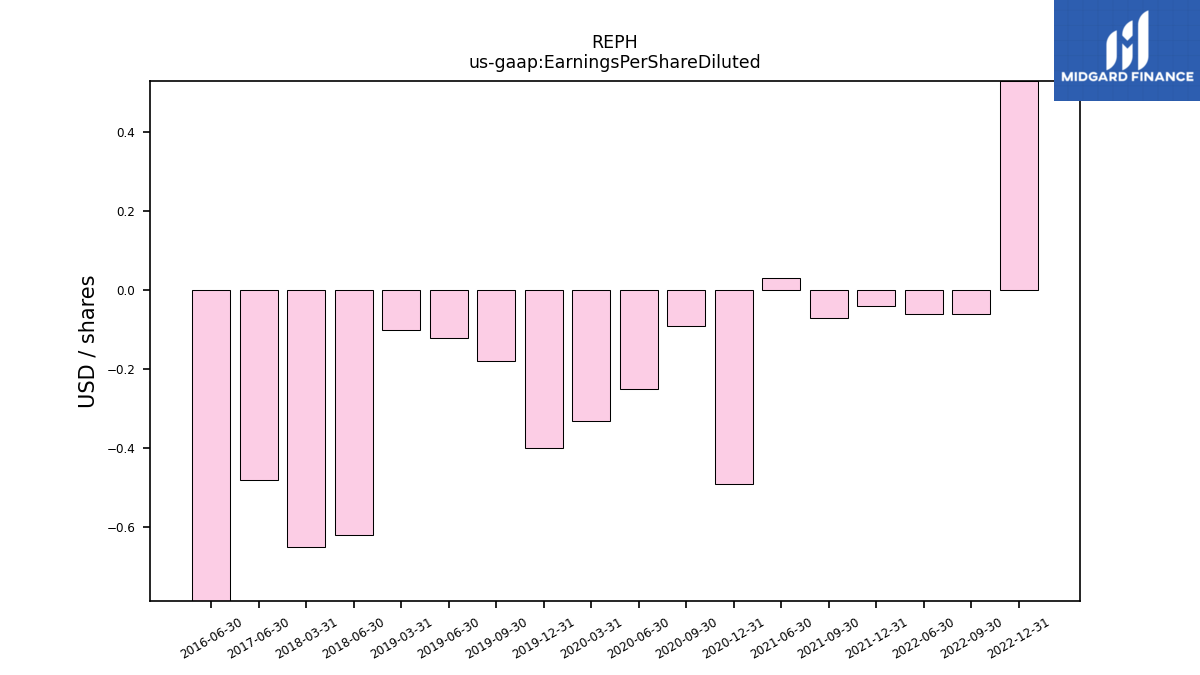
| Earnings Per Share Diluted | 0.53 | -0.06 | -0.06 | NA | -0.04 | -0.07 | 0.03 | NA | -0.49 | -0.09 | -0.25 | -0.33 | -0.40 | -0.18 | -0.12 | -0.10 | NA | NA | -0.62 | -0.65 | NA | NA | -0.48 | NA | NA | NA | -0.83 | NA | NA | NA | NA | |
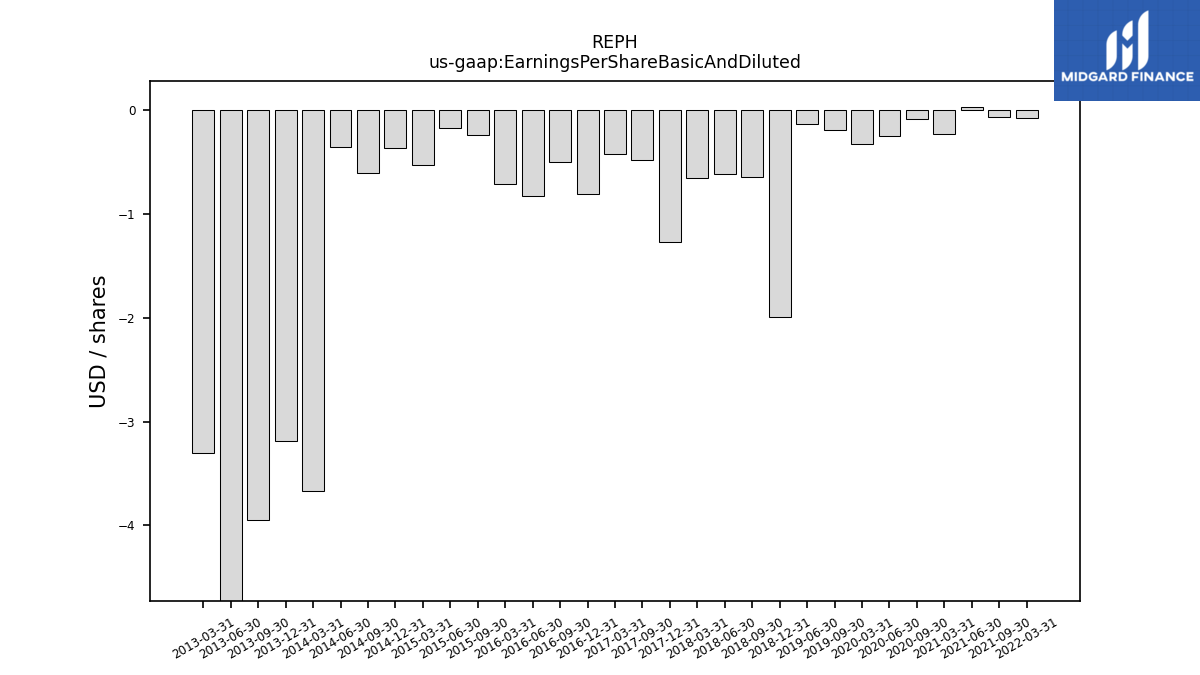
| Earnings Per Share Basic And Diluted | NA | NA | NA | -0.08 | NA | -0.07 | 0.03 | -0.23 | NA | -0.09 | -0.25 | -0.33 | NA | -0.19 | -0.13 | NA | -1.99 | -0.64 | -0.62 | -0.65 | -1.27 | -0.48 | NA | -0.42 | -0.81 | -0.50 | -0.83 | -0.71 | NA | -0.24 | -0.17 |
| 2022-12-31 | 2022-09-30 | 2022-06-30 | 2022-03-31 | 2021-12-31 | 2021-09-30 | 2021-06-30 | 2021-03-31 | 2020-12-31 | 2020-09-30 | 2020-06-30 | 2020-03-31 | 2019-12-31 | 2019-09-30 | 2019-06-30 | 2019-03-31 | 2018-12-31 | 2018-09-30 | 2018-06-30 | 2018-03-31 | 2017-12-31 | 2017-09-30 | 2017-06-30 | 2017-03-31 | 2016-12-31 | 2016-09-30 | 2016-06-30 | 2016-03-31 | 2015-12-31 | 2015-09-30 | 2015-06-30 | ||
|---|---|---|---|---|---|---|---|---|---|---|---|---|---|---|---|---|---|---|---|---|---|---|---|---|---|---|---|---|---|---|---|---|
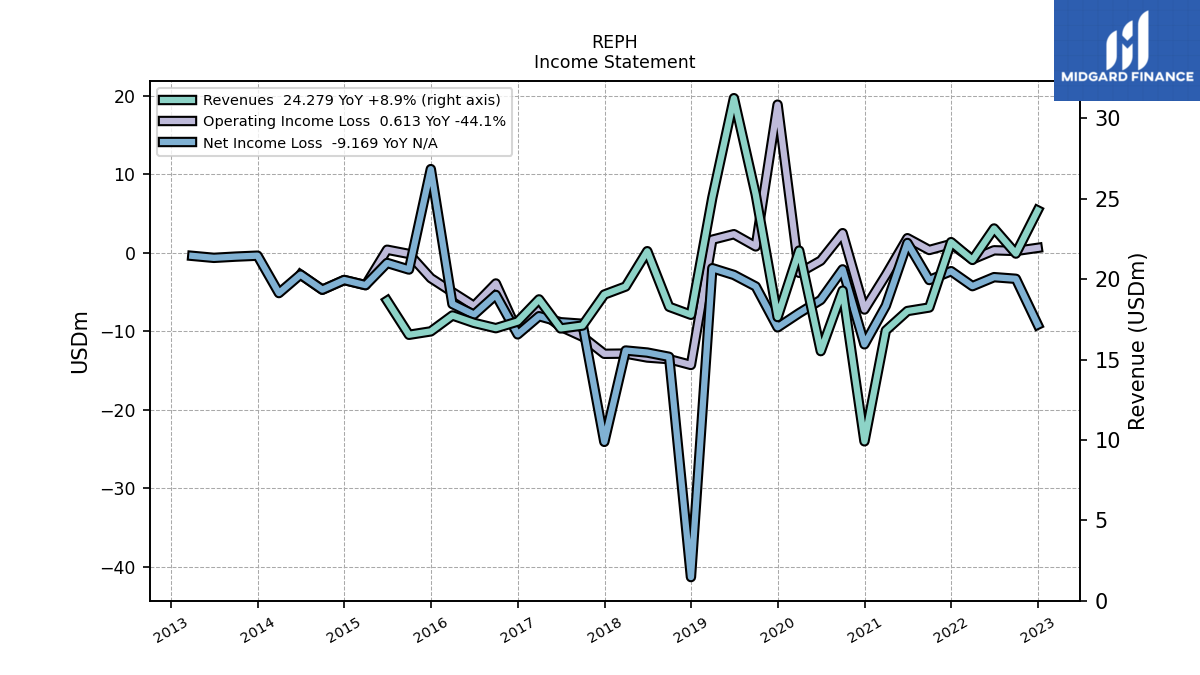
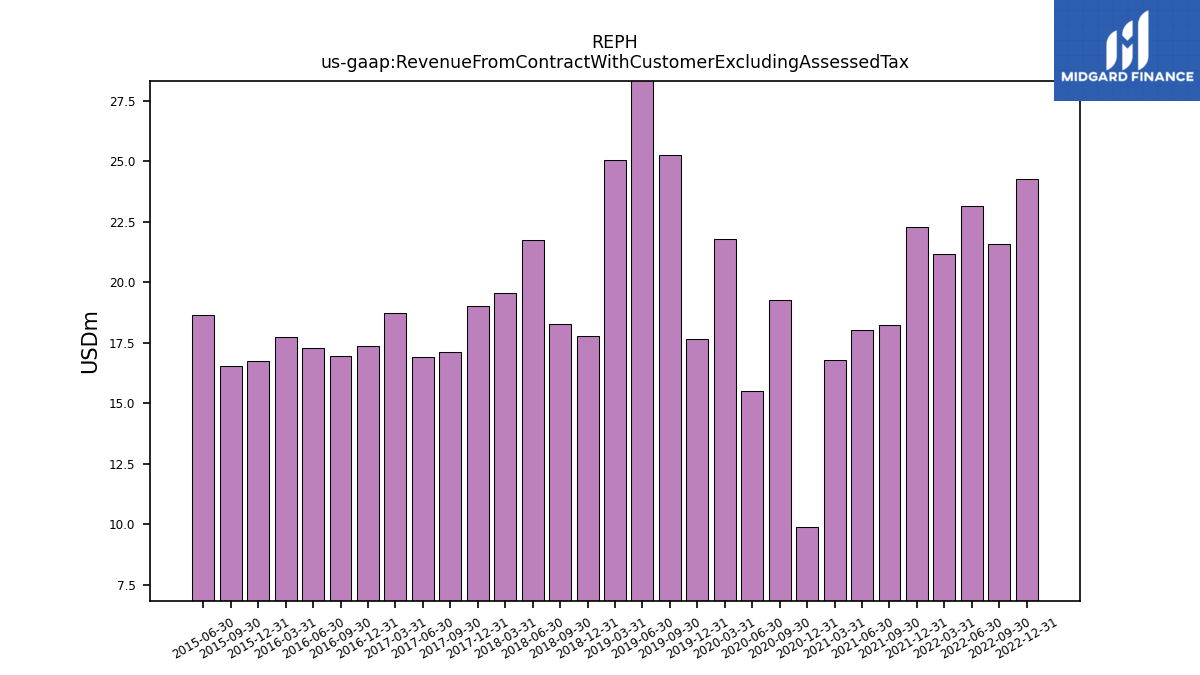
| Revenue From Contract With Customer Excluding Assessed Tax | 24.28 | 21.59 | 23.15 | 21.19 | 22.30 | 18.24 | 18.02 | 16.80 | 9.91 | 19.29 | 15.52 | 21.78 | 17.64 | 25.25 | 31.26 | 25.07 | 17.78 | 18.28 | 21.74 | 19.54 | 19.04 | 17.11 | 16.93 | 18.74 | 17.36 | 16.95 | 17.28 | 17.74 | 16.75 | 16.54 | 18.66 | |
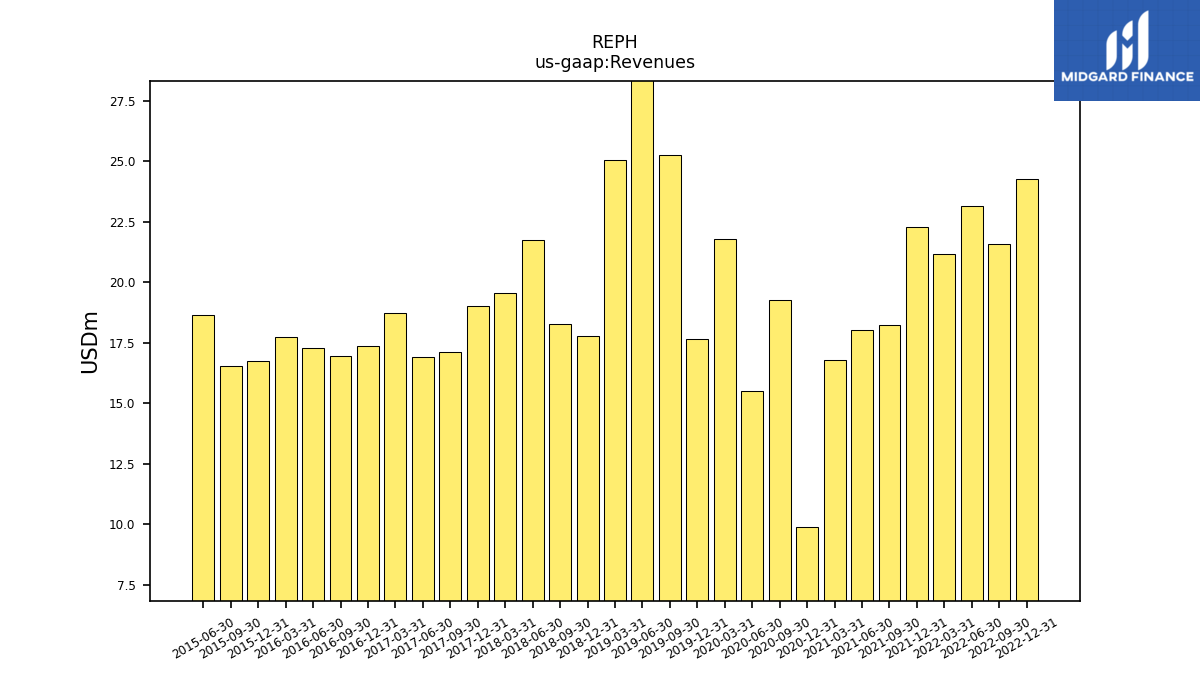
| Revenues | 24.28 | 21.59 | 23.15 | 21.19 | 22.30 | 18.24 | 18.02 | 16.80 | 9.91 | 19.29 | 15.52 | 21.78 | 17.64 | 25.25 | 31.26 | 25.07 | 17.78 | 18.28 | 21.74 | 19.54 | 19.04 | 17.11 | 16.93 | 18.74 | 17.36 | 16.95 | 17.28 | 17.74 | 16.75 | 16.54 | 18.66 | |
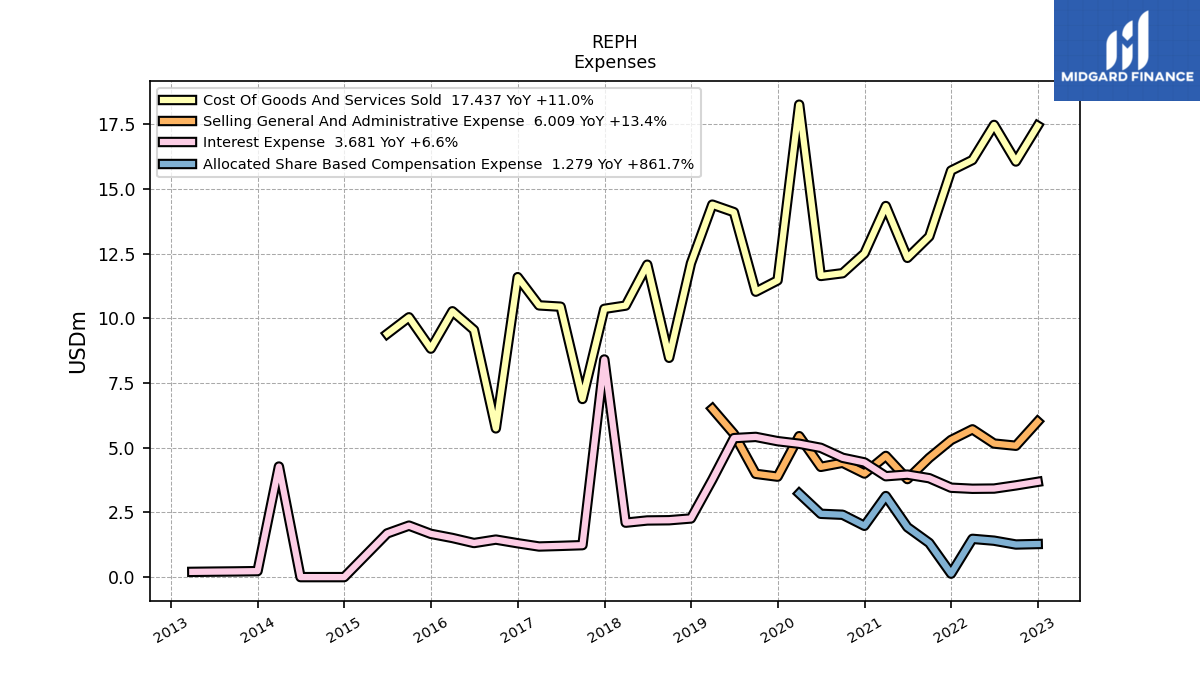
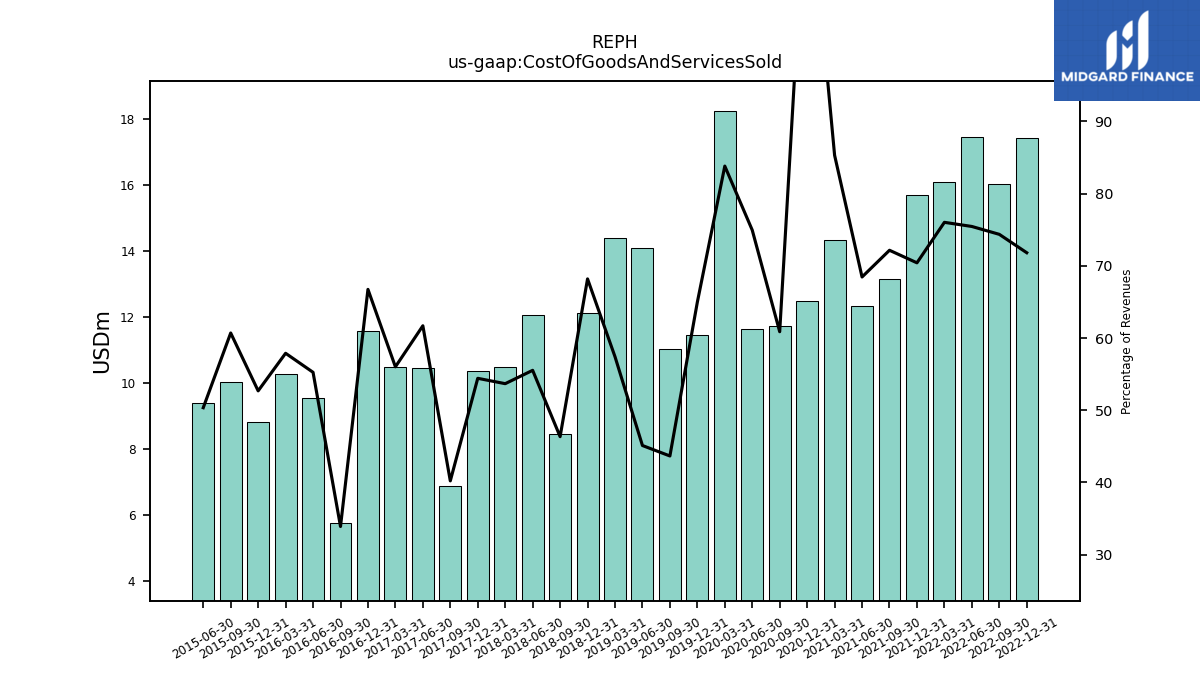
| Cost Of Goods And Services Sold | 17.44 | 16.05 | 17.47 | 16.11 | 15.71 | 13.16 | 12.33 | 14.34 | 12.51 | 11.74 | 11.63 | 18.25 | 11.46 | 11.03 | 14.10 | 14.39 | 12.13 | 8.47 | 12.07 | 10.49 | 10.36 | 6.88 | 10.45 | 10.50 | 11.59 | 5.75 | 9.55 | 10.27 | 8.83 | 10.04 | 9.39 | |
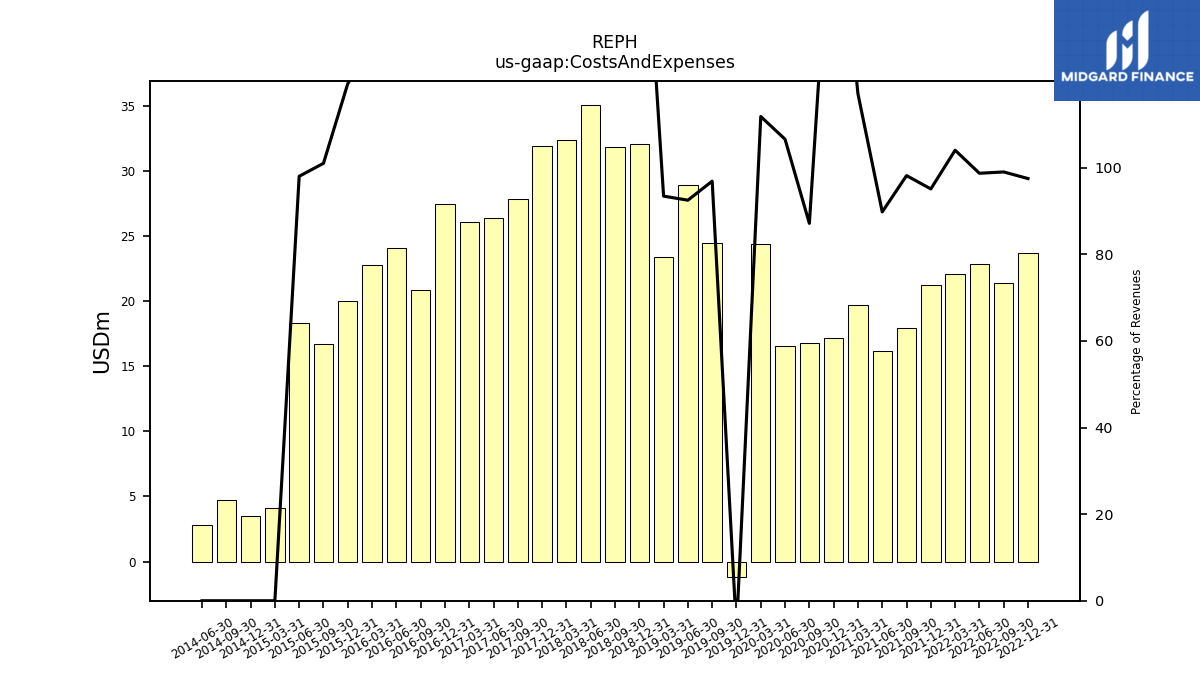
| Costs And Expenses | 23.67 | 21.37 | 22.85 | 22.05 | 21.21 | 17.90 | 16.18 | 19.67 | 17.15 | 16.80 | 16.54 | 24.35 | -1.20 | 24.47 | 28.91 | 23.41 | 32.08 | 31.84 | 35.09 | 32.39 | 31.92 | 27.82 | 26.36 | 26.04 | 27.42 | 20.87 | 24.05 | 22.77 | 20.00 | 16.70 | 18.29 | |
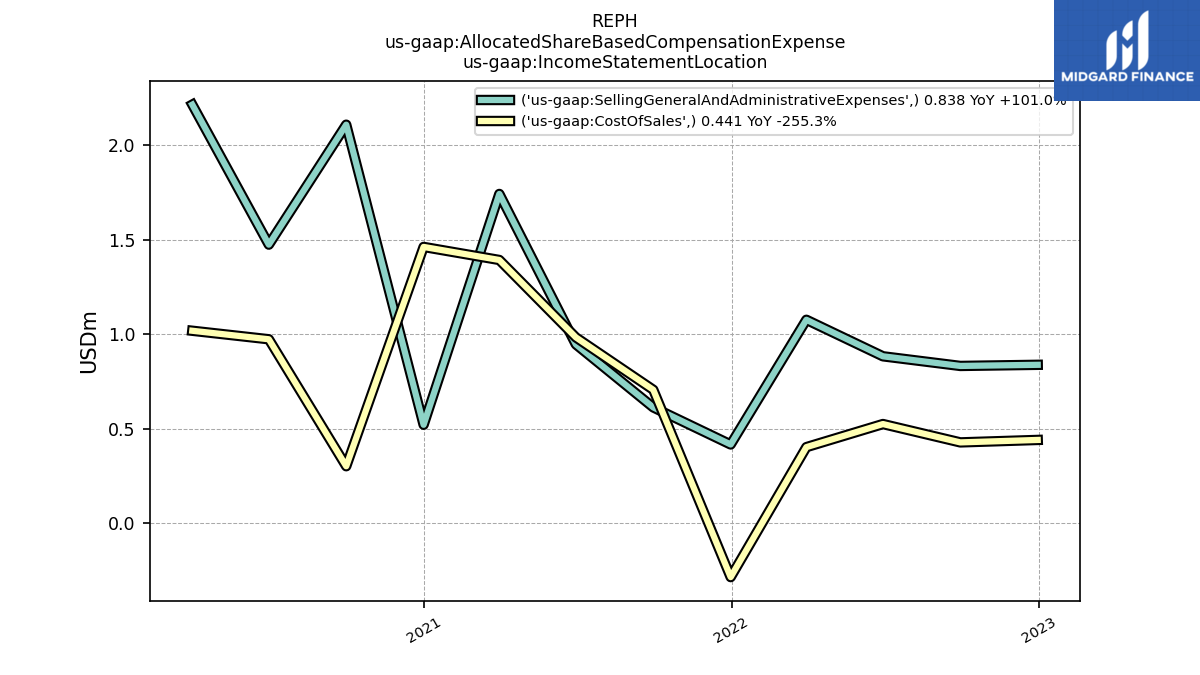
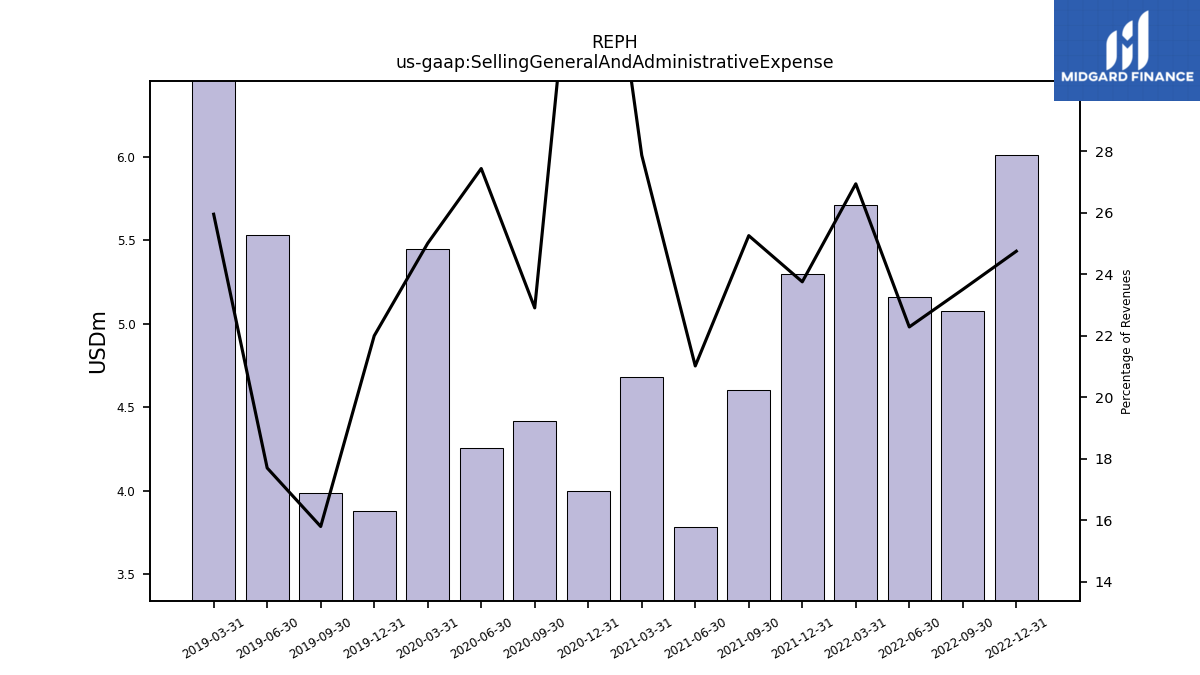
| Selling General And Administrative Expense | 6.01 | 5.08 | 5.16 | 5.71 | 5.30 | 4.61 | 3.79 | 4.68 | 4.00 | 4.42 | 4.26 | 5.45 | 3.88 | 3.99 | 5.53 | 6.50 | NA | NA | NA | NA | NA | NA | NA | NA | NA | NA | NA | NA | NA | NA | NA | |
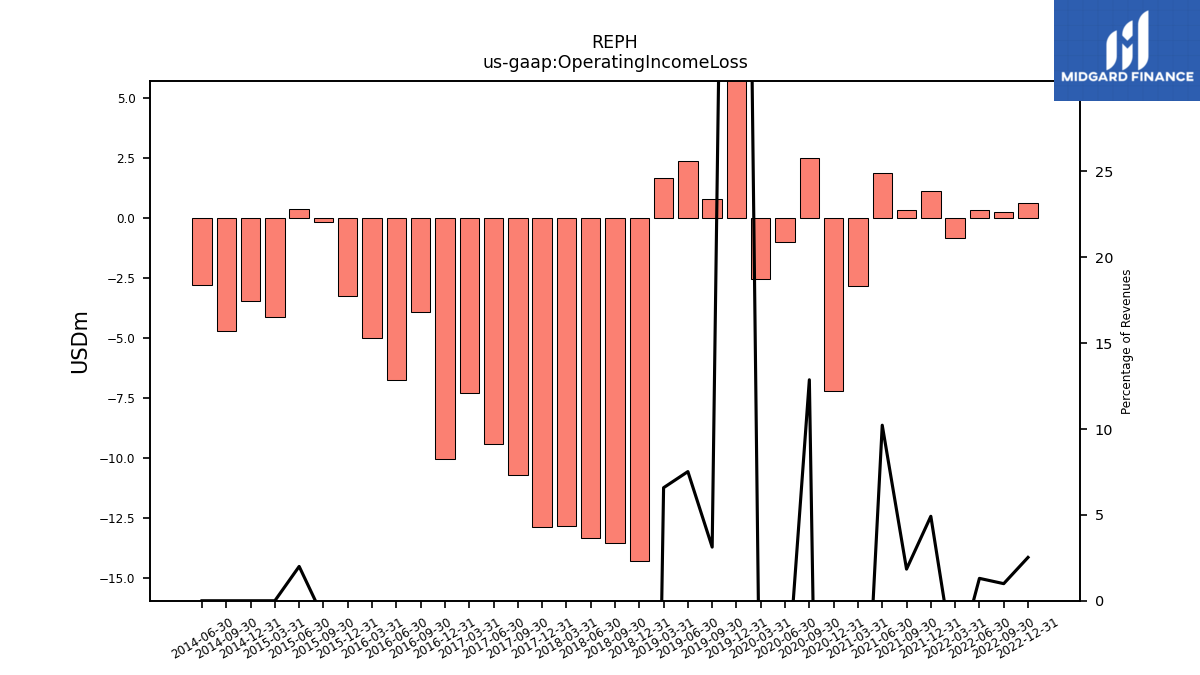
| Operating Income Loss | 0.61 | 0.21 | 0.30 | -0.85 | 1.10 | 0.34 | 1.84 | -2.86 | -7.24 | 2.48 | -1.02 | -2.57 | 18.84 | 0.79 | 2.35 | 1.65 | -14.29 | -13.55 | -13.35 | -12.85 | -12.88 | -10.70 | -9.43 | -7.30 | -10.06 | -3.92 | -6.77 | -5.03 | -3.25 | -0.16 | 0.37 | |
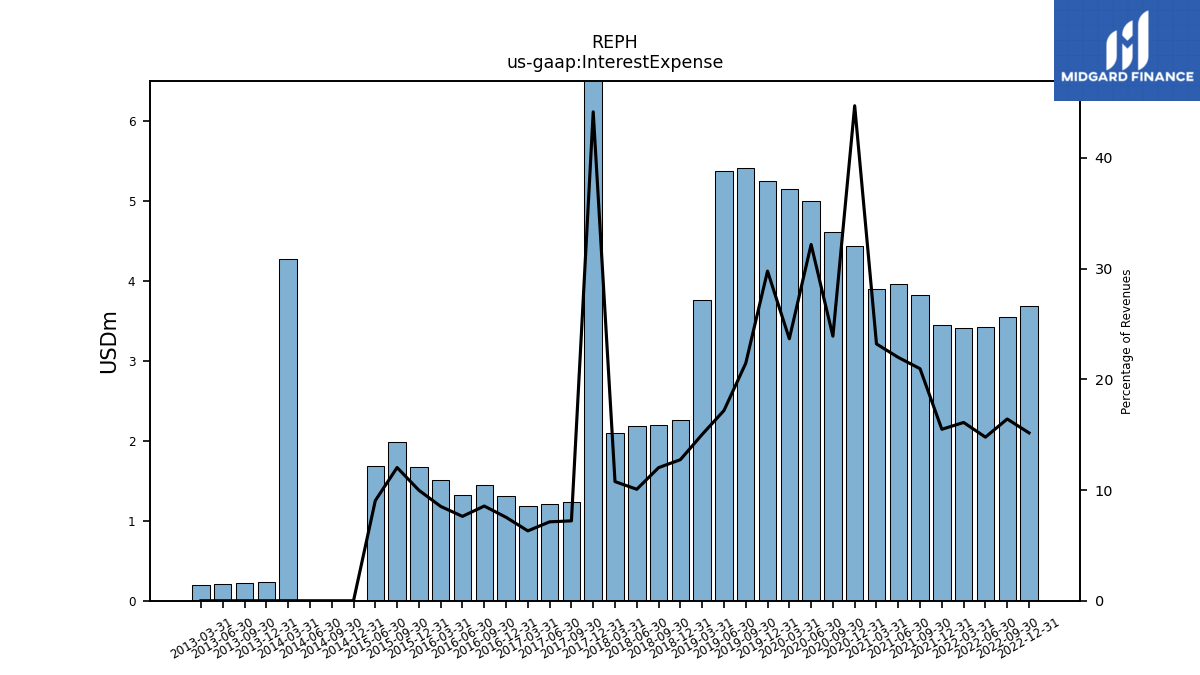
| Interest Expense | 3.68 | 3.54 | 3.42 | 3.41 | 3.45 | 3.82 | 3.96 | 3.90 | 4.43 | 4.61 | 5.00 | 5.15 | 5.25 | 5.42 | 5.37 | 3.77 | 2.27 | 2.20 | 2.19 | 2.10 | 8.41 | 1.24 | 1.21 | 1.18 | 1.31 | 1.45 | 1.32 | 1.51 | 1.67 | 1.99 | 1.69 | |
| Interest Paid Net | 2.49 | 3.07 | 2.34 | 4.68 | -0.22 | 2.63 | 2.34 | 2.50 | 3.28 | 3.43 | 3.54 | 3.69 | 3.79 | 3.96 | 3.91 | 2.73 | 1.92 | 1.84 | 1.83 | 2.55 | 2.22 | 1.06 | NA | NA | NA | NA | NA | NA | NA | NA | NA | |
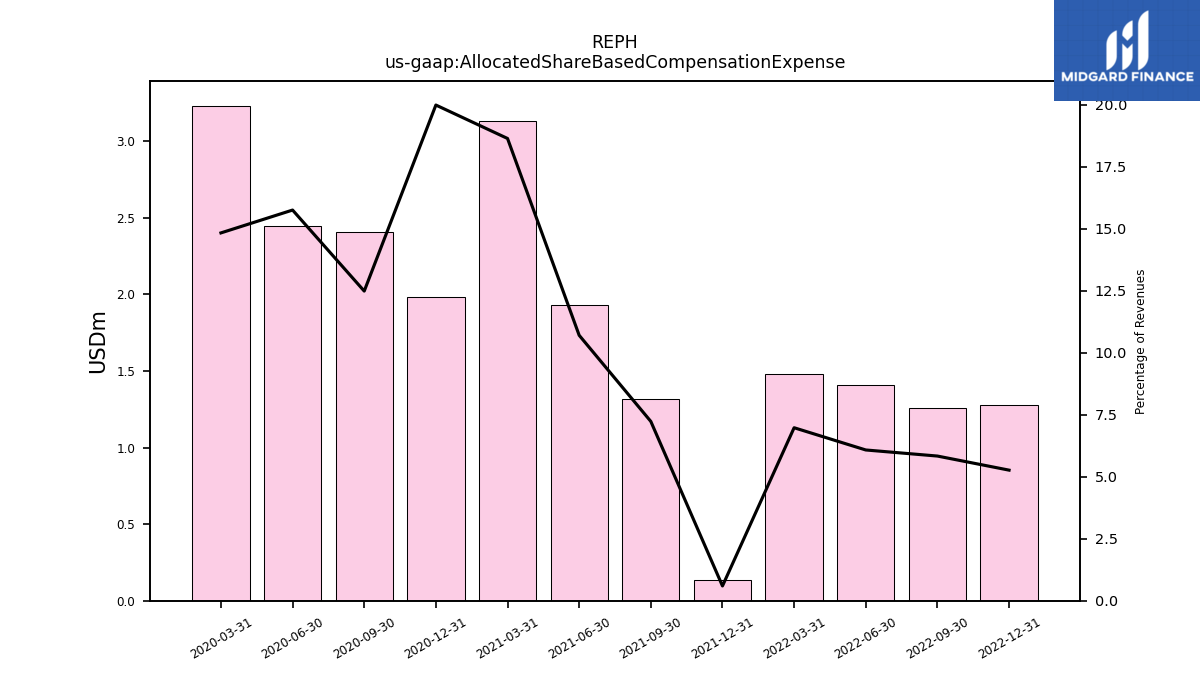
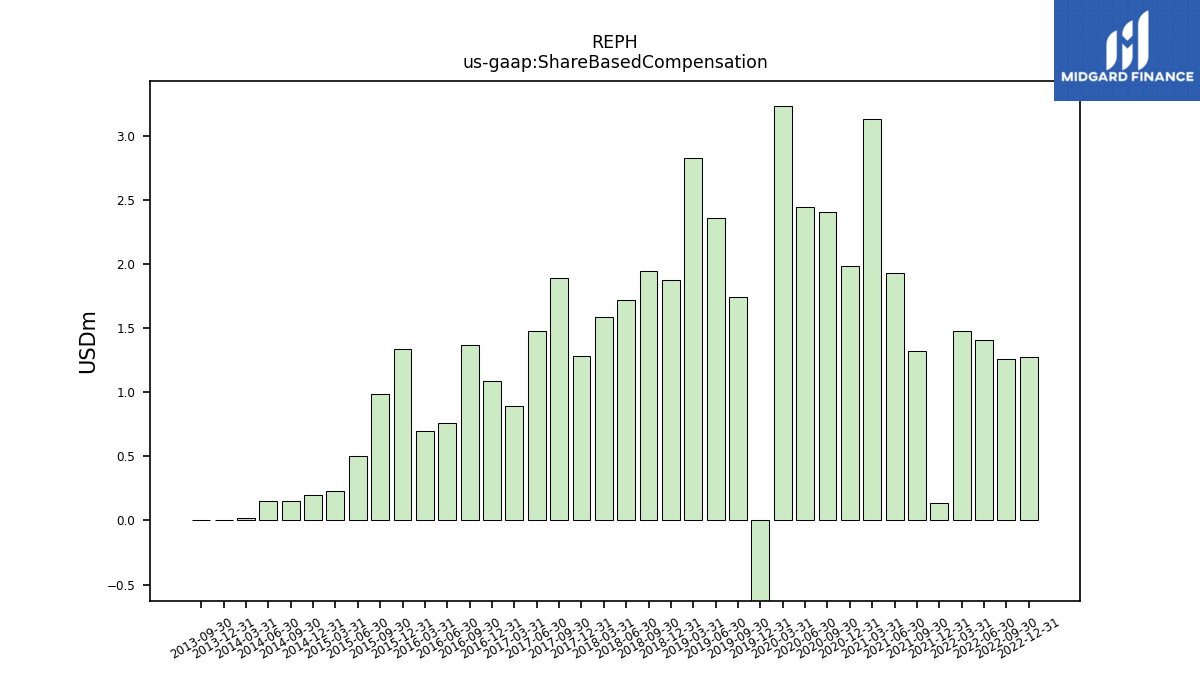
| Allocated Share Based Compensation Expense | 1.28 | 1.26 | 1.41 | 1.48 | 0.13 | 1.32 | 1.93 | 3.13 | 1.98 | 2.41 | 2.45 | 3.23 | NA | NA | NA | NA | NA | NA | NA | NA | NA | NA | NA | NA | NA | NA | NA | NA | NA | NA | NA | |
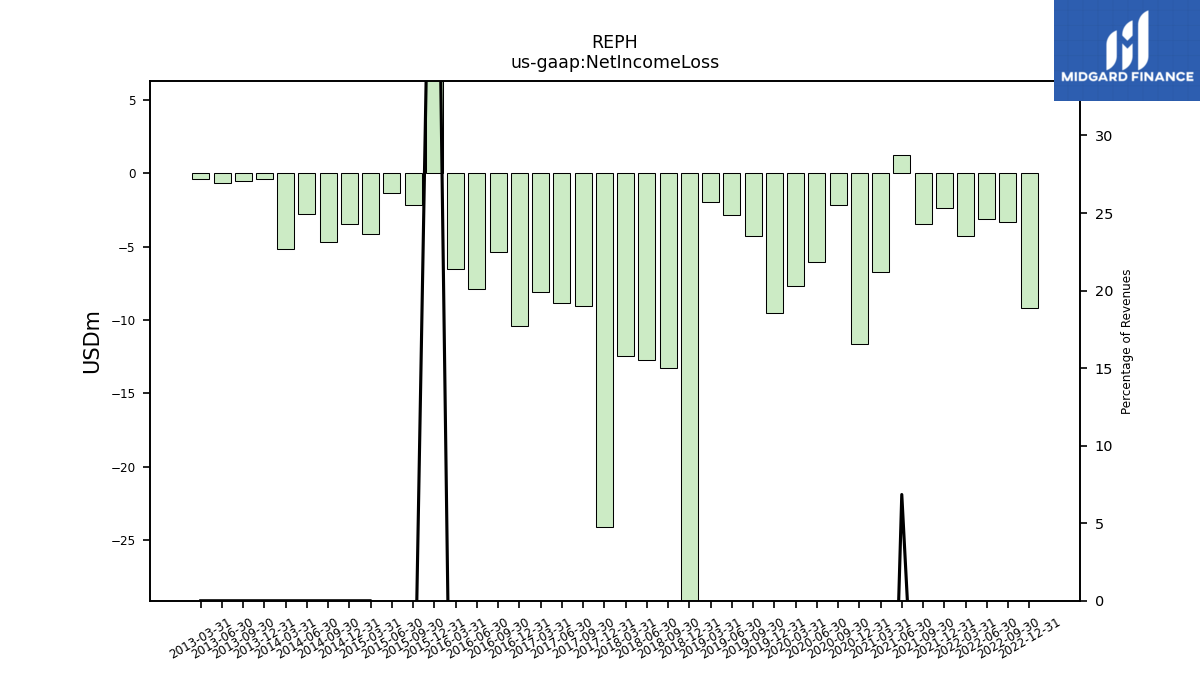
| Profit Loss | -9.17 | -3.33 | -3.12 | -4.26 | -2.36 | -3.49 | 1.23 | -6.76 | -11.67 | -2.13 | -6.01 | -7.69 | -9.51 | -4.31 | -2.84 | -1.98 | -41.30 | -13.25 | -12.72 | -12.46 | -24.08 | -9.05 | NA | NA | NA | NA | NA | NA | NA | NA | NA | |
| Net Income Loss | -9.17 | -3.33 | -3.12 | -4.26 | -2.36 | -3.49 | 1.23 | -6.76 | -11.67 | -2.13 | -6.01 | -7.69 | -9.51 | -4.30 | -2.84 | -1.98 | -41.30 | -13.26 | -12.71 | -12.46 | -24.08 | -9.05 | -8.86 | -8.09 | -10.40 | -5.38 | -7.88 | -6.54 | 10.63 | -2.15 | -1.31 |
| 2022-12-31 | 2022-09-30 | 2022-06-30 | 2022-03-31 | 2021-12-31 | 2021-09-30 | 2021-06-30 | 2021-03-31 | 2020-12-31 | 2020-09-30 | 2020-06-30 | 2020-03-31 | 2019-12-31 | 2019-09-30 | 2019-06-30 | 2019-03-31 | 2018-12-31 | 2018-09-30 | 2018-06-30 | 2018-03-31 | 2017-12-31 | 2017-09-30 | 2017-06-30 | 2017-03-31 | 2016-12-31 | 2016-09-30 | 2016-06-30 | 2016-03-31 | 2015-12-31 | 2015-09-30 | 2015-06-30 | ||
|---|---|---|---|---|---|---|---|---|---|---|---|---|---|---|---|---|---|---|---|---|---|---|---|---|---|---|---|---|---|---|---|---|
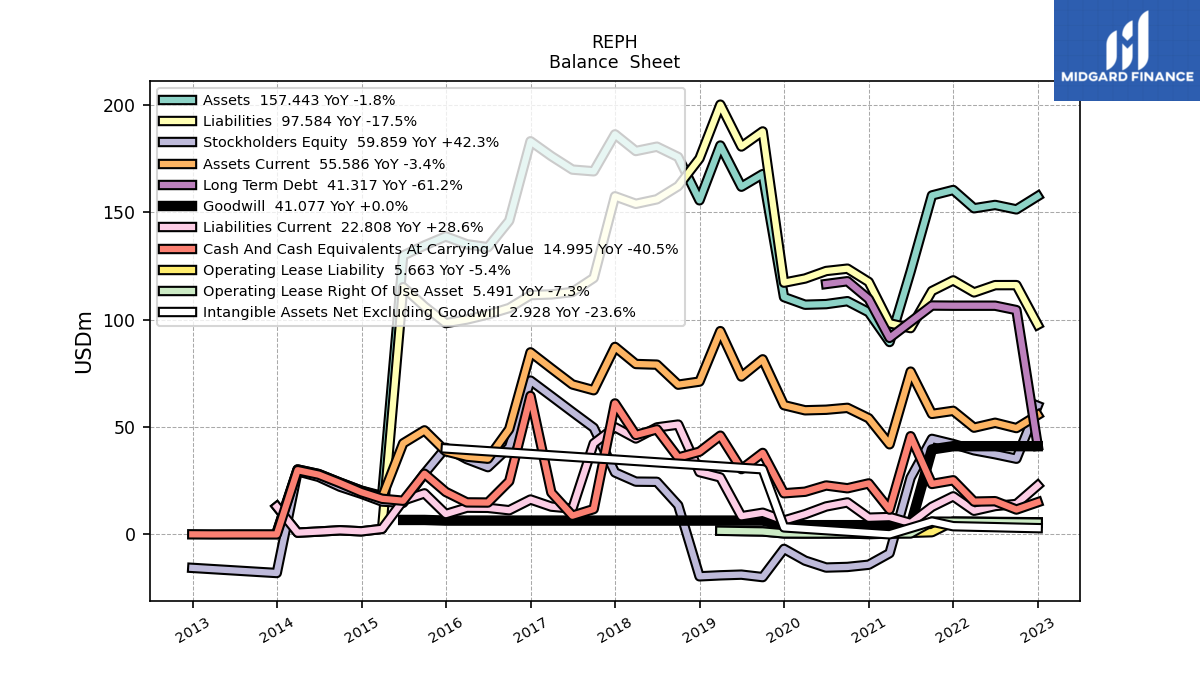
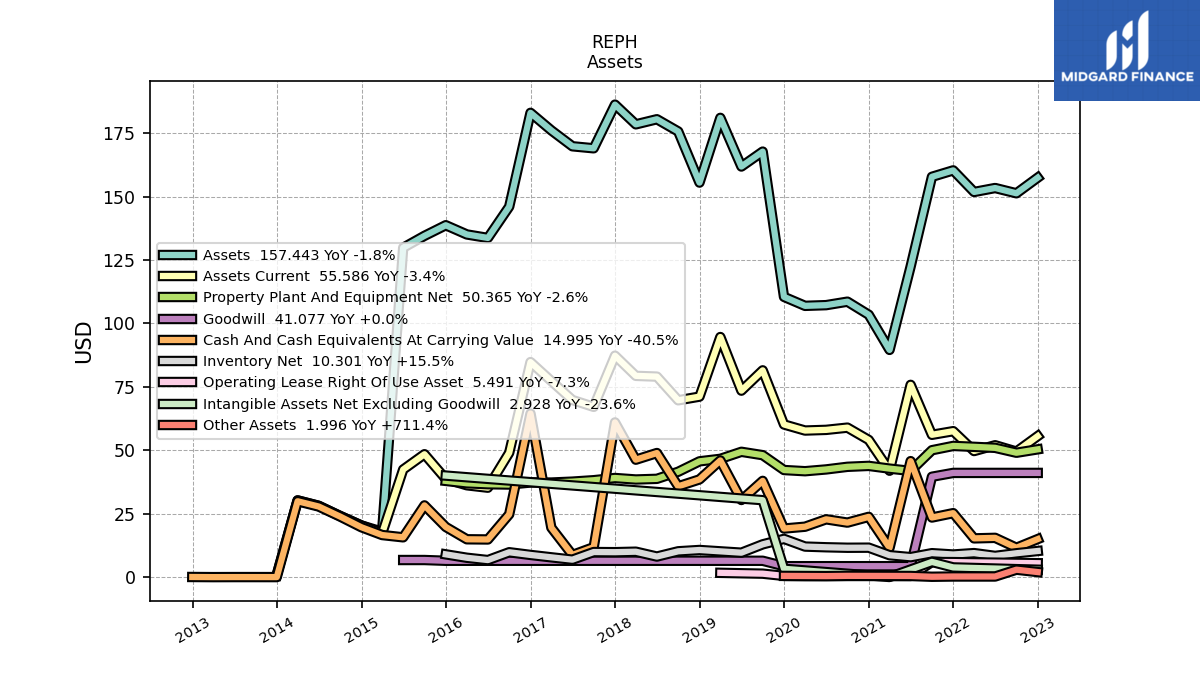
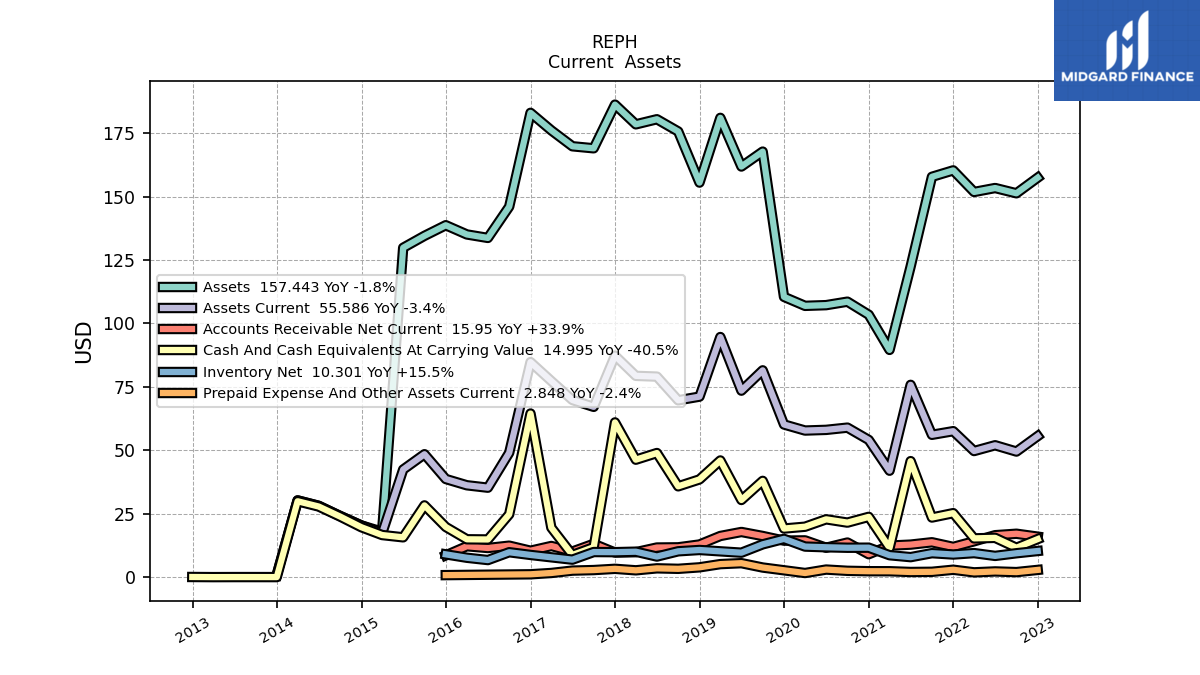
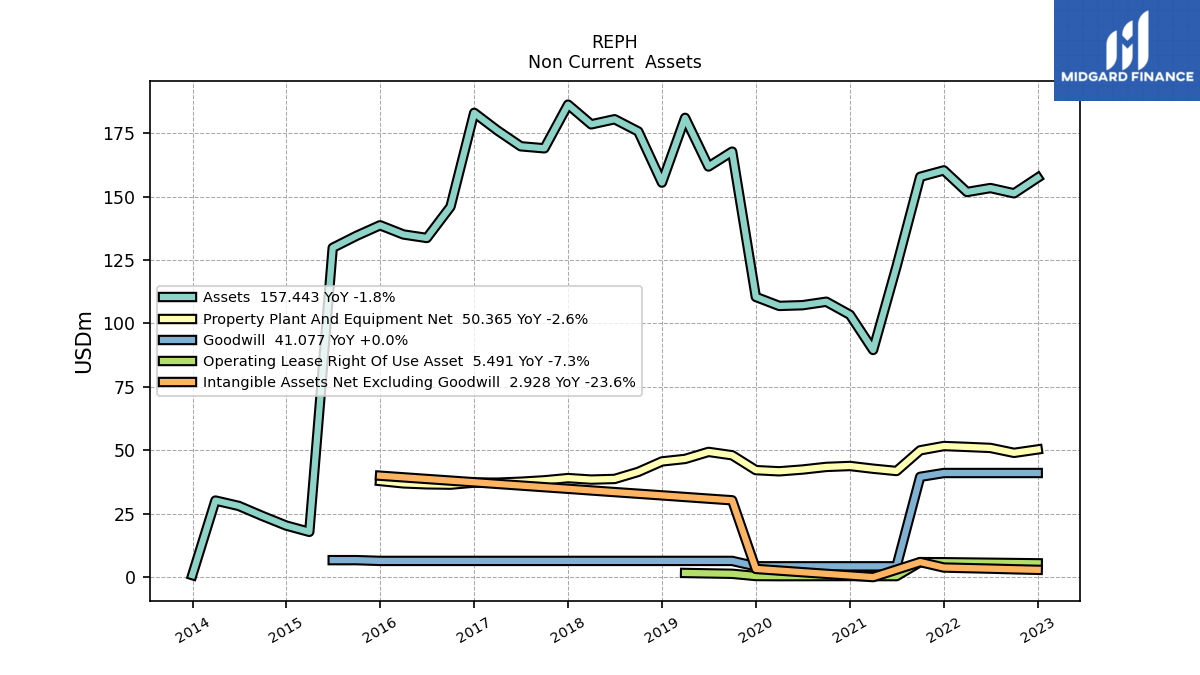
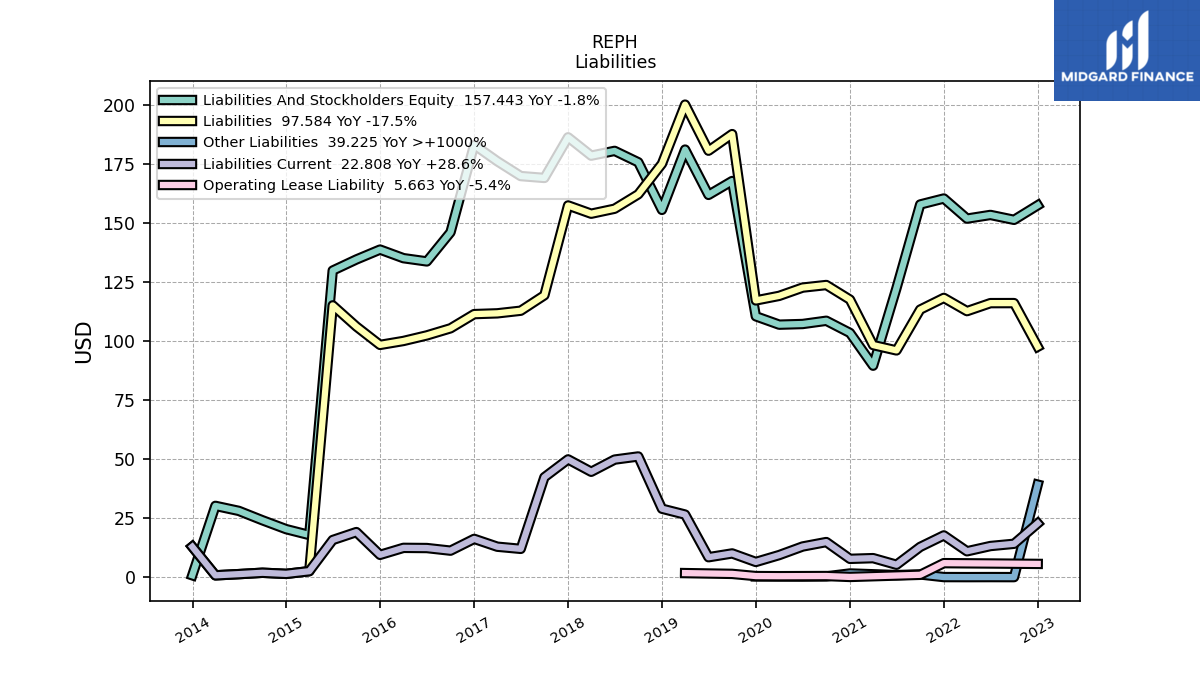
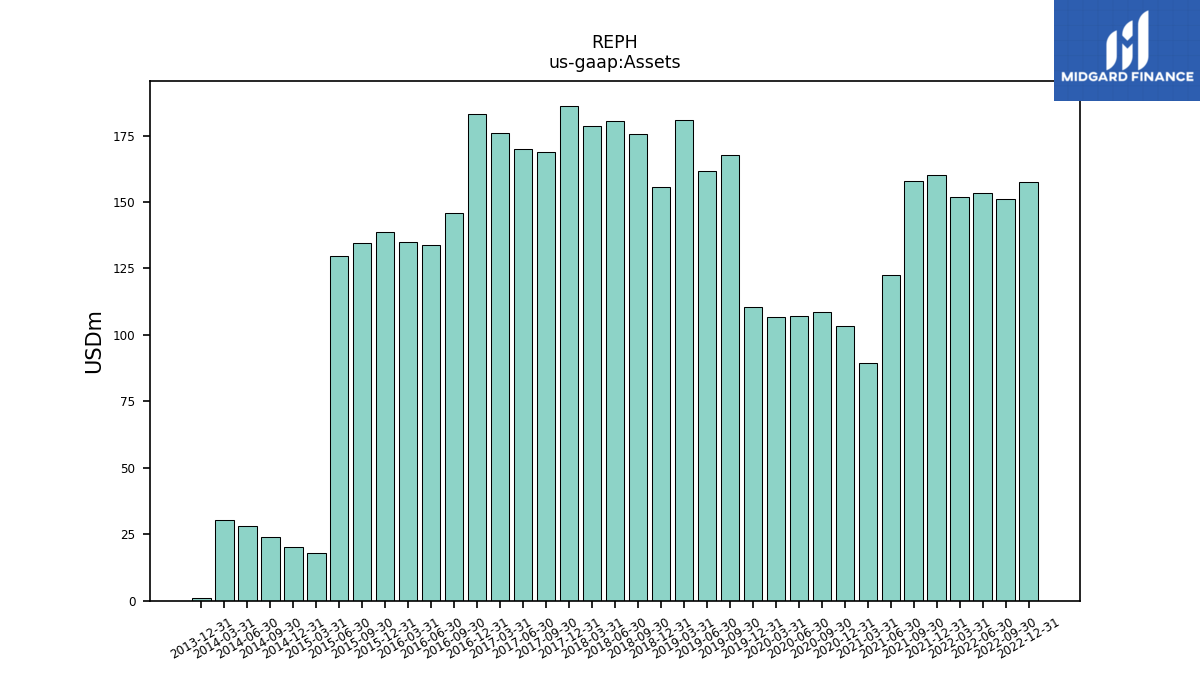
| Assets | 157.44 | 151.28 | 153.36 | 151.80 | 160.32 | 157.78 | 122.43 | 89.55 | 103.42 | 108.57 | 107.20 | 106.92 | 110.46 | 167.72 | 161.83 | 181.02 | 155.49 | 175.65 | 180.47 | 178.45 | 186.23 | 169.01 | 169.81 | 176.07 | 183.00 | 146.01 | 133.68 | 135.06 | 138.70 | 134.51 | 129.81 | |
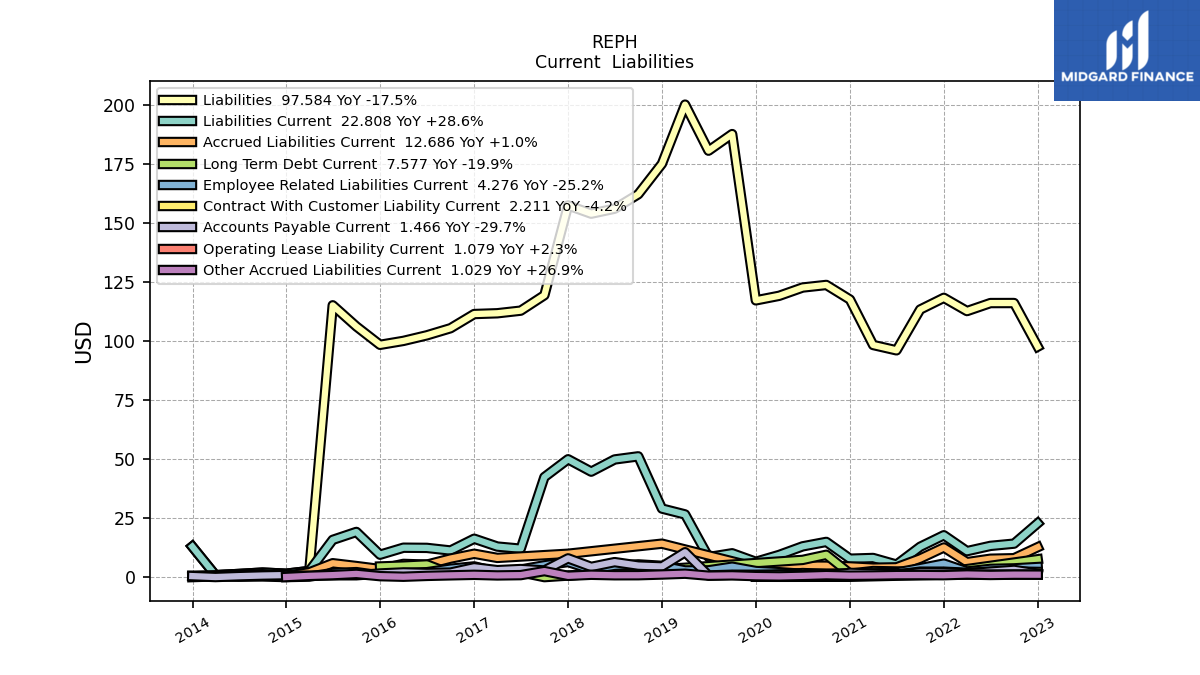
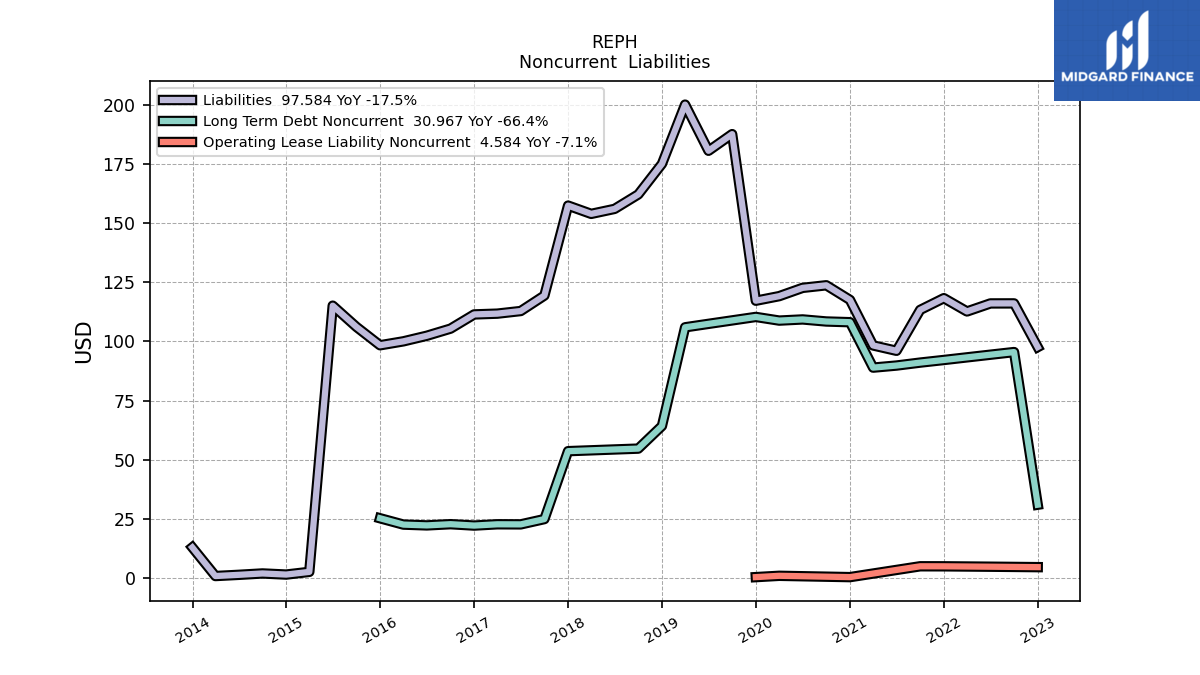
| Liabilities | 97.58 | 116.05 | 116.03 | 112.64 | 118.25 | 113.30 | 96.01 | 98.28 | 117.52 | 123.70 | 122.61 | 119.11 | 117.17 | 187.58 | 180.54 | 200.05 | 174.99 | 162.10 | 155.98 | 153.88 | 157.38 | 119.36 | 112.82 | 111.71 | 111.38 | 105.38 | 102.38 | 100.02 | 98.35 | 106.13 | 115.09 | |
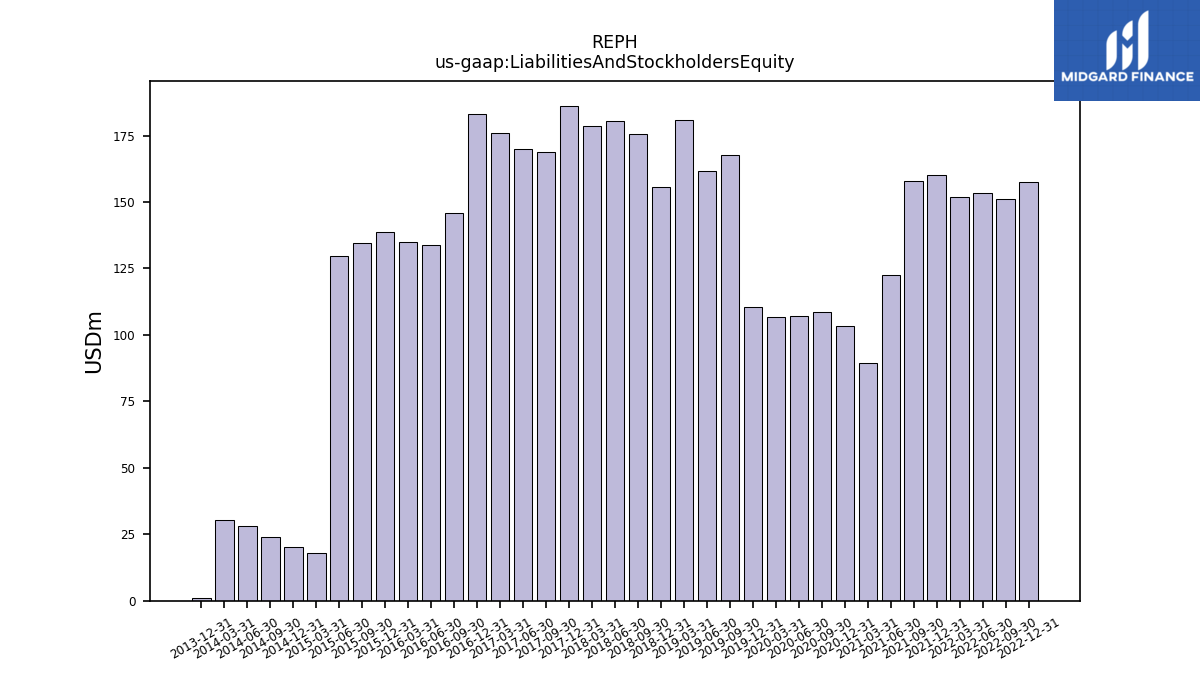
| Liabilities And Stockholders Equity | 157.44 | 151.28 | 153.36 | 151.80 | 160.32 | 157.78 | 122.43 | 89.55 | 103.42 | 108.57 | 107.20 | 106.92 | 110.46 | 167.72 | 161.83 | 181.02 | 155.49 | 175.65 | 180.47 | 178.45 | 186.23 | 169.01 | 169.81 | 176.07 | 183.00 | 146.01 | 133.68 | 135.06 | 138.70 | 134.51 | 129.81 | |
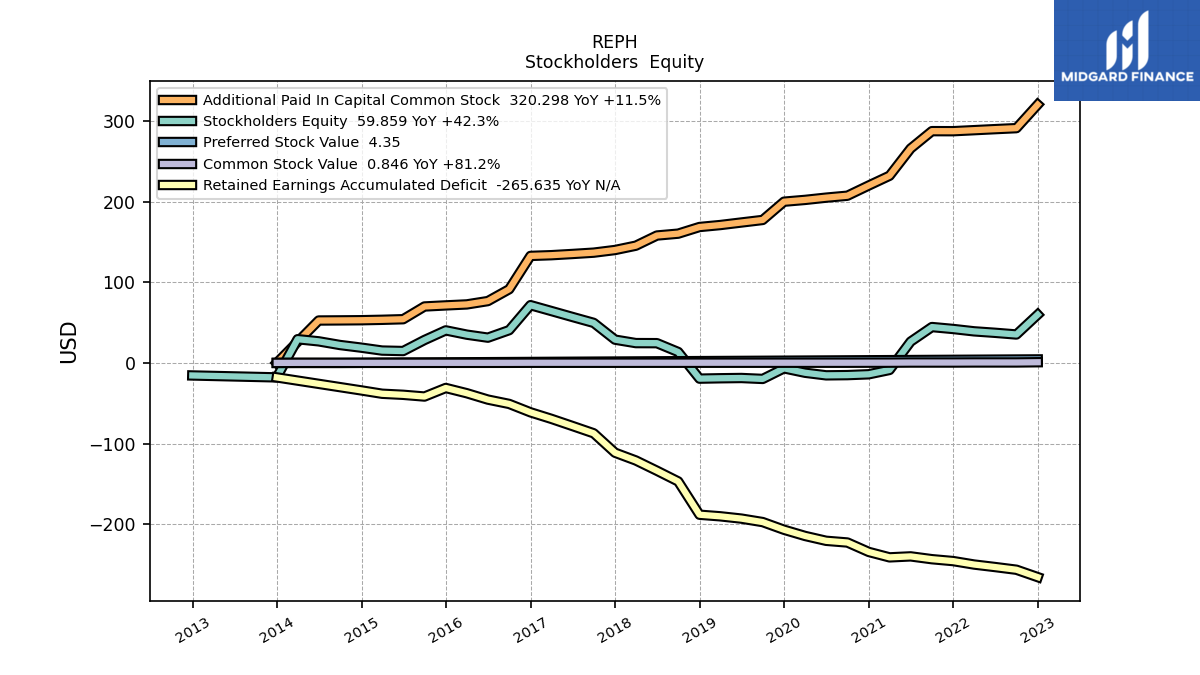
| Stockholders Equity | 59.86 | 35.23 | 37.33 | 39.16 | 42.06 | 44.48 | 26.42 | -8.72 | -14.10 | -15.13 | -15.41 | -12.19 | -6.71 | -19.87 | -18.71 | -19.03 | -19.50 | 13.55 | 24.49 | 24.58 | 28.85 | 49.65 | 56.99 | 64.36 | 71.61 | 40.63 | 31.31 | 35.04 | 40.35 | 28.38 | 14.73 |
| 2022-12-31 | 2022-09-30 | 2022-06-30 | 2022-03-31 | 2021-12-31 | 2021-09-30 | 2021-06-30 | 2021-03-31 | 2020-12-31 | 2020-09-30 | 2020-06-30 | 2020-03-31 | 2019-12-31 | 2019-09-30 | 2019-06-30 | 2019-03-31 | 2018-12-31 | 2018-09-30 | 2018-06-30 | 2018-03-31 | 2017-12-31 | 2017-09-30 | 2017-06-30 | 2017-03-31 | 2016-12-31 | 2016-09-30 | 2016-06-30 | 2016-03-31 | 2015-12-31 | 2015-09-30 | 2015-06-30 | ||
|---|---|---|---|---|---|---|---|---|---|---|---|---|---|---|---|---|---|---|---|---|---|---|---|---|---|---|---|---|---|---|---|---|
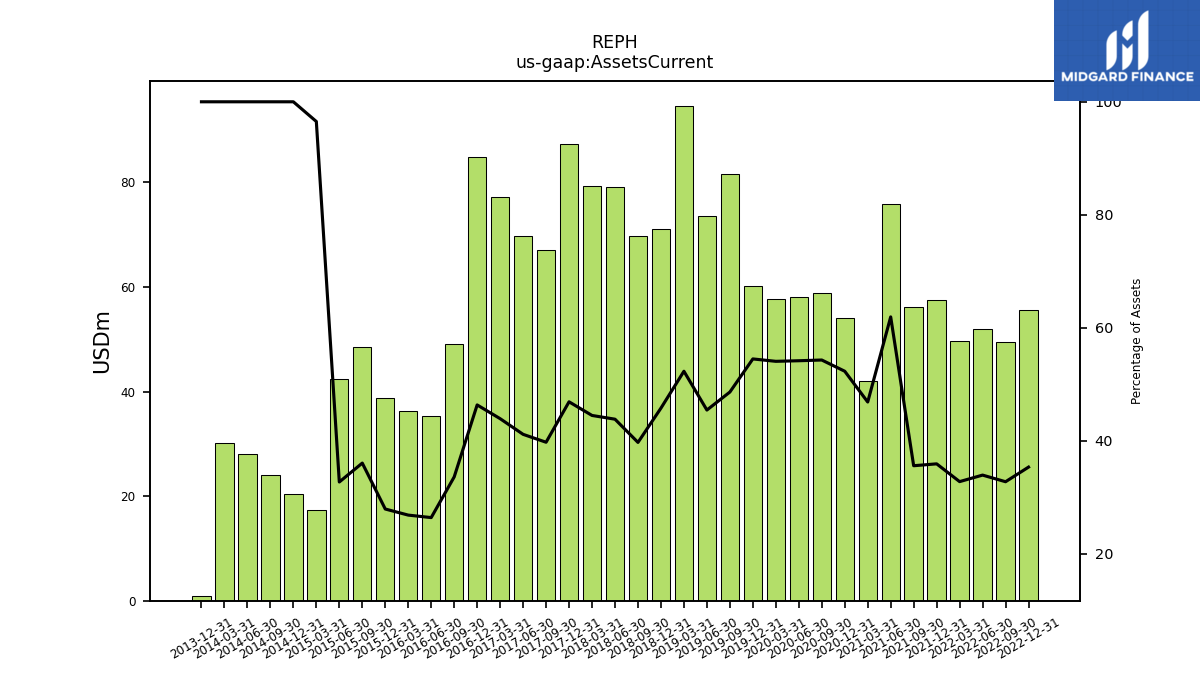
| Assets Current | 55.59 | 49.49 | 51.98 | 49.69 | 57.53 | 56.09 | 75.79 | 41.94 | 54.07 | 58.92 | 58.04 | 57.78 | 60.16 | 81.51 | 73.49 | 94.64 | 71.14 | 69.70 | 79.03 | 79.33 | 87.28 | 67.11 | 69.81 | 77.27 | 84.76 | 49.01 | 35.25 | 36.21 | 38.68 | 48.45 | 42.41 | |
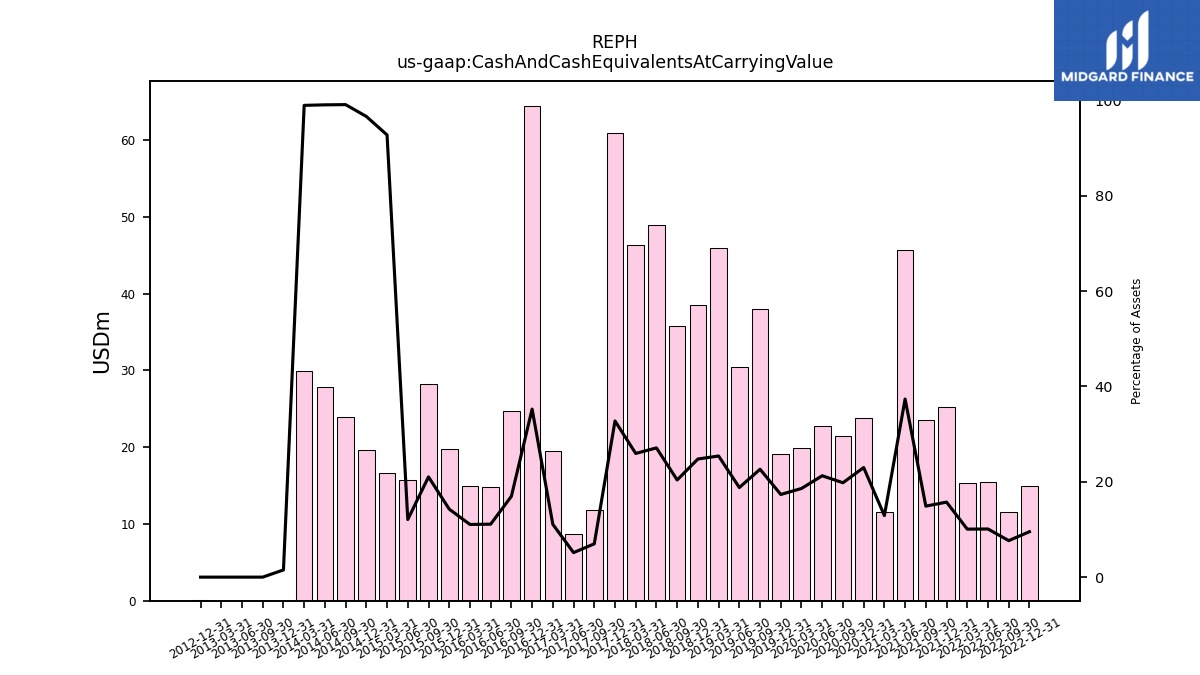
| Cash And Cash Equivalents At Carrying Value | 14.99 | 11.58 | 15.48 | 15.28 | 25.22 | 23.49 | 45.72 | 11.56 | 23.76 | 21.49 | 22.79 | 19.87 | 19.15 | 37.94 | 30.40 | 45.98 | 38.51 | 35.79 | 48.91 | 46.28 | 60.98 | 11.80 | 8.73 | 19.48 | 64.48 | 24.75 | 14.85 | 14.92 | 19.78 | 28.27 | 15.69 | |
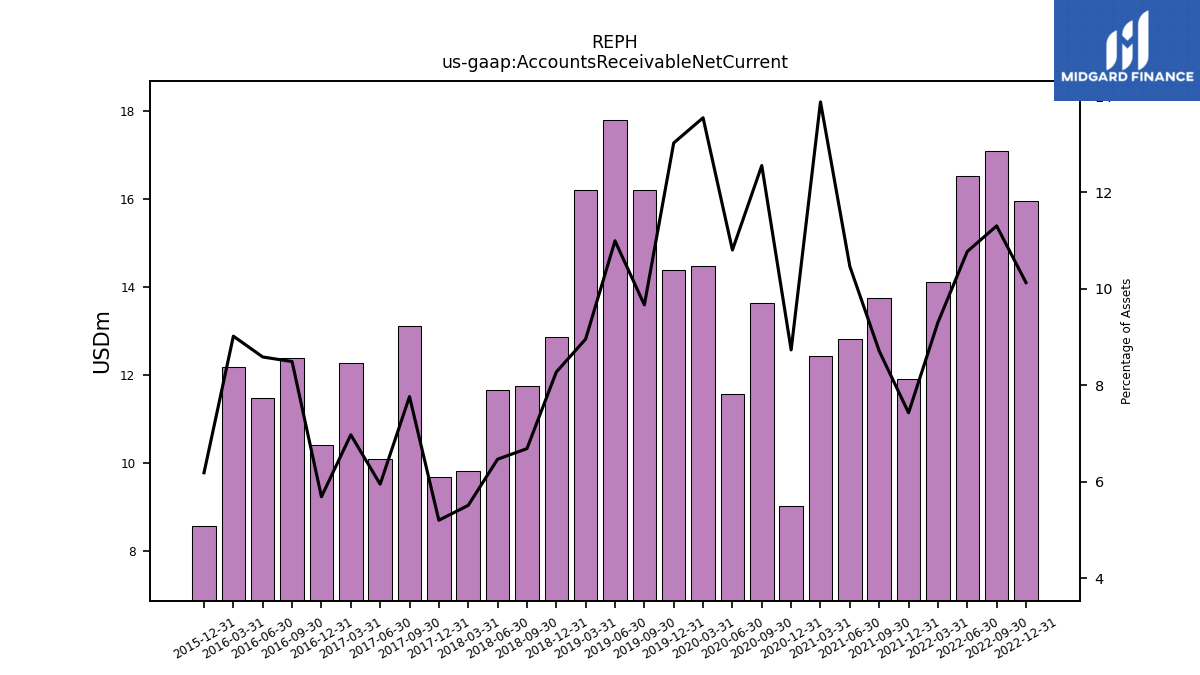
| Accounts Receivable Net Current | 15.95 | 17.10 | 16.52 | 14.12 | 11.91 | 13.75 | 12.81 | 12.43 | 9.03 | 13.63 | 11.58 | 14.49 | 14.39 | 16.22 | 17.80 | 16.22 | 12.87 | 11.74 | 11.67 | 9.83 | 9.69 | 13.13 | 10.10 | 12.28 | 10.41 | 12.40 | 11.48 | 12.18 | 8.58 | NA | NA | |
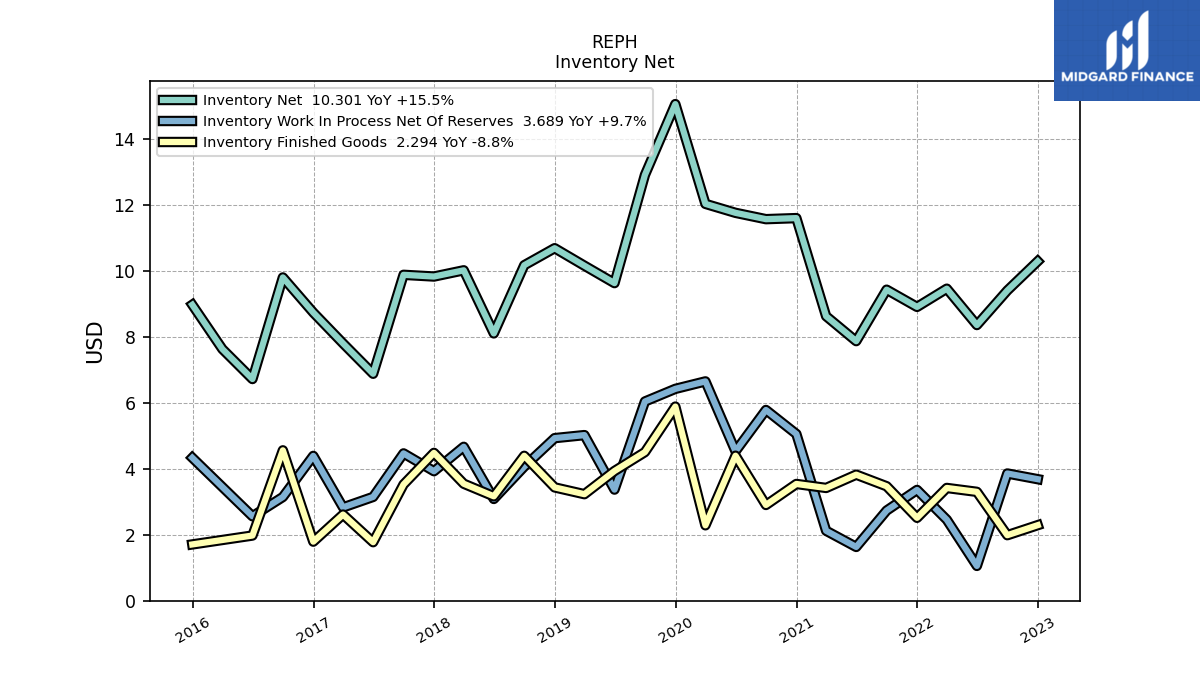
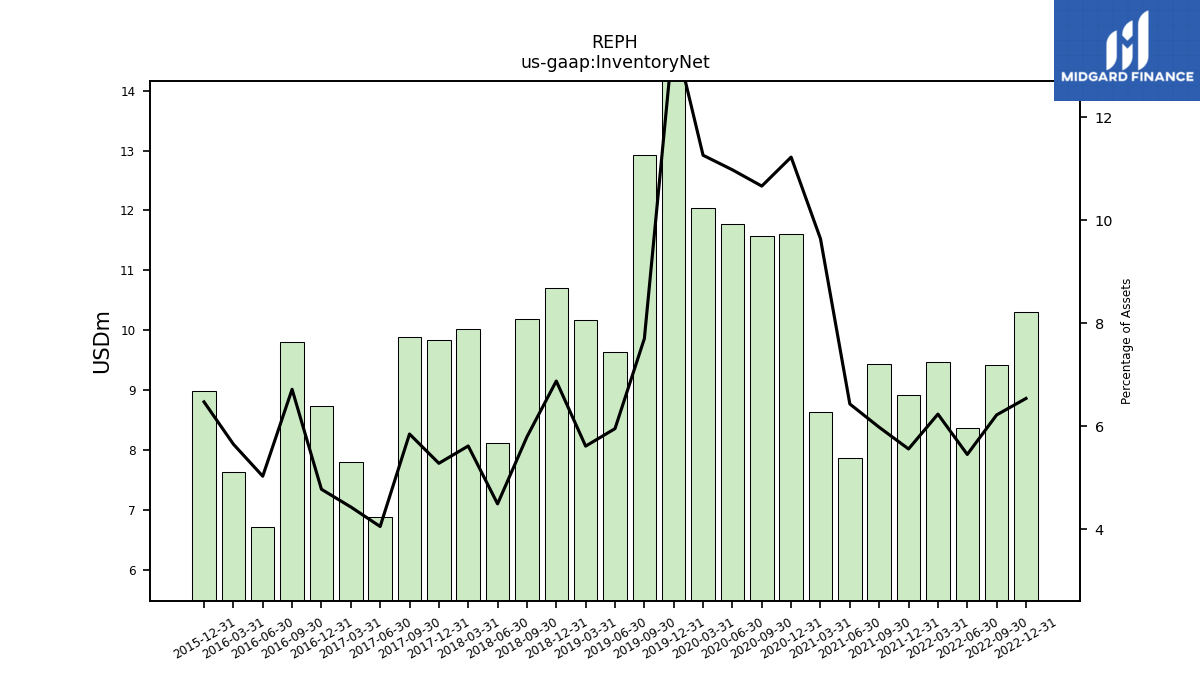
| Inventory Net | 10.30 | 9.41 | 8.37 | 9.47 | 8.92 | 9.44 | 7.88 | 8.64 | 11.61 | 11.58 | 11.77 | 12.04 | 15.07 | 12.92 | 9.64 | 10.17 | 10.70 | 10.18 | 8.11 | 10.03 | 9.84 | 9.89 | 6.89 | 7.81 | 8.75 | 9.81 | 6.73 | 7.64 | 8.98 | NA | NA | |
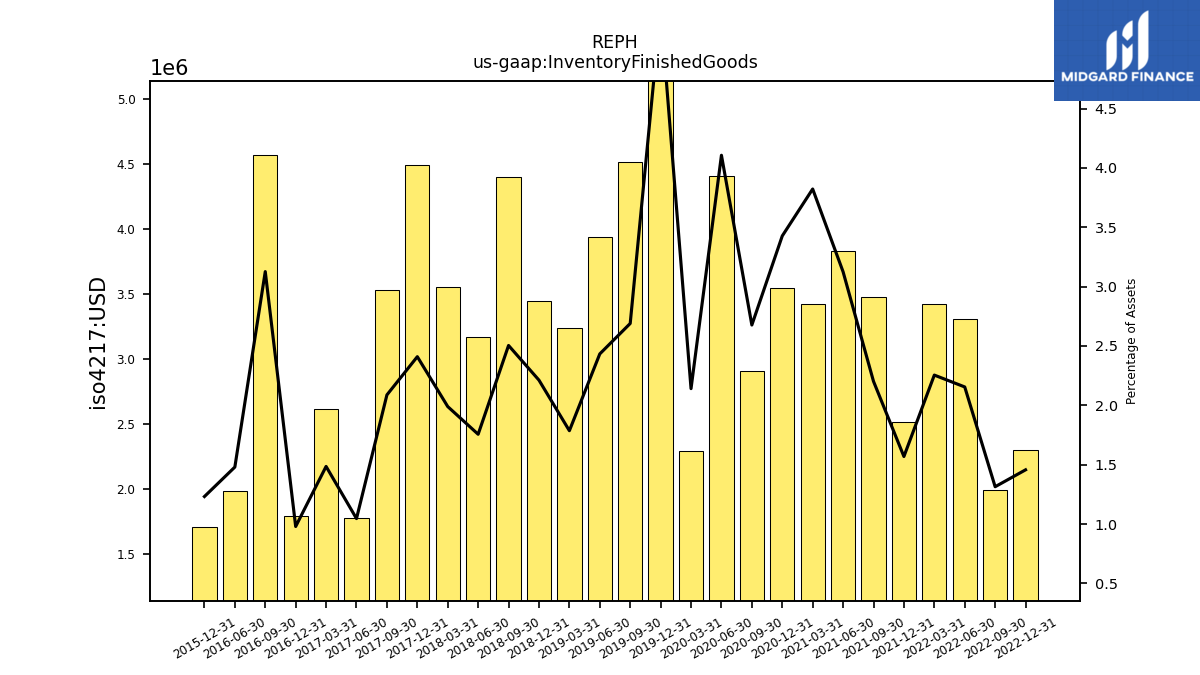
| Inventory Finished Goods | 2.29 | 1.99 | 3.31 | 3.42 | 2.52 | 3.48 | 3.83 | 3.42 | 3.54 | 2.91 | 4.40 | 2.29 | 5.89 | 4.51 | 3.94 | 3.23 | 3.44 | 4.40 | 3.17 | 3.55 | 4.49 | 3.53 | 1.78 | 2.62 | 1.79 | 4.57 | 1.98 | NA | 1.71 | NA | NA | |
| Prepaid Expense And Other Assets Current | 2.85 | 1.99 | 2.25 | 1.89 | 2.92 | 2.10 | 2.03 | 2.33 | 2.33 | 2.49 | 2.99 | 1.62 | 2.70 | 3.78 | 5.50 | 5.13 | 3.86 | 3.27 | 3.47 | 2.69 | 3.28 | 2.79 | 2.57 | 1.64 | 1.12 | NA | NA | NA | 0.79 | NA | NA |
| 2022-12-31 | 2022-09-30 | 2022-06-30 | 2022-03-31 | 2021-12-31 | 2021-09-30 | 2021-06-30 | 2021-03-31 | 2020-12-31 | 2020-09-30 | 2020-06-30 | 2020-03-31 | 2019-12-31 | 2019-09-30 | 2019-06-30 | 2019-03-31 | 2018-12-31 | 2018-09-30 | 2018-06-30 | 2018-03-31 | 2017-12-31 | 2017-09-30 | 2017-06-30 | 2017-03-31 | 2016-12-31 | 2016-09-30 | 2016-06-30 | 2016-03-31 | 2015-12-31 | 2015-09-30 | 2015-06-30 | ||
|---|---|---|---|---|---|---|---|---|---|---|---|---|---|---|---|---|---|---|---|---|---|---|---|---|---|---|---|---|---|---|---|---|
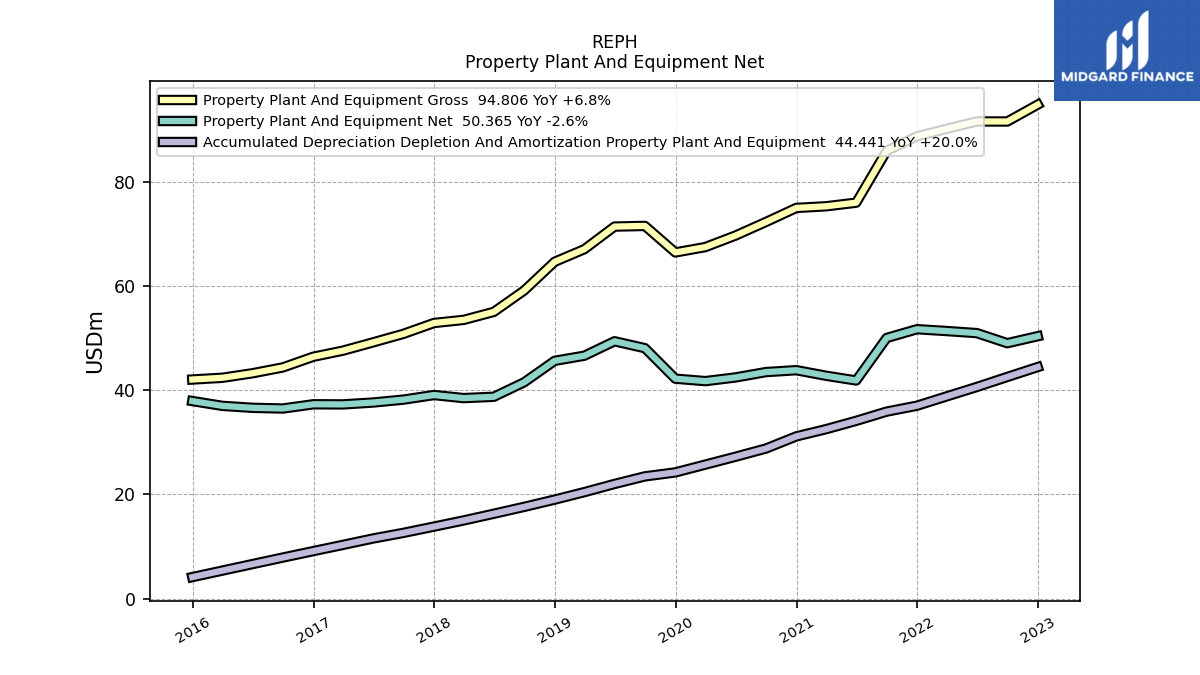
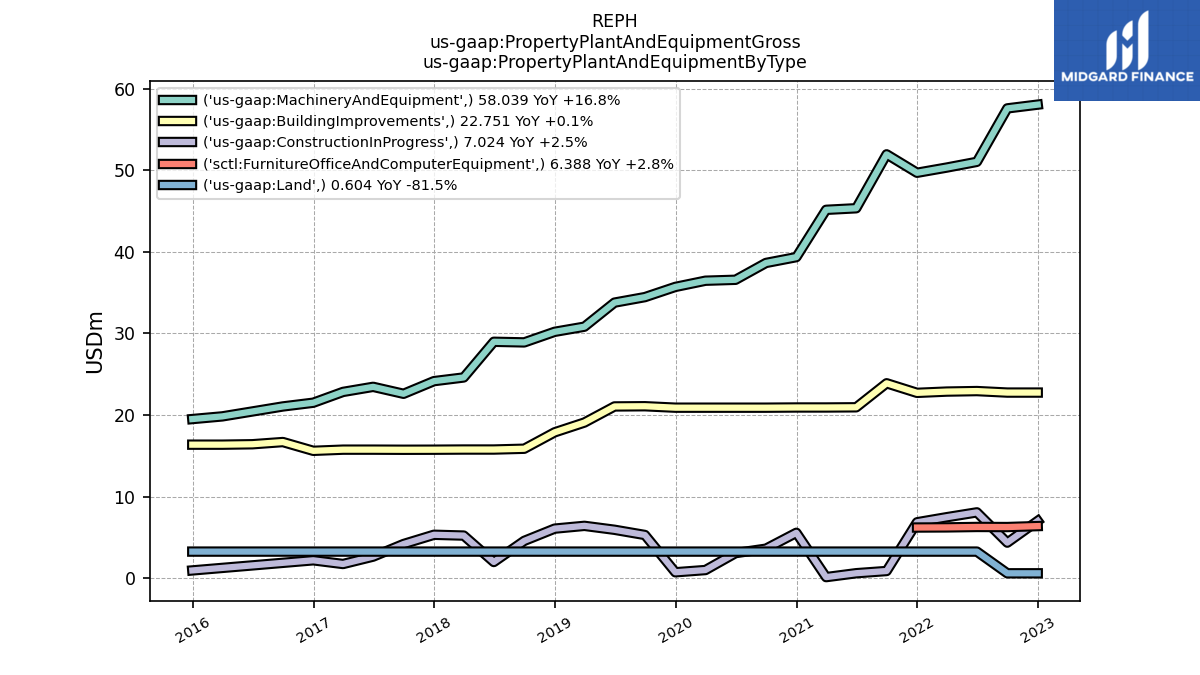
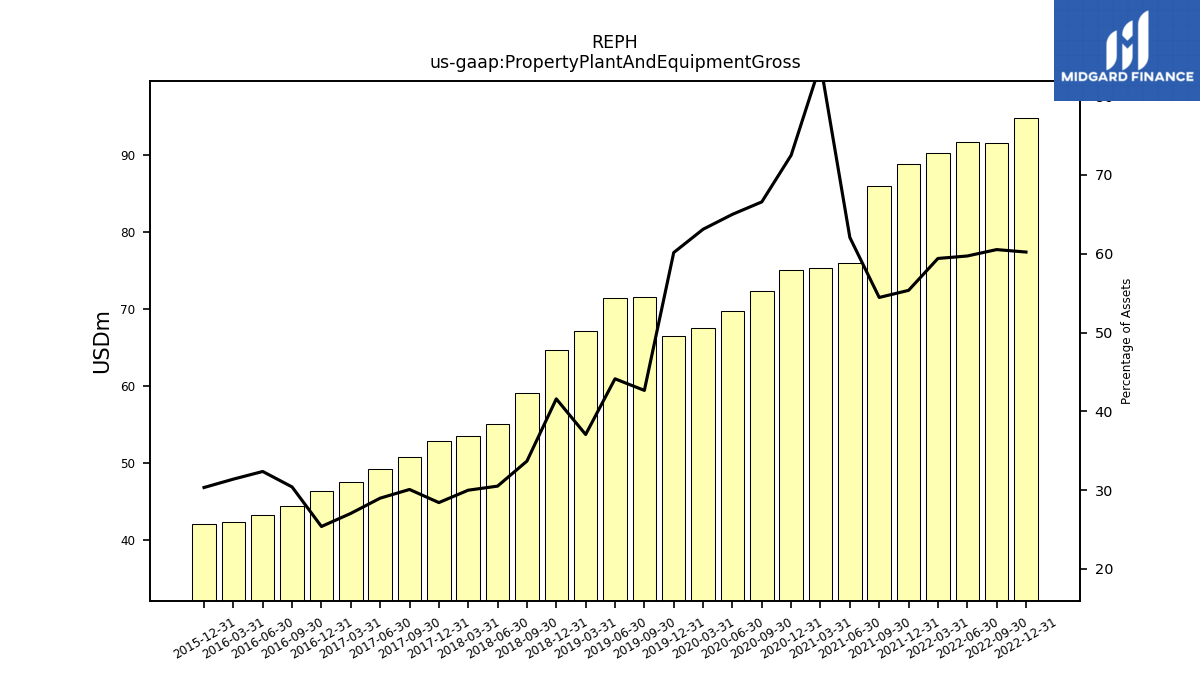
| Property Plant And Equipment Gross | 94.81 | 91.57 | 91.58 | 90.17 | 88.74 | 85.91 | 75.99 | 75.30 | 74.98 | 72.29 | 69.68 | 67.47 | 66.44 | 71.53 | 71.40 | 67.07 | 64.64 | 59.14 | 55.03 | 53.50 | 52.90 | 50.82 | 49.19 | 47.60 | 46.42 | 44.37 | 43.25 | 42.39 | 42.05 | NA | NA | |
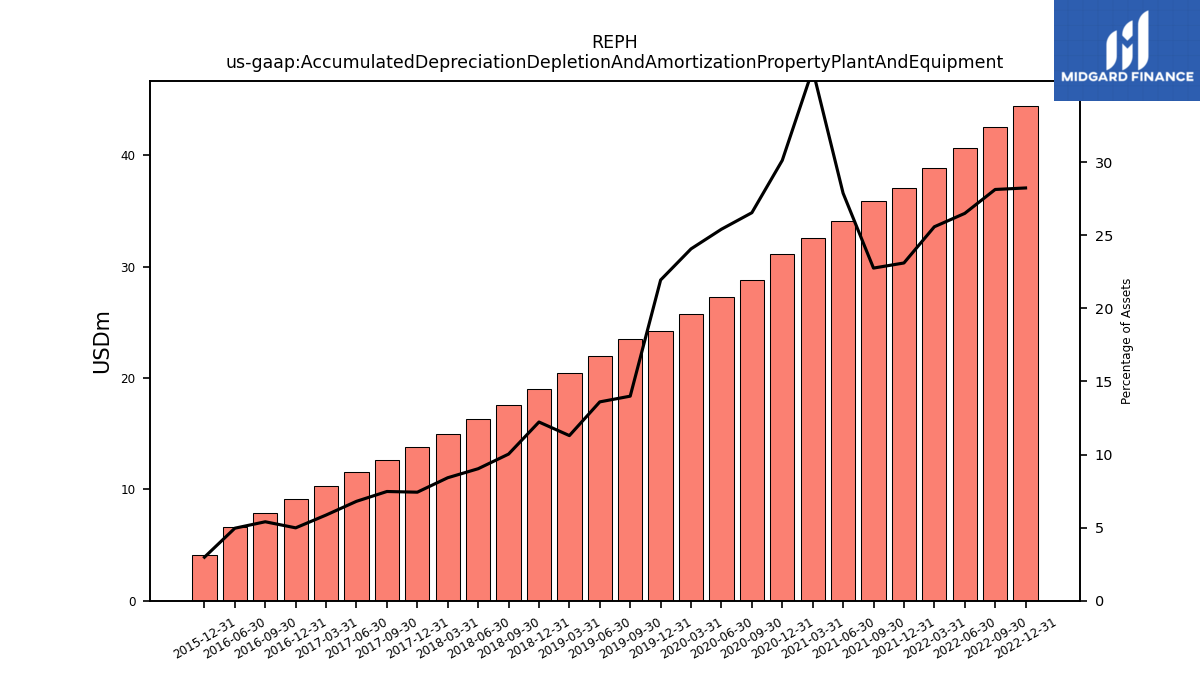
| Accumulated Depreciation Depletion And Amortization Property Plant And Equipment | 44.44 | 42.54 | 40.62 | 38.82 | 37.03 | 35.89 | 34.12 | 32.52 | 31.14 | 28.81 | 27.23 | 25.73 | 24.23 | 23.46 | 22.01 | 20.44 | 19.00 | 17.61 | 16.29 | 15.01 | 13.82 | 12.63 | 11.55 | 10.32 | 9.12 | 7.89 | 6.63 | NA | 4.13 | NA | NA | |
| Amortization Of Intangible Assets | 0.22 | 0.24 | 0.22 | 0.22 | 0.20 | 0.14 | 0.05 | 0.65 | 0.65 | 0.65 | 0.65 | 0.65 | 0.65 | 0.65 | 0.65 | 0.65 | 0.65 | 0.65 | 0.65 | 0.65 | 0.65 | 0.65 | 0.65 | 0.65 | 0.65 | 0.65 | 0.65 | 0.65 | 0.65 | 0.65 | 0.59 | |
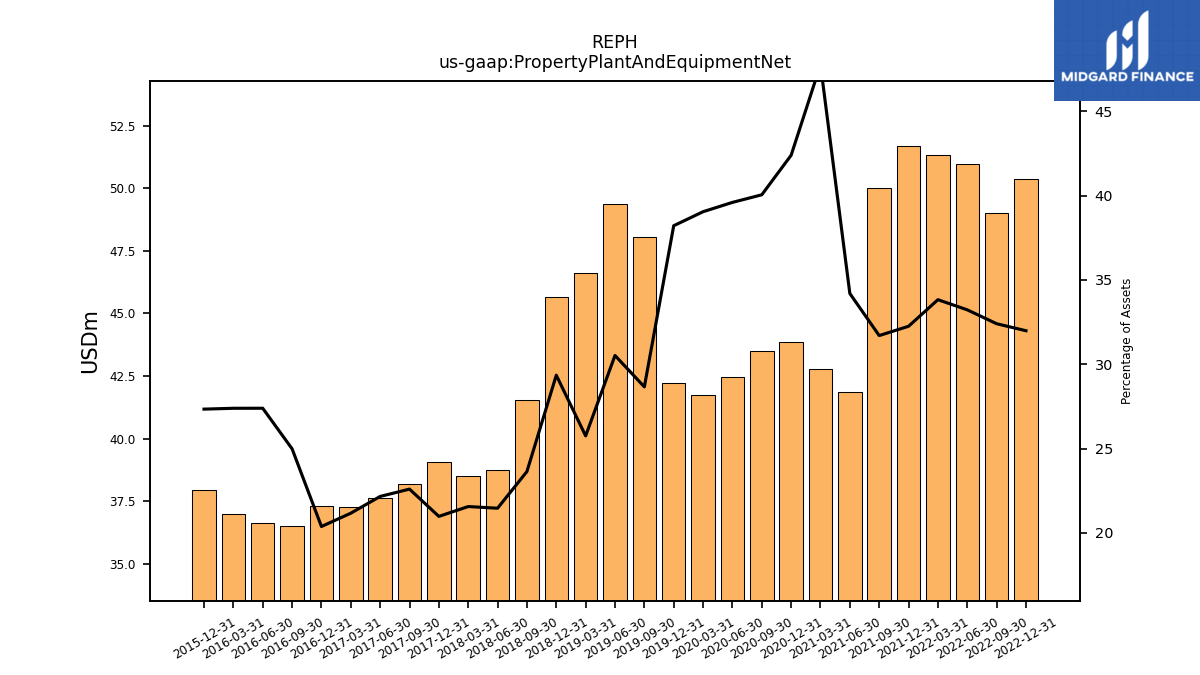
| Property Plant And Equipment Net | 50.37 | 49.02 | 50.96 | 51.35 | 51.71 | 50.02 | 41.87 | 42.77 | 43.84 | 43.48 | 42.45 | 41.75 | 42.21 | 48.07 | 49.39 | 46.62 | 45.64 | 41.53 | 38.74 | 38.49 | 39.07 | 38.20 | 37.64 | 37.28 | 37.30 | 36.49 | 36.62 | 36.99 | 37.92 | NA | NA | |
| Goodwill | 41.08 | 41.08 | 41.08 | 41.08 | 41.08 | 39.57 | 4.32 | 4.32 | 4.32 | 4.32 | 4.32 | 4.32 | 4.32 | 6.45 | 6.45 | 6.45 | 6.45 | 6.45 | 6.45 | 6.45 | 6.45 | 6.45 | 6.45 | 6.45 | 6.45 | 6.45 | 6.45 | 6.45 | 6.45 | 6.74 | 6.74 | |
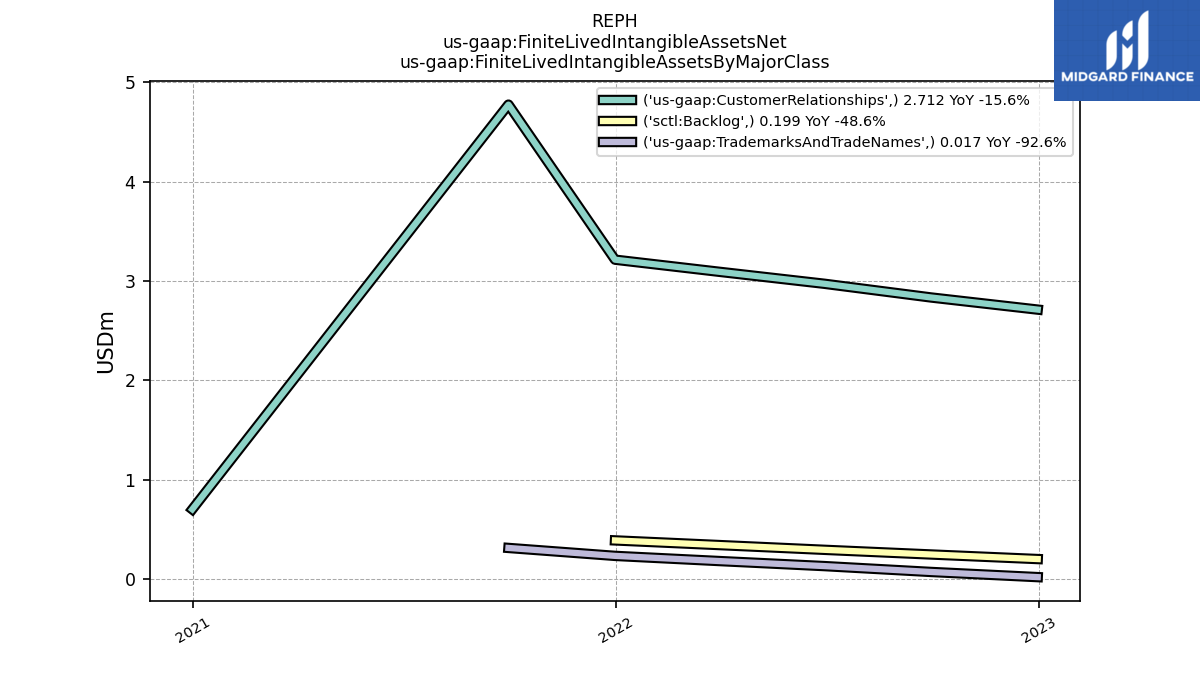
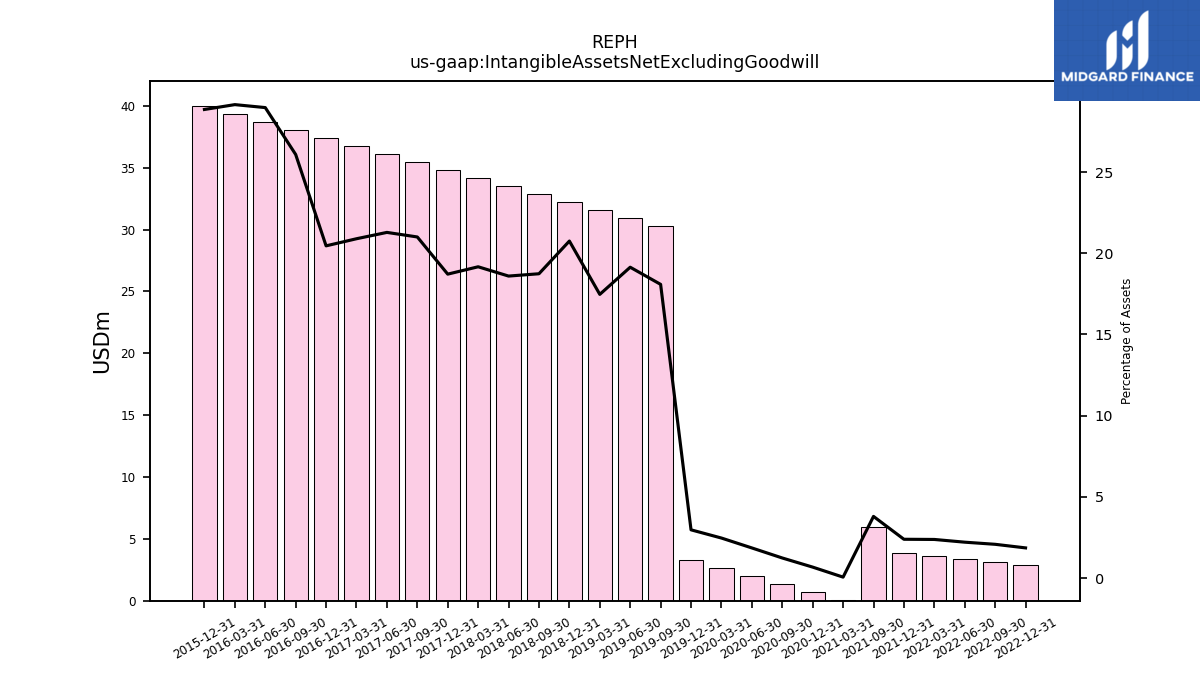
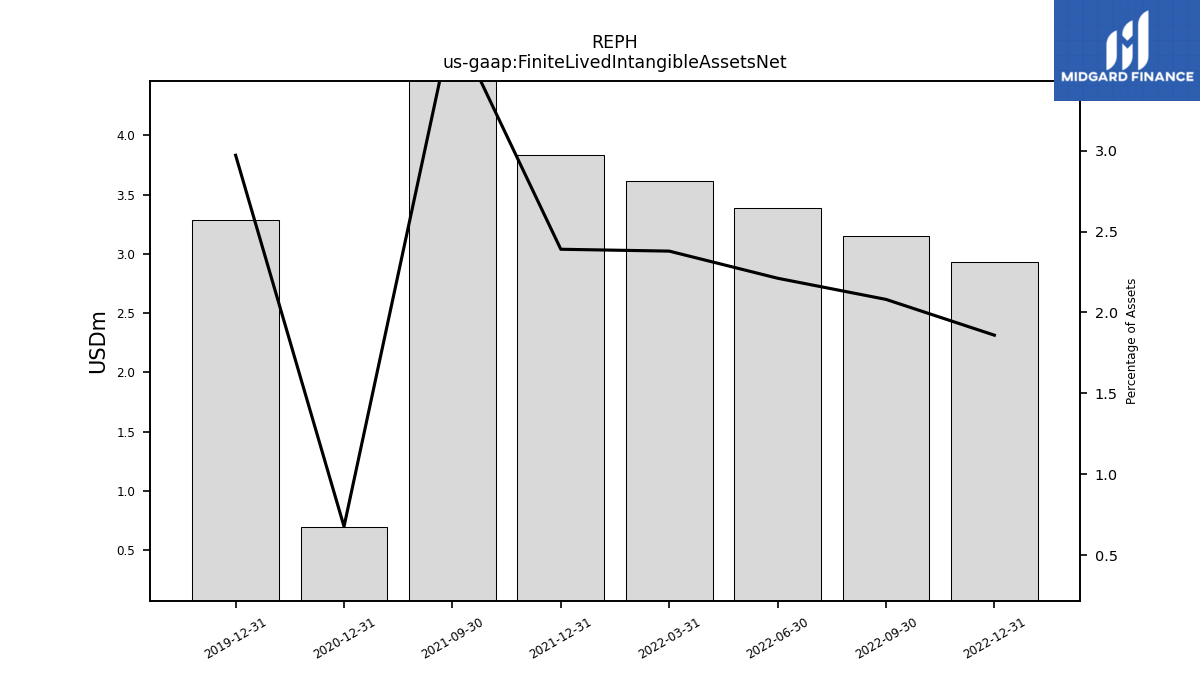
| Intangible Assets Net Excluding Goodwill | 2.93 | 3.15 | 3.39 | 3.61 | 3.83 | 5.99 | NA | 0.05 | 0.70 | 1.34 | 1.99 | 2.64 | 3.28 | 30.33 | 30.97 | 31.62 | 32.27 | 32.91 | 33.56 | 34.20 | 34.85 | 35.50 | 36.14 | 36.79 | 37.43 | 38.08 | 38.73 | 39.37 | 40.02 | NA | NA | |
| Finite Lived Intangible Assets Net | 2.93 | 3.15 | 3.39 | 3.61 | 3.83 | 5.99 | NA | NA | 0.70 | NA | NA | NA | 3.28 | NA | NA | NA | NA | NA | NA | NA | NA | NA | NA | NA | NA | NA | NA | NA | NA | NA | NA |
| 2022-12-31 | 2022-09-30 | 2022-06-30 | 2022-03-31 | 2021-12-31 | 2021-09-30 | 2021-06-30 | 2021-03-31 | 2020-12-31 | 2020-09-30 | 2020-06-30 | 2020-03-31 | 2019-12-31 | 2019-09-30 | 2019-06-30 | 2019-03-31 | 2018-12-31 | 2018-09-30 | 2018-06-30 | 2018-03-31 | 2017-12-31 | 2017-09-30 | 2017-06-30 | 2017-03-31 | 2016-12-31 | 2016-09-30 | 2016-06-30 | 2016-03-31 | 2015-12-31 | 2015-09-30 | 2015-06-30 | ||
|---|---|---|---|---|---|---|---|---|---|---|---|---|---|---|---|---|---|---|---|---|---|---|---|---|---|---|---|---|---|---|---|---|
| Liabilities Current | 22.81 | 14.18 | 13.23 | 11.00 | 17.73 | 12.86 | 5.30 | 8.11 | 7.80 | 14.92 | 13.03 | 9.41 | 6.49 | 10.10 | 8.49 | 26.55 | 29.03 | 51.14 | 49.81 | 44.65 | 49.90 | 42.34 | 12.03 | 12.94 | 16.26 | 11.27 | 12.38 | 12.46 | 9.49 | 19.14 | 15.78 | |
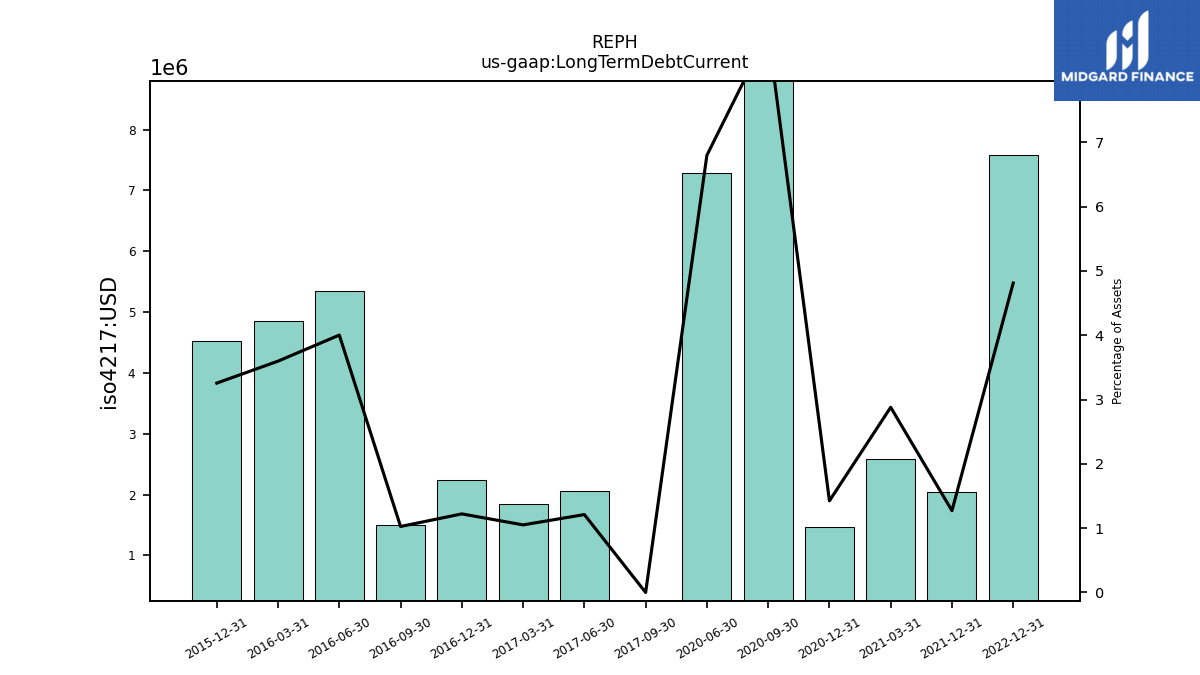
| Long Term Debt Current | 7.58 | NA | NA | NA | 2.04 | NA | NA | 2.58 | 1.47 | 9.46 | 7.29 | NA | NA | NA | NA | NA | NA | NA | NA | NA | NA | 0.00 | 2.06 | 1.85 | 2.24 | 1.50 | 5.35 | 4.86 | 4.52 | NA | NA | |
| Accounts Payable Current | 1.47 | 3.06 | 2.34 | 1.56 | 2.08 | 1.92 | 1.16 | 1.54 | 1.80 | 0.66 | 0.87 | 1.14 | 0.99 | 1.02 | 0.71 | 10.54 | 4.51 | 4.89 | 6.36 | 4.34 | 7.95 | 2.82 | 3.42 | 2.95 | 4.13 | 1.92 | 1.75 | 1.99 | 1.55 | 0.78 | 0.77 | |
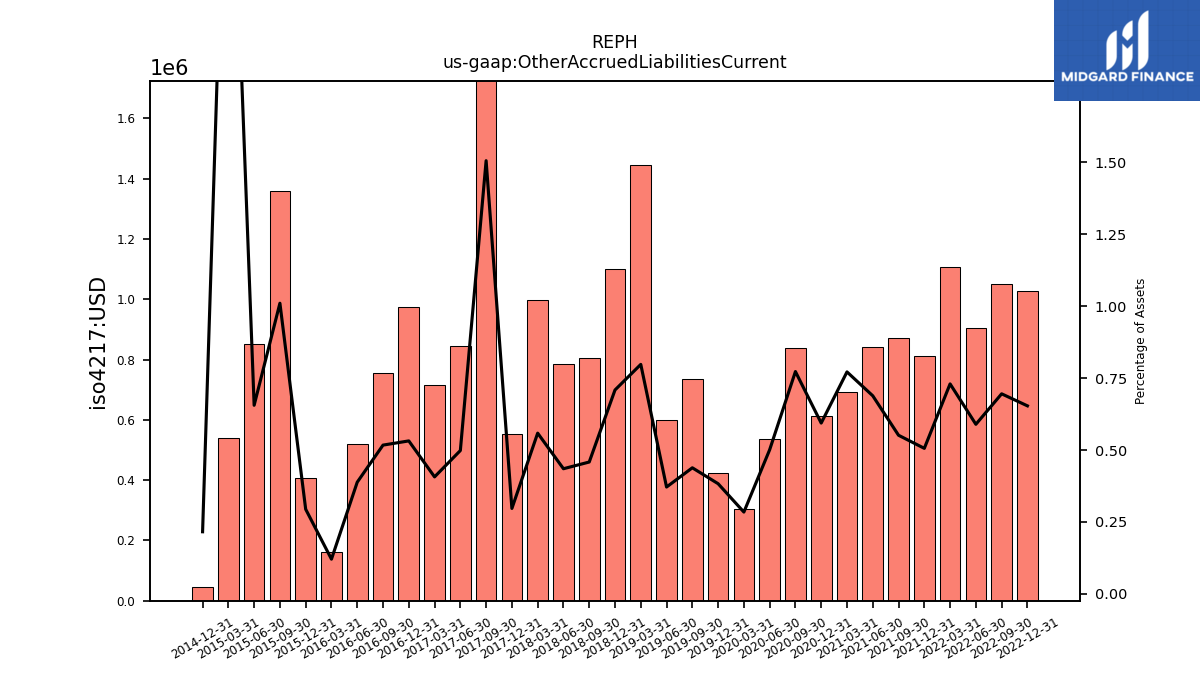
| Other Accrued Liabilities Current | 1.03 | 1.05 | 0.90 | 1.11 | 0.81 | 0.87 | 0.84 | 0.69 | 0.61 | 0.84 | 0.54 | 0.30 | 0.42 | 0.73 | 0.60 | 1.44 | 1.10 | 0.81 | 0.79 | 1.00 | 0.55 | 2.54 | 0.85 | 0.72 | 0.97 | 0.76 | 0.52 | 0.16 | 0.41 | 1.36 | 0.85 | |
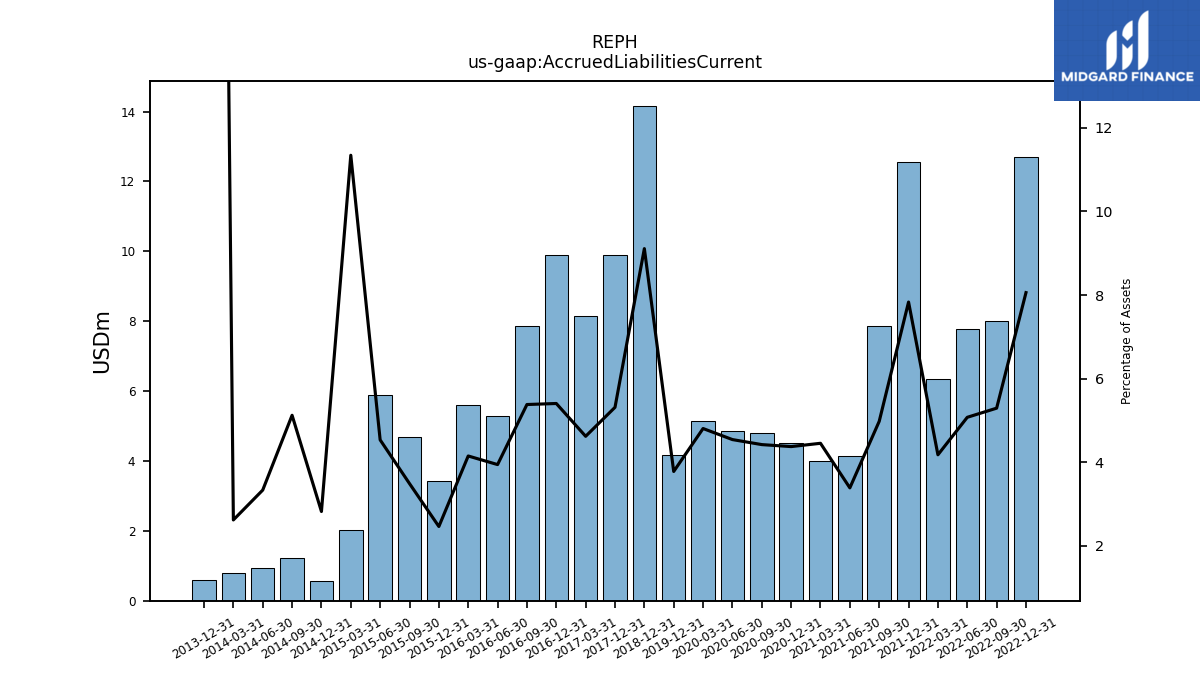
| Accrued Liabilities Current | 12.69 | 8.01 | 7.78 | 6.34 | 12.56 | 7.86 | 4.15 | 3.99 | 4.53 | 4.80 | 4.87 | 5.14 | 4.18 | NA | NA | NA | 14.16 | NA | NA | NA | 9.90 | NA | NA | 8.14 | 9.89 | 7.86 | 5.27 | 5.61 | 3.42 | 4.70 | 5.89 | |
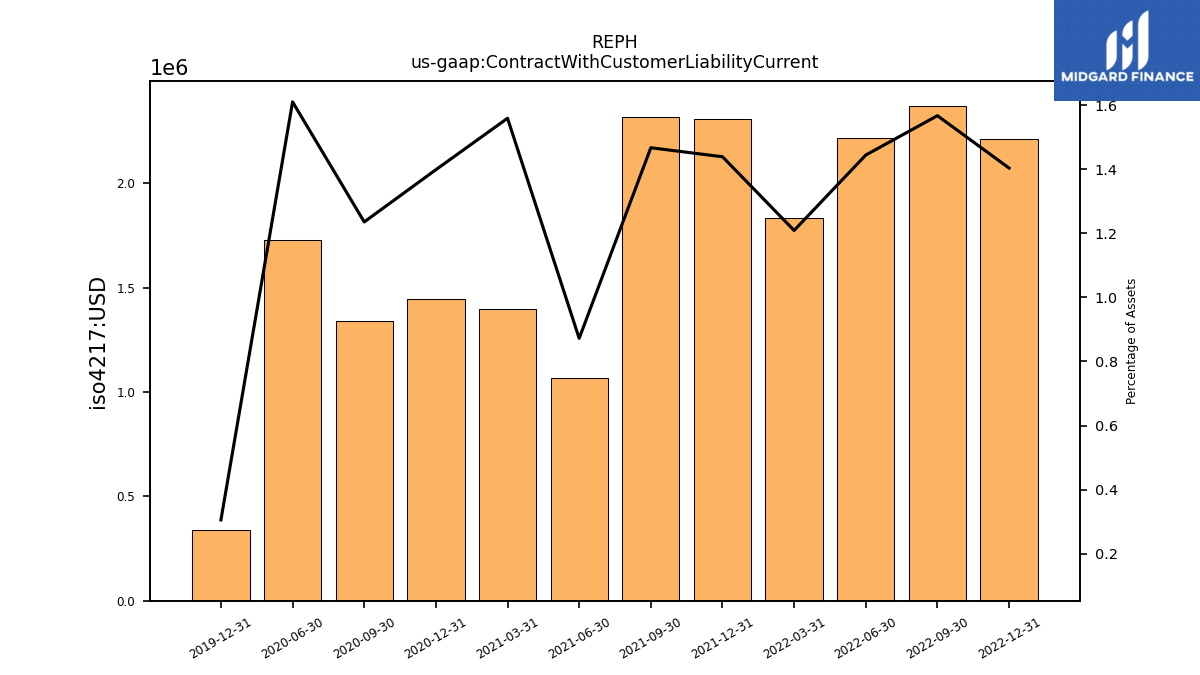
| Contract With Customer Liability Current | 2.21 | 2.37 | 2.22 | 1.84 | 2.31 | 2.32 | 1.07 | 1.40 | 1.45 | 1.34 | 1.73 | NA | 0.34 | NA | NA | NA | NA | NA | NA | NA | NA | NA | NA | NA | NA | NA | NA | NA | NA | NA | NA |
| 2022-12-31 | 2022-09-30 | 2022-06-30 | 2022-03-31 | 2021-12-31 | 2021-09-30 | 2021-06-30 | 2021-03-31 | 2020-12-31 | 2020-09-30 | 2020-06-30 | 2020-03-31 | 2019-12-31 | 2019-09-30 | 2019-06-30 | 2019-03-31 | 2018-12-31 | 2018-09-30 | 2018-06-30 | 2018-03-31 | 2017-12-31 | 2017-09-30 | 2017-06-30 | 2017-03-31 | 2016-12-31 | 2016-09-30 | 2016-06-30 | 2016-03-31 | 2015-12-31 | 2015-09-30 | 2015-06-30 | ||
|---|---|---|---|---|---|---|---|---|---|---|---|---|---|---|---|---|---|---|---|---|---|---|---|---|---|---|---|---|---|---|---|---|
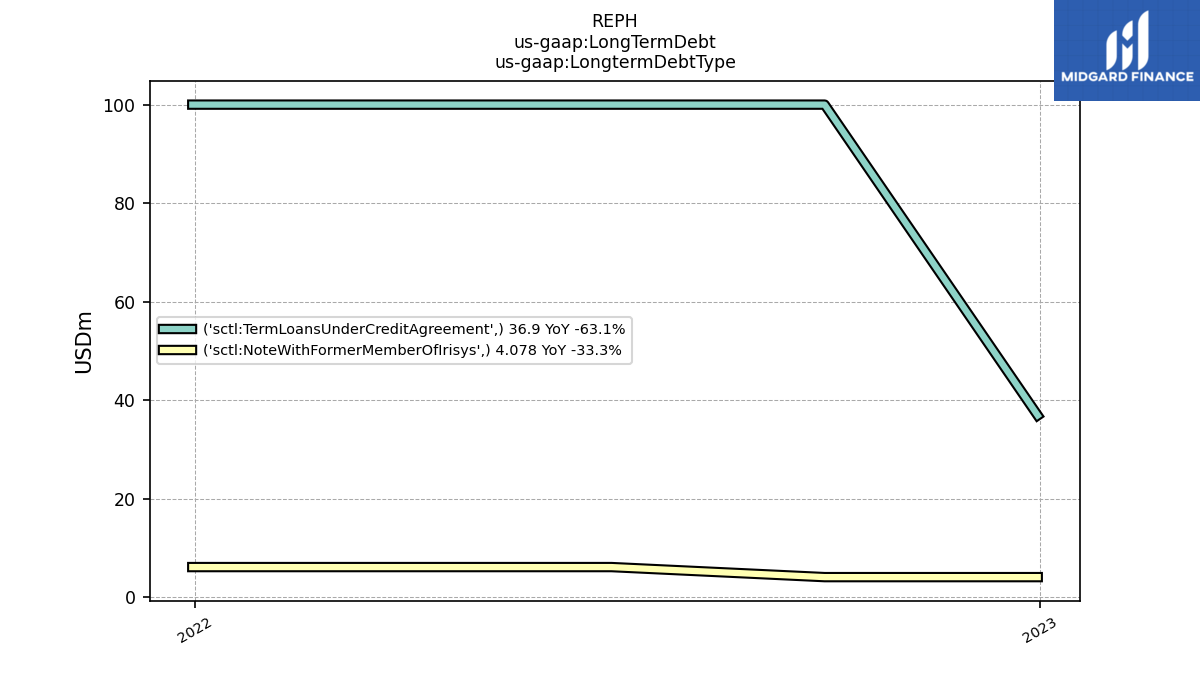
| Long Term Debt | 41.32 | 104.42 | 106.46 | 106.46 | 106.46 | 106.53 | NA | 91.48 | 109.57 | 117.86 | 116.55 | NA | NA | NA | NA | NA | NA | NA | NA | NA | NA | NA | NA | NA | NA | NA | NA | NA | NA | NA | NA | |
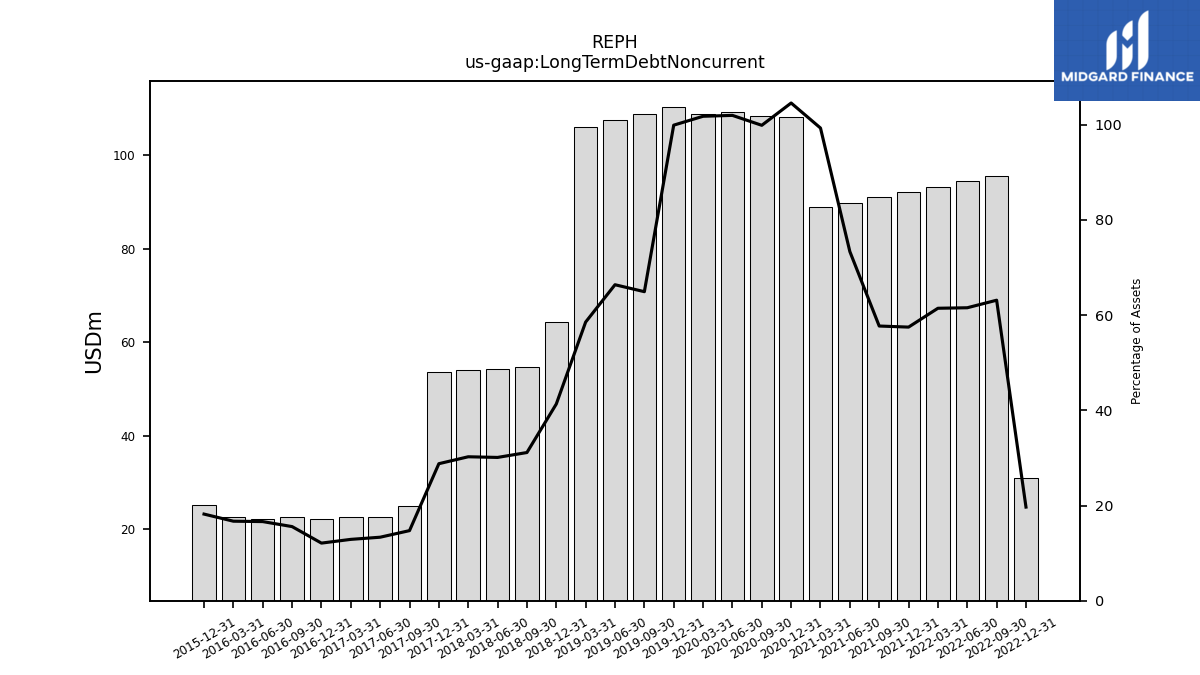
| Long Term Debt Noncurrent | 30.97 | 95.48 | 94.36 | 93.24 | 92.13 | 91.03 | 89.78 | 88.90 | 108.10 | 108.40 | 109.27 | 108.78 | 110.32 | 108.86 | 107.40 | 105.94 | 64.24 | 54.67 | 54.32 | 53.96 | 53.60 | 24.89 | 22.66 | 22.70 | 22.15 | 22.74 | 22.23 | 22.56 | 25.24 | NA | NA | |
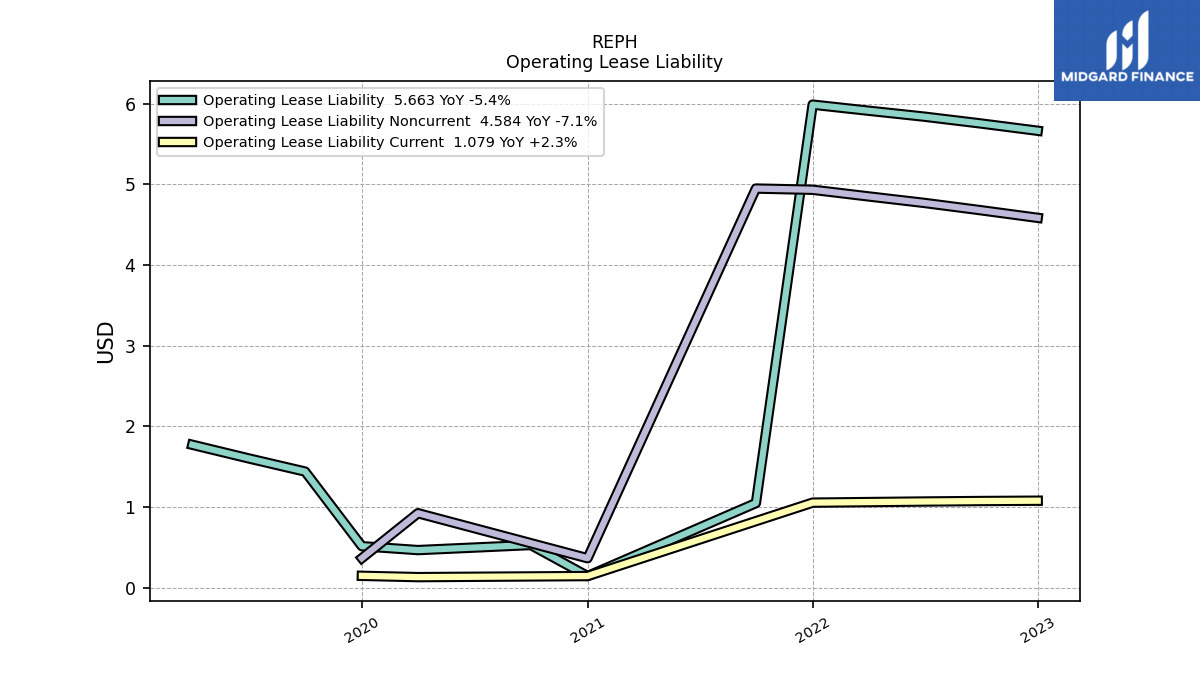
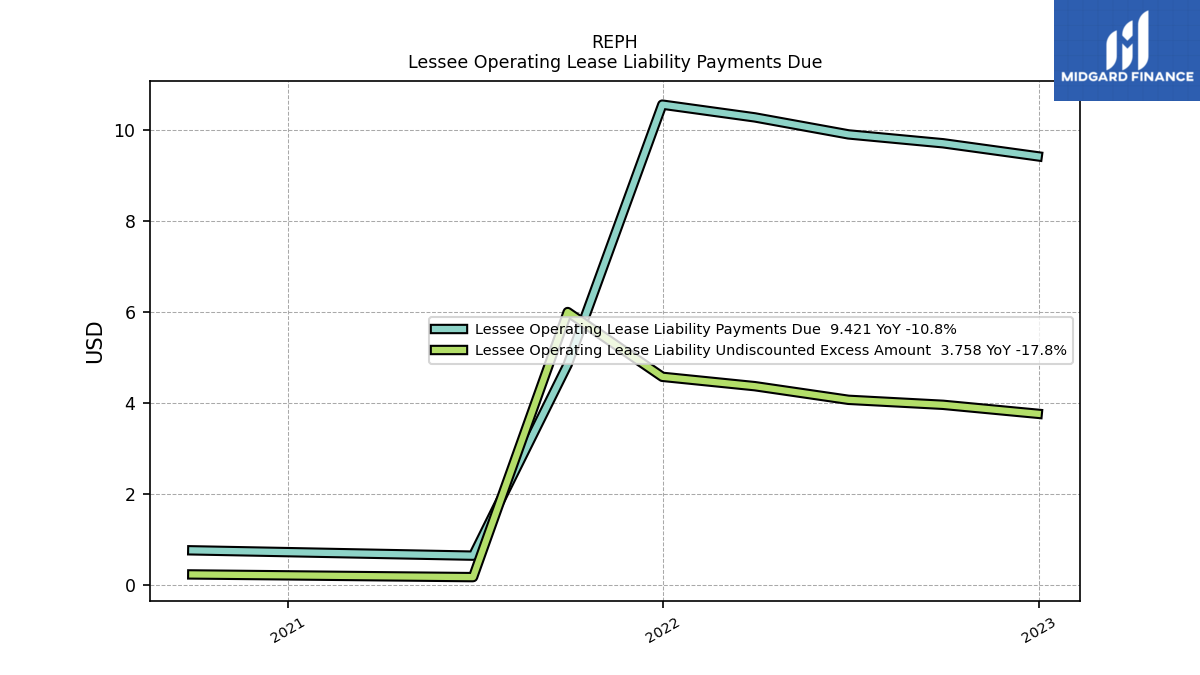
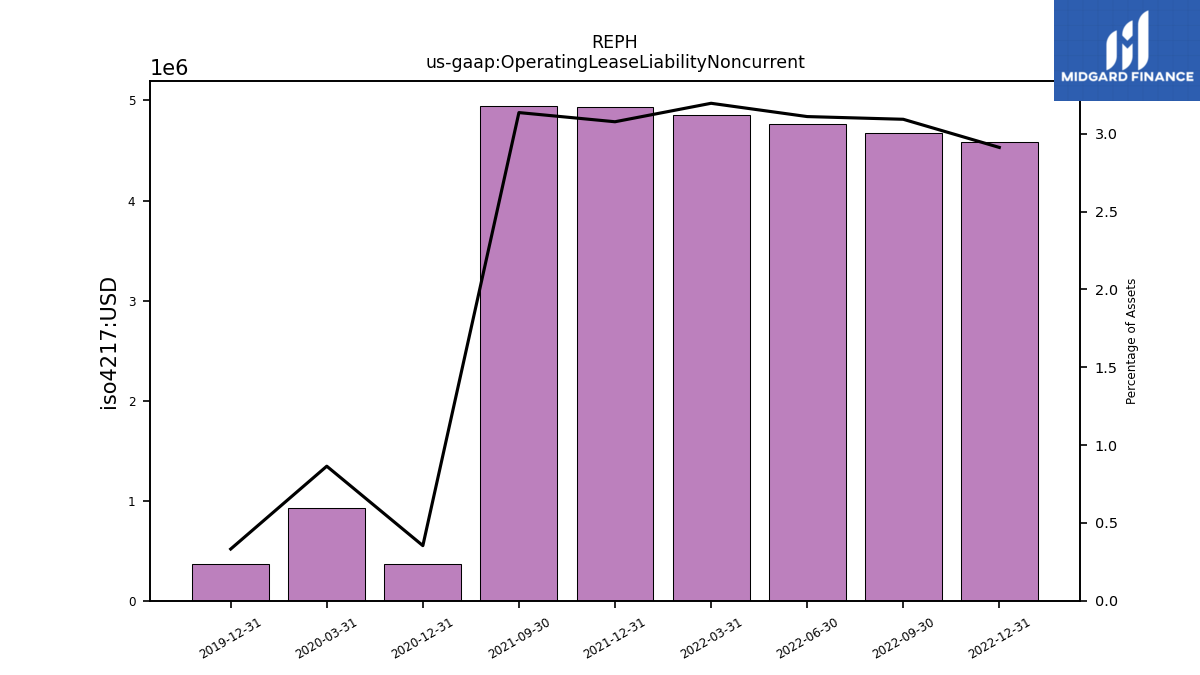
| Operating Lease Liability Noncurrent | 4.58 | 4.68 | 4.77 | 4.85 | 4.93 | 4.95 | NA | NA | 0.37 | NA | NA | 0.92 | 0.37 | NA | NA | NA | NA | NA | NA | NA | NA | NA | NA | NA | NA | NA | NA | NA | NA | NA | NA |
| 2022-12-31 | 2022-09-30 | 2022-06-30 | 2022-03-31 | 2021-12-31 | 2021-09-30 | 2021-06-30 | 2021-03-31 | 2020-12-31 | 2020-09-30 | 2020-06-30 | 2020-03-31 | 2019-12-31 | 2019-09-30 | 2019-06-30 | 2019-03-31 | 2018-12-31 | 2018-09-30 | 2018-06-30 | 2018-03-31 | 2017-12-31 | 2017-09-30 | 2017-06-30 | 2017-03-31 | 2016-12-31 | 2016-09-30 | 2016-06-30 | 2016-03-31 | 2015-12-31 | 2015-09-30 | 2015-06-30 | ||
|---|---|---|---|---|---|---|---|---|---|---|---|---|---|---|---|---|---|---|---|---|---|---|---|---|---|---|---|---|---|---|---|---|
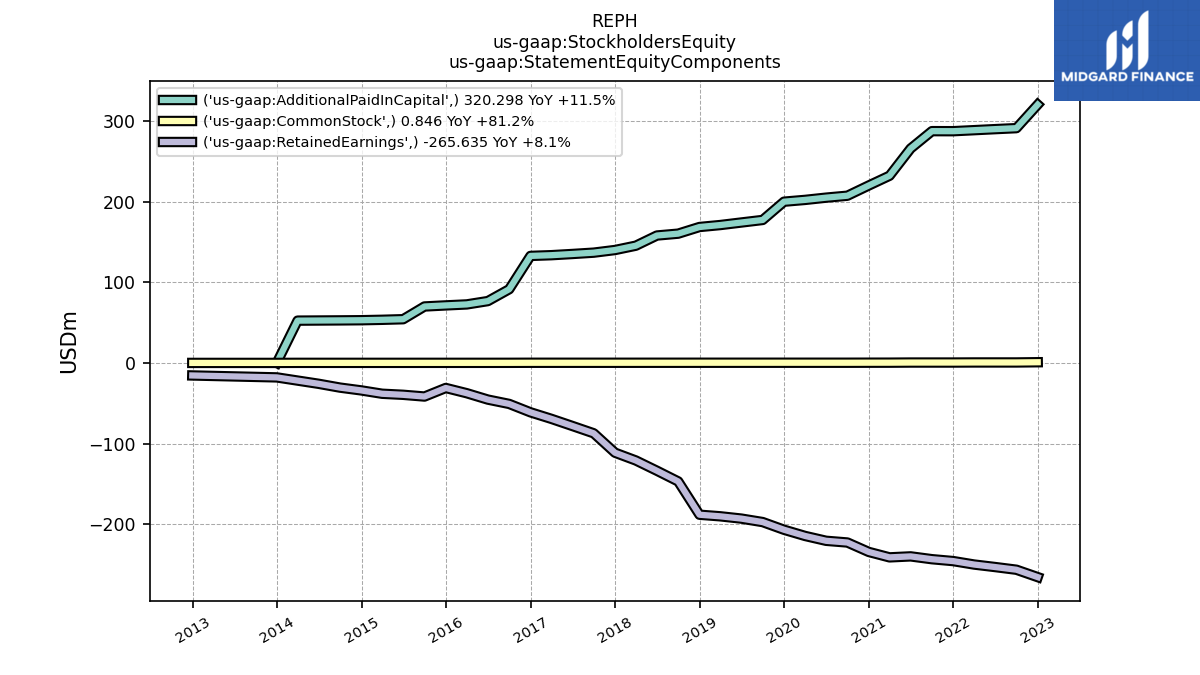
| Stockholders Equity | 59.86 | 35.23 | 37.33 | 39.16 | 42.06 | 44.48 | 26.42 | -8.72 | -14.10 | -15.13 | -15.41 | -12.19 | -6.71 | -19.87 | -18.71 | -19.03 | -19.50 | 13.55 | 24.49 | 24.58 | 28.85 | 49.65 | 56.99 | 64.36 | 71.61 | 40.63 | 31.31 | 35.04 | 40.35 | 28.38 | 14.73 | |
| Common Stock Value | 0.85 | 0.57 | 0.57 | 0.56 | 0.47 | 0.47 | 0.47 | 0.31 | 0.29 | 0.24 | 0.24 | 0.23 | 0.23 | 0.23 | 0.22 | 0.22 | 0.22 | 0.21 | 0.21 | 0.20 | 0.19 | 0.19 | 0.19 | 0.19 | 0.19 | 0.12 | 0.10 | 0.09 | 0.09 | 0.09 | 0.08 | |
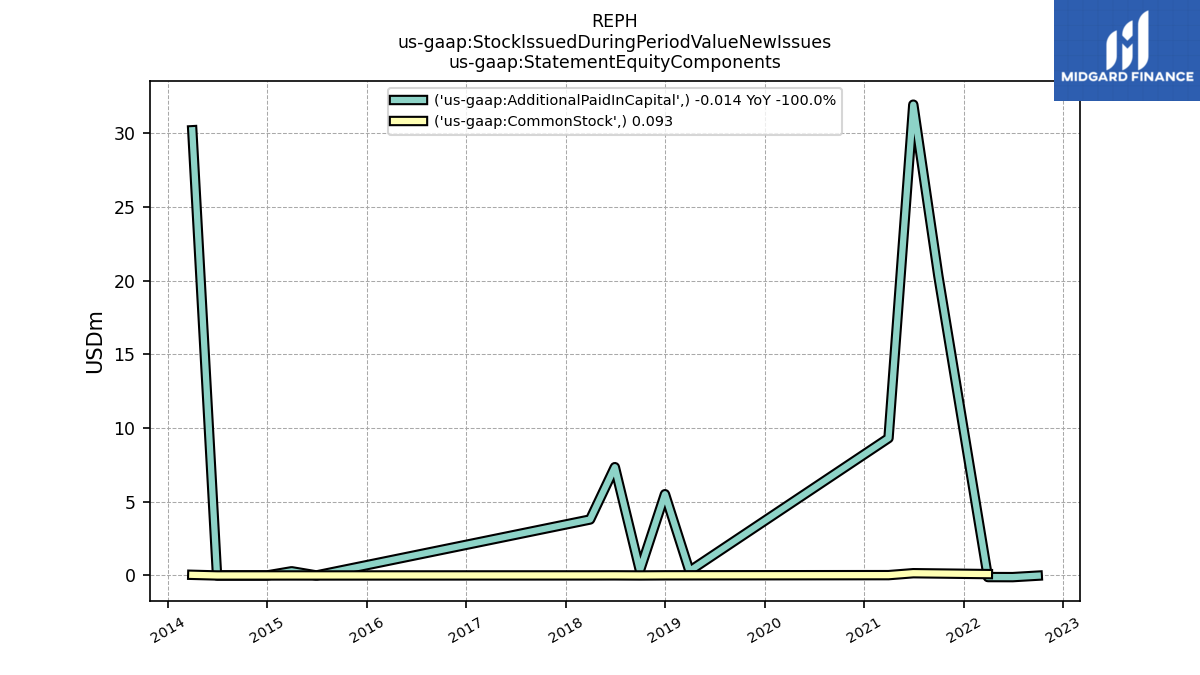
| Additional Paid In Capital Common Stock | 320.30 | 291.13 | 289.90 | 288.62 | 287.35 | 287.42 | 265.86 | 232.11 | 220.00 | 207.34 | 204.94 | 202.15 | 199.94 | 177.28 | 174.13 | 170.98 | 168.53 | 160.30 | 157.98 | 145.37 | 140.01 | 136.73 | 135.08 | 133.58 | 132.69 | 91.38 | 76.69 | 72.55 | 71.32 | 69.98 | 54.20 | |
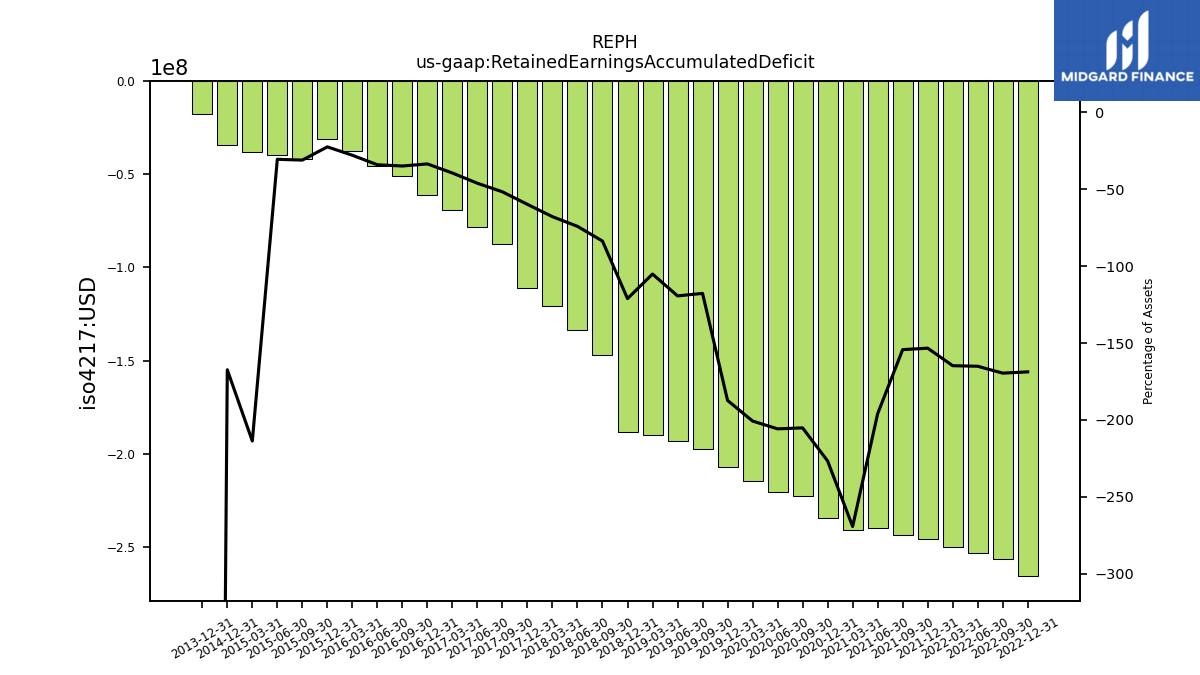
| Retained Earnings Accumulated Deficit | -265.63 | -256.47 | -253.14 | -250.02 | -245.75 | -243.40 | -239.91 | -241.15 | -234.38 | -222.71 | -220.59 | -214.57 | -206.88 | -197.37 | -193.07 | -190.23 | -188.25 | -146.96 | -133.70 | -120.98 | -111.35 | -87.27 | -78.21 | -69.36 | -61.27 | -50.87 | -45.49 | -37.60 | -31.06 | -41.70 | -39.55 | |
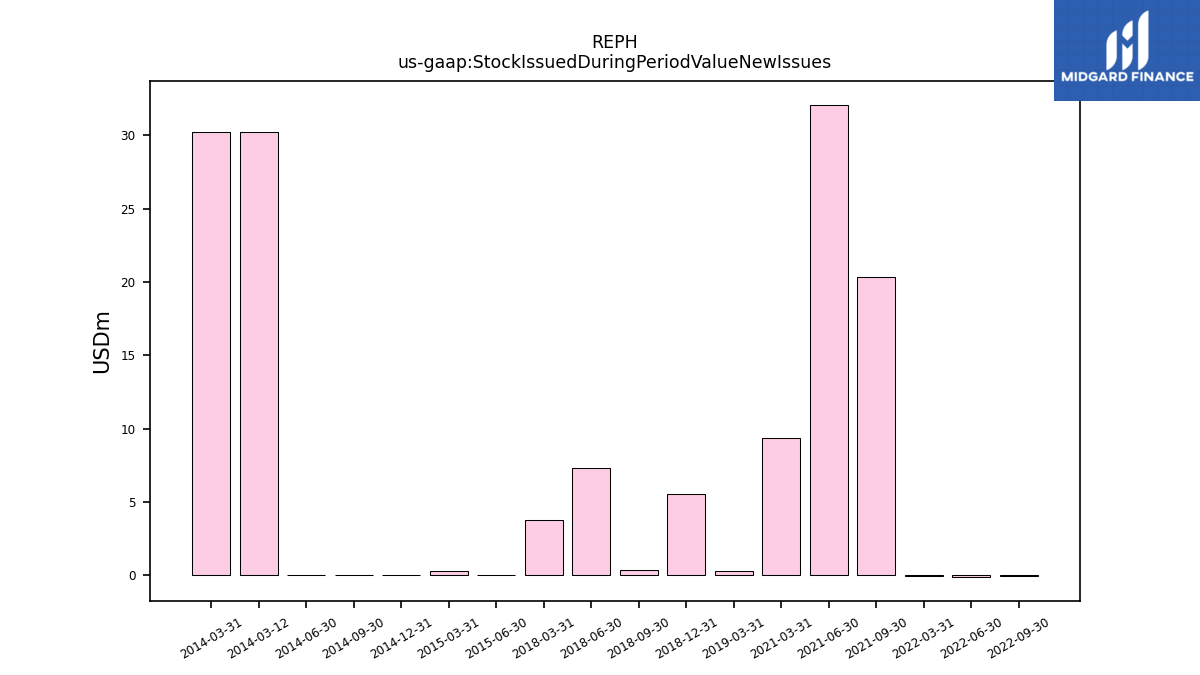
| Stock Issued During Period Value New Issues | NA | -0.01 | -0.11 | -0.02 | NA | 20.33 | 32.10 | 9.34 | NA | NA | NA | NA | NA | NA | NA | 0.30 | 5.53 | 0.34 | 7.36 | 3.80 | NA | NA | NA | NA | NA | NA | NA | NA | NA | NA | 0.00 | |
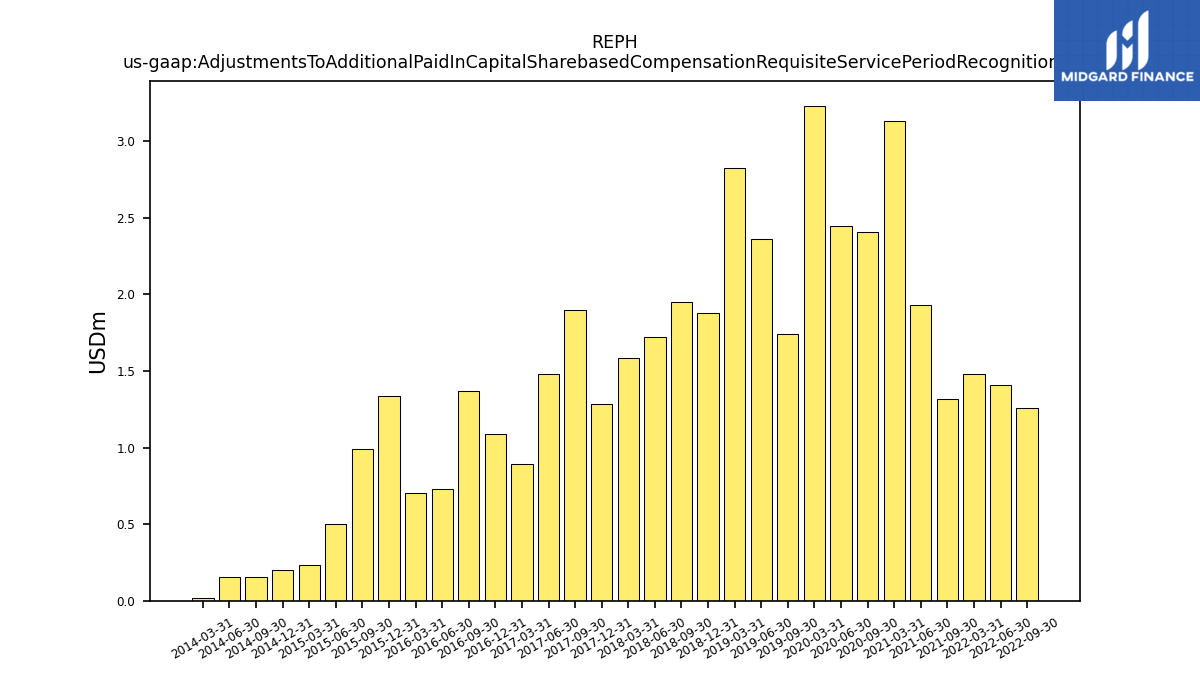
| Adjustments To Additional Paid In Capital Sharebased Compensation Requisite Service Period Recognition Value | NA | 1.26 | 1.41 | 1.48 | NA | 1.32 | 1.93 | 3.13 | NA | 2.41 | 2.45 | 3.23 | NA | 1.74 | 2.36 | 2.83 | 1.88 | 1.95 | 1.72 | 1.58 | 1.28 | 1.90 | 1.48 | 0.89 | 1.09 | 1.37 | 0.73 | 0.70 | 1.34 | 0.99 | 0.50 |
| 2022-12-31 | 2022-09-30 | 2022-06-30 | 2022-03-31 | 2021-12-31 | 2021-09-30 | 2021-06-30 | 2021-03-31 | 2020-12-31 | 2020-09-30 | 2020-06-30 | 2020-03-31 | 2019-12-31 | 2019-09-30 | 2019-06-30 | 2019-03-31 | 2018-12-31 | 2018-09-30 | 2018-06-30 | 2018-03-31 | 2017-12-31 | 2017-09-30 | 2017-06-30 | 2017-03-31 | 2016-12-31 | 2016-09-30 | 2016-06-30 | 2016-03-31 | 2015-12-31 | 2015-09-30 | 2015-06-30 | ||
|---|---|---|---|---|---|---|---|---|---|---|---|---|---|---|---|---|---|---|---|---|---|---|---|---|---|---|---|---|---|---|---|---|
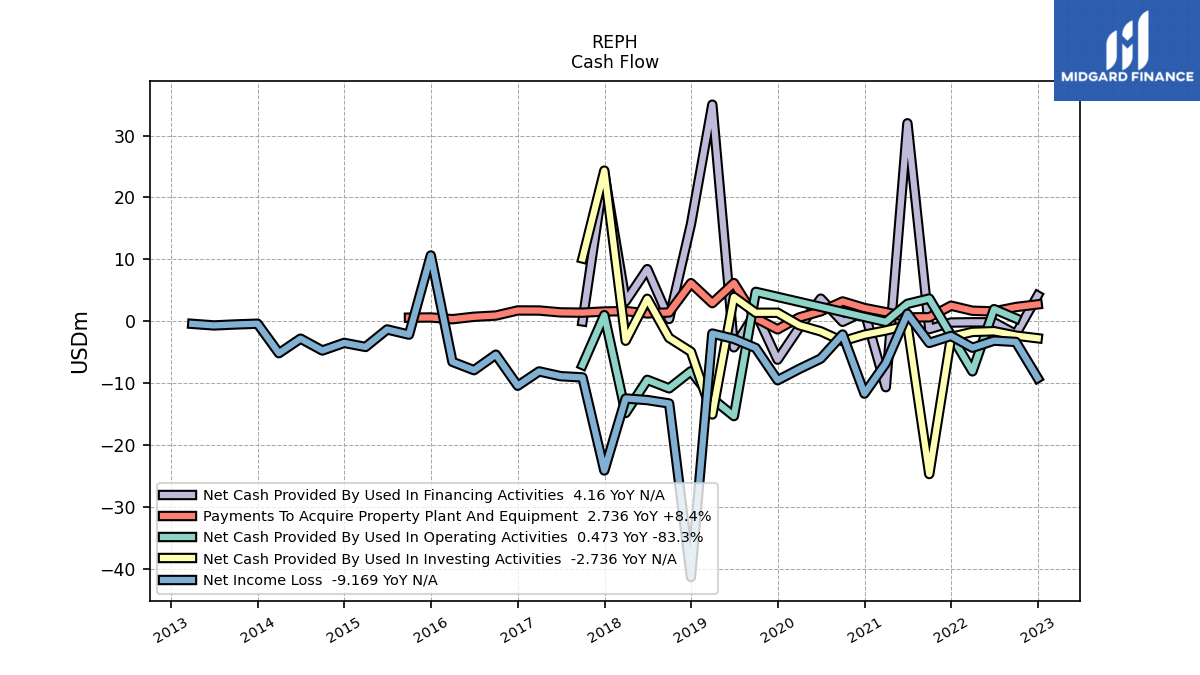
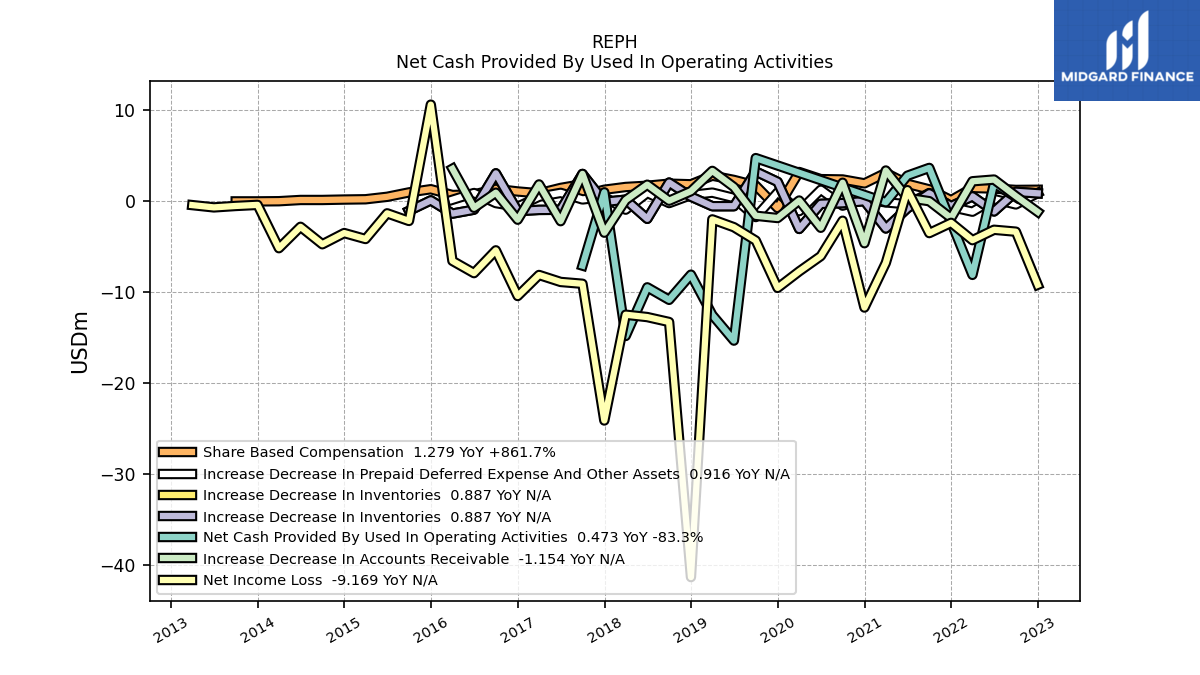
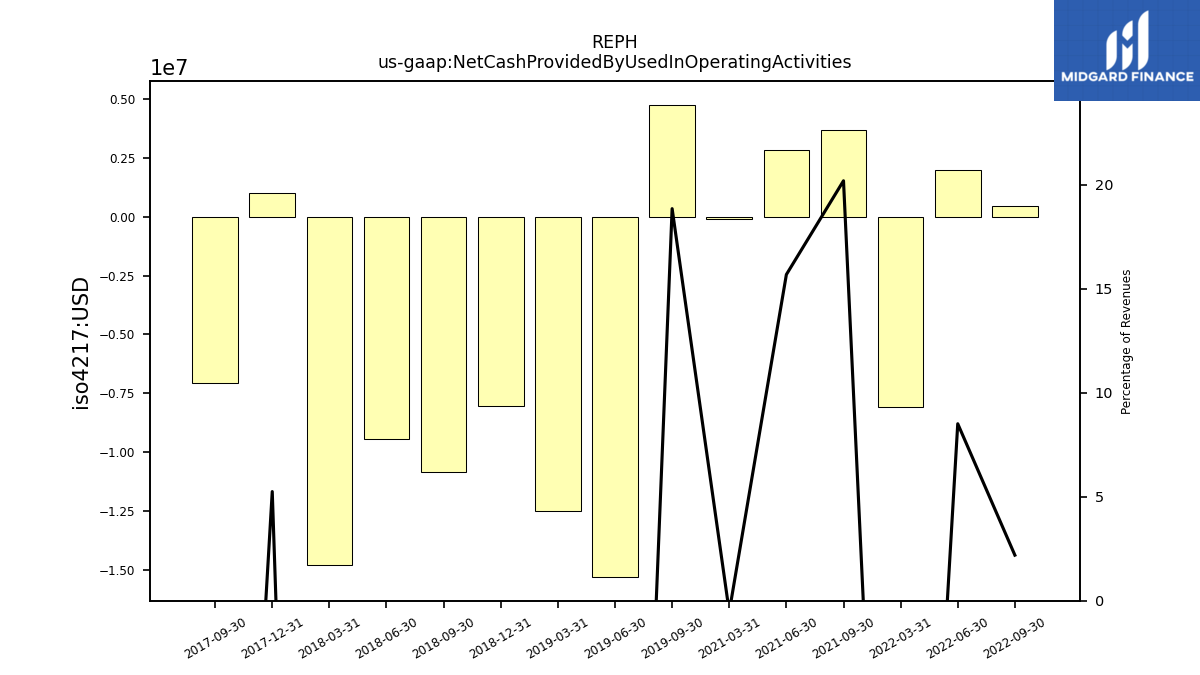
| Net Cash Provided By Used In Operating Activities | NA | 0.47 | 1.97 | -8.08 | NA | 3.68 | 2.82 | -0.09 | NA | NA | NA | NA | NA | 4.76 | -15.30 | -12.48 | -8.05 | -10.82 | -9.44 | -14.80 | 1.00 | -7.06 | NA | NA | NA | NA | NA | NA | NA | NA | NA | |
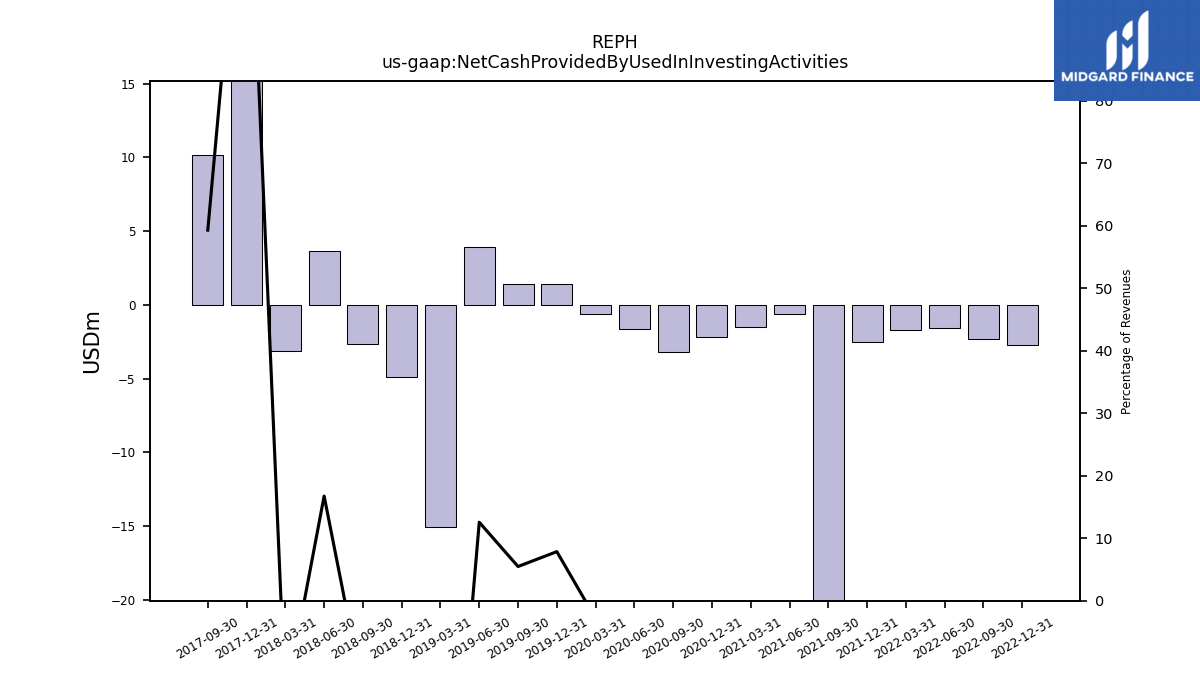
| Net Cash Provided By Used In Investing Activities | -2.74 | -2.31 | -1.60 | -1.71 | -2.52 | -24.66 | -0.64 | -1.48 | -2.15 | -3.21 | -1.62 | -0.62 | 1.39 | 1.38 | 3.92 | -15.04 | -4.91 | -2.67 | 3.64 | -3.13 | 24.33 | 10.15 | NA | NA | NA | NA | NA | NA | NA | NA | NA | |
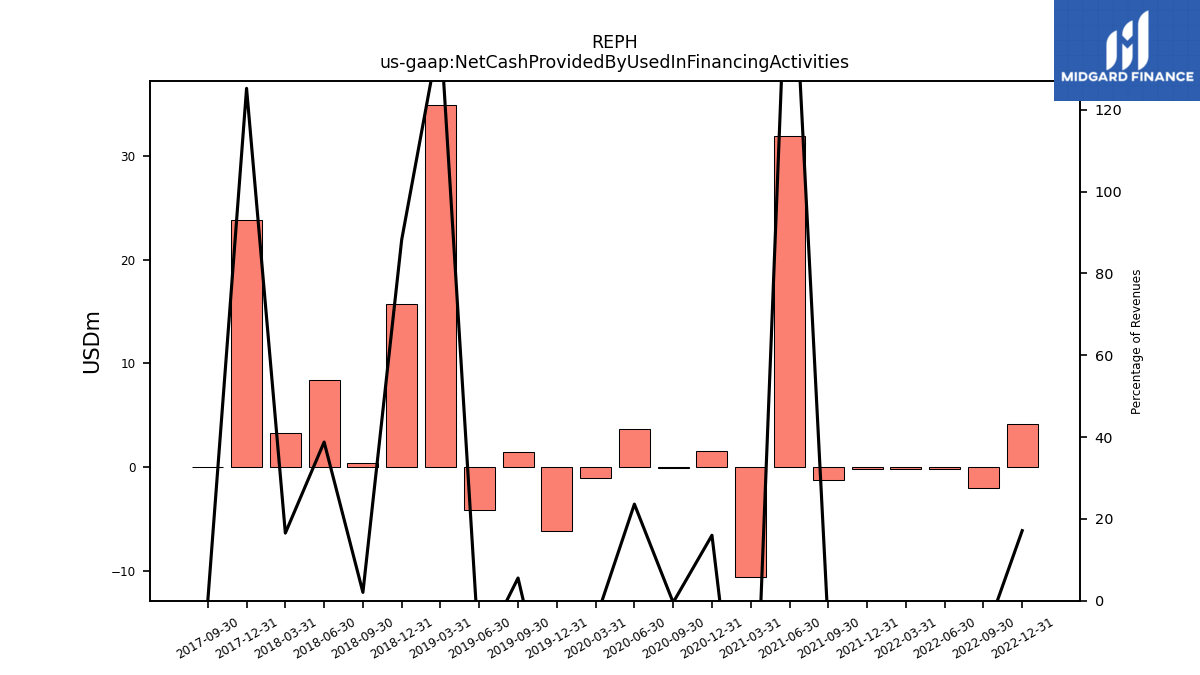
| Net Cash Provided By Used In Financing Activities | 4.16 | -2.07 | -0.17 | -0.15 | -0.20 | -1.25 | 31.98 | -10.64 | 1.59 | -0.08 | 3.67 | -1.02 | -6.20 | 1.40 | -4.20 | 34.99 | 15.69 | 0.37 | 8.43 | 3.23 | 23.85 | -0.01 | NA | NA | NA | NA | NA | NA | NA | NA | NA |
| 2022-12-31 | 2022-09-30 | 2022-06-30 | 2022-03-31 | 2021-12-31 | 2021-09-30 | 2021-06-30 | 2021-03-31 | 2020-12-31 | 2020-09-30 | 2020-06-30 | 2020-03-31 | 2019-12-31 | 2019-09-30 | 2019-06-30 | 2019-03-31 | 2018-12-31 | 2018-09-30 | 2018-06-30 | 2018-03-31 | 2017-12-31 | 2017-09-30 | 2017-06-30 | 2017-03-31 | 2016-12-31 | 2016-09-30 | 2016-06-30 | 2016-03-31 | 2015-12-31 | 2015-09-30 | 2015-06-30 | ||
|---|---|---|---|---|---|---|---|---|---|---|---|---|---|---|---|---|---|---|---|---|---|---|---|---|---|---|---|---|---|---|---|---|
| Net Cash Provided By Used In Operating Activities | NA | 0.47 | 1.97 | -8.08 | NA | 3.68 | 2.82 | -0.09 | NA | NA | NA | NA | NA | 4.76 | -15.30 | -12.48 | -8.05 | -10.82 | -9.44 | -14.80 | 1.00 | -7.06 | NA | NA | NA | NA | NA | NA | NA | NA | NA | |
| Net Income Loss | -9.17 | -3.33 | -3.12 | -4.26 | -2.36 | -3.49 | 1.23 | -6.76 | -11.67 | -2.13 | -6.01 | -7.69 | -9.51 | -4.30 | -2.84 | -1.98 | -41.30 | -13.26 | -12.71 | -12.46 | -24.08 | -9.05 | -8.86 | -8.09 | -10.40 | -5.38 | -7.88 | -6.54 | 10.63 | -2.15 | -1.31 | |
| Profit Loss | -9.17 | -3.33 | -3.12 | -4.26 | -2.36 | -3.49 | 1.23 | -6.76 | -11.67 | -2.13 | -6.01 | -7.69 | -9.51 | -4.31 | -2.84 | -1.98 | -41.30 | -13.25 | -12.72 | -12.46 | -24.08 | -9.05 | NA | NA | NA | NA | NA | NA | NA | NA | NA | |
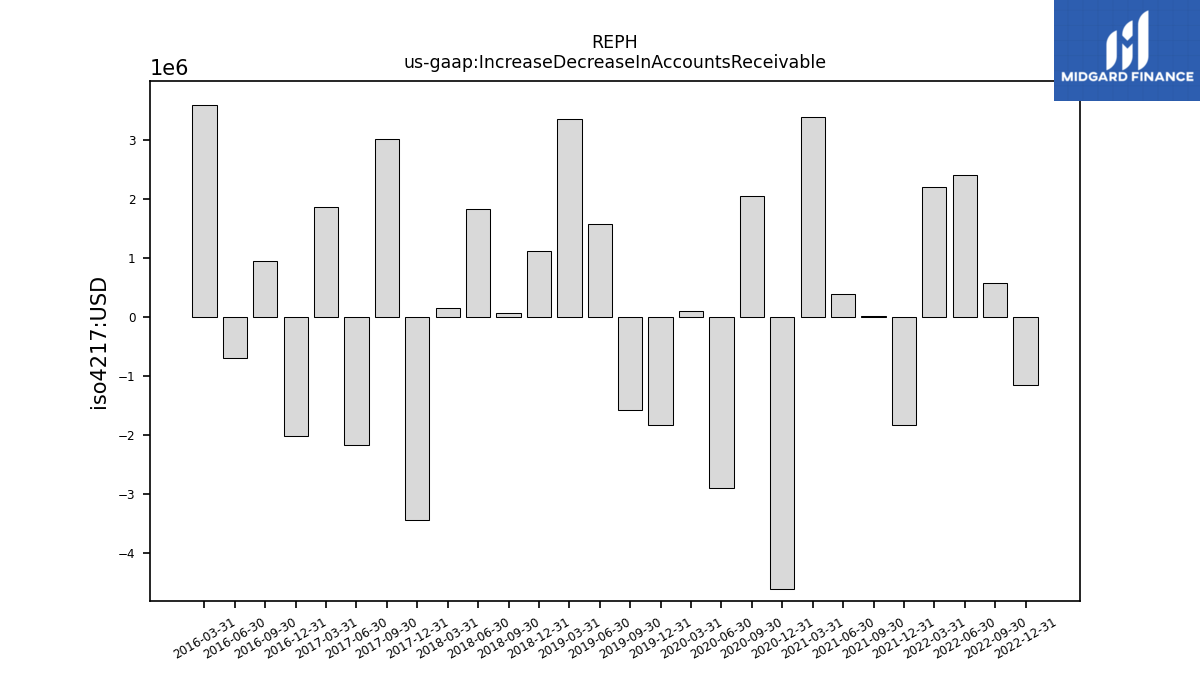
| Increase Decrease In Accounts Receivable | -1.15 | 0.58 | 2.40 | 2.21 | -1.83 | 0.02 | 0.39 | 3.40 | -4.60 | 2.05 | -2.90 | 0.10 | -1.83 | -1.58 | 1.58 | 3.35 | 1.12 | 0.07 | 1.84 | 0.15 | -3.44 | 3.02 | -2.18 | 1.87 | -2.01 | 0.96 | -0.70 | 3.59 | NA | NA | NA | |
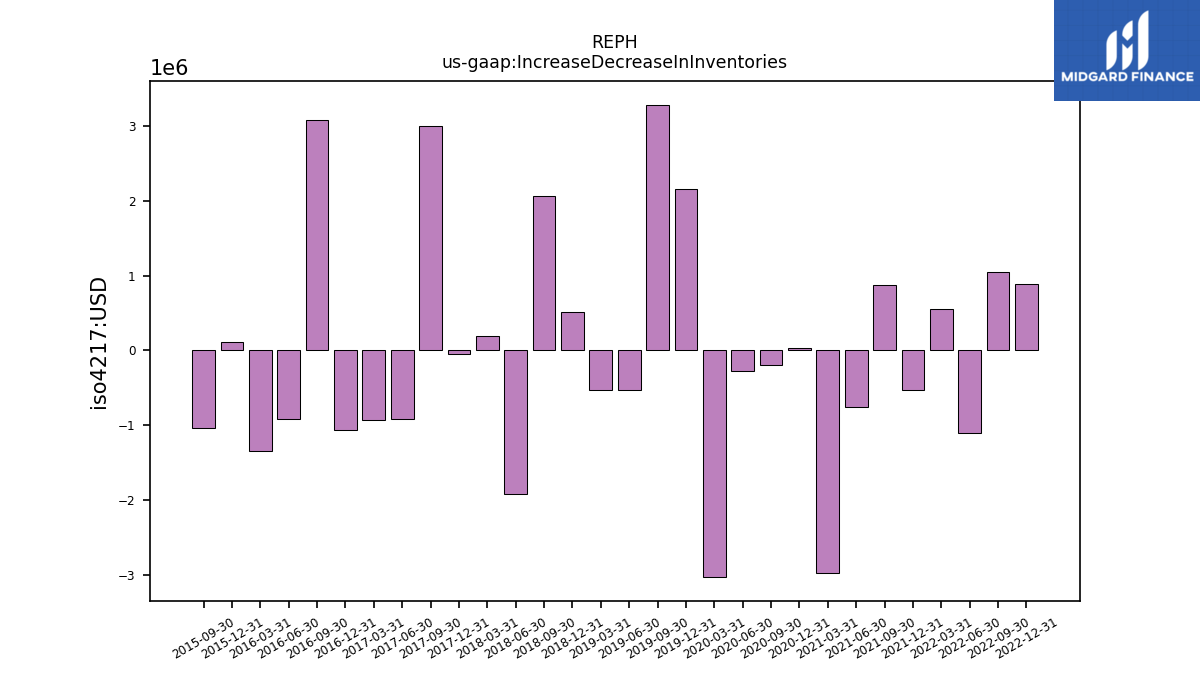
| Increase Decrease In Inventories | 0.89 | 1.05 | -1.10 | 0.55 | -0.52 | 0.88 | -0.76 | -2.98 | 0.03 | -0.19 | -0.27 | -3.03 | 2.15 | 3.28 | -0.53 | -0.53 | 0.52 | 2.07 | -1.92 | 0.19 | -0.05 | 3.00 | -0.92 | -0.94 | -1.07 | 3.08 | -0.91 | -1.34 | 0.11 | -1.04 | NA | |
| Share Based Compensation | 1.28 | 1.26 | 1.41 | 1.48 | 0.13 | 1.32 | 1.93 | 3.13 | 1.98 | 2.41 | 2.45 | 3.23 | -0.73 | 1.74 | 2.36 | 2.83 | 1.88 | 1.95 | 1.72 | 1.58 | 1.28 | 1.90 | 1.48 | 0.89 | 1.09 | 1.37 | 0.76 | 0.70 | 1.34 | 0.99 | 0.50 |
| 2022-12-31 | 2022-09-30 | 2022-06-30 | 2022-03-31 | 2021-12-31 | 2021-09-30 | 2021-06-30 | 2021-03-31 | 2020-12-31 | 2020-09-30 | 2020-06-30 | 2020-03-31 | 2019-12-31 | 2019-09-30 | 2019-06-30 | 2019-03-31 | 2018-12-31 | 2018-09-30 | 2018-06-30 | 2018-03-31 | 2017-12-31 | 2017-09-30 | 2017-06-30 | 2017-03-31 | 2016-12-31 | 2016-09-30 | 2016-06-30 | 2016-03-31 | 2015-12-31 | 2015-09-30 | 2015-06-30 | ||
|---|---|---|---|---|---|---|---|---|---|---|---|---|---|---|---|---|---|---|---|---|---|---|---|---|---|---|---|---|---|---|---|---|
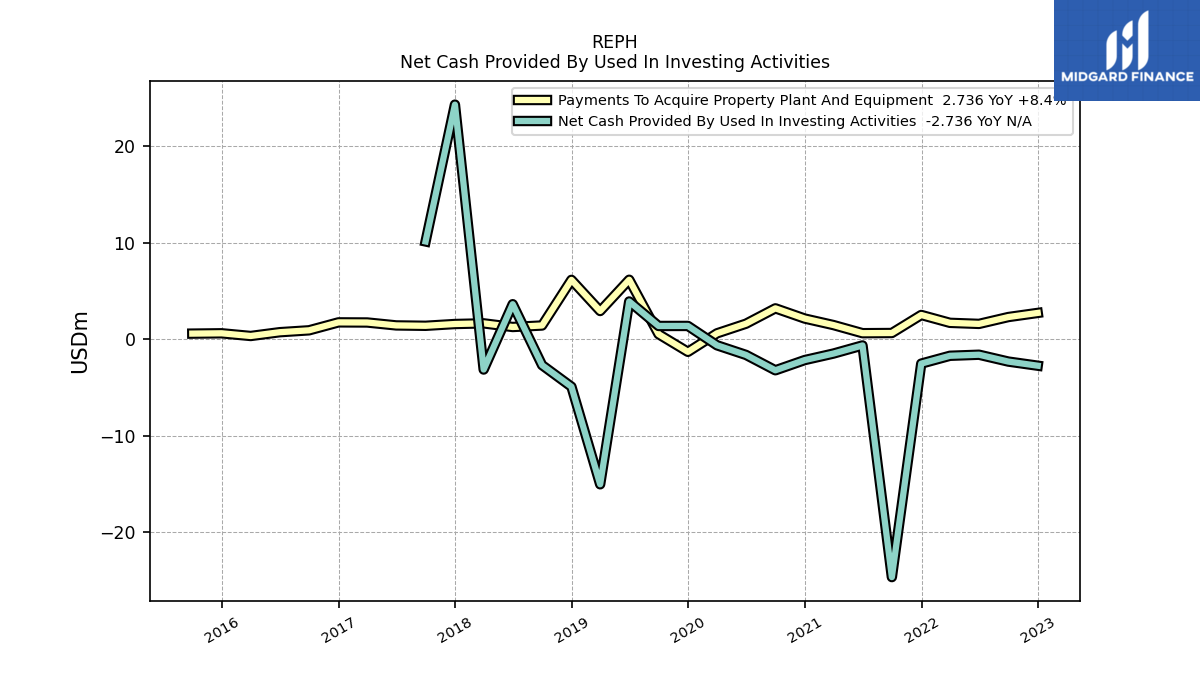
| Net Cash Provided By Used In Investing Activities | -2.74 | -2.31 | -1.60 | -1.71 | -2.52 | -24.66 | -0.64 | -1.48 | -2.15 | -3.21 | -1.62 | -0.62 | 1.39 | 1.38 | 3.92 | -15.04 | -4.91 | -2.67 | 3.64 | -3.13 | 24.33 | 10.15 | NA | NA | NA | NA | NA | NA | NA | NA | NA | |
| Payments To Acquire Property Plant And Equipment | 2.74 | 2.31 | 1.60 | 1.71 | 2.52 | 0.65 | 0.64 | 1.48 | 2.15 | 3.21 | 1.62 | 0.62 | -1.30 | 0.54 | 6.18 | 2.93 | 6.16 | 1.43 | 1.28 | 1.65 | 1.59 | 1.40 | 1.44 | 1.74 | 1.76 | 0.93 | 0.74 | 0.34 | 0.62 | 0.59 | NA |
| 2022-12-31 | 2022-09-30 | 2022-06-30 | 2022-03-31 | 2021-12-31 | 2021-09-30 | 2021-06-30 | 2021-03-31 | 2020-12-31 | 2020-09-30 | 2020-06-30 | 2020-03-31 | 2019-12-31 | 2019-09-30 | 2019-06-30 | 2019-03-31 | 2018-12-31 | 2018-09-30 | 2018-06-30 | 2018-03-31 | 2017-12-31 | 2017-09-30 | 2017-06-30 | 2017-03-31 | 2016-12-31 | 2016-09-30 | 2016-06-30 | 2016-03-31 | 2015-12-31 | 2015-09-30 | 2015-06-30 | ||
|---|---|---|---|---|---|---|---|---|---|---|---|---|---|---|---|---|---|---|---|---|---|---|---|---|---|---|---|---|---|---|---|---|
| Net Cash Provided By Used In Financing Activities | 4.16 | -2.07 | -0.17 | -0.15 | -0.20 | -1.25 | 31.98 | -10.64 | 1.59 | -0.08 | 3.67 | -1.02 | -6.20 | 1.40 | -4.20 | 34.99 | 15.69 | 0.37 | 8.43 | 3.23 | 23.85 | -0.01 | NA | NA | NA | NA | NA | NA | NA | NA | NA |
| 2022-12-31 | 2022-09-30 | 2022-06-30 | 2022-03-31 | 2021-12-31 | 2021-09-30 | 2021-06-30 | 2021-03-31 | 2020-12-31 | 2020-09-30 | 2020-06-30 | 2020-03-31 | 2019-12-31 | 2019-09-30 | 2019-06-30 | 2019-03-31 | 2018-12-31 | 2018-09-30 | 2018-06-30 | 2018-03-31 | 2017-12-31 | 2017-09-30 | 2017-06-30 | 2017-03-31 | 2016-12-31 | 2016-09-30 | 2016-06-30 | 2016-03-31 | 2015-12-31 | 2015-09-30 | 2015-06-30 | ||
|---|---|---|---|---|---|---|---|---|---|---|---|---|---|---|---|---|---|---|---|---|---|---|---|---|---|---|---|---|---|---|---|---|
| Revenues | 24.28 | 21.59 | 23.15 | 21.19 | 22.30 | 18.24 | 18.02 | 16.80 | 9.91 | 19.29 | 15.52 | 21.78 | 17.64 | 25.25 | 31.26 | 25.07 | 17.78 | 18.28 | 21.74 | 19.54 | 19.04 | 17.11 | 16.93 | 18.74 | 17.36 | 16.95 | 17.28 | 17.74 | 16.75 | 16.54 | 18.66 | |
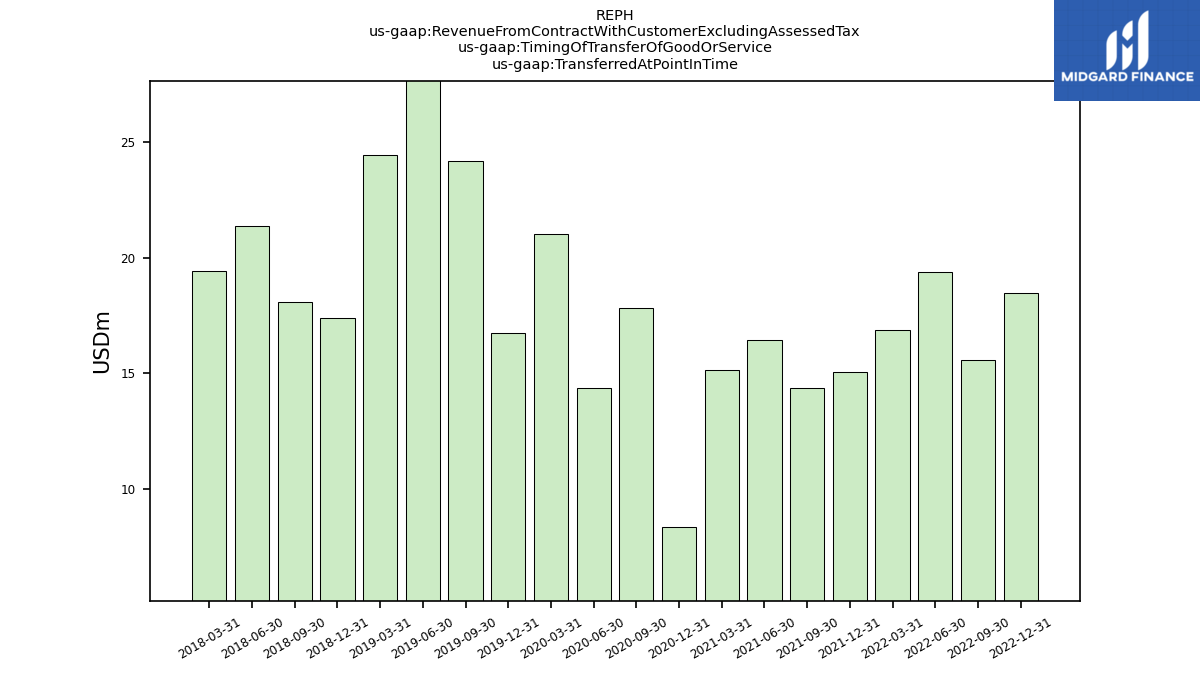
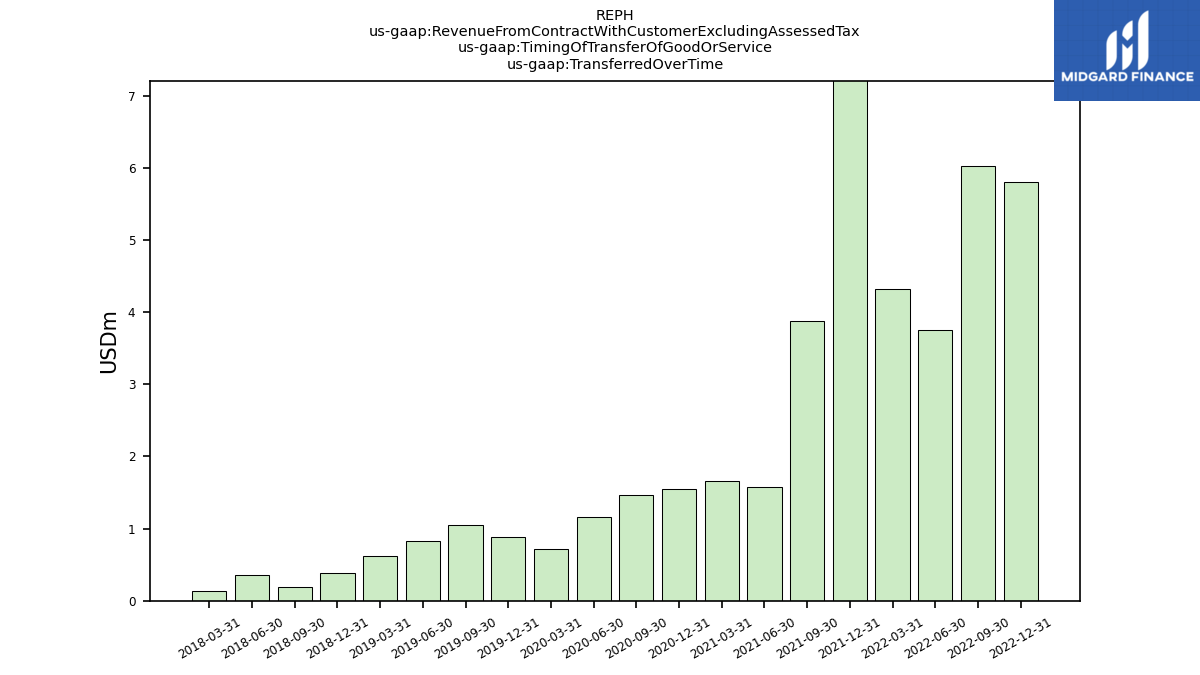
| Revenue From Contract With Customer Excluding Assessed Tax | 24.28 | 21.59 | 23.15 | 21.19 | 22.30 | 18.24 | 18.02 | 16.80 | 9.91 | 19.29 | 15.52 | 21.78 | 17.64 | 25.25 | 31.26 | 25.07 | 17.78 | 18.28 | 21.74 | 19.54 | 19.04 | 17.11 | 16.93 | 18.74 | 17.36 | 16.95 | 17.28 | 17.74 | 16.75 | 16.54 | 18.66 | |
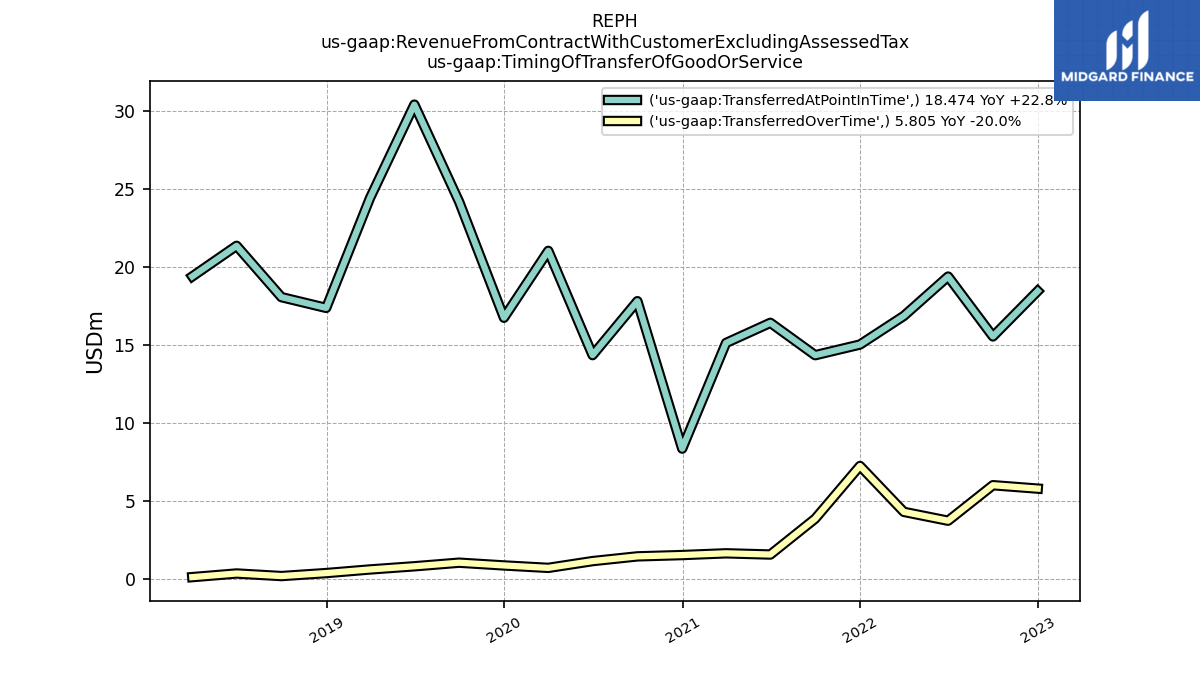
| Transferred At Point In Time | 18.47 | 15.56 | 19.41 | 16.88 | 15.04 | 14.36 | 16.44 | 15.15 | 8.37 | 17.83 | 14.37 | 21.05 | 16.76 | 24.20 | 30.43 | 24.44 | 17.39 | 18.09 | 21.38 | 19.41 | NA | NA | NA | NA | NA | NA | NA | NA | NA | NA | NA | |
| Transferred Over Time | 5.80 | 6.02 | 3.75 | 4.31 | 7.26 | 3.88 | 1.58 | 1.66 | 1.54 | 1.46 | 1.16 | 0.72 | 0.88 | 1.05 | 0.82 | 0.62 | 0.39 | 0.20 | 0.36 | 0.13 | NA | NA | NA | NA | NA | NA | NA | NA | NA | NA | NA |
