
| 2023-12-31 | 2023-09-30 | 2023-06-30 | 2023-03-31 | 2022-12-31 | 2022-09-30 | 2022-06-30 | 2022-03-31 | 2021-12-31 | 2021-09-30 | 2021-06-30 | 2021-03-31 | 2020-12-31 | 2020-09-30 | 2020-06-30 | 2020-03-31 | 2019-12-31 | 2019-09-30 | 2019-06-30 | 2019-03-31 | 2018-12-31 | 2018-09-30 | 2018-06-30 | 2018-03-31 | 2017-12-31 | 2017-09-30 | 2017-06-30 | 2017-03-31 | 2016-12-31 | 2016-09-30 | 2016-06-30 | 2016-03-31 | 2015-12-31 | 2015-09-30 | 2015-06-30 | 2015-03-31 | 2014-12-31 | 2014-09-30 | 2014-06-30 | 2014-03-31 | 2013-12-31 | 2013-09-30 | 2013-06-30 | 2013-03-31 | 2012-12-31 | 2012-09-30 | 2012-06-30 | 2012-03-31 | 2011-12-31 | 2011-09-30 | 2011-06-30 | 2011-03-31 | 2010-12-31 | 2010-09-30 | 2010-06-30 | 2010-03-31 | ||
|---|---|---|---|---|---|---|---|---|---|---|---|---|---|---|---|---|---|---|---|---|---|---|---|---|---|---|---|---|---|---|---|---|---|---|---|---|---|---|---|---|---|---|---|---|---|---|---|---|---|---|---|---|---|---|---|---|---|
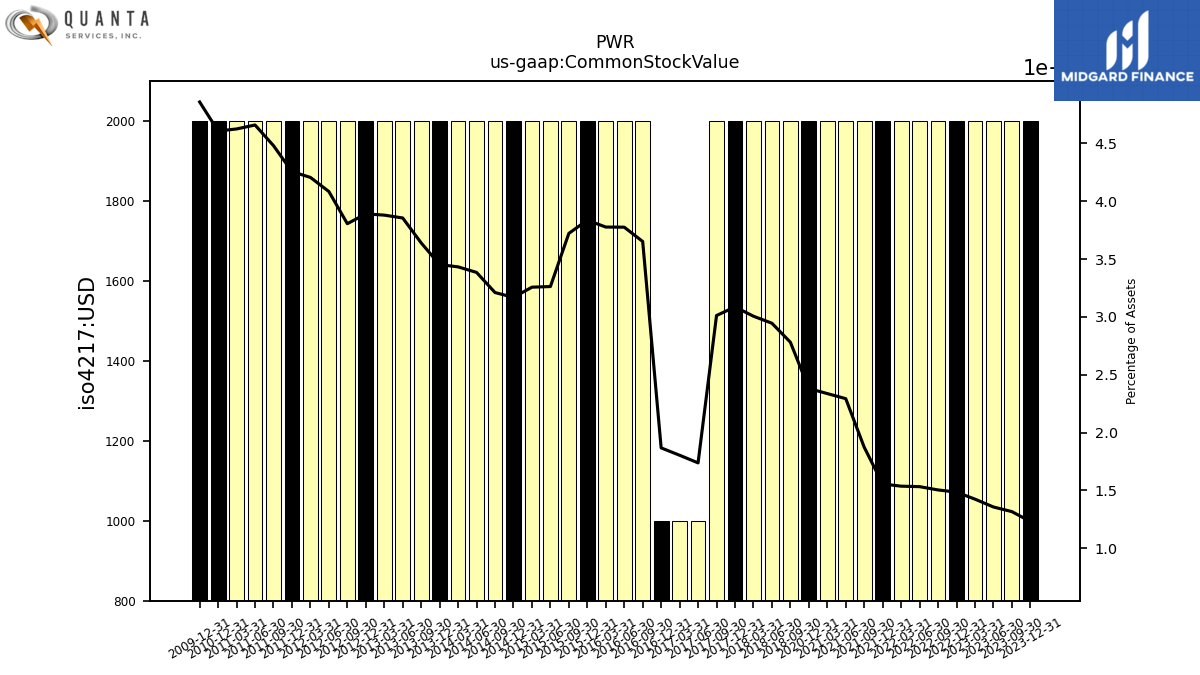
| Common Stock Value | 0.00 | 0.00 | 0.00 | 0.00 | 0.00 | 0.00 | 0.00 | 0.00 | 0.00 | 0.00 | 0.00 | 0.00 | 0.00 | NA | NA | NA | NA | NA | NA | NA | NA | 0.00 | 0.00 | 0.00 | 0.00 | 0.00 | 0.00 | 0.00 | 0.00 | 0.00 | 0.00 | 0.00 | 0.00 | 0.00 | 0.00 | 0.00 | 0.00 | 0.00 | 0.00 | 0.00 | 0.00 | 0.00 | 0.00 | 0.00 | 0.00 | 0.00 | 0.00 | 0.00 | 0.00 | 0.00 | 0.00 | 0.00 | 0.00 | NA | NA | NA | |
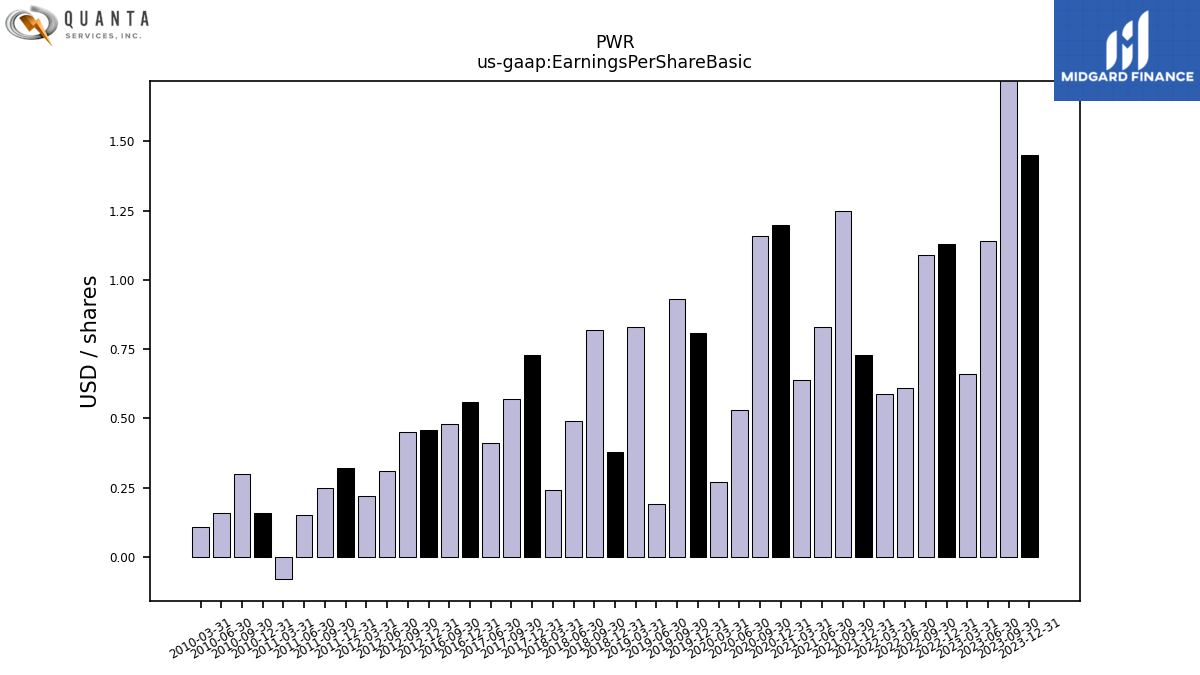
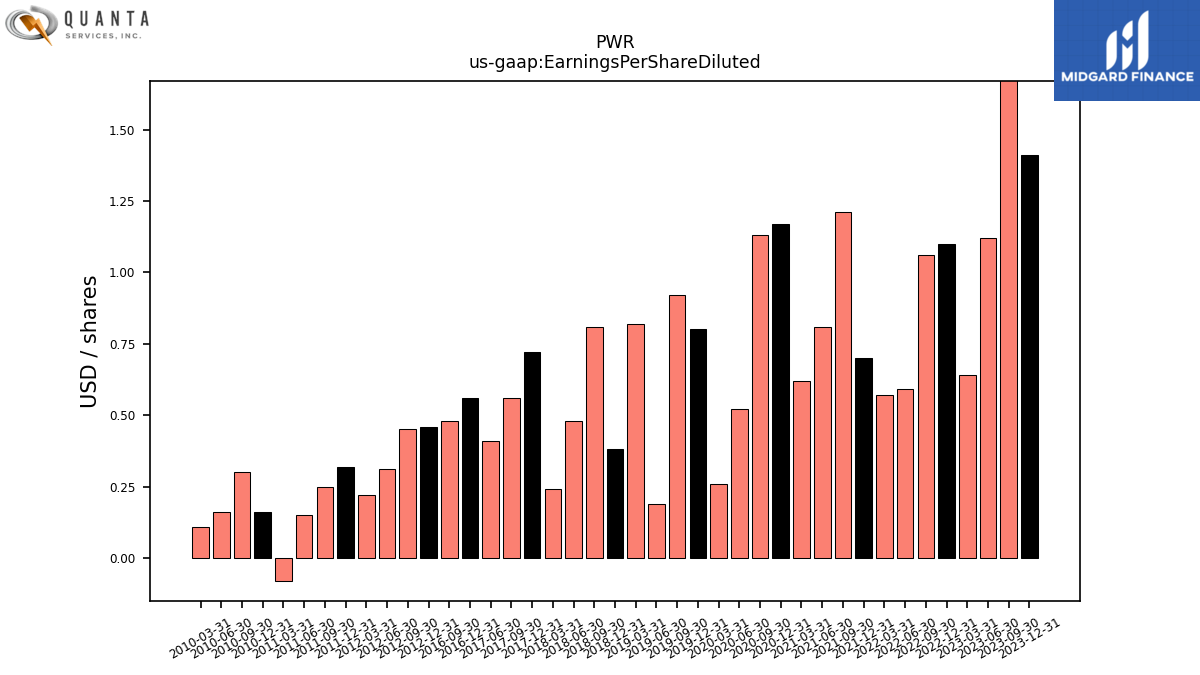
| Earnings Per Share Basic | 1.45 | 1.88 | 1.14 | 0.66 | 1.13 | 1.09 | 0.61 | 0.59 | 0.73 | 1.25 | 0.83 | 0.64 | 1.20 | 1.16 | 0.53 | 0.27 | 0.81 | 0.93 | 0.19 | 0.83 | 0.38 | 0.82 | 0.49 | 0.24 | 0.73 | 0.57 | 0.41 | NA | 0.56 | 0.48 | NA | NA | NA | NA | NA | NA | NA | NA | NA | NA | NA | NA | NA | NA | 0.46 | 0.45 | 0.31 | 0.22 | 0.32 | 0.25 | 0.15 | -0.08 | 0.16 | 0.30 | 0.16 | 0.11 | |
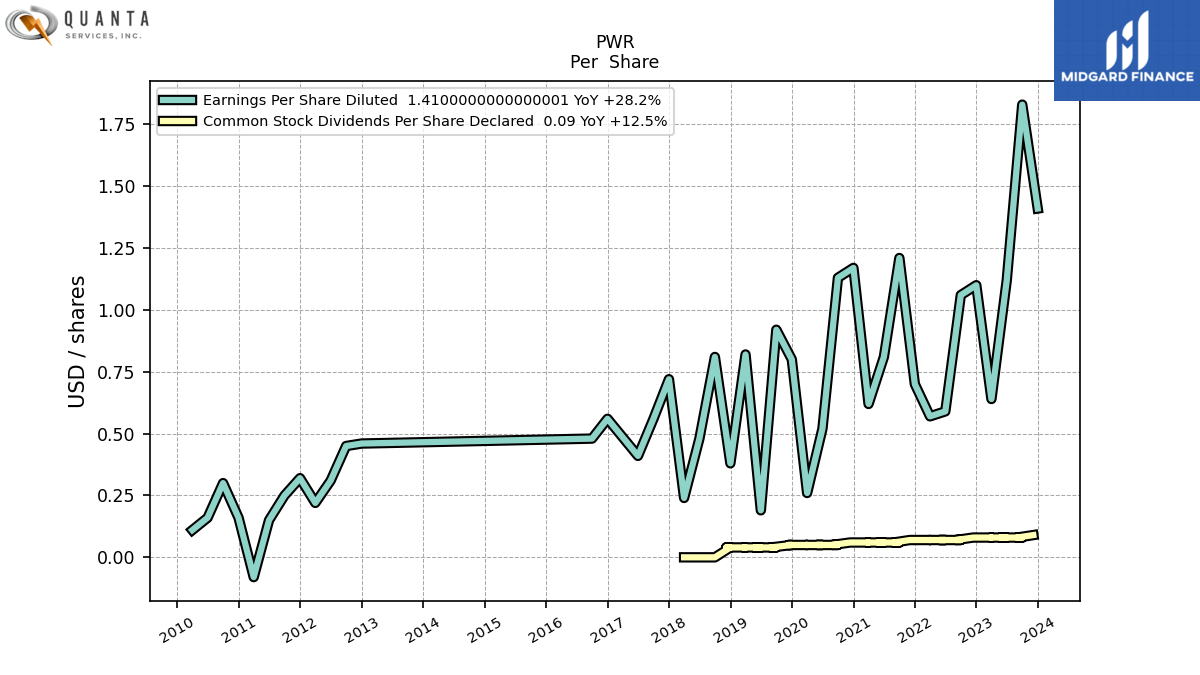
| Earnings Per Share Diluted | 1.41 | 1.83 | 1.12 | 0.64 | 1.10 | 1.06 | 0.59 | 0.57 | 0.70 | 1.21 | 0.81 | 0.62 | 1.17 | 1.13 | 0.52 | 0.26 | 0.80 | 0.92 | 0.19 | 0.82 | 0.38 | 0.81 | 0.48 | 0.24 | 0.72 | 0.56 | 0.41 | NA | 0.56 | 0.48 | NA | NA | NA | NA | NA | NA | NA | NA | NA | NA | NA | NA | NA | NA | 0.46 | 0.45 | 0.31 | 0.22 | 0.32 | 0.25 | 0.15 | -0.08 | 0.16 | 0.30 | 0.16 | 0.11 |
| 2023-12-31 | 2023-09-30 | 2023-06-30 | 2023-03-31 | 2022-12-31 | 2022-09-30 | 2022-06-30 | 2022-03-31 | 2021-12-31 | 2021-09-30 | 2021-06-30 | 2021-03-31 | 2020-12-31 | 2020-09-30 | 2020-06-30 | 2020-03-31 | 2019-12-31 | 2019-09-30 | 2019-06-30 | 2019-03-31 | 2018-12-31 | 2018-09-30 | 2018-06-30 | 2018-03-31 | 2017-12-31 | 2017-09-30 | 2017-06-30 | 2017-03-31 | 2016-12-31 | 2016-09-30 | 2016-06-30 | 2016-03-31 | 2015-12-31 | 2015-09-30 | 2015-06-30 | 2015-03-31 | 2014-12-31 | 2014-09-30 | 2014-06-30 | 2014-03-31 | 2013-12-31 | 2013-09-30 | 2013-06-30 | 2013-03-31 | 2012-12-31 | 2012-09-30 | 2012-06-30 | 2012-03-31 | 2011-12-31 | 2011-09-30 | 2011-06-30 | 2011-03-31 | 2010-12-31 | 2010-09-30 | 2010-06-30 | 2010-03-31 | ||
|---|---|---|---|---|---|---|---|---|---|---|---|---|---|---|---|---|---|---|---|---|---|---|---|---|---|---|---|---|---|---|---|---|---|---|---|---|---|---|---|---|---|---|---|---|---|---|---|---|---|---|---|---|---|---|---|---|---|
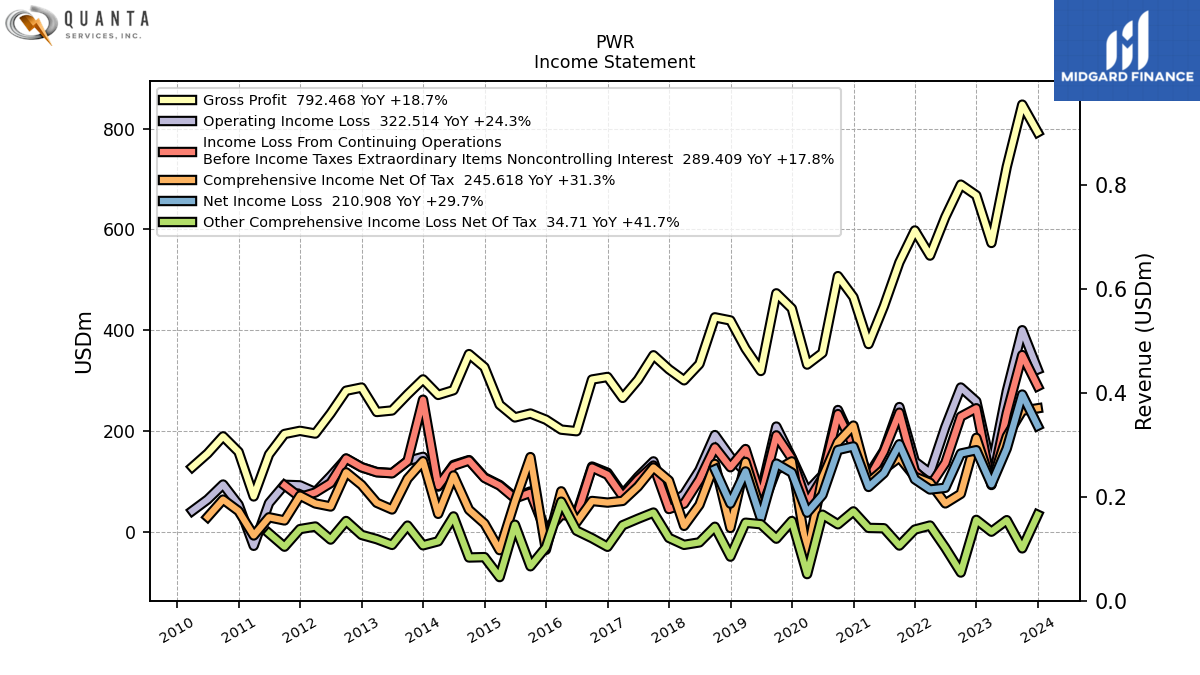
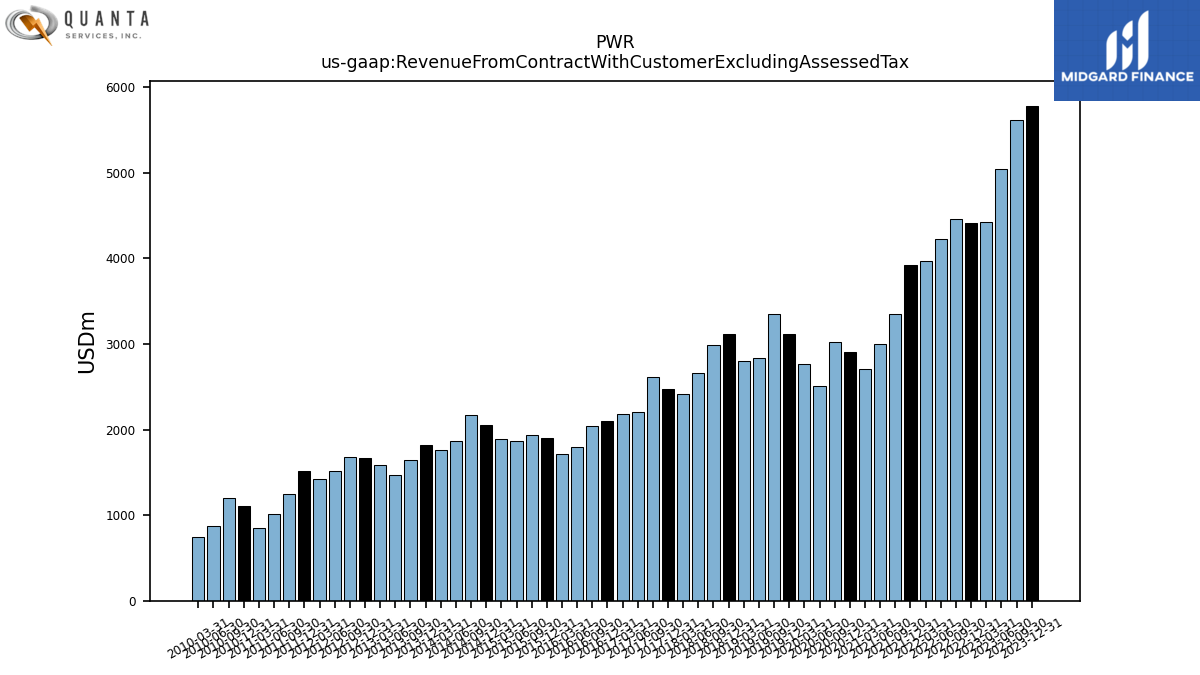
| Revenue From Contract With Customer Excluding Assessed Tax | 5783.95 | 5620.82 | 5048.61 | 4428.83 | 4416.62 | 4459.76 | 4232.00 | 3965.53 | 3923.54 | 3353.28 | 2999.82 | 2703.58 | 2912.18 | 3020.16 | 2506.23 | 2764.09 | 3112.80 | 3352.89 | 2839.20 | 2807.26 | 3112.22 | 2985.28 | 2656.35 | 2417.58 | 2478.63 | 2609.31 | 2200.37 | 2178.17 | 2102.97 | 2042.19 | 1792.43 | 1713.74 | 1899.27 | 1939.44 | 1872.34 | 1886.96 | 2052.98 | 2171.14 | 1864.55 | 1762.57 | 1817.62 | 1645.13 | 1474.38 | 1585.71 | 1673.34 | 1685.20 | 1516.70 | 1425.18 | 1513.14 | 1250.82 | 1010.91 | 848.96 | 1106.43 | 1206.01 | 870.50 | 748.28 | |
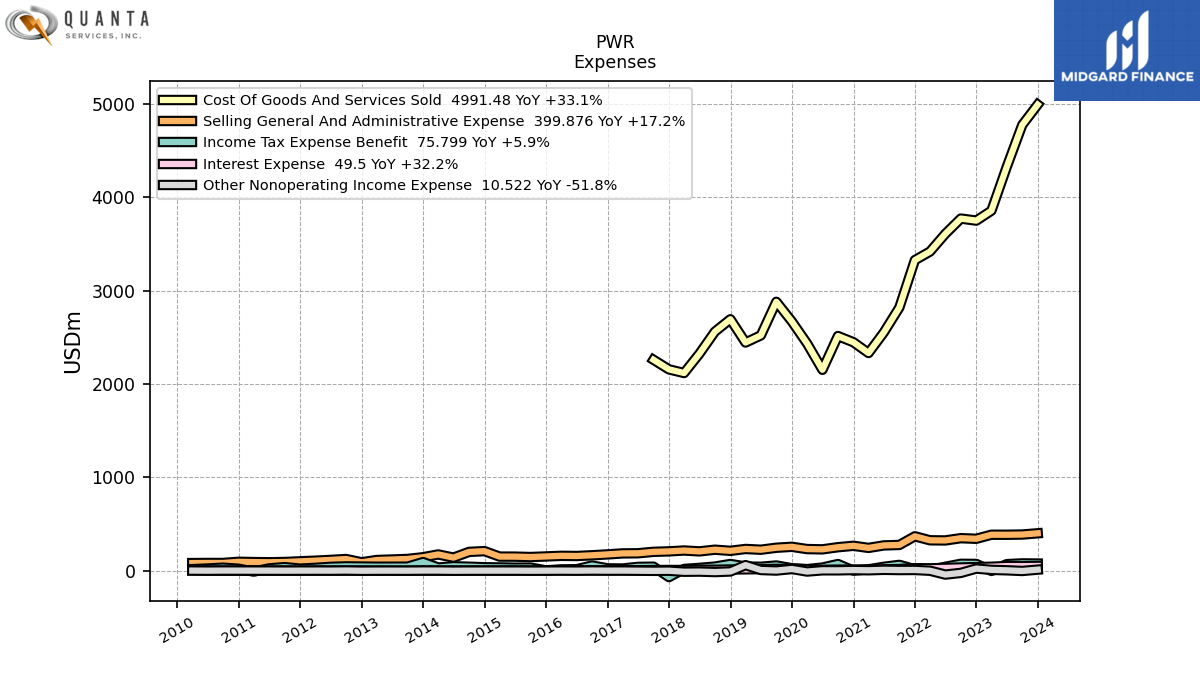
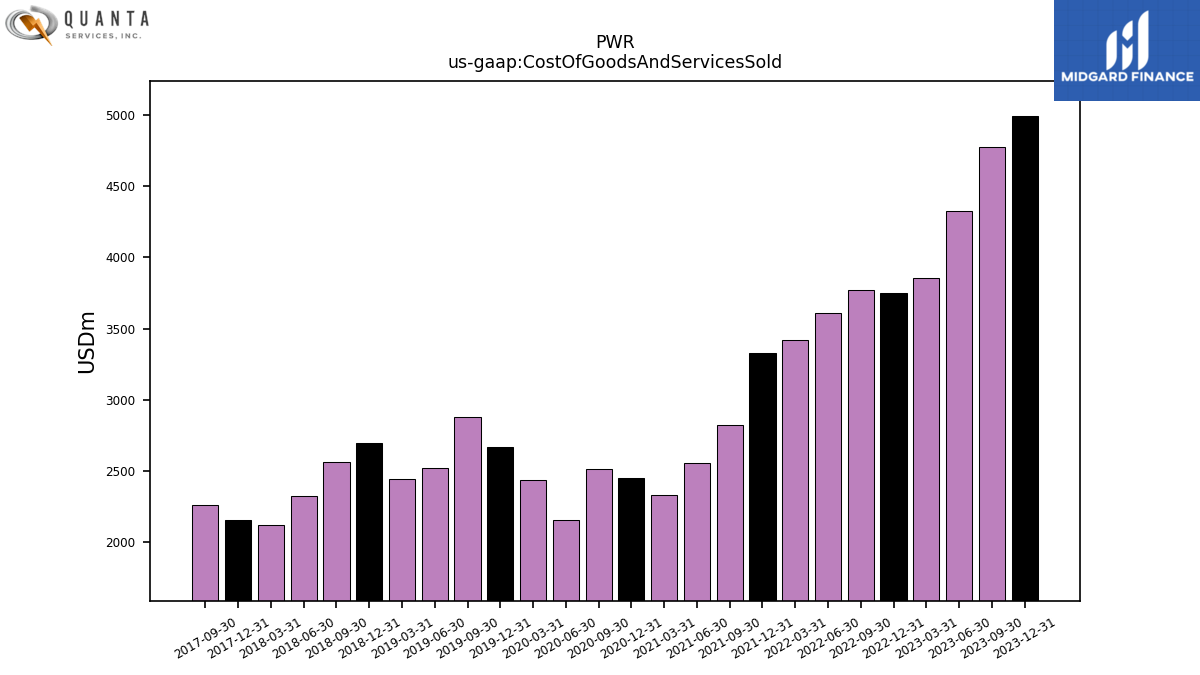
| Cost Of Goods And Services Sold | 4991.48 | 4773.50 | 4324.51 | 3855.63 | 3749.05 | 3770.93 | 3607.41 | 3417.35 | 3325.56 | 2818.60 | 2552.11 | 2330.69 | 2446.31 | 2512.65 | 2150.97 | 2431.90 | 2669.48 | 2879.45 | 2519.69 | 2443.28 | 2692.50 | 2559.45 | 2322.98 | 2116.53 | 2155.75 | 2258.68 | NA | NA | NA | NA | NA | NA | NA | NA | NA | NA | NA | NA | NA | NA | NA | NA | NA | NA | NA | NA | NA | NA | NA | NA | NA | NA | NA | NA | NA | NA | |
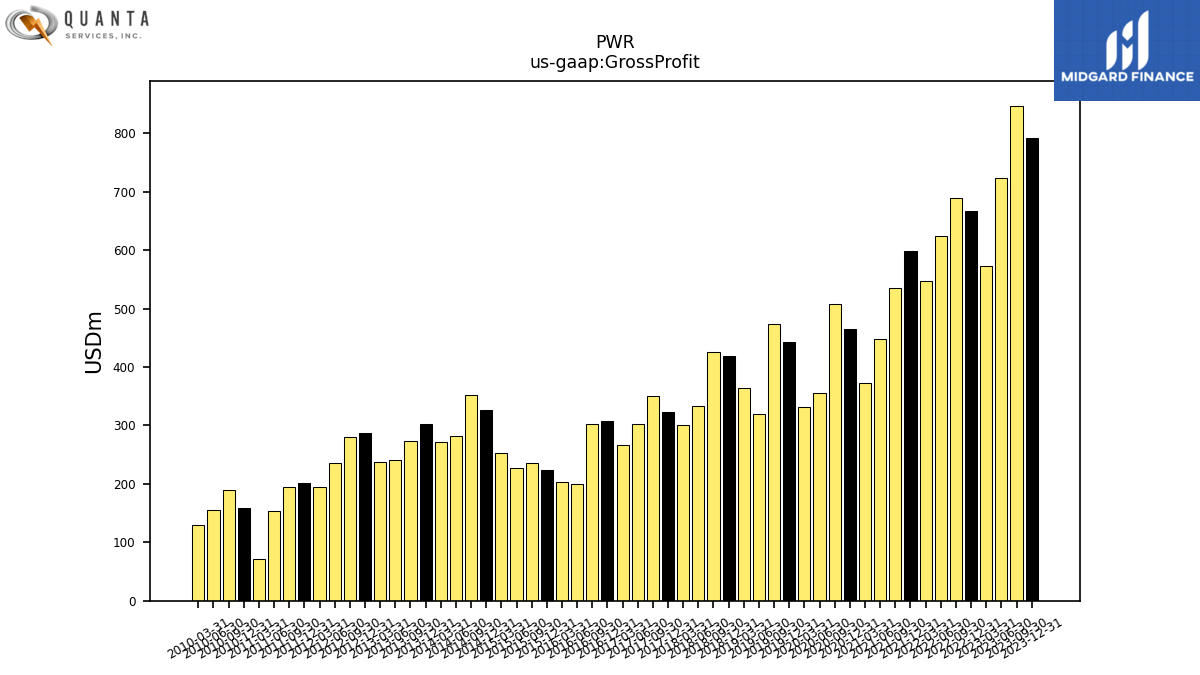
| Gross Profit | 792.47 | 847.32 | 724.10 | 573.20 | 667.56 | 688.83 | 624.59 | 548.17 | 597.98 | 534.68 | 447.71 | 372.89 | 465.87 | 507.51 | 355.26 | 332.20 | 443.32 | 473.44 | 319.50 | 363.98 | 419.71 | 425.83 | 333.37 | 301.05 | 322.88 | 350.63 | 302.17 | 266.19 | 307.69 | 302.58 | 200.22 | 203.31 | 223.04 | 235.22 | 227.50 | 252.66 | 327.03 | 352.97 | 281.45 | 272.07 | 302.84 | 273.05 | 241.28 | 238.27 | 286.74 | 280.43 | 235.41 | 195.51 | 200.93 | 194.69 | 154.09 | 70.89 | 159.25 | 189.99 | 156.04 | 129.14 | |
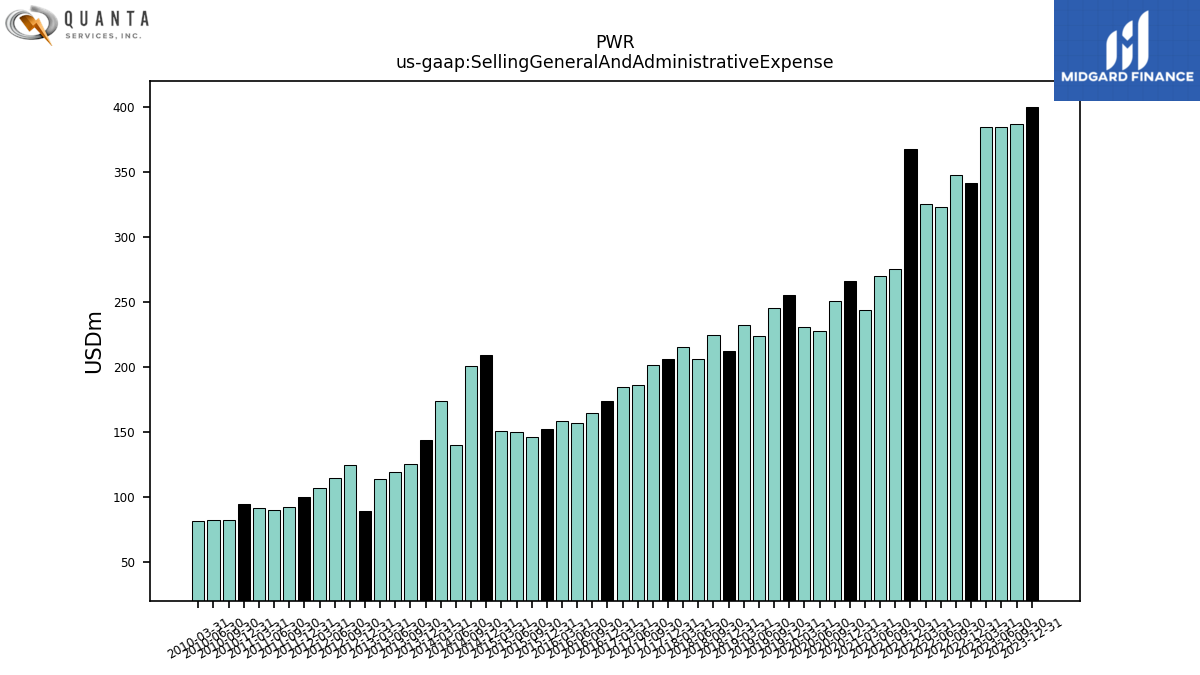
| Selling General And Administrative Expense | 399.88 | 386.54 | 384.17 | 384.55 | 341.13 | 347.45 | 323.25 | 324.89 | 367.65 | 274.85 | 270.11 | 243.35 | 265.77 | 250.65 | 227.85 | 230.79 | 255.13 | 245.01 | 223.94 | 231.91 | 212.01 | 224.04 | 206.10 | 215.42 | 206.26 | 201.22 | 185.88 | 184.55 | 173.88 | 164.32 | 156.61 | 158.52 | 151.79 | 145.69 | 149.92 | 150.24 | 208.75 | 200.52 | 139.44 | 173.33 | 143.35 | 124.95 | 119.03 | 113.68 | 89.26 | 124.28 | 114.71 | 106.65 | 99.52 | 92.41 | 89.49 | 91.54 | 94.51 | 82.04 | 82.12 | 81.00 | |
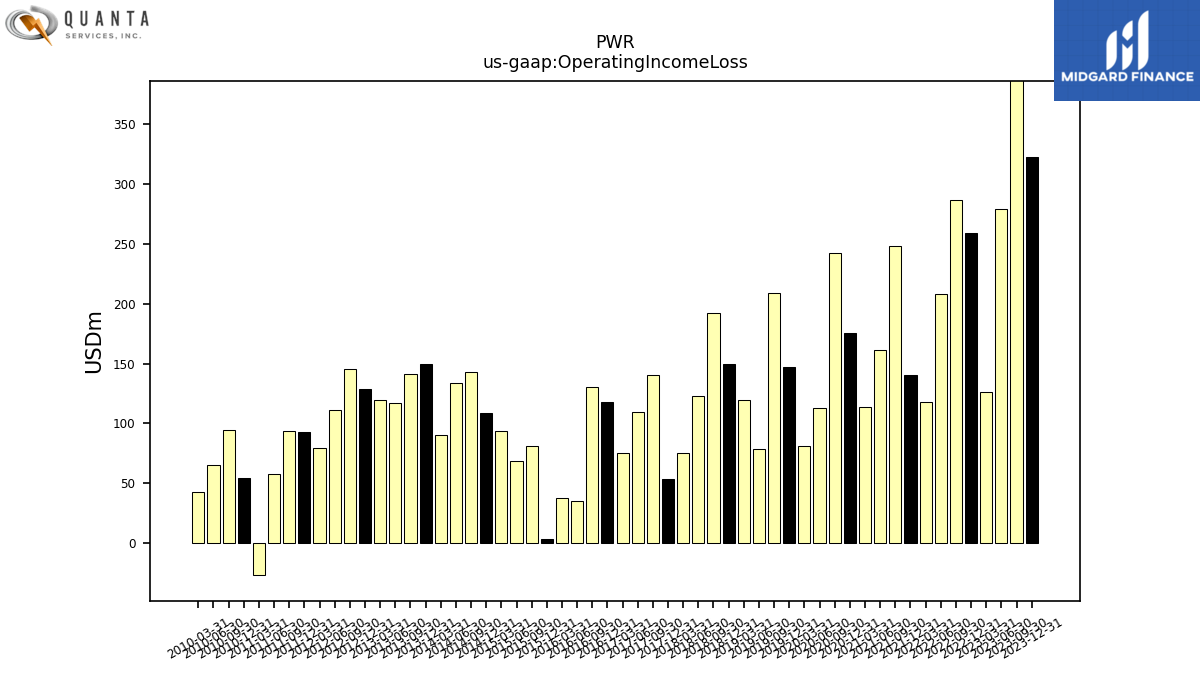
| Operating Income Loss | 322.51 | 400.33 | 279.27 | 125.86 | 259.39 | 286.79 | 208.36 | 117.52 | 140.06 | 248.08 | 161.65 | 113.73 | 175.50 | 242.22 | 112.92 | 80.74 | 147.41 | 209.39 | 78.58 | 119.49 | 149.45 | 192.56 | 123.04 | 75.22 | 53.56 | 140.43 | 109.79 | 75.07 | 117.89 | 130.16 | 35.47 | 37.29 | 3.62 | 80.88 | 68.85 | 93.72 | 108.78 | 142.91 | 133.39 | 90.50 | 149.38 | 141.08 | 117.17 | 119.29 | 128.85 | 145.65 | 111.15 | 79.47 | 92.89 | 93.98 | 57.73 | -26.92 | 54.51 | 94.56 | 64.83 | 42.29 | |
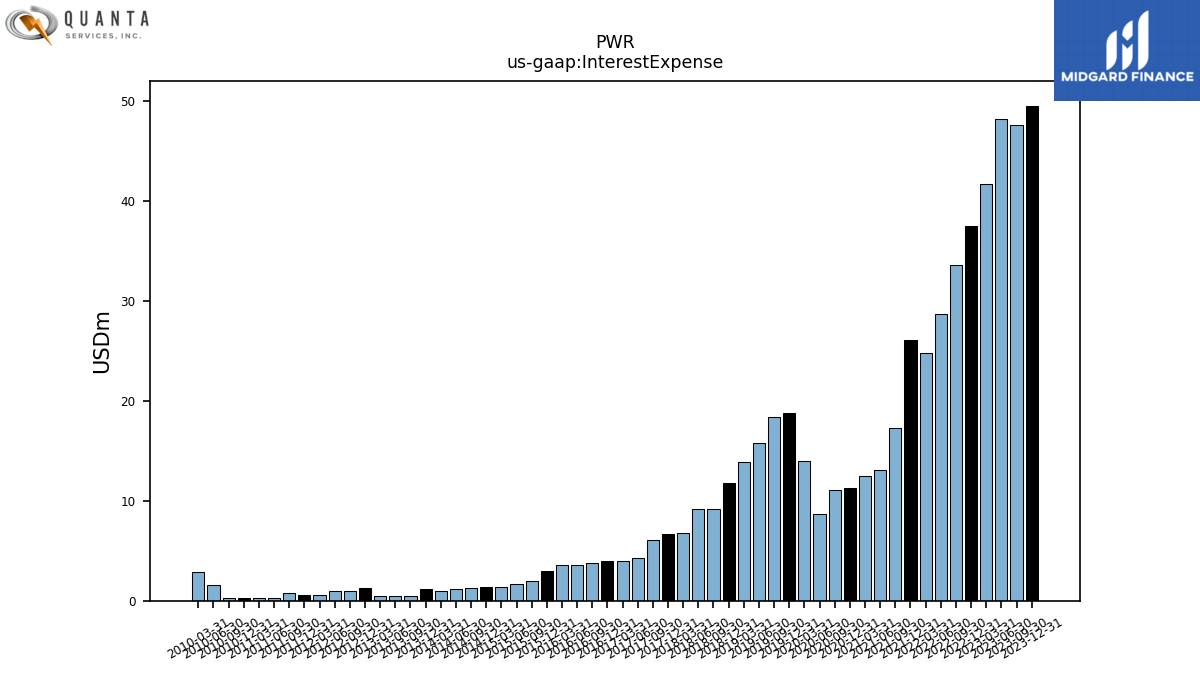
| Interest Expense | 49.50 | 47.53 | 48.19 | 41.69 | 37.43 | 33.57 | 28.64 | 24.73 | 26.06 | 17.26 | 13.11 | 12.47 | 11.30 | 11.05 | 8.65 | 14.01 | 18.82 | 18.37 | 15.82 | 13.88 | 11.77 | 9.22 | 9.18 | 6.78 | 6.65 | 6.06 | 4.27 | 3.96 | 3.99 | 3.73 | 3.58 | 3.59 | 2.93 | 2.02 | 1.68 | 1.40 | 1.33 | 1.32 | 1.13 | 0.98 | 1.19 | 0.47 | 0.50 | 0.50 | 1.24 | 0.97 | 0.96 | 0.58 | 0.57 | 0.74 | 0.26 | 0.26 | 0.25 | 0.27 | 1.53 | 2.86 | |
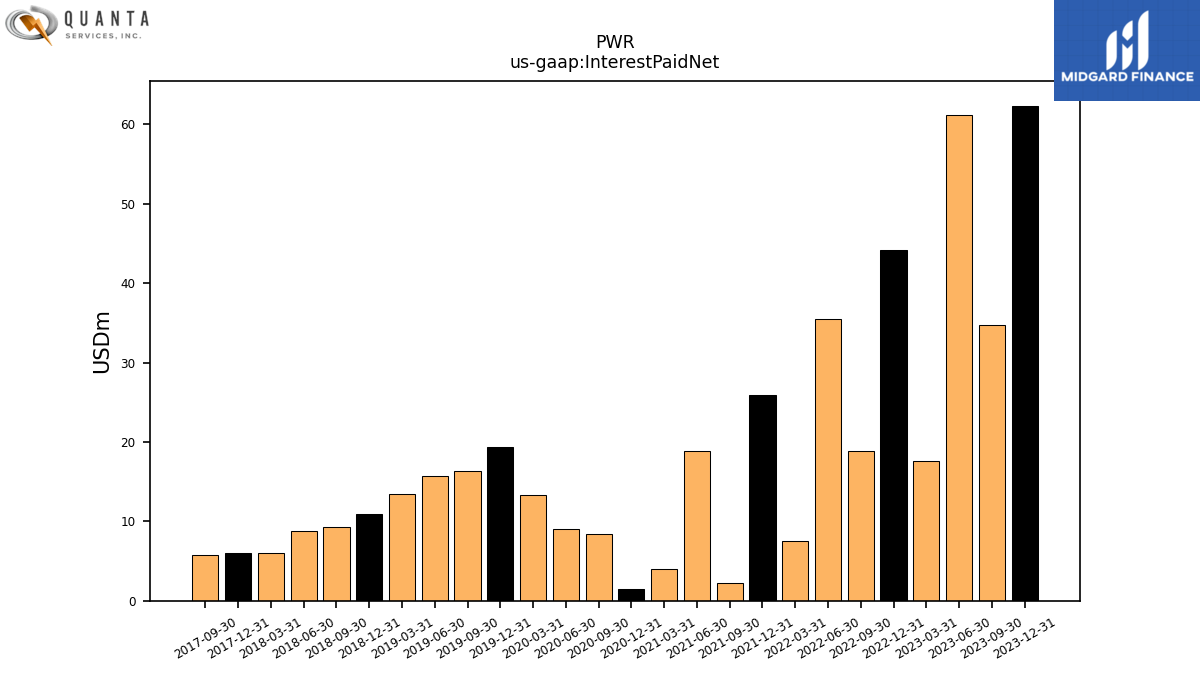
| Interest Paid Net | 62.34 | 34.67 | 61.17 | 17.61 | 44.24 | 18.86 | 35.49 | 7.47 | 25.85 | 2.26 | 18.89 | 4.04 | 1.44 | 8.44 | 8.99 | 13.27 | 19.34 | 16.31 | 15.72 | 13.43 | 10.92 | 9.28 | 8.77 | 5.96 | 6.06 | 5.81 | NA | NA | NA | NA | NA | NA | NA | NA | NA | NA | NA | NA | NA | NA | NA | NA | NA | NA | NA | NA | NA | NA | NA | NA | NA | NA | NA | NA | NA | NA | |
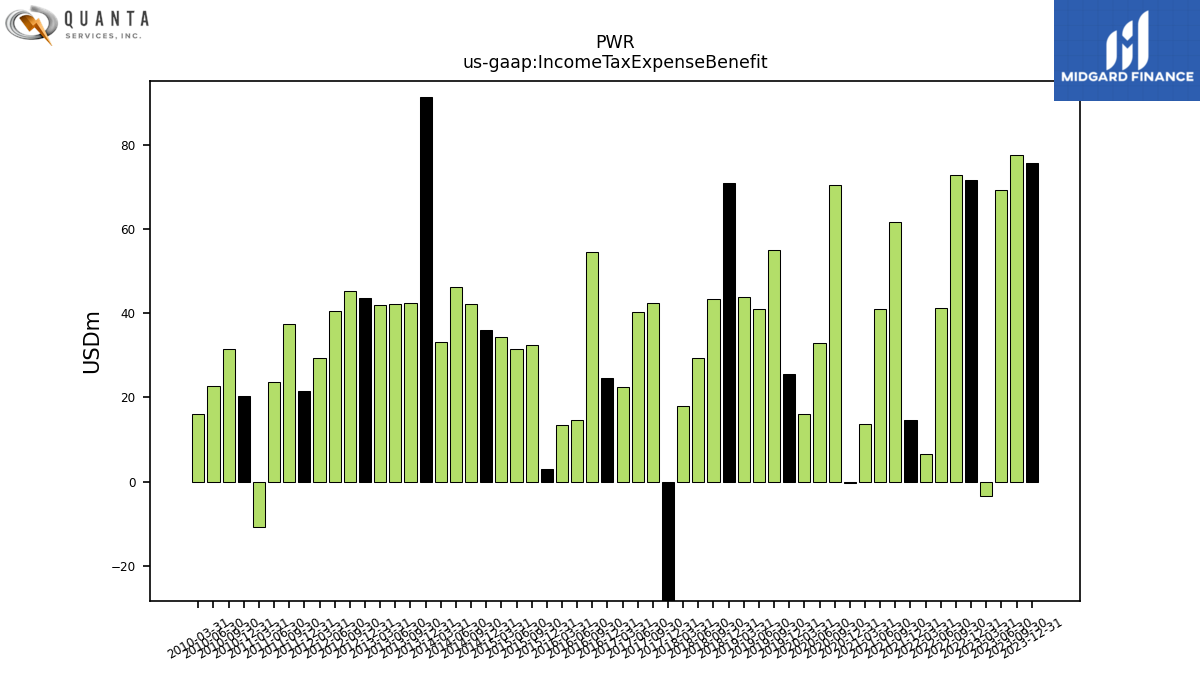
| Income Tax Expense Benefit | 75.80 | 77.52 | 69.37 | -3.42 | 71.55 | 72.89 | 41.25 | 6.56 | 14.66 | 61.58 | 40.95 | 13.72 | -0.24 | 70.48 | 32.99 | 16.16 | 25.63 | 54.91 | 41.09 | 43.84 | 71.00 | 43.27 | 29.39 | 18.00 | -69.65 | 42.35 | 40.24 | 22.59 | 24.59 | 54.52 | 14.70 | 13.44 | 2.90 | 32.39 | 31.58 | 34.38 | 36.07 | 42.10 | 46.19 | 33.05 | 91.33 | 42.51 | 42.16 | 41.94 | 43.57 | 45.35 | 40.47 | 29.47 | 21.65 | 37.34 | 23.61 | -10.64 | 20.38 | 31.49 | 22.77 | 16.07 | |
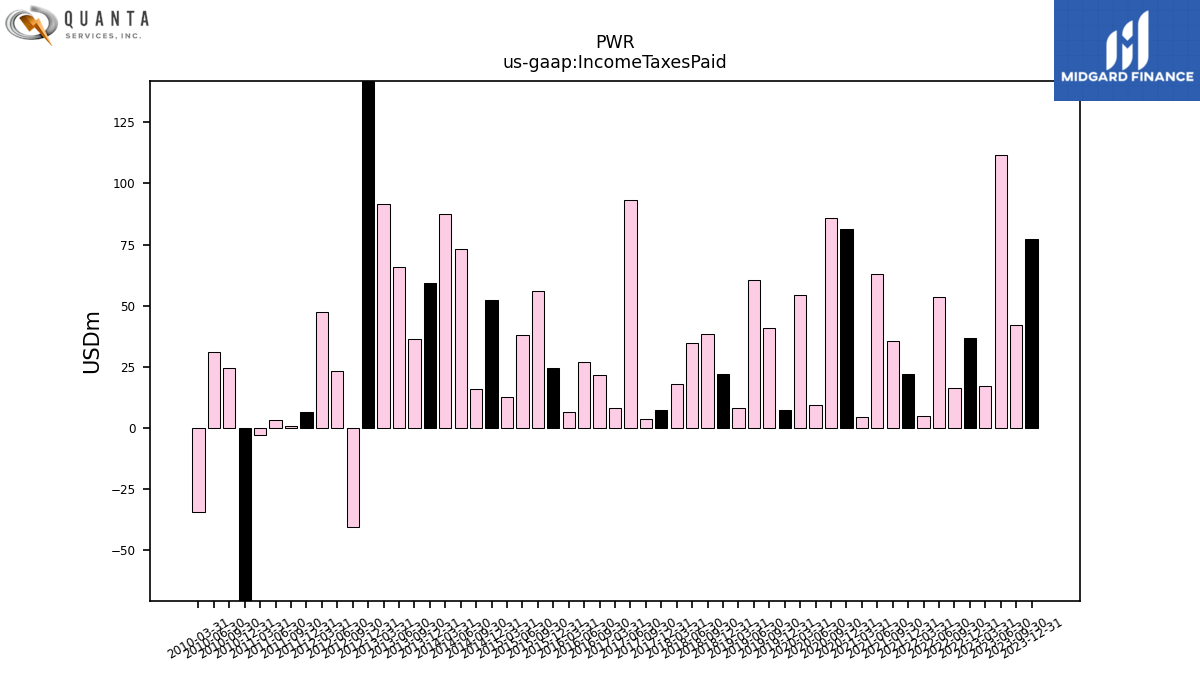
| Income Taxes Paid | 77.32 | 42.28 | 111.54 | 17.39 | 36.74 | 16.46 | 53.53 | 4.83 | 22.10 | 35.74 | 62.88 | 4.60 | 81.50 | 86.08 | 9.39 | 54.22 | 7.20 | 40.74 | 60.33 | 8.19 | 21.89 | 38.45 | 34.60 | 17.96 | 7.22 | 3.62 | 93.28 | 8.22 | NA | 21.80 | 27.04 | 6.49 | 24.38 | 56.06 | 37.88 | 12.61 | 52.34 | 15.80 | 73.33 | 87.71 | 59.23 | 36.56 | 65.81 | 91.58 | 266.67 | -40.26 | 23.33 | 47.59 | 6.42 | 0.88 | 3.23 | -2.77 | -198.99 | 24.62 | 31.27 | -34.40 | |
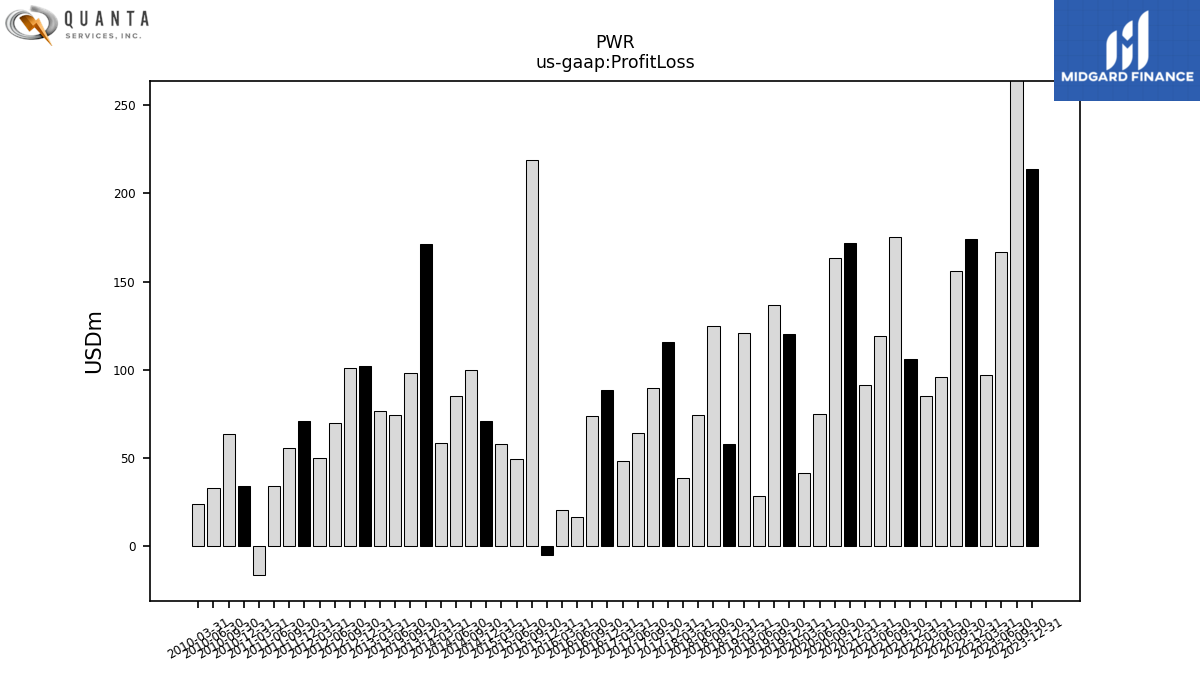
| Profit Loss | 213.61 | 273.52 | 166.58 | 96.97 | 174.14 | 156.32 | 96.16 | 85.03 | 106.30 | 175.40 | 118.97 | 91.32 | 171.96 | 163.70 | 74.80 | 41.50 | 120.30 | 137.02 | 28.46 | 121.03 | 57.79 | 124.90 | 74.71 | 38.61 | 115.58 | 89.85 | 64.36 | 48.44 | 88.36 | 74.15 | 16.73 | 20.86 | -4.88 | 218.96 | 49.56 | 58.19 | 70.97 | 100.02 | 85.44 | 58.65 | 171.32 | 98.41 | 74.73 | 76.86 | 102.01 | 100.86 | 69.80 | 49.99 | 70.81 | 55.60 | 34.31 | -16.30 | 34.43 | 63.70 | 33.32 | 24.10 | |
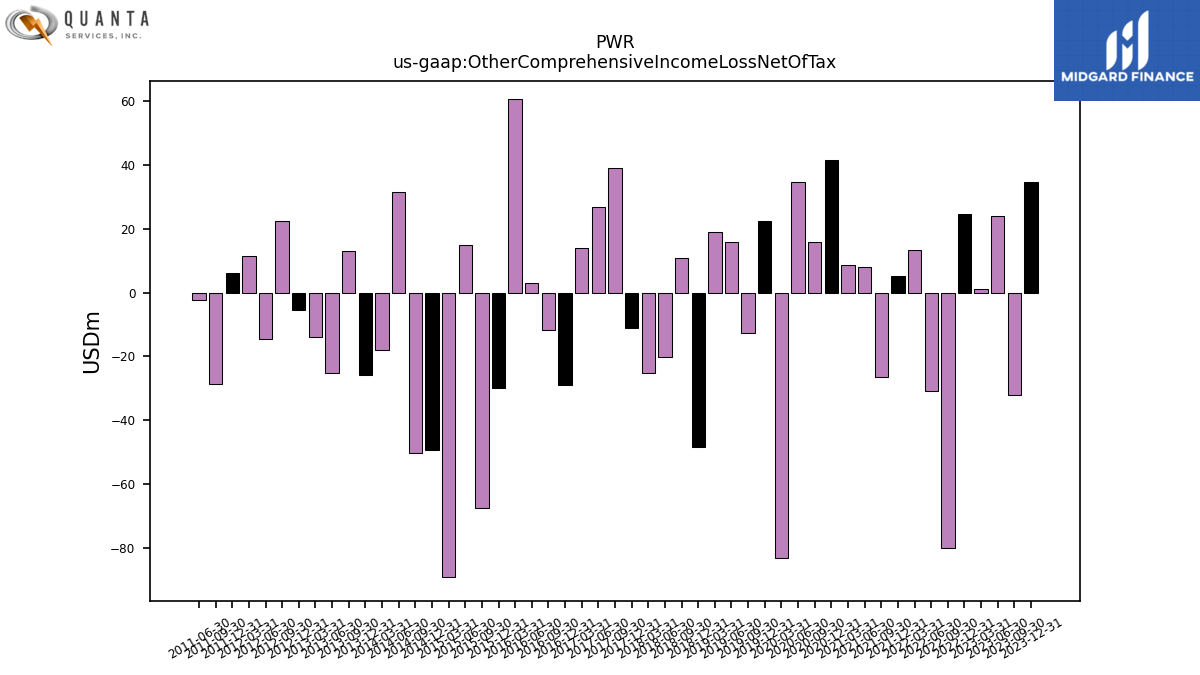
| Other Comprehensive Income Loss Net Of Tax | 34.71 | -32.00 | 23.92 | 1.10 | 24.50 | -79.87 | -30.89 | 13.28 | 5.30 | -26.42 | 7.89 | 8.54 | 41.34 | 15.71 | 34.74 | -82.97 | 22.30 | -12.78 | 15.87 | 18.85 | -48.35 | 10.84 | -20.12 | -25.01 | -11.21 | 38.98 | 26.68 | 13.82 | -28.85 | -11.80 | 3.08 | 60.59 | -29.84 | -67.51 | 14.90 | -88.95 | -49.35 | -50.07 | 31.34 | -17.98 | -25.92 | 13.12 | -25.15 | -13.74 | -5.32 | 22.29 | -14.55 | 11.32 | 6.24 | -28.64 | -2.18 | NA | NA | NA | NA | NA | |
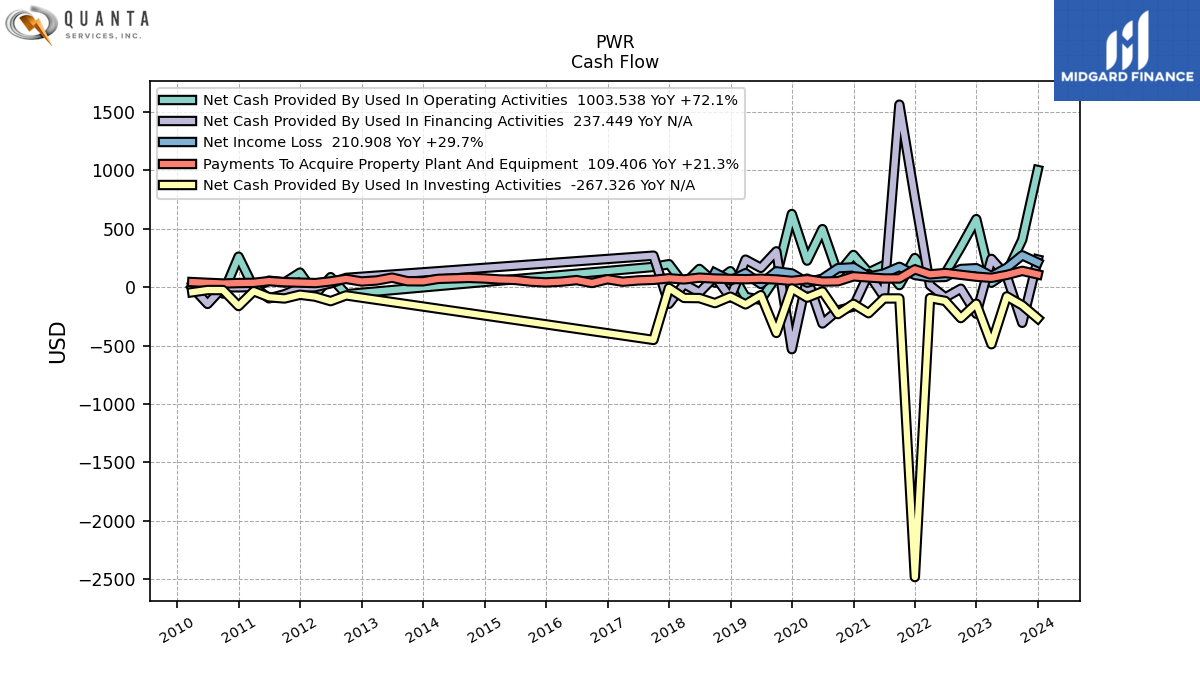
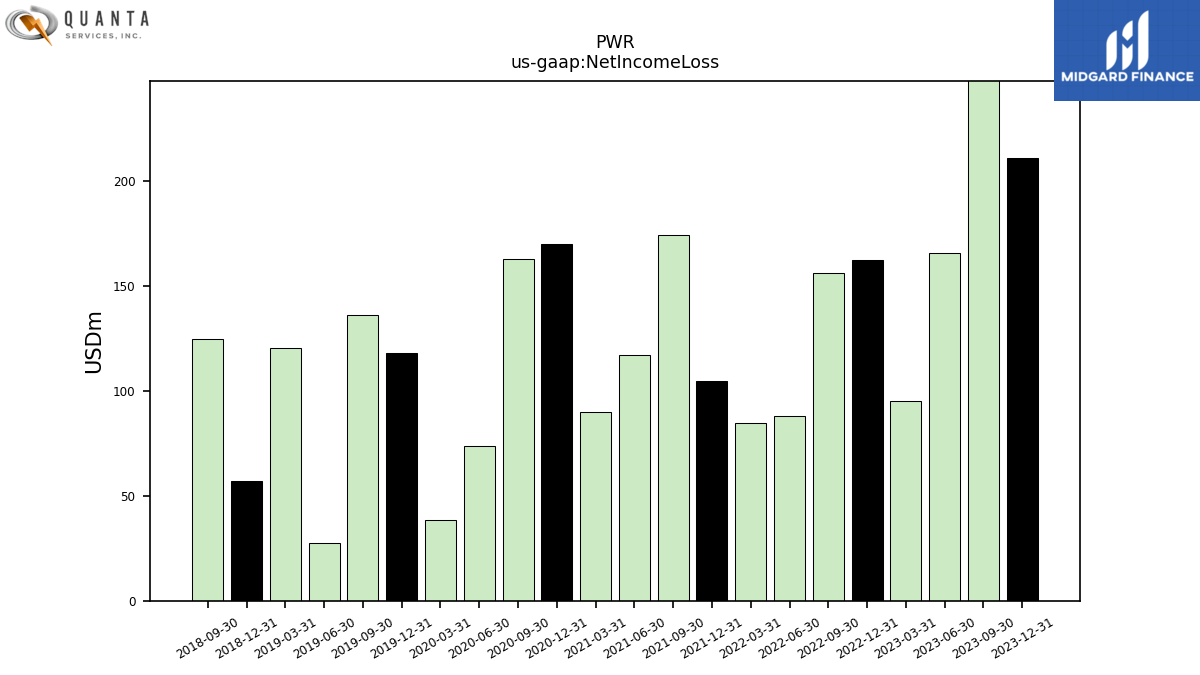
| Net Income Loss | 210.91 | 272.84 | 165.90 | 95.05 | 162.57 | 155.96 | 88.02 | 84.64 | 104.80 | 174.37 | 117.03 | 89.76 | 170.05 | 162.91 | 73.95 | 38.69 | 118.14 | 136.07 | 27.34 | 120.49 | 56.82 | 124.55 | NA | NA | NA | NA | NA | NA | NA | NA | NA | NA | NA | NA | NA | NA | NA | NA | NA | NA | NA | NA | NA | NA | NA | NA | NA | NA | NA | NA | NA | NA | NA | NA | NA | NA | |
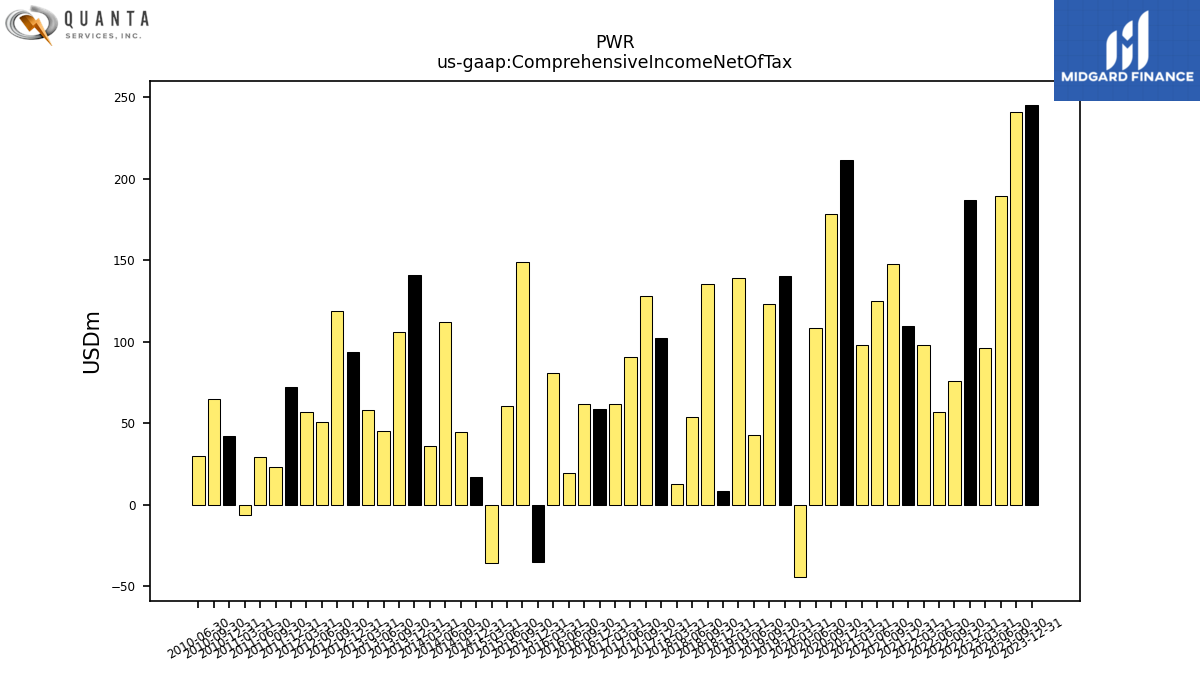
| Comprehensive Income Net Of Tax | 245.62 | 240.84 | 189.82 | 96.15 | 187.07 | 76.09 | 57.12 | 97.92 | 110.09 | 147.94 | 124.93 | 98.30 | 211.40 | 178.62 | 108.68 | -44.28 | 140.44 | 123.28 | 43.22 | 139.34 | 8.46 | 135.39 | 54.24 | 12.60 | 102.35 | 128.29 | 90.52 | 62.09 | 58.73 | 61.94 | 19.64 | 81.08 | -34.92 | 148.88 | 61.01 | -35.47 | 17.23 | 44.58 | 112.43 | 36.42 | 140.78 | 106.03 | 45.09 | 58.34 | 93.67 | 118.69 | 50.98 | 57.03 | 72.55 | 23.35 | 29.62 | -6.42 | 42.01 | 64.74 | 30.17 | NA | |
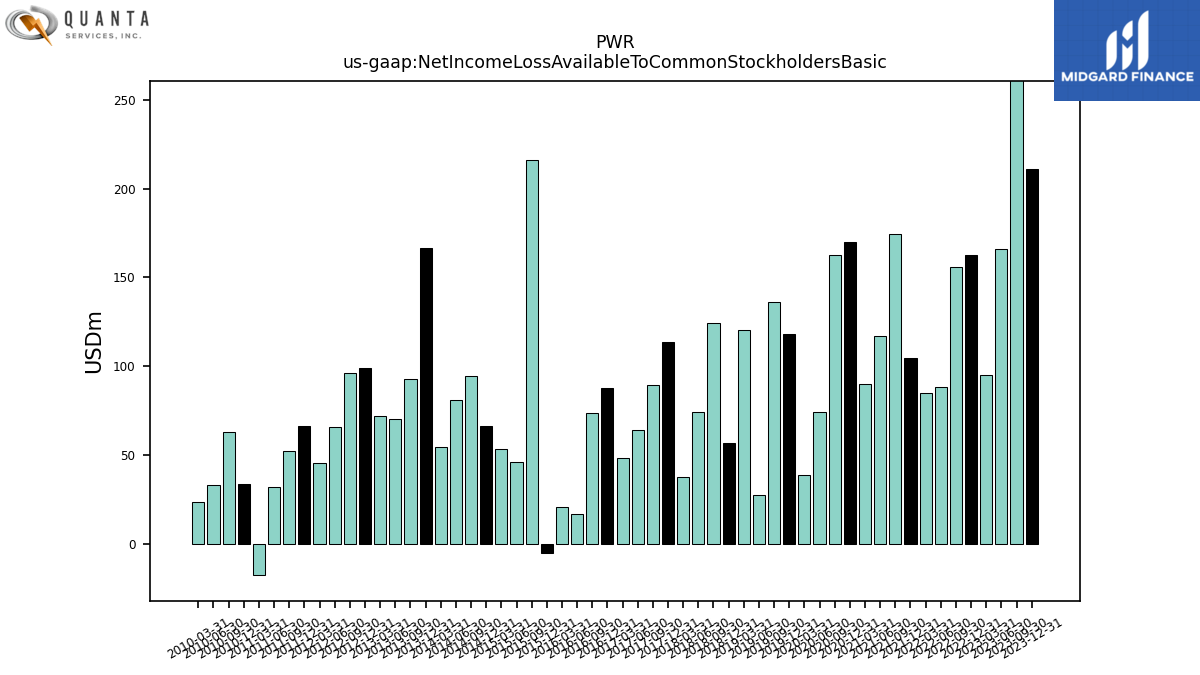
| Net Income Loss Available To Common Stockholders Basic | 210.91 | 272.84 | 165.90 | 95.05 | 162.57 | 155.96 | 88.02 | 84.64 | 104.80 | 174.37 | 117.03 | 89.76 | 170.05 | 162.91 | 73.95 | 38.69 | 118.14 | 136.07 | 27.34 | 120.49 | 56.82 | 124.55 | 74.36 | 37.61 | 113.56 | 89.31 | 63.84 | 48.27 | 87.58 | 73.74 | 16.56 | 20.50 | -5.07 | 216.39 | 46.11 | 53.48 | 66.58 | 94.65 | 81.08 | 54.41 | 166.70 | 92.91 | 70.24 | 72.08 | 98.99 | 96.40 | 65.54 | 45.71 | 66.31 | 51.99 | 31.80 | -17.59 | 33.67 | 62.78 | 32.99 | 23.74 | |
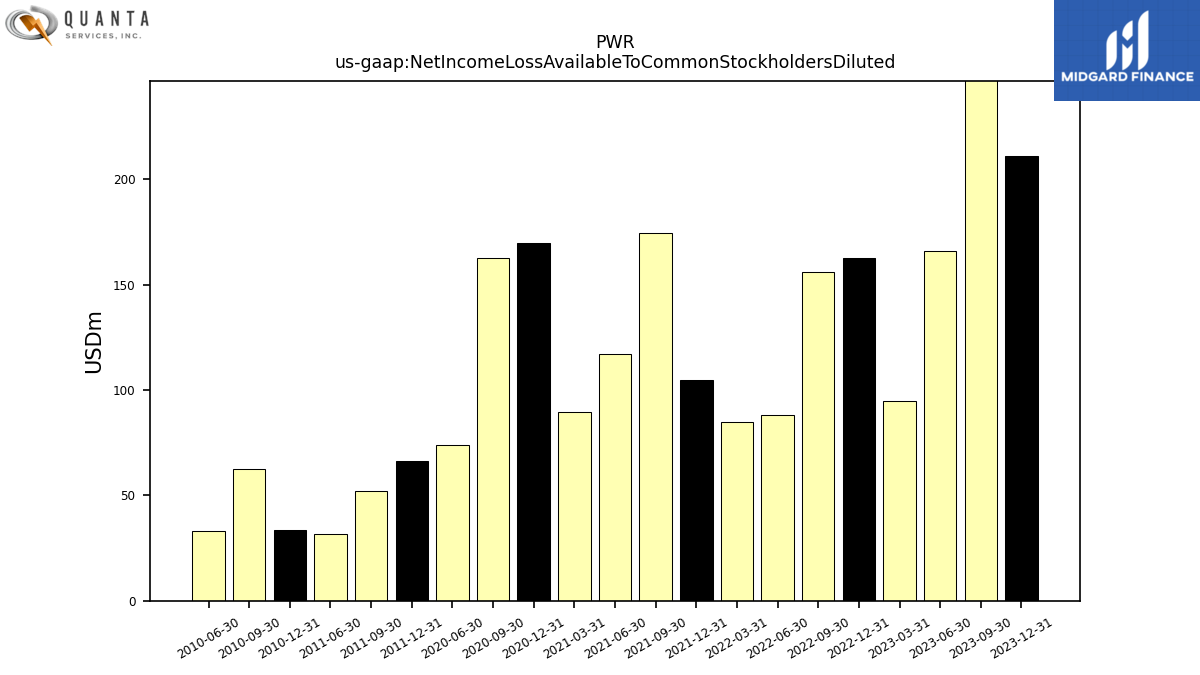
| Net Income Loss Available To Common Stockholders Diluted | 210.91 | 272.84 | 165.90 | 95.05 | 162.57 | 155.96 | 88.02 | 84.64 | 104.80 | 174.37 | 117.03 | 89.76 | 170.05 | 162.91 | 73.95 | NA | NA | NA | NA | NA | NA | NA | NA | NA | NA | NA | NA | NA | NA | NA | NA | NA | NA | NA | NA | NA | NA | NA | NA | NA | NA | NA | NA | NA | NA | NA | NA | NA | 66.31 | 51.99 | 31.80 | NA | 33.67 | 62.78 | 32.99 | NA |
| 2023-12-31 | 2023-09-30 | 2023-06-30 | 2023-03-31 | 2022-12-31 | 2022-09-30 | 2022-06-30 | 2022-03-31 | 2021-12-31 | 2021-09-30 | 2021-06-30 | 2021-03-31 | 2020-12-31 | 2020-09-30 | 2020-06-30 | 2020-03-31 | 2019-12-31 | 2019-09-30 | 2019-06-30 | 2019-03-31 | 2018-12-31 | 2018-09-30 | 2018-06-30 | 2018-03-31 | 2017-12-31 | 2017-09-30 | 2017-06-30 | 2017-03-31 | 2016-12-31 | 2016-09-30 | 2016-06-30 | 2016-03-31 | 2015-12-31 | 2015-09-30 | 2015-06-30 | 2015-03-31 | 2014-12-31 | 2014-09-30 | 2014-06-30 | 2014-03-31 | 2013-12-31 | 2013-09-30 | 2013-06-30 | 2013-03-31 | 2012-12-31 | 2012-09-30 | 2012-06-30 | 2012-03-31 | 2011-12-31 | 2011-09-30 | 2011-06-30 | 2011-03-31 | 2010-12-31 | 2010-09-30 | 2010-06-30 | 2010-03-31 | ||
|---|---|---|---|---|---|---|---|---|---|---|---|---|---|---|---|---|---|---|---|---|---|---|---|---|---|---|---|---|---|---|---|---|---|---|---|---|---|---|---|---|---|---|---|---|---|---|---|---|---|---|---|---|---|---|---|---|---|
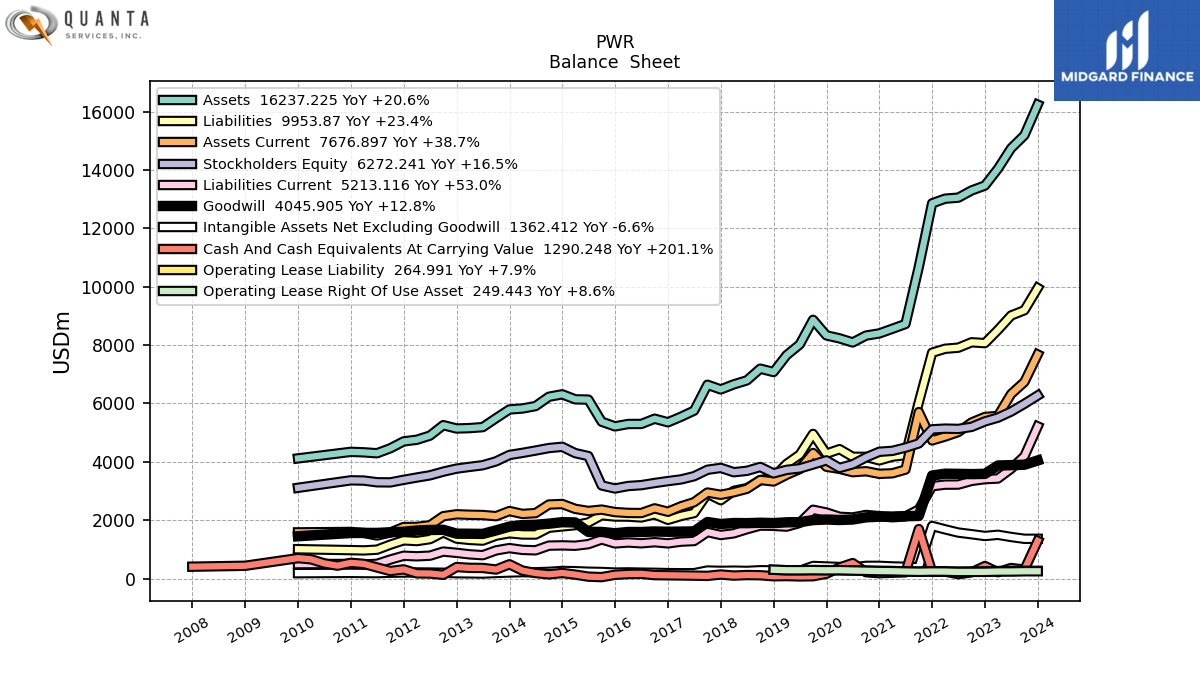
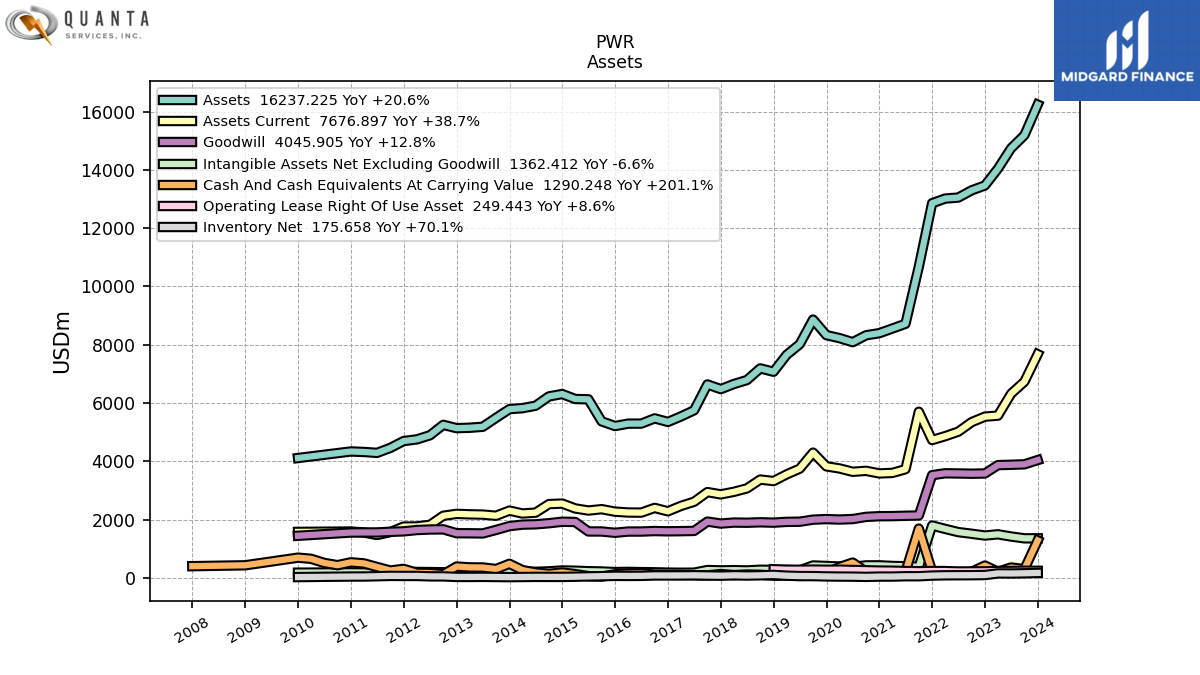
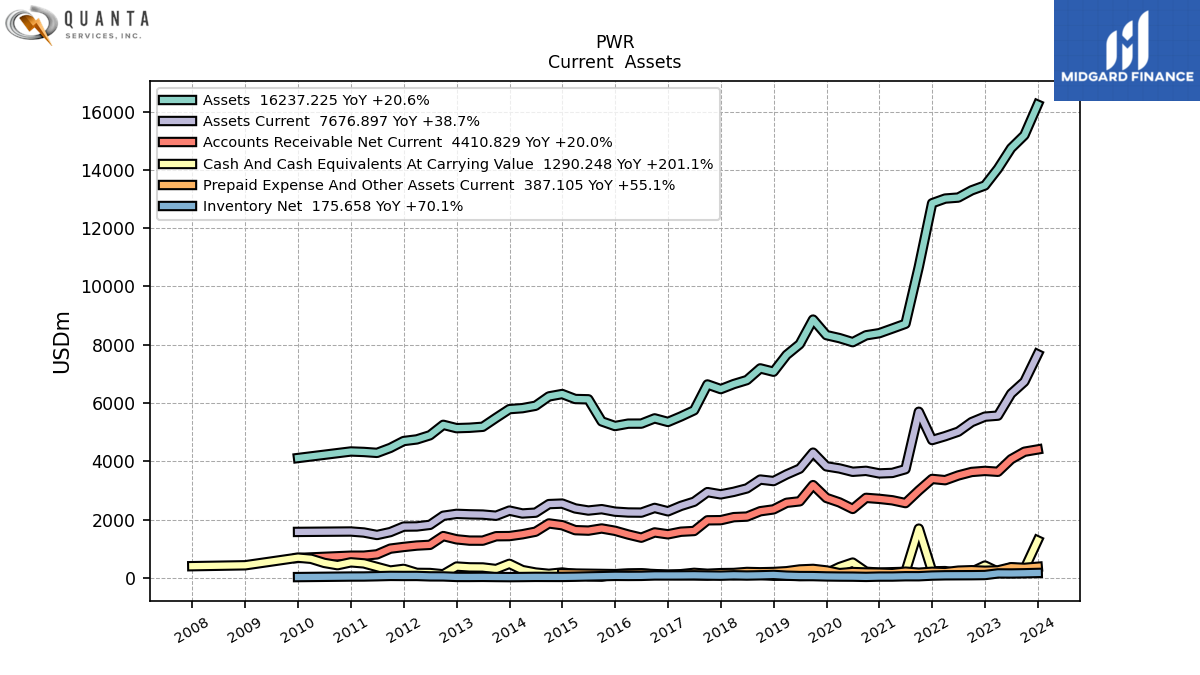
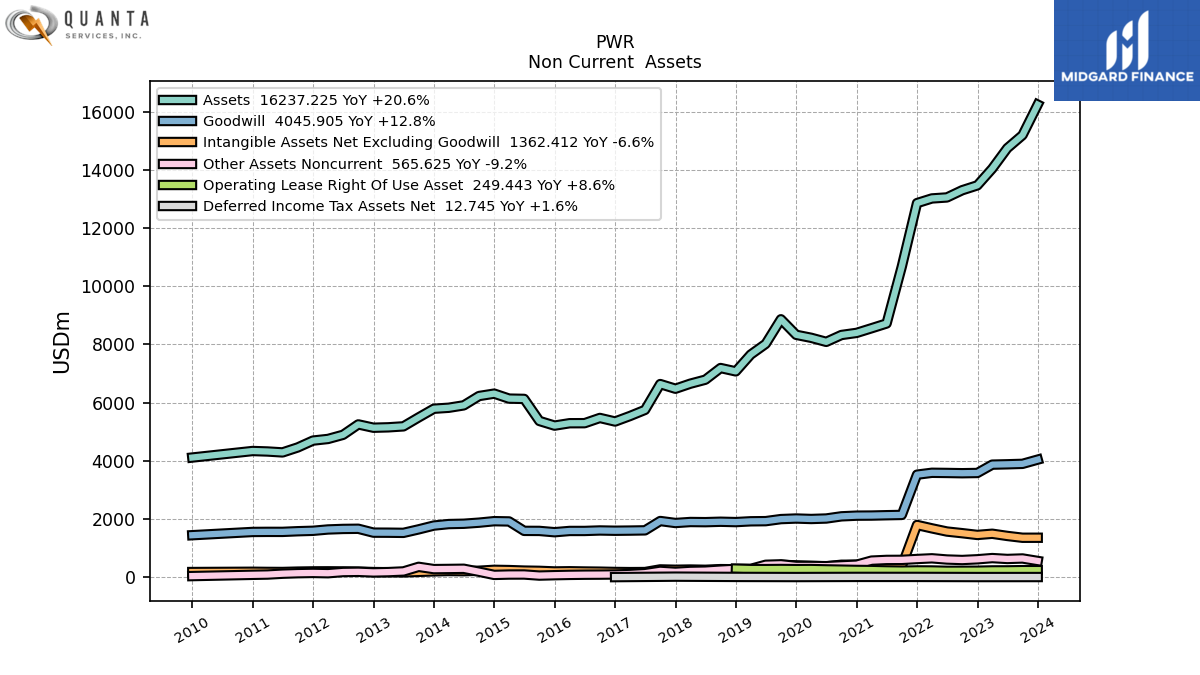
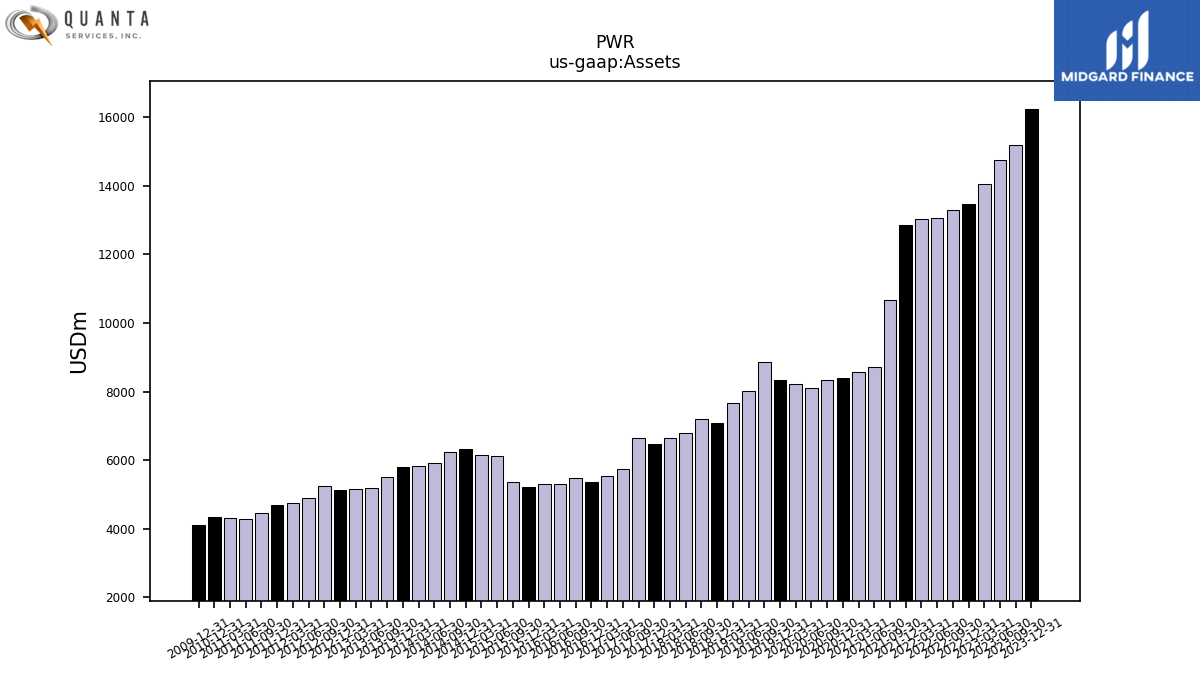
| Assets | 16237.23 | 15188.45 | 14740.85 | 14039.14 | 13464.34 | 13296.65 | 13049.65 | 13015.10 | 12855.19 | 10675.72 | 8720.60 | 8557.41 | 8398.27 | 8325.49 | 8089.63 | 8228.94 | 8331.68 | 8865.09 | 8021.82 | 7652.52 | 7075.79 | 7191.17 | 6790.38 | 6653.40 | 6480.15 | 6640.25 | 5753.34 | 5543.05 | 5354.06 | 5476.47 | 5297.10 | 5295.52 | 5213.54 | 5373.42 | 6130.51 | 6140.83 | 6312.02 | 6229.29 | 5909.06 | 5826.62 | 5793.24 | 5494.97 | 5187.93 | 5154.82 | 5140.76 | 5255.27 | 4897.30 | 4755.33 | 4699.11 | 4463.95 | 4292.85 | 4324.56 | 4341.21 | NA | NA | NA | |
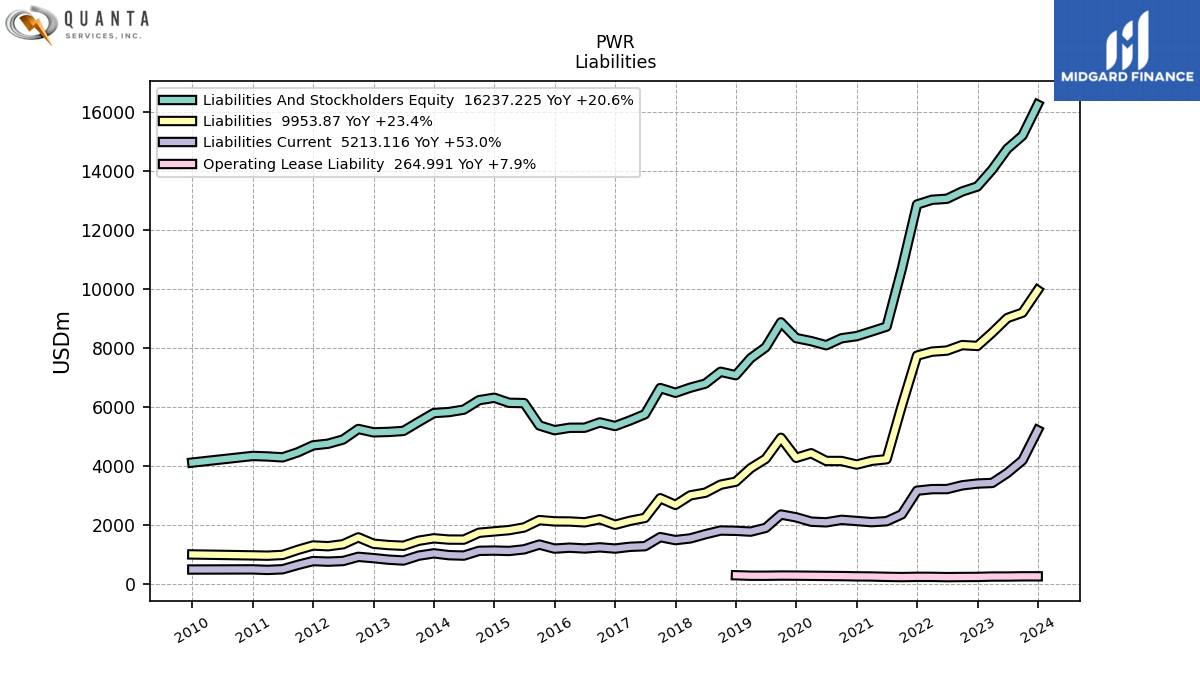
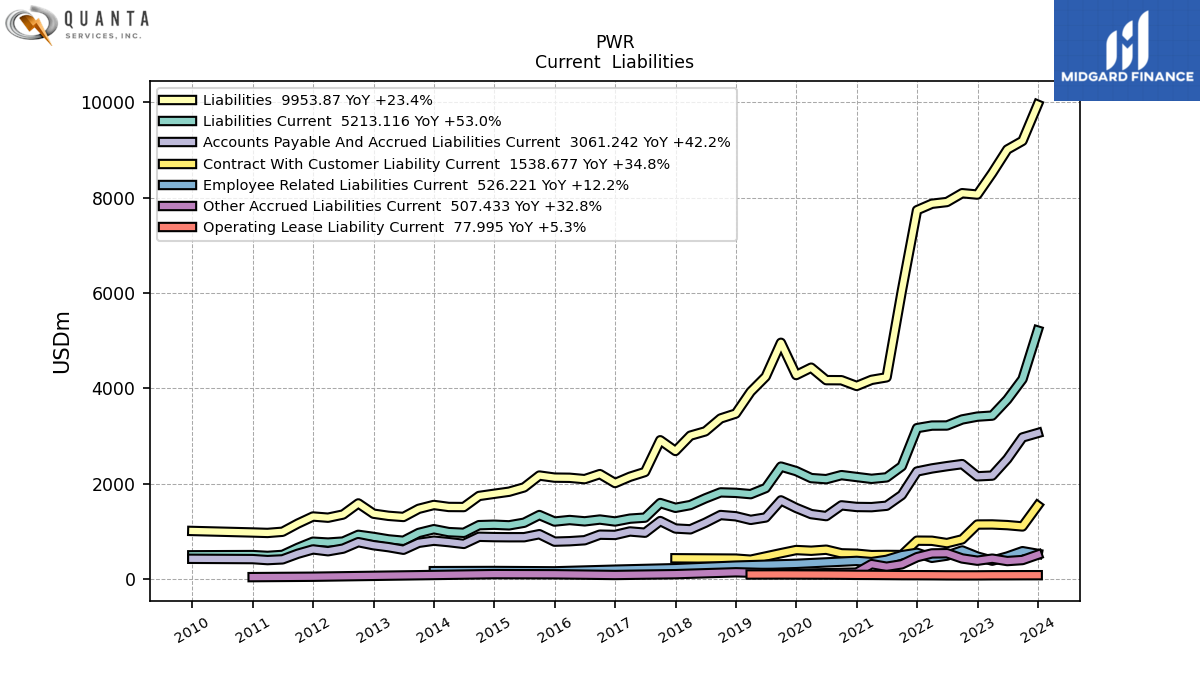
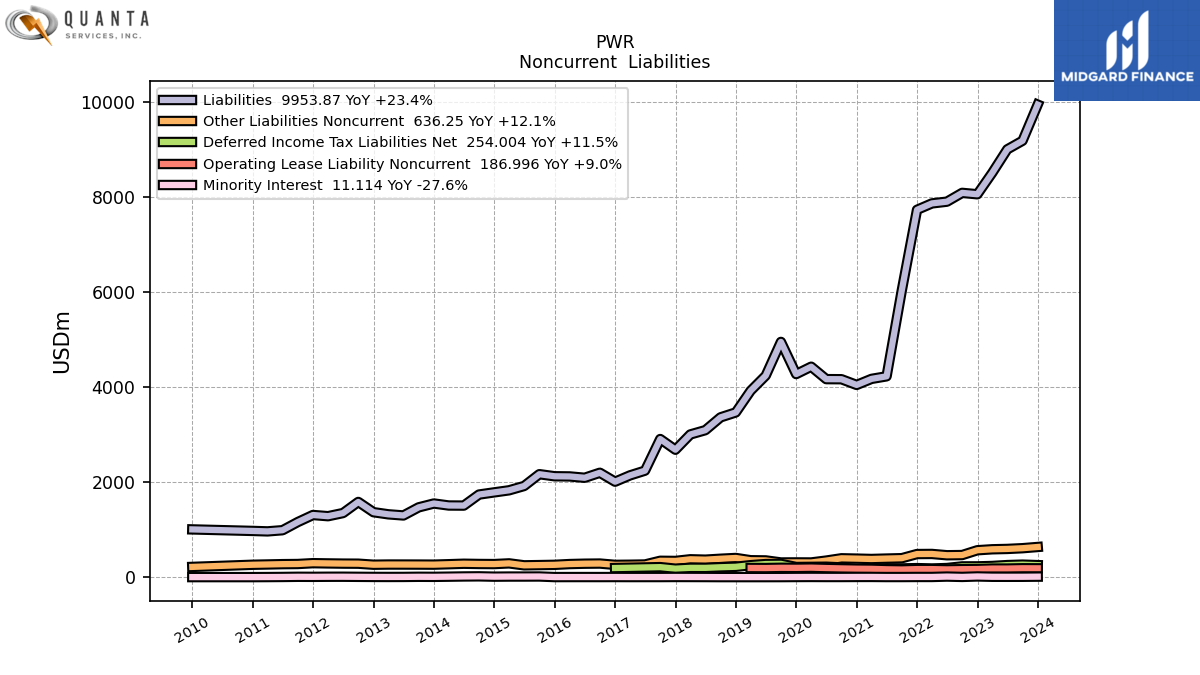
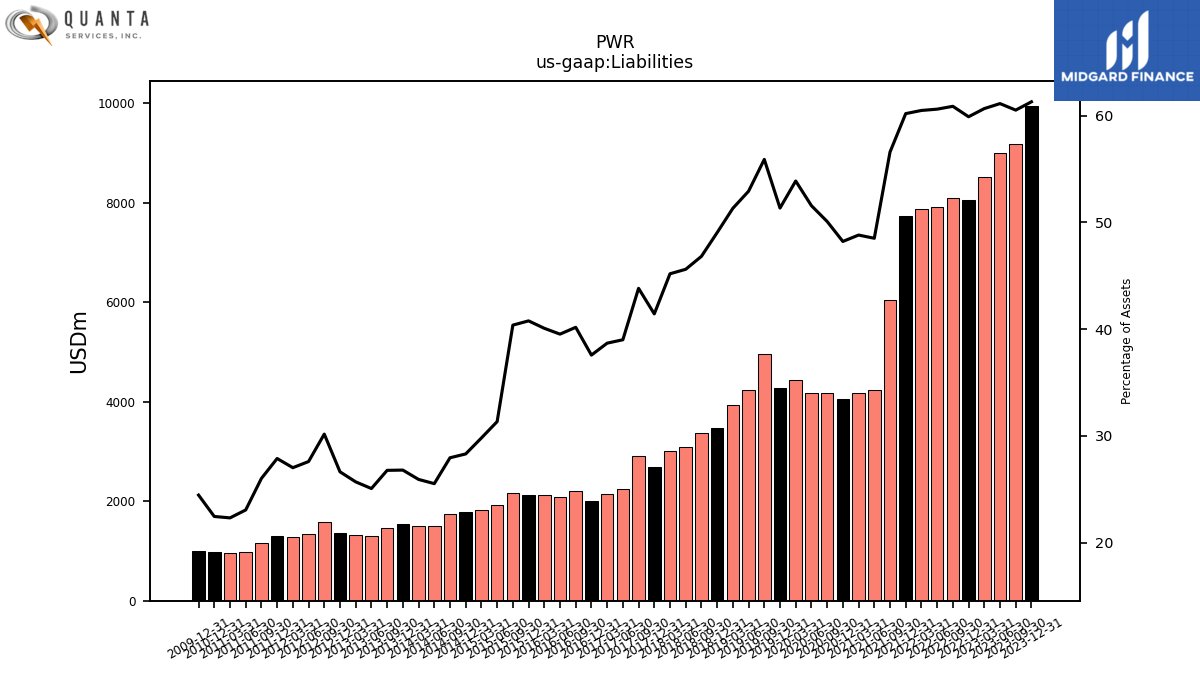
| Liabilities | 9953.87 | 9192.60 | 9011.87 | 8517.18 | 8065.52 | 8095.08 | 7909.87 | 7873.11 | 7738.27 | 6041.88 | 4230.80 | 4177.25 | 4049.30 | 4169.92 | 4171.63 | 4433.77 | 4277.85 | 4955.89 | 4245.56 | 3927.46 | 3470.33 | 3366.94 | 3096.92 | 3006.44 | 2684.53 | 2910.01 | 2244.01 | 2144.24 | 2011.36 | 2199.88 | 2093.93 | 2122.29 | 2125.73 | 2169.51 | 1920.79 | 1830.08 | 1786.48 | 1740.66 | 1507.97 | 1509.94 | 1551.93 | 1470.71 | 1300.09 | 1324.00 | 1368.84 | 1585.03 | 1351.15 | 1284.62 | 1309.85 | 1160.96 | 989.57 | 964.78 | 974.29 | NA | NA | NA | |
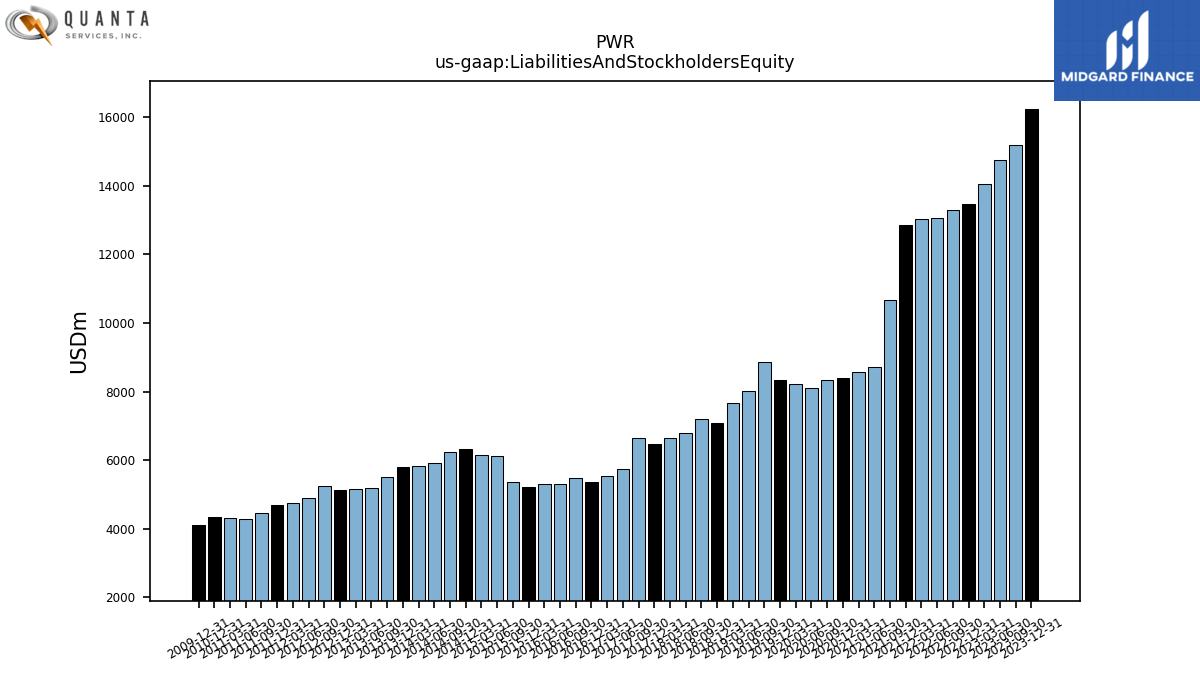
| Liabilities And Stockholders Equity | 16237.23 | 15188.45 | 14740.85 | 14039.14 | 13464.34 | 13296.65 | 13049.65 | 13015.10 | 12855.19 | 10675.72 | 8720.60 | 8557.41 | 8398.27 | 8325.49 | 8089.63 | 8228.94 | 8331.68 | 8865.09 | 8021.82 | 7652.52 | 7075.79 | 7191.17 | 6790.38 | 6653.40 | 6480.15 | 6640.25 | 5753.34 | 5543.05 | 5354.06 | 5476.47 | 5297.10 | 5295.52 | 5213.54 | 5373.42 | 6130.51 | 6140.83 | 6312.02 | 6229.29 | 5909.06 | 5826.62 | 5793.24 | 5494.97 | 5187.93 | 5154.82 | 5140.76 | 5255.27 | 4897.30 | 4755.33 | 4699.11 | 4463.95 | 4292.85 | 4324.56 | 4341.21 | NA | NA | NA | |
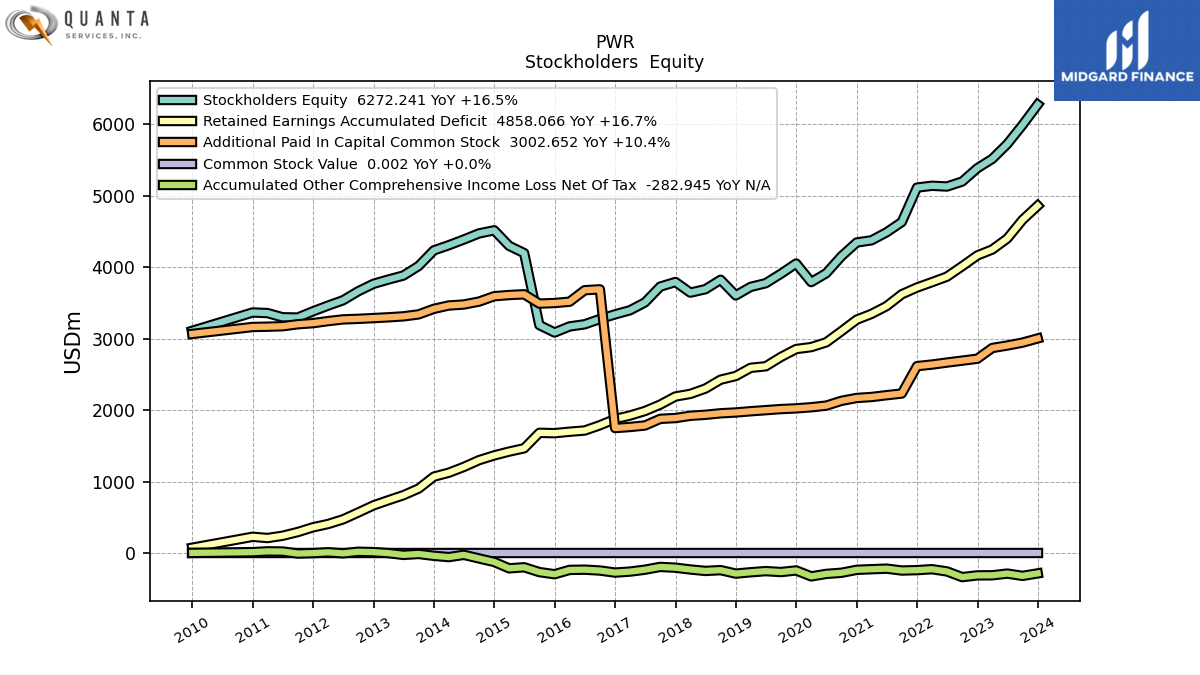
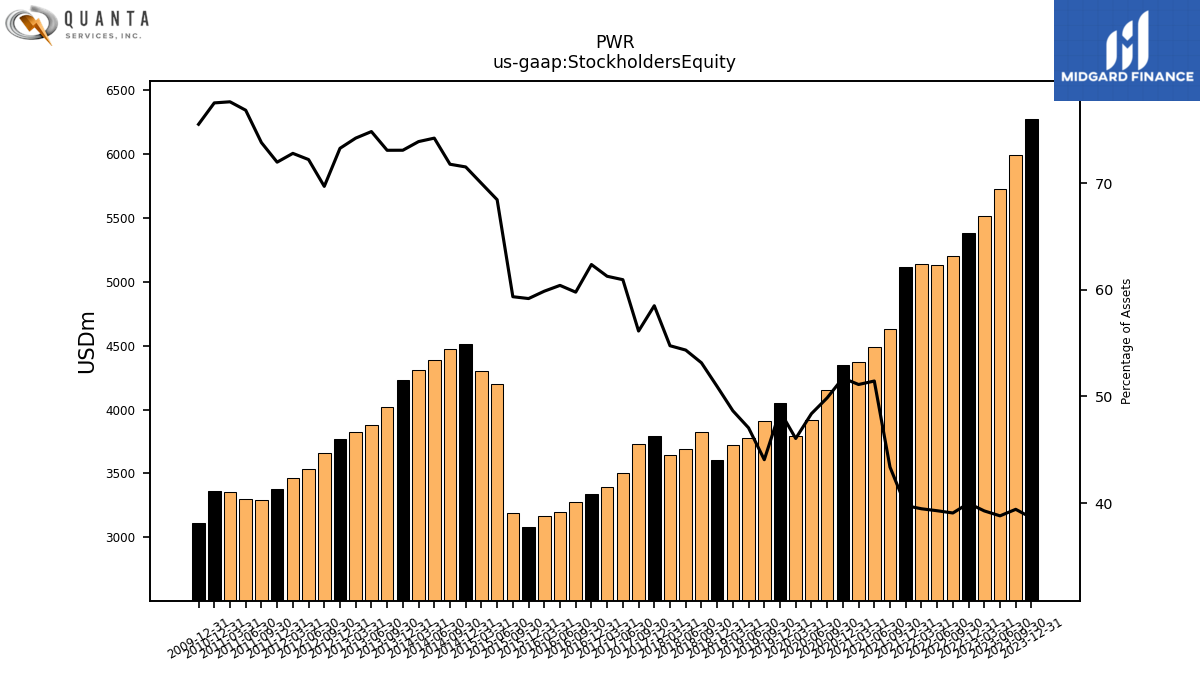
| Stockholders Equity | 6272.24 | 5987.31 | 5720.93 | 5513.42 | 5383.46 | 5196.05 | 5127.02 | 5137.52 | 5112.30 | 4630.71 | 4486.73 | 4374.94 | 4344.18 | 4151.95 | 3914.43 | 3790.49 | 4050.29 | 3907.41 | 3774.92 | 3723.74 | 3604.16 | 3822.82 | 3690.66 | 3643.35 | 3791.57 | 3727.53 | 3506.72 | 3396.34 | 3339.43 | 3273.94 | 3200.32 | 3170.55 | 3085.49 | 3189.37 | 4196.24 | 4297.49 | 4514.47 | 4471.04 | 4385.86 | 4305.81 | 4234.19 | 4015.93 | 3882.52 | 3826.13 | 3766.55 | 3662.90 | 3536.53 | 3461.61 | 3381.95 | 3294.70 | 3298.59 | 3357.12 | 3365.55 | NA | NA | NA |
| 2023-12-31 | 2023-09-30 | 2023-06-30 | 2023-03-31 | 2022-12-31 | 2022-09-30 | 2022-06-30 | 2022-03-31 | 2021-12-31 | 2021-09-30 | 2021-06-30 | 2021-03-31 | 2020-12-31 | 2020-09-30 | 2020-06-30 | 2020-03-31 | 2019-12-31 | 2019-09-30 | 2019-06-30 | 2019-03-31 | 2018-12-31 | 2018-09-30 | 2018-06-30 | 2018-03-31 | 2017-12-31 | 2017-09-30 | 2017-06-30 | 2017-03-31 | 2016-12-31 | 2016-09-30 | 2016-06-30 | 2016-03-31 | 2015-12-31 | 2015-09-30 | 2015-06-30 | 2015-03-31 | 2014-12-31 | 2014-09-30 | 2014-06-30 | 2014-03-31 | 2013-12-31 | 2013-09-30 | 2013-06-30 | 2013-03-31 | 2012-12-31 | 2012-09-30 | 2012-06-30 | 2012-03-31 | 2011-12-31 | 2011-09-30 | 2011-06-30 | 2011-03-31 | 2010-12-31 | 2010-09-30 | 2010-06-30 | 2010-03-31 | ||
|---|---|---|---|---|---|---|---|---|---|---|---|---|---|---|---|---|---|---|---|---|---|---|---|---|---|---|---|---|---|---|---|---|---|---|---|---|---|---|---|---|---|---|---|---|---|---|---|---|---|---|---|---|---|---|---|---|---|
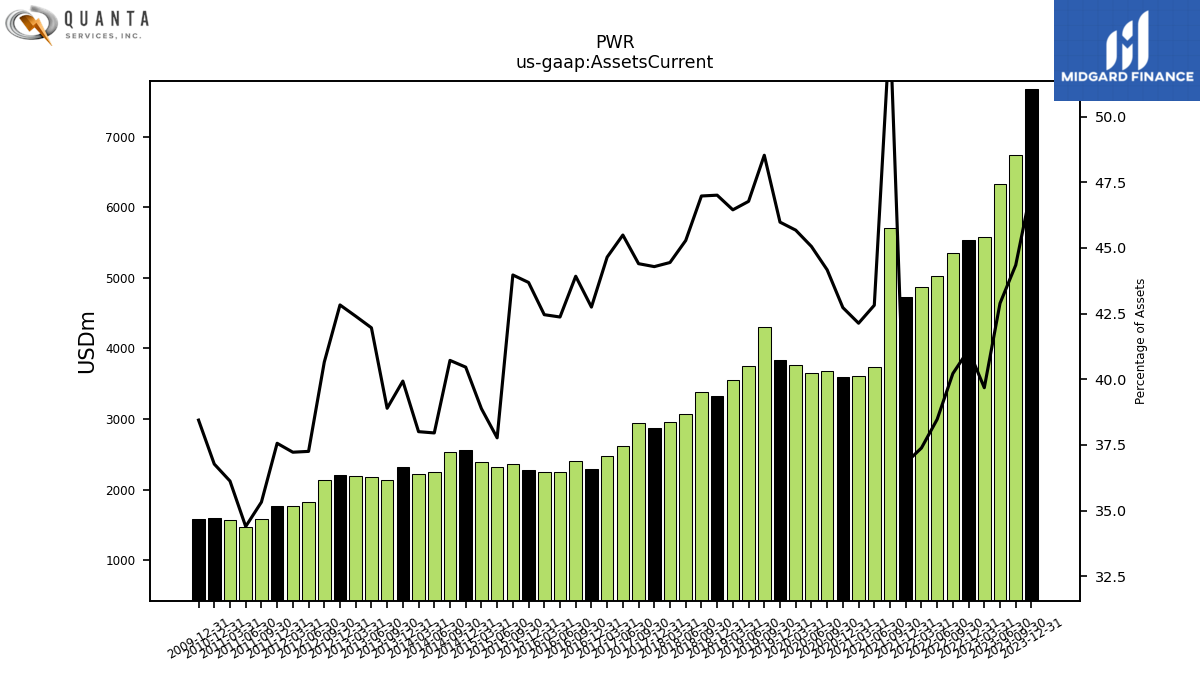
| Assets Current | 7676.90 | 6735.37 | 6322.39 | 5570.59 | 5536.07 | 5347.82 | 5020.86 | 4865.61 | 4732.58 | 5704.13 | 3733.93 | 3605.57 | 3588.39 | 3677.01 | 3644.76 | 3758.60 | 3830.99 | 4301.93 | 3751.93 | 3554.54 | 3326.10 | 3378.12 | 3074.84 | 2957.07 | 2869.91 | 2948.24 | 2617.20 | 2474.91 | 2288.74 | 2405.35 | 2244.39 | 2248.37 | 2277.52 | 2362.66 | 2315.57 | 2387.64 | 2553.98 | 2536.47 | 2242.93 | 2214.46 | 2313.32 | 2137.39 | 2176.83 | 2185.66 | 2201.73 | 2136.43 | 1824.50 | 1770.11 | 1765.15 | 1576.88 | 1476.58 | 1562.32 | 1596.36 | NA | NA | NA | |
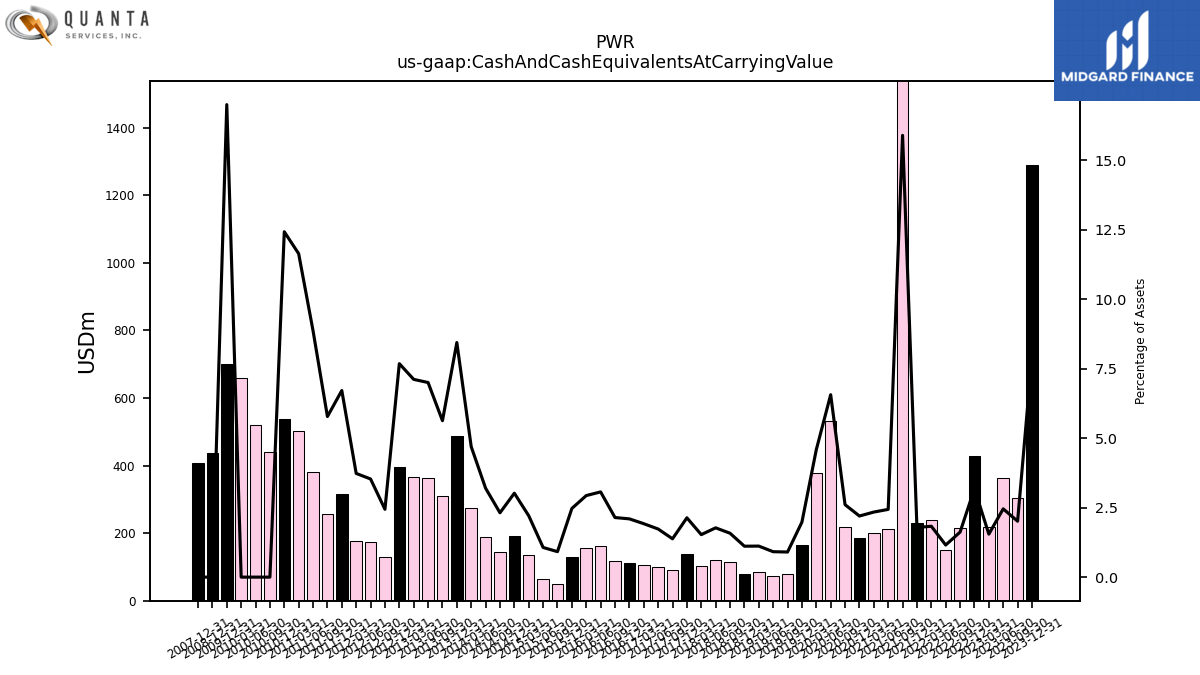
| Cash And Cash Equivalents At Carrying Value | 1290.25 | 305.36 | 361.97 | 217.12 | 428.50 | 215.40 | 150.65 | 238.26 | 229.10 | 1696.21 | 212.47 | 200.22 | 184.62 | 216.94 | 530.67 | 377.20 | 164.80 | 80.04 | 73.36 | 85.42 | 78.69 | 113.52 | 120.36 | 101.70 | 138.28 | 91.53 | 99.56 | 106.51 | 112.18 | 117.37 | 162.34 | 155.31 | 128.77 | 49.19 | 65.43 | 135.53 | 190.51 | 144.16 | 188.95 | 273.34 | 488.78 | 309.15 | 363.11 | 366.62 | 394.70 | 128.21 | 172.87 | 177.37 | 315.35 | 257.84 | 380.38 | 503.02 | 539.22 | 441.25 | 519.82 | 659.82 | |
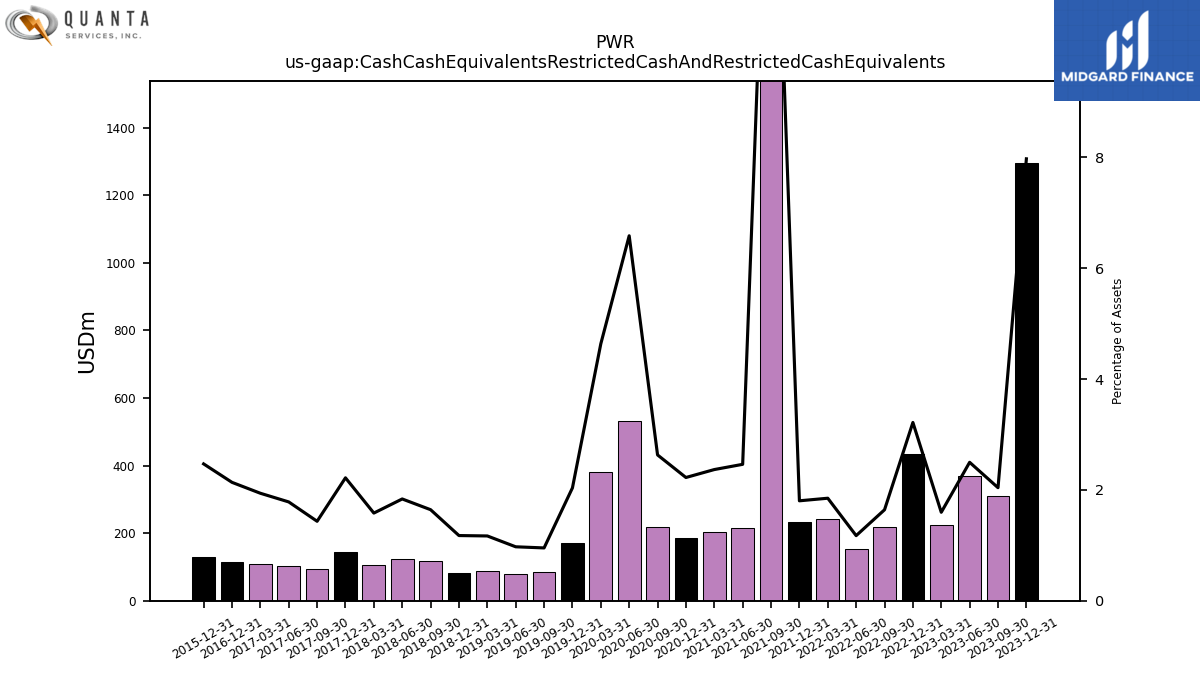
| Cash Cash Equivalents Restricted Cash And Restricted Cash Equivalents | 1295.04 | 309.89 | 368.31 | 224.12 | 433.21 | 218.34 | 153.37 | 240.84 | 231.89 | 1699.10 | 214.72 | 202.62 | 186.81 | 219.10 | 532.85 | 381.64 | 169.75 | 84.51 | 78.12 | 89.49 | 83.26 | 118.17 | 124.74 | 105.28 | 143.78 | 95.23 | 102.61 | 107.53 | 114.41 | NA | NA | NA | 128.77 | NA | NA | NA | NA | NA | NA | NA | NA | NA | NA | NA | NA | NA | NA | NA | NA | NA | NA | NA | NA | NA | NA | NA | |
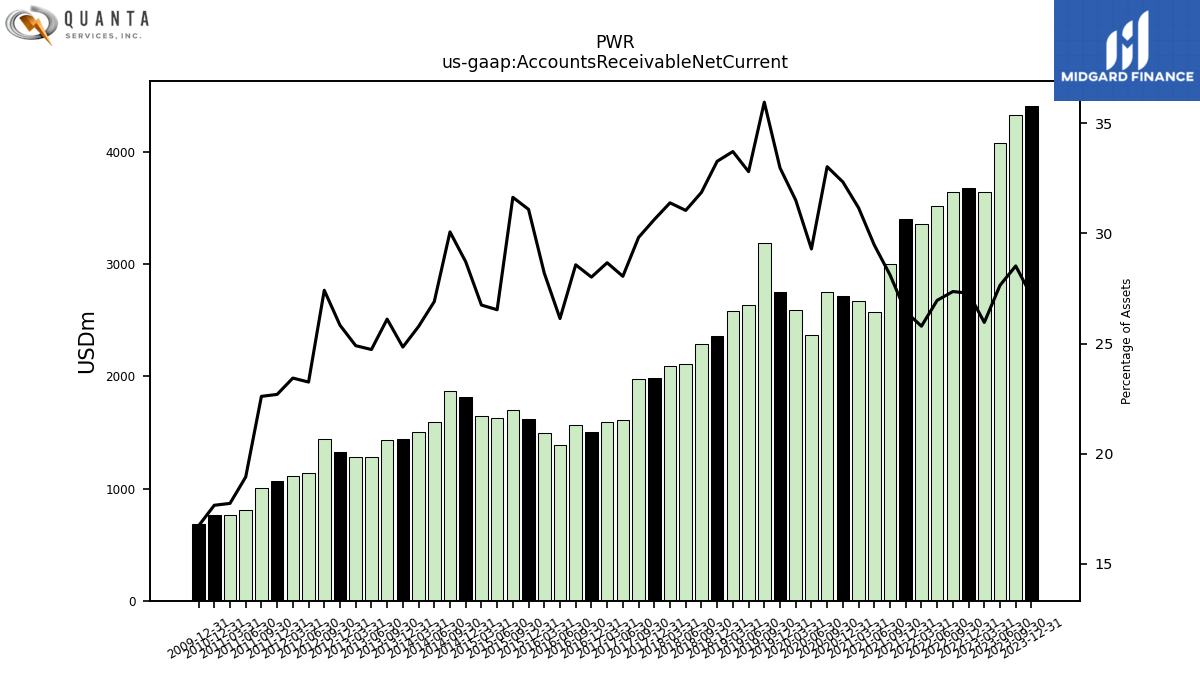
| Accounts Receivable Net Current | 4410.83 | 4332.50 | 4075.21 | 3644.62 | 3674.53 | 3638.36 | 3518.58 | 3356.57 | 3400.32 | 3002.17 | 2570.46 | 2666.98 | 2716.08 | 2750.27 | 2370.29 | 2593.28 | 2747.91 | 3188.33 | 2632.00 | 2580.66 | 2354.74 | 2291.61 | 2108.32 | 2088.68 | 1985.08 | 1980.24 | 1614.11 | 1589.26 | 1500.12 | 1565.08 | 1384.55 | 1493.26 | 1621.13 | 1700.31 | 1626.83 | 1642.67 | 1812.54 | 1873.24 | 1589.93 | 1501.86 | 1439.12 | 1434.70 | 1282.95 | 1283.74 | 1328.08 | 1441.02 | 1138.72 | 1114.25 | 1066.27 | 1008.94 | 813.06 | 767.13 | 766.39 | NA | NA | NA | |
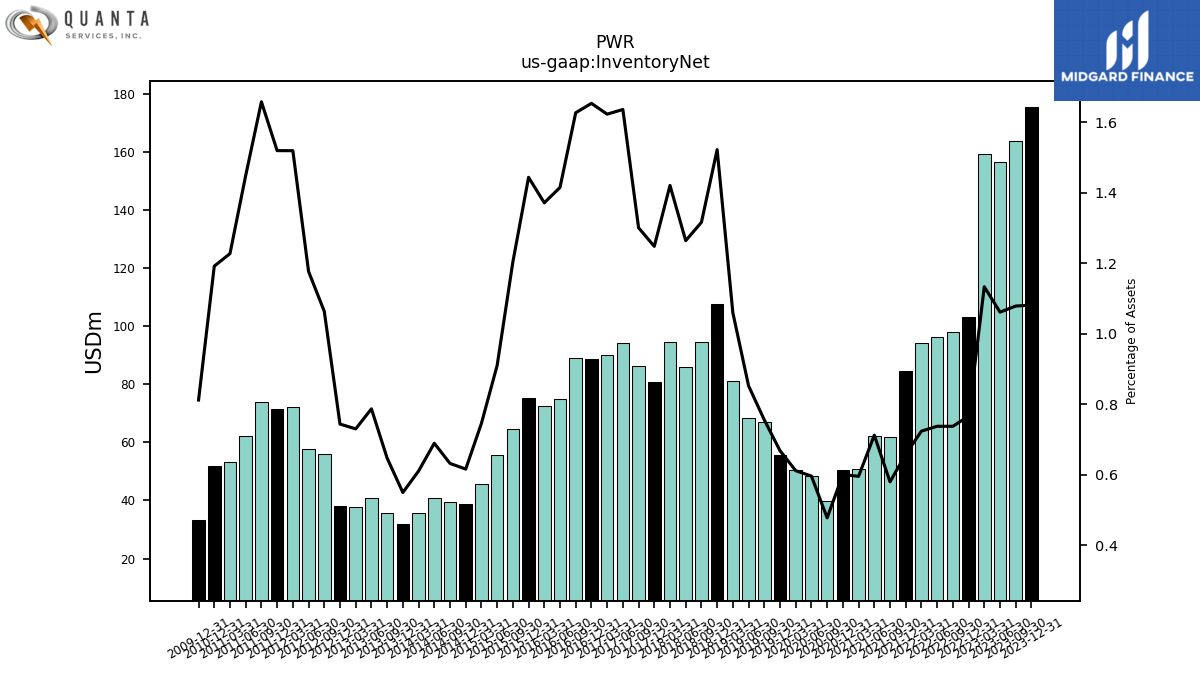
| Inventory Net | 175.66 | 163.88 | 156.50 | 159.16 | 103.27 | 98.12 | 96.31 | 94.26 | 84.66 | 61.96 | 62.15 | 51.01 | 50.47 | 39.82 | 48.27 | 50.37 | 55.72 | 67.04 | 68.40 | 81.12 | 107.73 | 94.67 | 85.86 | 94.55 | 80.89 | 86.39 | 94.15 | 89.97 | 88.55 | 89.11 | 74.98 | 72.64 | 75.28 | 64.69 | 55.81 | 45.82 | 38.92 | 39.41 | 40.77 | 35.60 | 31.88 | 35.59 | 40.85 | 37.67 | 38.26 | 55.92 | 57.65 | 72.26 | 71.42 | 74.02 | 62.22 | 53.09 | 51.75 | NA | NA | NA | |
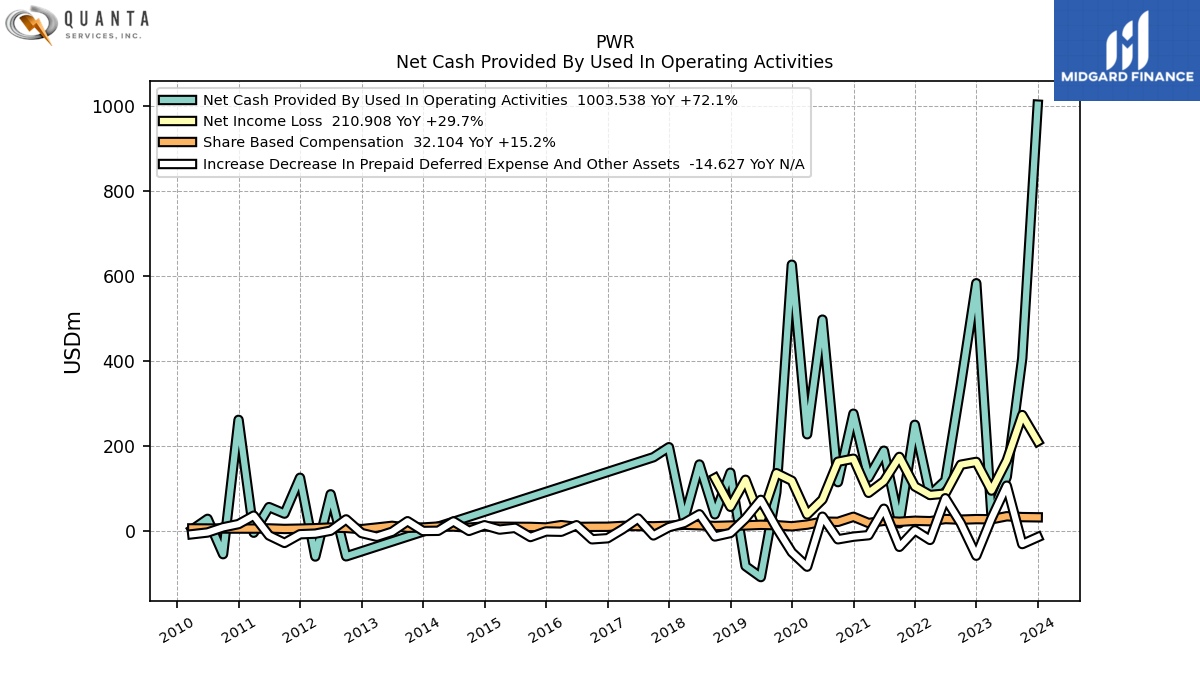
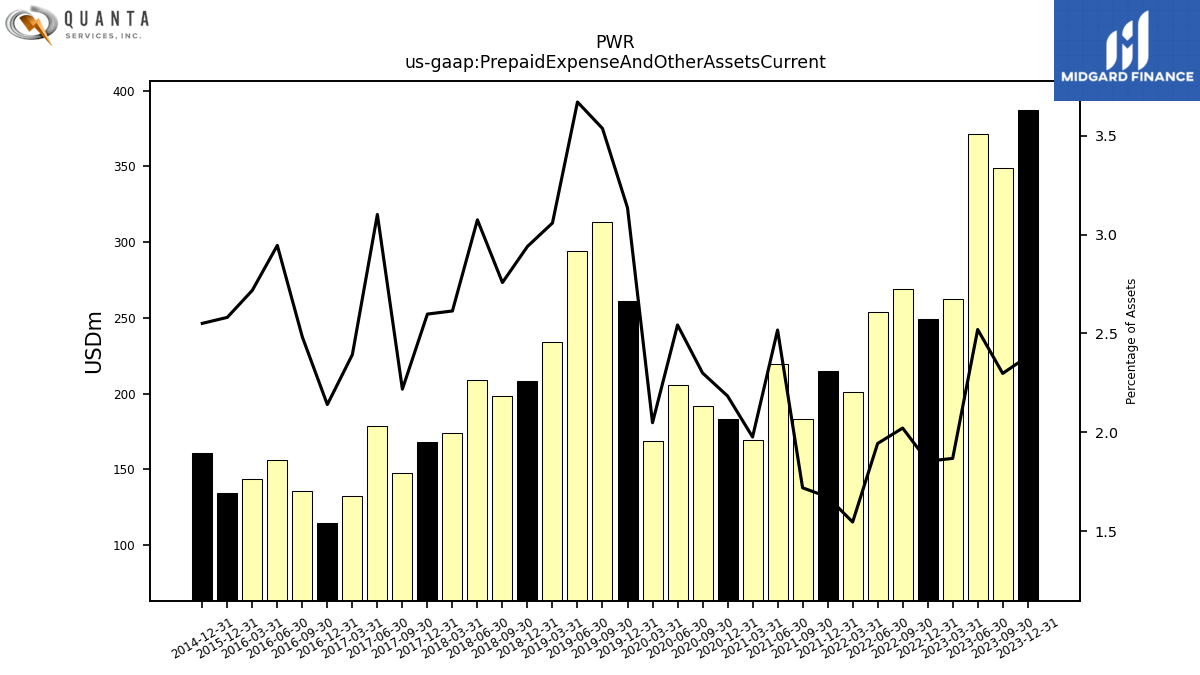
| Prepaid Expense And Other Assets Current | 387.11 | 349.01 | 371.48 | 262.23 | 249.57 | 268.77 | 253.59 | 201.19 | 215.05 | 183.51 | 219.54 | 169.10 | 183.38 | 191.50 | 205.72 | 168.56 | 261.29 | 313.60 | 294.51 | 234.09 | 208.06 | 198.31 | 208.80 | 173.91 | 168.36 | 147.29 | 178.49 | 132.64 | 114.59 | 135.95 | 156.04 | 143.94 | 134.59 | NA | NA | NA | 161.02 | NA | NA | NA | NA | NA | NA | NA | NA | NA | NA | NA | NA | NA | NA | NA | NA | NA | NA | NA |
| 2023-12-31 | 2023-09-30 | 2023-06-30 | 2023-03-31 | 2022-12-31 | 2022-09-30 | 2022-06-30 | 2022-03-31 | 2021-12-31 | 2021-09-30 | 2021-06-30 | 2021-03-31 | 2020-12-31 | 2020-09-30 | 2020-06-30 | 2020-03-31 | 2019-12-31 | 2019-09-30 | 2019-06-30 | 2019-03-31 | 2018-12-31 | 2018-09-30 | 2018-06-30 | 2018-03-31 | 2017-12-31 | 2017-09-30 | 2017-06-30 | 2017-03-31 | 2016-12-31 | 2016-09-30 | 2016-06-30 | 2016-03-31 | 2015-12-31 | 2015-09-30 | 2015-06-30 | 2015-03-31 | 2014-12-31 | 2014-09-30 | 2014-06-30 | 2014-03-31 | 2013-12-31 | 2013-09-30 | 2013-06-30 | 2013-03-31 | 2012-12-31 | 2012-09-30 | 2012-06-30 | 2012-03-31 | 2011-12-31 | 2011-09-30 | 2011-06-30 | 2011-03-31 | 2010-12-31 | 2010-09-30 | 2010-06-30 | 2010-03-31 | ||
|---|---|---|---|---|---|---|---|---|---|---|---|---|---|---|---|---|---|---|---|---|---|---|---|---|---|---|---|---|---|---|---|---|---|---|---|---|---|---|---|---|---|---|---|---|---|---|---|---|---|---|---|---|---|---|---|---|---|
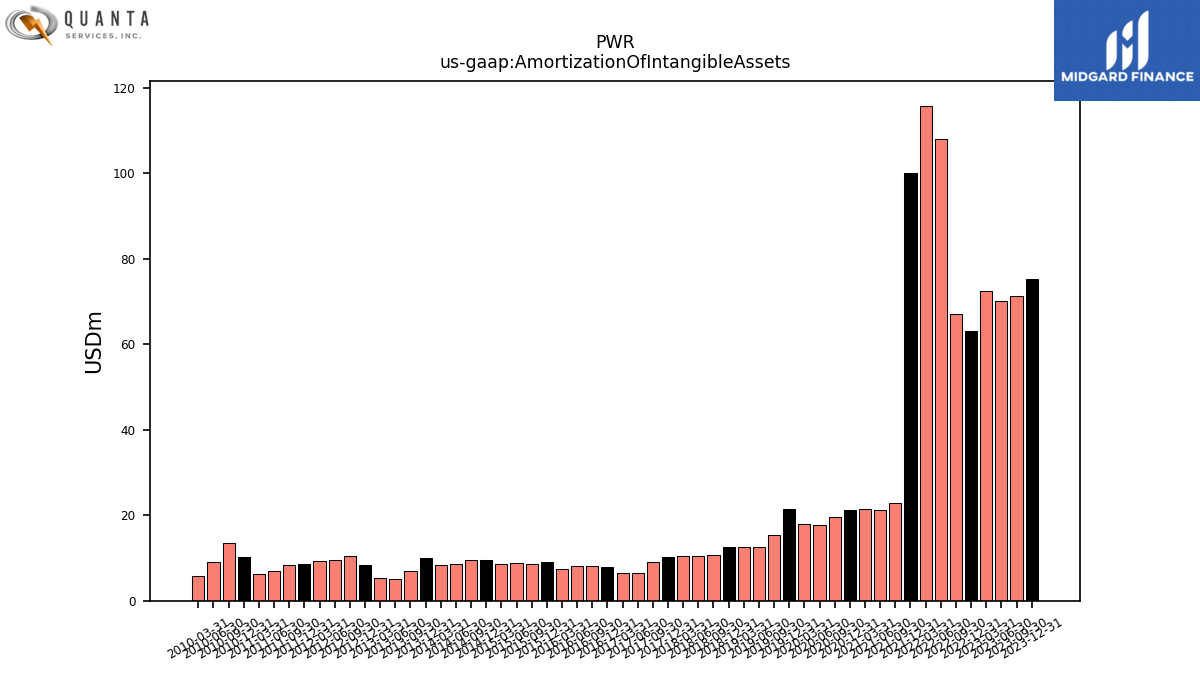
| Amortization Of Intangible Assets | 75.22 | 71.36 | 70.03 | 72.40 | 63.13 | 67.15 | 107.94 | 115.75 | 99.95 | 22.77 | 21.29 | 21.36 | 21.33 | 19.69 | 17.78 | 17.91 | 21.55 | 15.26 | 12.61 | 12.67 | 12.46 | 10.62 | 10.51 | 10.40 | 10.20 | 9.00 | 6.49 | 6.56 | 7.96 | 8.09 | 8.14 | 7.50 | 9.17 | 8.65 | 8.73 | 8.71 | 9.51 | 9.54 | 8.62 | 8.24 | 10.11 | 7.03 | 5.08 | 5.30 | 8.24 | 10.50 | 9.55 | 9.39 | 8.52 | 8.29 | 6.87 | 6.27 | 10.23 | 13.40 | 9.09 | 5.85 | |
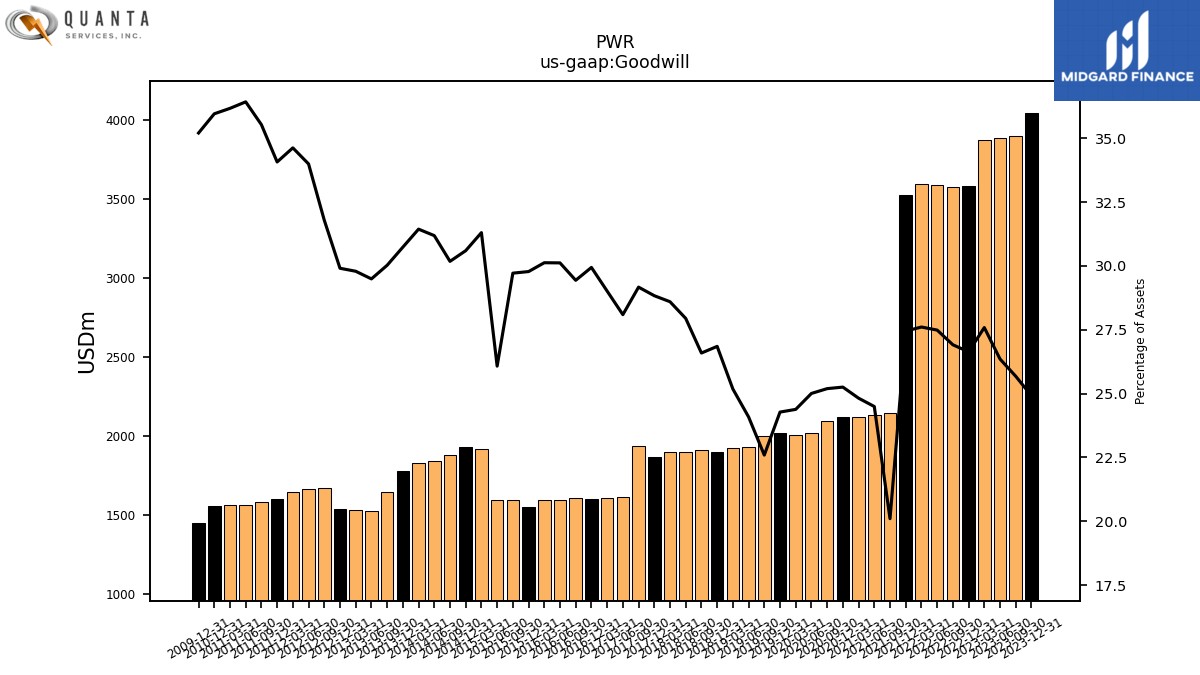
| Goodwill | 4045.91 | 3900.50 | 3885.10 | 3873.10 | 3586.74 | 3578.57 | 3587.22 | 3593.32 | 3528.89 | 2145.96 | 2136.13 | 2124.09 | 2121.01 | 2097.64 | 2022.99 | 2006.46 | 2022.67 | 2002.91 | 1932.30 | 1927.03 | 1899.88 | 1912.14 | 1897.66 | 1902.87 | 1868.60 | 1937.05 | 1616.32 | 1608.38 | 1603.17 | 1612.24 | 1595.56 | 1595.40 | 1552.66 | 1596.93 | 1598.65 | 1922.48 | 1931.48 | 1880.09 | 1842.99 | 1832.05 | 1780.72 | 1650.01 | 1530.14 | 1535.80 | 1537.64 | 1670.82 | 1664.96 | 1646.62 | 1601.21 | 1586.25 | 1563.87 | 1564.39 | 1561.15 | NA | NA | NA | |
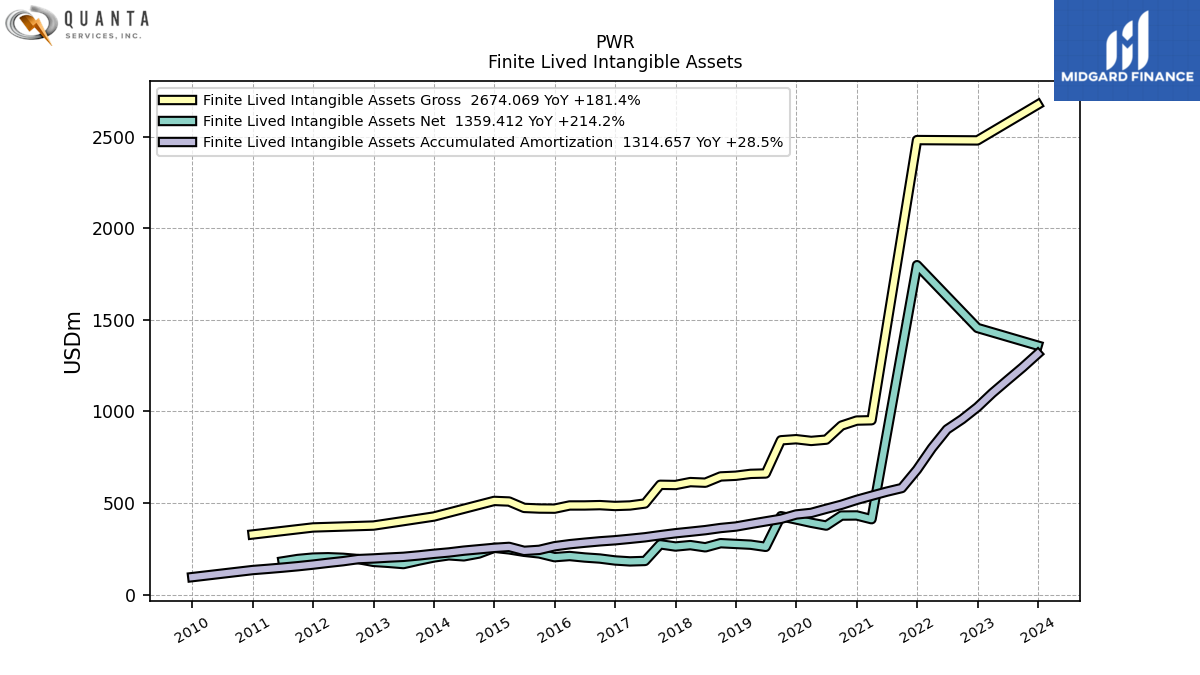
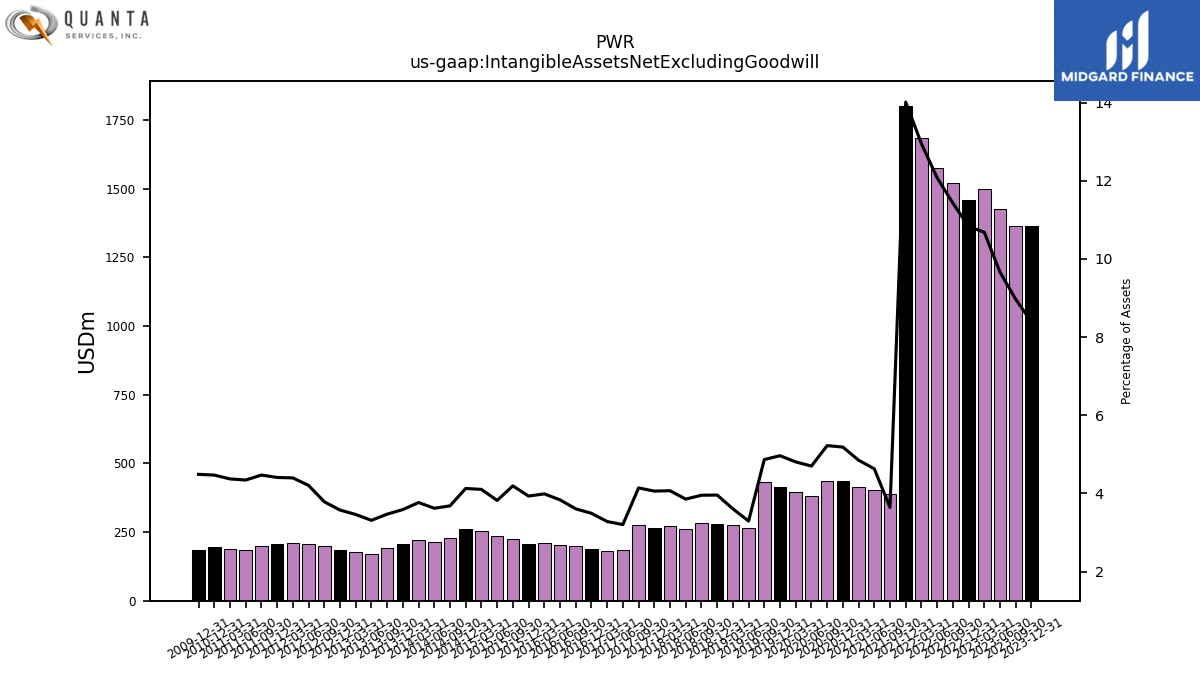
| Intangible Assets Net Excluding Goodwill | 1362.41 | 1362.08 | 1424.37 | 1499.57 | 1458.63 | 1519.37 | 1575.71 | 1685.26 | 1801.18 | 389.00 | 403.93 | 415.12 | 435.65 | 434.92 | 380.31 | 395.64 | 413.73 | 431.56 | 264.28 | 276.07 | 280.18 | 284.41 | 261.82 | 270.83 | 263.18 | 275.02 | 184.38 | 181.93 | 187.02 | 197.56 | 203.26 | 211.30 | 205.07 | 225.41 | 234.30 | 252.06 | 260.59 | 229.46 | 214.04 | 219.57 | 207.88 | 190.75 | 171.87 | 178.51 | 183.84 | 199.09 | 206.02 | 209.14 | 207.22 | 199.58 | 186.48 | 189.09 | 194.07 | NA | NA | NA | |
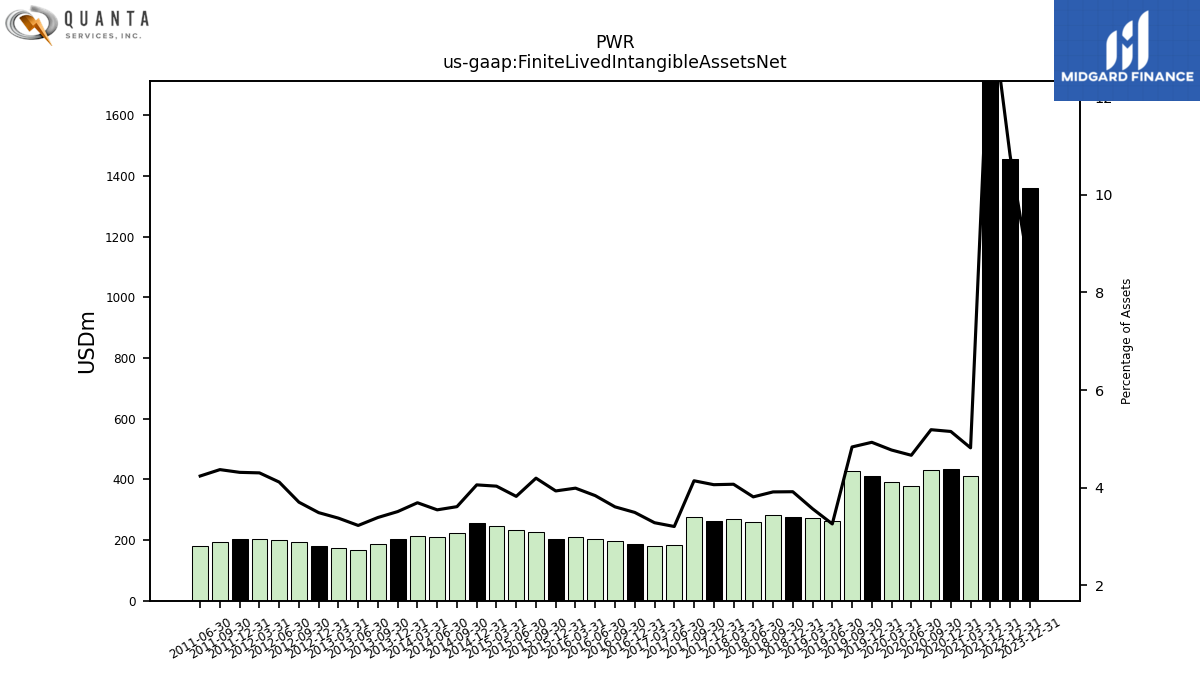
| Finite Lived Intangible Assets Net | 1359.41 | NA | NA | NA | 1455.63 | NA | NA | NA | 1798.18 | NA | NA | 412.12 | 432.65 | 431.92 | 377.31 | 392.64 | 410.73 | 428.56 | 261.28 | 273.07 | 277.18 | 281.41 | 258.82 | 270.83 | 263.18 | 275.02 | 184.38 | 181.93 | 187.02 | 197.56 | 203.26 | 211.30 | 205.07 | 225.41 | 234.30 | 247.56 | 256.09 | 224.96 | 209.54 | 215.07 | 203.38 | 186.25 | 167.37 | 174.01 | 179.34 | 194.59 | 201.52 | 204.64 | 202.72 | 195.08 | 181.98 | NA | NA | NA | NA | NA | |
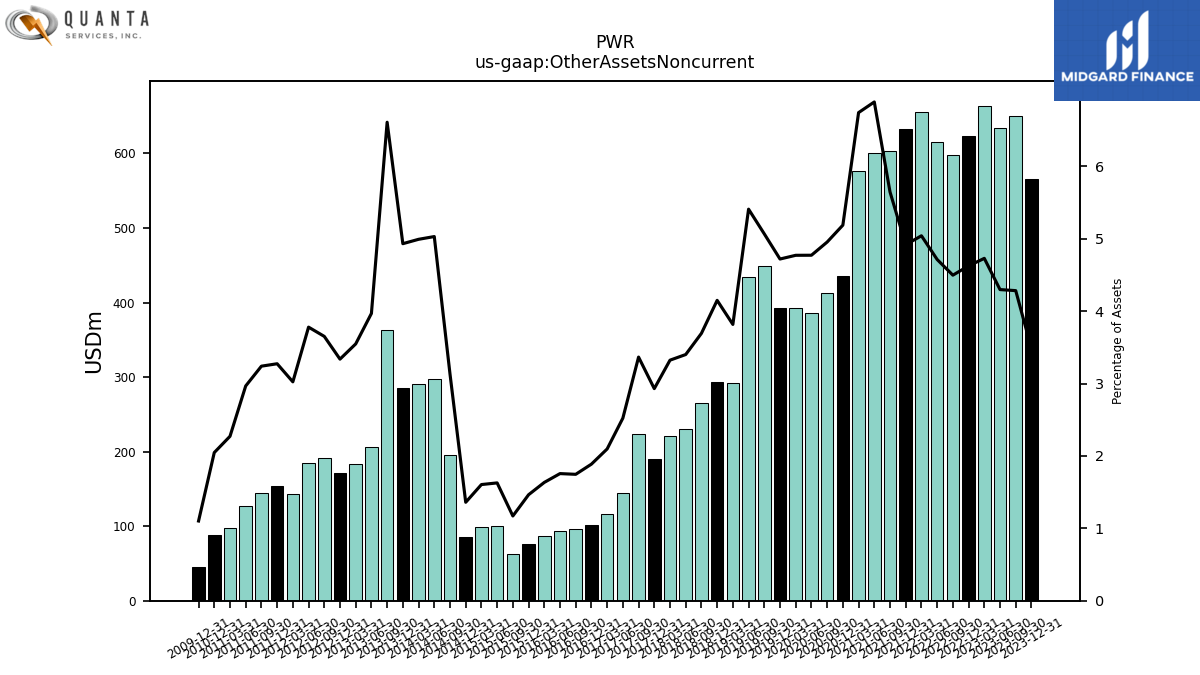
| Other Assets Noncurrent | 565.62 | 650.59 | 633.57 | 663.95 | 622.74 | 597.95 | 615.12 | 656.13 | 632.24 | 602.84 | 600.82 | 576.98 | 435.71 | 412.49 | 386.07 | 392.65 | 393.26 | 449.22 | 433.87 | 292.09 | 293.59 | 265.61 | 230.93 | 221.09 | 189.87 | 223.49 | 145.12 | 116.22 | 101.03 | 95.64 | 93.03 | 86.56 | 76.33 | 62.91 | 99.79 | 98.56 | 85.84 | 195.14 | 297.24 | 290.89 | 285.73 | 363.19 | 205.88 | 182.87 | 171.57 | 191.90 | 185.08 | 143.79 | 153.83 | 144.64 | 127.36 | 98.23 | 88.86 | NA | NA | NA |
| 2023-12-31 | 2023-09-30 | 2023-06-30 | 2023-03-31 | 2022-12-31 | 2022-09-30 | 2022-06-30 | 2022-03-31 | 2021-12-31 | 2021-09-30 | 2021-06-30 | 2021-03-31 | 2020-12-31 | 2020-09-30 | 2020-06-30 | 2020-03-31 | 2019-12-31 | 2019-09-30 | 2019-06-30 | 2019-03-31 | 2018-12-31 | 2018-09-30 | 2018-06-30 | 2018-03-31 | 2017-12-31 | 2017-09-30 | 2017-06-30 | 2017-03-31 | 2016-12-31 | 2016-09-30 | 2016-06-30 | 2016-03-31 | 2015-12-31 | 2015-09-30 | 2015-06-30 | 2015-03-31 | 2014-12-31 | 2014-09-30 | 2014-06-30 | 2014-03-31 | 2013-12-31 | 2013-09-30 | 2013-06-30 | 2013-03-31 | 2012-12-31 | 2012-09-30 | 2012-06-30 | 2012-03-31 | 2011-12-31 | 2011-09-30 | 2011-06-30 | 2011-03-31 | 2010-12-31 | 2010-09-30 | 2010-06-30 | 2010-03-31 | ||
|---|---|---|---|---|---|---|---|---|---|---|---|---|---|---|---|---|---|---|---|---|---|---|---|---|---|---|---|---|---|---|---|---|---|---|---|---|---|---|---|---|---|---|---|---|---|---|---|---|---|---|---|---|---|---|---|---|---|
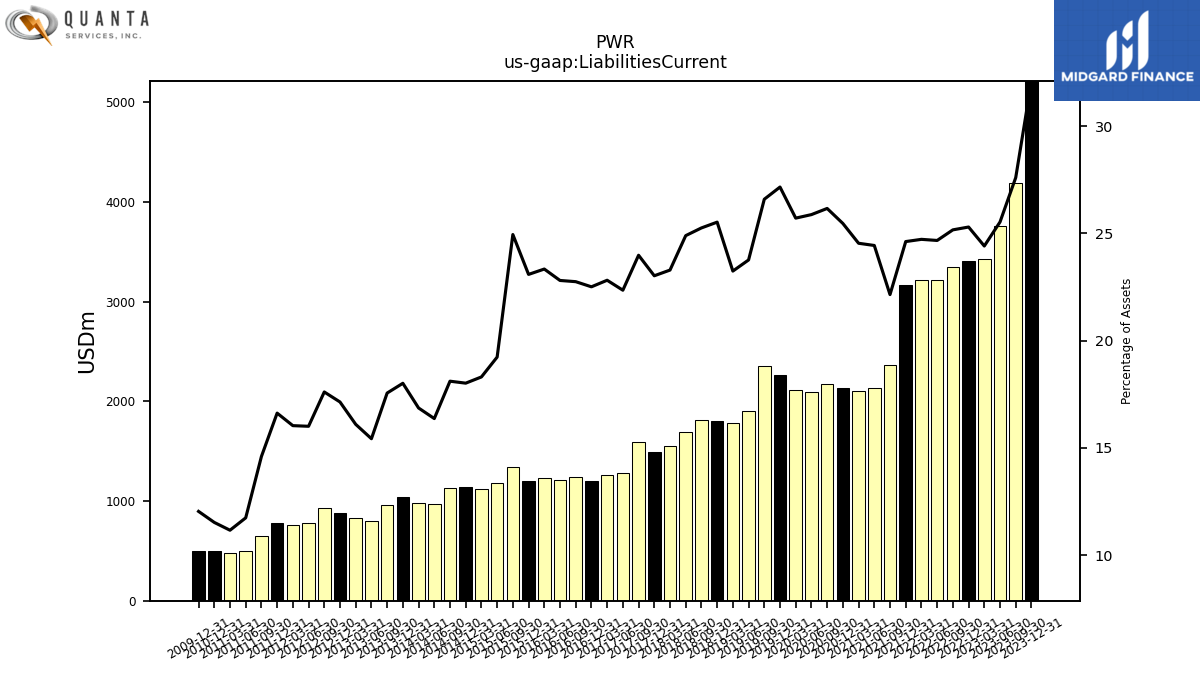
| Liabilities Current | 5213.12 | 4192.24 | 3763.67 | 3427.32 | 3406.19 | 3346.22 | 3219.55 | 3217.82 | 3164.96 | 2364.55 | 2131.13 | 2100.06 | 2138.56 | 2178.27 | 2093.36 | 2115.91 | 2263.05 | 2357.52 | 1906.23 | 1778.74 | 1806.13 | 1816.18 | 1690.57 | 1549.64 | 1492.07 | 1592.49 | 1286.02 | 1264.74 | 1205.23 | 1245.91 | 1208.09 | 1235.91 | 1203.74 | 1340.54 | 1179.15 | 1124.31 | 1137.33 | 1128.13 | 967.20 | 982.48 | 1043.52 | 964.79 | 800.41 | 829.89 | 881.18 | 925.35 | 783.97 | 762.66 | 781.08 | 651.71 | 503.96 | 482.71 | 500.39 | NA | NA | NA | |
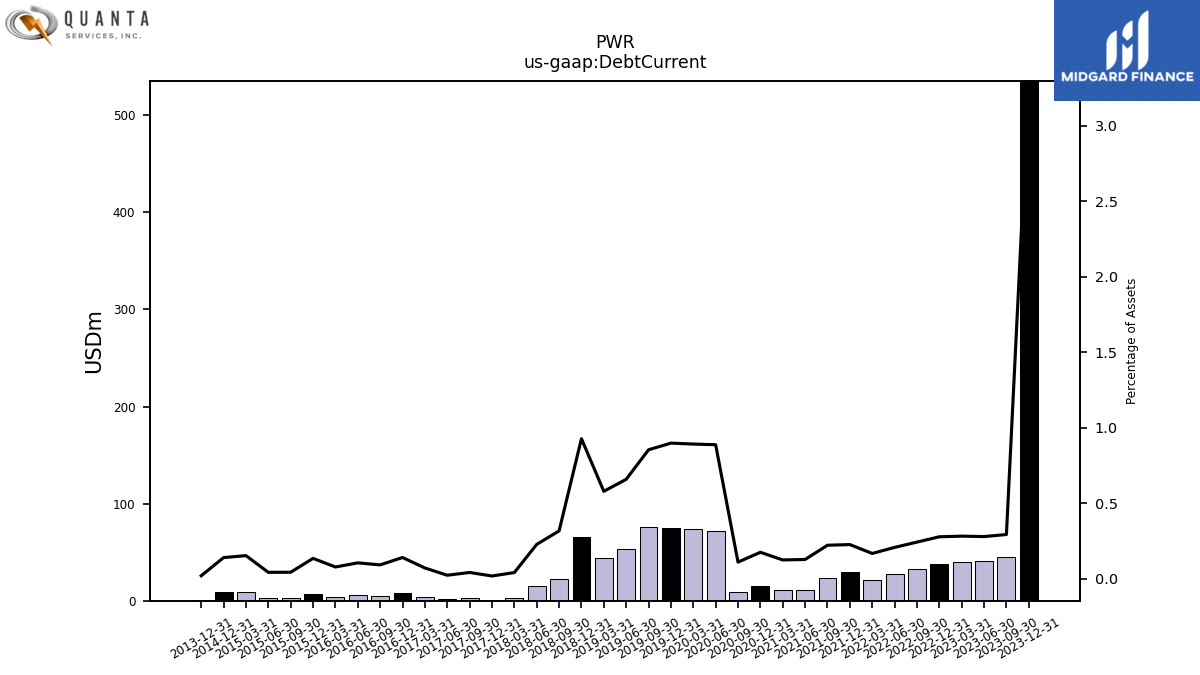
| Debt Current | 535.20 | 44.57 | 41.25 | 39.69 | 37.49 | 32.34 | 27.16 | 21.86 | 29.17 | 23.75 | 11.18 | 10.71 | 14.76 | 9.22 | 71.84 | 73.43 | 74.87 | 75.75 | 52.86 | 44.34 | 65.65 | 22.81 | 15.50 | 2.77 | 1.22 | 2.80 | 1.38 | 3.99 | 7.56 | 5.06 | 5.60 | 4.15 | 7.07 | 2.35 | 2.64 | 9.44 | 8.88 | NA | NA | NA | 1.18 | NA | NA | NA | NA | NA | NA | NA | NA | NA | NA | NA | NA | NA | NA | NA | |
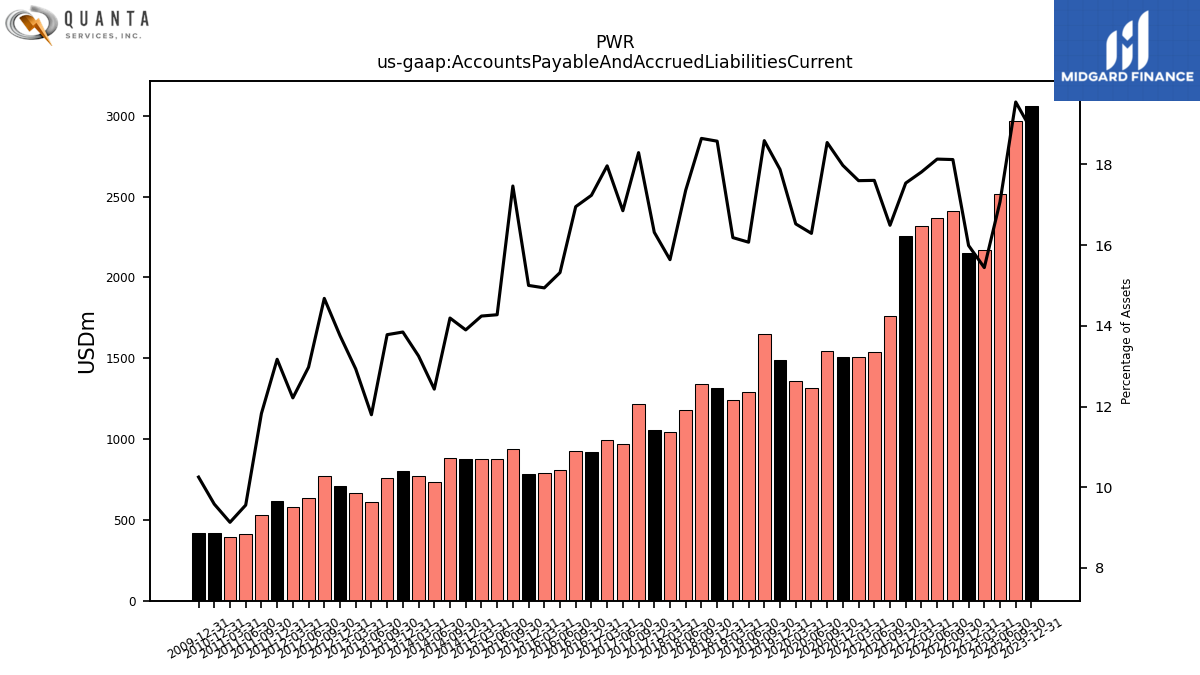
| Accounts Payable And Accrued Liabilities Current | 3061.24 | 2969.09 | 2516.91 | 2168.17 | 2153.13 | 2409.60 | 2366.34 | 2318.39 | 2254.67 | 1760.79 | 1535.33 | 1506.03 | 1509.79 | 1543.84 | 1317.98 | 1360.01 | 1489.56 | 1648.08 | 1289.39 | 1238.73 | 1314.52 | 1340.88 | 1178.98 | 1040.66 | 1057.46 | 1214.74 | 969.65 | 995.91 | 922.82 | 928.49 | 811.52 | 791.21 | 782.13 | 938.53 | 875.15 | 874.63 | 877.34 | 884.17 | 734.60 | 772.18 | 802.18 | 757.27 | 612.00 | 666.65 | 707.28 | 771.51 | 635.47 | 580.83 | 618.92 | 527.94 | 410.26 | 394.85 | 415.95 | NA | NA | NA | |
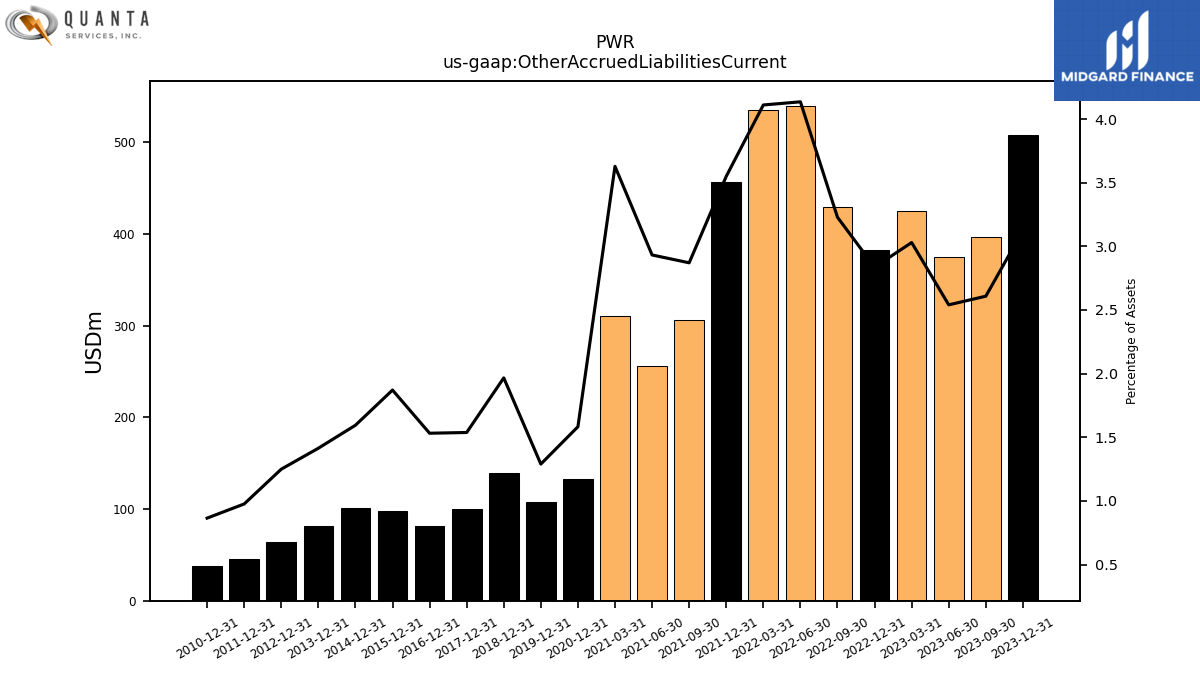
| Other Accrued Liabilities Current | 507.43 | 396.17 | 374.47 | 425.37 | 382.00 | 429.29 | 539.70 | 535.04 | 456.39 | 306.46 | 255.72 | 310.52 | 132.91 | NA | NA | NA | 107.41 | NA | NA | NA | 139.14 | NA | NA | NA | 99.62 | NA | NA | NA | 82.00 | NA | NA | NA | 97.53 | NA | NA | NA | 100.64 | NA | NA | NA | 81.90 | NA | NA | NA | 64.22 | NA | NA | NA | 45.85 | NA | NA | NA | 37.53 | NA | NA | NA | |
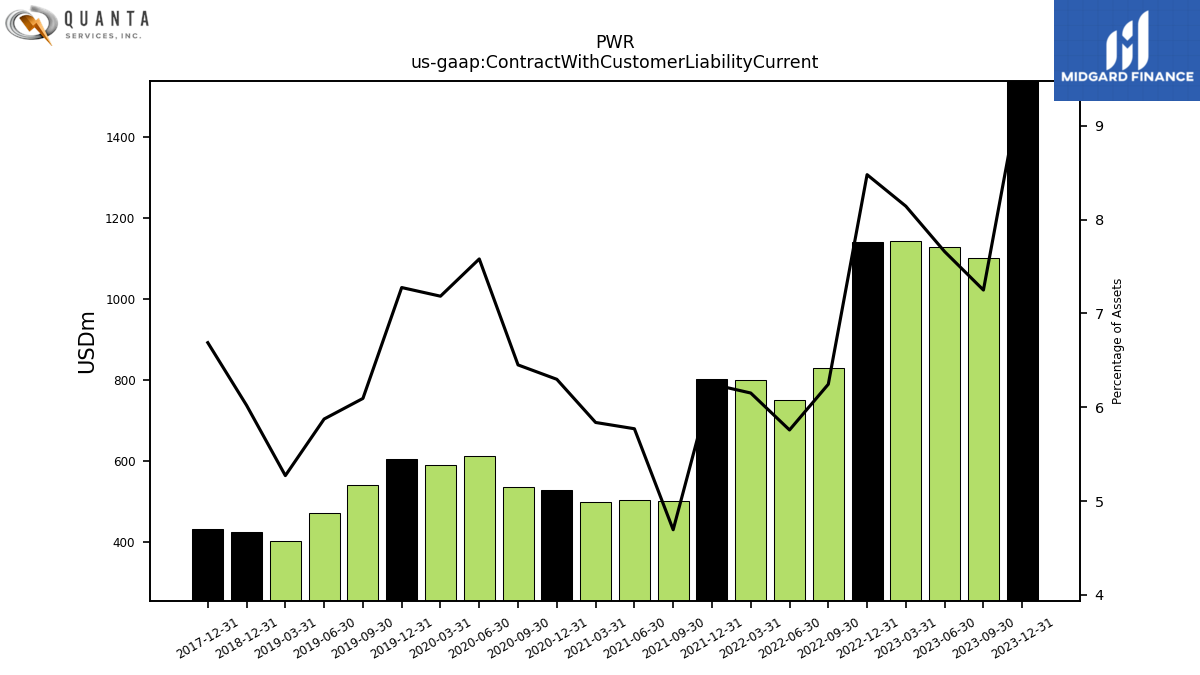
| Contract With Customer Liability Current | 1538.68 | 1100.93 | 1128.86 | 1143.04 | 1141.52 | 830.35 | 751.33 | 800.58 | 802.87 | 501.14 | 503.22 | 499.53 | 528.86 | 537.05 | 613.19 | 591.09 | 606.15 | 540.19 | 471.21 | 403.37 | 425.96 | NA | NA | NA | 433.39 | NA | NA | NA | NA | NA | NA | NA | NA | NA | NA | NA | NA | NA | NA | NA | NA | NA | NA | NA | NA | NA | NA | NA | NA | NA | NA | NA | NA | NA | NA | NA |
| 2023-12-31 | 2023-09-30 | 2023-06-30 | 2023-03-31 | 2022-12-31 | 2022-09-30 | 2022-06-30 | 2022-03-31 | 2021-12-31 | 2021-09-30 | 2021-06-30 | 2021-03-31 | 2020-12-31 | 2020-09-30 | 2020-06-30 | 2020-03-31 | 2019-12-31 | 2019-09-30 | 2019-06-30 | 2019-03-31 | 2018-12-31 | 2018-09-30 | 2018-06-30 | 2018-03-31 | 2017-12-31 | 2017-09-30 | 2017-06-30 | 2017-03-31 | 2016-12-31 | 2016-09-30 | 2016-06-30 | 2016-03-31 | 2015-12-31 | 2015-09-30 | 2015-06-30 | 2015-03-31 | 2014-12-31 | 2014-09-30 | 2014-06-30 | 2014-03-31 | 2013-12-31 | 2013-09-30 | 2013-06-30 | 2013-03-31 | 2012-12-31 | 2012-09-30 | 2012-06-30 | 2012-03-31 | 2011-12-31 | 2011-09-30 | 2011-06-30 | 2011-03-31 | 2010-12-31 | 2010-09-30 | 2010-06-30 | 2010-03-31 | ||
|---|---|---|---|---|---|---|---|---|---|---|---|---|---|---|---|---|---|---|---|---|---|---|---|---|---|---|---|---|---|---|---|---|---|---|---|---|---|---|---|---|---|---|---|---|---|---|---|---|---|---|---|---|---|---|---|---|---|
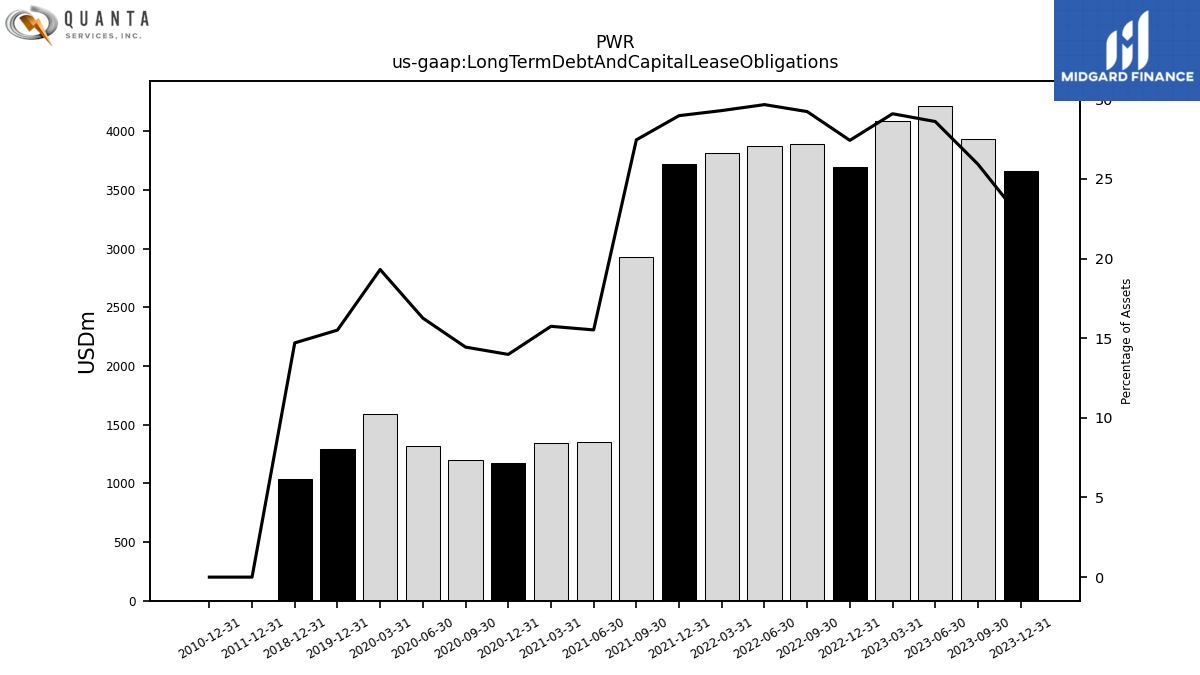
| Long Term Debt And Capital Lease Obligations | 3663.50 | 3937.35 | 4216.52 | 4084.41 | 3692.43 | 3886.52 | 3871.29 | 3812.41 | 3724.47 | 2930.91 | 1353.54 | 1347.56 | 1174.29 | 1202.42 | 1315.56 | 1589.32 | 1292.19 | NA | NA | NA | 1040.53 | NA | NA | NA | NA | NA | NA | NA | NA | NA | NA | NA | NA | NA | NA | NA | NA | NA | NA | NA | NA | NA | NA | NA | NA | NA | NA | NA | 0.00 | NA | NA | NA | 0.00 | NA | NA | NA | |
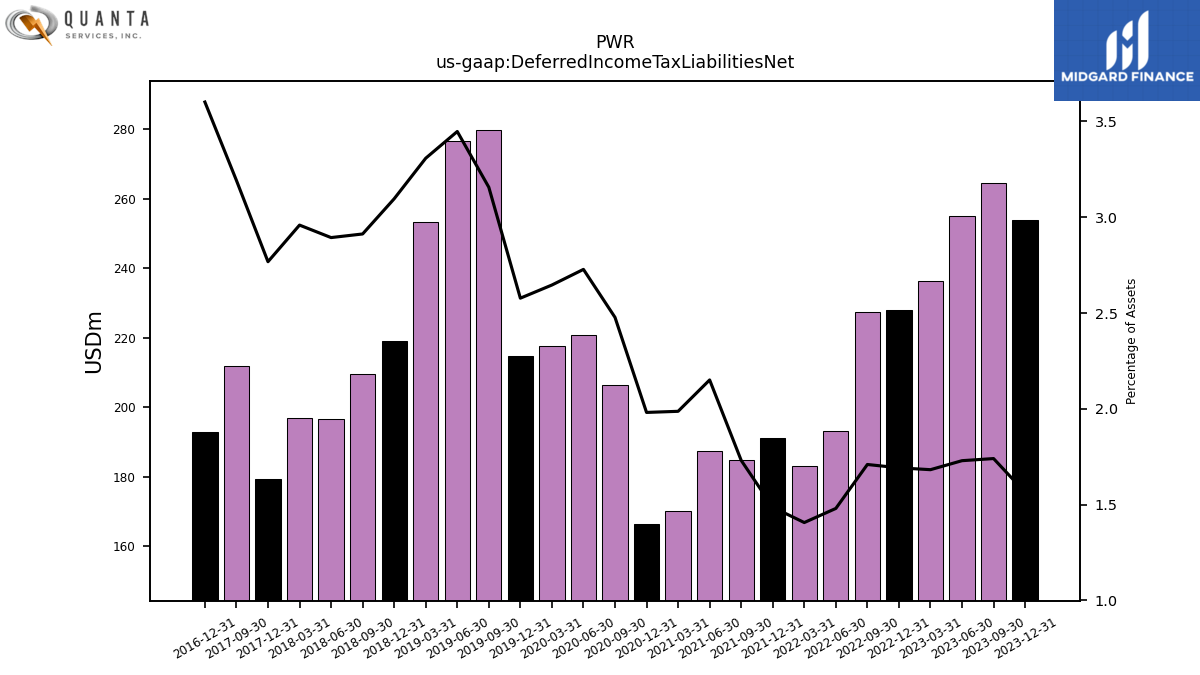
| Deferred Income Tax Liabilities Net | 254.00 | 264.38 | 254.95 | 236.22 | 227.86 | 227.33 | 193.17 | 183.08 | 191.10 | 184.83 | 187.58 | 170.06 | 166.41 | 206.28 | 220.69 | 217.78 | 214.78 | 279.86 | 276.57 | 253.16 | 219.12 | 209.47 | 196.52 | 196.89 | 179.38 | 211.98 | NA | NA | 192.83 | NA | NA | NA | NA | NA | NA | NA | NA | NA | NA | NA | NA | NA | NA | NA | NA | NA | NA | NA | NA | NA | NA | NA | NA | NA | NA | NA | |
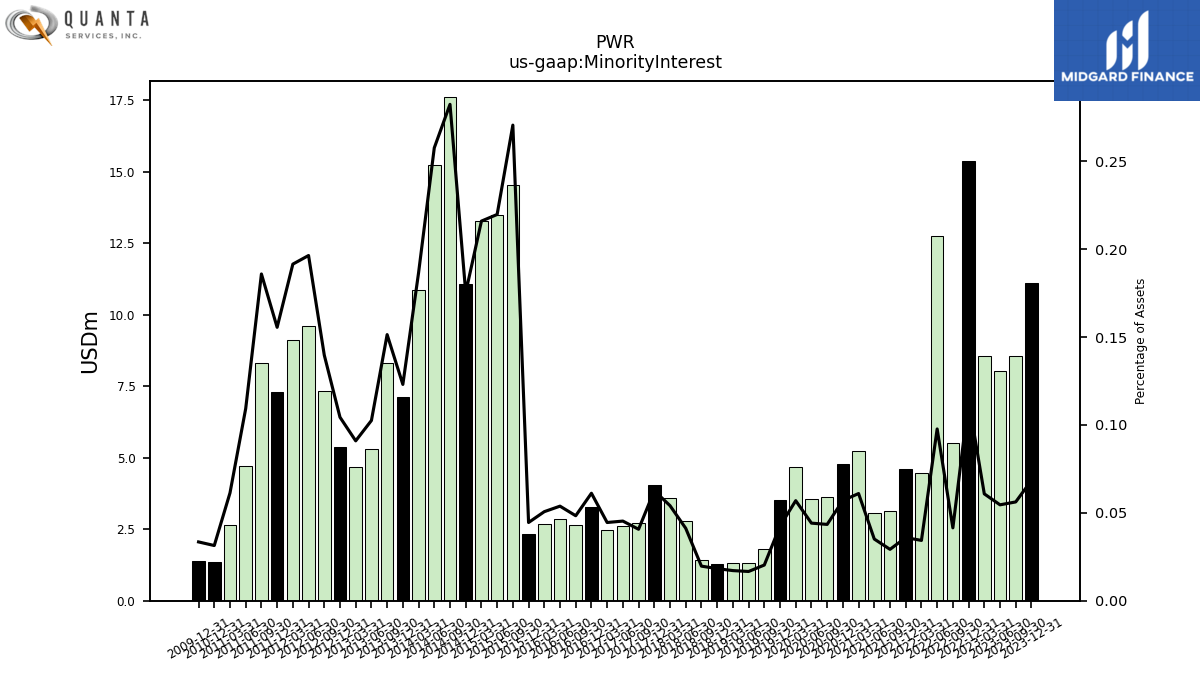
| Minority Interest | 11.11 | 8.54 | 8.05 | 8.54 | 15.36 | 5.51 | 12.76 | 4.47 | 4.62 | 3.12 | 3.06 | 5.22 | 4.79 | 3.62 | 3.57 | 4.69 | 3.54 | 1.80 | 1.34 | 1.31 | 1.29 | 1.42 | 2.80 | 3.60 | 4.06 | 2.70 | 2.61 | 2.47 | 3.27 | 2.65 | 2.85 | 2.68 | 2.32 | 14.54 | 13.47 | 13.27 | 11.07 | 17.59 | 15.23 | 10.87 | 7.13 | 8.32 | 5.32 | 4.69 | 5.37 | 7.34 | 9.62 | 9.11 | 7.31 | 8.30 | 4.69 | 2.65 | 1.36 | NA | NA | NA | |
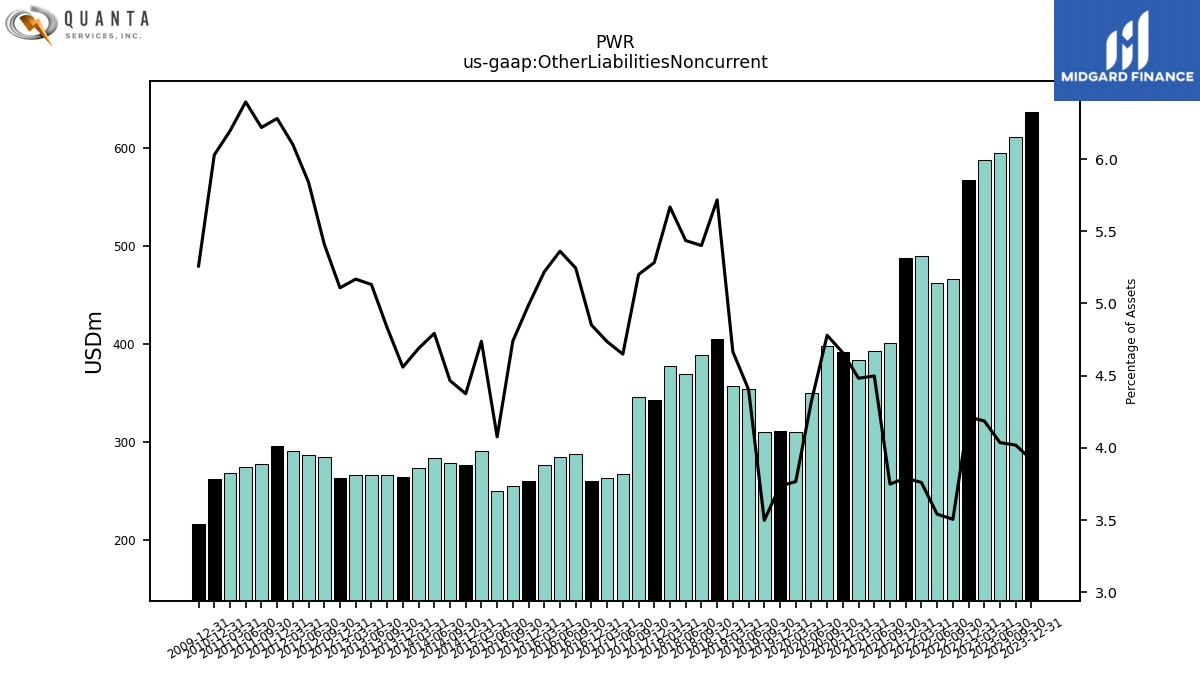
| Other Liabilities Noncurrent | 636.25 | 610.50 | 595.02 | 587.72 | 567.52 | 466.16 | 462.16 | 489.46 | 487.31 | 400.28 | 392.26 | 383.56 | 391.22 | 397.94 | 349.72 | 309.94 | 311.31 | 310.13 | 353.28 | 357.08 | 404.56 | 388.39 | 369.09 | 377.11 | 342.36 | 345.33 | 267.49 | 262.48 | 259.73 | 287.24 | 284.04 | 276.38 | 260.13 | 254.69 | 249.91 | 290.96 | 276.15 | 278.19 | 283.24 | 273.20 | 264.15 | 265.53 | 266.21 | 266.42 | 262.61 | 284.32 | 285.95 | 290.10 | 295.13 | 277.59 | 274.54 | 267.89 | 261.70 | NA | NA | NA | |
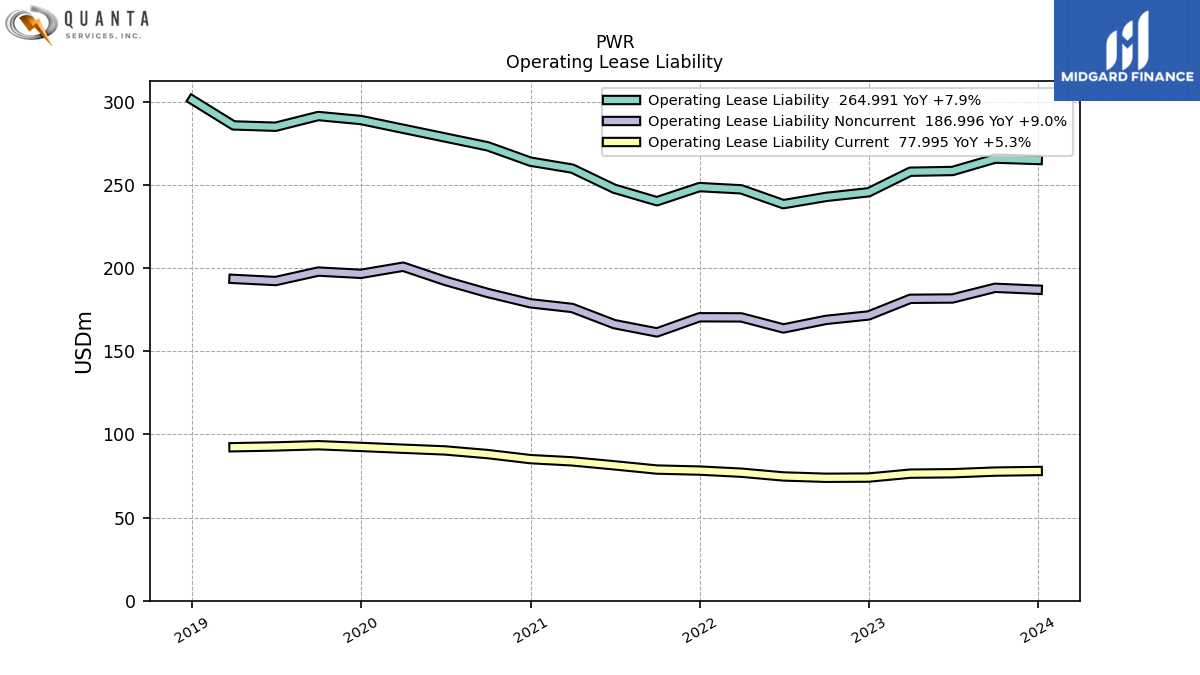
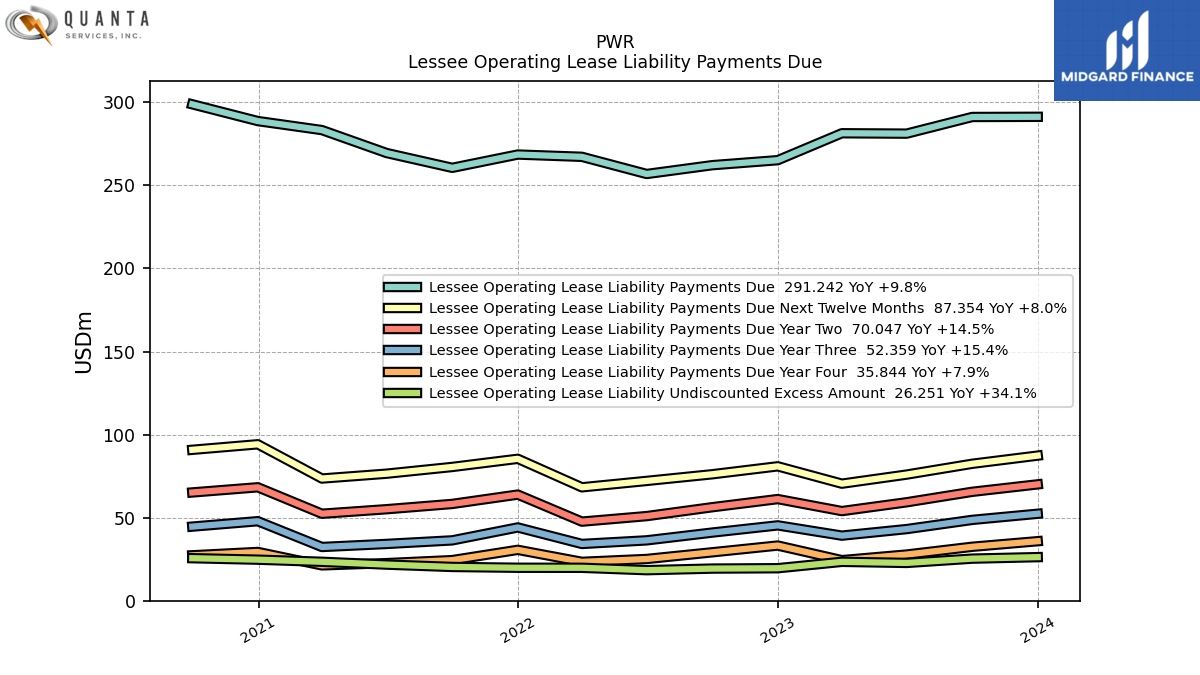
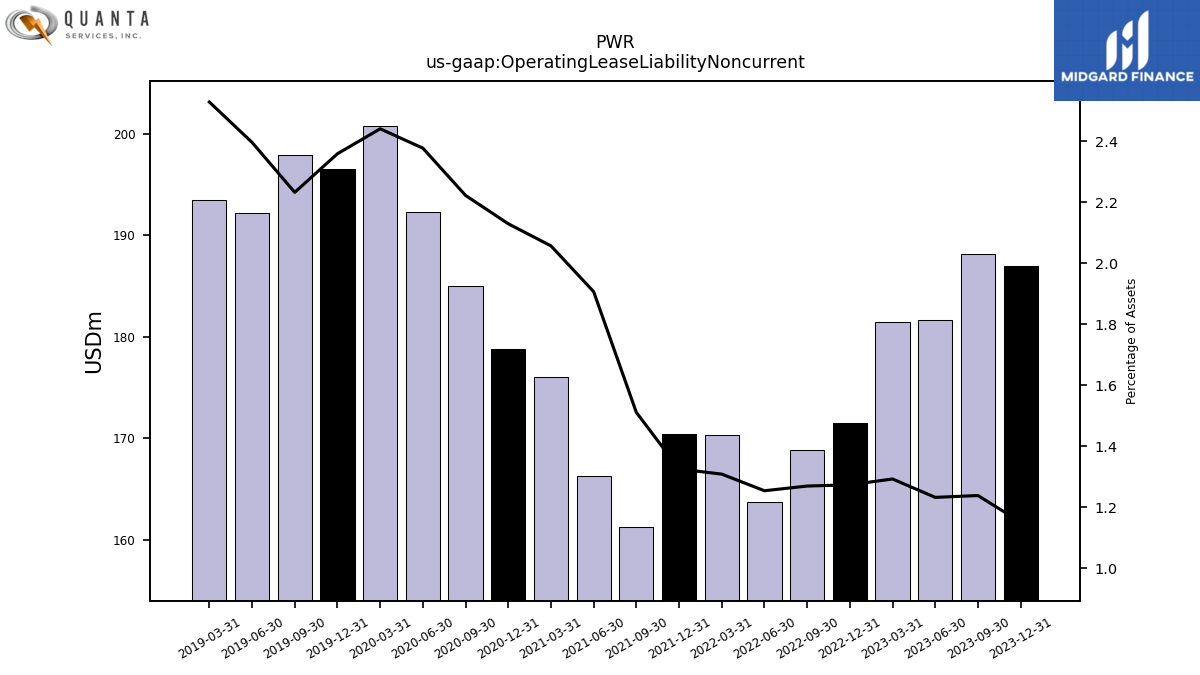
| Operating Lease Liability Noncurrent | 187.00 | 188.14 | 181.71 | 181.52 | 171.51 | 168.84 | 163.69 | 170.35 | 170.43 | 161.32 | 166.28 | 176.01 | 178.82 | 185.00 | 192.30 | 200.82 | 196.52 | 197.90 | 192.20 | 193.47 | NA | NA | NA | NA | NA | NA | NA | NA | NA | NA | NA | NA | NA | NA | NA | NA | NA | NA | NA | NA | NA | NA | NA | NA | NA | NA | NA | NA | NA | NA | NA | NA | NA | NA | NA | NA |
| 2023-12-31 | 2023-09-30 | 2023-06-30 | 2023-03-31 | 2022-12-31 | 2022-09-30 | 2022-06-30 | 2022-03-31 | 2021-12-31 | 2021-09-30 | 2021-06-30 | 2021-03-31 | 2020-12-31 | 2020-09-30 | 2020-06-30 | 2020-03-31 | 2019-12-31 | 2019-09-30 | 2019-06-30 | 2019-03-31 | 2018-12-31 | 2018-09-30 | 2018-06-30 | 2018-03-31 | 2017-12-31 | 2017-09-30 | 2017-06-30 | 2017-03-31 | 2016-12-31 | 2016-09-30 | 2016-06-30 | 2016-03-31 | 2015-12-31 | 2015-09-30 | 2015-06-30 | 2015-03-31 | 2014-12-31 | 2014-09-30 | 2014-06-30 | 2014-03-31 | 2013-12-31 | 2013-09-30 | 2013-06-30 | 2013-03-31 | 2012-12-31 | 2012-09-30 | 2012-06-30 | 2012-03-31 | 2011-12-31 | 2011-09-30 | 2011-06-30 | 2011-03-31 | 2010-12-31 | 2010-09-30 | 2010-06-30 | 2010-03-31 | ||
|---|---|---|---|---|---|---|---|---|---|---|---|---|---|---|---|---|---|---|---|---|---|---|---|---|---|---|---|---|---|---|---|---|---|---|---|---|---|---|---|---|---|---|---|---|---|---|---|---|---|---|---|---|---|---|---|---|---|
| Stockholders Equity | 6272.24 | 5987.31 | 5720.93 | 5513.42 | 5383.46 | 5196.05 | 5127.02 | 5137.52 | 5112.30 | 4630.71 | 4486.73 | 4374.94 | 4344.18 | 4151.95 | 3914.43 | 3790.49 | 4050.29 | 3907.41 | 3774.92 | 3723.74 | 3604.16 | 3822.82 | 3690.66 | 3643.35 | 3791.57 | 3727.53 | 3506.72 | 3396.34 | 3339.43 | 3273.94 | 3200.32 | 3170.55 | 3085.49 | 3189.37 | 4196.24 | 4297.49 | 4514.47 | 4471.04 | 4385.86 | 4305.81 | 4234.19 | 4015.93 | 3882.52 | 3826.13 | 3766.55 | 3662.90 | 3536.53 | 3461.61 | 3381.95 | 3294.70 | 3298.59 | 3357.12 | 3365.55 | NA | NA | NA | |
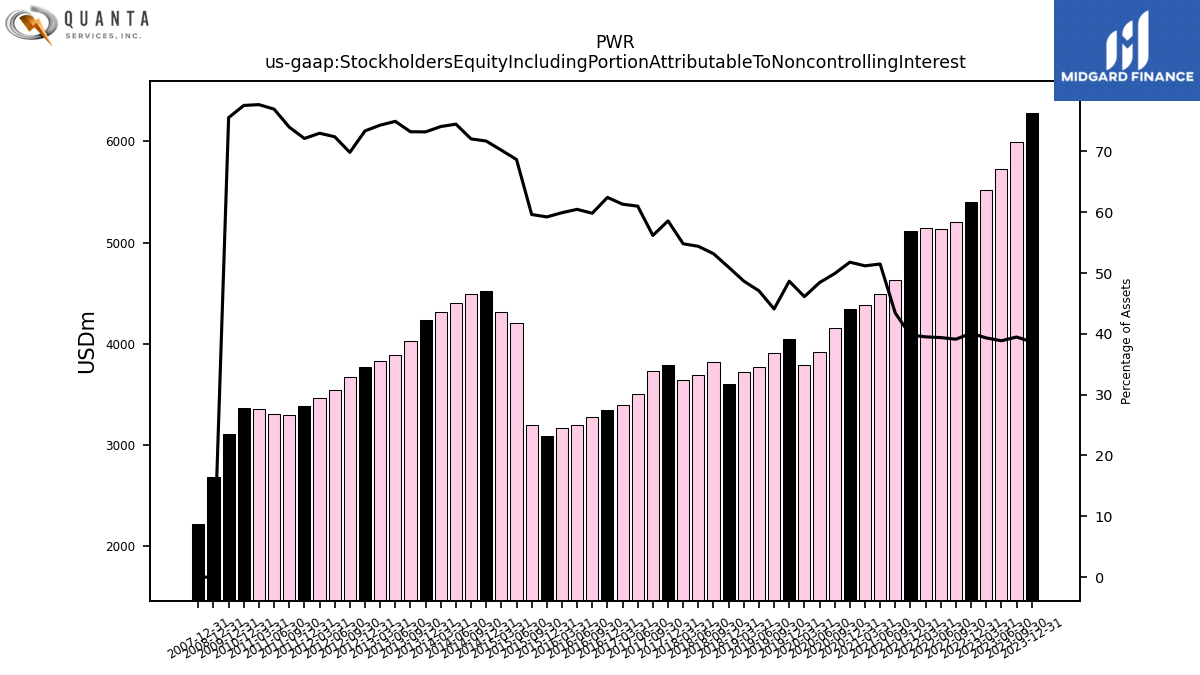
| Stockholders Equity Including Portion Attributable To Noncontrolling Interest | 6283.35 | 5995.85 | 5728.98 | 5521.95 | 5398.82 | 5201.57 | 5139.77 | 5141.99 | 5116.92 | 4633.83 | 4489.79 | 4380.16 | 4348.97 | 4155.57 | 3918.00 | 3795.18 | 4053.83 | 3909.21 | 3776.26 | 3725.06 | 3605.45 | 3824.23 | 3693.47 | 3646.97 | 3795.63 | 3730.23 | 3509.33 | 3398.81 | 3342.70 | 3276.59 | 3203.17 | 3173.23 | 3087.82 | 3203.91 | 4209.72 | 4310.75 | 4525.54 | 4488.63 | 4401.09 | 4316.68 | 4241.32 | 4024.25 | 3887.84 | 3830.82 | 3771.92 | 3670.24 | 3546.15 | 3470.71 | 3389.26 | 3303.00 | 3303.28 | 3359.78 | 3366.92 | NA | NA | NA | |
| Common Stock Value | 0.00 | 0.00 | 0.00 | 0.00 | 0.00 | 0.00 | 0.00 | 0.00 | 0.00 | 0.00 | 0.00 | 0.00 | 0.00 | NA | NA | NA | NA | NA | NA | NA | NA | 0.00 | 0.00 | 0.00 | 0.00 | 0.00 | 0.00 | 0.00 | 0.00 | 0.00 | 0.00 | 0.00 | 0.00 | 0.00 | 0.00 | 0.00 | 0.00 | 0.00 | 0.00 | 0.00 | 0.00 | 0.00 | 0.00 | 0.00 | 0.00 | 0.00 | 0.00 | 0.00 | 0.00 | 0.00 | 0.00 | 0.00 | 0.00 | NA | NA | NA | |
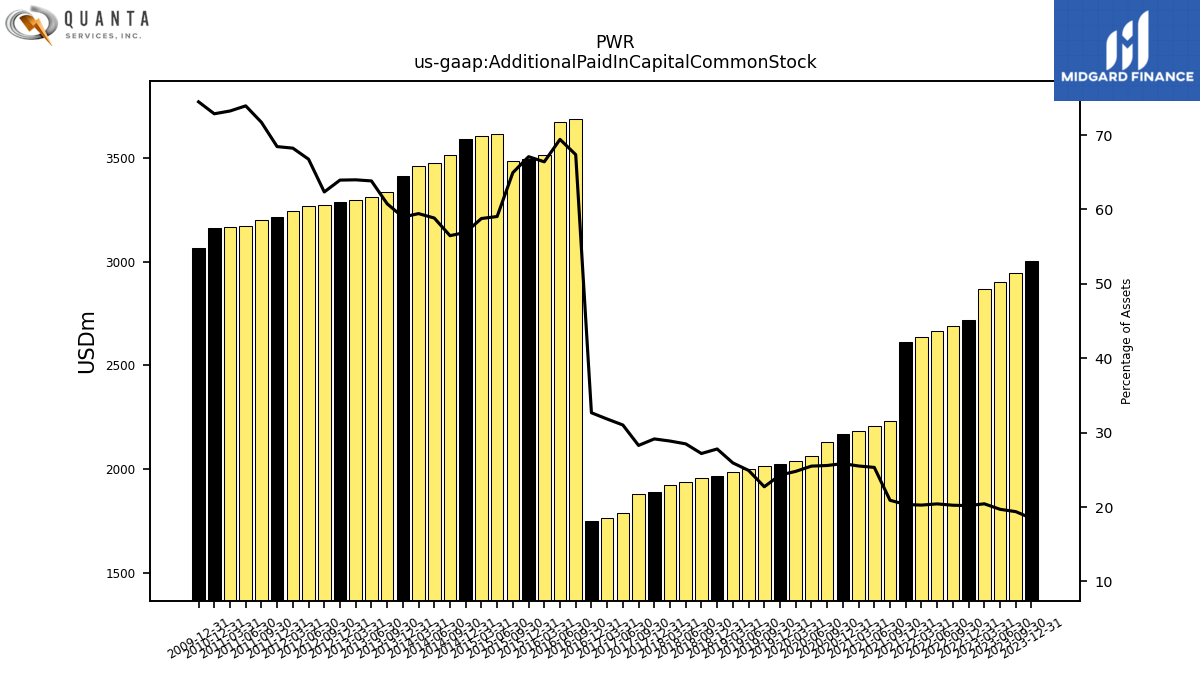
| Additional Paid In Capital Common Stock | 3002.65 | 2944.21 | 2903.63 | 2869.14 | 2718.99 | 2691.91 | 2665.29 | 2637.24 | 2615.41 | 2232.32 | 2208.91 | 2183.73 | 2170.03 | 2130.06 | 2063.10 | 2040.38 | 2024.61 | 2014.84 | 1999.46 | 1984.51 | 1967.35 | 1955.80 | 1934.83 | 1920.90 | 1889.36 | 1878.04 | 1785.19 | 1764.37 | 1749.31 | 3689.17 | 3676.91 | 3516.24 | 3497.74 | 3489.63 | 3619.92 | 3609.57 | 3592.91 | 3517.77 | 3477.07 | 3463.18 | 3416.59 | 3338.98 | 3311.52 | 3298.03 | 3287.09 | 3276.64 | 3268.91 | 3244.88 | 3216.21 | 3201.12 | 3173.25 | 3166.81 | 3162.78 | NA | NA | NA | |
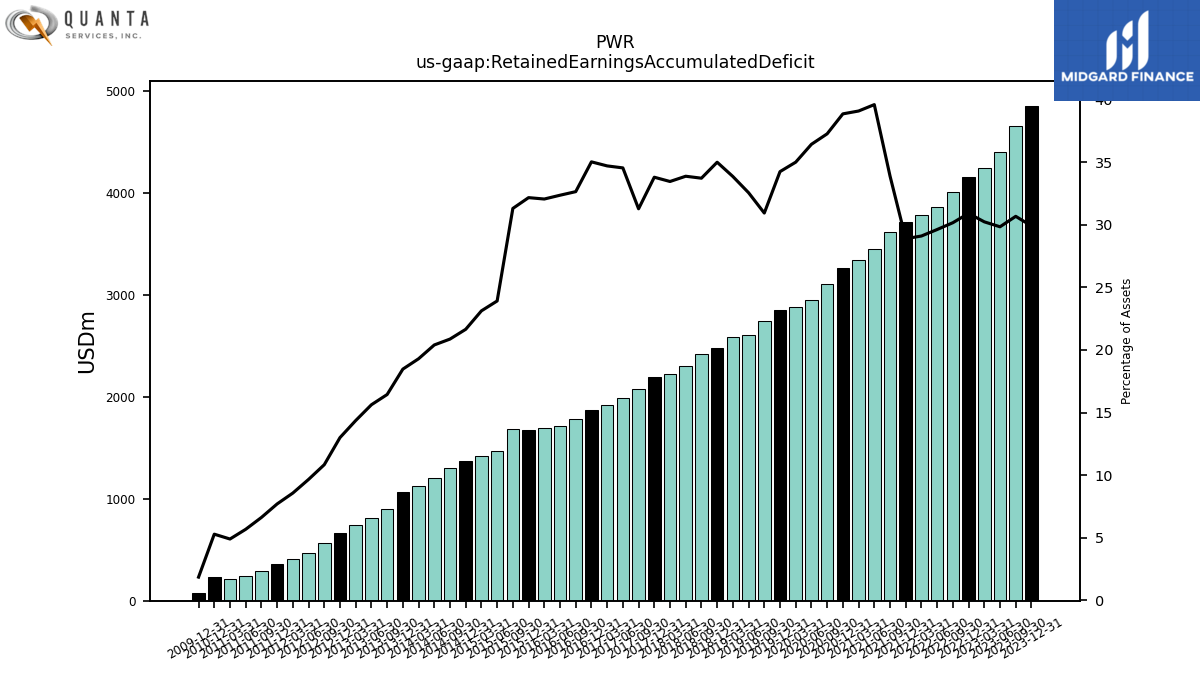
| Retained Earnings Accumulated Deficit | 4858.07 | 4660.57 | 4400.16 | 4246.16 | 4163.21 | 4012.40 | 3866.76 | 3789.03 | 3714.84 | 3620.41 | 3454.68 | 3346.30 | 3264.97 | 3103.85 | 2948.18 | 2881.42 | 2854.27 | 2743.50 | 2612.99 | 2591.88 | 2477.29 | 2425.83 | 2301.28 | 2226.92 | 2191.06 | 2077.50 | 1988.18 | 1924.35 | 1876.08 | 1788.50 | 1714.76 | 1698.19 | 1677.70 | 1682.77 | 1466.38 | 1420.28 | 1366.79 | 1300.21 | 1205.57 | 1124.48 | 1070.08 | 903.38 | 810.47 | 740.24 | 668.16 | 569.17 | 472.77 | 407.23 | 361.53 | 295.21 | 243.22 | 211.42 | 229.01 | NA | NA | NA | |
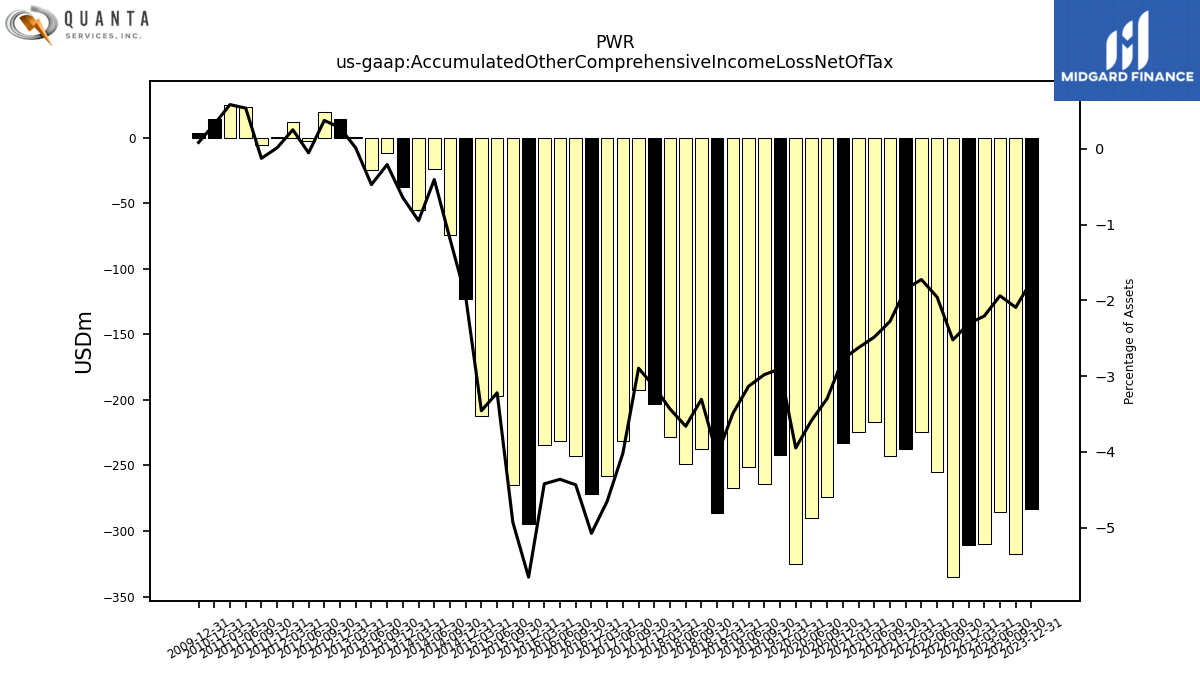
| Accumulated Other Comprehensive Income Loss Net Of Tax | -282.94 | -317.65 | -285.66 | -309.58 | -310.68 | -335.18 | -255.31 | -224.41 | -237.69 | -242.99 | -216.56 | -224.46 | -233.00 | -274.34 | -290.05 | -324.79 | -241.82 | -264.11 | -251.33 | -267.20 | -286.05 | -237.69 | -248.53 | -228.41 | -203.40 | -192.19 | -231.17 | -257.85 | -271.67 | -242.82 | -231.02 | -234.10 | -294.69 | -264.84 | -197.34 | -212.24 | -123.29 | -73.94 | -23.88 | -55.22 | -37.24 | -11.32 | -24.44 | 0.71 | 14.45 | 19.77 | -2.52 | 12.03 | 0.71 | -5.53 | 23.12 | 25.30 | 14.12 | NA | NA | NA | |
| Minority Interest | 11.11 | 8.54 | 8.05 | 8.54 | 15.36 | 5.51 | 12.76 | 4.47 | 4.62 | 3.12 | 3.06 | 5.22 | 4.79 | 3.62 | 3.57 | 4.69 | 3.54 | 1.80 | 1.34 | 1.31 | 1.29 | 1.42 | 2.80 | 3.60 | 4.06 | 2.70 | 2.61 | 2.47 | 3.27 | 2.65 | 2.85 | 2.68 | 2.32 | 14.54 | 13.47 | 13.27 | 11.07 | 17.59 | 15.23 | 10.87 | 7.13 | 8.32 | 5.32 | 4.69 | 5.37 | 7.34 | 9.62 | 9.11 | 7.31 | 8.30 | 4.69 | 2.65 | 1.36 | NA | NA | NA |
| 2023-12-31 | 2023-09-30 | 2023-06-30 | 2023-03-31 | 2022-12-31 | 2022-09-30 | 2022-06-30 | 2022-03-31 | 2021-12-31 | 2021-09-30 | 2021-06-30 | 2021-03-31 | 2020-12-31 | 2020-09-30 | 2020-06-30 | 2020-03-31 | 2019-12-31 | 2019-09-30 | 2019-06-30 | 2019-03-31 | 2018-12-31 | 2018-09-30 | 2018-06-30 | 2018-03-31 | 2017-12-31 | 2017-09-30 | 2017-06-30 | 2017-03-31 | 2016-12-31 | 2016-09-30 | 2016-06-30 | 2016-03-31 | 2015-12-31 | 2015-09-30 | 2015-06-30 | 2015-03-31 | 2014-12-31 | 2014-09-30 | 2014-06-30 | 2014-03-31 | 2013-12-31 | 2013-09-30 | 2013-06-30 | 2013-03-31 | 2012-12-31 | 2012-09-30 | 2012-06-30 | 2012-03-31 | 2011-12-31 | 2011-09-30 | 2011-06-30 | 2011-03-31 | 2010-12-31 | 2010-09-30 | 2010-06-30 | 2010-03-31 | ||
|---|---|---|---|---|---|---|---|---|---|---|---|---|---|---|---|---|---|---|---|---|---|---|---|---|---|---|---|---|---|---|---|---|---|---|---|---|---|---|---|---|---|---|---|---|---|---|---|---|---|---|---|---|---|---|---|---|---|
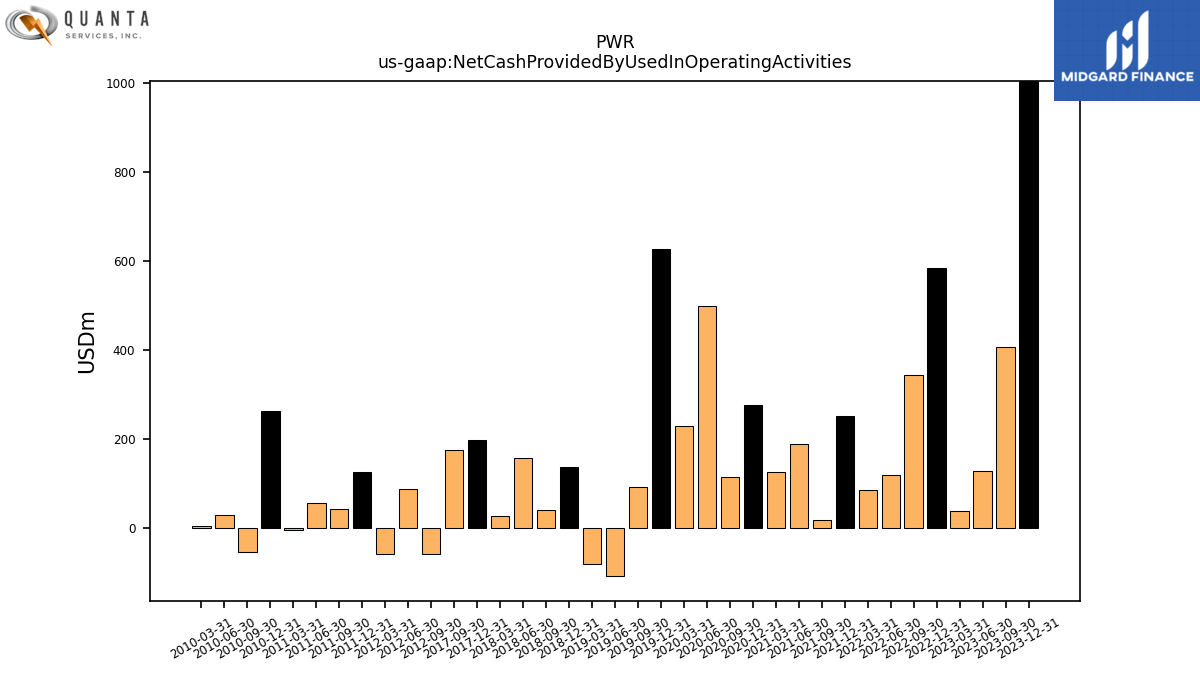
| Net Cash Provided By Used In Operating Activities | 1003.54 | 406.59 | 127.41 | 38.41 | 583.13 | 343.36 | 118.73 | 85.09 | 249.95 | 17.88 | 188.95 | 125.61 | 276.09 | 114.86 | 497.48 | 227.55 | 626.80 | 91.17 | -108.66 | -82.75 | 137.17 | 39.10 | 156.52 | 25.99 | 197.19 | 173.57 | NA | NA | NA | NA | NA | NA | NA | NA | NA | NA | NA | NA | NA | NA | NA | NA | NA | NA | NA | -59.77 | 86.30 | -60.22 | 125.28 | 40.78 | 56.16 | -4.19 | 261.59 | -54.71 | 28.54 | 3.63 | |
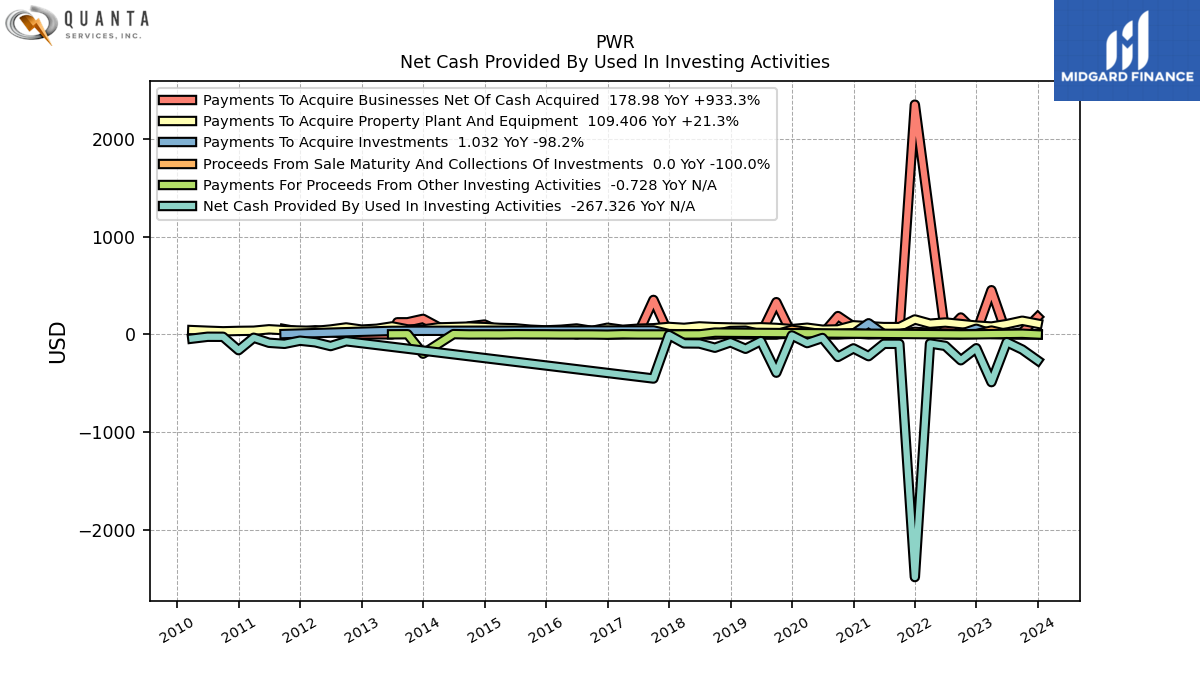
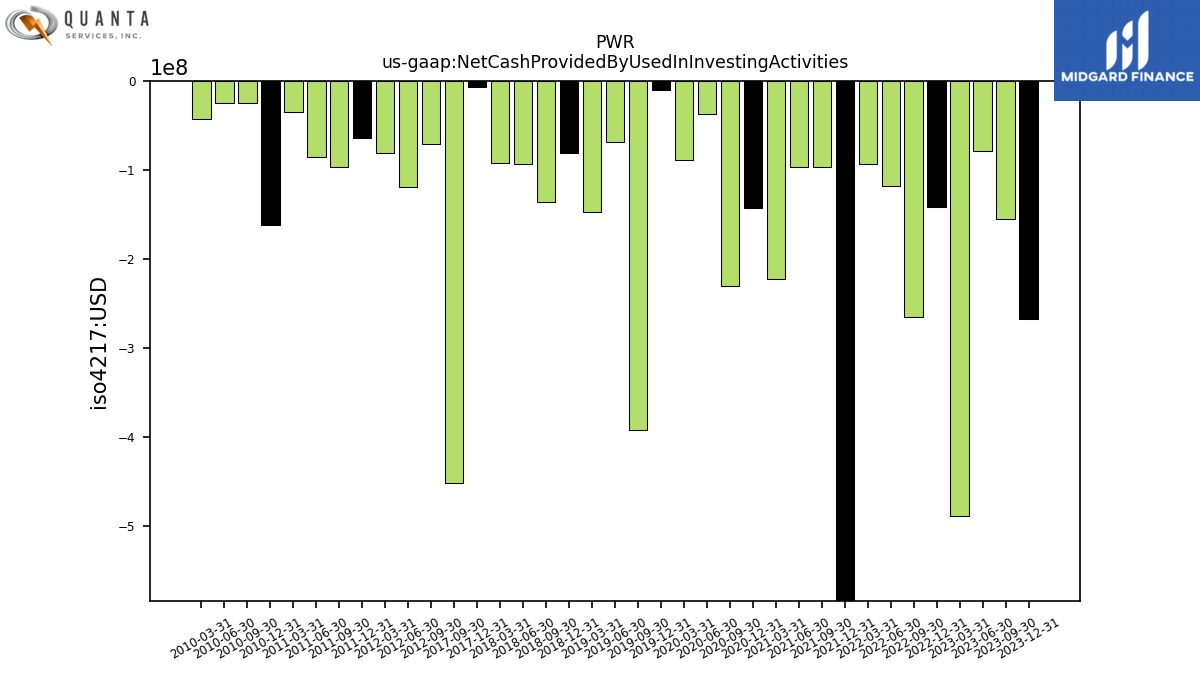
| Net Cash Provided By Used In Investing Activities | -267.33 | -154.96 | -78.74 | -488.62 | -141.44 | -264.73 | -117.95 | -93.07 | -2482.90 | -96.54 | -96.37 | -222.81 | -143.02 | -230.56 | -36.61 | -89.13 | -10.47 | -391.80 | -68.17 | -147.16 | -80.99 | -136.43 | -93.35 | -91.90 | -6.52 | -451.55 | NA | NA | NA | NA | NA | NA | NA | NA | NA | NA | NA | NA | NA | NA | NA | NA | NA | NA | NA | -70.27 | -119.39 | -80.95 | -64.44 | -96.67 | -85.81 | -34.30 | -161.46 | -24.53 | -24.19 | -42.87 | |
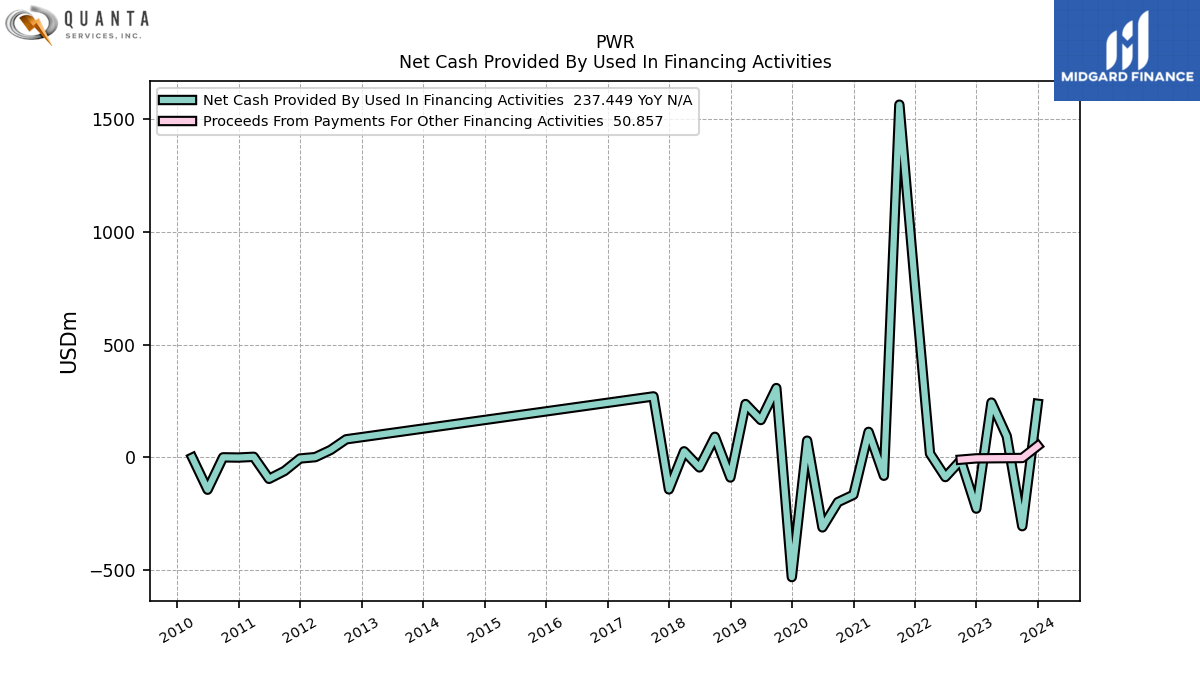
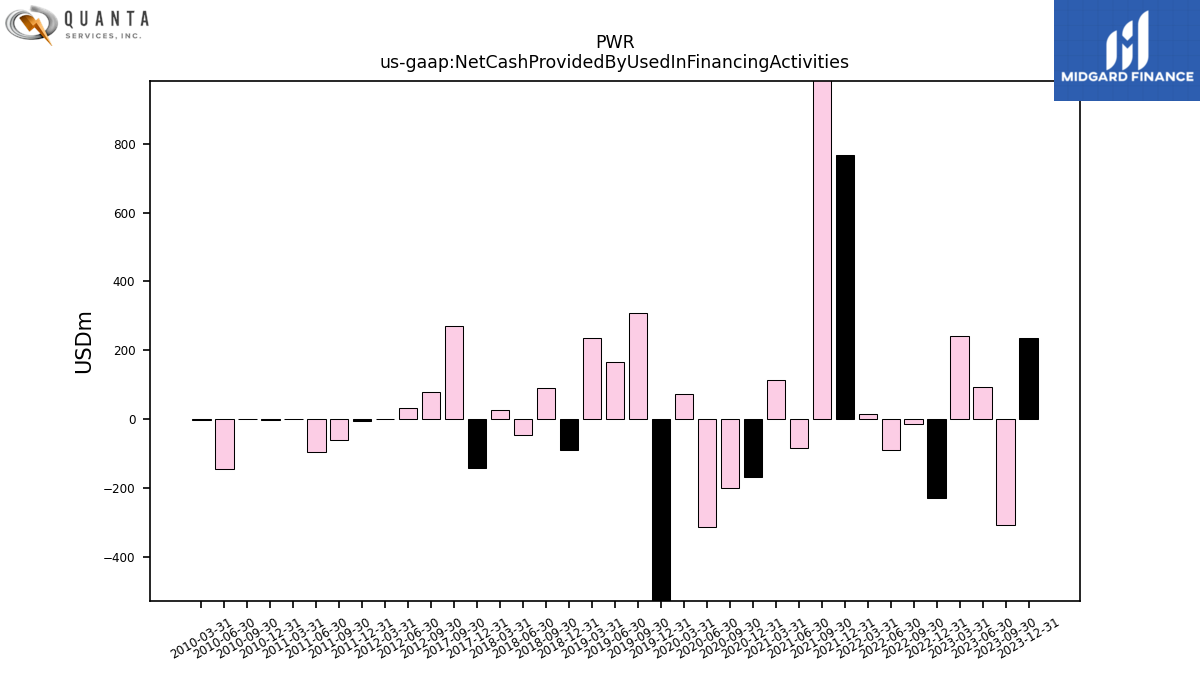
| Net Cash Provided By Used In Financing Activities | 237.45 | -305.24 | 93.61 | 242.69 | -227.35 | -12.81 | -87.47 | 16.55 | 766.05 | 1563.59 | -81.75 | 112.99 | -166.15 | -198.50 | -310.64 | 73.93 | -531.06 | 307.11 | 165.38 | 236.26 | -89.43 | 90.96 | -44.82 | 26.72 | -142.27 | 270.13 | NA | NA | NA | NA | NA | NA | NA | NA | NA | NA | NA | NA | NA | NA | NA | NA | NA | NA | NA | 79.84 | 32.80 | 0.90 | -5.19 | -60.48 | -95.39 | 2.32 | -0.98 | -0.02 | -143.56 | -1.14 |
| 2023-12-31 | 2023-09-30 | 2023-06-30 | 2023-03-31 | 2022-12-31 | 2022-09-30 | 2022-06-30 | 2022-03-31 | 2021-12-31 | 2021-09-30 | 2021-06-30 | 2021-03-31 | 2020-12-31 | 2020-09-30 | 2020-06-30 | 2020-03-31 | 2019-12-31 | 2019-09-30 | 2019-06-30 | 2019-03-31 | 2018-12-31 | 2018-09-30 | 2018-06-30 | 2018-03-31 | 2017-12-31 | 2017-09-30 | 2017-06-30 | 2017-03-31 | 2016-12-31 | 2016-09-30 | 2016-06-30 | 2016-03-31 | 2015-12-31 | 2015-09-30 | 2015-06-30 | 2015-03-31 | 2014-12-31 | 2014-09-30 | 2014-06-30 | 2014-03-31 | 2013-12-31 | 2013-09-30 | 2013-06-30 | 2013-03-31 | 2012-12-31 | 2012-09-30 | 2012-06-30 | 2012-03-31 | 2011-12-31 | 2011-09-30 | 2011-06-30 | 2011-03-31 | 2010-12-31 | 2010-09-30 | 2010-06-30 | 2010-03-31 | ||
|---|---|---|---|---|---|---|---|---|---|---|---|---|---|---|---|---|---|---|---|---|---|---|---|---|---|---|---|---|---|---|---|---|---|---|---|---|---|---|---|---|---|---|---|---|---|---|---|---|---|---|---|---|---|---|---|---|---|
| Net Cash Provided By Used In Operating Activities | 1003.54 | 406.59 | 127.41 | 38.41 | 583.13 | 343.36 | 118.73 | 85.09 | 249.95 | 17.88 | 188.95 | 125.61 | 276.09 | 114.86 | 497.48 | 227.55 | 626.80 | 91.17 | -108.66 | -82.75 | 137.17 | 39.10 | 156.52 | 25.99 | 197.19 | 173.57 | NA | NA | NA | NA | NA | NA | NA | NA | NA | NA | NA | NA | NA | NA | NA | NA | NA | NA | NA | -59.77 | 86.30 | -60.22 | 125.28 | 40.78 | 56.16 | -4.19 | 261.59 | -54.71 | 28.54 | 3.63 | |
| Net Income Loss | 210.91 | 272.84 | 165.90 | 95.05 | 162.57 | 155.96 | 88.02 | 84.64 | 104.80 | 174.37 | 117.03 | 89.76 | 170.05 | 162.91 | 73.95 | 38.69 | 118.14 | 136.07 | 27.34 | 120.49 | 56.82 | 124.55 | NA | NA | NA | NA | NA | NA | NA | NA | NA | NA | NA | NA | NA | NA | NA | NA | NA | NA | NA | NA | NA | NA | NA | NA | NA | NA | NA | NA | NA | NA | NA | NA | NA | NA | |
| Profit Loss | 213.61 | 273.52 | 166.58 | 96.97 | 174.14 | 156.32 | 96.16 | 85.03 | 106.30 | 175.40 | 118.97 | 91.32 | 171.96 | 163.70 | 74.80 | 41.50 | 120.30 | 137.02 | 28.46 | 121.03 | 57.79 | 124.90 | 74.71 | 38.61 | 115.58 | 89.85 | 64.36 | 48.44 | 88.36 | 74.15 | 16.73 | 20.86 | -4.88 | 218.96 | 49.56 | 58.19 | 70.97 | 100.02 | 85.44 | 58.65 | 171.32 | 98.41 | 74.73 | 76.86 | 102.01 | 100.86 | 69.80 | 49.99 | 70.81 | 55.60 | 34.31 | -16.30 | 34.43 | 63.70 | 33.32 | 24.10 | |
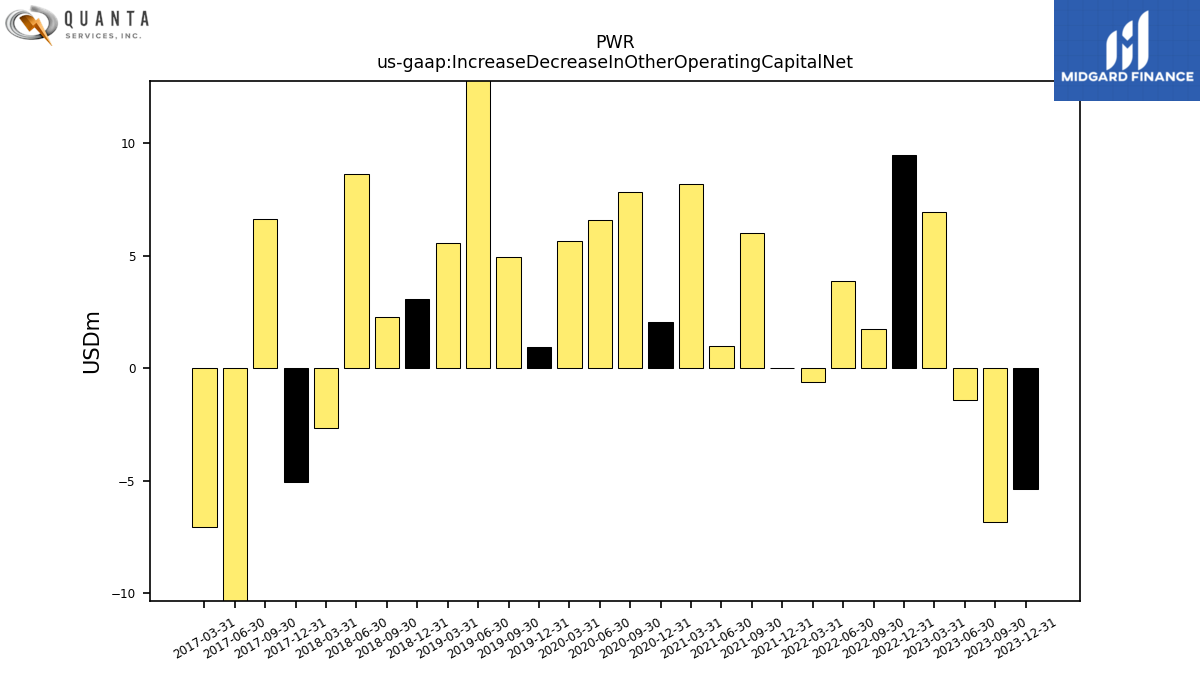
| Increase Decrease In Other Operating Capital Net | -5.37 | -6.86 | -1.41 | 6.93 | 9.47 | 1.75 | 3.86 | -0.63 | -0.01 | 6.03 | 0.98 | 8.20 | 2.03 | 7.81 | 6.59 | 5.66 | 0.94 | 4.96 | 123.80 | 5.55 | 3.06 | 2.29 | 8.64 | -2.66 | -5.04 | 6.62 | -12.39 | -7.05 | NA | NA | NA | NA | NA | NA | NA | NA | NA | NA | NA | NA | NA | NA | NA | NA | NA | NA | NA | NA | NA | NA | NA | NA | NA | NA | NA | NA | |
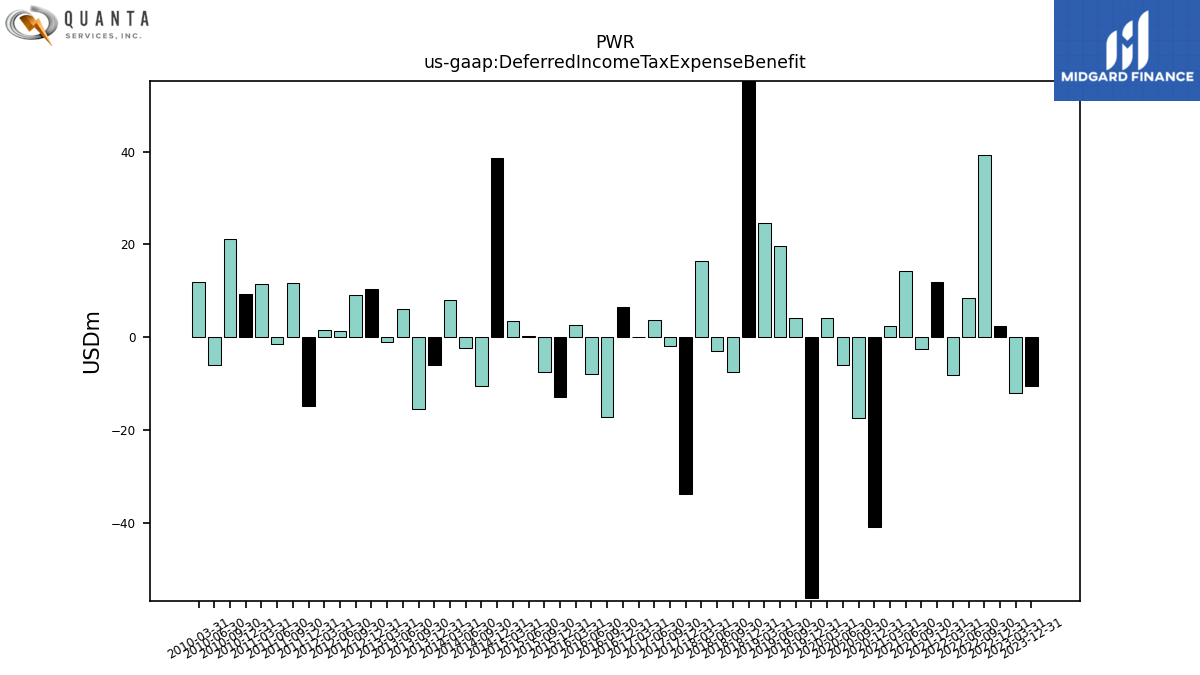
| Deferred Income Tax Expense Benefit | -10.49 | NA | NA | -12.00 | 2.44 | 39.22 | 8.49 | -8.10 | 11.83 | -2.50 | 14.25 | 2.49 | -40.79 | -17.44 | -5.99 | 4.21 | -56.22 | 4.17 | 19.57 | 24.56 | 55.86 | -7.39 | -2.87 | 16.38 | -33.78 | -1.98 | 3.67 | -0.04 | 6.54 | -17.10 | -7.86 | 2.72 | -12.85 | -7.54 | 0.28 | 3.50 | 38.53 | -10.61 | -2.34 | 8.09 | -5.96 | -15.48 | 6.10 | -1.12 | 10.50 | 9.12 | 1.30 | 1.62 | -14.76 | 11.68 | -1.39 | 11.48 | 9.38 | 21.13 | -6.01 | 11.93 | |
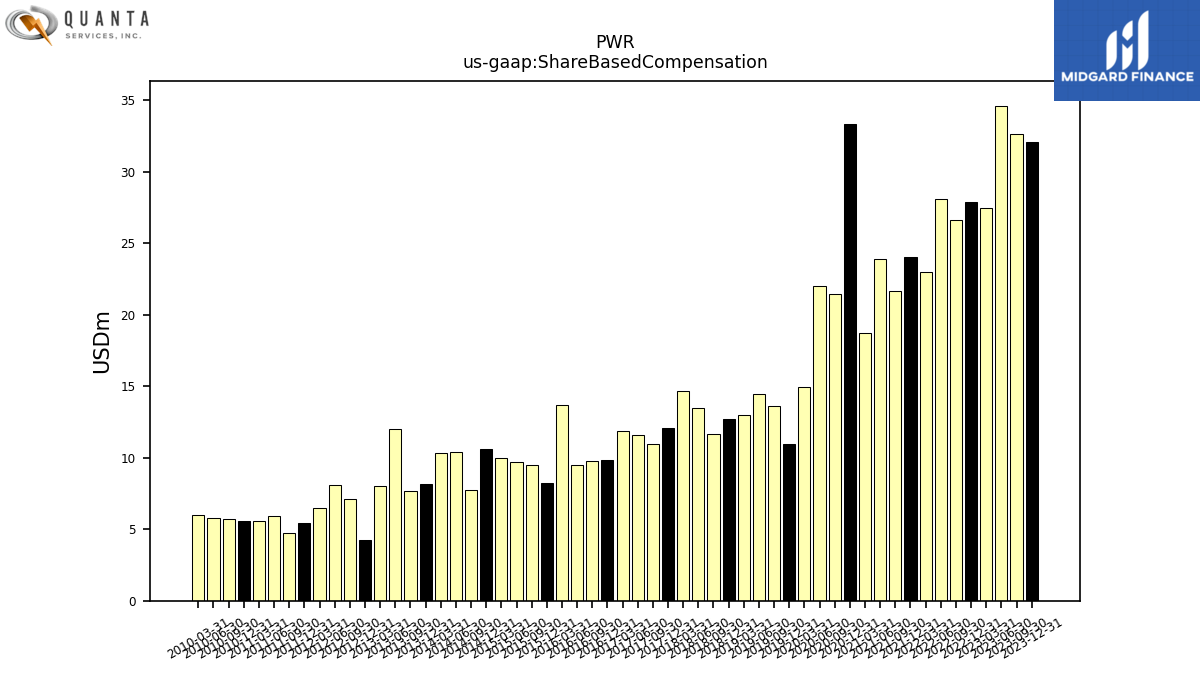
| Share Based Compensation | 32.10 | 32.60 | 34.61 | 27.45 | 27.87 | 26.65 | 28.09 | 22.99 | 24.01 | 21.64 | 23.92 | 18.69 | 33.32 | 21.43 | 21.98 | 14.91 | 10.93 | 13.58 | 14.48 | 13.01 | 12.68 | 11.63 | 13.48 | 14.69 | 12.10 | 10.93 | 11.56 | 11.87 | 9.88 | 9.75 | 9.50 | 13.72 | 8.23 | 9.52 | 9.71 | 9.96 | 10.58 | 7.77 | 10.38 | 10.30 | 8.13 | 7.67 | 12.04 | 8.04 | 4.28 | 7.14 | 8.09 | 6.48 | 5.41 | 4.72 | 5.95 | 5.54 | 5.58 | 5.70 | 5.76 | 6.00 |
| 2023-12-31 | 2023-09-30 | 2023-06-30 | 2023-03-31 | 2022-12-31 | 2022-09-30 | 2022-06-30 | 2022-03-31 | 2021-12-31 | 2021-09-30 | 2021-06-30 | 2021-03-31 | 2020-12-31 | 2020-09-30 | 2020-06-30 | 2020-03-31 | 2019-12-31 | 2019-09-30 | 2019-06-30 | 2019-03-31 | 2018-12-31 | 2018-09-30 | 2018-06-30 | 2018-03-31 | 2017-12-31 | 2017-09-30 | 2017-06-30 | 2017-03-31 | 2016-12-31 | 2016-09-30 | 2016-06-30 | 2016-03-31 | 2015-12-31 | 2015-09-30 | 2015-06-30 | 2015-03-31 | 2014-12-31 | 2014-09-30 | 2014-06-30 | 2014-03-31 | 2013-12-31 | 2013-09-30 | 2013-06-30 | 2013-03-31 | 2012-12-31 | 2012-09-30 | 2012-06-30 | 2012-03-31 | 2011-12-31 | 2011-09-30 | 2011-06-30 | 2011-03-31 | 2010-12-31 | 2010-09-30 | 2010-06-30 | 2010-03-31 | ||
|---|---|---|---|---|---|---|---|---|---|---|---|---|---|---|---|---|---|---|---|---|---|---|---|---|---|---|---|---|---|---|---|---|---|---|---|---|---|---|---|---|---|---|---|---|---|---|---|---|---|---|---|---|---|---|---|---|---|
| Net Cash Provided By Used In Investing Activities | -267.33 | -154.96 | -78.74 | -488.62 | -141.44 | -264.73 | -117.95 | -93.07 | -2482.90 | -96.54 | -96.37 | -222.81 | -143.02 | -230.56 | -36.61 | -89.13 | -10.47 | -391.80 | -68.17 | -147.16 | -80.99 | -136.43 | -93.35 | -91.90 | -6.52 | -451.55 | NA | NA | NA | NA | NA | NA | NA | NA | NA | NA | NA | NA | NA | NA | NA | NA | NA | NA | NA | -70.27 | -119.39 | -80.95 | -64.44 | -96.67 | -85.81 | -34.30 | -161.46 | -24.53 | -24.19 | -42.87 | |
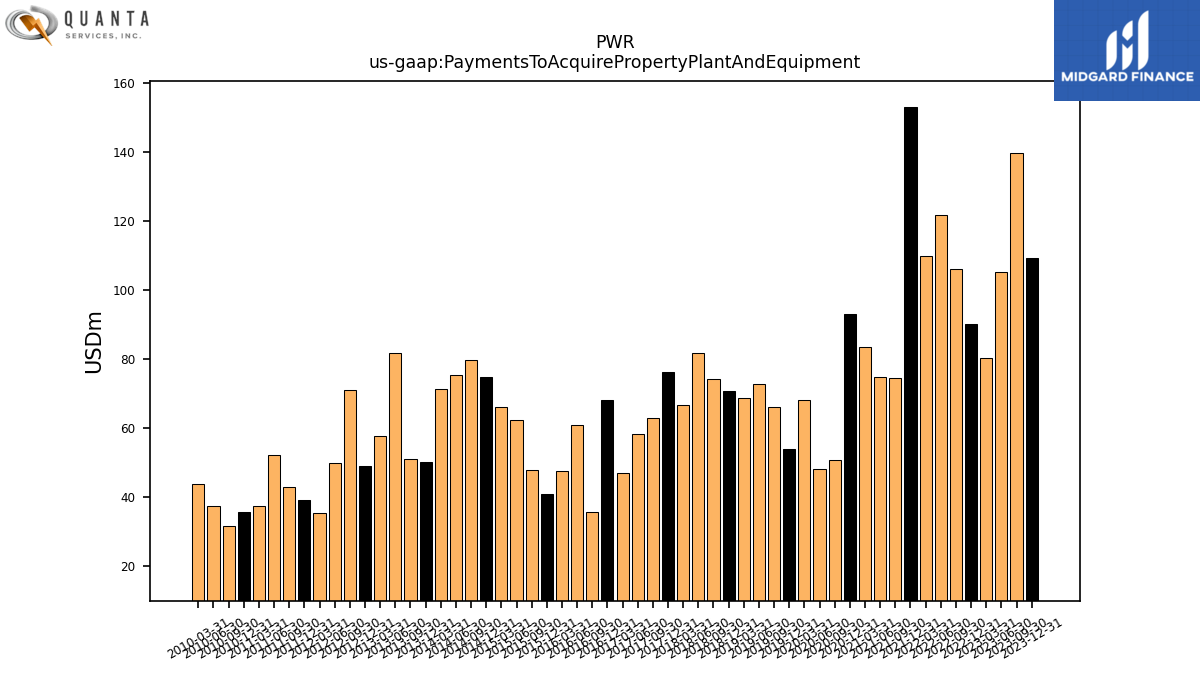
| Payments To Acquire Property Plant And Equipment | 109.41 | 139.80 | 105.28 | 80.32 | 90.16 | 105.96 | 121.57 | 109.94 | 152.86 | 74.61 | 74.90 | 83.49 | 93.02 | 50.78 | 48.15 | 68.11 | 54.12 | 66.24 | 72.78 | 68.63 | 70.86 | 74.14 | 81.78 | 66.81 | 76.37 | 63.00 | 58.26 | 47.02 | 68.13 | 35.87 | 60.85 | 47.70 | 41.00 | 47.97 | 62.49 | 66.17 | 74.80 | 79.86 | 75.40 | 71.42 | 50.32 | 51.07 | 81.74 | 57.64 | 49.09 | 71.06 | 49.98 | 35.34 | 39.24 | 43.08 | 52.20 | 37.49 | 35.61 | 31.67 | 37.36 | 43.80 | |
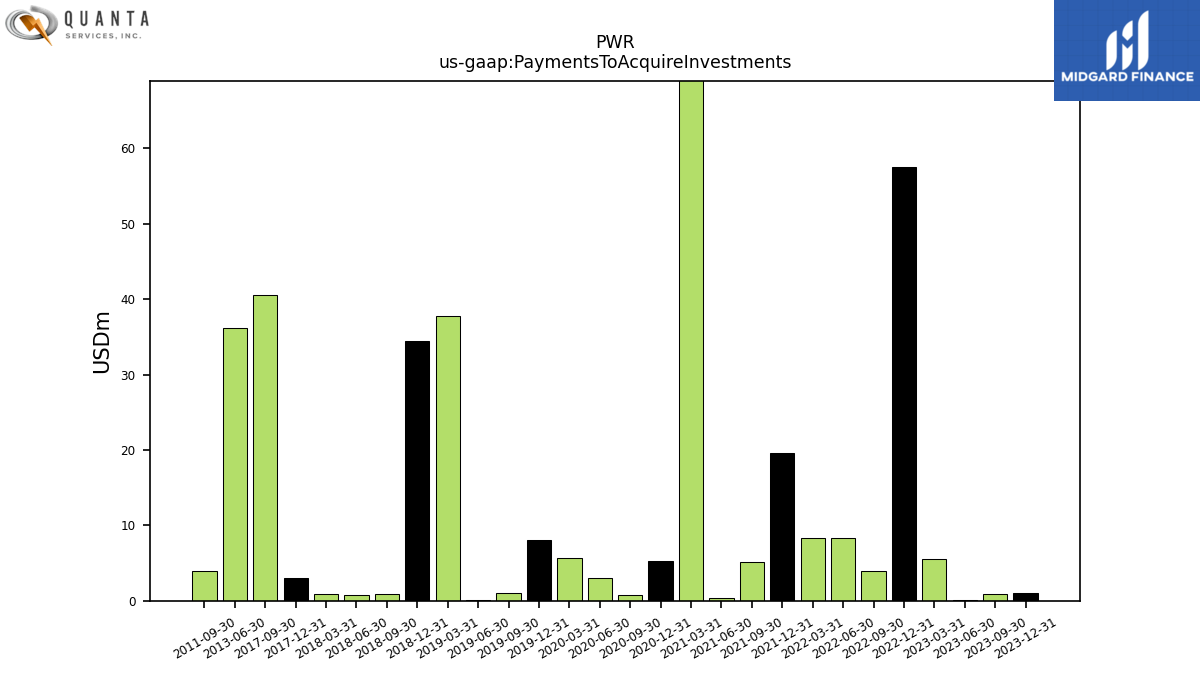
| Payments To Acquire Investments | 1.03 | 0.88 | 0.13 | 5.49 | 57.46 | 3.97 | 8.33 | 8.32 | 19.54 | 5.15 | 0.34 | 113.98 | 5.32 | 0.78 | 3.07 | 5.69 | 8.06 | 1.06 | 0.13 | 37.80 | 34.46 | 0.88 | 0.73 | 0.84 | 3.02 | 40.56 | NA | NA | NA | NA | NA | NA | NA | NA | NA | NA | NA | NA | NA | NA | NA | NA | 36.11 | NA | NA | NA | NA | NA | NA | 4.00 | NA | NA | NA | NA | NA | NA |
| 2023-12-31 | 2023-09-30 | 2023-06-30 | 2023-03-31 | 2022-12-31 | 2022-09-30 | 2022-06-30 | 2022-03-31 | 2021-12-31 | 2021-09-30 | 2021-06-30 | 2021-03-31 | 2020-12-31 | 2020-09-30 | 2020-06-30 | 2020-03-31 | 2019-12-31 | 2019-09-30 | 2019-06-30 | 2019-03-31 | 2018-12-31 | 2018-09-30 | 2018-06-30 | 2018-03-31 | 2017-12-31 | 2017-09-30 | 2017-06-30 | 2017-03-31 | 2016-12-31 | 2016-09-30 | 2016-06-30 | 2016-03-31 | 2015-12-31 | 2015-09-30 | 2015-06-30 | 2015-03-31 | 2014-12-31 | 2014-09-30 | 2014-06-30 | 2014-03-31 | 2013-12-31 | 2013-09-30 | 2013-06-30 | 2013-03-31 | 2012-12-31 | 2012-09-30 | 2012-06-30 | 2012-03-31 | 2011-12-31 | 2011-09-30 | 2011-06-30 | 2011-03-31 | 2010-12-31 | 2010-09-30 | 2010-06-30 | 2010-03-31 | ||
|---|---|---|---|---|---|---|---|---|---|---|---|---|---|---|---|---|---|---|---|---|---|---|---|---|---|---|---|---|---|---|---|---|---|---|---|---|---|---|---|---|---|---|---|---|---|---|---|---|---|---|---|---|---|---|---|---|---|
| Net Cash Provided By Used In Financing Activities | 237.45 | -305.24 | 93.61 | 242.69 | -227.35 | -12.81 | -87.47 | 16.55 | 766.05 | 1563.59 | -81.75 | 112.99 | -166.15 | -198.50 | -310.64 | 73.93 | -531.06 | 307.11 | 165.38 | 236.26 | -89.43 | 90.96 | -44.82 | 26.72 | -142.27 | 270.13 | NA | NA | NA | NA | NA | NA | NA | NA | NA | NA | NA | NA | NA | NA | NA | NA | NA | NA | NA | 79.84 | 32.80 | 0.90 | -5.19 | -60.48 | -95.39 | 2.32 | -0.98 | -0.02 | -143.56 | -1.14 | |
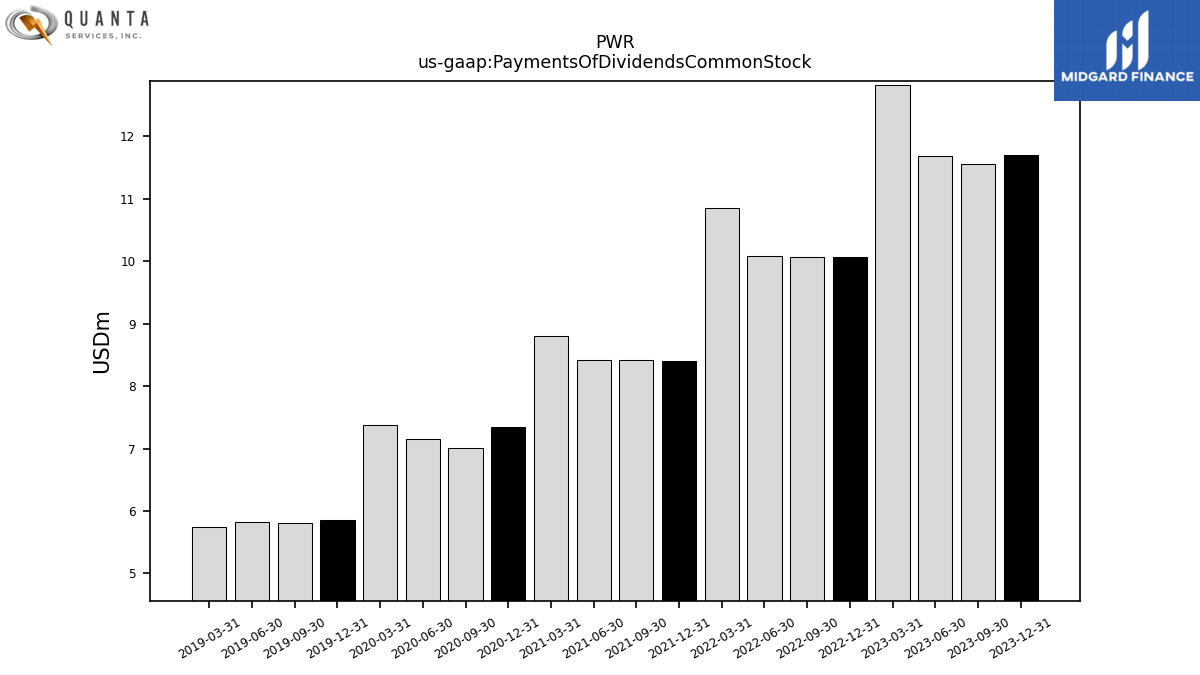
| Payments Of Dividends Common Stock | 11.69 | 11.56 | 11.68 | 12.82 | 10.06 | 10.07 | 10.09 | 10.84 | 8.39 | 8.41 | 8.41 | 8.80 | 7.35 | 7.00 | 7.16 | 7.38 | 5.85 | 5.80 | 5.83 | 5.75 | NA | NA | NA | NA | NA | NA | NA | NA | NA | NA | NA | NA | NA | NA | NA | NA | NA | NA | NA | NA | NA | NA | NA | NA | NA | NA | NA | NA | NA | NA | NA | NA | NA | NA | NA | NA |
| 2023-12-31 | 2023-09-30 | 2023-06-30 | 2023-03-31 | 2022-12-31 | 2022-09-30 | 2022-06-30 | 2022-03-31 | 2021-12-31 | 2021-09-30 | 2021-06-30 | 2021-03-31 | 2020-12-31 | 2020-09-30 | 2020-06-30 | 2020-03-31 | 2019-12-31 | 2019-09-30 | 2019-06-30 | 2019-03-31 | 2018-12-31 | 2018-09-30 | 2018-06-30 | 2018-03-31 | 2017-12-31 | 2017-09-30 | 2017-06-30 | 2017-03-31 | 2016-12-31 | 2016-09-30 | 2016-06-30 | 2016-03-31 | 2015-12-31 | 2015-09-30 | 2015-06-30 | 2015-03-31 | 2014-12-31 | 2014-09-30 | 2014-06-30 | 2014-03-31 | 2013-12-31 | 2013-09-30 | 2013-06-30 | 2013-03-31 | 2012-12-31 | 2012-09-30 | 2012-06-30 | 2012-03-31 | 2011-12-31 | 2011-09-30 | 2011-06-30 | 2011-03-31 | 2010-12-31 | 2010-09-30 | 2010-06-30 | 2010-03-31 | ||
|---|---|---|---|---|---|---|---|---|---|---|---|---|---|---|---|---|---|---|---|---|---|---|---|---|---|---|---|---|---|---|---|---|---|---|---|---|---|---|---|---|---|---|---|---|---|---|---|---|---|---|---|---|---|---|---|---|---|
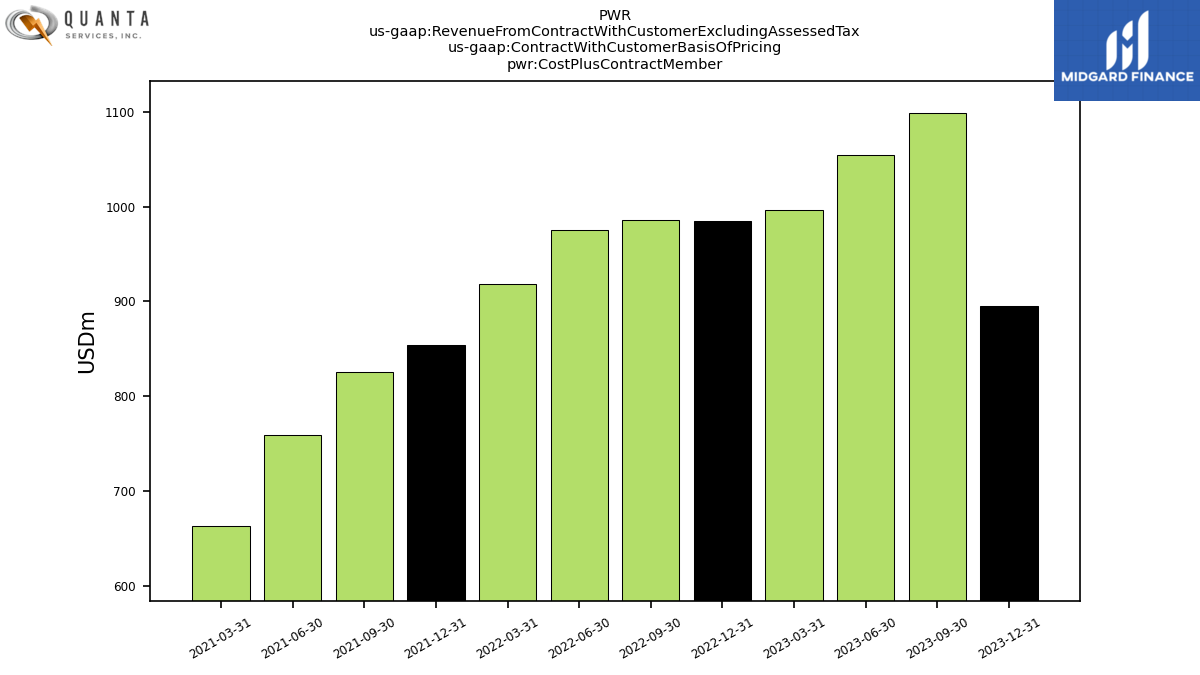
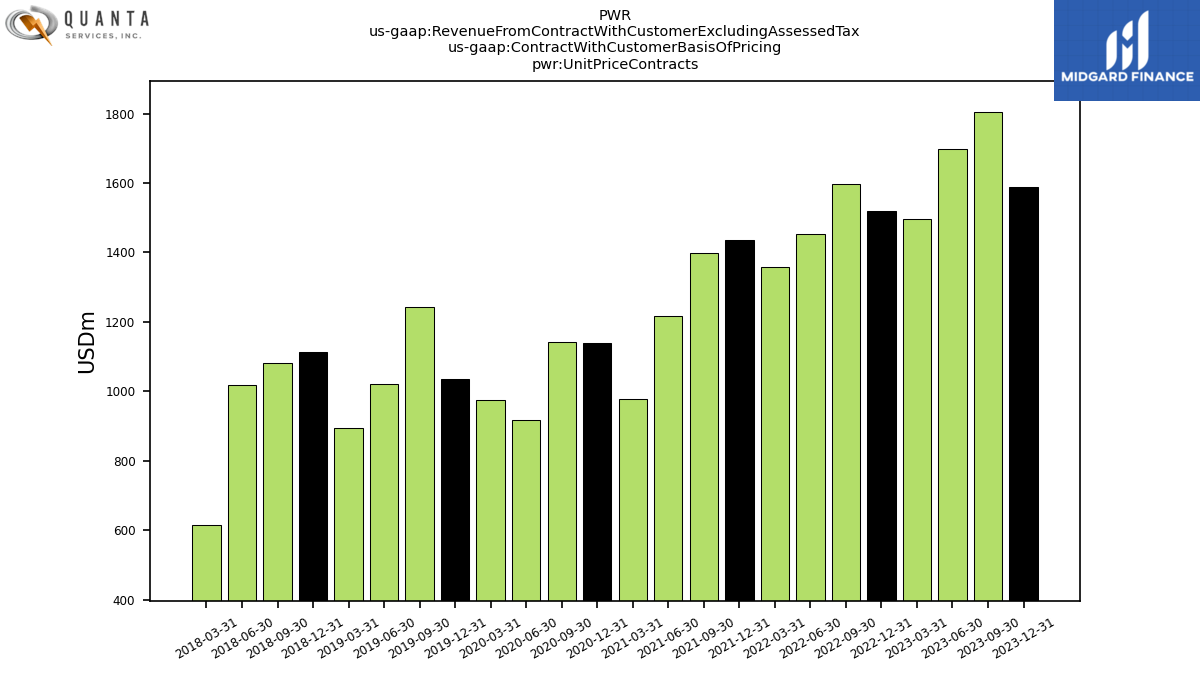
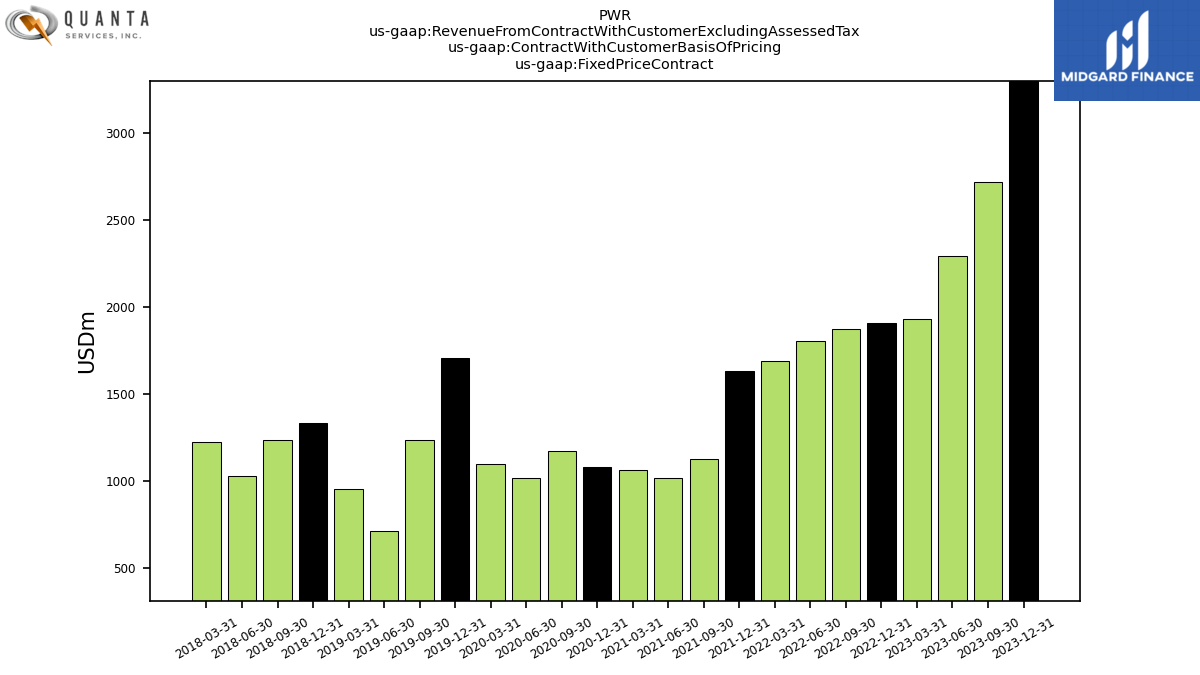
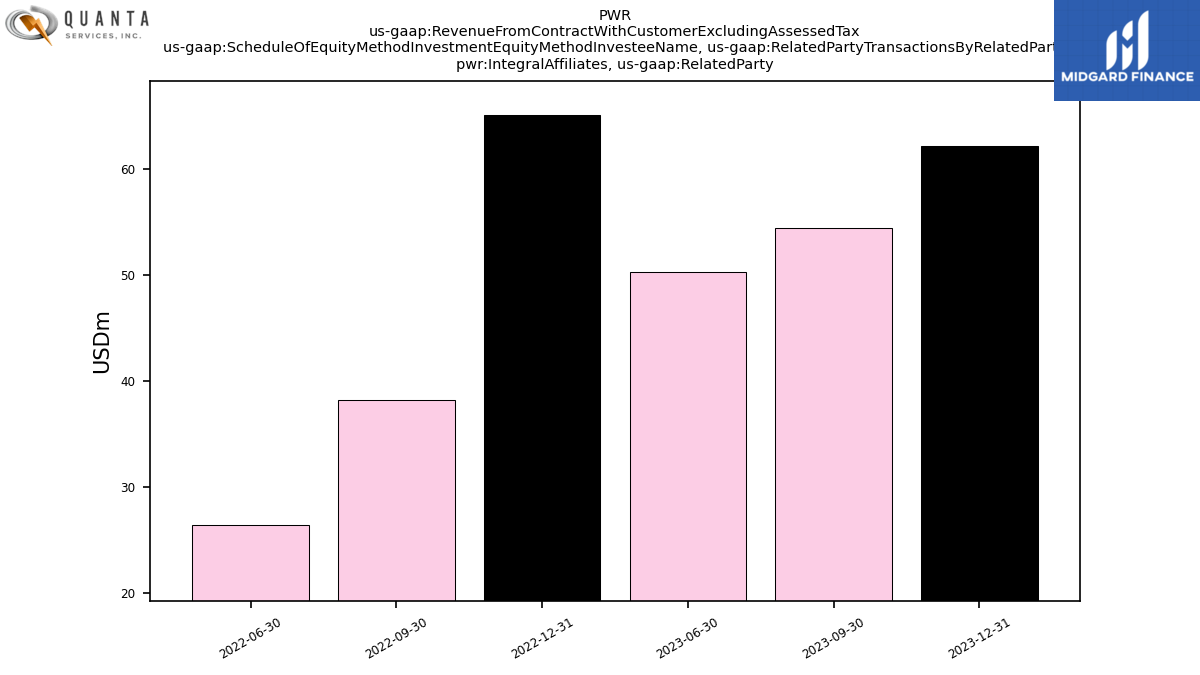
| Revenue From Contract With Customer Excluding Assessed Tax | 5783.95 | 5620.82 | 5048.61 | 4428.83 | 4416.62 | 4459.76 | 4232.00 | 3965.53 | 3923.54 | 3353.28 | 2999.82 | 2703.58 | 2912.18 | 3020.16 | 2506.23 | 2764.09 | 3112.80 | 3352.89 | 2839.20 | 2807.26 | 3112.22 | 2985.28 | 2656.35 | 2417.58 | 2478.63 | 2609.31 | 2200.37 | 2178.17 | 2102.97 | 2042.19 | 1792.43 | 1713.74 | 1899.27 | 1939.44 | 1872.34 | 1886.96 | 2052.98 | 2171.14 | 1864.55 | 1762.57 | 1817.62 | 1645.13 | 1474.38 | 1585.71 | 1673.34 | 1685.20 | 1516.70 | 1425.18 | 1513.14 | 1250.82 | 1010.91 | 848.96 | 1106.43 | 1206.01 | 870.50 | 748.28 | |
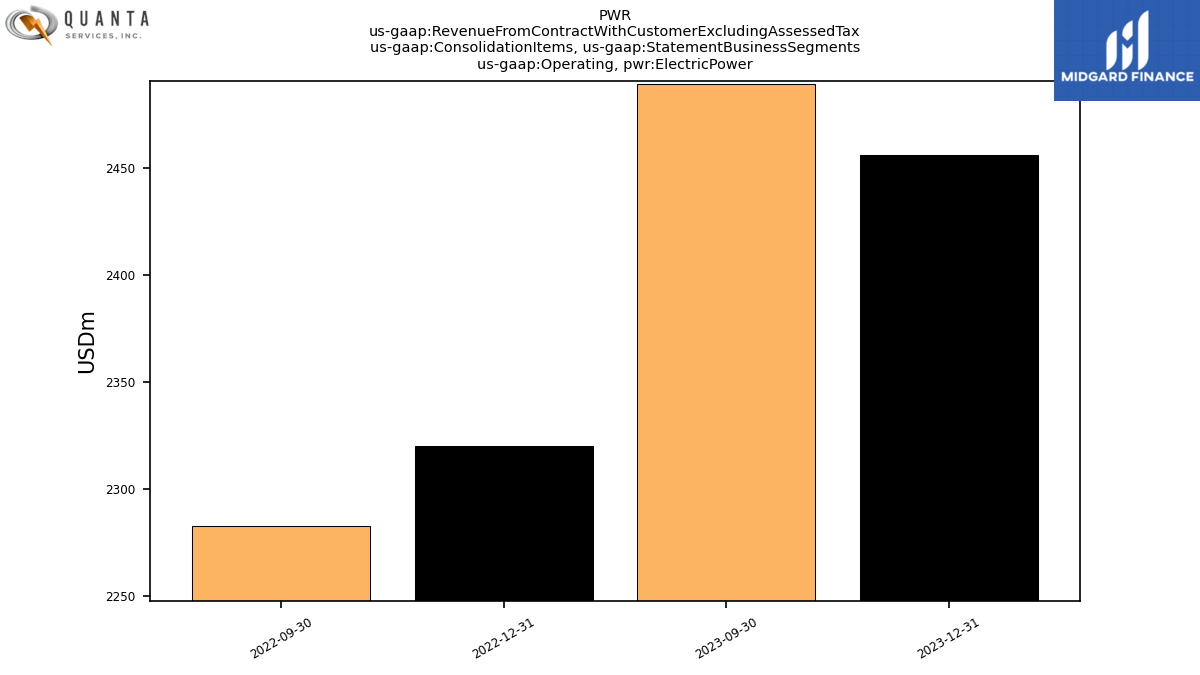
| Operating, Electric Power | 2456.06 | 2489.55 | NA | NA | 2319.82 | 2282.33 | NA | NA | NA | NA | NA | NA | NA | NA | NA | NA | NA | NA | NA | NA | NA | NA | NA | NA | NA | NA | NA | NA | NA | NA | NA | NA | NA | NA | NA | NA | NA | NA | NA | NA | NA | NA | NA | NA | NA | NA | NA | NA | NA | NA | NA | NA | NA | NA | NA | NA | |
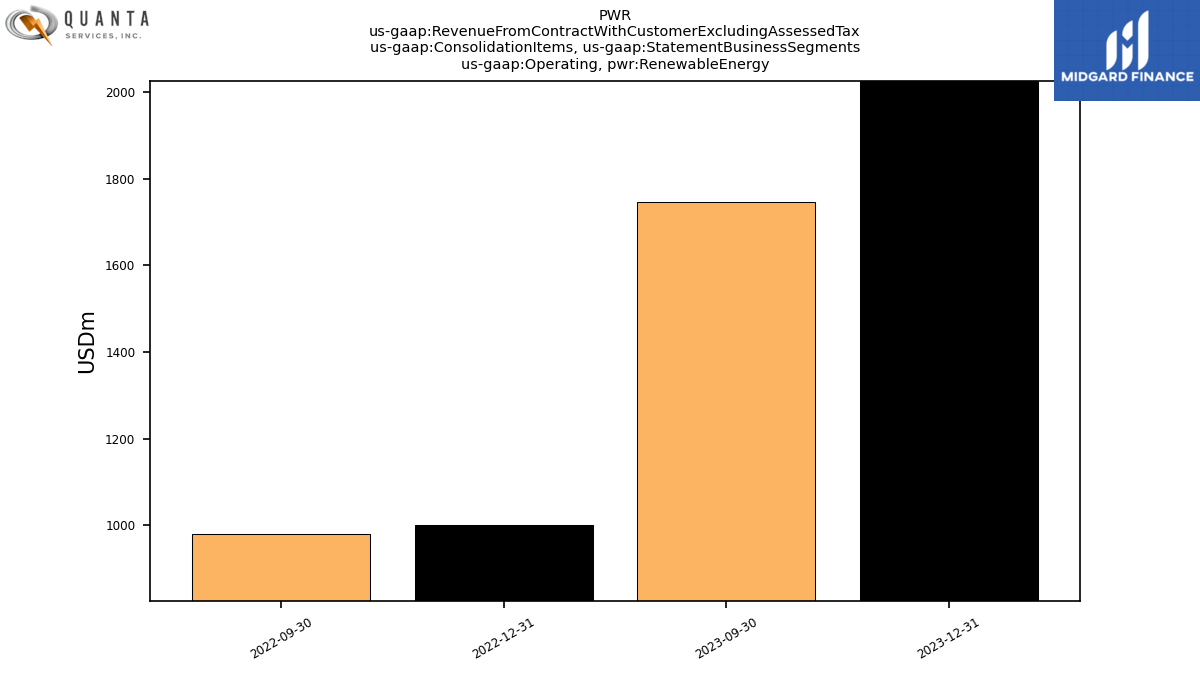
| Operating, Renewable Energy | 2026.00 | 1746.64 | NA | NA | 999.91 | 978.78 | NA | NA | NA | NA | NA | NA | NA | NA | NA | NA | NA | NA | NA | NA | NA | NA | NA | NA | NA | NA | NA | NA | NA | NA | NA | NA | NA | NA | NA | NA | NA | NA | NA | NA | NA | NA | NA | NA | NA | NA | NA | NA | NA | NA | NA | NA | NA | NA | NA | NA | |
| Cost Plus Contract Member | 895.41 | 1098.14 | 1054.09 | 996.54 | 984.54 | 986.26 | 974.94 | 918.29 | 854.20 | 825.62 | 759.49 | 662.77 | NA | NA | NA | NA | NA | NA | NA | NA | NA | NA | NA | NA | NA | NA | NA | NA | NA | NA | NA | NA | NA | NA | NA | NA | NA | NA | NA | NA | NA | NA | NA | NA | NA | NA | NA | NA | NA | NA | NA | NA | NA | NA | NA | NA | |
| Unit Price Contracts | 1588.19 | 1803.76 | 1697.63 | 1497.39 | 1520.19 | 1597.64 | 1451.90 | 1357.60 | 1435.46 | 1399.36 | 1217.72 | 976.56 | 1138.19 | 1141.10 | 918.42 | 974.65 | 1035.75 | 1241.85 | 1020.65 | 895.04 | 1114.56 | 1082.86 | 1018.14 | 613.44 | NA | NA | NA | NA | NA | NA | NA | NA | NA | NA | NA | NA | NA | NA | NA | NA | NA | NA | NA | NA | NA | NA | NA | NA | NA | NA | NA | NA | NA | NA | NA | NA | |
| Fixed Price Contract | 3300.34 | 2718.92 | 2296.89 | 1934.89 | 1911.89 | 1875.86 | 1805.16 | 1689.63 | 1633.89 | 1128.30 | 1022.61 | 1064.25 | 1082.62 | 1176.67 | 1019.89 | 1101.36 | 1707.11 | 1238.31 | 715.41 | 953.86 | 1337.65 | 1239.67 | 1032.99 | 1225.09 | NA | NA | NA | NA | NA | NA | NA | NA | NA | NA | NA | NA | NA | NA | NA | NA | NA | NA | NA | NA | NA | NA | NA | NA | NA | NA | NA | NA | NA | NA | NA | NA | |
| Integral Affiliates, Related Party | 62.10 | 54.40 | 50.20 | NA | 65.00 | 38.20 | 26.40 | NA | NA | NA | NA | NA | NA | NA | NA | NA | NA | NA | NA | NA | NA | NA | NA | NA | NA | NA | NA | NA | NA | NA | NA | NA | NA | NA | NA | NA | NA | NA | NA | NA | NA | NA | NA | NA | NA | NA | NA | NA | NA | NA | NA | NA | NA | NA | NA | NA | |
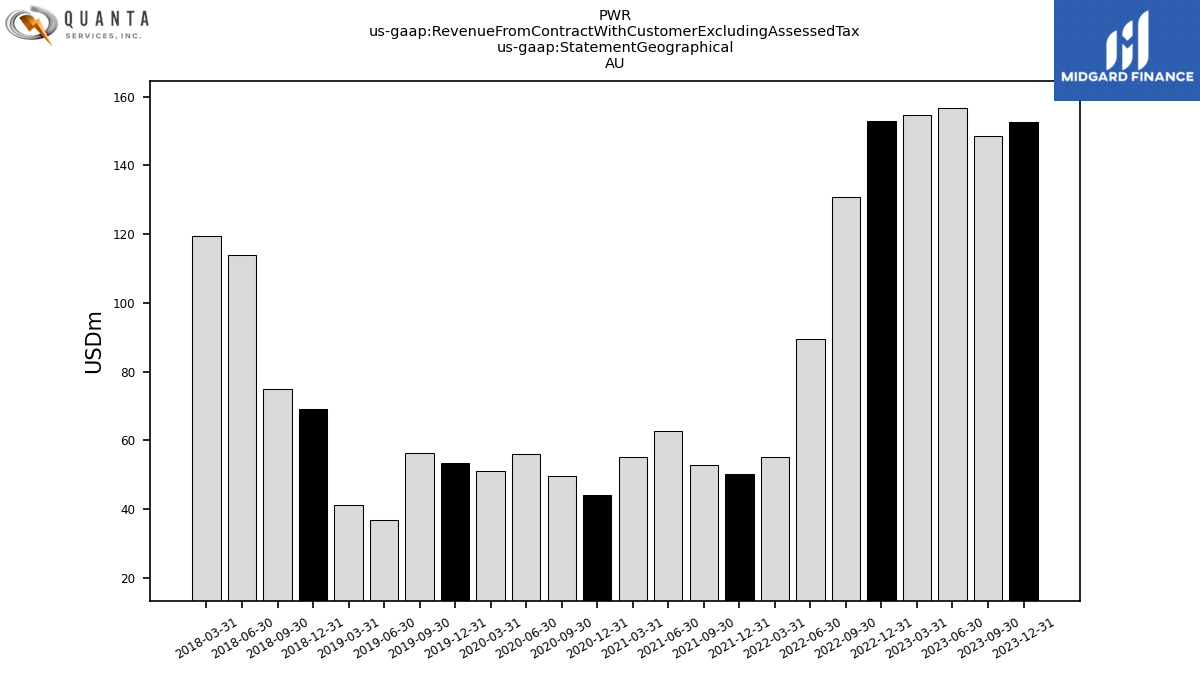
| 152.60 | 148.50 | 156.72 | 154.68 | 152.90 | 130.85 | 89.37 | 55.20 | 50.32 | 52.80 | 62.81 | 55.11 | 44.00 | 49.54 | 56.08 | 51.05 | 53.38 | 56.32 | 36.89 | 41.32 | 69.06 | 75.06 | 113.88 | 119.46 | NA | NA | NA | NA | NA | NA | NA | NA | NA | NA | NA | NA | NA | NA | NA | NA | NA | NA | NA | NA | NA | NA | NA | NA | NA | NA | NA | NA | NA | NA | NA | NA | ||
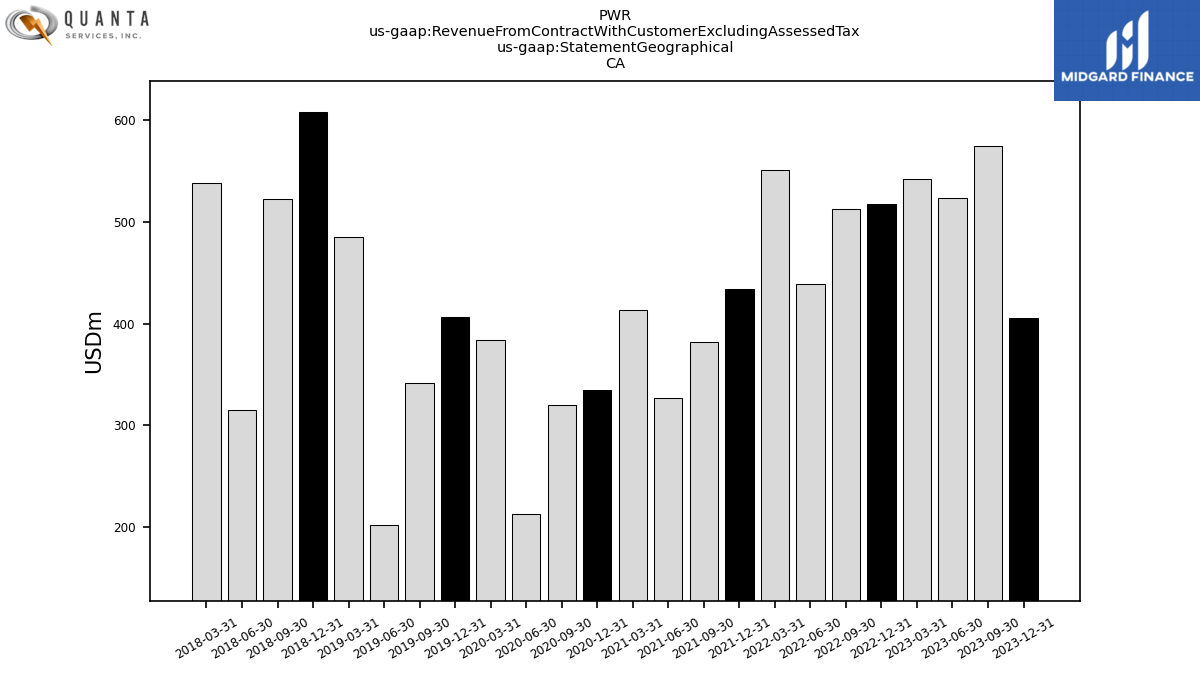
| 405.85 | 574.54 | 523.26 | 542.36 | 517.68 | 512.80 | 439.47 | 550.90 | 434.04 | 382.07 | 327.16 | 413.85 | 334.74 | 320.58 | 212.82 | 384.23 | 407.05 | 342.02 | 202.22 | 485.43 | 608.07 | 522.62 | 315.17 | 538.36 | NA | NA | NA | NA | NA | NA | NA | NA | NA | NA | NA | NA | NA | NA | NA | NA | NA | NA | NA | NA | NA | NA | NA | NA | NA | NA | NA | NA | NA | NA | NA | NA | ||
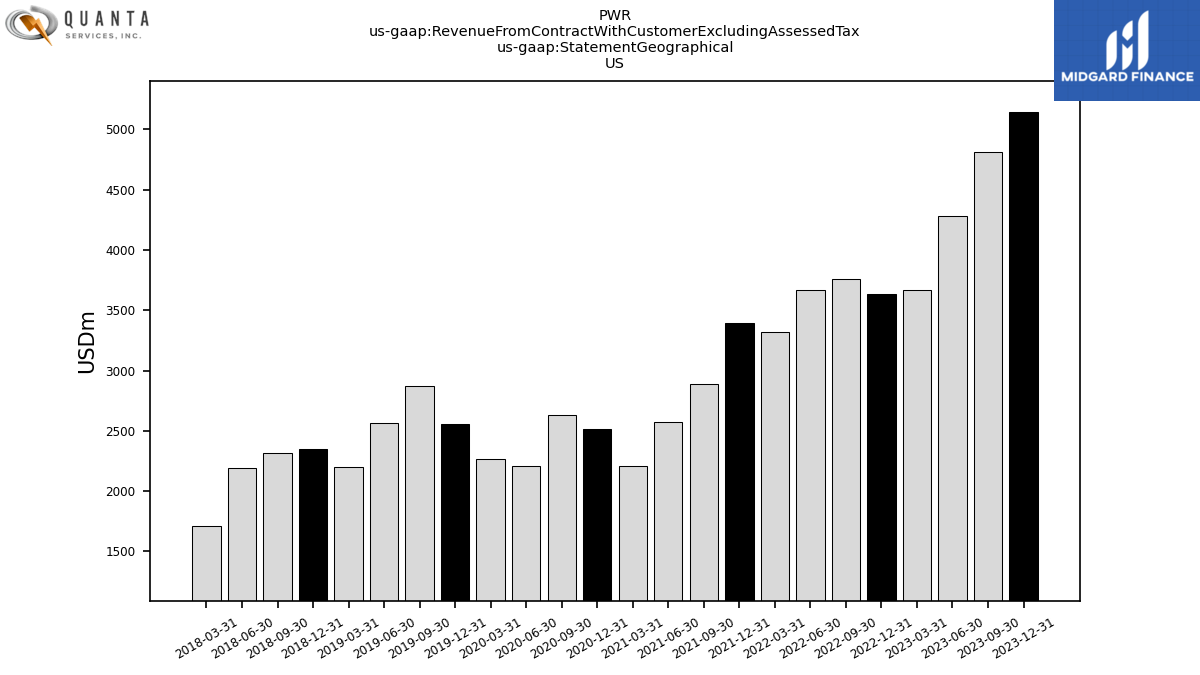
| US | 5144.80 | 4816.82 | 4282.90 | 3666.36 | 3638.91 | 3760.02 | 3667.34 | 3323.97 | 3399.13 | 2892.45 | 2570.80 | 2206.12 | 2513.38 | 2629.61 | 2207.88 | 2268.09 | 2555.22 | 2872.92 | 2561.92 | 2200.61 | 2351.83 | 2317.64 | 2193.44 | 1712.43 | NA | NA | NA | NA | NA | NA | NA | NA | NA | NA | NA | NA | NA | NA | NA | NA | NA | NA | NA | NA | NA | NA | NA | NA | NA | NA | NA | NA | NA | NA | NA | NA | |
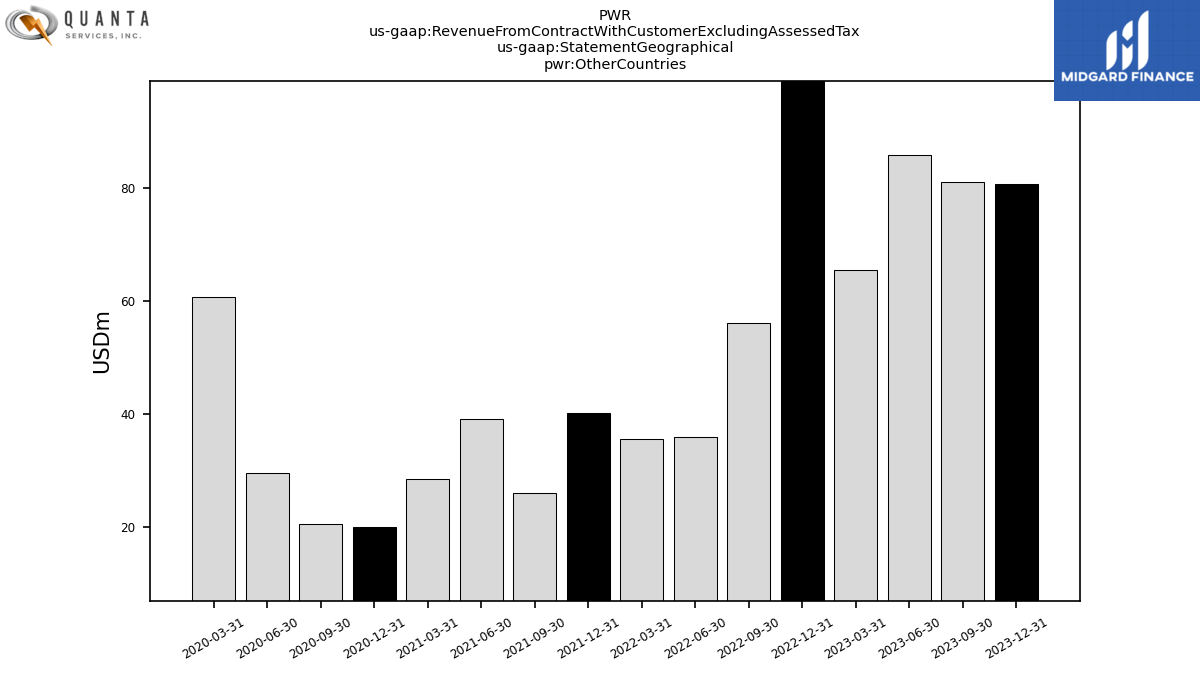
| Other Countries | 80.71 | 80.96 | 85.72 | 65.42 | 107.13 | 56.08 | 35.83 | 35.45 | 40.05 | 25.96 | 39.05 | 28.51 | 20.06 | 20.44 | 29.46 | 60.73 | NA | NA | NA | NA | NA | NA | NA | NA | NA | NA | NA | NA | NA | NA | NA | NA | NA | NA | NA | NA | NA | NA | NA | NA | NA | NA | NA | NA | NA | NA | NA | NA | NA | NA | NA | NA | NA | NA | NA | NA |