
| 2024-02-04 | 2023-10-29 | 2023-07-30 | 2023-04-30 | 2023-01-29 | 2022-10-30 | 2022-07-31 | 2022-05-01 | 2022-01-30 | 2021-10-31 | 2021-08-01 | 2021-05-02 | 2021-01-31 | 2020-11-01 | 2020-08-02 | 2020-05-03 | 2020-02-02 | 2019-11-03 | 2019-08-04 | 2019-05-05 | 2019-02-03 | 2018-11-04 | 2018-08-05 | 2018-05-06 | 2018-02-04 | 2017-10-29 | 2017-07-30 | 2017-04-30 | 2017-01-29 | 2016-10-30 | 2016-07-31 | 2016-05-01 | 2016-01-31 | 2015-11-01 | 2015-08-02 | 2015-05-03 | 2015-02-01 | 2014-11-02 | 2014-08-03 | 2014-05-04 | 2014-02-02 | 2013-11-03 | 2013-08-04 | 2013-05-05 | 2013-02-03 | 2012-10-28 | 2012-07-29 | 2012-04-29 | 2012-01-29 | 2011-10-30 | 2011-07-31 | 2011-05-01 | 2011-01-30 | 2010-10-31 | 2010-08-01 | 2010-05-02 | 2010-01-31 | ||
|---|---|---|---|---|---|---|---|---|---|---|---|---|---|---|---|---|---|---|---|---|---|---|---|---|---|---|---|---|---|---|---|---|---|---|---|---|---|---|---|---|---|---|---|---|---|---|---|---|---|---|---|---|---|---|---|---|---|---|
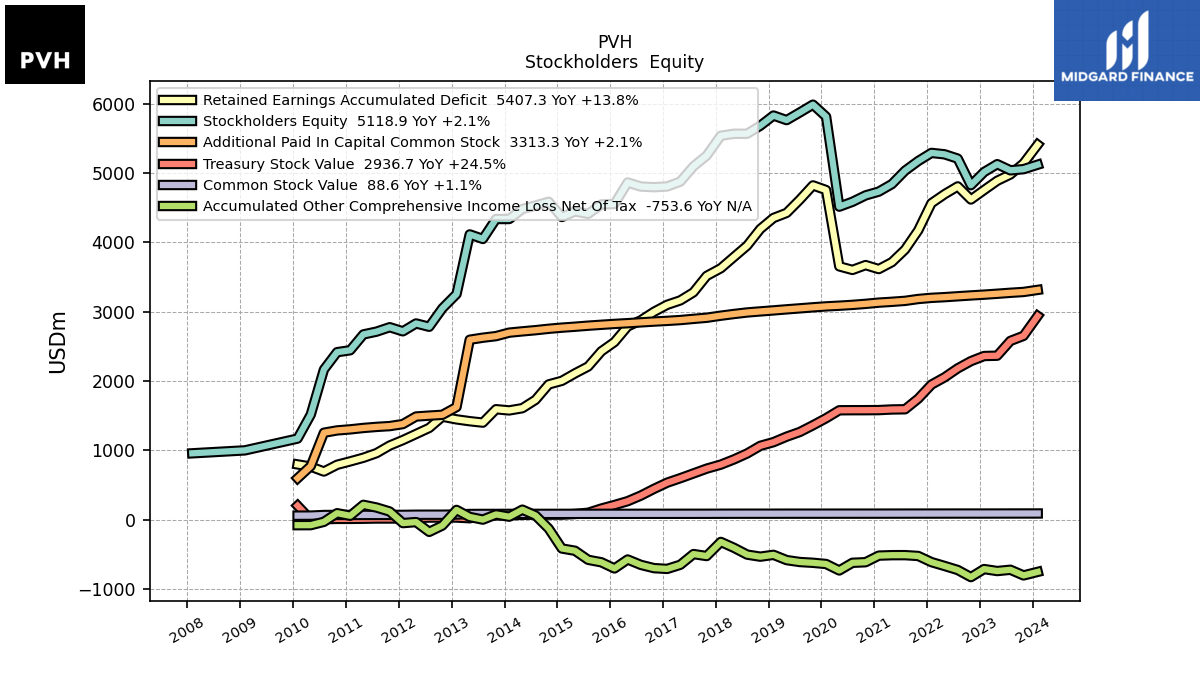
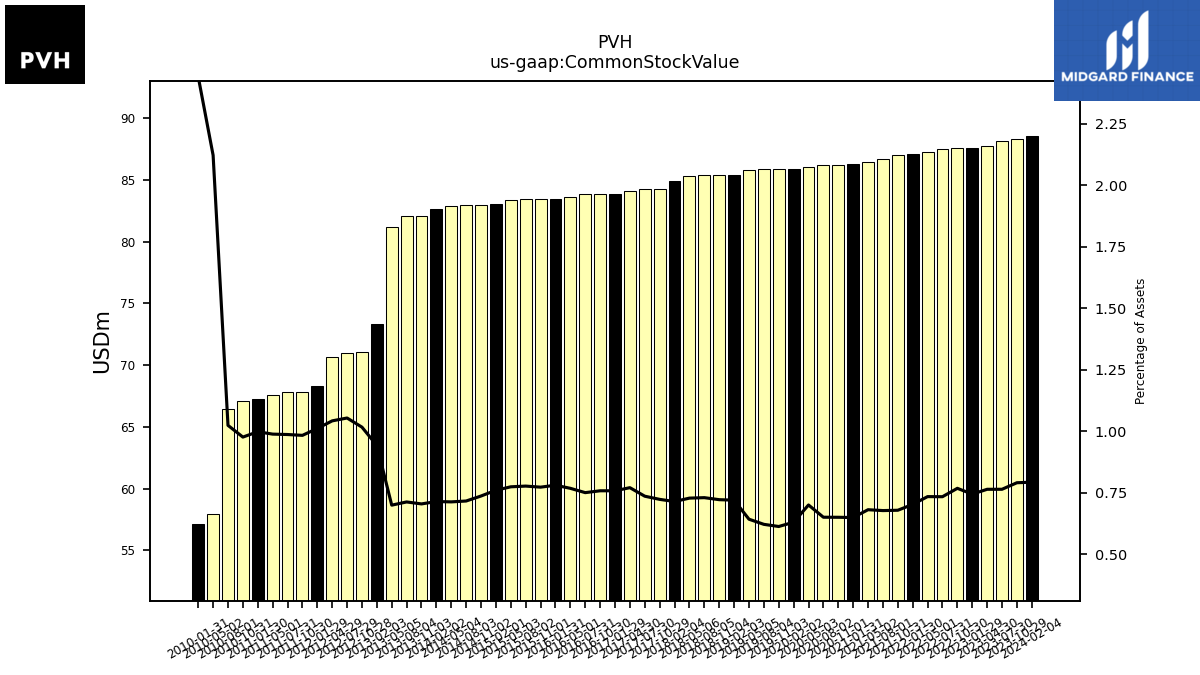
| Common Stock Value | 88.60 | 88.30 | 88.20 | 87.80 | 87.60 | 87.60 | 87.50 | 87.30 | 87.10 | 87.00 | 86.70 | 86.50 | 86.30 | 86.20 | 86.20 | 86.10 | 85.90 | 85.90 | 85.90 | 85.80 | 85.40 | 85.40 | 85.40 | 85.30 | 84.90 | 84.30 | 84.30 | 84.10 | 83.90 | 83.90 | 83.90 | 83.60 | 83.50 | 83.50 | 83.50 | 83.40 | 83.10 | 83.00 | 83.00 | 82.90 | 82.68 | 82.10 | 82.05 | 81.20 | 73.32 | 71.04 | 70.95 | 70.68 | 68.30 | 67.83 | 67.80 | 67.55 | 67.23 | 67.11 | 66.45 | 57.95 | 57.14 | |
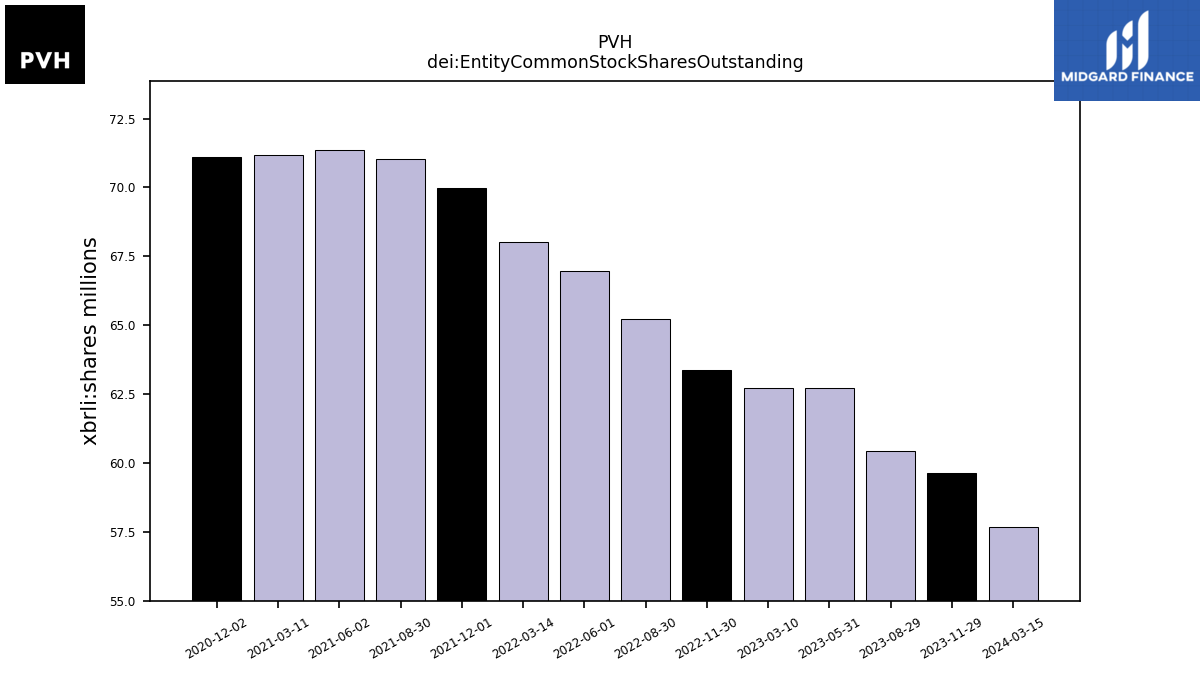
| dei: Entity Common Stock Shares Outstanding | NA | NA | NA | NA | NA | NA | NA | NA | NA | NA | NA | NA | NA | NA | NA | NA | NA | NA | NA | NA | NA | NA | NA | NA | NA | NA | NA | NA | NA | NA | NA | NA | NA | NA | NA | NA | NA | NA | NA | NA | NA | NA | NA | NA | NA | NA | NA | NA | NA | NA | NA | NA | NA | NA | NA | NA | NA |
| 2024-02-04 | 2023-10-29 | 2023-07-30 | 2023-04-30 | 2023-01-29 | 2022-10-30 | 2022-07-31 | 2022-05-01 | 2022-01-30 | 2021-10-31 | 2021-08-01 | 2021-05-02 | 2021-01-31 | 2020-11-01 | 2020-08-02 | 2020-05-03 | 2020-02-02 | 2019-11-03 | 2019-08-04 | 2019-05-05 | 2019-02-03 | 2018-11-04 | 2018-08-05 | 2018-05-06 | 2018-02-04 | 2017-10-29 | 2017-07-30 | 2017-04-30 | 2017-01-29 | 2016-10-30 | 2016-07-31 | 2016-05-01 | 2016-01-31 | 2015-11-01 | 2015-08-02 | 2015-05-03 | 2015-02-01 | 2014-11-02 | 2014-08-03 | 2014-05-04 | 2014-02-02 | 2013-11-03 | 2013-08-04 | 2013-05-05 | 2013-02-03 | 2012-10-28 | 2012-07-29 | 2012-04-29 | 2012-01-29 | 2011-10-30 | 2011-07-31 | 2011-05-01 | 2011-01-30 | 2010-10-31 | 2010-08-01 | 2010-05-02 | 2010-01-31 | ||
|---|---|---|---|---|---|---|---|---|---|---|---|---|---|---|---|---|---|---|---|---|---|---|---|---|---|---|---|---|---|---|---|---|---|---|---|---|---|---|---|---|---|---|---|---|---|---|---|---|---|---|---|---|---|---|---|---|---|---|
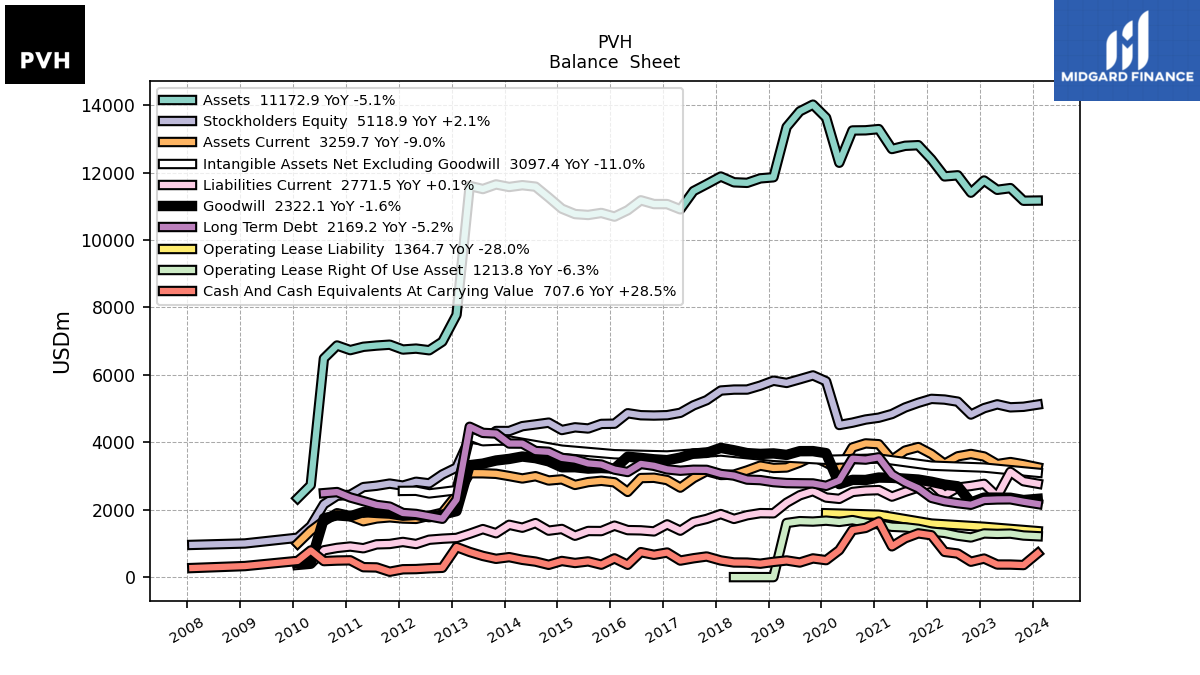
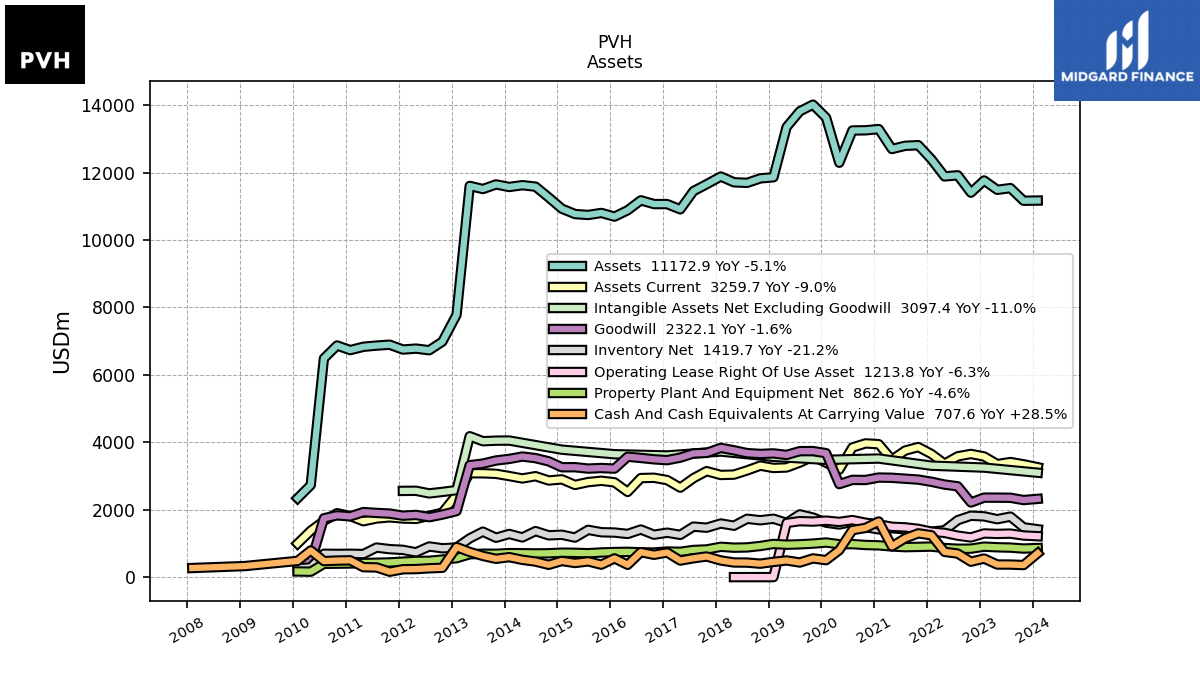
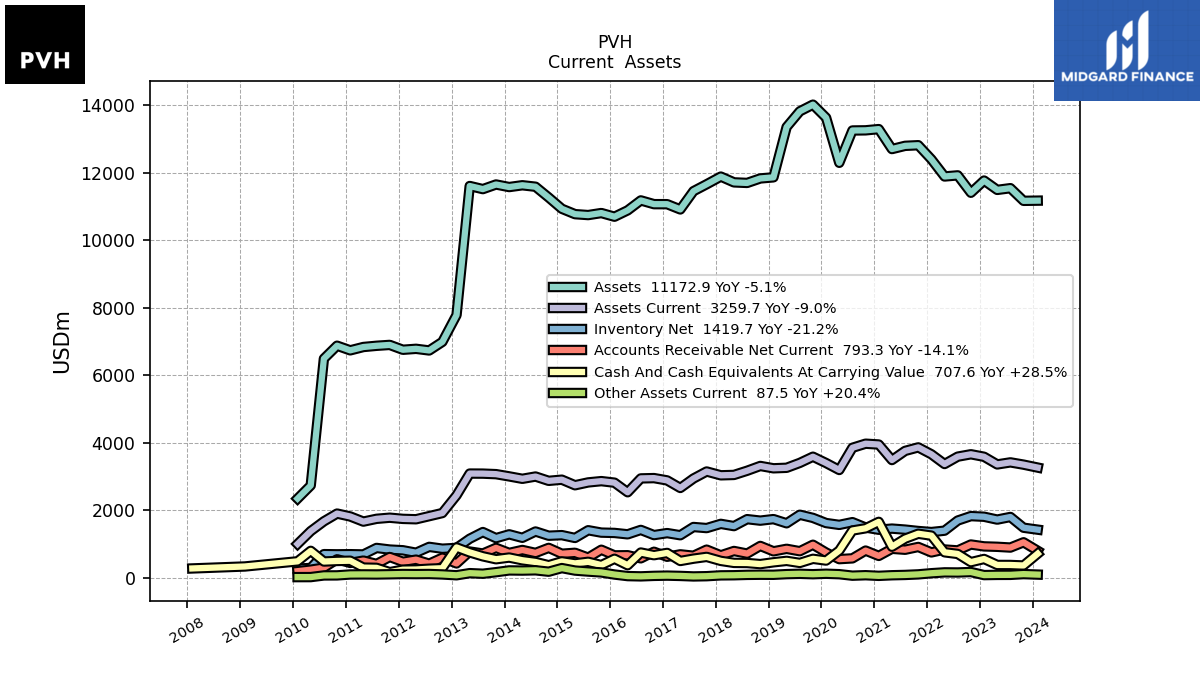
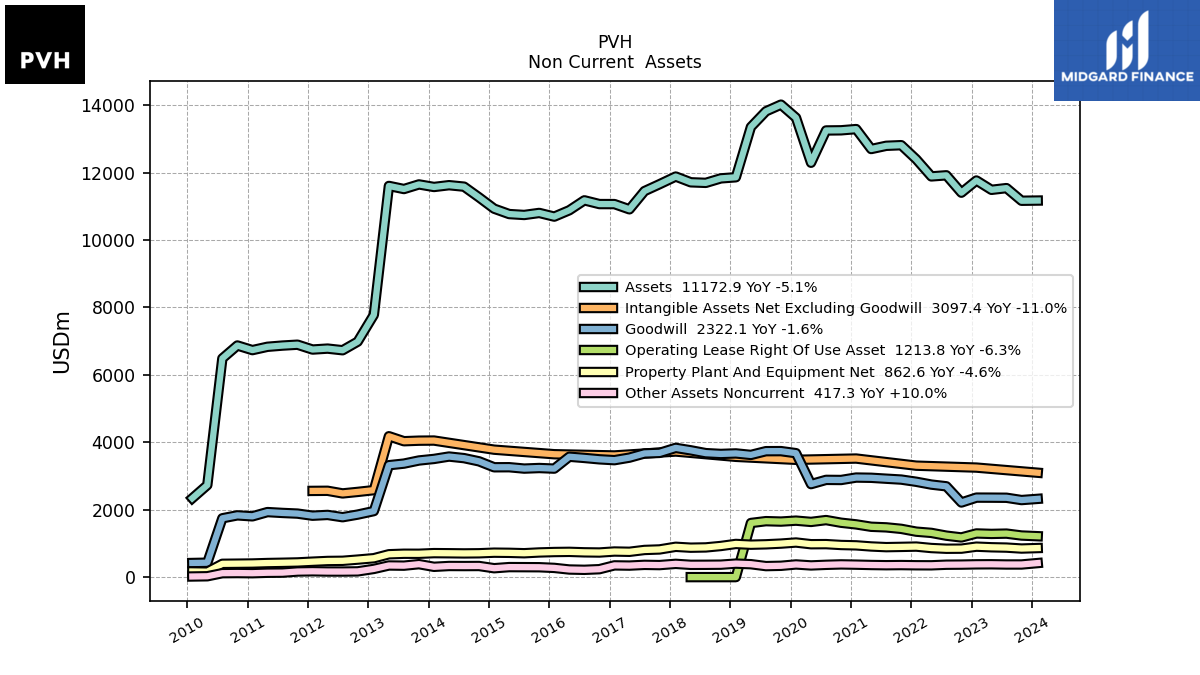
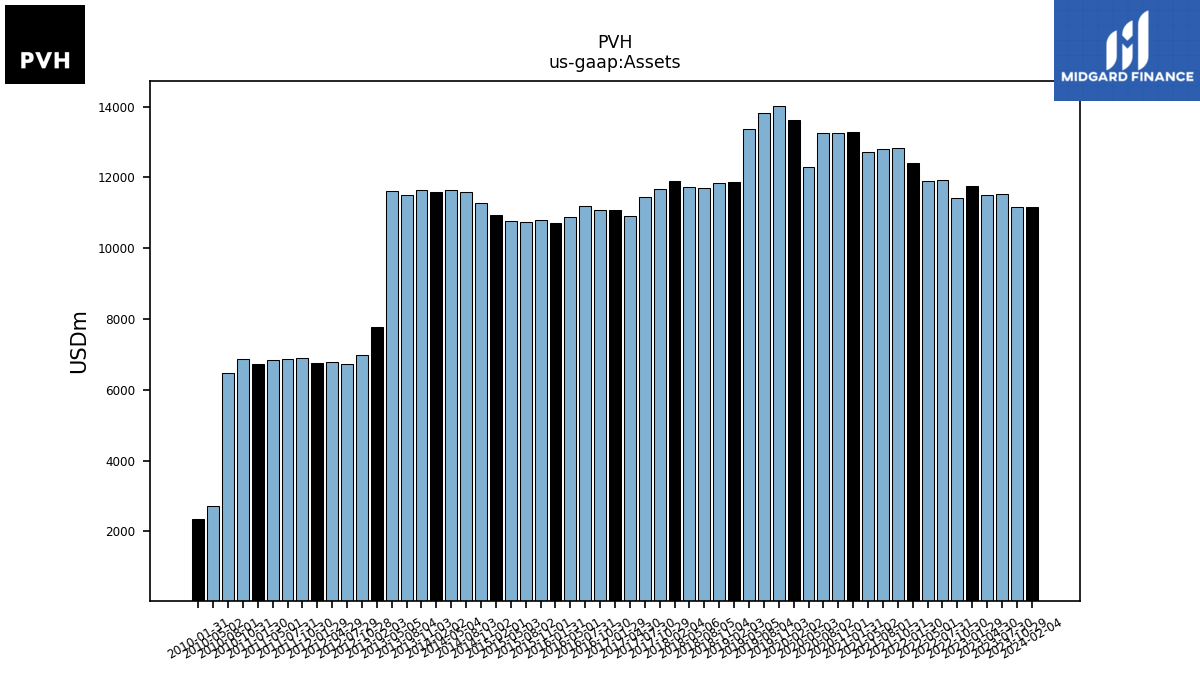
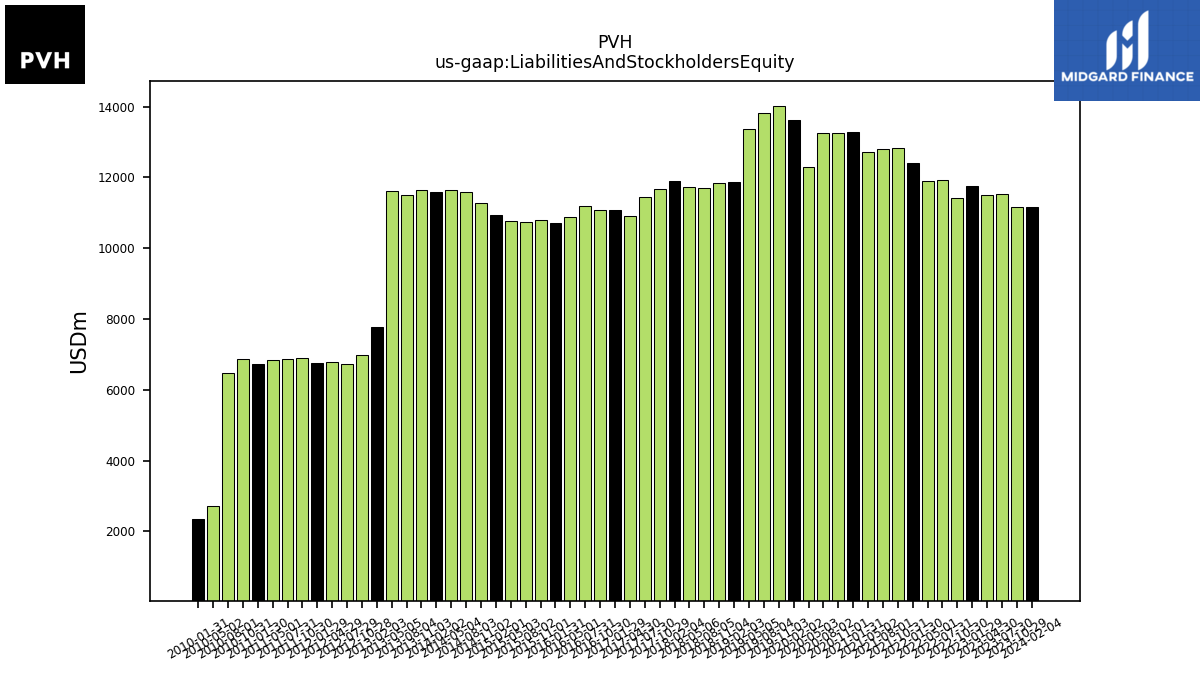
| Assets | 11172.90 | 11167.10 | 11542.40 | 11491.20 | 11768.30 | 11405.90 | 11922.30 | 11889.30 | 12396.80 | 12816.00 | 12797.30 | 12701.60 | 13293.50 | 13257.20 | 13252.50 | 12294.20 | 13631.00 | 14019.20 | 13820.90 | 13355.00 | 11863.70 | 11830.90 | 11697.70 | 11714.60 | 11885.70 | 11658.20 | 11453.90 | 10912.30 | 11067.90 | 11068.60 | 11179.80 | 10885.10 | 10696.40 | 10805.40 | 10745.00 | 10772.40 | 10931.80 | 11265.70 | 11585.30 | 11629.00 | 11575.58 | 11651.62 | 11514.75 | 11607.28 | 7781.55 | 6985.97 | 6731.49 | 6780.40 | 6752.36 | 6896.36 | 6870.15 | 6834.05 | 6735.33 | 6872.75 | 6488.60 | 2730.02 | 2339.68 | |
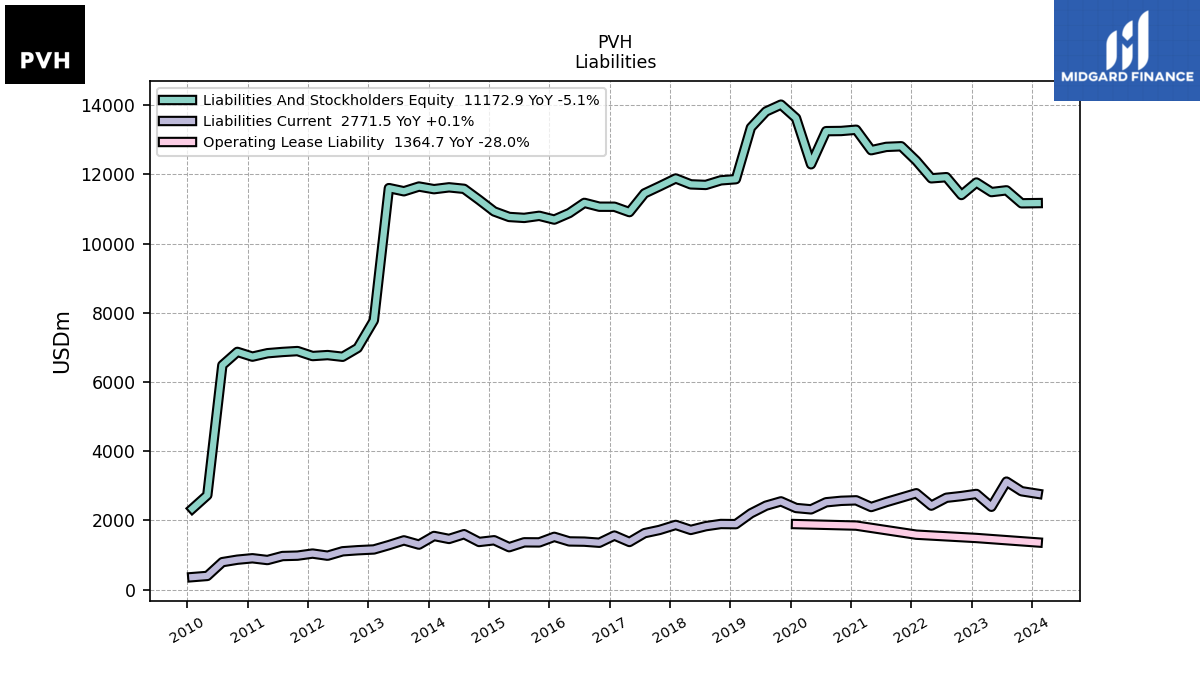
| Liabilities And Stockholders Equity | 11172.90 | 11167.10 | 11542.40 | 11491.20 | 11768.30 | 11405.90 | 11922.30 | 11889.30 | 12396.80 | 12816.00 | 12797.30 | 12701.60 | 13293.50 | 13257.20 | 13252.50 | 12294.20 | 13631.00 | 14019.20 | 13820.90 | 13355.00 | 11863.70 | 11830.90 | 11697.70 | 11714.60 | 11885.70 | 11658.20 | 11453.90 | 10912.30 | 11067.90 | 11068.60 | 11179.80 | 10885.10 | 10696.40 | 10805.40 | 10745.00 | 10772.40 | 10931.80 | 11265.70 | 11585.30 | 11629.00 | 11575.58 | 11651.62 | 11514.75 | 11607.28 | 7781.55 | 6985.97 | 6731.49 | 6780.40 | 6752.36 | 6896.36 | 6870.15 | 6834.05 | 6735.33 | 6872.75 | 6488.60 | 2730.02 | 2339.68 | |
| Stockholders Equity | 5118.90 | 5054.30 | 5037.60 | 5126.40 | 5012.70 | 4822.80 | 5206.40 | 5268.50 | 5288.80 | 5171.70 | 5032.80 | 4839.40 | 4730.30 | 4676.20 | 4583.50 | 4513.40 | 5811.50 | 5985.10 | 5871.70 | 5761.50 | 5827.80 | 5681.20 | 5565.40 | 5564.60 | 5536.40 | 5249.80 | 5095.20 | 4875.00 | 4804.50 | 4794.30 | 4803.50 | 4862.30 | 4552.30 | 4545.60 | 4409.80 | 4444.50 | 4364.30 | 4583.80 | 4530.30 | 4479.50 | 4335.18 | 4335.57 | 4047.76 | 4113.69 | 3252.57 | 3046.62 | 2781.20 | 2829.31 | 2715.45 | 2774.89 | 2711.20 | 2670.99 | 2442.56 | 2414.76 | 2163.46 | 1513.25 | 1168.55 |
| 2024-02-04 | 2023-10-29 | 2023-07-30 | 2023-04-30 | 2023-01-29 | 2022-10-30 | 2022-07-31 | 2022-05-01 | 2022-01-30 | 2021-10-31 | 2021-08-01 | 2021-05-02 | 2021-01-31 | 2020-11-01 | 2020-08-02 | 2020-05-03 | 2020-02-02 | 2019-11-03 | 2019-08-04 | 2019-05-05 | 2019-02-03 | 2018-11-04 | 2018-08-05 | 2018-05-06 | 2018-02-04 | 2017-10-29 | 2017-07-30 | 2017-04-30 | 2017-01-29 | 2016-10-30 | 2016-07-31 | 2016-05-01 | 2016-01-31 | 2015-11-01 | 2015-08-02 | 2015-05-03 | 2015-02-01 | 2014-11-02 | 2014-08-03 | 2014-05-04 | 2014-02-02 | 2013-11-03 | 2013-08-04 | 2013-05-05 | 2013-02-03 | 2012-10-28 | 2012-07-29 | 2012-04-29 | 2012-01-29 | 2011-10-30 | 2011-07-31 | 2011-05-01 | 2011-01-30 | 2010-10-31 | 2010-08-01 | 2010-05-02 | 2010-01-31 | ||
|---|---|---|---|---|---|---|---|---|---|---|---|---|---|---|---|---|---|---|---|---|---|---|---|---|---|---|---|---|---|---|---|---|---|---|---|---|---|---|---|---|---|---|---|---|---|---|---|---|---|---|---|---|---|---|---|---|---|---|
| Assets Current | 3259.70 | 3347.10 | 3414.10 | 3353.20 | 3580.40 | 3654.70 | 3584.40 | 3365.00 | 3653.70 | 3858.90 | 3754.30 | 3483.00 | 3943.70 | 3967.90 | 3846.80 | 3188.30 | 3394.20 | 3582.10 | 3398.60 | 3253.40 | 3238.60 | 3307.80 | 3166.00 | 3041.60 | 3030.80 | 3144.10 | 2935.50 | 2655.20 | 2879.60 | 2948.10 | 2939.00 | 2528.20 | 2812.60 | 2858.20 | 2819.80 | 2735.70 | 2901.20 | 2866.70 | 2994.50 | 2927.30 | 2998.59 | 3064.95 | 3080.64 | 3082.45 | 2437.01 | 1912.12 | 1819.94 | 1727.95 | 1739.23 | 1774.04 | 1740.84 | 1658.34 | 1810.56 | 1896.42 | 1666.66 | 1376.39 | 994.88 | |
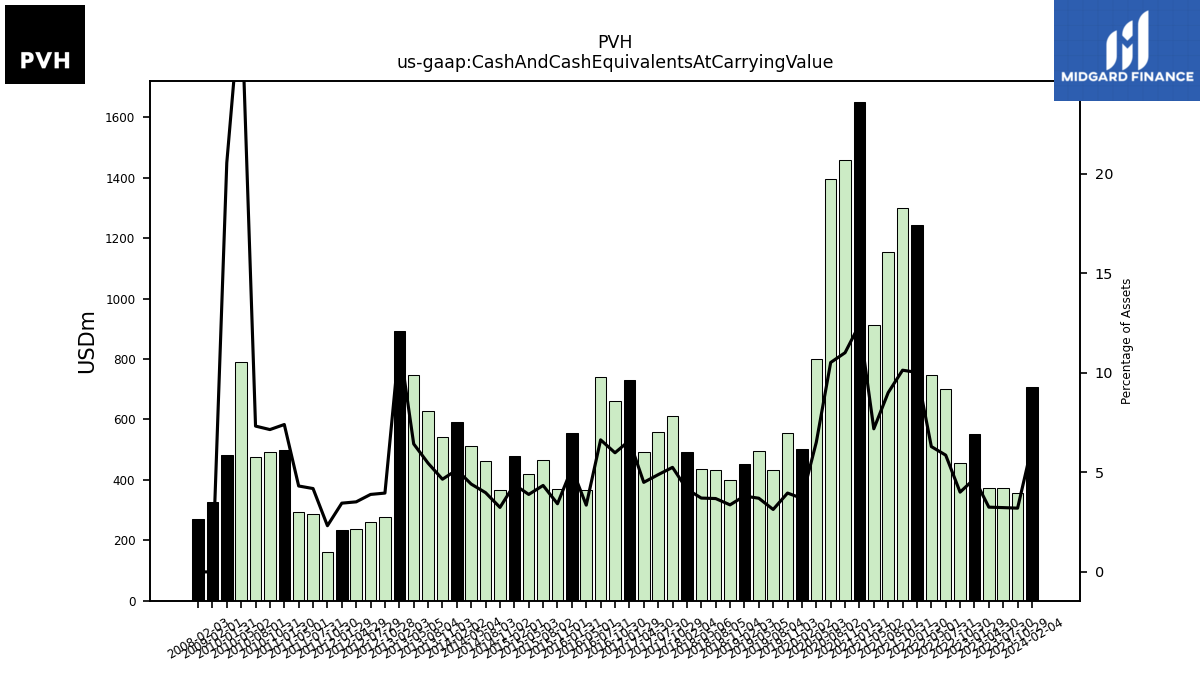
| Cash And Cash Equivalents At Carrying Value | 707.60 | 357.60 | 372.80 | 373.80 | 550.70 | 457.00 | 699.30 | 748.70 | 1242.50 | 1298.70 | 1152.60 | 913.20 | 1651.40 | 1460.00 | 1394.30 | 800.70 | 503.40 | 555.20 | 433.50 | 494.30 | 452.00 | 398.50 | 431.10 | 434.50 | 493.90 | 612.30 | 559.40 | 490.90 | 730.10 | 662.40 | 741.70 | 365.10 | 556.40 | 369.90 | 466.70 | 419.30 | 479.30 | 365.10 | 461.10 | 513.00 | 593.16 | 542.53 | 628.92 | 746.28 | 892.21 | 276.63 | 261.99 | 238.61 | 233.20 | 159.98 | 287.69 | 294.96 | 498.72 | 491.44 | 475.34 | 791.60 | 480.88 | |
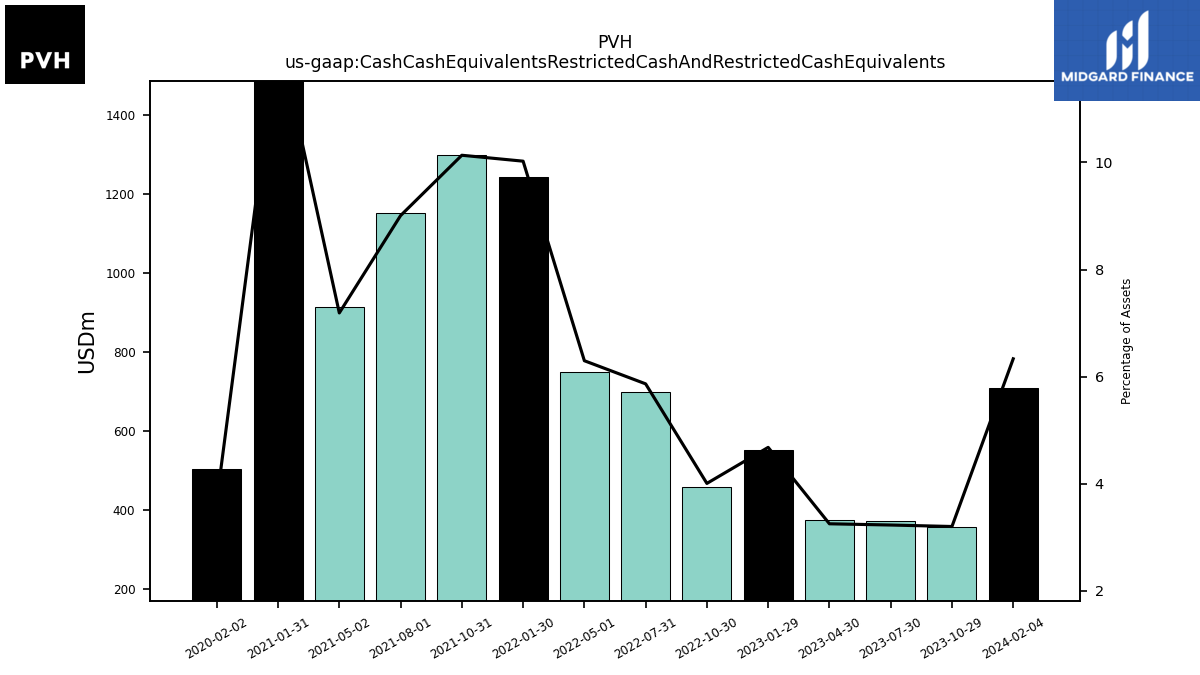
| Cash Cash Equivalents Restricted Cash And Restricted Cash Equivalents | 707.60 | 357.60 | 372.80 | 373.80 | 550.70 | 457.00 | 699.30 | 748.70 | 1242.50 | 1298.70 | 1152.60 | 913.20 | 1651.40 | NA | NA | NA | 503.40 | NA | NA | NA | NA | NA | NA | NA | NA | NA | NA | NA | NA | NA | NA | NA | NA | NA | NA | NA | NA | NA | NA | NA | NA | NA | NA | NA | NA | NA | NA | NA | NA | NA | NA | NA | NA | NA | NA | NA | NA | |
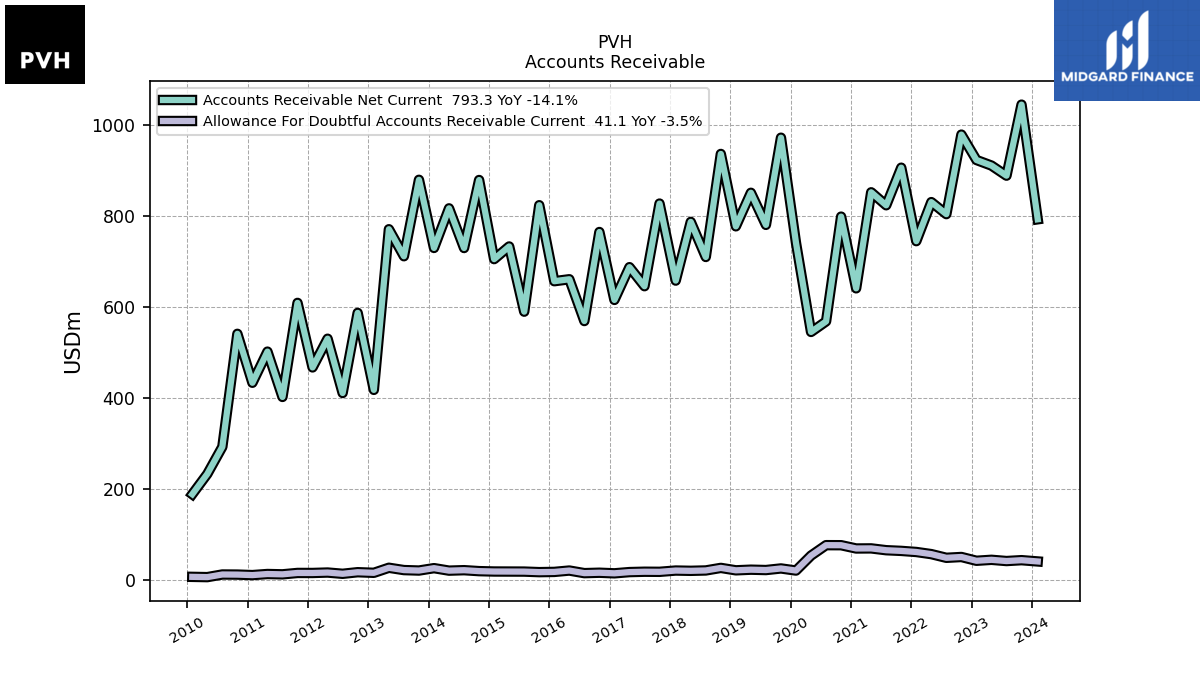
| Accounts Receivable Net Current | 793.30 | 1045.40 | 889.20 | 911.40 | 923.70 | 979.50 | 804.60 | 831.10 | 745.20 | 906.80 | 824.10 | 852.70 | 641.50 | 799.20 | 568.80 | 545.60 | 741.40 | 972.70 | 781.00 | 851.60 | 777.80 | 937.00 | 710.40 | 787.60 | 658.50 | 827.90 | 646.20 | 688.10 | 616.00 | 765.40 | 569.60 | 661.50 | 657.20 | 824.30 | 590.20 | 733.60 | 705.70 | 879.70 | 730.10 | 817.40 | 730.25 | 880.16 | 712.06 | 771.50 | 418.25 | 587.60 | 411.38 | 530.77 | 467.63 | 609.55 | 402.74 | 502.42 | 433.90 | 541.55 | 293.06 | 233.47 | 188.84 | |
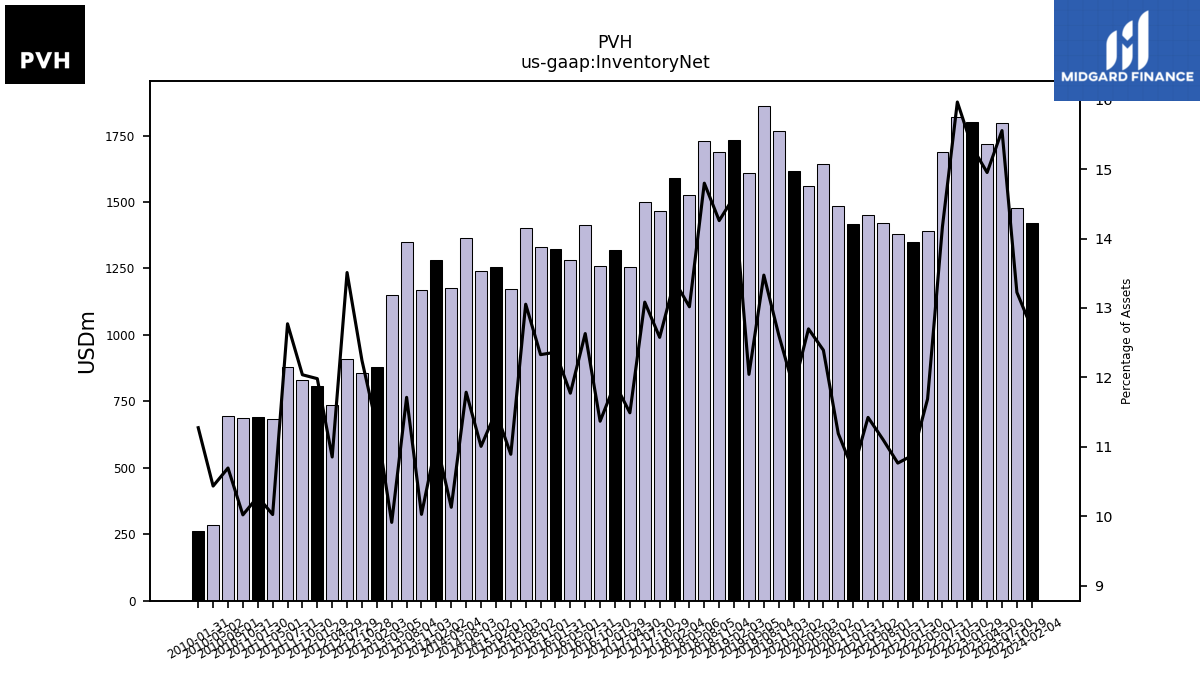
| Inventory Net | 1419.70 | 1476.90 | 1795.50 | 1718.10 | 1802.60 | 1821.20 | 1689.90 | 1389.70 | 1348.50 | 1379.60 | 1421.30 | 1450.90 | 1417.10 | 1483.50 | 1642.20 | 1561.20 | 1615.70 | 1768.10 | 1862.10 | 1608.40 | 1732.40 | 1686.90 | 1731.00 | 1524.90 | 1591.30 | 1466.20 | 1498.60 | 1253.80 | 1317.90 | 1258.30 | 1412.10 | 1281.40 | 1322.30 | 1332.00 | 1402.60 | 1173.30 | 1257.30 | 1239.90 | 1365.40 | 1177.80 | 1280.96 | 1168.19 | 1348.60 | 1150.31 | 878.41 | 855.36 | 909.45 | 735.85 | 809.01 | 830.14 | 877.45 | 685.03 | 692.31 | 688.56 | 693.87 | 284.84 | 263.79 | |
| Other Assets Current | 87.50 | 102.00 | 79.80 | 78.60 | 72.70 | 163.80 | 150.30 | 153.60 | 128.40 | 94.20 | 77.20 | 68.10 | 50.40 | 69.30 | 55.50 | 99.40 | 112.90 | 98.70 | 110.80 | 101.30 | 81.70 | 83.40 | 79.30 | 68.30 | 64.70 | 40.10 | 33.10 | 47.90 | 57.00 | 49.70 | 34.90 | 42.90 | 89.50 | 151.40 | 177.50 | 207.10 | 280.30 | 173.10 | 215.00 | 207.10 | 211.43 | 159.16 | 113.20 | 130.35 | 67.26 | 91.74 | 105.01 | 102.02 | 104.84 | 97.06 | 90.87 | 93.27 | 91.01 | 64.11 | 62.23 | 13.33 | 12.57 |
| 2024-02-04 | 2023-10-29 | 2023-07-30 | 2023-04-30 | 2023-01-29 | 2022-10-30 | 2022-07-31 | 2022-05-01 | 2022-01-30 | 2021-10-31 | 2021-08-01 | 2021-05-02 | 2021-01-31 | 2020-11-01 | 2020-08-02 | 2020-05-03 | 2020-02-02 | 2019-11-03 | 2019-08-04 | 2019-05-05 | 2019-02-03 | 2018-11-04 | 2018-08-05 | 2018-05-06 | 2018-02-04 | 2017-10-29 | 2017-07-30 | 2017-04-30 | 2017-01-29 | 2016-10-30 | 2016-07-31 | 2016-05-01 | 2016-01-31 | 2015-11-01 | 2015-08-02 | 2015-05-03 | 2015-02-01 | 2014-11-02 | 2014-08-03 | 2014-05-04 | 2014-02-02 | 2013-11-03 | 2013-08-04 | 2013-05-05 | 2013-02-03 | 2012-10-28 | 2012-07-29 | 2012-04-29 | 2012-01-29 | 2011-10-30 | 2011-07-31 | 2011-05-01 | 2011-01-30 | 2010-10-31 | 2010-08-01 | 2010-05-02 | 2010-01-31 | ||
|---|---|---|---|---|---|---|---|---|---|---|---|---|---|---|---|---|---|---|---|---|---|---|---|---|---|---|---|---|---|---|---|---|---|---|---|---|---|---|---|---|---|---|---|---|---|---|---|---|---|---|---|---|---|---|---|---|---|---|
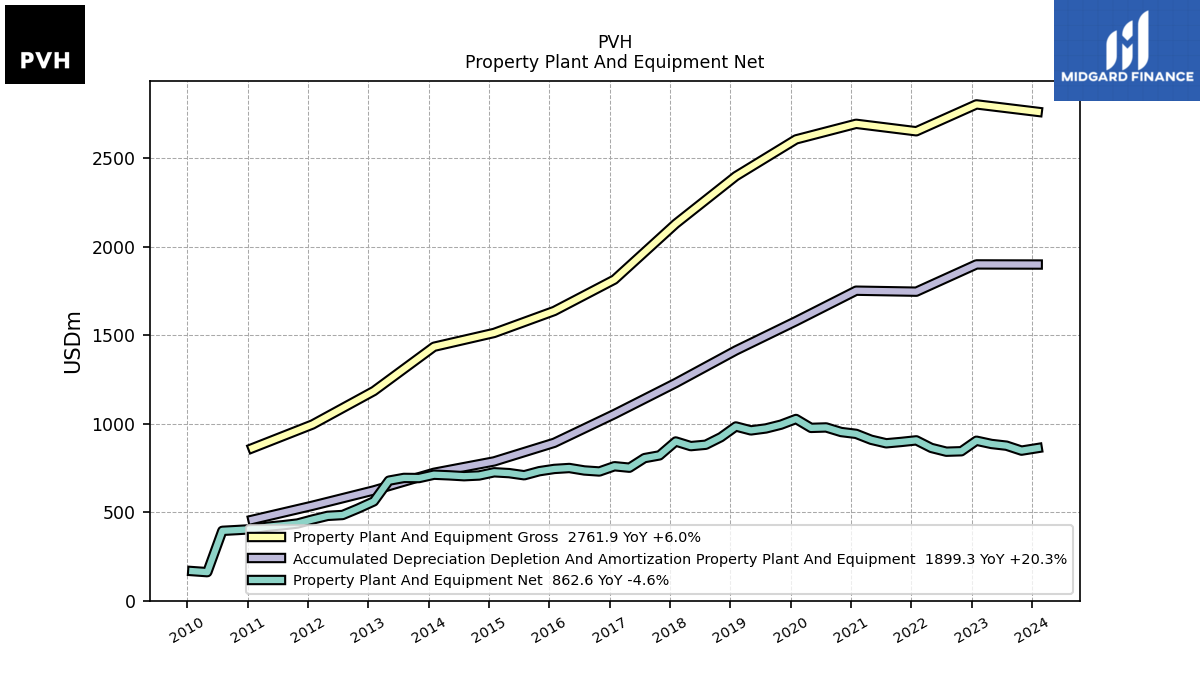
| Property Plant And Equipment Gross | 2761.90 | NA | NA | NA | 2804.00 | NA | NA | NA | 2652.10 | NA | NA | NA | 2694.30 | NA | NA | NA | 2606.20 | NA | NA | NA | 2398.50 | NA | NA | NA | 2129.70 | NA | NA | NA | 1814.30 | NA | NA | NA | 1636.90 | NA | NA | NA | 1512.90 | NA | NA | NA | 1434.85 | NA | NA | NA | 1184.70 | NA | NA | NA | 995.75 | NA | NA | NA | 862.14 | NA | NA | NA | NA | |
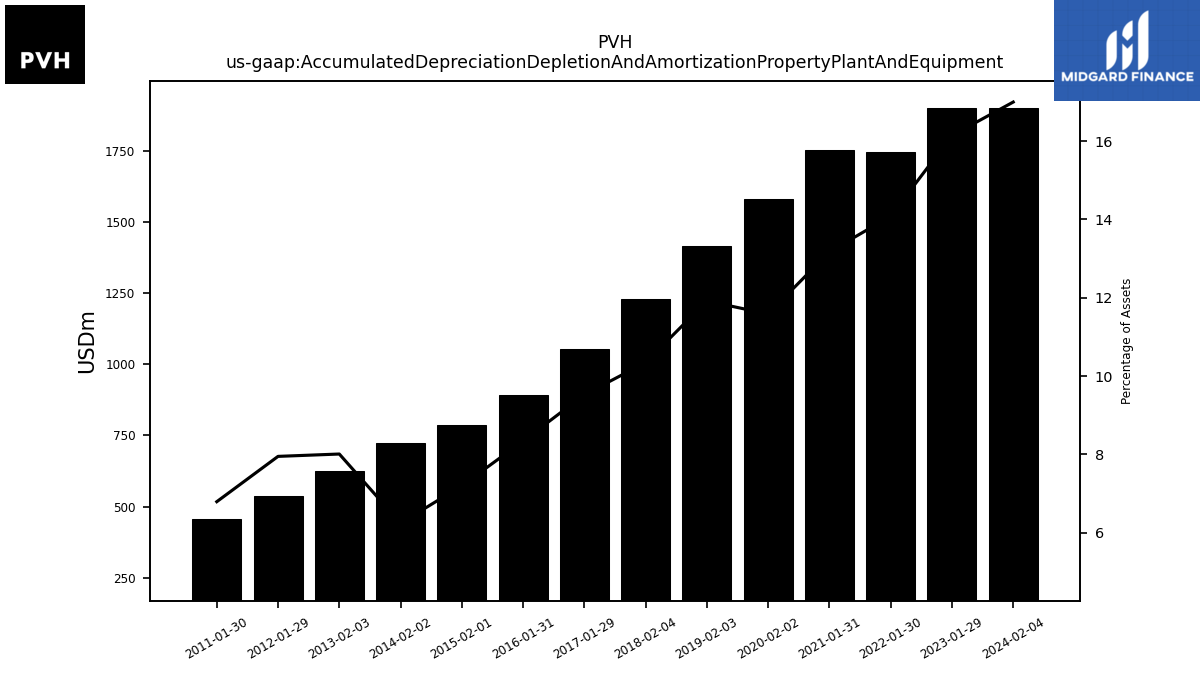
| Accumulated Depreciation Depletion And Amortization Property Plant And Equipment | 1899.30 | NA | NA | NA | 1900.00 | NA | NA | NA | 1746.00 | NA | NA | NA | 1751.60 | NA | NA | NA | 1579.40 | NA | NA | NA | 1414.00 | NA | NA | NA | 1229.90 | NA | NA | NA | 1054.40 | NA | NA | NA | 892.30 | NA | NA | NA | 787.20 | NA | NA | NA | 722.77 | NA | NA | NA | 623.36 | NA | NA | NA | 536.86 | NA | NA | NA | 457.56 | NA | NA | NA | NA | |
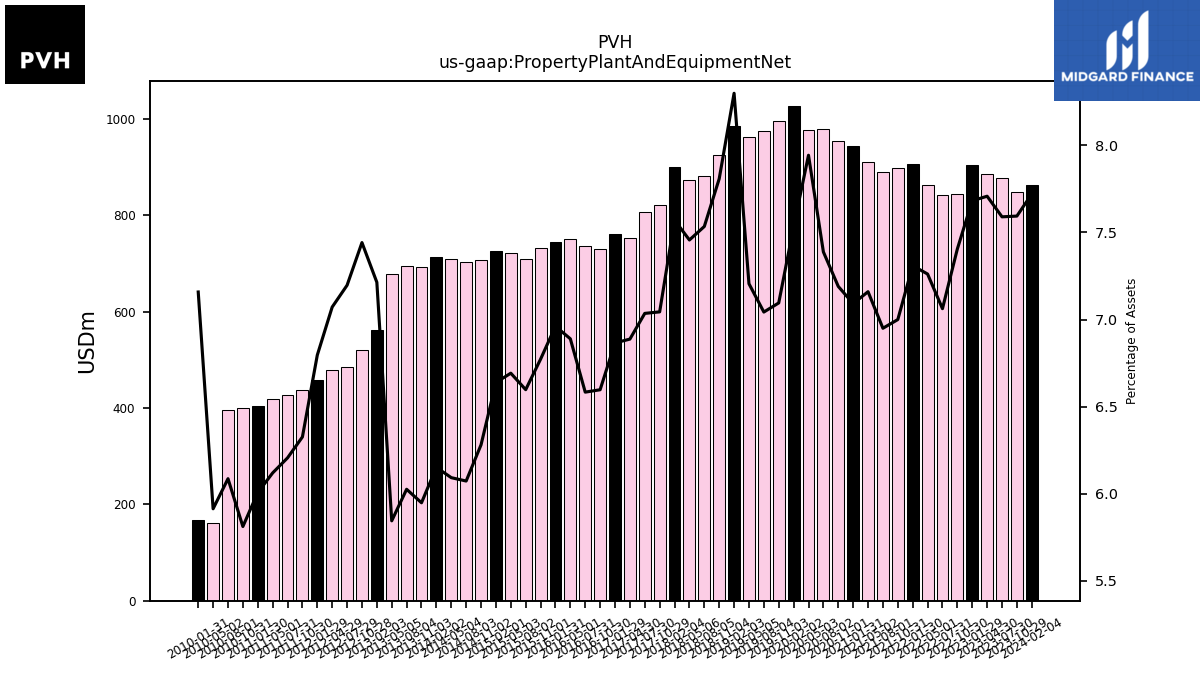
| Property Plant And Equipment Net | 862.60 | 848.00 | 876.00 | 885.70 | 904.00 | 844.60 | 842.00 | 863.30 | 906.10 | 897.10 | 889.40 | 909.40 | 942.70 | 953.20 | 979.10 | 976.50 | 1026.80 | 994.70 | 973.40 | 962.30 | 984.50 | 923.70 | 881.30 | 873.50 | 899.80 | 821.20 | 805.80 | 751.60 | 759.90 | 730.20 | 736.00 | 749.90 | 744.60 | 731.80 | 708.90 | 720.90 | 725.70 | 707.60 | 703.60 | 708.50 | 712.08 | 693.09 | 693.86 | 678.43 | 561.34 | 519.86 | 484.44 | 479.49 | 458.89 | 436.29 | 426.37 | 418.22 | 404.58 | 399.46 | 394.93 | 161.45 | 167.47 | |
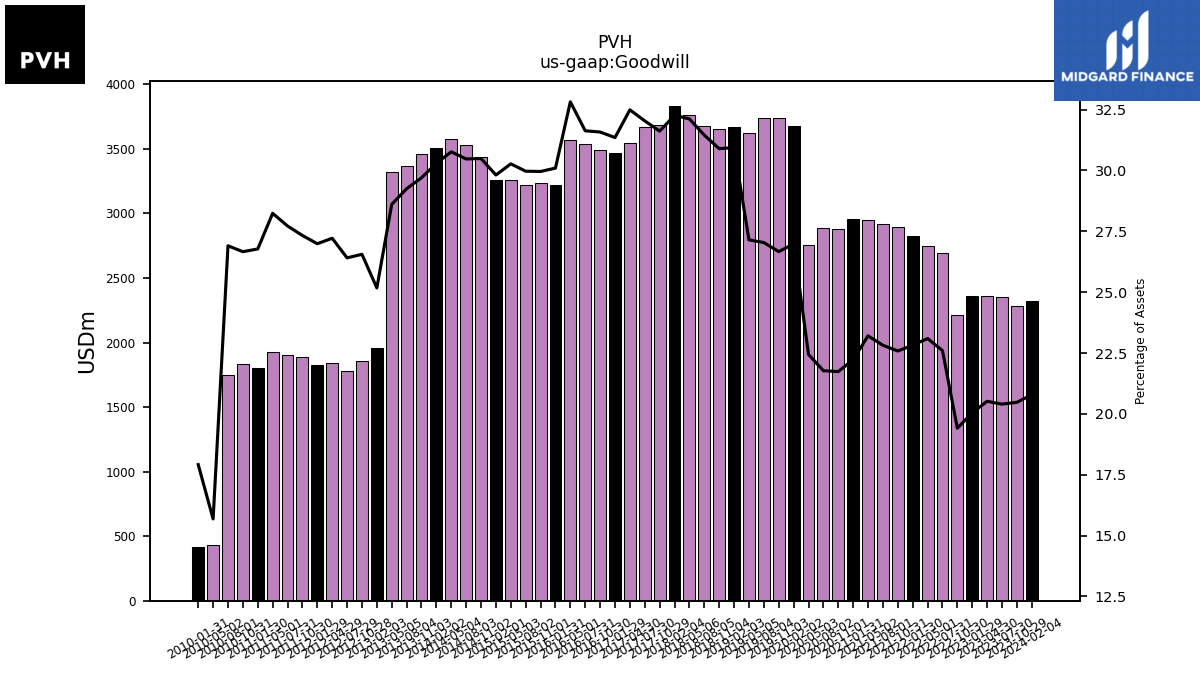
| Goodwill | 2322.10 | 2286.50 | 2354.70 | 2357.70 | 2359.00 | 2214.00 | 2694.50 | 2745.90 | 2828.90 | 2894.20 | 2920.20 | 2947.40 | 2954.30 | 2881.90 | 2885.40 | 2759.10 | 3677.60 | 3738.50 | 3736.90 | 3625.70 | 3670.50 | 3655.20 | 3678.80 | 3762.40 | 3834.70 | 3685.80 | 3669.40 | 3545.40 | 3469.90 | 3495.40 | 3536.10 | 3572.30 | 3219.30 | 3237.10 | 3220.20 | 3261.00 | 3259.10 | 3435.00 | 3530.30 | 3577.70 | 3506.77 | 3460.51 | 3368.00 | 3320.53 | 1958.89 | 1855.19 | 1777.72 | 1845.24 | 1822.47 | 1884.70 | 1904.39 | 1929.80 | 1803.40 | 1832.44 | 1745.85 | 428.19 | 419.18 | |
| Indefinite Lived Intangible Assets Excluding Goodwill | 2802.50 | NA | NA | NA | 2922.20 | NA | NA | NA | 2940.30 | NA | NA | NA | 3108.70 | NA | NA | NA | 3039.40 | NA | NA | NA | 3078.50 | NA | NA | NA | 3145.00 | NA | NA | NA | 2997.50 | NA | NA | NA | 3016.10 | NA | NA | NA | 3048.50 | NA | NA | NA | 3229.14 | 3218.69 | 3194.72 | 3244.63 | 2426.85 | 2386.85 | 2344.59 | 2410.82 | 2405.39 | NA | NA | NA | NA | NA | NA | NA | NA | |
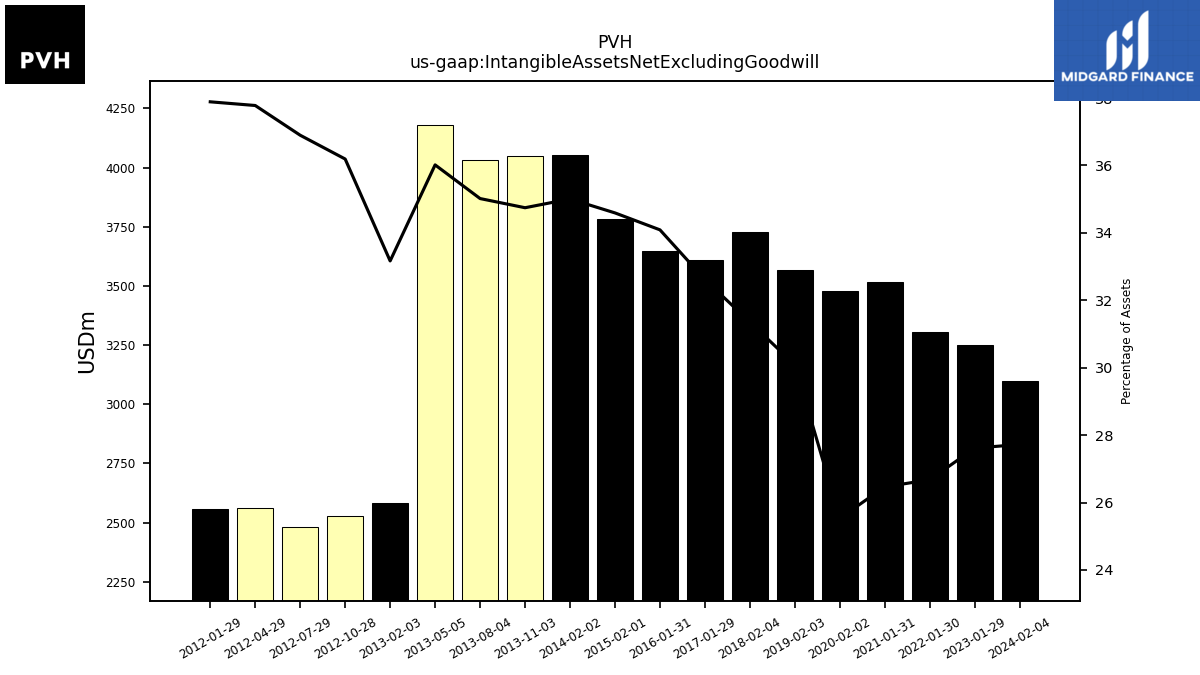
| Intangible Assets Net Excluding Goodwill | 3097.40 | NA | NA | NA | 3249.90 | NA | NA | NA | 3307.00 | NA | NA | NA | 3518.20 | NA | NA | NA | 3480.70 | NA | NA | NA | 3569.20 | NA | NA | NA | 3726.60 | NA | NA | NA | 3610.00 | NA | NA | NA | 3646.40 | NA | NA | NA | 3781.60 | NA | NA | NA | 4052.19 | 4048.53 | 4032.32 | 4180.65 | 2581.01 | 2528.32 | 2483.74 | 2561.59 | 2558.38 | NA | NA | NA | NA | NA | NA | NA | NA | |
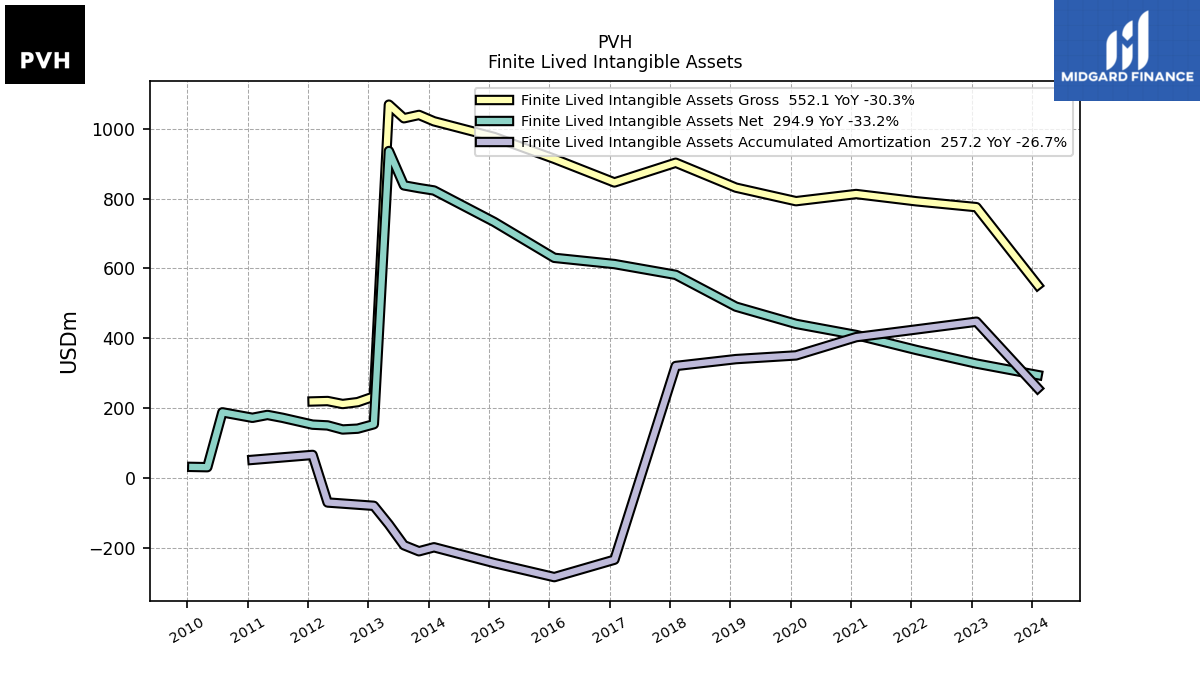
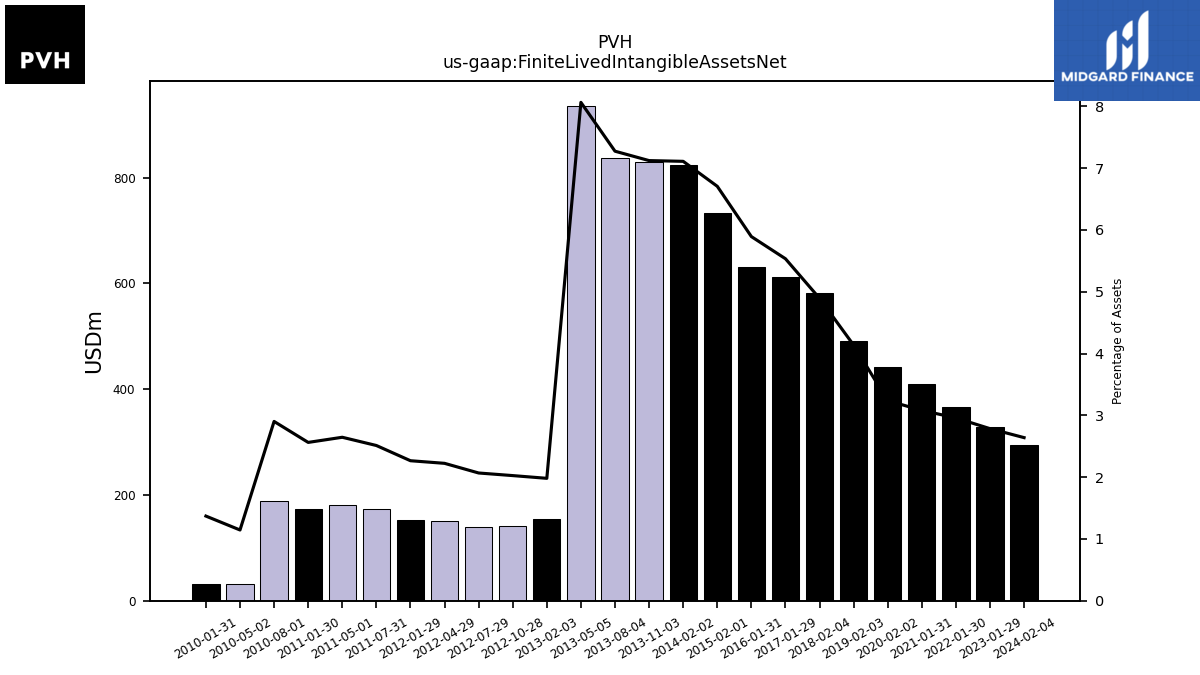
| Finite Lived Intangible Assets Net | 294.90 | NA | NA | NA | 327.70 | NA | NA | NA | 366.70 | NA | NA | NA | 409.50 | NA | NA | NA | 441.30 | NA | NA | NA | 490.70 | NA | NA | NA | 581.60 | NA | NA | NA | 612.50 | NA | NA | NA | 630.30 | NA | NA | NA | 733.10 | NA | NA | NA | 823.05 | 829.84 | 837.60 | 936.02 | 154.15 | 141.47 | 139.16 | 150.77 | 152.99 | NA | 172.58 | 180.78 | 172.56 | NA | 188.26 | 31.26 | 32.06 | |
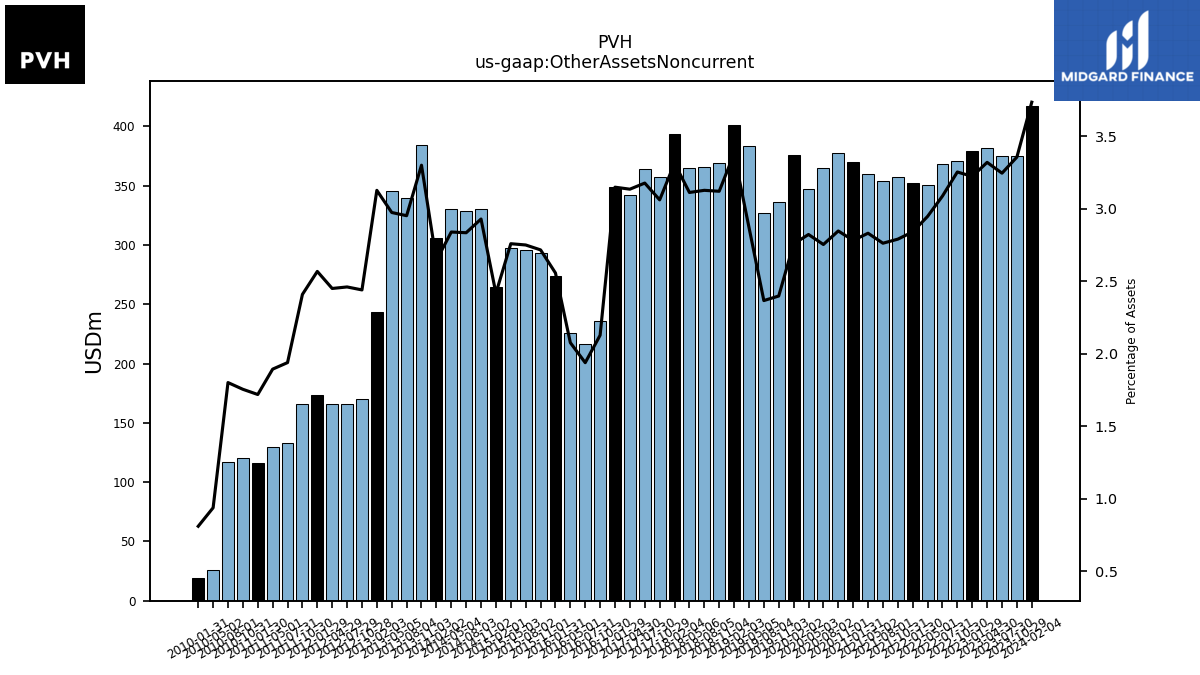
| Other Assets Noncurrent | 417.30 | 374.80 | 374.60 | 381.50 | 379.30 | 371.10 | 368.10 | 350.40 | 352.10 | 357.60 | 353.50 | 359.60 | 369.80 | 377.40 | 364.90 | 347.00 | 375.90 | 336.20 | 327.10 | 383.60 | 400.90 | 369.20 | 365.80 | 364.60 | 393.80 | 356.90 | 363.90 | 342.10 | 348.50 | 235.50 | 216.70 | 226.00 | 273.50 | 293.50 | 295.50 | 297.20 | 264.20 | 330.00 | 328.40 | 330.20 | 305.95 | 384.55 | 339.92 | 345.22 | 243.32 | 170.47 | 165.64 | 166.13 | 173.38 | 166.15 | 133.20 | 129.41 | 115.77 | 120.59 | 116.87 | 25.59 | 18.95 |
| 2024-02-04 | 2023-10-29 | 2023-07-30 | 2023-04-30 | 2023-01-29 | 2022-10-30 | 2022-07-31 | 2022-05-01 | 2022-01-30 | 2021-10-31 | 2021-08-01 | 2021-05-02 | 2021-01-31 | 2020-11-01 | 2020-08-02 | 2020-05-03 | 2020-02-02 | 2019-11-03 | 2019-08-04 | 2019-05-05 | 2019-02-03 | 2018-11-04 | 2018-08-05 | 2018-05-06 | 2018-02-04 | 2017-10-29 | 2017-07-30 | 2017-04-30 | 2017-01-29 | 2016-10-30 | 2016-07-31 | 2016-05-01 | 2016-01-31 | 2015-11-01 | 2015-08-02 | 2015-05-03 | 2015-02-01 | 2014-11-02 | 2014-08-03 | 2014-05-04 | 2014-02-02 | 2013-11-03 | 2013-08-04 | 2013-05-05 | 2013-02-03 | 2012-10-28 | 2012-07-29 | 2012-04-29 | 2012-01-29 | 2011-10-30 | 2011-07-31 | 2011-05-01 | 2011-01-30 | 2010-10-31 | 2010-08-01 | 2010-05-02 | 2010-01-31 | ||
|---|---|---|---|---|---|---|---|---|---|---|---|---|---|---|---|---|---|---|---|---|---|---|---|---|---|---|---|---|---|---|---|---|---|---|---|---|---|---|---|---|---|---|---|---|---|---|---|---|---|---|---|---|---|---|---|---|---|---|
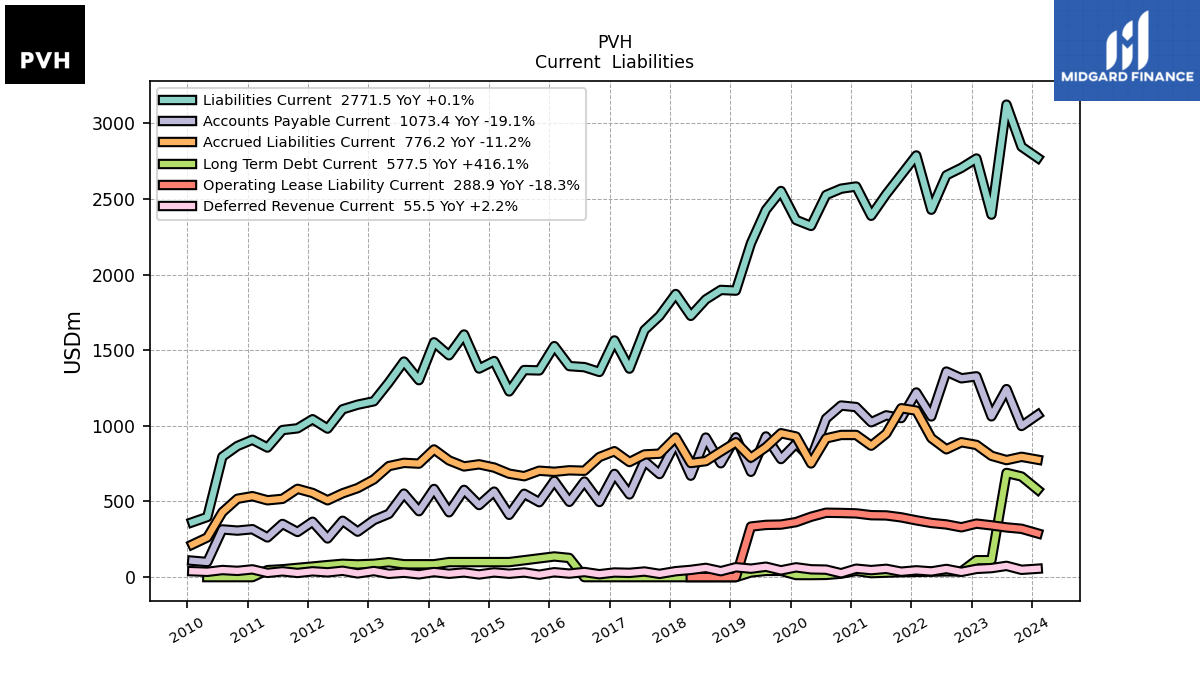
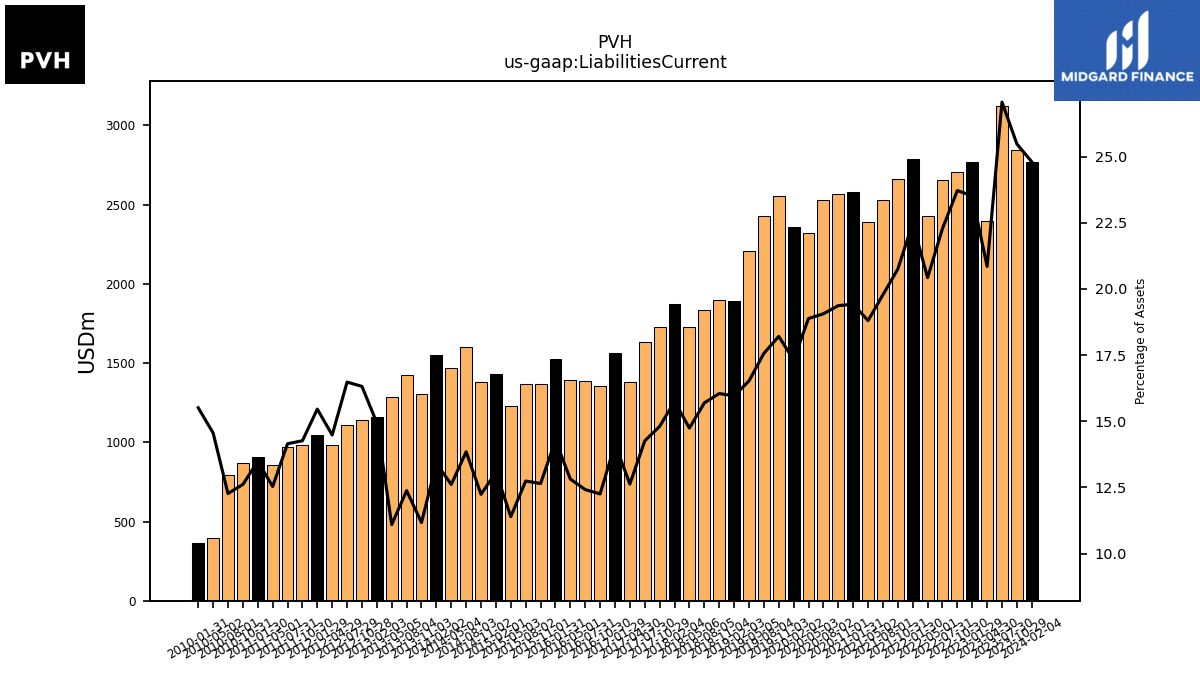
| Liabilities Current | 2771.50 | 2845.50 | 3123.60 | 2396.20 | 2767.50 | 2705.50 | 2656.50 | 2428.70 | 2787.50 | 2659.30 | 2531.40 | 2388.50 | 2582.40 | 2567.90 | 2526.10 | 2321.60 | 2361.10 | 2552.70 | 2427.70 | 2206.60 | 1893.90 | 1898.60 | 1835.70 | 1727.10 | 1871.60 | 1726.30 | 1633.20 | 1378.20 | 1564.80 | 1356.40 | 1388.20 | 1394.90 | 1527.20 | 1366.40 | 1369.00 | 1227.60 | 1428.60 | 1378.70 | 1604.10 | 1466.40 | 1552.40 | 1301.91 | 1425.20 | 1287.70 | 1162.45 | 1139.97 | 1109.39 | 981.89 | 1043.87 | 983.68 | 972.19 | 856.54 | 908.16 | 866.86 | 795.95 | 397.47 | 362.88 | |
| Long Term Debt Current | 577.50 | 665.20 | 688.90 | 112.00 | 111.90 | 37.30 | 38.20 | 36.20 | 34.80 | 32.80 | 29.70 | 26.40 | 41.10 | 22.90 | 14.80 | 13.60 | 13.80 | 41.30 | 41.20 | 31.00 | 0.00 | 0.00 | 0.00 | 0.00 | 0.00 | 0.00 | 0.00 | 0.00 | 0.00 | 0.00 | 0.00 | 126.70 | 136.60 | 124.10 | 111.70 | 99.30 | 99.30 | 99.30 | 99.30 | 99.30 | 85.00 | 85.00 | 85.00 | 98.75 | 88.00 | 84.00 | 88.02 | 79.48 | 69.95 | 61.11 | 51.82 | 46.30 | 0.00 | 0.00 | 0.00 | 0.00 | NA | |
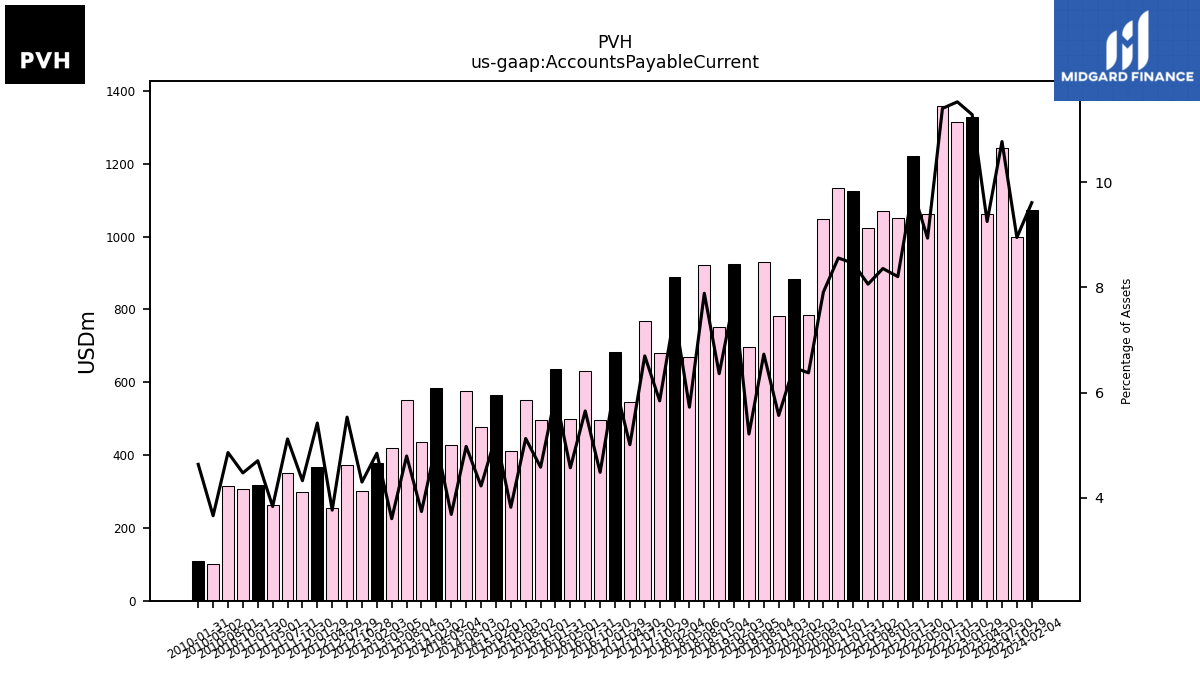
| Accounts Payable Current | 1073.40 | 999.10 | 1242.90 | 1063.00 | 1327.40 | 1314.30 | 1359.00 | 1062.20 | 1220.80 | 1051.30 | 1069.50 | 1023.80 | 1124.20 | 1134.40 | 1048.20 | 783.90 | 882.80 | 780.50 | 930.20 | 696.20 | 924.20 | 752.50 | 922.60 | 670.50 | 889.80 | 681.30 | 767.10 | 546.70 | 682.60 | 496.50 | 631.80 | 497.70 | 636.10 | 495.30 | 551.00 | 411.70 | 565.30 | 476.20 | 576.70 | 428.70 | 582.92 | 435.92 | 552.22 | 418.46 | 377.23 | 300.47 | 372.53 | 255.51 | 366.14 | 298.43 | 351.75 | 262.23 | 316.92 | 307.54 | 315.43 | 99.97 | 108.49 | |
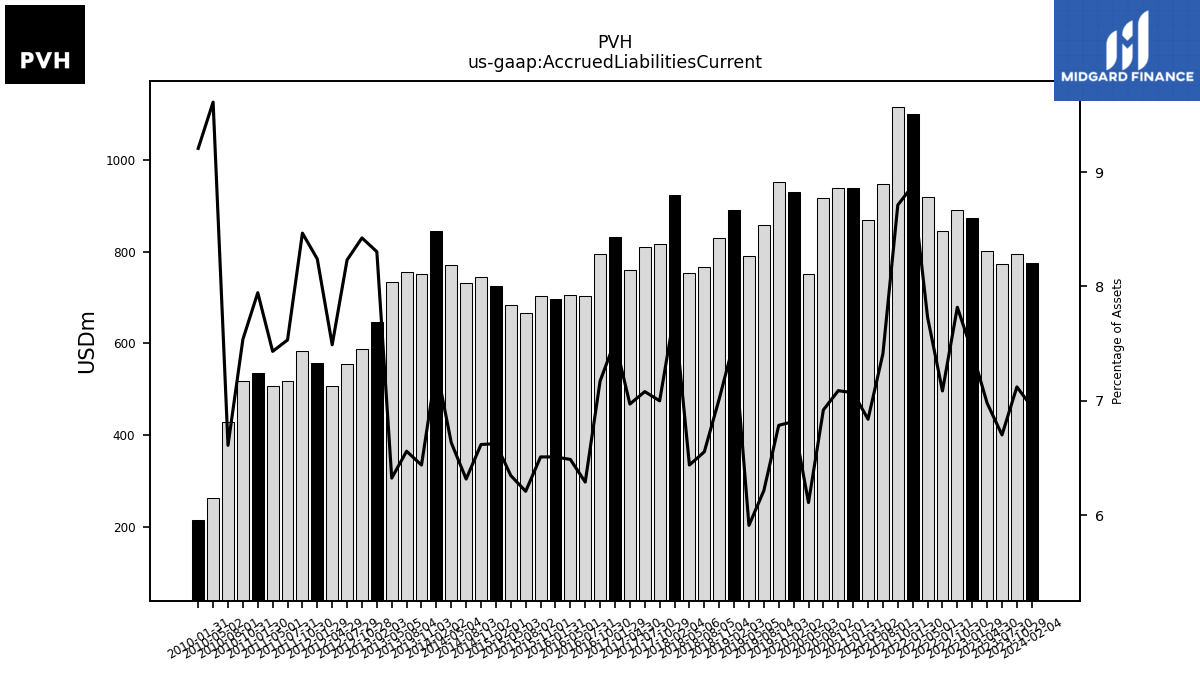
| Accrued Liabilities Current | 776.20 | 795.30 | 773.60 | 802.10 | 874.00 | 891.70 | 844.90 | 919.10 | 1100.80 | 1116.50 | 948.60 | 868.70 | 939.90 | 939.80 | 917.20 | 751.30 | 929.60 | 951.30 | 859.00 | 789.50 | 891.60 | 830.10 | 766.70 | 754.30 | 923.10 | 816.10 | 811.00 | 760.80 | 832.40 | 794.00 | 703.20 | 706.20 | 696.30 | 703.40 | 667.20 | 683.70 | 724.30 | 745.60 | 731.80 | 771.50 | 844.18 | 750.21 | 755.33 | 734.12 | 646.13 | 588.51 | 554.08 | 507.89 | 556.37 | 583.84 | 517.46 | 507.93 | 535.14 | 518.03 | 428.95 | 262.38 | 215.41 |
| 2024-02-04 | 2023-10-29 | 2023-07-30 | 2023-04-30 | 2023-01-29 | 2022-10-30 | 2022-07-31 | 2022-05-01 | 2022-01-30 | 2021-10-31 | 2021-08-01 | 2021-05-02 | 2021-01-31 | 2020-11-01 | 2020-08-02 | 2020-05-03 | 2020-02-02 | 2019-11-03 | 2019-08-04 | 2019-05-05 | 2019-02-03 | 2018-11-04 | 2018-08-05 | 2018-05-06 | 2018-02-04 | 2017-10-29 | 2017-07-30 | 2017-04-30 | 2017-01-29 | 2016-10-30 | 2016-07-31 | 2016-05-01 | 2016-01-31 | 2015-11-01 | 2015-08-02 | 2015-05-03 | 2015-02-01 | 2014-11-02 | 2014-08-03 | 2014-05-04 | 2014-02-02 | 2013-11-03 | 2013-08-04 | 2013-05-05 | 2013-02-03 | 2012-10-28 | 2012-07-29 | 2012-04-29 | 2012-01-29 | 2011-10-30 | 2011-07-31 | 2011-05-01 | 2011-01-30 | 2010-10-31 | 2010-08-01 | 2010-05-02 | 2010-01-31 | ||
|---|---|---|---|---|---|---|---|---|---|---|---|---|---|---|---|---|---|---|---|---|---|---|---|---|---|---|---|---|---|---|---|---|---|---|---|---|---|---|---|---|---|---|---|---|---|---|---|---|---|---|---|---|---|---|---|---|---|---|
| Long Term Debt | 2169.20 | 2236.50 | 2308.50 | 2305.00 | 2288.90 | 2146.40 | 2193.70 | 2252.70 | 2352.40 | 2638.00 | 2812.20 | 3044.60 | 3554.80 | 3487.00 | 3513.10 | 2867.80 | 2707.70 | 2779.70 | 2784.20 | 2790.40 | 2819.40 | 2878.30 | 2893.50 | 3013.20 | 3061.30 | 3182.70 | 3185.70 | 3157.10 | 3197.30 | 3303.10 | 3358.20 | 3118.30 | 3190.90 | 3339.60 | 3373.90 | 3489.00 | 3538.00 | 3718.00 | 3742.20 | 3961.30 | 3963.22 | 4259.55 | 4280.15 | 4461.09 | 2299.64 | 1731.60 | 1803.48 | 1874.34 | 1902.88 | 2091.56 | 2141.88 | 2254.49 | 2364.00 | 2523.92 | 2491.64 | NA | NA | |
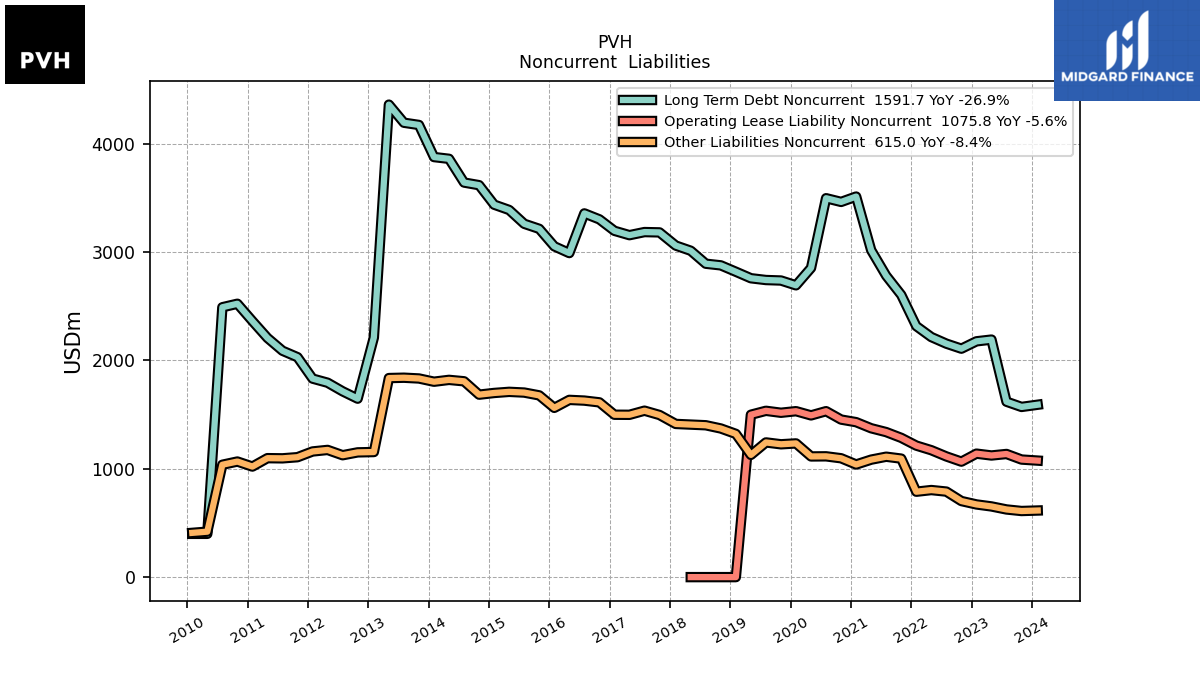
| Long Term Debt Noncurrent | 1591.70 | 1571.30 | 1619.60 | 2193.00 | 2177.00 | 2109.10 | 2155.50 | 2216.50 | 2317.60 | 2605.20 | 2782.50 | 3018.20 | 3513.70 | 3464.10 | 3498.30 | 2854.20 | 2693.90 | 2738.40 | 2743.00 | 2759.40 | 2819.40 | 2878.30 | 2893.50 | 3013.20 | 3061.30 | 3182.70 | 3185.70 | 3157.10 | 3197.30 | 3303.10 | 3358.20 | 2991.60 | 3054.30 | 3215.50 | 3262.20 | 3389.70 | 3438.70 | 3618.70 | 3642.90 | 3862.00 | 3878.22 | 4174.55 | 4195.15 | 4362.34 | 2211.64 | 1647.60 | 1715.46 | 1794.86 | 1832.92 | 2030.44 | 2090.06 | 2208.19 | 2364.00 | 2523.92 | 2491.64 | 399.59 | 399.58 | |
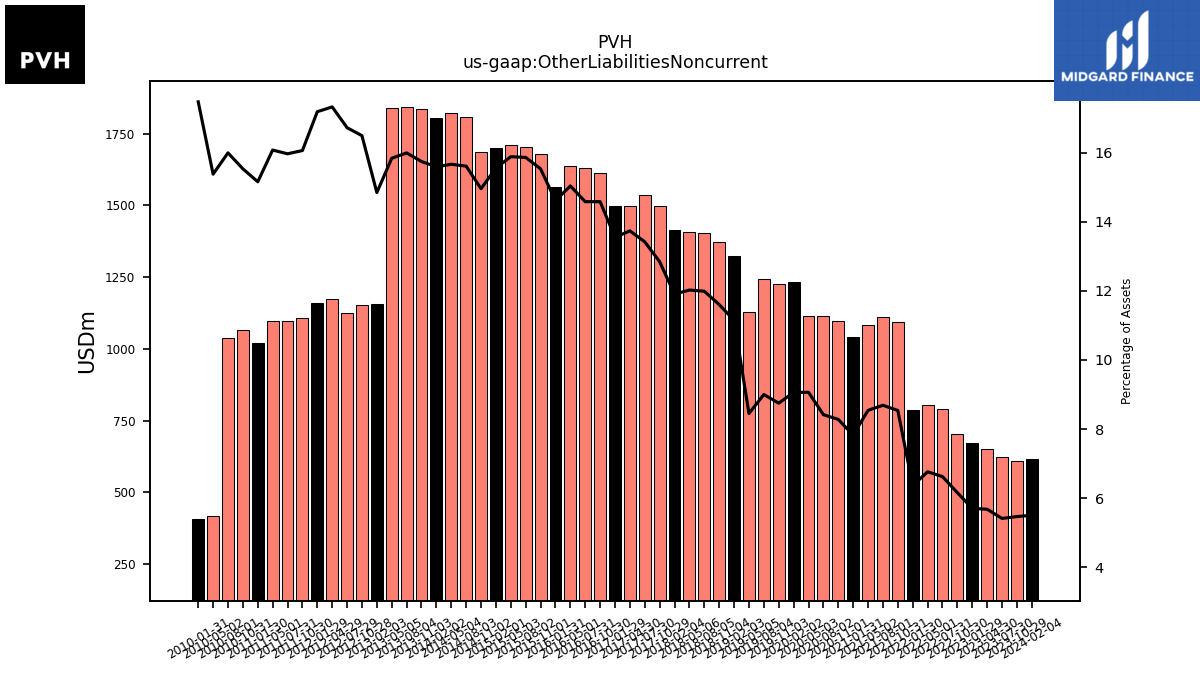
| Other Liabilities Noncurrent | 615.00 | 610.40 | 624.70 | 652.60 | 671.10 | 702.40 | 789.70 | 803.90 | 788.50 | 1094.10 | 1111.70 | 1084.70 | 1039.80 | 1097.40 | 1115.20 | 1114.20 | 1234.50 | 1226.40 | 1243.60 | 1128.30 | 1322.40 | 1372.30 | 1402.10 | 1408.20 | 1414.40 | 1496.80 | 1536.70 | 1498.60 | 1499.30 | 1613.60 | 1629.80 | 1636.30 | 1562.60 | 1677.90 | 1704.00 | 1710.60 | 1700.20 | 1684.50 | 1808.00 | 1821.10 | 1804.18 | 1833.99 | 1841.03 | 1837.81 | 1154.89 | 1151.79 | 1125.43 | 1174.33 | 1160.12 | 1107.35 | 1096.69 | 1098.33 | 1020.61 | 1067.21 | 1037.54 | 419.71 | 408.66 | |
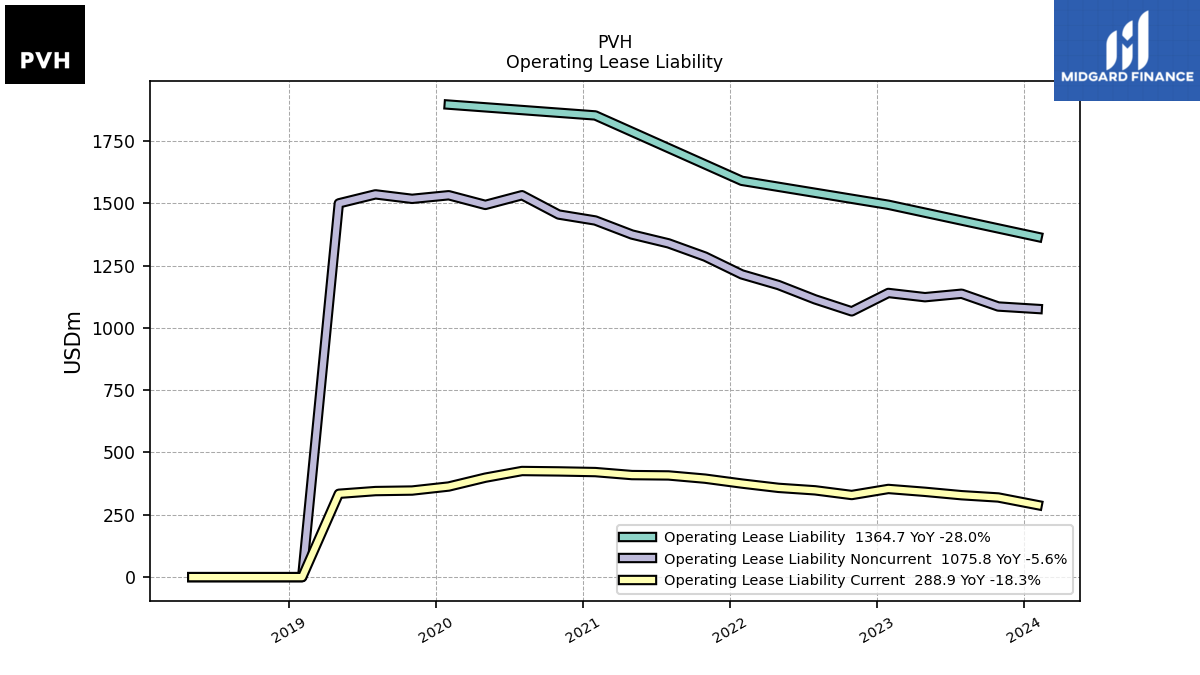
| Operating Lease Liability Noncurrent | 1075.80 | 1085.60 | 1136.90 | 1123.00 | 1140.00 | 1066.10 | 1114.20 | 1171.70 | 1214.40 | 1285.70 | 1338.90 | 1374.40 | 1430.70 | 1454.60 | 1532.10 | 1493.20 | 1532.00 | 1517.50 | 1535.50 | 1499.40 | 0.00 | 0.00 | 0.00 | 0.00 | NA | NA | NA | NA | NA | NA | NA | NA | NA | NA | NA | NA | NA | NA | NA | NA | NA | NA | NA | NA | NA | NA | NA | NA | NA | NA | NA | NA | NA | NA | NA | NA | NA |
| 2024-02-04 | 2023-10-29 | 2023-07-30 | 2023-04-30 | 2023-01-29 | 2022-10-30 | 2022-07-31 | 2022-05-01 | 2022-01-30 | 2021-10-31 | 2021-08-01 | 2021-05-02 | 2021-01-31 | 2020-11-01 | 2020-08-02 | 2020-05-03 | 2020-02-02 | 2019-11-03 | 2019-08-04 | 2019-05-05 | 2019-02-03 | 2018-11-04 | 2018-08-05 | 2018-05-06 | 2018-02-04 | 2017-10-29 | 2017-07-30 | 2017-04-30 | 2017-01-29 | 2016-10-30 | 2016-07-31 | 2016-05-01 | 2016-01-31 | 2015-11-01 | 2015-08-02 | 2015-05-03 | 2015-02-01 | 2014-11-02 | 2014-08-03 | 2014-05-04 | 2014-02-02 | 2013-11-03 | 2013-08-04 | 2013-05-05 | 2013-02-03 | 2012-10-28 | 2012-07-29 | 2012-04-29 | 2012-01-29 | 2011-10-30 | 2011-07-31 | 2011-05-01 | 2011-01-30 | 2010-10-31 | 2010-08-01 | 2010-05-02 | 2010-01-31 | ||
|---|---|---|---|---|---|---|---|---|---|---|---|---|---|---|---|---|---|---|---|---|---|---|---|---|---|---|---|---|---|---|---|---|---|---|---|---|---|---|---|---|---|---|---|---|---|---|---|---|---|---|---|---|---|---|---|---|---|---|
| Stockholders Equity | 5118.90 | 5054.30 | 5037.60 | 5126.40 | 5012.70 | 4822.80 | 5206.40 | 5268.50 | 5288.80 | 5171.70 | 5032.80 | 4839.40 | 4730.30 | 4676.20 | 4583.50 | 4513.40 | 5811.50 | 5985.10 | 5871.70 | 5761.50 | 5827.80 | 5681.20 | 5565.40 | 5564.60 | 5536.40 | 5249.80 | 5095.20 | 4875.00 | 4804.50 | 4794.30 | 4803.50 | 4862.30 | 4552.30 | 4545.60 | 4409.80 | 4444.50 | 4364.30 | 4583.80 | 4530.30 | 4479.50 | 4335.18 | 4335.57 | 4047.76 | 4113.69 | 3252.57 | 3046.62 | 2781.20 | 2829.31 | 2715.45 | 2774.89 | 2711.20 | 2670.99 | 2442.56 | 2414.76 | 2163.46 | 1513.25 | 1168.55 | |
| Common Stock Value | 88.60 | 88.30 | 88.20 | 87.80 | 87.60 | 87.60 | 87.50 | 87.30 | 87.10 | 87.00 | 86.70 | 86.50 | 86.30 | 86.20 | 86.20 | 86.10 | 85.90 | 85.90 | 85.90 | 85.80 | 85.40 | 85.40 | 85.40 | 85.30 | 84.90 | 84.30 | 84.30 | 84.10 | 83.90 | 83.90 | 83.90 | 83.60 | 83.50 | 83.50 | 83.50 | 83.40 | 83.10 | 83.00 | 83.00 | 82.90 | 82.68 | 82.10 | 82.05 | 81.20 | 73.32 | 71.04 | 70.95 | 70.68 | 68.30 | 67.83 | 67.80 | 67.55 | 67.23 | 67.11 | 66.45 | 57.95 | 57.14 | |
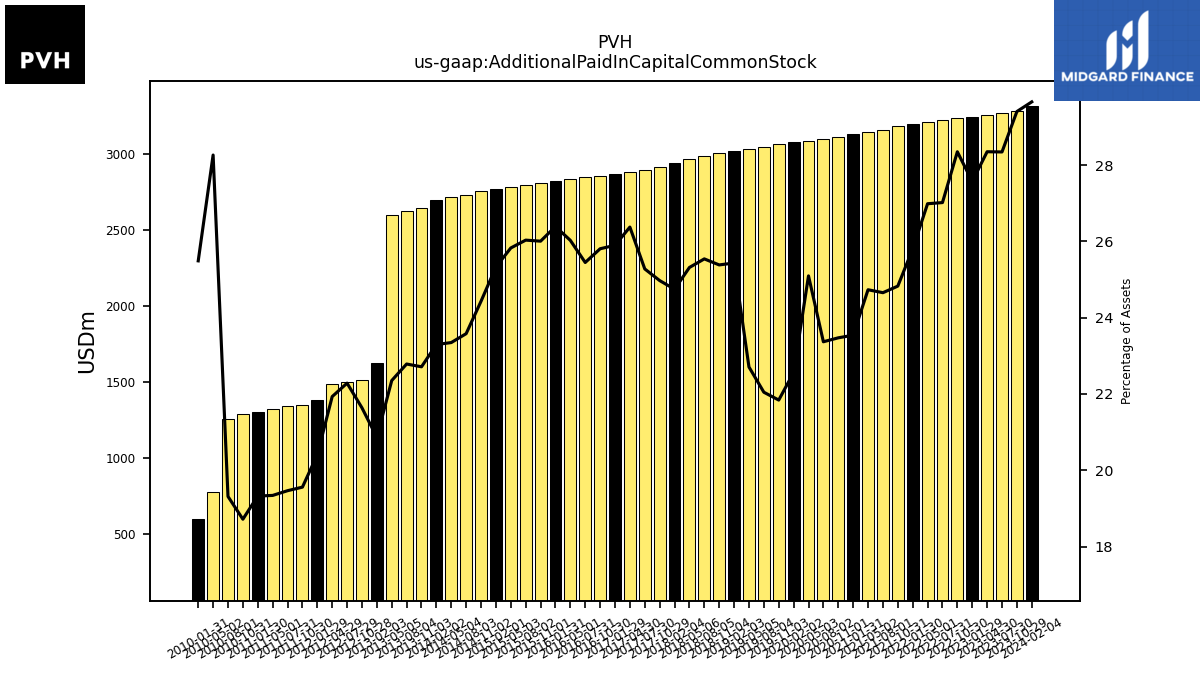
| Additional Paid In Capital Common Stock | 3313.30 | 3283.30 | 3271.40 | 3257.50 | 3244.50 | 3233.20 | 3220.90 | 3208.40 | 3198.40 | 3181.80 | 3155.10 | 3141.30 | 3129.40 | 3111.70 | 3096.90 | 3085.20 | 3075.40 | 3061.90 | 3047.00 | 3032.70 | 3017.30 | 3002.90 | 2987.60 | 2965.60 | 2941.20 | 2911.30 | 2895.20 | 2878.00 | 2866.20 | 2856.30 | 2844.80 | 2832.90 | 2822.50 | 2809.90 | 2797.10 | 2782.10 | 2768.70 | 2752.30 | 2731.90 | 2715.10 | 2696.58 | 2646.40 | 2623.66 | 2594.47 | 1623.69 | 1511.57 | 1500.03 | 1487.09 | 1377.92 | 1348.88 | 1337.33 | 1321.84 | 1301.65 | 1286.48 | 1253.25 | 771.55 | 596.34 | |
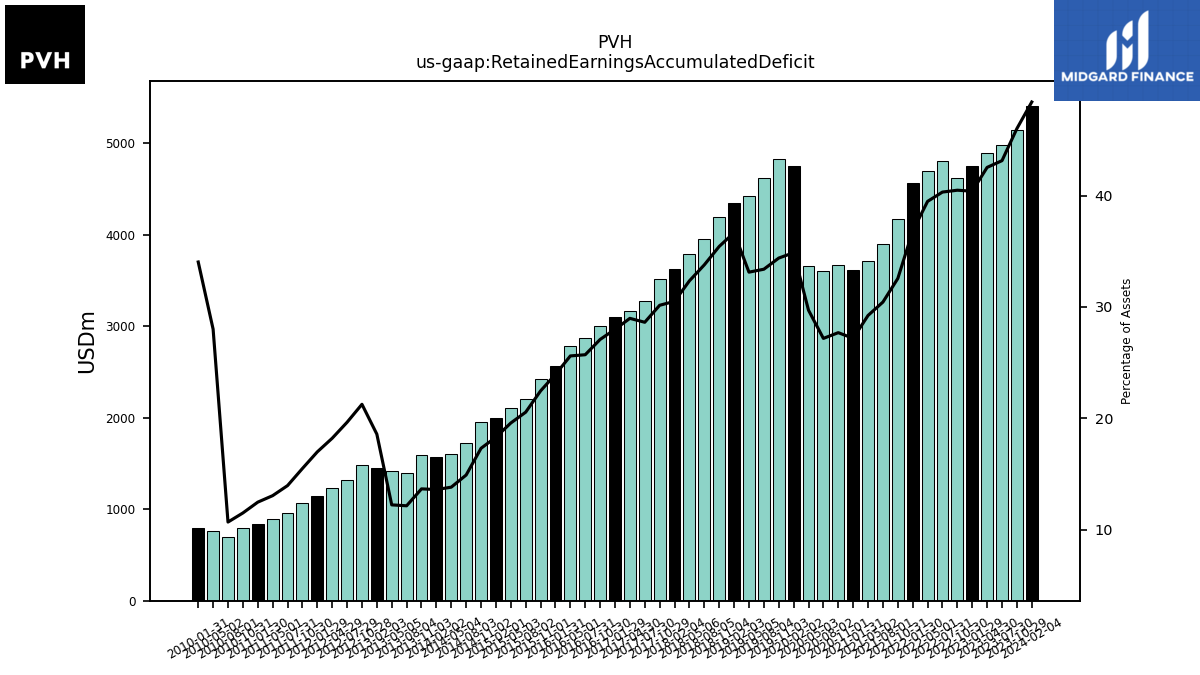
| Retained Earnings Accumulated Deficit | 5407.30 | 5137.80 | 4978.50 | 4886.70 | 4753.10 | 4616.80 | 4806.00 | 4693.30 | 4562.80 | 4172.00 | 3895.00 | 3713.10 | 3613.20 | 3670.90 | 3601.10 | 3652.50 | 4753.00 | 4820.40 | 4614.00 | 4423.30 | 4350.10 | 4191.40 | 3951.10 | 3788.80 | 3625.20 | 3514.70 | 3278.40 | 3161.70 | 3098.00 | 2997.30 | 2874.10 | 2786.60 | 2561.20 | 2427.00 | 2208.20 | 2109.20 | 2001.30 | 1949.80 | 1727.20 | 1607.00 | 1574.77 | 1592.20 | 1398.80 | 1419.49 | 1445.67 | 1485.07 | 1322.40 | 1234.71 | 1147.08 | 1068.55 | 959.03 | 892.33 | 840.07 | 790.55 | 693.39 | 764.50 | 796.28 | |
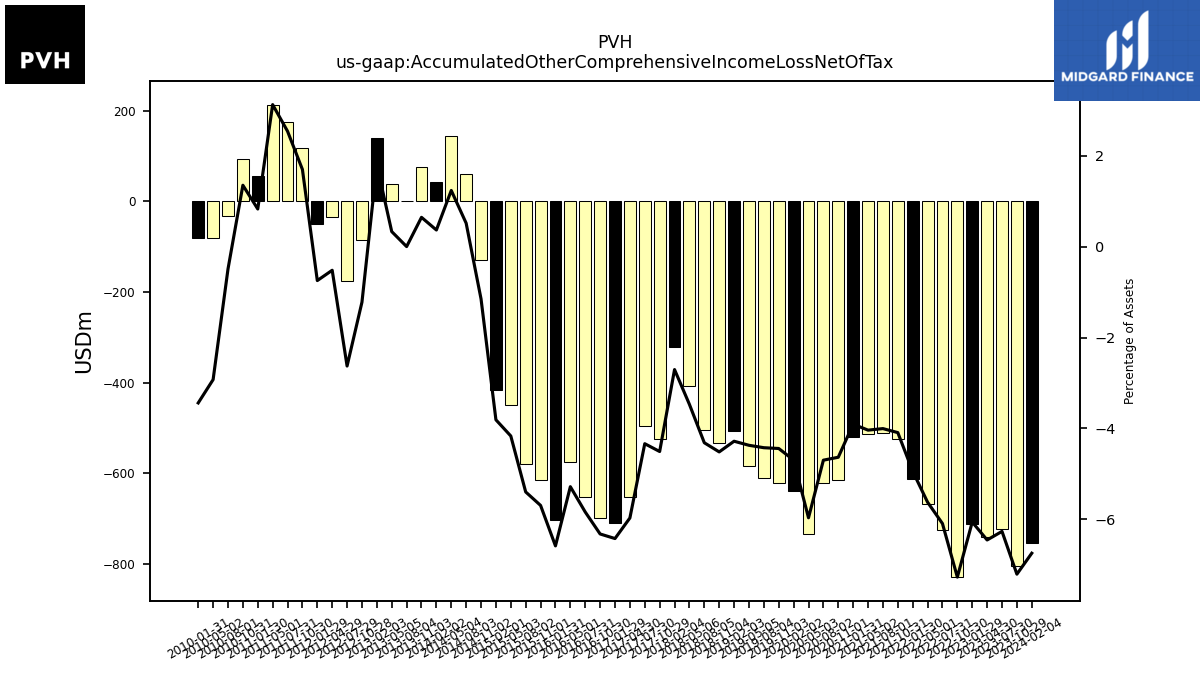
| Accumulated Other Comprehensive Income Loss Net Of Tax | -753.60 | -804.70 | -723.10 | -741.60 | -713.10 | -829.30 | -726.40 | -668.50 | -612.70 | -524.40 | -512.30 | -512.80 | -519.10 | -614.30 | -622.60 | -733.40 | -640.10 | -622.60 | -611.40 | -583.70 | -507.90 | -534.30 | -504.70 | -406.60 | -321.50 | -525.50 | -496.60 | -651.40 | -710.80 | -699.70 | -652.70 | -574.90 | -704.20 | -615.20 | -579.90 | -448.80 | -416.50 | -129.60 | 59.70 | 143.60 | 42.32 | 75.05 | 0.11 | 38.39 | 139.88 | -85.38 | -176.84 | -35.26 | -50.43 | 117.05 | 174.39 | 213.48 | 55.76 | 92.78 | -31.99 | -79.87 | -80.45 | |
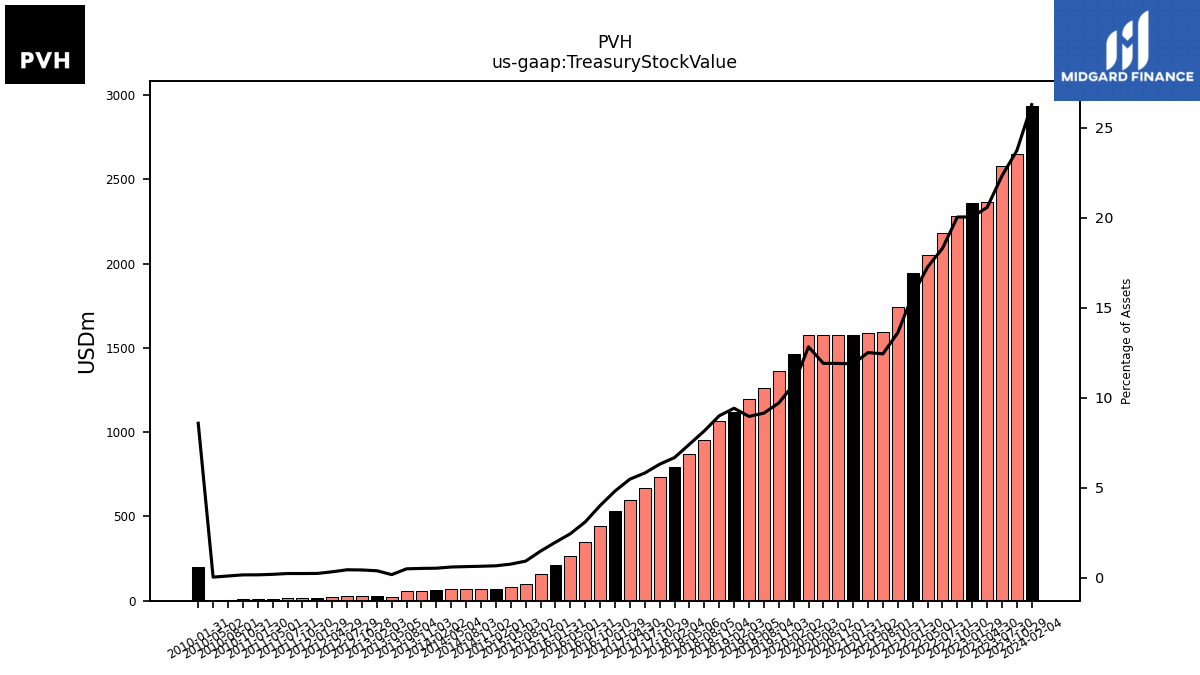
| Treasury Stock Value | 2936.70 | 2650.40 | 2577.40 | 2364.00 | 2359.40 | 2285.50 | 2181.60 | 2052.00 | 1946.80 | 1744.70 | 1591.70 | 1588.70 | 1579.50 | 1578.30 | 1578.10 | 1577.00 | 1462.70 | 1360.50 | 1263.80 | 1196.60 | 1117.10 | 1064.20 | 954.00 | 868.50 | 793.40 | 735.00 | 666.10 | 597.40 | 532.80 | 443.50 | 346.60 | 265.90 | 210.70 | 159.60 | 99.10 | 81.40 | 72.30 | 71.70 | 71.50 | 69.10 | 61.17 | 60.17 | 56.85 | 19.86 | 30.00 | 29.97 | 29.65 | 22.20 | 16.02 | 16.01 | 15.94 | 12.80 | 10.75 | 10.75 | 6.23 | 0.88 | 200.76 |