
| 2023-12-31 | 2023-09-30 | 2023-06-30 | 2023-03-31 | 2022-12-31 | 2022-09-30 | 2022-06-30 | 2022-03-31 | 2021-12-31 | 2021-09-30 | 2021-06-30 | 2021-03-31 | 2020-12-31 | 2020-09-30 | 2020-06-30 | 2020-03-31 | 2019-12-31 | 2019-09-30 | 2019-06-30 | 2019-03-31 | 2018-12-31 | 2018-09-30 | 2018-06-30 | 2018-03-31 | 2017-12-31 | 2017-09-30 | 2017-06-30 | 2017-03-31 | 2016-12-31 | 2013-09-30 | 2013-06-30 | 2013-03-31 | 2012-12-31 | 2012-09-30 | 2012-06-30 | 2012-03-31 | 2011-12-31 | 2011-09-30 | 2011-06-30 | 2011-03-31 | 2010-12-31 | ||
|---|---|---|---|---|---|---|---|---|---|---|---|---|---|---|---|---|---|---|---|---|---|---|---|---|---|---|---|---|---|---|---|---|---|---|---|---|---|---|---|---|---|---|
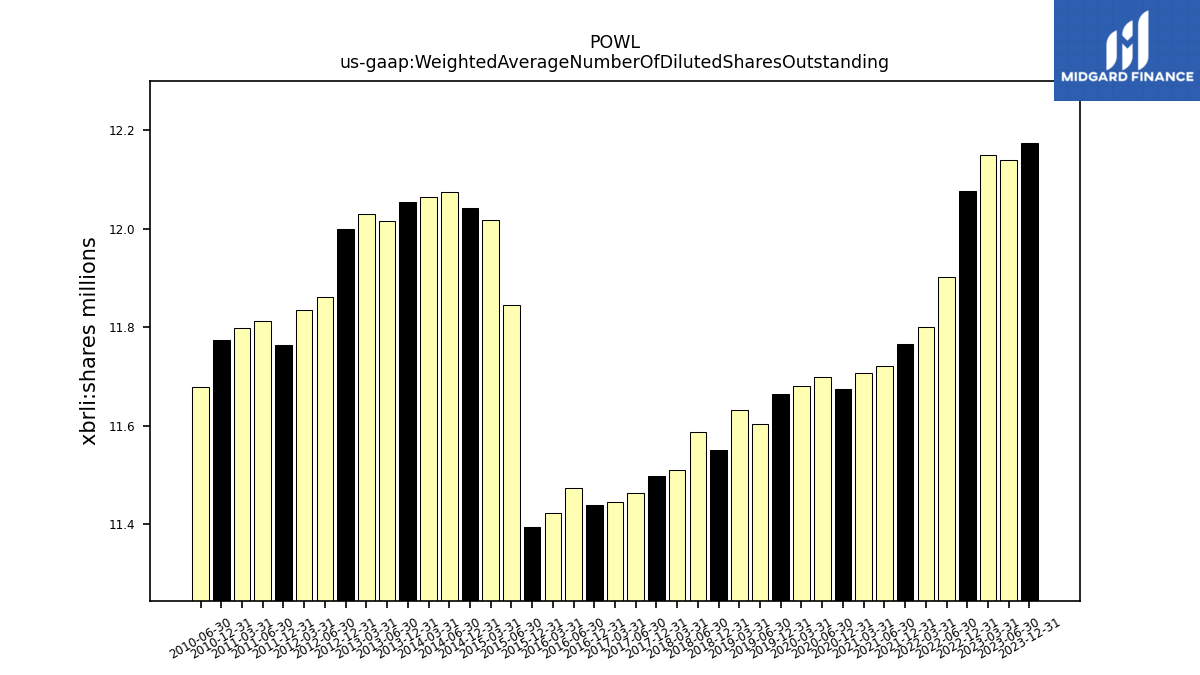
| Weighted Average Number Of Diluted Shares Outstanding | 12.17 | NA | 12.14 | 12.15 | 12.08 | NA | 11.90 | 11.80 | 11.77 | NA | 11.72 | 11.71 | 11.67 | NA | 11.70 | 11.68 | 11.66 | NA | 11.60 | 11.63 | 11.55 | NA | 11.59 | 11.51 | 11.50 | NA | 11.46 | 11.45 | 11.44 | NA | 12.02 | 12.03 | 12.00 | NA | 11.86 | 11.84 | 11.76 | NA | 11.81 | 11.80 | 11.77 | |
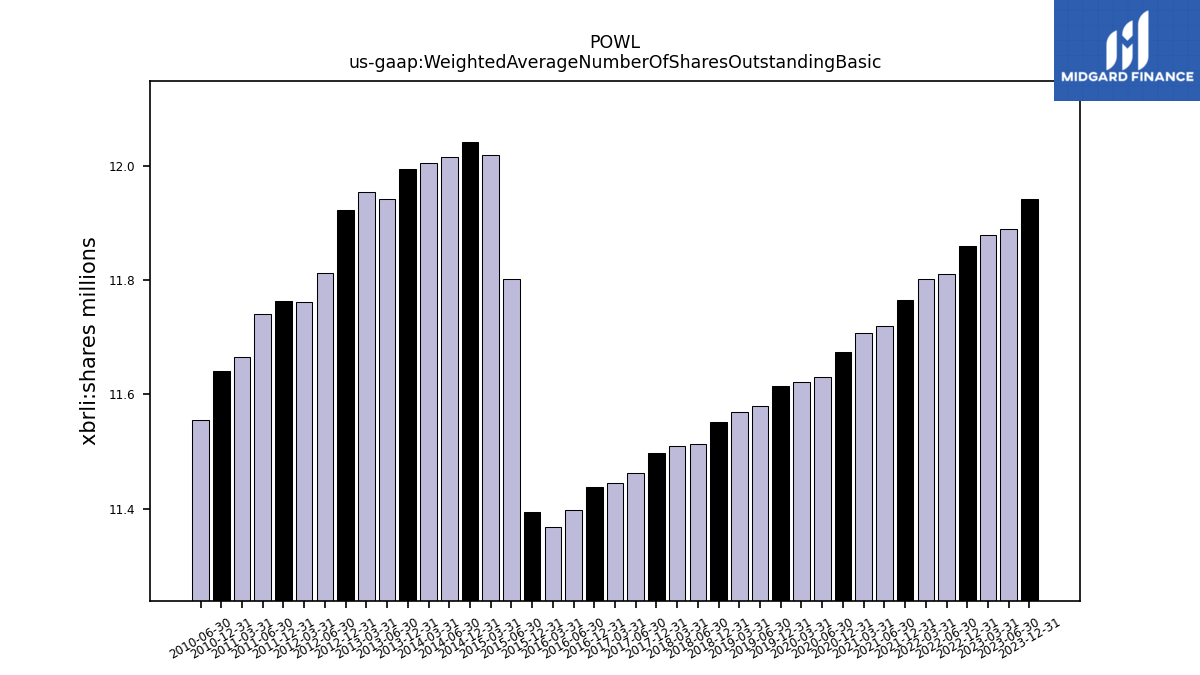
| Weighted Average Number Of Shares Outstanding Basic | 11.94 | NA | 11.89 | 11.88 | 11.86 | NA | 11.81 | 11.80 | 11.77 | NA | 11.72 | 11.71 | 11.67 | NA | 11.63 | 11.62 | 11.61 | NA | 11.58 | 11.57 | 11.55 | NA | 11.51 | 11.51 | 11.50 | NA | 11.46 | 11.45 | 11.44 | NA | 11.94 | 11.95 | 11.92 | NA | 11.81 | 11.76 | 11.76 | NA | 11.74 | 11.67 | 11.64 | |
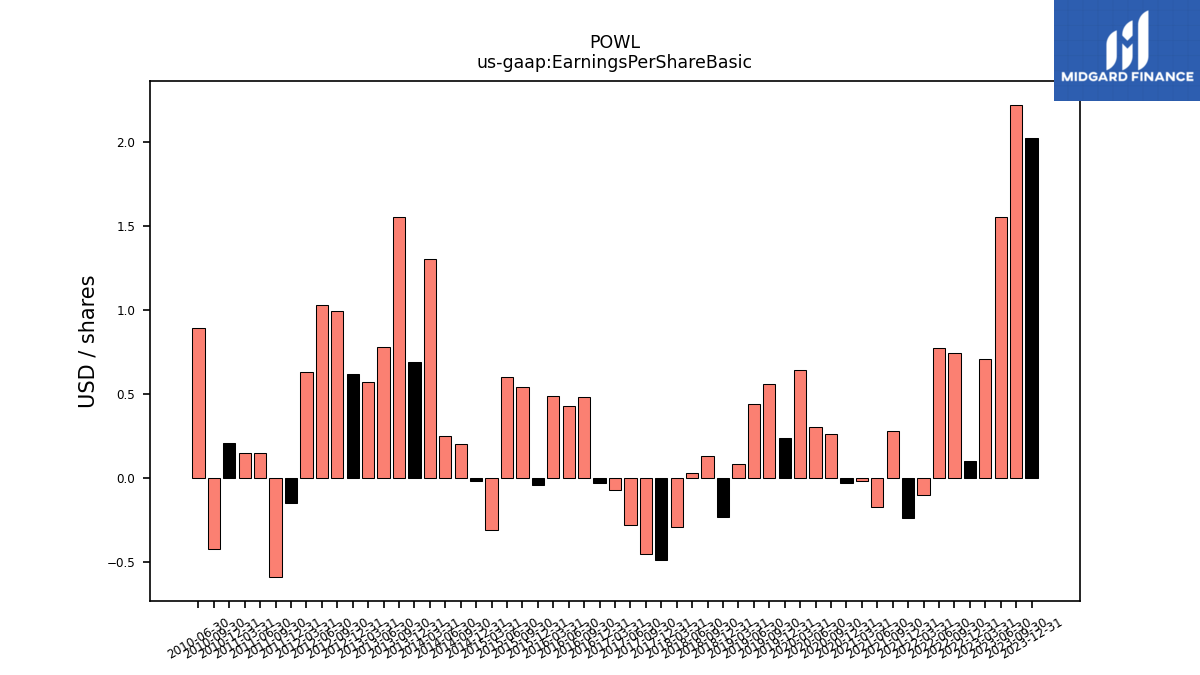
| Earnings Per Share Basic | 2.02 | 2.22 | 1.55 | 0.71 | 0.10 | 0.74 | 0.77 | -0.10 | -0.24 | 0.28 | -0.17 | -0.02 | -0.03 | 0.26 | 0.30 | 0.64 | 0.24 | 0.56 | 0.44 | 0.08 | -0.23 | 0.13 | 0.03 | -0.29 | -0.49 | -0.45 | -0.28 | -0.07 | -0.03 | 1.55 | 0.78 | 0.57 | 0.62 | 0.99 | 1.03 | 0.63 | -0.15 | -0.59 | 0.15 | 0.15 | 0.21 | |
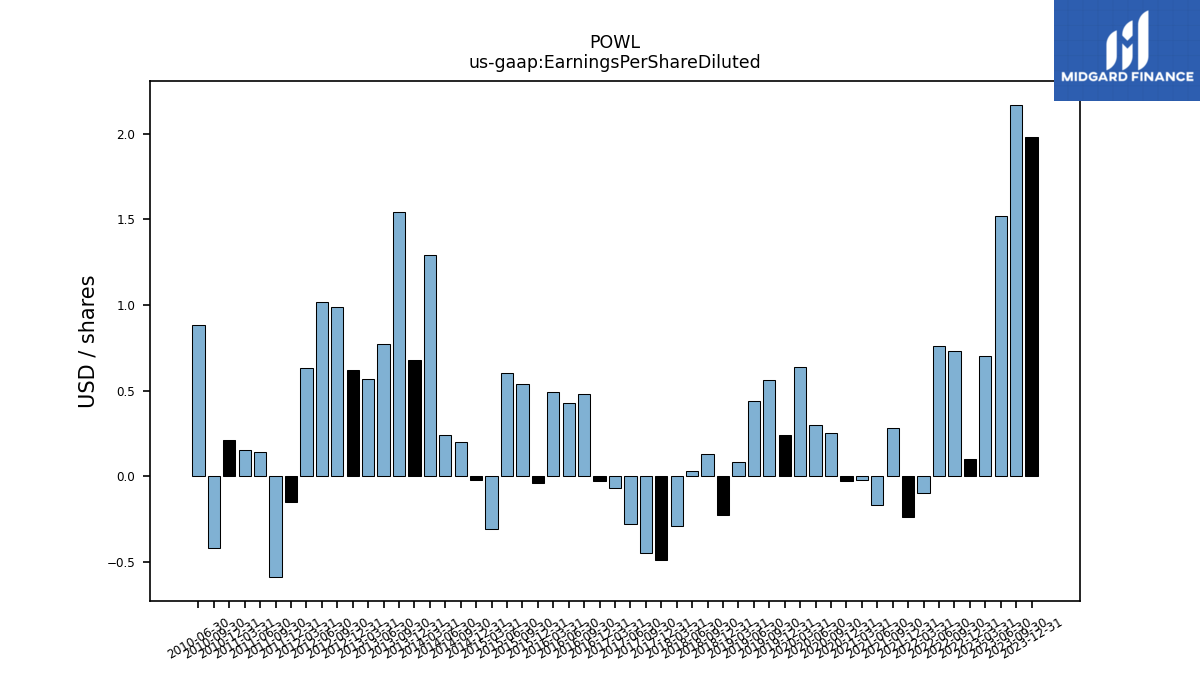
| Earnings Per Share Diluted | 1.98 | 2.17 | 1.52 | 0.70 | 0.10 | 0.73 | 0.76 | -0.10 | -0.24 | 0.28 | -0.17 | -0.02 | -0.03 | 0.25 | 0.30 | 0.64 | 0.24 | 0.56 | 0.44 | 0.08 | -0.23 | 0.13 | 0.03 | -0.29 | -0.49 | -0.45 | -0.28 | -0.07 | -0.03 | 1.54 | 0.77 | 0.57 | 0.62 | 0.99 | 1.02 | 0.63 | -0.15 | -0.59 | 0.14 | 0.15 | 0.21 |
| 2023-12-31 | 2023-09-30 | 2023-06-30 | 2023-03-31 | 2022-12-31 | 2022-09-30 | 2022-06-30 | 2022-03-31 | 2021-12-31 | 2021-09-30 | 2021-06-30 | 2021-03-31 | 2020-12-31 | 2020-09-30 | 2020-06-30 | 2020-03-31 | 2019-12-31 | 2019-09-30 | 2019-06-30 | 2019-03-31 | 2018-12-31 | 2018-09-30 | 2018-06-30 | 2018-03-31 | 2017-12-31 | 2017-09-30 | 2017-06-30 | 2017-03-31 | 2016-12-31 | 2013-09-30 | 2013-06-30 | 2013-03-31 | 2012-12-31 | 2012-09-30 | 2012-06-30 | 2012-03-31 | 2011-12-31 | 2011-09-30 | 2011-06-30 | 2011-03-31 | 2010-12-31 | ||
|---|---|---|---|---|---|---|---|---|---|---|---|---|---|---|---|---|---|---|---|---|---|---|---|---|---|---|---|---|---|---|---|---|---|---|---|---|---|---|---|---|---|---|
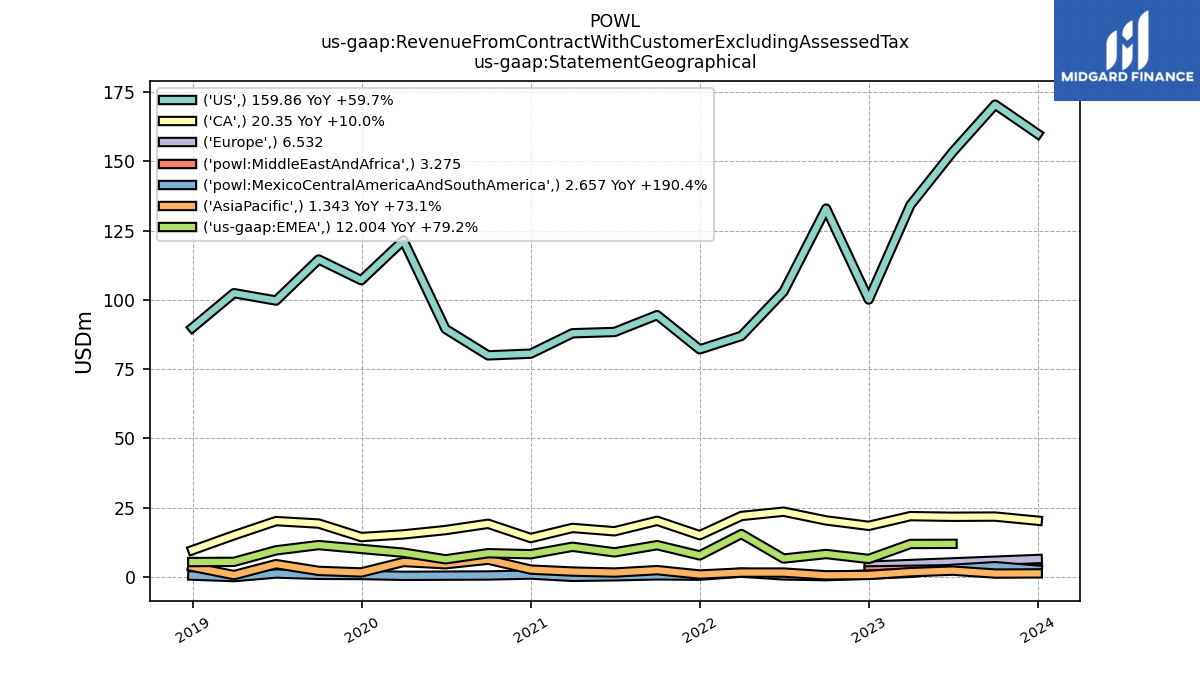
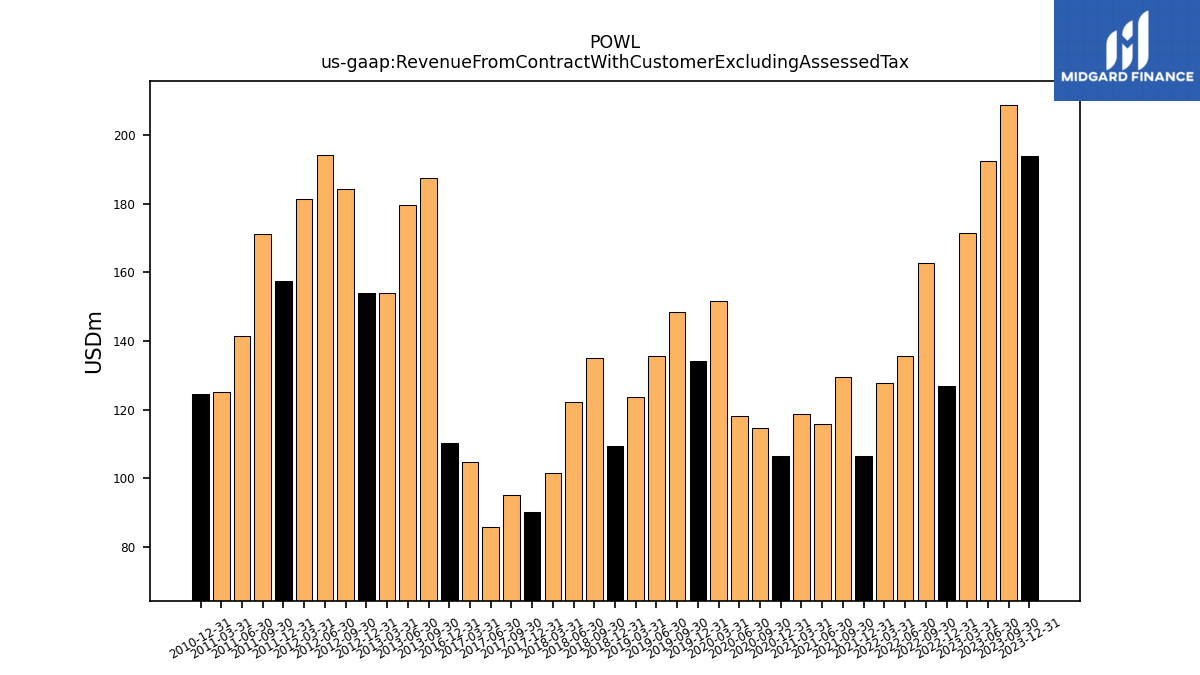
| Revenue From Contract With Customer Excluding Assessed Tax | 194.02 | 208.64 | 192.37 | 171.44 | 126.86 | 162.68 | 135.48 | 127.85 | 106.57 | 129.46 | 115.81 | 118.72 | 106.58 | 114.72 | 118.06 | 151.57 | 134.15 | 148.50 | 135.59 | 123.74 | 109.35 | 134.90 | 122.13 | 101.50 | 90.18 | 94.96 | 85.93 | 104.68 | 110.34 | 187.40 | 179.52 | 153.91 | 153.94 | 184.16 | 194.09 | 181.49 | 157.46 | 171.24 | 141.37 | 125.11 | 124.67 | |
| Revenue From Contract With Customer Including Assessed Tax | 194.02 | 208.64 | 192.37 | 171.44 | 126.86 | 162.68 | 135.48 | 127.85 | 106.57 | 129.46 | 115.81 | 118.72 | 106.58 | 114.72 | 118.06 | 151.57 | 134.15 | 148.50 | 135.59 | 123.74 | 109.35 | 134.90 | 122.13 | 101.50 | 90.18 | 94.96 | 85.93 | 104.68 | 110.34 | 187.40 | 179.52 | 153.91 | 153.94 | 184.16 | 194.09 | 181.49 | 157.46 | 171.24 | 141.37 | 125.11 | 124.67 | |
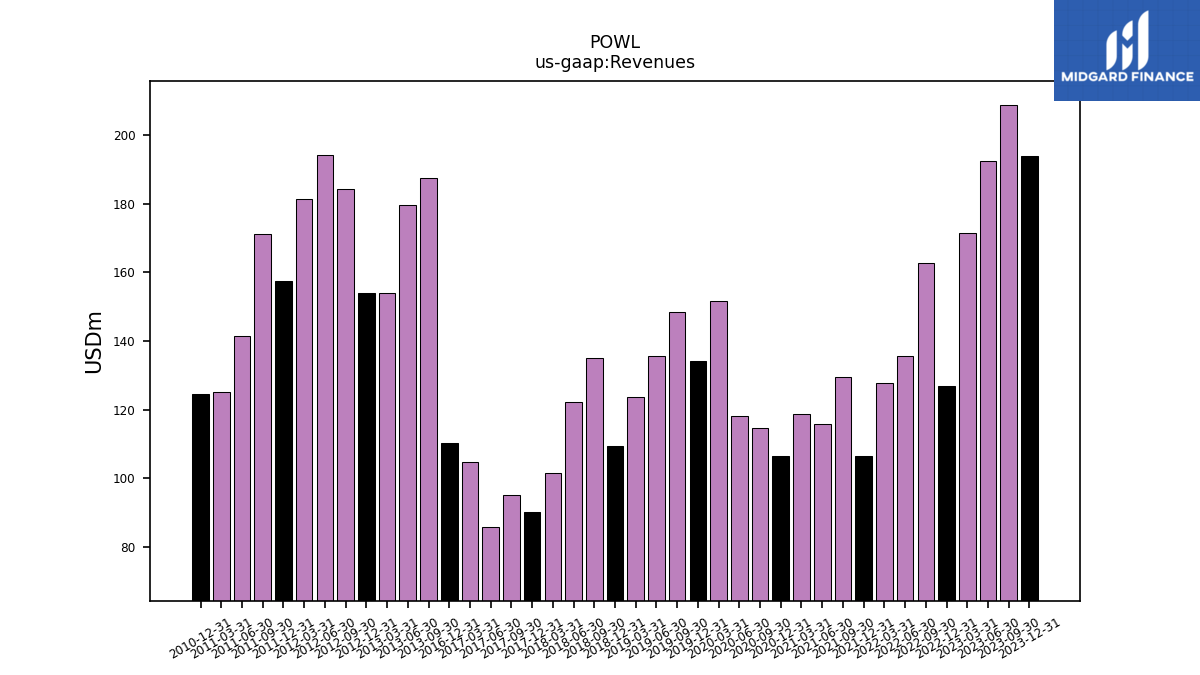
| Revenues | 194.02 | 208.64 | 192.37 | 171.44 | 126.86 | 162.68 | 135.48 | 127.85 | 106.57 | 129.46 | 115.81 | 118.72 | 106.58 | 114.72 | 118.06 | 151.57 | 134.15 | 148.50 | 135.59 | 123.74 | 109.35 | 134.90 | 122.13 | 101.50 | 90.18 | 94.96 | 85.93 | 104.68 | 110.34 | 187.40 | 179.52 | 153.91 | 153.94 | 184.16 | 194.09 | 181.49 | 157.46 | 171.24 | 141.37 | 125.11 | 124.67 | |
| Cost Of Goods And Services Sold | 145.82 | 156.66 | 149.69 | 138.01 | 107.39 | 129.24 | 116.42 | 108.77 | 93.13 | 106.98 | 98.65 | 101.56 | 88.30 | 93.00 | 96.72 | 121.89 | 112.32 | 119.95 | 111.87 | 103.66 | 94.72 | 110.89 | 103.75 | 89.08 | 79.63 | 84.07 | 76.87 | NA | NA | NA | NA | NA | NA | NA | NA | NA | NA | NA | NA | NA | NA | |
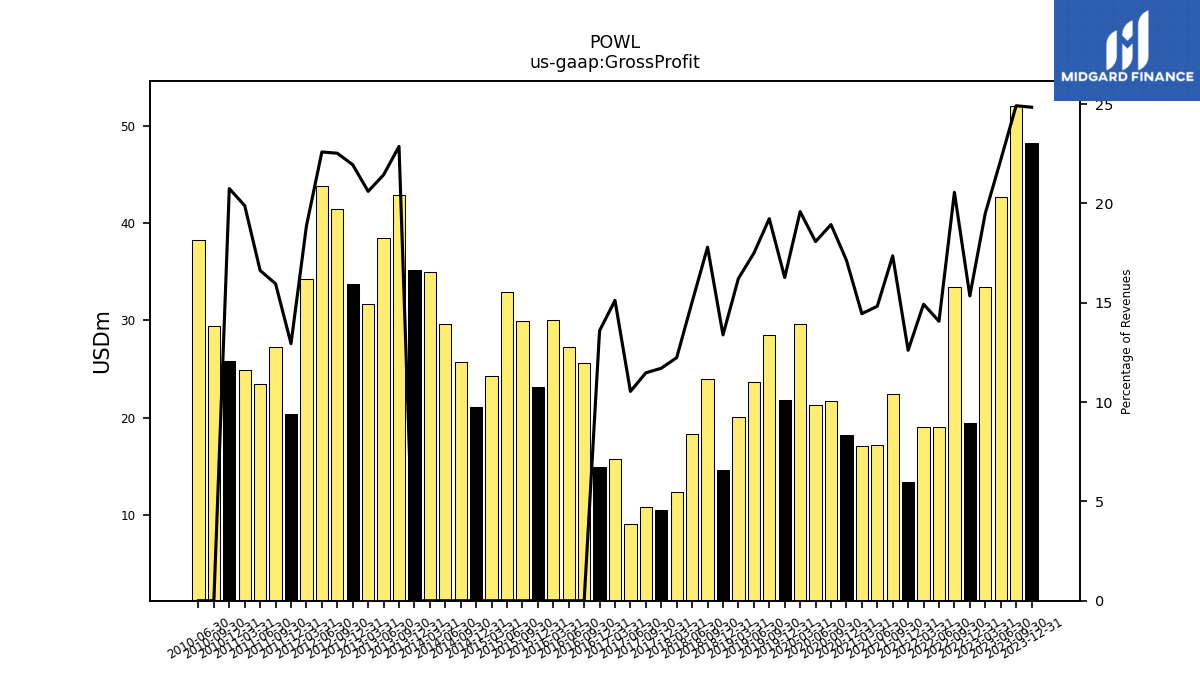
| Gross Profit | 48.19 | 51.98 | 42.67 | 33.44 | 19.46 | 33.44 | 19.06 | 19.08 | 13.44 | 22.47 | 17.17 | 17.15 | 18.27 | 21.72 | 21.34 | 29.68 | 21.83 | 28.55 | 23.71 | 20.07 | 14.63 | 24.00 | 18.38 | 12.42 | 10.55 | 10.89 | 9.05 | 15.82 | 15.00 | 42.85 | 38.48 | 31.71 | 33.78 | 41.48 | 43.84 | 34.24 | 20.38 | 27.32 | 23.50 | 24.88 | 25.86 | |
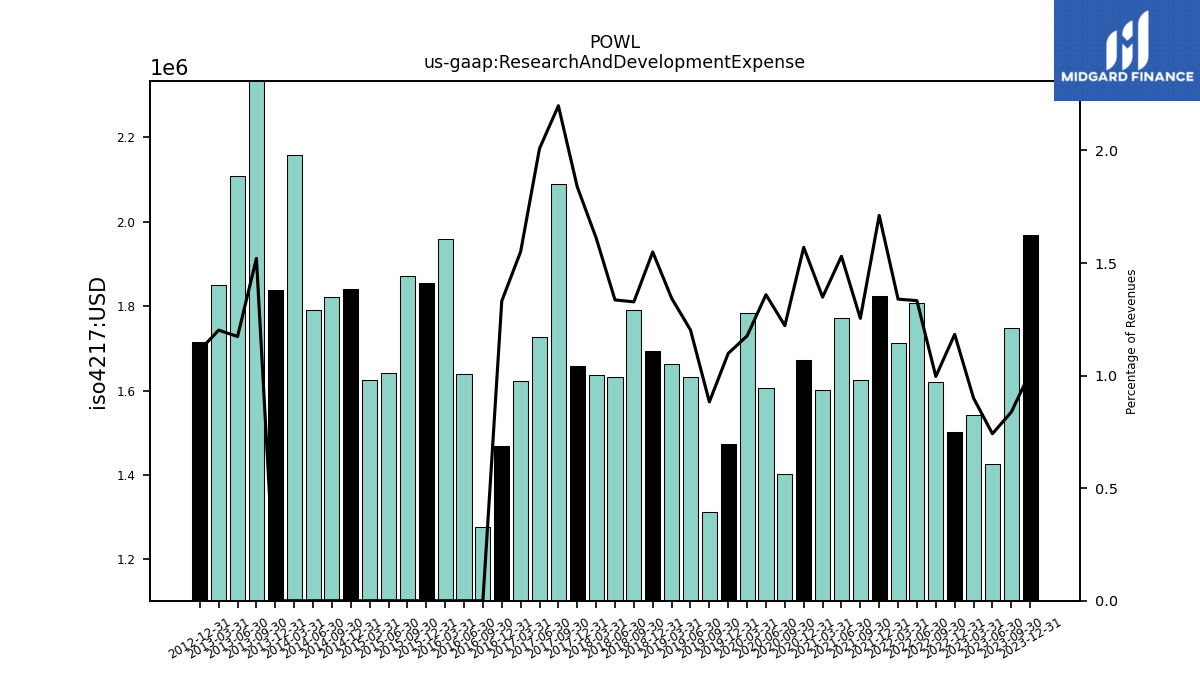
| Research And Development Expense | 1.97 | 1.75 | 1.43 | 1.54 | 1.50 | 1.62 | 1.81 | 1.71 | 1.82 | 1.62 | 1.77 | 1.60 | 1.67 | 1.40 | 1.60 | 1.78 | 1.47 | 1.31 | 1.63 | 1.66 | 1.69 | 1.79 | 1.63 | 1.64 | 1.66 | 2.09 | 1.73 | 1.62 | 1.47 | 2.85 | 2.11 | 1.85 | 1.71 | NA | NA | NA | NA | NA | NA | NA | NA | |
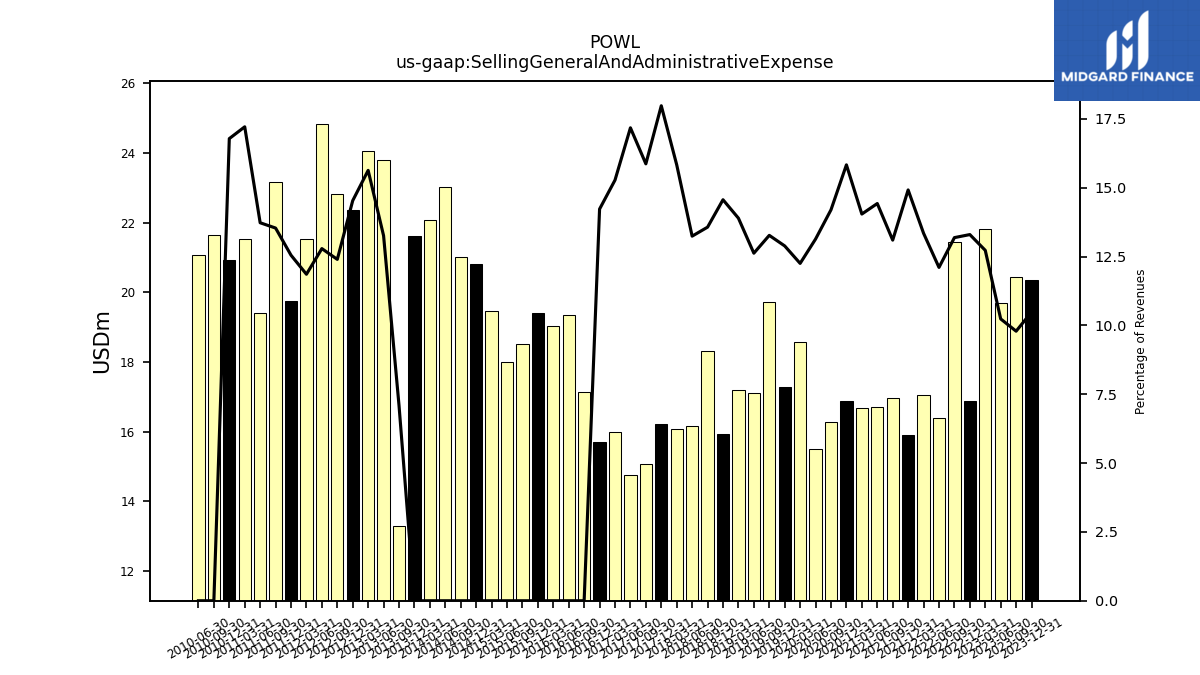
| Selling General And Administrative Expense | 20.35 | 20.43 | 19.69 | 21.82 | 16.87 | 21.46 | 16.40 | 17.07 | 15.90 | 16.96 | 16.71 | 16.68 | 16.87 | 16.29 | 15.51 | 18.57 | 17.29 | 19.71 | 17.12 | 17.20 | 15.93 | 18.31 | 16.17 | 16.07 | 16.21 | 15.07 | 14.76 | 15.99 | 15.70 | 13.30 | 23.80 | 24.06 | 22.37 | 22.84 | 24.83 | 21.52 | 19.76 | 23.18 | 19.41 | 21.54 | 20.93 | |
| Operating Income Loss | 25.88 | 29.80 | 21.55 | 10.07 | 1.09 | 10.36 | 0.85 | 0.30 | -4.29 | 3.86 | -1.36 | -1.17 | -0.32 | 3.98 | 2.78 | 9.29 | 3.02 | 7.68 | 5.64 | 1.17 | -3.04 | 3.08 | 0.53 | -5.33 | -7.39 | -6.84 | -7.52 | -2.72 | -2.26 | 18.40 | 12.55 | 7.24 | 11.00 | 18.16 | 18.31 | 12.01 | -0.09 | -6.51 | 2.85 | 2.08 | 3.77 | |
| Interest Income Expense Nonoperating Net | 4.00 | NA | 2.09 | 0.90 | 0.52 | NA | 0.06 | 0.01 | 0.00 | NA | 0.02 | -0.00 | NA | NA | NA | NA | NA | NA | NA | NA | NA | NA | NA | NA | NA | NA | NA | NA | NA | NA | NA | NA | NA | NA | NA | NA | NA | NA | NA | NA | NA | |
| Disposal Group Not Discontinued Operation Gain Loss On Disposal | NA | NA | NA | NA | NA | NA | 2.00 | NA | NA | NA | NA | NA | NA | NA | NA | NA | NA | NA | NA | NA | NA | NA | NA | NA | NA | NA | NA | NA | NA | NA | NA | NA | NA | NA | NA | NA | NA | NA | NA | NA | NA | |
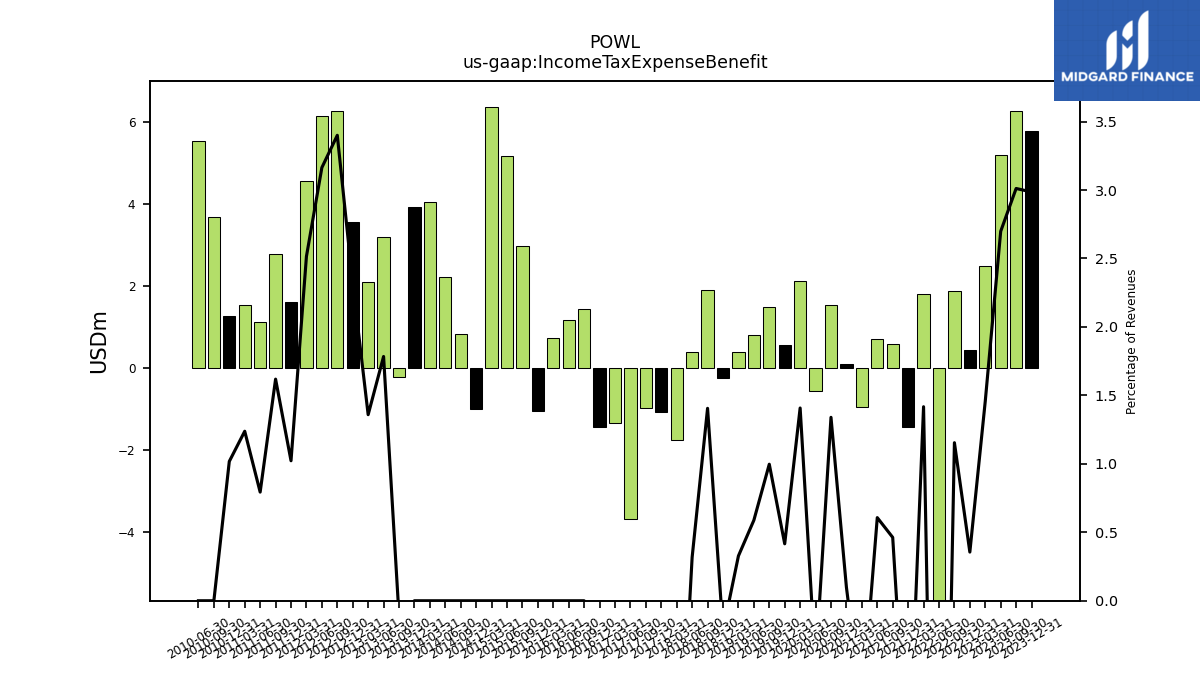
| Income Tax Expense Benefit | 5.79 | 6.28 | 5.19 | 2.50 | 0.45 | 1.88 | -6.14 | 1.81 | -1.44 | 0.60 | 0.70 | -0.95 | 0.10 | 1.54 | -0.56 | 2.13 | 0.56 | 1.48 | 0.80 | 0.41 | -0.24 | 1.90 | 0.39 | -1.76 | -1.07 | -0.96 | -3.68 | -1.34 | -1.44 | -0.21 | 3.20 | 2.09 | 3.57 | 6.26 | 6.14 | 4.57 | 1.61 | 2.77 | 1.12 | 1.55 | 1.27 | |
| Other Comprehensive Income Loss Cash Flow Hedge Gain Loss After Reclassification And Tax | NA | 0.03 | -0.04 | 0.11 | 0.22 | NA | NA | NA | NA | NA | NA | NA | NA | NA | NA | NA | NA | NA | NA | NA | NA | NA | NA | NA | NA | NA | NA | NA | NA | NA | NA | NA | NA | NA | NA | NA | NA | NA | NA | NA | NA | |
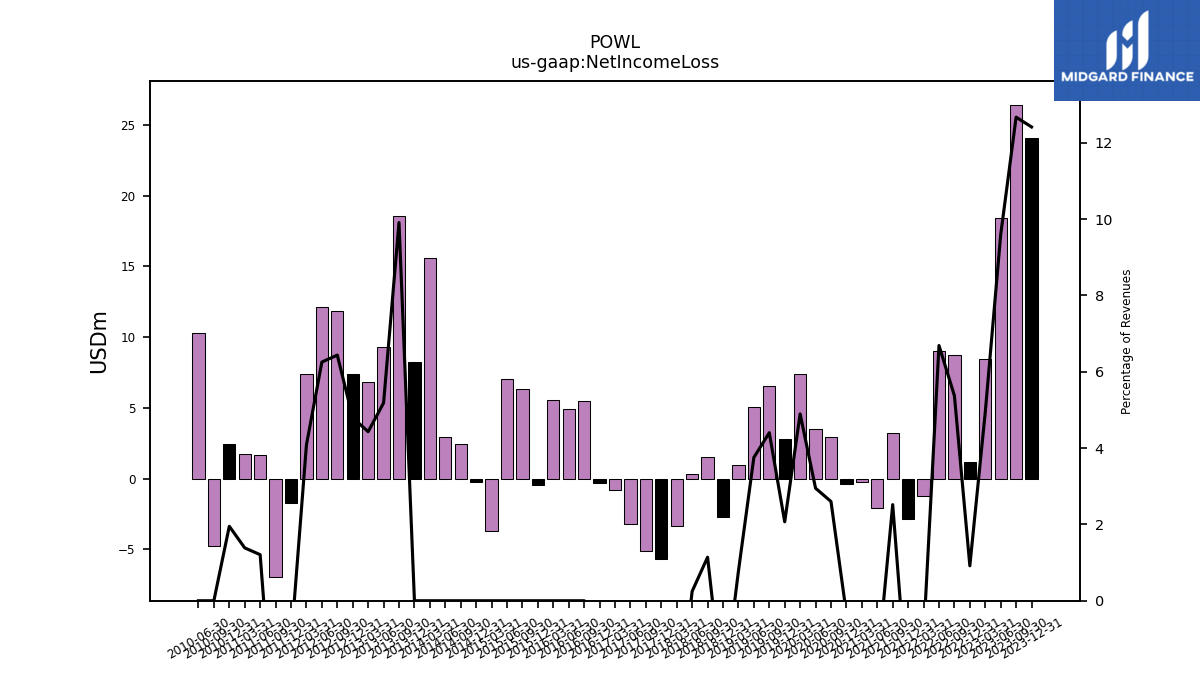
| Net Income Loss | 24.09 | 26.44 | 18.45 | 8.47 | 1.16 | 8.74 | 9.06 | -1.22 | -2.85 | 3.26 | -2.04 | -0.23 | -0.36 | 2.98 | 3.48 | 7.42 | 2.77 | 6.54 | 5.09 | 0.96 | -2.69 | 1.54 | 0.30 | -3.33 | -5.66 | -5.14 | -3.21 | -0.83 | -0.30 | 18.57 | 9.30 | 6.82 | 7.38 | 11.85 | 12.14 | 7.41 | -1.75 | -6.95 | 1.71 | 1.73 | 2.43 | |
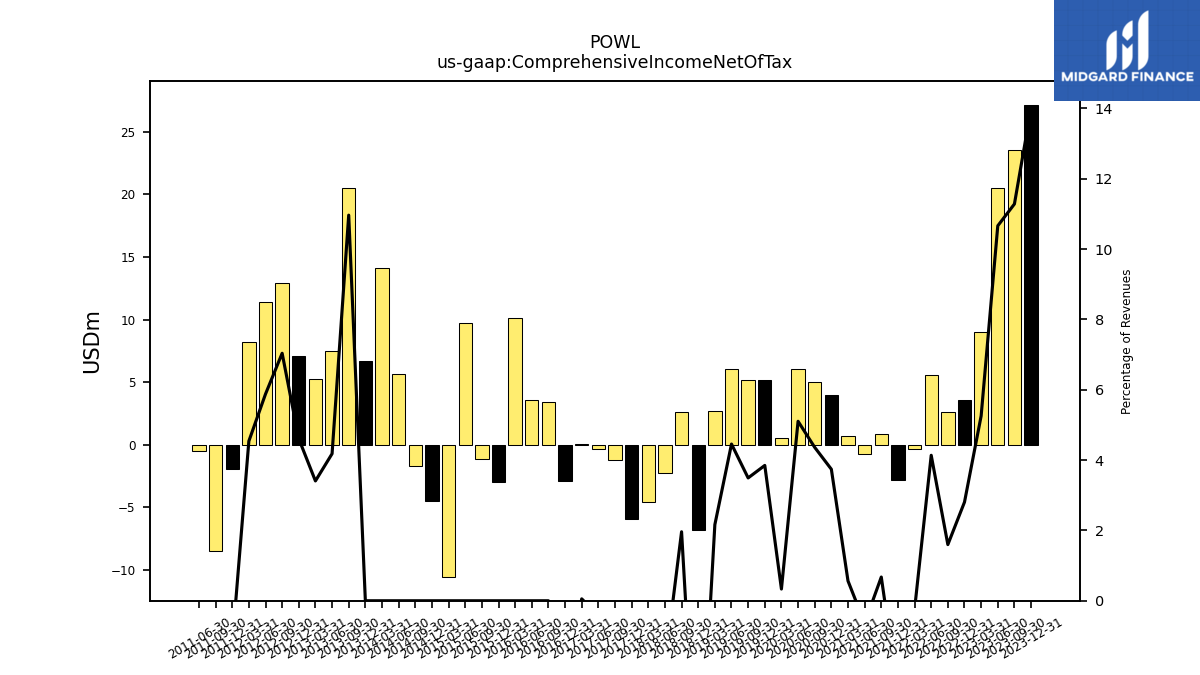
| Comprehensive Income Net Of Tax | 27.17 | 23.54 | 20.51 | 9.01 | 3.56 | 2.60 | 5.60 | -0.32 | -2.79 | 0.87 | -0.74 | 0.67 | 3.98 | 5.00 | 6.02 | 0.51 | 5.16 | 5.19 | 6.04 | 2.68 | -6.78 | 2.65 | -2.24 | -4.61 | -5.98 | -1.25 | -0.37 | 0.06 | -2.91 | 20.55 | 7.50 | 5.24 | 7.09 | 12.96 | 11.41 | 8.24 | -1.95 | -8.47 | -0.49 | NA | NA |
| 2023-12-31 | 2023-09-30 | 2023-06-30 | 2023-03-31 | 2022-12-31 | 2022-09-30 | 2022-06-30 | 2022-03-31 | 2021-12-31 | 2021-09-30 | 2021-06-30 | 2021-03-31 | 2020-12-31 | 2020-09-30 | 2020-06-30 | 2020-03-31 | 2019-12-31 | 2019-09-30 | 2019-06-30 | 2019-03-31 | 2018-12-31 | 2018-09-30 | 2018-06-30 | 2018-03-31 | 2017-12-31 | 2017-09-30 | 2017-06-30 | 2017-03-31 | 2016-12-31 | 2013-09-30 | 2013-06-30 | 2013-03-31 | 2012-12-31 | 2012-09-30 | 2012-06-30 | 2012-03-31 | 2011-12-31 | 2011-09-30 | 2011-06-30 | 2011-03-31 | 2010-12-31 | ||
|---|---|---|---|---|---|---|---|---|---|---|---|---|---|---|---|---|---|---|---|---|---|---|---|---|---|---|---|---|---|---|---|---|---|---|---|---|---|---|---|---|---|---|
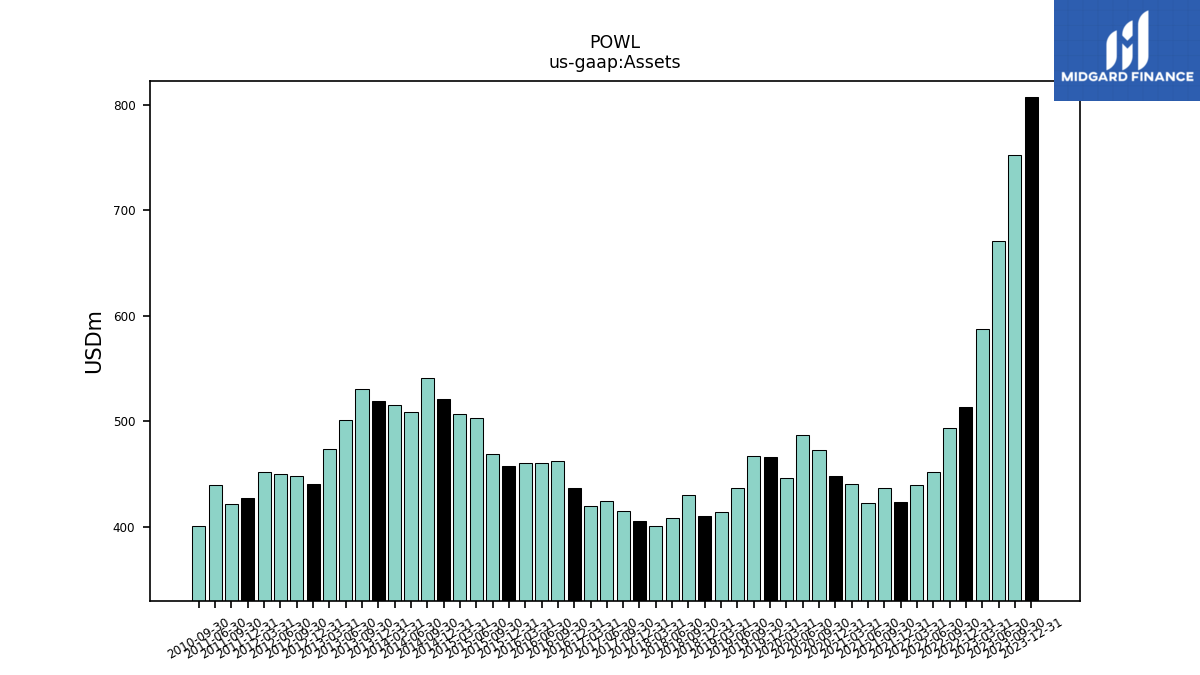
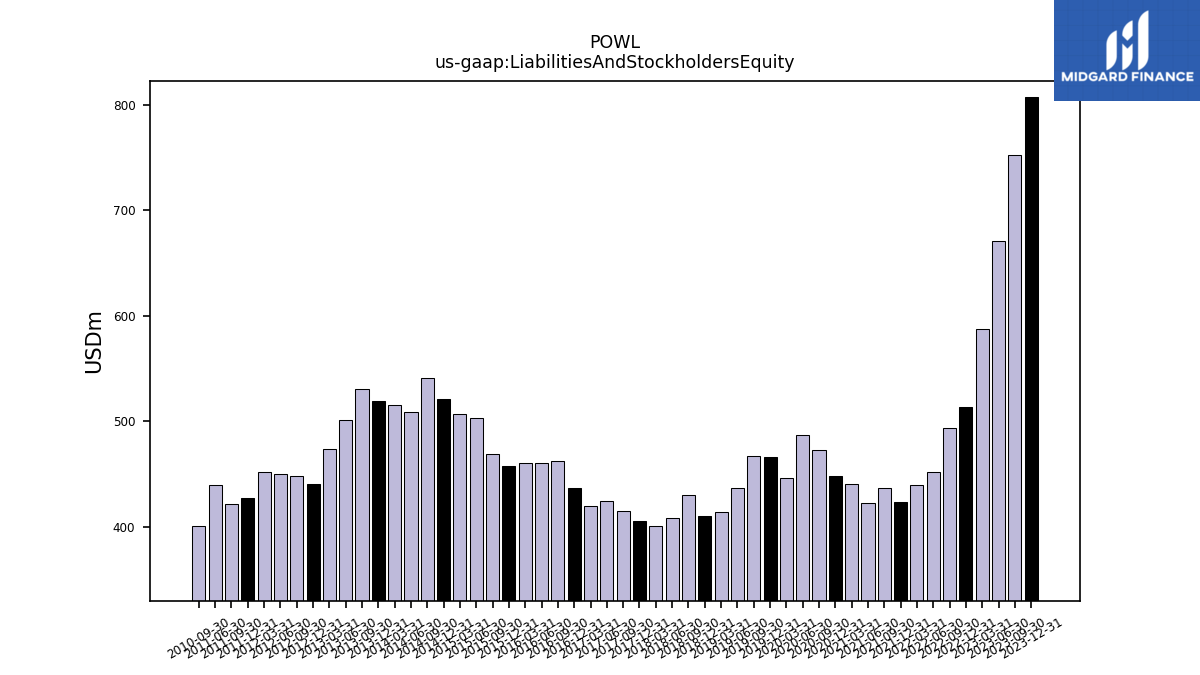
| Assets | 807.95 | 752.24 | 671.10 | 587.10 | 513.67 | 493.38 | 451.80 | 439.70 | 423.80 | 436.19 | 421.96 | 440.75 | 448.31 | 472.28 | 487.20 | 446.60 | 466.45 | 467.41 | 437.11 | 413.60 | 410.02 | 429.95 | 408.65 | 400.14 | 405.65 | 414.99 | 424.33 | 419.96 | 436.99 | 530.90 | 501.21 | 473.43 | 440.28 | 448.31 | 449.48 | 451.92 | 426.98 | 421.68 | 439.78 | NA | NA | |
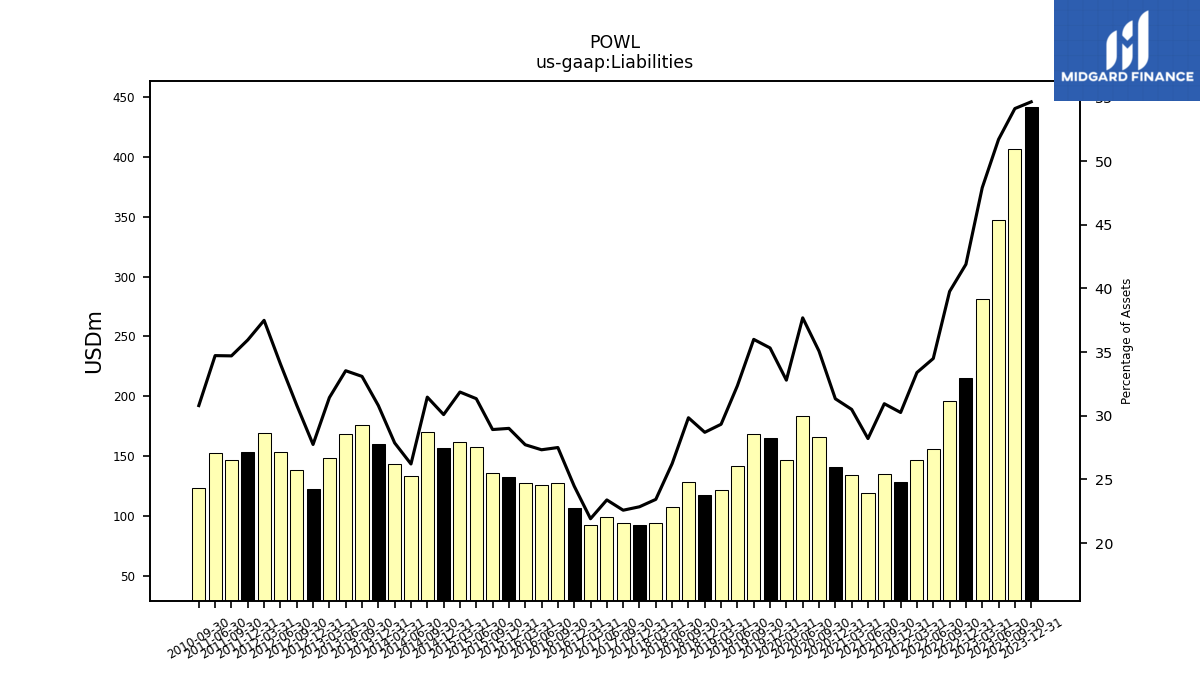
| Liabilities | 441.63 | 407.22 | 347.03 | 281.30 | 215.20 | 196.17 | 155.86 | 146.84 | 128.22 | 134.97 | 119.02 | 134.42 | 140.47 | 165.65 | 183.63 | 146.47 | 164.78 | 168.26 | 141.45 | 121.31 | 117.66 | 128.31 | 107.20 | 93.75 | 92.68 | 93.69 | 99.23 | 92.01 | 106.94 | 175.68 | 168.08 | 148.77 | 122.15 | 138.21 | 153.16 | 169.44 | 153.51 | 146.33 | 152.71 | NA | NA | |
| Liabilities And Stockholders Equity | 807.95 | 752.24 | 671.10 | 587.10 | 513.67 | 493.38 | 451.80 | 439.70 | 423.80 | 436.19 | 421.96 | 440.75 | 448.31 | 472.28 | 487.20 | 446.60 | 466.45 | 467.41 | 437.11 | 413.60 | 410.02 | 429.95 | 408.65 | 400.14 | 405.65 | 414.99 | 424.33 | 419.96 | 436.99 | 530.90 | 501.21 | 473.43 | 440.28 | 448.31 | 449.48 | 451.92 | 426.98 | 421.68 | 439.78 | NA | NA | |
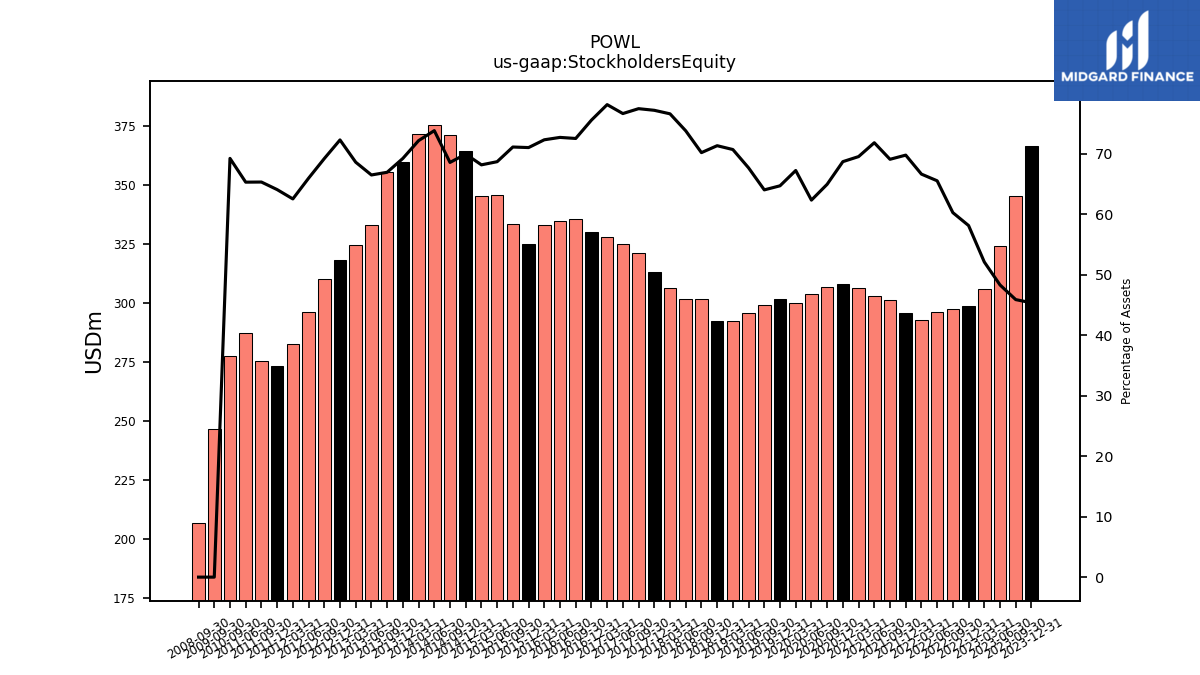
| Stockholders Equity | 366.32 | 345.03 | 324.07 | 305.80 | 298.47 | 297.21 | 295.95 | 292.87 | 295.58 | 301.22 | 302.94 | 306.33 | 307.85 | 306.63 | 303.57 | 300.13 | 301.67 | 299.15 | 295.66 | 292.29 | 292.36 | 301.64 | 301.45 | 306.39 | 312.97 | 321.30 | 325.10 | 327.95 | 330.05 | 355.23 | 333.13 | 324.66 | 318.13 | 310.10 | 296.32 | 282.47 | 273.46 | 275.34 | 287.08 | NA | NA |
| 2023-12-31 | 2023-09-30 | 2023-06-30 | 2023-03-31 | 2022-12-31 | 2022-09-30 | 2022-06-30 | 2022-03-31 | 2021-12-31 | 2021-09-30 | 2021-06-30 | 2021-03-31 | 2020-12-31 | 2020-09-30 | 2020-06-30 | 2020-03-31 | 2019-12-31 | 2019-09-30 | 2019-06-30 | 2019-03-31 | 2018-12-31 | 2018-09-30 | 2018-06-30 | 2018-03-31 | 2017-12-31 | 2017-09-30 | 2017-06-30 | 2017-03-31 | 2016-12-31 | 2013-09-30 | 2013-06-30 | 2013-03-31 | 2012-12-31 | 2012-09-30 | 2012-06-30 | 2012-03-31 | 2011-12-31 | 2011-09-30 | 2011-06-30 | 2011-03-31 | 2010-12-31 | ||
|---|---|---|---|---|---|---|---|---|---|---|---|---|---|---|---|---|---|---|---|---|---|---|---|---|---|---|---|---|---|---|---|---|---|---|---|---|---|---|---|---|---|---|
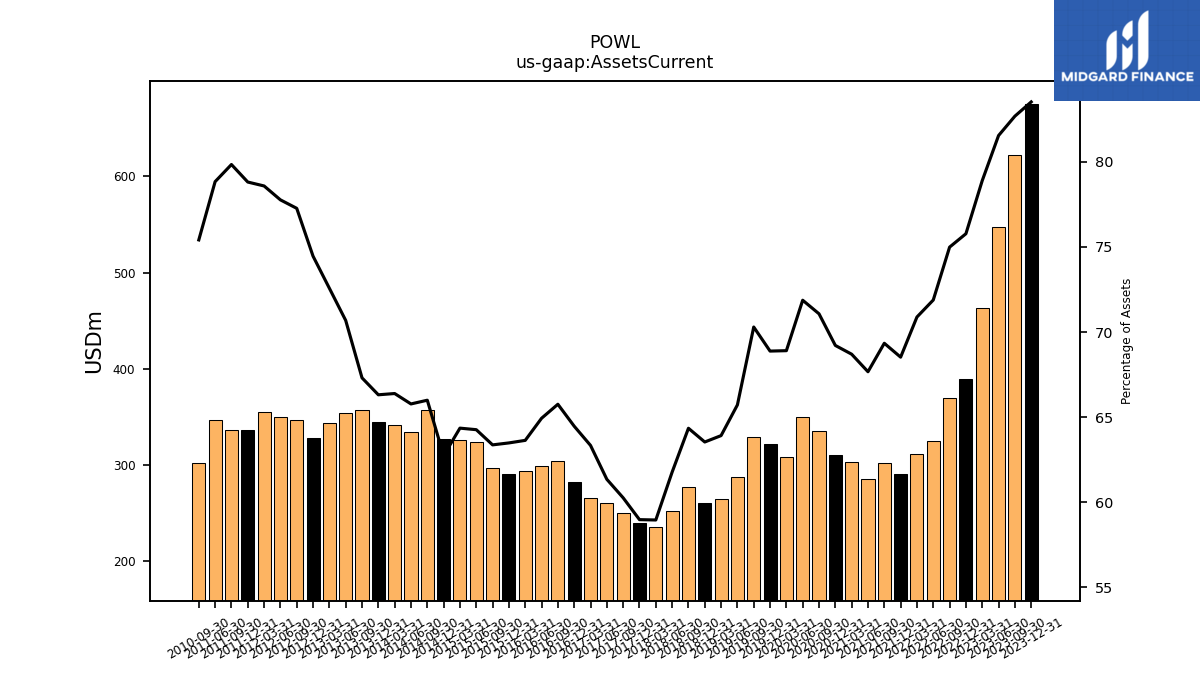
| Assets Current | 674.83 | 621.99 | 547.25 | 463.20 | 389.24 | 369.98 | 324.77 | 311.68 | 290.41 | 302.46 | 285.53 | 302.79 | 310.29 | 335.66 | 350.15 | 307.73 | 321.30 | 328.57 | 287.27 | 264.36 | 260.53 | 276.66 | 252.42 | 235.91 | 239.25 | 250.07 | 260.32 | 266.00 | 281.72 | 357.34 | 354.27 | 343.58 | 327.83 | 346.41 | 349.55 | 355.13 | 336.52 | 336.68 | 346.71 | NA | NA | |
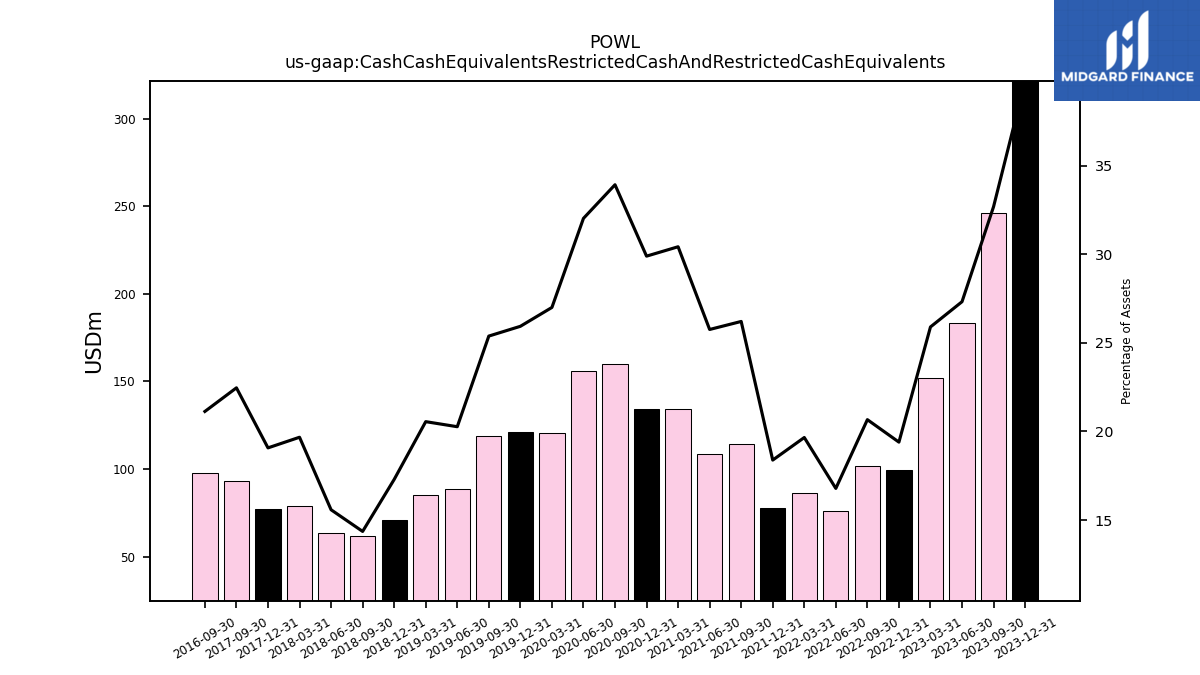
| Cash And Cash Equivalents At Carrying Value | 321.40 | 245.88 | 183.35 | 152.04 | 99.63 | 101.95 | 75.83 | 86.43 | 77.91 | 114.31 | 108.67 | 134.09 | 134.02 | 160.22 | 156.03 | 120.57 | 120.97 | 118.64 | 71.92 | 66.38 | 55.01 | 36.58 | 40.08 | 48.24 | 49.59 | 68.36 | 32.48 | 93.47 | 80.58 | 107.75 | 124.86 | 114.06 | 97.37 | 90.04 | 106.83 | 128.06 | 104.27 | 123.47 | 137.27 | 122.06 | 120.92 | |
| Cash Cash Equivalents Restricted Cash And Restricted Cash Equivalents | 321.40 | 245.88 | 183.35 | 152.04 | 99.63 | 101.95 | 75.83 | 86.43 | 77.91 | 114.31 | 108.67 | 134.09 | 134.02 | 160.22 | 156.03 | 120.57 | 120.97 | 118.64 | 88.58 | 85.00 | 70.89 | 61.73 | 63.66 | 78.72 | 77.36 | 93.21 | NA | NA | NA | NA | NA | NA | NA | NA | NA | NA | NA | NA | NA | NA | NA | |
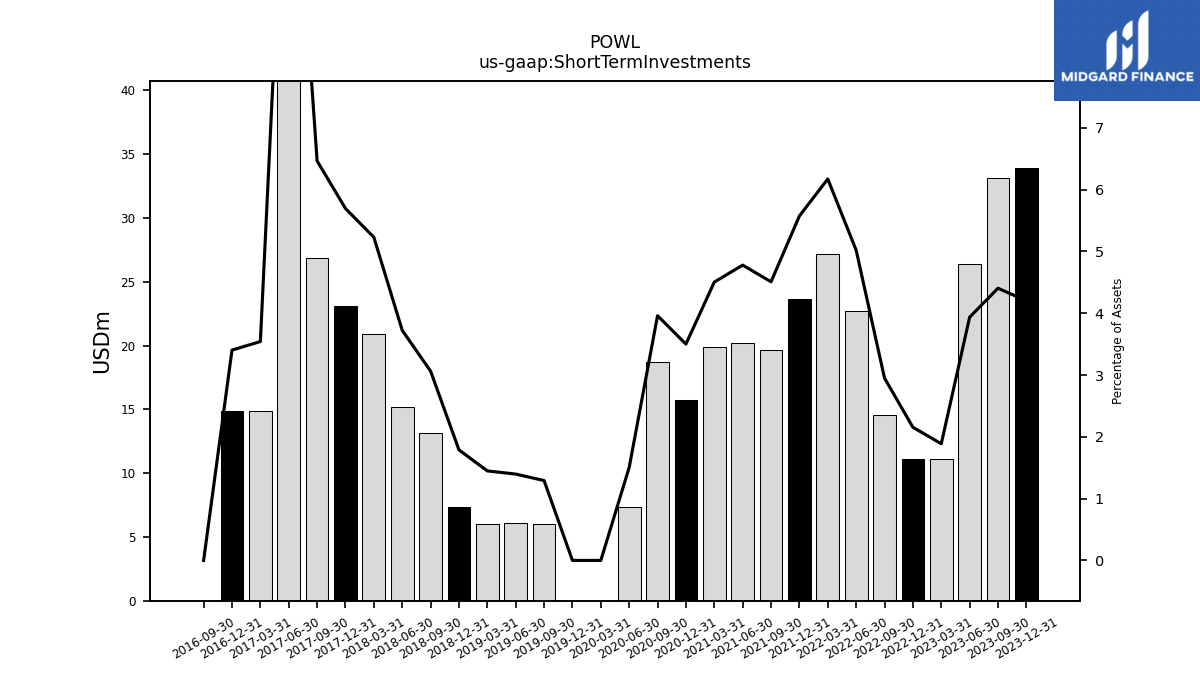
| Short Term Investments | 33.94 | 33.13 | 26.41 | 11.09 | 11.07 | 14.55 | 22.68 | 27.14 | 23.62 | 19.67 | 20.16 | 19.85 | 15.69 | 18.70 | 7.33 | 0.00 | 0.00 | 6.04 | 6.11 | 5.99 | 7.34 | 13.17 | 15.22 | 20.93 | 23.10 | 26.83 | 55.36 | 14.87 | 14.87 | NA | NA | NA | NA | NA | NA | NA | NA | NA | NA | NA | NA | |
| Accounts Receivable Net Current | 169.48 | 206.59 | 204.52 | 170.18 | 151.38 | 106.11 | 103.02 | 90.74 | 79.48 | 78.30 | 72.37 | 72.07 | 77.29 | 69.96 | 97.14 | 90.50 | 100.89 | 112.09 | 108.55 | 81.27 | 89.40 | 92.55 | 72.68 | 68.07 | 78.98 | 53.85 | 77.55 | 66.75 | 88.49 | 119.42 | 111.49 | 112.35 | 118.21 | 125.77 | 106.87 | 97.69 | 130.89 | 109.32 | 106.81 | NA | NA | |
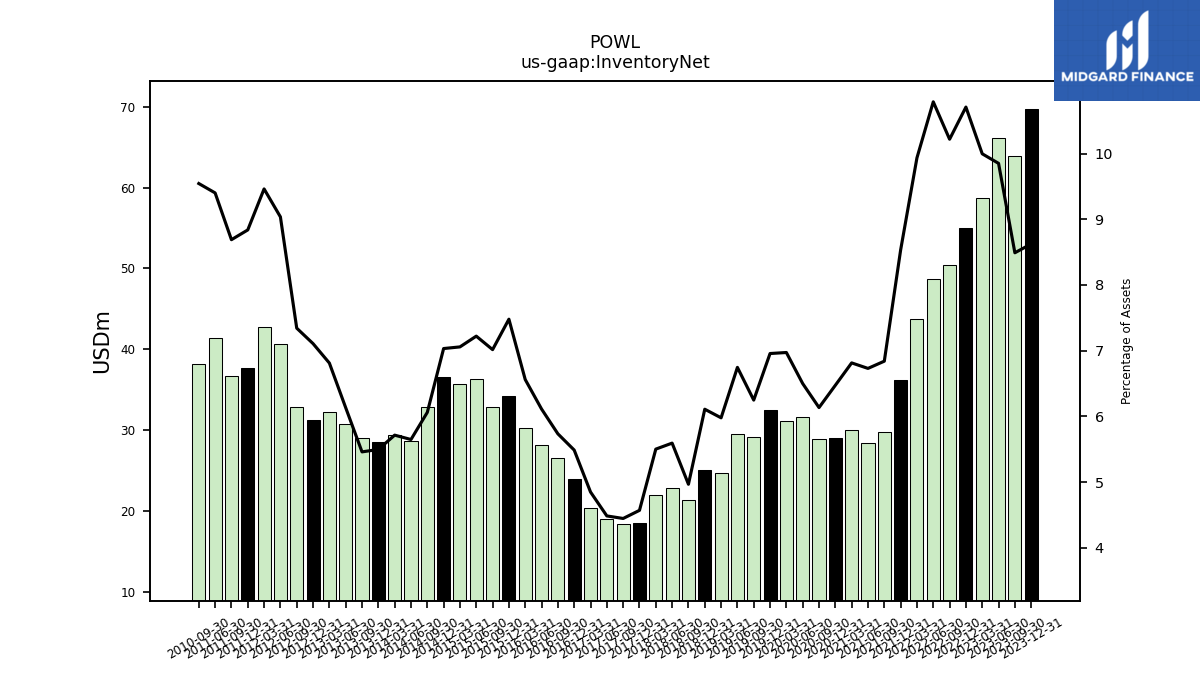
| Inventory Net | 69.68 | 63.87 | 66.11 | 58.69 | 55.00 | 50.41 | 48.74 | 43.69 | 36.16 | 29.84 | 28.40 | 30.03 | 29.02 | 28.97 | 31.66 | 31.14 | 32.45 | 29.20 | 29.48 | 24.72 | 25.05 | 21.35 | 22.85 | 22.01 | 18.54 | 18.45 | 19.03 | 20.36 | 23.98 | 28.98 | 30.73 | 32.25 | 31.29 | 32.92 | 40.62 | 42.76 | 37.73 | 36.64 | 41.34 | NA | NA | |
| Inventory Raw Materials And Supplies | NA | 68.63 | NA | NA | NA | 54.22 | NA | NA | NA | 33.15 | NA | NA | NA | 31.20 | NA | NA | NA | 31.78 | NA | NA | NA | 24.56 | NA | NA | NA | 22.10 | NA | NA | NA | 30.10 | 32.69 | 34.14 | 32.88 | 33.63 | 41.21 | NA | NA | 38.40 | NA | NA | NA | |
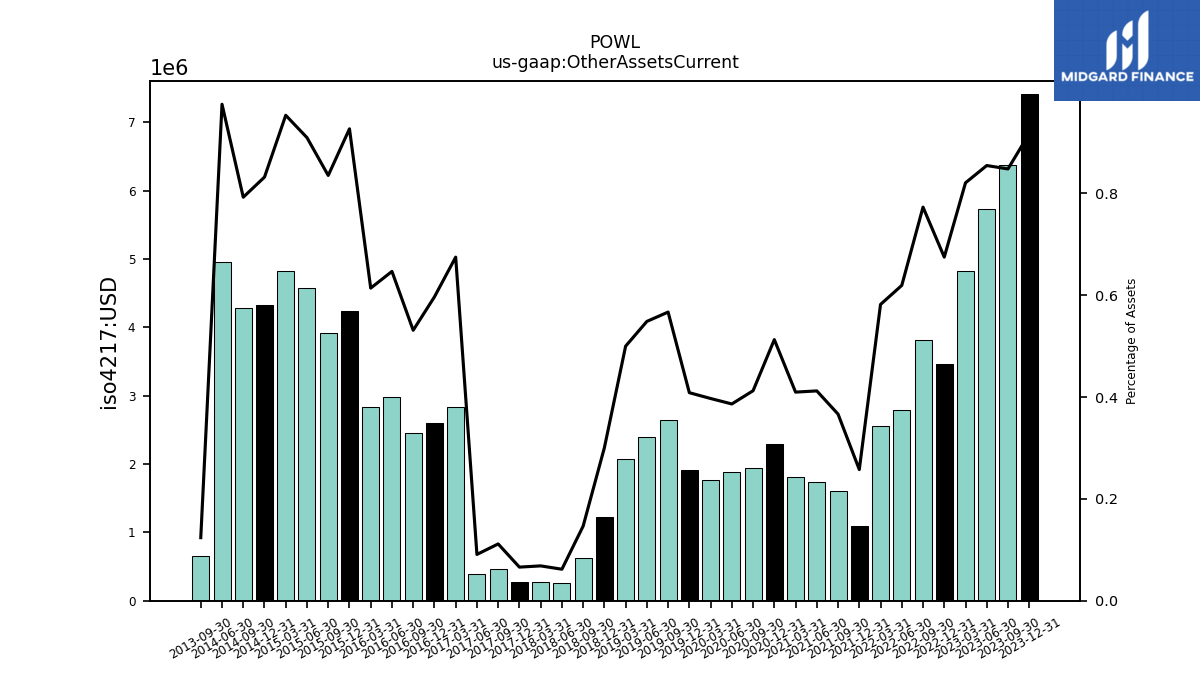
| Other Assets Current | 7.41 | 6.38 | 5.74 | 4.82 | 3.47 | 3.81 | 2.80 | 2.56 | 1.09 | 1.60 | 1.74 | 1.81 | 2.30 | 1.95 | 1.88 | 1.77 | 1.91 | 2.65 | 2.40 | 2.07 | 1.23 | 0.63 | 0.25 | 0.27 | 0.27 | 0.46 | 0.39 | 2.83 | 2.61 | 0.66 | NA | NA | NA | NA | NA | NA | NA | NA | NA | NA | NA |
| 2023-12-31 | 2023-09-30 | 2023-06-30 | 2023-03-31 | 2022-12-31 | 2022-09-30 | 2022-06-30 | 2022-03-31 | 2021-12-31 | 2021-09-30 | 2021-06-30 | 2021-03-31 | 2020-12-31 | 2020-09-30 | 2020-06-30 | 2020-03-31 | 2019-12-31 | 2019-09-30 | 2019-06-30 | 2019-03-31 | 2018-12-31 | 2018-09-30 | 2018-06-30 | 2018-03-31 | 2017-12-31 | 2017-09-30 | 2017-06-30 | 2017-03-31 | 2016-12-31 | 2013-09-30 | 2013-06-30 | 2013-03-31 | 2012-12-31 | 2012-09-30 | 2012-06-30 | 2012-03-31 | 2011-12-31 | 2011-09-30 | 2011-06-30 | 2011-03-31 | 2010-12-31 | ||
|---|---|---|---|---|---|---|---|---|---|---|---|---|---|---|---|---|---|---|---|---|---|---|---|---|---|---|---|---|---|---|---|---|---|---|---|---|---|---|---|---|---|---|
| Property Plant And Equipment Gross | 246.30 | 243.31 | NA | NA | NA | 235.33 | NA | NA | NA | 247.60 | NA | NA | NA | 258.12 | NA | NA | NA | 256.23 | NA | NA | NA | 254.22 | NA | NA | NA | 256.07 | NA | NA | NA | 227.25 | NA | NA | NA | 157.37 | NA | NA | NA | 130.25 | NA | NA | NA | |
| Accumulated Depreciation Depletion And Amortization Property Plant And Equipment | 147.98 | 145.69 | NA | NA | NA | 136.70 | NA | NA | NA | 138.15 | NA | NA | NA | 143.75 | NA | NA | NA | 135.42 | NA | NA | NA | 125.46 | NA | NA | NA | 116.65 | NA | NA | NA | 82.66 | NA | NA | NA | 78.72 | NA | NA | NA | 70.61 | NA | NA | NA | |
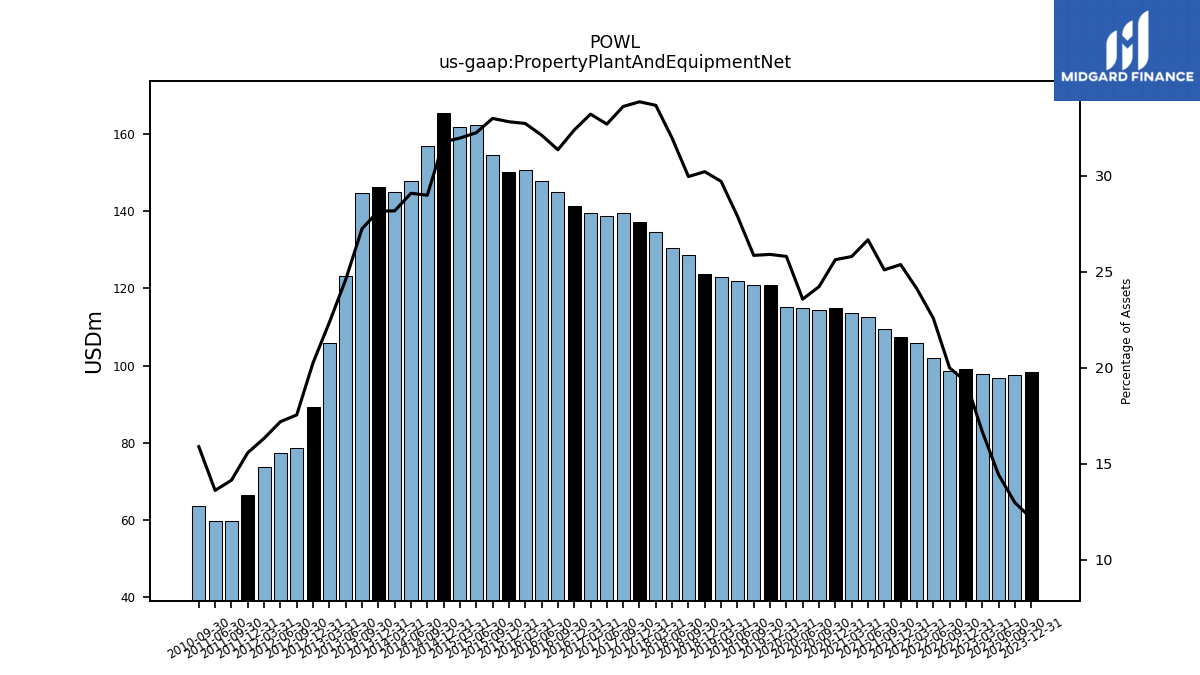
| Property Plant And Equipment Net | 98.32 | 97.62 | 96.88 | 97.91 | 99.05 | 98.63 | 102.02 | 105.97 | 107.51 | 109.46 | 112.48 | 113.65 | 114.87 | 114.37 | 114.83 | 115.19 | 120.80 | 120.81 | 121.91 | 122.84 | 123.84 | 128.76 | 130.54 | 134.68 | 137.27 | 139.42 | 138.66 | 139.42 | 141.45 | 144.59 | 123.23 | 105.86 | 89.19 | 78.65 | 77.27 | 73.77 | 66.51 | 59.64 | 59.87 | NA | NA | |
| Goodwill | NA | 1.00 | 1.00 | NA | NA | 1.00 | NA | NA | NA | 1.00 | NA | NA | NA | 1.00 | NA | NA | NA | NA | NA | NA | NA | NA | NA | NA | NA | NA | NA | NA | NA | 1.00 | 1.00 | 1.00 | 1.00 | 1.00 | 1.00 | 1.00 | 1.00 | 1.00 | 1.00 | NA | NA | |
| Intangible Assets Net Including Goodwill | 1.50 | 1.00 | NA | 1.00 | 1.00 | 1.00 | 1.00 | 1.00 | 1.00 | 1.00 | 1.03 | 1.07 | 1.12 | 1.16 | 1.21 | 1.25 | 1.29 | 1.34 | 1.38 | 1.43 | 1.47 | 1.51 | 1.56 | 1.60 | 1.65 | 1.72 | 1.82 | 1.89 | 1.97 | NA | NA | NA | NA | NA | NA | NA | NA | NA | NA | NA | NA | |
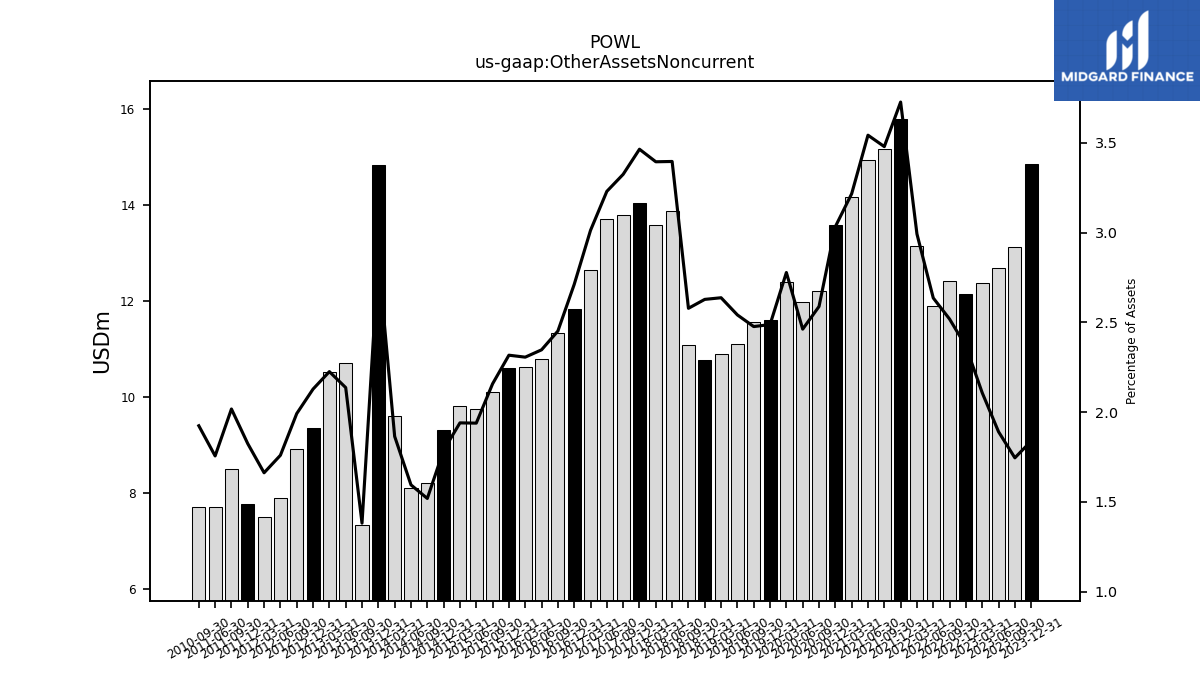
| Other Assets Noncurrent | 14.86 | 13.13 | 12.69 | 12.37 | 12.16 | 12.43 | 11.91 | 13.16 | 15.80 | 15.18 | 14.95 | 14.18 | 13.60 | 12.23 | 12.00 | 12.41 | 11.61 | 11.58 | 11.11 | 10.91 | 10.78 | 11.09 | 13.88 | 13.59 | 14.06 | 13.80 | 13.71 | 12.65 | 11.85 | 7.33 | 10.71 | 10.54 | 9.37 | 8.93 | 7.91 | 7.51 | 7.79 | 8.51 | 7.72 | NA | NA |
| 2023-12-31 | 2023-09-30 | 2023-06-30 | 2023-03-31 | 2022-12-31 | 2022-09-30 | 2022-06-30 | 2022-03-31 | 2021-12-31 | 2021-09-30 | 2021-06-30 | 2021-03-31 | 2020-12-31 | 2020-09-30 | 2020-06-30 | 2020-03-31 | 2019-12-31 | 2019-09-30 | 2019-06-30 | 2019-03-31 | 2018-12-31 | 2018-09-30 | 2018-06-30 | 2018-03-31 | 2017-12-31 | 2017-09-30 | 2017-06-30 | 2017-03-31 | 2016-12-31 | 2013-09-30 | 2013-06-30 | 2013-03-31 | 2012-12-31 | 2012-09-30 | 2012-06-30 | 2012-03-31 | 2011-12-31 | 2011-09-30 | 2011-06-30 | 2011-03-31 | 2010-12-31 | ||
|---|---|---|---|---|---|---|---|---|---|---|---|---|---|---|---|---|---|---|---|---|---|---|---|---|---|---|---|---|---|---|---|---|---|---|---|---|---|---|---|---|---|---|
| Liabilities Current | 427.85 | 395.69 | 335.00 | 269.69 | 203.77 | 186.37 | 144.35 | 132.88 | 113.67 | 121.16 | 105.31 | 120.95 | 126.83 | 152.95 | 170.50 | 133.00 | 149.54 | 157.90 | 129.80 | 110.28 | 106.78 | 117.85 | 99.12 | 85.71 | 84.65 | 85.58 | 91.04 | 83.91 | 98.58 | 168.06 | 160.64 | 141.28 | 114.80 | 130.87 | 145.57 | 161.69 | 145.97 | 137.72 | 144.16 | NA | NA | |
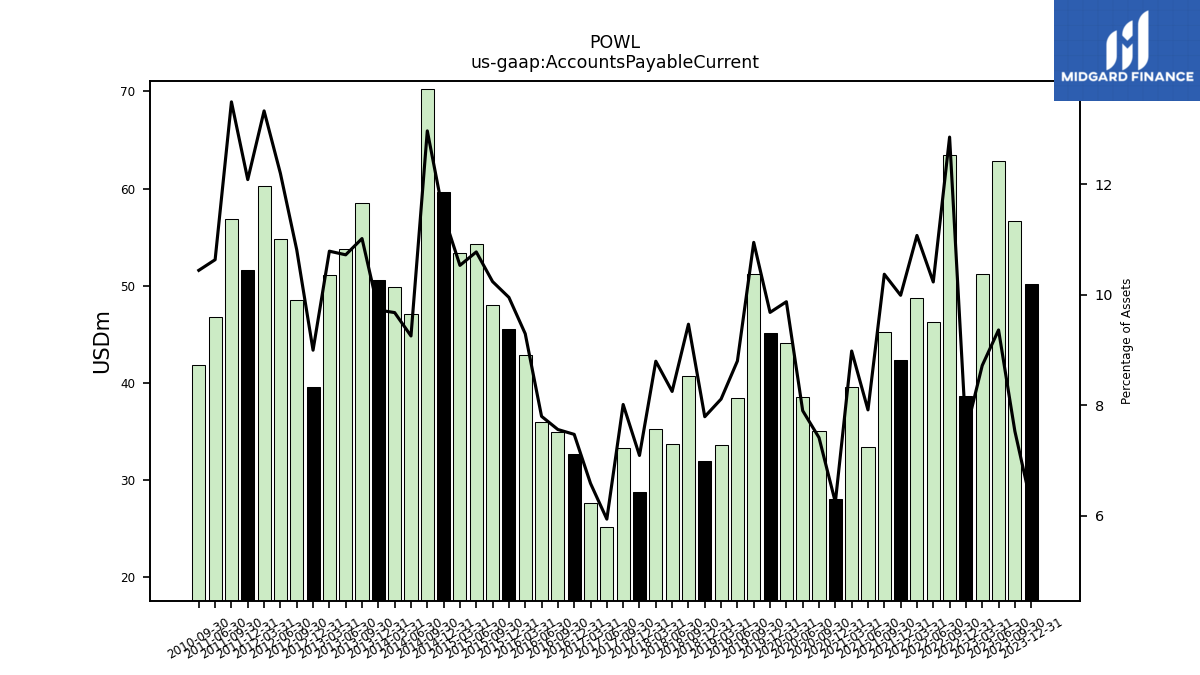
| Accounts Payable Current | 50.17 | 56.67 | 62.85 | 51.21 | 38.63 | 63.42 | 46.23 | 48.70 | 42.35 | 45.25 | 33.42 | 39.60 | 28.01 | 35.03 | 38.51 | 44.11 | 45.17 | 51.18 | 38.48 | 33.56 | 31.96 | 40.71 | 33.73 | 35.21 | 28.78 | 33.27 | 25.22 | 27.67 | 32.67 | 58.50 | 53.75 | 51.09 | 39.62 | 48.49 | 54.83 | 60.23 | 51.60 | 56.89 | 46.78 | NA | NA | |
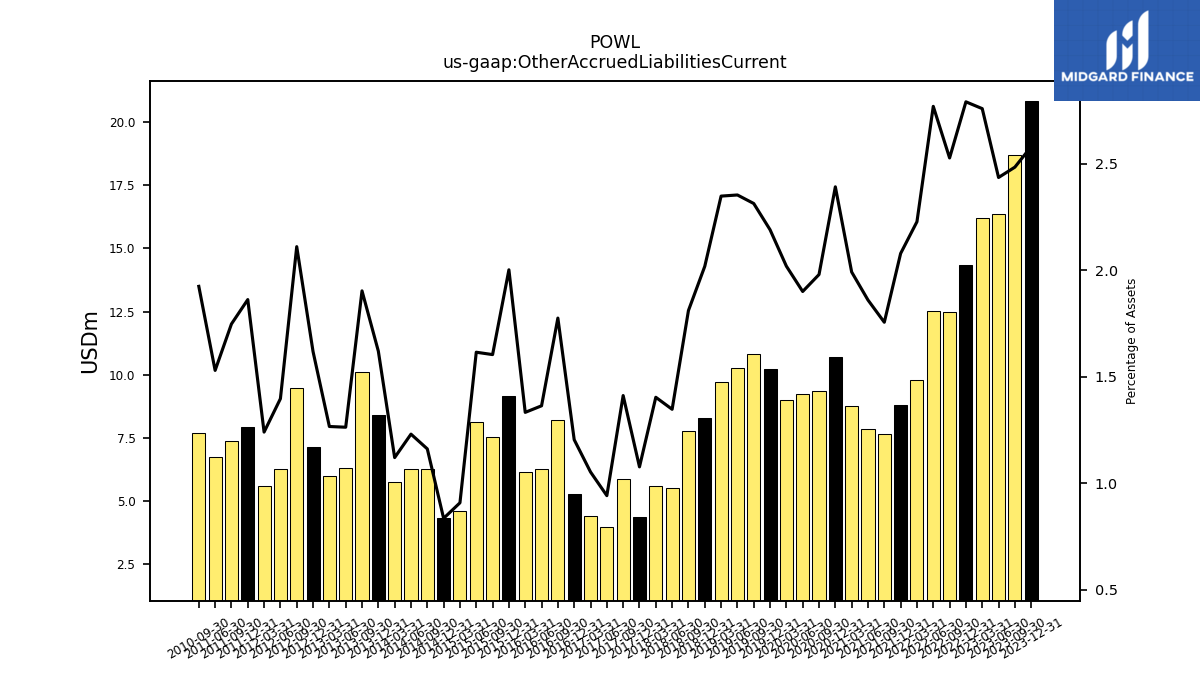
| Other Accrued Liabilities Current | 20.84 | 18.68 | 16.34 | 16.19 | 14.33 | 12.47 | 12.51 | 9.79 | 8.81 | 7.66 | 7.85 | 8.78 | 10.72 | 9.35 | 9.26 | 9.02 | 10.21 | 10.81 | 10.29 | 9.71 | 8.28 | 7.79 | 5.51 | 5.62 | 4.37 | 5.86 | 4.00 | 4.42 | 5.27 | 10.10 | 6.33 | 6.00 | 7.12 | 9.46 | 6.28 | 5.61 | 7.95 | 7.37 | 6.73 | NA | NA | |
| Accrued Income Taxes Current | 11.98 | 6.52 | 1.74 | 2.58 | 2.74 | 1.72 | 0.36 | 1.10 | 0.55 | 1.08 | 0.05 | 0.31 | 1.80 | 1.86 | 0.42 | 0.91 | 1.03 | 0.91 | 0.51 | 0.28 | 0.88 | 0.90 | 1.42 | 1.44 | 1.44 | 1.22 | 1.08 | 0.92 | 1.48 | 5.92 | 4.68 | 0.99 | 0.88 | 3.52 | 1.72 | 2.36 | 0.45 | 0.88 | 3.41 | NA | NA | |
| Contract With Customer Liability Current | 328.89 | 279.80 | 225.77 | 178.22 | 133.75 | 79.86 | 66.58 | 56.71 | 49.40 | 42.43 | 43.14 | 54.10 | 70.94 | 79.44 | 97.97 | 57.82 | 77.56 | 71.46 | 60.87 | 51.09 | 51.41 | 43.17 | NA | NA | NA | NA | NA | NA | NA | NA | NA | NA | NA | NA | NA | NA | NA | NA | NA | NA | NA |
| 2023-12-31 | 2023-09-30 | 2023-06-30 | 2023-03-31 | 2022-12-31 | 2022-09-30 | 2022-06-30 | 2022-03-31 | 2021-12-31 | 2021-09-30 | 2021-06-30 | 2021-03-31 | 2020-12-31 | 2020-09-30 | 2020-06-30 | 2020-03-31 | 2019-12-31 | 2019-09-30 | 2019-06-30 | 2019-03-31 | 2018-12-31 | 2018-09-30 | 2018-06-30 | 2018-03-31 | 2017-12-31 | 2017-09-30 | 2017-06-30 | 2017-03-31 | 2016-12-31 | 2013-09-30 | 2013-06-30 | 2013-03-31 | 2012-12-31 | 2012-09-30 | 2012-06-30 | 2012-03-31 | 2011-12-31 | 2011-09-30 | 2011-06-30 | 2011-03-31 | 2010-12-31 | ||
|---|---|---|---|---|---|---|---|---|---|---|---|---|---|---|---|---|---|---|---|---|---|---|---|---|---|---|---|---|---|---|---|---|---|---|---|---|---|---|---|---|---|---|
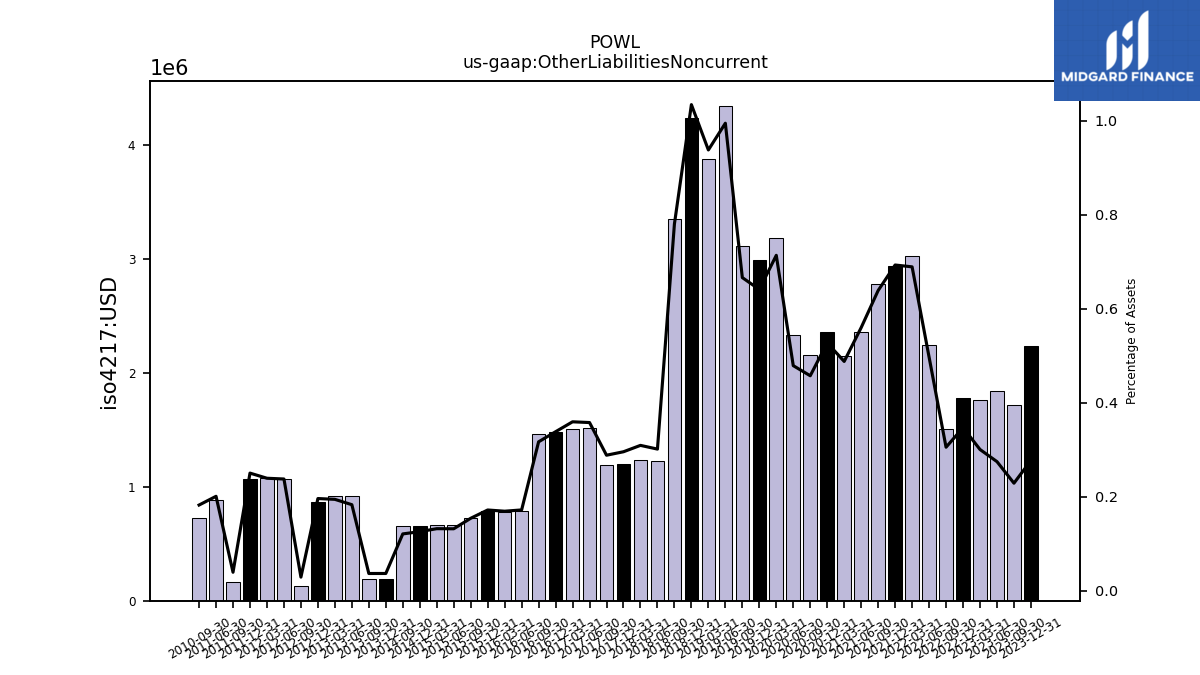
| Other Liabilities Noncurrent | 2.24 | 1.72 | 1.84 | 1.76 | 1.78 | 1.51 | 2.25 | 3.03 | 2.94 | 2.79 | 2.36 | 2.15 | 2.37 | 2.16 | 2.33 | 3.19 | 2.99 | 3.12 | 4.35 | 3.88 | 4.24 | 3.36 | 1.23 | 1.24 | 1.20 | 1.20 | 1.52 | 1.51 | 1.48 | 0.20 | 0.92 | 0.92 | 0.86 | 0.13 | 1.07 | 1.08 | 1.07 | 0.17 | 0.88 | NA | NA | |
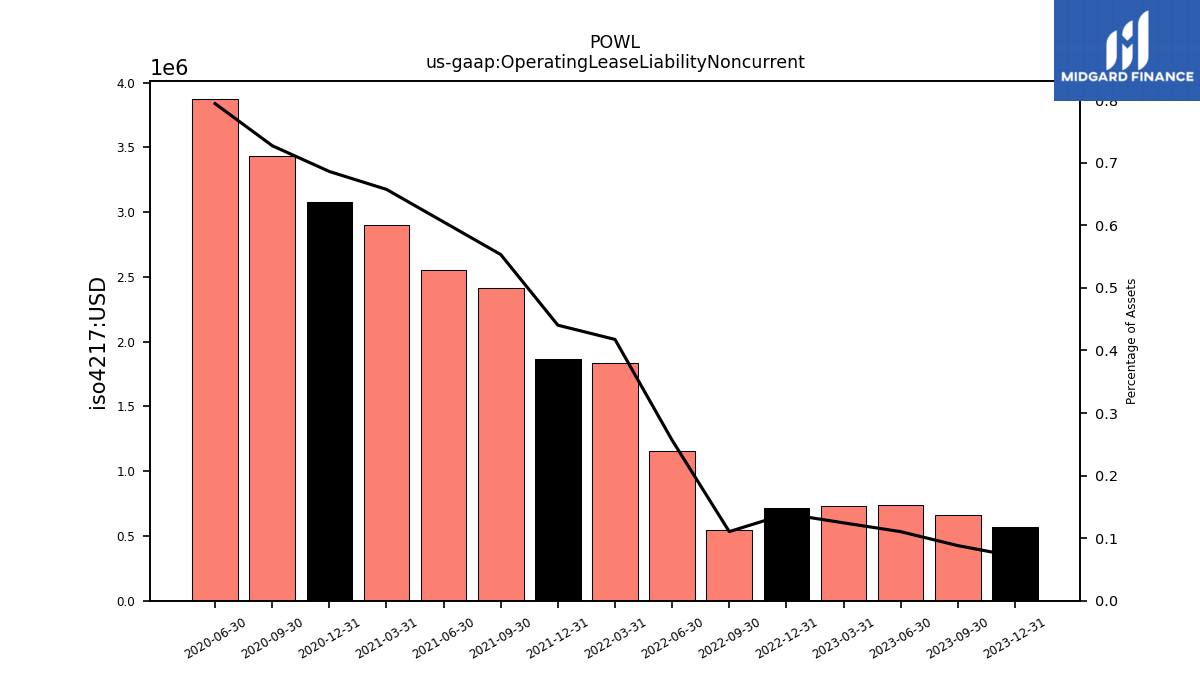
| Operating Lease Liability Noncurrent | 0.57 | 0.66 | 0.74 | 0.73 | 0.71 | 0.55 | 1.16 | 1.84 | 1.87 | 2.41 | 2.55 | 2.90 | 3.08 | 3.43 | 3.87 | NA | NA | NA | NA | NA | NA | NA | NA | NA | NA | NA | NA | NA | NA | NA | NA | NA | NA | NA | NA | NA | NA | NA | NA | NA | NA |
| 2023-12-31 | 2023-09-30 | 2023-06-30 | 2023-03-31 | 2022-12-31 | 2022-09-30 | 2022-06-30 | 2022-03-31 | 2021-12-31 | 2021-09-30 | 2021-06-30 | 2021-03-31 | 2020-12-31 | 2020-09-30 | 2020-06-30 | 2020-03-31 | 2019-12-31 | 2019-09-30 | 2019-06-30 | 2019-03-31 | 2018-12-31 | 2018-09-30 | 2018-06-30 | 2018-03-31 | 2017-12-31 | 2017-09-30 | 2017-06-30 | 2017-03-31 | 2016-12-31 | 2013-09-30 | 2013-06-30 | 2013-03-31 | 2012-12-31 | 2012-09-30 | 2012-06-30 | 2012-03-31 | 2011-12-31 | 2011-09-30 | 2011-06-30 | 2011-03-31 | 2010-12-31 | ||
|---|---|---|---|---|---|---|---|---|---|---|---|---|---|---|---|---|---|---|---|---|---|---|---|---|---|---|---|---|---|---|---|---|---|---|---|---|---|---|---|---|---|---|
| Stockholders Equity | 366.32 | 345.03 | 324.07 | 305.80 | 298.47 | 297.21 | 295.95 | 292.87 | 295.58 | 301.22 | 302.94 | 306.33 | 307.85 | 306.63 | 303.57 | 300.13 | 301.67 | 299.15 | 295.66 | 292.29 | 292.36 | 301.64 | 301.45 | 306.39 | 312.97 | 321.30 | 325.10 | 327.95 | 330.05 | 355.23 | 333.13 | 324.66 | 318.13 | 310.10 | 296.32 | 282.47 | 273.46 | 275.34 | 287.08 | NA | NA | |
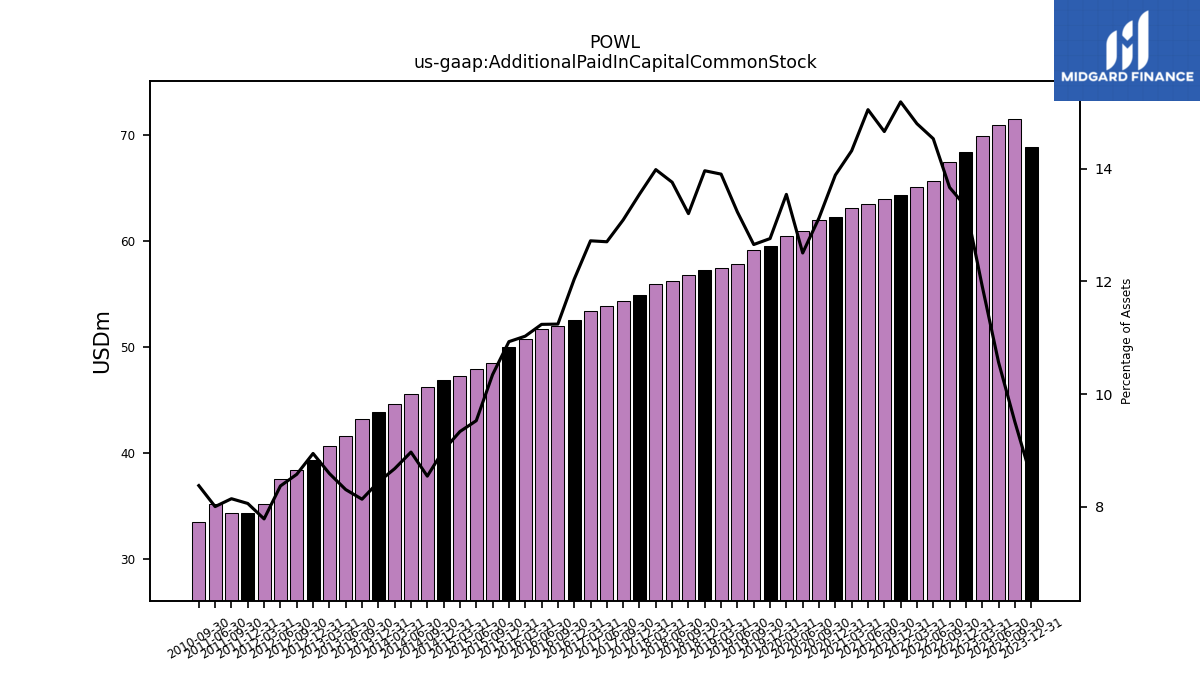
| Additional Paid In Capital Common Stock | 68.85 | 71.53 | 70.91 | 69.95 | 68.45 | 67.44 | 65.66 | 65.08 | 64.36 | 63.95 | 63.50 | 63.11 | 62.26 | 62.00 | 60.93 | 60.49 | 59.52 | 59.15 | 57.84 | 57.51 | 57.26 | 56.77 | 56.23 | 55.96 | 54.96 | 54.33 | 53.91 | 53.42 | 52.61 | 43.19 | 41.63 | 40.67 | 39.39 | 38.45 | 37.62 | 35.19 | 34.41 | 34.34 | 35.20 | NA | NA | |
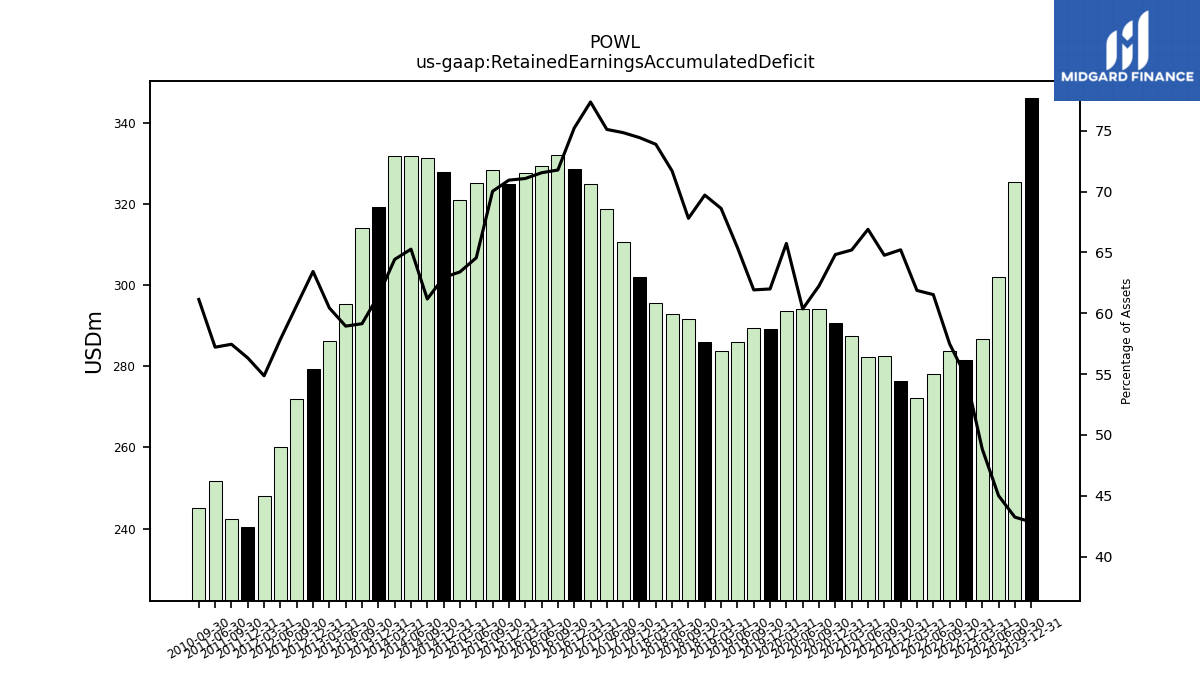
| Retained Earnings Accumulated Deficit | 346.16 | 325.28 | 302.04 | 286.78 | 281.49 | 283.64 | 278.02 | 272.07 | 276.39 | 282.50 | 282.28 | 287.36 | 290.62 | 294.02 | 294.05 | 293.59 | 289.18 | 289.42 | 285.89 | 283.81 | 285.84 | 291.53 | 292.97 | 295.65 | 301.96 | 310.60 | 318.71 | 324.90 | 328.69 | 313.99 | 295.43 | 286.11 | 279.30 | 271.91 | 260.07 | 247.92 | 240.51 | 242.25 | 251.61 | NA | NA | |
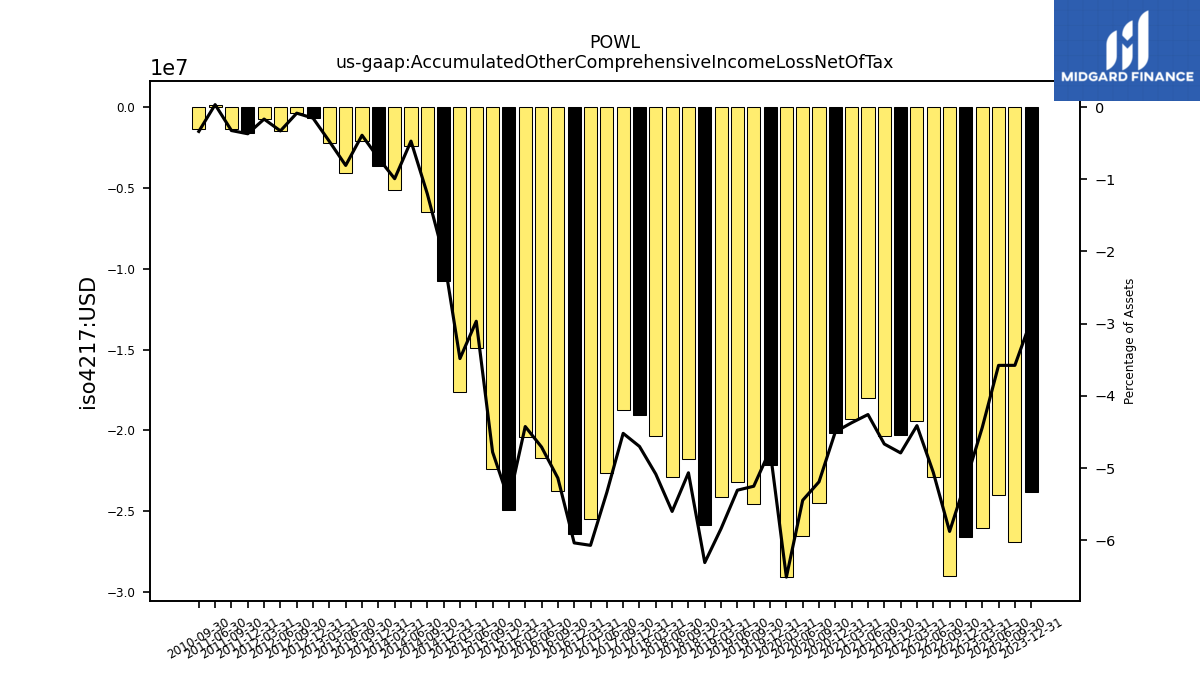
| Accumulated Other Comprehensive Income Loss Net Of Tax | -23.82 | -26.91 | -24.01 | -26.06 | -26.60 | -29.00 | -22.86 | -19.40 | -20.30 | -20.36 | -17.97 | -19.27 | -20.16 | -24.51 | -26.53 | -29.08 | -22.16 | -24.55 | -23.20 | -24.15 | -25.87 | -21.78 | -22.89 | -20.34 | -19.07 | -18.75 | -22.64 | -25.49 | -26.38 | -2.07 | -4.05 | -2.25 | -0.68 | -0.38 | -1.48 | -0.75 | -1.58 | -1.37 | 0.15 | NA | NA | |
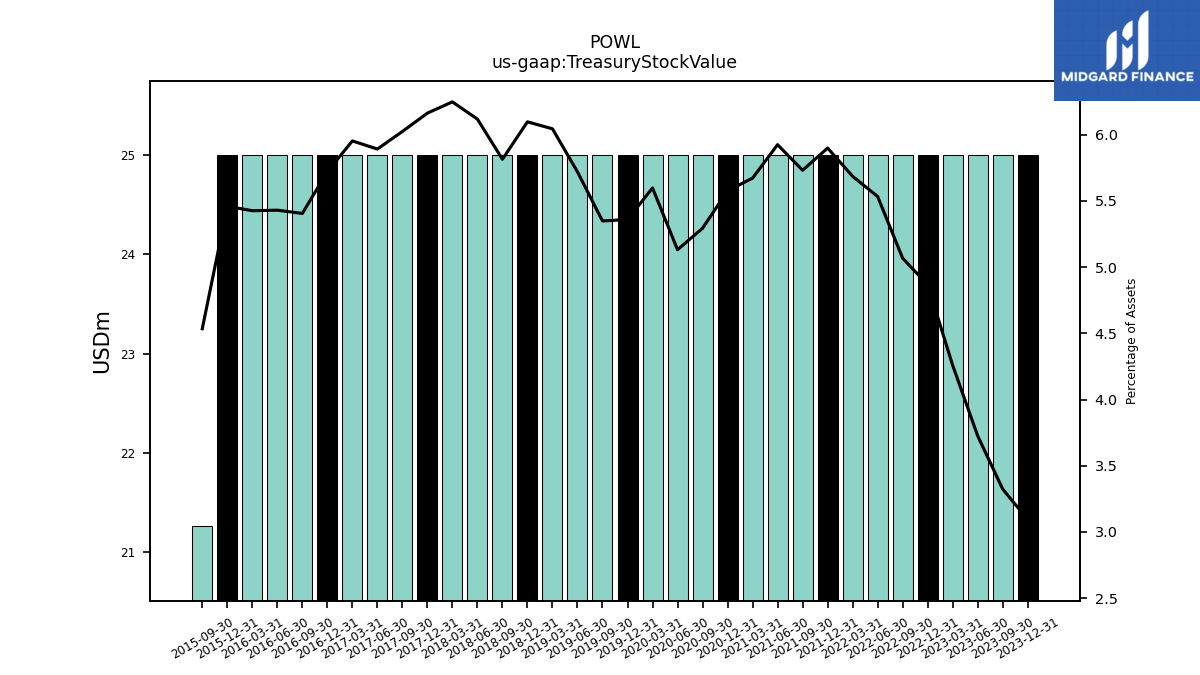
| Treasury Stock Value | 25.00 | 25.00 | 25.00 | 25.00 | 25.00 | 25.00 | 25.00 | 25.00 | 25.00 | 25.00 | 25.00 | 25.00 | 25.00 | 25.00 | 25.00 | 25.00 | 25.00 | 25.00 | 25.00 | 25.00 | 25.00 | 25.00 | 25.00 | 25.00 | 25.00 | 25.00 | 25.00 | 25.00 | 25.00 | NA | NA | NA | NA | NA | NA | NA | NA | NA | NA | NA | NA |
| 2023-12-31 | 2023-09-30 | 2023-06-30 | 2023-03-31 | 2022-12-31 | 2022-09-30 | 2022-06-30 | 2022-03-31 | 2021-12-31 | 2021-09-30 | 2021-06-30 | 2021-03-31 | 2020-12-31 | 2020-09-30 | 2020-06-30 | 2020-03-31 | 2019-12-31 | 2019-09-30 | 2019-06-30 | 2019-03-31 | 2018-12-31 | 2018-09-30 | 2018-06-30 | 2018-03-31 | 2017-12-31 | 2017-09-30 | 2017-06-30 | 2017-03-31 | 2016-12-31 | 2013-09-30 | 2013-06-30 | 2013-03-31 | 2012-12-31 | 2012-09-30 | 2012-06-30 | 2012-03-31 | 2011-12-31 | 2011-09-30 | 2011-06-30 | 2011-03-31 | 2010-12-31 | ||
|---|---|---|---|---|---|---|---|---|---|---|---|---|---|---|---|---|---|---|---|---|---|---|---|---|---|---|---|---|---|---|---|---|---|---|---|---|---|---|---|---|---|---|
| Net Cash Provided By Used In Operating Activities | 83.90 | 77.24 | 49.80 | 56.06 | -0.55 | 24.20 | -14.78 | 14.82 | -27.83 | 9.23 | -21.61 | 7.10 | -25.18 | 18.99 | 45.98 | 5.31 | 2.11 | 34.82 | 7.89 | 16.94 | 9.11 | -2.49 | -15.45 | 3.45 | -14.06 | 9.69 | NA | NA | NA | 3.10 | 31.49 | 35.97 | 21.20 | -12.42 | -16.92 | 33.24 | -9.86 | -9.75 | 16.75 | 1.69 | 6.80 | |
| Net Cash Provided By Used In Investing Activities | -1.49 | -11.18 | -15.74 | -0.63 | 0.97 | 6.48 | 7.61 | -3.25 | -4.37 | -0.45 | -0.85 | -4.12 | 2.96 | -12.08 | -8.13 | -1.07 | 3.74 | -1.04 | -1.25 | 0.26 | 5.00 | 2.07 | 5.53 | 0.48 | 2.07 | 27.87 | NA | NA | NA | -20.47 | -20.39 | -19.28 | -13.35 | -3.48 | -6.50 | -9.56 | -8.32 | -4.23 | -1.16 | -0.64 | -0.74 | |
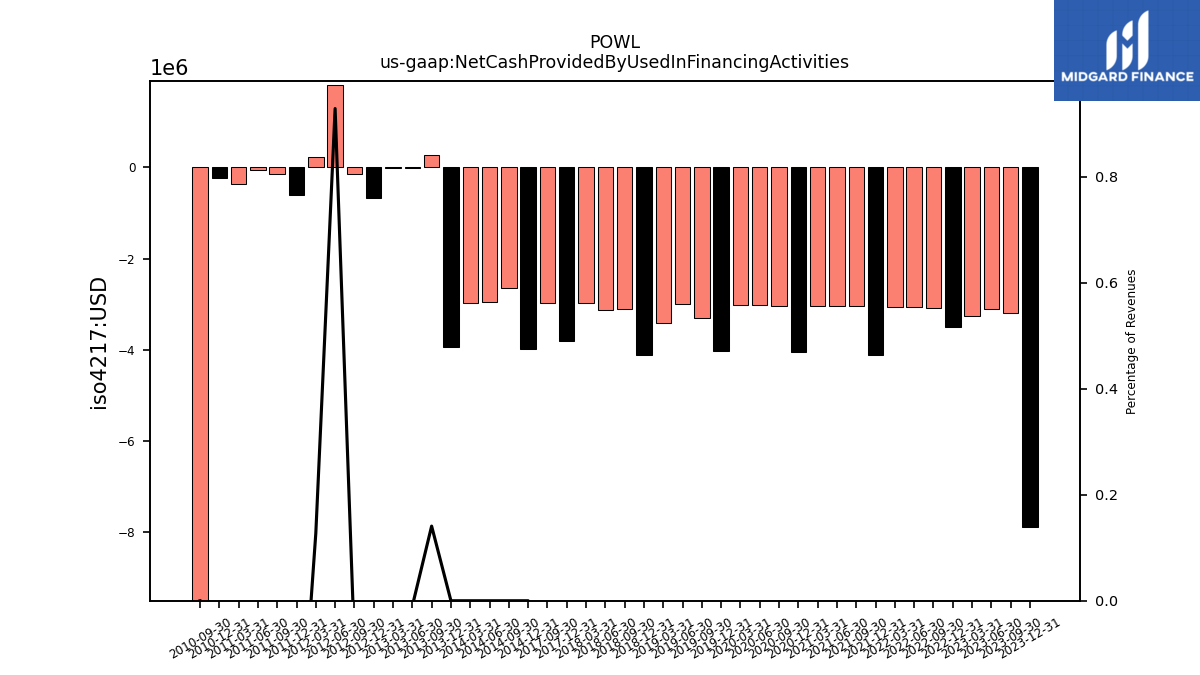
| Net Cash Provided By Used In Financing Activities | -7.88 | -3.19 | -3.11 | -3.27 | -3.50 | -3.08 | -3.07 | -3.06 | -4.11 | -3.04 | -3.04 | -3.04 | -4.06 | -3.03 | -3.02 | -3.02 | -4.02 | -3.31 | -3.01 | -3.41 | -4.12 | -3.12 | -3.12 | -2.98 | -3.81 | -2.97 | NA | NA | NA | 0.26 | -0.02 | -0.02 | -0.68 | -0.15 | 1.80 | 0.23 | -0.61 | -0.14 | -0.06 | -0.36 | -0.23 |
| 2023-12-31 | 2023-09-30 | 2023-06-30 | 2023-03-31 | 2022-12-31 | 2022-09-30 | 2022-06-30 | 2022-03-31 | 2021-12-31 | 2021-09-30 | 2021-06-30 | 2021-03-31 | 2020-12-31 | 2020-09-30 | 2020-06-30 | 2020-03-31 | 2019-12-31 | 2019-09-30 | 2019-06-30 | 2019-03-31 | 2018-12-31 | 2018-09-30 | 2018-06-30 | 2018-03-31 | 2017-12-31 | 2017-09-30 | 2017-06-30 | 2017-03-31 | 2016-12-31 | 2013-09-30 | 2013-06-30 | 2013-03-31 | 2012-12-31 | 2012-09-30 | 2012-06-30 | 2012-03-31 | 2011-12-31 | 2011-09-30 | 2011-06-30 | 2011-03-31 | 2010-12-31 | ||
|---|---|---|---|---|---|---|---|---|---|---|---|---|---|---|---|---|---|---|---|---|---|---|---|---|---|---|---|---|---|---|---|---|---|---|---|---|---|---|---|---|---|---|
| Net Cash Provided By Used In Operating Activities | 83.90 | 77.24 | 49.80 | 56.06 | -0.55 | 24.20 | -14.78 | 14.82 | -27.83 | 9.23 | -21.61 | 7.10 | -25.18 | 18.99 | 45.98 | 5.31 | 2.11 | 34.82 | 7.89 | 16.94 | 9.11 | -2.49 | -15.45 | 3.45 | -14.06 | 9.69 | NA | NA | NA | 3.10 | 31.49 | 35.97 | 21.20 | -12.42 | -16.92 | 33.24 | -9.86 | -9.75 | 16.75 | 1.69 | 6.80 | |
| Net Income Loss | 24.09 | 26.44 | 18.45 | 8.47 | 1.16 | 8.74 | 9.06 | -1.22 | -2.85 | 3.26 | -2.04 | -0.23 | -0.36 | 2.98 | 3.48 | 7.42 | 2.77 | 6.54 | 5.09 | 0.96 | -2.69 | 1.54 | 0.30 | -3.33 | -5.66 | -5.14 | -3.21 | -0.83 | -0.30 | 18.57 | 9.30 | 6.82 | 7.38 | 11.85 | 12.14 | 7.41 | -1.75 | -6.95 | 1.71 | 1.73 | 2.43 | |
| Depreciation Depletion And Amortization | NA | NA | NA | NA | NA | 2.15 | 2.38 | 2.42 | 2.41 | 2.44 | 2.61 | 2.66 | 2.63 | 2.66 | 2.64 | 2.64 | 2.60 | 2.62 | 2.95 | 3.24 | 3.22 | 3.25 | 3.23 | 3.19 | 3.23 | NA | NA | NA | NA | 2.42 | 2.35 | 2.35 | 3.07 | 3.25 | 3.39 | 3.25 | 3.17 | 3.90 | 3.99 | NA | NA | |
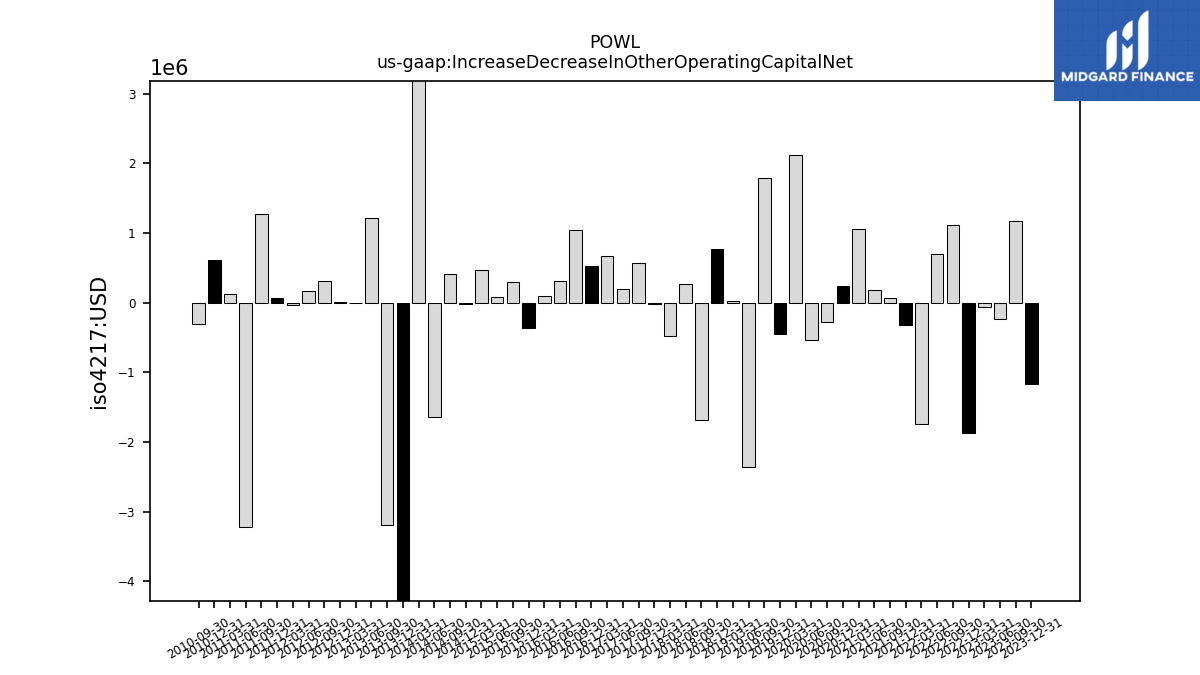
| Increase Decrease In Other Operating Capital Net | -1.16 | 1.17 | -0.23 | -0.07 | -1.86 | 1.11 | 0.70 | -1.75 | -0.32 | 0.07 | 0.19 | 1.06 | 0.23 | -0.27 | -0.54 | 2.12 | -0.45 | 1.80 | -2.35 | 0.02 | 0.76 | -1.68 | 0.27 | -0.47 | -0.01 | 0.56 | 0.20 | 0.67 | 0.53 | -3.19 | 1.22 | -0.00 | 0.01 | 0.31 | 0.17 | -0.03 | 0.07 | 1.28 | -3.21 | 0.13 | 0.62 | |
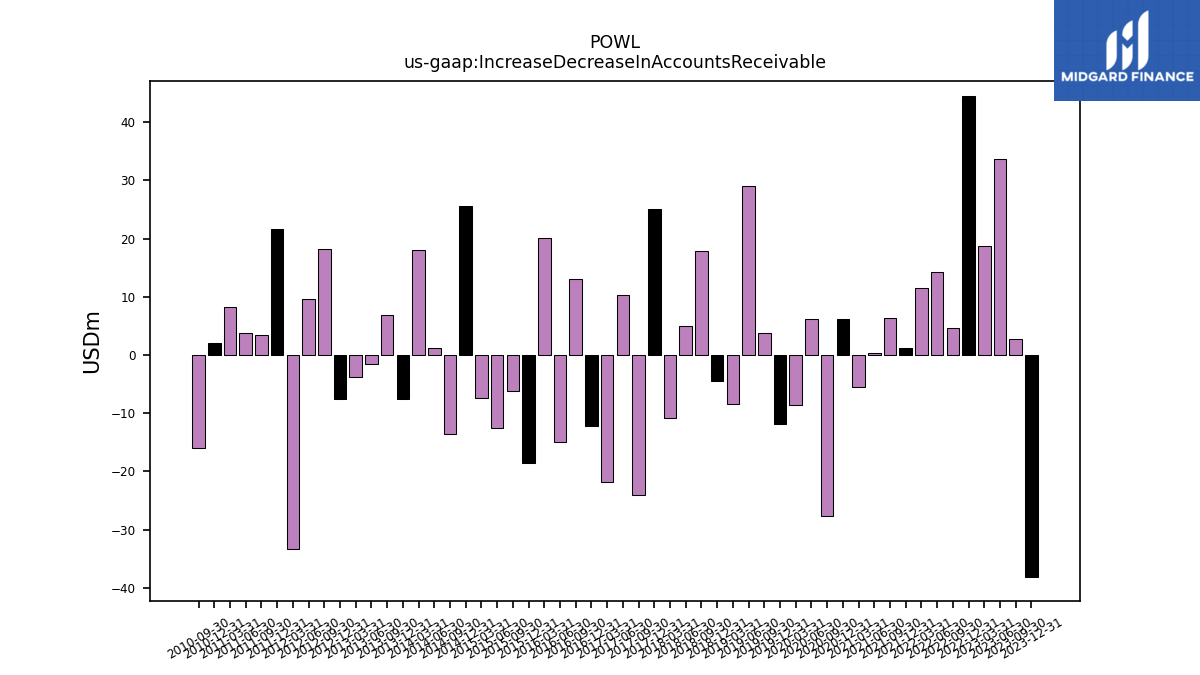
| Increase Decrease In Accounts Receivable | -38.09 | 2.73 | 33.69 | 18.75 | 44.55 | 4.62 | 14.35 | 11.47 | 1.19 | 6.31 | 0.38 | -5.43 | 6.25 | -27.70 | 6.18 | -8.60 | -11.84 | 3.84 | 29.07 | -8.33 | -4.38 | 17.92 | 4.98 | -10.83 | 25.10 | -24.14 | 10.24 | -21.85 | -12.23 | 6.94 | -1.47 | -3.73 | -7.57 | 18.28 | 9.68 | -33.34 | 21.58 | 3.46 | 3.83 | 8.20 | 2.13 | |
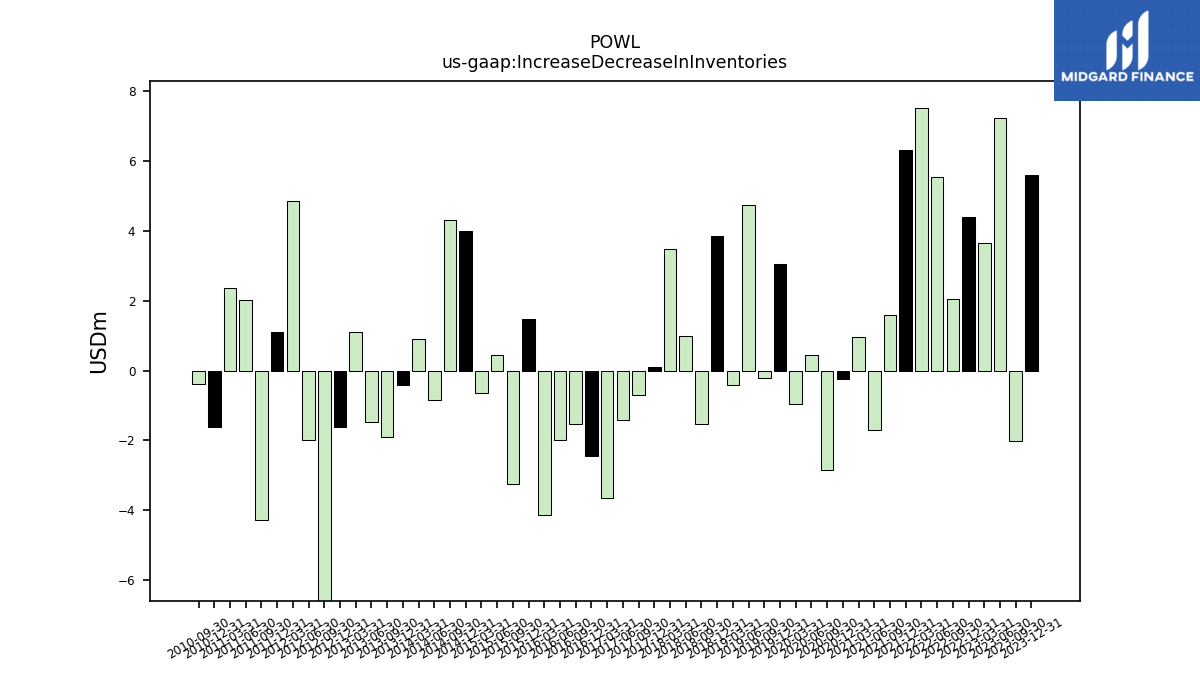
| Increase Decrease In Inventories | 5.60 | -2.03 | 7.24 | 3.65 | 4.41 | 2.04 | 5.55 | 7.52 | 6.31 | 1.59 | -1.70 | 0.95 | -0.24 | -2.84 | 0.44 | -0.96 | 3.05 | -0.21 | 4.75 | -0.40 | 3.85 | -1.52 | 0.98 | 3.47 | 0.09 | -0.69 | -1.43 | -3.64 | -2.44 | -1.91 | -1.48 | 1.11 | -1.61 | -7.91 | -2.00 | 4.86 | 1.10 | -4.29 | 2.01 | 2.36 | -1.62 | |
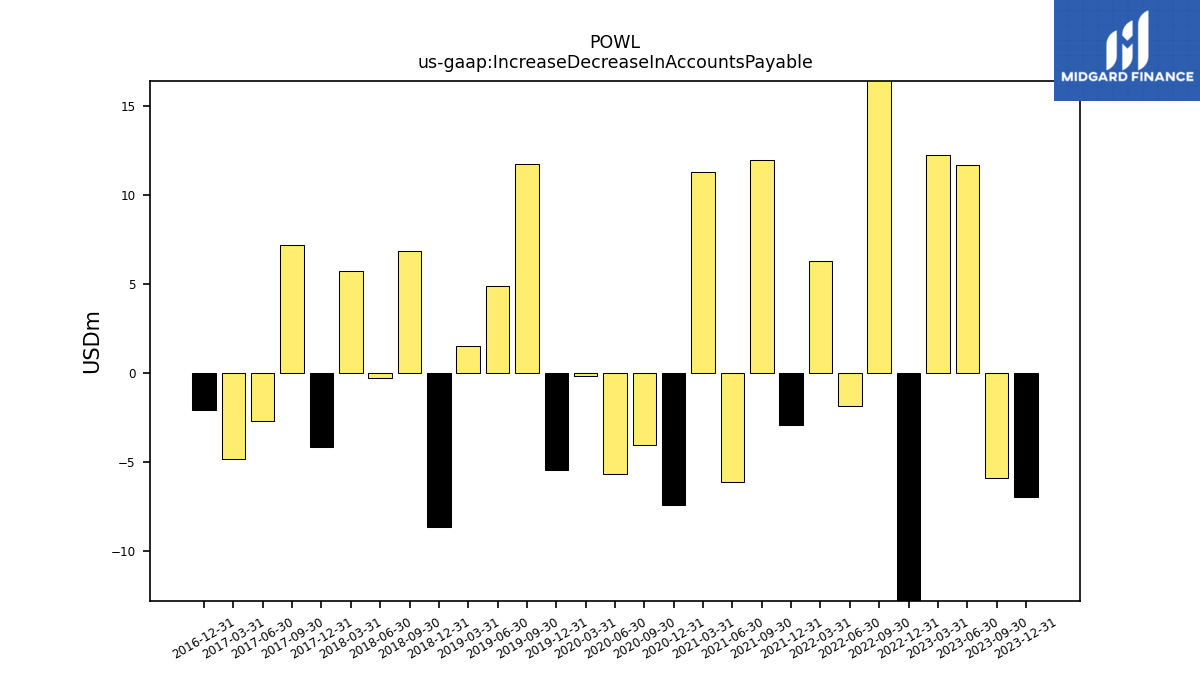
| Increase Decrease In Accounts Payable | -6.99 | -5.92 | 11.67 | 12.23 | -24.15 | 17.07 | -1.85 | 6.29 | -2.92 | 11.96 | -6.11 | 11.29 | -7.39 | -4.04 | -5.66 | -0.14 | -5.46 | 11.72 | 4.91 | 1.54 | -8.62 | 6.86 | -0.30 | 5.73 | -4.14 | 7.21 | -2.70 | -4.84 | -2.08 | NA | NA | NA | NA | NA | NA | NA | NA | NA | NA | NA | NA | |
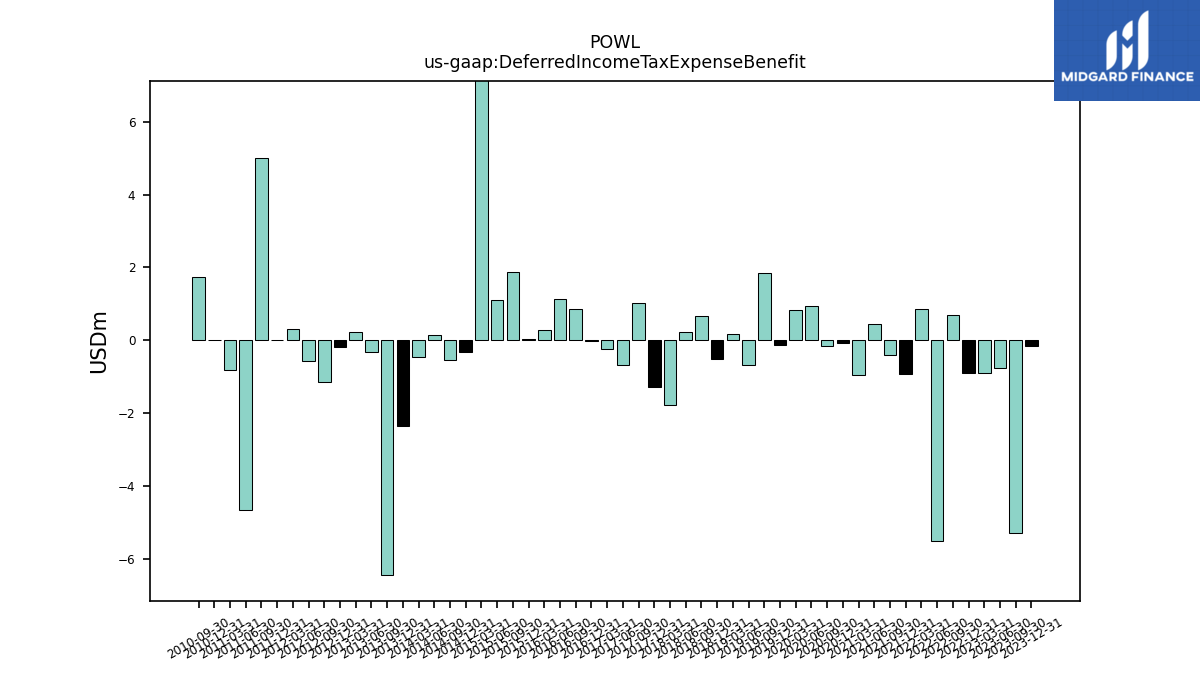
| Deferred Income Tax Expense Benefit | -0.17 | -5.30 | -0.77 | -0.89 | -0.90 | 0.69 | -5.50 | 0.86 | -0.92 | -0.41 | 0.44 | -0.94 | -0.08 | -0.17 | 0.93 | 0.83 | -0.13 | 1.84 | -0.68 | 0.17 | -0.52 | 0.67 | 0.22 | -1.77 | -1.29 | 1.01 | -0.67 | -0.24 | -0.01 | -6.43 | -0.33 | 0.22 | -0.18 | -1.15 | -0.58 | 0.31 | -0.00 | 5.01 | -4.66 | -0.80 | 0.02 | |
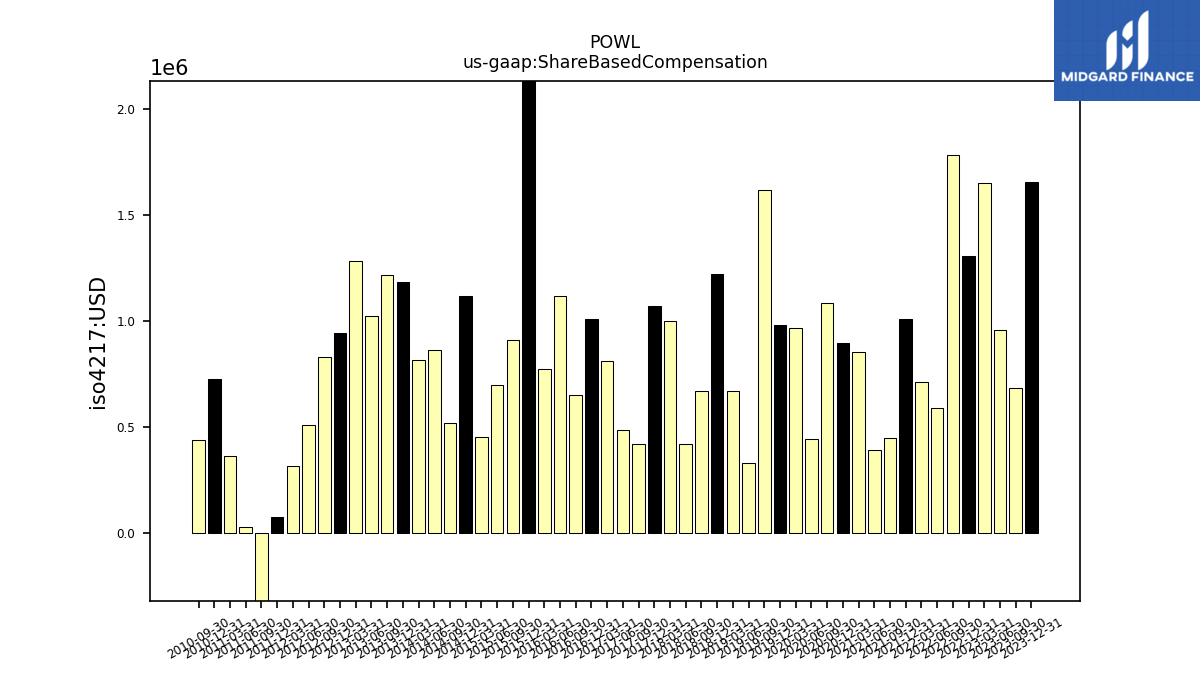
| Share Based Compensation | 1.66 | 0.69 | 0.96 | 1.65 | 1.31 | 1.78 | 0.59 | 0.71 | 1.01 | 0.45 | 0.39 | 0.85 | 0.89 | 1.08 | 0.44 | 0.97 | 0.98 | 1.62 | 0.33 | 0.67 | 1.22 | 0.67 | 0.42 | 1.00 | 1.07 | 0.42 | 0.48 | 0.81 | 1.01 | 1.22 | 1.02 | 1.28 | 0.94 | 0.83 | 0.51 | 0.31 | 0.07 | -1.02 | 0.03 | 0.36 | 0.72 |
| 2023-12-31 | 2023-09-30 | 2023-06-30 | 2023-03-31 | 2022-12-31 | 2022-09-30 | 2022-06-30 | 2022-03-31 | 2021-12-31 | 2021-09-30 | 2021-06-30 | 2021-03-31 | 2020-12-31 | 2020-09-30 | 2020-06-30 | 2020-03-31 | 2019-12-31 | 2019-09-30 | 2019-06-30 | 2019-03-31 | 2018-12-31 | 2018-09-30 | 2018-06-30 | 2018-03-31 | 2017-12-31 | 2017-09-30 | 2017-06-30 | 2017-03-31 | 2016-12-31 | 2013-09-30 | 2013-06-30 | 2013-03-31 | 2012-12-31 | 2012-09-30 | 2012-06-30 | 2012-03-31 | 2011-12-31 | 2011-09-30 | 2011-06-30 | 2011-03-31 | 2010-12-31 | ||
|---|---|---|---|---|---|---|---|---|---|---|---|---|---|---|---|---|---|---|---|---|---|---|---|---|---|---|---|---|---|---|---|---|---|---|---|---|---|---|---|---|---|---|
| Net Cash Provided By Used In Investing Activities | -1.49 | -11.18 | -15.74 | -0.63 | 0.97 | 6.48 | 7.61 | -3.25 | -4.37 | -0.45 | -0.85 | -4.12 | 2.96 | -12.08 | -8.13 | -1.07 | 3.74 | -1.04 | -1.25 | 0.26 | 5.00 | 2.07 | 5.53 | 0.48 | 2.07 | 27.87 | NA | NA | NA | -20.47 | -20.39 | -19.28 | -13.35 | -3.48 | -6.50 | -9.56 | -8.32 | -4.23 | -1.16 | -0.64 | -0.74 | |
| Payments To Acquire Property Plant And Equipment | 1.24 | 3.81 | 0.65 | 0.63 | 2.73 | 0.69 | 0.65 | 0.68 | 0.44 | 0.45 | 0.85 | 0.63 | 0.96 | 0.86 | 0.81 | 1.07 | 2.40 | 1.04 | 1.25 | 1.20 | 0.76 | 0.52 | 1.16 | 1.11 | 1.70 | 1.12 | 0.82 | 0.77 | 0.93 | 20.64 | 20.46 | 19.89 | 13.38 | 3.52 | 6.67 | 9.50 | 9.38 | 3.27 | 1.41 | 1.90 | 0.76 |
| 2023-12-31 | 2023-09-30 | 2023-06-30 | 2023-03-31 | 2022-12-31 | 2022-09-30 | 2022-06-30 | 2022-03-31 | 2021-12-31 | 2021-09-30 | 2021-06-30 | 2021-03-31 | 2020-12-31 | 2020-09-30 | 2020-06-30 | 2020-03-31 | 2019-12-31 | 2019-09-30 | 2019-06-30 | 2019-03-31 | 2018-12-31 | 2018-09-30 | 2018-06-30 | 2018-03-31 | 2017-12-31 | 2017-09-30 | 2017-06-30 | 2017-03-31 | 2016-12-31 | 2013-09-30 | 2013-06-30 | 2013-03-31 | 2012-12-31 | 2012-09-30 | 2012-06-30 | 2012-03-31 | 2011-12-31 | 2011-09-30 | 2011-06-30 | 2011-03-31 | 2010-12-31 | ||
|---|---|---|---|---|---|---|---|---|---|---|---|---|---|---|---|---|---|---|---|---|---|---|---|---|---|---|---|---|---|---|---|---|---|---|---|---|---|---|---|---|---|---|
| Net Cash Provided By Used In Financing Activities | -7.88 | -3.19 | -3.11 | -3.27 | -3.50 | -3.08 | -3.07 | -3.06 | -4.11 | -3.04 | -3.04 | -3.04 | -4.06 | -3.03 | -3.02 | -3.02 | -4.02 | -3.31 | -3.01 | -3.41 | -4.12 | -3.12 | -3.12 | -2.98 | -3.81 | -2.97 | NA | NA | NA | 0.26 | -0.02 | -0.02 | -0.68 | -0.15 | 1.80 | 0.23 | -0.61 | -0.14 | -0.06 | -0.36 | -0.23 | |
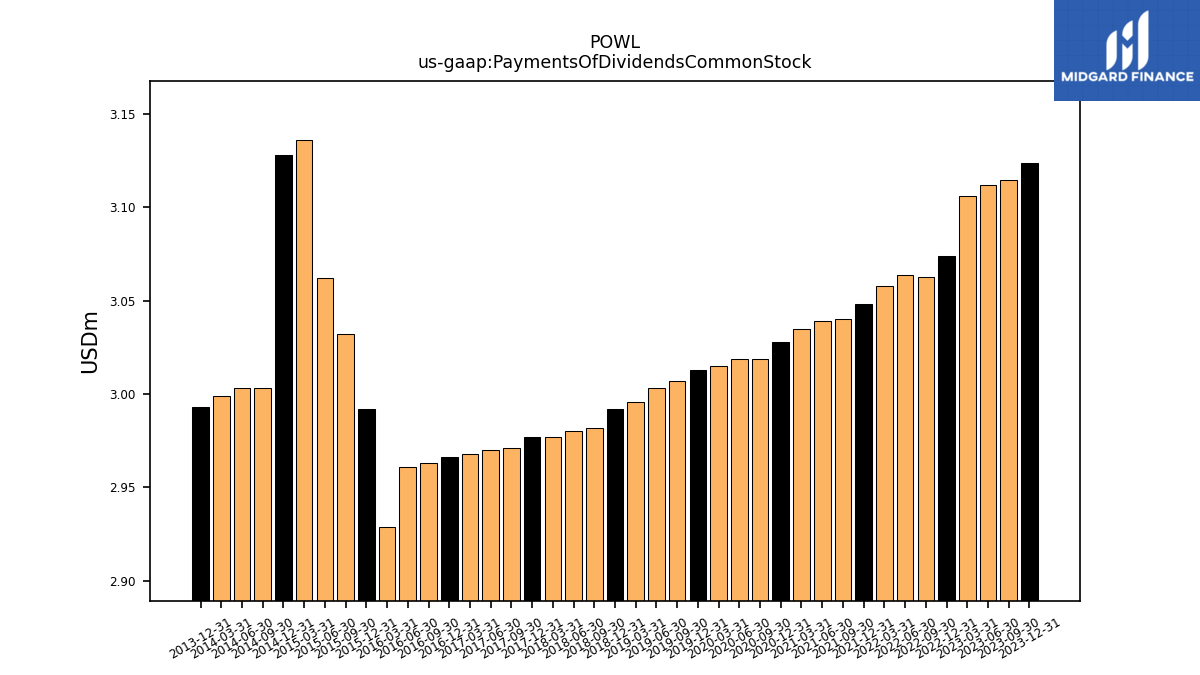
| Payments Of Dividends Common Stock | 3.12 | 3.12 | 3.11 | 3.11 | 3.07 | 3.06 | 3.06 | 3.06 | 3.05 | 3.04 | 3.04 | 3.04 | 3.03 | 3.02 | 3.02 | 3.02 | 3.01 | 3.01 | 3.00 | 3.00 | 2.99 | 2.98 | 2.98 | 2.98 | 2.98 | 2.97 | 2.97 | 2.97 | 2.97 | NA | NA | NA | NA | NA | NA | NA | NA | NA | NA | NA | NA |
| 2023-12-31 | 2023-09-30 | 2023-06-30 | 2023-03-31 | 2022-12-31 | 2022-09-30 | 2022-06-30 | 2022-03-31 | 2021-12-31 | 2021-09-30 | 2021-06-30 | 2021-03-31 | 2020-12-31 | 2020-09-30 | 2020-06-30 | 2020-03-31 | 2019-12-31 | 2019-09-30 | 2019-06-30 | 2019-03-31 | 2018-12-31 | 2018-09-30 | 2018-06-30 | 2018-03-31 | 2017-12-31 | 2017-09-30 | 2017-06-30 | 2017-03-31 | 2016-12-31 | 2013-09-30 | 2013-06-30 | 2013-03-31 | 2012-12-31 | 2012-09-30 | 2012-06-30 | 2012-03-31 | 2011-12-31 | 2011-09-30 | 2011-06-30 | 2011-03-31 | 2010-12-31 | ||
|---|---|---|---|---|---|---|---|---|---|---|---|---|---|---|---|---|---|---|---|---|---|---|---|---|---|---|---|---|---|---|---|---|---|---|---|---|---|---|---|---|---|---|
| Revenues | 194.02 | 208.64 | 192.37 | 171.44 | 126.86 | 162.68 | 135.48 | 127.85 | 106.57 | 129.46 | 115.81 | 118.72 | 106.58 | 114.72 | 118.06 | 151.57 | 134.15 | 148.50 | 135.59 | 123.74 | 109.35 | 134.90 | 122.13 | 101.50 | 90.18 | 94.96 | 85.93 | 104.68 | 110.34 | 187.40 | 179.52 | 153.91 | 153.94 | 184.16 | 194.09 | 181.49 | 157.46 | 171.24 | 141.37 | 125.11 | 124.67 | |
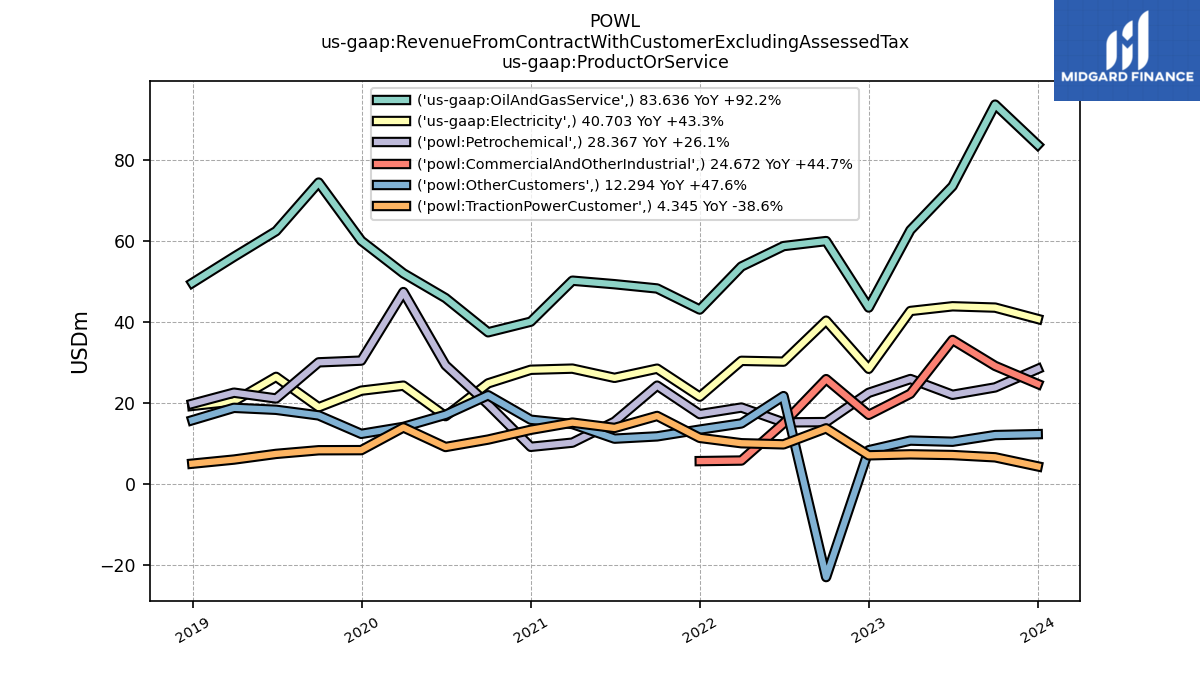
| Revenue From Contract With Customer Excluding Assessed Tax | 194.02 | 208.64 | 192.37 | 171.44 | 126.86 | 162.68 | 135.48 | 127.85 | 106.57 | 129.46 | 115.81 | 118.72 | 106.58 | 114.72 | 118.06 | 151.57 | 134.15 | 148.50 | 135.59 | 123.74 | 109.35 | 134.90 | 122.13 | 101.50 | 90.18 | 94.96 | 85.93 | 104.68 | 110.34 | 187.40 | 179.52 | 153.91 | 153.94 | 184.16 | 194.09 | 181.49 | 157.46 | 171.24 | 141.37 | 125.11 | 124.67 | |
| Commercial And Other Industrial | 24.67 | 29.12 | 35.53 | 22.27 | 17.05 | 25.86 | 14.97 | 5.79 | 5.65 | NA | NA | NA | NA | NA | NA | NA | NA | NA | NA | NA | NA | NA | NA | NA | NA | NA | NA | NA | NA | NA | NA | NA | NA | NA | NA | NA | NA | NA | NA | NA | NA | |
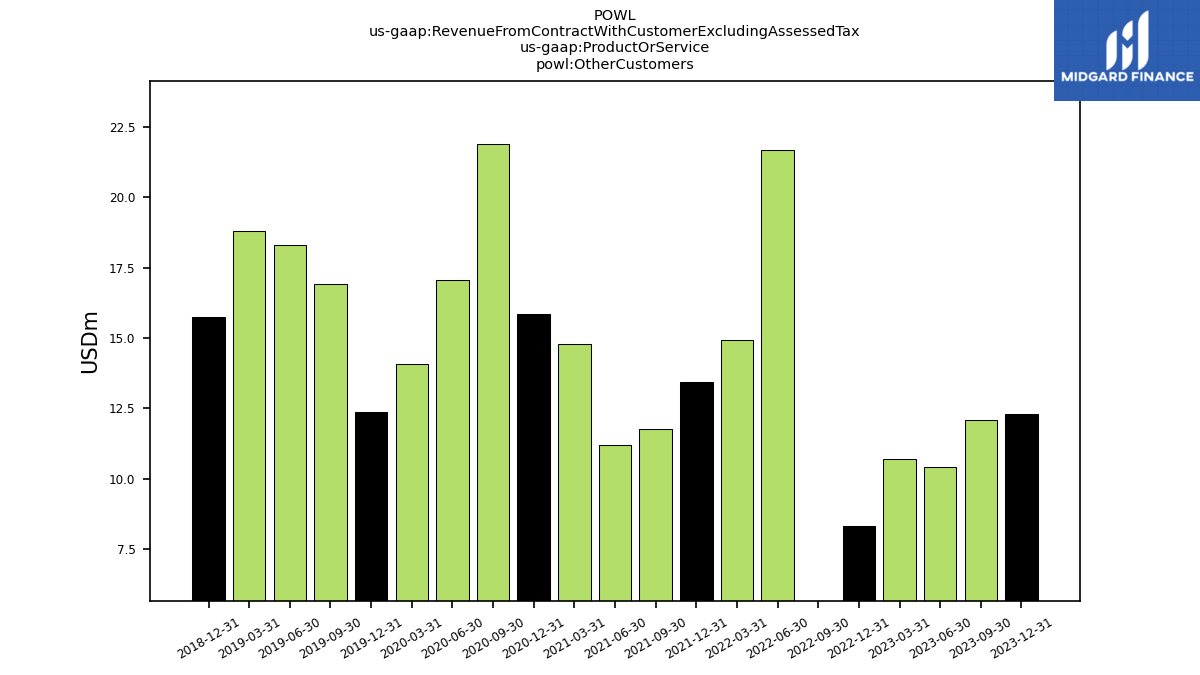
| Other Customers | 12.29 | 12.07 | 10.42 | 10.71 | 8.33 | -22.97 | 21.68 | 14.94 | 13.41 | 11.74 | 11.18 | 14.79 | 15.85 | 21.89 | 17.07 | 14.08 | 12.36 | 16.91 | 18.30 | 18.78 | 15.73 | NA | NA | NA | NA | NA | NA | NA | NA | NA | NA | NA | NA | NA | NA | NA | NA | NA | NA | NA | NA | |
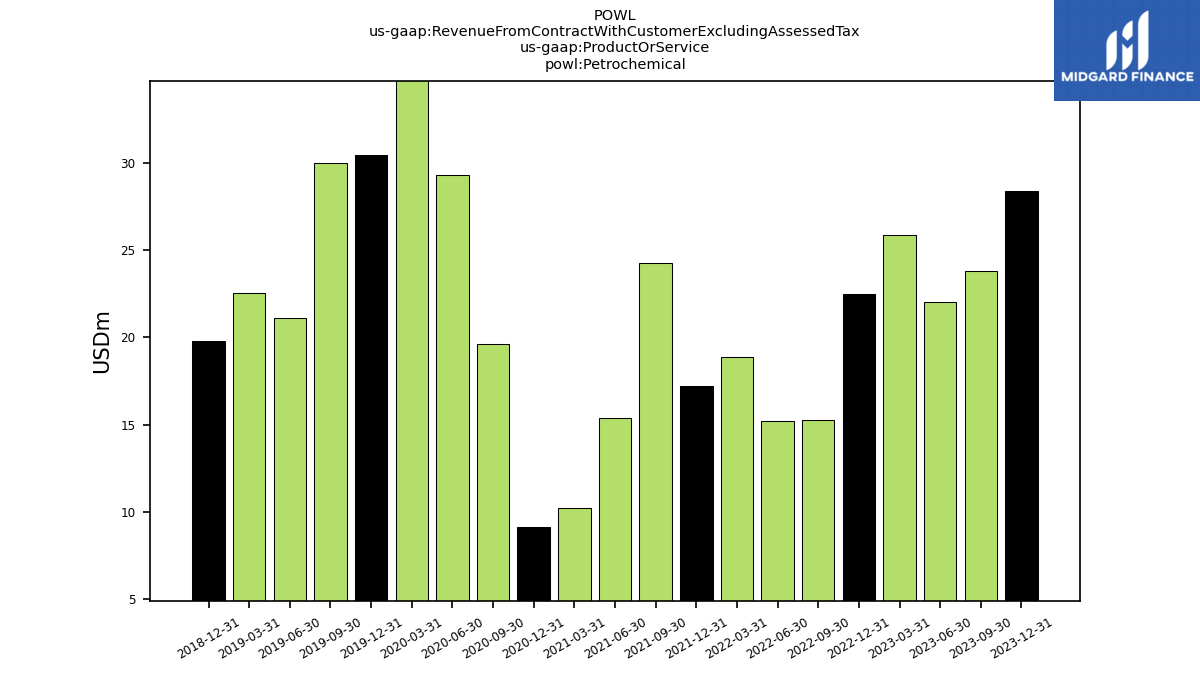
| Petrochemical | 28.37 | 23.82 | 22.00 | 25.89 | 22.49 | 15.27 | 15.19 | 18.85 | 17.23 | 24.26 | 15.37 | 10.20 | 9.16 | 19.64 | 29.29 | 47.34 | 30.43 | 30.00 | 21.09 | 22.52 | 19.78 | NA | NA | NA | NA | NA | NA | NA | NA | NA | NA | NA | NA | NA | NA | NA | NA | NA | NA | NA | NA | |
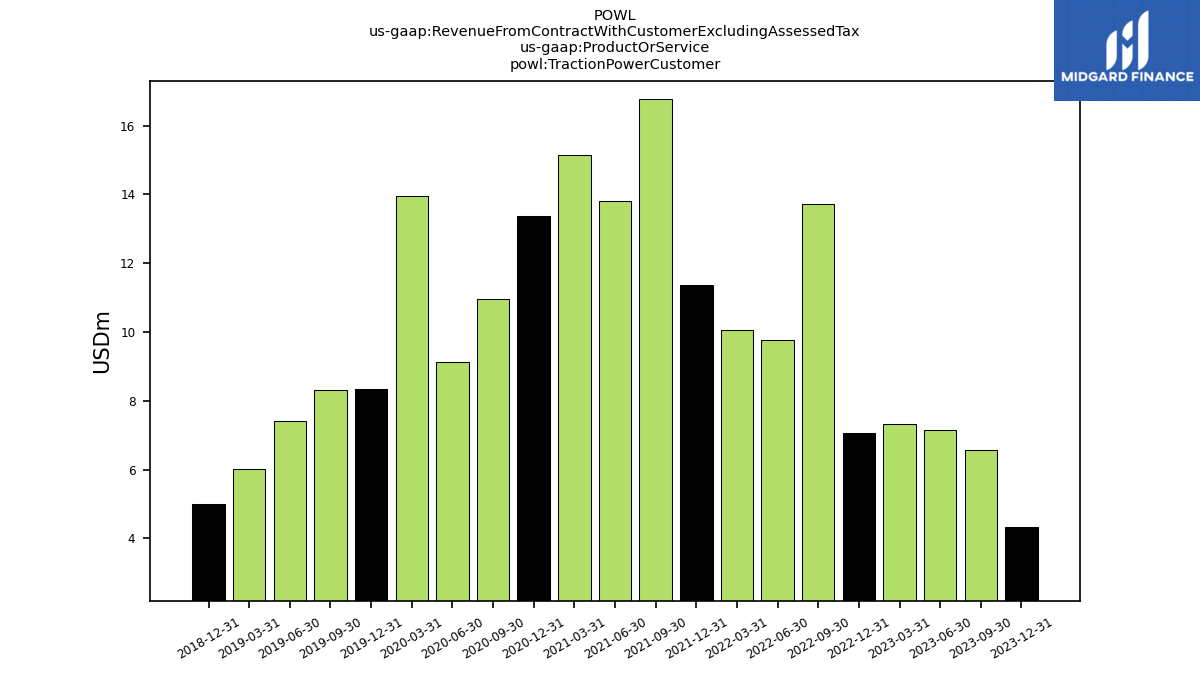
| Traction Power Customer | 4.34 | 6.58 | 7.14 | 7.32 | 7.07 | 13.73 | 9.78 | 10.05 | 11.37 | 16.78 | 13.82 | 15.14 | 13.36 | 10.96 | 9.12 | 13.94 | 8.35 | 8.32 | 7.42 | 6.03 | 5.01 | NA | NA | NA | NA | NA | NA | NA | NA | NA | NA | NA | NA | NA | NA | NA | NA | NA | NA | NA | NA | |
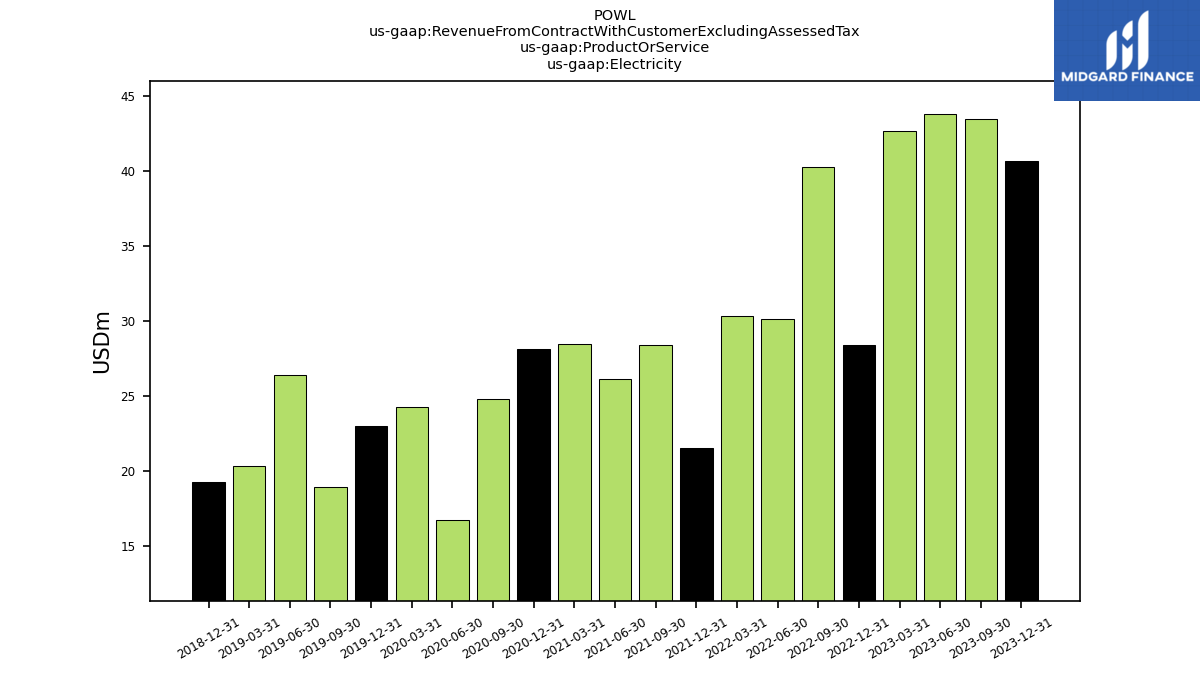
| Electricity | 40.70 | 43.50 | 43.82 | 42.67 | 28.41 | 40.28 | 30.17 | 30.37 | 21.53 | 28.45 | 26.18 | 28.45 | 28.17 | 24.82 | 16.73 | 24.25 | 23.02 | 18.93 | 26.43 | 20.38 | 19.26 | NA | NA | NA | NA | NA | NA | NA | NA | NA | NA | NA | NA | NA | NA | NA | NA | NA | NA | NA | NA | |
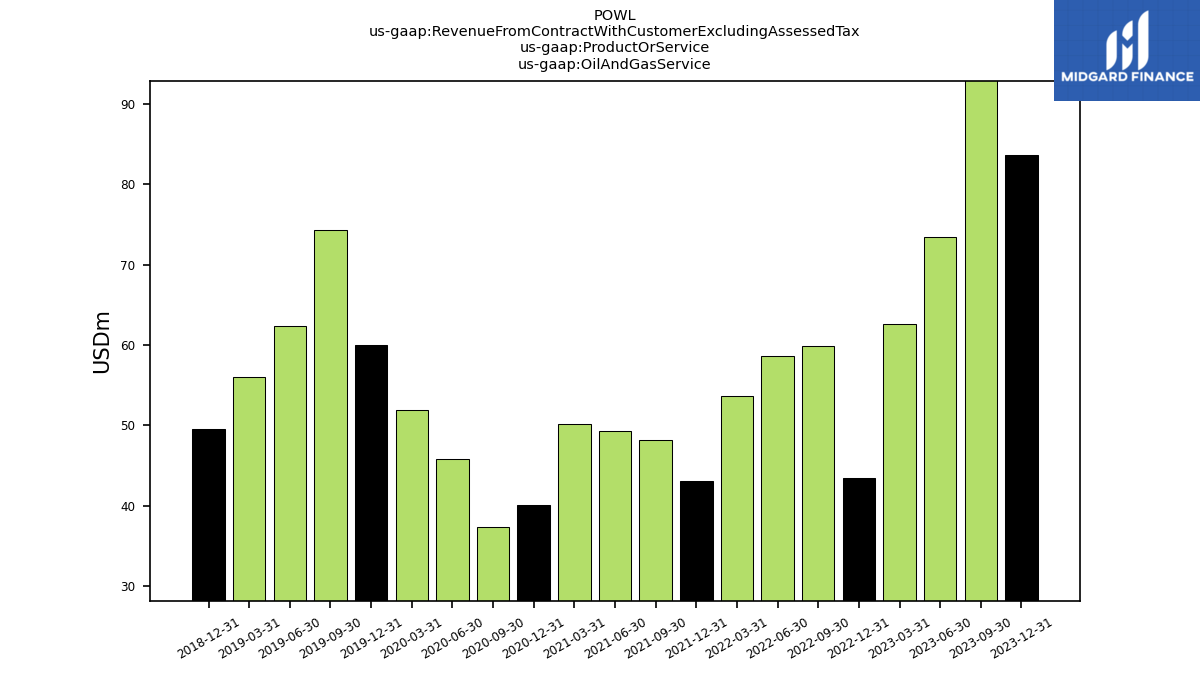
| Oil And Gas Service | 83.64 | 93.56 | 73.45 | 62.60 | 43.51 | 59.91 | 58.67 | 53.63 | 43.02 | 48.22 | 49.27 | 50.14 | 40.03 | 37.41 | 45.85 | 51.95 | 59.99 | 74.34 | 62.36 | 56.02 | 49.58 | NA | NA | NA | NA | NA | NA | NA | NA | NA | NA | NA | NA | NA | NA | NA | NA | NA | NA | NA | NA | |
| 1.34 | 1.28 | 2.34 | 1.79 | 0.78 | 0.65 | 1.65 | 1.65 | 0.94 | 2.51 | 1.65 | 2.01 | 2.72 | 6.29 | 4.64 | 5.46 | 1.69 | 2.25 | 4.68 | 0.73 | 3.74 | NA | NA | NA | NA | NA | NA | NA | NA | NA | NA | NA | NA | NA | NA | NA | NA | NA | NA | NA | NA | ||
| 20.35 | 21.84 | 21.77 | 22.00 | 18.50 | 20.44 | 23.60 | 22.05 | 15.12 | 20.30 | 16.53 | 17.73 | 14.09 | 19.23 | 16.97 | 15.41 | 14.45 | 19.31 | 20.21 | 15.09 | 9.71 | NA | NA | NA | NA | NA | NA | NA | NA | NA | NA | NA | NA | NA | NA | NA | NA | NA | NA | NA | NA | ||
| 6.53 | NA | NA | NA | 4.13 | NA | NA | NA | NA | NA | NA | NA | NA | NA | NA | NA | NA | NA | NA | NA | NA | NA | NA | NA | NA | NA | NA | NA | NA | NA | NA | NA | NA | NA | NA | NA | NA | NA | NA | NA | NA | ||
| US | 159.86 | 170.40 | 153.26 | 134.16 | 100.11 | 132.90 | 102.93 | 86.99 | 82.14 | 94.48 | 88.41 | 87.94 | 80.59 | 79.97 | 89.50 | 121.43 | 107.08 | 114.56 | 99.75 | 102.41 | 89.90 | NA | NA | NA | NA | NA | NA | NA | NA | NA | NA | NA | NA | NA | NA | NA | NA | NA | NA | NA | NA | |
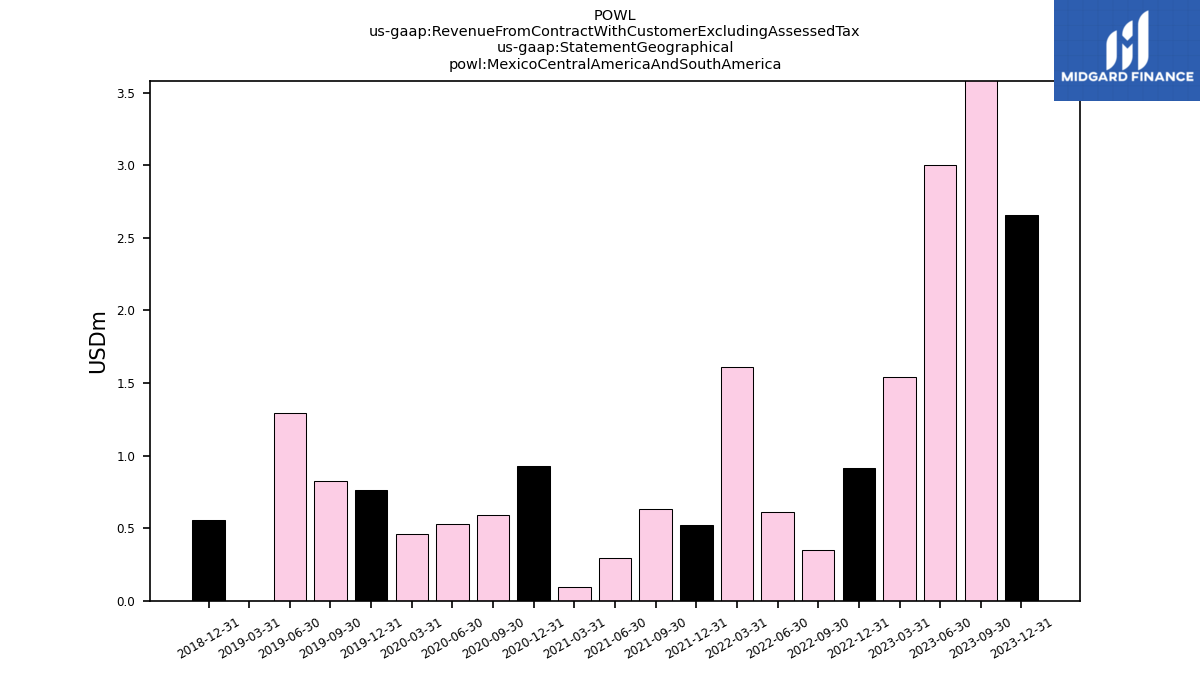
| Mexico Central America And South America | 2.66 | 3.94 | 3.00 | 1.54 | 0.92 | 0.35 | 0.61 | 1.61 | 0.53 | 0.63 | 0.29 | 0.10 | 0.93 | 0.59 | 0.53 | 0.46 | 0.77 | 0.82 | 1.30 | 0.00 | 0.55 | NA | NA | NA | NA | NA | NA | NA | NA | NA | NA | NA | NA | NA | NA | NA | NA | NA | NA | NA | NA | |
| Middle East And Africa | 3.27 | NA | NA | NA | 2.42 | NA | NA | NA | NA | NA | NA | NA | NA | NA | NA | NA | NA | NA | NA | NA | NA | NA | NA | NA | NA | NA | NA | NA | NA | NA | NA | NA | NA | NA | NA | NA | NA | NA | NA | NA | NA | |
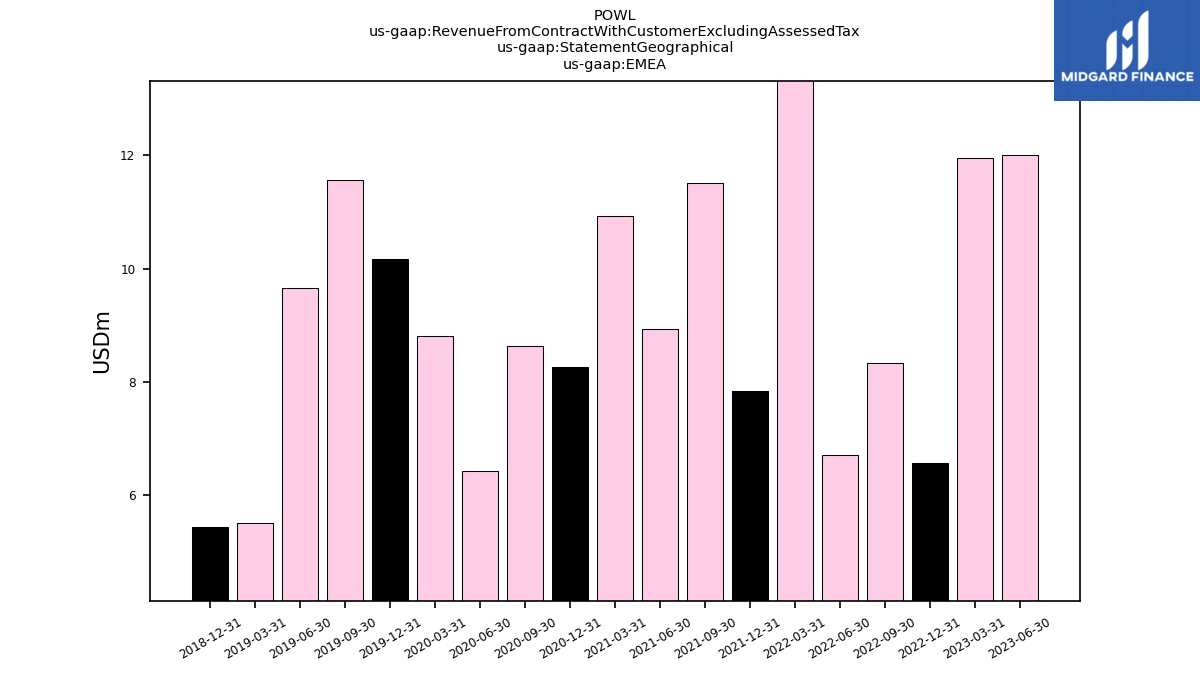
| EMEA | NA | NA | 12.00 | 11.96 | 6.56 | 8.33 | 6.70 | 15.55 | 7.83 | 11.52 | 8.93 | 10.94 | 8.26 | 8.62 | 6.42 | 8.82 | 10.17 | 11.56 | 9.66 | 5.51 | 5.44 | NA | NA | NA | NA | NA | NA | NA | NA | NA | NA | NA | NA | NA | NA | NA | NA | NA | NA | NA | NA | |
| Revenue From Contract With Customer Including Assessed Tax | 194.02 | 208.64 | 192.37 | 171.44 | 126.86 | 162.68 | 135.48 | 127.85 | 106.57 | 129.46 | 115.81 | 118.72 | 106.58 | 114.72 | 118.06 | 151.57 | 134.15 | 148.50 | 135.59 | 123.74 | 109.35 | 134.90 | 122.13 | 101.50 | 90.18 | 94.96 | 85.93 | 104.68 | 110.34 | 187.40 | 179.52 | 153.91 | 153.94 | 184.16 | 194.09 | 181.49 | 157.46 | 171.24 | 141.37 | 125.11 | 124.67 |


