
| 2023-12-31 | 2023-09-30 | 2023-06-30 | 2023-03-31 | 2022-12-31 | 2022-09-30 | 2022-06-30 | 2022-03-31 | 2021-12-31 | 2021-09-30 | 2021-06-30 | 2021-03-31 | 2020-12-31 | 2020-09-30 | 2020-06-30 | 2020-03-31 | 2019-12-31 | 2019-09-30 | 2019-06-30 | 2019-03-31 | 2018-12-31 | 2018-09-30 | 2018-06-30 | 2018-03-31 | 2017-12-31 | 2017-09-30 | 2017-06-30 | 2017-03-31 | 2016-12-31 | 2016-09-30 | 2016-06-30 | 2016-03-31 | 2015-12-31 | 2015-09-30 | 2015-06-30 | 2015-03-31 | 2014-12-31 | 2014-09-30 | 2014-06-30 | 2014-03-31 | 2013-12-31 | 2013-09-30 | 2013-06-30 | 2013-03-31 | 2012-12-31 | 2012-09-30 | 2012-06-30 | 2012-03-31 | 2011-12-31 | 2011-09-30 | 2011-06-30 | 2011-03-31 | 2010-12-31 | 2010-09-30 | 2010-06-30 | ||
|---|---|---|---|---|---|---|---|---|---|---|---|---|---|---|---|---|---|---|---|---|---|---|---|---|---|---|---|---|---|---|---|---|---|---|---|---|---|---|---|---|---|---|---|---|---|---|---|---|---|---|---|---|---|---|---|---|
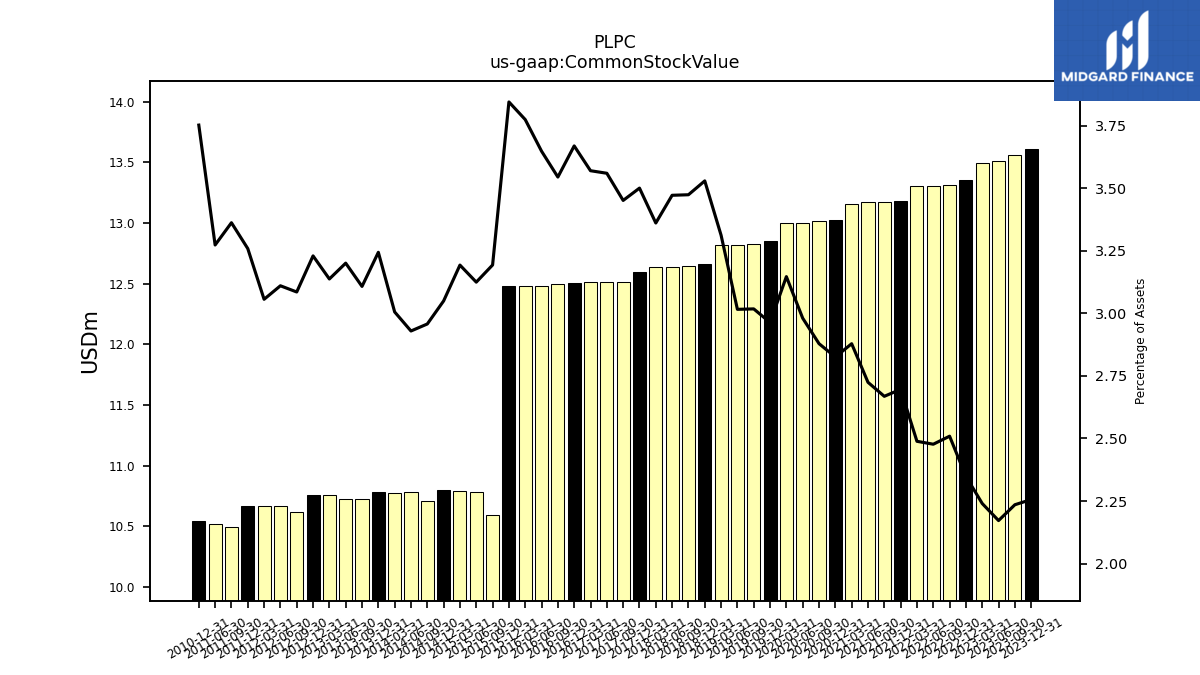
| Common Stock Value | 13.61 | 13.56 | 13.51 | 13.49 | 13.35 | 13.32 | 13.30 | 13.30 | 13.19 | 13.17 | 13.17 | 13.15 | 13.03 | 13.01 | 13.00 | 13.00 | 12.85 | 12.82 | 12.82 | 12.82 | 12.66 | 12.64 | 12.64 | 12.63 | 12.59 | 12.51 | 12.51 | 12.51 | 12.51 | 12.50 | 12.48 | 12.48 | 12.48 | 10.59 | 10.78 | 10.79 | 10.79 | 10.71 | 10.78 | 10.78 | 10.78 | 10.72 | 10.72 | 10.75 | 10.76 | 10.62 | 10.67 | 10.66 | 10.67 | 10.50 | 10.52 | NA | 10.54 | NA | NA | |
| Earnings Per Share Basic | 1.31 | 3.08 | 4.14 | 4.33 | 3.35 | 2.41 | 2.78 | 2.49 | 1.83 | 2.19 | 1.81 | 1.46 | 0.58 | 2.63 | 2.11 | 0.74 | 1.12 | 1.58 | 1.57 | 0.36 | 1.05 | 1.80 | 1.34 | 1.10 | 0.14 | 1.23 | 0.81 | 0.30 | 1.00 | 0.92 | 0.53 | 0.51 | 0.58 | 0.04 | 0.68 | -0.05 | 0.46 | 0.48 | 0.94 | 0.51 | 0.59 | 1.14 | 1.19 | 0.92 | 0.99 | 1.75 | 1.24 | 1.52 | 1.70 | 1.27 | 1.59 | 1.33 | 1.15 | 1.89 | 1.16 | |
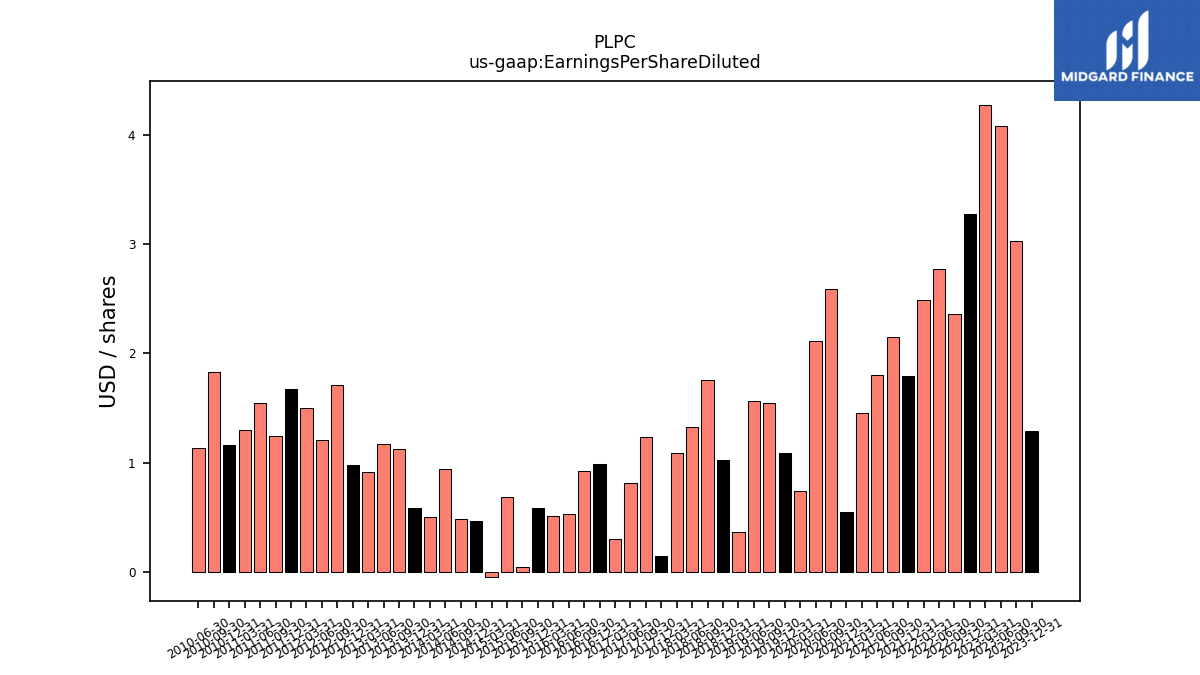
| Earnings Per Share Diluted | 1.29 | 3.03 | 4.08 | 4.28 | 3.28 | 2.36 | 2.77 | 2.49 | 1.79 | 2.15 | 1.80 | 1.45 | 0.55 | 2.59 | 2.11 | 0.74 | 1.09 | 1.55 | 1.56 | 0.36 | 1.02 | 1.76 | 1.33 | 1.09 | 0.14 | 1.23 | 0.81 | 0.30 | 0.99 | 0.92 | 0.53 | 0.51 | 0.58 | 0.04 | 0.68 | -0.05 | 0.46 | 0.48 | 0.94 | 0.50 | 0.58 | 1.12 | 1.17 | 0.91 | 0.98 | 1.71 | 1.21 | 1.50 | 1.67 | 1.24 | 1.55 | 1.30 | 1.16 | 1.83 | 1.13 |
| 2023-12-31 | 2023-09-30 | 2023-06-30 | 2023-03-31 | 2022-12-31 | 2022-09-30 | 2022-06-30 | 2022-03-31 | 2021-12-31 | 2021-09-30 | 2021-06-30 | 2021-03-31 | 2020-12-31 | 2020-09-30 | 2020-06-30 | 2020-03-31 | 2019-12-31 | 2019-09-30 | 2019-06-30 | 2019-03-31 | 2018-12-31 | 2018-09-30 | 2018-06-30 | 2018-03-31 | 2017-12-31 | 2017-09-30 | 2017-06-30 | 2017-03-31 | 2016-12-31 | 2016-09-30 | 2016-06-30 | 2016-03-31 | 2015-12-31 | 2015-09-30 | 2015-06-30 | 2015-03-31 | 2014-12-31 | 2014-09-30 | 2014-06-30 | 2014-03-31 | 2013-12-31 | 2013-09-30 | 2013-06-30 | 2013-03-31 | 2012-12-31 | 2012-09-30 | 2012-06-30 | 2012-03-31 | 2011-12-31 | 2011-09-30 | 2011-06-30 | 2011-03-31 | 2010-12-31 | 2010-09-30 | 2010-06-30 | ||
|---|---|---|---|---|---|---|---|---|---|---|---|---|---|---|---|---|---|---|---|---|---|---|---|---|---|---|---|---|---|---|---|---|---|---|---|---|---|---|---|---|---|---|---|---|---|---|---|---|---|---|---|---|---|---|---|---|
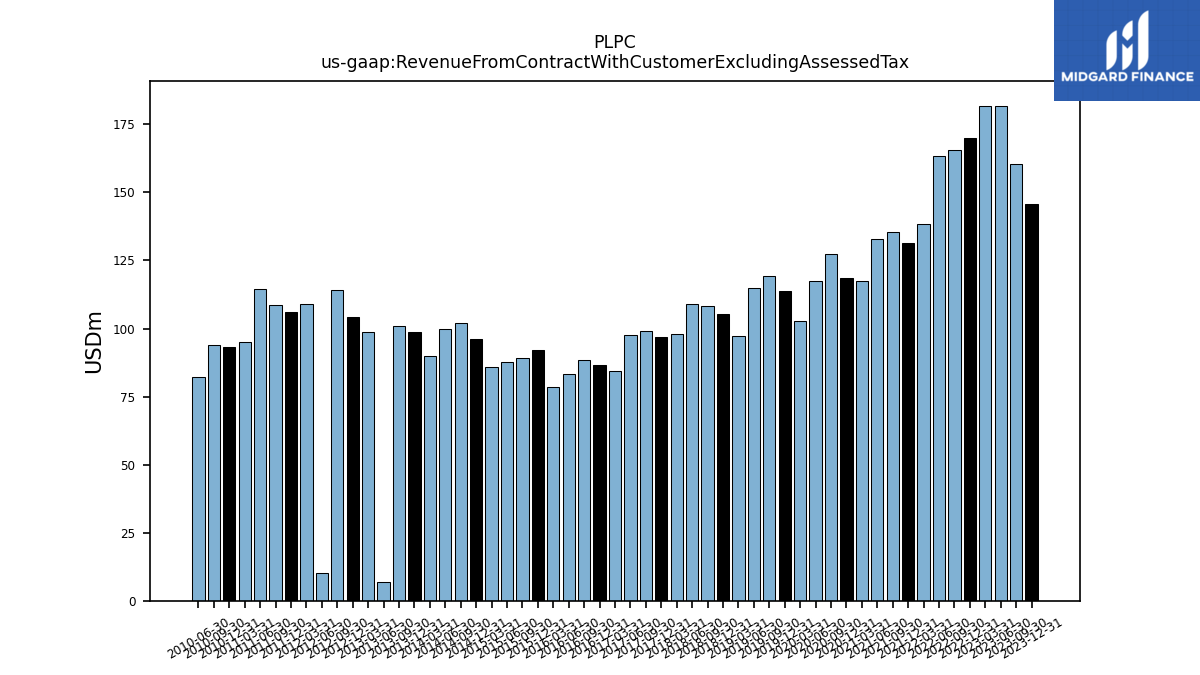
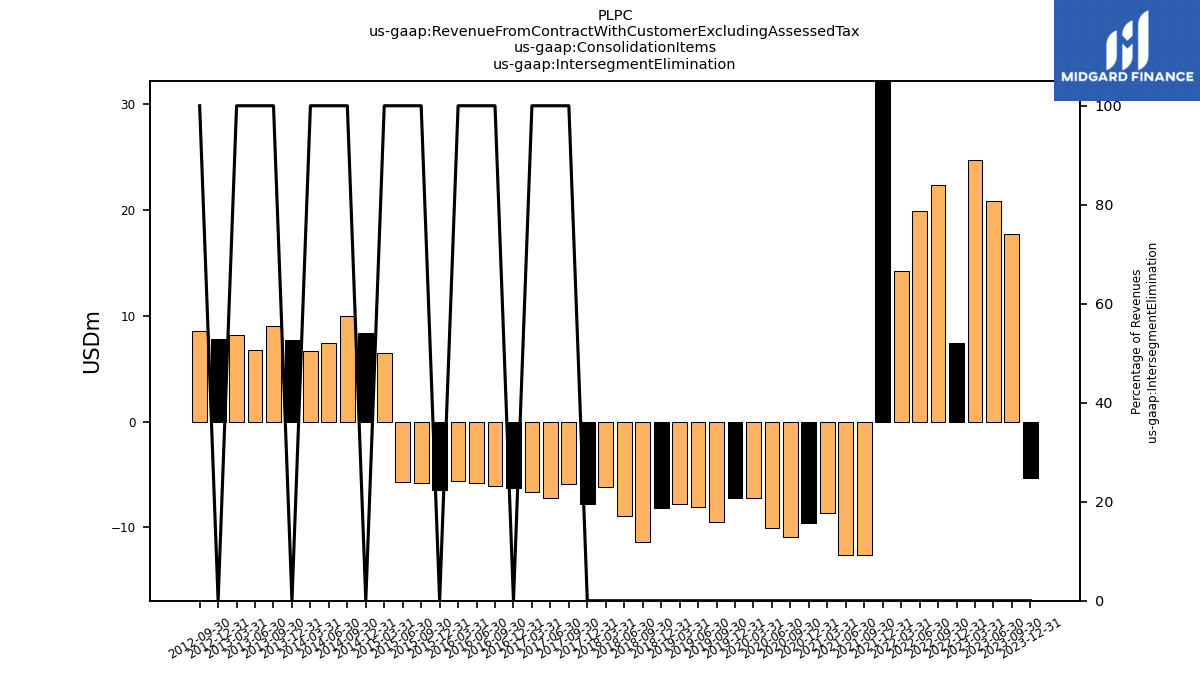
| Revenue From Contract With Customer Excluding Assessed Tax | 145.60 | 160.44 | 181.81 | 181.82 | 169.92 | 165.40 | 163.47 | 138.22 | 131.45 | 135.38 | 133.04 | 117.55 | 118.50 | 127.46 | 117.63 | 102.85 | 113.65 | 119.22 | 114.84 | 97.15 | 105.41 | 108.41 | 108.92 | 98.14 | 96.89 | 99.24 | 97.51 | 84.57 | 86.43 | 88.30 | 83.22 | 78.68 | 91.96 | 89.05 | 87.87 | 85.79 | 96.18 | 102.10 | 99.98 | 89.92 | 98.54 | 100.83 | 6.81 | 98.69 | 104.20 | 114.21 | 10.07 | 108.85 | 106.10 | 108.69 | 114.53 | 95.09 | 93.32 | 93.94 | 82.14 | |
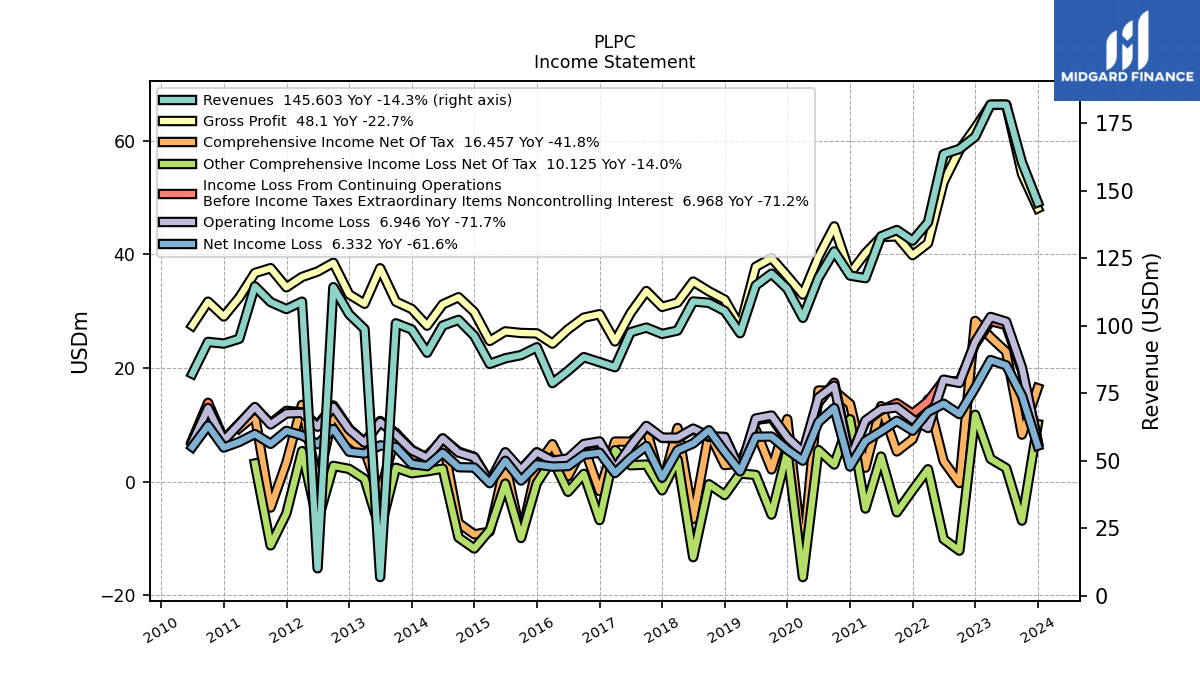
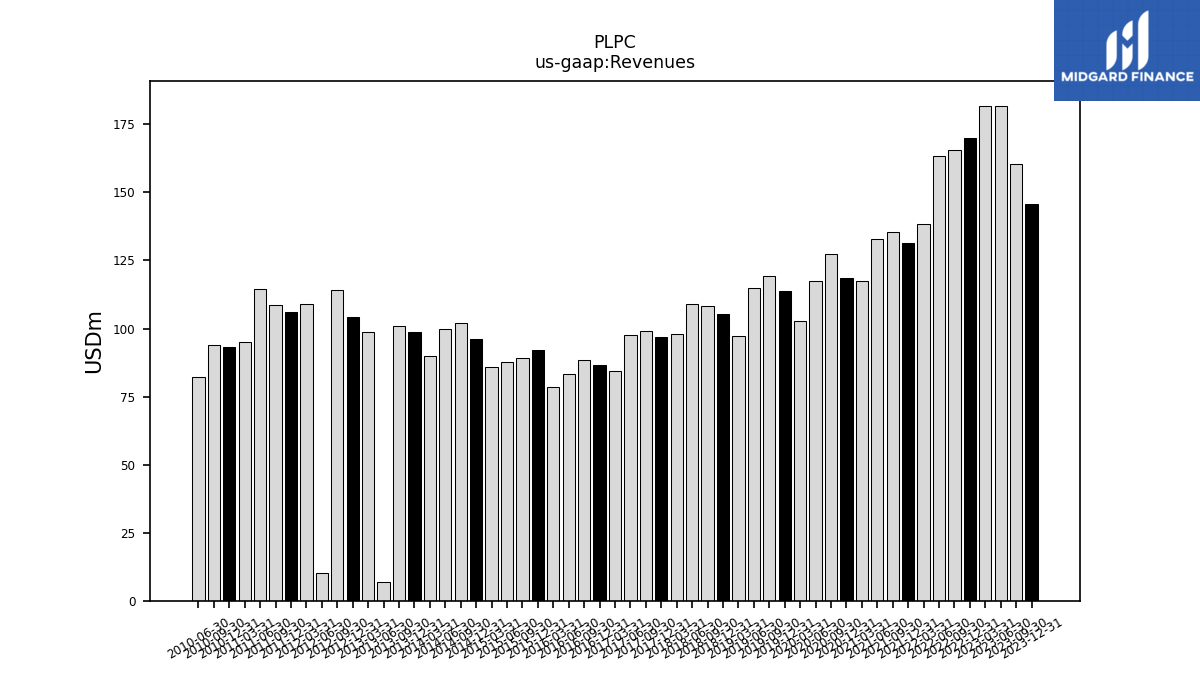
| Revenues | 145.60 | 160.44 | 181.81 | 181.82 | 169.92 | 165.40 | 163.47 | 138.22 | 131.45 | 135.38 | 133.04 | 117.55 | 118.50 | 127.46 | 117.63 | 102.85 | 113.65 | 119.22 | 114.84 | 97.15 | 105.41 | 108.41 | 108.92 | 98.14 | 96.89 | 99.24 | 97.51 | 84.57 | 86.43 | 88.30 | 83.22 | 78.68 | 91.96 | 89.05 | 87.87 | 85.79 | 96.18 | 102.10 | 99.98 | 89.92 | 98.54 | 100.83 | 6.81 | 98.69 | 104.20 | 114.21 | 10.07 | 108.85 | 106.10 | 108.69 | 114.53 | 95.09 | 93.32 | 93.94 | 82.14 | |
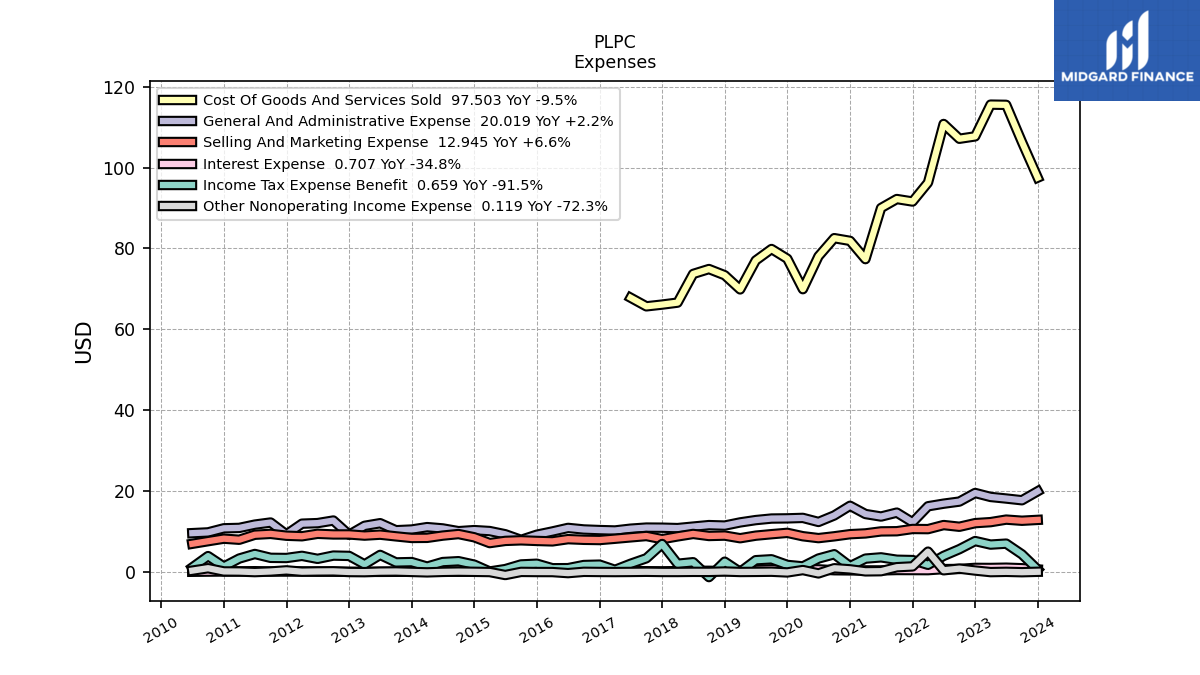
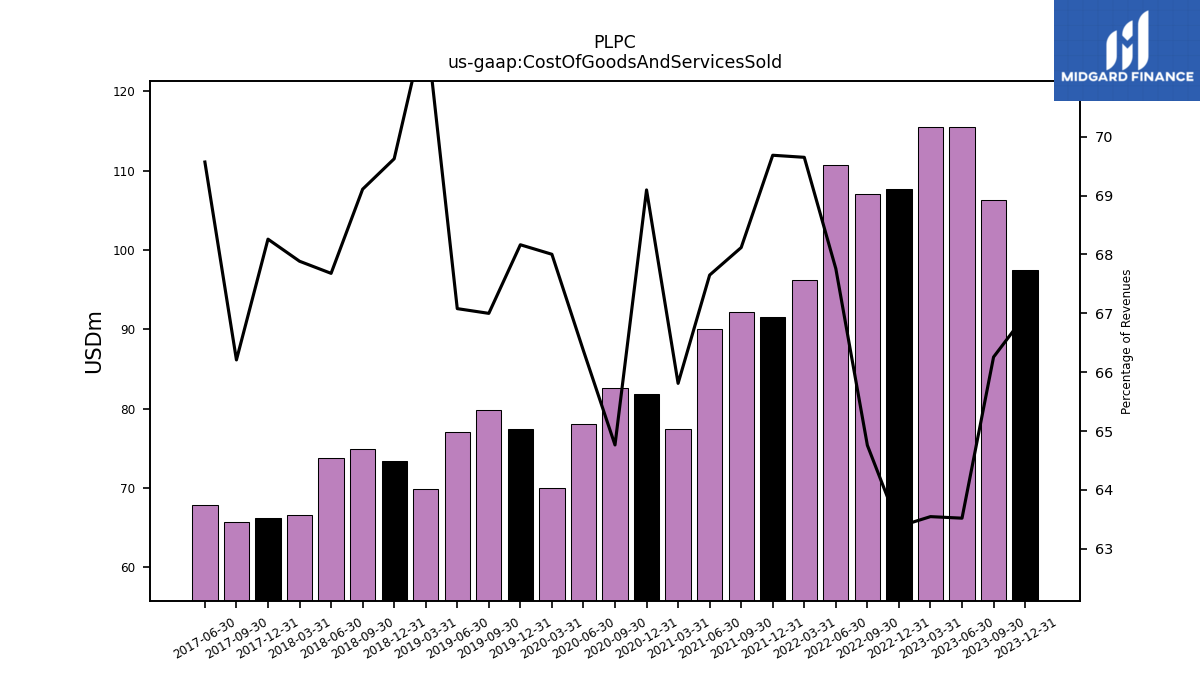
| Cost Of Goods And Services Sold | 97.50 | 106.30 | 115.49 | 115.54 | 107.69 | 107.11 | 110.77 | 96.27 | 91.60 | 92.22 | 90.00 | 77.36 | 81.88 | 82.55 | 78.06 | 69.94 | 77.47 | 79.87 | 77.03 | 69.89 | 73.39 | 74.92 | 73.71 | 66.62 | 66.14 | 65.70 | 67.84 | NA | NA | NA | NA | NA | NA | NA | NA | NA | NA | NA | NA | NA | NA | NA | NA | NA | NA | NA | NA | NA | NA | NA | NA | NA | NA | NA | NA | |
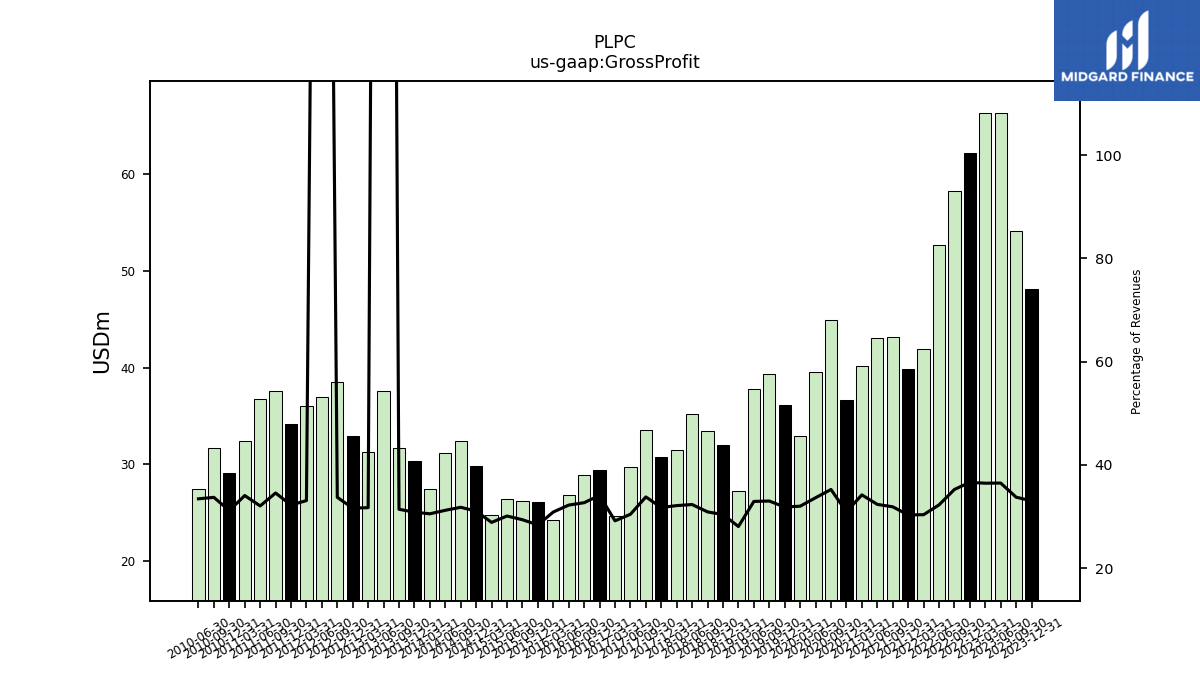
| Gross Profit | 48.10 | 54.14 | 66.33 | 66.28 | 62.23 | 58.29 | 52.71 | 41.95 | 39.85 | 43.16 | 43.04 | 40.19 | 36.62 | 44.91 | 39.57 | 32.91 | 36.18 | 39.34 | 37.81 | 27.27 | 32.02 | 33.49 | 35.20 | 31.52 | 30.75 | 33.53 | 29.67 | 24.66 | 29.46 | 28.86 | 26.81 | 24.29 | 26.09 | 26.16 | 26.44 | 24.76 | 29.85 | 32.45 | 31.20 | 27.45 | 30.39 | 31.66 | 37.55 | 31.30 | 32.95 | 38.51 | 36.97 | 36.01 | 34.19 | 37.56 | 36.71 | 32.39 | 29.07 | 31.67 | 27.45 | |
| Costs And Expenses | 41.15 | 34.06 | 38.18 | 37.30 | 37.64 | 40.92 | 34.76 | 32.50 | 28.88 | 30.09 | 30.30 | 29.42 | 32.76 | 28.02 | 24.76 | 27.76 | 28.36 | 27.70 | 26.69 | 25.22 | 24.18 | 25.48 | 25.87 | 23.77 | 23.01 | 23.73 | 23.38 | 22.41 | 22.38 | 22.23 | 22.73 | 20.60 | 20.93 | 24.07 | 21.26 | 24.84 | 25.57 | 27.32 | 23.59 | 23.23 | 24.87 | 23.39 | 27.06 | 24.43 | 23.77 | 25.35 | 27.29 | 23.91 | 22.18 | 27.48 | 23.57 | 22.27 | 21.79 | 18.71 | 20.54 | |
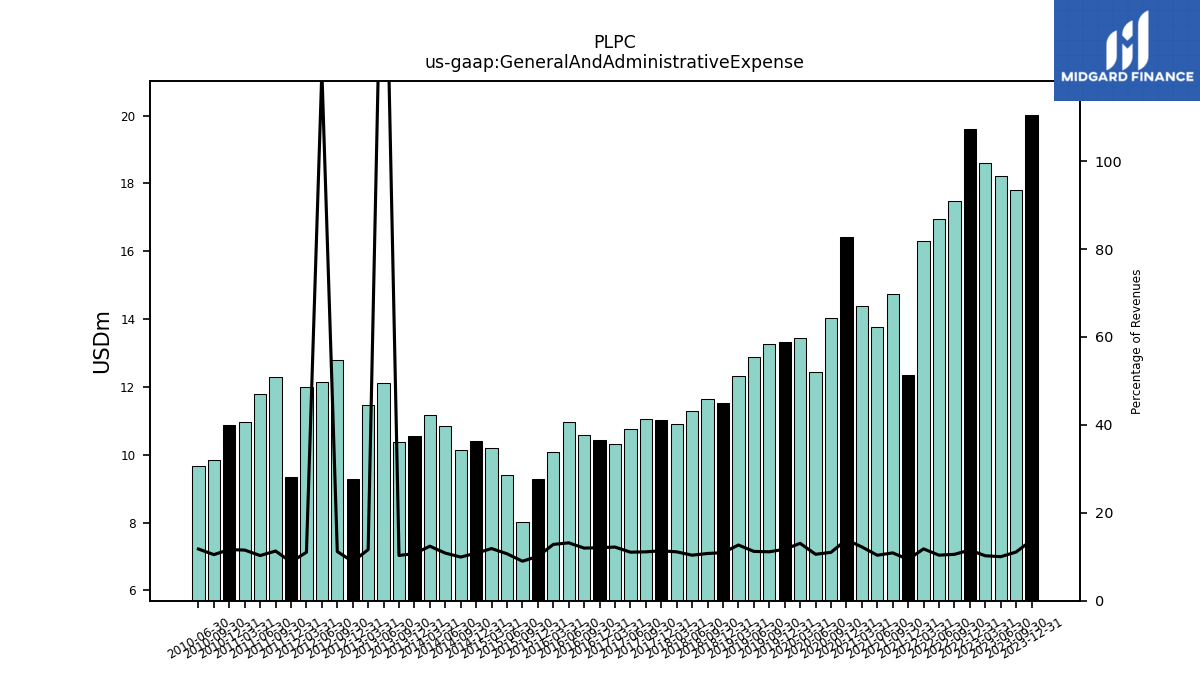
| General And Administrative Expense | 20.02 | 17.79 | 18.22 | 18.61 | 19.59 | 17.47 | 16.95 | 16.31 | 12.35 | 14.74 | 13.77 | 14.39 | 16.43 | 14.04 | 12.43 | 13.43 | 13.32 | 13.28 | 12.89 | 12.32 | 11.54 | 11.65 | 11.29 | 10.92 | 11.02 | 11.04 | 10.77 | 10.33 | 10.43 | 10.58 | 10.96 | 10.09 | 9.28 | 8.01 | 9.39 | 10.19 | 10.42 | 10.15 | 10.84 | 11.16 | 10.56 | 10.39 | 12.13 | 11.48 | 9.28 | 12.79 | 12.15 | 12.01 | 9.36 | 12.30 | 11.78 | 10.96 | 10.87 | 9.86 | 9.67 | |
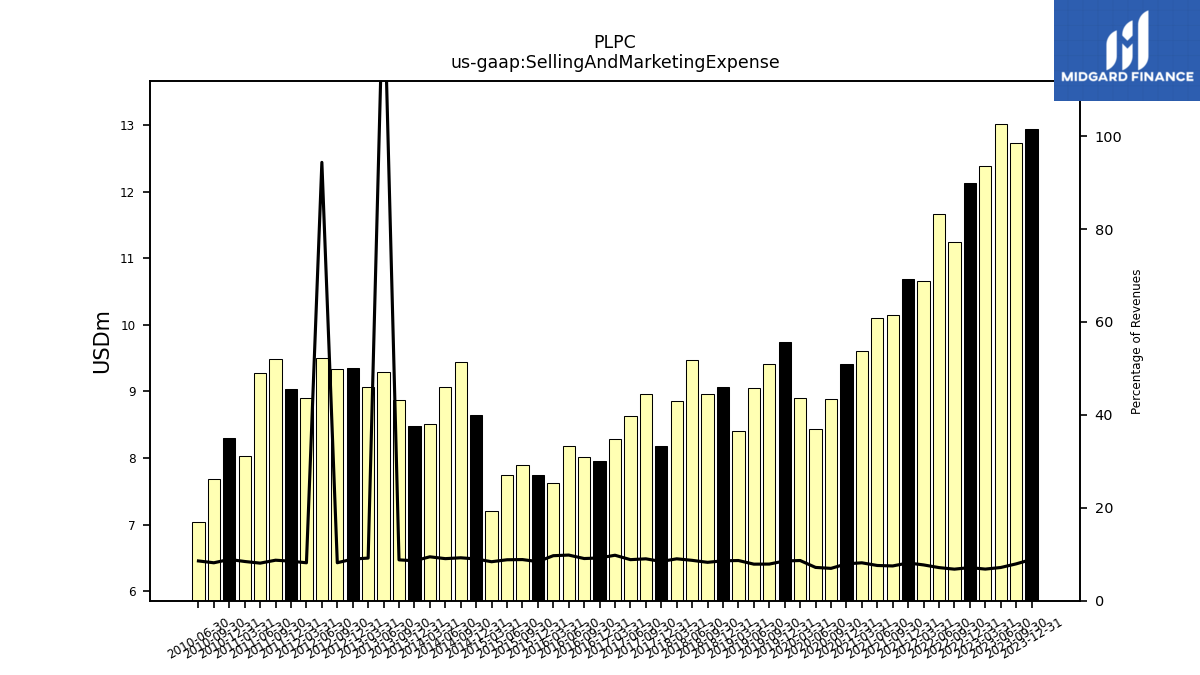
| Selling And Marketing Expense | 12.95 | 12.73 | 13.01 | 12.39 | 12.14 | 11.24 | 11.67 | 10.66 | 10.70 | 10.14 | 10.10 | 9.60 | 9.41 | 8.88 | 8.44 | 8.90 | 9.74 | 9.41 | 9.05 | 8.41 | 9.06 | 8.96 | 9.47 | 8.86 | 8.18 | 8.96 | 8.63 | 8.28 | 7.96 | 8.02 | 8.18 | 7.63 | 7.74 | 7.89 | 7.75 | 7.21 | 8.64 | 9.44 | 9.06 | 8.51 | 8.48 | 8.87 | 9.29 | 9.06 | 9.35 | 9.34 | 9.51 | 8.90 | 9.03 | 9.48 | 9.27 | 8.04 | 8.30 | 7.68 | 7.04 | |
| Operating Income Loss | 6.95 | 20.08 | 28.15 | 28.98 | 24.59 | 17.37 | 17.95 | 9.45 | 10.96 | 13.08 | 12.74 | 10.77 | 3.87 | 16.89 | 14.81 | 5.15 | 7.82 | 11.64 | 11.12 | 2.05 | 7.84 | 8.02 | 9.33 | 7.75 | 7.75 | 9.81 | 6.29 | 2.26 | 7.09 | 6.62 | 4.08 | 3.69 | 5.16 | 2.09 | 5.18 | -0.09 | 4.28 | 5.13 | 7.61 | 4.21 | 5.53 | 8.27 | 10.49 | 6.87 | 9.18 | 13.16 | 9.67 | 12.11 | 12.02 | 10.08 | 13.13 | 10.12 | 7.28 | 12.96 | 6.92 | |
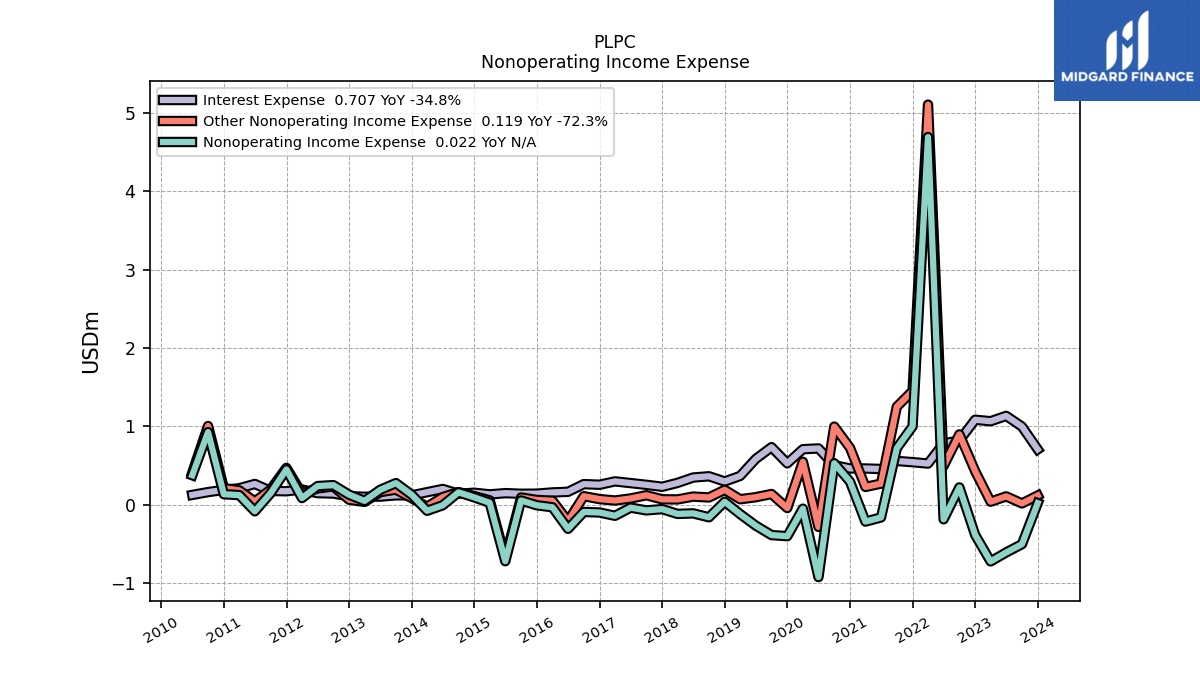
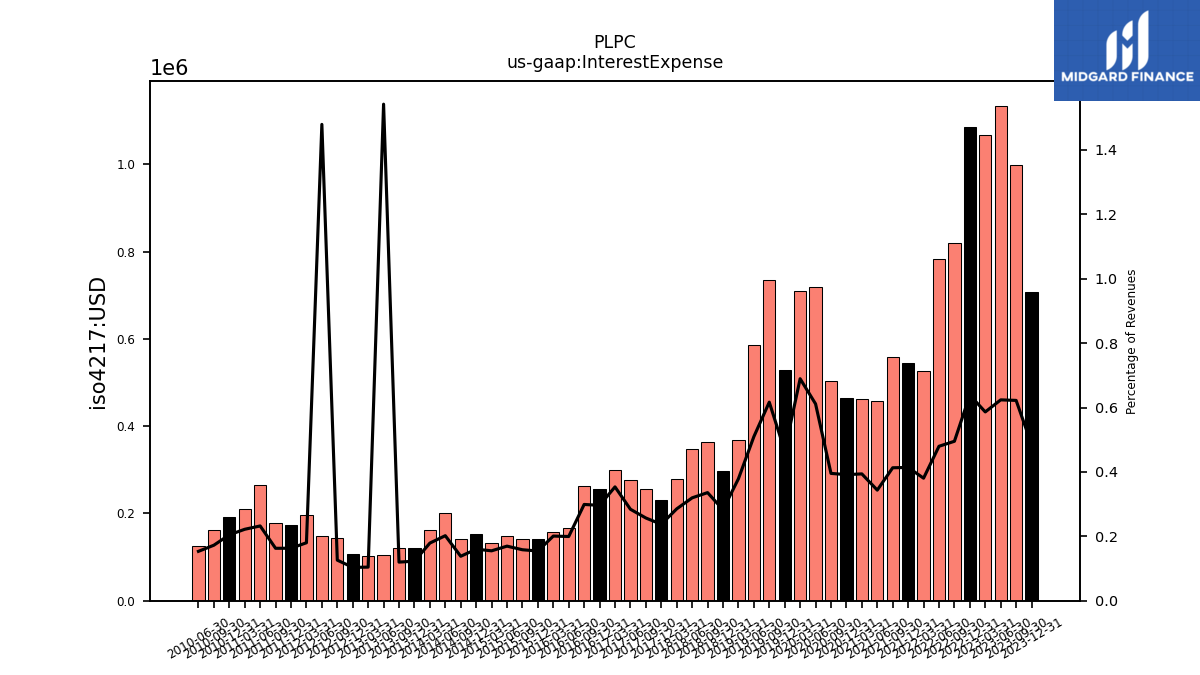
| Interest Expense | 0.71 | 1.00 | 1.13 | 1.07 | 1.08 | 0.82 | 0.78 | 0.53 | 0.54 | 0.56 | 0.46 | 0.46 | 0.46 | 0.50 | 0.72 | 0.71 | 0.53 | 0.73 | 0.58 | 0.37 | 0.30 | 0.36 | 0.35 | 0.28 | 0.23 | 0.26 | 0.28 | 0.30 | 0.26 | 0.26 | 0.17 | 0.16 | 0.14 | 0.14 | 0.15 | 0.13 | 0.15 | 0.14 | 0.20 | 0.16 | 0.12 | 0.12 | 0.10 | 0.10 | 0.11 | 0.14 | 0.15 | 0.20 | 0.17 | 0.18 | 0.27 | 0.21 | 0.19 | 0.16 | 0.13 | |
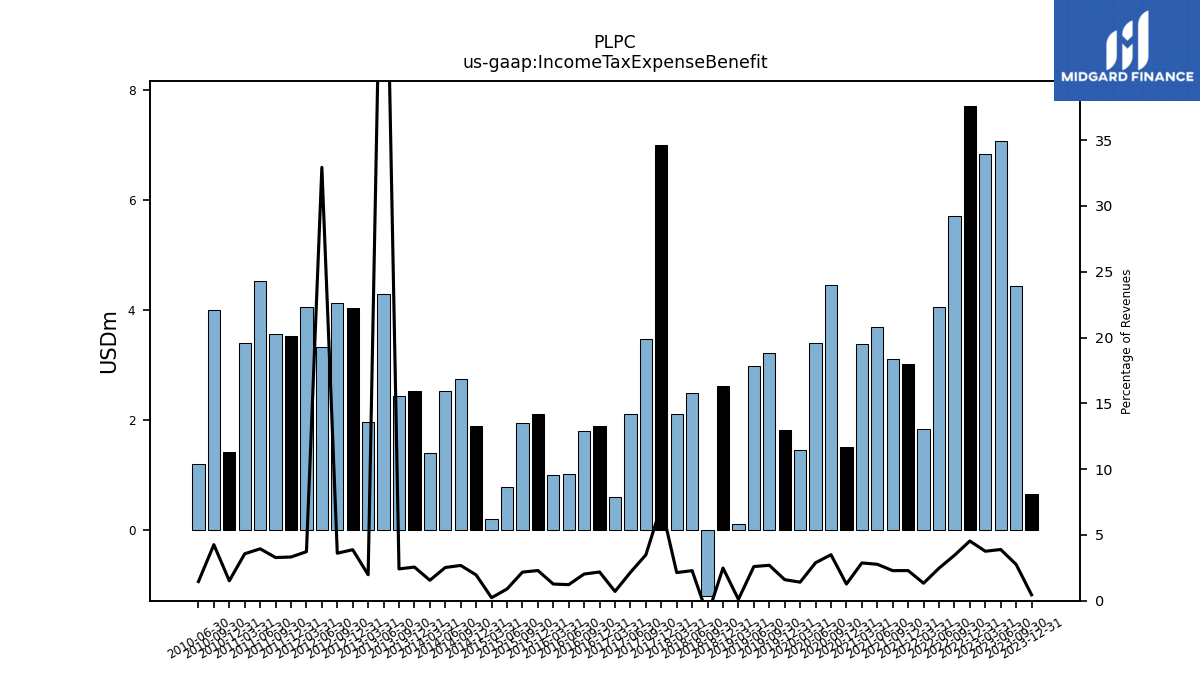
| Income Tax Expense Benefit | 0.66 | 4.43 | 7.08 | 6.84 | 7.71 | 5.71 | 4.04 | 1.84 | 3.01 | 3.10 | 3.69 | 3.38 | 1.50 | 4.46 | 3.40 | 1.45 | 1.82 | 3.21 | 2.98 | 0.10 | 2.62 | -1.20 | 2.49 | 2.10 | 6.99 | 3.46 | 2.10 | 0.60 | 1.89 | 1.79 | 1.02 | 1.00 | 2.11 | 1.94 | 0.79 | 0.20 | 1.89 | 2.74 | 2.53 | 1.40 | 2.52 | 2.44 | 4.29 | 1.95 | 4.04 | 4.13 | 3.32 | 4.06 | 3.53 | 3.57 | 4.52 | 3.40 | 1.42 | 4.00 | 1.20 | |
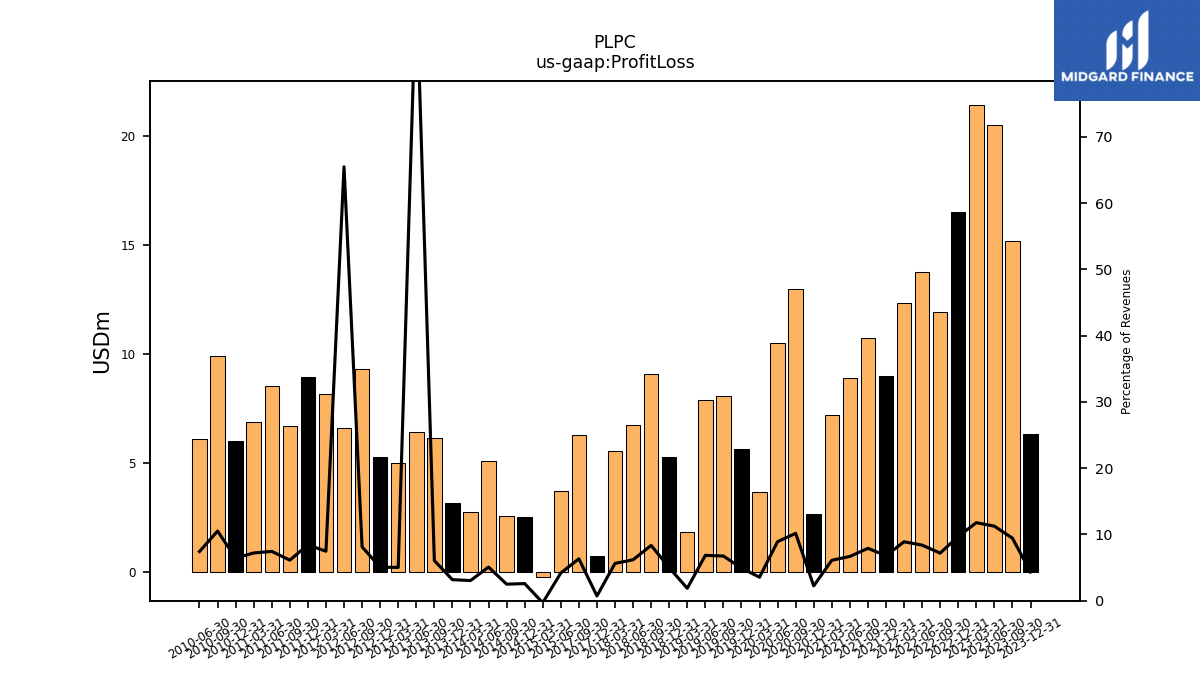
| Profit Loss | 6.31 | 15.14 | 20.46 | 21.42 | 16.49 | 11.89 | 13.72 | 12.30 | 8.95 | 10.70 | 8.89 | 7.18 | 2.66 | 12.96 | 10.49 | 3.65 | 5.60 | 8.04 | 7.87 | 1.82 | 5.26 | 9.05 | 6.74 | 5.53 | 0.70 | 6.28 | NA | NA | NA | NA | NA | NA | NA | NA | 3.68 | -0.26 | 2.49 | 2.56 | 5.08 | 2.74 | 3.13 | 6.10 | 6.39 | 4.96 | 5.27 | 9.28 | 6.60 | 8.13 | 8.94 | 6.66 | 8.53 | 6.85 | 6.00 | 9.88 | 6.10 | |
| Other Comprehensive Income Loss Net Of Tax | 10.12 | -6.84 | 2.39 | 4.01 | 11.77 | -12.13 | -10.10 | 2.19 | -1.50 | -5.38 | 4.42 | -4.71 | 11.00 | 3.02 | 5.56 | -16.78 | 5.38 | -5.79 | 1.19 | 1.45 | -2.34 | -0.45 | -13.28 | 3.92 | -1.52 | 3.01 | 2.89 | 5.54 | -6.76 | 1.38 | -1.78 | 3.94 | -0.24 | -9.90 | -0.34 | -8.53 | -11.75 | -9.81 | 2.30 | 1.83 | 1.50 | 2.45 | -8.48 | 0.50 | 2.25 | 2.78 | -7.04 | 5.38 | -5.59 | -11.20 | 3.20 | NA | NA | NA | NA | |
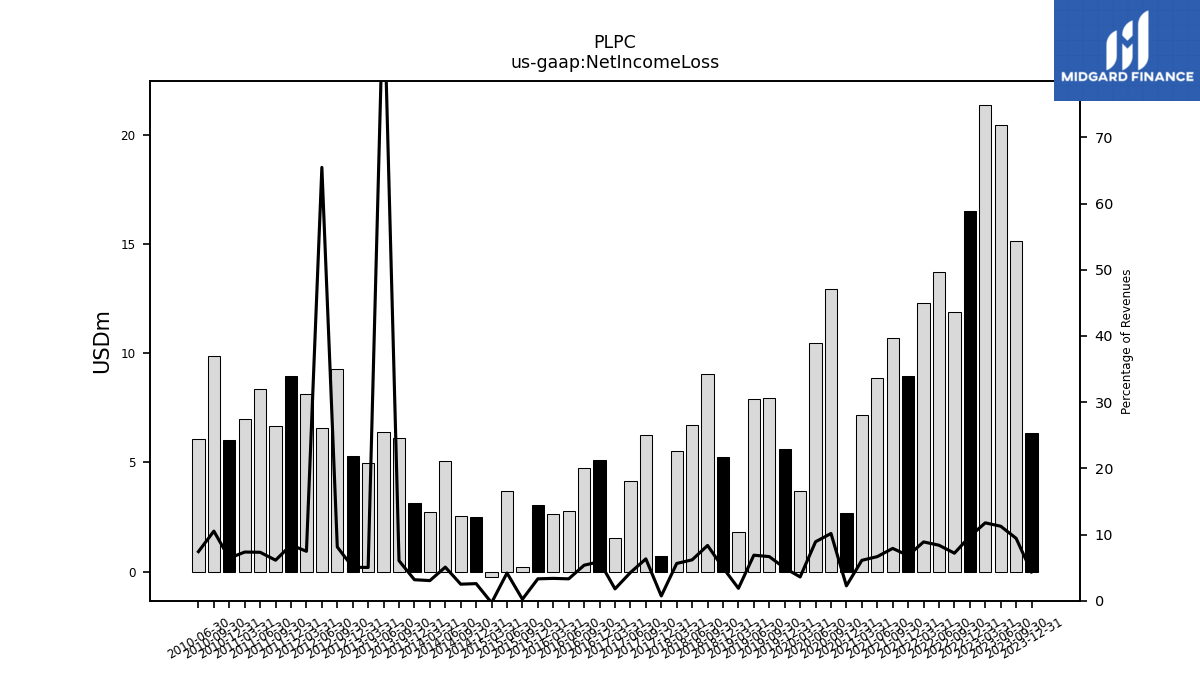
| Net Income Loss | 6.33 | 15.13 | 20.47 | 21.40 | 16.51 | 11.89 | 13.71 | 12.29 | 8.97 | 10.71 | 8.87 | 7.18 | 2.67 | 12.95 | 10.48 | 3.70 | 5.62 | 7.95 | 7.90 | 1.82 | 5.26 | 9.05 | 6.74 | 5.53 | 0.70 | 6.28 | 4.16 | 1.52 | 5.10 | 4.74 | 2.75 | 2.66 | 3.04 | 0.21 | 3.68 | -0.26 | 2.49 | 2.56 | 5.08 | 2.74 | 3.13 | 6.10 | 6.39 | 4.96 | 5.27 | 9.28 | 6.60 | 8.13 | 8.94 | 6.66 | 8.39 | 7.00 | 6.01 | 9.88 | 6.10 | |
| Comprehensive Income Net Of Tax | 16.46 | 8.29 | 22.86 | 25.41 | 28.28 | -0.24 | 3.61 | 14.47 | 7.48 | 5.33 | 13.29 | 2.46 | 13.67 | 15.98 | 16.04 | -13.09 | 11.00 | 2.16 | 9.10 | 3.27 | 2.92 | 8.61 | -6.54 | 9.45 | -0.82 | 9.29 | 7.05 | 7.06 | -1.66 | 6.12 | 0.98 | 6.60 | 2.75 | -9.70 | 3.34 | -8.78 | -9.26 | -7.26 | 7.38 | 4.57 | 4.63 | 8.56 | -2.10 | 5.46 | 7.54 | 12.06 | -0.44 | 13.52 | 3.35 | -4.54 | 11.70 | 9.40 | NA | NA | NA |
| 2023-12-31 | 2023-09-30 | 2023-06-30 | 2023-03-31 | 2022-12-31 | 2022-09-30 | 2022-06-30 | 2022-03-31 | 2021-12-31 | 2021-09-30 | 2021-06-30 | 2021-03-31 | 2020-12-31 | 2020-09-30 | 2020-06-30 | 2020-03-31 | 2019-12-31 | 2019-09-30 | 2019-06-30 | 2019-03-31 | 2018-12-31 | 2018-09-30 | 2018-06-30 | 2018-03-31 | 2017-12-31 | 2017-09-30 | 2017-06-30 | 2017-03-31 | 2016-12-31 | 2016-09-30 | 2016-06-30 | 2016-03-31 | 2015-12-31 | 2015-09-30 | 2015-06-30 | 2015-03-31 | 2014-12-31 | 2014-09-30 | 2014-06-30 | 2014-03-31 | 2013-12-31 | 2013-09-30 | 2013-06-30 | 2013-03-31 | 2012-12-31 | 2012-09-30 | 2012-06-30 | 2012-03-31 | 2011-12-31 | 2011-09-30 | 2011-06-30 | 2011-03-31 | 2010-12-31 | 2010-09-30 | 2010-06-30 | ||
|---|---|---|---|---|---|---|---|---|---|---|---|---|---|---|---|---|---|---|---|---|---|---|---|---|---|---|---|---|---|---|---|---|---|---|---|---|---|---|---|---|---|---|---|---|---|---|---|---|---|---|---|---|---|---|---|---|
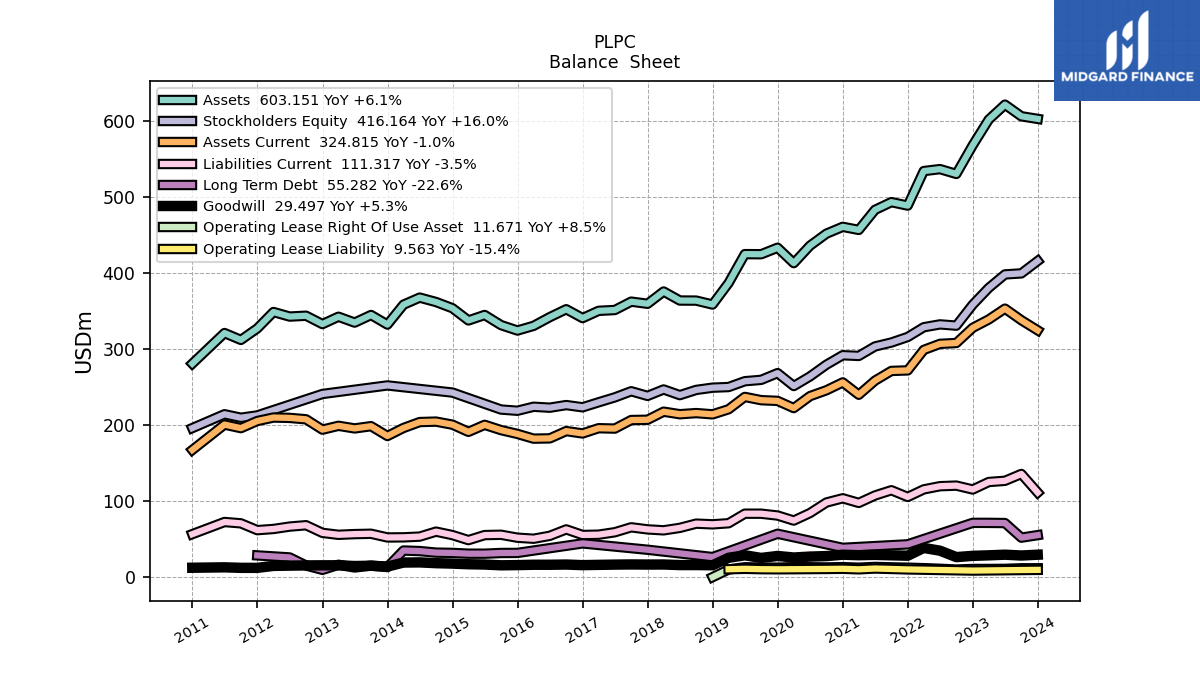
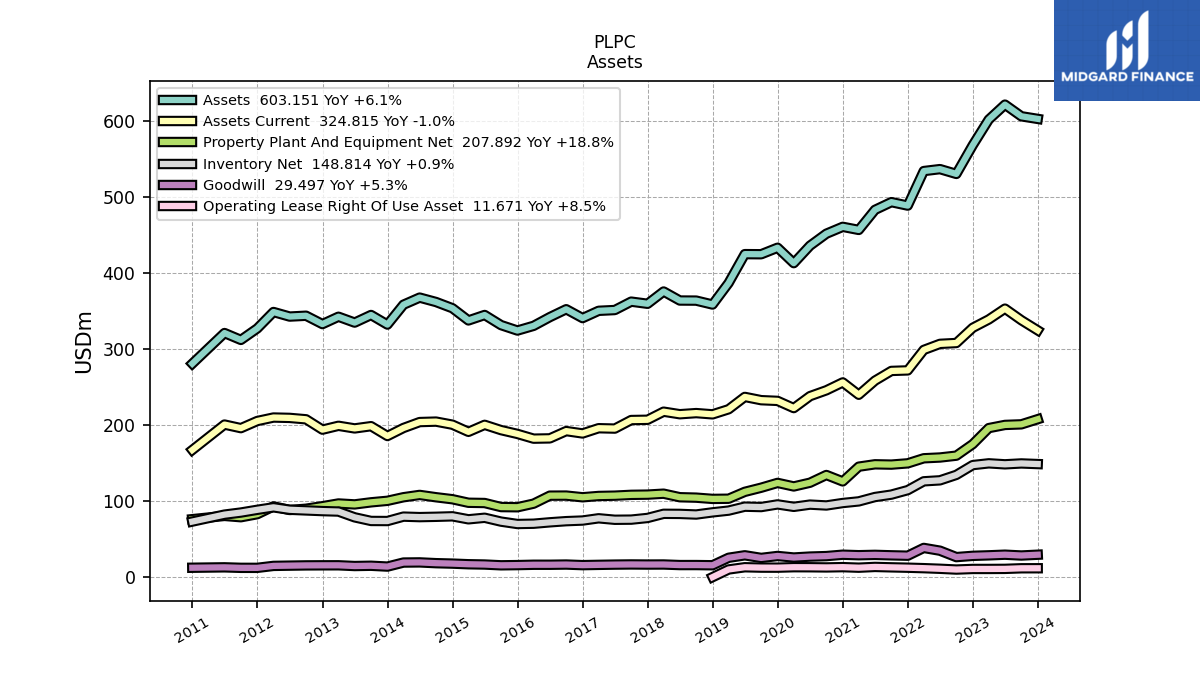
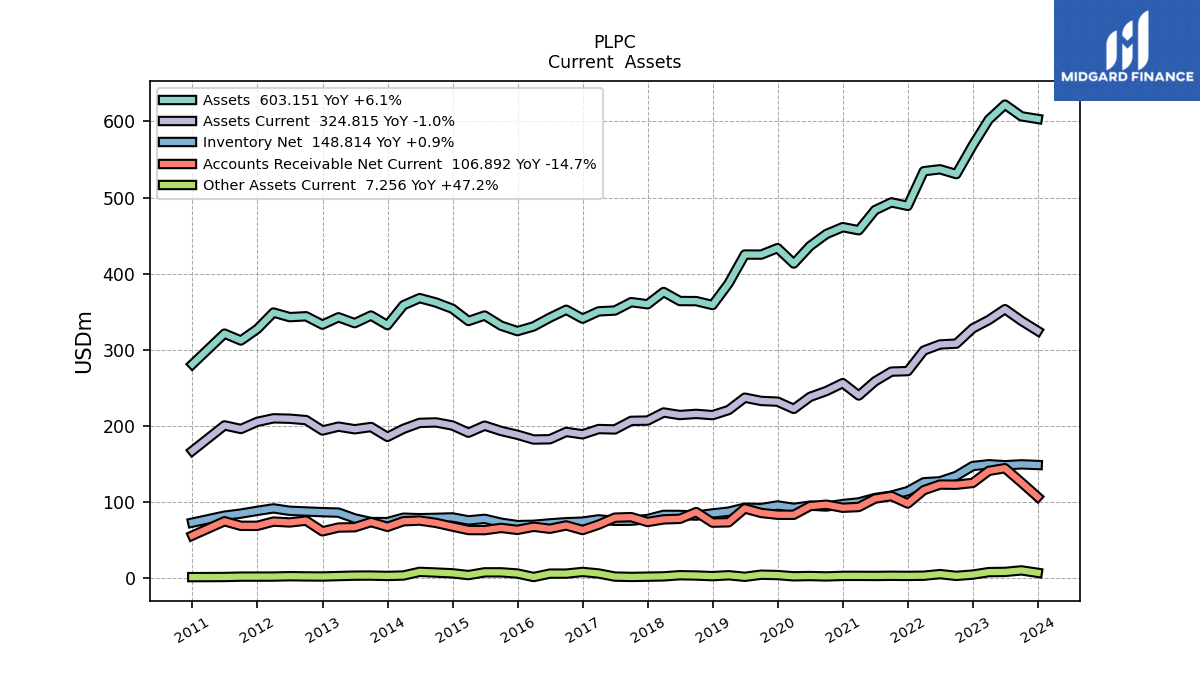
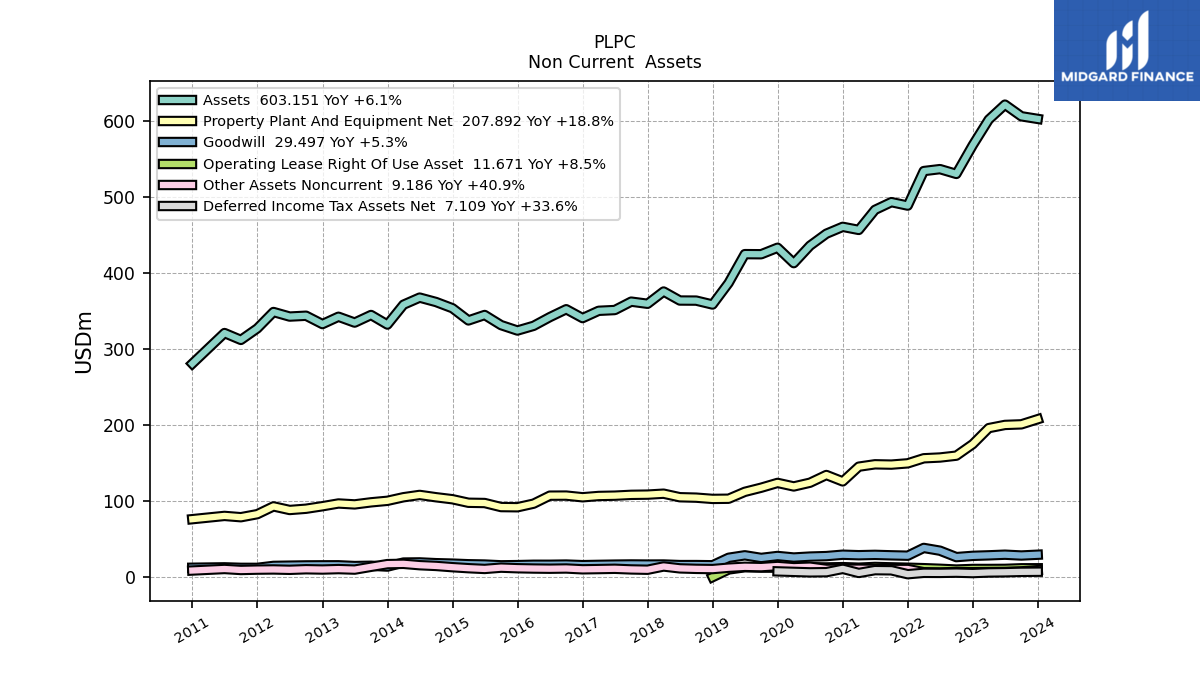
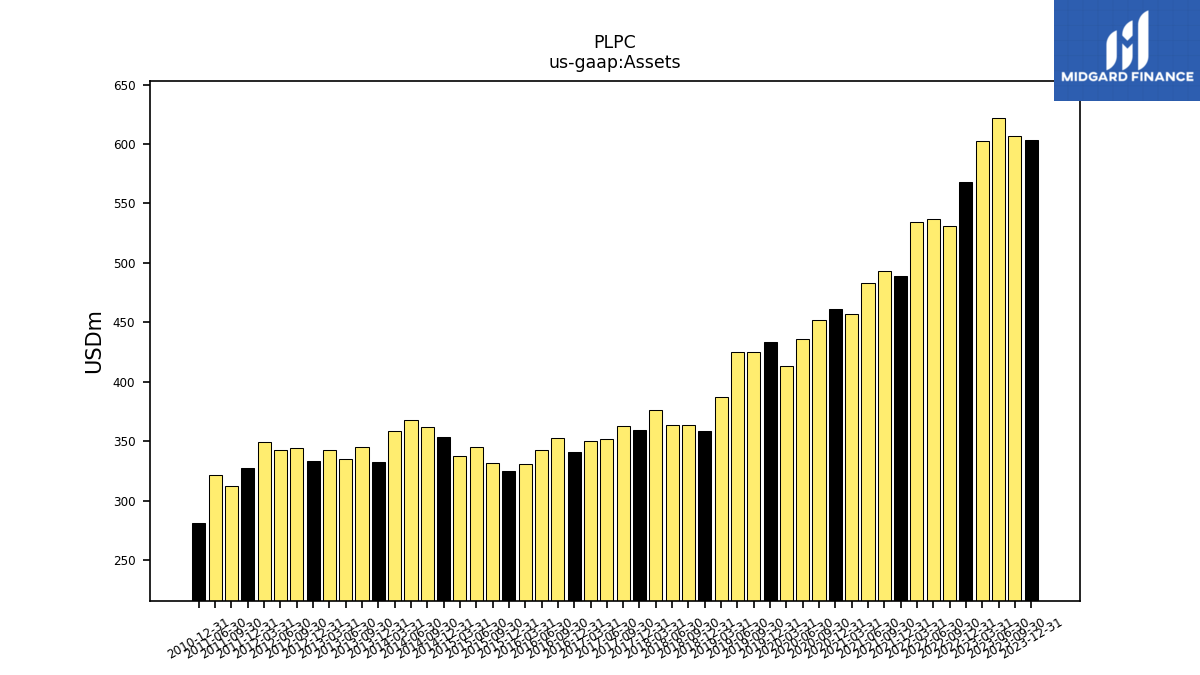
| Assets | 603.15 | 606.60 | 621.94 | 602.25 | 568.48 | 530.71 | 537.06 | 534.50 | 489.02 | 493.59 | 483.41 | 457.00 | 461.09 | 452.04 | 436.27 | 413.26 | 433.57 | 425.00 | 425.15 | 387.13 | 358.80 | 363.97 | 364.08 | 375.96 | 359.79 | 362.62 | 351.57 | 350.54 | 340.94 | 352.62 | 342.25 | 330.77 | 324.57 | 331.72 | 345.04 | 337.87 | 353.97 | 362.11 | 367.93 | 358.58 | 332.41 | 345.04 | 335.02 | 342.76 | 333.06 | 344.07 | 342.96 | 348.99 | 327.35 | 312.24 | 321.30 | NA | 280.98 | NA | NA | |
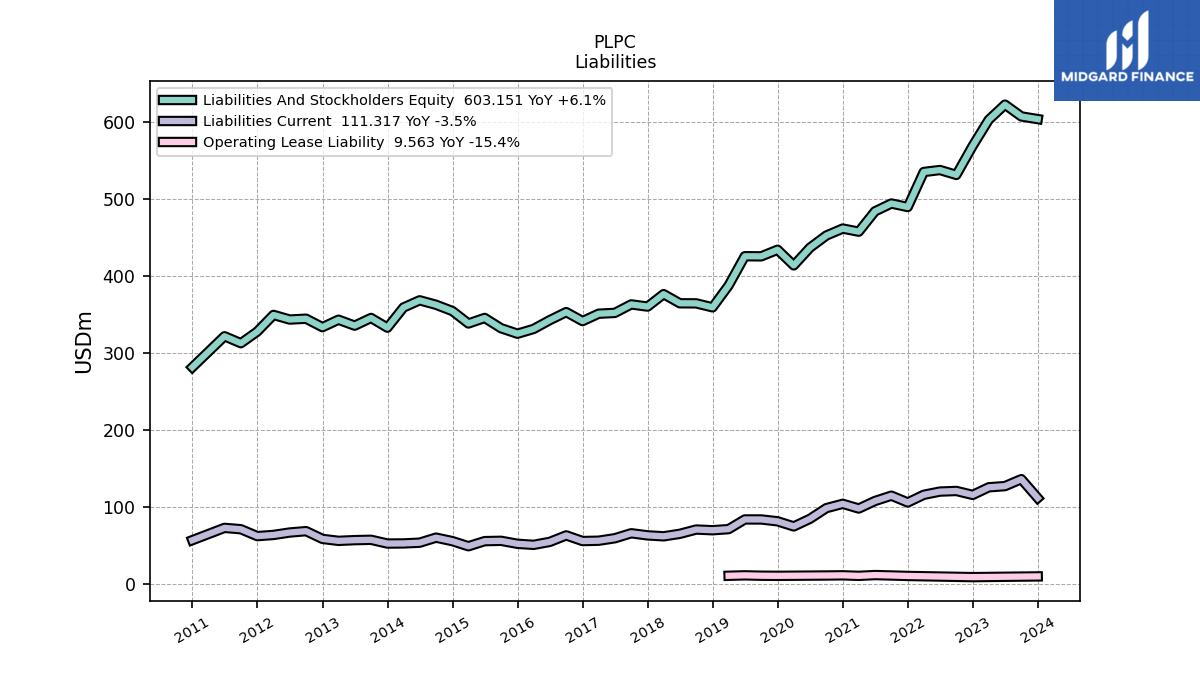
| Liabilities And Stockholders Equity | 603.15 | 606.60 | 621.94 | 602.25 | 568.48 | 530.71 | 537.06 | 534.50 | 489.02 | 493.59 | 483.41 | 457.00 | 461.09 | 452.04 | 436.27 | 413.26 | 433.57 | 425.00 | 425.15 | 387.13 | 358.80 | 363.97 | 364.08 | 375.96 | 359.79 | 362.62 | 351.57 | 350.54 | 340.94 | 352.62 | 342.25 | 330.77 | 324.57 | 331.72 | 345.04 | 337.87 | 353.97 | 362.11 | 367.93 | 358.58 | 332.41 | 345.04 | 335.02 | 342.76 | 333.06 | 344.07 | 342.96 | 348.99 | 327.35 | 312.24 | 321.30 | NA | 280.98 | NA | NA | |
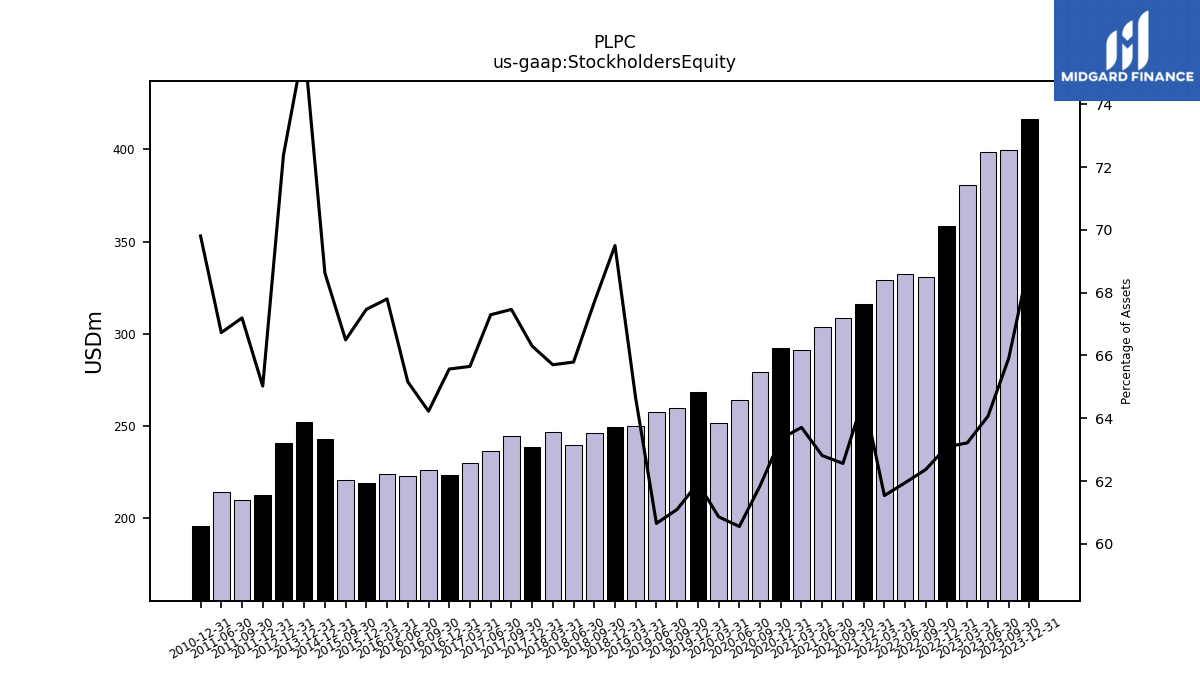
| Stockholders Equity | 416.16 | 399.81 | 398.45 | 380.71 | 358.64 | 331.00 | 332.68 | 328.91 | 316.12 | 308.79 | 303.63 | 291.15 | 292.08 | 279.57 | 264.16 | 251.51 | 268.54 | 259.66 | 257.85 | 250.20 | 249.37 | 246.41 | 239.53 | 247.02 | 238.54 | 244.65 | 236.60 | 230.13 | 223.54 | 226.47 | 223.02 | 224.27 | 218.98 | 220.59 | NA | NA | 242.93 | NA | NA | NA | 252.33 | NA | NA | NA | 241.07 | NA | NA | NA | 212.86 | 209.81 | 214.39 | NA | 196.14 | NA | NA |
| 2023-12-31 | 2023-09-30 | 2023-06-30 | 2023-03-31 | 2022-12-31 | 2022-09-30 | 2022-06-30 | 2022-03-31 | 2021-12-31 | 2021-09-30 | 2021-06-30 | 2021-03-31 | 2020-12-31 | 2020-09-30 | 2020-06-30 | 2020-03-31 | 2019-12-31 | 2019-09-30 | 2019-06-30 | 2019-03-31 | 2018-12-31 | 2018-09-30 | 2018-06-30 | 2018-03-31 | 2017-12-31 | 2017-09-30 | 2017-06-30 | 2017-03-31 | 2016-12-31 | 2016-09-30 | 2016-06-30 | 2016-03-31 | 2015-12-31 | 2015-09-30 | 2015-06-30 | 2015-03-31 | 2014-12-31 | 2014-09-30 | 2014-06-30 | 2014-03-31 | 2013-12-31 | 2013-09-30 | 2013-06-30 | 2013-03-31 | 2012-12-31 | 2012-09-30 | 2012-06-30 | 2012-03-31 | 2011-12-31 | 2011-09-30 | 2011-06-30 | 2011-03-31 | 2010-12-31 | 2010-09-30 | 2010-06-30 | ||
|---|---|---|---|---|---|---|---|---|---|---|---|---|---|---|---|---|---|---|---|---|---|---|---|---|---|---|---|---|---|---|---|---|---|---|---|---|---|---|---|---|---|---|---|---|---|---|---|---|---|---|---|---|---|---|---|---|
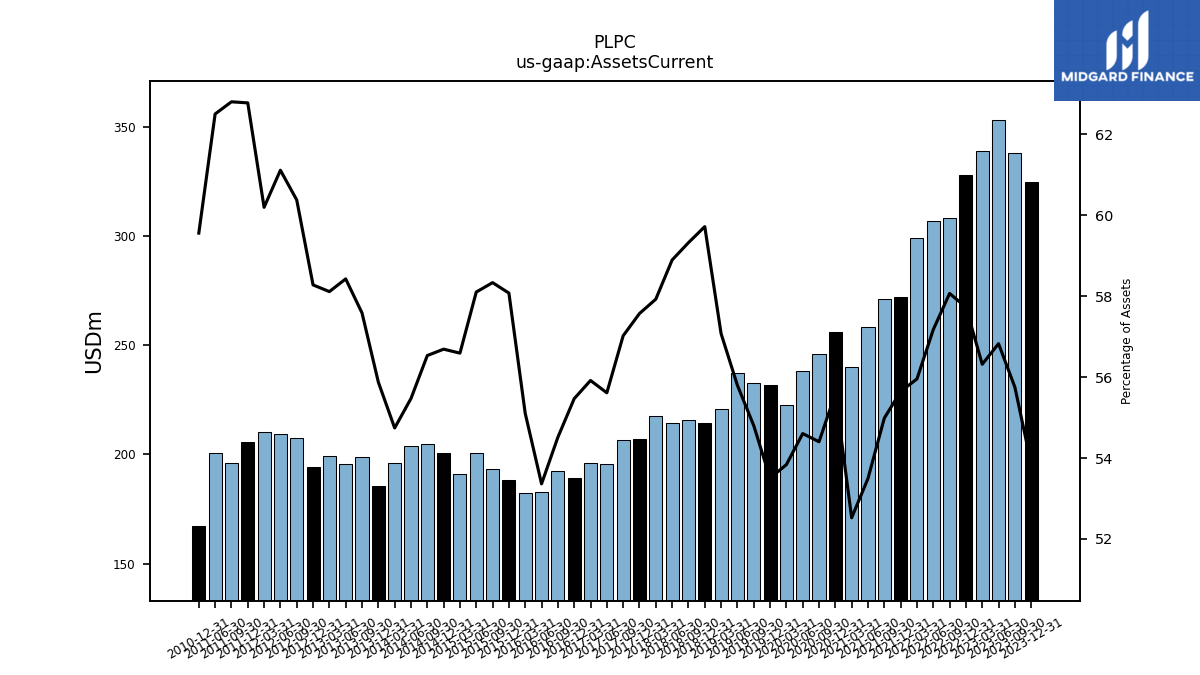
| Assets Current | 324.81 | 338.19 | 353.42 | 339.17 | 328.17 | 308.17 | 307.05 | 299.08 | 272.11 | 271.40 | 258.60 | 240.04 | 256.31 | 245.92 | 238.22 | 222.48 | 231.97 | 232.91 | 237.22 | 220.95 | 214.26 | 215.91 | 214.42 | 217.78 | 207.13 | 206.77 | 195.52 | 196.01 | 189.11 | 192.22 | 182.63 | 182.26 | 188.50 | 193.50 | 200.47 | 191.21 | 200.66 | 204.71 | 204.10 | 196.30 | 185.73 | 198.69 | 195.74 | 199.18 | 194.10 | 207.74 | 209.59 | 210.07 | 205.49 | 196.09 | 200.81 | NA | 167.34 | NA | NA | |
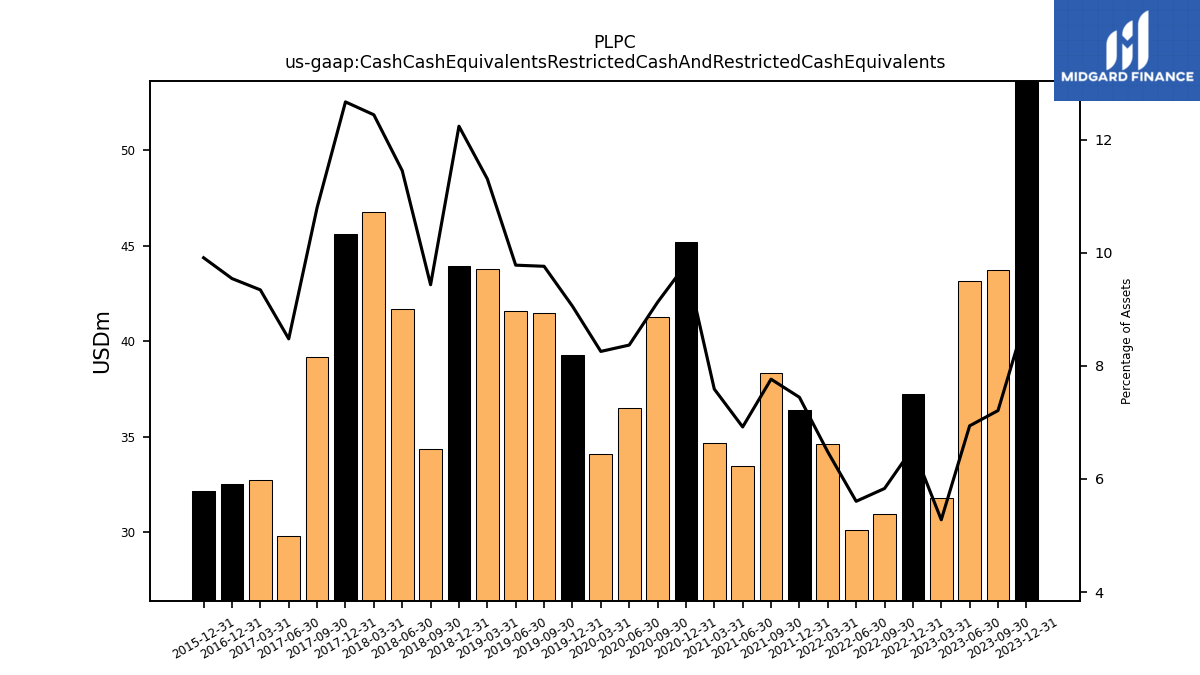
| Cash Cash Equivalents Restricted Cash And Restricted Cash Equivalents | 53.61 | 43.74 | 43.16 | 31.79 | 37.24 | 30.95 | 30.10 | 34.63 | 36.41 | 38.33 | 33.45 | 34.69 | 45.17 | 41.25 | 36.51 | 34.12 | 39.26 | 41.48 | 41.59 | 43.77 | 43.91 | 34.34 | 41.70 | 46.77 | 45.58 | 39.16 | 29.81 | 32.76 | 32.54 | NA | NA | NA | 32.17 | NA | NA | NA | NA | NA | NA | NA | NA | NA | NA | NA | NA | NA | NA | NA | NA | NA | NA | NA | NA | NA | NA | |
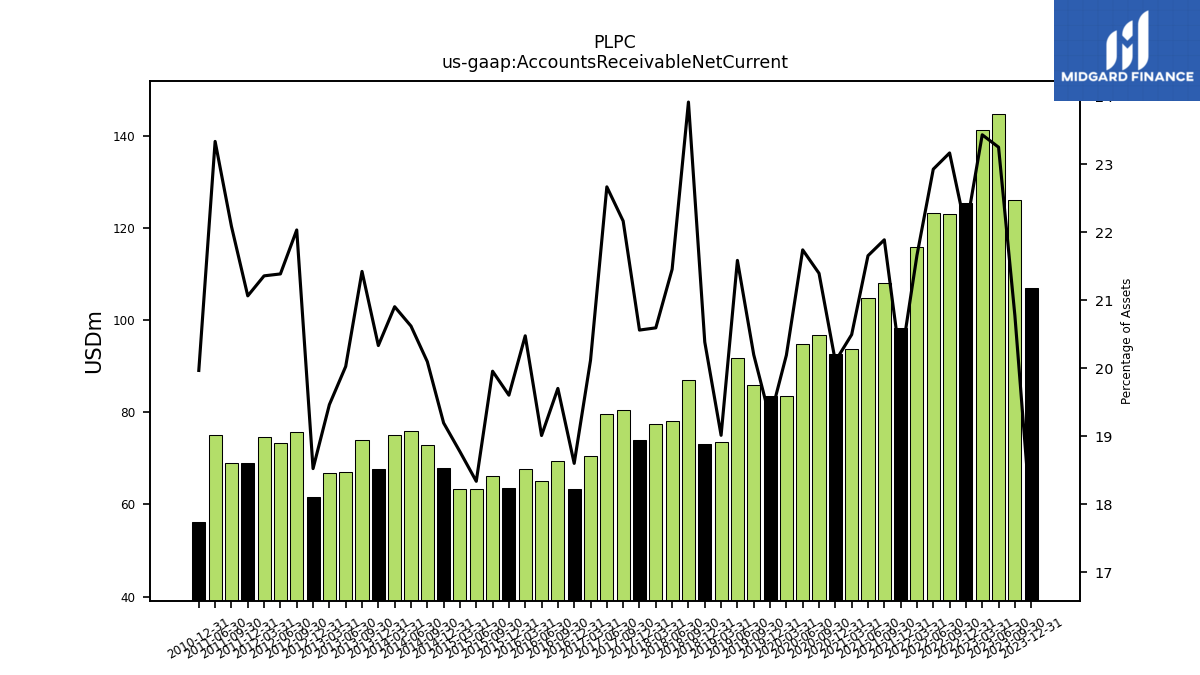
| Accounts Receivable Net Current | 106.89 | 126.02 | 144.59 | 141.11 | 125.26 | 122.94 | 123.12 | 115.76 | 98.20 | 108.03 | 104.67 | 93.65 | 92.69 | 96.71 | 94.84 | 83.44 | 83.52 | 85.84 | 91.77 | 73.60 | 73.14 | 87.03 | 78.11 | 77.42 | 73.97 | 80.37 | 79.69 | 70.51 | 63.41 | 69.47 | 65.06 | 67.73 | 63.63 | 66.19 | 63.27 | 63.43 | 67.94 | 72.77 | 75.86 | 74.96 | 67.59 | 73.92 | 67.09 | 66.71 | 61.70 | 75.81 | 73.34 | 74.53 | 68.95 | 68.96 | 74.97 | NA | 56.10 | NA | NA | |
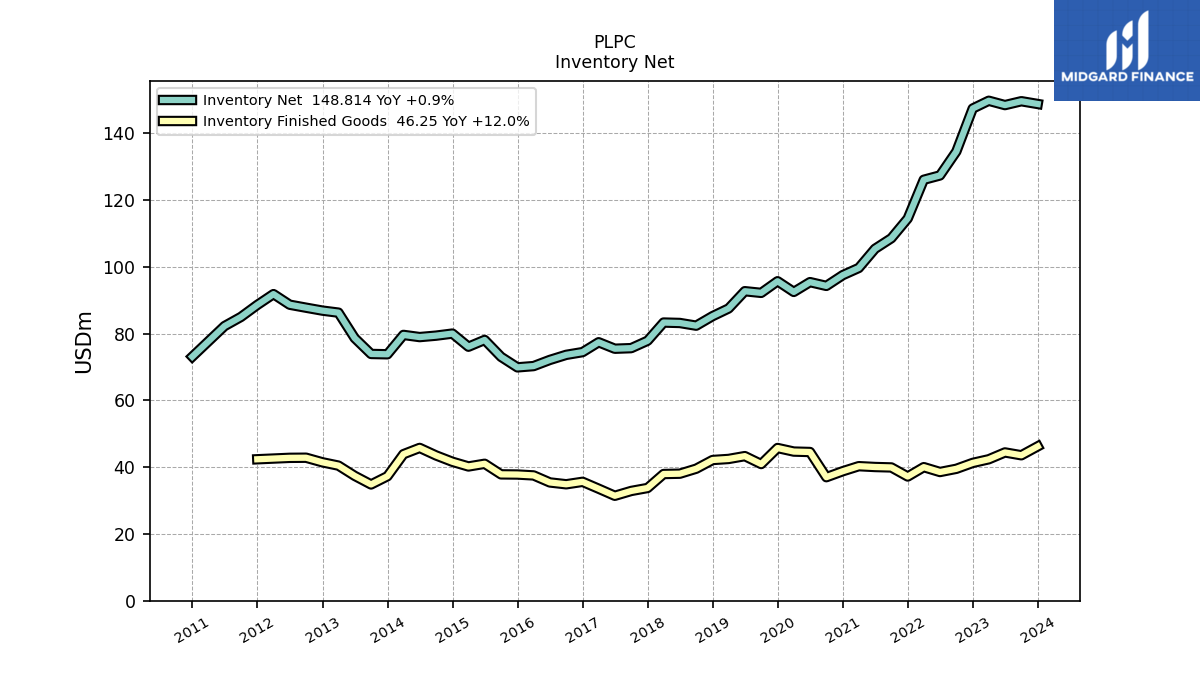
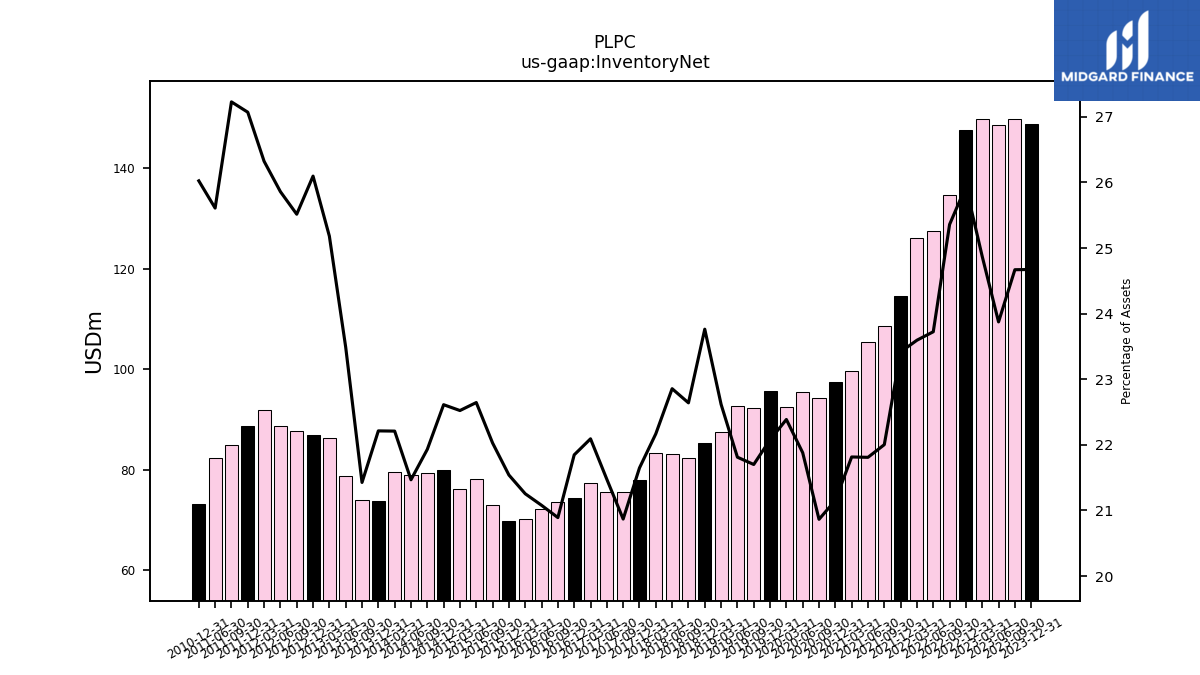
| Inventory Net | 148.81 | 149.64 | 148.48 | 149.78 | 147.46 | 134.58 | 127.41 | 126.11 | 114.51 | 108.60 | 105.43 | 99.69 | 97.54 | 94.31 | 95.45 | 92.51 | 95.72 | 92.23 | 92.73 | 87.56 | 85.26 | 82.40 | 83.21 | 83.34 | 77.89 | 75.67 | 75.50 | 77.44 | 74.48 | 73.67 | 72.14 | 70.30 | 69.91 | 73.07 | 78.13 | 76.10 | 80.04 | 79.42 | 78.99 | 79.64 | 73.83 | 73.93 | 78.69 | 86.31 | 86.92 | 87.79 | 88.69 | 91.86 | 88.61 | 85.01 | 82.28 | NA | 73.12 | NA | NA | |
| Inventory Finished Goods | 46.25 | 43.58 | 44.43 | 42.38 | 41.30 | 39.53 | 38.56 | 40.03 | 37.22 | 39.93 | 40.06 | 40.31 | 38.80 | 37.02 | 44.56 | 44.69 | 45.76 | 40.95 | 43.33 | 42.48 | 42.16 | 39.56 | 38.06 | 37.97 | 33.78 | 32.89 | 31.44 | 33.57 | 35.63 | 34.89 | 35.44 | 37.54 | 37.81 | 37.86 | 41.03 | 40.23 | 41.63 | 43.53 | 45.79 | 43.91 | 37.30 | 34.84 | 37.42 | 40.48 | 41.47 | 42.85 | 42.81 | NA | 42.38 | NA | NA | NA | NA | NA | NA | |
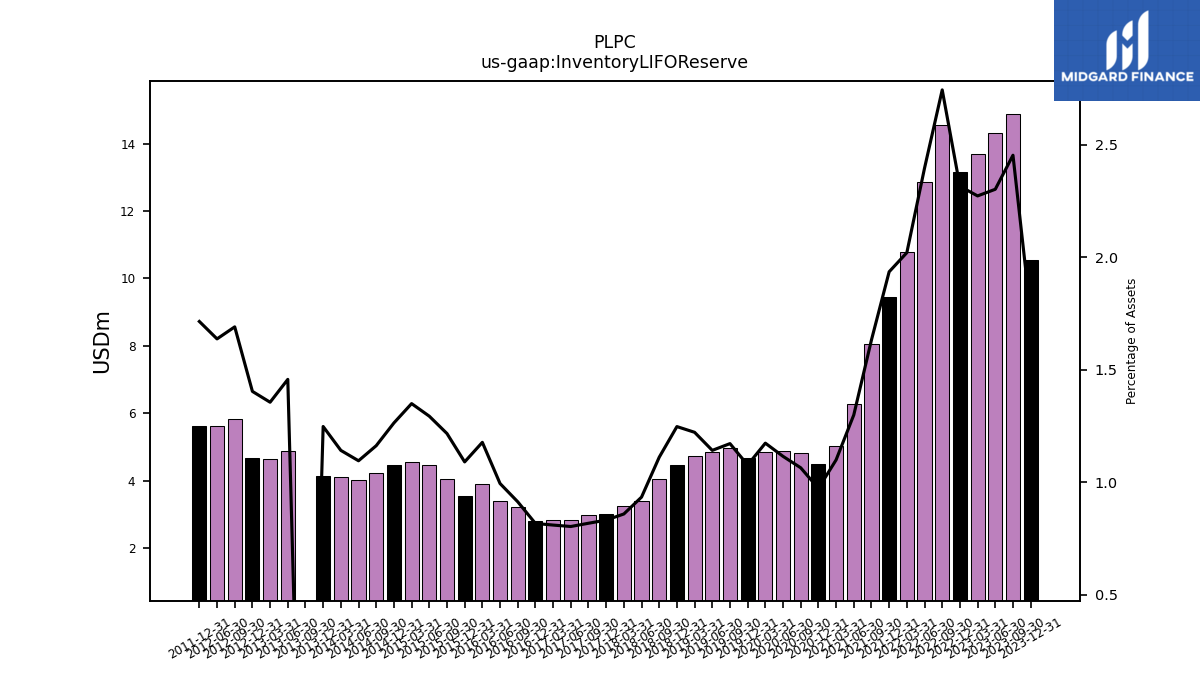
| Inventory L I F O Reserve | 10.54 | 14.88 | 14.31 | 13.68 | 13.16 | 14.56 | 12.86 | 10.80 | 9.46 | 8.06 | 6.28 | 5.02 | 4.48 | 4.81 | 4.86 | 4.85 | 4.67 | 4.98 | 4.85 | 4.73 | 4.47 | 4.04 | 3.40 | 3.23 | 2.99 | 2.96 | 2.82 | 2.84 | 2.78 | 3.22 | 3.40 | 3.89 | 3.54 | 4.03 | 4.46 | 4.56 | 4.47 | 4.21 | 4.03 | 4.09 | 4.15 | -4.83 | 4.88 | 4.64 | 4.67 | 5.82 | 5.61 | NA | 5.61 | NA | NA | NA | NA | NA | NA | |
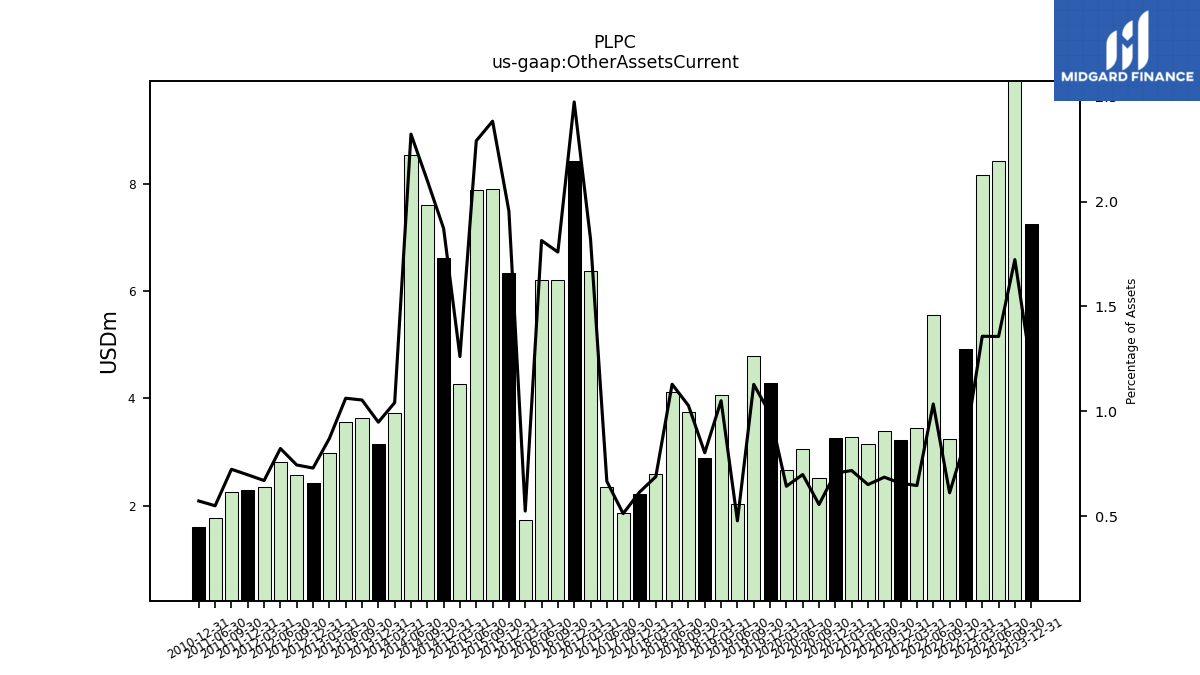
| Other Assets Current | 7.26 | 10.45 | 8.44 | 8.18 | 4.93 | 3.25 | 5.56 | 3.46 | 3.22 | 3.39 | 3.15 | 3.28 | 3.26 | 2.52 | 3.05 | 2.66 | 4.29 | 4.80 | 2.04 | 4.07 | 2.88 | 3.74 | 4.11 | 2.59 | 2.21 | 1.86 | 2.35 | 6.38 | 8.44 | 6.20 | 6.21 | 1.74 | 6.34 | 7.90 | 7.90 | 4.26 | 6.62 | 7.61 | 8.54 | 3.74 | 3.15 | 3.64 | 3.56 | 2.99 | 2.43 | 2.56 | 2.82 | 2.34 | 2.29 | 2.26 | 1.77 | NA | 1.61 | NA | NA |
| 2023-12-31 | 2023-09-30 | 2023-06-30 | 2023-03-31 | 2022-12-31 | 2022-09-30 | 2022-06-30 | 2022-03-31 | 2021-12-31 | 2021-09-30 | 2021-06-30 | 2021-03-31 | 2020-12-31 | 2020-09-30 | 2020-06-30 | 2020-03-31 | 2019-12-31 | 2019-09-30 | 2019-06-30 | 2019-03-31 | 2018-12-31 | 2018-09-30 | 2018-06-30 | 2018-03-31 | 2017-12-31 | 2017-09-30 | 2017-06-30 | 2017-03-31 | 2016-12-31 | 2016-09-30 | 2016-06-30 | 2016-03-31 | 2015-12-31 | 2015-09-30 | 2015-06-30 | 2015-03-31 | 2014-12-31 | 2014-09-30 | 2014-06-30 | 2014-03-31 | 2013-12-31 | 2013-09-30 | 2013-06-30 | 2013-03-31 | 2012-12-31 | 2012-09-30 | 2012-06-30 | 2012-03-31 | 2011-12-31 | 2011-09-30 | 2011-06-30 | 2011-03-31 | 2010-12-31 | 2010-09-30 | 2010-06-30 | ||
|---|---|---|---|---|---|---|---|---|---|---|---|---|---|---|---|---|---|---|---|---|---|---|---|---|---|---|---|---|---|---|---|---|---|---|---|---|---|---|---|---|---|---|---|---|---|---|---|---|---|---|---|---|---|---|---|---|
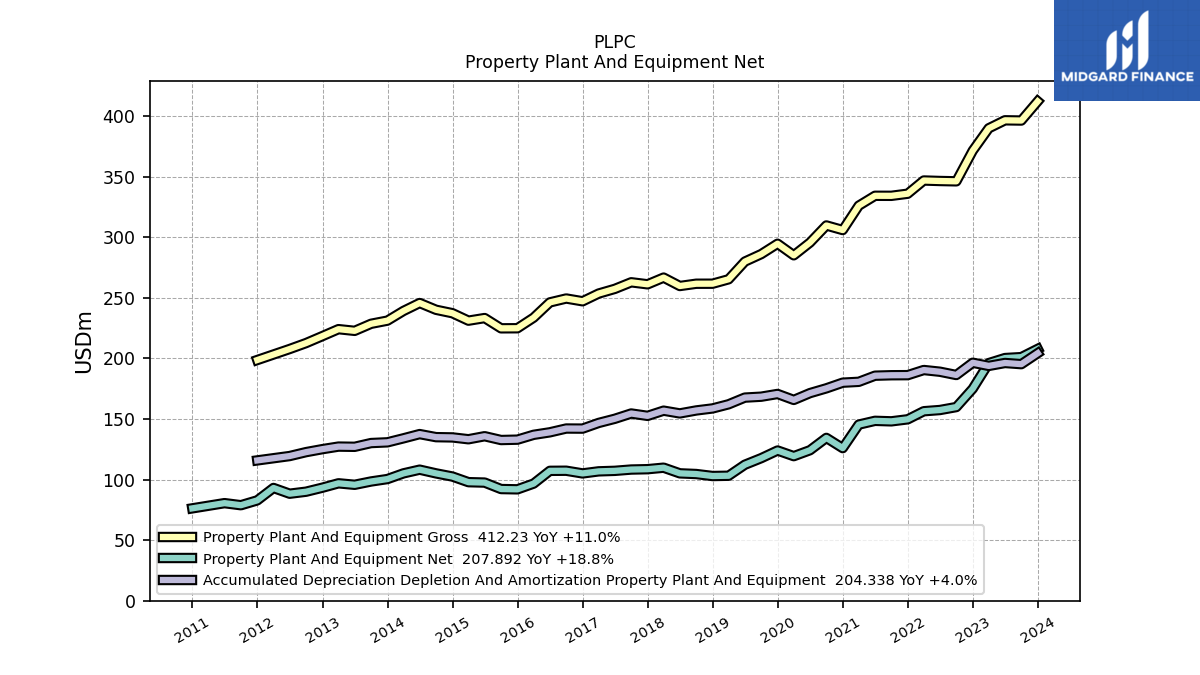
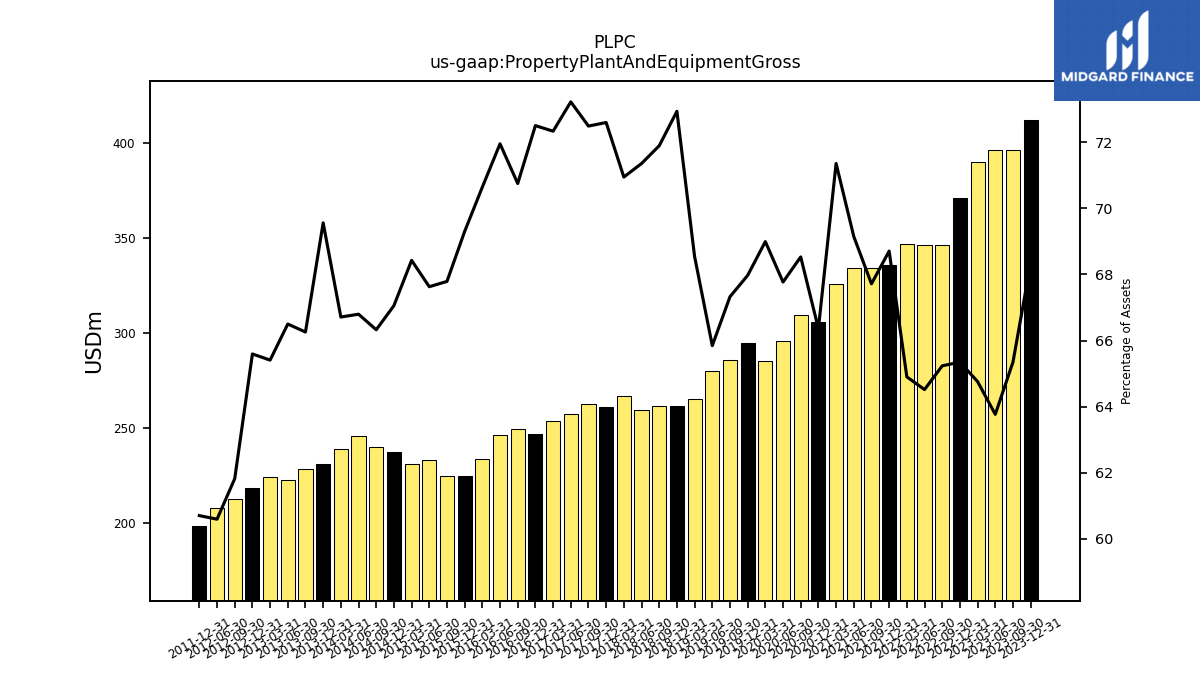
| Property Plant And Equipment Gross | 412.23 | 396.39 | 396.59 | 390.00 | 371.48 | 346.21 | 346.49 | 346.89 | 335.99 | 334.25 | 334.28 | 326.12 | 305.98 | 309.79 | 295.66 | 285.13 | 294.71 | 286.13 | 279.95 | 265.36 | 261.70 | 261.68 | 259.80 | 266.74 | 261.20 | 262.88 | 257.44 | 253.57 | 247.20 | 249.49 | 246.26 | 233.67 | 224.94 | 224.87 | 233.35 | 231.19 | 237.35 | 240.18 | 245.77 | 239.22 | 231.23 | 228.62 | 222.79 | 224.19 | 218.47 | 212.70 | 207.81 | NA | 198.70 | NA | NA | NA | NA | NA | NA | |
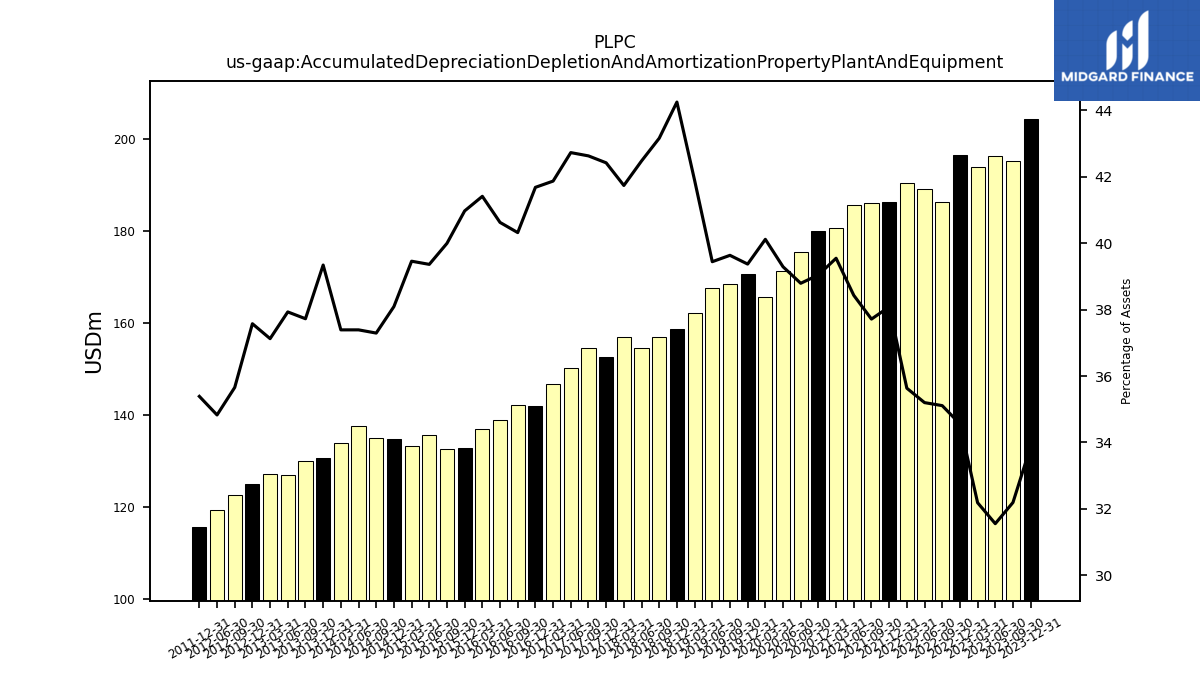
| Accumulated Depreciation Depletion And Amortization Property Plant And Equipment | 204.34 | 195.29 | 196.26 | 193.85 | 196.47 | 186.33 | 189.04 | 190.46 | 186.22 | 186.15 | 185.76 | 180.72 | 180.02 | 175.35 | 171.40 | 165.77 | 170.69 | 168.44 | 167.68 | 162.17 | 158.75 | 157.07 | 154.63 | 156.91 | 152.61 | 154.57 | 150.20 | 146.76 | 142.10 | 142.16 | 139.03 | 136.97 | 132.97 | 132.66 | 135.81 | 133.31 | 134.82 | 135.04 | 137.57 | 134.07 | 130.77 | 130.16 | 127.07 | 127.25 | 125.14 | 122.68 | 119.45 | NA | 115.84 | NA | NA | NA | NA | NA | NA | |
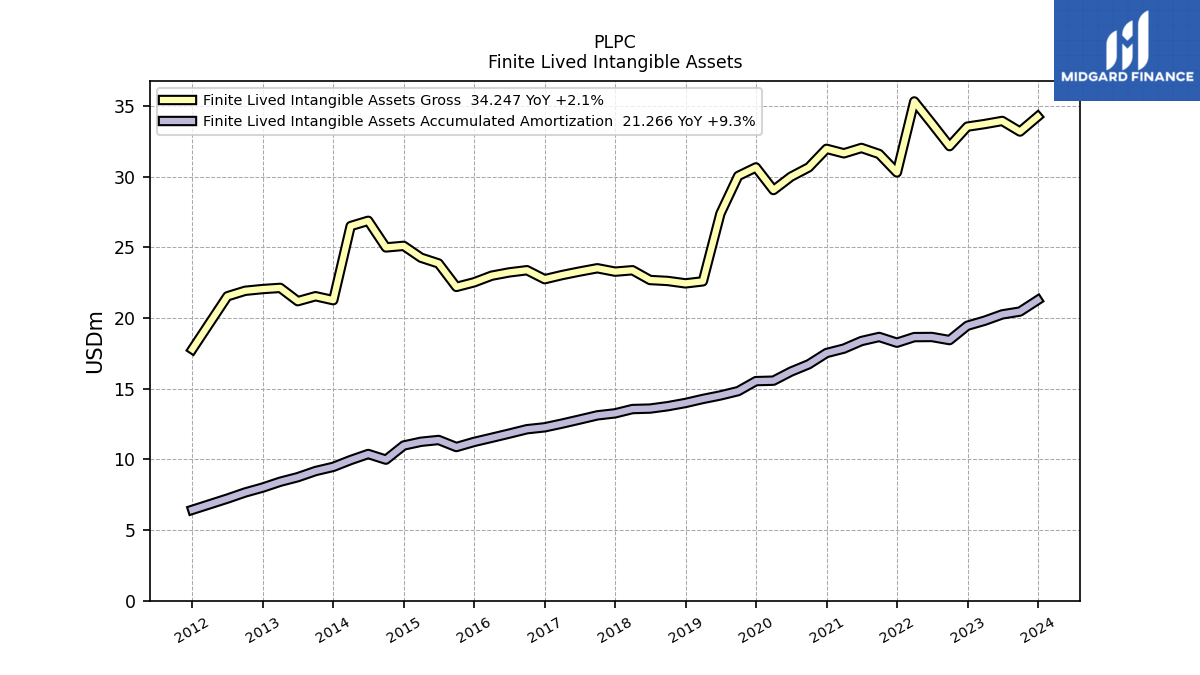
| Amortization Of Intangible Assets | 0.40 | 0.50 | 0.50 | 0.60 | 0.50 | 0.50 | 0.50 | 0.40 | 0.50 | 0.50 | 0.50 | 0.50 | 0.50 | 0.50 | 0.40 | 0.40 | 0.40 | 0.50 | 0.30 | 0.30 | 0.20 | 0.30 | 0.30 | 0.30 | 0.20 | 0.30 | 0.30 | 0.30 | 0.20 | 0.30 | 0.20 | 0.30 | 0.30 | 0.30 | 0.30 | 0.40 | 0.40 | 0.40 | 0.40 | 0.40 | 0.30 | 0.40 | 0.40 | 0.40 | 0.40 | 0.40 | 0.40 | 0.40 | 0.20 | 0.30 | 0.30 | NA | NA | NA | NA | |
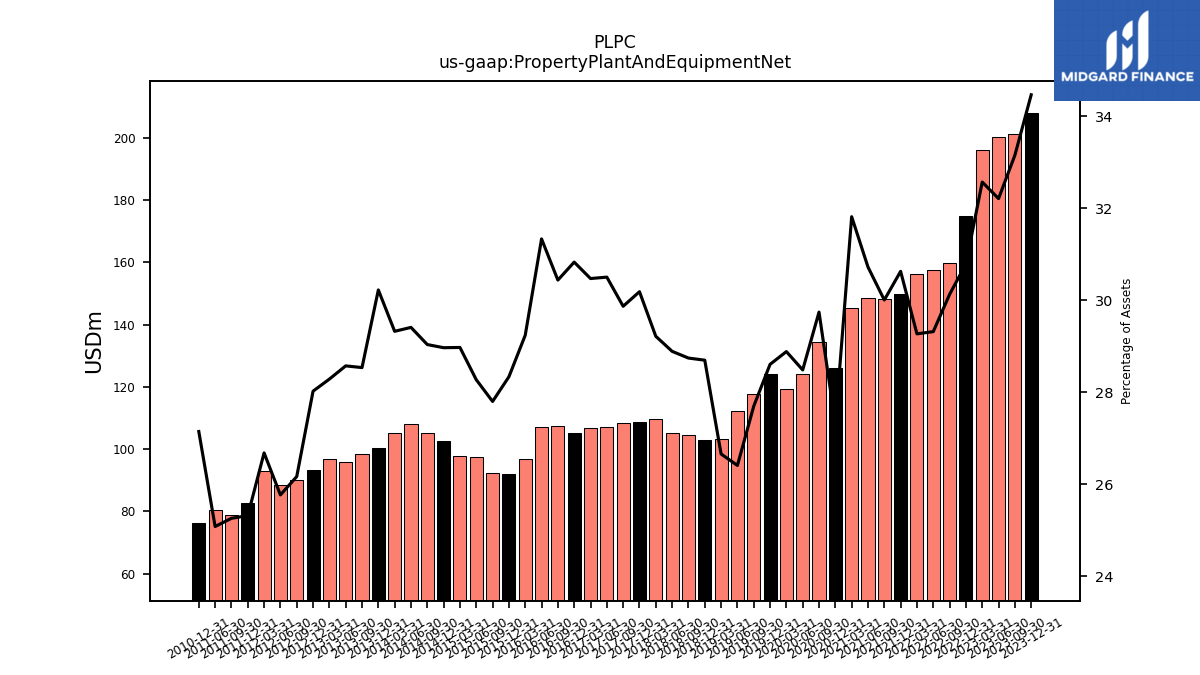
| Property Plant And Equipment Net | 207.89 | 201.10 | 200.32 | 196.15 | 175.01 | 159.88 | 157.44 | 156.43 | 149.77 | 148.10 | 148.51 | 145.40 | 125.97 | 134.44 | 124.26 | 119.36 | 124.02 | 117.70 | 112.26 | 103.19 | 102.95 | 104.61 | 105.17 | 109.84 | 108.60 | 108.31 | 107.23 | 106.81 | 105.10 | 107.33 | 107.23 | 96.71 | 91.97 | 92.21 | 97.54 | 97.89 | 102.53 | 105.14 | 108.20 | 105.15 | 100.46 | 98.45 | 95.72 | 96.94 | 93.33 | 90.02 | 88.36 | 93.10 | 82.86 | 78.86 | 80.57 | NA | 76.27 | NA | NA | |
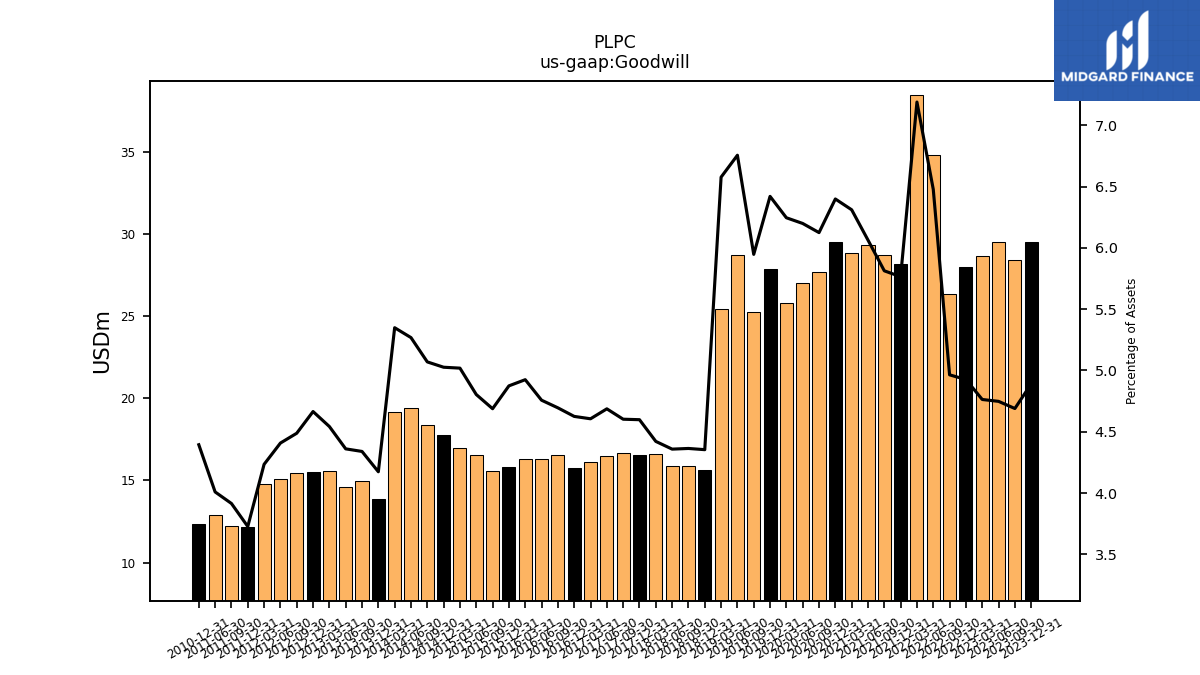
| Goodwill | 29.50 | 28.45 | 29.53 | 28.69 | 28.00 | 26.35 | 34.79 | 38.44 | 28.19 | 28.70 | 29.32 | 28.84 | 29.51 | 27.69 | 27.05 | 25.81 | 27.84 | 25.28 | 28.73 | 25.46 | 15.62 | 15.88 | 15.87 | 16.62 | 16.54 | 16.69 | 16.48 | 16.14 | 15.77 | 16.56 | 16.28 | 16.29 | 15.82 | 15.55 | 16.57 | 16.96 | 17.79 | 18.36 | 19.38 | 19.18 | 13.87 | 14.97 | 14.61 | 15.57 | 15.54 | 15.44 | 15.12 | 14.78 | 12.20 | 12.22 | 12.88 | NA | 12.35 | NA | NA | |
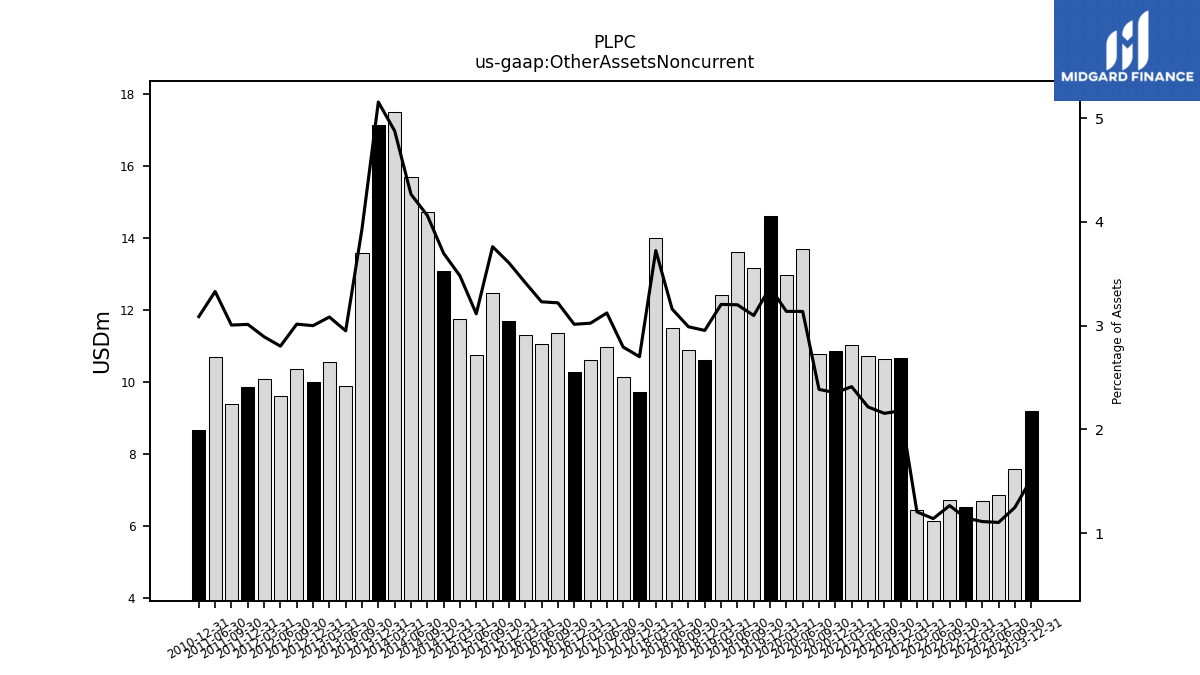
| Other Assets Noncurrent | 9.19 | 7.58 | 6.87 | 6.70 | 6.52 | 6.72 | 6.13 | 6.45 | 10.66 | 10.64 | 10.72 | 11.03 | 10.86 | 10.79 | 13.69 | 12.97 | 14.61 | 13.17 | 13.61 | 12.41 | 10.60 | 10.88 | 11.51 | 14.00 | 9.72 | 10.13 | 10.98 | 10.60 | 10.27 | 11.36 | 11.05 | 11.30 | 11.70 | 12.48 | 10.75 | 11.76 | 13.09 | 14.71 | 15.70 | 17.49 | 17.14 | 13.57 | 9.88 | 10.57 | 9.99 | 10.37 | 9.61 | 10.10 | 9.86 | 9.38 | 10.70 | NA | 8.68 | NA | NA |
| 2023-12-31 | 2023-09-30 | 2023-06-30 | 2023-03-31 | 2022-12-31 | 2022-09-30 | 2022-06-30 | 2022-03-31 | 2021-12-31 | 2021-09-30 | 2021-06-30 | 2021-03-31 | 2020-12-31 | 2020-09-30 | 2020-06-30 | 2020-03-31 | 2019-12-31 | 2019-09-30 | 2019-06-30 | 2019-03-31 | 2018-12-31 | 2018-09-30 | 2018-06-30 | 2018-03-31 | 2017-12-31 | 2017-09-30 | 2017-06-30 | 2017-03-31 | 2016-12-31 | 2016-09-30 | 2016-06-30 | 2016-03-31 | 2015-12-31 | 2015-09-30 | 2015-06-30 | 2015-03-31 | 2014-12-31 | 2014-09-30 | 2014-06-30 | 2014-03-31 | 2013-12-31 | 2013-09-30 | 2013-06-30 | 2013-03-31 | 2012-12-31 | 2012-09-30 | 2012-06-30 | 2012-03-31 | 2011-12-31 | 2011-09-30 | 2011-06-30 | 2011-03-31 | 2010-12-31 | 2010-09-30 | 2010-06-30 | ||
|---|---|---|---|---|---|---|---|---|---|---|---|---|---|---|---|---|---|---|---|---|---|---|---|---|---|---|---|---|---|---|---|---|---|---|---|---|---|---|---|---|---|---|---|---|---|---|---|---|---|---|---|---|---|---|---|---|
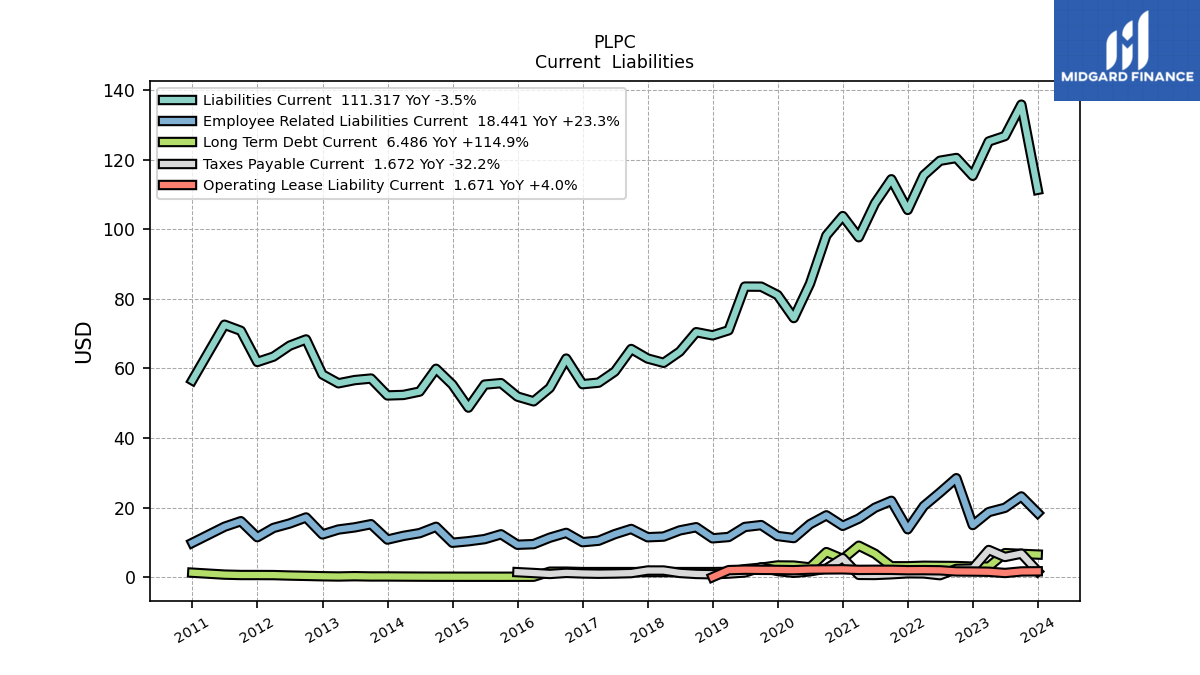
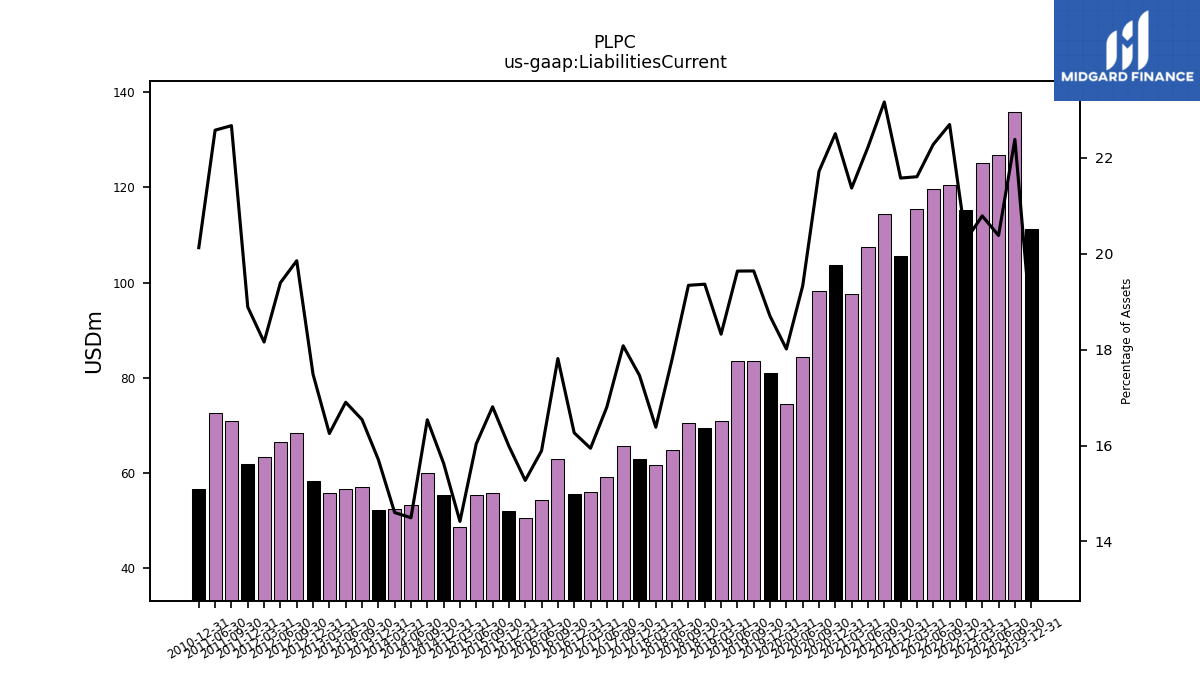
| Liabilities Current | 111.32 | 135.80 | 126.77 | 125.22 | 115.33 | 120.46 | 119.67 | 115.50 | 105.53 | 114.36 | 107.45 | 97.67 | 103.77 | 98.19 | 84.34 | 74.45 | 81.07 | 83.48 | 83.50 | 70.94 | 69.49 | 70.40 | 64.82 | 61.59 | 62.83 | 65.57 | 59.08 | 55.89 | 55.45 | 62.82 | 54.39 | 50.52 | 51.89 | 55.76 | 55.34 | 48.72 | 55.33 | 59.88 | 53.33 | 52.36 | 52.22 | 57.08 | 56.63 | 55.70 | 58.24 | 68.32 | 66.53 | 63.38 | 61.83 | 70.80 | 72.55 | NA | 56.56 | NA | NA | |
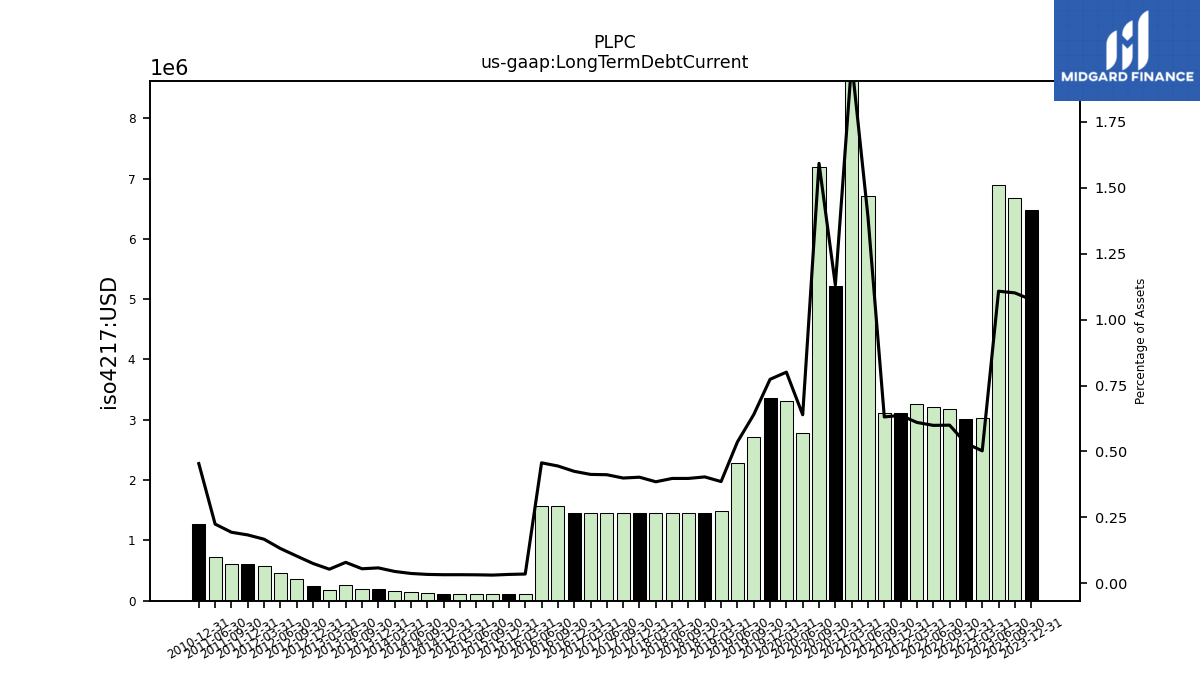
| Long Term Debt Current | 6.49 | 6.68 | 6.89 | 3.03 | 3.02 | 3.18 | 3.22 | 3.26 | 3.12 | 3.11 | 6.72 | 9.03 | 5.22 | 7.20 | 2.79 | 3.31 | 3.35 | 2.72 | 2.28 | 1.49 | 1.45 | 1.45 | 1.45 | 1.45 | 1.45 | 1.45 | 1.45 | 1.45 | 1.45 | 1.57 | 1.56 | 0.12 | 0.11 | 0.10 | 0.11 | 0.11 | 0.12 | 0.12 | 0.14 | 0.16 | 0.20 | 0.19 | 0.27 | 0.18 | 0.25 | 0.36 | 0.45 | 0.58 | 0.60 | 0.60 | 0.72 | NA | 1.28 | NA | NA | |
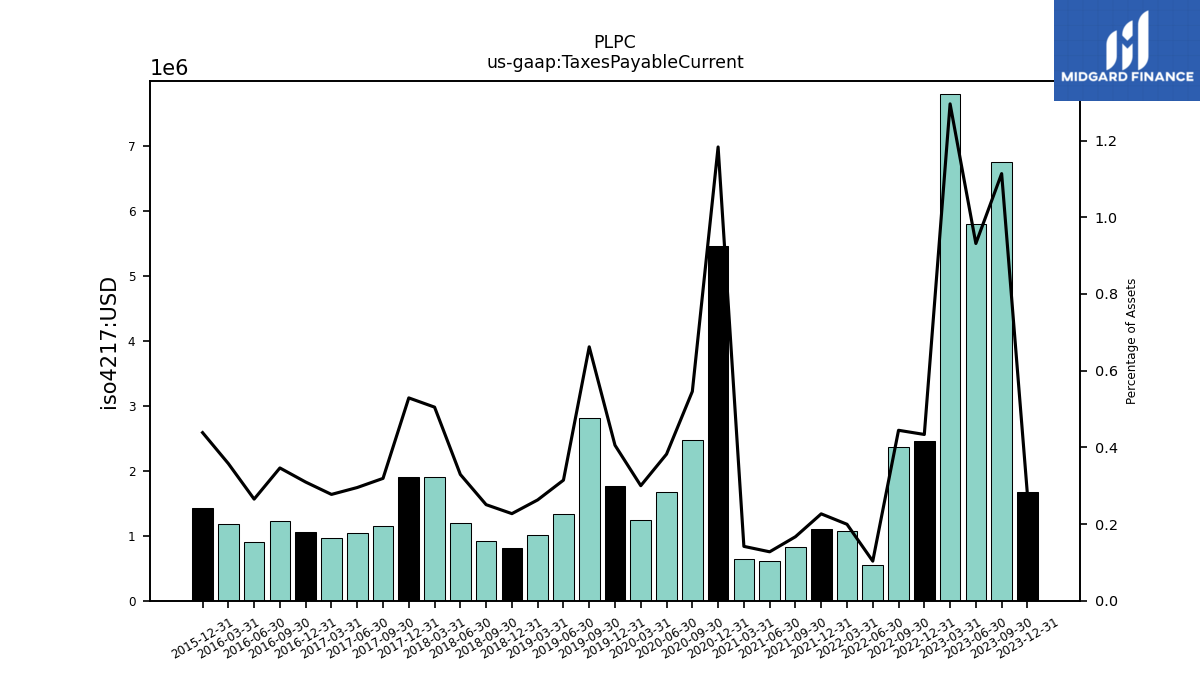
| Taxes Payable Current | 1.67 | 6.76 | 5.79 | 7.80 | 2.46 | 2.36 | 0.56 | 1.07 | 1.11 | 0.82 | 0.62 | 0.65 | 5.46 | 2.47 | 1.67 | 1.24 | 1.76 | 2.81 | 1.34 | 1.02 | 0.81 | 0.91 | 1.20 | 1.90 | 1.90 | 1.16 | 1.04 | 0.97 | 1.05 | 1.22 | 0.91 | 1.18 | 1.42 | NA | NA | NA | NA | NA | NA | NA | NA | NA | NA | NA | NA | NA | NA | NA | NA | NA | NA | NA | NA | NA | NA | |
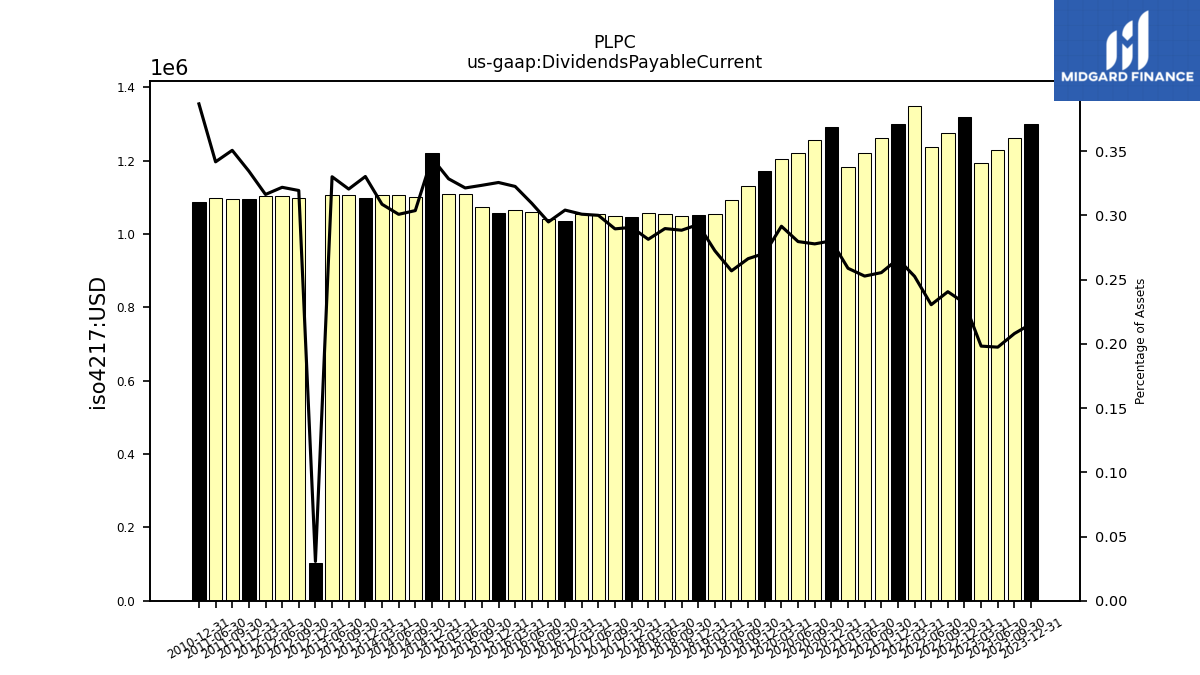
| Dividends Payable Current | 1.30 | 1.26 | 1.23 | 1.19 | 1.32 | 1.28 | 1.24 | 1.35 | 1.30 | 1.26 | 1.22 | 1.18 | 1.29 | 1.26 | 1.22 | 1.21 | 1.17 | 1.13 | 1.09 | 1.05 | 1.05 | 1.05 | 1.05 | 1.06 | 1.05 | 1.05 | 1.05 | 1.05 | 1.04 | 1.04 | 1.06 | 1.07 | 1.06 | 1.07 | 1.11 | 1.11 | 1.22 | 1.10 | 1.11 | 1.11 | 1.10 | 1.11 | 1.11 | NA | 0.10 | 1.10 | 1.10 | 1.10 | 1.09 | 1.09 | 1.10 | NA | 1.09 | NA | NA | |
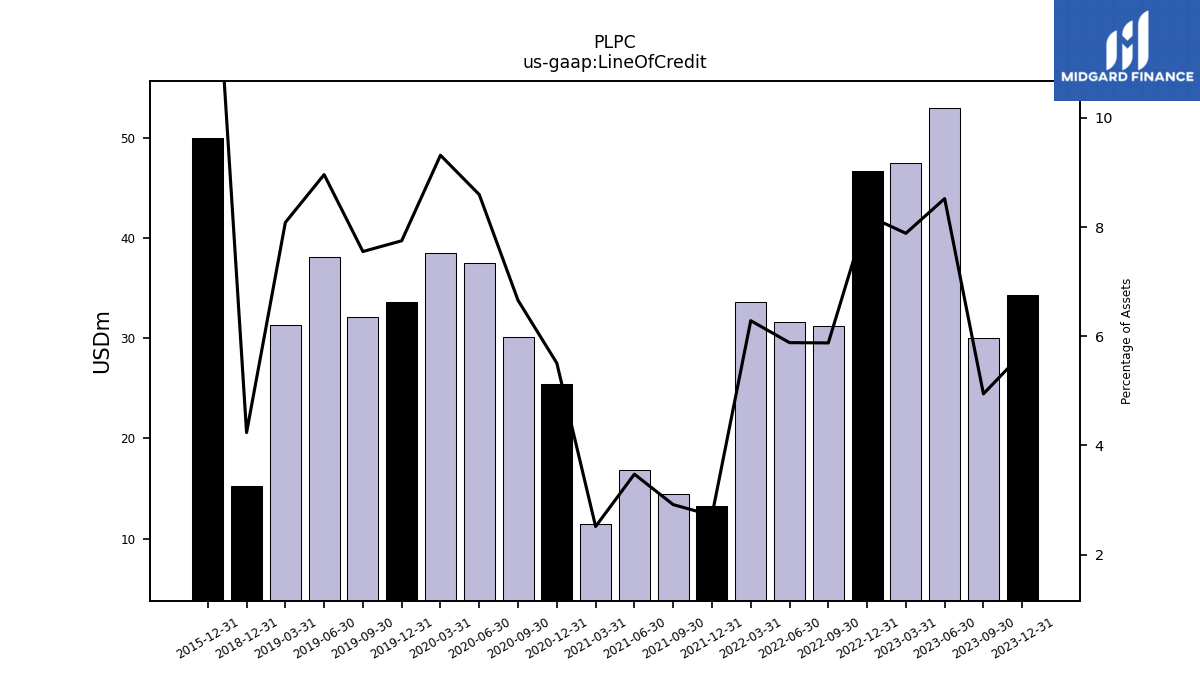
| Line Of Credit | 34.30 | 30.00 | 53.00 | 47.50 | 46.70 | 31.20 | 31.60 | 33.60 | 13.30 | 14.40 | 16.80 | 11.50 | 25.40 | 30.10 | 37.50 | 38.50 | 33.60 | 32.10 | 38.10 | 31.30 | 15.20 | NA | NA | NA | NA | NA | NA | NA | NA | NA | NA | NA | 50.00 | NA | NA | NA | NA | NA | NA | NA | NA | NA | NA | NA | NA | NA | NA | NA | NA | NA | NA | NA | NA | NA | NA |
| 2023-12-31 | 2023-09-30 | 2023-06-30 | 2023-03-31 | 2022-12-31 | 2022-09-30 | 2022-06-30 | 2022-03-31 | 2021-12-31 | 2021-09-30 | 2021-06-30 | 2021-03-31 | 2020-12-31 | 2020-09-30 | 2020-06-30 | 2020-03-31 | 2019-12-31 | 2019-09-30 | 2019-06-30 | 2019-03-31 | 2018-12-31 | 2018-09-30 | 2018-06-30 | 2018-03-31 | 2017-12-31 | 2017-09-30 | 2017-06-30 | 2017-03-31 | 2016-12-31 | 2016-09-30 | 2016-06-30 | 2016-03-31 | 2015-12-31 | 2015-09-30 | 2015-06-30 | 2015-03-31 | 2014-12-31 | 2014-09-30 | 2014-06-30 | 2014-03-31 | 2013-12-31 | 2013-09-30 | 2013-06-30 | 2013-03-31 | 2012-12-31 | 2012-09-30 | 2012-06-30 | 2012-03-31 | 2011-12-31 | 2011-09-30 | 2011-06-30 | 2011-03-31 | 2010-12-31 | 2010-09-30 | 2010-06-30 | ||
|---|---|---|---|---|---|---|---|---|---|---|---|---|---|---|---|---|---|---|---|---|---|---|---|---|---|---|---|---|---|---|---|---|---|---|---|---|---|---|---|---|---|---|---|---|---|---|---|---|---|---|---|---|---|---|---|---|
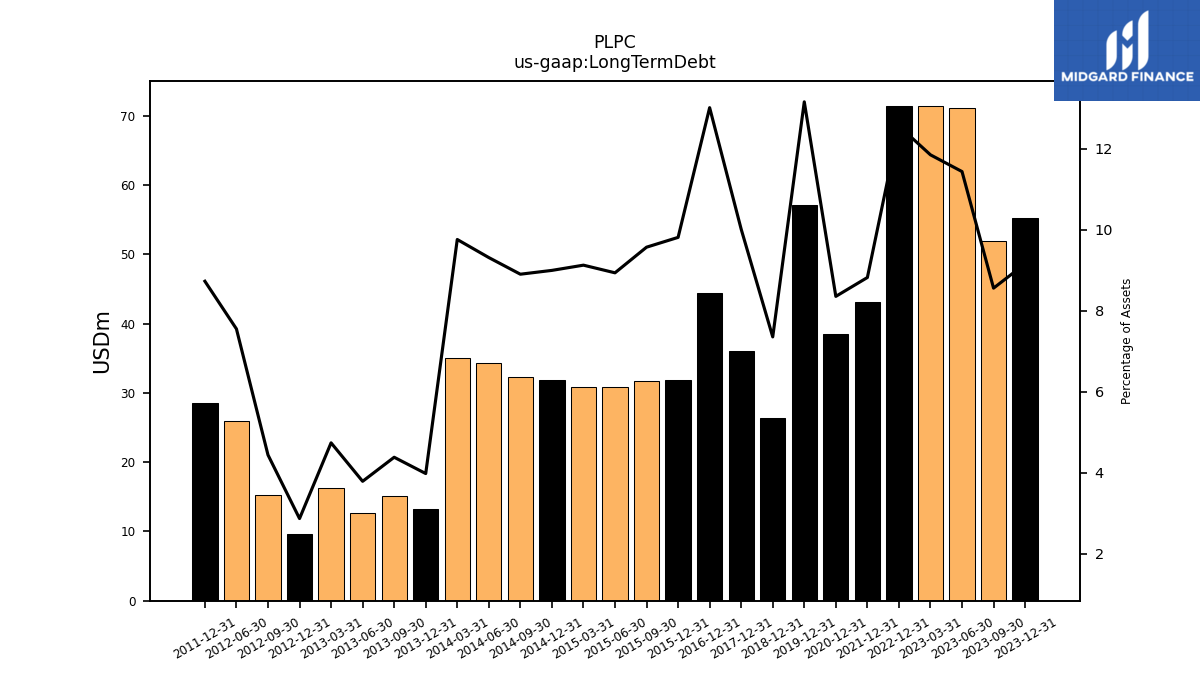
| Long Term Debt | 55.28 | 51.95 | 71.17 | 71.40 | 71.44 | NA | NA | NA | 43.16 | NA | NA | NA | 38.55 | NA | NA | NA | 57.08 | NA | NA | NA | 26.41 | NA | NA | NA | 36.05 | NA | NA | NA | 44.39 | NA | NA | NA | 31.86 | 31.76 | 30.86 | 30.85 | 31.86 | 32.26 | 34.29 | 35.02 | 13.25 | 15.14 | 12.71 | 16.26 | 9.57 | 15.30 | 25.92 | NA | 28.59 | NA | NA | NA | NA | NA | NA | |
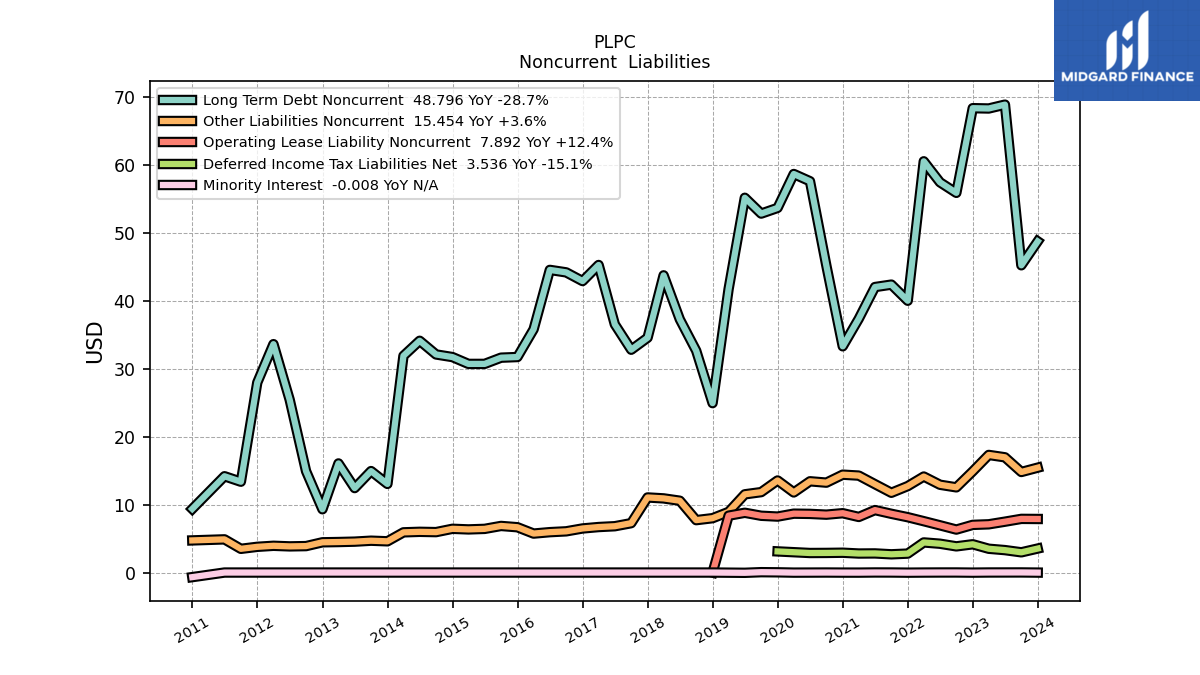
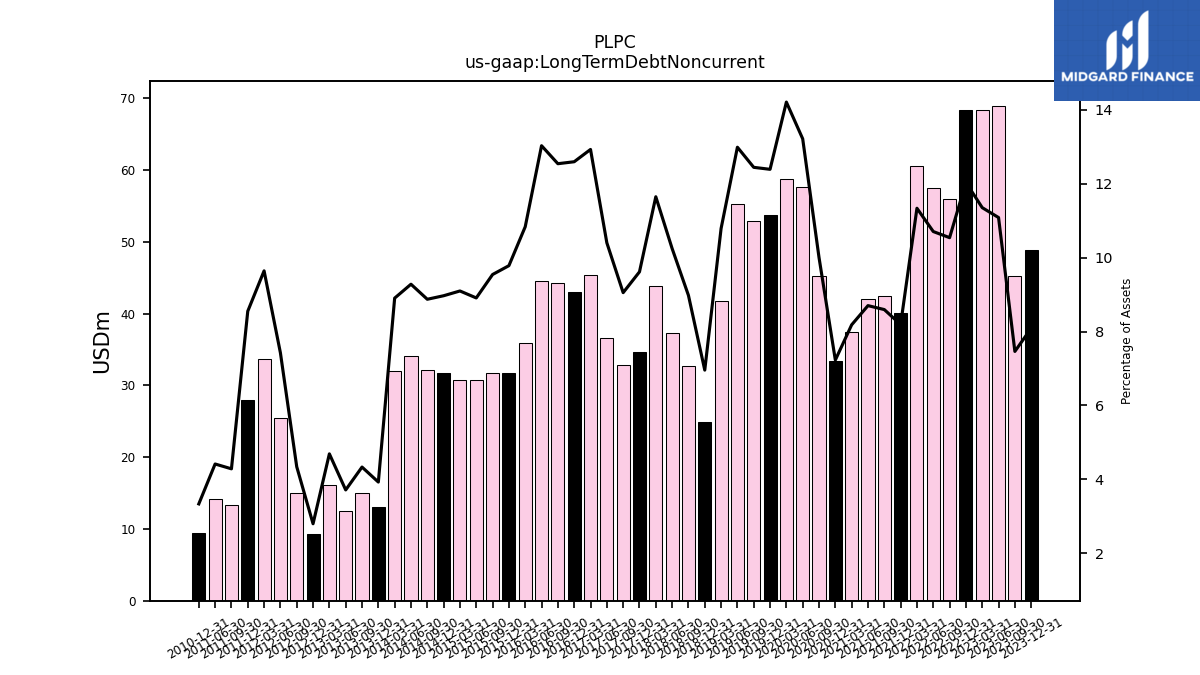
| Long Term Debt Noncurrent | 48.80 | 45.27 | 68.94 | 68.37 | 68.42 | 55.94 | 57.50 | 60.59 | 40.05 | 42.42 | 42.07 | 37.39 | 33.33 | 45.22 | 57.66 | 58.72 | 53.72 | 52.89 | 55.22 | 41.77 | 24.96 | 32.68 | 37.31 | 43.79 | 34.60 | 32.83 | 36.57 | 45.32 | 42.94 | 44.23 | 44.59 | 35.84 | 31.75 | 31.66 | 30.74 | 30.74 | 31.75 | 32.13 | 34.15 | 31.93 | 13.05 | 14.95 | 12.44 | 16.08 | 9.32 | 14.94 | 25.46 | 33.65 | 27.99 | 13.38 | 14.19 | NA | 9.37 | NA | NA | |
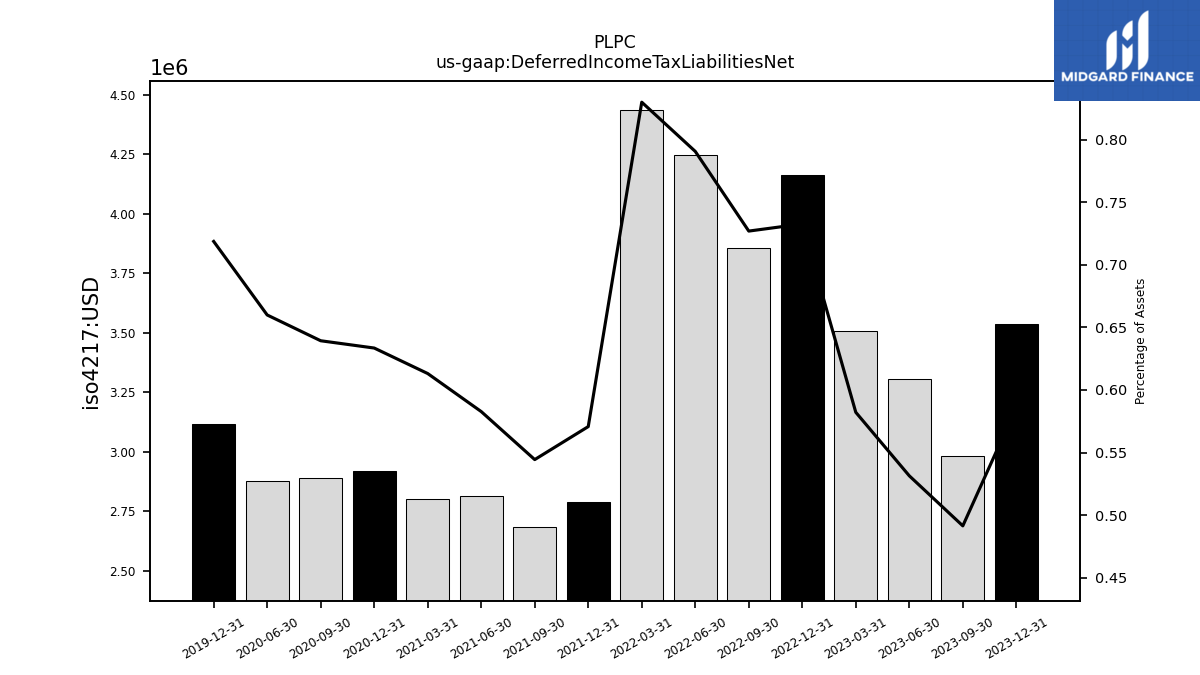
| Deferred Income Tax Liabilities Net | 3.54 | 2.98 | 3.31 | 3.51 | 4.17 | 3.86 | 4.25 | 4.44 | 2.79 | 2.69 | 2.82 | 2.80 | 2.92 | 2.89 | 2.88 | NA | 3.12 | NA | NA | NA | NA | NA | NA | NA | NA | NA | NA | NA | NA | NA | NA | NA | NA | NA | NA | NA | NA | NA | NA | NA | NA | NA | NA | NA | NA | NA | NA | NA | NA | NA | NA | NA | NA | NA | NA | |
| Minority Interest | -0.01 | 0.01 | NA | 0.01 | -0.01 | 0.01 | 0.01 | -0.00 | -0.02 | 0.01 | 0.01 | -0.01 | -0.01 | 0.00 | -0.01 | -0.01 | 0.03 | 0.05 | -0.04 | NA | 0.00 | NA | NA | NA | NA | NA | NA | NA | NA | NA | NA | NA | NA | NA | NA | NA | NA | NA | NA | NA | NA | NA | NA | NA | NA | NA | NA | NA | 0.00 | 0.00 | 0.00 | NA | -0.68 | NA | NA | |
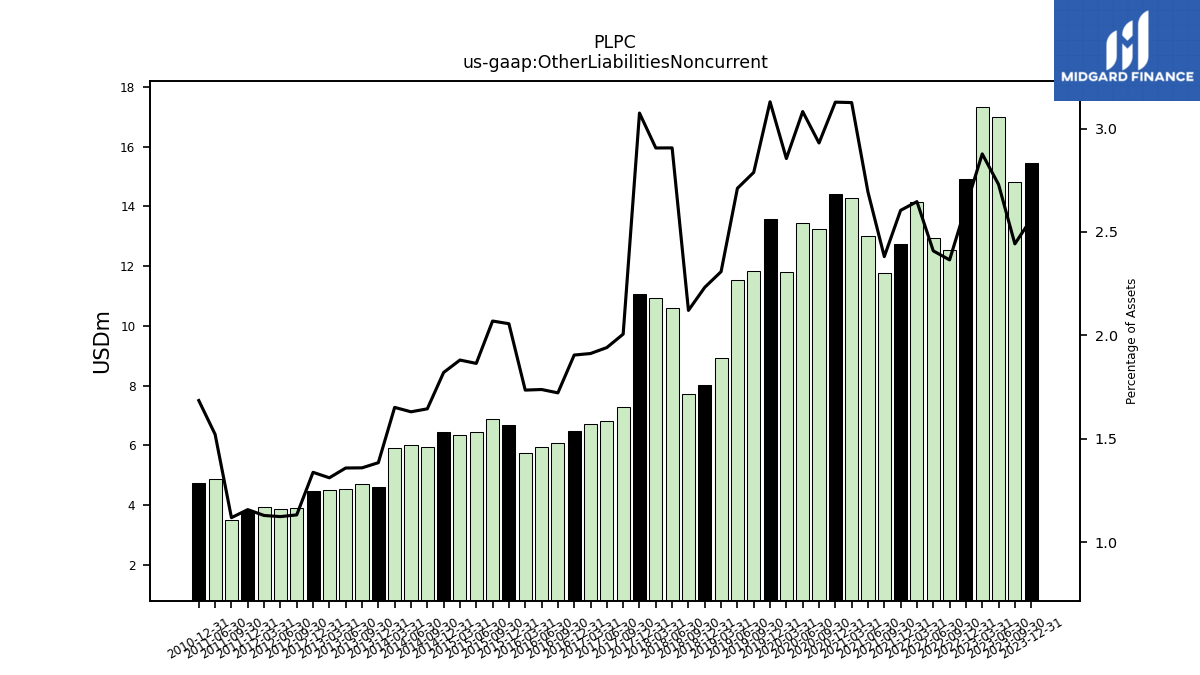
| Other Liabilities Noncurrent | 15.45 | 14.82 | 16.98 | 17.33 | 14.91 | 12.55 | 12.94 | 14.15 | 12.74 | 11.75 | 13.02 | 14.28 | 14.42 | 13.25 | 13.45 | 11.80 | 13.57 | 11.85 | 11.53 | 8.94 | 8.01 | 7.72 | 10.58 | 10.93 | 11.06 | 7.28 | 6.83 | 6.70 | 6.50 | 6.07 | 5.95 | 5.74 | 6.67 | 6.87 | 6.43 | 6.36 | 6.45 | 5.96 | 6.00 | 5.92 | 4.60 | 4.69 | 4.55 | 4.50 | 4.46 | 3.90 | 3.85 | 3.94 | 3.79 | 3.49 | 4.89 | NA | 4.74 | NA | NA | |
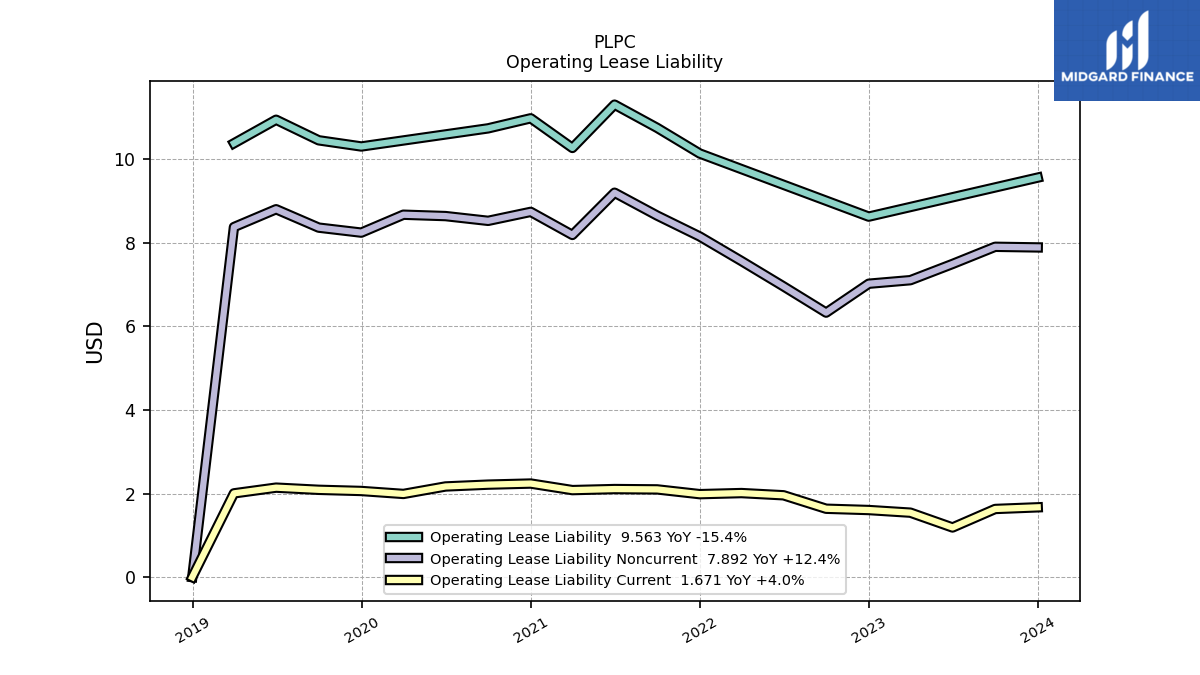
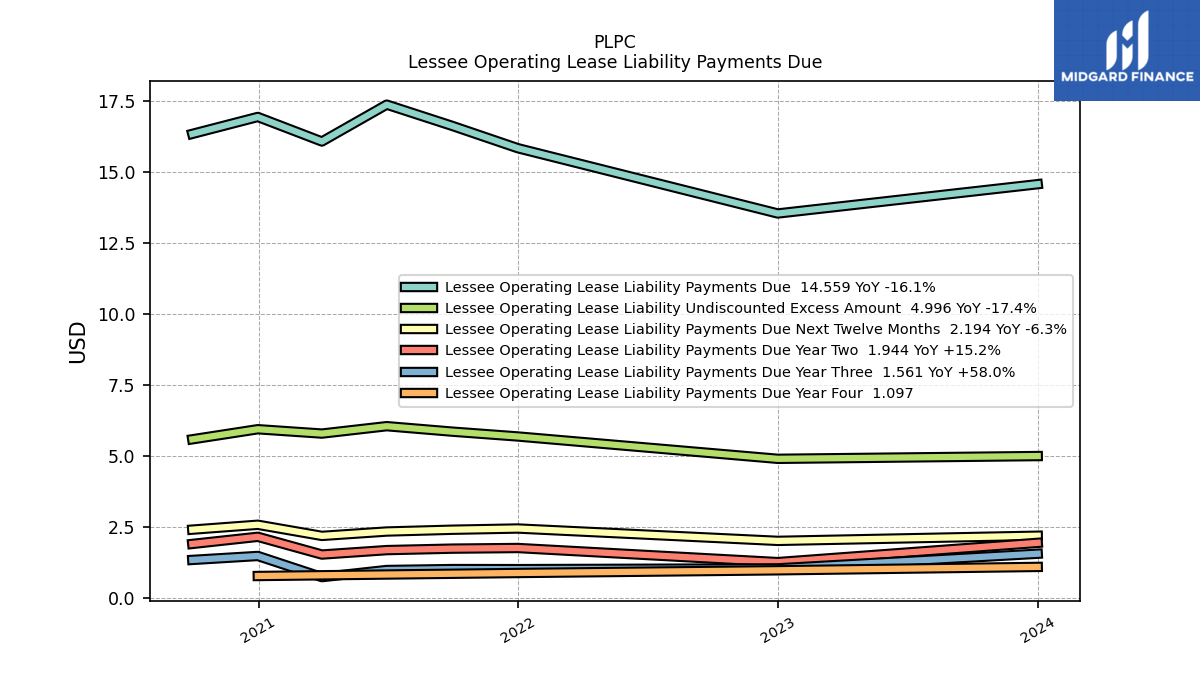
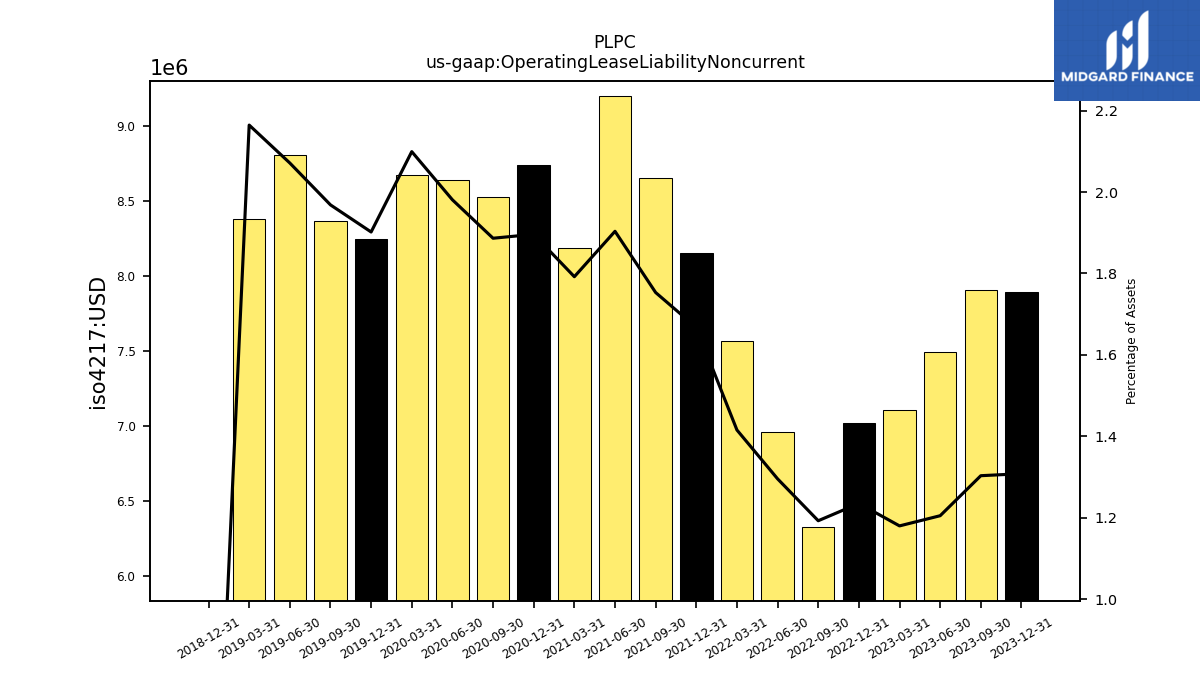
| Operating Lease Liability Noncurrent | 7.89 | 7.91 | 7.50 | 7.11 | 7.02 | 6.33 | 6.96 | 7.57 | 8.15 | 8.65 | 9.20 | 8.19 | 8.74 | 8.53 | 8.64 | 8.68 | 8.25 | 8.37 | 8.81 | 8.38 | 0.00 | NA | NA | NA | NA | NA | NA | NA | NA | NA | NA | NA | NA | NA | NA | NA | NA | NA | NA | NA | NA | NA | NA | NA | NA | NA | NA | NA | NA | NA | NA | NA | NA | NA | NA |
| 2023-12-31 | 2023-09-30 | 2023-06-30 | 2023-03-31 | 2022-12-31 | 2022-09-30 | 2022-06-30 | 2022-03-31 | 2021-12-31 | 2021-09-30 | 2021-06-30 | 2021-03-31 | 2020-12-31 | 2020-09-30 | 2020-06-30 | 2020-03-31 | 2019-12-31 | 2019-09-30 | 2019-06-30 | 2019-03-31 | 2018-12-31 | 2018-09-30 | 2018-06-30 | 2018-03-31 | 2017-12-31 | 2017-09-30 | 2017-06-30 | 2017-03-31 | 2016-12-31 | 2016-09-30 | 2016-06-30 | 2016-03-31 | 2015-12-31 | 2015-09-30 | 2015-06-30 | 2015-03-31 | 2014-12-31 | 2014-09-30 | 2014-06-30 | 2014-03-31 | 2013-12-31 | 2013-09-30 | 2013-06-30 | 2013-03-31 | 2012-12-31 | 2012-09-30 | 2012-06-30 | 2012-03-31 | 2011-12-31 | 2011-09-30 | 2011-06-30 | 2011-03-31 | 2010-12-31 | 2010-09-30 | 2010-06-30 | ||
|---|---|---|---|---|---|---|---|---|---|---|---|---|---|---|---|---|---|---|---|---|---|---|---|---|---|---|---|---|---|---|---|---|---|---|---|---|---|---|---|---|---|---|---|---|---|---|---|---|---|---|---|---|---|---|---|---|
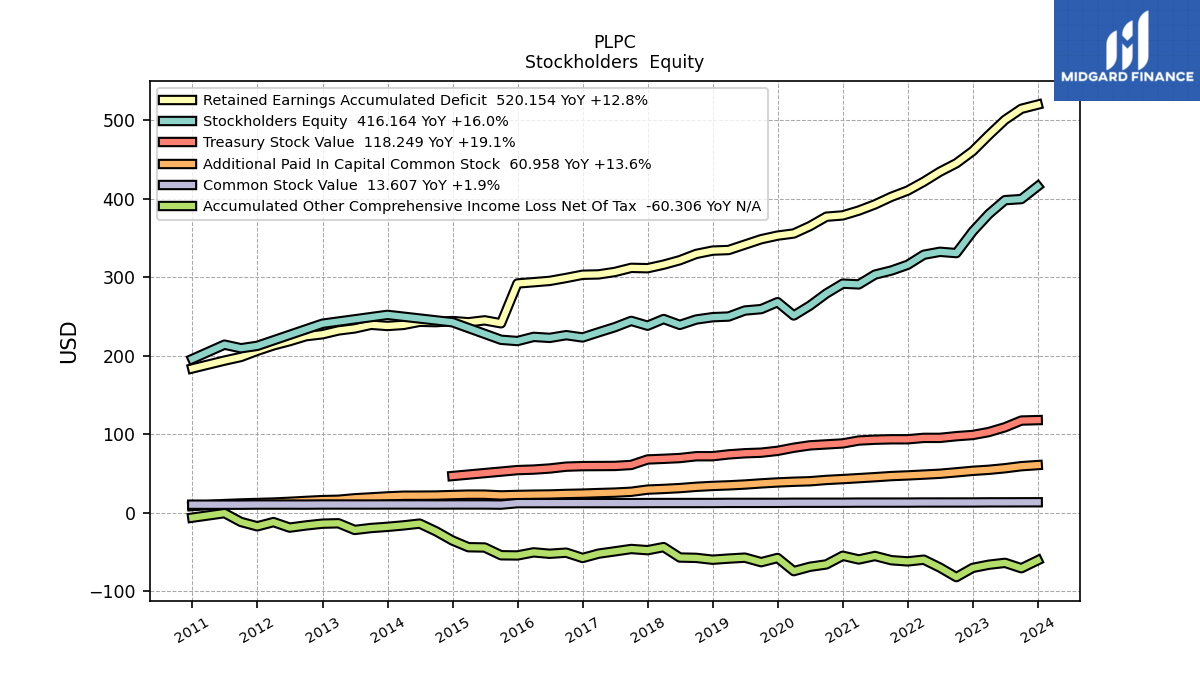
| Stockholders Equity | 416.16 | 399.81 | 398.45 | 380.71 | 358.64 | 331.00 | 332.68 | 328.91 | 316.12 | 308.79 | 303.63 | 291.15 | 292.08 | 279.57 | 264.16 | 251.51 | 268.54 | 259.66 | 257.85 | 250.20 | 249.37 | 246.41 | 239.53 | 247.02 | 238.54 | 244.65 | 236.60 | 230.13 | 223.54 | 226.47 | 223.02 | 224.27 | 218.98 | 220.59 | NA | NA | 242.93 | NA | NA | NA | 252.33 | NA | NA | NA | 241.07 | NA | NA | NA | 212.86 | 209.81 | 214.39 | NA | 196.14 | NA | NA | |
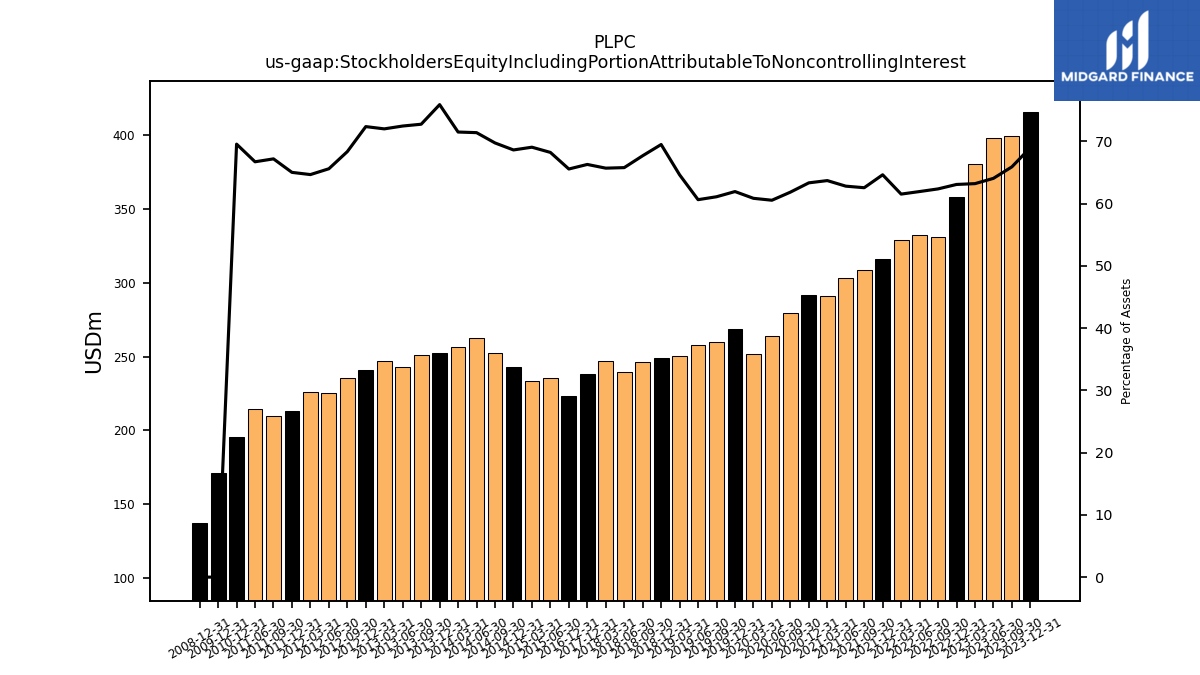
| Stockholders Equity Including Portion Attributable To Noncontrolling Interest | 416.16 | 399.83 | 398.45 | 380.71 | 358.62 | 331.01 | 332.69 | 328.91 | 316.10 | 308.80 | 303.64 | 291.14 | 292.07 | 279.58 | 264.16 | 251.50 | 268.57 | 259.72 | 257.81 | 250.20 | 249.37 | 246.41 | 239.53 | 247.02 | 238.54 | NA | NA | NA | 223.54 | NA | NA | NA | NA | NA | 235.43 | 233.37 | 242.93 | 252.59 | 262.73 | 256.41 | 252.33 | 251.06 | 242.79 | 246.84 | 241.07 | 235.21 | 225.01 | 225.70 | 212.86 | 209.81 | 214.39 | NA | 195.47 | NA | NA | |
| Common Stock Value | 13.61 | 13.56 | 13.51 | 13.49 | 13.35 | 13.32 | 13.30 | 13.30 | 13.19 | 13.17 | 13.17 | 13.15 | 13.03 | 13.01 | 13.00 | 13.00 | 12.85 | 12.82 | 12.82 | 12.82 | 12.66 | 12.64 | 12.64 | 12.63 | 12.59 | 12.51 | 12.51 | 12.51 | 12.51 | 12.50 | 12.48 | 12.48 | 12.48 | 10.59 | 10.78 | 10.79 | 10.79 | 10.71 | 10.78 | 10.78 | 10.78 | 10.72 | 10.72 | 10.75 | 10.76 | 10.62 | 10.67 | 10.66 | 10.67 | 10.50 | 10.52 | NA | 10.54 | NA | NA | |
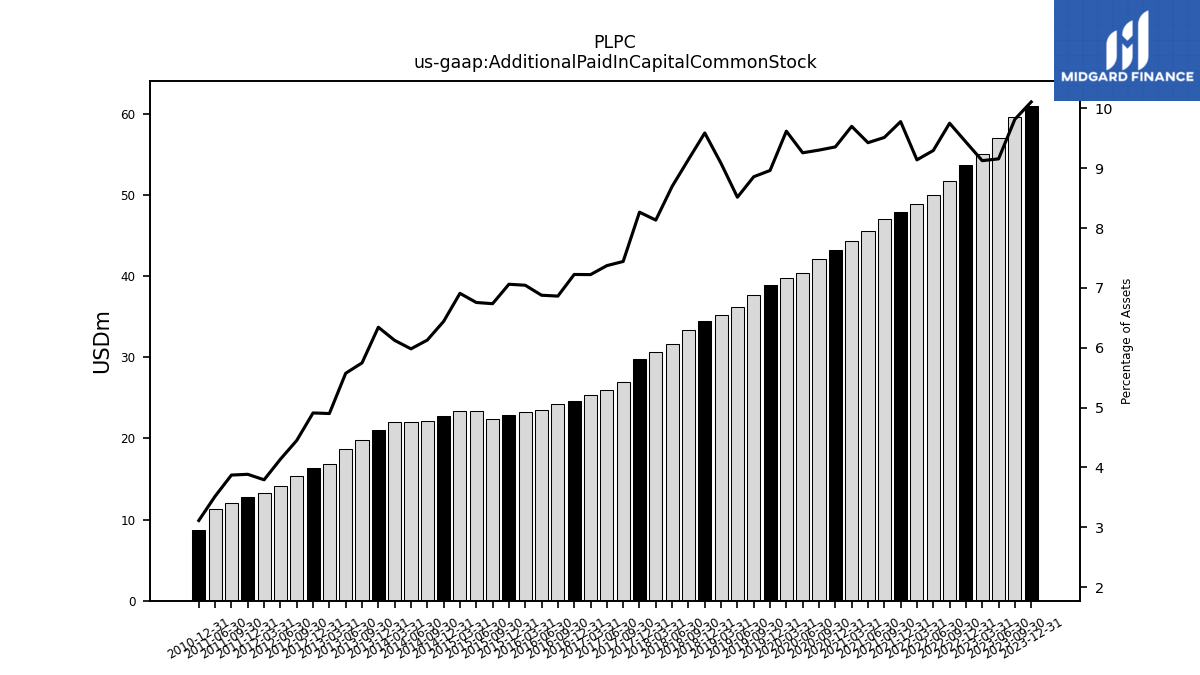
| Additional Paid In Capital Common Stock | 60.96 | 59.55 | 56.94 | 54.96 | 53.65 | 51.75 | 49.92 | 48.85 | 47.81 | 46.96 | 45.56 | 44.32 | 43.13 | 42.05 | 40.38 | 39.75 | 38.85 | 37.64 | 36.20 | 35.15 | 34.40 | 33.28 | 31.66 | 30.58 | 29.73 | 26.98 | 25.92 | 25.32 | 24.63 | 24.20 | 23.54 | 23.30 | 22.92 | 22.34 | 23.31 | 23.34 | 22.80 | 22.19 | 22.01 | 21.95 | 21.08 | 19.83 | 18.67 | 16.80 | 16.36 | 15.31 | 14.19 | 13.24 | 12.72 | 12.09 | 11.31 | NA | 8.75 | NA | NA | |
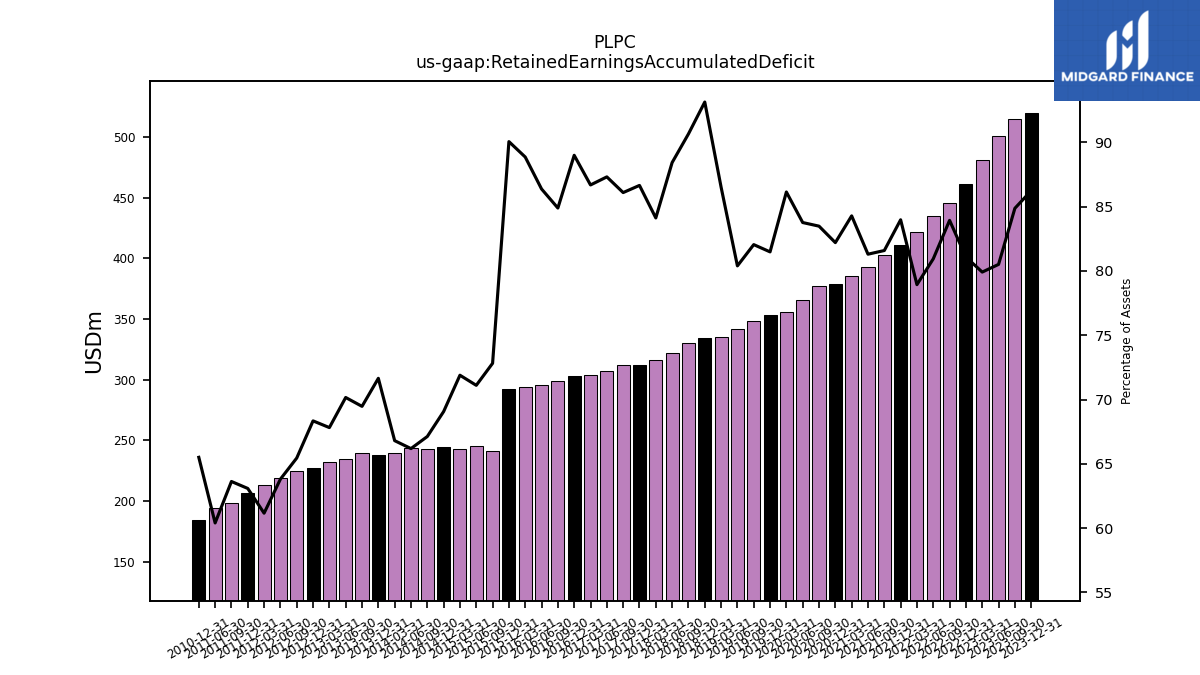
| Retained Earnings Accumulated Deficit | 520.15 | 514.84 | 500.73 | 481.28 | 460.93 | 445.46 | 434.72 | 421.92 | 410.67 | 402.72 | 393.03 | 385.18 | 379.04 | 377.38 | 365.44 | 355.98 | 353.29 | 348.71 | 341.80 | 334.95 | 334.17 | 329.96 | 321.95 | 316.27 | 311.76 | 312.21 | 306.98 | 303.88 | 303.42 | 299.35 | 295.62 | 293.92 | 292.31 | 241.56 | 245.35 | 242.90 | 244.47 | 243.07 | 243.52 | 239.55 | 238.17 | 239.70 | 235.05 | 232.46 | 227.62 | 225.20 | 218.84 | 213.45 | 206.51 | 198.67 | 194.07 | NA | 184.06 | NA | NA | |
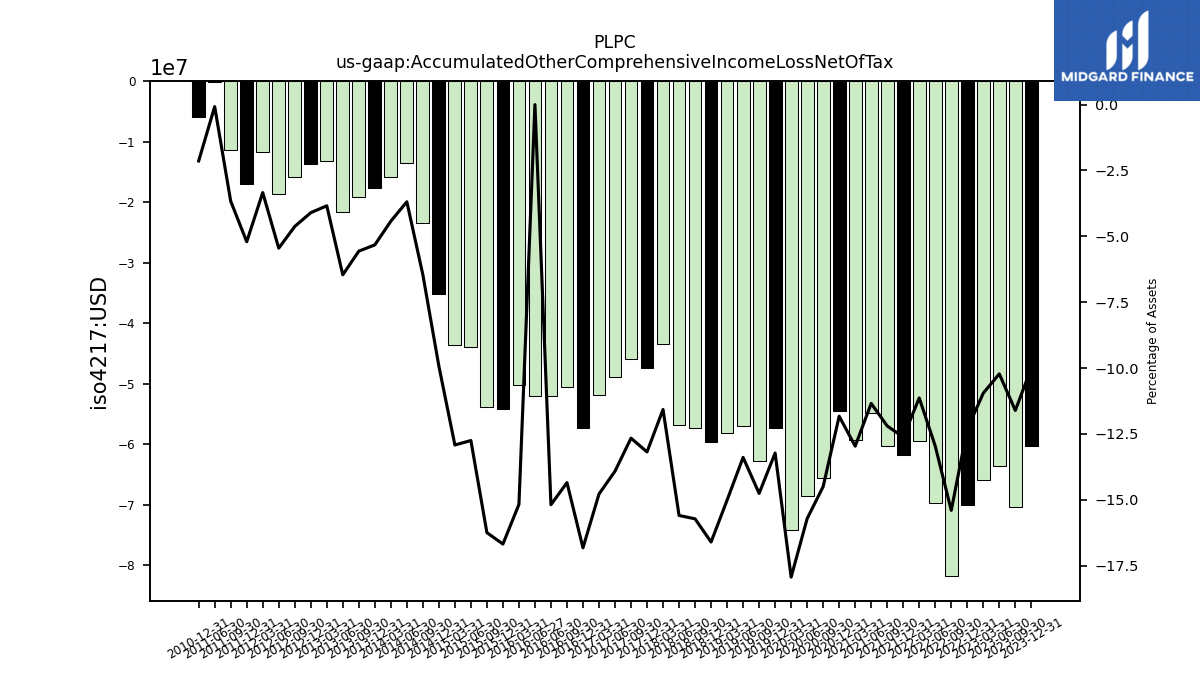
| Accumulated Other Comprehensive Income Loss Net Of Tax | -60.31 | -70.43 | -63.59 | -65.98 | -69.99 | -81.76 | -69.63 | -59.53 | -61.72 | -60.22 | -54.84 | -59.27 | -54.55 | -65.55 | -68.57 | -74.14 | -57.35 | -62.73 | -56.94 | -58.14 | -59.58 | -57.24 | -56.79 | -43.52 | -47.44 | -45.92 | -48.93 | -51.83 | -57.37 | -50.61 | -51.99 | -50.21 | -54.15 | -53.91 | -44.01 | -43.66 | -35.13 | -23.38 | -13.57 | -15.87 | -17.70 | -19.20 | -21.65 | -13.17 | -13.66 | -15.91 | -18.69 | -11.66 | -17.04 | -11.45 | -0.24 | NA | -6.01 | NA | NA | |
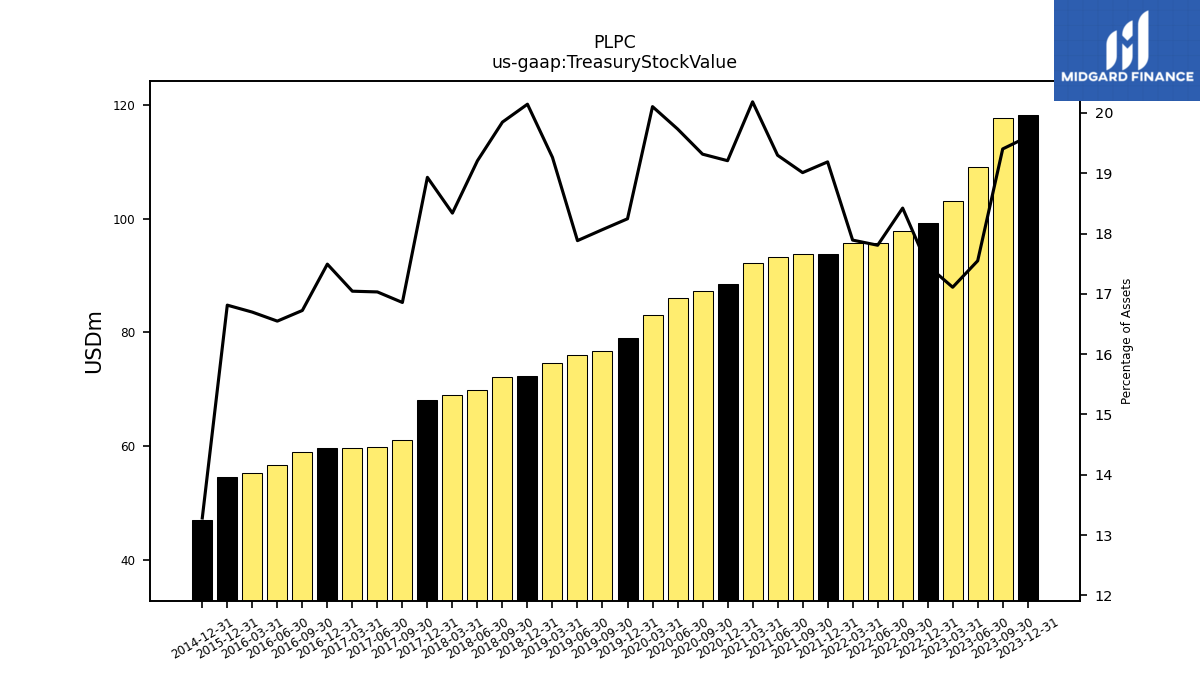
| Treasury Stock Value | 118.25 | 117.70 | 109.14 | 103.04 | 99.30 | 97.77 | 95.63 | 95.63 | 93.84 | 93.84 | 93.29 | 92.25 | 88.57 | 87.32 | 86.10 | 83.09 | 79.11 | 76.78 | 76.03 | 74.57 | 72.28 | 72.24 | 69.93 | 68.95 | 68.11 | 61.13 | 59.88 | 59.75 | 59.64 | 58.97 | 56.63 | 55.23 | 54.57 | NA | NA | NA | 47.02 | NA | NA | NA | NA | NA | NA | NA | NA | NA | NA | NA | NA | NA | NA | NA | NA | NA | NA | |
| Minority Interest | -0.01 | 0.01 | NA | 0.01 | -0.01 | 0.01 | 0.01 | -0.00 | -0.02 | 0.01 | 0.01 | -0.01 | -0.01 | 0.00 | -0.01 | -0.01 | 0.03 | 0.05 | -0.04 | NA | 0.00 | NA | NA | NA | NA | NA | NA | NA | NA | NA | NA | NA | NA | NA | NA | NA | NA | NA | NA | NA | NA | NA | NA | NA | NA | NA | NA | NA | 0.00 | 0.00 | 0.00 | NA | -0.68 | NA | NA |
| 2023-12-31 | 2023-09-30 | 2023-06-30 | 2023-03-31 | 2022-12-31 | 2022-09-30 | 2022-06-30 | 2022-03-31 | 2021-12-31 | 2021-09-30 | 2021-06-30 | 2021-03-31 | 2020-12-31 | 2020-09-30 | 2020-06-30 | 2020-03-31 | 2019-12-31 | 2019-09-30 | 2019-06-30 | 2019-03-31 | 2018-12-31 | 2018-09-30 | 2018-06-30 | 2018-03-31 | 2017-12-31 | 2017-09-30 | 2017-06-30 | 2017-03-31 | 2016-12-31 | 2016-09-30 | 2016-06-30 | 2016-03-31 | 2015-12-31 | 2015-09-30 | 2015-06-30 | 2015-03-31 | 2014-12-31 | 2014-09-30 | 2014-06-30 | 2014-03-31 | 2013-12-31 | 2013-09-30 | 2013-06-30 | 2013-03-31 | 2012-12-31 | 2012-09-30 | 2012-06-30 | 2012-03-31 | 2011-12-31 | 2011-09-30 | 2011-06-30 | 2011-03-31 | 2010-12-31 | 2010-09-30 | 2010-06-30 | ||
|---|---|---|---|---|---|---|---|---|---|---|---|---|---|---|---|---|---|---|---|---|---|---|---|---|---|---|---|---|---|---|---|---|---|---|---|---|---|---|---|---|---|---|---|---|---|---|---|---|---|---|---|---|---|---|---|---|
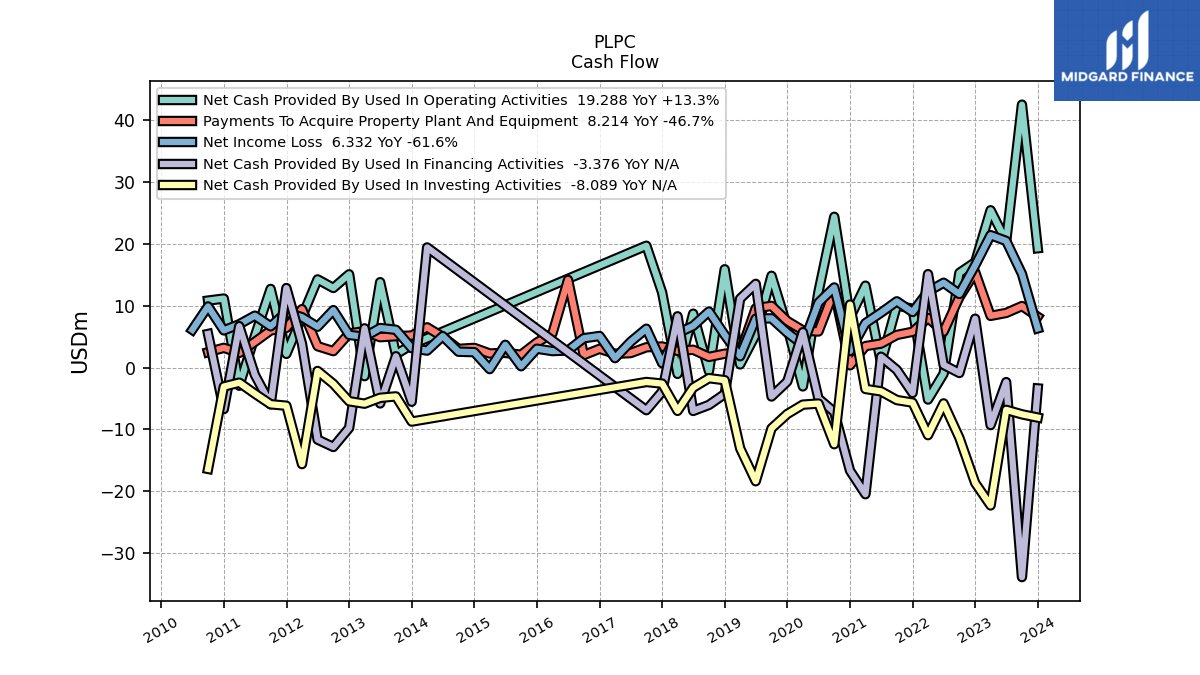
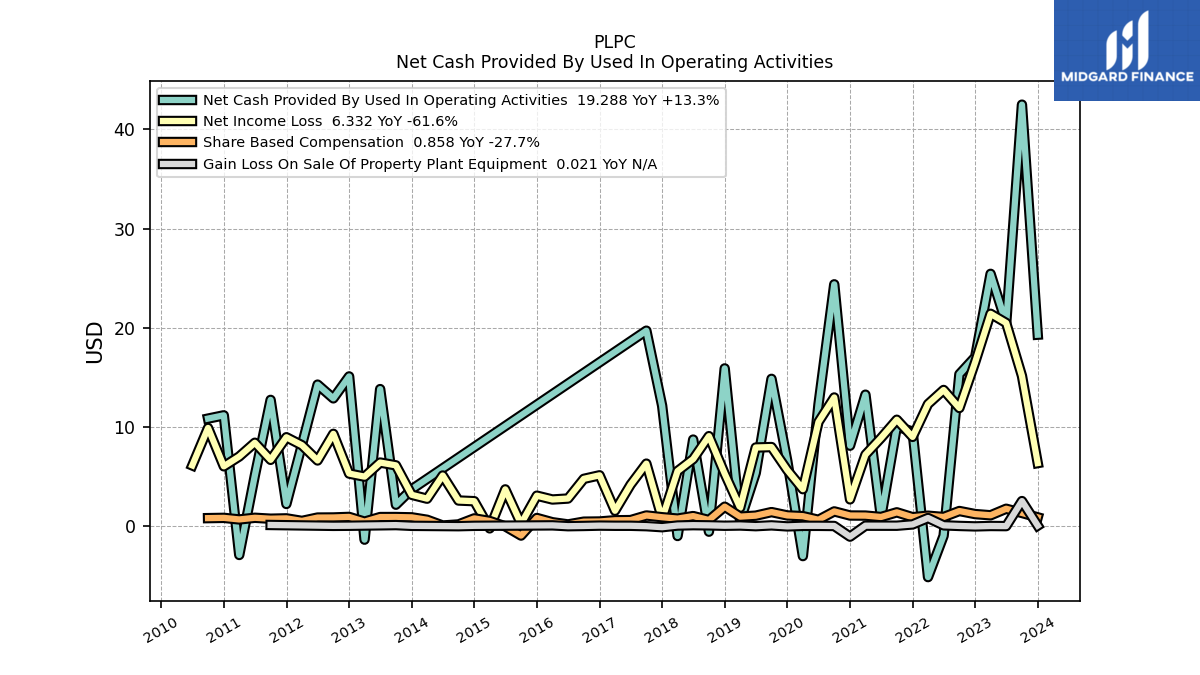
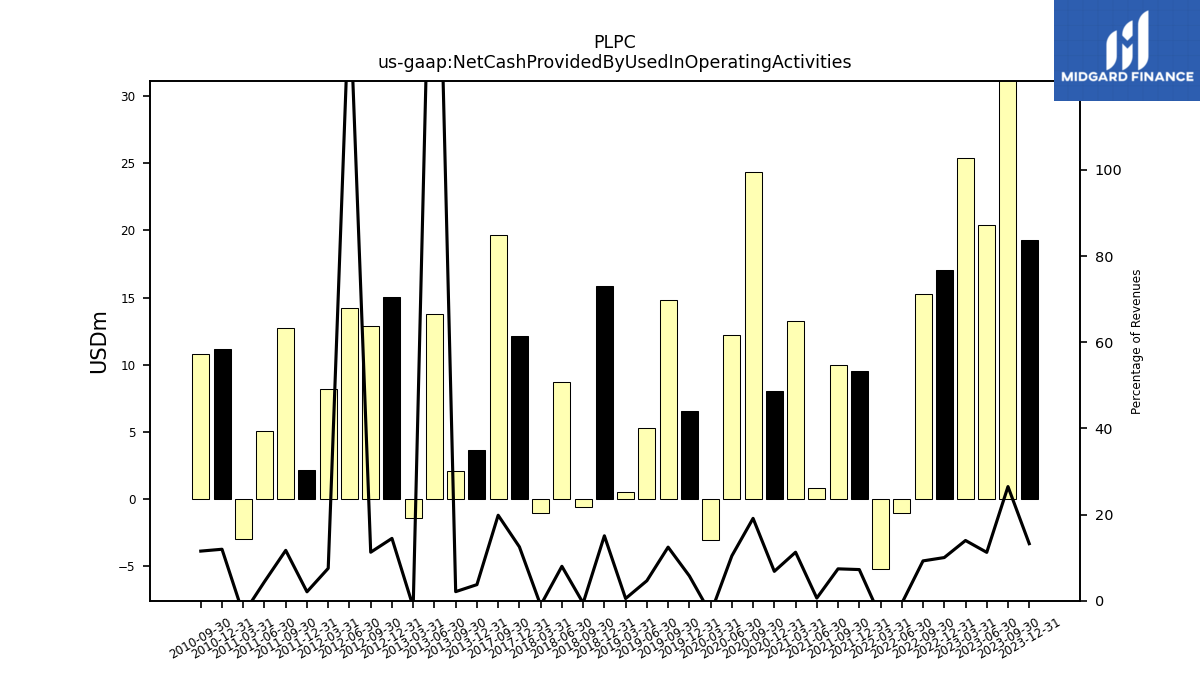
| Net Cash Provided By Used In Operating Activities | 19.29 | 42.50 | 20.42 | 25.43 | 17.03 | 15.30 | -1.00 | -5.17 | 9.51 | 10.03 | 0.82 | 13.24 | 8.09 | 24.37 | 12.24 | -3.06 | 6.55 | 14.83 | 5.33 | 0.50 | 15.89 | -0.59 | 8.71 | -1.03 | 12.12 | 19.69 | NA | NA | NA | NA | NA | NA | NA | NA | NA | NA | NA | NA | NA | NA | 3.69 | 2.13 | 13.80 | -1.40 | 15.08 | 12.86 | 14.25 | 8.19 | 2.20 | 12.71 | 5.08 | -2.94 | 11.15 | 10.82 | NA | |
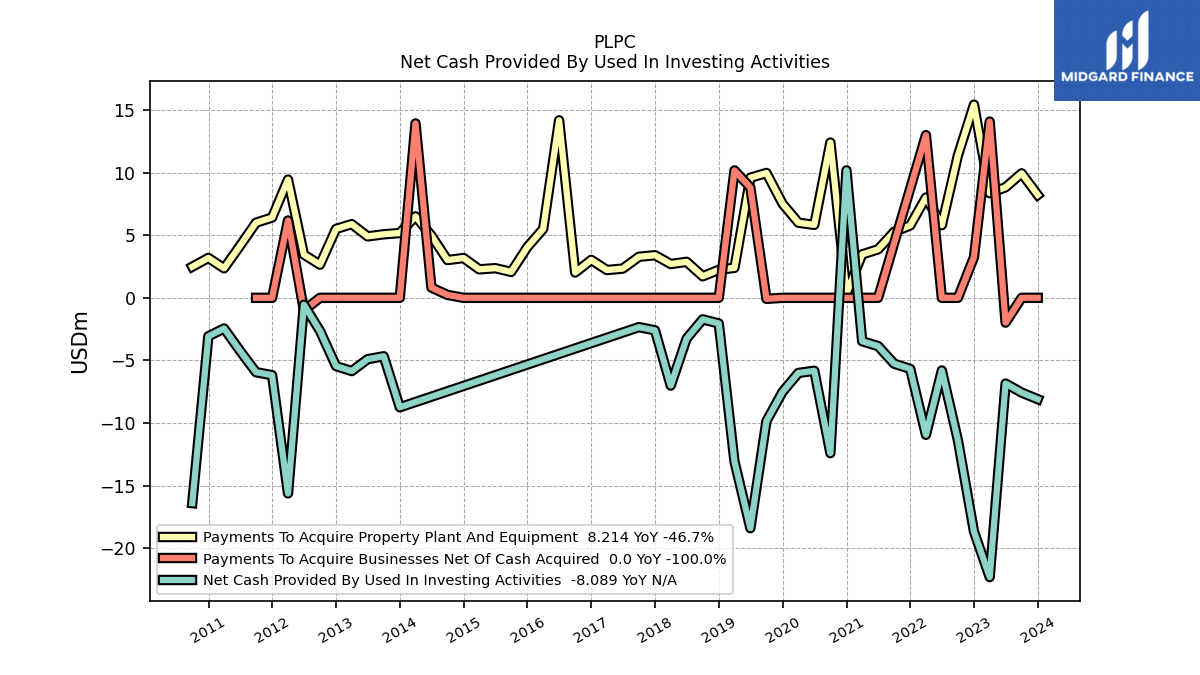
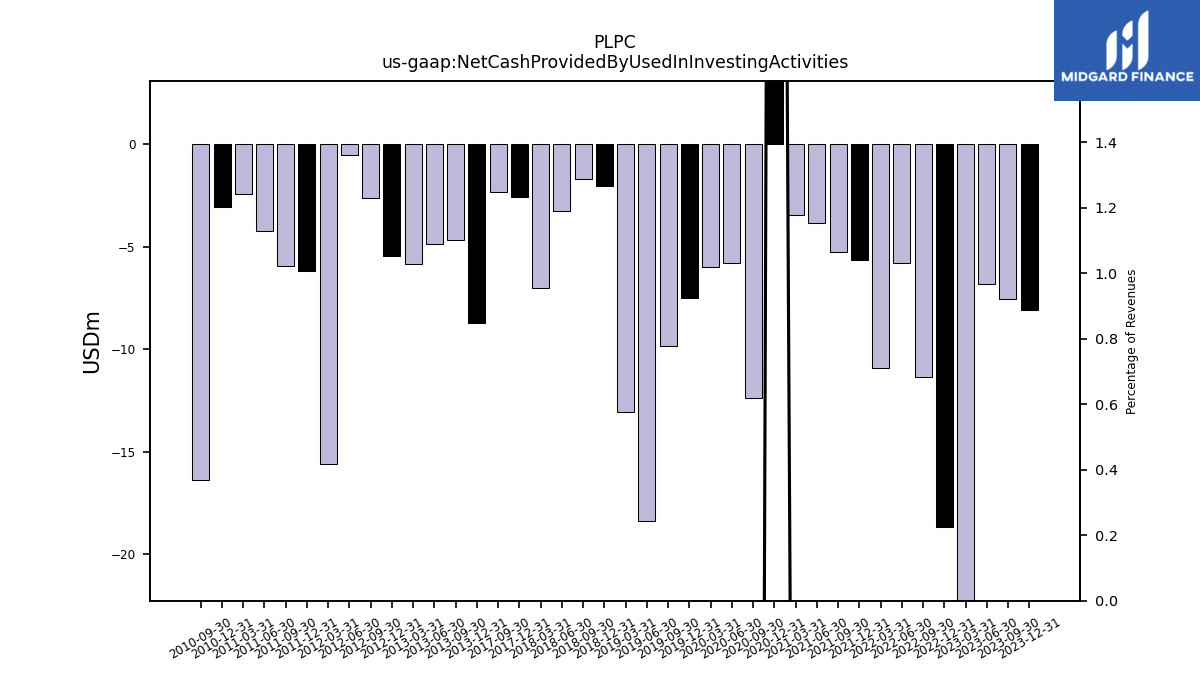
| Net Cash Provided By Used In Investing Activities | -8.09 | -7.56 | -6.84 | -22.30 | -18.66 | -11.37 | -5.80 | -10.93 | -5.67 | -5.26 | -3.85 | -3.46 | 10.18 | -12.40 | -5.82 | -6.00 | -7.51 | -9.84 | -18.39 | -13.06 | -2.04 | -1.72 | -3.25 | -7.01 | -2.60 | -2.34 | NA | NA | NA | NA | NA | NA | NA | NA | NA | NA | NA | NA | NA | NA | -8.74 | -4.66 | -4.89 | -5.85 | -5.45 | -2.64 | -0.55 | -15.62 | -6.17 | -5.94 | -4.22 | -2.44 | -3.07 | -16.39 | NA | |
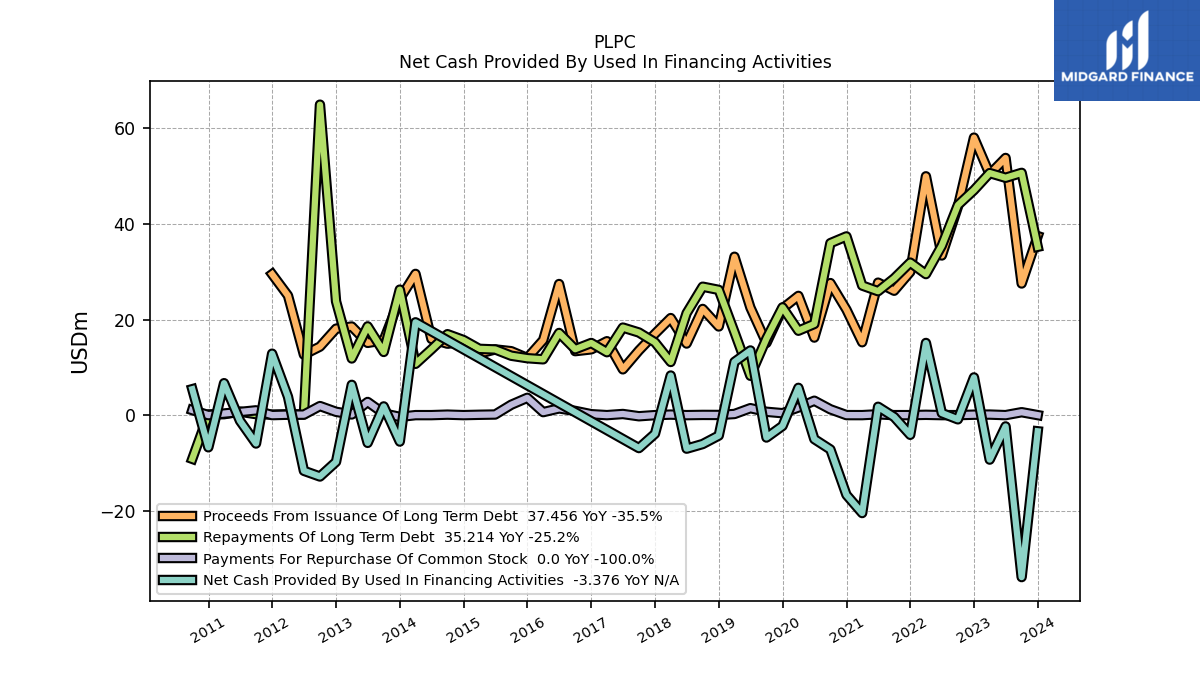
| Net Cash Provided By Used In Financing Activities | -3.38 | -33.88 | -2.35 | -9.31 | 7.90 | -0.88 | 0.43 | 15.10 | -4.12 | -0.38 | 1.75 | -20.48 | -16.68 | -7.18 | -5.01 | 5.71 | -2.26 | -4.69 | 13.53 | 11.13 | -4.27 | -6.05 | -7.02 | 8.29 | -3.89 | -6.90 | NA | NA | NA | NA | NA | NA | NA | NA | NA | NA | NA | NA | NA | 19.42 | -5.53 | 1.83 | -5.81 | 6.34 | -9.77 | -12.84 | -11.65 | 3.84 | 12.86 | -5.94 | -1.18 | 6.69 | -6.73 | 5.43 | NA |
| 2023-12-31 | 2023-09-30 | 2023-06-30 | 2023-03-31 | 2022-12-31 | 2022-09-30 | 2022-06-30 | 2022-03-31 | 2021-12-31 | 2021-09-30 | 2021-06-30 | 2021-03-31 | 2020-12-31 | 2020-09-30 | 2020-06-30 | 2020-03-31 | 2019-12-31 | 2019-09-30 | 2019-06-30 | 2019-03-31 | 2018-12-31 | 2018-09-30 | 2018-06-30 | 2018-03-31 | 2017-12-31 | 2017-09-30 | 2017-06-30 | 2017-03-31 | 2016-12-31 | 2016-09-30 | 2016-06-30 | 2016-03-31 | 2015-12-31 | 2015-09-30 | 2015-06-30 | 2015-03-31 | 2014-12-31 | 2014-09-30 | 2014-06-30 | 2014-03-31 | 2013-12-31 | 2013-09-30 | 2013-06-30 | 2013-03-31 | 2012-12-31 | 2012-09-30 | 2012-06-30 | 2012-03-31 | 2011-12-31 | 2011-09-30 | 2011-06-30 | 2011-03-31 | 2010-12-31 | 2010-09-30 | 2010-06-30 | ||
|---|---|---|---|---|---|---|---|---|---|---|---|---|---|---|---|---|---|---|---|---|---|---|---|---|---|---|---|---|---|---|---|---|---|---|---|---|---|---|---|---|---|---|---|---|---|---|---|---|---|---|---|---|---|---|---|---|
| Net Cash Provided By Used In Operating Activities | 19.29 | 42.50 | 20.42 | 25.43 | 17.03 | 15.30 | -1.00 | -5.17 | 9.51 | 10.03 | 0.82 | 13.24 | 8.09 | 24.37 | 12.24 | -3.06 | 6.55 | 14.83 | 5.33 | 0.50 | 15.89 | -0.59 | 8.71 | -1.03 | 12.12 | 19.69 | NA | NA | NA | NA | NA | NA | NA | NA | NA | NA | NA | NA | NA | NA | 3.69 | 2.13 | 13.80 | -1.40 | 15.08 | 12.86 | 14.25 | 8.19 | 2.20 | 12.71 | 5.08 | -2.94 | 11.15 | 10.82 | NA | |
| Net Income Loss | 6.33 | 15.13 | 20.47 | 21.40 | 16.51 | 11.89 | 13.71 | 12.29 | 8.97 | 10.71 | 8.87 | 7.18 | 2.67 | 12.95 | 10.48 | 3.70 | 5.62 | 7.95 | 7.90 | 1.82 | 5.26 | 9.05 | 6.74 | 5.53 | 0.70 | 6.28 | 4.16 | 1.52 | 5.10 | 4.74 | 2.75 | 2.66 | 3.04 | 0.21 | 3.68 | -0.26 | 2.49 | 2.56 | 5.08 | 2.74 | 3.13 | 6.10 | 6.39 | 4.96 | 5.27 | 9.28 | 6.60 | 8.13 | 8.94 | 6.66 | 8.39 | 7.00 | 6.01 | 9.88 | 6.10 | |
| Profit Loss | 6.31 | 15.14 | 20.46 | 21.42 | 16.49 | 11.89 | 13.72 | 12.30 | 8.95 | 10.70 | 8.89 | 7.18 | 2.66 | 12.96 | 10.49 | 3.65 | 5.60 | 8.04 | 7.87 | 1.82 | 5.26 | 9.05 | 6.74 | 5.53 | 0.70 | 6.28 | NA | NA | NA | NA | NA | NA | NA | NA | 3.68 | -0.26 | 2.49 | 2.56 | 5.08 | 2.74 | 3.13 | 6.10 | 6.39 | 4.96 | 5.27 | 9.28 | 6.60 | 8.13 | 8.94 | 6.66 | 8.53 | 6.85 | 6.00 | 9.88 | 6.10 | |
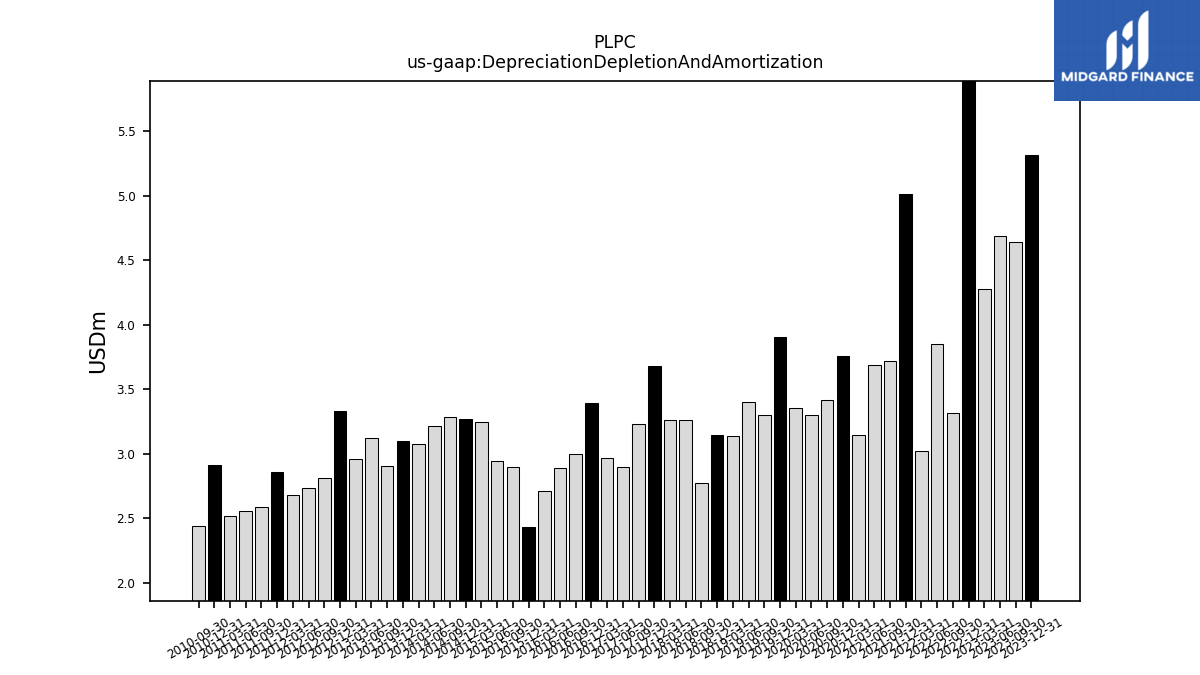
| Depreciation Depletion And Amortization | 5.31 | 4.64 | 4.69 | 4.28 | 6.24 | 3.31 | 3.85 | 3.02 | 5.01 | 3.72 | 3.69 | 3.15 | 3.76 | 3.42 | 3.30 | 3.36 | 3.90 | 3.31 | 3.40 | 3.14 | 3.15 | 2.77 | 3.26 | 3.27 | 3.68 | 3.23 | 2.90 | 2.97 | 3.39 | 3.00 | 2.89 | 2.71 | 2.44 | 2.90 | 2.95 | 3.25 | 3.27 | 3.29 | 3.22 | 3.08 | 3.10 | 2.90 | 3.12 | 2.96 | 3.33 | 2.81 | 2.74 | 2.68 | 2.86 | 2.59 | 2.56 | 2.52 | 2.91 | 2.44 | NA | |
| Deferred Income Tax Expense Benefit | 0.60 | -0.83 | -0.48 | -1.53 | -1.51 | 1.44 | -2.03 | -0.56 | 5.86 | -0.89 | -3.35 | 4.92 | -4.44 | 0.39 | -0.49 | 1.16 | 0.23 | -0.79 | -0.81 | 0.10 | 0.79 | -0.02 | -0.31 | -0.15 | 2.58 | 0.65 | -0.50 | -0.29 | 3.39 | -0.33 | -0.79 | -0.02 | 0.97 | -0.81 | 0.11 | -1.22 | -1.33 | -0.81 | 0.13 | 0.31 | 0.59 | -1.21 | -0.16 | -0.32 | -2.87 | 0.58 | -2.19 | 1.55 | 1.47 | -1.47 | -0.17 | -0.52 | -0.83 | 1.10 | NA | |
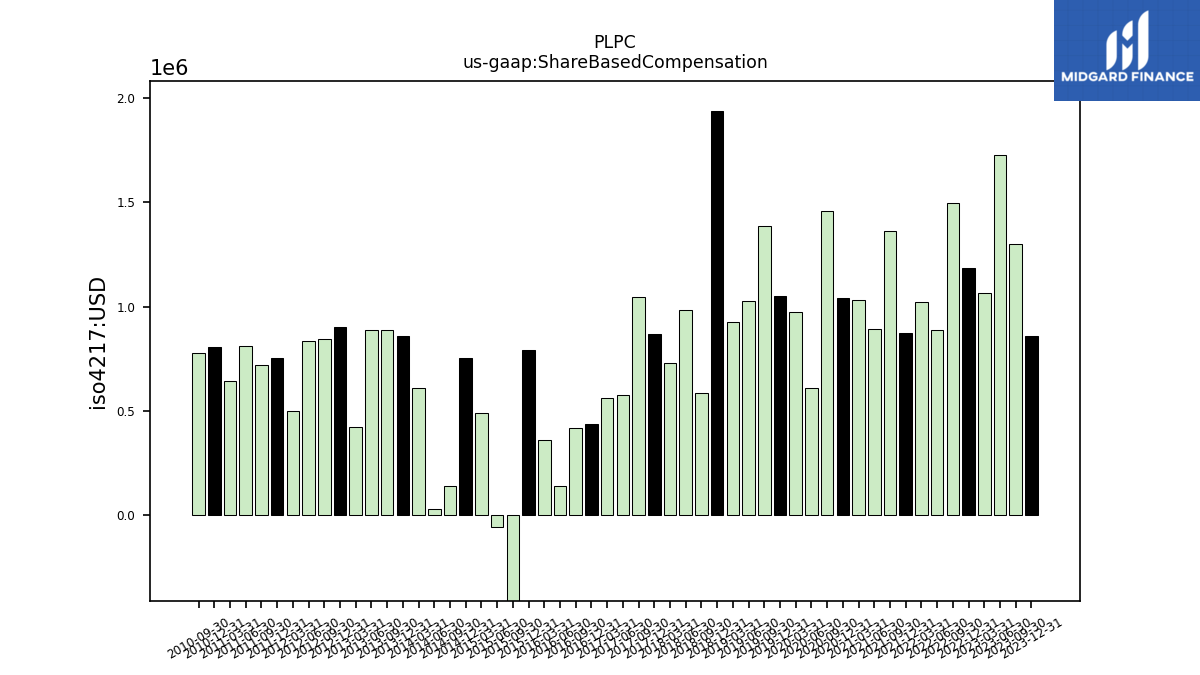
| Share Based Compensation | 0.86 | 1.30 | 1.73 | 1.07 | 1.19 | 1.50 | 0.89 | 1.02 | 0.87 | 1.36 | 0.89 | 1.03 | 1.04 | 1.46 | 0.61 | 0.98 | 1.05 | 1.39 | 1.03 | 0.93 | 1.94 | 0.58 | 0.99 | 0.73 | 0.87 | 1.05 | 0.58 | 0.56 | 0.44 | 0.42 | 0.14 | 0.36 | 0.79 | -0.98 | -0.05 | 0.49 | 0.75 | 0.14 | 0.03 | 0.61 | 0.86 | 0.89 | 0.89 | 0.42 | 0.90 | 0.84 | 0.84 | 0.50 | 0.76 | 0.72 | 0.81 | 0.65 | 0.81 | 0.78 | NA |
| 2023-12-31 | 2023-09-30 | 2023-06-30 | 2023-03-31 | 2022-12-31 | 2022-09-30 | 2022-06-30 | 2022-03-31 | 2021-12-31 | 2021-09-30 | 2021-06-30 | 2021-03-31 | 2020-12-31 | 2020-09-30 | 2020-06-30 | 2020-03-31 | 2019-12-31 | 2019-09-30 | 2019-06-30 | 2019-03-31 | 2018-12-31 | 2018-09-30 | 2018-06-30 | 2018-03-31 | 2017-12-31 | 2017-09-30 | 2017-06-30 | 2017-03-31 | 2016-12-31 | 2016-09-30 | 2016-06-30 | 2016-03-31 | 2015-12-31 | 2015-09-30 | 2015-06-30 | 2015-03-31 | 2014-12-31 | 2014-09-30 | 2014-06-30 | 2014-03-31 | 2013-12-31 | 2013-09-30 | 2013-06-30 | 2013-03-31 | 2012-12-31 | 2012-09-30 | 2012-06-30 | 2012-03-31 | 2011-12-31 | 2011-09-30 | 2011-06-30 | 2011-03-31 | 2010-12-31 | 2010-09-30 | 2010-06-30 | ||
|---|---|---|---|---|---|---|---|---|---|---|---|---|---|---|---|---|---|---|---|---|---|---|---|---|---|---|---|---|---|---|---|---|---|---|---|---|---|---|---|---|---|---|---|---|---|---|---|---|---|---|---|---|---|---|---|---|
| Net Cash Provided By Used In Investing Activities | -8.09 | -7.56 | -6.84 | -22.30 | -18.66 | -11.37 | -5.80 | -10.93 | -5.67 | -5.26 | -3.85 | -3.46 | 10.18 | -12.40 | -5.82 | -6.00 | -7.51 | -9.84 | -18.39 | -13.06 | -2.04 | -1.72 | -3.25 | -7.01 | -2.60 | -2.34 | NA | NA | NA | NA | NA | NA | NA | NA | NA | NA | NA | NA | NA | NA | -8.74 | -4.66 | -4.89 | -5.85 | -5.45 | -2.64 | -0.55 | -15.62 | -6.17 | -5.94 | -4.22 | -2.44 | -3.07 | -16.39 | NA | |
| Payments To Acquire Property Plant And Equipment | 8.21 | 9.94 | 8.83 | 8.35 | 15.42 | 11.37 | 5.80 | 8.01 | 5.78 | 5.27 | 3.87 | 3.47 | 0.35 | 12.40 | 5.82 | 6.00 | 7.52 | 9.97 | 9.59 | 2.40 | 2.24 | 1.72 | 2.87 | 2.70 | 3.40 | 3.28 | 2.34 | 2.22 | 3.03 | 2.02 | 14.17 | 5.51 | 4.04 | 2.07 | 2.37 | 2.27 | 3.18 | 3.01 | 4.97 | 6.50 | 5.17 | 5.07 | 4.91 | 5.88 | 5.50 | 2.65 | 3.45 | 9.44 | 6.41 | 6.00 | 4.15 | 2.36 | 3.19 | 2.48 | NA |
| 2023-12-31 | 2023-09-30 | 2023-06-30 | 2023-03-31 | 2022-12-31 | 2022-09-30 | 2022-06-30 | 2022-03-31 | 2021-12-31 | 2021-09-30 | 2021-06-30 | 2021-03-31 | 2020-12-31 | 2020-09-30 | 2020-06-30 | 2020-03-31 | 2019-12-31 | 2019-09-30 | 2019-06-30 | 2019-03-31 | 2018-12-31 | 2018-09-30 | 2018-06-30 | 2018-03-31 | 2017-12-31 | 2017-09-30 | 2017-06-30 | 2017-03-31 | 2016-12-31 | 2016-09-30 | 2016-06-30 | 2016-03-31 | 2015-12-31 | 2015-09-30 | 2015-06-30 | 2015-03-31 | 2014-12-31 | 2014-09-30 | 2014-06-30 | 2014-03-31 | 2013-12-31 | 2013-09-30 | 2013-06-30 | 2013-03-31 | 2012-12-31 | 2012-09-30 | 2012-06-30 | 2012-03-31 | 2011-12-31 | 2011-09-30 | 2011-06-30 | 2011-03-31 | 2010-12-31 | 2010-09-30 | 2010-06-30 | ||
|---|---|---|---|---|---|---|---|---|---|---|---|---|---|---|---|---|---|---|---|---|---|---|---|---|---|---|---|---|---|---|---|---|---|---|---|---|---|---|---|---|---|---|---|---|---|---|---|---|---|---|---|---|---|---|---|---|
| Net Cash Provided By Used In Financing Activities | -3.38 | -33.88 | -2.35 | -9.31 | 7.90 | -0.88 | 0.43 | 15.10 | -4.12 | -0.38 | 1.75 | -20.48 | -16.68 | -7.18 | -5.01 | 5.71 | -2.26 | -4.69 | 13.53 | 11.13 | -4.27 | -6.05 | -7.02 | 8.29 | -3.89 | -6.90 | NA | NA | NA | NA | NA | NA | NA | NA | NA | NA | NA | NA | NA | 19.42 | -5.53 | 1.83 | -5.81 | 6.34 | -9.77 | -12.84 | -11.65 | 3.84 | 12.86 | -5.94 | -1.18 | 6.69 | -6.73 | 5.43 | NA | |
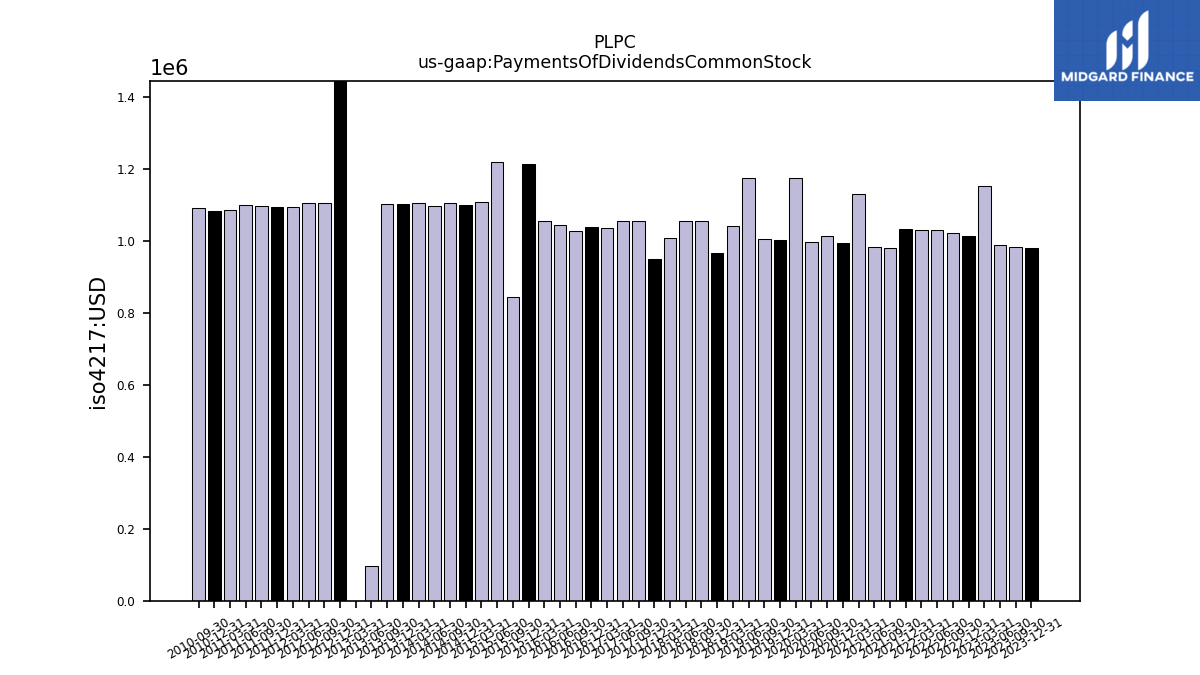
| Payments Of Dividends Common Stock | 0.98 | 0.98 | 0.99 | 1.15 | 1.01 | 1.02 | 1.03 | 1.03 | 1.03 | 0.98 | 0.98 | 1.13 | 1.00 | 1.01 | 1.00 | 1.18 | 1.00 | 1.01 | 1.18 | 1.04 | 0.97 | 1.06 | 1.06 | 1.01 | 0.95 | 1.06 | 1.05 | 1.04 | 1.04 | 1.03 | 1.05 | 1.06 | 1.22 | 0.84 | 1.22 | 1.11 | 1.10 | 1.11 | 1.10 | 1.11 | 1.10 | 1.10 | 0.10 | 0.00 | 3.19 | 1.10 | 1.10 | 1.09 | 1.09 | 1.10 | 1.10 | 1.09 | 1.08 | 1.09 | NA | |
| Payments For Repurchase Of Common Stock | 0.00 | 0.61 | 0.00 | 0.12 | 0.09 | 0.00 | 0.00 | 0.07 | 0.00 | 0.00 | 0.18 | 0.00 | 0.00 | 1.22 | 3.01 | 1.60 | 0.40 | 0.70 | 1.46 | 0.24 | 0.04 | 0.04 | 0.00 | 0.11 | 0.00 | -0.24 | 0.24 | 0.00 | 0.19 | 0.88 | 1.41 | 0.63 | 3.62 | 2.17 | 0.13 | 0.07 | 0.00 | 0.10 | 0.00 | 0.00 | -0.37 | 0.36 | 2.76 | 0.13 | 0.70 | 1.90 | 0.10 | 0.09 | 0.00 | 1.00 | NA | NA | 0.00 | 1.06 | NA |
| 2023-12-31 | 2023-09-30 | 2023-06-30 | 2023-03-31 | 2022-12-31 | 2022-09-30 | 2022-06-30 | 2022-03-31 | 2021-12-31 | 2021-09-30 | 2021-06-30 | 2021-03-31 | 2020-12-31 | 2020-09-30 | 2020-06-30 | 2020-03-31 | 2019-12-31 | 2019-09-30 | 2019-06-30 | 2019-03-31 | 2018-12-31 | 2018-09-30 | 2018-06-30 | 2018-03-31 | 2017-12-31 | 2017-09-30 | 2017-06-30 | 2017-03-31 | 2016-12-31 | 2016-09-30 | 2016-06-30 | 2016-03-31 | 2015-12-31 | 2015-09-30 | 2015-06-30 | 2015-03-31 | 2014-12-31 | 2014-09-30 | 2014-06-30 | 2014-03-31 | 2013-12-31 | 2013-09-30 | 2013-06-30 | 2013-03-31 | 2012-12-31 | 2012-09-30 | 2012-06-30 | 2012-03-31 | 2011-12-31 | 2011-09-30 | 2011-06-30 | 2011-03-31 | 2010-12-31 | 2010-09-30 | 2010-06-30 | ||
|---|---|---|---|---|---|---|---|---|---|---|---|---|---|---|---|---|---|---|---|---|---|---|---|---|---|---|---|---|---|---|---|---|---|---|---|---|---|---|---|---|---|---|---|---|---|---|---|---|---|---|---|---|---|---|---|---|
| Revenues | 145.60 | 160.44 | 181.81 | 181.82 | 169.92 | 165.40 | 163.47 | 138.22 | 131.45 | 135.38 | 133.04 | 117.55 | 118.50 | 127.46 | 117.63 | 102.85 | 113.65 | 119.22 | 114.84 | 97.15 | 105.41 | 108.41 | 108.92 | 98.14 | 96.89 | 99.24 | 97.51 | 84.57 | 86.43 | 88.30 | 83.22 | 78.68 | 91.96 | 89.05 | 87.87 | 85.79 | 96.18 | 102.10 | 99.98 | 89.92 | 98.54 | 100.83 | 6.81 | 98.69 | 104.20 | 114.21 | 10.07 | 108.85 | 106.10 | 108.69 | 114.53 | 95.09 | 93.32 | 93.94 | 82.14 | |
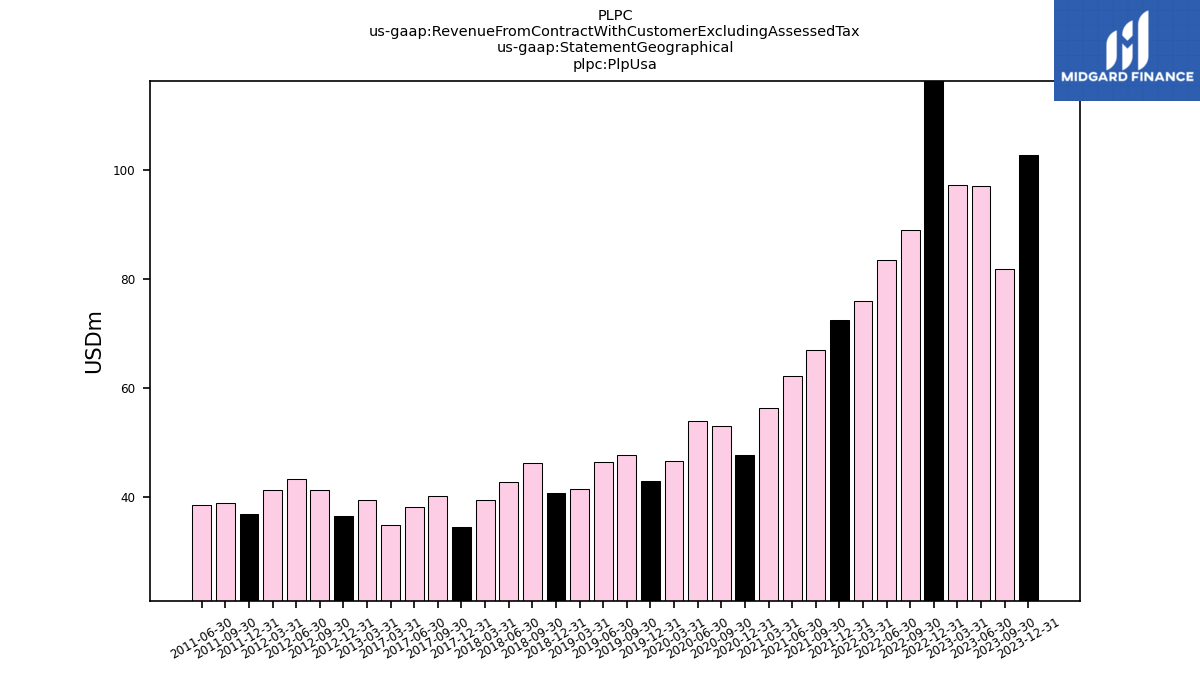
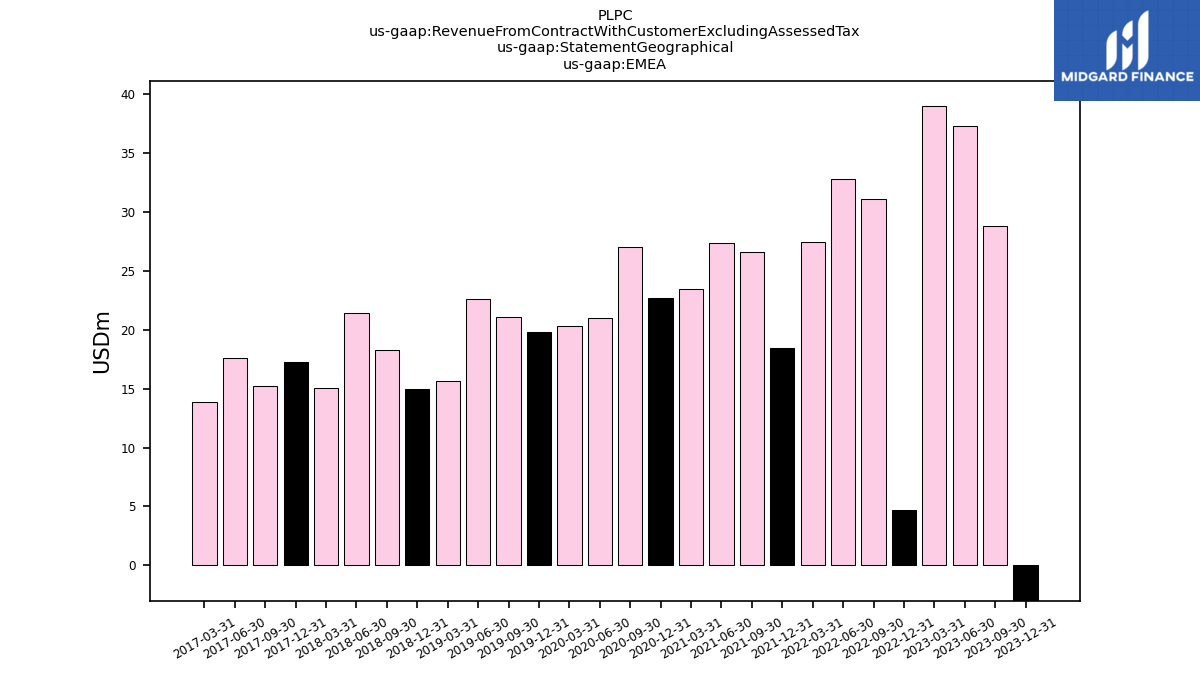
| Revenue From Contract With Customer Excluding Assessed Tax | 145.60 | 160.44 | 181.81 | 181.82 | 169.92 | 165.40 | 163.47 | 138.22 | 131.45 | 135.38 | 133.04 | 117.55 | 118.50 | 127.46 | 117.63 | 102.85 | 113.65 | 119.22 | 114.84 | 97.15 | 105.41 | 108.41 | 108.92 | 98.14 | 96.89 | 99.24 | 97.51 | 84.57 | 86.43 | 88.30 | 83.22 | 78.68 | 91.96 | 89.05 | 87.87 | 85.79 | 96.18 | 102.10 | 99.98 | 89.92 | 98.54 | 100.83 | 6.81 | 98.69 | 104.20 | 114.21 | 10.07 | 108.85 | 106.10 | 108.69 | 114.53 | 95.09 | 93.32 | 93.94 | 82.14 | |
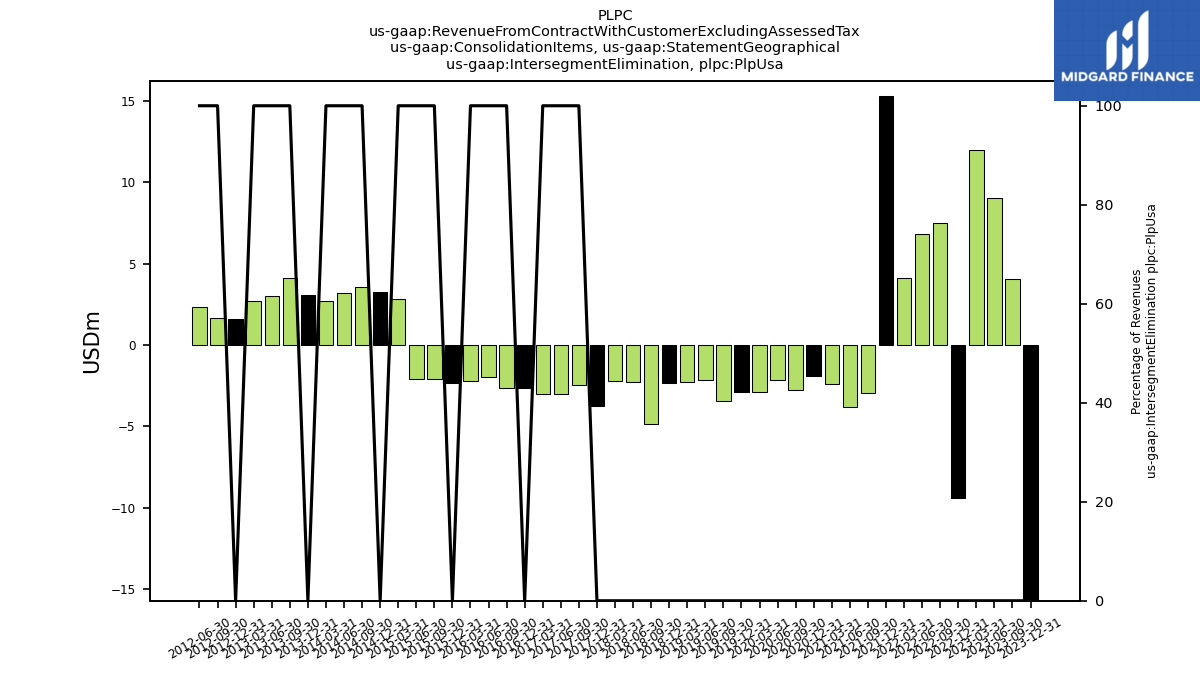
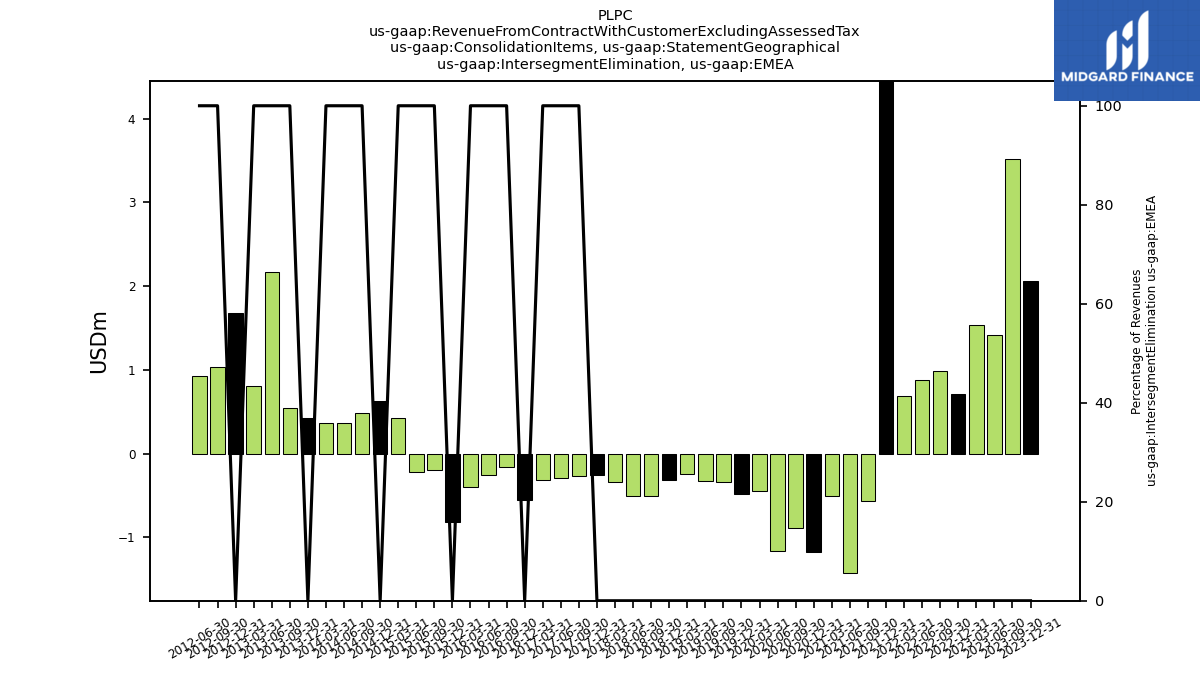
| Intersegment Elimination | -5.29 | 17.72 | 20.83 | 24.72 | 7.44 | 22.36 | 19.92 | 14.20 | 73.84 | -12.60 | -12.57 | -8.61 | -9.59 | -10.88 | -10.01 | -7.26 | -7.26 | -9.50 | -8.05 | -7.83 | -8.17 | -11.40 | -8.93 | -6.20 | -7.75 | -5.91 | -7.25 | -6.61 | -6.29 | -6.04 | -5.81 | -5.65 | -6.48 | -5.75 | -5.67 | 6.52 | 8.39 | 9.95 | 7.41 | 6.65 | 7.71 | 9.02 | 6.81 | 8.17 | 7.78 | 8.58 | NA | NA | NA | NA | NA | NA | NA | NA | NA | |
| Intersegment Elimination, | 3.32 | 4.51 | 4.30 | 4.21 | 6.16 | 4.90 | 4.14 | 2.71 | 16.66 | -2.56 | -2.56 | -2.07 | -2.23 | -3.03 | -2.81 | -1.86 | -1.87 | -2.15 | -1.63 | -2.13 | -2.28 | -2.62 | -2.61 | -1.97 | -1.58 | -1.28 | -1.47 | NA | NA | NA | NA | NA | NA | NA | NA | NA | NA | NA | NA | NA | NA | NA | NA | NA | NA | NA | NA | NA | NA | NA | NA | NA | NA | NA | NA | |
| Intersegment Elimination, | 5.04 | 5.61 | 6.09 | 7.01 | 9.95 | 8.96 | 8.06 | 6.68 | 36.61 | -6.53 | -4.81 | -3.65 | -4.27 | -4.18 | -3.91 | -2.09 | -2.02 | -3.57 | -3.93 | -3.19 | -3.23 | -3.41 | -3.56 | -1.71 | -2.16 | -1.90 | -2.48 | NA | NA | NA | NA | NA | NA | NA | NA | NA | NA | NA | NA | NA | NA | NA | NA | NA | NA | NA | NA | NA | NA | NA | NA | NA | NA | NA | NA | |
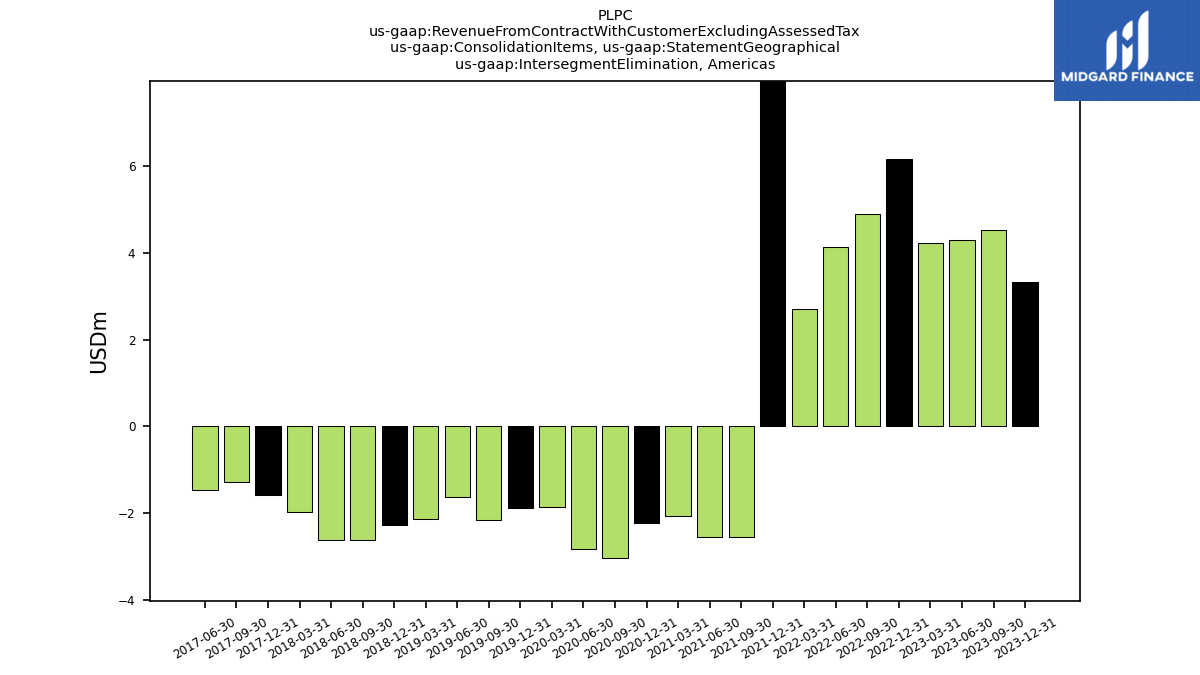
| Intersegment Elimination, Plp Usa | -15.71 | 4.08 | 9.01 | 11.96 | -9.38 | 7.51 | 6.83 | 4.12 | 15.29 | -2.95 | -3.78 | -2.38 | -1.92 | -2.79 | -2.13 | -2.86 | -2.89 | -3.44 | -2.17 | -2.26 | -2.35 | -4.86 | -2.25 | -2.18 | -3.76 | -2.46 | -3.01 | -3.01 | -2.65 | -2.65 | -1.97 | -2.21 | -2.35 | -2.09 | -2.08 | 2.82 | 3.23 | 3.55 | 3.21 | 2.73 | 3.08 | 4.14 | 3.00 | 2.72 | 1.64 | 1.66 | 2.35 | NA | NA | NA | NA | NA | NA | NA | NA | |
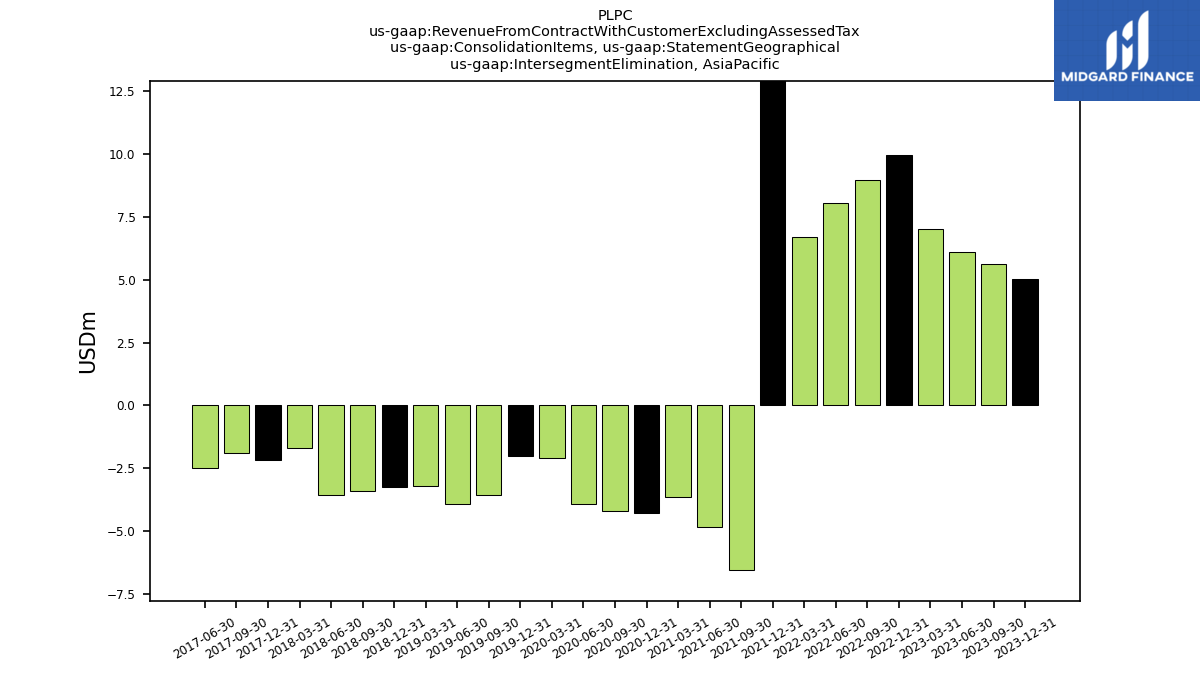
| Intersegment Elimination,EMEA | 2.06 | 3.51 | 1.42 | 1.53 | 0.72 | 0.99 | 0.88 | 0.69 | 5.28 | -0.56 | -1.42 | -0.51 | -1.17 | -0.89 | -1.16 | -0.45 | -0.48 | -0.34 | -0.33 | -0.24 | -0.31 | -0.51 | -0.51 | -0.33 | -0.25 | -0.27 | -0.28 | -0.32 | -0.55 | -0.16 | -0.26 | -0.40 | -0.82 | -0.19 | -0.22 | 0.42 | 0.63 | 0.49 | 0.37 | 0.36 | 0.43 | 0.54 | 2.17 | 0.81 | 1.69 | 1.03 | 0.93 | NA | NA | NA | NA | NA | NA | NA | NA | |
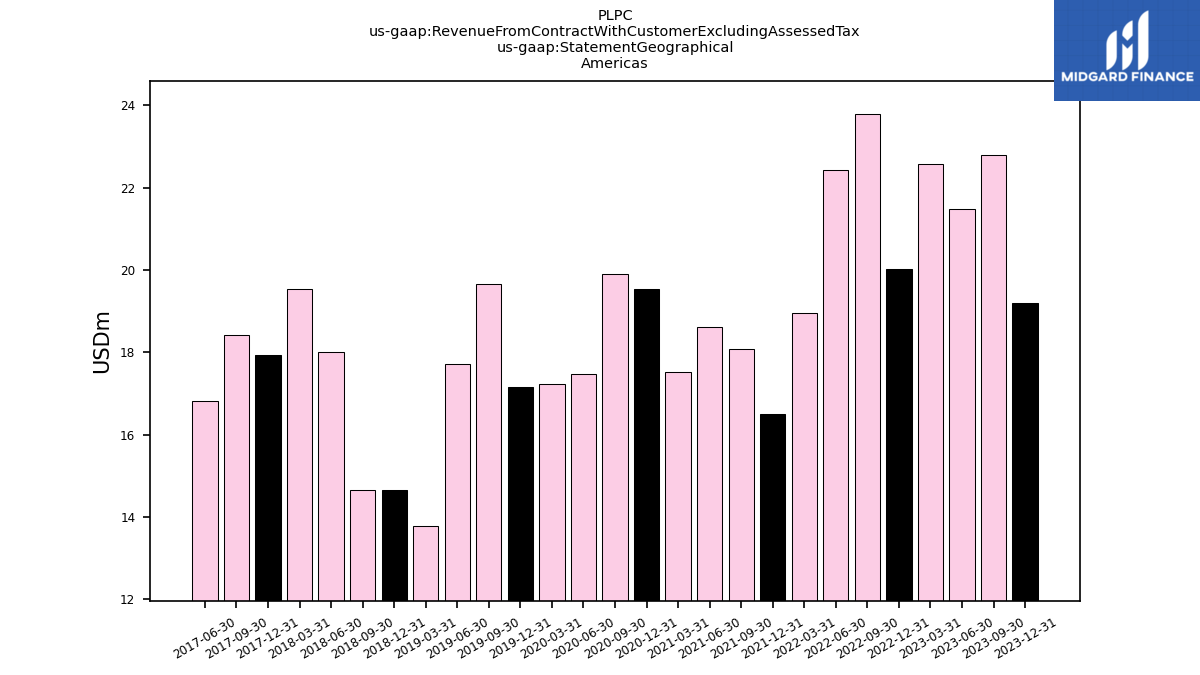
| 19.21 | 22.79 | 21.49 | 22.57 | 20.02 | 23.78 | 22.44 | 18.96 | 16.50 | 18.08 | 18.62 | 17.52 | 19.55 | 19.91 | 17.49 | 17.24 | 17.15 | 19.66 | 17.71 | 13.77 | 14.65 | 14.66 | 18.01 | 19.55 | 17.94 | 18.43 | 16.83 | NA | NA | NA | NA | NA | NA | NA | NA | NA | NA | NA | NA | NA | NA | NA | NA | NA | NA | NA | NA | NA | NA | NA | NA | NA | NA | NA | NA | ||
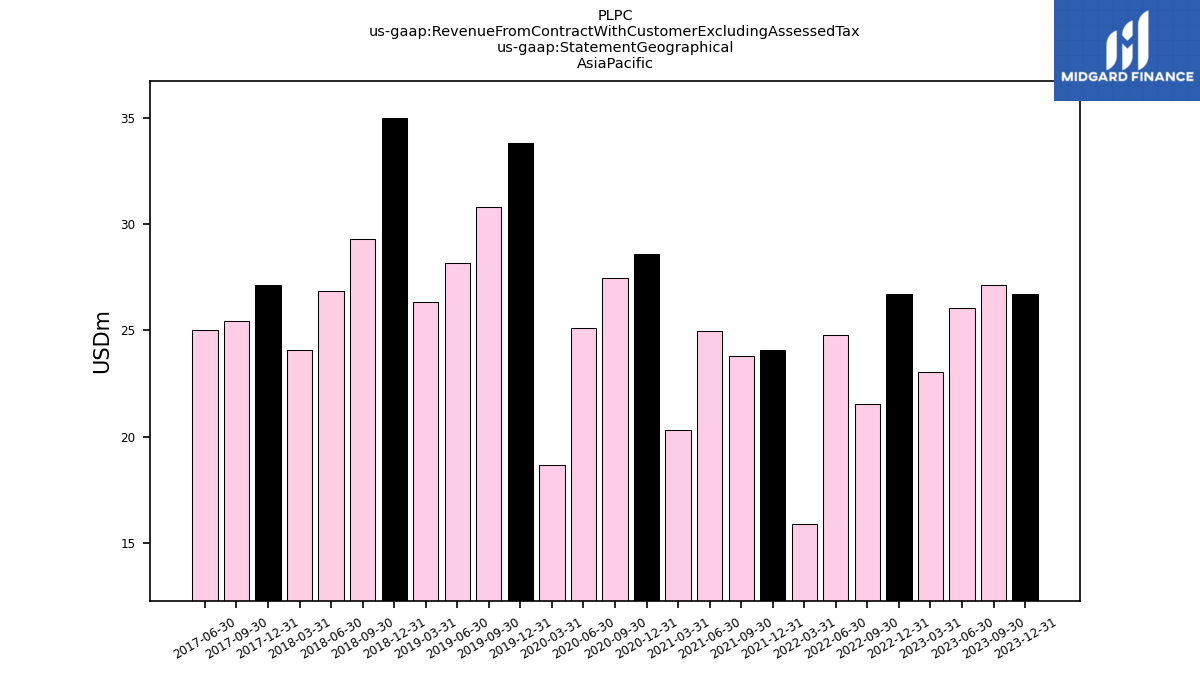
| 26.72 | 27.12 | 26.04 | 23.05 | 26.72 | 21.52 | 24.77 | 15.86 | 24.08 | 23.79 | 24.97 | 20.32 | 28.61 | 27.49 | 25.13 | 18.65 | 33.83 | 30.80 | 28.16 | 26.32 | 35.00 | 29.29 | 26.84 | 24.07 | 27.14 | 25.44 | 25.02 | NA | NA | NA | NA | NA | NA | NA | NA | NA | NA | NA | NA | NA | NA | NA | NA | NA | NA | NA | NA | NA | NA | NA | NA | NA | NA | NA | NA | ||
| Plp Usa | 102.68 | 81.73 | 96.98 | 97.18 | 118.51 | 88.96 | 83.42 | 75.92 | 72.39 | 66.89 | 62.09 | 56.23 | 47.68 | 53.03 | 53.97 | 46.60 | 42.89 | 47.62 | 46.37 | 41.42 | 40.74 | 46.19 | 42.66 | 39.44 | 34.52 | 40.18 | 38.09 | 34.86 | NA | NA | NA | NA | NA | NA | NA | NA | NA | NA | NA | NA | NA | NA | NA | 39.42 | 36.38 | 41.29 | 43.20 | 41.16 | 36.84 | 38.90 | 38.48 | NA | NA | NA | NA | |
| EMEA | -3.01 | 28.80 | 37.31 | 39.03 | 4.67 | 31.14 | 32.84 | 27.47 | 18.47 | 26.62 | 27.35 | 23.48 | 22.67 | 27.03 | 21.05 | 20.36 | 19.78 | 21.13 | 22.61 | 15.63 | 15.02 | 18.27 | 21.40 | 15.08 | 17.30 | 15.19 | 17.58 | 13.85 | NA | NA | NA | NA | NA | NA | NA | NA | NA | NA | NA | NA | NA | NA | NA | NA | NA | NA | NA | NA | NA | NA | NA | NA | NA | NA | NA |