
| 2023-08-27 | 2023-05-28 | 2023-02-26 | 2022-11-27 | 2022-08-28 | 2022-05-29 | 2022-02-27 | 2021-11-28 | 2021-08-29 | 2021-05-31 | 2021-05-30 | 2021-02-28 | 2020-11-29 | 2020-08-30 | 2020-05-31 | 2020-03-01 | 2019-12-01 | 2019-09-01 | 2019-06-02 | 2019-03-03 | 2018-11-25 | 2018-08-26 | 2018-05-27 | 2018-02-25 | 2017-11-26 | 2017-08-27 | 2017-05-28 | 2017-02-26 | 2016-11-27 | 2016-08-28 | 2016-05-29 | 2016-02-28 | 2015-11-29 | 2015-08-30 | 2015-05-31 | 2015-03-01 | 2014-11-30 | 2014-08-31 | 2014-06-01 | 2014-03-02 | 2013-12-01 | 2013-09-01 | 2013-06-02 | 2013-03-03 | 2012-11-25 | 2012-08-26 | 2012-05-27 | 2012-02-26 | 2011-11-27 | 2011-08-28 | 2011-05-29 | 2011-02-27 | 2010-11-28 | 2010-08-29 | ||
|---|---|---|---|---|---|---|---|---|---|---|---|---|---|---|---|---|---|---|---|---|---|---|---|---|---|---|---|---|---|---|---|---|---|---|---|---|---|---|---|---|---|---|---|---|---|---|---|---|---|---|---|---|---|---|---|
| Common Stock Value | 2.10 | 2.10 | 2.10 | 2.10 | 2.10 | 2.10 | 2.10 | 2.10 | 2.10 | NA | 2.10 | 2.10 | 2.10 | NA | NA | 2.10 | 2.10 | NA | NA | 2.10 | NA | NA | NA | 2.10 | 2.10 | 2.10 | 2.10 | 2.10 | 2.10 | 2.10 | 2.10 | 2.10 | 2.10 | 2.10 | 2.10 | 2.10 | 2.10 | 2.10 | 2.09 | 2.09 | 2.09 | 2.08 | 2.08 | 2.08 | 2.08 | 2.08 | 2.08 | 2.08 | 2.08 | 2.08 | NA | 2.07 | NA | NA | |
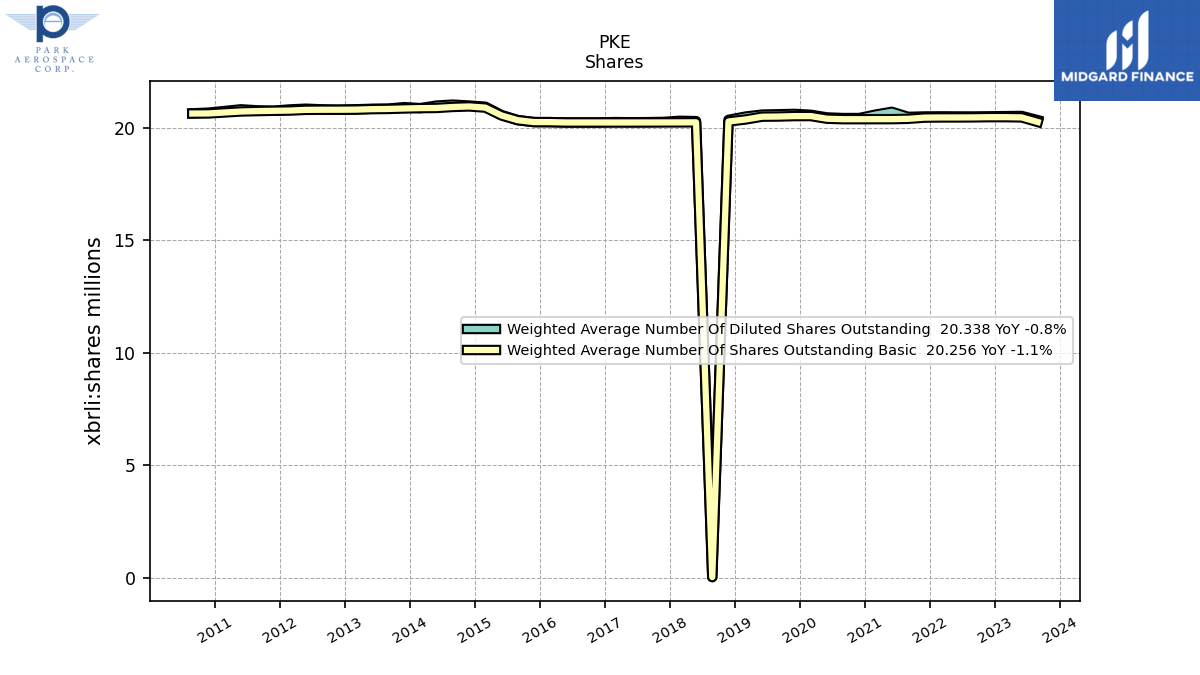
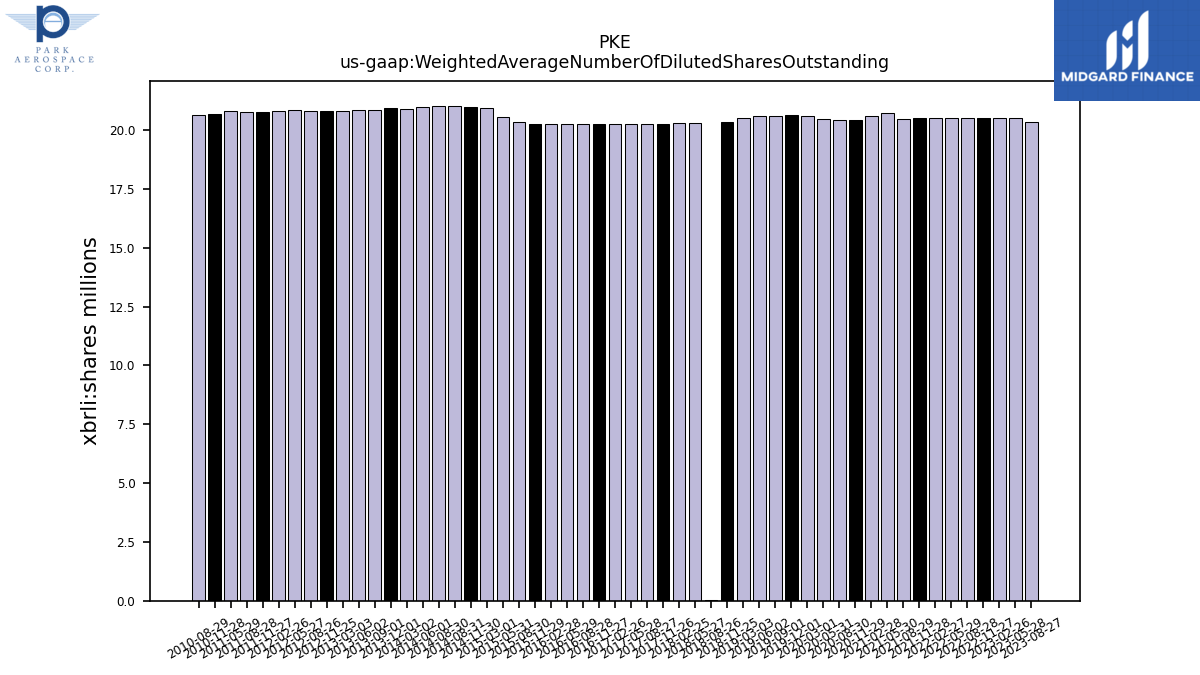
| Weighted Average Number Of Diluted Shares Outstanding | 20.34 | 20.53 | 20.52 | 20.51 | 20.50 | 20.50 | 20.51 | 20.50 | 20.48 | NA | 20.71 | 20.59 | 20.43 | 20.43 | 20.46 | 20.58 | 20.62 | 20.60 | 20.59 | 20.50 | 20.35 | 0.02 | 20.30 | 20.31 | 20.26 | 20.25 | 20.24 | 20.25 | 20.23 | 20.23 | 20.23 | 20.25 | 20.25 | 20.34 | 20.57 | 20.94 | 20.99 | 21.03 | 20.99 | 20.87 | 20.92 | 20.85 | 20.84 | 20.82 | 20.80 | 20.82 | 20.85 | 20.82 | 20.76 | 20.78 | 20.82 | NA | 20.67 | 20.64 | |
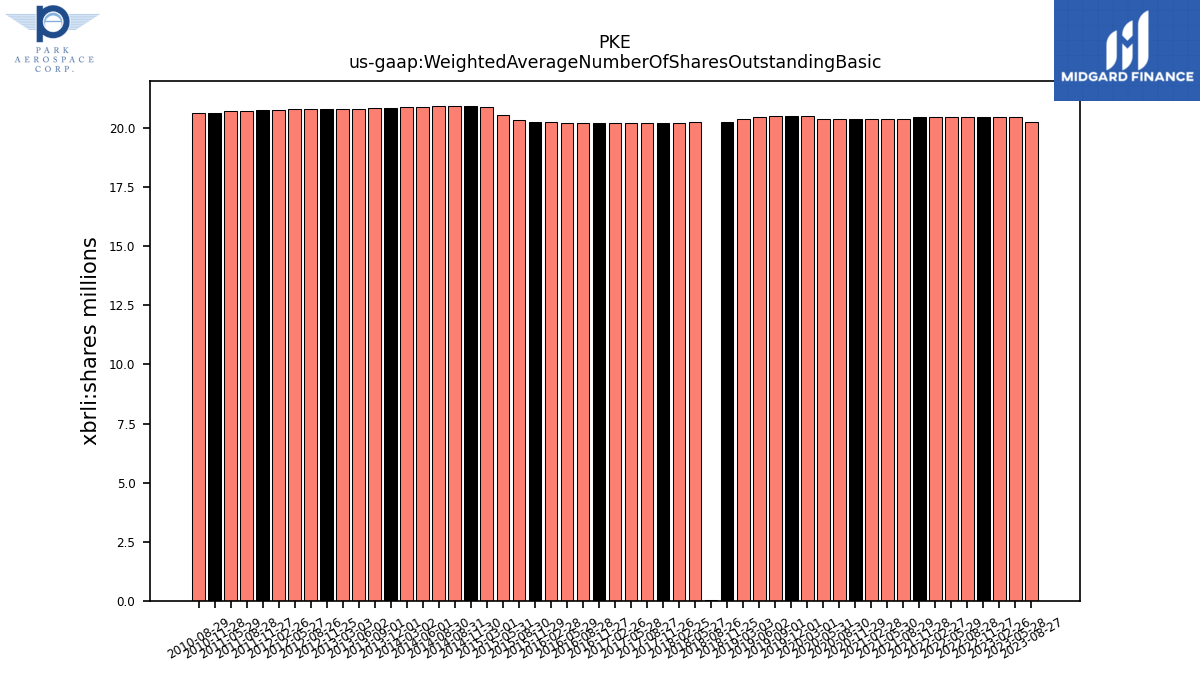
| Weighted Average Number Of Shares Outstanding Basic | 20.26 | 20.46 | 20.47 | 20.47 | 20.46 | 20.46 | 20.46 | 20.45 | 20.40 | NA | 20.38 | 20.38 | 20.38 | 20.38 | 20.40 | 20.52 | 20.52 | 20.50 | 20.49 | 20.37 | 20.28 | 0.02 | 20.24 | 20.24 | 20.24 | 20.24 | 20.23 | 20.23 | 20.23 | 20.23 | 20.23 | 20.25 | 20.25 | 20.34 | 20.55 | 20.90 | 20.95 | 20.93 | 20.88 | 20.87 | 20.86 | 20.84 | 20.83 | 20.81 | 20.80 | 20.80 | 20.80 | 20.76 | 20.75 | 20.74 | 20.72 | NA | 20.64 | 20.63 |
| 2023-08-27 | 2023-05-28 | 2023-02-26 | 2022-11-27 | 2022-08-28 | 2022-05-29 | 2022-02-27 | 2021-11-28 | 2021-08-29 | 2021-05-31 | 2021-05-30 | 2021-02-28 | 2020-11-29 | 2020-08-30 | 2020-05-31 | 2020-03-01 | 2019-12-01 | 2019-09-01 | 2019-06-02 | 2019-03-03 | 2018-11-25 | 2018-08-26 | 2018-05-27 | 2018-02-25 | 2017-11-26 | 2017-08-27 | 2017-05-28 | 2017-02-26 | 2016-11-27 | 2016-08-28 | 2016-05-29 | 2016-02-28 | 2015-11-29 | 2015-08-30 | 2015-05-31 | 2015-03-01 | 2014-11-30 | 2014-08-31 | 2014-06-01 | 2014-03-02 | 2013-12-01 | 2013-09-01 | 2013-06-02 | 2013-03-03 | 2012-11-25 | 2012-08-26 | 2012-05-27 | 2012-02-26 | 2011-11-27 | 2011-08-28 | 2011-05-29 | 2011-02-27 | 2010-11-28 | 2010-08-29 | ||
|---|---|---|---|---|---|---|---|---|---|---|---|---|---|---|---|---|---|---|---|---|---|---|---|---|---|---|---|---|---|---|---|---|---|---|---|---|---|---|---|---|---|---|---|---|---|---|---|---|---|---|---|---|---|---|---|
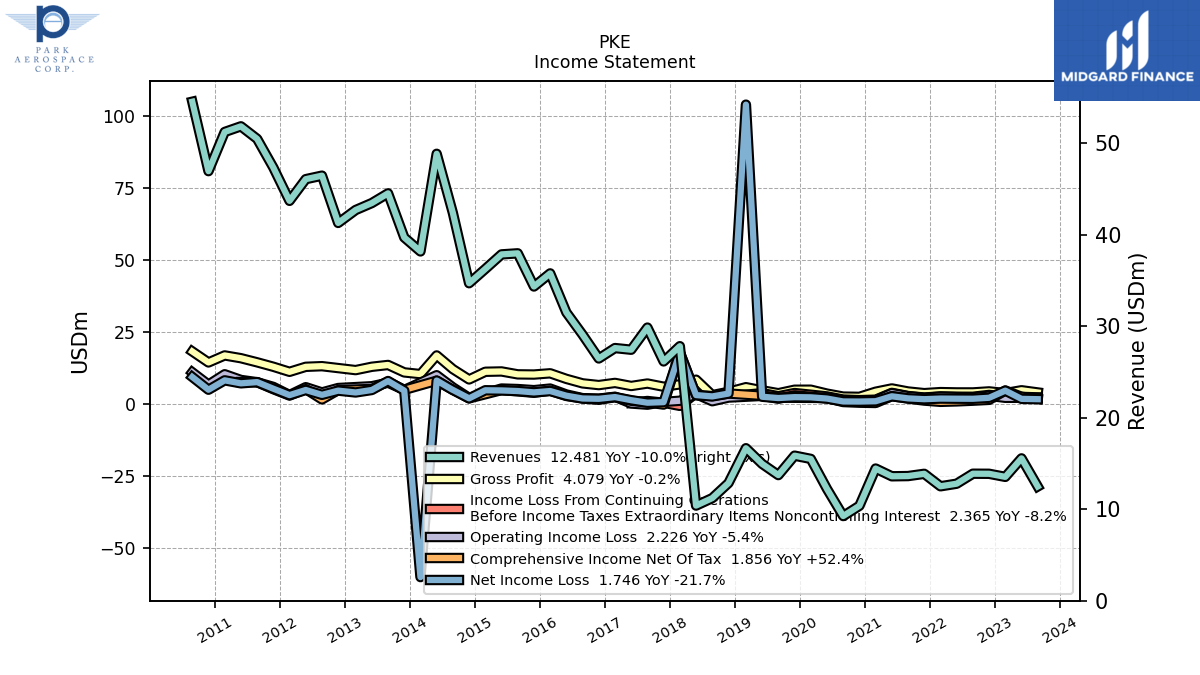
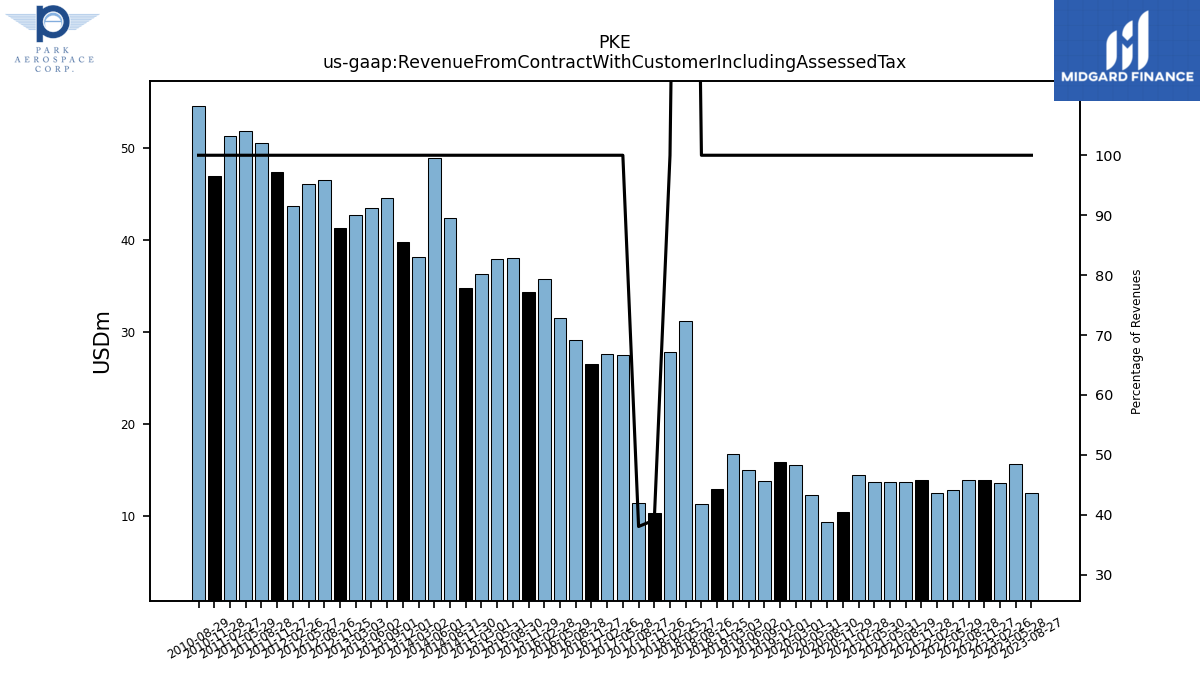
| Revenue From Contract With Customer Including Assessed Tax | 12.48 | 15.55 | 13.53 | 13.87 | 13.88 | 12.78 | 12.50 | 13.86 | 13.62 | 13.59 | 13.59 | 14.44 | 10.37 | 9.25 | 12.21 | 15.49 | 15.85 | 13.72 | 14.95 | 16.66 | 12.85 | 11.21 | 31.10 | 27.80 | 10.23 | 11.36 | 27.42 | 27.60 | 26.46 | 29.06 | 31.49 | 35.76 | 34.32 | 37.95 | 37.83 | 36.24 | 34.68 | 42.35 | 48.82 | 38.15 | 39.68 | 44.50 | 43.44 | 42.67 | 41.27 | 46.43 | 46.05 | 43.68 | 47.31 | 50.45 | 51.82 | 51.20 | 46.92 | 54.51 | |
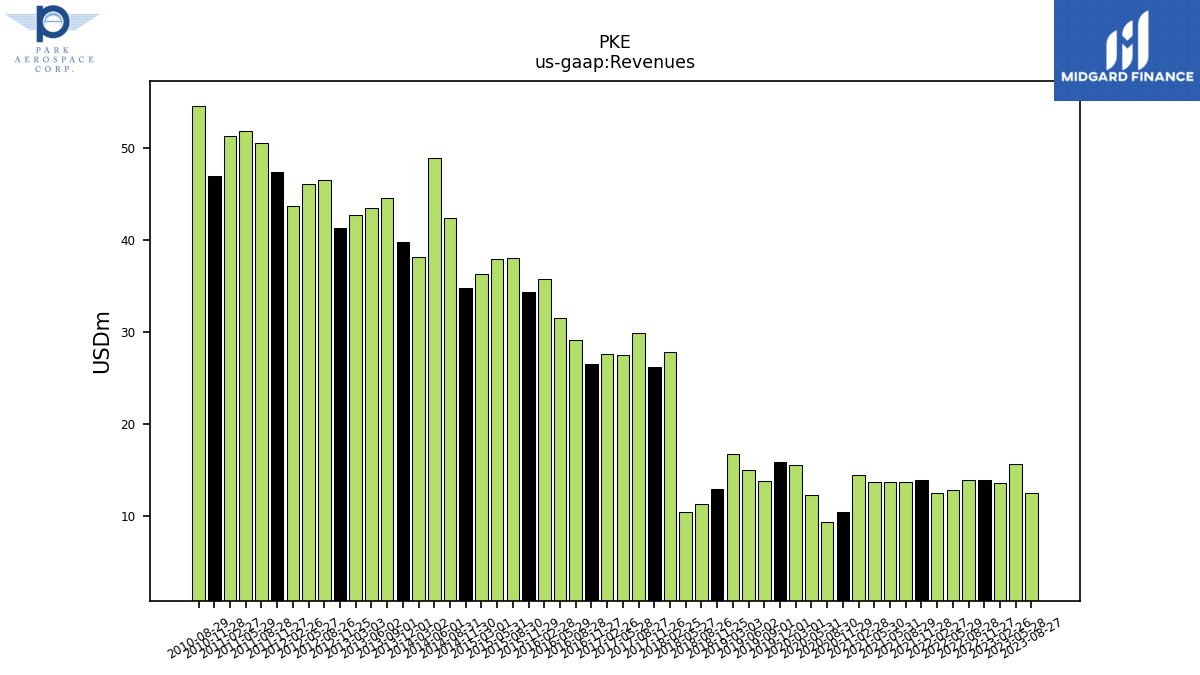
| Revenues | 12.48 | 15.55 | 13.53 | 13.87 | 13.88 | 12.78 | 12.50 | 13.86 | 13.62 | 13.59 | 13.59 | 14.44 | 10.37 | 9.25 | 12.21 | 15.49 | 15.85 | 13.72 | 14.95 | 16.66 | 12.85 | 11.21 | 10.39 | 27.80 | 26.14 | 29.84 | 27.42 | 27.60 | 26.46 | 29.06 | 31.49 | 35.76 | 34.32 | 37.95 | 37.83 | 36.24 | 34.68 | 42.35 | 48.82 | 38.15 | 39.68 | 44.50 | 43.44 | 42.67 | 41.27 | 46.43 | 46.05 | 43.68 | 47.31 | 50.45 | 51.82 | 51.20 | 46.92 | 54.51 | |
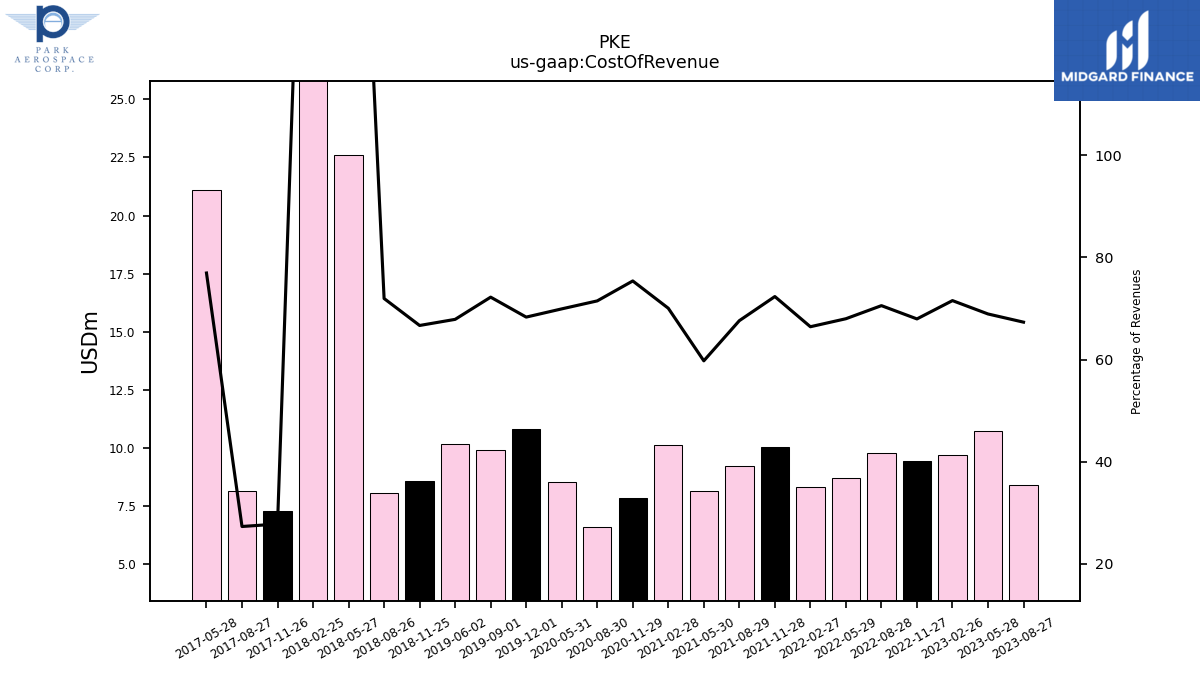
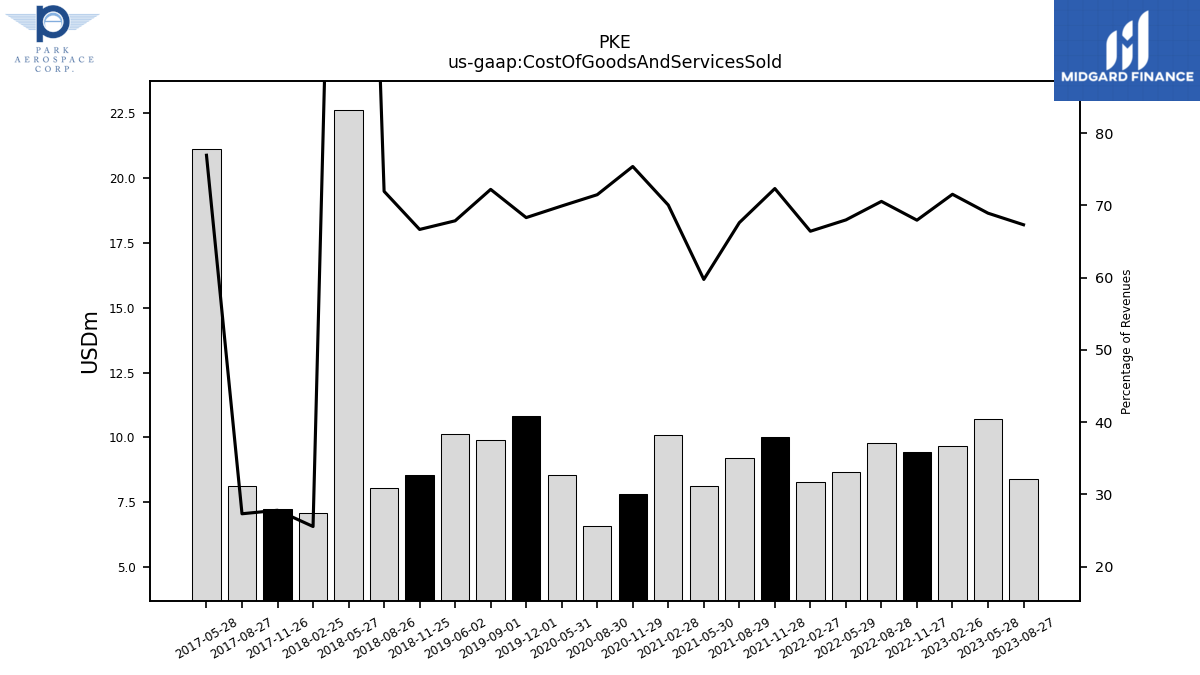
| Cost Of Revenue | 8.40 | 10.72 | 9.68 | 9.42 | 9.79 | 8.69 | 8.30 | 10.03 | 9.21 | NA | 8.12 | 10.12 | 7.82 | 6.61 | 8.54 | NA | 10.82 | 9.91 | 10.15 | NA | 8.57 | 8.07 | 22.59 | 62.90 | 7.26 | 8.15 | 21.09 | NA | NA | NA | NA | NA | NA | NA | NA | NA | NA | NA | NA | NA | NA | NA | NA | NA | NA | NA | NA | NA | NA | NA | NA | NA | NA | NA | |
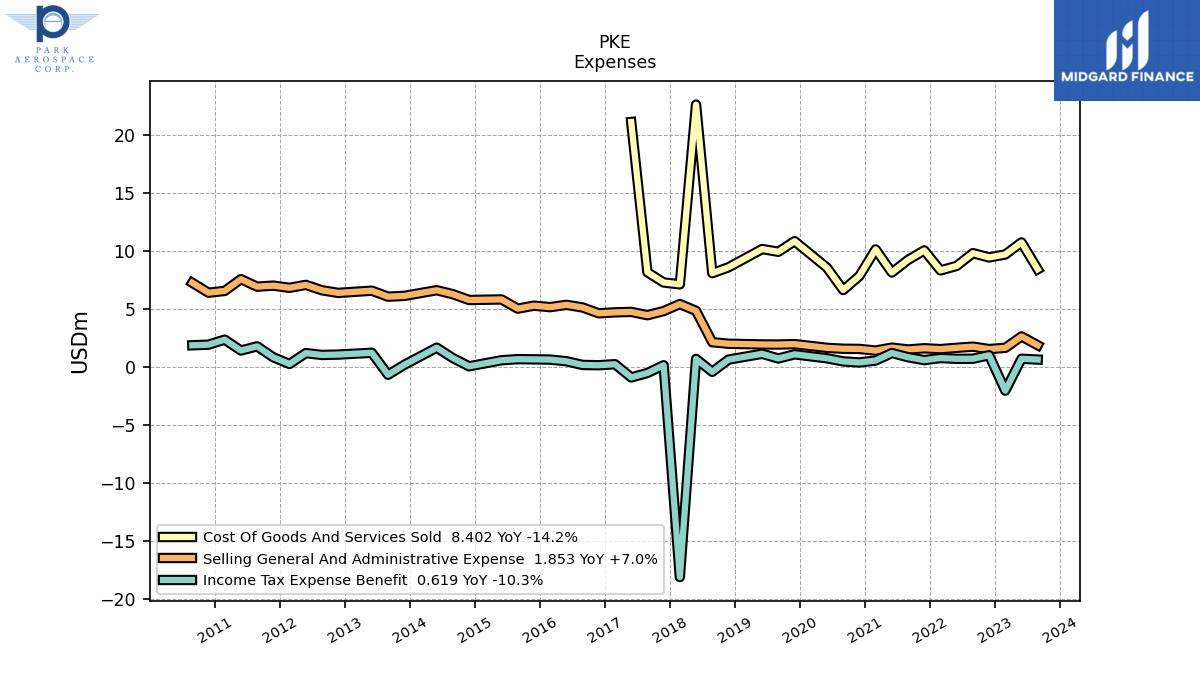
| Cost Of Goods And Services Sold | 8.40 | 10.72 | 9.68 | 9.42 | 9.79 | 8.69 | 8.30 | 10.03 | 9.21 | NA | 8.12 | 10.12 | 7.82 | 6.61 | 8.54 | NA | 10.82 | 9.91 | 10.15 | NA | 8.57 | 8.07 | 22.59 | 7.10 | 7.26 | 8.15 | 21.09 | NA | NA | NA | NA | NA | NA | NA | NA | NA | NA | NA | NA | NA | NA | NA | NA | NA | NA | NA | NA | NA | NA | NA | NA | NA | NA | NA | |
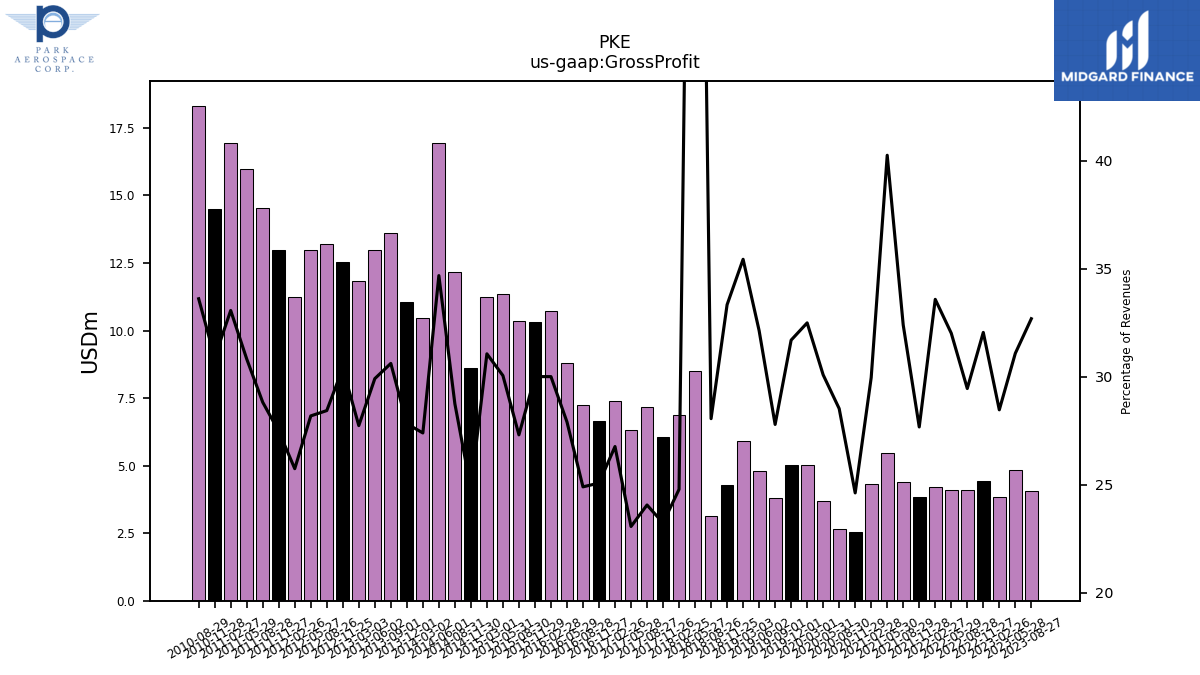
| Gross Profit | 4.08 | 4.83 | 3.85 | 4.44 | 4.09 | 4.09 | 4.20 | 3.84 | 4.41 | NA | 5.47 | 4.33 | 2.55 | 2.64 | 3.67 | 5.03 | 5.02 | 3.81 | 4.80 | 5.90 | 4.28 | 3.15 | 8.51 | 6.89 | 6.07 | 7.18 | 6.32 | 7.39 | 6.63 | 7.23 | 8.79 | 10.73 | 10.30 | 10.36 | 11.37 | 11.26 | 8.60 | 12.17 | 16.93 | 10.45 | 11.04 | 13.62 | 12.99 | 11.84 | 12.54 | 13.20 | 12.98 | 11.24 | 13.00 | 14.54 | 15.97 | 16.93 | 14.49 | 18.32 | |
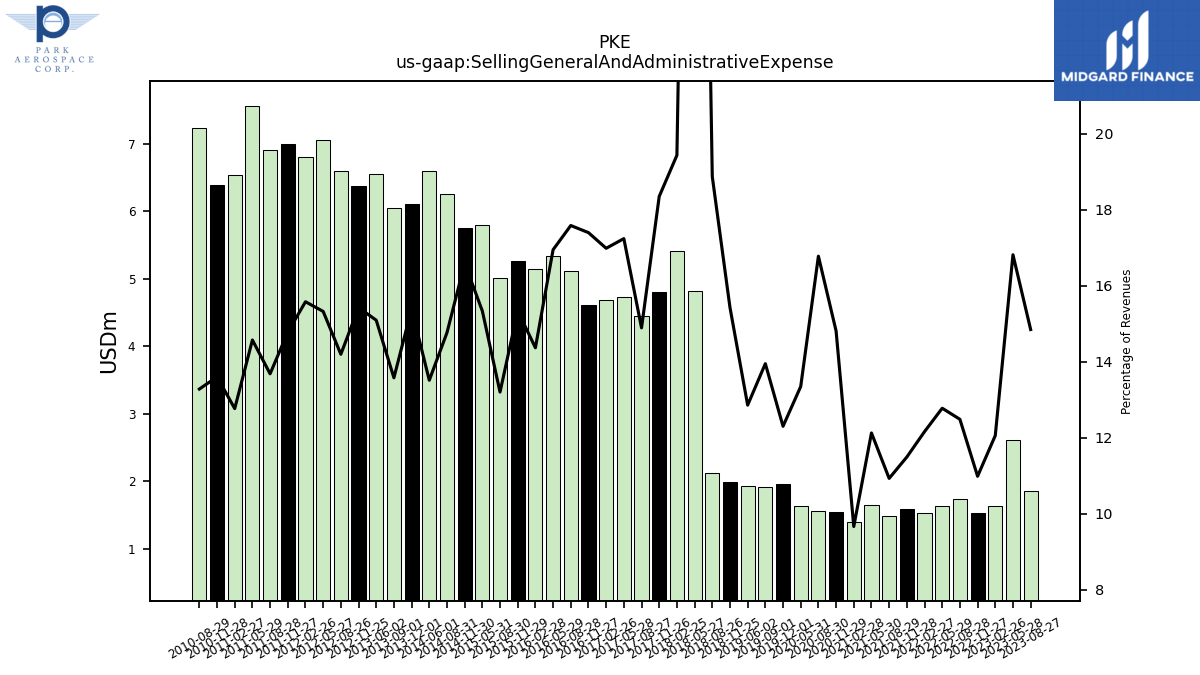
| Selling General And Administrative Expense | 1.85 | 2.62 | 1.63 | 1.52 | 1.73 | 1.63 | 1.52 | 1.59 | 1.49 | NA | 1.65 | 1.40 | 1.54 | 1.55 | 1.63 | NA | 1.95 | 1.91 | 1.92 | NA | 1.98 | 2.12 | 4.82 | 5.40 | 4.80 | 4.44 | 4.73 | 4.69 | 4.60 | 5.11 | 5.34 | 5.14 | 5.26 | 5.01 | 5.80 | NA | 5.75 | 6.25 | 6.60 | NA | 6.11 | 6.04 | 6.56 | NA | 6.37 | 6.59 | 7.06 | 6.80 | 6.99 | 6.90 | 7.55 | 6.54 | 6.38 | 7.24 | |
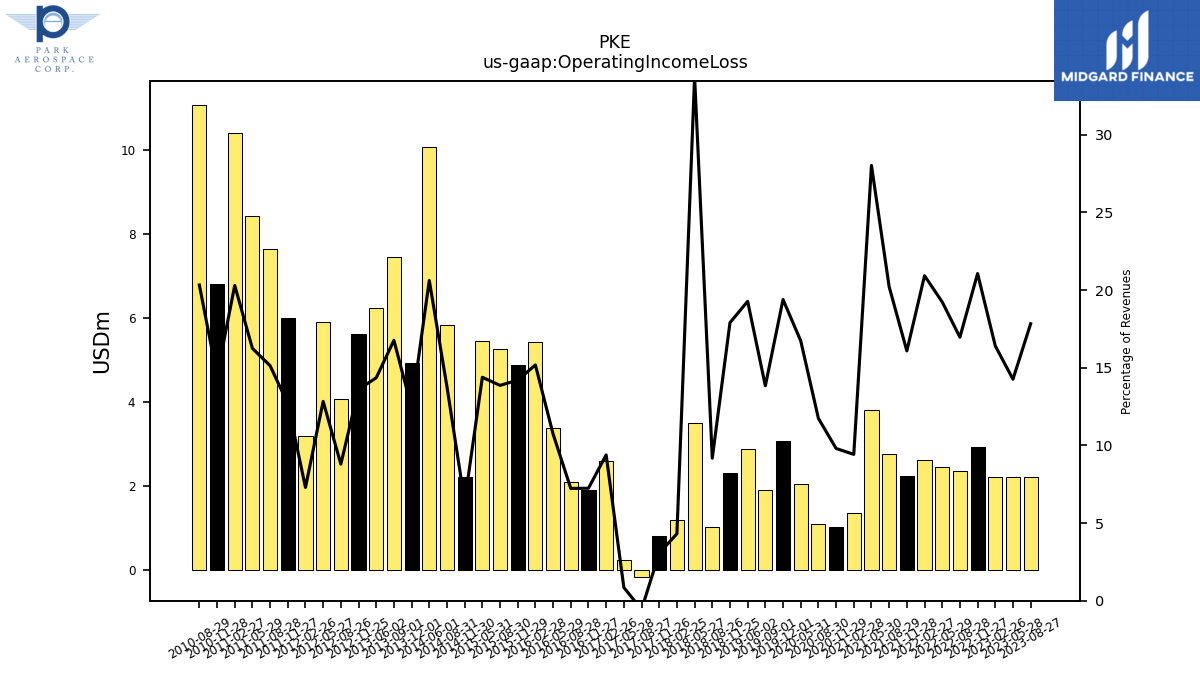
| Operating Income Loss | 2.23 | 2.22 | 2.22 | 2.92 | 2.35 | 2.46 | 2.62 | 2.23 | 2.75 | NA | 3.81 | 1.36 | 1.02 | 1.09 | 2.04 | NA | 3.07 | 1.90 | 2.88 | NA | 2.30 | 1.03 | 3.51 | 1.20 | 0.80 | -0.17 | 0.23 | 2.59 | 1.92 | 2.10 | 3.38 | 5.43 | 4.88 | 5.26 | 5.44 | NA | 2.21 | 5.84 | 10.07 | NA | 4.93 | 7.46 | 6.24 | NA | 5.62 | 4.08 | 5.91 | 3.19 | 6.00 | 7.63 | 8.42 | 10.39 | 6.80 | 11.08 | |
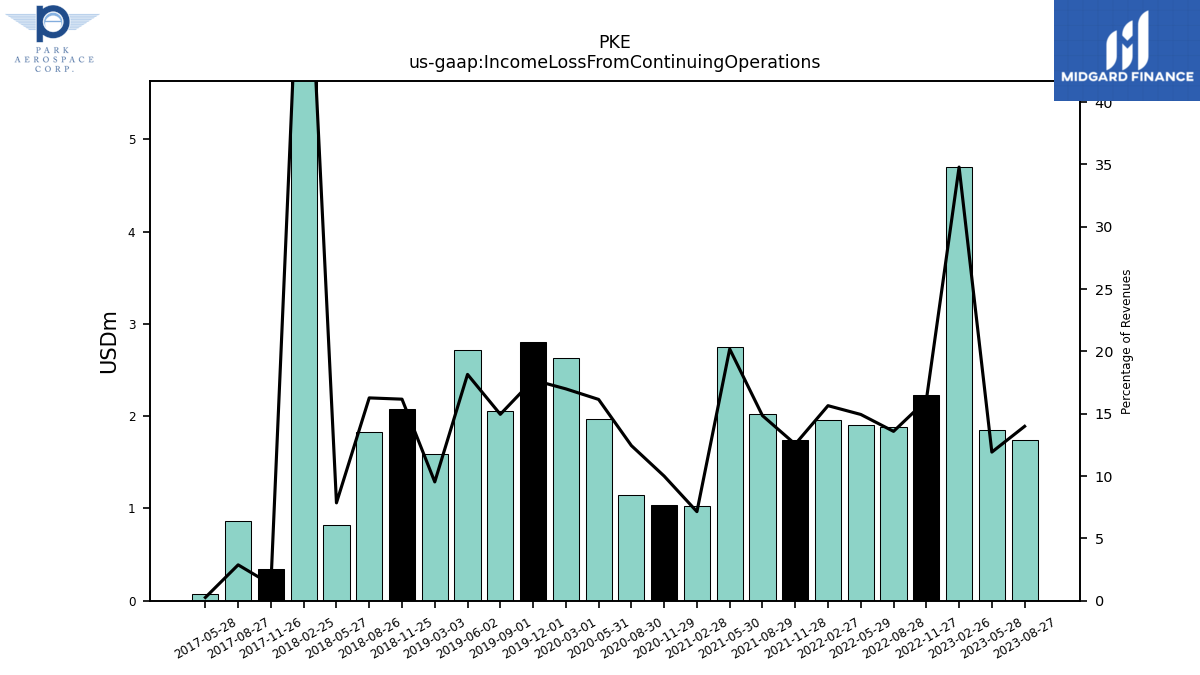
| Income Loss From Continuing Operations | 1.75 | 1.85 | 4.71 | 2.23 | 1.89 | 1.91 | 1.96 | 1.74 | 2.02 | NA | 2.75 | 1.03 | 1.04 | 1.15 | 1.97 | 2.63 | 2.81 | 2.05 | 2.71 | 1.59 | 2.08 | 1.82 | 0.82 | 17.20 | 0.34 | 0.86 | 0.07 | NA | NA | NA | NA | NA | NA | NA | NA | NA | NA | NA | NA | NA | NA | NA | NA | NA | NA | NA | NA | NA | NA | NA | NA | NA | NA | NA | |
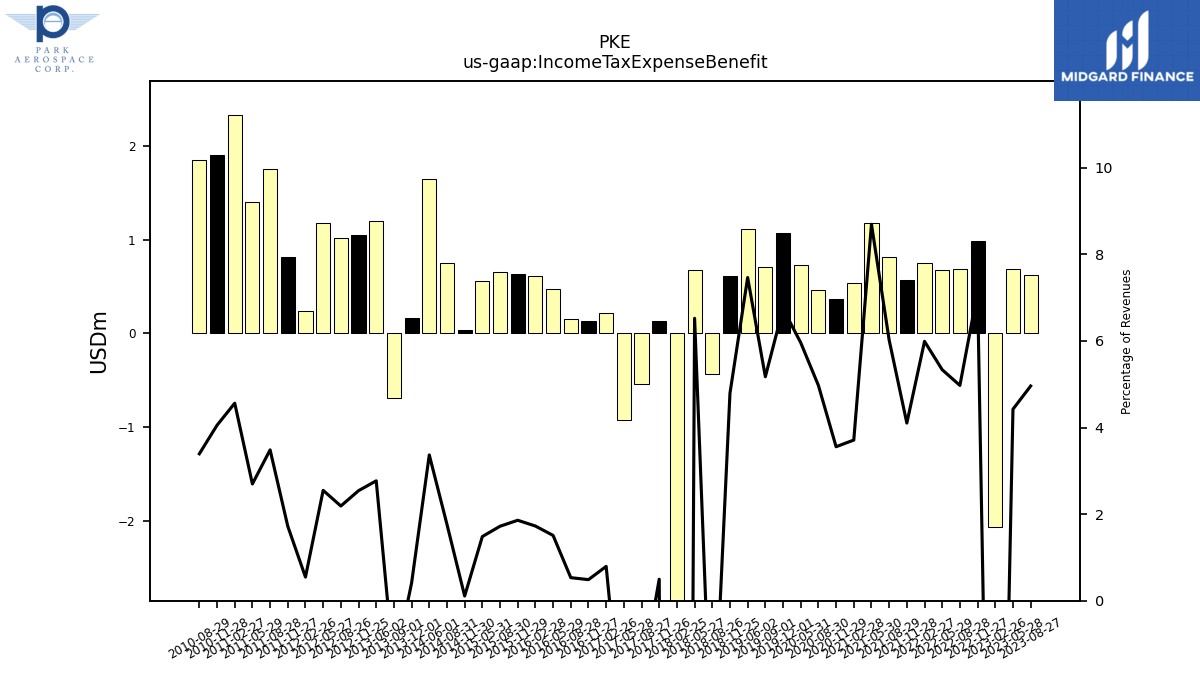
| Income Tax Expense Benefit | 0.62 | 0.69 | -2.06 | 0.99 | 0.69 | 0.68 | 0.75 | 0.57 | 0.82 | NA | 1.18 | 0.54 | 0.37 | 0.46 | 0.73 | NA | 1.07 | 0.71 | 1.12 | NA | 0.62 | -0.44 | 0.68 | -18.13 | 0.13 | -0.54 | -0.92 | 0.22 | 0.13 | 0.15 | 0.47 | 0.62 | 0.64 | 0.65 | 0.56 | NA | 0.04 | 0.75 | 1.64 | NA | 0.16 | -0.69 | 1.20 | NA | 1.05 | 1.02 | 1.17 | 0.24 | 0.81 | 1.76 | 1.40 | 2.34 | 1.90 | 1.85 | |
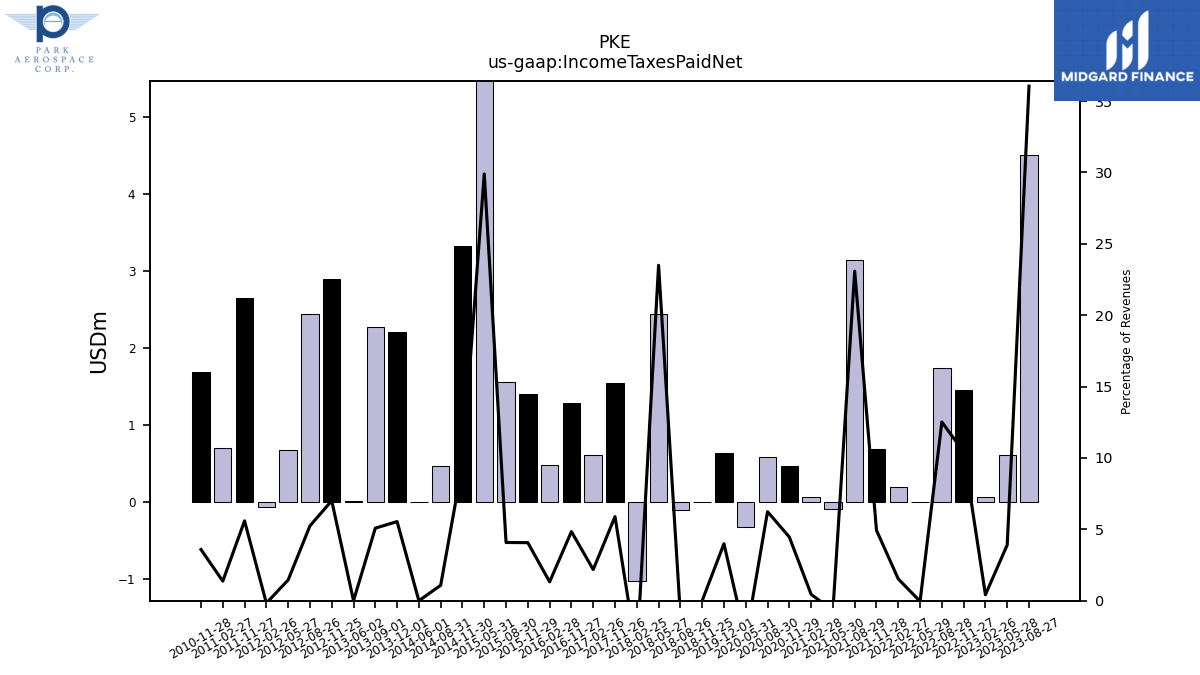
| Income Taxes Paid Net | 4.50 | 0.61 | 0.06 | 1.45 | 1.74 | -0.01 | 0.19 | 0.68 | 3.14 | NA | -0.10 | 0.07 | 0.46 | 0.58 | -0.32 | NA | 0.63 | NA | NA | NA | 0.00 | -0.11 | 2.44 | -1.03 | 1.54 | NA | NA | 0.60 | 1.28 | NA | NA | 0.47 | 1.40 | 1.55 | 11.31 | NA | 3.32 | 0.46 | 0.00 | NA | 2.20 | 2.26 | 0.00 | NA | 2.89 | 2.44 | 0.67 | -0.07 | 2.65 | NA | NA | 0.70 | 1.68 | NA | |
| Net Income Loss | 1.75 | 1.85 | 4.71 | 2.23 | 1.89 | 1.91 | 1.96 | 1.74 | 2.02 | NA | 2.75 | 1.03 | 0.92 | 0.95 | 1.96 | 2.38 | 2.45 | 2.13 | 2.59 | 103.99 | 3.69 | 2.70 | 3.17 | 17.96 | 0.72 | 0.52 | 1.39 | 2.48 | 1.88 | 1.98 | 2.95 | 4.57 | 4.11 | 4.57 | 4.78 | 4.84 | 2.03 | 4.96 | 8.22 | -60.02 | 4.72 | 8.04 | 4.93 | 4.07 | 4.71 | 3.25 | 4.93 | 3.15 | 5.38 | 7.67 | 7.24 | 8.29 | 5.02 | 9.45 | |
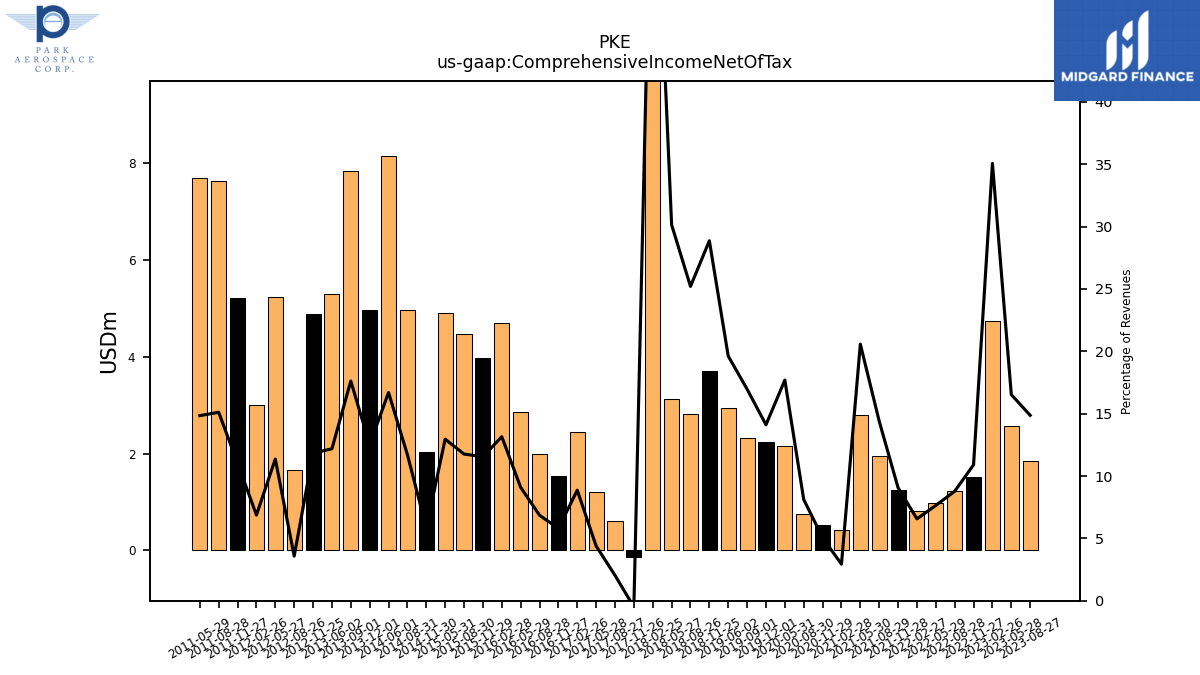
| Comprehensive Income Net Of Tax | 1.86 | 2.57 | 4.75 | 1.51 | 1.22 | 0.98 | 0.82 | 1.26 | 1.96 | NA | 2.80 | 0.42 | 0.52 | 0.75 | 2.16 | NA | 2.24 | 2.33 | 2.93 | NA | 3.71 | 2.83 | 3.13 | 18.02 | -0.13 | 0.61 | 1.20 | 2.45 | 1.53 | 1.99 | 2.87 | 4.70 | 3.96 | 4.46 | 4.90 | NA | 2.03 | 4.96 | 8.15 | NA | 4.97 | 7.84 | 5.29 | NA | 4.88 | 1.66 | 5.23 | 3.00 | 5.22 | 7.62 | 7.69 | NA | NA | NA |
| 2023-08-27 | 2023-05-28 | 2023-02-26 | 2022-11-27 | 2022-08-28 | 2022-05-29 | 2022-02-27 | 2021-11-28 | 2021-08-29 | 2021-05-31 | 2021-05-30 | 2021-02-28 | 2020-11-29 | 2020-08-30 | 2020-05-31 | 2020-03-01 | 2019-12-01 | 2019-09-01 | 2019-06-02 | 2019-03-03 | 2018-11-25 | 2018-08-26 | 2018-05-27 | 2018-02-25 | 2017-11-26 | 2017-08-27 | 2017-05-28 | 2017-02-26 | 2016-11-27 | 2016-08-28 | 2016-05-29 | 2016-02-28 | 2015-11-29 | 2015-08-30 | 2015-05-31 | 2015-03-01 | 2014-11-30 | 2014-08-31 | 2014-06-01 | 2014-03-02 | 2013-12-01 | 2013-09-01 | 2013-06-02 | 2013-03-03 | 2012-11-25 | 2012-08-26 | 2012-05-27 | 2012-02-26 | 2011-11-27 | 2011-08-28 | 2011-05-29 | 2011-02-27 | 2010-11-28 | 2010-08-29 | ||
|---|---|---|---|---|---|---|---|---|---|---|---|---|---|---|---|---|---|---|---|---|---|---|---|---|---|---|---|---|---|---|---|---|---|---|---|---|---|---|---|---|---|---|---|---|---|---|---|---|---|---|---|---|---|---|---|
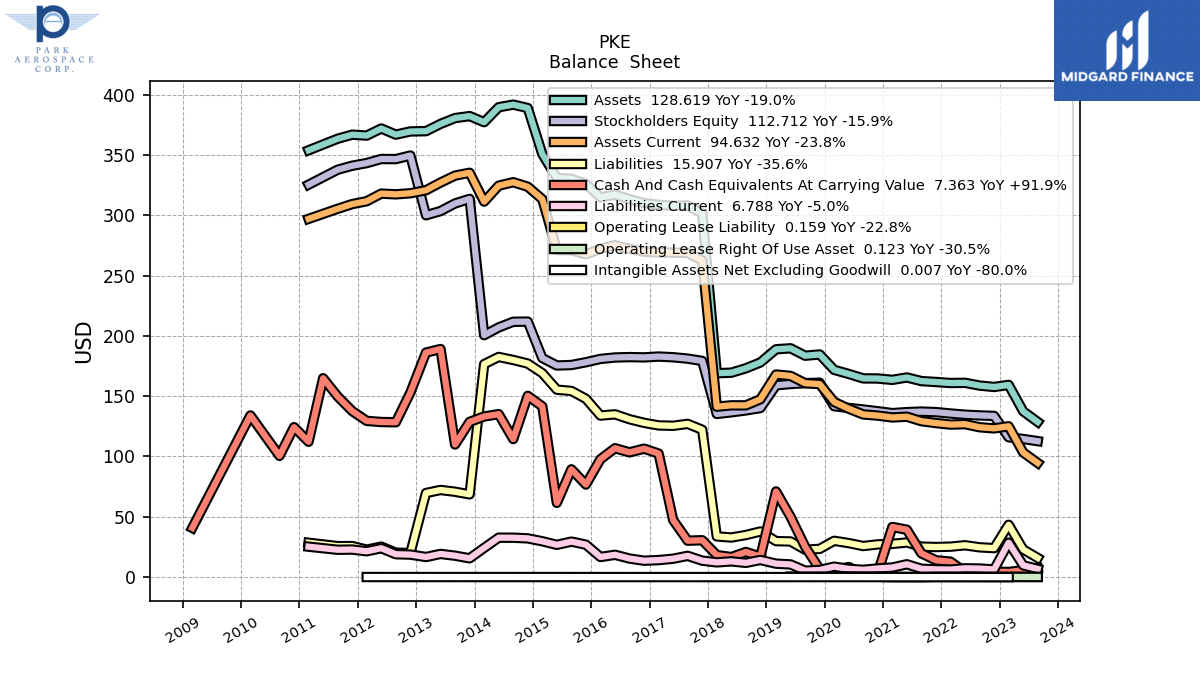
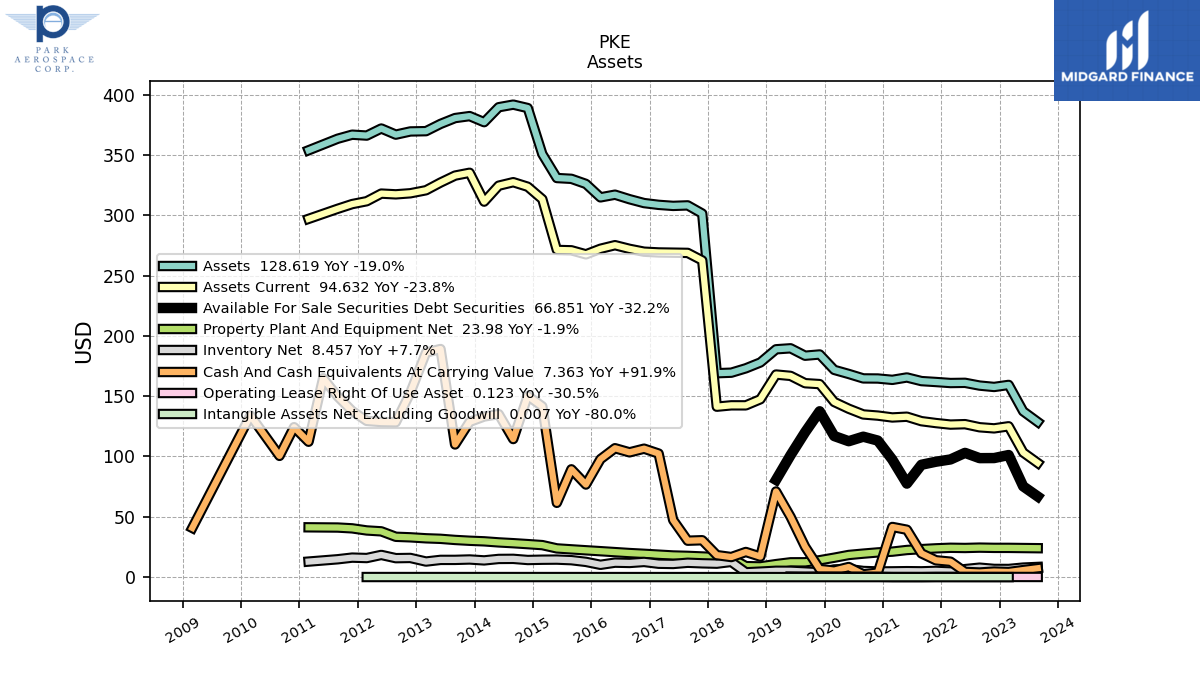
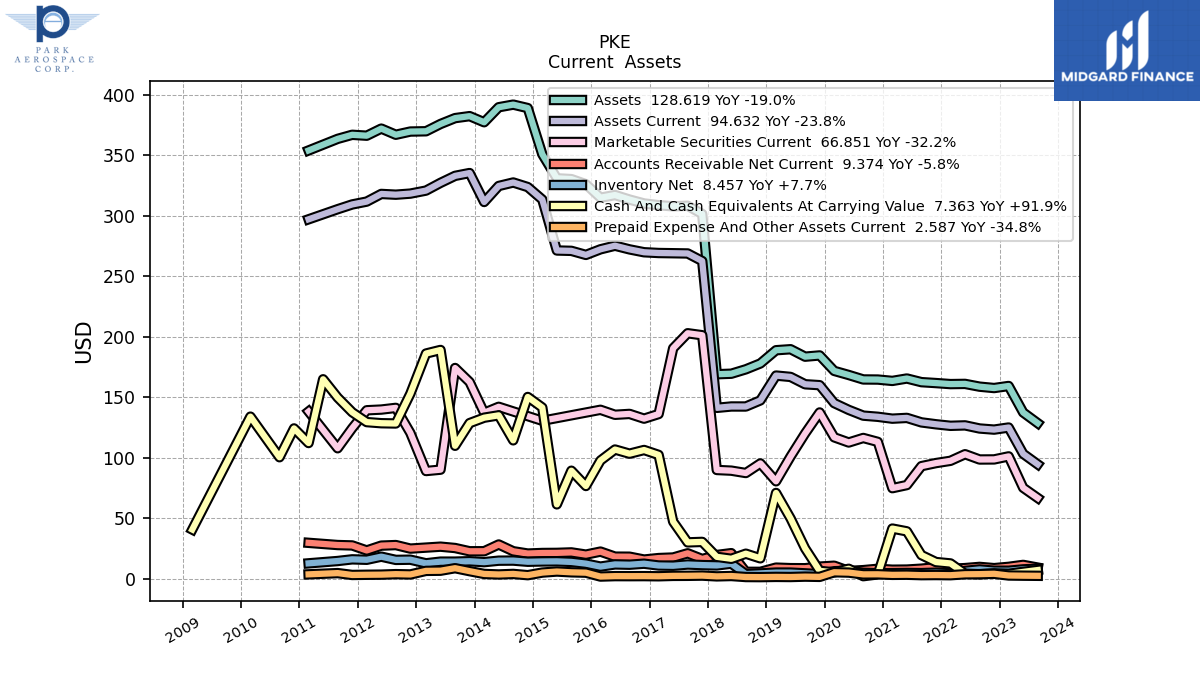
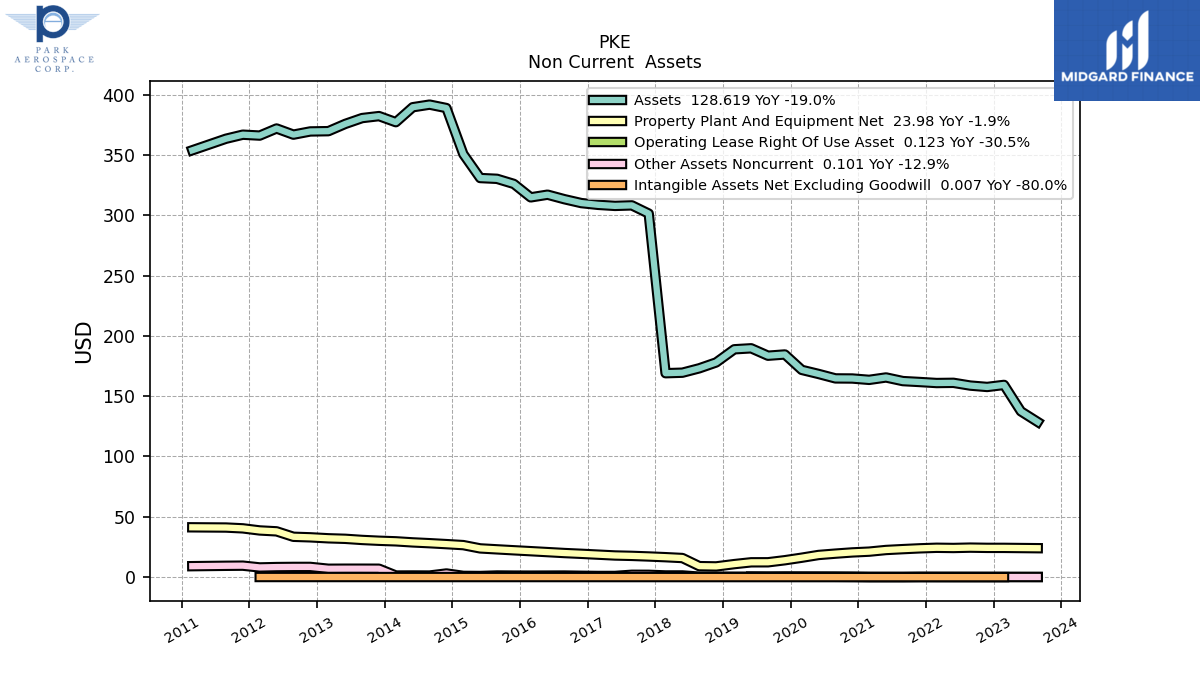
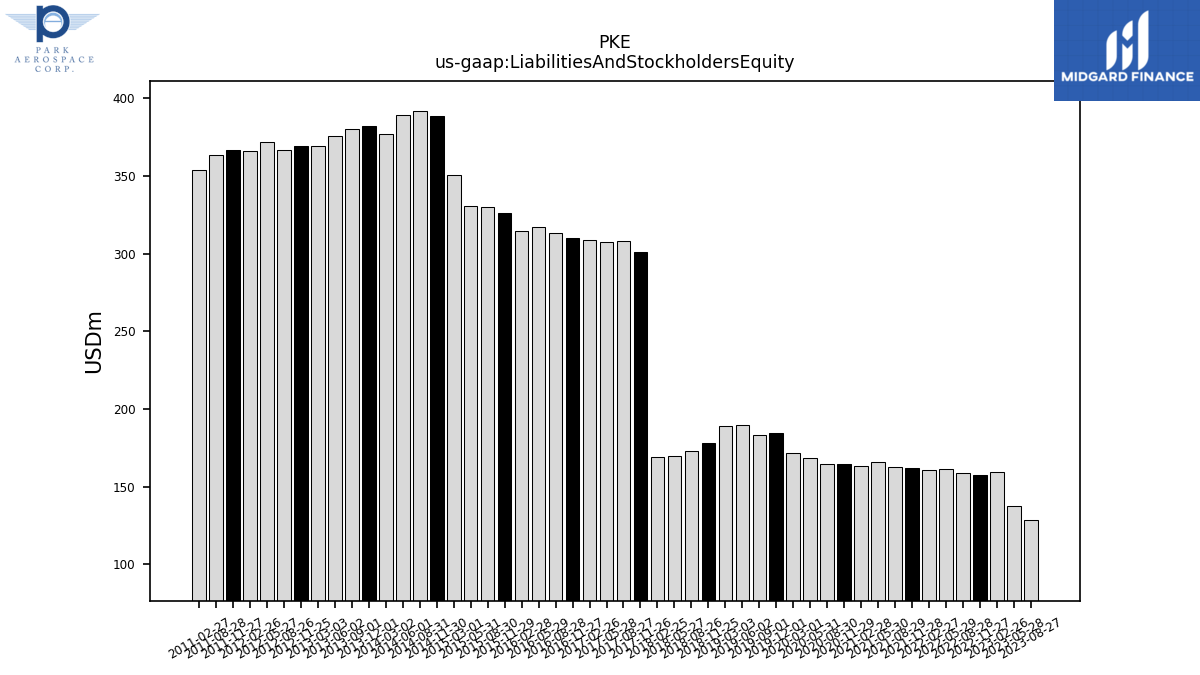
| Assets | 128.62 | 137.44 | 159.33 | 157.63 | 158.77 | 161.05 | 160.89 | 161.74 | 162.50 | NA | 165.50 | 163.51 | 164.64 | 164.72 | 168.40 | 171.79 | 184.56 | 183.53 | 189.68 | 188.85 | 177.94 | 173.10 | 169.46 | 169.02 | 301.35 | 308.14 | 307.71 | 308.58 | 310.04 | 313.25 | 317.00 | 314.78 | 325.92 | 330.15 | 330.81 | 350.68 | 388.81 | 391.65 | 389.49 | 377.09 | 382.14 | 380.50 | 375.67 | 369.66 | 369.42 | 366.77 | 371.87 | 365.99 | 366.74 | 363.38 | NA | 353.81 | NA | NA | |
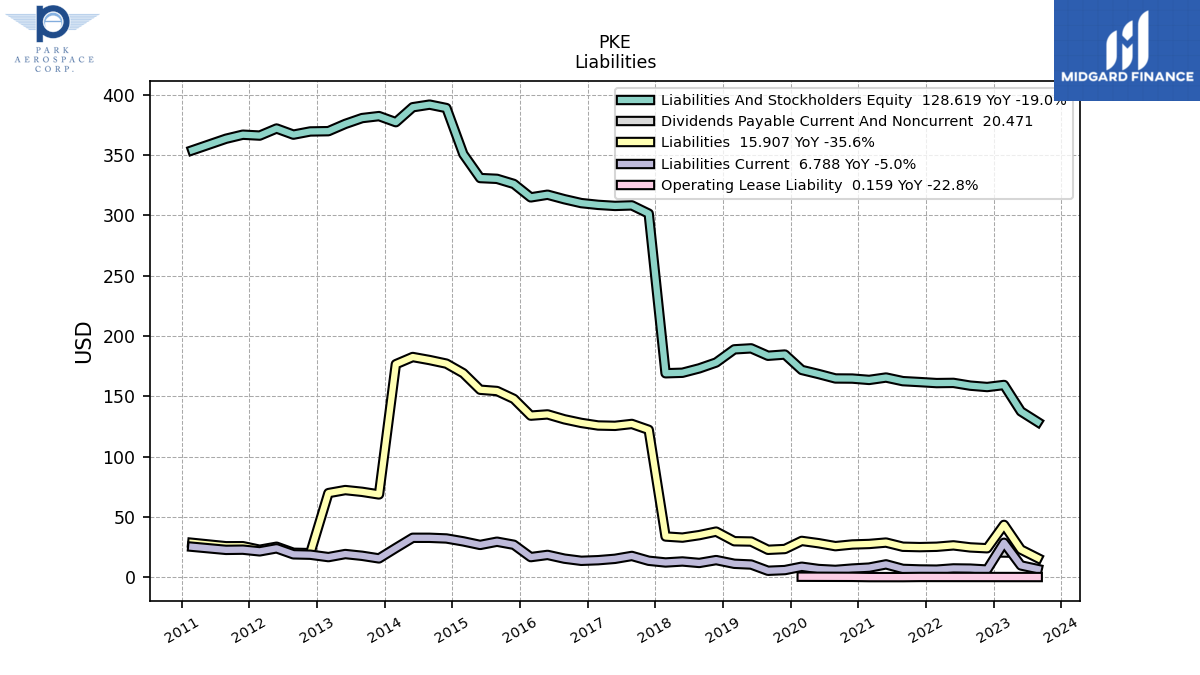
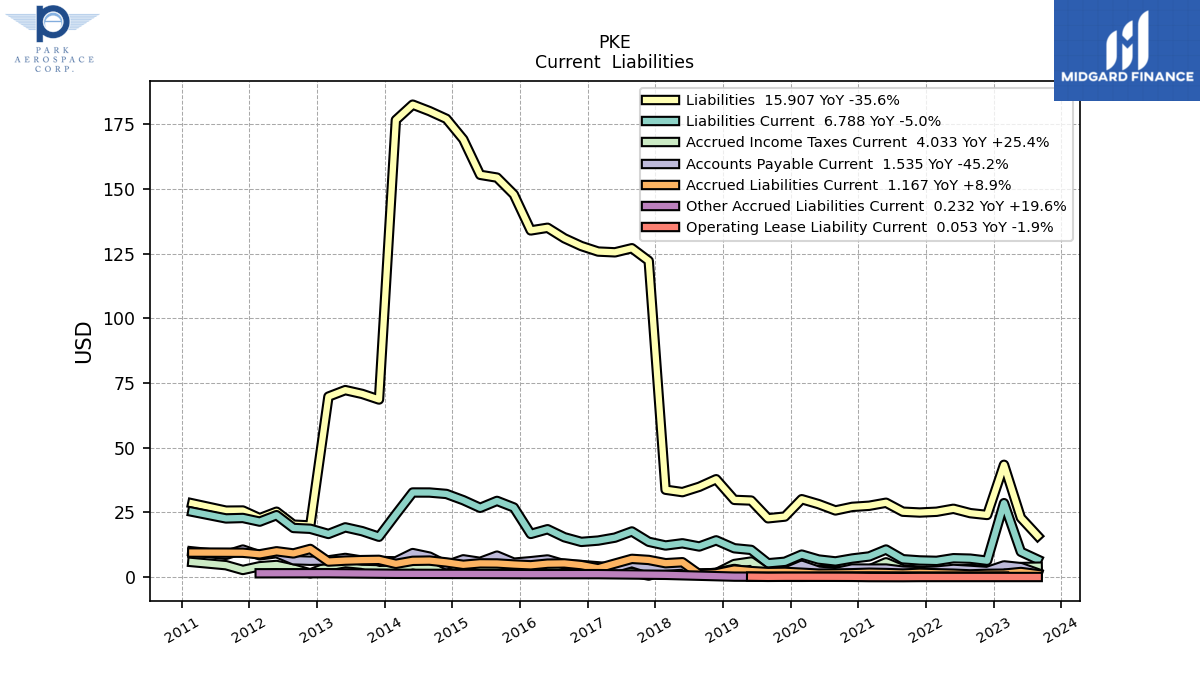
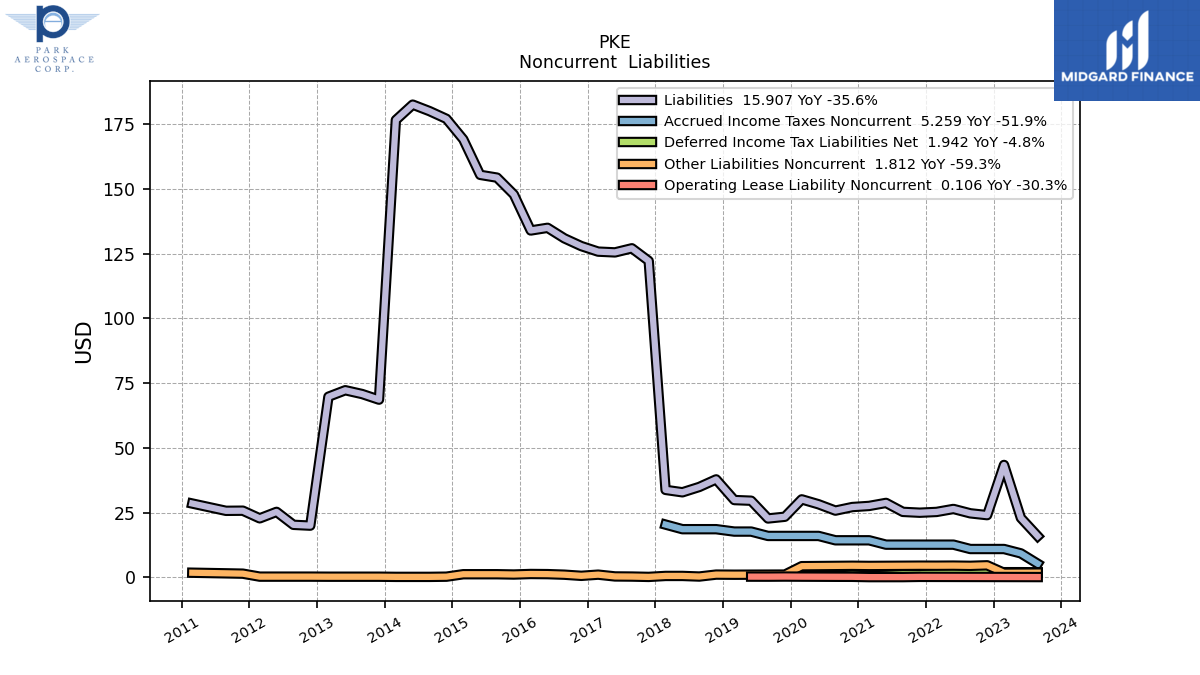
| Liabilities | 15.91 | 22.95 | 43.40 | 24.01 | 24.72 | 26.41 | 25.25 | 24.96 | 25.28 | NA | 28.74 | 27.57 | 27.14 | 25.76 | 28.20 | 30.11 | 23.39 | 22.73 | 29.59 | 29.84 | 37.83 | 34.90 | 32.84 | 33.76 | 122.16 | 127.04 | 125.45 | 125.75 | 127.89 | 130.87 | 134.94 | 133.91 | 147.81 | 154.32 | 155.39 | 169.08 | 177.01 | 179.99 | 182.50 | 176.55 | 68.60 | 70.77 | 72.24 | 69.74 | 19.96 | 20.28 | 25.28 | 22.78 | 25.73 | 25.68 | NA | 28.50 | NA | NA | |
| Liabilities And Stockholders Equity | 128.62 | 137.44 | 159.33 | 157.63 | 158.77 | 161.05 | 160.89 | 161.74 | 162.50 | NA | 165.50 | 163.51 | 164.64 | 164.72 | 168.40 | 171.79 | 184.56 | 183.53 | 189.68 | 188.85 | 177.94 | 173.10 | 169.46 | 169.02 | 301.35 | 308.14 | 307.71 | 308.58 | 310.04 | 313.25 | 317.00 | 314.78 | 325.92 | 330.15 | 330.81 | 350.68 | 388.81 | 391.65 | 389.49 | 377.09 | 382.14 | 380.50 | 375.67 | 369.66 | 369.42 | 366.77 | 371.87 | 365.99 | 366.74 | 363.38 | NA | 353.81 | NA | NA | |
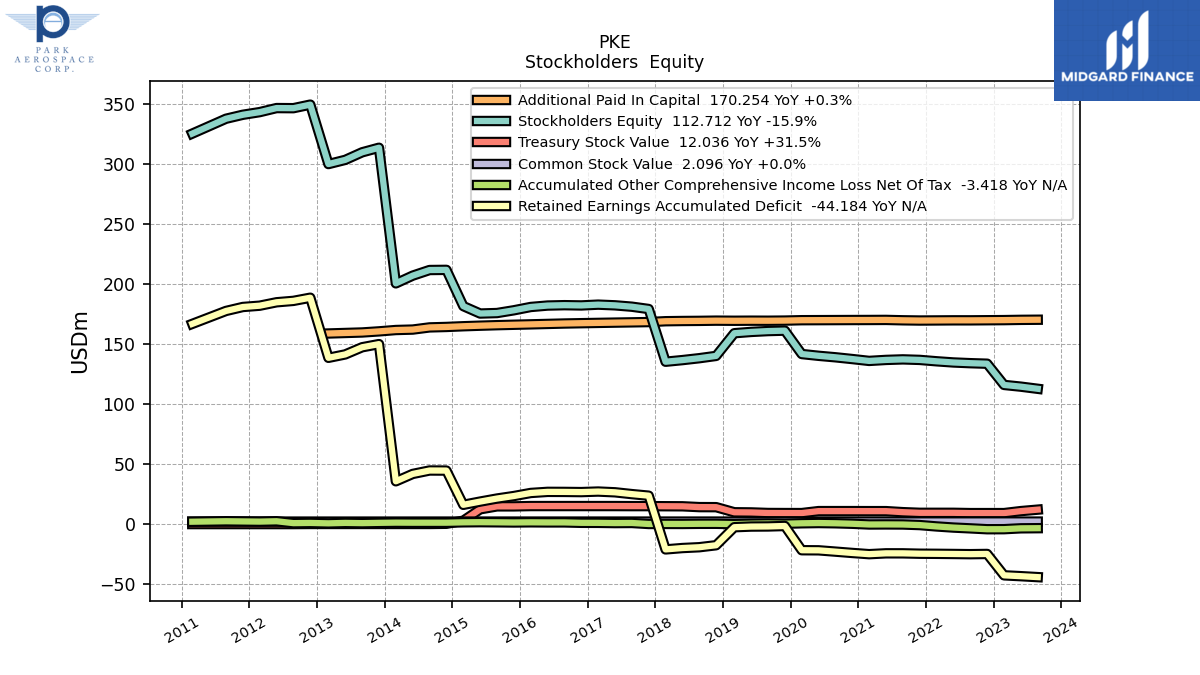
| Stockholders Equity | 112.71 | 114.49 | 115.93 | 133.61 | 134.05 | 134.65 | 135.63 | 136.78 | 137.22 | NA | 136.76 | 135.94 | 137.50 | 138.96 | 140.20 | 141.68 | 161.16 | 160.80 | 160.09 | 159.01 | 140.11 | 138.20 | 136.62 | 135.26 | 179.19 | 181.11 | 182.25 | 182.83 | 182.16 | 182.38 | 182.06 | 180.87 | 178.12 | 175.82 | 175.42 | 181.60 | 211.80 | 211.66 | 206.98 | 200.54 | 313.54 | 309.73 | 303.43 | 299.92 | 349.46 | 346.49 | 346.59 | 343.21 | 341.00 | 337.69 | NA | 325.31 | NA | NA |
| 2023-08-27 | 2023-05-28 | 2023-02-26 | 2022-11-27 | 2022-08-28 | 2022-05-29 | 2022-02-27 | 2021-11-28 | 2021-08-29 | 2021-05-31 | 2021-05-30 | 2021-02-28 | 2020-11-29 | 2020-08-30 | 2020-05-31 | 2020-03-01 | 2019-12-01 | 2019-09-01 | 2019-06-02 | 2019-03-03 | 2018-11-25 | 2018-08-26 | 2018-05-27 | 2018-02-25 | 2017-11-26 | 2017-08-27 | 2017-05-28 | 2017-02-26 | 2016-11-27 | 2016-08-28 | 2016-05-29 | 2016-02-28 | 2015-11-29 | 2015-08-30 | 2015-05-31 | 2015-03-01 | 2014-11-30 | 2014-08-31 | 2014-06-01 | 2014-03-02 | 2013-12-01 | 2013-09-01 | 2013-06-02 | 2013-03-03 | 2012-11-25 | 2012-08-26 | 2012-05-27 | 2012-02-26 | 2011-11-27 | 2011-08-28 | 2011-05-29 | 2011-02-27 | 2010-11-28 | 2010-08-29 | ||
|---|---|---|---|---|---|---|---|---|---|---|---|---|---|---|---|---|---|---|---|---|---|---|---|---|---|---|---|---|---|---|---|---|---|---|---|---|---|---|---|---|---|---|---|---|---|---|---|---|---|---|---|---|---|---|---|
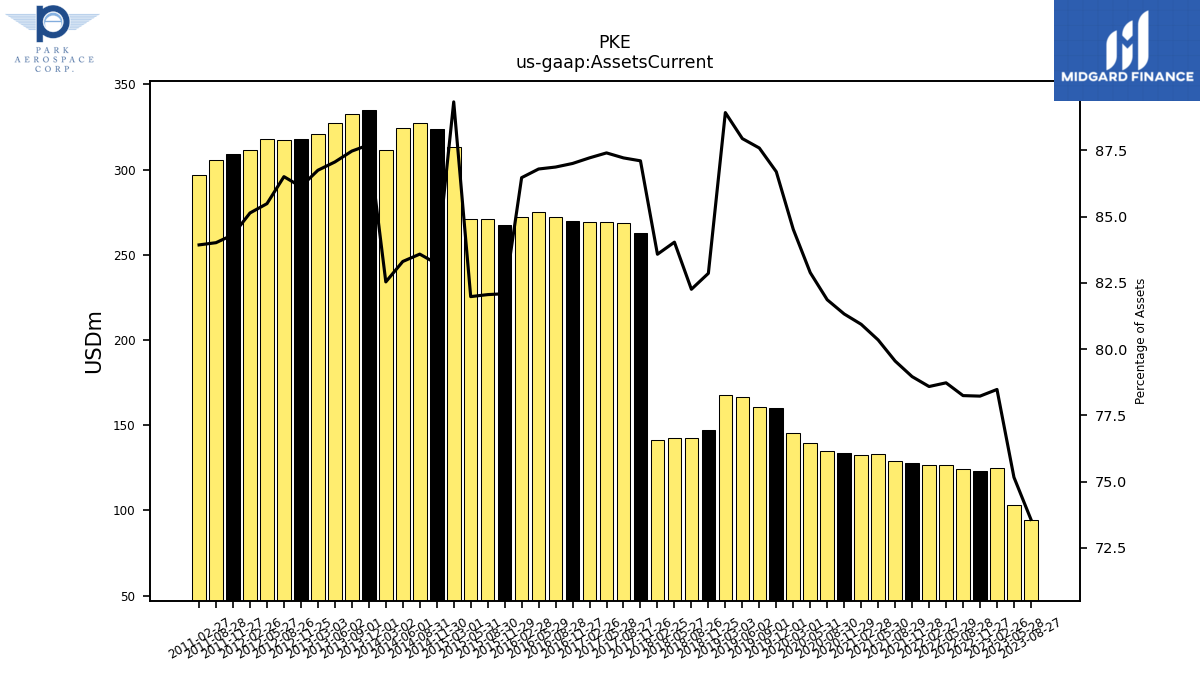
| Assets Current | 94.63 | 103.31 | 125.04 | 123.31 | 124.23 | 126.80 | 126.44 | 127.71 | 129.27 | NA | 132.97 | 132.34 | 133.89 | 134.85 | 139.58 | 145.19 | 160.00 | 160.75 | 166.81 | 167.93 | 147.44 | 142.38 | 142.40 | 141.27 | 262.49 | 268.75 | 268.94 | 269.13 | 269.75 | 272.12 | 275.15 | 272.19 | 267.55 | 270.91 | 271.20 | 313.26 | 323.58 | 327.36 | 324.47 | 311.24 | 335.17 | 332.83 | 327.06 | 320.67 | 318.17 | 317.28 | 317.90 | 311.59 | 309.22 | 305.30 | NA | 296.96 | NA | NA | |
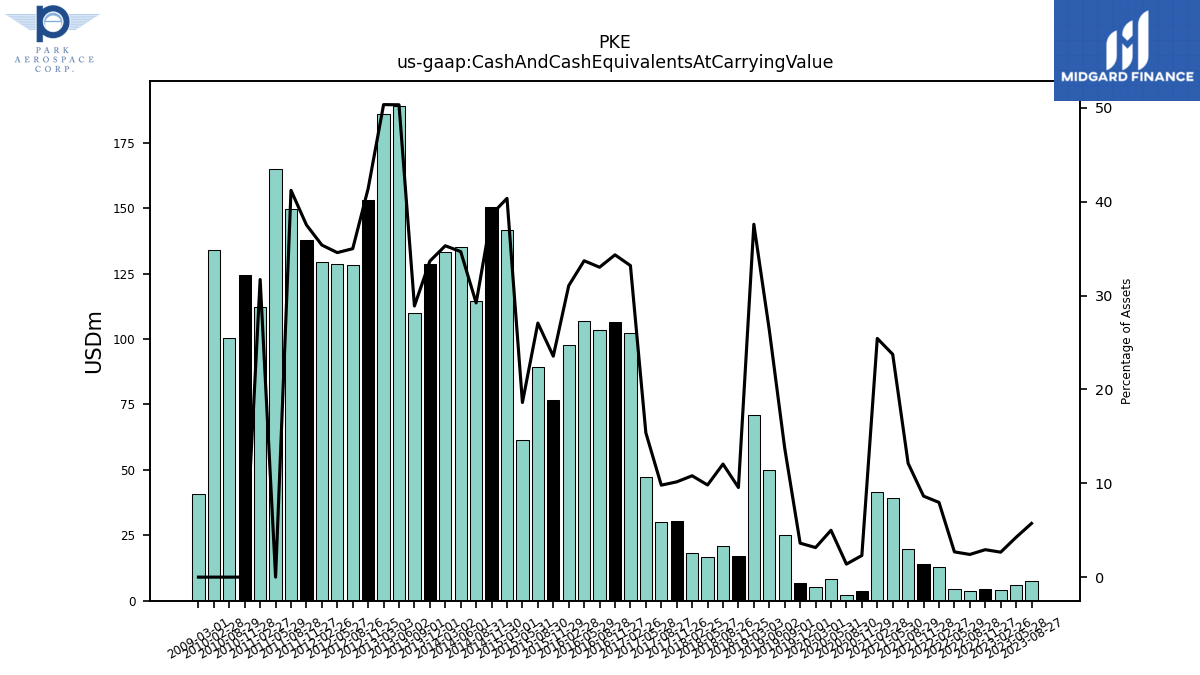
| Cash And Cash Equivalents At Carrying Value | 7.36 | 5.84 | 4.24 | 4.61 | 3.84 | 4.33 | 12.81 | 13.96 | 19.70 | NA | 39.30 | 41.59 | 3.79 | 2.29 | 8.40 | 5.41 | 6.68 | 25.23 | 49.97 | 71.01 | 17.00 | 20.85 | 16.64 | 18.25 | 30.59 | 30.19 | 47.31 | 102.44 | 106.47 | 103.44 | 106.86 | 97.76 | 76.73 | 89.38 | 61.56 | 141.54 | 150.26 | 114.44 | 135.10 | 133.15 | 128.68 | 109.94 | 189.08 | 186.12 | 152.94 | 128.36 | 128.59 | 129.50 | 137.65 | 149.77 | 164.87 | 112.19 | 124.30 | 100.48 | |
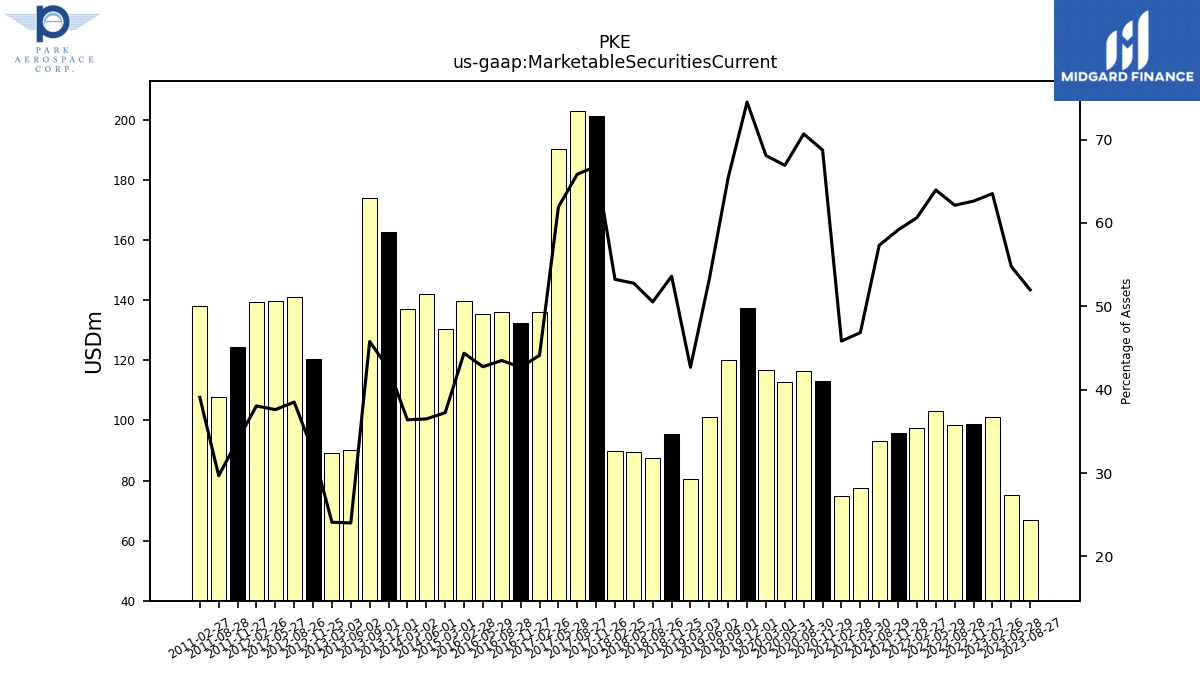
| Marketable Securities Current | 66.85 | 75.27 | 101.20 | 98.69 | 98.63 | 102.99 | 97.55 | 95.67 | 93.14 | NA | 77.52 | 74.95 | 113.18 | 116.40 | 112.67 | 116.94 | 137.49 | 120.12 | 101.09 | 80.62 | 95.39 | 87.46 | 89.41 | 89.98 | 201.23 | 202.87 | 190.49 | 136.15 | 132.35 | 136.27 | 135.54 | 139.67 | NA | NA | NA | 130.59 | NA | NA | 142.15 | 137.21 | 162.58 | 174.19 | 90.23 | 89.10 | 120.57 | 141.26 | 139.86 | 139.28 | 124.43 | 107.90 | NA | 138.25 | NA | NA | |
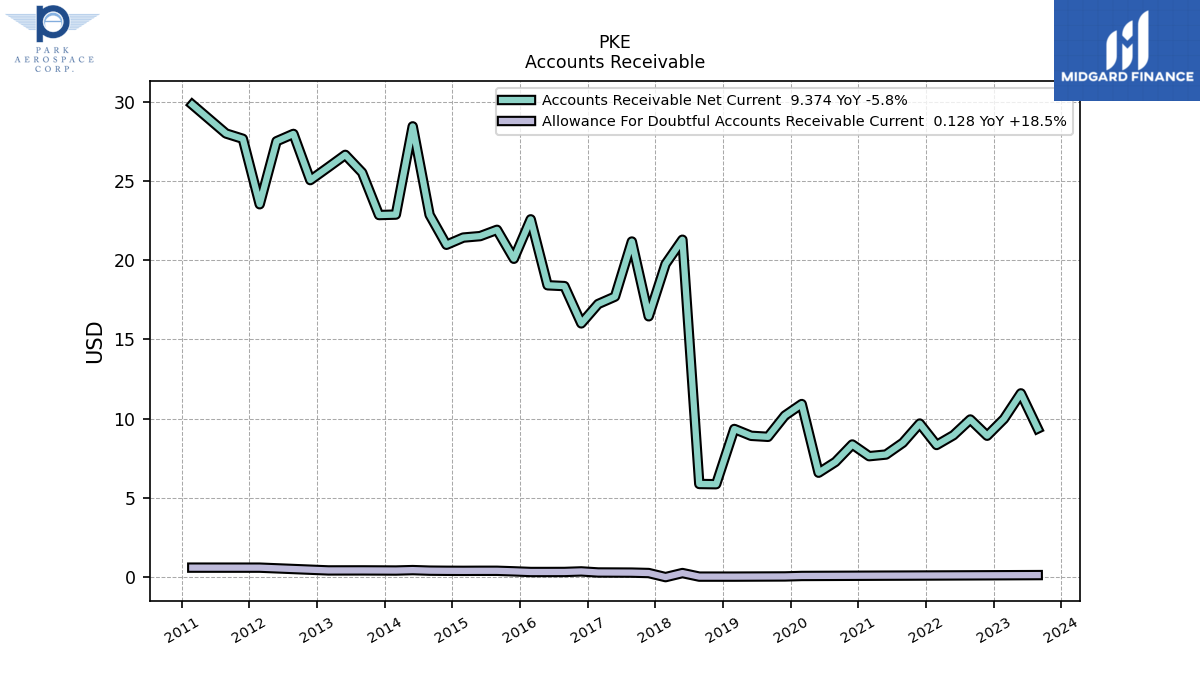
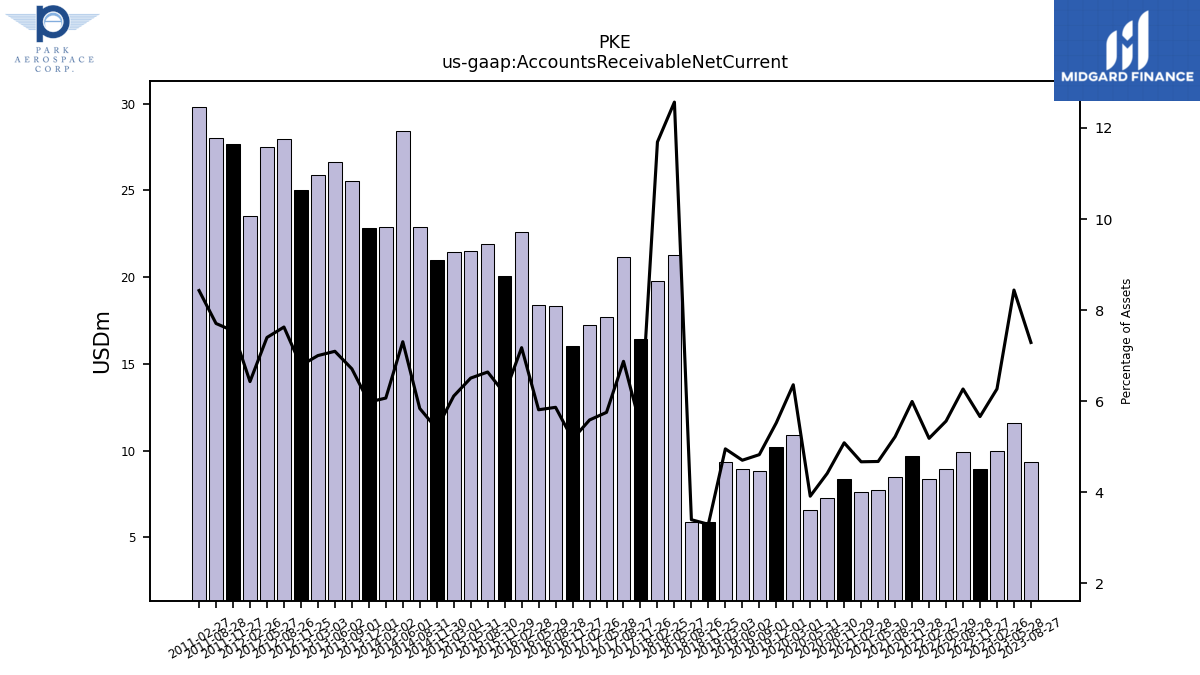
| Accounts Receivable Net Current | 9.37 | 11.60 | 9.99 | 8.92 | 9.95 | 8.96 | 8.34 | 9.69 | 8.48 | NA | 7.74 | 7.63 | 8.37 | 7.27 | 6.59 | 10.93 | 10.19 | 8.86 | 8.92 | 9.35 | 5.86 | 5.88 | 21.30 | 19.76 | 16.46 | 21.18 | 17.70 | 17.24 | 16.01 | 18.37 | 18.42 | 22.58 | 20.09 | 21.92 | 21.52 | 21.43 | 20.98 | 22.87 | 28.45 | 22.88 | 22.85 | 25.53 | 26.65 | 25.88 | 25.06 | 27.98 | 27.51 | 23.53 | 27.67 | 28.00 | NA | 29.82 | NA | NA | |
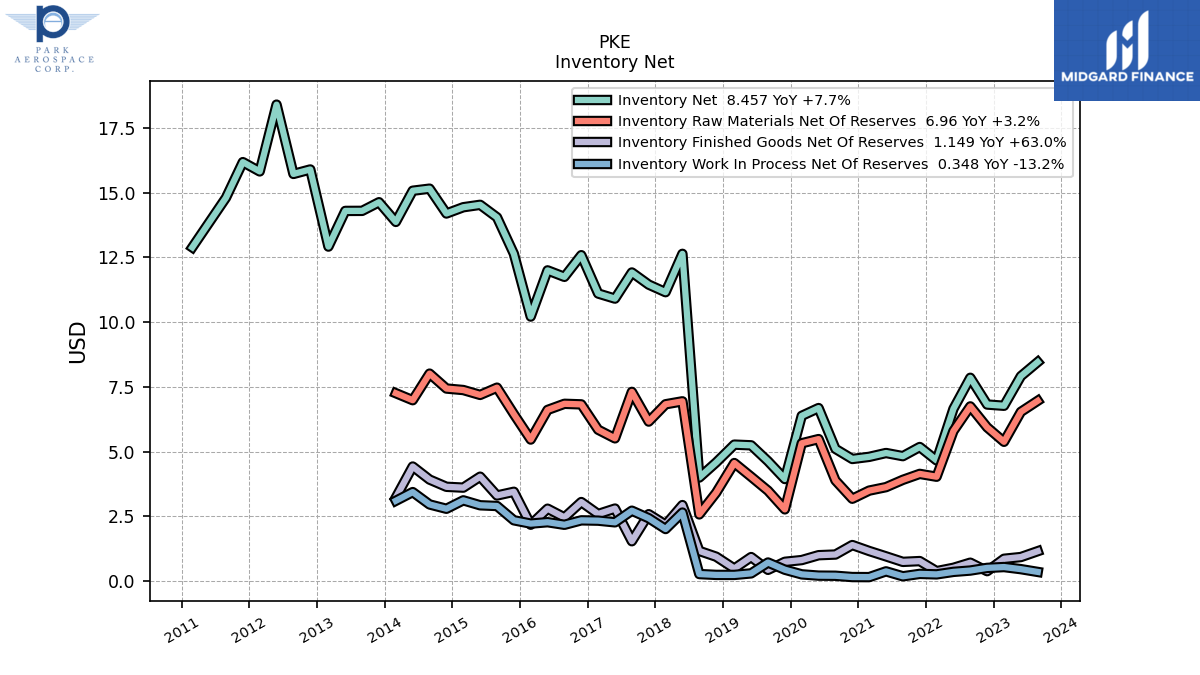
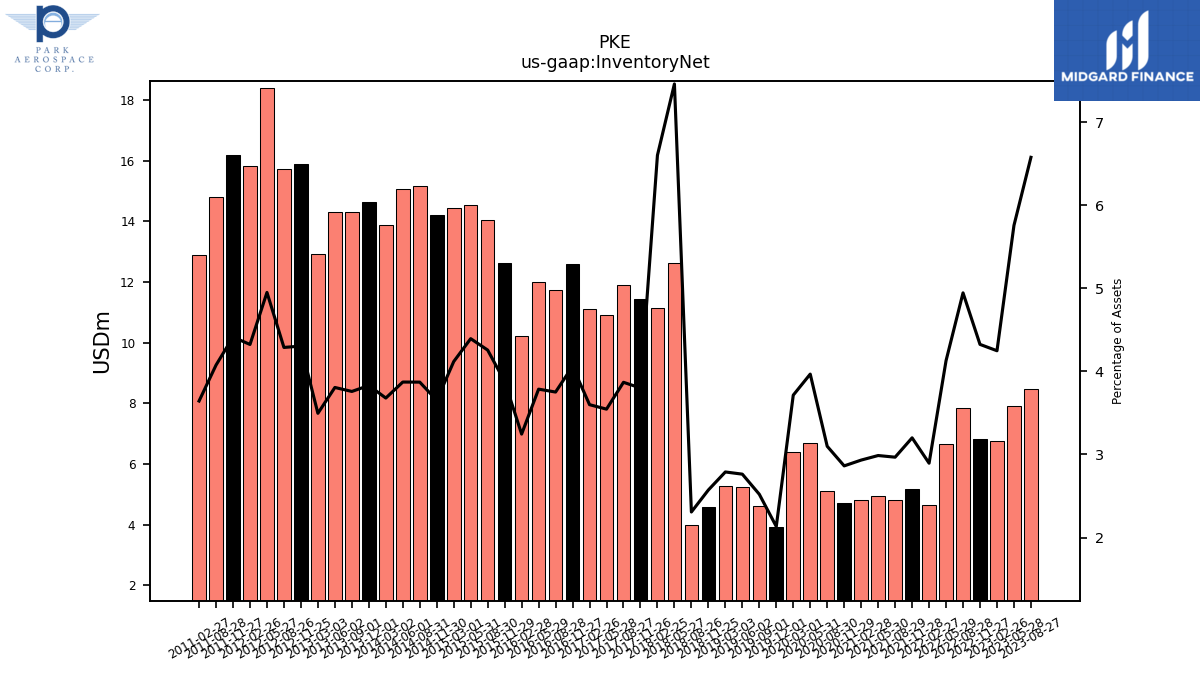
| Inventory Net | 8.46 | 7.91 | 6.77 | 6.82 | 7.85 | 6.65 | 4.66 | 5.17 | 4.82 | NA | 4.94 | 4.79 | 4.71 | 5.10 | 6.68 | 6.38 | 3.94 | 4.63 | 5.24 | 5.27 | 4.58 | 3.99 | 12.64 | 11.16 | 11.45 | 11.92 | 10.91 | 11.11 | 12.59 | 11.75 | 12.00 | 10.21 | 12.64 | 14.05 | 14.53 | 14.44 | 14.20 | 15.16 | 15.08 | 13.87 | 14.63 | 14.30 | 14.30 | 12.92 | 15.90 | 15.72 | 18.40 | 15.82 | 16.18 | 14.81 | NA | 12.89 | NA | NA | |
| Prepaid Expense And Other Assets Current | 2.59 | 2.69 | 2.84 | 4.26 | 3.97 | 3.86 | 3.08 | 3.21 | 3.12 | NA | 3.48 | 3.37 | 3.84 | 3.78 | 5.24 | 5.54 | 1.70 | 1.91 | 1.59 | 1.69 | 1.50 | 1.58 | 2.42 | 2.12 | 2.75 | 2.58 | 2.53 | 2.20 | 2.33 | 2.29 | 2.32 | 1.96 | 5.18 | 5.47 | 6.13 | 5.26 | 3.10 | 4.15 | 3.70 | 4.13 | 6.42 | 8.88 | 6.80 | 6.66 | 3.71 | 3.96 | 3.54 | 3.45 | 3.29 | 4.82 | NA | 3.81 | NA | NA | |
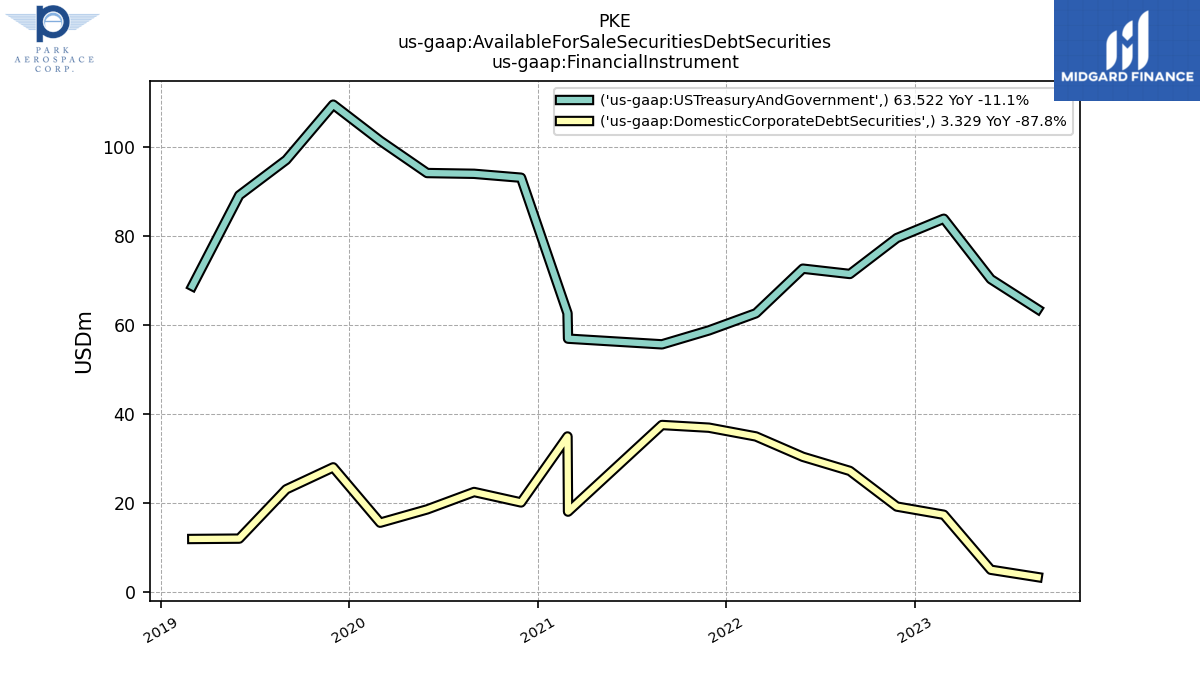
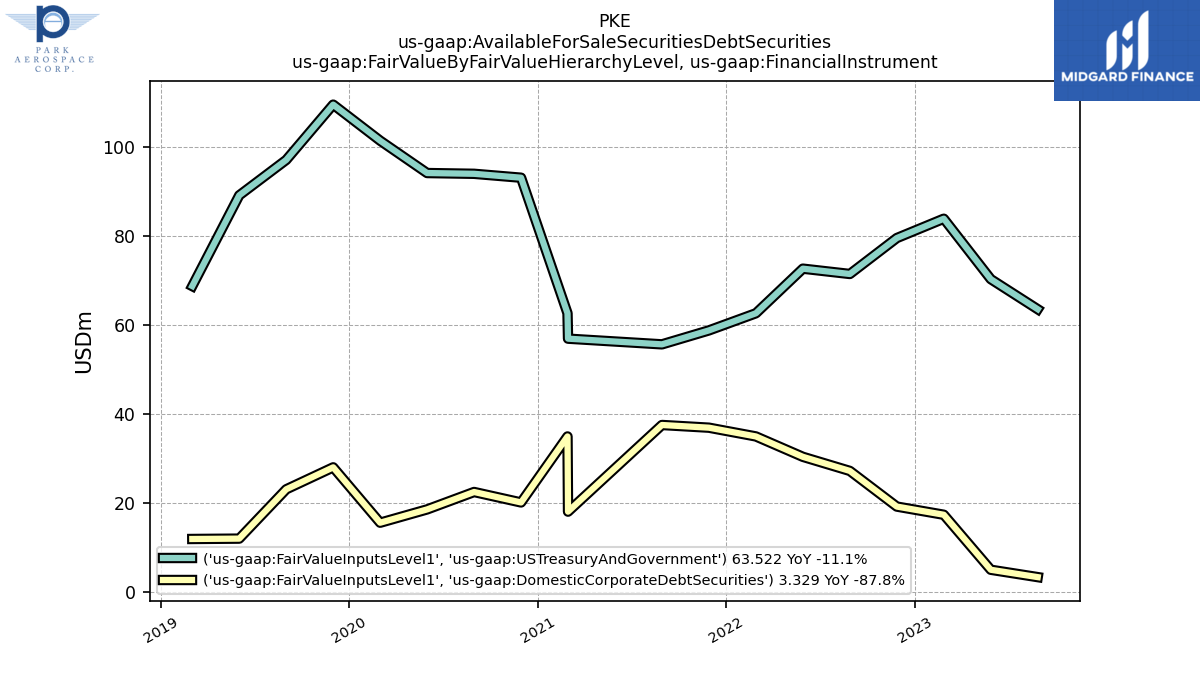
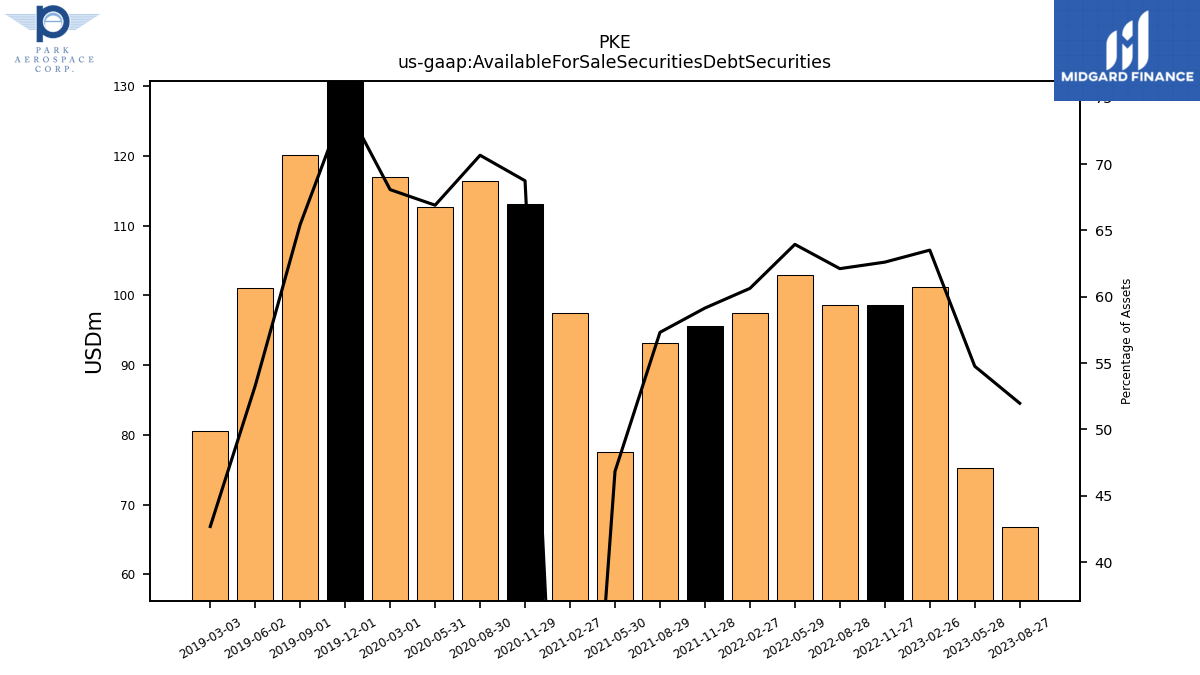
| Available For Sale Securities Debt Securities | 66.85 | 75.27 | 101.20 | 98.69 | 98.63 | 102.99 | 97.55 | 95.67 | 93.14 | NA | 77.52 | NA | 113.18 | 116.40 | 112.67 | 116.94 | 137.49 | 120.12 | 101.09 | 80.62 | NA | NA | NA | NA | NA | NA | NA | NA | NA | NA | NA | NA | NA | NA | NA | NA | NA | NA | NA | NA | NA | NA | NA | NA | NA | NA | NA | NA | NA | NA | NA | NA | NA | NA |
| 2023-08-27 | 2023-05-28 | 2023-02-26 | 2022-11-27 | 2022-08-28 | 2022-05-29 | 2022-02-27 | 2021-11-28 | 2021-08-29 | 2021-05-31 | 2021-05-30 | 2021-02-28 | 2020-11-29 | 2020-08-30 | 2020-05-31 | 2020-03-01 | 2019-12-01 | 2019-09-01 | 2019-06-02 | 2019-03-03 | 2018-11-25 | 2018-08-26 | 2018-05-27 | 2018-02-25 | 2017-11-26 | 2017-08-27 | 2017-05-28 | 2017-02-26 | 2016-11-27 | 2016-08-28 | 2016-05-29 | 2016-02-28 | 2015-11-29 | 2015-08-30 | 2015-05-31 | 2015-03-01 | 2014-11-30 | 2014-08-31 | 2014-06-01 | 2014-03-02 | 2013-12-01 | 2013-09-01 | 2013-06-02 | 2013-03-03 | 2012-11-25 | 2012-08-26 | 2012-05-27 | 2012-02-26 | 2011-11-27 | 2011-08-28 | 2011-05-29 | 2011-02-27 | 2010-11-28 | 2010-08-29 | ||
|---|---|---|---|---|---|---|---|---|---|---|---|---|---|---|---|---|---|---|---|---|---|---|---|---|---|---|---|---|---|---|---|---|---|---|---|---|---|---|---|---|---|---|---|---|---|---|---|---|---|---|---|---|---|---|---|
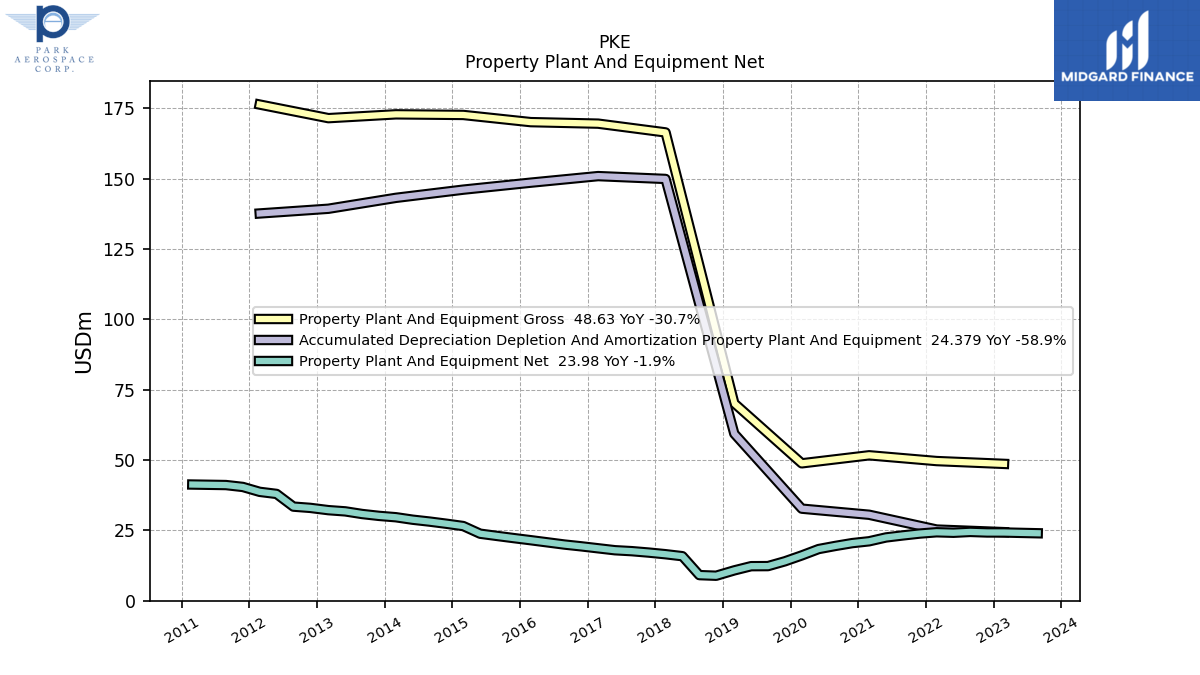
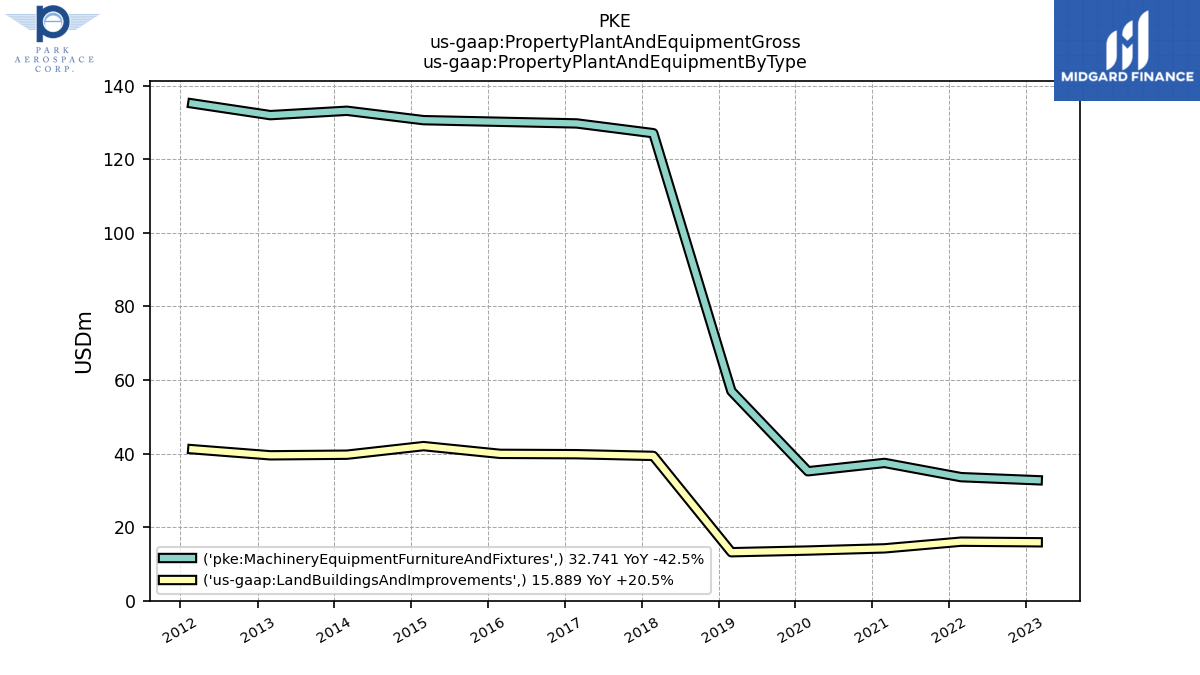
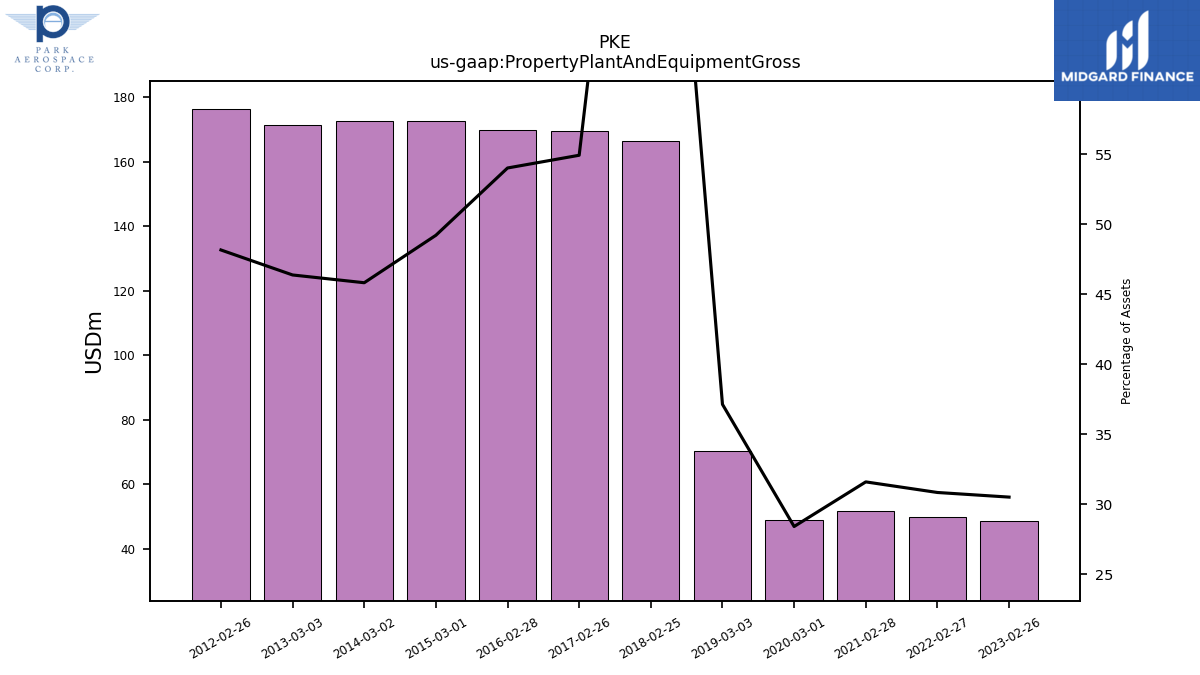
| Property Plant And Equipment Gross | NA | NA | 48.63 | NA | NA | NA | 49.63 | NA | NA | NA | NA | 51.68 | NA | NA | NA | 48.82 | NA | NA | NA | 70.15 | NA | NA | NA | 166.40 | NA | NA | NA | 169.52 | NA | NA | NA | 170.06 | NA | NA | NA | 172.60 | NA | NA | NA | 172.82 | NA | NA | NA | 171.47 | NA | NA | NA | 176.30 | NA | NA | NA | NA | NA | NA | |
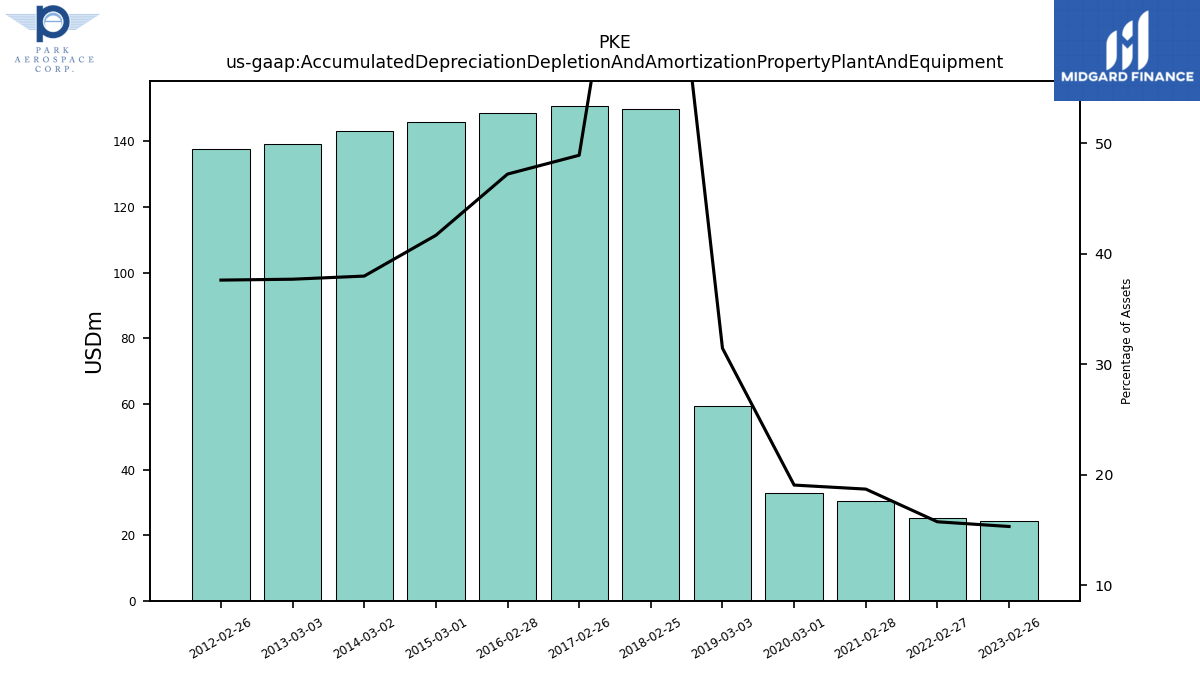
| Accumulated Depreciation Depletion And Amortization Property Plant And Equipment | NA | NA | 24.38 | NA | NA | NA | 25.30 | NA | NA | NA | NA | 30.55 | NA | NA | NA | 32.72 | NA | NA | NA | 59.36 | NA | NA | NA | 149.87 | NA | NA | NA | 150.88 | NA | NA | NA | 148.55 | NA | NA | NA | 146.07 | NA | NA | NA | 143.15 | NA | NA | NA | 139.28 | NA | NA | NA | 137.60 | NA | NA | NA | NA | NA | NA | |
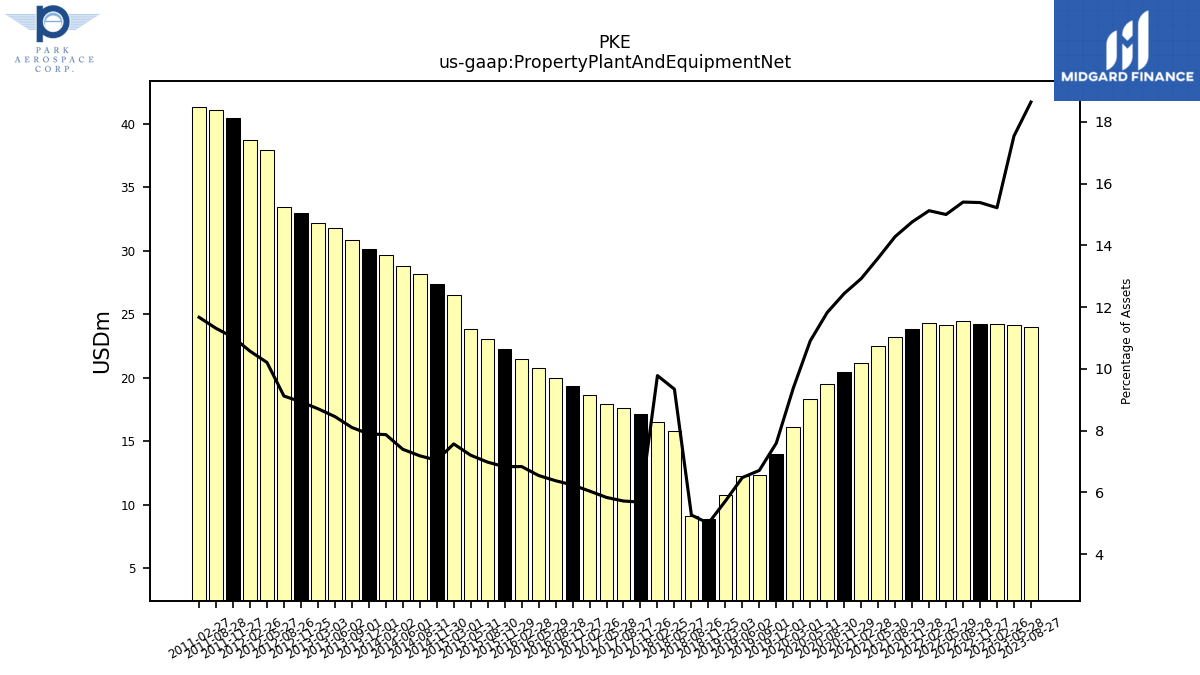
| Property Plant And Equipment Net | 23.98 | 24.11 | 24.25 | 24.26 | 24.46 | 24.16 | 24.33 | 23.87 | 23.21 | NA | 22.49 | 21.13 | 20.48 | 19.48 | 18.36 | 16.10 | 14.01 | 12.31 | 12.28 | 10.79 | 8.89 | 9.11 | 15.83 | 16.53 | 17.12 | 17.62 | 17.95 | 18.64 | 19.33 | 19.97 | 20.74 | 21.51 | 22.26 | 23.03 | 23.82 | 26.54 | 27.36 | 28.13 | 28.80 | 29.67 | 30.15 | 30.82 | 31.76 | 32.19 | 32.99 | 33.45 | 37.96 | 38.70 | 40.43 | 41.10 | NA | 41.29 | NA | NA | |
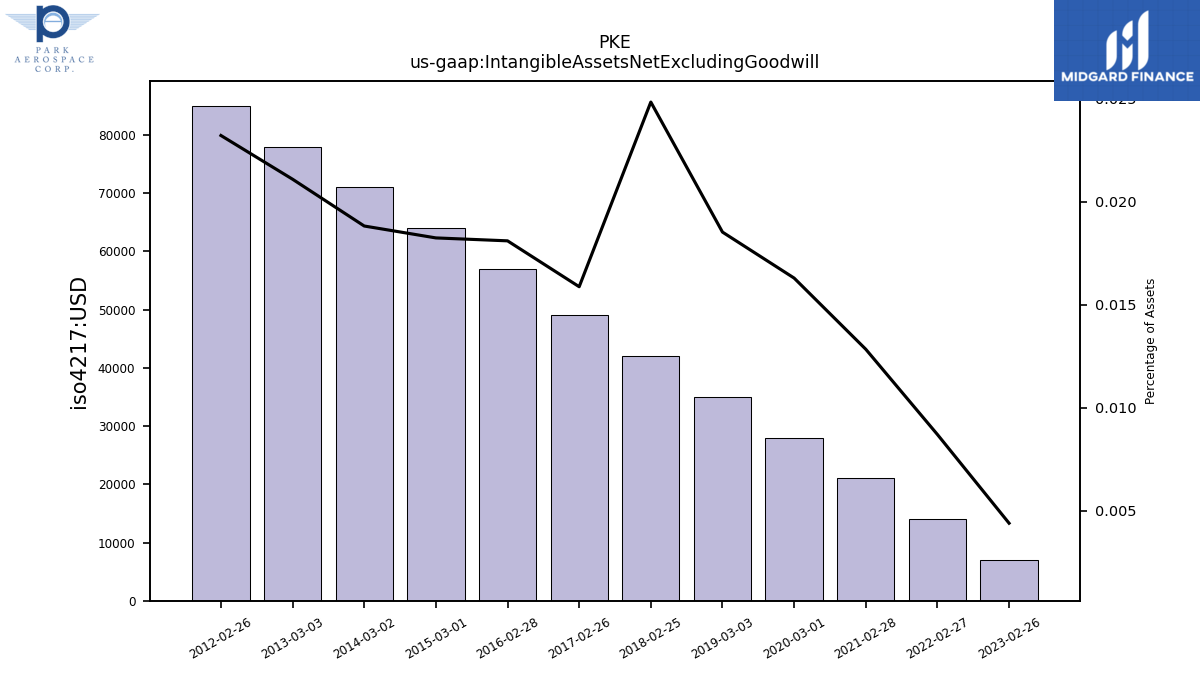
| Intangible Assets Net Excluding Goodwill | NA | NA | 0.01 | NA | NA | NA | 0.01 | NA | NA | NA | NA | 0.02 | NA | NA | NA | 0.03 | NA | NA | NA | 0.04 | NA | NA | NA | 0.04 | NA | NA | NA | 0.05 | NA | NA | NA | 0.06 | NA | NA | NA | 0.06 | NA | NA | NA | 0.07 | NA | NA | NA | 0.08 | NA | NA | NA | 0.09 | NA | NA | NA | NA | NA | NA | |
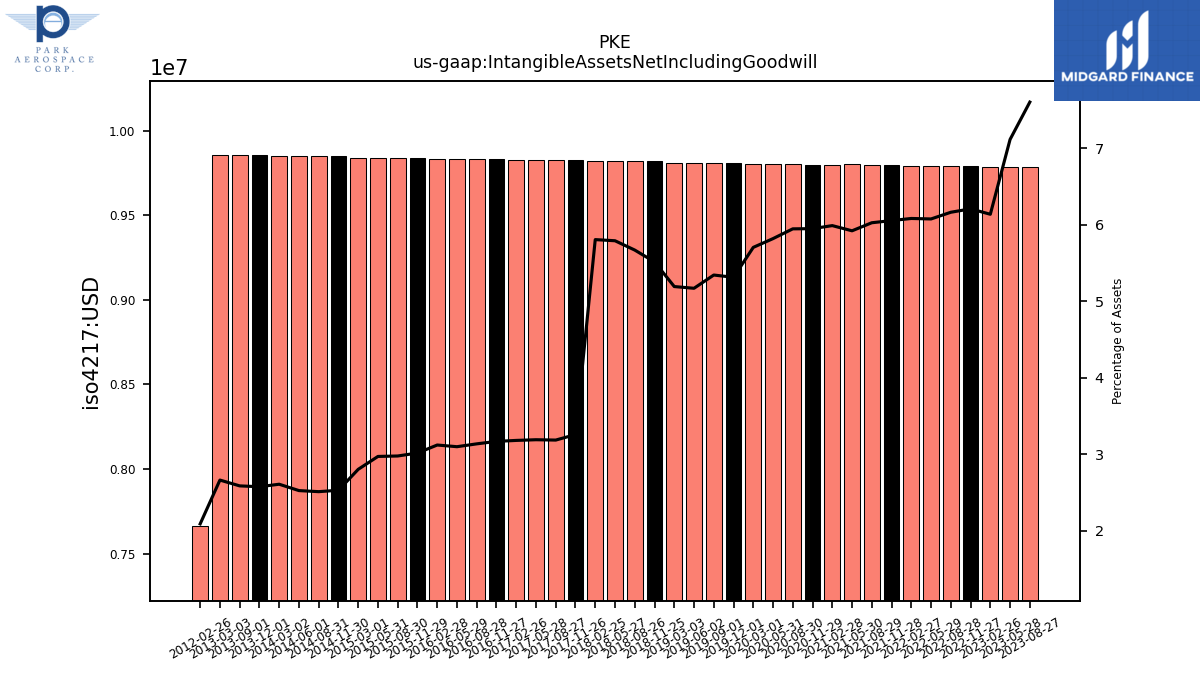
| Intangible Assets Net Including Goodwill | 9.78 | 9.78 | 9.78 | 9.79 | 9.79 | 9.79 | 9.79 | 9.80 | 9.80 | NA | 9.80 | 9.80 | 9.80 | 9.80 | 9.80 | 9.80 | 9.81 | 9.81 | 9.81 | 9.81 | 9.82 | 9.82 | 9.82 | 9.82 | 9.82 | 9.82 | 9.82 | 9.82 | 9.83 | 9.83 | 9.83 | 9.83 | 9.84 | 9.84 | 9.84 | 9.84 | 9.85 | 9.85 | 9.85 | 9.85 | 9.85 | 9.85 | NA | 9.85 | NA | NA | NA | 7.66 | NA | NA | NA | NA | NA | NA | |
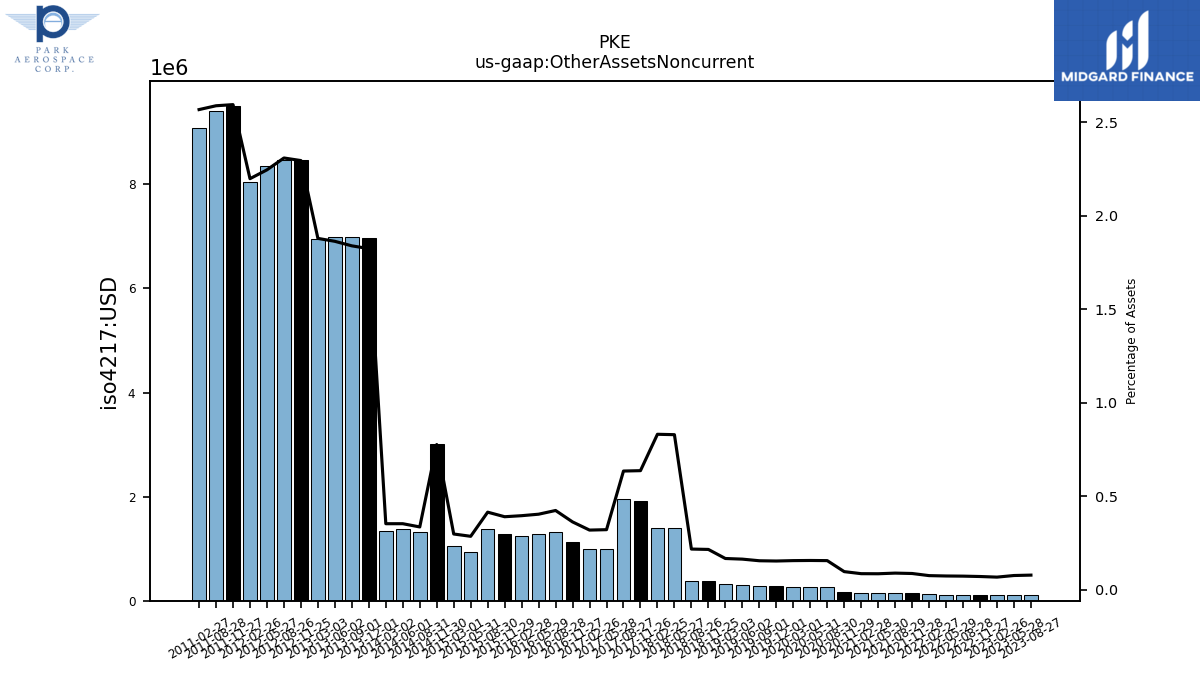
| Other Assets Noncurrent | 0.10 | 0.10 | 0.11 | 0.11 | 0.12 | 0.12 | 0.12 | 0.14 | 0.14 | NA | 0.14 | 0.14 | 0.16 | 0.26 | 0.26 | 0.27 | 0.28 | 0.28 | 0.31 | 0.32 | 0.38 | 0.38 | 1.41 | 1.41 | 1.92 | 1.96 | 0.99 | 0.98 | 1.12 | 1.33 | 1.28 | 1.25 | 1.27 | 1.37 | 0.95 | 1.05 | 3.02 | 1.32 | 1.38 | 1.33 | 6.97 | 7.00 | 7.00 | 6.94 | 8.47 | 8.46 | 8.35 | 8.04 | 9.51 | 9.40 | NA | 9.08 | NA | NA | |
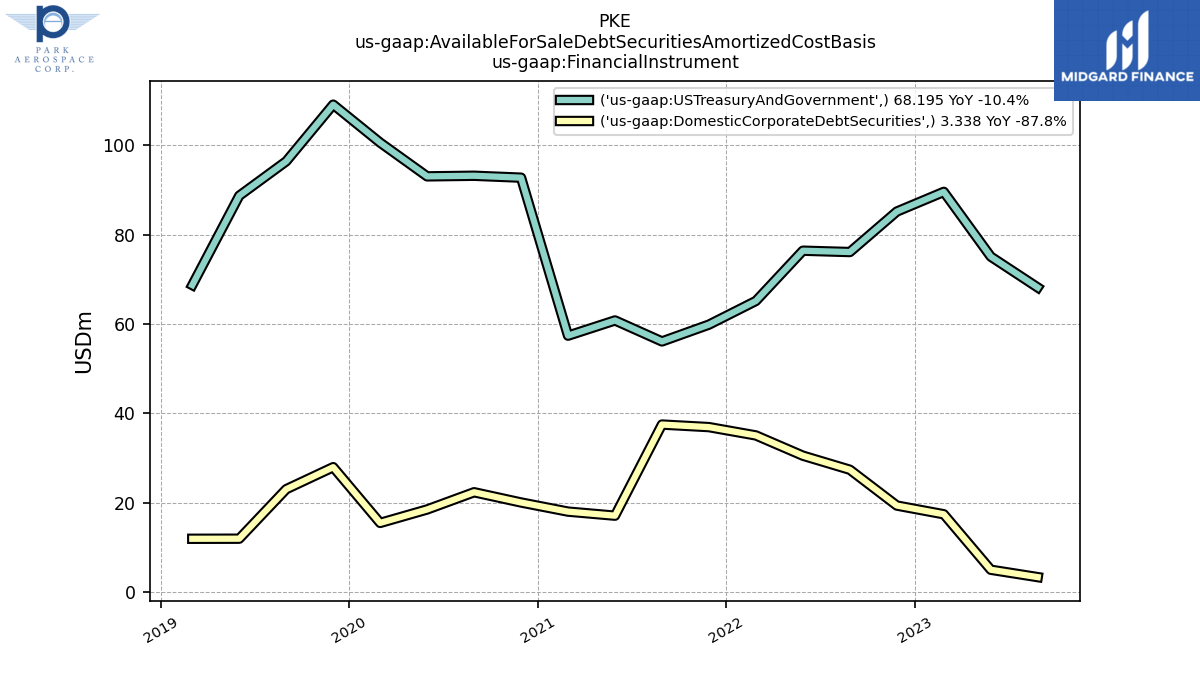
| Available For Sale Debt Securities Amortized Cost Basis | 71.53 | 80.10 | 107.02 | 104.56 | 103.51 | 106.96 | 100.24 | 96.80 | 93.61 | NA | 77.91 | 75.41 | 112.83 | 115.56 | 111.56 | 116.10 | 137.10 | 119.47 | 100.68 | 80.65 | NA | NA | NA | NA | NA | NA | NA | NA | NA | NA | NA | NA | NA | NA | NA | NA | NA | NA | NA | NA | NA | NA | NA | NA | NA | NA | NA | NA | NA | NA | NA | NA | NA | NA |
| 2023-08-27 | 2023-05-28 | 2023-02-26 | 2022-11-27 | 2022-08-28 | 2022-05-29 | 2022-02-27 | 2021-11-28 | 2021-08-29 | 2021-05-31 | 2021-05-30 | 2021-02-28 | 2020-11-29 | 2020-08-30 | 2020-05-31 | 2020-03-01 | 2019-12-01 | 2019-09-01 | 2019-06-02 | 2019-03-03 | 2018-11-25 | 2018-08-26 | 2018-05-27 | 2018-02-25 | 2017-11-26 | 2017-08-27 | 2017-05-28 | 2017-02-26 | 2016-11-27 | 2016-08-28 | 2016-05-29 | 2016-02-28 | 2015-11-29 | 2015-08-30 | 2015-05-31 | 2015-03-01 | 2014-11-30 | 2014-08-31 | 2014-06-01 | 2014-03-02 | 2013-12-01 | 2013-09-01 | 2013-06-02 | 2013-03-03 | 2012-11-25 | 2012-08-26 | 2012-05-27 | 2012-02-26 | 2011-11-27 | 2011-08-28 | 2011-05-29 | 2011-02-27 | 2010-11-28 | 2010-08-29 | ||
|---|---|---|---|---|---|---|---|---|---|---|---|---|---|---|---|---|---|---|---|---|---|---|---|---|---|---|---|---|---|---|---|---|---|---|---|---|---|---|---|---|---|---|---|---|---|---|---|---|---|---|---|---|---|---|---|
| Liabilities Current | 6.79 | 9.80 | 28.59 | 6.35 | 7.14 | 7.31 | 6.29 | 6.45 | 6.92 | NA | 10.67 | 7.99 | 7.20 | 6.08 | 6.81 | 8.71 | 5.94 | 5.36 | 10.53 | 11.15 | 14.22 | 11.84 | 13.07 | 12.23 | 13.65 | 17.65 | 15.26 | 14.12 | 13.61 | 15.40 | 18.51 | 16.68 | 26.91 | 29.45 | 26.77 | 29.72 | 32.13 | 32.68 | 32.70 | 24.24 | 15.59 | 17.76 | 19.23 | 16.68 | 18.68 | 18.99 | 23.94 | 21.44 | 22.85 | 22.68 | NA | 25.25 | NA | NA | |
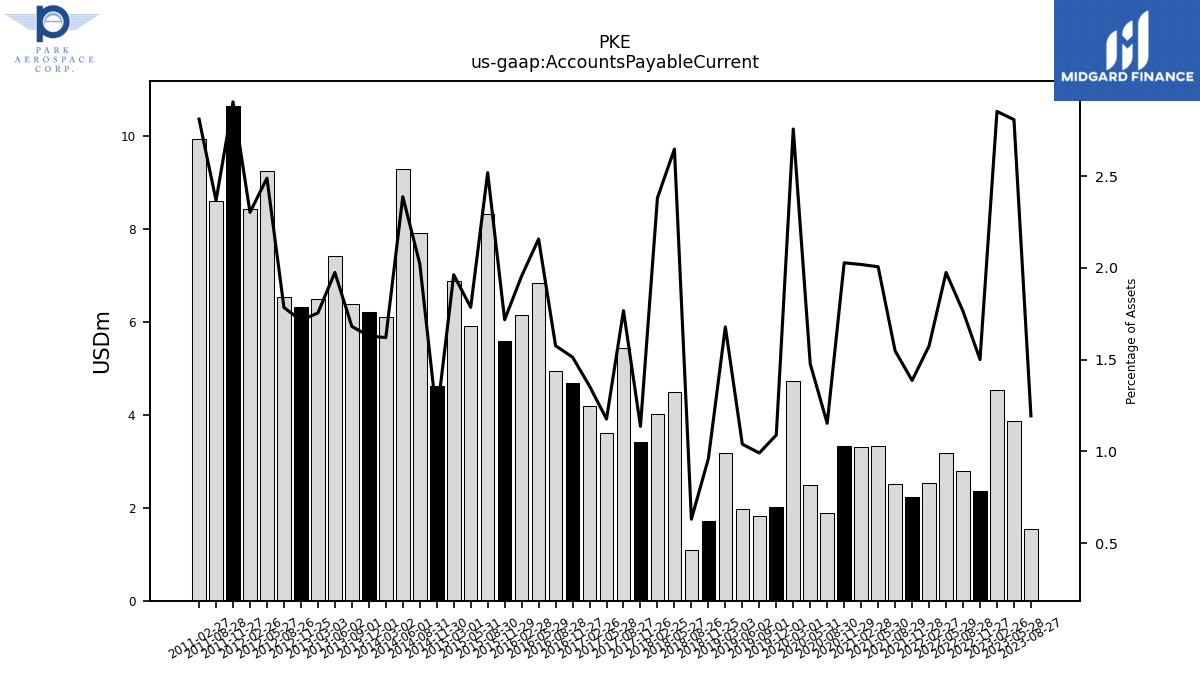
| Accounts Payable Current | 1.53 | 3.86 | 4.54 | 2.37 | 2.80 | 3.18 | 2.53 | 2.24 | 2.52 | NA | 3.32 | 3.30 | 3.34 | 1.90 | 2.49 | 4.74 | 2.01 | 1.82 | 1.97 | 3.17 | 1.71 | 1.09 | 4.49 | 4.03 | 3.42 | 5.44 | 3.62 | 4.18 | 4.69 | 4.94 | 6.84 | 6.16 | 5.60 | 8.31 | 5.90 | 6.88 | 4.62 | 7.92 | 9.30 | 6.11 | 6.22 | 6.39 | 7.42 | 6.49 | 6.33 | 6.54 | 9.26 | 8.43 | 10.65 | 8.60 | NA | 9.94 | NA | NA | |
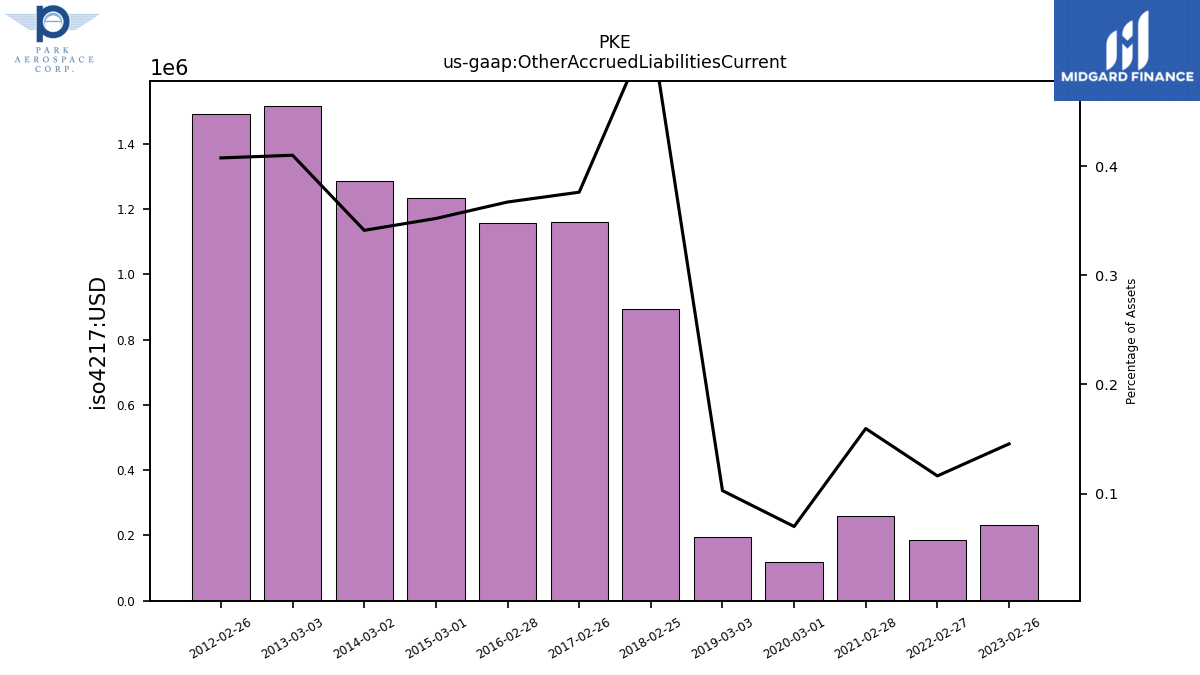
| Other Accrued Liabilities Current | NA | NA | 0.23 | NA | NA | NA | 0.19 | NA | NA | NA | NA | 0.26 | NA | NA | NA | 0.12 | NA | NA | NA | 0.19 | NA | NA | NA | 0.89 | NA | NA | NA | 1.16 | NA | NA | NA | 1.16 | NA | NA | NA | 1.24 | NA | NA | NA | 1.29 | NA | NA | NA | 1.52 | NA | NA | NA | 1.49 | NA | NA | NA | NA | NA | NA | |
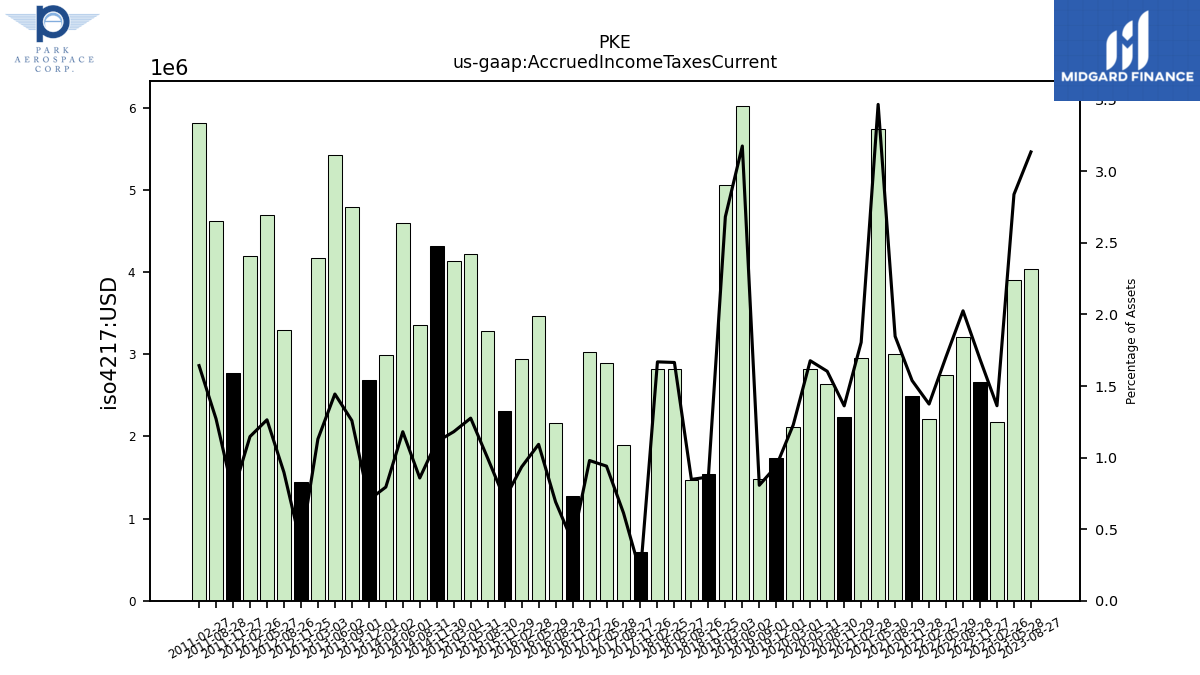
| Accrued Income Taxes Current | 4.03 | 3.90 | 2.17 | 2.66 | 3.22 | 2.75 | 2.21 | 2.49 | 3.00 | NA | 5.74 | 2.95 | 2.24 | 2.64 | 2.82 | 2.11 | 1.74 | 1.48 | 6.03 | 5.07 | 1.54 | 1.47 | 2.82 | 2.82 | 0.59 | 1.89 | 2.89 | 3.02 | 1.28 | 2.16 | 3.46 | 2.94 | 2.32 | 3.29 | 4.22 | 4.14 | 4.32 | 3.36 | 4.60 | 3.00 | 2.69 | 4.79 | 5.43 | 4.18 | 1.45 | 3.29 | 4.70 | 4.20 | 2.77 | 4.62 | NA | 5.81 | NA | NA | |
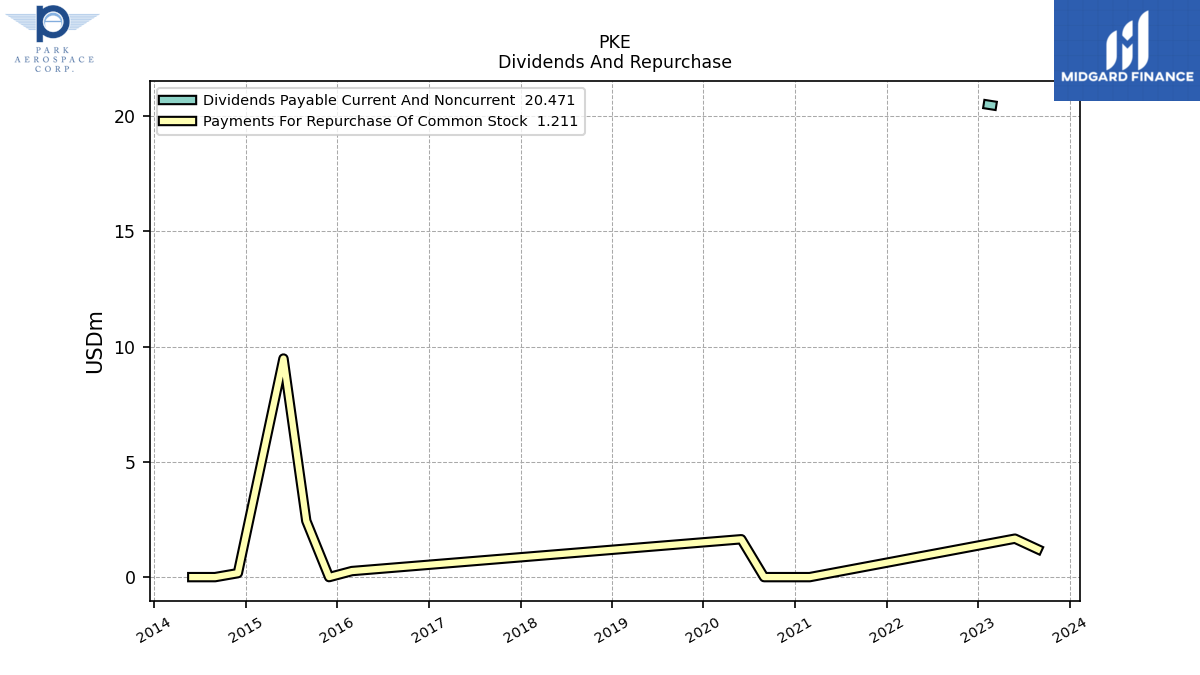
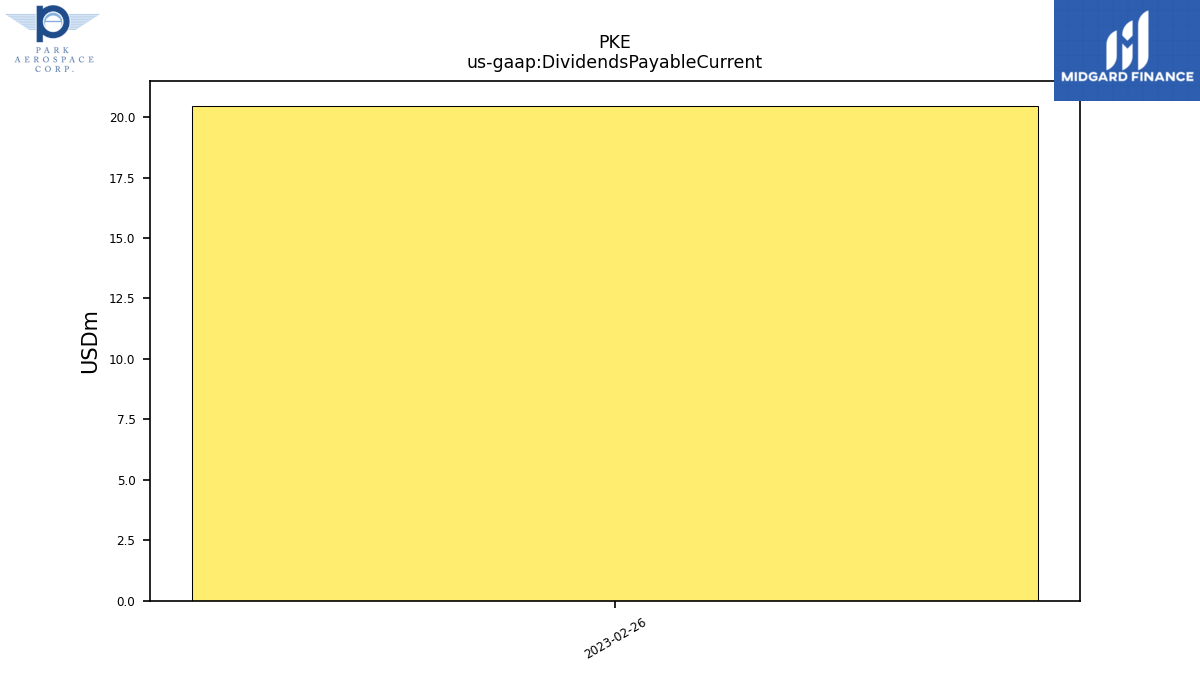
| Dividends Payable Current | NA | NA | 20.47 | NA | NA | NA | NA | NA | NA | NA | NA | NA | NA | NA | NA | NA | NA | NA | NA | NA | NA | NA | NA | NA | NA | NA | NA | NA | NA | NA | NA | NA | NA | NA | NA | NA | NA | NA | NA | NA | NA | NA | NA | NA | NA | NA | NA | NA | NA | NA | NA | NA | NA | NA | |
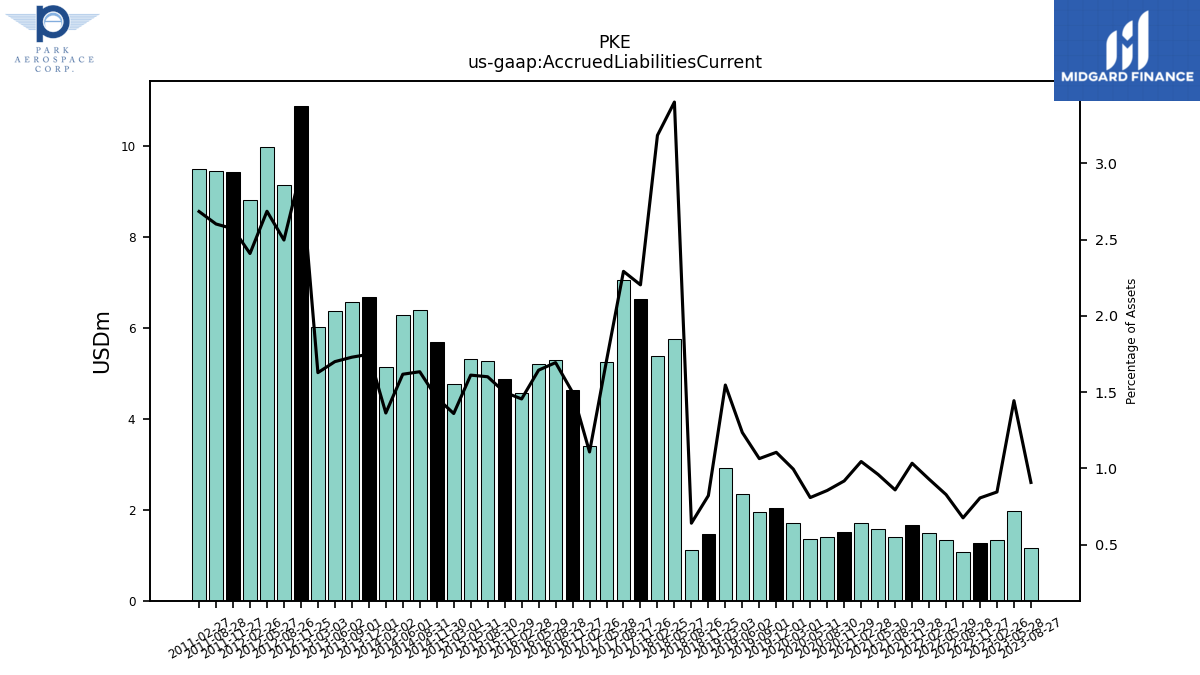
| Accrued Liabilities Current | 1.17 | 1.98 | 1.35 | 1.27 | 1.07 | 1.33 | 1.49 | 1.67 | 1.40 | NA | 1.59 | 1.71 | 1.51 | 1.41 | 1.36 | 1.71 | 2.04 | 1.95 | 2.34 | 2.92 | 1.46 | 1.11 | 5.76 | 5.38 | 6.64 | 7.06 | 5.25 | 3.42 | 4.64 | 5.30 | 5.21 | 4.58 | 4.88 | 5.28 | 5.33 | 4.77 | 5.69 | 6.40 | 6.30 | 5.14 | 6.68 | 6.58 | 6.38 | 6.02 | 10.90 | 9.16 | 9.99 | 8.82 | 9.43 | 9.46 | NA | 9.50 | NA | NA |
| 2023-08-27 | 2023-05-28 | 2023-02-26 | 2022-11-27 | 2022-08-28 | 2022-05-29 | 2022-02-27 | 2021-11-28 | 2021-08-29 | 2021-05-31 | 2021-05-30 | 2021-02-28 | 2020-11-29 | 2020-08-30 | 2020-05-31 | 2020-03-01 | 2019-12-01 | 2019-09-01 | 2019-06-02 | 2019-03-03 | 2018-11-25 | 2018-08-26 | 2018-05-27 | 2018-02-25 | 2017-11-26 | 2017-08-27 | 2017-05-28 | 2017-02-26 | 2016-11-27 | 2016-08-28 | 2016-05-29 | 2016-02-28 | 2015-11-29 | 2015-08-30 | 2015-05-31 | 2015-03-01 | 2014-11-30 | 2014-08-31 | 2014-06-01 | 2014-03-02 | 2013-12-01 | 2013-09-01 | 2013-06-02 | 2013-03-03 | 2012-11-25 | 2012-08-26 | 2012-05-27 | 2012-02-26 | 2011-11-27 | 2011-08-28 | 2011-05-29 | 2011-02-27 | 2010-11-28 | 2010-08-29 | ||
|---|---|---|---|---|---|---|---|---|---|---|---|---|---|---|---|---|---|---|---|---|---|---|---|---|---|---|---|---|---|---|---|---|---|---|---|---|---|---|---|---|---|---|---|---|---|---|---|---|---|---|---|---|---|---|---|
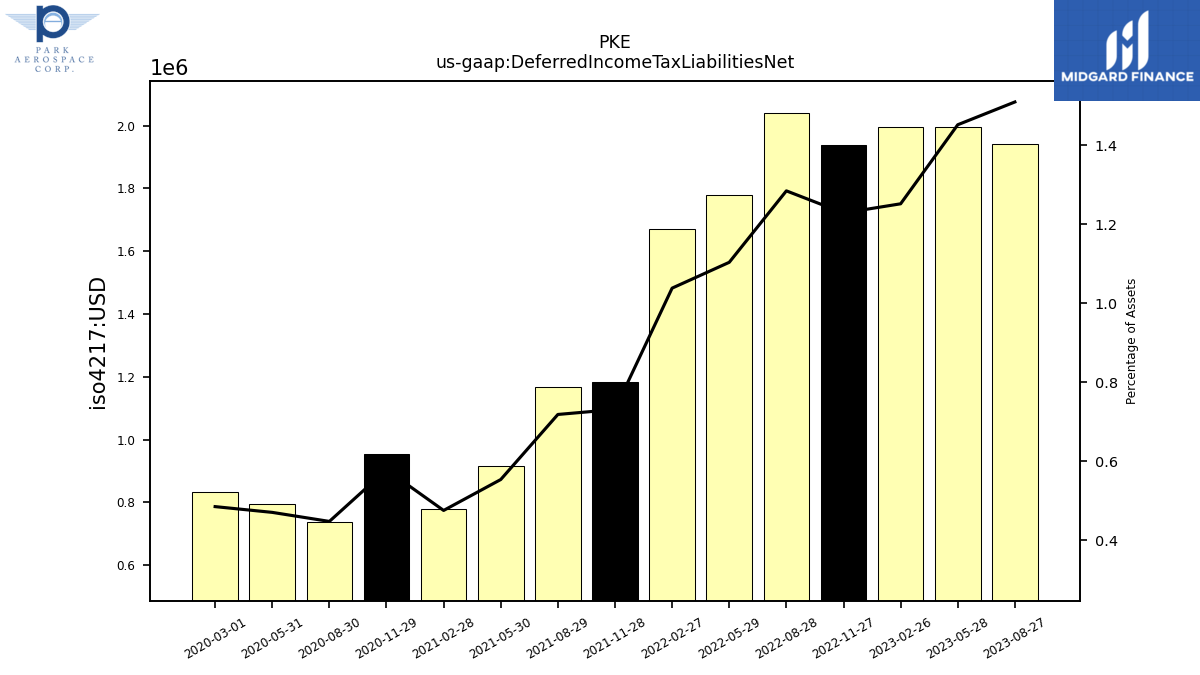
| Deferred Income Tax Liabilities Net | 1.94 | 2.00 | 2.00 | 1.94 | 2.04 | 1.78 | 1.67 | 1.18 | 1.17 | NA | 0.92 | 0.78 | 0.95 | 0.74 | 0.79 | 0.83 | NA | NA | NA | NA | NA | NA | NA | NA | NA | NA | NA | NA | NA | NA | NA | NA | NA | NA | NA | NA | NA | NA | NA | NA | NA | NA | NA | NA | NA | NA | NA | NA | NA | NA | NA | NA | NA | NA | |
| Other Liabilities Noncurrent | 1.81 | 1.78 | 1.75 | 4.65 | 4.45 | 4.53 | 4.50 | 4.51 | 4.48 | NA | 4.45 | 4.41 | 4.48 | 4.42 | 4.37 | 4.32 | 1.07 | 1.05 | 1.03 | 1.02 | 1.06 | 0.31 | 0.54 | 0.54 | 0.17 | 0.30 | 0.35 | 1.04 | 0.59 | 1.02 | 1.24 | 1.29 | 1.09 | 1.20 | 1.20 | 1.20 | 0.26 | 0.18 | 0.18 | 0.18 | 0.25 | 0.25 | 0.25 | 0.25 | 0.27 | 0.27 | 0.27 | 0.27 | 1.42 | 1.55 | NA | 1.79 | NA | NA | |
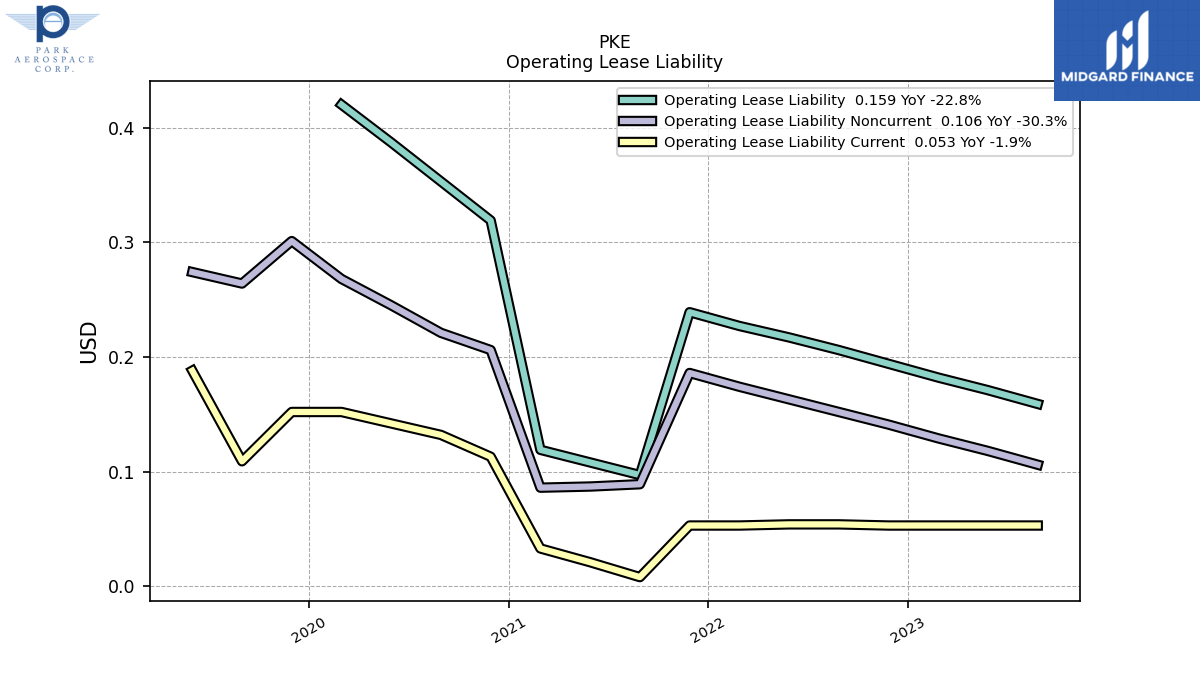
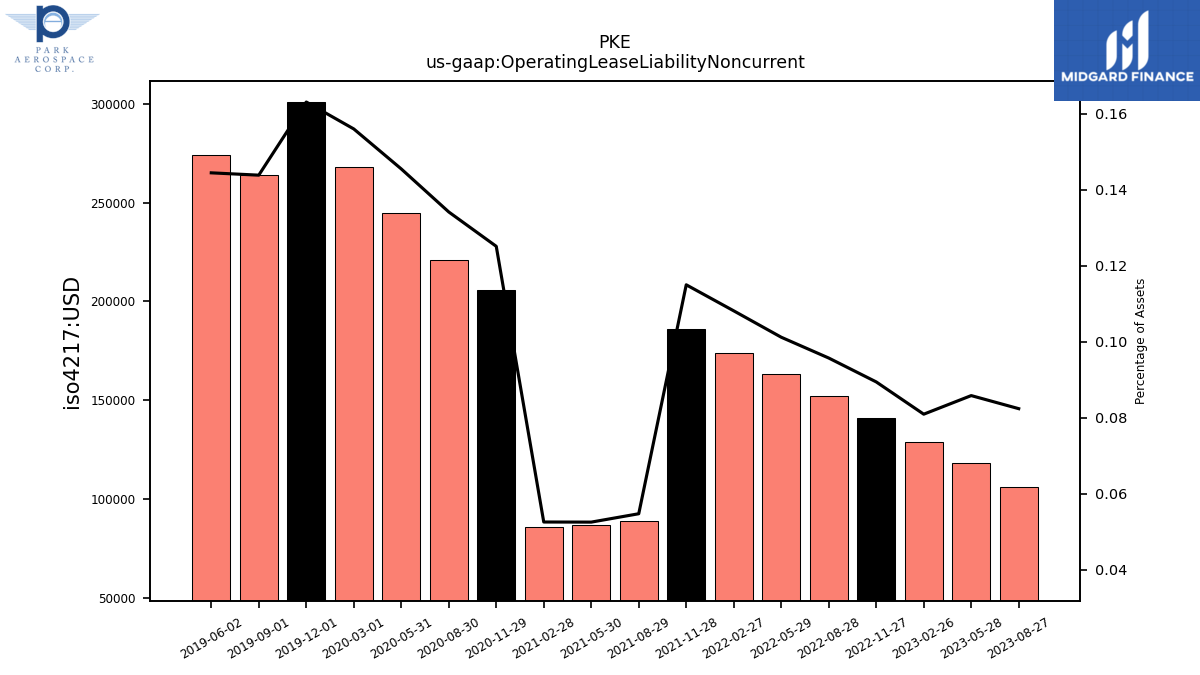
| Operating Lease Liability Noncurrent | 0.11 | 0.12 | 0.13 | 0.14 | 0.15 | 0.16 | 0.17 | 0.19 | 0.09 | NA | 0.09 | 0.09 | 0.21 | 0.22 | 0.24 | 0.27 | 0.30 | 0.26 | 0.27 | NA | NA | NA | NA | NA | NA | NA | NA | NA | NA | NA | NA | NA | NA | NA | NA | NA | NA | NA | NA | NA | NA | NA | NA | NA | NA | NA | NA | NA | NA | NA | NA | NA | NA | NA |
| 2023-08-27 | 2023-05-28 | 2023-02-26 | 2022-11-27 | 2022-08-28 | 2022-05-29 | 2022-02-27 | 2021-11-28 | 2021-08-29 | 2021-05-31 | 2021-05-30 | 2021-02-28 | 2020-11-29 | 2020-08-30 | 2020-05-31 | 2020-03-01 | 2019-12-01 | 2019-09-01 | 2019-06-02 | 2019-03-03 | 2018-11-25 | 2018-08-26 | 2018-05-27 | 2018-02-25 | 2017-11-26 | 2017-08-27 | 2017-05-28 | 2017-02-26 | 2016-11-27 | 2016-08-28 | 2016-05-29 | 2016-02-28 | 2015-11-29 | 2015-08-30 | 2015-05-31 | 2015-03-01 | 2014-11-30 | 2014-08-31 | 2014-06-01 | 2014-03-02 | 2013-12-01 | 2013-09-01 | 2013-06-02 | 2013-03-03 | 2012-11-25 | 2012-08-26 | 2012-05-27 | 2012-02-26 | 2011-11-27 | 2011-08-28 | 2011-05-29 | 2011-02-27 | 2010-11-28 | 2010-08-29 | ||
|---|---|---|---|---|---|---|---|---|---|---|---|---|---|---|---|---|---|---|---|---|---|---|---|---|---|---|---|---|---|---|---|---|---|---|---|---|---|---|---|---|---|---|---|---|---|---|---|---|---|---|---|---|---|---|---|
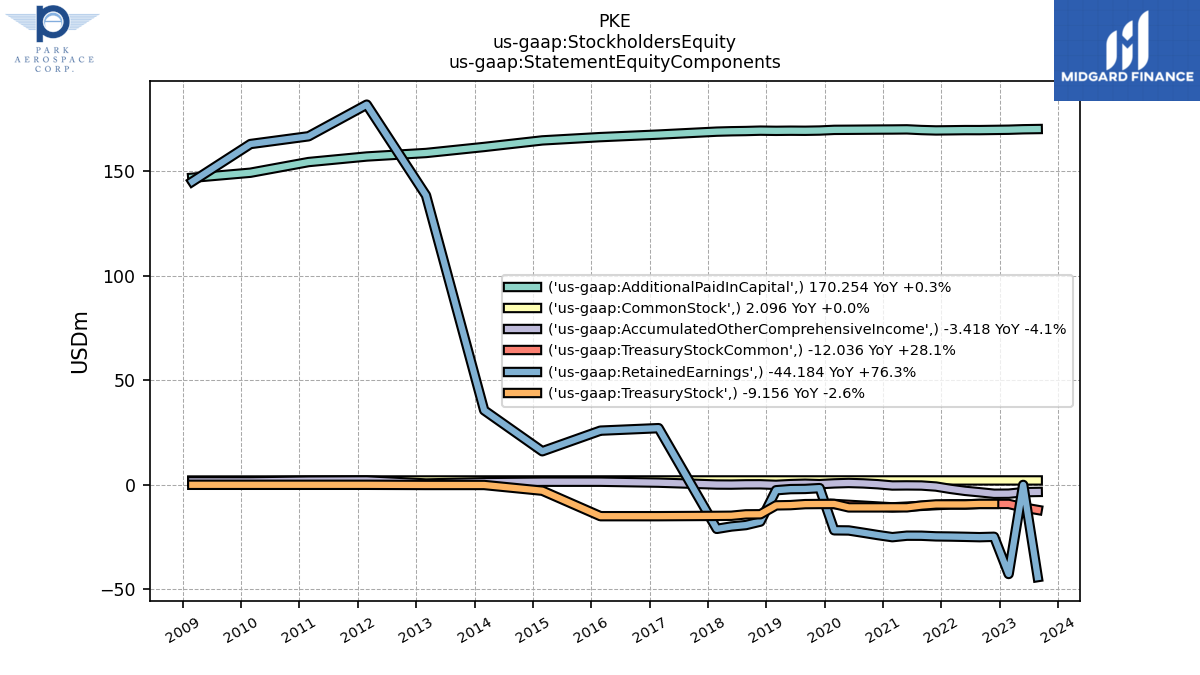
| Stockholders Equity | 112.71 | 114.49 | 115.93 | 133.61 | 134.05 | 134.65 | 135.63 | 136.78 | 137.22 | NA | 136.76 | 135.94 | 137.50 | 138.96 | 140.20 | 141.68 | 161.16 | 160.80 | 160.09 | 159.01 | 140.11 | 138.20 | 136.62 | 135.26 | 179.19 | 181.11 | 182.25 | 182.83 | 182.16 | 182.38 | 182.06 | 180.87 | 178.12 | 175.82 | 175.42 | 181.60 | 211.80 | 211.66 | 206.98 | 200.54 | 313.54 | 309.73 | 303.43 | 299.92 | 349.46 | 346.49 | 346.59 | 343.21 | 341.00 | 337.69 | NA | 325.31 | NA | NA | |
| Common Stock Value | 2.10 | 2.10 | 2.10 | 2.10 | 2.10 | 2.10 | 2.10 | 2.10 | 2.10 | NA | 2.10 | 2.10 | 2.10 | NA | NA | 2.10 | 2.10 | NA | NA | 2.10 | NA | NA | NA | 2.10 | 2.10 | 2.10 | 2.10 | 2.10 | 2.10 | 2.10 | 2.10 | 2.10 | 2.10 | 2.10 | 2.10 | 2.10 | 2.10 | 2.10 | 2.09 | 2.09 | 2.09 | 2.08 | 2.08 | 2.08 | 2.08 | 2.08 | 2.08 | 2.08 | 2.08 | 2.08 | NA | 2.07 | NA | NA | |
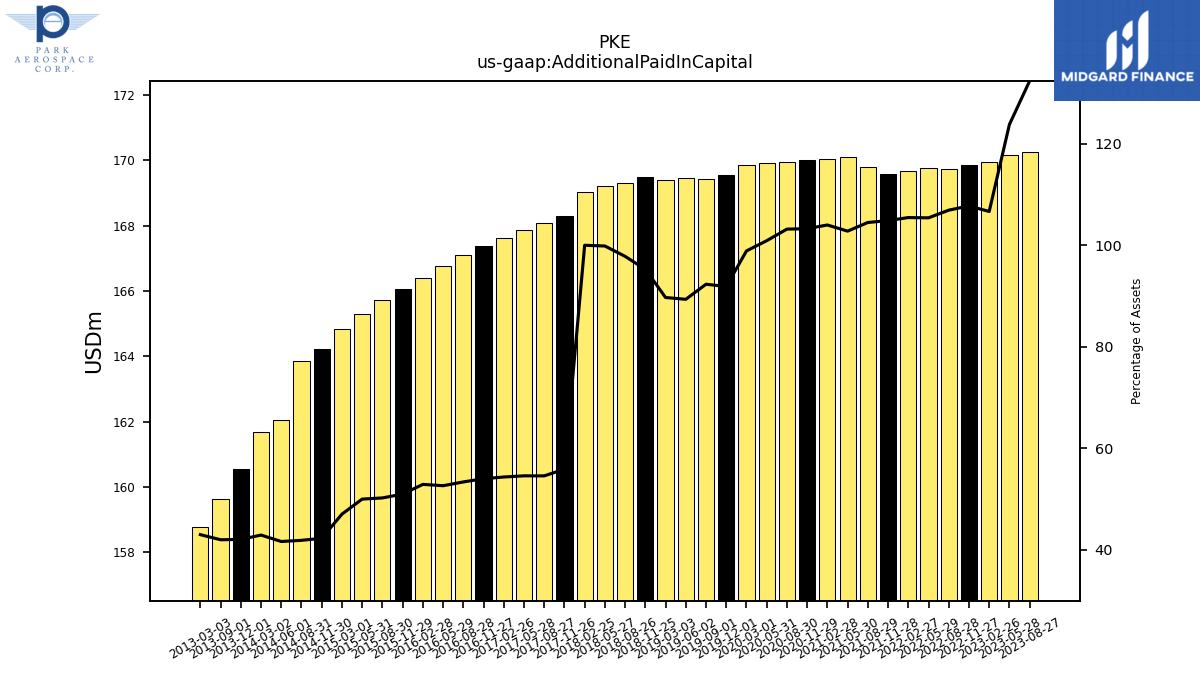
| Additional Paid In Capital | 170.25 | 170.15 | 169.93 | 169.84 | 169.74 | 169.75 | 169.66 | 169.59 | 169.78 | NA | 170.10 | 170.04 | 170.00 | 169.96 | 169.91 | 169.86 | 169.54 | 169.43 | 169.46 | 169.40 | 169.49 | 169.30 | 169.20 | 169.01 | 168.31 | 168.07 | 167.85 | 167.61 | 167.37 | 167.10 | 166.75 | 166.40 | 166.06 | 165.71 | 165.29 | 164.82 | 164.23 | 163.86 | 162.05 | 161.68 | 160.56 | 159.63 | NA | 158.79 | NA | NA | NA | NA | NA | NA | NA | NA | NA | NA | |
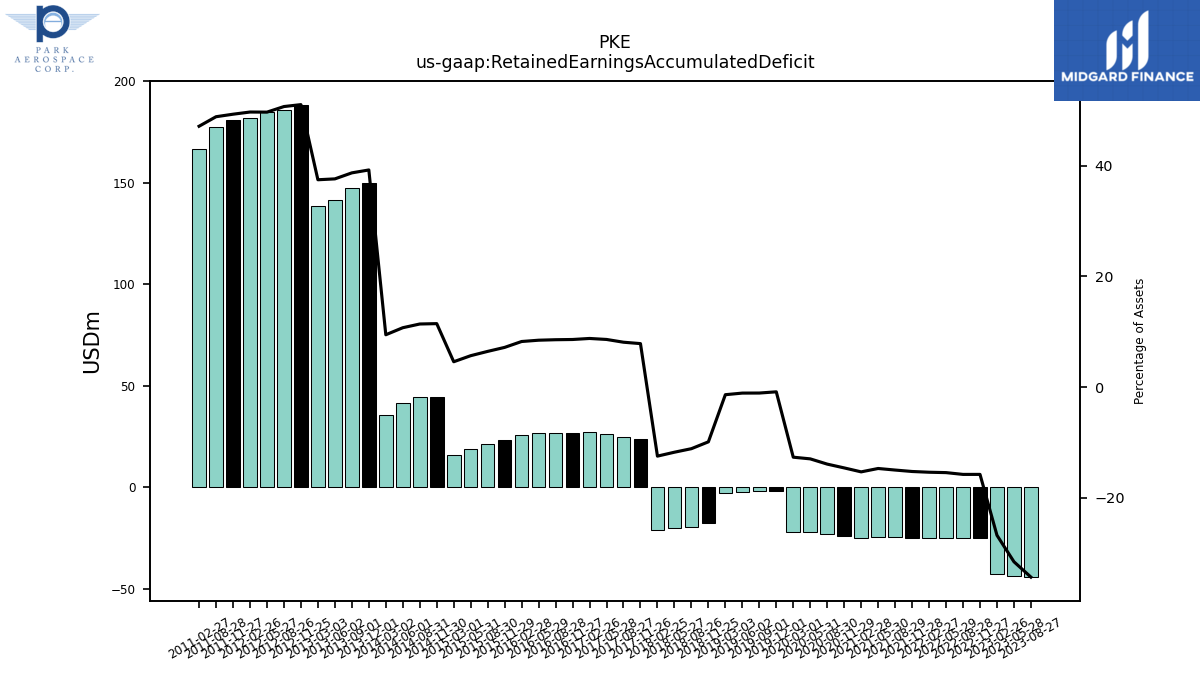
| Retained Earnings Accumulated Deficit | -44.18 | -43.40 | -42.69 | -24.88 | -25.06 | -24.90 | -24.77 | -24.68 | -24.37 | NA | -24.36 | -25.06 | -24.06 | -22.94 | -21.86 | -21.77 | -1.59 | -1.98 | -2.07 | -2.60 | -17.61 | -19.28 | -19.95 | -21.10 | 23.67 | 24.98 | 26.48 | 27.11 | 26.66 | 26.81 | 26.85 | 25.92 | 23.37 | 21.29 | 18.76 | 16.05 | 44.58 | 44.64 | 41.78 | 35.65 | 149.96 | 147.32 | 141.36 | 138.51 | 188.59 | 185.96 | 184.79 | 181.94 | 180.87 | 177.56 | NA | 166.79 | NA | NA | |
| Accumulated Other Comprehensive Income Loss Net Of Tax | -3.42 | -3.53 | -4.24 | -4.28 | -3.56 | -2.90 | -1.97 | -0.83 | -0.34 | NA | -0.28 | -0.34 | 0.27 | 0.67 | 0.87 | 0.67 | 0.31 | 0.52 | 0.32 | -0.02 | 0.24 | 0.22 | 0.10 | 0.13 | 0.08 | 0.92 | 0.84 | 1.03 | 1.06 | 1.40 | 1.39 | 1.47 | 1.34 | 1.49 | 1.59 | 1.47 | 1.16 | 1.16 | 1.16 | 1.22 | 1.03 | 0.79 | 0.99 | 0.63 | 0.96 | 0.79 | 2.37 | 2.08 | 2.23 | 2.39 | NA | 1.98 | NA | NA | |
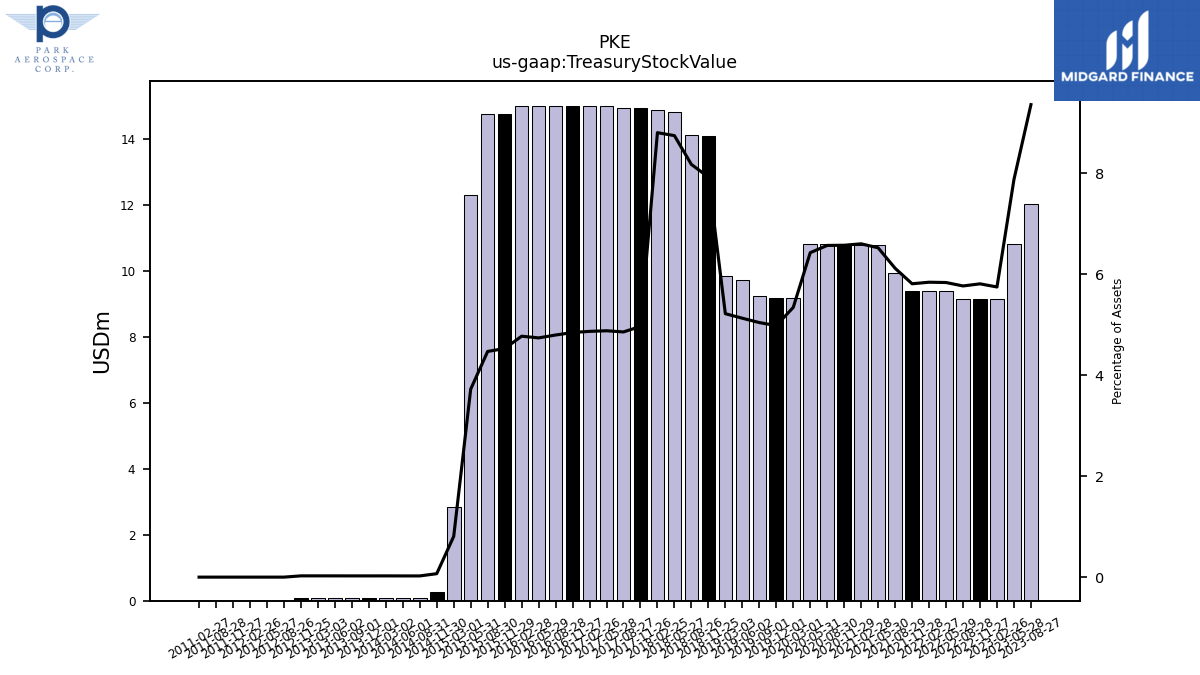
| Treasury Stock Value | 12.04 | 10.82 | 9.16 | 9.16 | 9.16 | 9.40 | 9.40 | 9.40 | 9.94 | NA | 10.79 | 10.79 | 10.82 | 10.82 | 10.82 | 9.18 | 9.20 | 9.25 | 9.73 | 9.85 | 14.10 | 14.15 | 14.82 | 14.88 | 14.96 | 14.96 | 15.01 | 15.02 | 15.02 | 15.02 | 15.02 | 15.02 | 14.76 | 14.76 | 12.32 | 2.83 | 0.27 | 0.09 | 0.09 | 0.09 | 0.09 | 0.09 | 0.09 | 0.09 | 0.09 | 0.00 | 0.00 | 0.00 | 0.00 | 0.00 | NA | 0.00 | NA | NA |
| 2023-08-27 | 2023-05-28 | 2023-02-26 | 2022-11-27 | 2022-08-28 | 2022-05-29 | 2022-02-27 | 2021-11-28 | 2021-08-29 | 2021-05-31 | 2021-05-30 | 2021-02-28 | 2020-11-29 | 2020-08-30 | 2020-05-31 | 2020-03-01 | 2019-12-01 | 2019-09-01 | 2019-06-02 | 2019-03-03 | 2018-11-25 | 2018-08-26 | 2018-05-27 | 2018-02-25 | 2017-11-26 | 2017-08-27 | 2017-05-28 | 2017-02-26 | 2016-11-27 | 2016-08-28 | 2016-05-29 | 2016-02-28 | 2015-11-29 | 2015-08-30 | 2015-05-31 | 2015-03-01 | 2014-11-30 | 2014-08-31 | 2014-06-01 | 2014-03-02 | 2013-12-01 | 2013-09-01 | 2013-06-02 | 2013-03-03 | 2012-11-25 | 2012-08-26 | 2012-05-27 | 2012-02-26 | 2011-11-27 | 2011-08-28 | 2011-05-29 | 2011-02-27 | 2010-11-28 | 2010-08-29 | ||
|---|---|---|---|---|---|---|---|---|---|---|---|---|---|---|---|---|---|---|---|---|---|---|---|---|---|---|---|---|---|---|---|---|---|---|---|---|---|---|---|---|---|---|---|---|---|---|---|---|---|---|---|---|---|---|---|
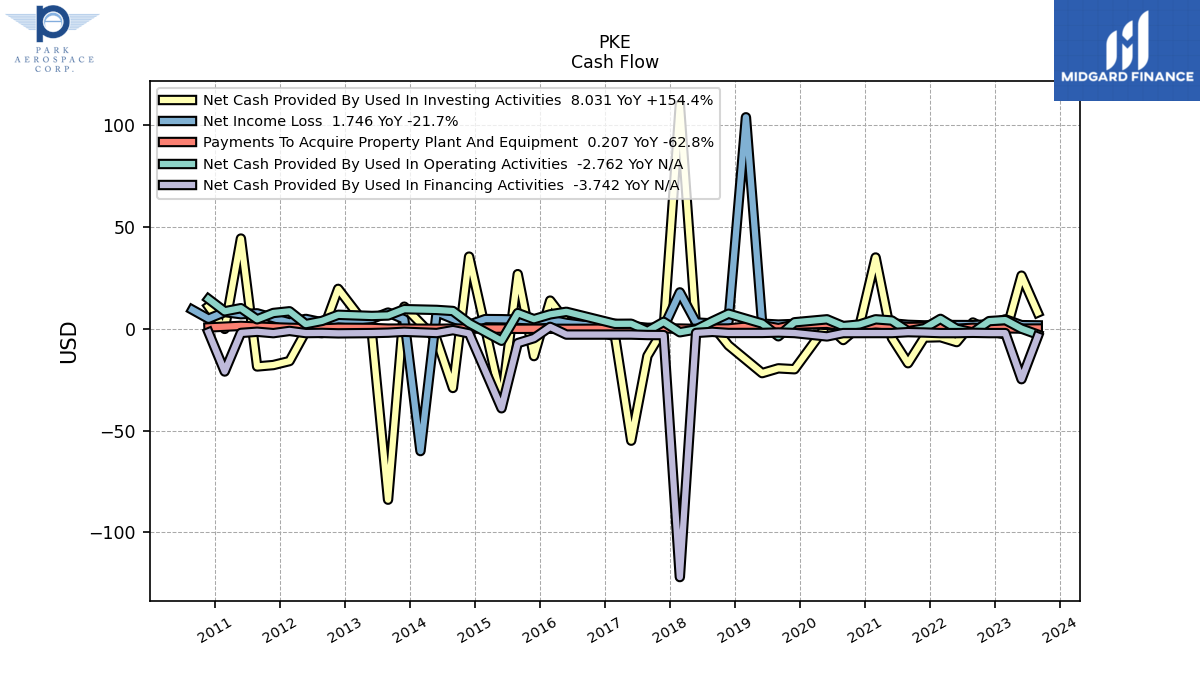
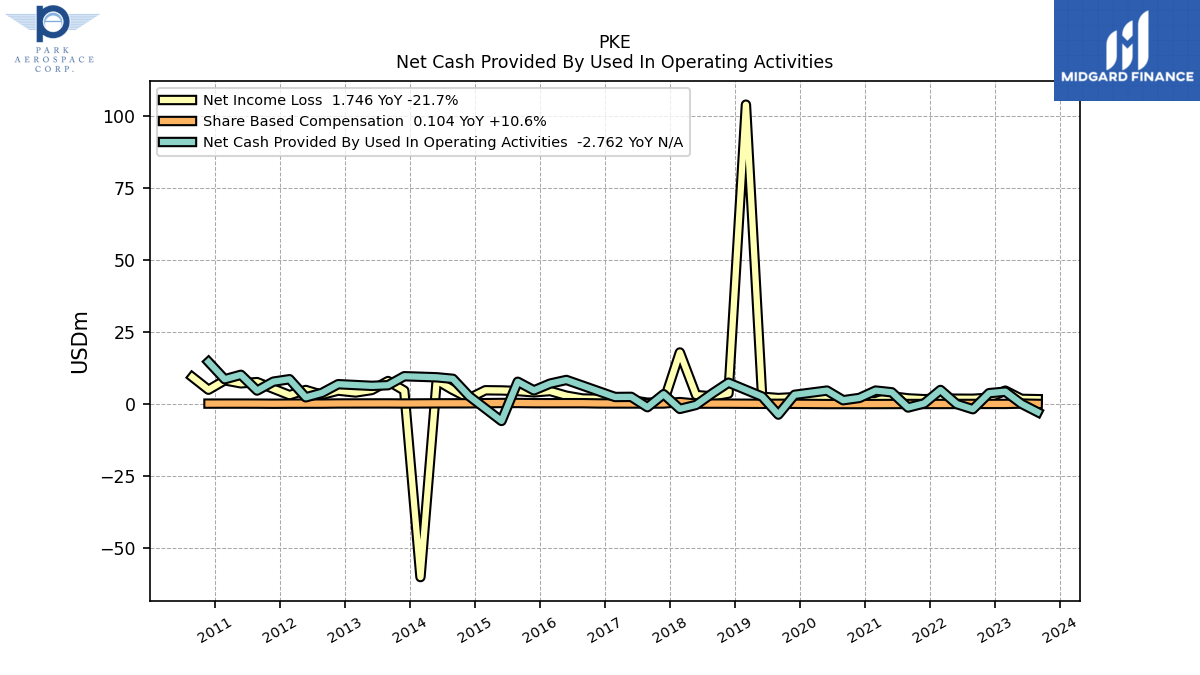
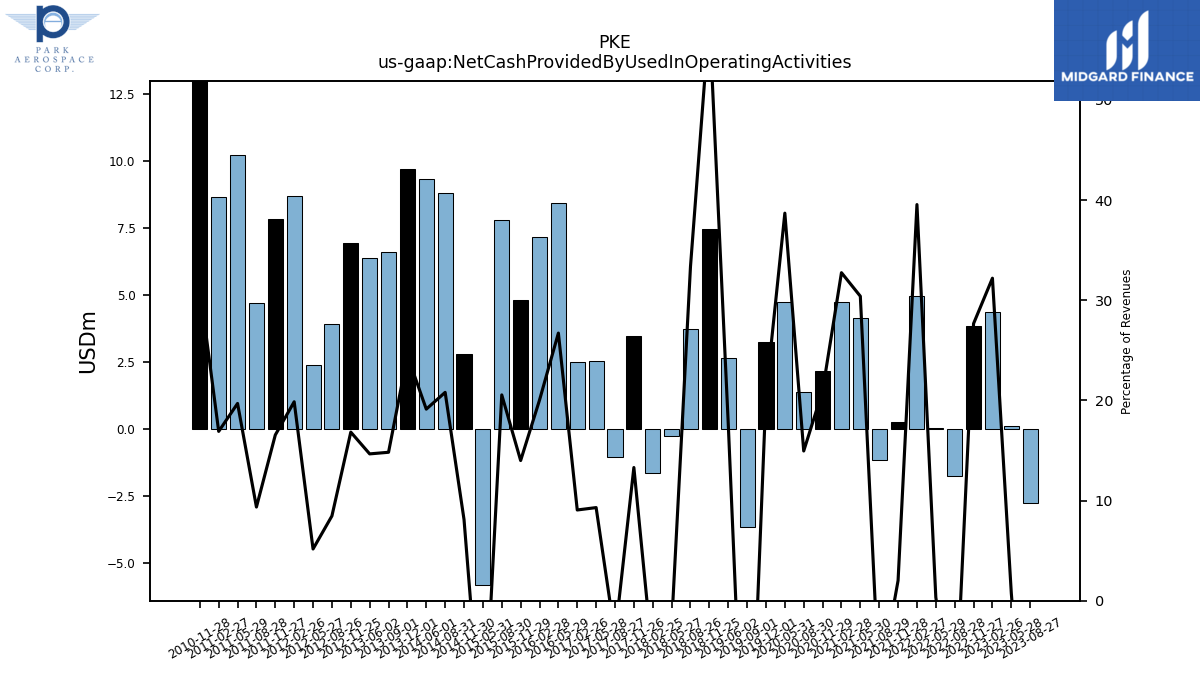
| Net Cash Provided By Used In Operating Activities | -2.76 | 0.12 | 4.36 | 3.84 | -1.75 | 0.04 | 4.95 | 0.28 | -1.16 | NA | 4.13 | 4.73 | 2.17 | 1.38 | 4.73 | NA | 3.26 | -3.62 | 2.65 | NA | 7.47 | 3.74 | -0.26 | -1.64 | 3.48 | -1.05 | 2.55 | 2.50 | NA | NA | 8.41 | 7.16 | 4.80 | 7.80 | -5.82 | NA | 2.81 | 8.81 | 9.34 | NA | 9.71 | 6.60 | 6.37 | NA | 6.95 | 3.93 | 2.38 | 8.68 | 7.83 | 4.72 | 10.21 | 8.66 | 14.70 | NA | |
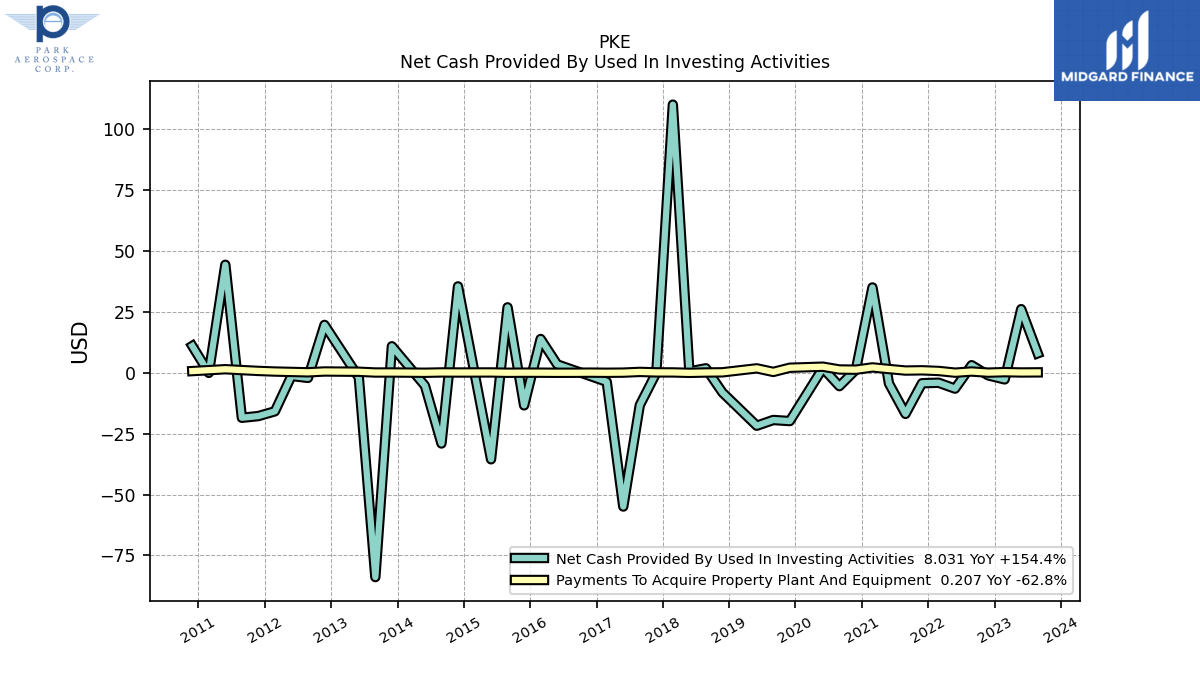
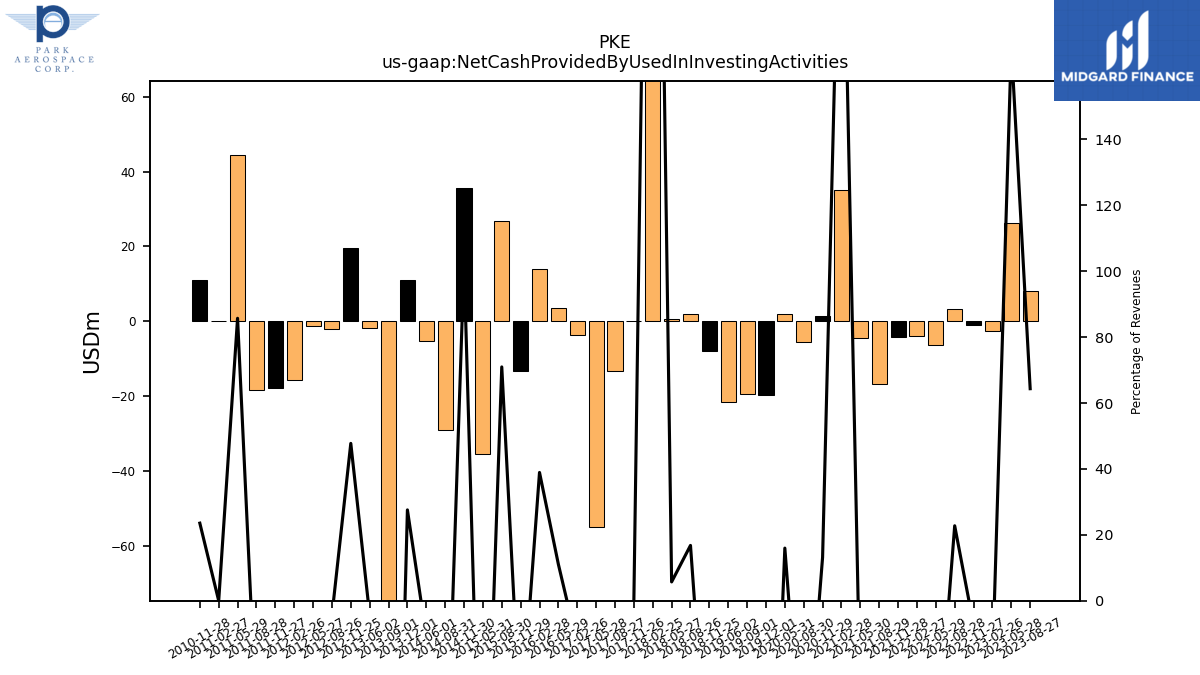
| Net Cash Provided By Used In Investing Activities | 8.03 | 26.18 | -2.68 | -1.02 | 3.16 | -6.48 | -4.05 | -4.25 | -16.86 | NA | -4.39 | 35.10 | 1.37 | -5.46 | 1.95 | NA | -19.80 | -19.36 | -21.71 | NA | -8.07 | 1.88 | 0.59 | 110.19 | 0.03 | -13.27 | -54.91 | -3.65 | NA | NA | 3.48 | 13.92 | -13.35 | 26.93 | -35.51 | NA | 35.53 | -29.01 | -5.26 | NA | 10.94 | -83.90 | -1.88 | NA | 19.70 | -2.07 | -1.25 | -15.79 | -17.74 | -18.45 | 44.41 | -0.00 | 11.05 | NA | |
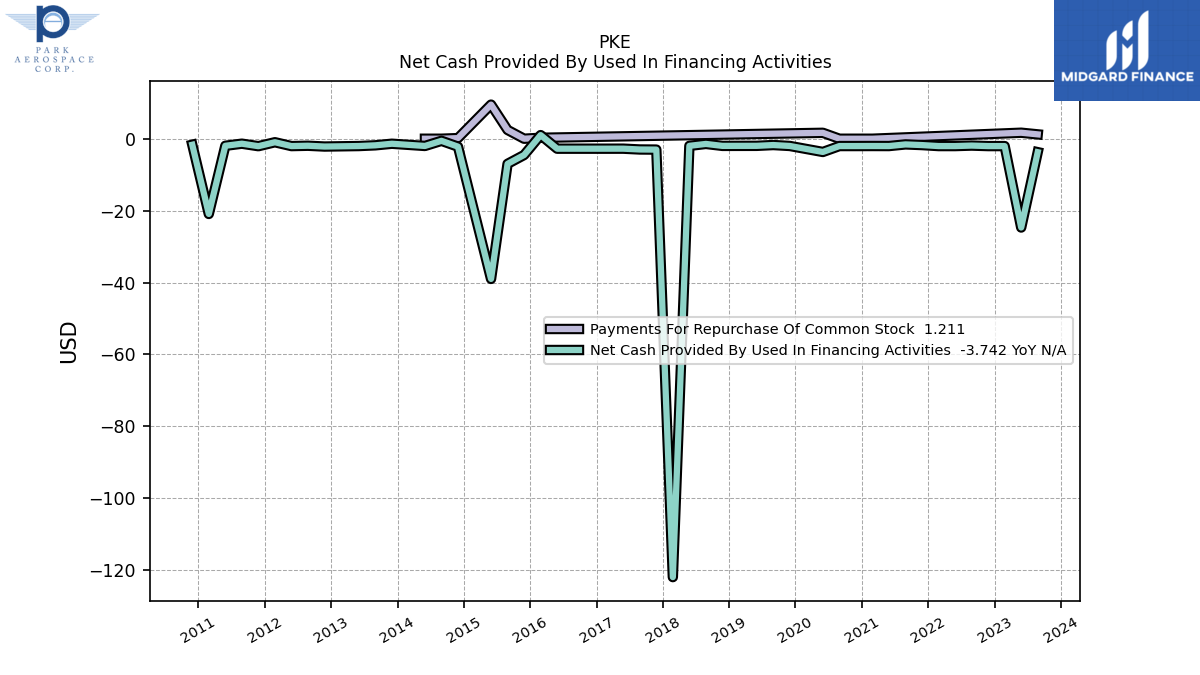
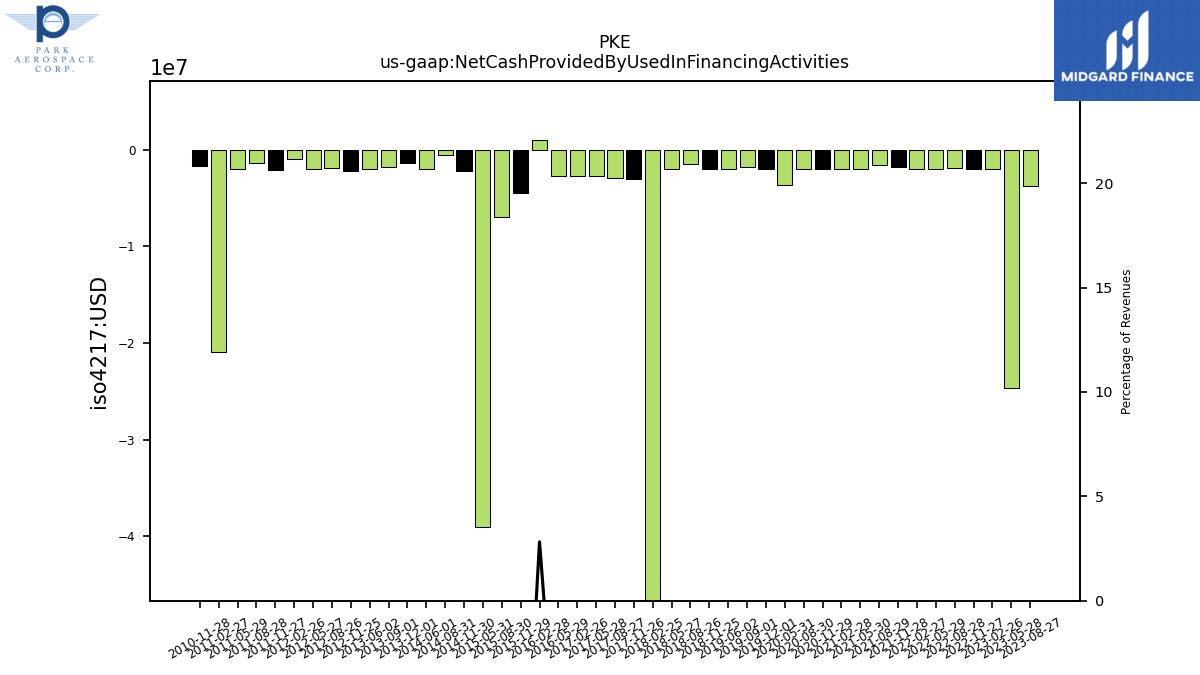
| Net Cash Provided By Used In Financing Activities | -3.74 | -24.70 | -2.05 | -2.05 | -1.91 | -2.05 | -2.04 | -1.77 | -1.58 | NA | -2.04 | -2.03 | -2.04 | -2.04 | -3.68 | NA | -2.02 | -1.76 | -1.98 | NA | -1.99 | -1.45 | -1.98 | -121.93 | -3.02 | -2.99 | -2.77 | -2.77 | NA | NA | -2.77 | 1.01 | -4.53 | -6.98 | -39.00 | NA | -2.20 | -0.59 | -2.01 | NA | -1.40 | -1.83 | -2.04 | NA | -2.17 | -1.95 | -2.05 | -0.98 | -2.08 | -1.38 | -1.96 | -20.93 | -1.67 | NA |
| 2023-08-27 | 2023-05-28 | 2023-02-26 | 2022-11-27 | 2022-08-28 | 2022-05-29 | 2022-02-27 | 2021-11-28 | 2021-08-29 | 2021-05-31 | 2021-05-30 | 2021-02-28 | 2020-11-29 | 2020-08-30 | 2020-05-31 | 2020-03-01 | 2019-12-01 | 2019-09-01 | 2019-06-02 | 2019-03-03 | 2018-11-25 | 2018-08-26 | 2018-05-27 | 2018-02-25 | 2017-11-26 | 2017-08-27 | 2017-05-28 | 2017-02-26 | 2016-11-27 | 2016-08-28 | 2016-05-29 | 2016-02-28 | 2015-11-29 | 2015-08-30 | 2015-05-31 | 2015-03-01 | 2014-11-30 | 2014-08-31 | 2014-06-01 | 2014-03-02 | 2013-12-01 | 2013-09-01 | 2013-06-02 | 2013-03-03 | 2012-11-25 | 2012-08-26 | 2012-05-27 | 2012-02-26 | 2011-11-27 | 2011-08-28 | 2011-05-29 | 2011-02-27 | 2010-11-28 | 2010-08-29 | ||
|---|---|---|---|---|---|---|---|---|---|---|---|---|---|---|---|---|---|---|---|---|---|---|---|---|---|---|---|---|---|---|---|---|---|---|---|---|---|---|---|---|---|---|---|---|---|---|---|---|---|---|---|---|---|---|---|
| Net Cash Provided By Used In Operating Activities | -2.76 | 0.12 | 4.36 | 3.84 | -1.75 | 0.04 | 4.95 | 0.28 | -1.16 | NA | 4.13 | 4.73 | 2.17 | 1.38 | 4.73 | NA | 3.26 | -3.62 | 2.65 | NA | 7.47 | 3.74 | -0.26 | -1.64 | 3.48 | -1.05 | 2.55 | 2.50 | NA | NA | 8.41 | 7.16 | 4.80 | 7.80 | -5.82 | NA | 2.81 | 8.81 | 9.34 | NA | 9.71 | 6.60 | 6.37 | NA | 6.95 | 3.93 | 2.38 | 8.68 | 7.83 | 4.72 | 10.21 | 8.66 | 14.70 | NA | |
| Net Income Loss | 1.75 | 1.85 | 4.71 | 2.23 | 1.89 | 1.91 | 1.96 | 1.74 | 2.02 | NA | 2.75 | 1.03 | 0.92 | 0.95 | 1.96 | 2.38 | 2.45 | 2.13 | 2.59 | 103.99 | 3.69 | 2.70 | 3.17 | 17.96 | 0.72 | 0.52 | 1.39 | 2.48 | 1.88 | 1.98 | 2.95 | 4.57 | 4.11 | 4.57 | 4.78 | 4.84 | 2.03 | 4.96 | 8.22 | -60.02 | 4.72 | 8.04 | 4.93 | 4.07 | 4.71 | 3.25 | 4.93 | 3.15 | 5.38 | 7.67 | 7.24 | 8.29 | 5.02 | 9.45 | |
| Depreciation Depletion And Amortization | 0.34 | 0.30 | 0.31 | 0.30 | 0.26 | 0.26 | 0.33 | 0.35 | 0.23 | NA | 0.22 | 0.28 | 0.31 | 0.28 | 0.28 | NA | 0.41 | 0.37 | 0.37 | NA | 0.45 | 0.16 | 0.70 | 0.75 | 0.72 | 0.74 | 0.81 | 0.73 | 0.72 | 0.82 | 0.83 | 0.84 | 0.85 | 0.84 | 0.84 | NA | 0.89 | 0.86 | 0.90 | NA | 1.01 | 0.99 | 0.97 | NA | 1.03 | 1.07 | 1.10 | 1.60 | 1.44 | 1.43 | 1.43 | 1.56 | 1.72 | NA | |
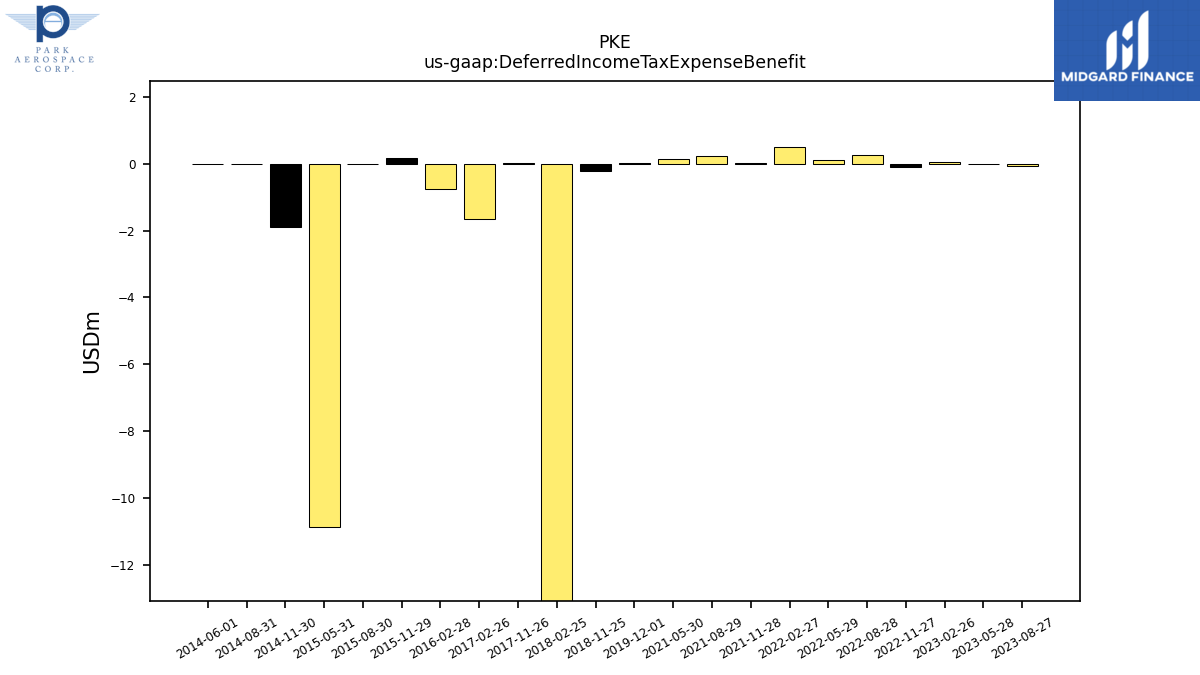
| Deferred Income Tax Expense Benefit | -0.05 | 0.00 | 0.06 | -0.10 | 0.26 | 0.11 | 0.52 | 0.01 | 0.25 | NA | 0.14 | NA | NA | NA | NA | NA | 0.04 | NA | NA | NA | -0.20 | NA | NA | -41.11 | 0.04 | NA | NA | -1.64 | NA | NA | NA | -0.74 | 0.19 | 0.00 | -10.86 | NA | -1.90 | 0.00 | 0.00 | NA | NA | NA | NA | NA | NA | NA | NA | NA | NA | NA | NA | NA | NA | NA | |
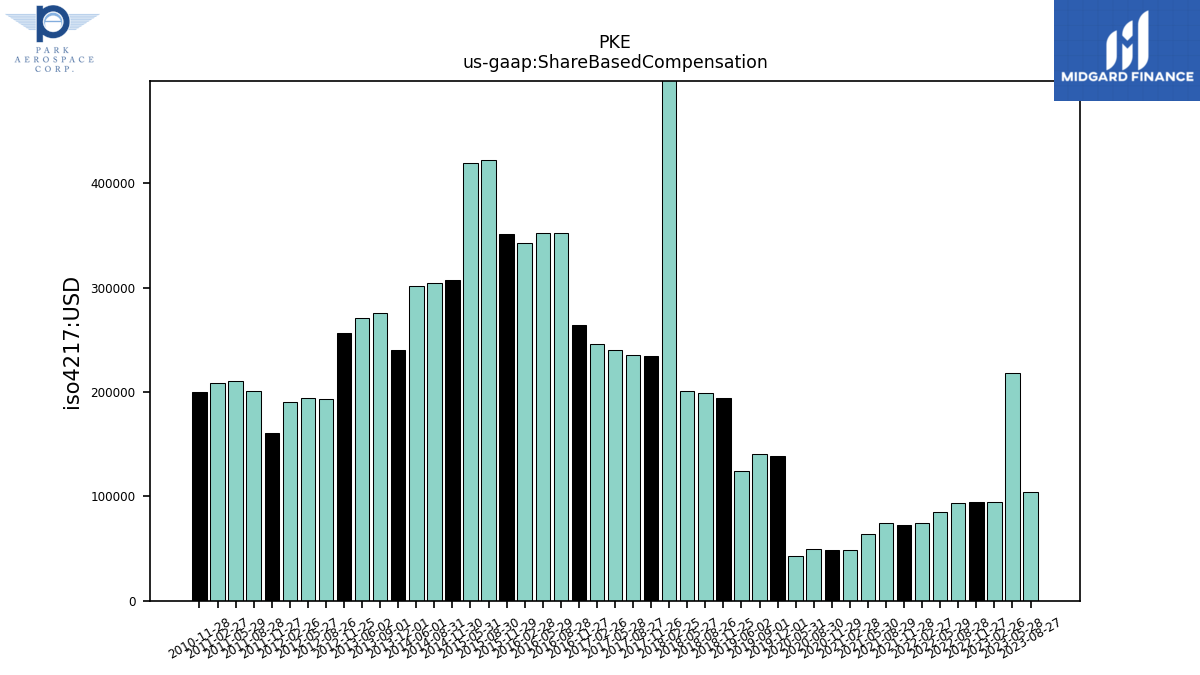
| Share Based Compensation | 0.10 | 0.22 | 0.10 | 0.10 | 0.09 | 0.09 | 0.07 | 0.07 | 0.07 | NA | 0.06 | 0.05 | 0.05 | 0.05 | 0.04 | NA | 0.14 | 0.14 | 0.12 | NA | 0.19 | 0.20 | 0.20 | 0.74 | 0.23 | 0.23 | 0.24 | 0.25 | 0.26 | 0.35 | 0.35 | 0.34 | 0.35 | 0.42 | 0.42 | NA | 0.31 | 0.30 | 0.30 | NA | 0.24 | 0.28 | 0.27 | NA | 0.26 | 0.19 | 0.19 | 0.19 | 0.16 | 0.20 | 0.21 | 0.21 | 0.20 | NA |
| 2023-08-27 | 2023-05-28 | 2023-02-26 | 2022-11-27 | 2022-08-28 | 2022-05-29 | 2022-02-27 | 2021-11-28 | 2021-08-29 | 2021-05-31 | 2021-05-30 | 2021-02-28 | 2020-11-29 | 2020-08-30 | 2020-05-31 | 2020-03-01 | 2019-12-01 | 2019-09-01 | 2019-06-02 | 2019-03-03 | 2018-11-25 | 2018-08-26 | 2018-05-27 | 2018-02-25 | 2017-11-26 | 2017-08-27 | 2017-05-28 | 2017-02-26 | 2016-11-27 | 2016-08-28 | 2016-05-29 | 2016-02-28 | 2015-11-29 | 2015-08-30 | 2015-05-31 | 2015-03-01 | 2014-11-30 | 2014-08-31 | 2014-06-01 | 2014-03-02 | 2013-12-01 | 2013-09-01 | 2013-06-02 | 2013-03-03 | 2012-11-25 | 2012-08-26 | 2012-05-27 | 2012-02-26 | 2011-11-27 | 2011-08-28 | 2011-05-29 | 2011-02-27 | 2010-11-28 | 2010-08-29 | ||
|---|---|---|---|---|---|---|---|---|---|---|---|---|---|---|---|---|---|---|---|---|---|---|---|---|---|---|---|---|---|---|---|---|---|---|---|---|---|---|---|---|---|---|---|---|---|---|---|---|---|---|---|---|---|---|---|
| Net Cash Provided By Used In Investing Activities | 8.03 | 26.18 | -2.68 | -1.02 | 3.16 | -6.48 | -4.05 | -4.25 | -16.86 | NA | -4.39 | 35.10 | 1.37 | -5.46 | 1.95 | NA | -19.80 | -19.36 | -21.71 | NA | -8.07 | 1.88 | 0.59 | 110.19 | 0.03 | -13.27 | -54.91 | -3.65 | NA | NA | 3.48 | 13.92 | -13.35 | 26.93 | -35.51 | NA | 35.53 | -29.01 | -5.26 | NA | 10.94 | -83.90 | -1.88 | NA | 19.70 | -2.07 | -1.25 | -15.79 | -17.74 | -18.45 | 44.41 | -0.00 | 11.05 | NA | |
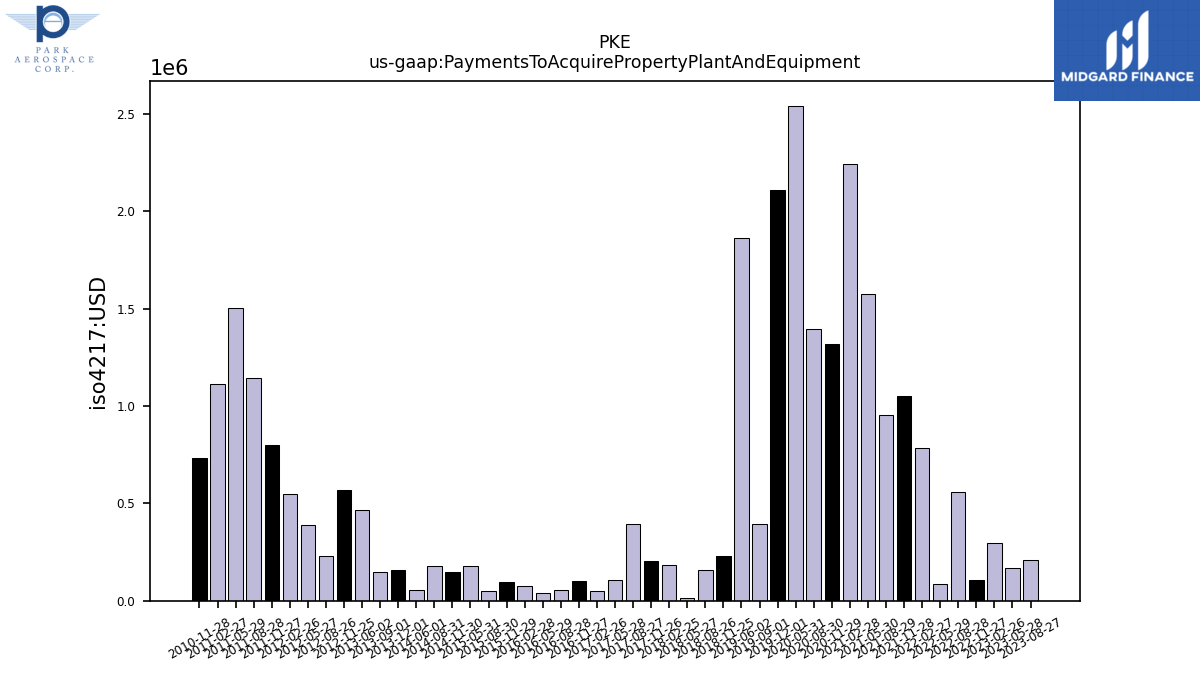
| Payments To Acquire Property Plant And Equipment | 0.21 | 0.17 | 0.30 | 0.10 | 0.56 | 0.09 | 0.79 | 1.05 | 0.96 | NA | 1.58 | 2.24 | 1.32 | 1.39 | 2.54 | NA | 2.11 | 0.39 | 1.86 | NA | 0.23 | 0.16 | 0.01 | 0.18 | 0.20 | 0.40 | 0.10 | 0.05 | 0.10 | 0.05 | 0.04 | 0.08 | 0.09 | 0.05 | 0.18 | NA | 0.15 | 0.18 | 0.05 | NA | 0.16 | 0.15 | 0.46 | NA | 0.57 | 0.23 | 0.39 | 0.55 | 0.80 | 1.14 | 1.50 | 1.11 | 0.73 | NA |
| 2023-08-27 | 2023-05-28 | 2023-02-26 | 2022-11-27 | 2022-08-28 | 2022-05-29 | 2022-02-27 | 2021-11-28 | 2021-08-29 | 2021-05-31 | 2021-05-30 | 2021-02-28 | 2020-11-29 | 2020-08-30 | 2020-05-31 | 2020-03-01 | 2019-12-01 | 2019-09-01 | 2019-06-02 | 2019-03-03 | 2018-11-25 | 2018-08-26 | 2018-05-27 | 2018-02-25 | 2017-11-26 | 2017-08-27 | 2017-05-28 | 2017-02-26 | 2016-11-27 | 2016-08-28 | 2016-05-29 | 2016-02-28 | 2015-11-29 | 2015-08-30 | 2015-05-31 | 2015-03-01 | 2014-11-30 | 2014-08-31 | 2014-06-01 | 2014-03-02 | 2013-12-01 | 2013-09-01 | 2013-06-02 | 2013-03-03 | 2012-11-25 | 2012-08-26 | 2012-05-27 | 2012-02-26 | 2011-11-27 | 2011-08-28 | 2011-05-29 | 2011-02-27 | 2010-11-28 | 2010-08-29 | ||
|---|---|---|---|---|---|---|---|---|---|---|---|---|---|---|---|---|---|---|---|---|---|---|---|---|---|---|---|---|---|---|---|---|---|---|---|---|---|---|---|---|---|---|---|---|---|---|---|---|---|---|---|---|---|---|---|
| Net Cash Provided By Used In Financing Activities | -3.74 | -24.70 | -2.05 | -2.05 | -1.91 | -2.05 | -2.04 | -1.77 | -1.58 | NA | -2.04 | -2.03 | -2.04 | -2.04 | -3.68 | NA | -2.02 | -1.76 | -1.98 | NA | -1.99 | -1.45 | -1.98 | -121.93 | -3.02 | -2.99 | -2.77 | -2.77 | NA | NA | -2.77 | 1.01 | -4.53 | -6.98 | -39.00 | NA | -2.20 | -0.59 | -2.01 | NA | -1.40 | -1.83 | -2.04 | NA | -2.17 | -1.95 | -2.05 | -0.98 | -2.08 | -1.38 | -1.96 | -20.93 | -1.67 | NA | |
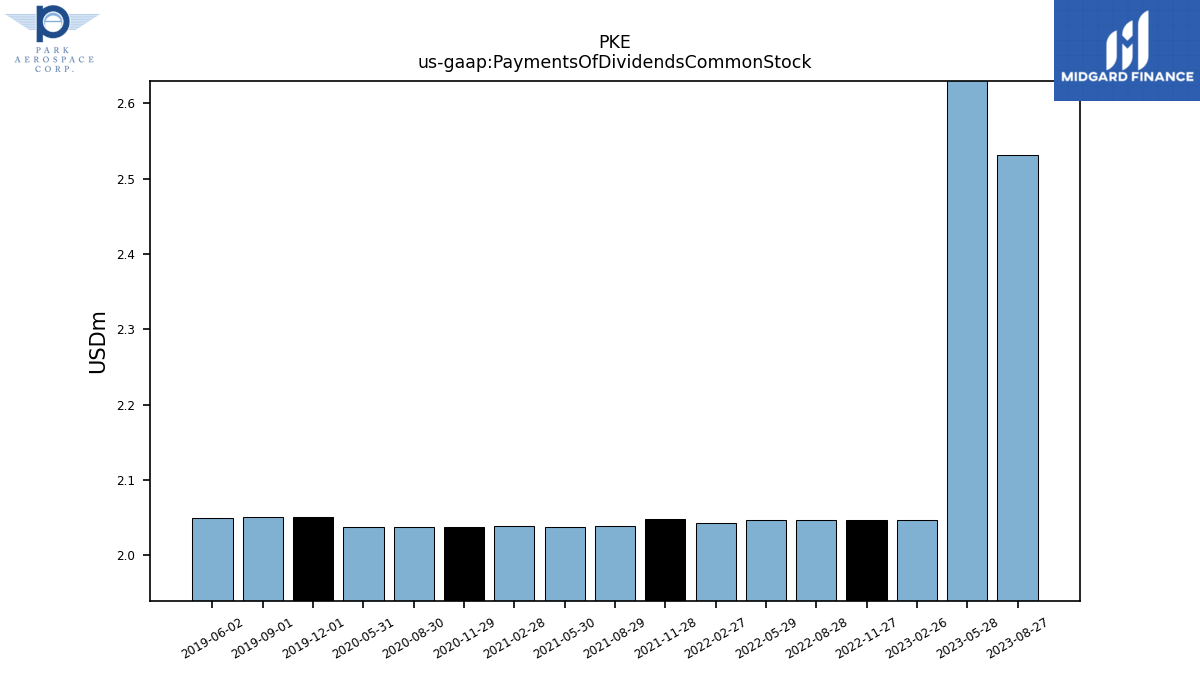
| Payments Of Dividends Common Stock | 2.53 | 23.03 | 2.05 | 2.05 | 2.05 | 2.05 | 2.04 | 2.05 | 2.04 | NA | 2.04 | 2.04 | 2.04 | 2.04 | 2.04 | NA | 2.05 | 2.05 | 2.05 | NA | NA | NA | NA | NA | NA | NA | NA | NA | NA | NA | NA | NA | NA | NA | NA | NA | NA | NA | NA | NA | NA | NA | NA | NA | NA | NA | NA | NA | NA | NA | NA | NA | NA | NA | |
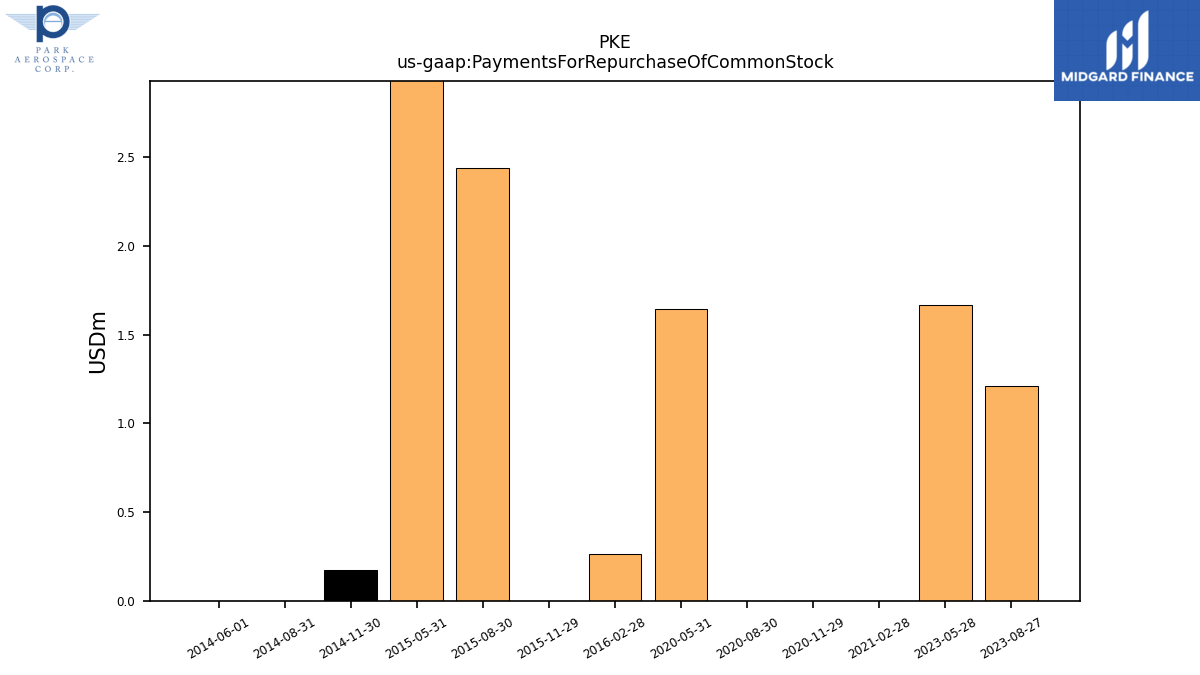
| Payments For Repurchase Of Common Stock | 1.21 | 1.67 | NA | NA | NA | NA | NA | NA | NA | NA | NA | 0.00 | 0.00 | 0.00 | 1.64 | NA | NA | NA | NA | NA | NA | NA | NA | NA | NA | NA | NA | NA | NA | NA | NA | 0.26 | 0.00 | 2.44 | 9.48 | NA | 0.17 | 0.00 | 0.00 | NA | NA | NA | NA | NA | NA | NA | NA | NA | NA | NA | NA | NA | NA | NA |
| 2023-08-27 | 2023-05-28 | 2023-02-26 | 2022-11-27 | 2022-08-28 | 2022-05-29 | 2022-02-27 | 2021-11-28 | 2021-08-29 | 2021-05-31 | 2021-05-30 | 2021-02-28 | 2020-11-29 | 2020-08-30 | 2020-05-31 | 2020-03-01 | 2019-12-01 | 2019-09-01 | 2019-06-02 | 2019-03-03 | 2018-11-25 | 2018-08-26 | 2018-05-27 | 2018-02-25 | 2017-11-26 | 2017-08-27 | 2017-05-28 | 2017-02-26 | 2016-11-27 | 2016-08-28 | 2016-05-29 | 2016-02-28 | 2015-11-29 | 2015-08-30 | 2015-05-31 | 2015-03-01 | 2014-11-30 | 2014-08-31 | 2014-06-01 | 2014-03-02 | 2013-12-01 | 2013-09-01 | 2013-06-02 | 2013-03-03 | 2012-11-25 | 2012-08-26 | 2012-05-27 | 2012-02-26 | 2011-11-27 | 2011-08-28 | 2011-05-29 | 2011-02-27 | 2010-11-28 | 2010-08-29 | ||
|---|---|---|---|---|---|---|---|---|---|---|---|---|---|---|---|---|---|---|---|---|---|---|---|---|---|---|---|---|---|---|---|---|---|---|---|---|---|---|---|---|---|---|---|---|---|---|---|---|---|---|---|---|---|---|---|
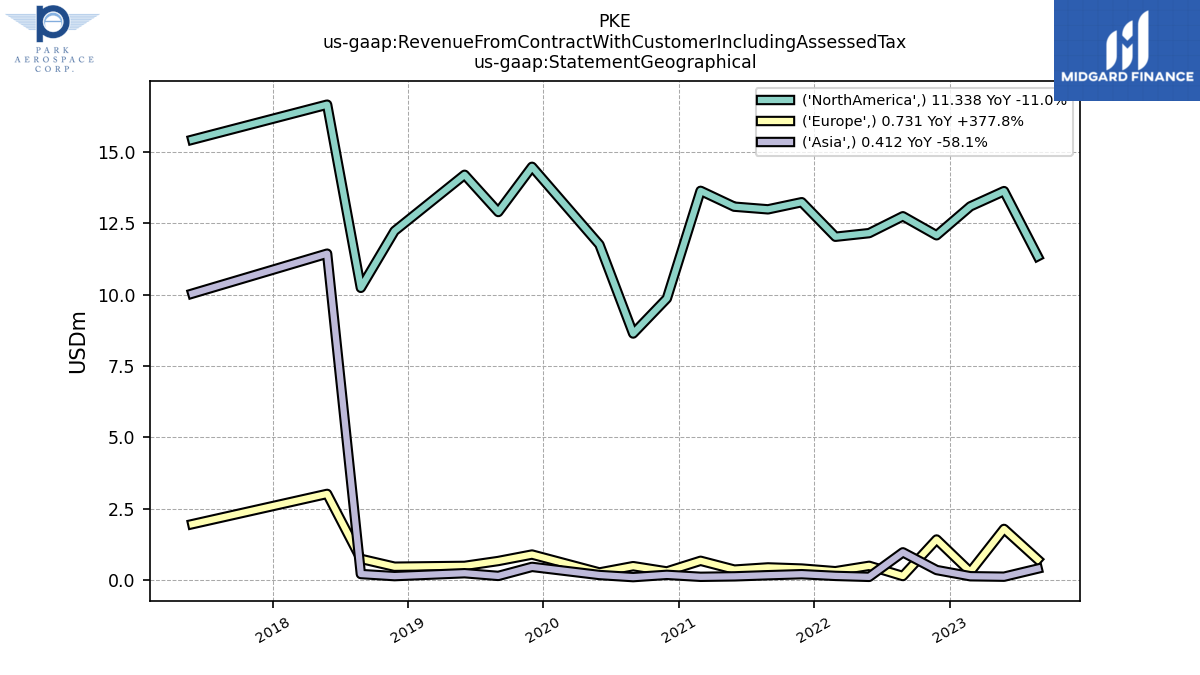
| Revenues | 12.48 | 15.55 | 13.53 | 13.87 | 13.88 | 12.78 | 12.50 | 13.86 | 13.62 | 13.59 | 13.59 | 14.44 | 10.37 | 9.25 | 12.21 | 15.49 | 15.85 | 13.72 | 14.95 | 16.66 | 12.85 | 11.21 | 10.39 | 27.80 | 26.14 | 29.84 | 27.42 | 27.60 | 26.46 | 29.06 | 31.49 | 35.76 | 34.32 | 37.95 | 37.83 | 36.24 | 34.68 | 42.35 | 48.82 | 38.15 | 39.68 | 44.50 | 43.44 | 42.67 | 41.27 | 46.43 | 46.05 | 43.68 | 47.31 | 50.45 | 51.82 | 51.20 | 46.92 | 54.51 | |
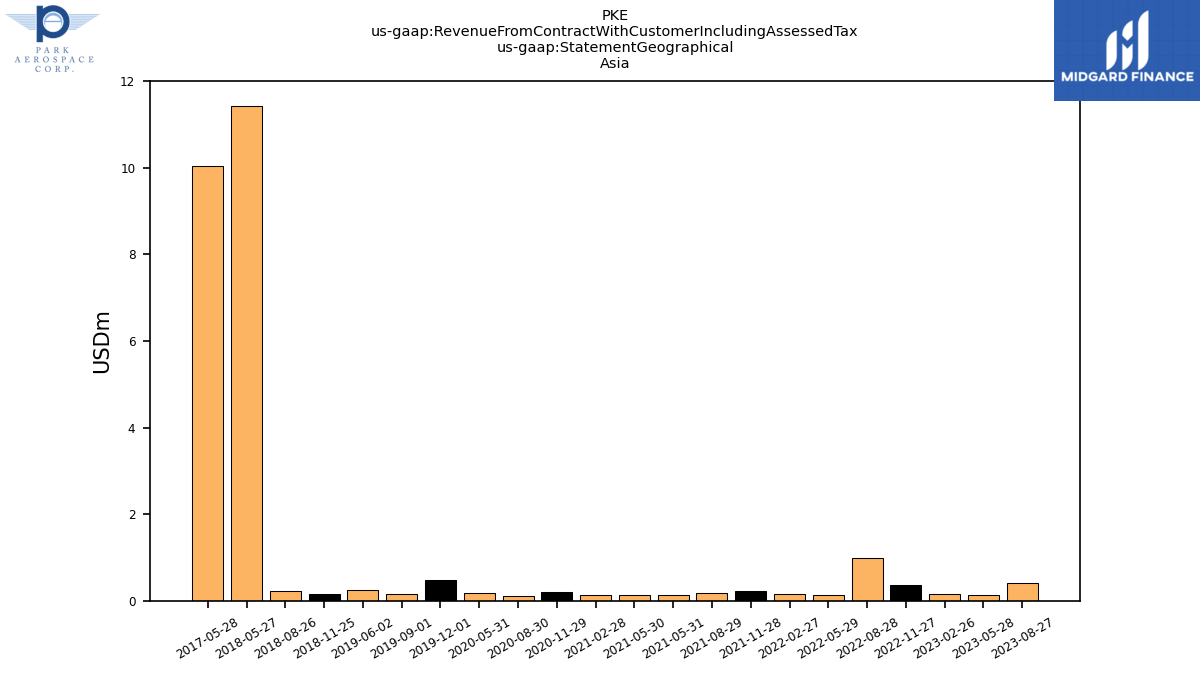
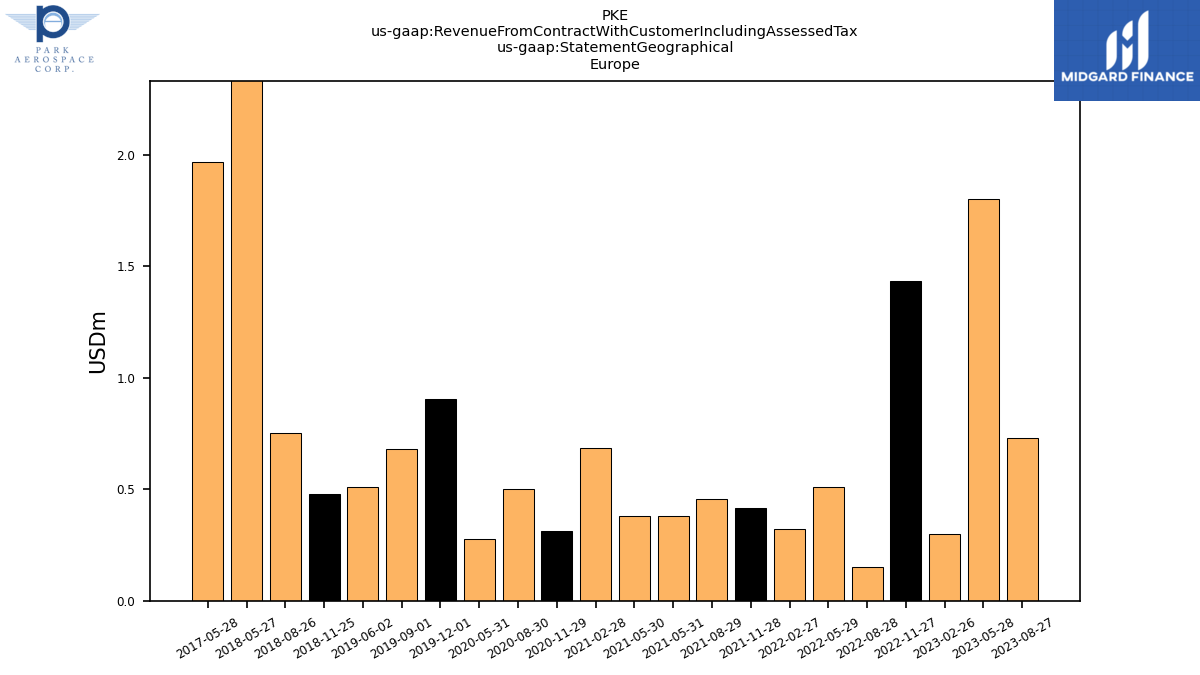
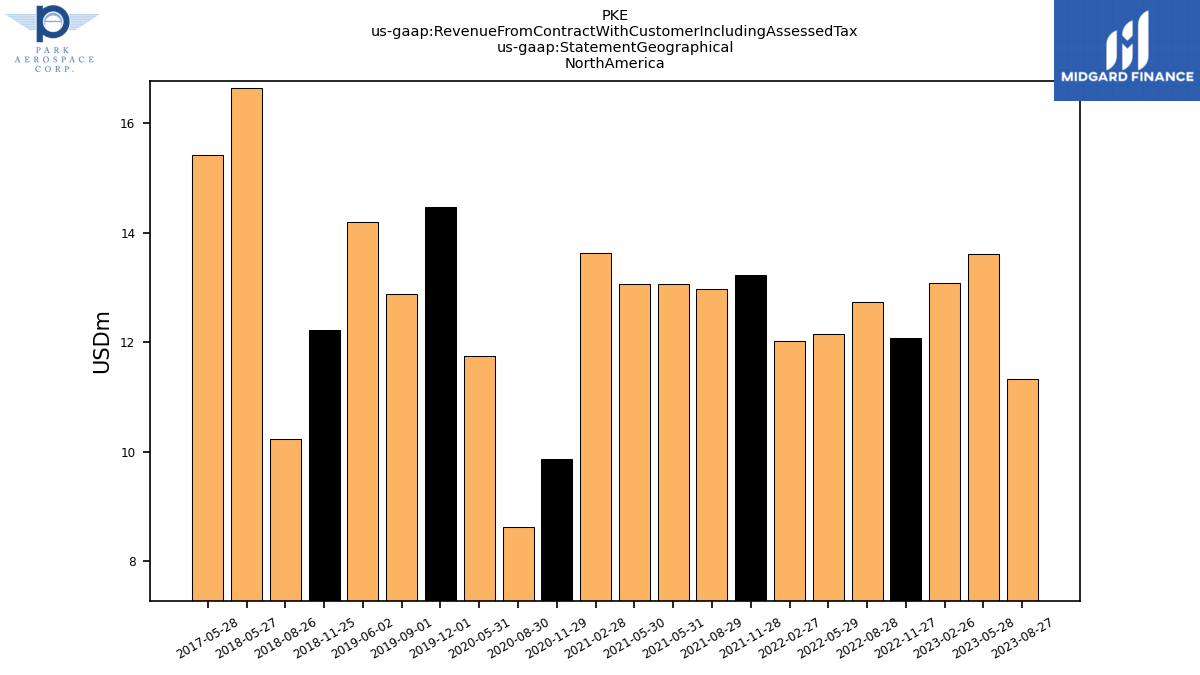
| Revenue From Contract With Customer Including Assessed Tax | 12.48 | 15.55 | 13.53 | 13.87 | 13.88 | 12.78 | 12.50 | 13.86 | 13.62 | 13.59 | 13.59 | 14.44 | 10.37 | 9.25 | 12.21 | 15.49 | 15.85 | 13.72 | 14.95 | 16.66 | 12.85 | 11.21 | 31.10 | 27.80 | 10.23 | 11.36 | 27.42 | 27.60 | 26.46 | 29.06 | 31.49 | 35.76 | 34.32 | 37.95 | 37.83 | 36.24 | 34.68 | 42.35 | 48.82 | 38.15 | 39.68 | 44.50 | 43.44 | 42.67 | 41.27 | 46.43 | 46.05 | 43.68 | 47.31 | 50.45 | 51.82 | 51.20 | 46.92 | 54.51 | |
| 0.41 | 0.13 | 0.15 | 0.36 | 0.98 | 0.12 | 0.16 | 0.22 | 0.18 | 0.14 | 0.14 | 0.13 | 0.20 | 0.12 | 0.19 | NA | 0.47 | 0.16 | 0.25 | NA | 0.15 | 0.22 | 11.43 | NA | NA | NA | 10.03 | NA | NA | NA | NA | NA | NA | NA | NA | NA | NA | NA | NA | NA | NA | NA | NA | NA | NA | NA | NA | NA | NA | NA | NA | NA | NA | NA | ||
| 0.73 | 1.80 | 0.30 | 1.43 | 0.15 | 0.51 | 0.32 | 0.41 | 0.46 | 0.38 | 0.38 | 0.69 | 0.31 | 0.50 | 0.28 | NA | 0.91 | 0.68 | 0.51 | NA | 0.48 | 0.75 | 3.03 | NA | NA | NA | 1.97 | NA | NA | NA | NA | NA | NA | NA | NA | NA | NA | NA | NA | NA | NA | NA | NA | NA | NA | NA | NA | NA | NA | NA | NA | NA | NA | NA | ||
| 11.34 | 13.62 | 13.08 | 12.07 | 12.74 | 12.15 | 12.02 | 13.23 | 12.98 | 13.07 | 13.07 | 13.63 | 9.86 | 8.64 | 11.75 | NA | 14.47 | 12.89 | 14.19 | NA | 12.22 | 10.23 | 16.64 | NA | NA | NA | 15.42 | NA | NA | NA | NA | NA | NA | NA | NA | NA | NA | NA | NA | NA | NA | NA | NA | NA | NA | NA | NA | NA | NA | NA | NA | NA | NA | NA |