
| 2023-11-30 | 2023-08-31 | 2023-05-31 | 2023-02-28 | 2022-11-30 | 2022-08-31 | 2022-05-31 | 2022-02-28 | 2021-11-30 | 2021-08-31 | 2021-05-31 | 2021-02-28 | 2020-11-30 | 2020-08-31 | 2020-05-31 | 2020-02-29 | 2019-11-30 | 2019-08-31 | 2019-05-31 | 2019-02-28 | 2018-11-30 | 2018-08-31 | 2018-05-31 | 2018-02-28 | 2017-11-30 | 2017-08-31 | 2017-05-31 | 2017-02-28 | 2016-11-30 | 2016-08-31 | 2016-05-31 | 2016-02-29 | 2015-11-30 | 2015-08-31 | 2015-05-31 | 2015-02-28 | 2014-11-30 | 2014-08-31 | 2014-05-31 | 2014-02-28 | 2013-11-30 | 2013-08-31 | 2013-05-31 | 2013-02-28 | 2012-11-30 | 2012-08-31 | 2012-05-31 | 2012-02-29 | 2011-11-30 | 2011-08-31 | 2011-05-31 | 2011-02-28 | 2010-11-30 | 2010-08-31 | 2010-05-31 | 2010-02-28 | 2009-11-30 | 2009-08-31 | ||
|---|---|---|---|---|---|---|---|---|---|---|---|---|---|---|---|---|---|---|---|---|---|---|---|---|---|---|---|---|---|---|---|---|---|---|---|---|---|---|---|---|---|---|---|---|---|---|---|---|---|---|---|---|---|---|---|---|---|---|---|
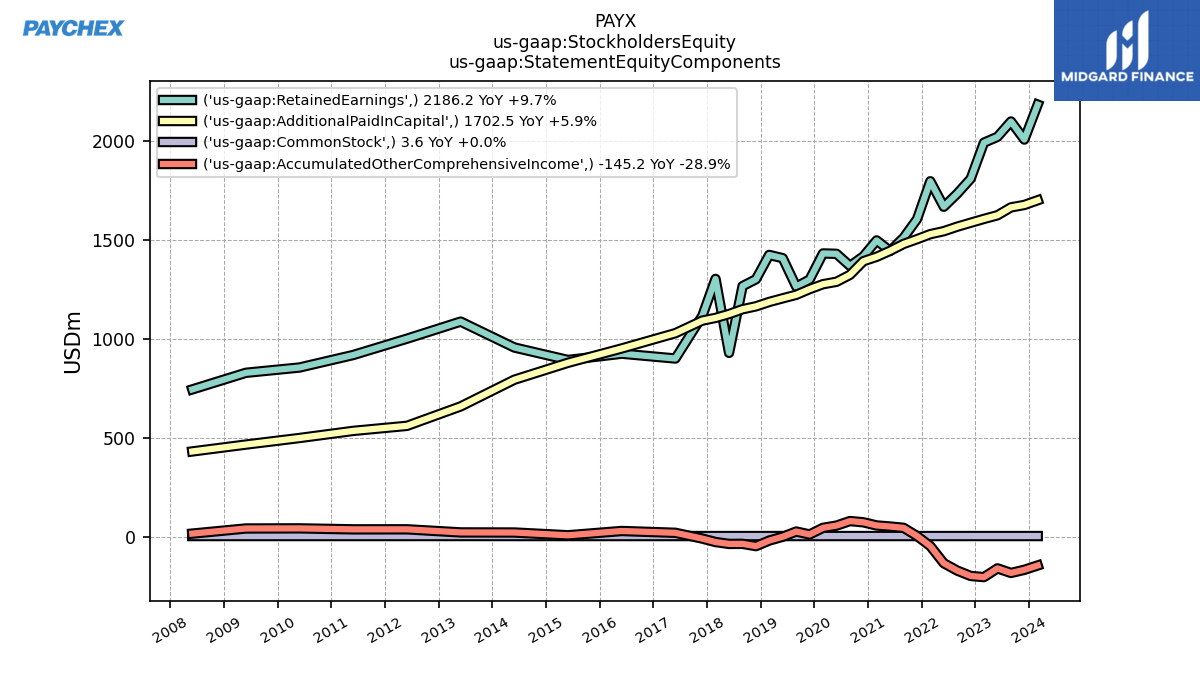
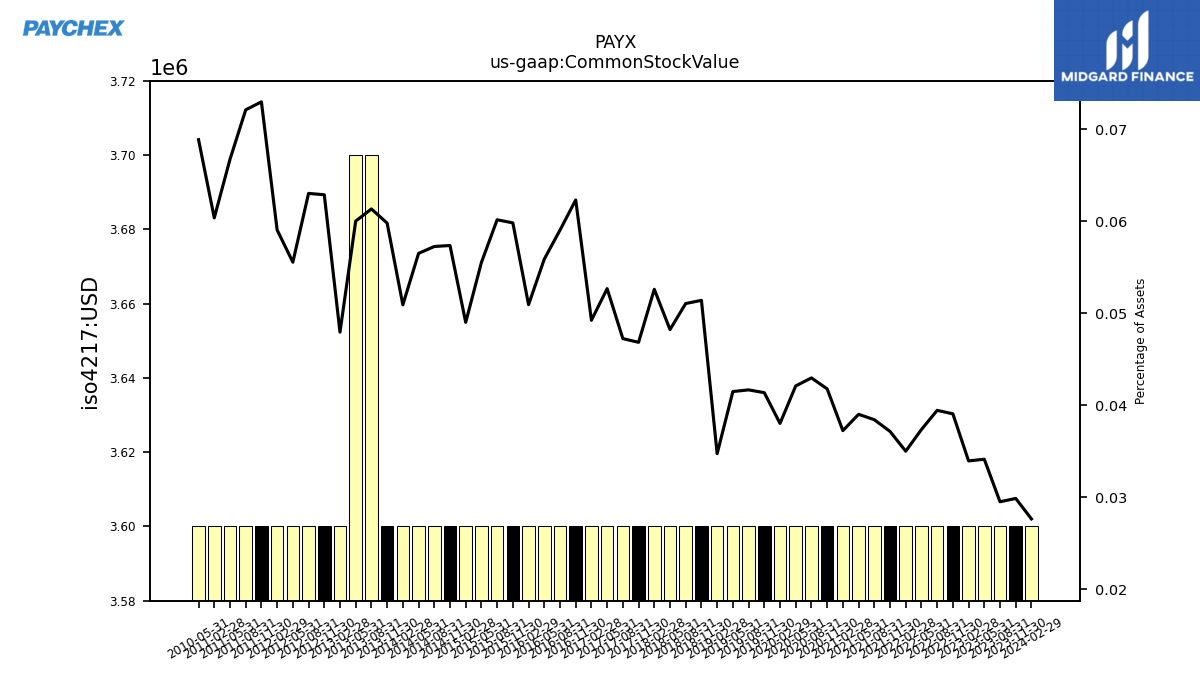
| Common Stock Value | 3.60 | 3.60 | 3.60 | 3.60 | 3.60 | 3.60 | 3.60 | 3.60 | 3.60 | 3.60 | 3.60 | 3.60 | 3.60 | 3.60 | 3.60 | 3.60 | 3.60 | 3.60 | 3.60 | 3.60 | 3.60 | 3.60 | 3.60 | 3.60 | 3.60 | 3.60 | 3.60 | 3.60 | 3.60 | 3.60 | 3.60 | 3.60 | 3.60 | 3.60 | 3.60 | 3.60 | 3.60 | 3.60 | 3.60 | 3.60 | 3.60 | 3.70 | 3.70 | 3.60 | 3.60 | 3.60 | 3.60 | 3.60 | 3.60 | 3.60 | 3.60 | 3.60 | NA | NA | 3.60 | NA | NA | NA | |
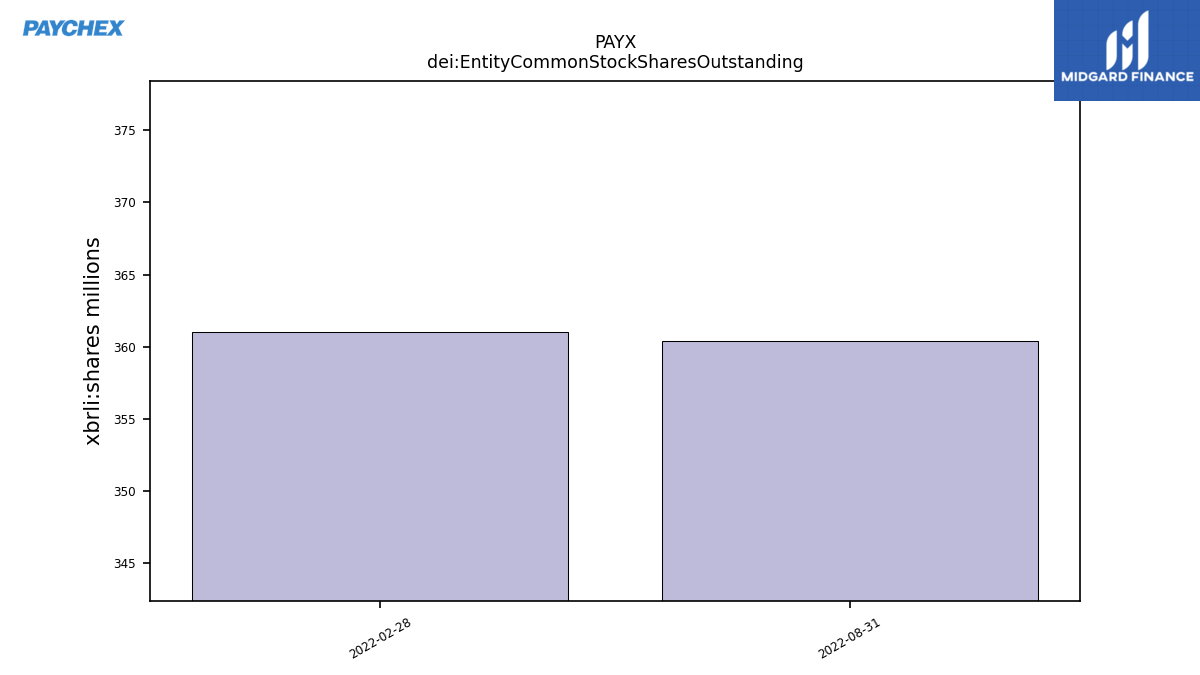
| dei: Entity Common Stock Shares Outstanding | NA | NA | NA | NA | NA | 360.40 | NA | 361.02 | NA | NA | NA | NA | NA | NA | NA | NA | NA | NA | NA | NA | NA | NA | NA | NA | NA | NA | NA | NA | NA | NA | NA | NA | NA | NA | NA | NA | NA | NA | NA | NA | NA | NA | NA | NA | NA | NA | NA | NA | NA | NA | NA | NA | NA | NA | NA | NA | NA | NA | |
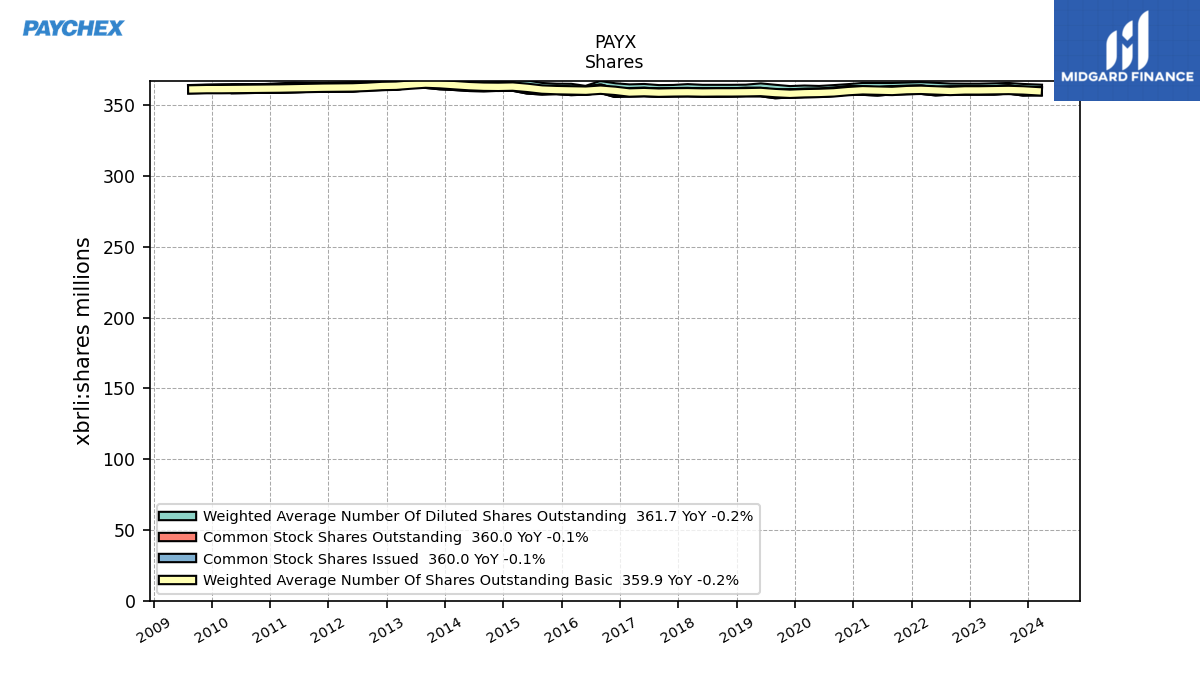
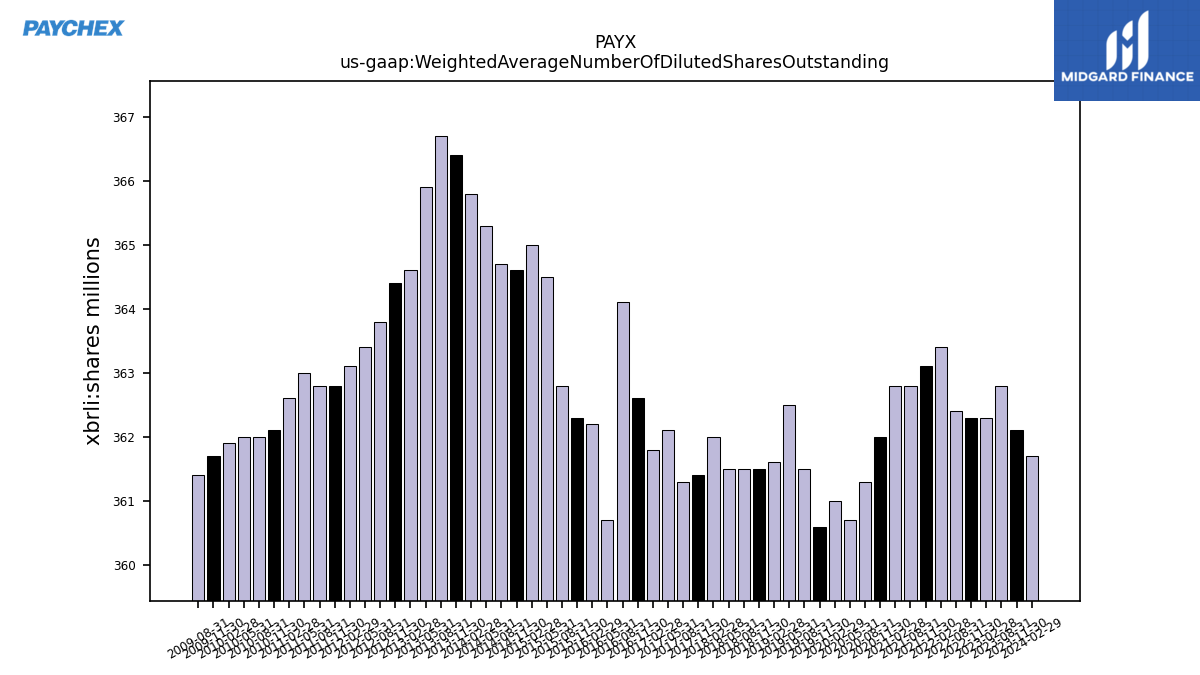
| Weighted Average Number Of Diluted Shares Outstanding | 362.10 | 362.80 | NA | 362.30 | 362.30 | 362.40 | NA | 363.40 | 363.10 | 362.80 | NA | 362.80 | 362.00 | 361.30 | 360.70 | 361.00 | 360.60 | 361.50 | 362.50 | 361.60 | 361.50 | 361.50 | 361.50 | 362.00 | 361.40 | 361.30 | 362.10 | 361.80 | 362.60 | 364.10 | 360.70 | 362.20 | 362.30 | 362.80 | 364.50 | 365.00 | 364.60 | 364.70 | 365.30 | 365.80 | 366.40 | 366.70 | 365.90 | 364.60 | 364.40 | 363.80 | 363.40 | 363.10 | 362.80 | 362.80 | 363.00 | 362.60 | 362.10 | 362.00 | 362.00 | 361.90 | 361.70 | 361.40 | |
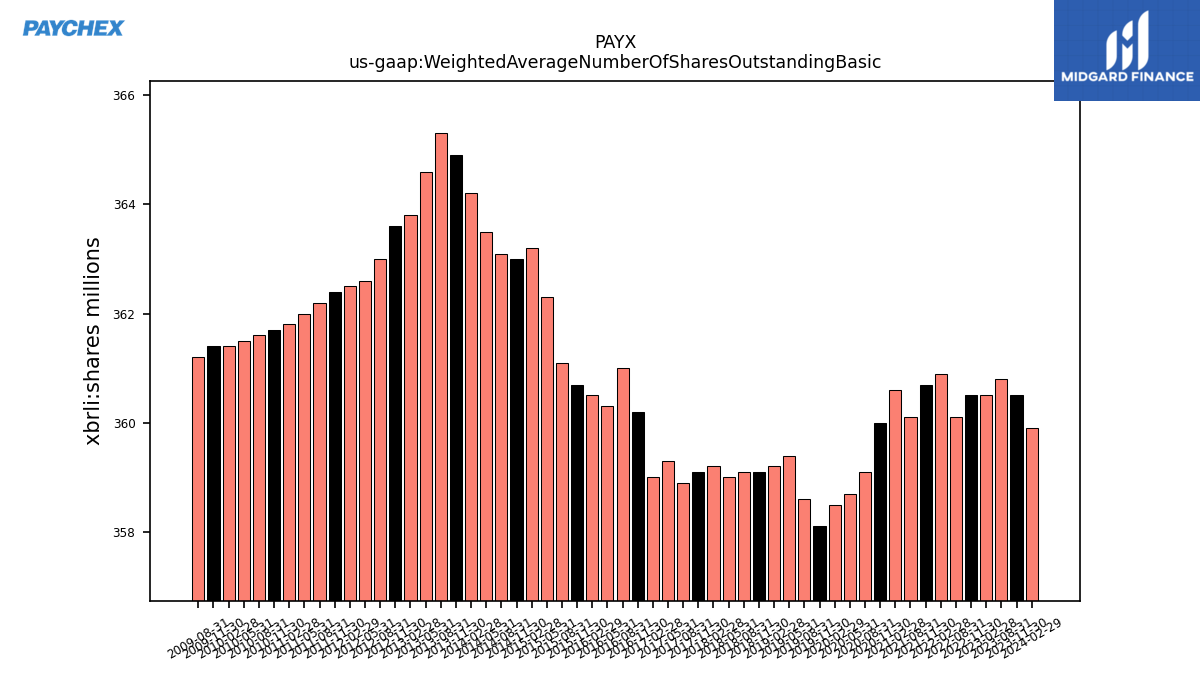
| Weighted Average Number Of Shares Outstanding Basic | 360.50 | 360.80 | NA | 360.50 | 360.50 | 360.10 | NA | 360.90 | 360.70 | 360.10 | NA | 360.60 | 360.00 | 359.10 | 358.70 | 358.50 | 358.10 | 358.60 | 359.40 | 359.20 | 359.10 | 359.10 | 359.00 | 359.20 | 359.10 | 358.90 | 359.30 | 359.00 | 360.20 | 361.00 | 360.30 | 360.50 | 360.70 | 361.10 | 362.30 | 363.20 | 363.00 | 363.10 | 363.50 | 364.20 | 364.90 | 365.30 | 364.60 | 363.80 | 363.60 | 363.00 | 362.60 | 362.50 | 362.40 | 362.20 | 362.00 | 361.80 | 361.70 | 361.60 | 361.50 | 361.40 | 361.40 | 361.20 | |
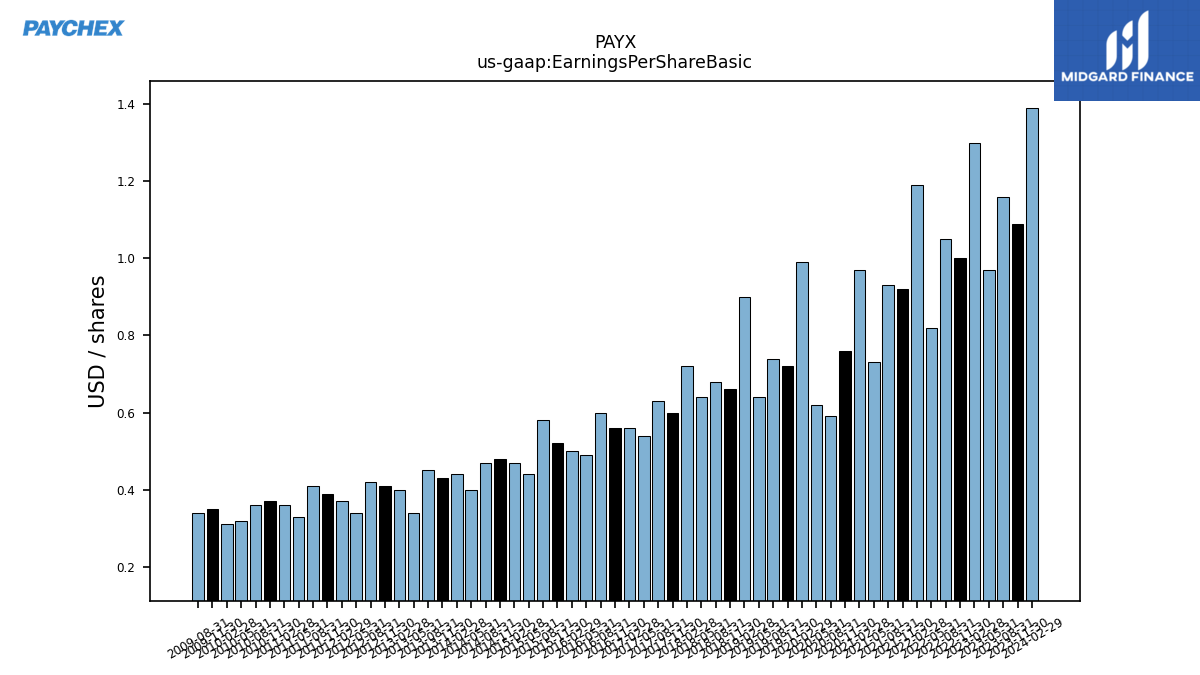
| Earnings Per Share Basic | 1.09 | 1.16 | 0.97 | 1.30 | 1.00 | 1.05 | 0.82 | 1.19 | 0.92 | 0.93 | 0.73 | 0.97 | 0.76 | 0.59 | 0.62 | 0.99 | 0.72 | 0.74 | 0.64 | 0.90 | 0.66 | 0.68 | 0.64 | 0.72 | 0.60 | 0.63 | 0.54 | 0.56 | 0.56 | 0.60 | 0.49 | 0.50 | 0.52 | 0.58 | 0.44 | 0.47 | 0.48 | 0.47 | 0.40 | 0.44 | 0.43 | 0.45 | 0.34 | 0.40 | 0.41 | 0.42 | 0.34 | 0.37 | 0.39 | 0.41 | 0.33 | 0.36 | 0.37 | 0.36 | 0.32 | 0.31 | 0.35 | 0.34 | |
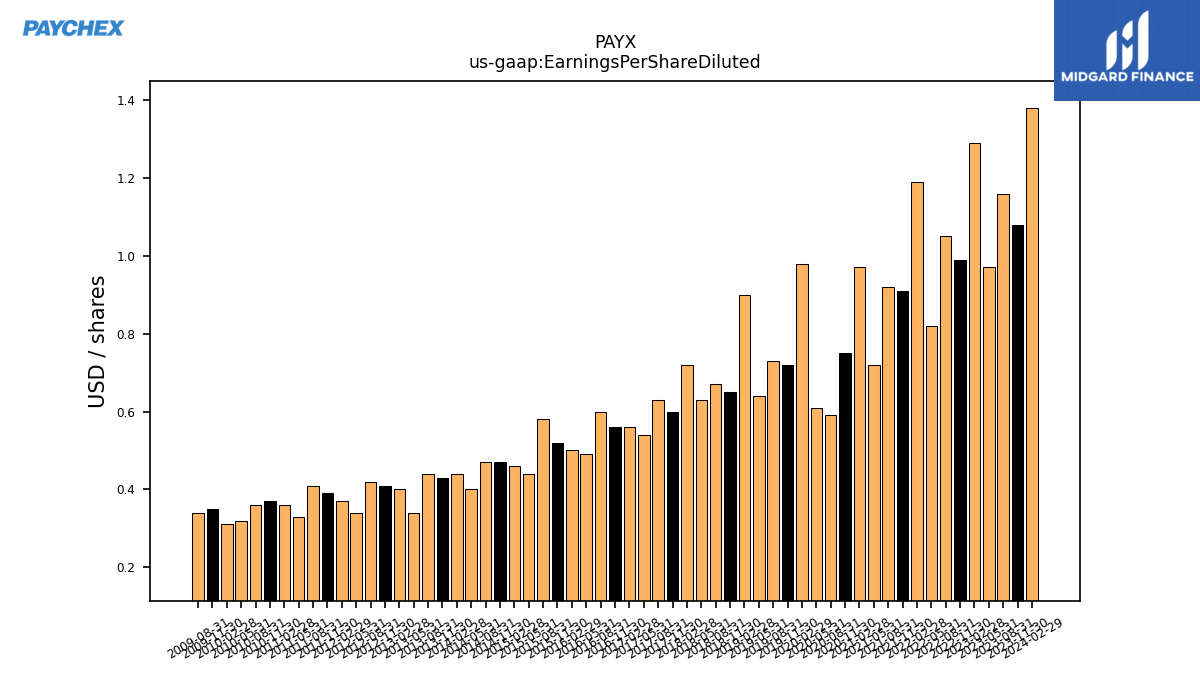
| Earnings Per Share Diluted | 1.08 | 1.16 | 0.97 | 1.29 | 0.99 | 1.05 | 0.82 | 1.19 | 0.91 | 0.92 | 0.72 | 0.97 | 0.75 | 0.59 | 0.61 | 0.98 | 0.72 | 0.73 | 0.64 | 0.90 | 0.65 | 0.67 | 0.63 | 0.72 | 0.60 | 0.63 | 0.54 | 0.56 | 0.56 | 0.60 | 0.49 | 0.50 | 0.52 | 0.58 | 0.44 | 0.46 | 0.47 | 0.47 | 0.40 | 0.44 | 0.43 | 0.44 | 0.34 | 0.40 | 0.41 | 0.42 | 0.34 | 0.37 | 0.39 | 0.41 | 0.33 | 0.36 | 0.37 | 0.36 | 0.32 | 0.31 | 0.35 | 0.34 |
| 2023-11-30 | 2023-08-31 | 2023-05-31 | 2023-02-28 | 2022-11-30 | 2022-08-31 | 2022-05-31 | 2022-02-28 | 2021-11-30 | 2021-08-31 | 2021-05-31 | 2021-02-28 | 2020-11-30 | 2020-08-31 | 2020-05-31 | 2020-02-29 | 2019-11-30 | 2019-08-31 | 2019-05-31 | 2019-02-28 | 2018-11-30 | 2018-08-31 | 2018-05-31 | 2018-02-28 | 2017-11-30 | 2017-08-31 | 2017-05-31 | 2017-02-28 | 2016-11-30 | 2016-08-31 | 2016-05-31 | 2016-02-29 | 2015-11-30 | 2015-08-31 | 2015-05-31 | 2015-02-28 | 2014-11-30 | 2014-08-31 | 2014-05-31 | 2014-02-28 | 2013-11-30 | 2013-08-31 | 2013-05-31 | 2013-02-28 | 2012-11-30 | 2012-08-31 | 2012-05-31 | 2012-02-29 | 2011-11-30 | 2011-08-31 | 2011-05-31 | 2011-02-28 | 2010-11-30 | 2010-08-31 | 2010-05-31 | 2010-02-28 | 2009-11-30 | 2009-08-31 | ||
|---|---|---|---|---|---|---|---|---|---|---|---|---|---|---|---|---|---|---|---|---|---|---|---|---|---|---|---|---|---|---|---|---|---|---|---|---|---|---|---|---|---|---|---|---|---|---|---|---|---|---|---|---|---|---|---|---|---|---|---|
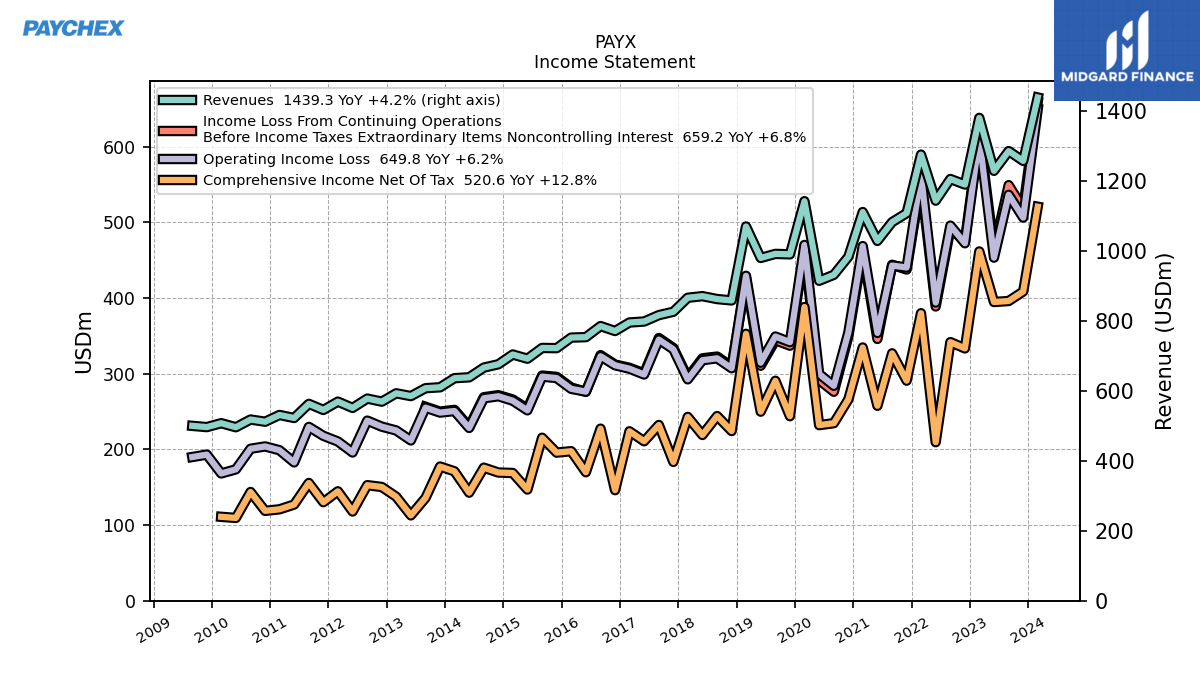
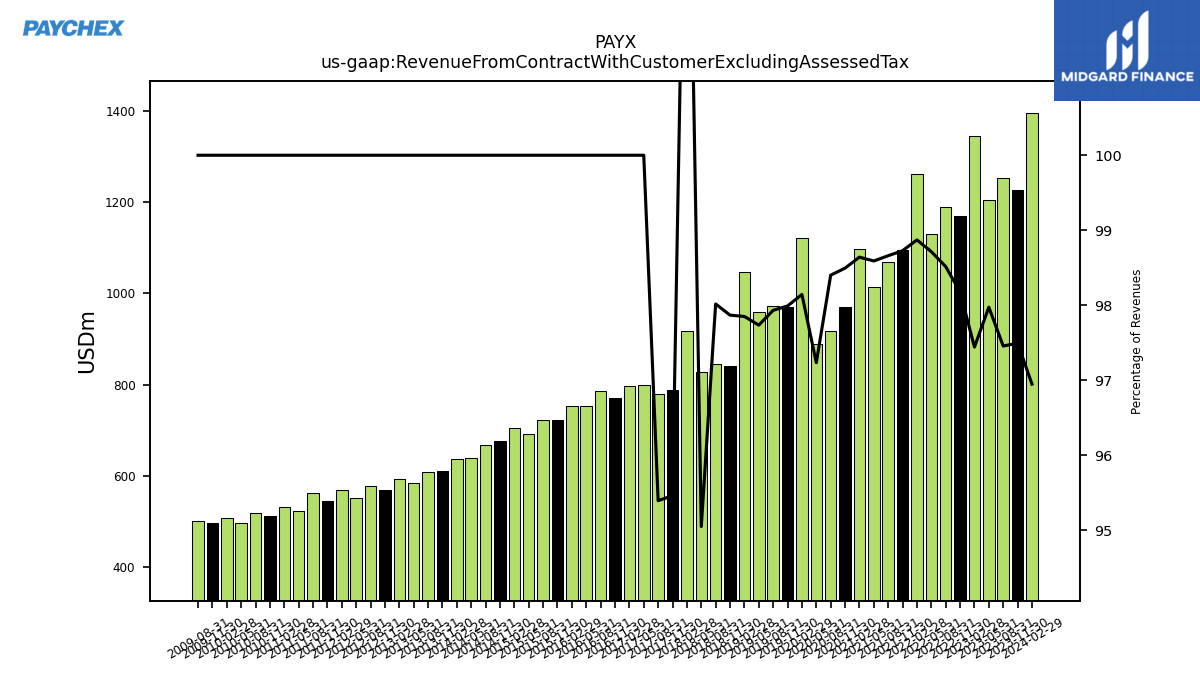
| Revenue From Contract With Customer Excluding Assessed Tax | 1226.40 | 1253.30 | 1204.70 | 1345.70 | 1168.60 | 1188.30 | 1129.60 | 1261.60 | 1094.40 | 1068.40 | 1014.70 | 1096.60 | 968.90 | 917.30 | 889.80 | 1121.50 | 970.80 | 971.50 | 958.20 | 1047.40 | 840.60 | 845.70 | 828.00 | 918.00 | 789.00 | 779.20 | 798.60 | 795.80 | 771.40 | 785.50 | 753.90 | 752.60 | 722.40 | 723.00 | 692.20 | 704.30 | 676.30 | 666.80 | 639.00 | 636.50 | 610.50 | 607.90 | 585.30 | 593.30 | 569.40 | 578.20 | 551.50 | 569.50 | 545.70 | 563.10 | 522.70 | 531.30 | 512.00 | 518.30 | 496.20 | 507.80 | 496.60 | 500.20 | |
| Revenue From Contract With Customer Including Assessed Tax | 1257.90 | 1286.00 | 1229.60 | 1381.00 | 1190.30 | 1206.20 | 1144.30 | 1276.00 | 1108.50 | 1082.90 | 1029.20 | 1111.70 | 983.70 | 932.20 | 915.10 | 1142.70 | 990.70 | 992.00 | 980.40 | 1070.40 | 858.90 | 845.70 | 871.10 | 866.50 | 826.50 | 779.20 | 798.60 | 795.80 | 771.40 | 785.50 | 753.90 | 752.60 | 722.40 | 723.00 | 692.20 | 704.30 | 676.30 | 666.80 | 639.00 | 636.50 | 610.50 | 607.90 | 585.30 | 593.30 | 569.40 | 578.20 | 551.50 | 569.50 | 545.70 | 563.10 | 522.70 | 531.30 | 512.00 | 518.30 | 496.20 | 507.80 | 496.60 | 500.20 | |
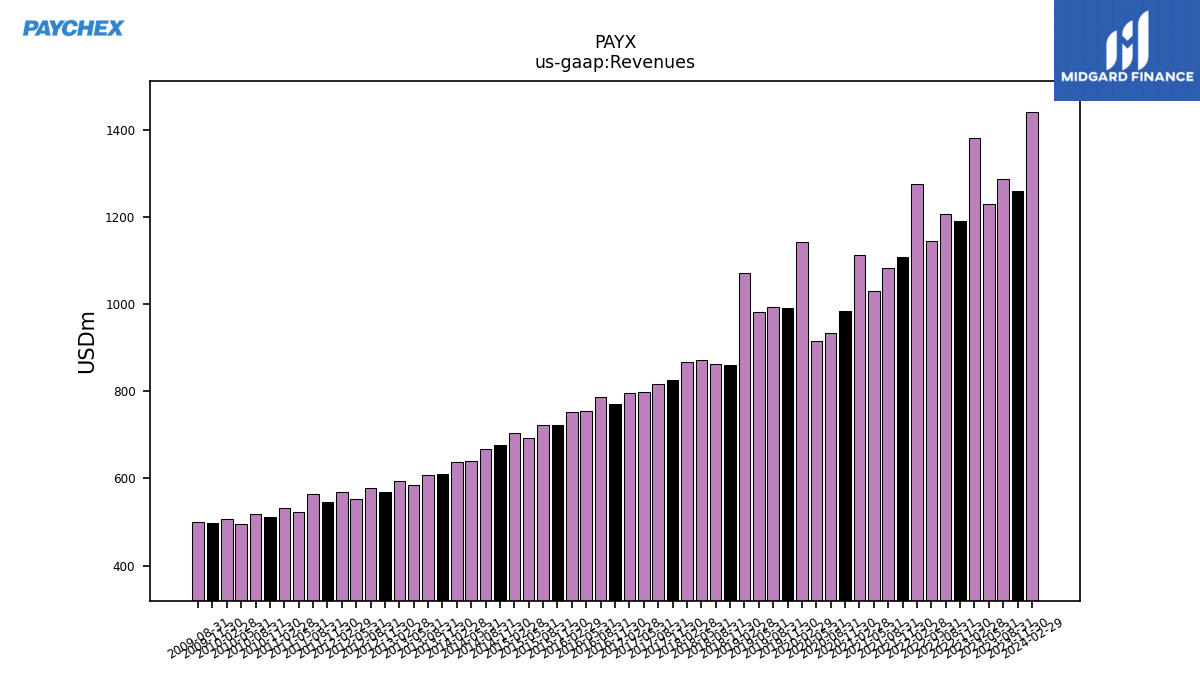
| Revenues | 1257.90 | 1286.00 | 1229.60 | 1381.00 | 1190.30 | 1206.20 | 1144.30 | 1276.00 | 1108.50 | 1082.90 | 1029.20 | 1111.70 | 983.70 | 932.20 | 915.10 | 1142.70 | 990.70 | 992.00 | 980.40 | 1070.40 | 858.90 | 862.80 | 871.10 | 866.50 | 826.50 | 816.80 | 798.60 | 795.80 | 771.40 | 785.50 | 753.90 | 752.60 | 722.40 | 723.00 | 692.20 | 704.30 | 676.30 | 666.80 | 639.00 | 636.50 | 610.50 | 607.90 | 585.30 | 593.30 | 569.40 | 578.20 | 551.50 | 569.50 | 545.70 | 563.10 | 522.70 | 531.30 | 512.00 | 518.30 | 496.20 | 507.80 | 496.60 | 500.20 | |
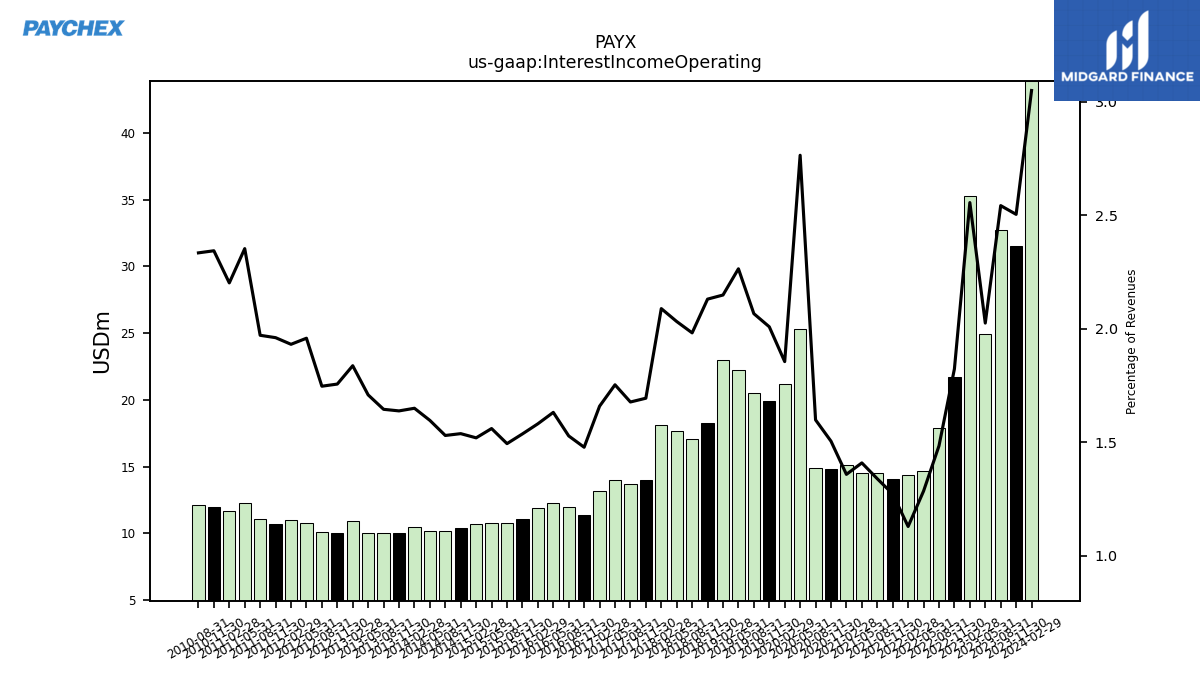
| Interest Income Operating | 31.50 | 32.70 | 24.90 | 35.30 | 21.70 | 17.90 | 14.70 | 14.40 | 14.10 | 14.50 | 14.50 | 15.10 | 14.80 | 14.90 | 25.30 | 21.20 | 19.90 | 20.50 | 22.20 | 23.00 | 18.30 | 17.10 | 17.70 | 18.10 | 14.00 | 13.70 | 14.00 | 13.20 | 11.40 | 12.00 | 12.30 | 11.90 | 11.10 | 10.80 | 10.80 | 10.70 | 10.40 | 10.20 | 10.20 | 10.50 | 10.00 | 10.00 | 10.00 | 10.90 | 10.00 | 10.10 | 10.80 | 11.00 | 10.70 | 11.10 | 12.30 | 11.70 | 12.00 | 12.10 | NA | NA | NA | NA | |
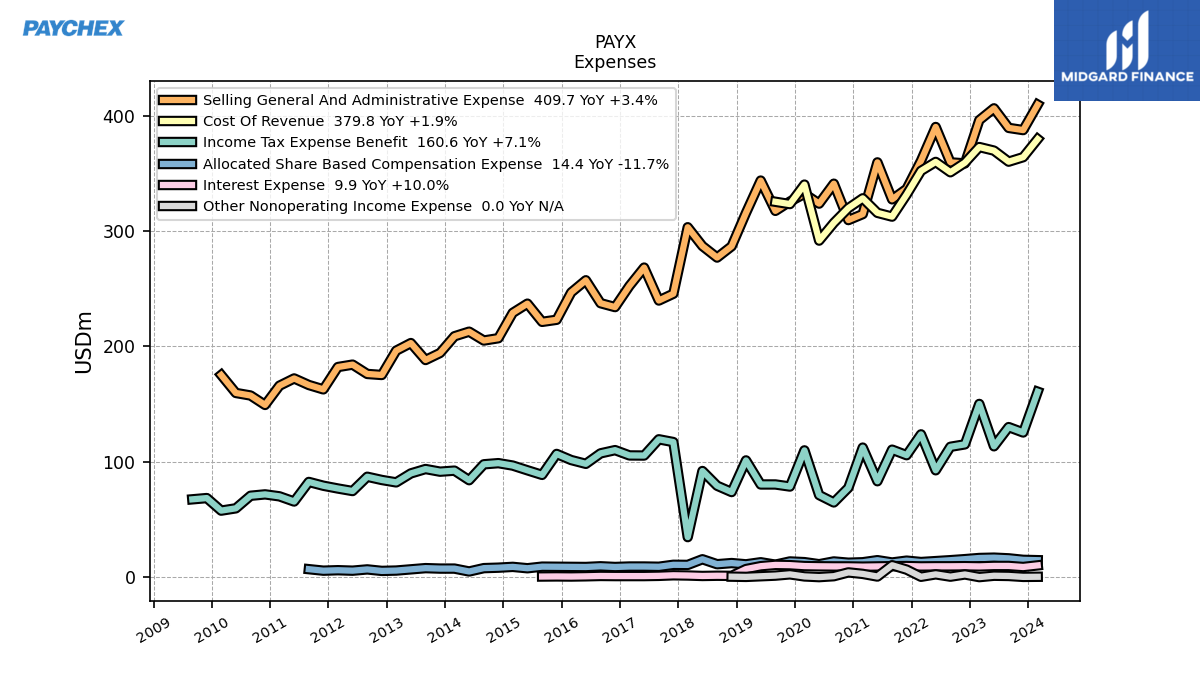
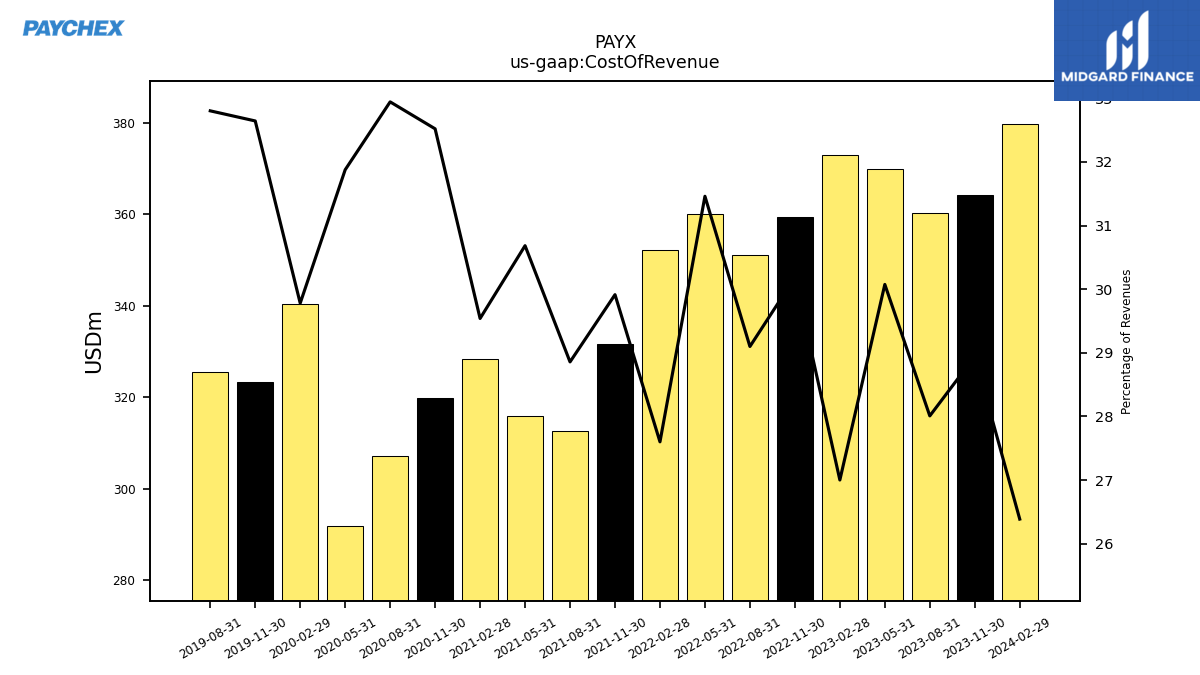
| Cost Of Revenue | 364.10 | 360.20 | 369.80 | 372.90 | 359.30 | 351.00 | 360.00 | 352.20 | 331.60 | 312.50 | 315.80 | 328.40 | 319.90 | 307.10 | 291.70 | 340.30 | 323.40 | 325.40 | NA | NA | NA | NA | NA | NA | NA | NA | NA | NA | NA | NA | NA | NA | NA | NA | NA | NA | NA | NA | NA | NA | NA | NA | NA | NA | NA | NA | NA | NA | NA | NA | NA | NA | NA | NA | NA | NA | NA | NA | |
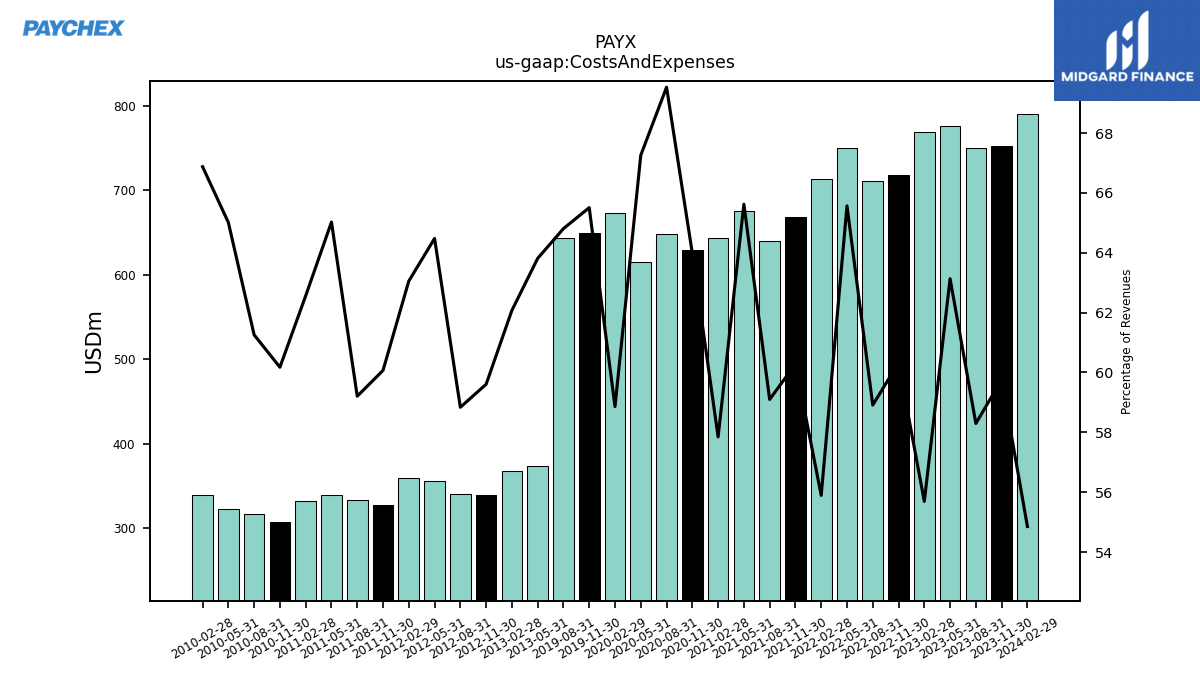
| Costs And Expenses | 751.70 | 749.70 | 776.30 | 769.10 | 718.00 | 710.60 | 750.30 | 713.20 | 668.20 | 640.00 | 675.40 | 643.10 | 629.40 | 648.20 | 615.50 | 672.60 | 649.00 | 642.90 | NA | NA | NA | NA | NA | NA | NA | NA | NA | NA | NA | NA | NA | NA | NA | NA | NA | NA | NA | NA | NA | NA | NA | NA | 373.50 | 368.30 | 339.40 | 340.20 | 355.60 | 359.10 | 327.80 | 333.40 | 339.90 | 332.40 | 308.10 | 317.50 | 322.60 | 339.60 | NA | NA | |
| Selling General And Administrative Expense | 387.60 | 389.50 | 406.50 | 396.20 | 358.70 | 359.60 | 390.30 | 361.00 | 336.60 | 327.50 | 359.60 | 314.70 | 309.50 | 341.10 | 323.80 | 332.30 | 325.60 | 317.50 | 343.80 | 315.80 | 286.80 | 277.00 | 287.00 | 303.30 | 245.60 | 239.70 | 268.30 | 252.40 | 234.00 | 237.40 | 257.30 | 246.70 | 223.00 | 221.20 | 237.00 | 229.00 | 207.00 | 205.00 | 212.70 | 208.70 | 194.20 | 188.10 | 202.80 | 196.20 | 175.10 | 176.00 | 184.10 | 182.00 | 162.60 | 166.40 | 172.10 | 165.80 | 149.10 | 157.30 | 159.50 | 175.10 | NA | NA | |
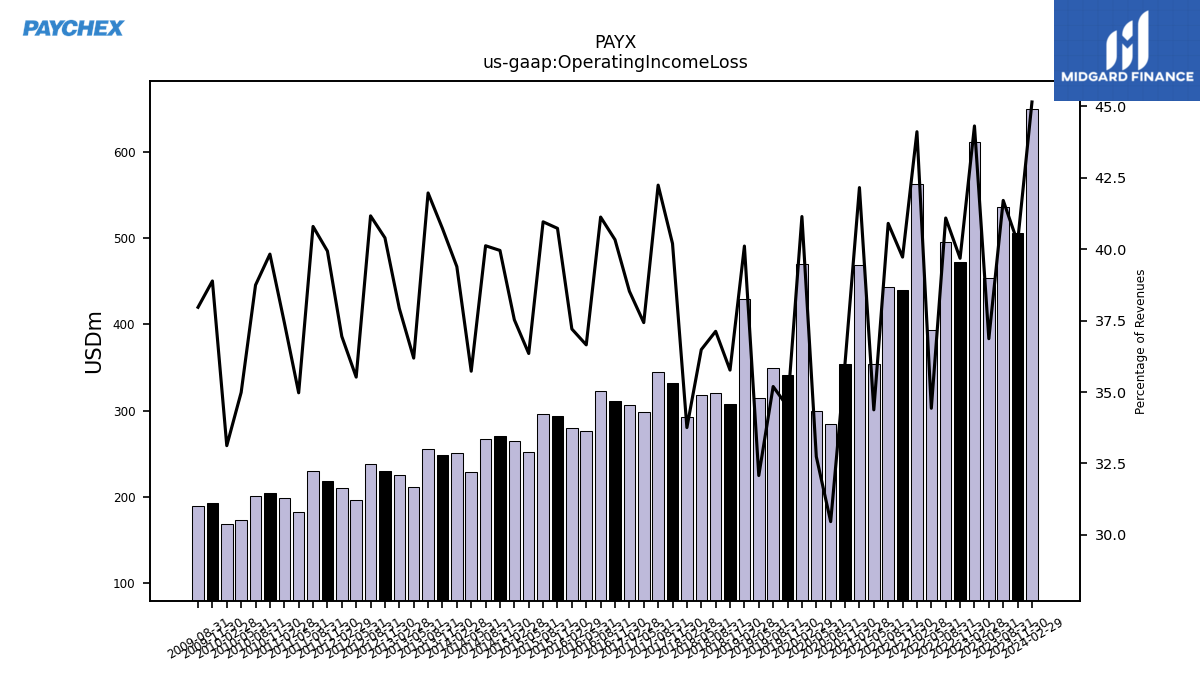
| Operating Income Loss | 506.20 | 536.30 | 453.30 | 611.90 | 472.30 | 495.60 | 394.00 | 562.80 | 440.30 | 442.90 | 353.80 | 468.60 | 354.30 | 284.00 | 299.60 | 470.10 | 341.70 | 349.10 | 314.50 | 429.30 | 307.20 | 320.30 | 317.80 | 292.50 | 332.20 | 345.00 | 298.90 | 306.60 | 311.10 | 323.00 | 276.30 | 280.00 | 294.20 | 296.10 | 251.60 | 264.30 | 270.20 | 267.50 | 228.30 | 250.70 | 248.60 | 255.10 | 211.80 | 225.00 | 230.00 | 238.00 | 195.90 | 210.40 | 217.90 | 229.70 | 182.80 | 198.90 | 203.90 | 200.80 | 173.60 | 168.20 | 193.10 | 189.90 | |
| Interest Expense | 8.50 | 9.40 | 9.40 | 9.00 | 9.20 | 9.10 | 9.10 | 9.00 | 9.30 | 9.20 | 9.00 | 8.80 | 9.00 | 9.00 | 9.10 | 9.30 | 10.10 | 10.30 | 9.20 | 6.70 | 0.80 | 0.90 | 0.70 | 1.10 | 1.30 | 0.80 | 0.60 | 0.60 | 0.60 | 0.70 | 0.40 | 0.20 | 0.30 | 0.20 | NA | NA | NA | NA | NA | NA | NA | NA | NA | NA | NA | NA | NA | NA | NA | NA | NA | NA | NA | NA | NA | NA | NA | NA | |
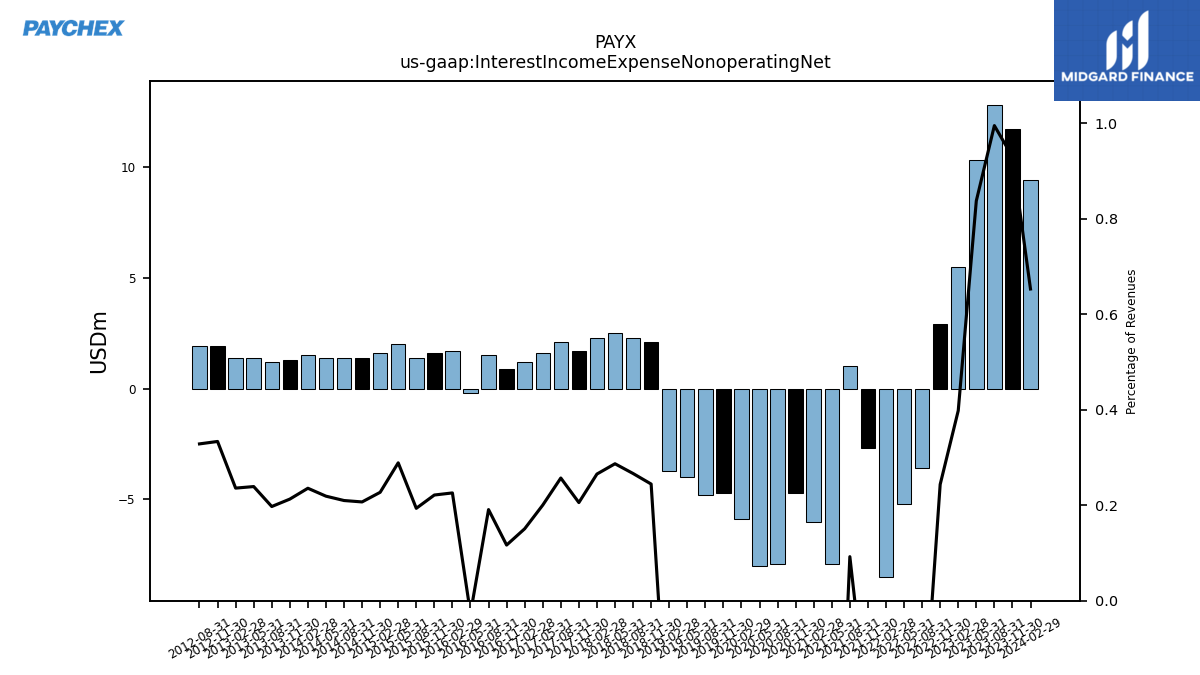
| Interest Income Expense Nonoperating Net | 11.70 | 12.80 | 10.30 | 5.50 | 2.90 | -3.60 | -5.20 | -8.50 | -2.70 | 1.00 | -7.90 | -6.00 | -4.70 | -7.90 | -8.00 | -5.90 | -4.70 | -4.80 | -4.00 | -3.70 | 2.10 | 2.30 | 2.50 | 2.30 | 1.70 | 2.10 | 1.60 | 1.20 | 0.90 | 1.50 | -0.20 | 1.70 | 1.60 | 1.40 | 2.00 | 1.60 | 1.40 | 1.40 | 1.40 | 1.50 | 1.30 | 1.20 | 1.40 | 1.40 | 1.90 | 1.90 | NA | NA | NA | NA | NA | NA | NA | NA | NA | NA | NA | NA | |
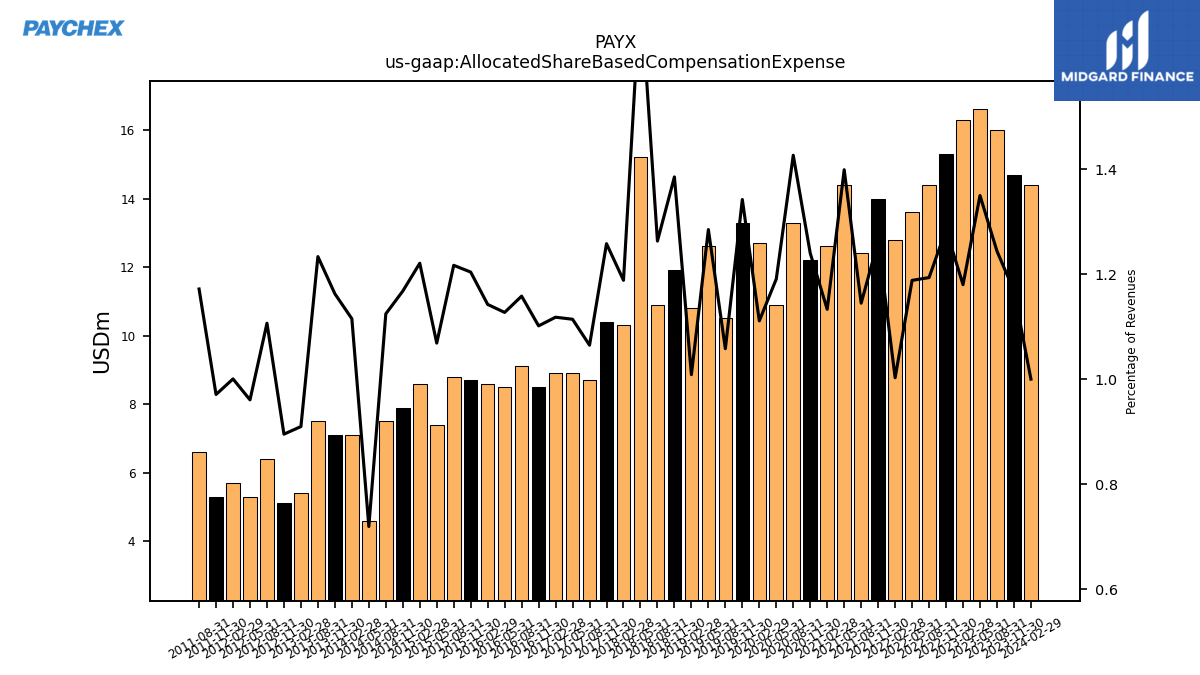
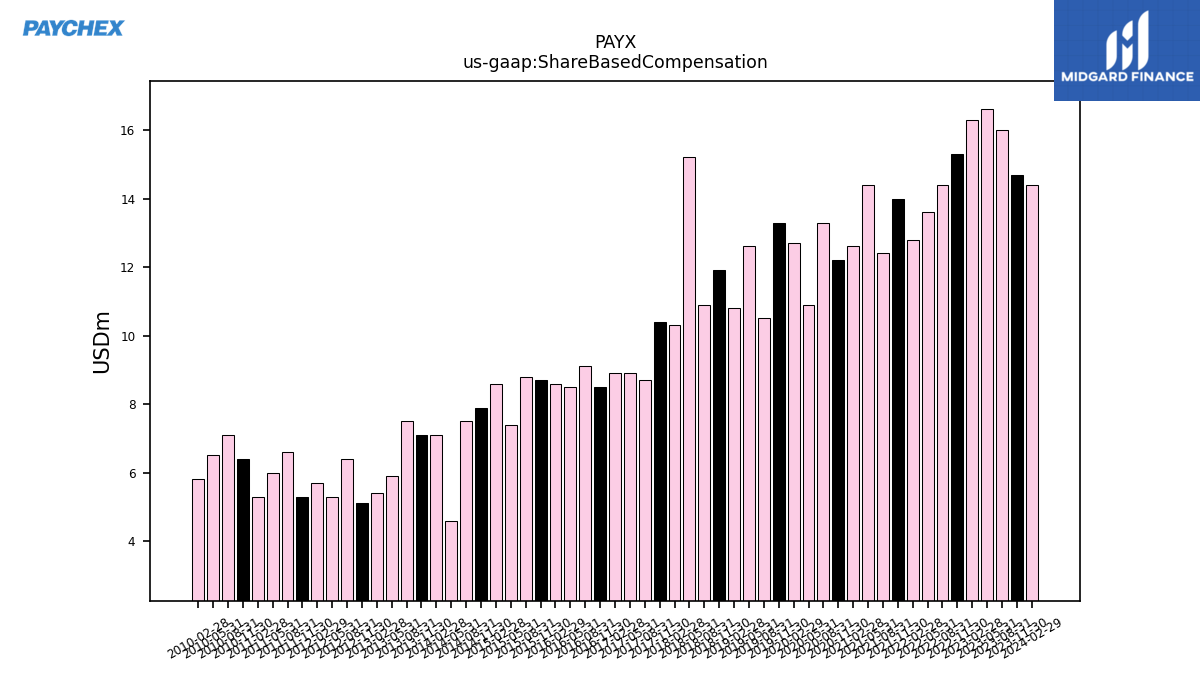
| Allocated Share Based Compensation Expense | 14.70 | 16.00 | 16.60 | 16.30 | 15.30 | 14.40 | 13.60 | 12.80 | 14.00 | 12.40 | 14.40 | 12.60 | 12.20 | 13.30 | 10.90 | 12.70 | 13.30 | 10.50 | 12.60 | 10.80 | 11.90 | 10.90 | 15.20 | 10.30 | 10.40 | 8.70 | 8.90 | 8.90 | 8.50 | 9.10 | 8.50 | 8.60 | 8.70 | 8.80 | 7.40 | 8.60 | 7.90 | 7.50 | 4.60 | 7.10 | 7.10 | 7.50 | NA | 5.40 | 5.10 | 6.40 | 5.30 | 5.70 | 5.30 | 6.60 | NA | NA | NA | NA | NA | NA | NA | NA | |
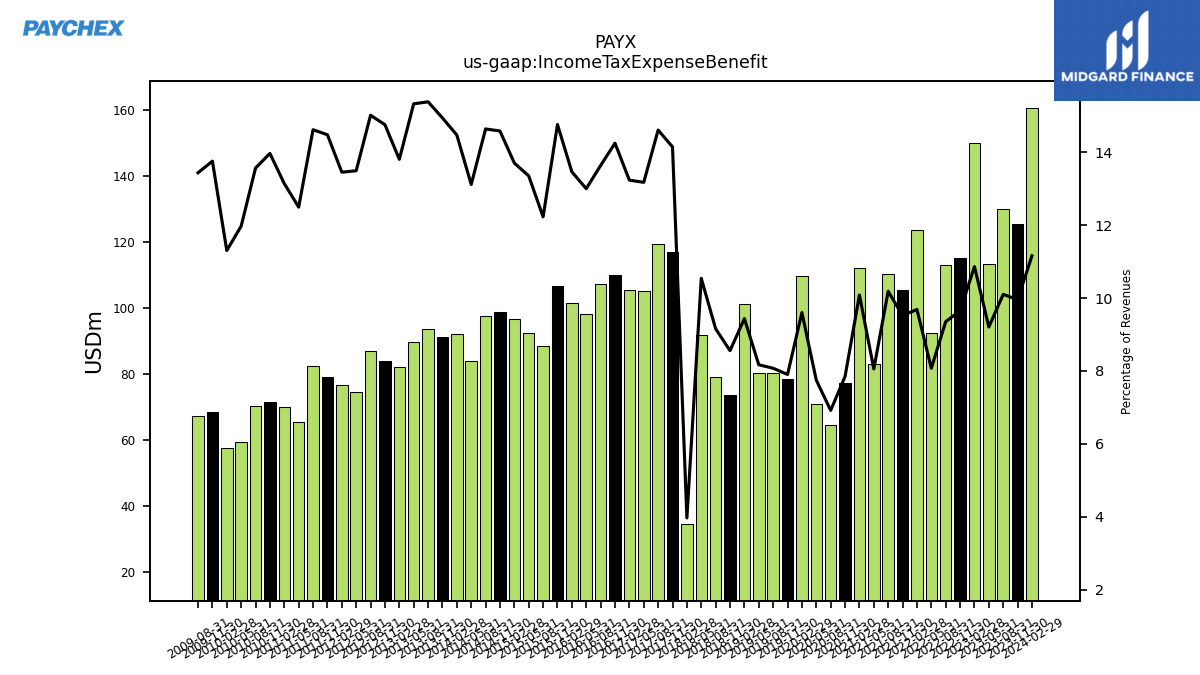
| Income Tax Expense Benefit | 125.20 | 129.90 | 113.20 | 150.00 | 114.90 | 112.80 | 92.40 | 123.60 | 105.50 | 110.30 | 82.90 | 112.10 | 77.20 | 64.50 | 70.90 | 109.70 | 78.30 | 80.10 | 80.10 | 101.00 | 73.50 | 79.00 | 91.80 | 34.40 | 116.90 | 119.30 | 105.20 | 105.30 | 109.90 | 107.10 | 98.00 | 101.30 | 106.60 | 88.40 | 92.40 | 96.50 | 98.60 | 97.60 | 83.80 | 92.10 | 91.20 | 93.50 | 89.70 | 81.90 | 84.00 | 86.80 | 74.40 | 76.60 | 79.00 | 82.30 | 65.30 | 69.80 | 71.50 | 70.30 | 59.40 | 57.40 | 68.30 | 67.20 | |
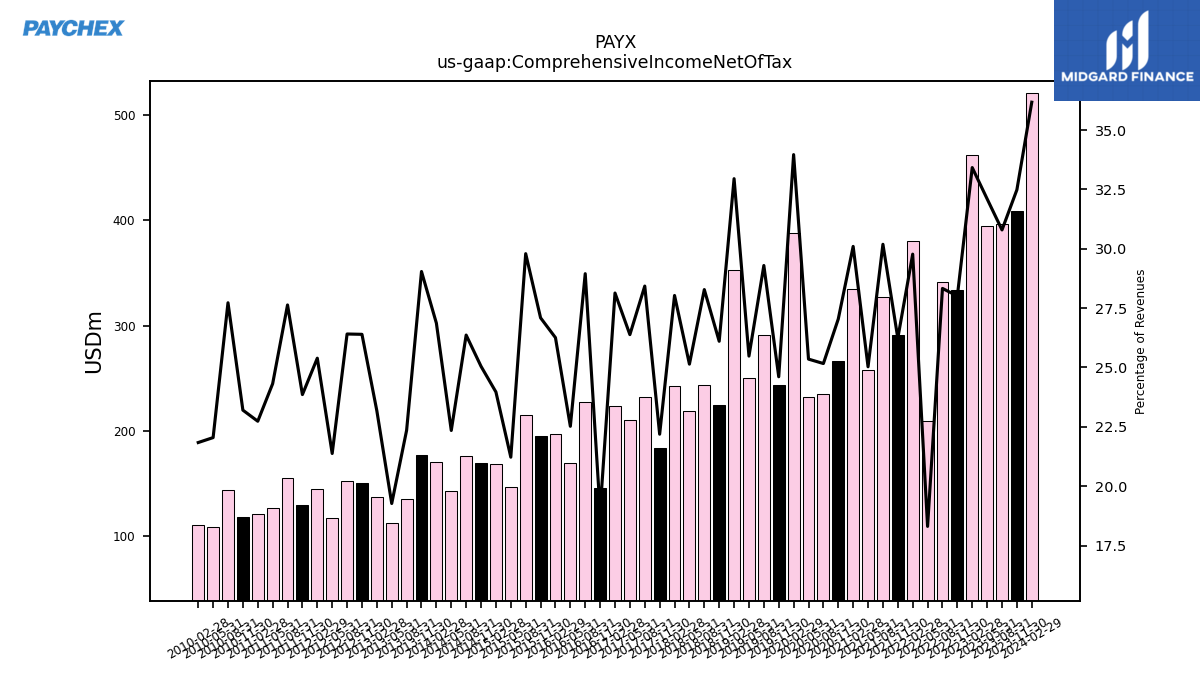
| Comprehensive Income Net Of Tax | 408.60 | 396.00 | 394.70 | 461.50 | 333.40 | 341.70 | 209.50 | 379.90 | 290.80 | 326.90 | 257.60 | 334.60 | 266.00 | 234.60 | 232.00 | 388.10 | 243.80 | 290.60 | 249.80 | 352.70 | 224.20 | 244.00 | 219.00 | 242.90 | 183.40 | 232.20 | 210.70 | 223.90 | 146.10 | 227.40 | 169.80 | 197.60 | 195.70 | 215.40 | 146.90 | 168.80 | 169.40 | 175.80 | 142.80 | 171.00 | 177.30 | 135.90 | 112.80 | 137.50 | 150.30 | 152.70 | 117.90 | 144.60 | 130.20 | 155.60 | 127.10 | 120.80 | 118.80 | 143.70 | 109.40 | 110.90 | NA | NA | |
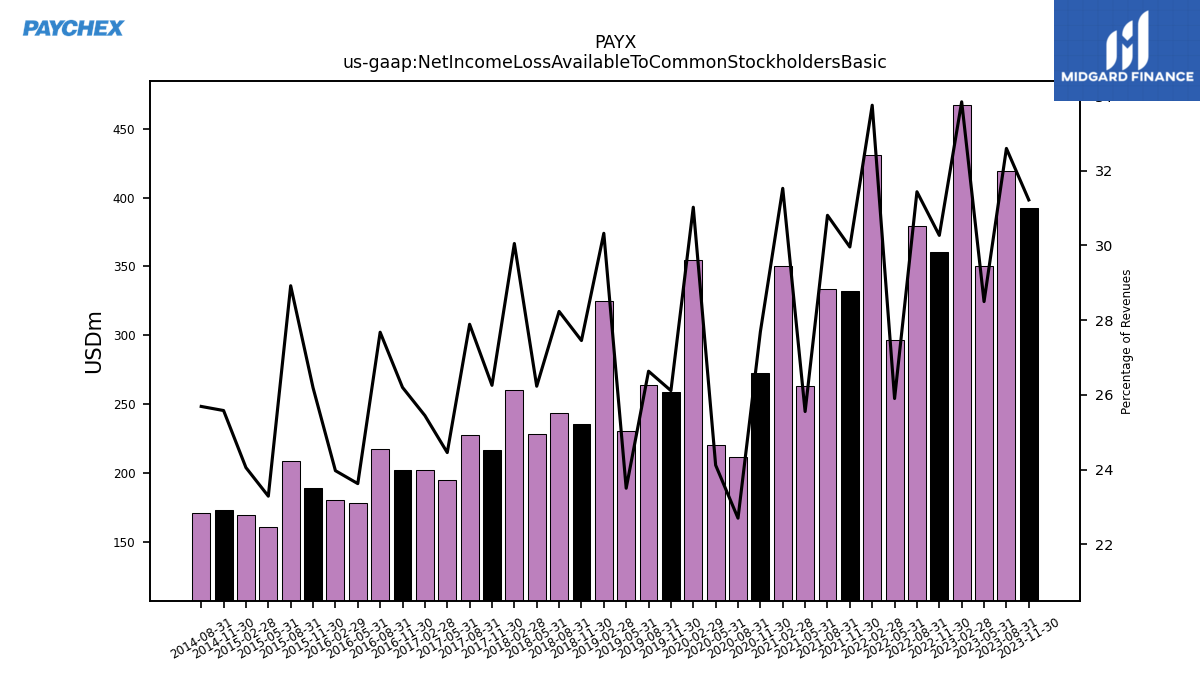
| Net Income Loss Available To Common Stockholders Basic | 392.70 | 419.20 | 350.40 | 467.40 | 360.30 | 379.20 | 296.40 | 430.70 | 332.10 | 333.60 | 263.00 | 350.50 | 272.40 | 211.60 | 220.70 | 354.50 | 258.70 | 264.20 | 230.40 | 324.60 | 235.80 | 243.60 | 228.50 | 260.40 | 217.00 | 227.80 | 195.30 | 202.50 | 202.10 | 217.40 | 178.10 | 180.40 | 189.20 | 209.10 | 161.20 | 169.40 | 173.00 | 171.30 | NA | NA | NA | NA | NA | NA | NA | NA | NA | NA | NA | NA | NA | NA | NA | NA | NA | NA | NA | NA |
| 2023-11-30 | 2023-08-31 | 2023-05-31 | 2023-02-28 | 2022-11-30 | 2022-08-31 | 2022-05-31 | 2022-02-28 | 2021-11-30 | 2021-08-31 | 2021-05-31 | 2021-02-28 | 2020-11-30 | 2020-08-31 | 2020-05-31 | 2020-02-29 | 2019-11-30 | 2019-08-31 | 2019-05-31 | 2019-02-28 | 2018-11-30 | 2018-08-31 | 2018-05-31 | 2018-02-28 | 2017-11-30 | 2017-08-31 | 2017-05-31 | 2017-02-28 | 2016-11-30 | 2016-08-31 | 2016-05-31 | 2016-02-29 | 2015-11-30 | 2015-08-31 | 2015-05-31 | 2015-02-28 | 2014-11-30 | 2014-08-31 | 2014-05-31 | 2014-02-28 | 2013-11-30 | 2013-08-31 | 2013-05-31 | 2013-02-28 | 2012-11-30 | 2012-08-31 | 2012-05-31 | 2012-02-29 | 2011-11-30 | 2011-08-31 | 2011-05-31 | 2011-02-28 | 2010-11-30 | 2010-08-31 | 2010-05-31 | 2010-02-28 | 2009-11-30 | 2009-08-31 | ||
|---|---|---|---|---|---|---|---|---|---|---|---|---|---|---|---|---|---|---|---|---|---|---|---|---|---|---|---|---|---|---|---|---|---|---|---|---|---|---|---|---|---|---|---|---|---|---|---|---|---|---|---|---|---|---|---|---|---|---|---|
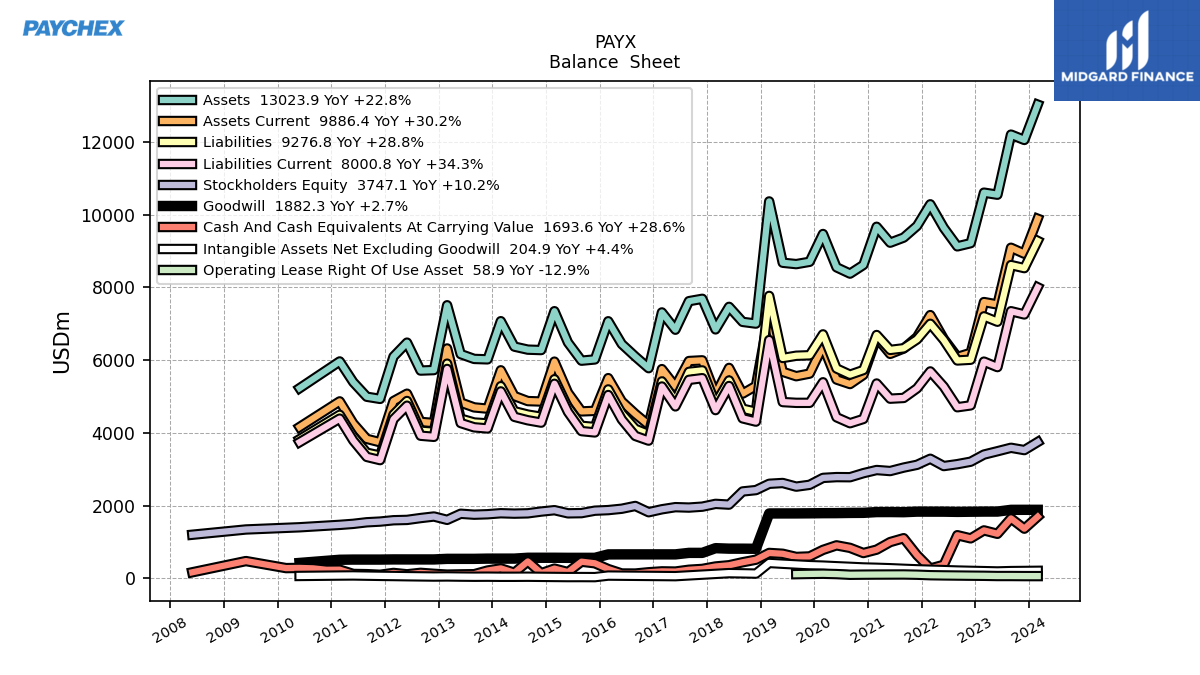
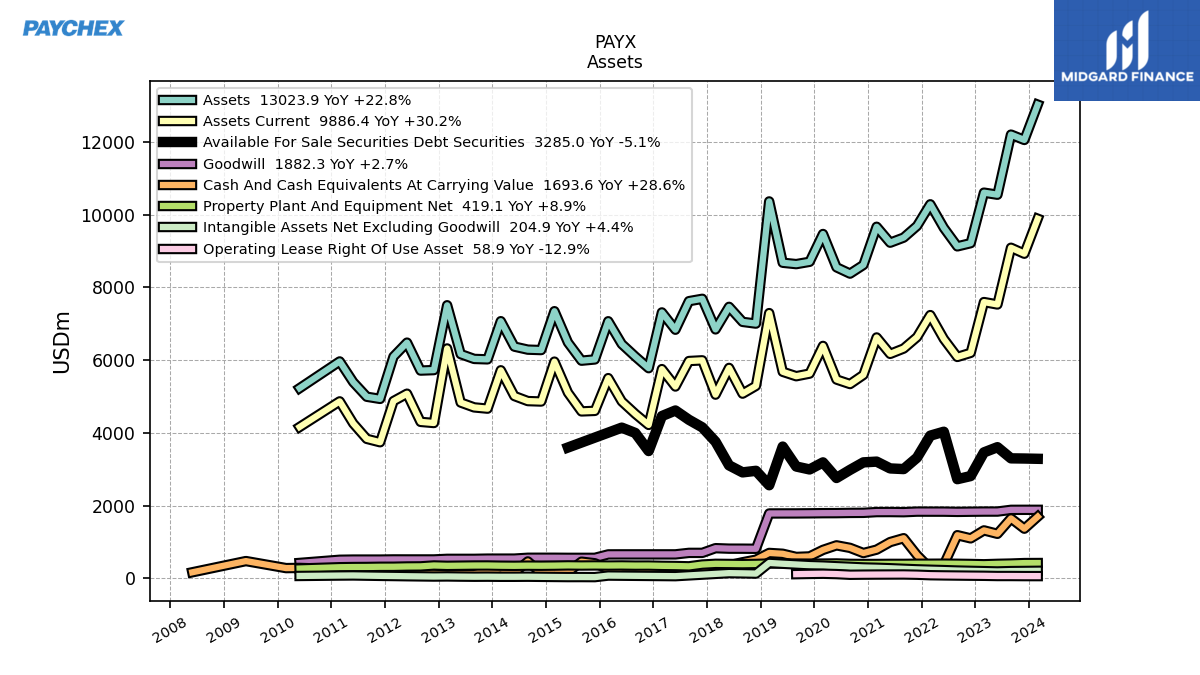
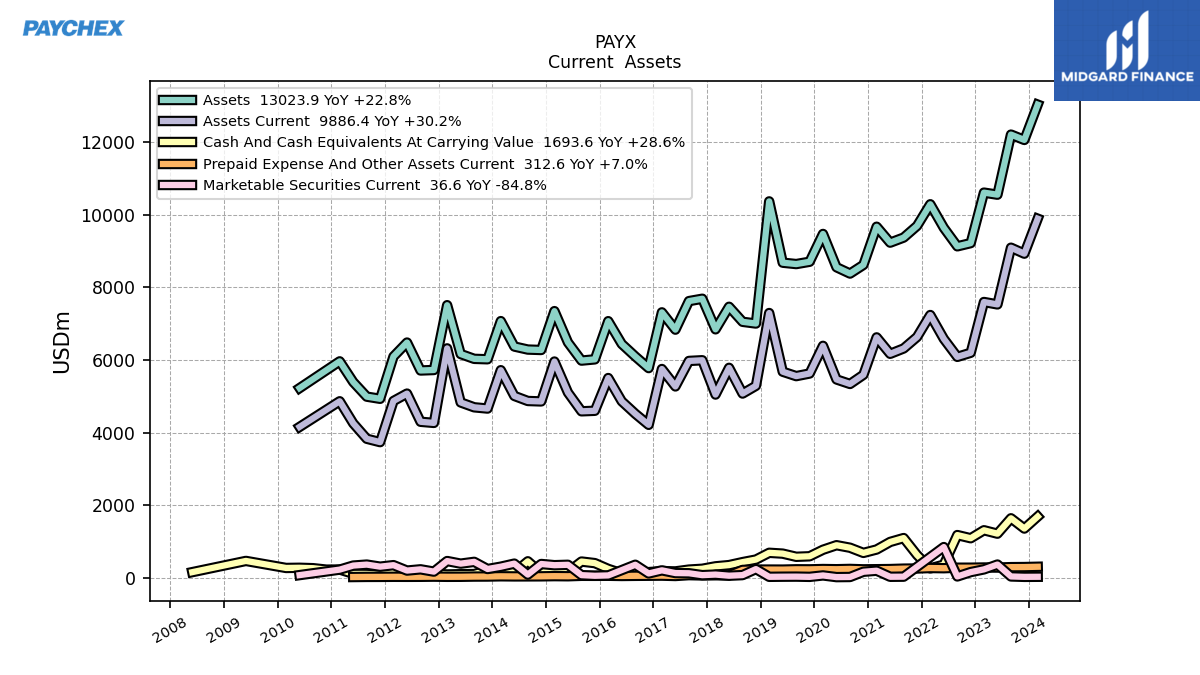
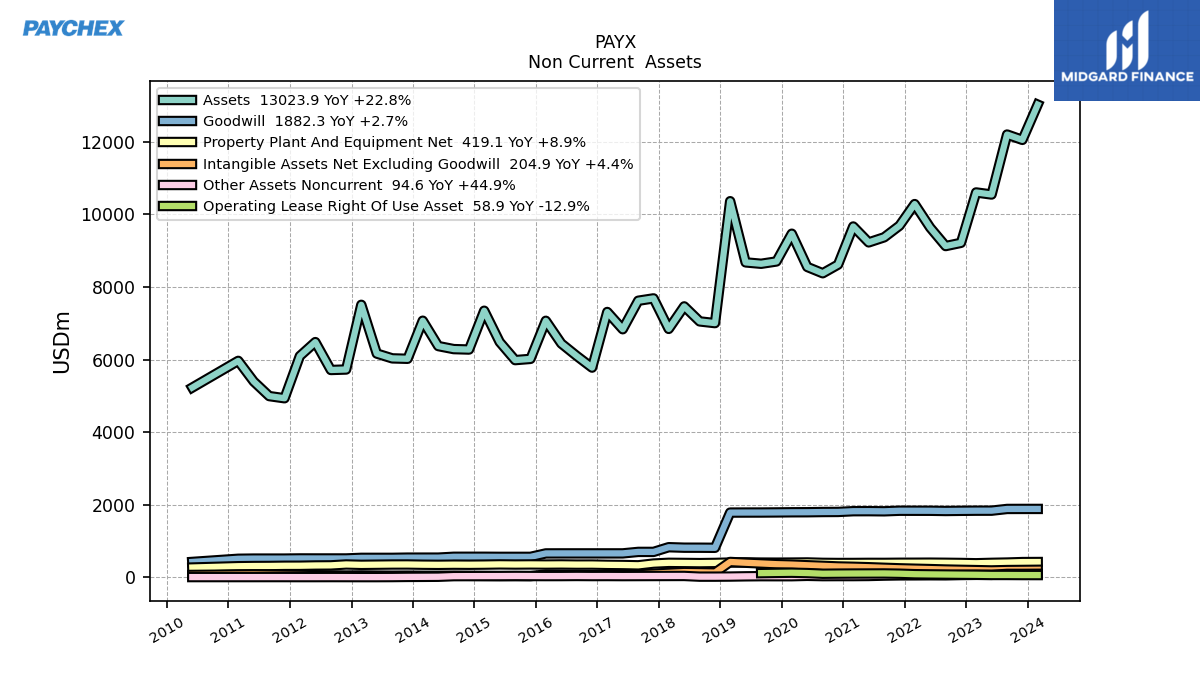
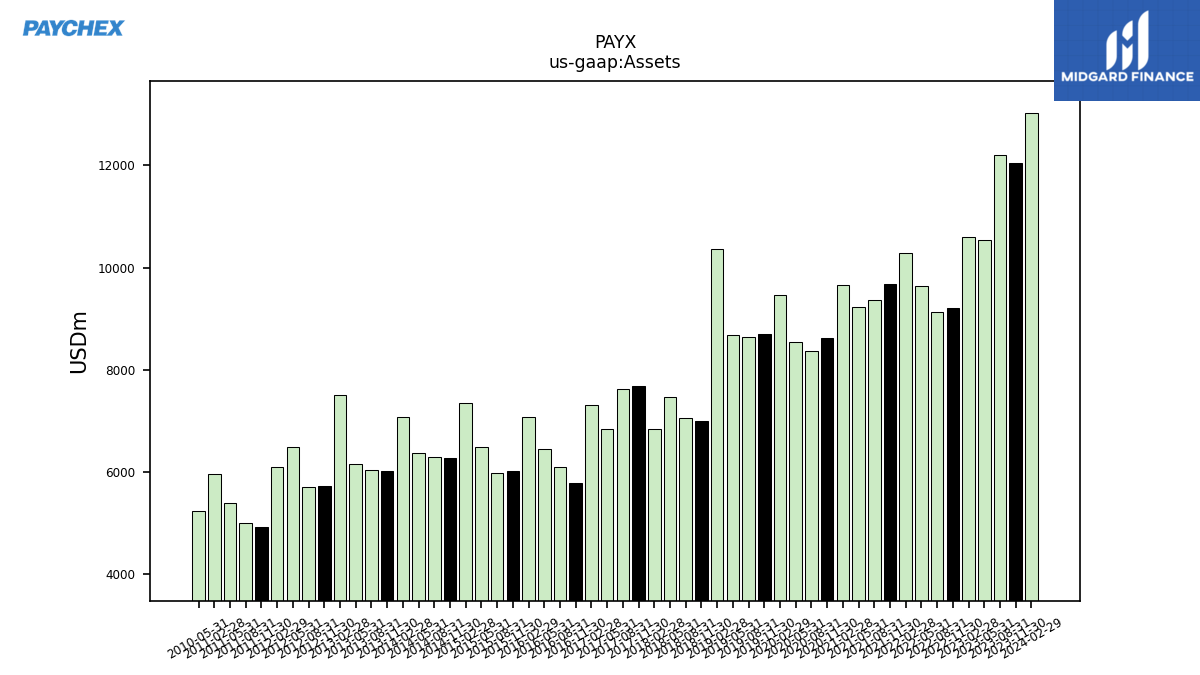
| Assets | 12052.10 | 12200.00 | 10546.40 | 10603.60 | 9214.30 | 9125.90 | 9635.20 | 10283.70 | 9688.10 | 9367.30 | 9227.20 | 9665.90 | 8615.40 | 8376.90 | 8550.70 | 9466.90 | 8701.70 | 8638.20 | 8676.00 | 10363.00 | 7002.40 | 7050.00 | 7463.70 | 6842.80 | 7684.60 | 7619.50 | 6833.70 | 7310.30 | 5776.10 | 6096.90 | 6440.80 | 7067.50 | 6016.80 | 5983.00 | 6482.50 | 7344.20 | 6274.50 | 6286.60 | 6370.10 | 7069.40 | 6019.40 | 6031.20 | 6163.70 | 7507.50 | 5724.20 | 5710.90 | 6479.60 | 6094.90 | 4932.00 | 4991.50 | 5393.80 | 5962.80 | NA | NA | 5226.30 | NA | NA | NA | |
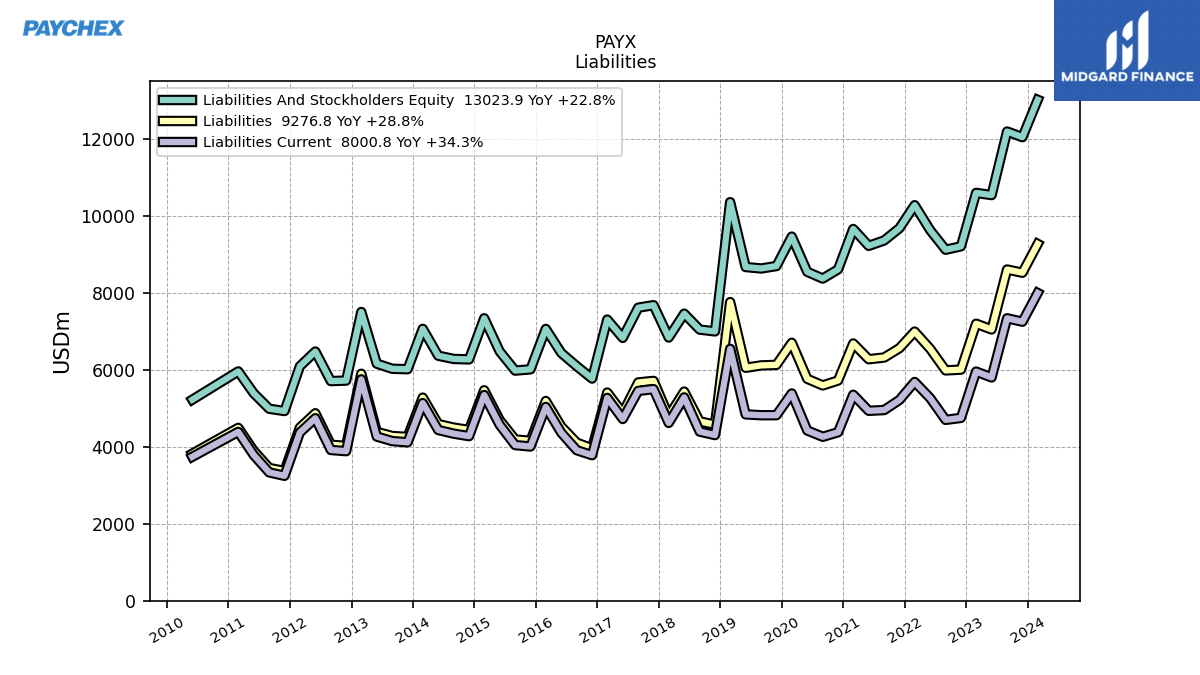
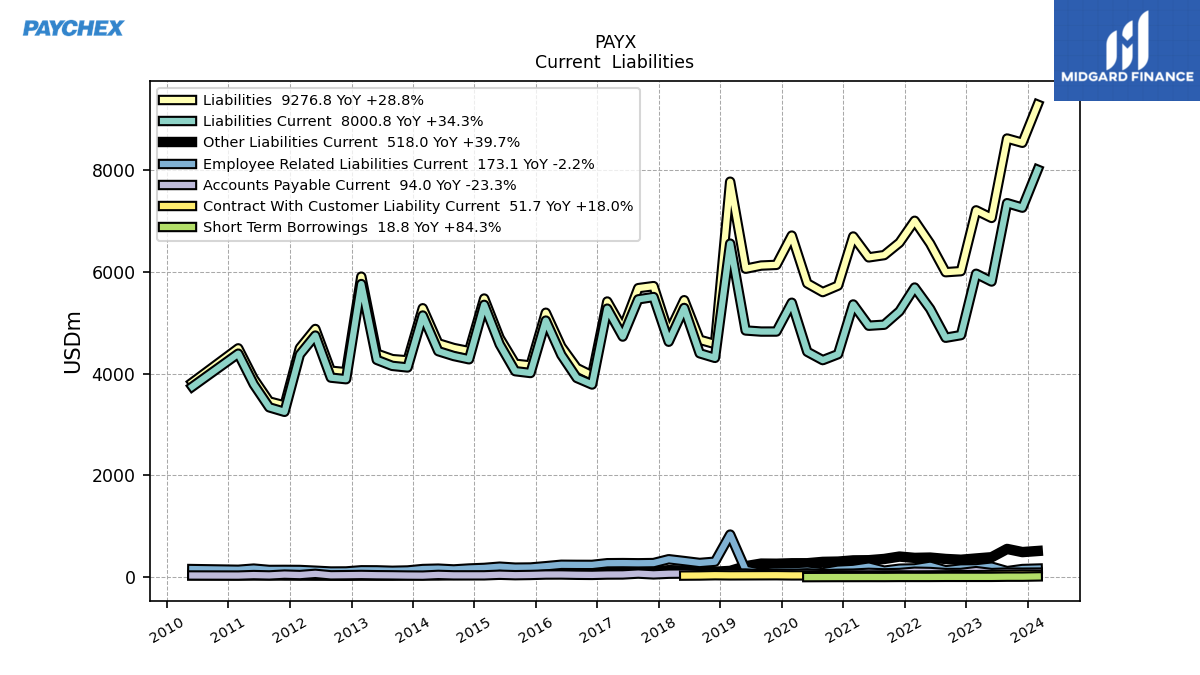
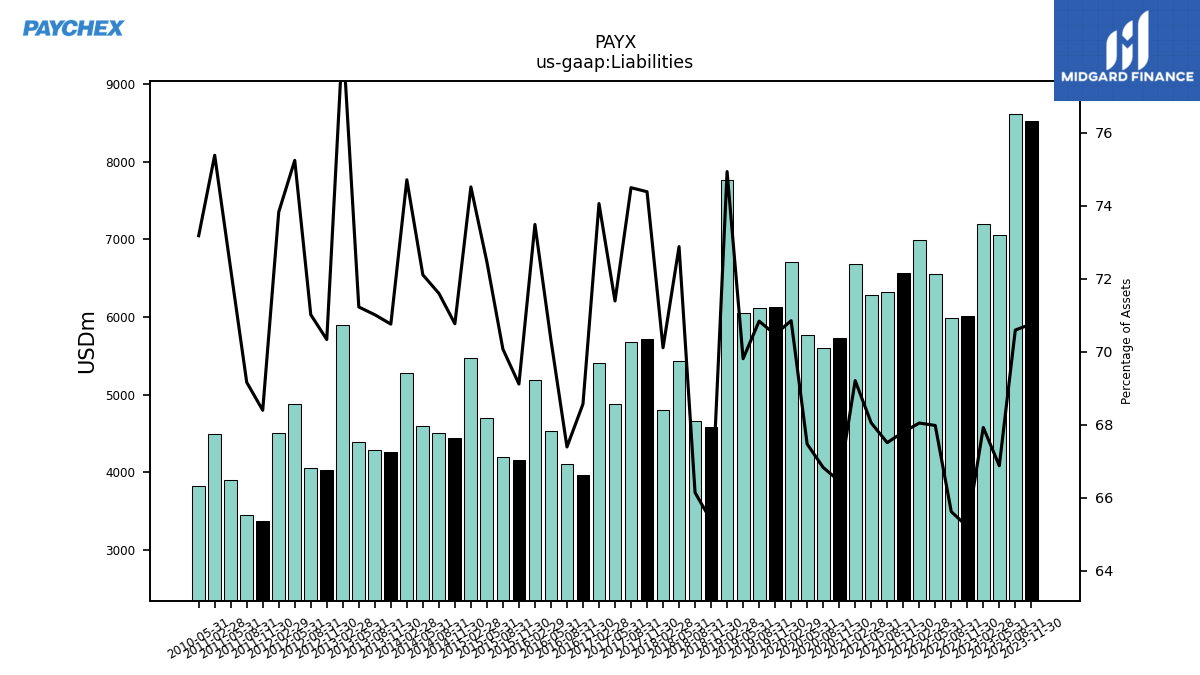
| Liabilities | 8527.70 | 8612.20 | 7053.20 | 7202.50 | 6009.00 | 5988.50 | 6550.00 | 6997.70 | 6568.30 | 6323.80 | 6279.20 | 6689.50 | 5725.70 | 5598.30 | 5769.30 | 6707.10 | 6132.30 | 6118.90 | 6056.50 | 7765.00 | 4577.90 | 4663.00 | 5439.20 | 4797.30 | 5715.70 | 5675.70 | 4878.40 | 5413.60 | 3960.50 | 4108.80 | 4529.10 | 5193.40 | 4158.50 | 4192.20 | 4697.00 | 5472.20 | 4440.20 | 4501.00 | 4593.10 | 5281.20 | 4259.00 | 4282.80 | 4390.00 | 5901.60 | 4026.00 | 4055.50 | 4875.10 | 4499.50 | 3373.30 | 3452.20 | 3897.60 | 4494.60 | NA | NA | 3824.30 | NA | NA | NA | |
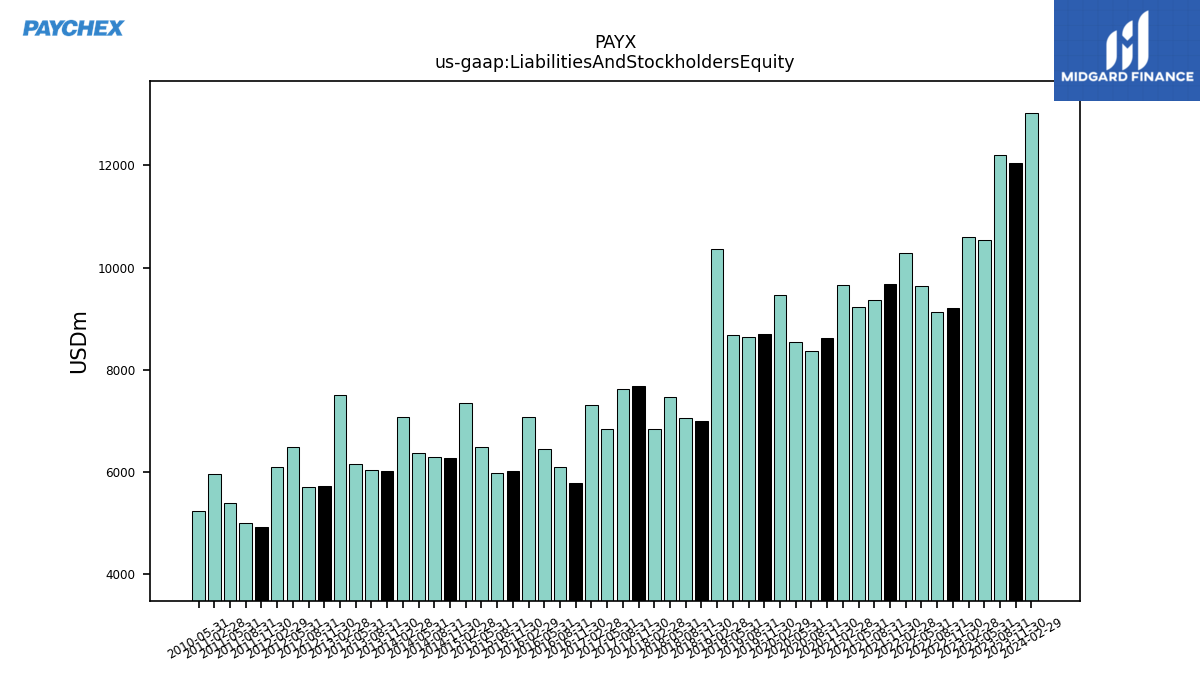
| Liabilities And Stockholders Equity | 12052.10 | 12200.00 | 10546.40 | 10603.60 | 9214.30 | 9125.90 | 9635.20 | 10283.70 | 9688.10 | 9367.30 | 9227.20 | 9665.90 | 8615.40 | 8376.90 | 8550.70 | 9466.90 | 8701.70 | 8638.20 | 8676.00 | 10363.00 | 7002.40 | 7050.00 | 7463.70 | 6842.80 | 7684.60 | 7619.50 | 6833.70 | 7310.30 | 5776.10 | 6096.90 | 6440.80 | 7067.50 | 6016.80 | 5983.00 | 6482.50 | 7344.20 | 6274.50 | 6286.60 | 6370.10 | 7069.40 | 6019.40 | 6031.20 | 6163.70 | 7507.50 | 5724.20 | 5710.90 | 6479.60 | 6094.90 | 4932.00 | 4991.50 | 5393.80 | 5962.80 | NA | NA | 5226.30 | NA | NA | NA | |
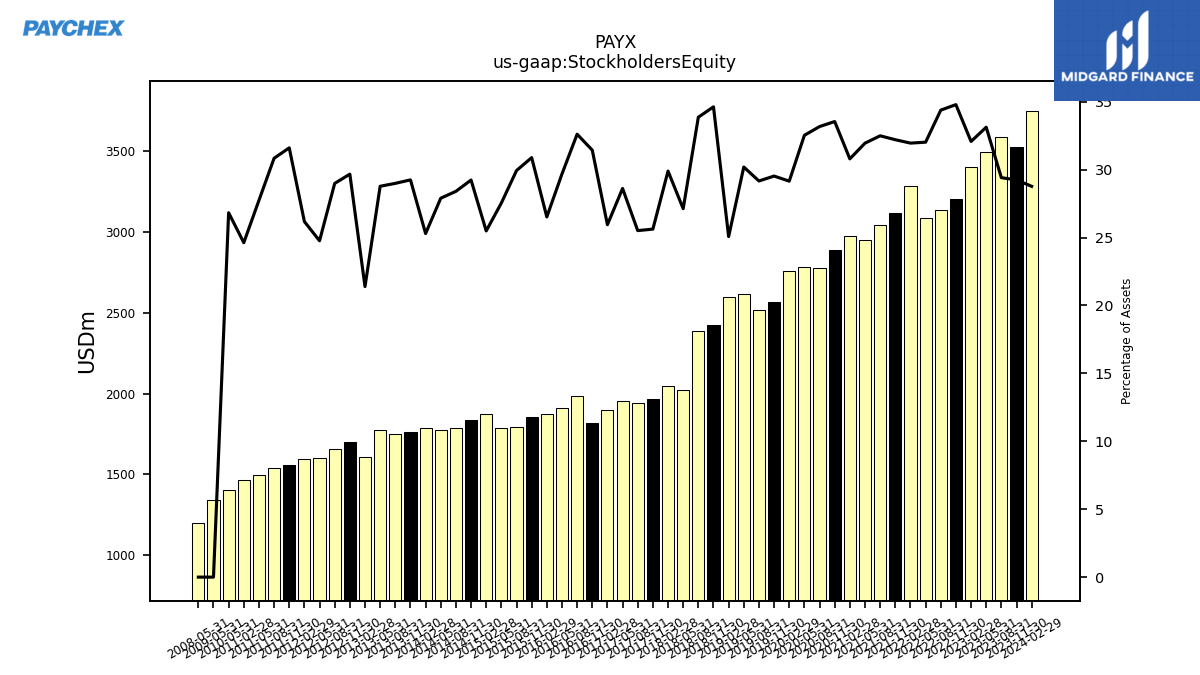
| Stockholders Equity | 3524.40 | 3587.80 | 3493.20 | 3401.10 | 3205.30 | 3137.40 | 3085.20 | 3286.00 | 3119.80 | 3043.50 | 2948.00 | 2976.40 | 2889.70 | 2778.60 | 2781.40 | 2759.80 | 2569.40 | 2519.30 | 2619.50 | 2598.00 | 2424.50 | 2387.00 | 2024.50 | 2045.50 | 1968.90 | 1943.80 | 1955.30 | 1896.70 | 1815.60 | 1988.10 | 1911.70 | 1874.10 | 1858.30 | 1790.80 | 1785.50 | 1872.00 | 1834.30 | 1785.60 | 1777.00 | 1788.20 | 1760.40 | 1748.40 | 1773.70 | 1605.90 | 1698.20 | 1655.40 | 1604.50 | 1595.40 | 1558.70 | 1539.30 | 1496.20 | 1468.20 | NA | NA | 1402.00 | NA | NA | NA |
| 2023-11-30 | 2023-08-31 | 2023-05-31 | 2023-02-28 | 2022-11-30 | 2022-08-31 | 2022-05-31 | 2022-02-28 | 2021-11-30 | 2021-08-31 | 2021-05-31 | 2021-02-28 | 2020-11-30 | 2020-08-31 | 2020-05-31 | 2020-02-29 | 2019-11-30 | 2019-08-31 | 2019-05-31 | 2019-02-28 | 2018-11-30 | 2018-08-31 | 2018-05-31 | 2018-02-28 | 2017-11-30 | 2017-08-31 | 2017-05-31 | 2017-02-28 | 2016-11-30 | 2016-08-31 | 2016-05-31 | 2016-02-29 | 2015-11-30 | 2015-08-31 | 2015-05-31 | 2015-02-28 | 2014-11-30 | 2014-08-31 | 2014-05-31 | 2014-02-28 | 2013-11-30 | 2013-08-31 | 2013-05-31 | 2013-02-28 | 2012-11-30 | 2012-08-31 | 2012-05-31 | 2012-02-29 | 2011-11-30 | 2011-08-31 | 2011-05-31 | 2011-02-28 | 2010-11-30 | 2010-08-31 | 2010-05-31 | 2010-02-28 | 2009-11-30 | 2009-08-31 | ||
|---|---|---|---|---|---|---|---|---|---|---|---|---|---|---|---|---|---|---|---|---|---|---|---|---|---|---|---|---|---|---|---|---|---|---|---|---|---|---|---|---|---|---|---|---|---|---|---|---|---|---|---|---|---|---|---|---|---|---|---|
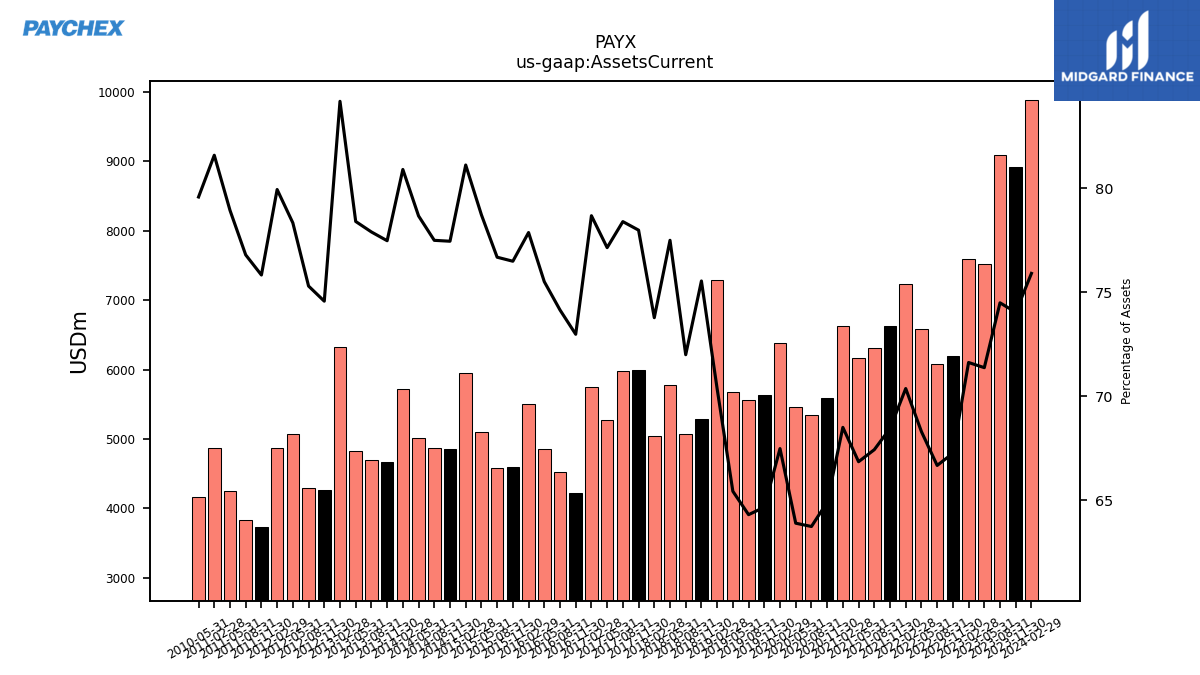
| Assets Current | 8923.70 | 9088.50 | 7528.10 | 7595.20 | 6198.20 | 6085.40 | 6581.60 | 7237.30 | 6632.40 | 6317.30 | 6169.50 | 6622.20 | 5592.40 | 5340.20 | 5464.60 | 6389.40 | 5627.90 | 5555.90 | 5677.70 | 7292.00 | 5290.00 | 5076.20 | 5784.40 | 5048.70 | 5993.00 | 5973.50 | 5272.00 | 5751.80 | 4215.70 | 4521.00 | 4863.60 | 5503.60 | 4602.50 | 4588.20 | 5103.20 | 5957.40 | 4859.90 | 4872.00 | 5011.40 | 5719.30 | 4663.80 | 4698.30 | 4832.60 | 6319.60 | 4268.80 | 4300.40 | 5075.90 | 4872.20 | 3740.00 | 3833.40 | 4257.90 | 4864.80 | NA | NA | 4159.10 | NA | NA | NA | |
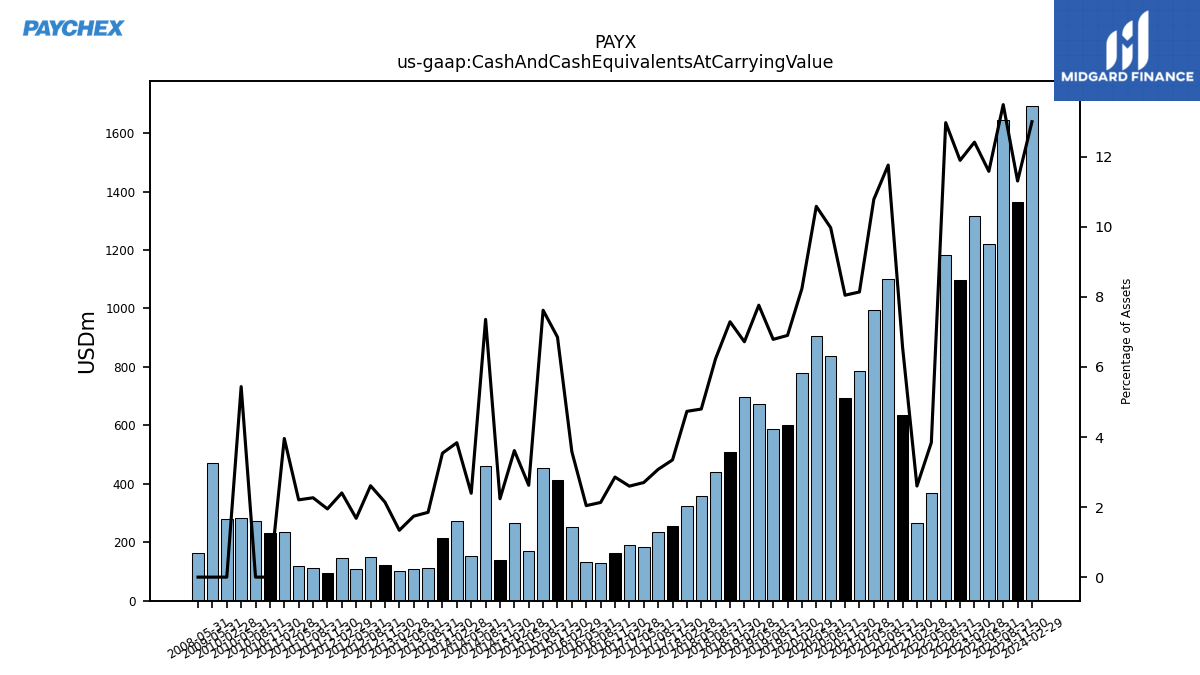
| Cash And Cash Equivalents At Carrying Value | 1363.10 | 1645.90 | 1222.00 | 1316.90 | 1096.50 | 1184.20 | 370.00 | 267.50 | 636.20 | 1102.00 | 995.20 | 787.00 | 693.50 | 835.70 | 905.20 | 780.00 | 600.60 | 586.40 | 673.60 | 696.40 | 510.60 | 440.10 | 358.20 | 323.90 | 257.20 | 234.40 | 184.60 | 189.90 | 165.00 | 130.00 | 131.50 | 253.10 | 412.30 | 455.90 | 170.00 | 265.30 | 140.40 | 462.60 | 152.50 | 271.30 | 213.00 | 111.60 | 107.30 | 100.40 | 122.60 | 149.00 | 108.80 | 146.50 | 96.10 | 113.10 | 119.00 | 236.00 | 233.20 | 272.90 | 284.30 | 279.30 | NA | NA | |
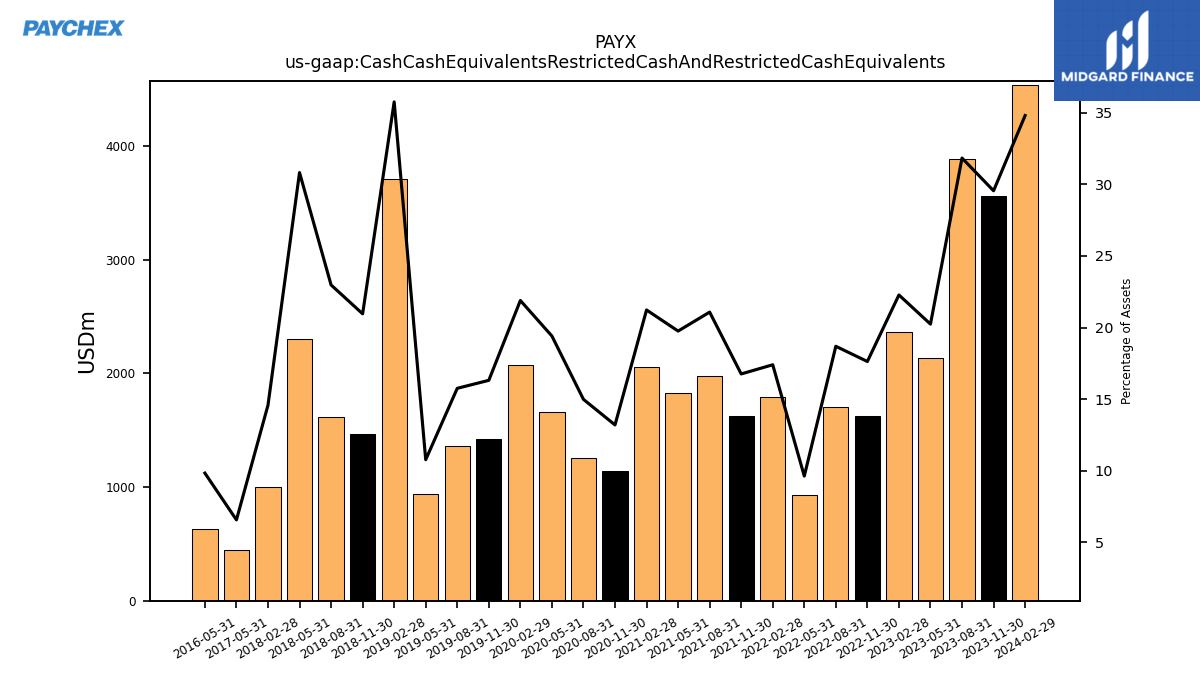
| Cash Cash Equivalents Restricted Cash And Restricted Cash Equivalents | 3561.80 | 3884.10 | 2134.90 | 2362.40 | 1624.80 | 1706.10 | 928.40 | 1789.90 | 1624.20 | 1974.70 | 1823.10 | 2052.20 | 1137.70 | 1255.70 | 1659.80 | 2072.50 | 1420.00 | 1361.50 | 935.20 | 3705.50 | 1467.80 | 1619.90 | 2300.50 | 997.80 | NA | NA | 449.40 | NA | NA | NA | 633.90 | NA | NA | NA | NA | NA | NA | NA | NA | NA | NA | NA | NA | NA | NA | NA | NA | NA | NA | NA | NA | NA | NA | NA | NA | NA | NA | NA | |
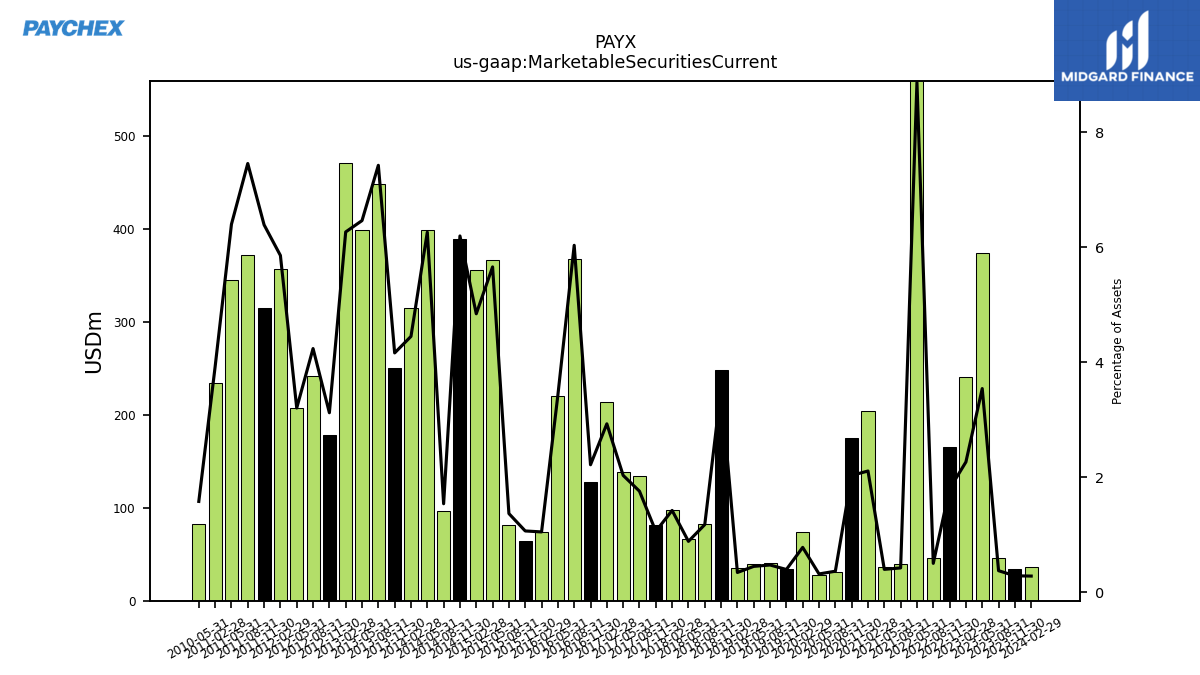
| Marketable Securities Current | 34.40 | 45.70 | 373.40 | 240.10 | 165.60 | 45.80 | 853.90 | NA | NA | 39.60 | 36.70 | 203.70 | 174.90 | 30.60 | 27.20 | 73.80 | 34.40 | 40.90 | 39.00 | 35.60 | 248.40 | 82.90 | 66.00 | 97.30 | 81.40 | 133.80 | 138.80 | 214.00 | 128.00 | 367.70 | 220.60 | 74.10 | 64.10 | 81.80 | 366.60 | 355.50 | 388.60 | 96.70 | 398.70 | 314.40 | 250.40 | 447.60 | 398.20 | 470.20 | 178.60 | 241.90 | 207.50 | 356.80 | 315.00 | 372.00 | 345.00 | 233.70 | NA | NA | 82.50 | NA | NA | NA | |
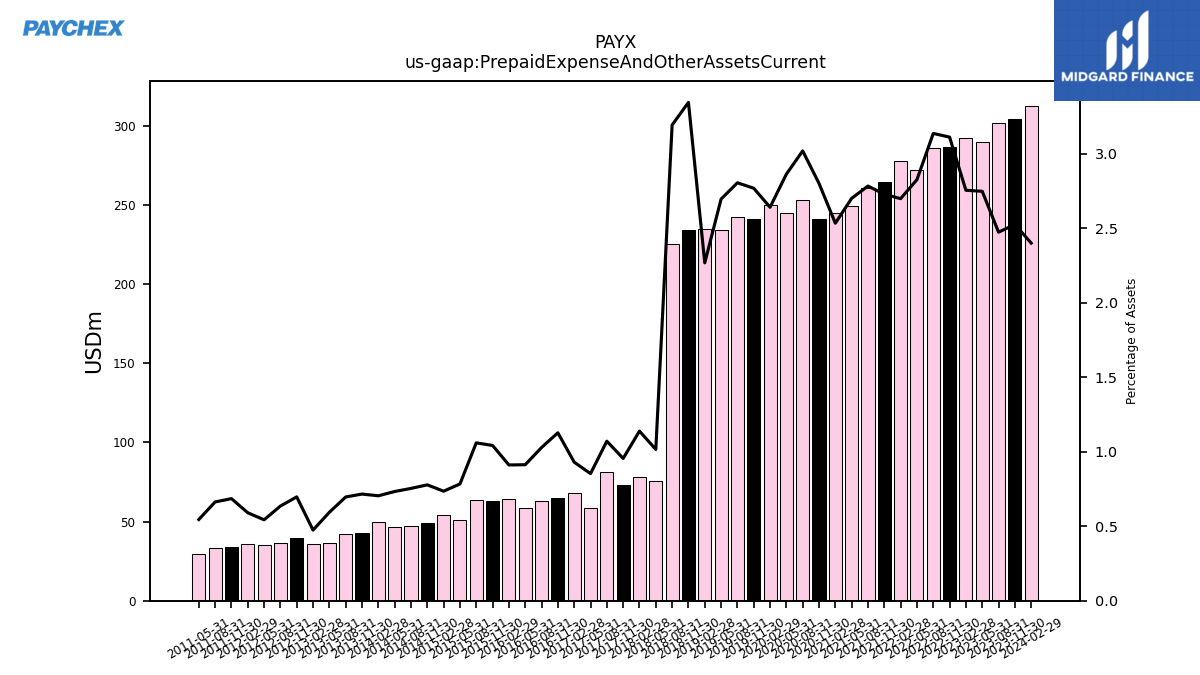
| Prepaid Expense And Other Assets Current | 304.30 | 301.80 | 289.80 | 292.10 | 286.70 | 286.20 | 272.30 | 277.50 | 264.30 | 260.70 | 249.20 | 244.90 | 241.30 | 252.90 | 244.80 | 250.00 | 240.90 | 242.30 | 233.90 | 235.00 | 234.20 | 225.10 | 75.80 | 77.90 | 73.40 | 81.60 | 58.30 | 68.00 | 65.10 | 62.70 | 58.80 | 64.40 | 62.70 | 63.40 | 50.80 | 54.00 | 48.80 | 47.40 | 46.70 | 49.80 | 43.10 | 42.00 | 36.60 | 35.60 | 39.90 | 36.30 | 35.20 | 36.00 | 33.80 | 33.10 | 29.40 | NA | NA | NA | NA | NA | NA | NA | |
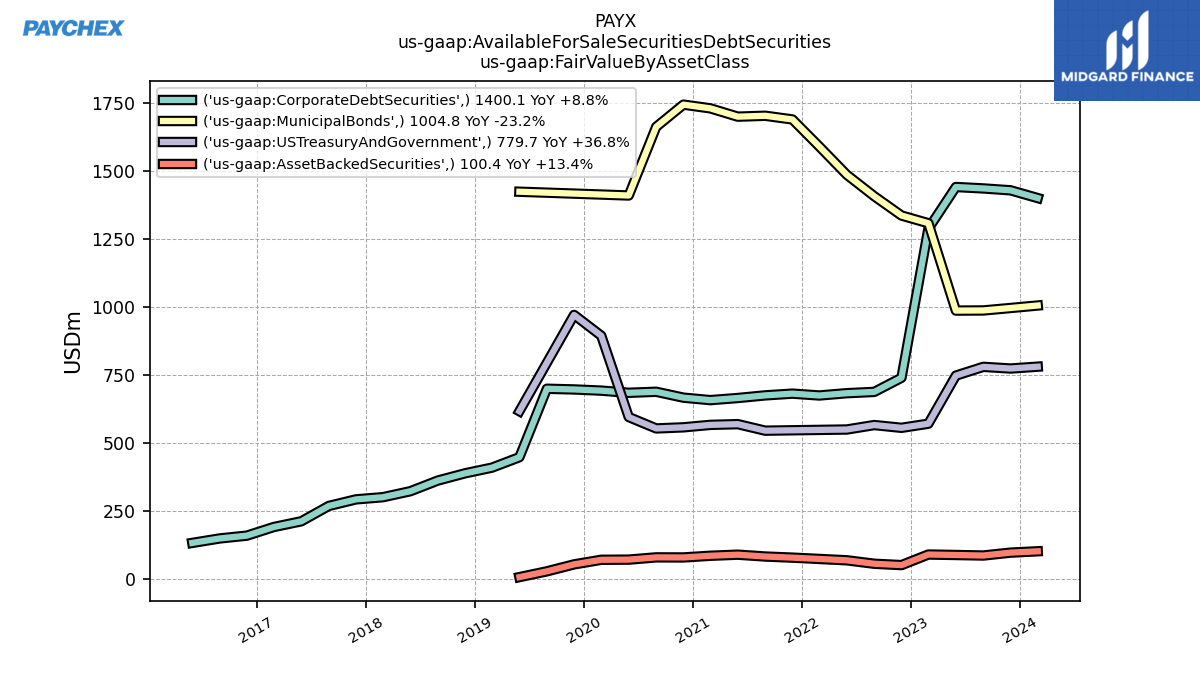
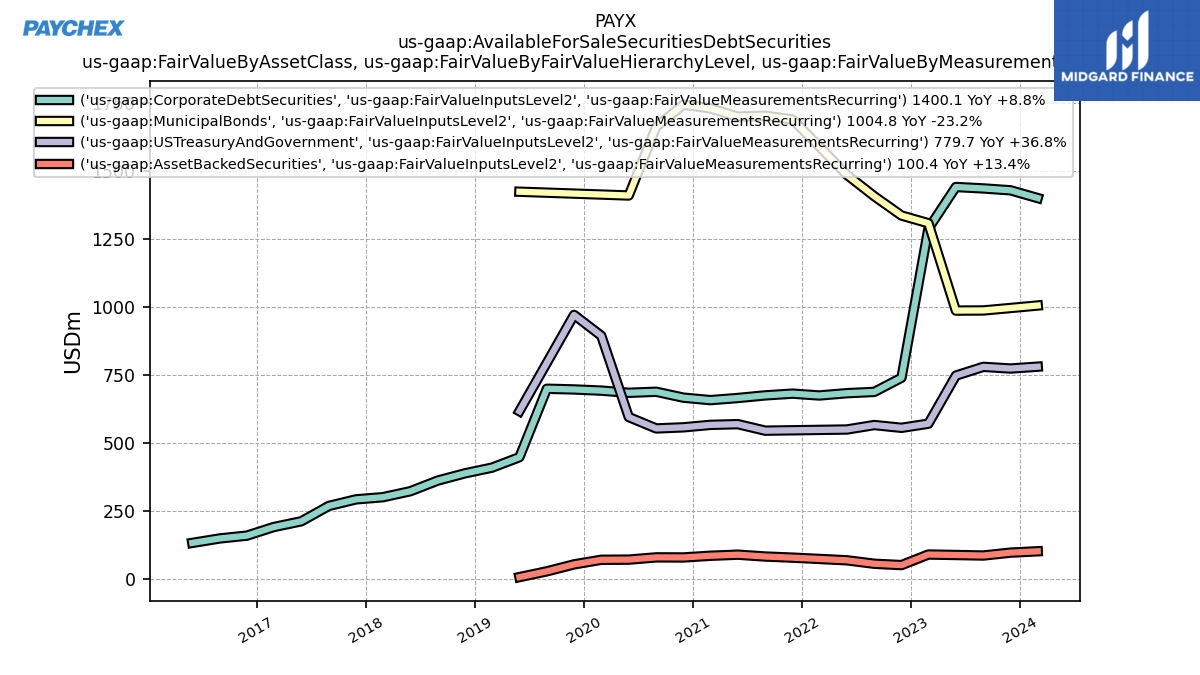
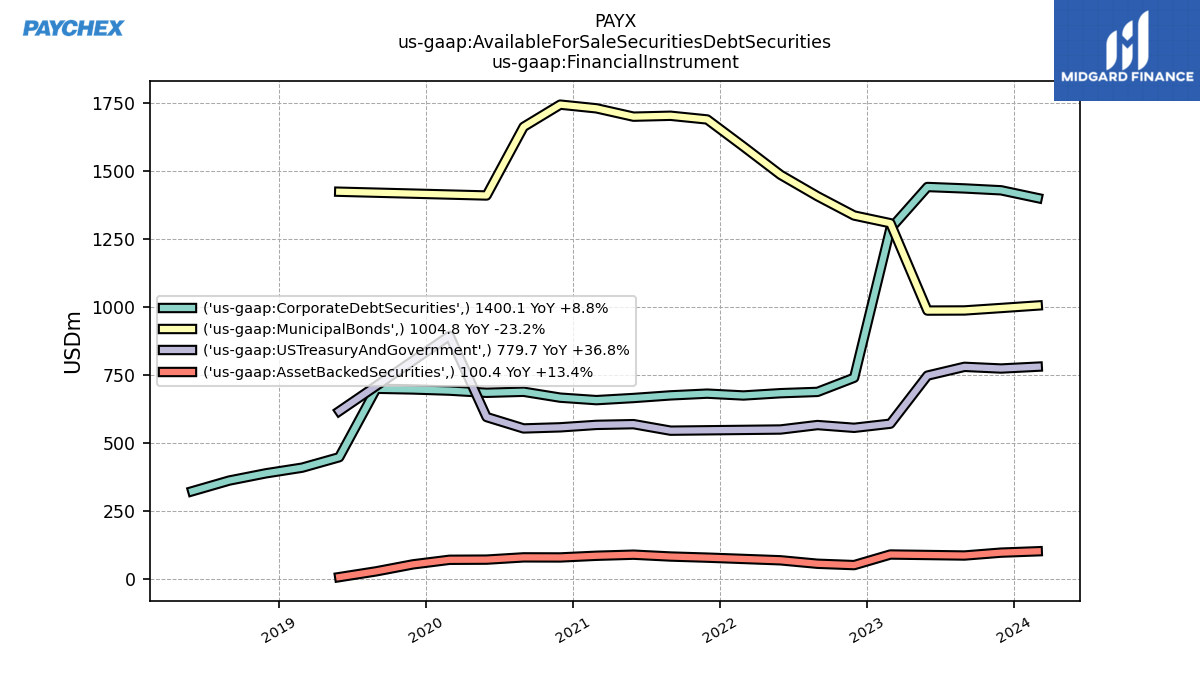
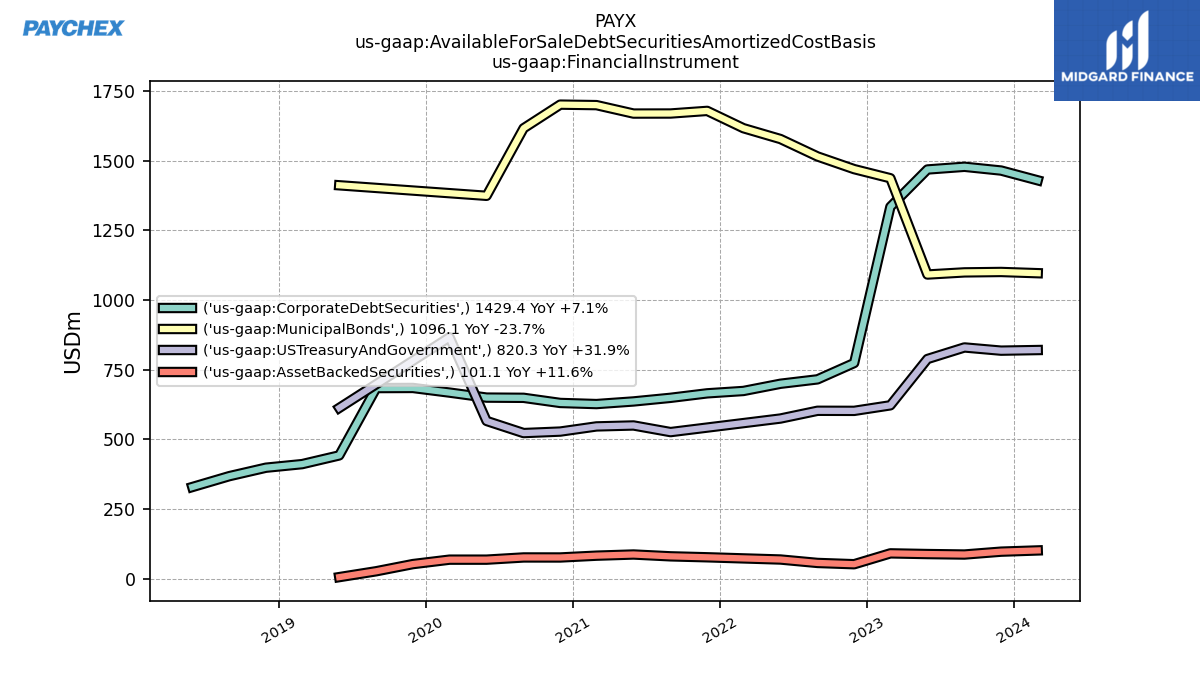
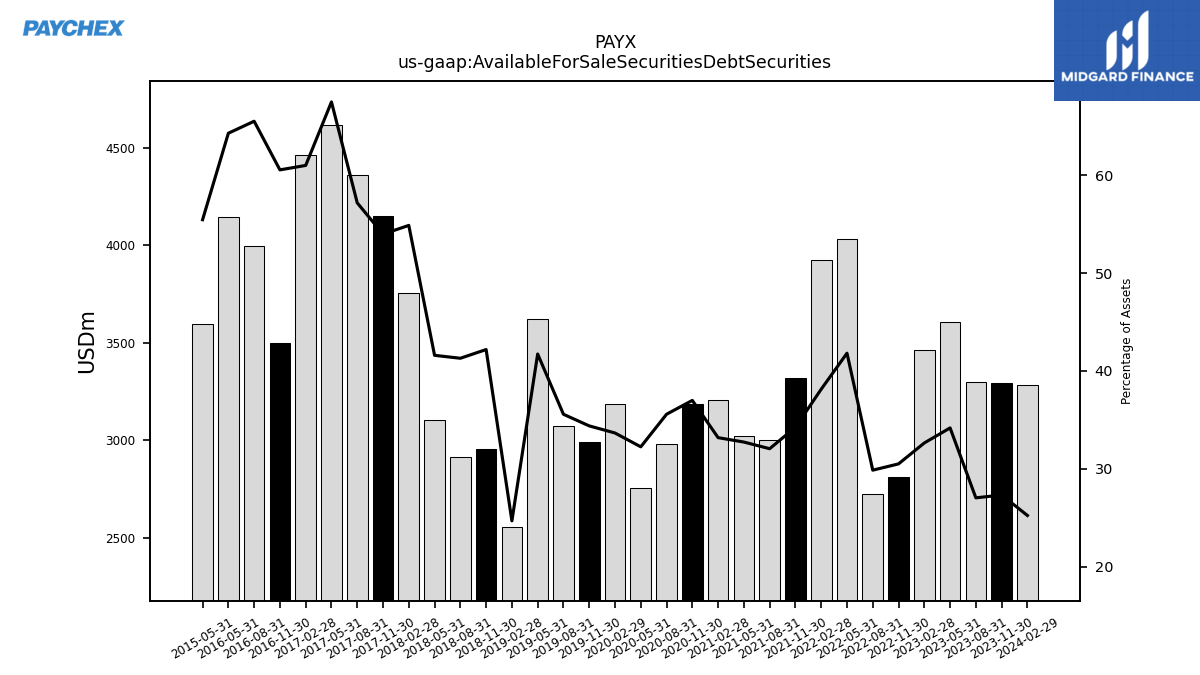
| Available For Sale Securities Debt Securities | 3292.60 | 3297.40 | 3604.60 | 3460.90 | 2810.30 | 2724.80 | 4029.20 | 3921.70 | 3317.10 | 3002.40 | 3020.20 | 3207.40 | 3186.80 | 2980.10 | 2757.20 | 3186.40 | 2992.10 | 3072.80 | 3620.80 | 2557.30 | 2954.30 | 2911.60 | 3104.80 | 3755.60 | 4148.90 | 4357.50 | 4613.20 | 4460.30 | 3498.10 | 3995.50 | 4141.90 | NA | NA | NA | 3595.60 | NA | NA | NA | NA | NA | NA | NA | NA | NA | NA | NA | NA | NA | NA | NA | NA | NA | NA | NA | NA | NA | NA | NA |
| 2023-11-30 | 2023-08-31 | 2023-05-31 | 2023-02-28 | 2022-11-30 | 2022-08-31 | 2022-05-31 | 2022-02-28 | 2021-11-30 | 2021-08-31 | 2021-05-31 | 2021-02-28 | 2020-11-30 | 2020-08-31 | 2020-05-31 | 2020-02-29 | 2019-11-30 | 2019-08-31 | 2019-05-31 | 2019-02-28 | 2018-11-30 | 2018-08-31 | 2018-05-31 | 2018-02-28 | 2017-11-30 | 2017-08-31 | 2017-05-31 | 2017-02-28 | 2016-11-30 | 2016-08-31 | 2016-05-31 | 2016-02-29 | 2015-11-30 | 2015-08-31 | 2015-05-31 | 2015-02-28 | 2014-11-30 | 2014-08-31 | 2014-05-31 | 2014-02-28 | 2013-11-30 | 2013-08-31 | 2013-05-31 | 2013-02-28 | 2012-11-30 | 2012-08-31 | 2012-05-31 | 2012-02-29 | 2011-11-30 | 2011-08-31 | 2011-05-31 | 2011-02-28 | 2010-11-30 | 2010-08-31 | 2010-05-31 | 2010-02-28 | 2009-11-30 | 2009-08-31 | ||
|---|---|---|---|---|---|---|---|---|---|---|---|---|---|---|---|---|---|---|---|---|---|---|---|---|---|---|---|---|---|---|---|---|---|---|---|---|---|---|---|---|---|---|---|---|---|---|---|---|---|---|---|---|---|---|---|---|---|---|---|
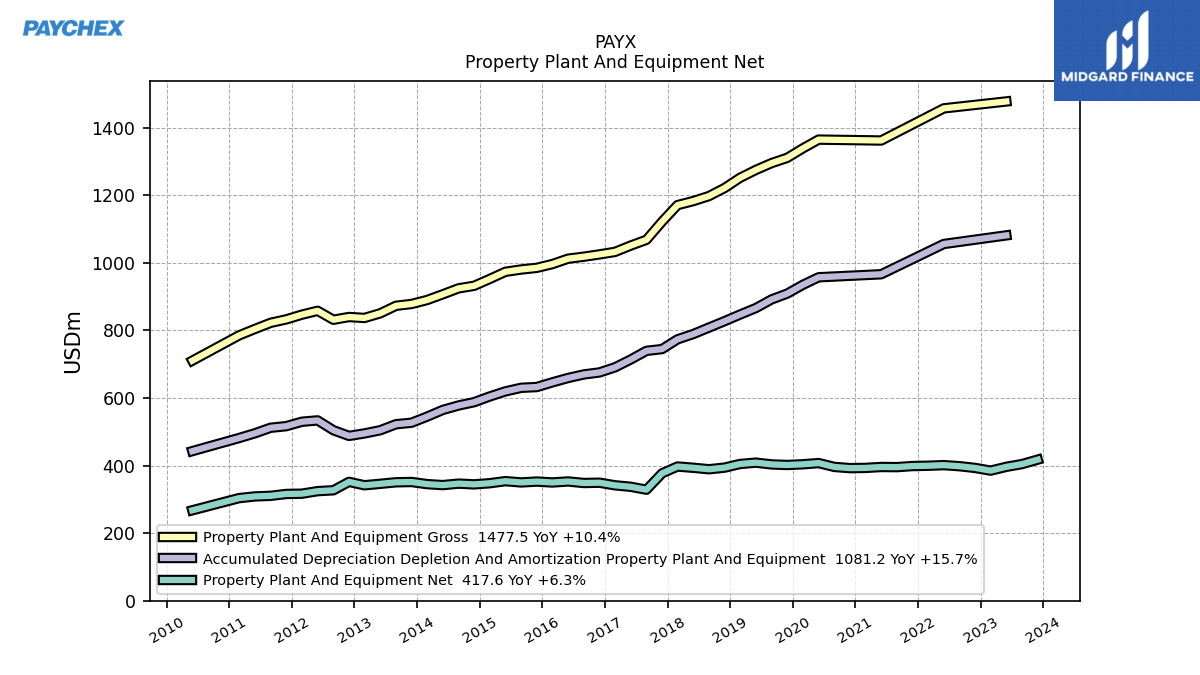
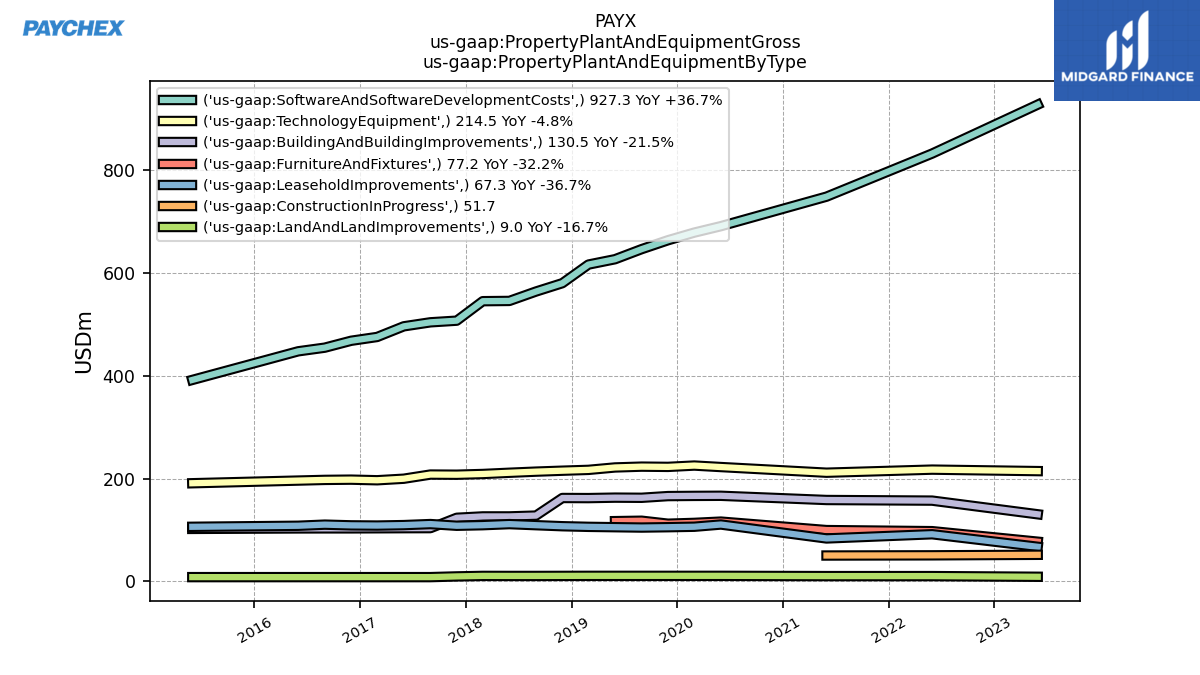
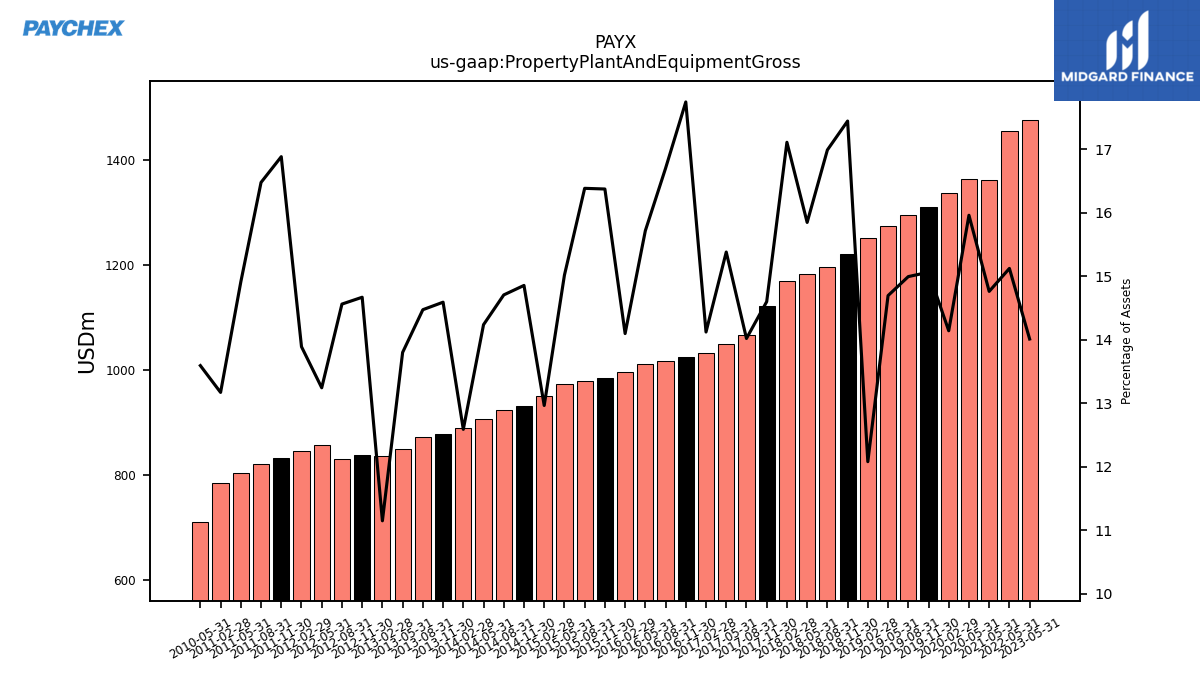
| Property Plant And Equipment Gross | NA | NA | 1477.50 | NA | NA | NA | 1457.00 | NA | NA | NA | 1361.90 | NA | NA | NA | 1364.60 | 1338.60 | 1310.60 | 1295.10 | 1274.80 | 1251.60 | 1221.40 | 1197.60 | 1182.70 | 1170.70 | 1121.80 | 1068.10 | 1051.00 | 1032.20 | 1024.90 | 1018.10 | 1012.20 | 996.20 | 985.10 | 980.20 | 973.40 | 952.00 | 932.00 | 924.40 | 906.80 | 889.80 | 878.20 | 872.80 | 850.50 | 836.80 | 839.60 | 831.50 | 858.00 | 846.50 | 832.60 | 822.40 | 804.20 | 785.20 | NA | NA | 710.30 | NA | NA | NA | |
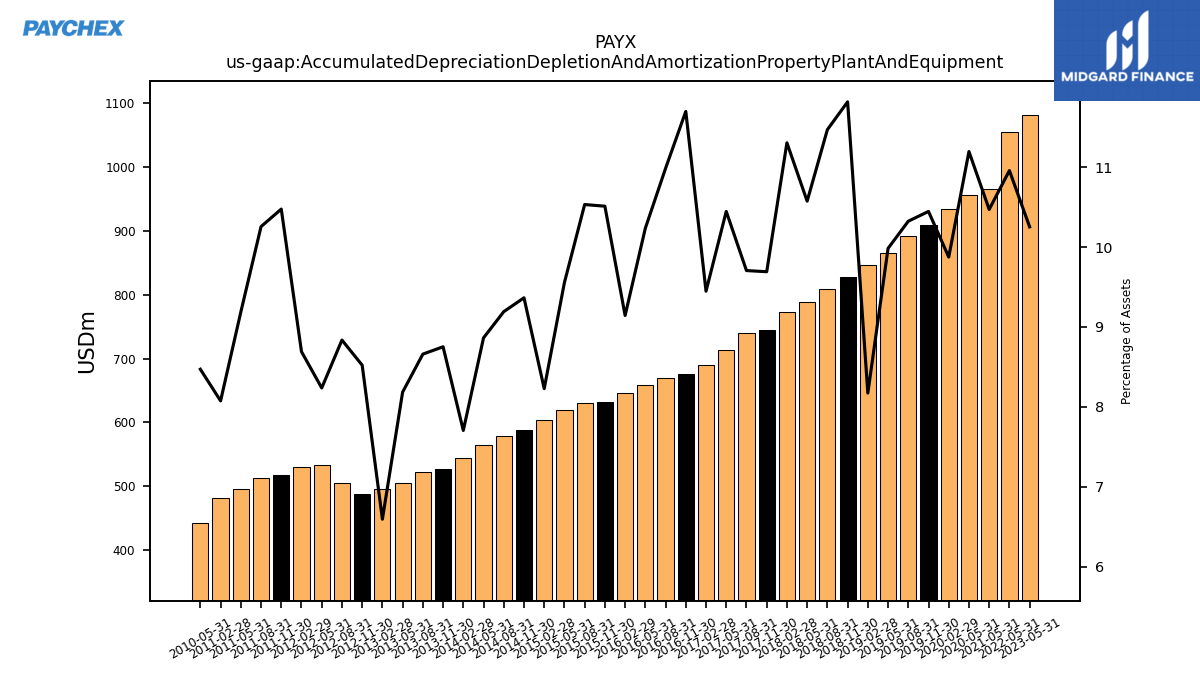
| Accumulated Depreciation Depletion And Amortization Property Plant And Equipment | NA | NA | 1081.20 | NA | NA | NA | 1055.70 | NA | NA | NA | 966.10 | NA | NA | NA | 957.20 | 934.80 | 908.90 | 891.70 | 866.10 | 846.90 | 827.40 | 808.50 | 789.20 | 773.50 | 744.70 | 739.50 | 713.80 | 690.60 | 675.60 | 669.70 | 659.20 | 646.20 | 632.40 | 630.10 | 619.50 | 604.30 | 587.60 | 577.80 | 564.60 | 544.70 | 526.80 | 522.30 | 504.50 | 495.10 | 487.80 | 504.60 | 533.70 | 529.70 | 516.60 | 511.90 | 495.50 | 481.50 | NA | NA | 442.70 | NA | NA | NA | |
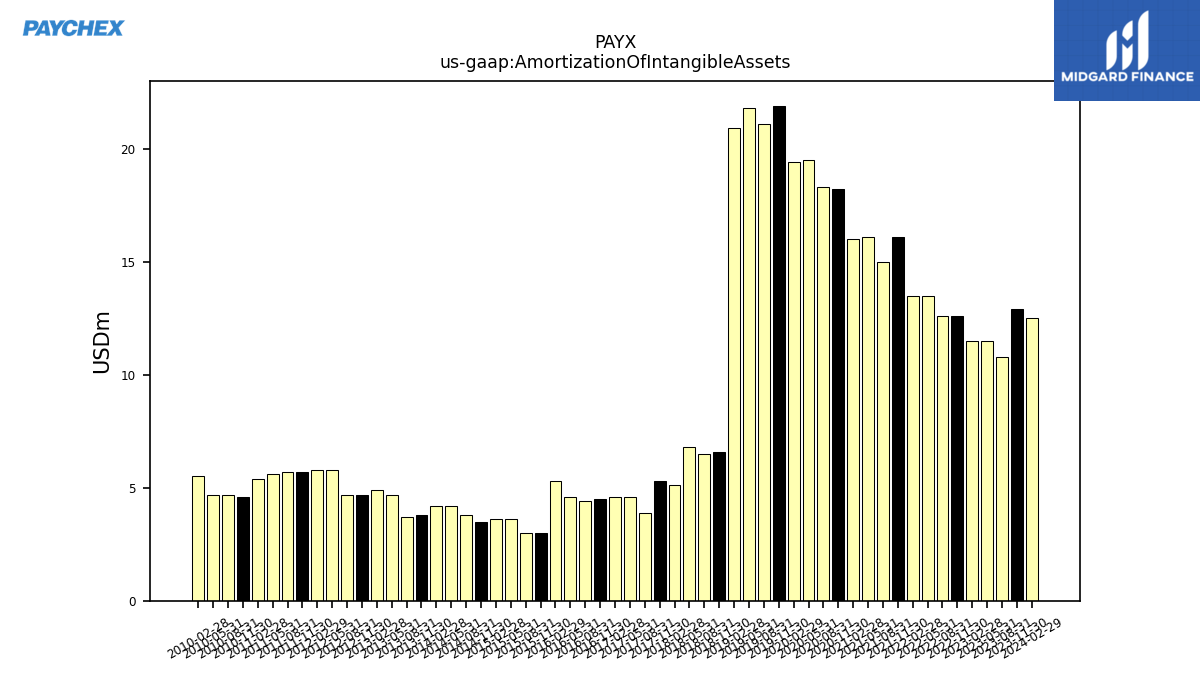
| Amortization Of Intangible Assets | 12.90 | 10.80 | 11.50 | 11.50 | 12.60 | 12.60 | 13.50 | 13.50 | 16.10 | 15.00 | 16.10 | 16.00 | 18.20 | 18.30 | 19.50 | 19.40 | 21.90 | 21.10 | 21.80 | 20.90 | 6.60 | 6.50 | 6.80 | 5.10 | 5.30 | 3.90 | 4.60 | 4.60 | 4.50 | 4.40 | 4.60 | 5.30 | 3.00 | 3.00 | 3.60 | 3.60 | 3.50 | 3.80 | 4.20 | 4.20 | 3.80 | 3.70 | 4.70 | 4.90 | 4.70 | 4.70 | 5.80 | 5.80 | 5.70 | 5.70 | 5.60 | 5.40 | 4.60 | 4.70 | 4.70 | 5.50 | NA | NA | |
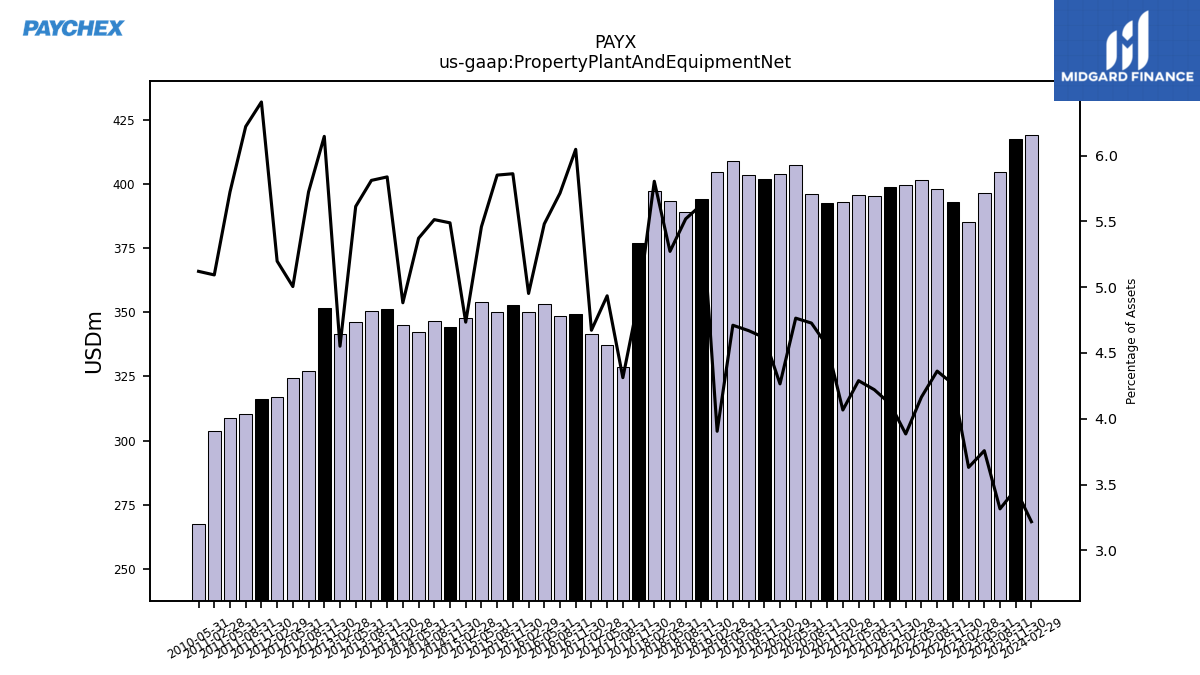
| Property Plant And Equipment Net | 417.60 | 404.50 | 396.30 | 385.00 | 393.00 | 398.10 | 401.30 | 399.50 | 398.60 | 395.40 | 395.80 | 393.10 | 392.40 | 396.00 | 407.40 | 403.80 | 401.70 | 403.40 | 408.70 | 404.70 | 394.00 | 389.10 | 393.50 | 397.20 | 377.10 | 328.60 | 337.20 | 341.60 | 349.30 | 348.40 | 353.00 | 350.00 | 352.70 | 350.10 | 353.90 | 347.70 | 344.40 | 346.60 | 342.20 | 345.10 | 351.40 | 350.50 | 346.00 | 341.70 | 351.80 | 326.90 | 324.30 | 316.80 | 316.00 | 310.50 | 308.70 | 303.70 | NA | NA | 267.60 | NA | NA | NA | |
| Goodwill | 1882.30 | 1881.40 | 1834.00 | 1833.60 | 1830.00 | 1825.30 | 1831.50 | 1831.80 | 1832.30 | 1816.70 | 1820.70 | 1819.60 | 1798.90 | 1796.80 | 1791.10 | 1789.80 | 1785.80 | 1783.10 | 1782.60 | 1781.50 | 810.60 | 813.30 | 814.00 | 827.40 | 698.10 | 698.00 | 657.10 | 657.10 | 657.10 | 657.10 | 657.10 | 656.20 | 561.50 | 561.50 | 561.50 | 563.80 | 563.80 | 563.40 | 540.30 | 540.00 | 540.00 | 533.90 | 533.90 | 533.90 | 517.40 | 517.40 | 517.40 | 518.10 | 513.60 | 513.60 | 513.70 | 508.60 | NA | NA | 421.60 | NA | NA | NA | |
| Intangible Assets Net Excluding Goodwill | 201.00 | 197.50 | 187.40 | 196.20 | 203.90 | 212.50 | 224.60 | 234.80 | 245.90 | 260.00 | 275.80 | 287.90 | 297.20 | 314.10 | 330.60 | 348.00 | 359.70 | 379.50 | 399.10 | 420.90 | 128.00 | 135.50 | 141.40 | NA | NA | NA | 57.60 | NA | NA | NA | NA | 73.50 | 31.30 | 33.00 | 32.40 | 35.60 | 38.80 | 42.60 | 40.60 | 40.50 | 43.60 | 42.10 | 45.20 | 49.90 | 47.00 | 51.30 | 55.80 | 61.20 | 65.70 | 71.30 | 77.20 | 74.50 | NA | NA | 63.30 | NA | NA | NA | |
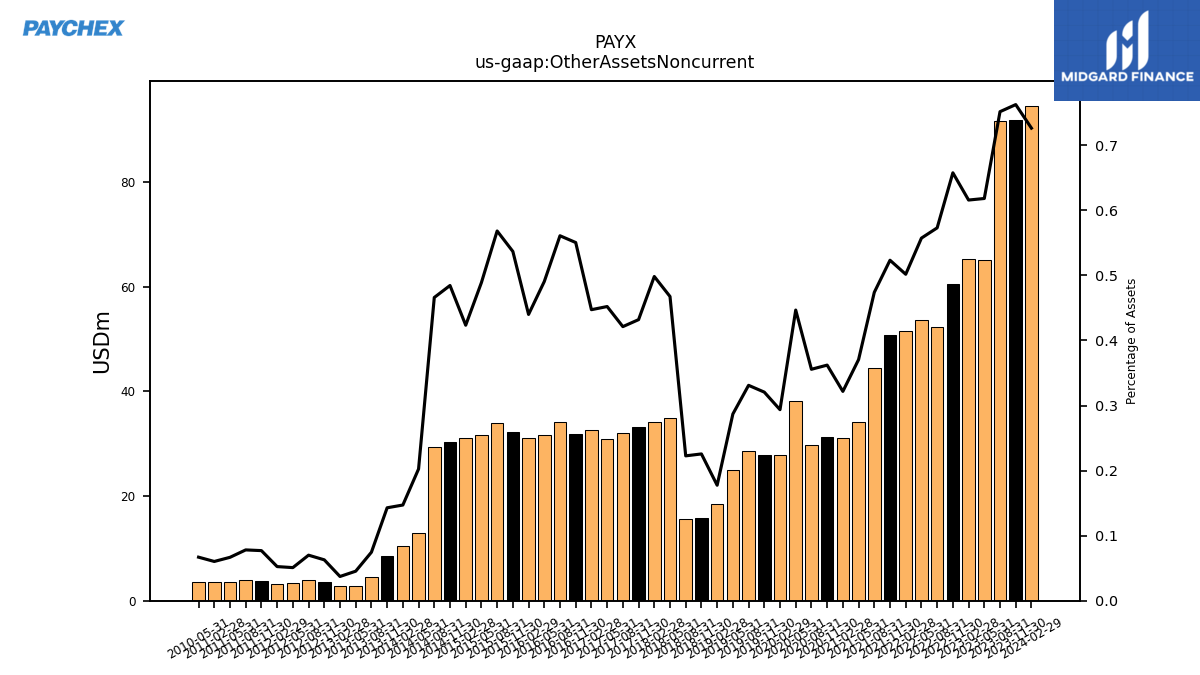
| Other Assets Noncurrent | 91.90 | 91.70 | 65.20 | 65.30 | 60.60 | 52.30 | 53.70 | 51.60 | 50.70 | 44.40 | 34.20 | 31.10 | 31.20 | 29.80 | 38.20 | 27.80 | 27.90 | 28.60 | 24.90 | 18.40 | 15.80 | 15.70 | 34.90 | 34.10 | 33.20 | 32.10 | 30.90 | 32.70 | 31.80 | 34.20 | 31.60 | 31.10 | 32.30 | 34.00 | 31.70 | 31.10 | 30.40 | 29.30 | 12.90 | 10.40 | 8.60 | 4.50 | 2.80 | 2.80 | 3.60 | 4.00 | 3.30 | 3.20 | 3.80 | 3.90 | 3.60 | 3.60 | NA | NA | 3.50 | NA | NA | NA | |
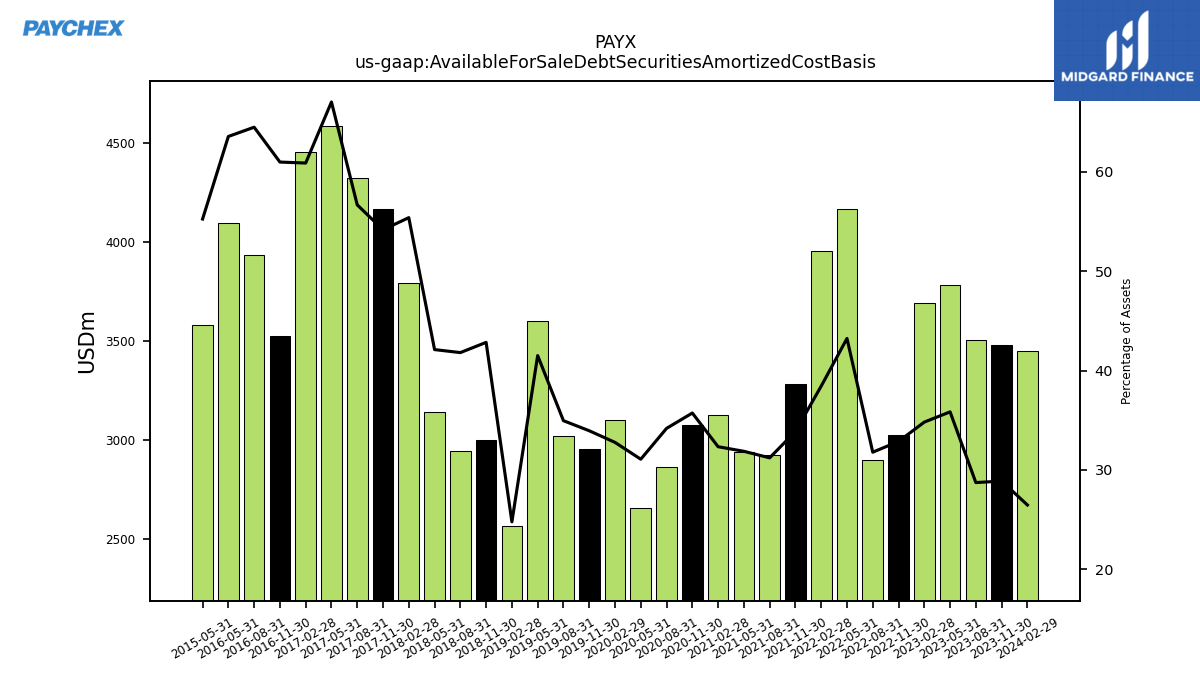
| Available For Sale Debt Securities Amortized Cost Basis | 3479.80 | 3504.30 | 3779.90 | 3691.40 | 3028.10 | 2900.40 | 4165.50 | 3952.60 | 3281.20 | 2923.70 | 2940.90 | 3125.30 | 3077.90 | 2863.20 | 2657.20 | 3102.30 | 2953.40 | 3019.40 | 3601.10 | 2567.10 | 2999.60 | 2947.50 | 3143.10 | 3790.50 | 4163.10 | 4318.90 | 4581.20 | 4451.40 | 3522.90 | 3932.50 | 4094.30 | NA | NA | NA | 3582.00 | NA | NA | NA | NA | NA | NA | NA | NA | NA | NA | NA | NA | NA | NA | NA | NA | NA | NA | NA | NA | NA | NA | NA |
| 2023-11-30 | 2023-08-31 | 2023-05-31 | 2023-02-28 | 2022-11-30 | 2022-08-31 | 2022-05-31 | 2022-02-28 | 2021-11-30 | 2021-08-31 | 2021-05-31 | 2021-02-28 | 2020-11-30 | 2020-08-31 | 2020-05-31 | 2020-02-29 | 2019-11-30 | 2019-08-31 | 2019-05-31 | 2019-02-28 | 2018-11-30 | 2018-08-31 | 2018-05-31 | 2018-02-28 | 2017-11-30 | 2017-08-31 | 2017-05-31 | 2017-02-28 | 2016-11-30 | 2016-08-31 | 2016-05-31 | 2016-02-29 | 2015-11-30 | 2015-08-31 | 2015-05-31 | 2015-02-28 | 2014-11-30 | 2014-08-31 | 2014-05-31 | 2014-02-28 | 2013-11-30 | 2013-08-31 | 2013-05-31 | 2013-02-28 | 2012-11-30 | 2012-08-31 | 2012-05-31 | 2012-02-29 | 2011-11-30 | 2011-08-31 | 2011-05-31 | 2011-02-28 | 2010-11-30 | 2010-08-31 | 2010-05-31 | 2010-02-28 | 2009-11-30 | 2009-08-31 | ||
|---|---|---|---|---|---|---|---|---|---|---|---|---|---|---|---|---|---|---|---|---|---|---|---|---|---|---|---|---|---|---|---|---|---|---|---|---|---|---|---|---|---|---|---|---|---|---|---|---|---|---|---|---|---|---|---|---|---|---|---|
| Liabilities Current | 7254.40 | 7343.50 | 5805.40 | 5958.10 | 4753.90 | 4702.20 | 5269.20 | 5687.90 | 5221.90 | 4957.90 | 4938.20 | 5356.00 | 4380.00 | 4263.10 | 4426.90 | 5389.70 | 4823.90 | 4823.50 | 4845.00 | 6549.70 | 4306.80 | 4397.40 | 5287.20 | 4623.70 | 5501.70 | 5455.70 | 4725.10 | 5273.70 | 3784.10 | 3913.20 | 4365.90 | 5039.20 | 4009.90 | 4046.40 | 4573.00 | 5348.00 | 4279.30 | 4344.00 | 4438.90 | 5138.90 | 4119.10 | 4150.40 | 4268.20 | 5756.50 | 3888.60 | 3919.70 | 4745.70 | 4372.40 | 3248.20 | 3337.10 | 3788.30 | 4390.50 | NA | NA | 3742.20 | NA | NA | NA | |
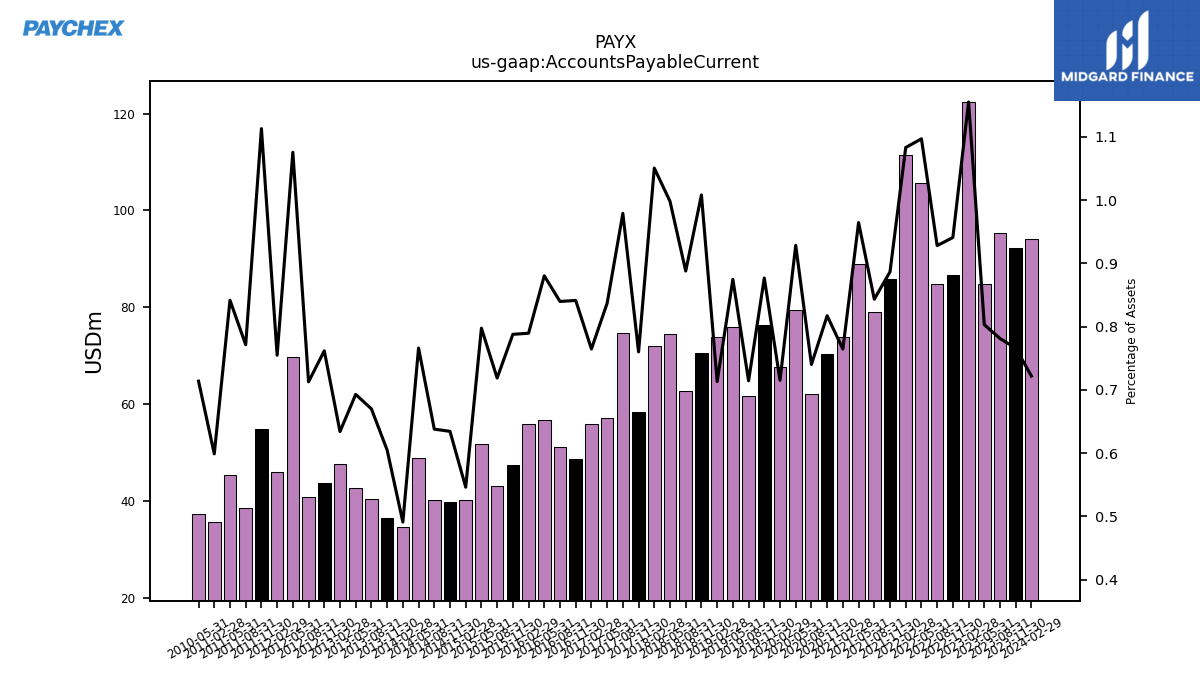
| Accounts Payable Current | 92.30 | 95.30 | 84.70 | 122.50 | 86.70 | 84.70 | 105.70 | 111.40 | 85.90 | 79.00 | 89.00 | 73.90 | 70.40 | 62.00 | 79.40 | 67.70 | 76.30 | 61.70 | 75.90 | 73.90 | 70.60 | 62.60 | 74.50 | 71.90 | 58.40 | 74.60 | 57.20 | 55.90 | 48.60 | 51.20 | 56.70 | 55.80 | 47.40 | 43.00 | 51.70 | 40.10 | 39.80 | 40.10 | 48.80 | 34.70 | 36.40 | 40.40 | 42.70 | 47.60 | 43.60 | 40.70 | 69.70 | 46.00 | 54.90 | 38.50 | 45.40 | 35.70 | NA | NA | 37.30 | NA | NA | NA | |
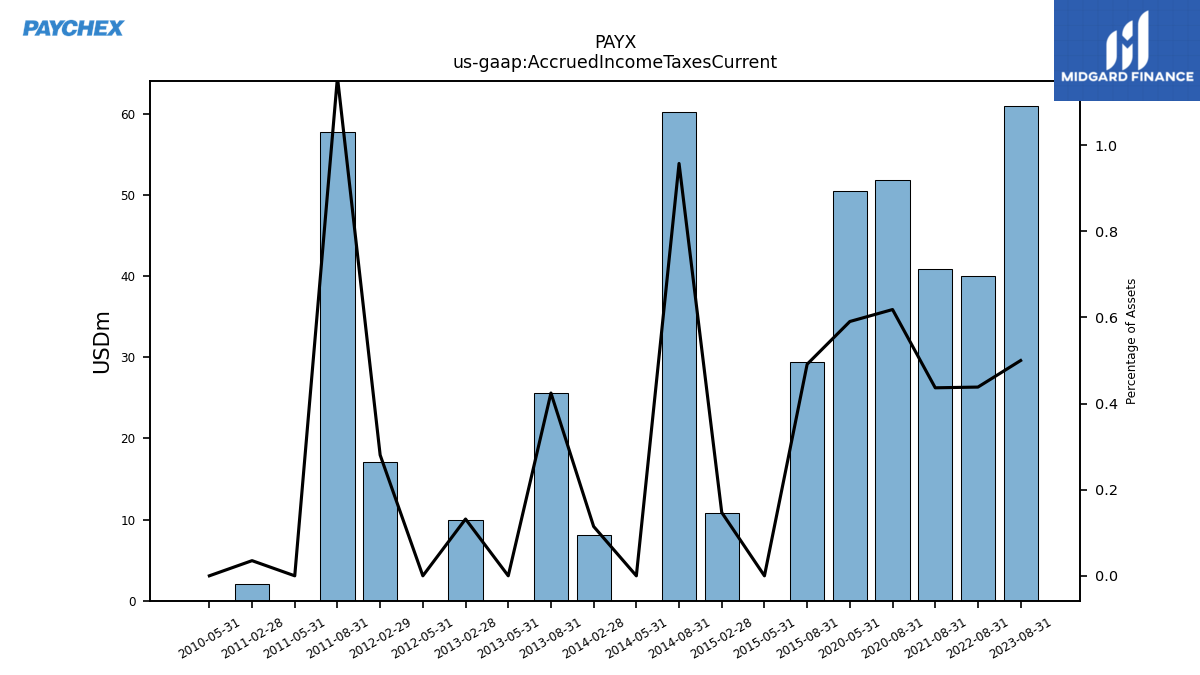
| Accrued Income Taxes Current | NA | 61.00 | NA | NA | NA | 40.00 | NA | NA | NA | 40.90 | NA | NA | NA | 51.80 | 50.50 | NA | NA | NA | NA | NA | NA | NA | NA | NA | NA | NA | NA | NA | NA | NA | NA | NA | NA | 29.40 | 0.00 | 10.80 | NA | 60.20 | 0.00 | 8.10 | NA | 25.60 | 0.00 | 9.90 | NA | NA | 0.00 | 17.10 | NA | 57.80 | 0.00 | 2.10 | NA | NA | 0.00 | NA | NA | NA | |
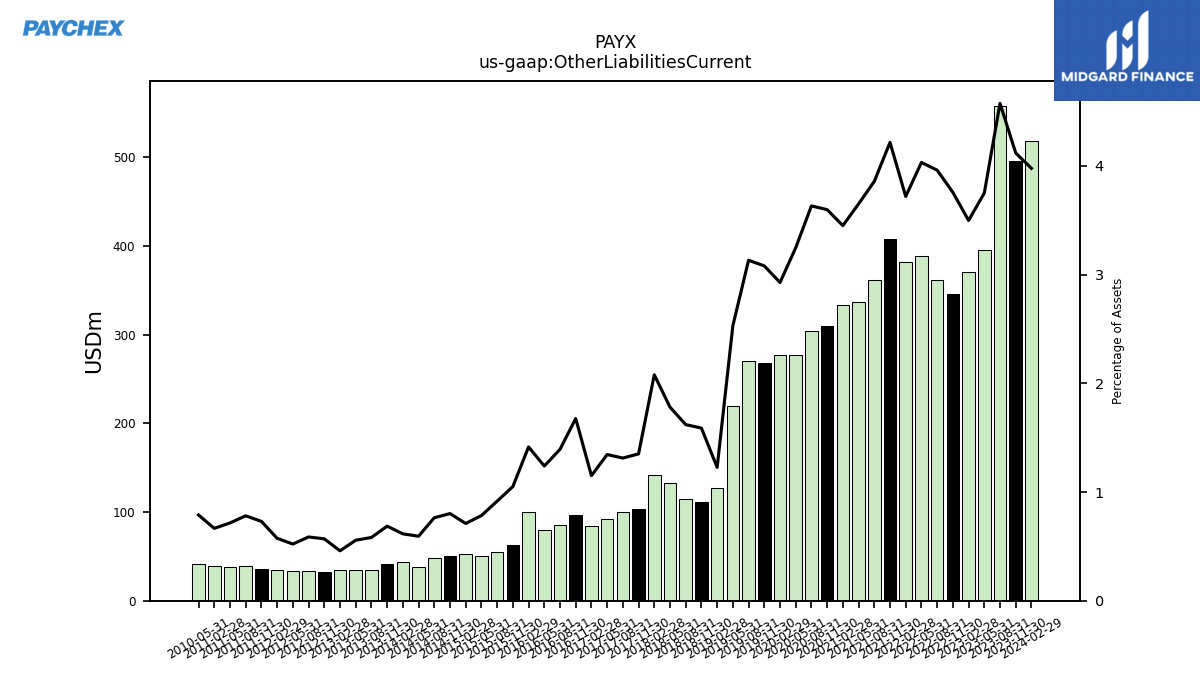
| Other Liabilities Current | 496.30 | 558.10 | 395.40 | 370.90 | 346.10 | 361.40 | 388.40 | 382.40 | 408.40 | 361.30 | 336.80 | 333.50 | 309.90 | 304.20 | 277.60 | 277.10 | 268.00 | 270.50 | 219.50 | 127.10 | 111.20 | 114.20 | 132.90 | 142.20 | 103.80 | 100.00 | 91.90 | 84.10 | 96.80 | 84.90 | 79.80 | 100.00 | 63.20 | 54.80 | 50.80 | 52.20 | 50.30 | 48.00 | 37.80 | 43.50 | 41.30 | 35.10 | 34.30 | 34.50 | 32.60 | 33.50 | 33.80 | 35.00 | 36.00 | 39.00 | 38.60 | 39.70 | NA | NA | 41.20 | NA | NA | NA | |
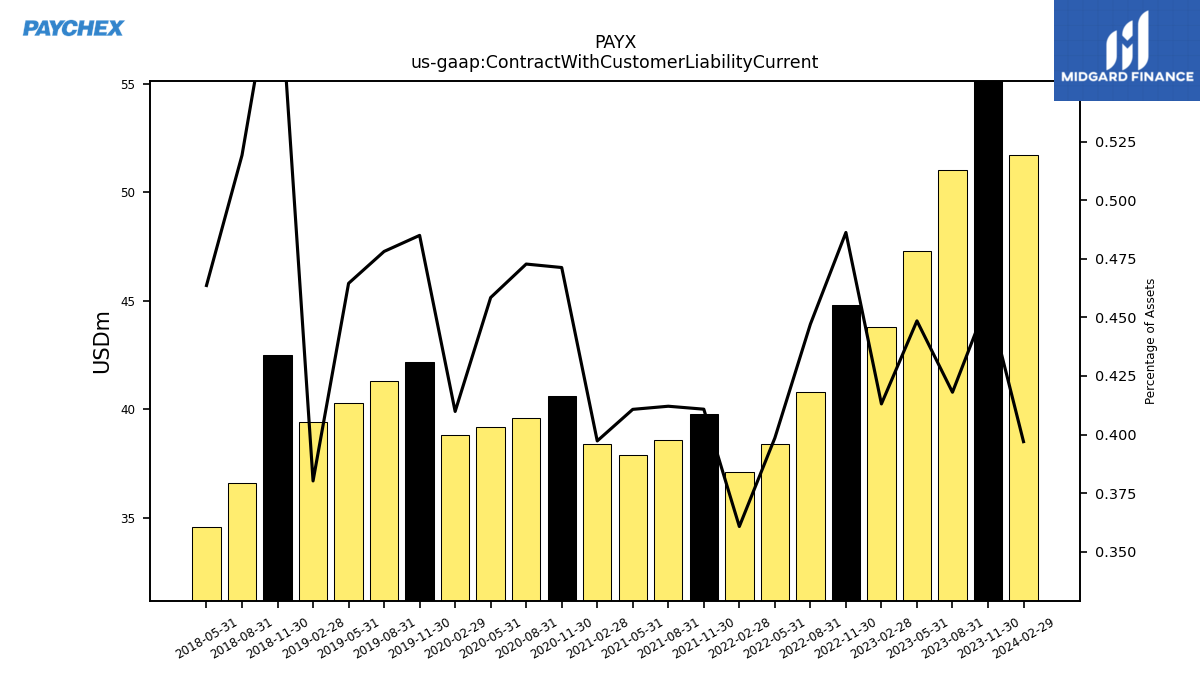
| Contract With Customer Liability Current | 55.10 | 51.00 | 47.30 | 43.80 | 44.80 | 40.80 | 38.40 | 37.10 | 39.80 | 38.60 | 37.90 | 38.40 | 40.60 | 39.60 | 39.20 | 38.80 | 42.20 | 41.30 | 40.30 | 39.40 | 42.50 | 36.60 | 34.60 | NA | NA | NA | NA | NA | NA | NA | NA | NA | NA | NA | NA | NA | NA | NA | NA | NA | NA | NA | NA | NA | NA | NA | NA | NA | NA | NA | NA | NA | NA | NA | NA | NA | NA | NA |
| 2023-11-30 | 2023-08-31 | 2023-05-31 | 2023-02-28 | 2022-11-30 | 2022-08-31 | 2022-05-31 | 2022-02-28 | 2021-11-30 | 2021-08-31 | 2021-05-31 | 2021-02-28 | 2020-11-30 | 2020-08-31 | 2020-05-31 | 2020-02-29 | 2019-11-30 | 2019-08-31 | 2019-05-31 | 2019-02-28 | 2018-11-30 | 2018-08-31 | 2018-05-31 | 2018-02-28 | 2017-11-30 | 2017-08-31 | 2017-05-31 | 2017-02-28 | 2016-11-30 | 2016-08-31 | 2016-05-31 | 2016-02-29 | 2015-11-30 | 2015-08-31 | 2015-05-31 | 2015-02-28 | 2014-11-30 | 2014-08-31 | 2014-05-31 | 2014-02-28 | 2013-11-30 | 2013-08-31 | 2013-05-31 | 2013-02-28 | 2012-11-30 | 2012-08-31 | 2012-05-31 | 2012-02-29 | 2011-11-30 | 2011-08-31 | 2011-05-31 | 2011-02-28 | 2010-11-30 | 2010-08-31 | 2010-05-31 | 2010-02-28 | 2009-11-30 | 2009-08-31 | ||
|---|---|---|---|---|---|---|---|---|---|---|---|---|---|---|---|---|---|---|---|---|---|---|---|---|---|---|---|---|---|---|---|---|---|---|---|---|---|---|---|---|---|---|---|---|---|---|---|---|---|---|---|---|---|---|---|---|---|---|---|
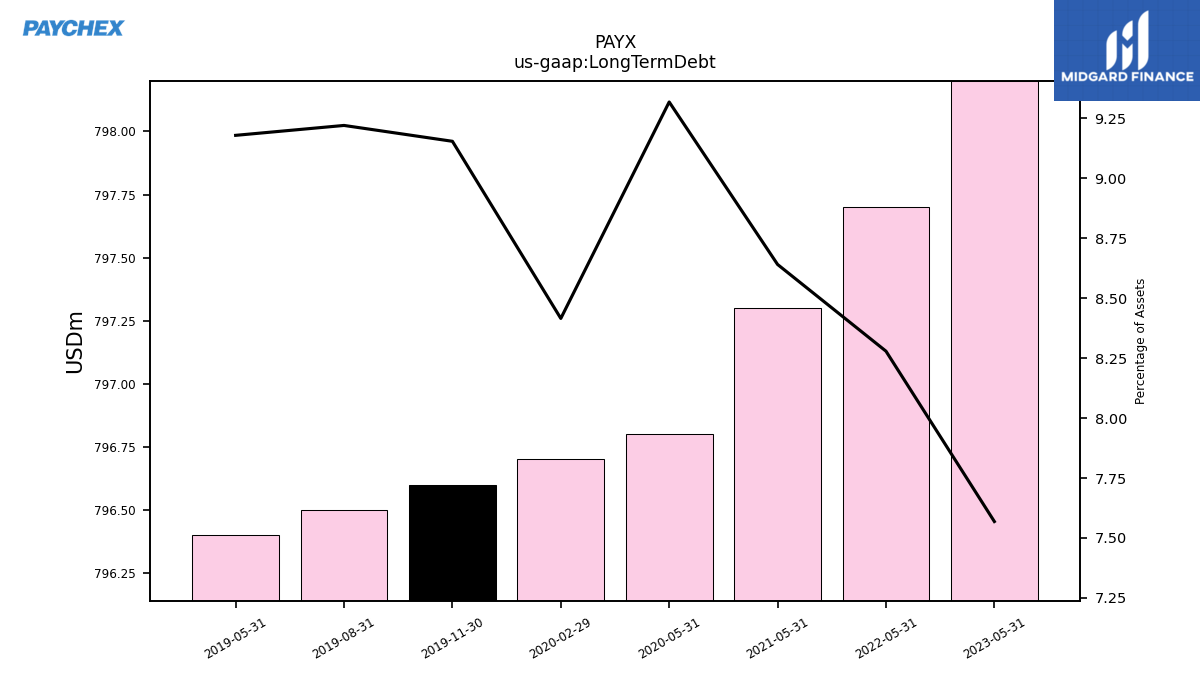
| Long Term Debt | NA | NA | 798.20 | NA | NA | NA | 797.70 | NA | NA | NA | 797.30 | NA | NA | NA | 796.80 | 796.70 | 796.60 | 796.50 | 796.40 | NA | NA | NA | NA | NA | NA | NA | NA | NA | NA | NA | NA | NA | NA | NA | NA | NA | NA | NA | NA | NA | NA | NA | NA | NA | NA | NA | NA | NA | NA | NA | NA | NA | NA | NA | NA | NA | NA | NA | |
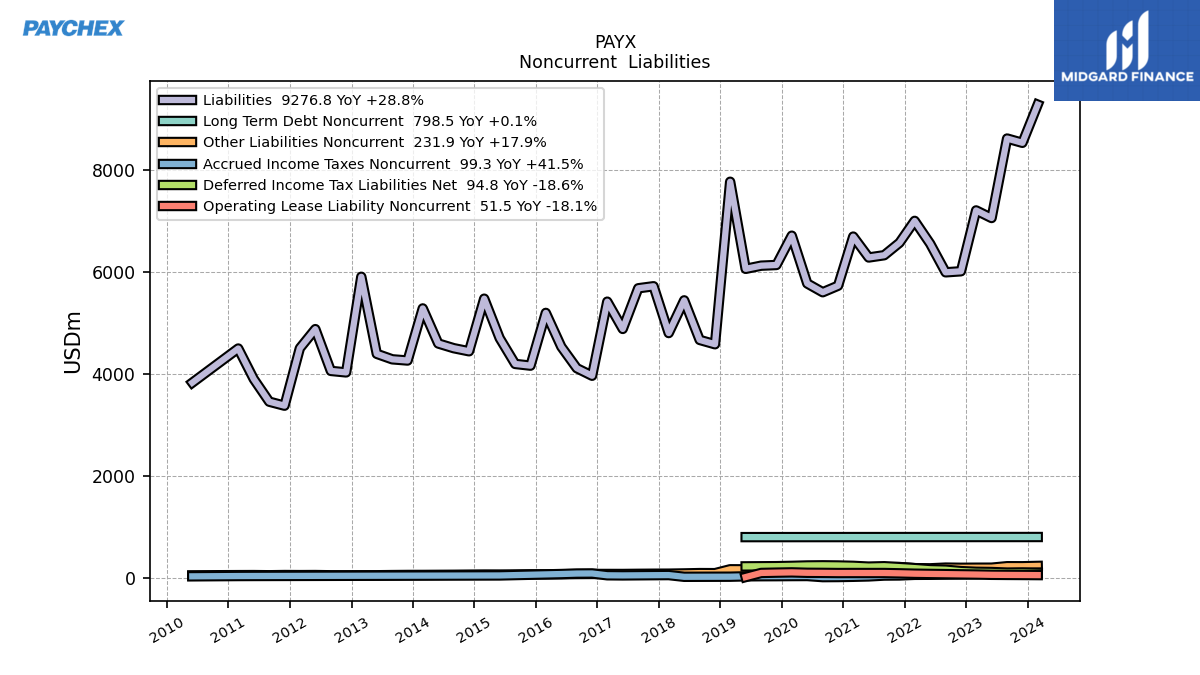
| Long Term Debt Noncurrent | 798.40 | 798.30 | 798.20 | 798.10 | 797.90 | 797.80 | 797.70 | 797.60 | 797.50 | 797.40 | 797.30 | 797.20 | 797.00 | 796.90 | 796.80 | 796.70 | 796.60 | 796.50 | 796.40 | NA | NA | NA | NA | NA | NA | NA | NA | NA | NA | NA | NA | NA | NA | NA | NA | NA | NA | NA | NA | NA | NA | NA | NA | NA | NA | NA | NA | NA | NA | NA | NA | NA | NA | NA | NA | NA | NA | NA | |
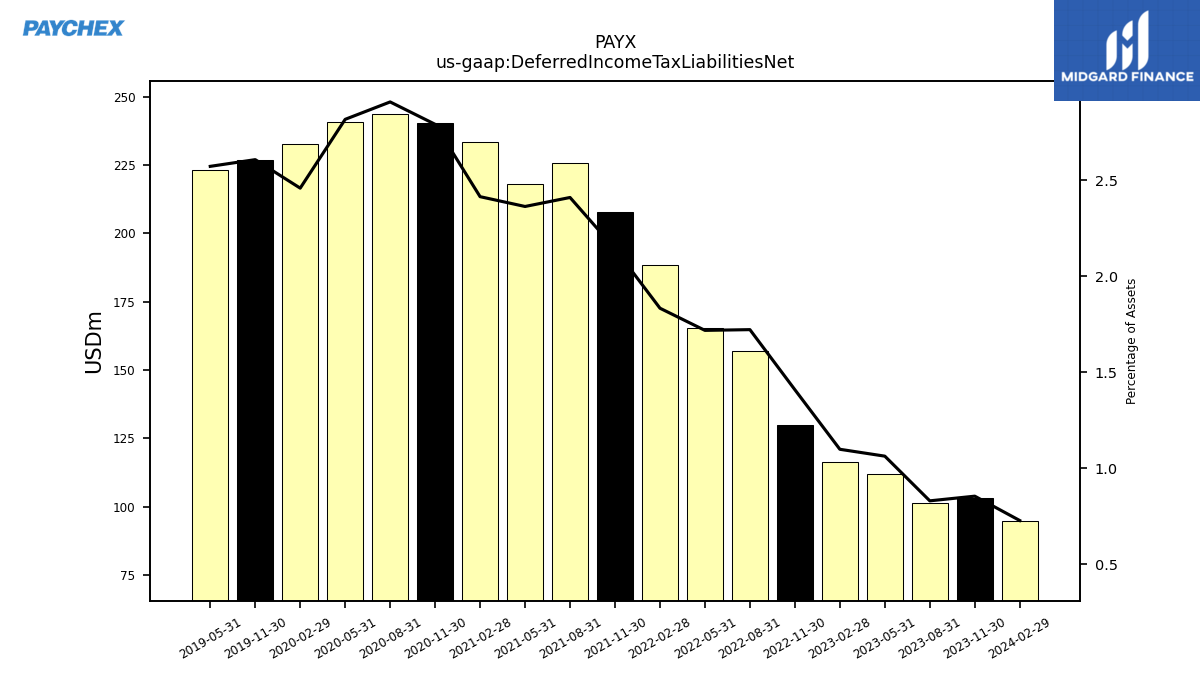
| Deferred Income Tax Liabilities Net | 103.00 | 101.30 | 112.10 | 116.50 | 129.80 | 157.10 | 165.50 | 188.50 | 207.60 | 225.70 | 218.00 | 233.30 | 240.40 | 243.50 | 240.80 | 232.70 | 226.80 | NA | 223.10 | NA | NA | NA | NA | NA | NA | NA | NA | NA | NA | NA | NA | NA | NA | NA | NA | NA | NA | NA | NA | NA | NA | NA | NA | NA | NA | NA | NA | NA | NA | NA | NA | NA | NA | NA | NA | NA | NA | NA | |
| Other Liabilities Noncurrent | 225.20 | 225.90 | 197.20 | 196.70 | 195.00 | 198.70 | 184.70 | 187.60 | 210.00 | 207.90 | 207.50 | 191.80 | 202.50 | 187.70 | 174.40 | 150.30 | 154.30 | 147.80 | 164.70 | 165.70 | 89.80 | 91.00 | 84.80 | 79.90 | 78.90 | 76.70 | 73.80 | 74.20 | 74.20 | 72.30 | 68.30 | 66.10 | 67.00 | 64.40 | 62.40 | 62.90 | 60.70 | 58.10 | 56.60 | 55.10 | 54.60 | 52.30 | 48.80 | 48.50 | 48.10 | 48.30 | 52.90 | 51.50 | 53.00 | 48.90 | 52.10 | 51.20 | NA | NA | 46.90 | NA | NA | NA | |
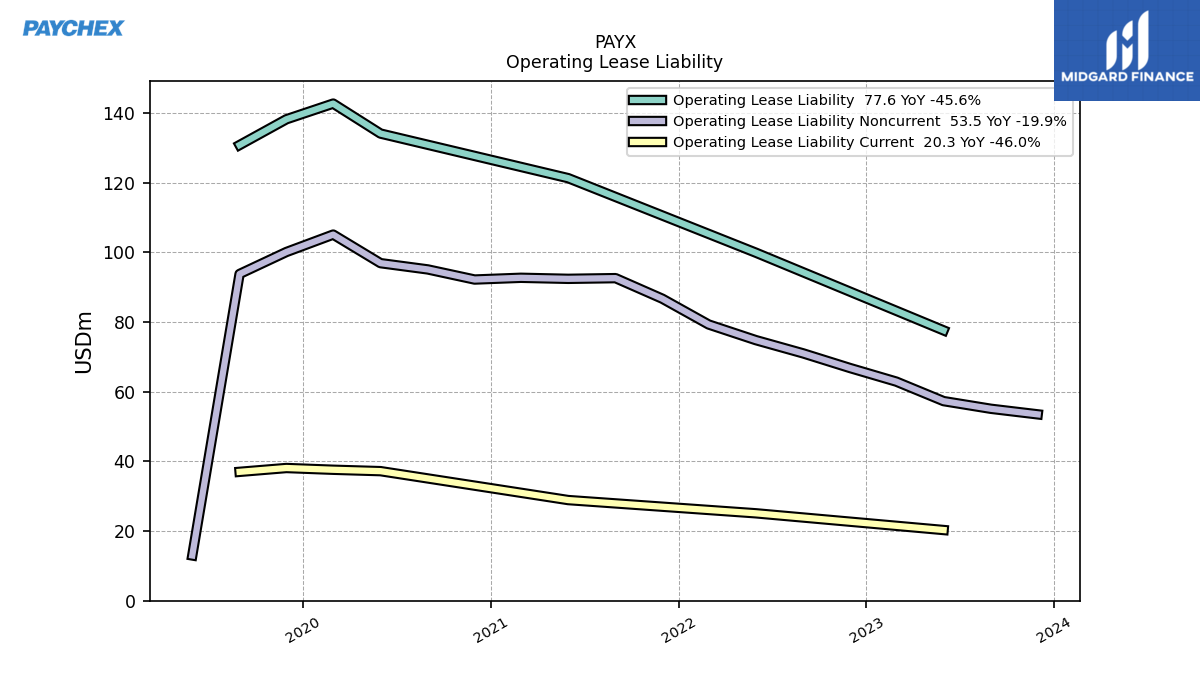
| Operating Lease Liability Noncurrent | 53.50 | 55.10 | 57.30 | 62.90 | 66.80 | 71.00 | 74.80 | 79.30 | 86.70 | 92.60 | 92.40 | 92.70 | 92.20 | 95.10 | 96.90 | 105.10 | 100.10 | 93.80 | 13.00 | NA | NA | NA | NA | NA | NA | NA | NA | NA | NA | NA | NA | NA | NA | NA | NA | NA | NA | NA | NA | NA | NA | NA | NA | NA | NA | NA | NA | NA | NA | NA | NA | NA | NA | NA | NA | NA | NA | NA |
| 2023-11-30 | 2023-08-31 | 2023-05-31 | 2023-02-28 | 2022-11-30 | 2022-08-31 | 2022-05-31 | 2022-02-28 | 2021-11-30 | 2021-08-31 | 2021-05-31 | 2021-02-28 | 2020-11-30 | 2020-08-31 | 2020-05-31 | 2020-02-29 | 2019-11-30 | 2019-08-31 | 2019-05-31 | 2019-02-28 | 2018-11-30 | 2018-08-31 | 2018-05-31 | 2018-02-28 | 2017-11-30 | 2017-08-31 | 2017-05-31 | 2017-02-28 | 2016-11-30 | 2016-08-31 | 2016-05-31 | 2016-02-29 | 2015-11-30 | 2015-08-31 | 2015-05-31 | 2015-02-28 | 2014-11-30 | 2014-08-31 | 2014-05-31 | 2014-02-28 | 2013-11-30 | 2013-08-31 | 2013-05-31 | 2013-02-28 | 2012-11-30 | 2012-08-31 | 2012-05-31 | 2012-02-29 | 2011-11-30 | 2011-08-31 | 2011-05-31 | 2011-02-28 | 2010-11-30 | 2010-08-31 | 2010-05-31 | 2010-02-28 | 2009-11-30 | 2009-08-31 | ||
|---|---|---|---|---|---|---|---|---|---|---|---|---|---|---|---|---|---|---|---|---|---|---|---|---|---|---|---|---|---|---|---|---|---|---|---|---|---|---|---|---|---|---|---|---|---|---|---|---|---|---|---|---|---|---|---|---|---|---|---|
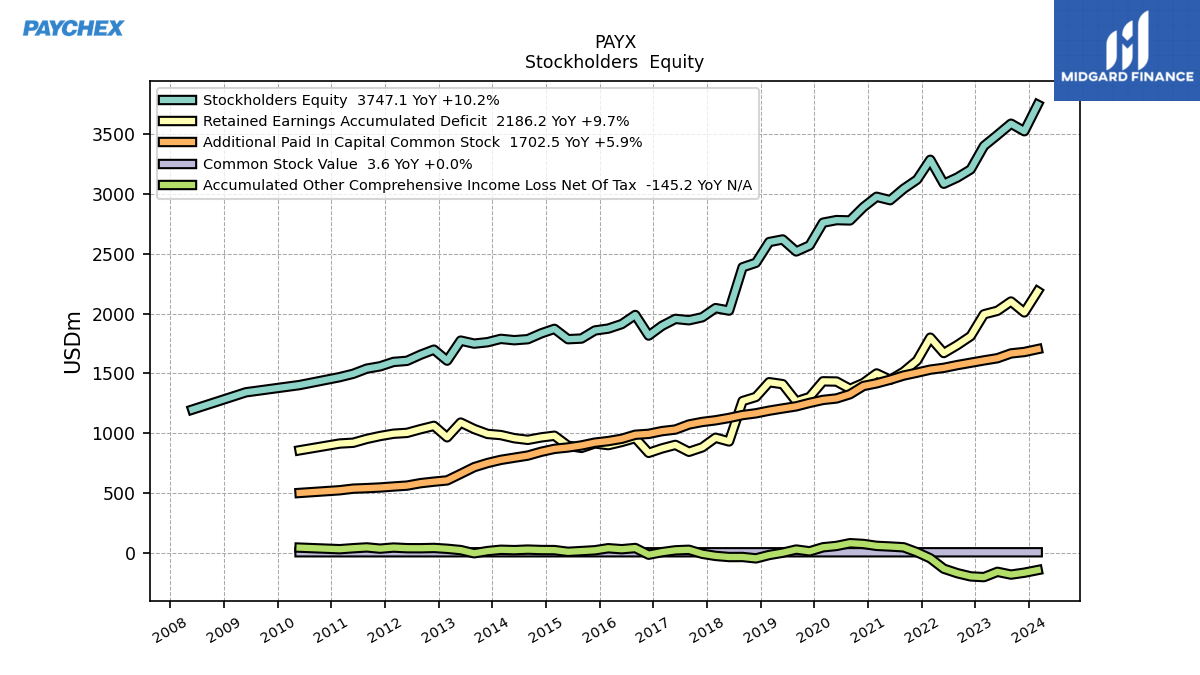
| Stockholders Equity | 3524.40 | 3587.80 | 3493.20 | 3401.10 | 3205.30 | 3137.40 | 3085.20 | 3286.00 | 3119.80 | 3043.50 | 2948.00 | 2976.40 | 2889.70 | 2778.60 | 2781.40 | 2759.80 | 2569.40 | 2519.30 | 2619.50 | 2598.00 | 2424.50 | 2387.00 | 2024.50 | 2045.50 | 1968.90 | 1943.80 | 1955.30 | 1896.70 | 1815.60 | 1988.10 | 1911.70 | 1874.10 | 1858.30 | 1790.80 | 1785.50 | 1872.00 | 1834.30 | 1785.60 | 1777.00 | 1788.20 | 1760.40 | 1748.40 | 1773.70 | 1605.90 | 1698.20 | 1655.40 | 1604.50 | 1595.40 | 1558.70 | 1539.30 | 1496.20 | 1468.20 | NA | NA | 1402.00 | NA | NA | NA | |
| Common Stock Value | 3.60 | 3.60 | 3.60 | 3.60 | 3.60 | 3.60 | 3.60 | 3.60 | 3.60 | 3.60 | 3.60 | 3.60 | 3.60 | 3.60 | 3.60 | 3.60 | 3.60 | 3.60 | 3.60 | 3.60 | 3.60 | 3.60 | 3.60 | 3.60 | 3.60 | 3.60 | 3.60 | 3.60 | 3.60 | 3.60 | 3.60 | 3.60 | 3.60 | 3.60 | 3.60 | 3.60 | 3.60 | 3.60 | 3.60 | 3.60 | 3.60 | 3.70 | 3.70 | 3.60 | 3.60 | 3.60 | 3.60 | 3.60 | 3.60 | 3.60 | 3.60 | 3.60 | NA | NA | 3.60 | NA | NA | NA | |
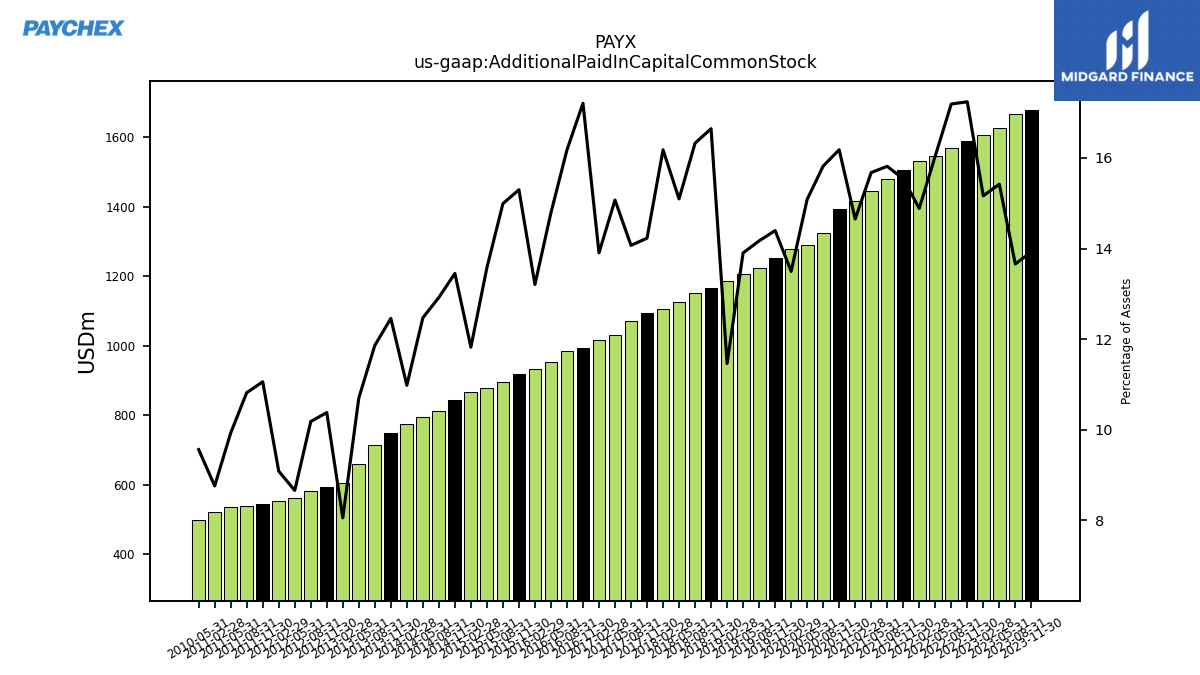
| Additional Paid In Capital Common Stock | 1678.60 | 1666.40 | 1626.40 | 1608.00 | 1588.60 | 1568.90 | 1545.90 | 1530.90 | 1505.50 | 1481.50 | 1446.70 | 1416.30 | 1394.10 | 1325.30 | 1289.90 | 1277.70 | 1252.80 | 1224.00 | 1206.30 | 1187.90 | 1165.70 | 1151.10 | 1126.80 | 1107.20 | 1093.50 | 1072.10 | 1030.00 | 1016.60 | 993.90 | 986.40 | 952.70 | 933.40 | 920.50 | 897.00 | 880.10 | 868.30 | 844.00 | 812.30 | 794.40 | 776.30 | 749.90 | 715.40 | 659.50 | 604.70 | 594.10 | 581.50 | 561.10 | 553.70 | 545.40 | 540.00 | 535.60 | 522.30 | NA | NA | 499.70 | NA | NA | NA | |
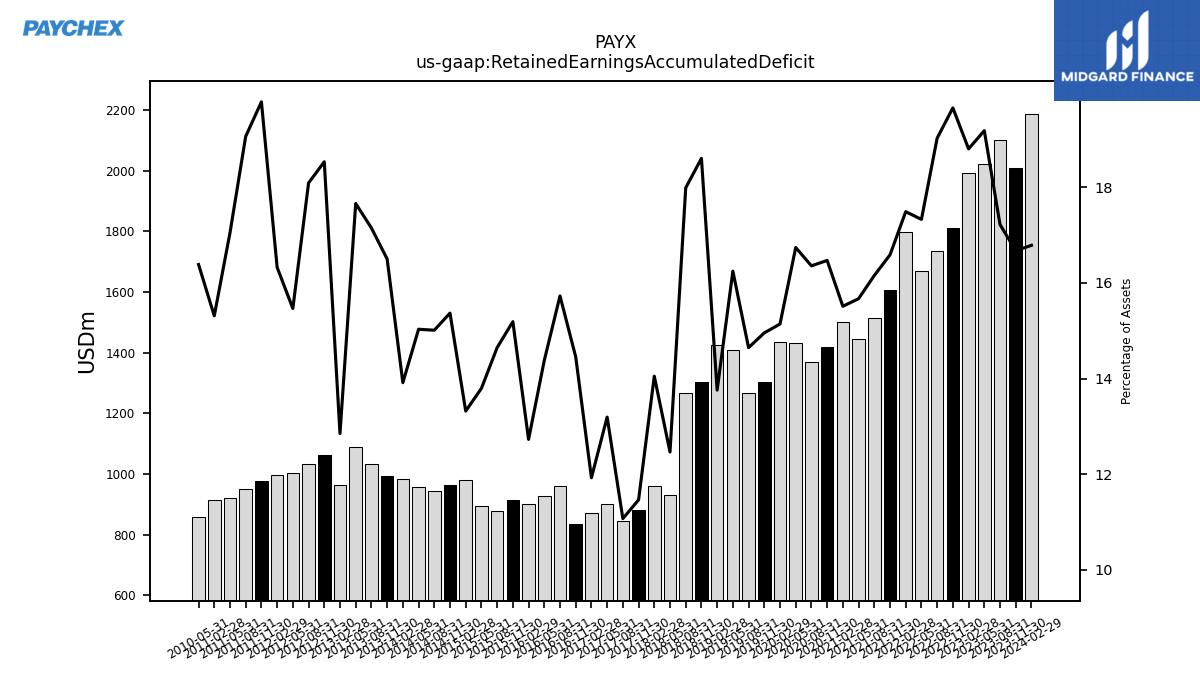
| Retained Earnings Accumulated Deficit | 2009.40 | 2100.90 | 2023.10 | 1993.70 | 1811.40 | 1736.30 | 1669.60 | 1798.50 | 1606.90 | 1513.30 | 1445.90 | 1499.30 | 1418.90 | 1370.20 | 1431.40 | 1433.30 | 1301.40 | 1265.20 | 1409.50 | 1425.80 | 1302.60 | 1268.10 | 930.30 | 961.40 | 881.00 | 843.70 | 901.70 | 871.90 | 834.90 | 958.90 | 926.20 | 899.60 | 913.90 | 876.40 | 894.30 | 978.30 | 964.30 | 943.70 | 957.50 | 983.70 | 993.20 | 1034.20 | 1088.50 | 964.90 | 1060.80 | 1033.00 | 1002.10 | 995.00 | 975.80 | 951.50 | 919.50 | 913.00 | NA | NA | 856.30 | NA | NA | NA | |
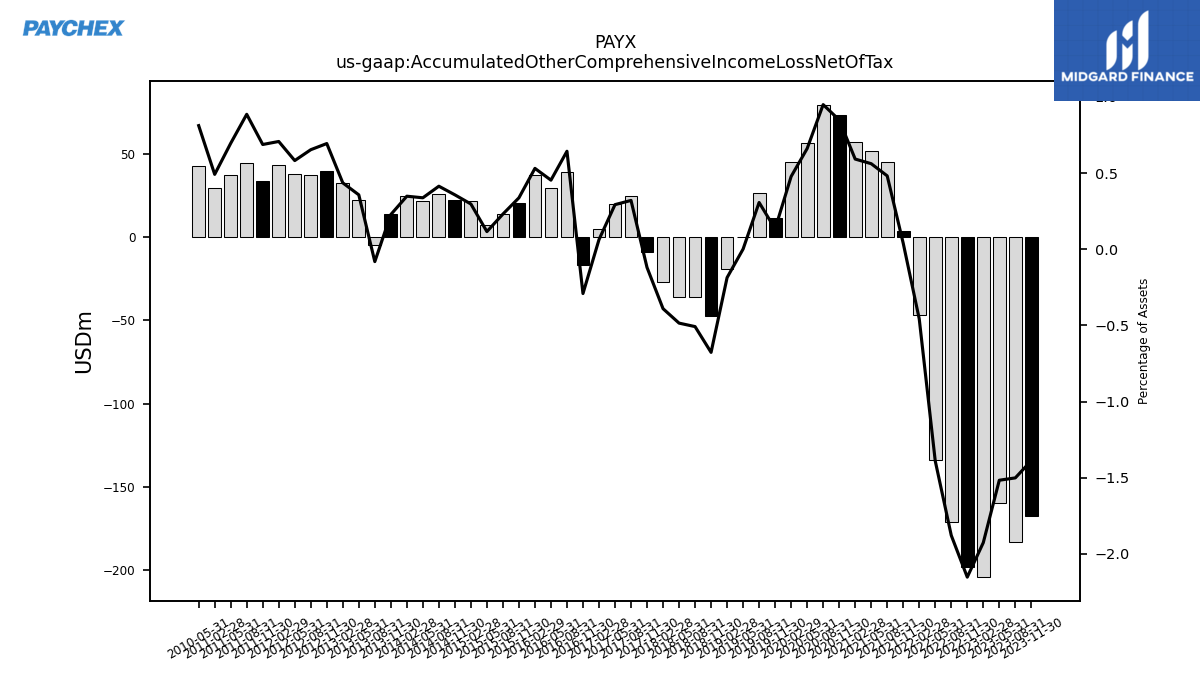
| Accumulated Other Comprehensive Income Loss Net Of Tax | -167.20 | -183.10 | -159.90 | -204.20 | -198.30 | -171.40 | -133.90 | -47.00 | 3.80 | 45.10 | 51.80 | 57.20 | 73.10 | 79.50 | 56.50 | 45.20 | 11.60 | 26.50 | 0.10 | -19.30 | -47.40 | -35.80 | -36.20 | -26.70 | -9.20 | 24.40 | 20.00 | 4.60 | -16.80 | 39.20 | 29.20 | 37.50 | 20.30 | 13.80 | 7.50 | 21.80 | 22.40 | 26.00 | 21.50 | 24.60 | 13.70 | -4.90 | 22.00 | 32.70 | 39.70 | 37.30 | 37.70 | 43.10 | 33.90 | 44.20 | 37.50 | 29.30 | NA | NA | 42.40 | NA | NA | NA | |
| Adjustments To Additional Paid In Capital Sharebased Compensation Requisite Service Period Recognition Value | 14.70 | 16.00 | 16.60 | 16.30 | 15.30 | 14.40 | 13.60 | 12.80 | 14.00 | 12.40 | 14.40 | 12.60 | 12.20 | 13.30 | 10.90 | 12.70 | 13.30 | 10.50 | 12.60 | 10.80 | 11.90 | 10.90 | 15.20 | 10.30 | NA | NA | NA | NA | NA | NA | NA | NA | NA | NA | NA | NA | NA | NA | NA | NA | NA | NA | NA | NA | NA | NA | NA | NA | NA | NA | NA | NA | NA | NA | NA | NA | NA | NA |
| 2023-11-30 | 2023-08-31 | 2023-05-31 | 2023-02-28 | 2022-11-30 | 2022-08-31 | 2022-05-31 | 2022-02-28 | 2021-11-30 | 2021-08-31 | 2021-05-31 | 2021-02-28 | 2020-11-30 | 2020-08-31 | 2020-05-31 | 2020-02-29 | 2019-11-30 | 2019-08-31 | 2019-05-31 | 2019-02-28 | 2018-11-30 | 2018-08-31 | 2018-05-31 | 2018-02-28 | 2017-11-30 | 2017-08-31 | 2017-05-31 | 2017-02-28 | 2016-11-30 | 2016-08-31 | 2016-05-31 | 2016-02-29 | 2015-11-30 | 2015-08-31 | 2015-05-31 | 2015-02-28 | 2014-11-30 | 2014-08-31 | 2014-05-31 | 2014-02-28 | 2013-11-30 | 2013-08-31 | 2013-05-31 | 2013-02-28 | 2012-11-30 | 2012-08-31 | 2012-05-31 | 2012-02-29 | 2011-11-30 | 2011-08-31 | 2011-05-31 | 2011-02-28 | 2010-11-30 | 2010-08-31 | 2010-05-31 | 2010-02-28 | 2009-11-30 | 2009-08-31 | ||
|---|---|---|---|---|---|---|---|---|---|---|---|---|---|---|---|---|---|---|---|---|---|---|---|---|---|---|---|---|---|---|---|---|---|---|---|---|---|---|---|---|---|---|---|---|---|---|---|---|---|---|---|---|---|---|---|---|---|---|---|
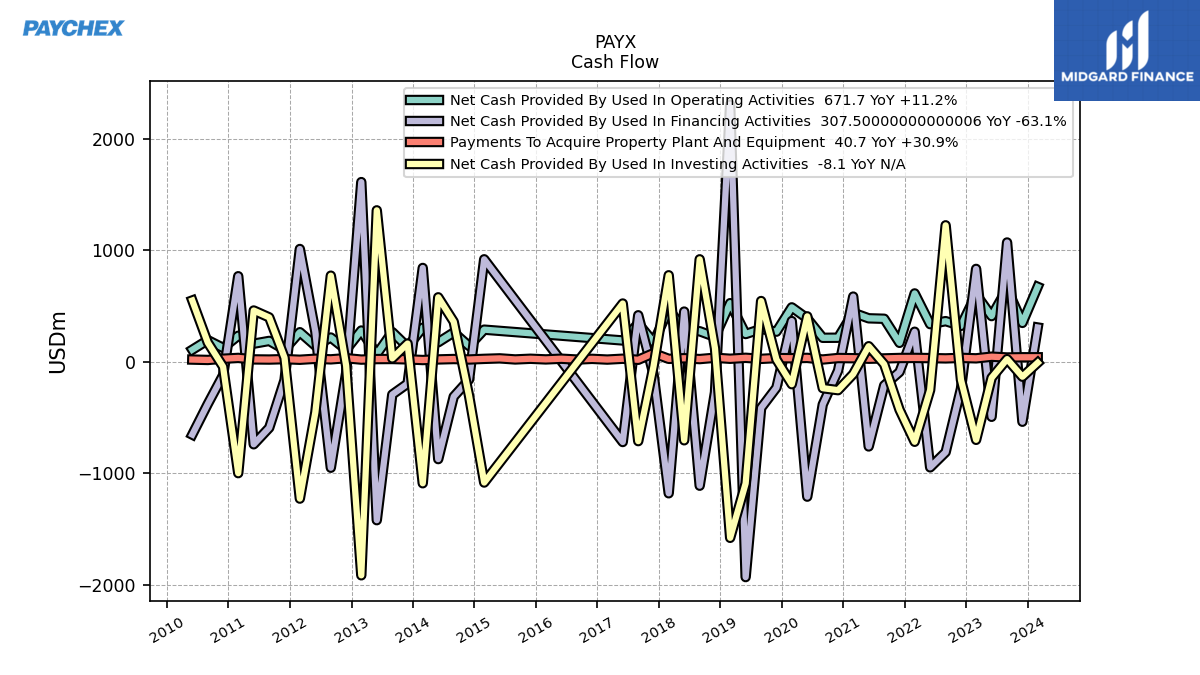
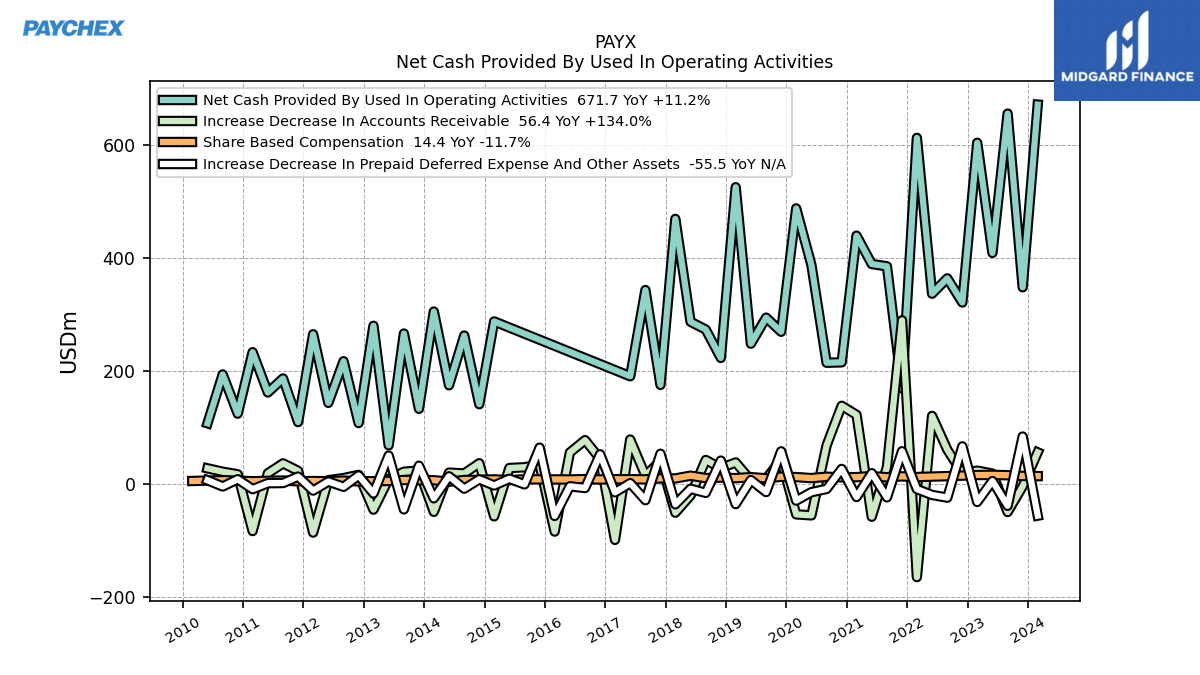
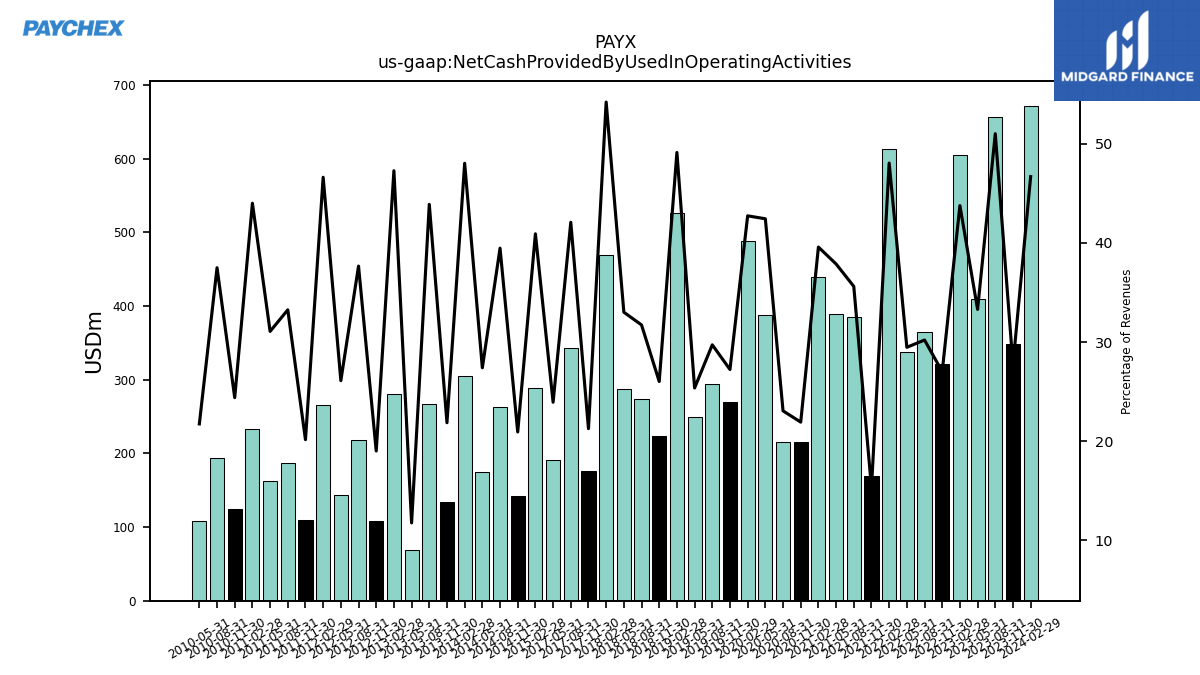
| Net Cash Provided By Used In Operating Activities | 348.50 | 655.80 | 409.30 | 604.20 | 321.60 | 364.30 | 337.20 | 612.90 | 169.80 | 385.60 | 389.70 | 439.90 | 215.70 | 215.00 | 388.20 | 488.10 | 269.80 | 294.80 | 248.70 | 525.60 | 223.50 | 273.70 | 287.50 | 469.50 | 175.80 | 343.60 | 191.10 | NA | NA | NA | NA | NA | NA | NA | NA | 288.10 | 141.60 | 263.10 | 175.10 | 305.60 | 133.50 | 266.70 | 68.90 | 280.40 | 108.30 | 217.70 | 144.00 | 265.40 | 110.00 | 187.20 | 162.40 | 233.70 | 124.90 | 194.30 | 107.90 | NA | NA | NA | |
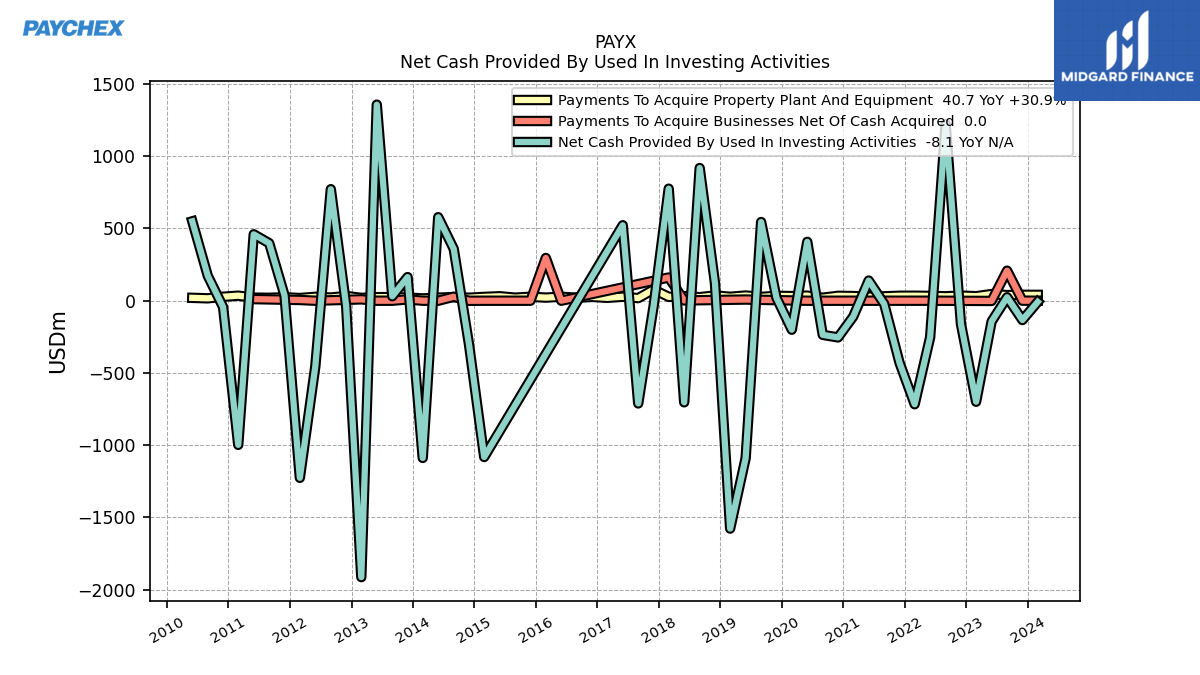
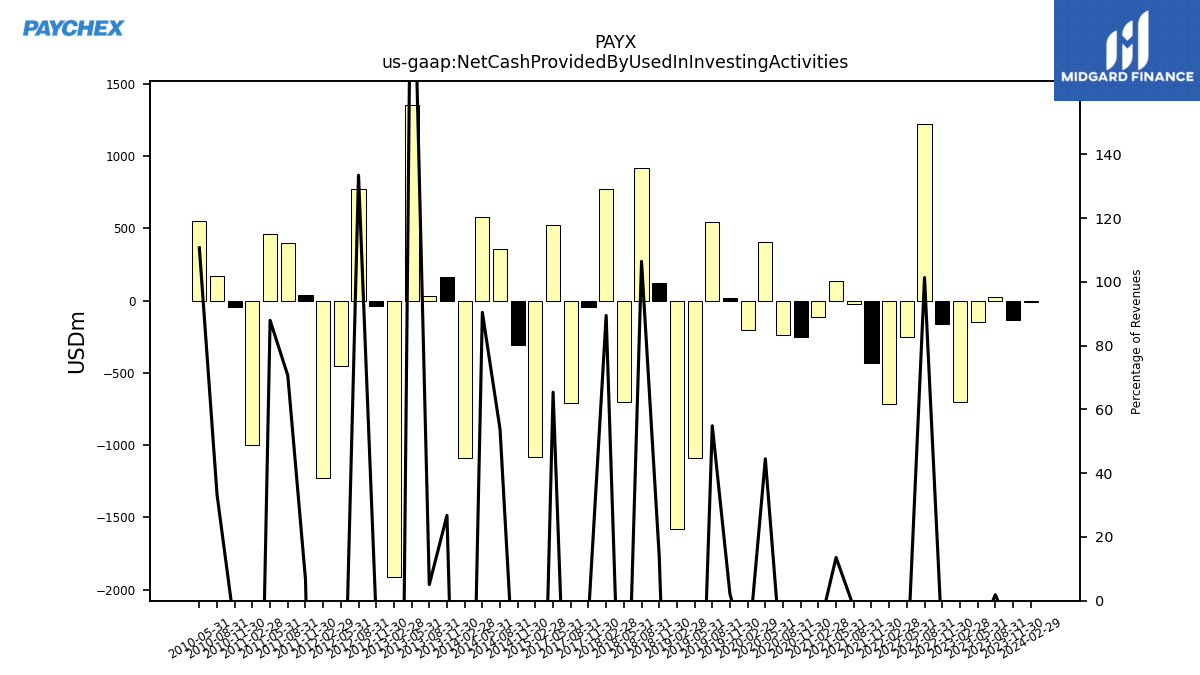
| Net Cash Provided By Used In Investing Activities | -133.70 | 24.00 | -143.90 | -699.20 | -161.50 | 1223.10 | -252.80 | -716.70 | -429.10 | -22.30 | 139.70 | -109.90 | -254.10 | -236.30 | 407.50 | -200.80 | 20.50 | 544.70 | -1089.70 | -1577.40 | 120.30 | 918.50 | -703.40 | 775.50 | -40.10 | -711.00 | 522.50 | NA | NA | NA | NA | NA | NA | NA | NA | -1081.90 | -304.20 | 358.90 | 578.10 | -1088.50 | 163.50 | 30.80 | 1357.30 | -1913.20 | -34.30 | 771.90 | -453.10 | -1226.00 | 36.80 | 398.00 | 459.80 | -997.90 | -43.90 | 172.50 | 549.50 | NA | NA | NA | |
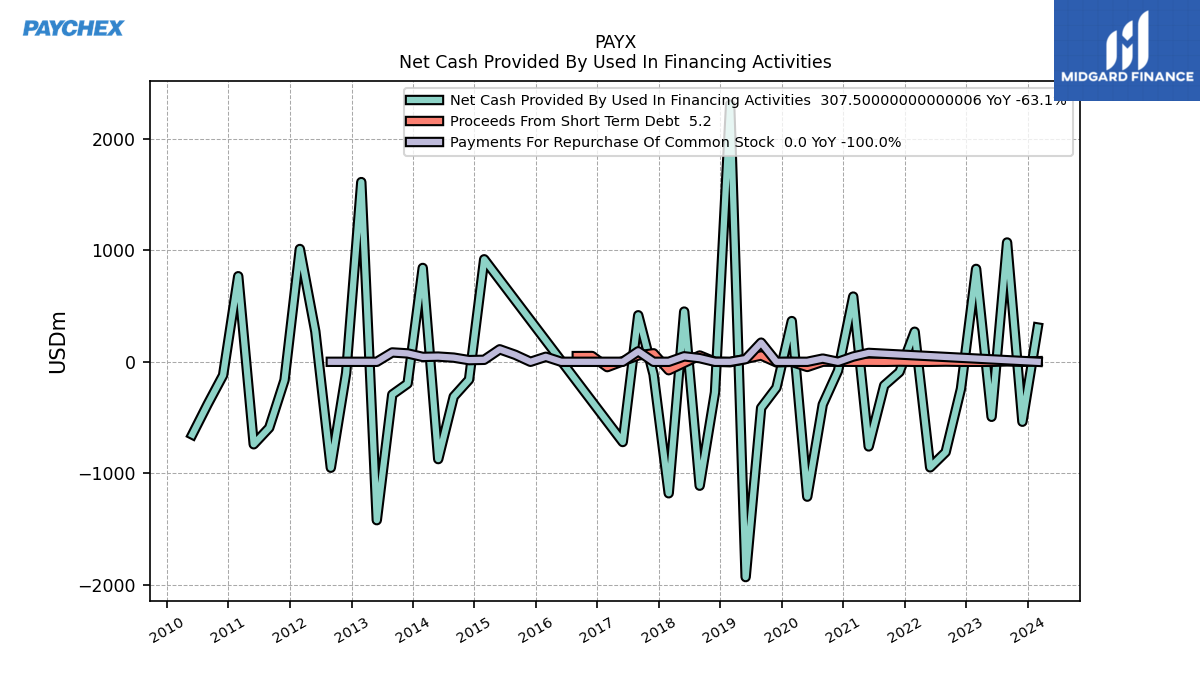
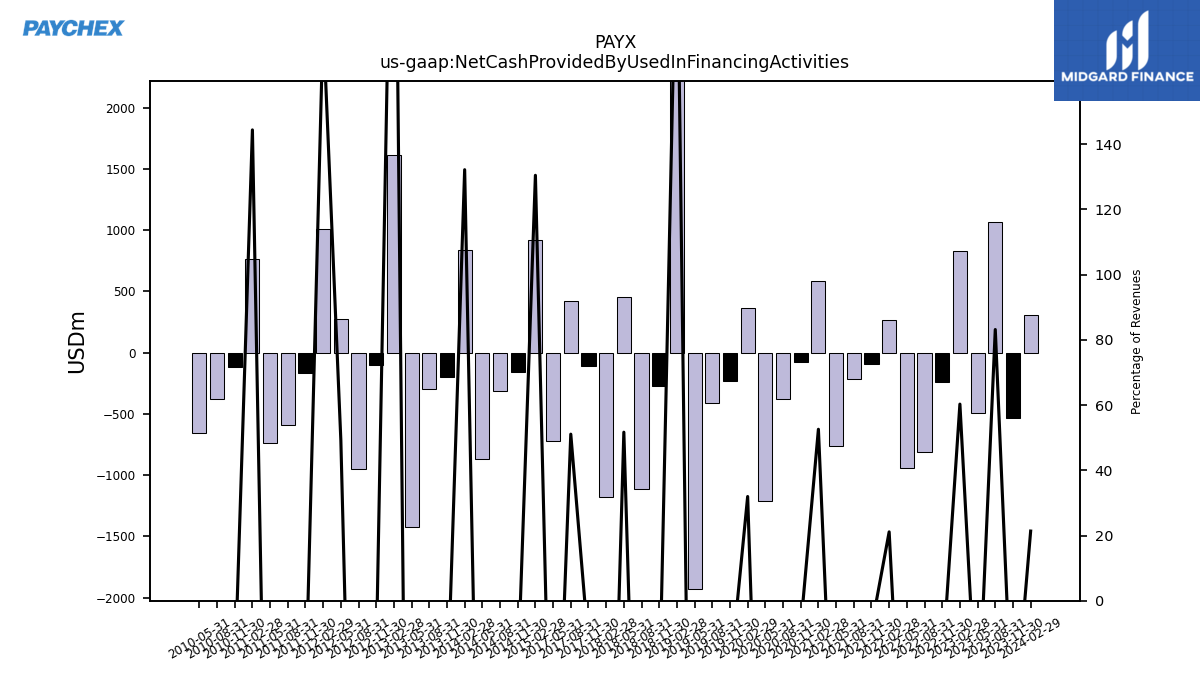
| Net Cash Provided By Used In Financing Activities | -537.10 | 1069.40 | -492.90 | 832.60 | -241.40 | -809.70 | -945.90 | 269.50 | -91.20 | -211.70 | -758.50 | 584.50 | -79.60 | -382.80 | -1208.40 | 365.20 | -231.80 | -413.20 | -1929.30 | 2304.40 | -273.30 | -1110.30 | 450.20 | -1178.30 | -112.90 | 417.20 | -718.90 | NA | NA | NA | NA | NA | NA | NA | NA | 918.70 | -159.60 | -311.90 | -872.00 | 841.20 | -195.60 | -293.20 | -1419.30 | 1610.60 | -100.40 | -949.40 | 271.40 | 1011.00 | -163.80 | -591.10 | -739.20 | 767.00 | -120.70 | -378.20 | -652.40 | NA | NA | NA |
| 2023-11-30 | 2023-08-31 | 2023-05-31 | 2023-02-28 | 2022-11-30 | 2022-08-31 | 2022-05-31 | 2022-02-28 | 2021-11-30 | 2021-08-31 | 2021-05-31 | 2021-02-28 | 2020-11-30 | 2020-08-31 | 2020-05-31 | 2020-02-29 | 2019-11-30 | 2019-08-31 | 2019-05-31 | 2019-02-28 | 2018-11-30 | 2018-08-31 | 2018-05-31 | 2018-02-28 | 2017-11-30 | 2017-08-31 | 2017-05-31 | 2017-02-28 | 2016-11-30 | 2016-08-31 | 2016-05-31 | 2016-02-29 | 2015-11-30 | 2015-08-31 | 2015-05-31 | 2015-02-28 | 2014-11-30 | 2014-08-31 | 2014-05-31 | 2014-02-28 | 2013-11-30 | 2013-08-31 | 2013-05-31 | 2013-02-28 | 2012-11-30 | 2012-08-31 | 2012-05-31 | 2012-02-29 | 2011-11-30 | 2011-08-31 | 2011-05-31 | 2011-02-28 | 2010-11-30 | 2010-08-31 | 2010-05-31 | 2010-02-28 | 2009-11-30 | 2009-08-31 | ||
|---|---|---|---|---|---|---|---|---|---|---|---|---|---|---|---|---|---|---|---|---|---|---|---|---|---|---|---|---|---|---|---|---|---|---|---|---|---|---|---|---|---|---|---|---|---|---|---|---|---|---|---|---|---|---|---|---|---|---|---|
| Net Cash Provided By Used In Operating Activities | 348.50 | 655.80 | 409.30 | 604.20 | 321.60 | 364.30 | 337.20 | 612.90 | 169.80 | 385.60 | 389.70 | 439.90 | 215.70 | 215.00 | 388.20 | 488.10 | 269.80 | 294.80 | 248.70 | 525.60 | 223.50 | 273.70 | 287.50 | 469.50 | 175.80 | 343.60 | 191.10 | NA | NA | NA | NA | NA | NA | NA | NA | 288.10 | 141.60 | 263.10 | 175.10 | 305.60 | 133.50 | 266.70 | 68.90 | 280.40 | 108.30 | 217.70 | 144.00 | 265.40 | 110.00 | 187.20 | 162.40 | 233.70 | 124.90 | 194.30 | 107.90 | NA | NA | NA | |
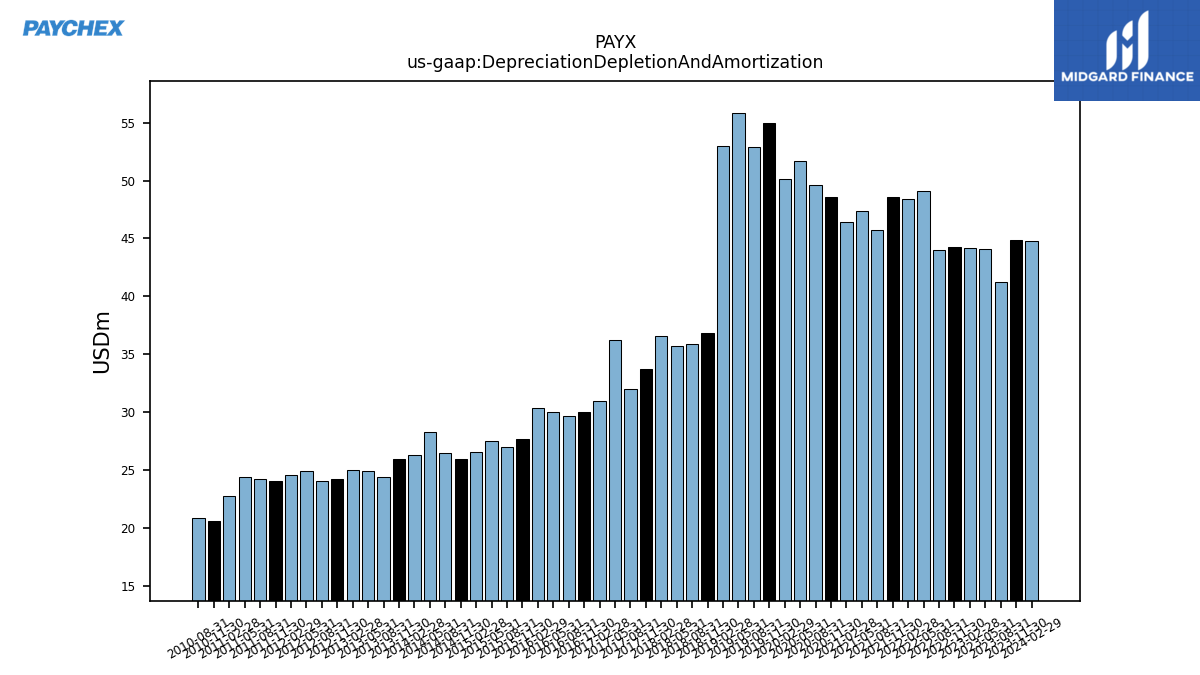
| Depreciation Depletion And Amortization | 44.90 | 41.20 | 44.10 | 44.20 | 44.30 | 44.00 | 49.10 | 48.40 | 48.60 | 45.70 | 47.40 | 46.40 | 48.60 | 49.60 | 51.70 | 50.10 | 55.00 | 52.90 | 55.80 | 53.00 | 36.80 | 35.90 | 35.70 | 36.60 | 33.70 | 32.00 | 36.20 | 31.00 | 30.00 | 29.70 | 30.00 | 30.40 | 27.70 | 27.00 | 27.50 | 26.60 | 26.00 | 26.50 | 28.30 | 26.30 | 26.00 | 24.40 | 24.90 | 25.00 | 24.20 | 24.10 | 24.90 | 24.60 | 24.10 | 24.20 | 24.40 | 22.80 | 20.60 | 20.90 | NA | NA | NA | NA | |
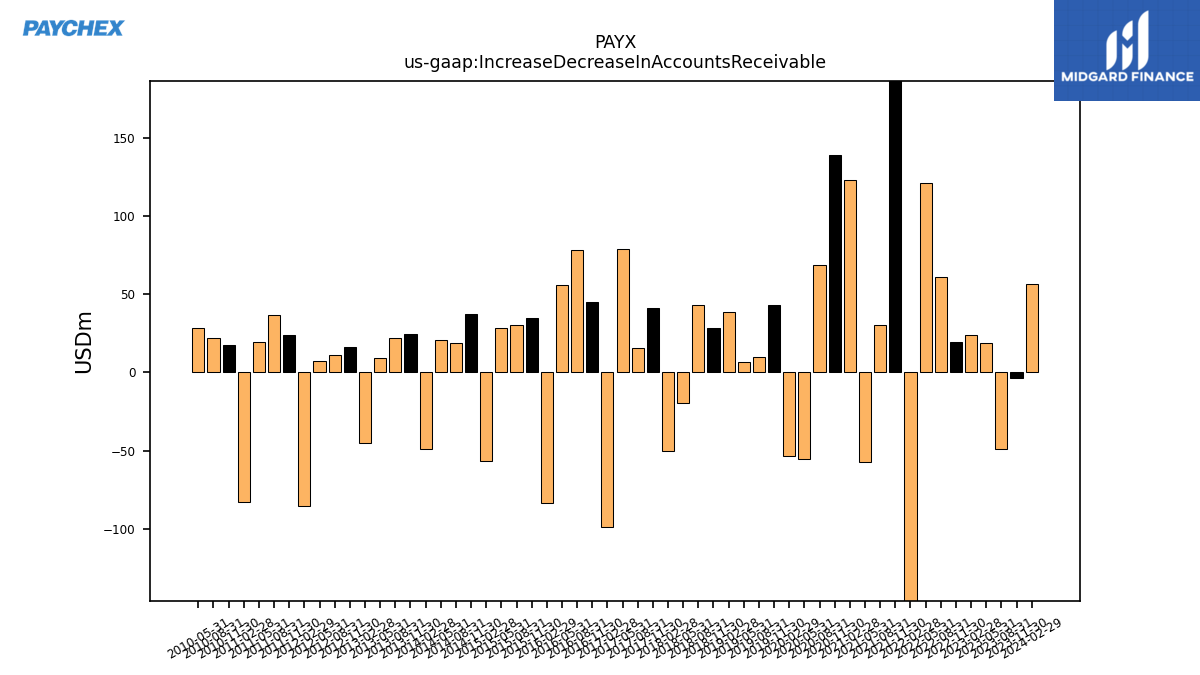
| Increase Decrease In Accounts Receivable | -3.80 | -49.10 | 18.90 | 24.10 | 19.40 | 61.20 | 120.90 | -164.30 | 290.00 | 30.40 | -57.50 | 122.80 | 138.80 | 68.80 | -55.00 | -53.30 | 43.40 | 9.80 | 7.00 | 38.60 | 28.60 | 43.00 | -19.80 | -50.30 | 41.10 | 15.40 | 79.10 | -98.40 | 44.90 | 78.10 | 56.10 | -83.70 | 35.00 | 30.10 | 28.70 | -56.80 | 37.20 | 19.10 | 20.60 | -48.80 | 24.30 | 22.10 | 9.10 | -44.90 | 16.60 | 10.90 | 7.20 | -85.50 | 23.70 | 37.00 | 19.30 | -82.80 | 17.60 | 22.20 | 28.20 | NA | NA | NA | |
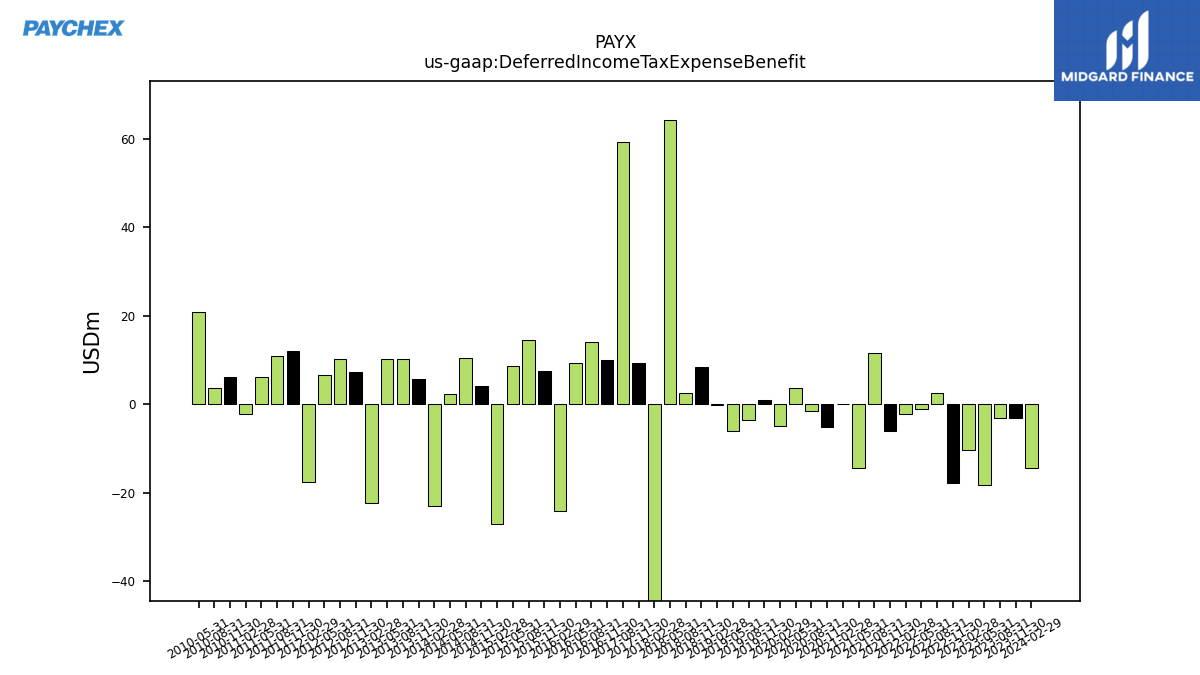
| Deferred Income Tax Expense Benefit | -3.20 | -3.20 | -18.40 | -10.30 | -17.80 | 2.50 | -1.00 | -2.20 | -6.00 | 11.50 | -14.40 | 0.10 | -5.20 | -1.50 | 3.70 | -5.00 | 1.00 | -3.70 | -6.00 | -0.20 | 8.30 | 2.60 | 64.20 | -113.40 | 9.20 | 59.20 | NA | NA | 9.90 | 14.10 | 9.30 | -24.10 | 7.50 | 14.40 | 8.70 | -27.20 | 4.00 | 10.40 | 2.20 | -23.10 | 5.70 | 10.30 | 10.10 | -22.30 | 7.30 | 10.20 | 6.50 | -17.70 | 12.10 | 10.80 | 6.20 | -2.30 | 6.10 | 3.60 | 20.90 | NA | NA | NA | |
| Share Based Compensation | 14.70 | 16.00 | 16.60 | 16.30 | 15.30 | 14.40 | 13.60 | 12.80 | 14.00 | 12.40 | 14.40 | 12.60 | 12.20 | 13.30 | 10.90 | 12.70 | 13.30 | 10.50 | 12.60 | 10.80 | 11.90 | 10.90 | 15.20 | 10.30 | 10.40 | 8.70 | 8.90 | 8.90 | 8.50 | 9.10 | 8.50 | 8.60 | 8.70 | 8.80 | 7.40 | 8.60 | 7.90 | 7.50 | 4.60 | 7.10 | 7.10 | 7.50 | 5.90 | 5.40 | 5.10 | 6.40 | 5.30 | 5.70 | 5.30 | 6.60 | 6.00 | 5.30 | 6.40 | 7.10 | 6.50 | 5.80 | NA | NA |
| 2023-11-30 | 2023-08-31 | 2023-05-31 | 2023-02-28 | 2022-11-30 | 2022-08-31 | 2022-05-31 | 2022-02-28 | 2021-11-30 | 2021-08-31 | 2021-05-31 | 2021-02-28 | 2020-11-30 | 2020-08-31 | 2020-05-31 | 2020-02-29 | 2019-11-30 | 2019-08-31 | 2019-05-31 | 2019-02-28 | 2018-11-30 | 2018-08-31 | 2018-05-31 | 2018-02-28 | 2017-11-30 | 2017-08-31 | 2017-05-31 | 2017-02-28 | 2016-11-30 | 2016-08-31 | 2016-05-31 | 2016-02-29 | 2015-11-30 | 2015-08-31 | 2015-05-31 | 2015-02-28 | 2014-11-30 | 2014-08-31 | 2014-05-31 | 2014-02-28 | 2013-11-30 | 2013-08-31 | 2013-05-31 | 2013-02-28 | 2012-11-30 | 2012-08-31 | 2012-05-31 | 2012-02-29 | 2011-11-30 | 2011-08-31 | 2011-05-31 | 2011-02-28 | 2010-11-30 | 2010-08-31 | 2010-05-31 | 2010-02-28 | 2009-11-30 | 2009-08-31 | ||
|---|---|---|---|---|---|---|---|---|---|---|---|---|---|---|---|---|---|---|---|---|---|---|---|---|---|---|---|---|---|---|---|---|---|---|---|---|---|---|---|---|---|---|---|---|---|---|---|---|---|---|---|---|---|---|---|---|---|---|---|
| Net Cash Provided By Used In Investing Activities | -133.70 | 24.00 | -143.90 | -699.20 | -161.50 | 1223.10 | -252.80 | -716.70 | -429.10 | -22.30 | 139.70 | -109.90 | -254.10 | -236.30 | 407.50 | -200.80 | 20.50 | 544.70 | -1089.70 | -1577.40 | 120.30 | 918.50 | -703.40 | 775.50 | -40.10 | -711.00 | 522.50 | NA | NA | NA | NA | NA | NA | NA | NA | -1081.90 | -304.20 | 358.90 | 578.10 | -1088.50 | 163.50 | 30.80 | 1357.30 | -1913.20 | -34.30 | 771.90 | -453.10 | -1226.00 | 36.80 | 398.00 | 459.80 | -997.90 | -43.90 | 172.50 | 549.50 | NA | NA | NA | |
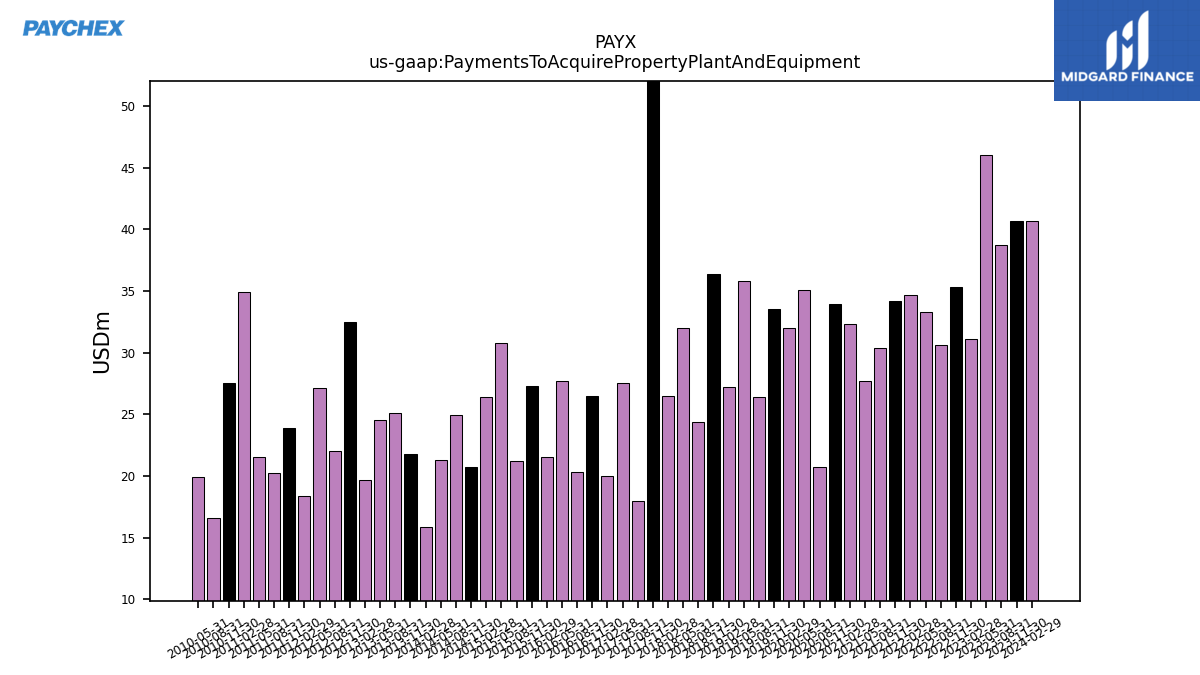
| Payments To Acquire Property Plant And Equipment | 40.70 | 38.70 | 46.00 | 31.10 | 35.30 | 30.60 | 33.30 | 34.70 | 34.20 | 30.40 | 27.70 | 32.30 | 33.90 | 20.70 | 35.10 | 32.00 | 33.50 | 26.40 | 35.80 | 27.20 | 36.40 | 24.40 | 32.00 | 26.50 | 77.50 | 18.00 | 27.50 | 20.00 | 26.50 | 20.30 | 27.70 | 21.50 | 27.30 | 21.20 | 30.80 | 26.40 | 20.70 | 24.90 | 21.30 | 15.90 | 21.80 | 25.10 | 24.50 | 19.70 | 32.50 | 22.00 | 27.10 | 18.40 | 23.90 | 20.20 | 21.50 | 34.90 | 27.50 | 16.60 | 19.90 | NA | NA | NA |
| 2023-11-30 | 2023-08-31 | 2023-05-31 | 2023-02-28 | 2022-11-30 | 2022-08-31 | 2022-05-31 | 2022-02-28 | 2021-11-30 | 2021-08-31 | 2021-05-31 | 2021-02-28 | 2020-11-30 | 2020-08-31 | 2020-05-31 | 2020-02-29 | 2019-11-30 | 2019-08-31 | 2019-05-31 | 2019-02-28 | 2018-11-30 | 2018-08-31 | 2018-05-31 | 2018-02-28 | 2017-11-30 | 2017-08-31 | 2017-05-31 | 2017-02-28 | 2016-11-30 | 2016-08-31 | 2016-05-31 | 2016-02-29 | 2015-11-30 | 2015-08-31 | 2015-05-31 | 2015-02-28 | 2014-11-30 | 2014-08-31 | 2014-05-31 | 2014-02-28 | 2013-11-30 | 2013-08-31 | 2013-05-31 | 2013-02-28 | 2012-11-30 | 2012-08-31 | 2012-05-31 | 2012-02-29 | 2011-11-30 | 2011-08-31 | 2011-05-31 | 2011-02-28 | 2010-11-30 | 2010-08-31 | 2010-05-31 | 2010-02-28 | 2009-11-30 | 2009-08-31 | ||
|---|---|---|---|---|---|---|---|---|---|---|---|---|---|---|---|---|---|---|---|---|---|---|---|---|---|---|---|---|---|---|---|---|---|---|---|---|---|---|---|---|---|---|---|---|---|---|---|---|---|---|---|---|---|---|---|---|---|---|---|
| Net Cash Provided By Used In Financing Activities | -537.10 | 1069.40 | -492.90 | 832.60 | -241.40 | -809.70 | -945.90 | 269.50 | -91.20 | -211.70 | -758.50 | 584.50 | -79.60 | -382.80 | -1208.40 | 365.20 | -231.80 | -413.20 | -1929.30 | 2304.40 | -273.30 | -1110.30 | 450.20 | -1178.30 | -112.90 | 417.20 | -718.90 | NA | NA | NA | NA | NA | NA | NA | NA | 918.70 | -159.60 | -311.90 | -872.00 | 841.20 | -195.60 | -293.20 | -1419.30 | 1610.60 | -100.40 | -949.40 | 271.40 | 1011.00 | -163.80 | -591.10 | -739.20 | 767.00 | -120.70 | -378.20 | -652.40 | NA | NA | NA | |
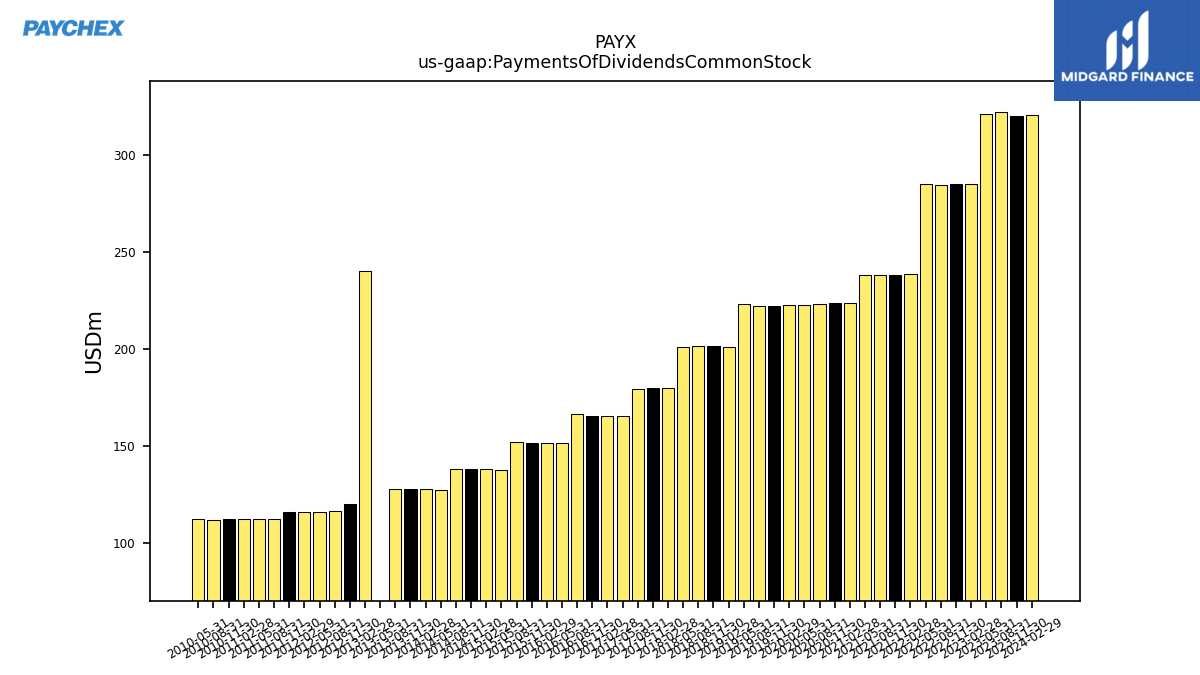
| Payments Of Dividends Common Stock | 320.20 | 321.90 | 320.90 | 284.80 | 284.70 | 284.60 | 284.70 | 238.50 | 238.30 | 238.10 | 238.20 | 223.80 | 223.50 | 223.20 | 222.60 | 222.50 | 222.30 | 222.00 | 222.90 | 201.20 | 201.30 | 201.40 | 201.00 | 179.80 | 179.80 | 179.10 | 165.40 | 165.40 | 165.20 | 166.30 | 151.50 | 151.40 | 151.70 | 151.90 | 137.40 | 138.20 | 137.90 | 138.30 | 127.20 | 127.70 | 127.80 | 127.90 | 0.00 | 240.30 | 120.00 | 116.40 | 116.20 | 115.90 | 116.00 | 112.40 | 112.40 | 112.20 | 112.20 | 112.00 | 112.20 | NA | NA | NA |
| 2023-11-30 | 2023-08-31 | 2023-05-31 | 2023-02-28 | 2022-11-30 | 2022-08-31 | 2022-05-31 | 2022-02-28 | 2021-11-30 | 2021-08-31 | 2021-05-31 | 2021-02-28 | 2020-11-30 | 2020-08-31 | 2020-05-31 | 2020-02-29 | 2019-11-30 | 2019-08-31 | 2019-05-31 | 2019-02-28 | 2018-11-30 | 2018-08-31 | 2018-05-31 | 2018-02-28 | 2017-11-30 | 2017-08-31 | 2017-05-31 | 2017-02-28 | 2016-11-30 | 2016-08-31 | 2016-05-31 | 2016-02-29 | 2015-11-30 | 2015-08-31 | 2015-05-31 | 2015-02-28 | 2014-11-30 | 2014-08-31 | 2014-05-31 | 2014-02-28 | 2013-11-30 | 2013-08-31 | 2013-05-31 | 2013-02-28 | 2012-11-30 | 2012-08-31 | 2012-05-31 | 2012-02-29 | 2011-11-30 | 2011-08-31 | 2011-05-31 | 2011-02-28 | 2010-11-30 | 2010-08-31 | 2010-05-31 | 2010-02-28 | 2009-11-30 | 2009-08-31 | ||
|---|---|---|---|---|---|---|---|---|---|---|---|---|---|---|---|---|---|---|---|---|---|---|---|---|---|---|---|---|---|---|---|---|---|---|---|---|---|---|---|---|---|---|---|---|---|---|---|---|---|---|---|---|---|---|---|---|---|---|---|
| Revenues | 1257.90 | 1286.00 | 1229.60 | 1381.00 | 1190.30 | 1206.20 | 1144.30 | 1276.00 | 1108.50 | 1082.90 | 1029.20 | 1111.70 | 983.70 | 932.20 | 915.10 | 1142.70 | 990.70 | 992.00 | 980.40 | 1070.40 | 858.90 | 862.80 | 871.10 | 866.50 | 826.50 | 816.80 | 798.60 | 795.80 | 771.40 | 785.50 | 753.90 | 752.60 | 722.40 | 723.00 | 692.20 | 704.30 | 676.30 | 666.80 | 639.00 | 636.50 | 610.50 | 607.90 | 585.30 | 593.30 | 569.40 | 578.20 | 551.50 | 569.50 | 545.70 | 563.10 | 522.70 | 531.30 | 512.00 | 518.30 | 496.20 | 507.80 | 496.60 | 500.20 | |
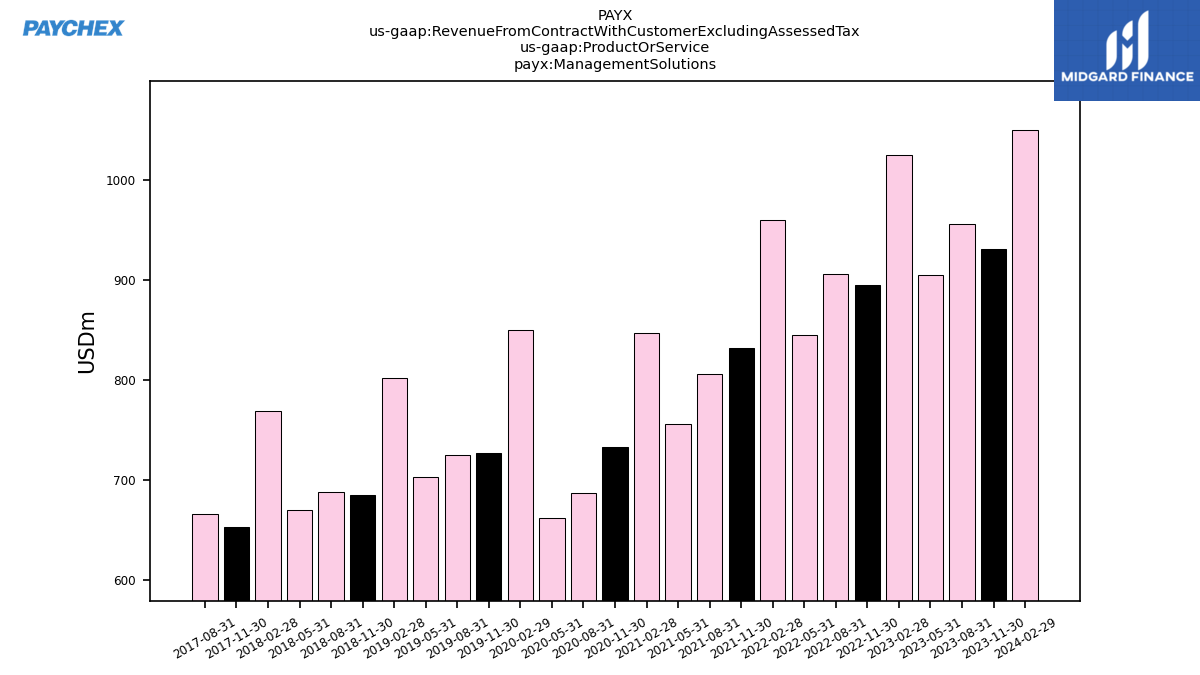
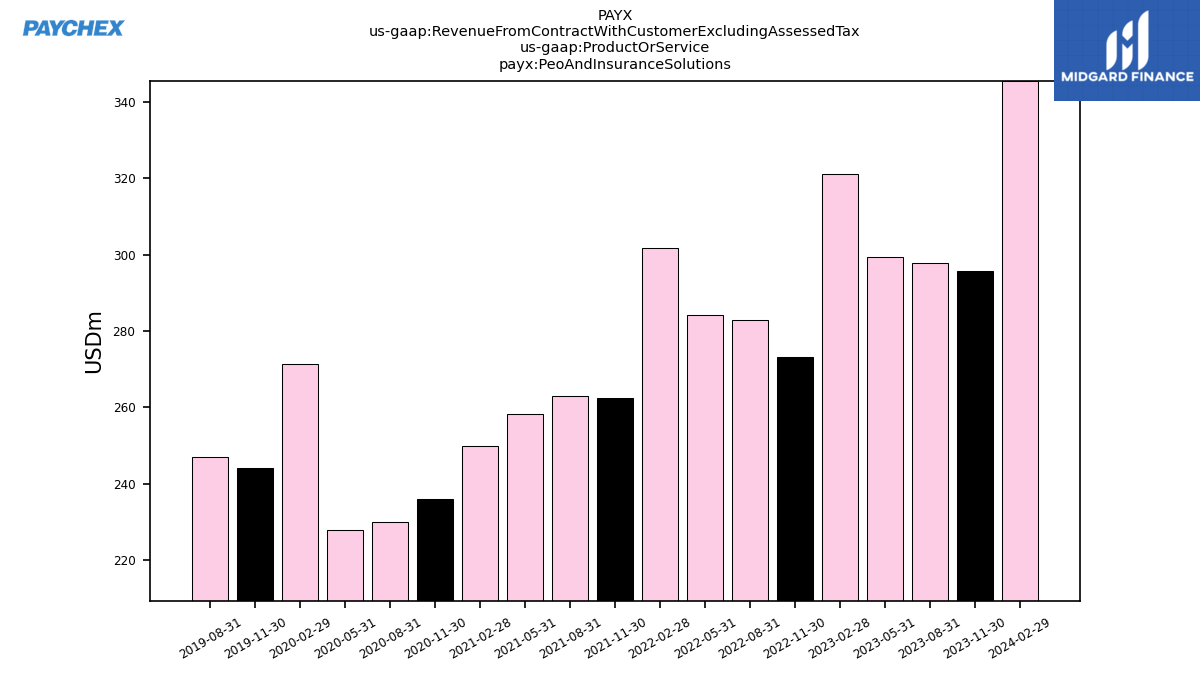
| Revenue From Contract With Customer Excluding Assessed Tax | 1226.40 | 1253.30 | 1204.70 | 1345.70 | 1168.60 | 1188.30 | 1129.60 | 1261.60 | 1094.40 | 1068.40 | 1014.70 | 1096.60 | 968.90 | 917.30 | 889.80 | 1121.50 | 970.80 | 971.50 | 958.20 | 1047.40 | 840.60 | 845.70 | 828.00 | 918.00 | 789.00 | 779.20 | 798.60 | 795.80 | 771.40 | 785.50 | 753.90 | 752.60 | 722.40 | 723.00 | 692.20 | 704.30 | 676.30 | 666.80 | 639.00 | 636.50 | 610.50 | 607.90 | 585.30 | 593.30 | 569.40 | 578.20 | 551.50 | 569.50 | 545.70 | 563.10 | 522.70 | 531.30 | 512.00 | 518.30 | 496.20 | 507.80 | 496.60 | 500.20 | |
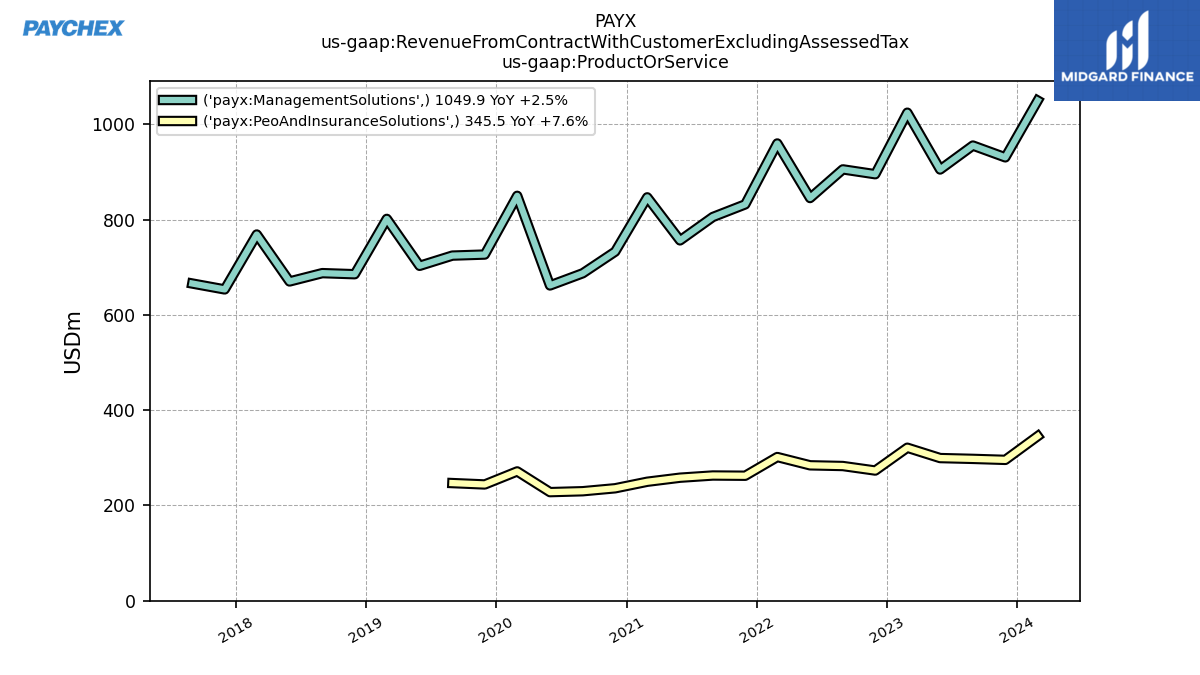
| Management Solutions | 930.70 | 955.50 | 905.20 | 1024.50 | 895.30 | 905.50 | 845.30 | 959.90 | 832.00 | 805.50 | 756.40 | 846.80 | 732.80 | 687.40 | 661.80 | 850.00 | 726.70 | 724.50 | 703.00 | 801.60 | 685.40 | 687.70 | 670.20 | 768.80 | 653.50 | 665.90 | NA | NA | NA | NA | NA | NA | NA | NA | NA | NA | NA | NA | NA | NA | NA | NA | NA | NA | NA | NA | NA | NA | NA | NA | NA | NA | NA | NA | NA | NA | NA | NA | |
| Peo And Insurance Solutions | 295.70 | 297.80 | 299.50 | 321.20 | 273.30 | 282.80 | 284.30 | 301.70 | 262.40 | 262.90 | 258.30 | 249.80 | 236.10 | 229.90 | 228.00 | 271.50 | 244.10 | 247.00 | NA | NA | NA | NA | NA | NA | NA | NA | NA | NA | NA | NA | NA | NA | NA | NA | NA | NA | NA | NA | NA | NA | NA | NA | NA | NA | NA | NA | NA | NA | NA | NA | NA | NA | NA | NA | NA | NA | NA | NA | |
| Revenue From Contract With Customer Including Assessed Tax | 1257.90 | 1286.00 | 1229.60 | 1381.00 | 1190.30 | 1206.20 | 1144.30 | 1276.00 | 1108.50 | 1082.90 | 1029.20 | 1111.70 | 983.70 | 932.20 | 915.10 | 1142.70 | 990.70 | 992.00 | 980.40 | 1070.40 | 858.90 | 845.70 | 871.10 | 866.50 | 826.50 | 779.20 | 798.60 | 795.80 | 771.40 | 785.50 | 753.90 | 752.60 | 722.40 | 723.00 | 692.20 | 704.30 | 676.30 | 666.80 | 639.00 | 636.50 | 610.50 | 607.90 | 585.30 | 593.30 | 569.40 | 578.20 | 551.50 | 569.50 | 545.70 | 563.10 | 522.70 | 531.30 | 512.00 | 518.30 | 496.20 | 507.80 | 496.60 | 500.20 | |
| Interest Income Operating | 31.50 | 32.70 | 24.90 | 35.30 | 21.70 | 17.90 | 14.70 | 14.40 | 14.10 | 14.50 | 14.50 | 15.10 | 14.80 | 14.90 | 25.30 | 21.20 | 19.90 | 20.50 | 22.20 | 23.00 | 18.30 | 17.10 | 17.70 | 18.10 | 14.00 | 13.70 | 14.00 | 13.20 | 11.40 | 12.00 | 12.30 | 11.90 | 11.10 | 10.80 | 10.80 | 10.70 | 10.40 | 10.20 | 10.20 | 10.50 | 10.00 | 10.00 | 10.00 | 10.90 | 10.00 | 10.10 | 10.80 | 11.00 | 10.70 | 11.10 | 12.30 | 11.70 | 12.00 | 12.10 | NA | NA | NA | NA |