
| 2023-12-31 | 2023-09-30 | 2023-06-30 | 2023-03-31 | 2022-12-31 | 2022-09-30 | 2022-06-30 | 2022-03-31 | 2021-12-31 | 2021-09-30 | 2021-06-30 | 2021-03-31 | 2020-12-31 | 2020-09-30 | 2020-06-30 | 2020-03-31 | 2019-12-31 | 2019-09-30 | 2019-06-30 | 2019-03-31 | 2018-12-31 | 2018-09-30 | 2018-06-30 | 2018-03-31 | 2017-12-31 | 2017-09-30 | 2017-06-30 | 2017-03-31 | 2012-03-31 | 2011-12-31 | 2011-09-30 | 2011-06-30 | 2011-03-31 | 2010-12-31 | 2010-09-30 | 2010-06-30 | 2010-03-31 | ||
|---|---|---|---|---|---|---|---|---|---|---|---|---|---|---|---|---|---|---|---|---|---|---|---|---|---|---|---|---|---|---|---|---|---|---|---|---|---|---|
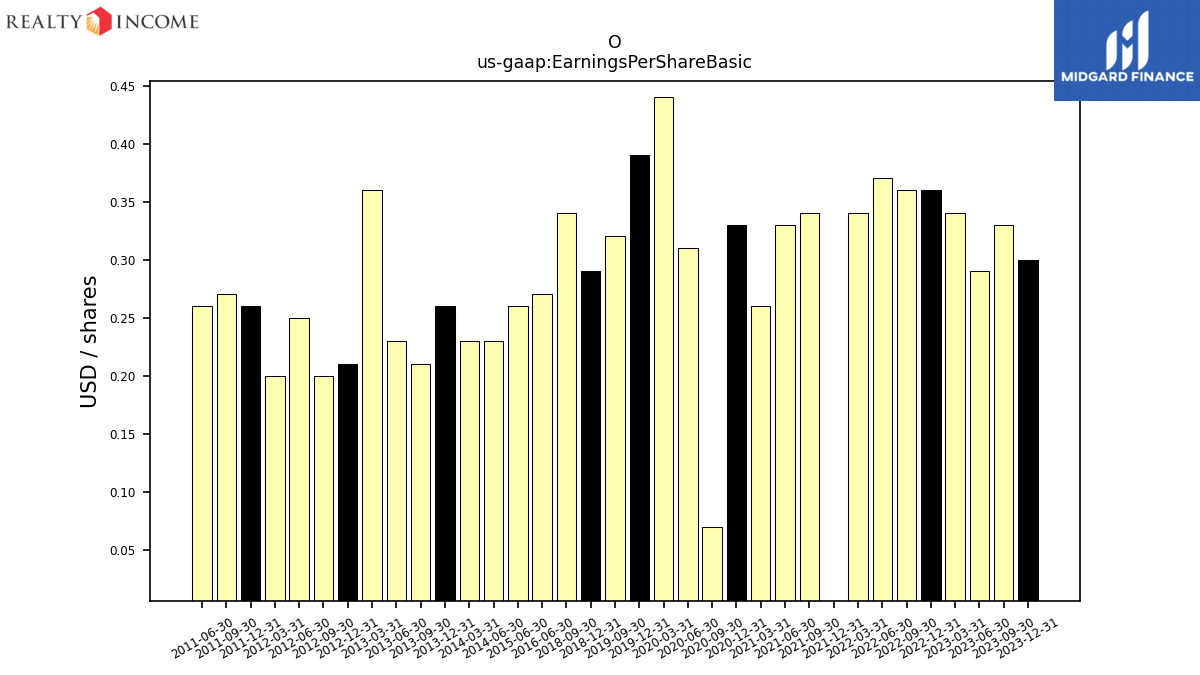
| Earnings Per Share Basic | 0.30 | 0.33 | 0.29 | 0.34 | 0.36 | 0.36 | 0.37 | 0.34 | -0.07 | 0.34 | 0.33 | 0.26 | 0.33 | 0.07 | 0.31 | 0.44 | 0.39 | 0.32 | NA | NA | 0.29 | 0.34 | NA | NA | NA | NA | NA | NA | 0.20 | 0.26 | 0.27 | 0.26 | NA | NA | NA | NA | NA | |
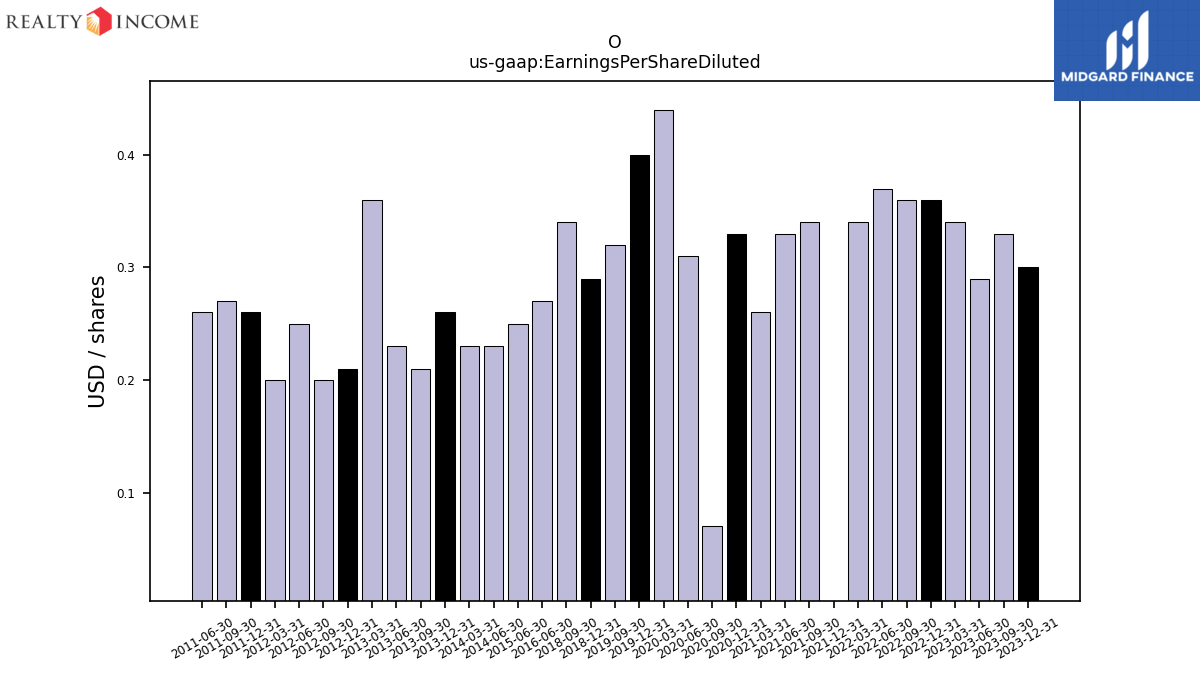
| Earnings Per Share Diluted | 0.30 | 0.33 | 0.29 | 0.34 | 0.36 | 0.36 | 0.37 | 0.34 | -0.07 | 0.34 | 0.33 | 0.26 | 0.33 | 0.07 | 0.31 | 0.44 | 0.40 | 0.32 | NA | NA | 0.29 | 0.34 | NA | NA | NA | NA | NA | NA | 0.20 | 0.26 | 0.27 | 0.26 | NA | NA | NA | NA | NA |
| 2023-12-31 | 2023-09-30 | 2023-06-30 | 2023-03-31 | 2022-12-31 | 2022-09-30 | 2022-06-30 | 2022-03-31 | 2021-12-31 | 2021-09-30 | 2021-06-30 | 2021-03-31 | 2020-12-31 | 2020-09-30 | 2020-06-30 | 2020-03-31 | 2019-12-31 | 2019-09-30 | 2019-06-30 | 2019-03-31 | 2018-12-31 | 2018-09-30 | 2018-06-30 | 2018-03-31 | 2017-12-31 | 2017-09-30 | 2017-06-30 | 2017-03-31 | 2012-03-31 | 2011-12-31 | 2011-09-30 | 2011-06-30 | 2011-03-31 | 2010-12-31 | 2010-09-30 | 2010-06-30 | 2010-03-31 | ||
|---|---|---|---|---|---|---|---|---|---|---|---|---|---|---|---|---|---|---|---|---|---|---|---|---|---|---|---|---|---|---|---|---|---|---|---|---|---|---|
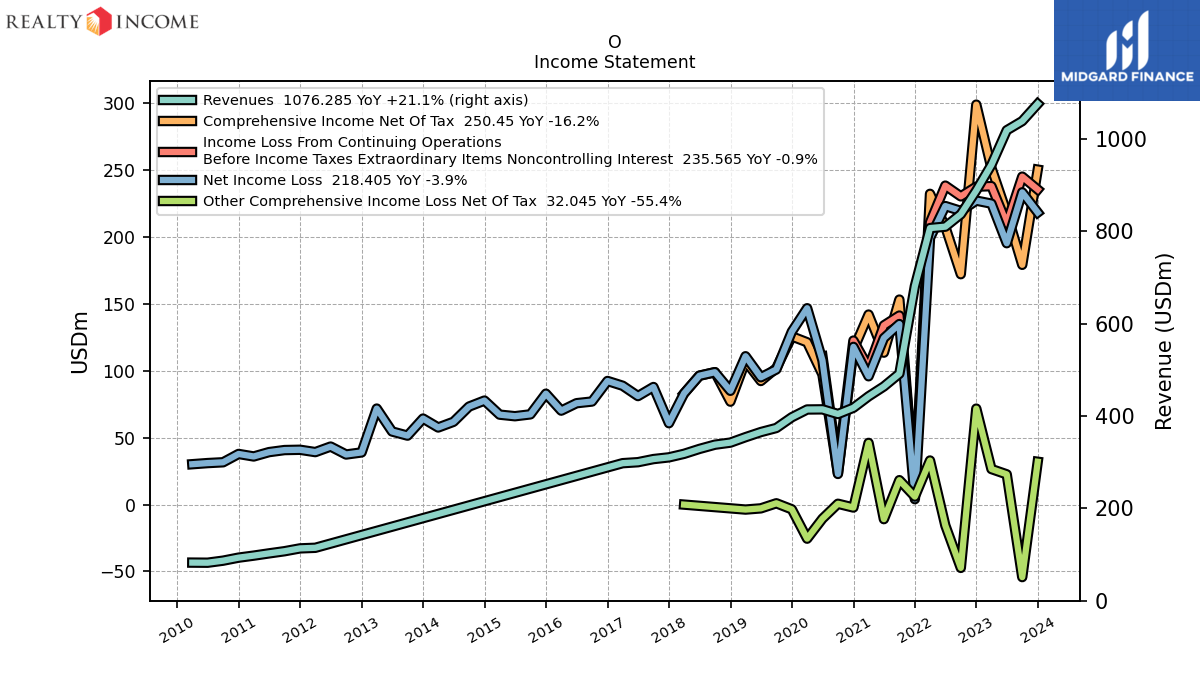
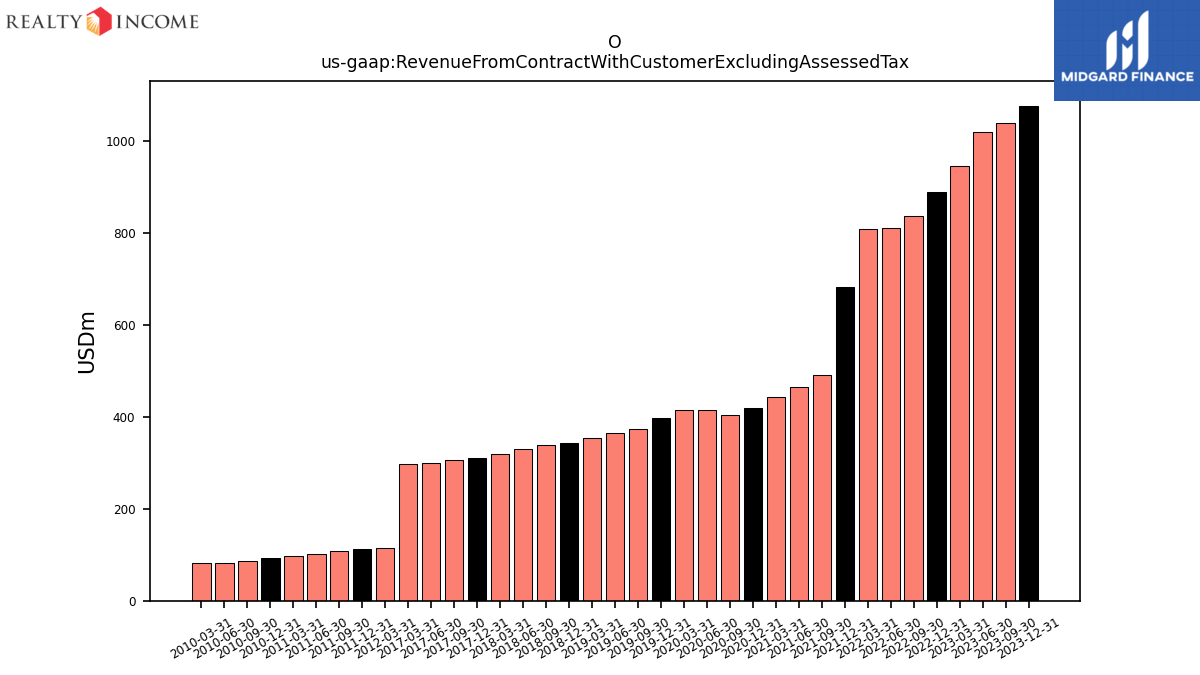
| Revenue From Contract With Customer Excluding Assessed Tax | 1076.29 | 1039.10 | 1019.21 | 944.40 | 888.65 | 837.27 | 810.42 | 807.34 | 681.50 | 491.88 | 464.28 | 442.80 | 418.08 | 404.57 | 414.64 | 414.34 | 397.53 | 374.25 | 365.45 | 354.37 | 342.58 | 338.08 | 328.89 | 318.30 | 310.65 | 306.92 | 300.17 | 298.02 | 114.72 | 113.43 | 107.30 | 102.63 | 97.76 | 93.39 | 86.83 | 82.40 | 82.62 | |
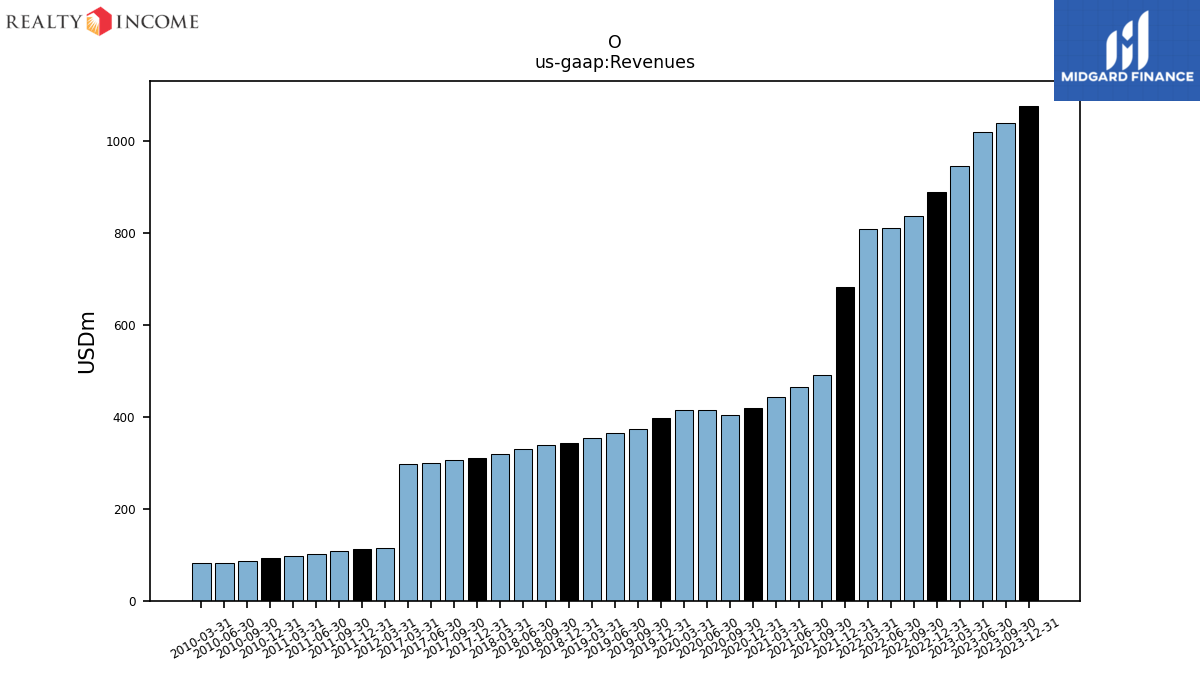
| Revenues | 1076.29 | 1039.10 | 1019.21 | 944.40 | 888.65 | 837.27 | 810.42 | 807.34 | 681.50 | 491.88 | 464.28 | 442.80 | 418.08 | 404.57 | 414.64 | 414.34 | 397.53 | 374.25 | 365.45 | 354.37 | 342.58 | 338.08 | 328.89 | 318.30 | 310.65 | 306.92 | 300.17 | 298.02 | 114.72 | 113.43 | 107.30 | 102.63 | 97.76 | 93.39 | 86.83 | 82.40 | 82.62 | |
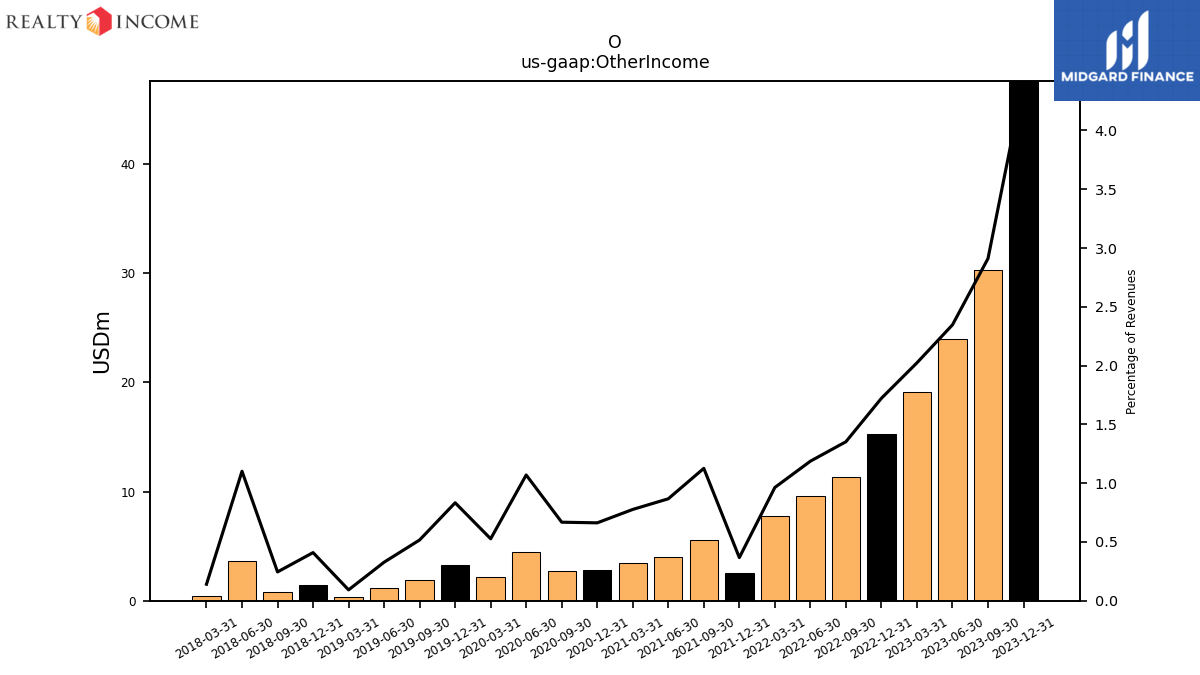
| Other Income | 47.58 | 30.24 | 23.92 | 19.11 | 15.30 | 11.32 | 9.62 | 7.78 | 2.50 | 5.54 | 4.03 | 3.44 | 2.77 | 2.70 | 4.43 | 2.18 | 3.31 | 1.94 | 1.20 | 0.33 | 1.40 | 0.83 | 3.62 | 0.45 | NA | NA | NA | NA | NA | NA | NA | NA | NA | NA | NA | NA | NA | |
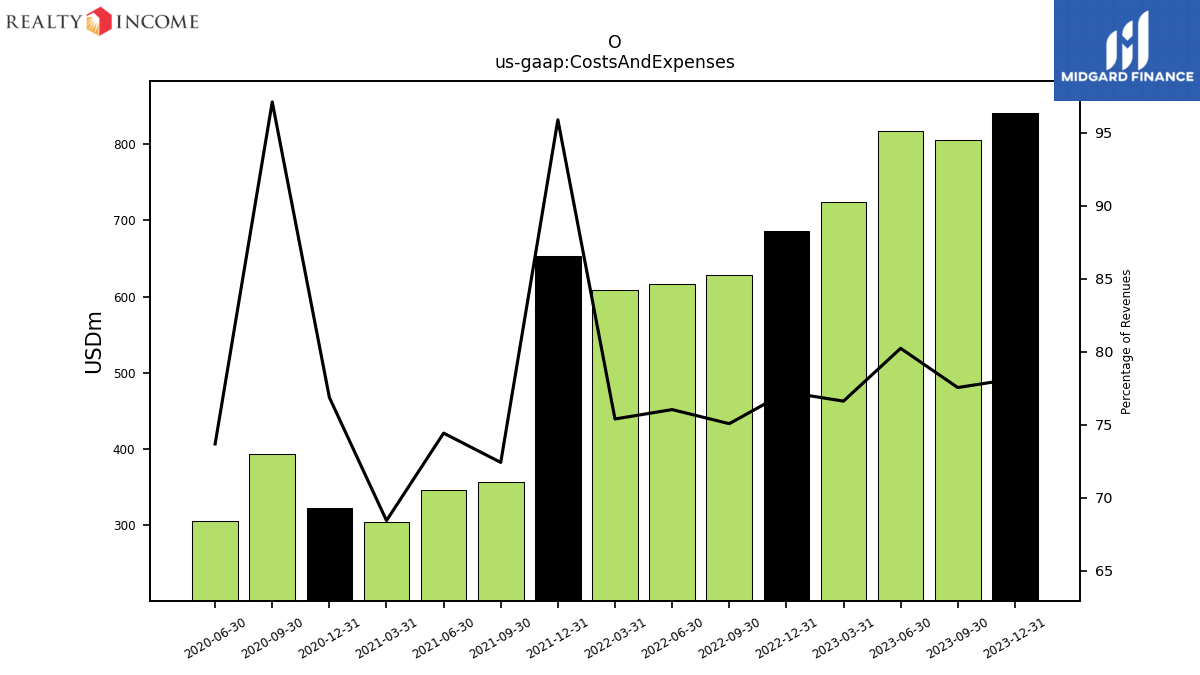
| Costs And Expenses | 841.28 | 805.88 | 817.82 | 723.66 | 686.46 | 628.64 | 616.30 | 608.76 | 653.52 | 356.26 | 345.59 | 303.07 | 321.40 | 392.91 | 305.55 | NA | NA | NA | NA | NA | NA | NA | NA | NA | NA | NA | NA | NA | NA | NA | NA | NA | NA | NA | NA | NA | NA | |
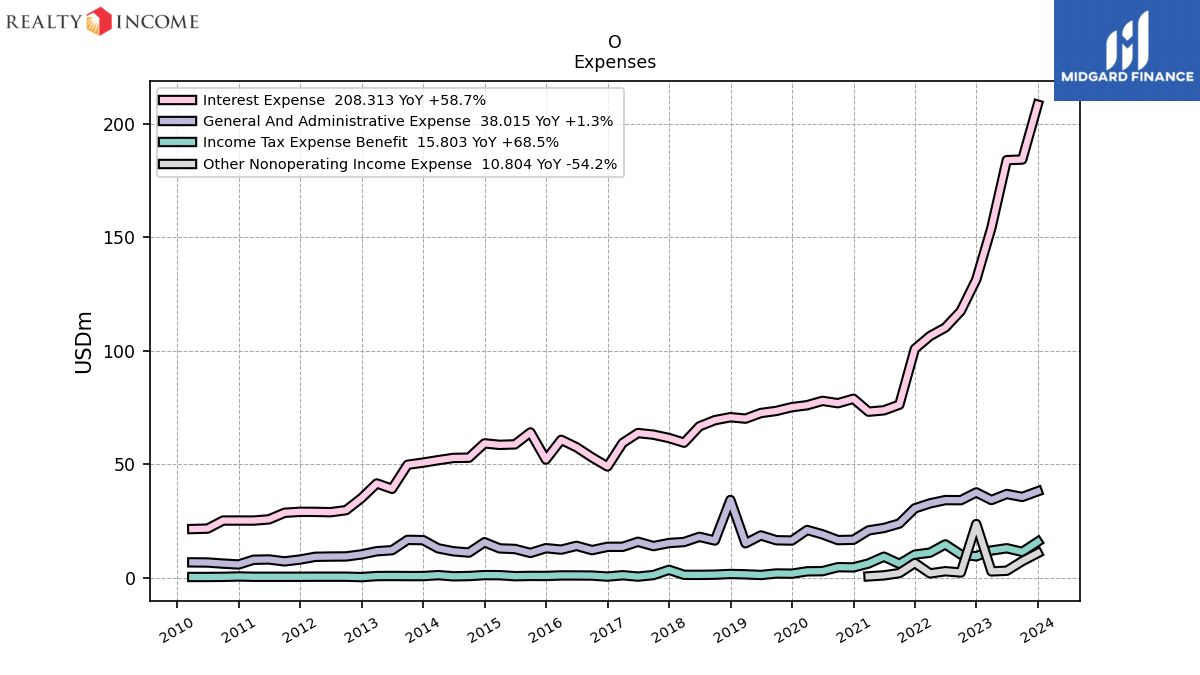
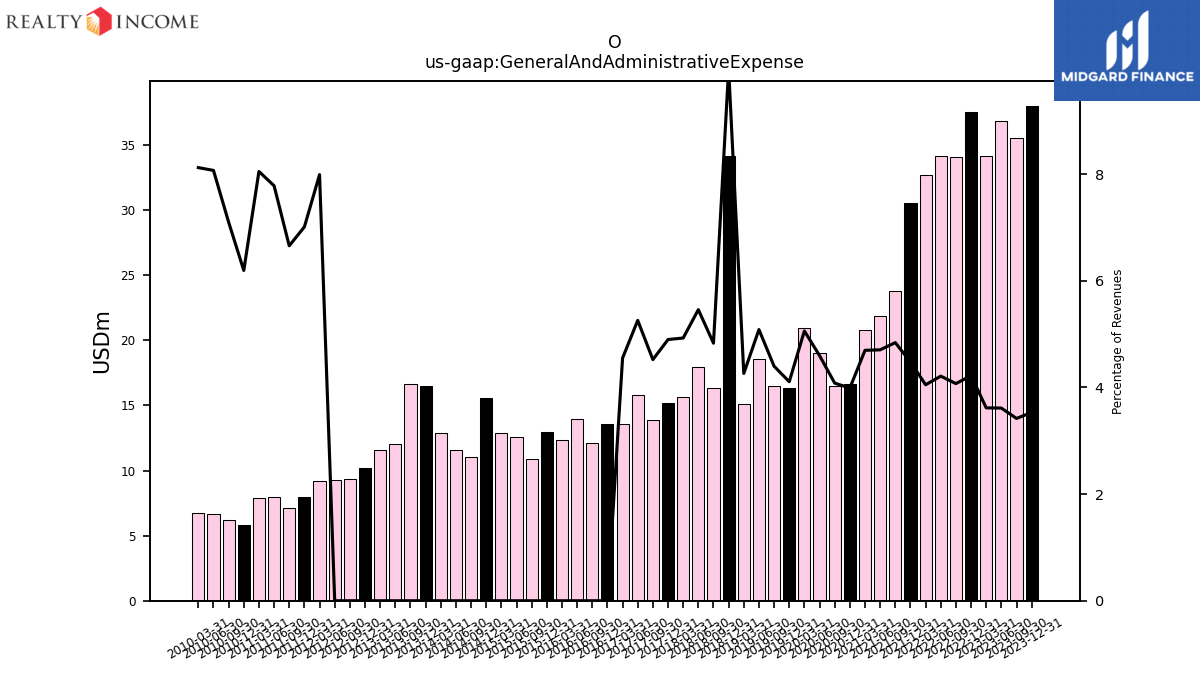
| General And Administrative Expense | 38.02 | 35.52 | 36.83 | 34.17 | 37.52 | 34.10 | 34.14 | 32.70 | 30.52 | 23.81 | 21.85 | 20.80 | 16.67 | 16.51 | 19.06 | 20.96 | 16.33 | 16.46 | 18.59 | 15.11 | 34.18 | 16.33 | 17.95 | 15.68 | 15.22 | 13.88 | 15.78 | 13.56 | 9.17 | 7.95 | 7.14 | 7.99 | 7.87 | 5.79 | 6.17 | 6.65 | 6.71 | |
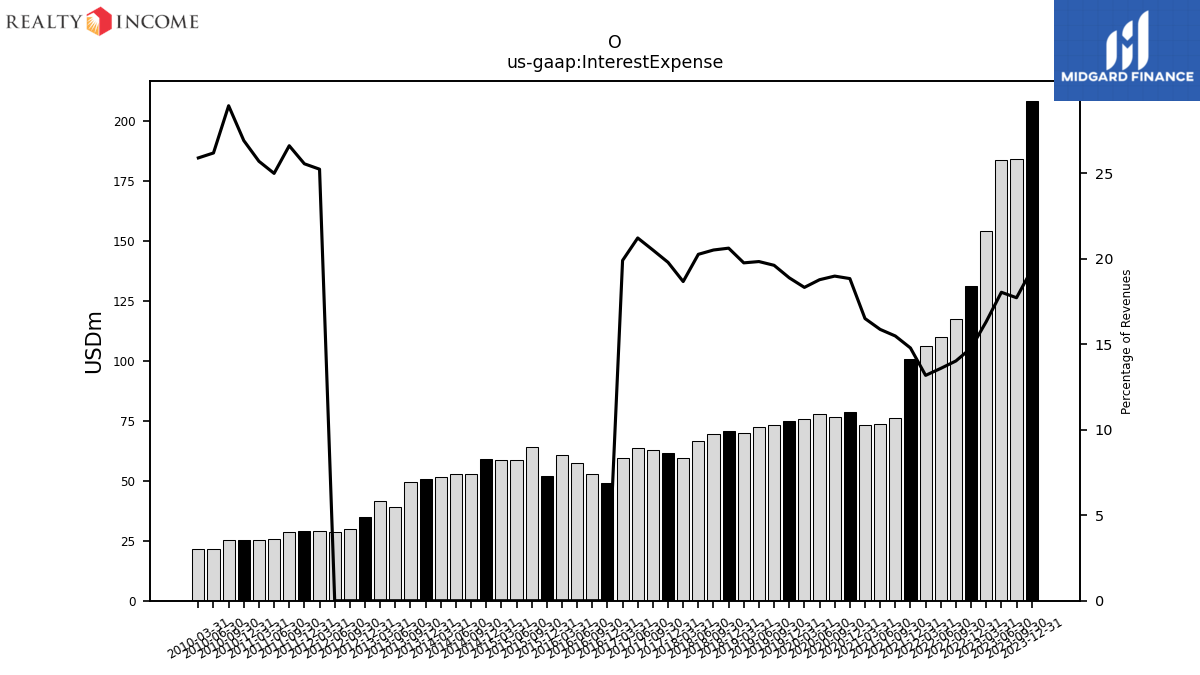
| Interest Expense | 208.31 | 184.12 | 183.86 | 154.13 | 131.29 | 117.41 | 110.12 | 106.40 | 100.74 | 76.16 | 73.67 | 73.08 | 78.76 | 76.81 | 77.84 | 75.92 | 75.07 | 73.41 | 72.49 | 70.02 | 70.64 | 69.34 | 66.63 | 59.41 | 61.48 | 62.95 | 63.68 | 59.30 | 28.95 | 28.98 | 28.55 | 25.65 | 25.12 | 25.13 | 25.14 | 21.58 | 21.39 | |
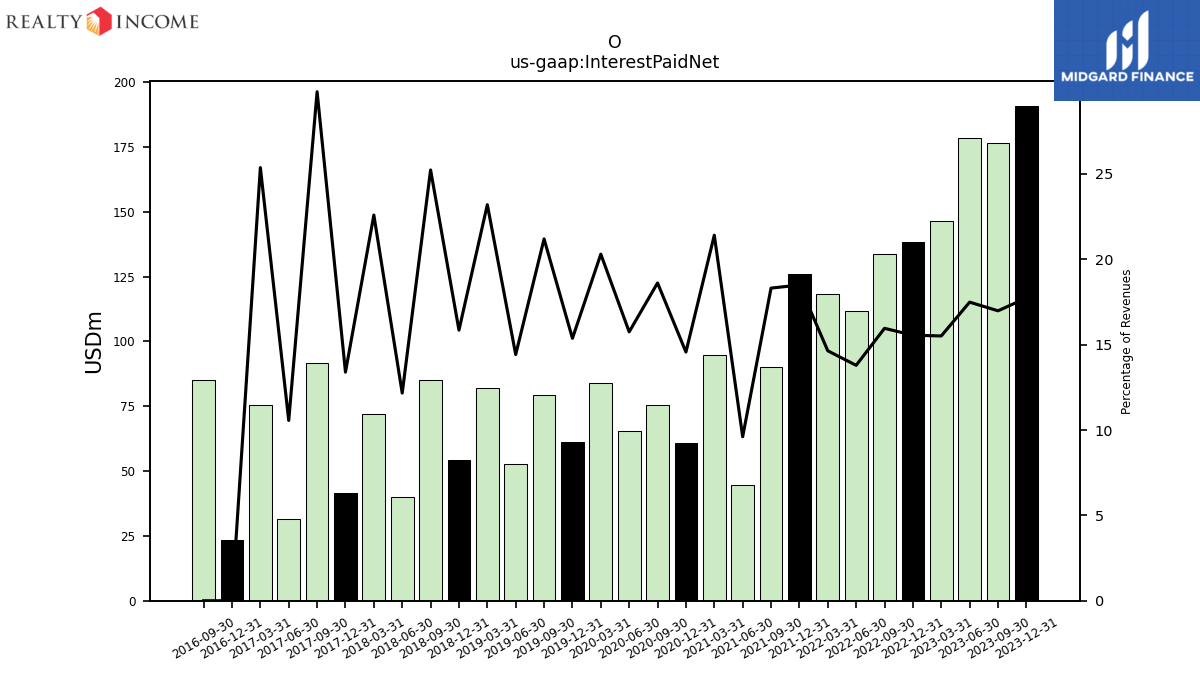
| Interest Paid Net | 190.84 | 176.45 | 178.25 | 146.46 | 138.20 | 133.59 | 111.74 | 118.19 | 126.02 | 90.06 | 44.60 | 94.80 | 60.90 | 75.30 | 65.30 | 84.10 | 61.10 | 79.30 | 52.70 | 82.20 | 54.30 | 85.30 | 40.00 | 71.90 | 41.60 | 91.50 | 31.70 | 75.60 | NA | NA | NA | NA | NA | NA | NA | NA | NA | |
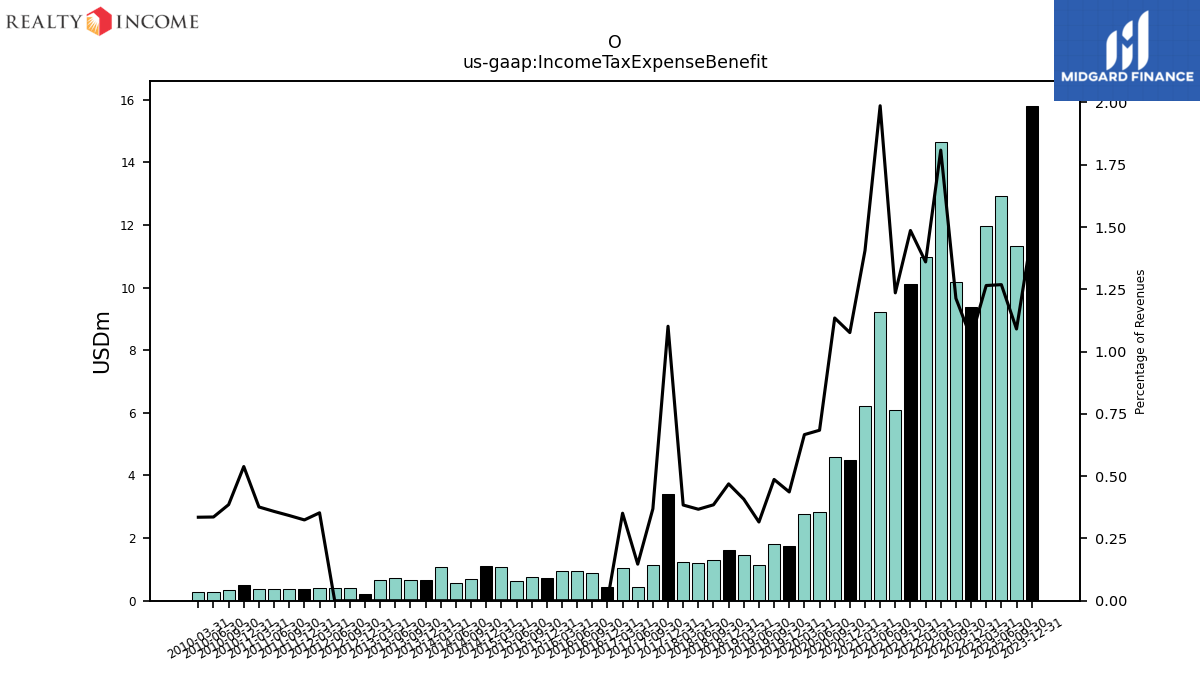
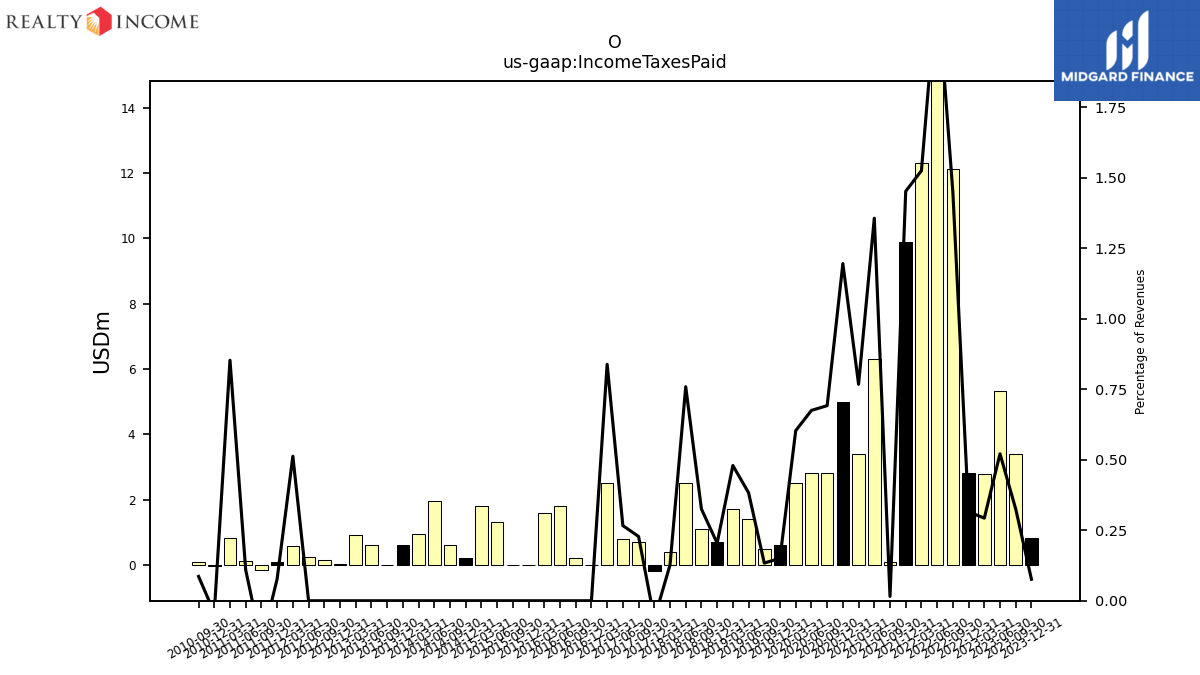
| Income Tax Expense Benefit | 15.80 | 11.34 | 12.93 | 11.95 | 9.38 | 10.16 | 14.66 | 10.98 | 10.13 | 6.08 | 9.22 | 6.22 | 4.50 | 4.59 | 2.84 | 2.76 | 1.74 | 1.82 | 1.16 | 1.45 | 1.61 | 1.30 | 1.21 | 1.22 | 3.42 | 1.13 | 0.44 | 1.05 | 0.41 | 0.37 | 0.37 | 0.37 | 0.37 | 0.50 | 0.34 | 0.28 | 0.28 | |
| Income Taxes Paid | 0.82 | 3.38 | 5.31 | 2.77 | 2.81 | 12.13 | 17.77 | 12.32 | 9.90 | 0.08 | 6.30 | 3.40 | 5.00 | 2.80 | 2.80 | 2.50 | 0.60 | 0.50 | 1.40 | 1.70 | 0.70 | 1.10 | 2.50 | 0.40 | -0.20 | 0.70 | 0.80 | 2.50 | 0.59 | 0.09 | -0.16 | 0.11 | 0.83 | -0.04 | 0.07 | NA | NA | |
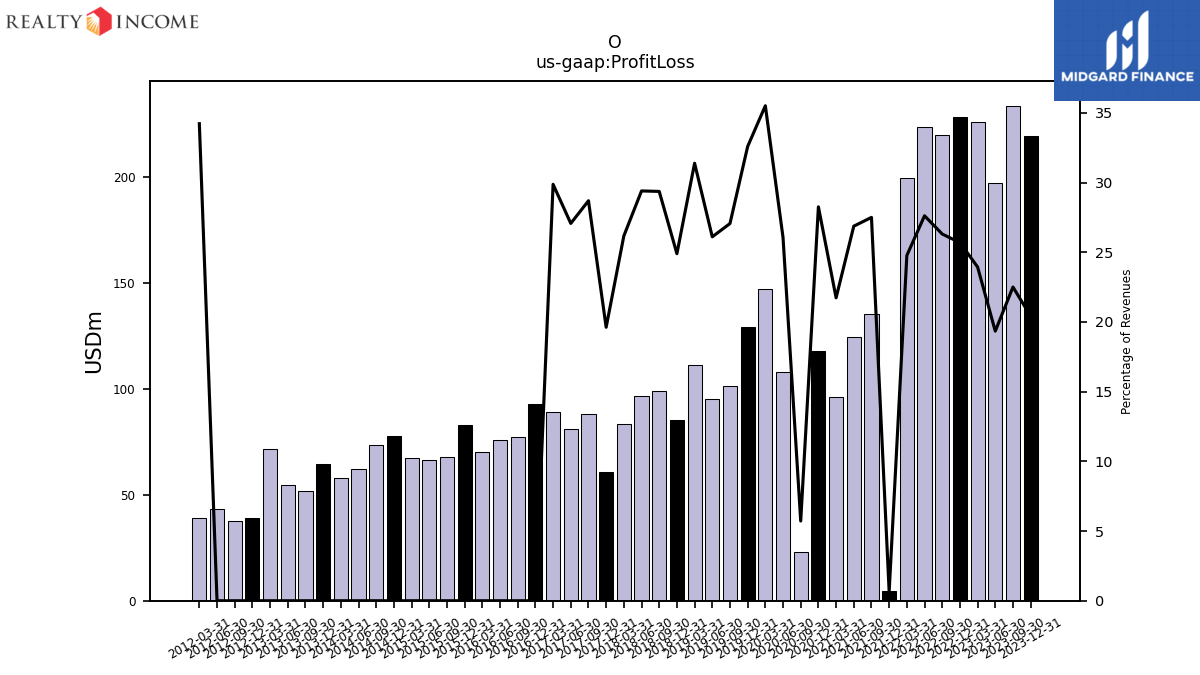
| Profit Loss | 219.76 | 233.88 | 197.15 | 226.12 | 228.34 | 220.29 | 223.82 | 199.97 | 4.47 | 135.28 | 124.77 | 96.24 | 118.15 | 23.14 | 108.07 | 147.14 | 129.55 | 101.28 | 95.42 | 111.23 | 85.30 | 99.28 | 96.70 | 83.31 | 60.95 | 88.07 | 81.26 | 89.03 | 39.26 | NA | NA | NA | NA | NA | NA | NA | NA | |
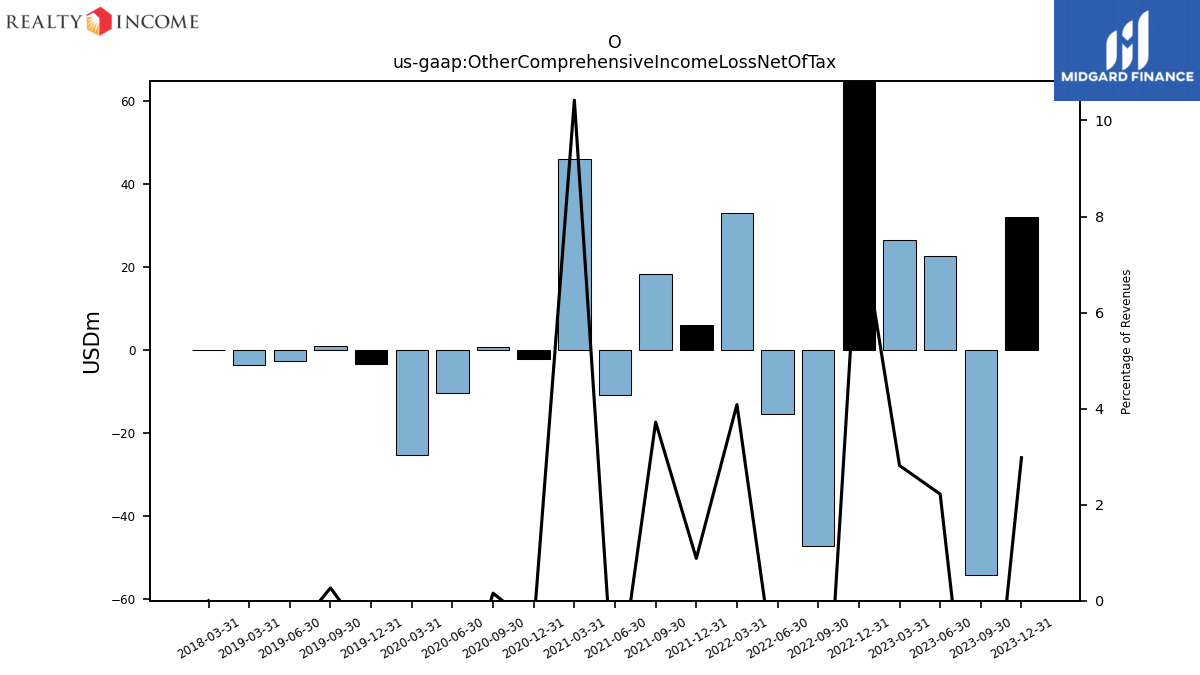
| Other Comprehensive Income Loss Net Of Tax | 32.05 | -54.21 | 22.64 | 26.59 | 71.77 | -47.32 | -15.54 | 32.98 | 6.01 | 18.29 | -10.88 | 46.15 | -2.19 | 0.64 | -10.51 | -25.47 | -3.50 | 1.00 | -2.80 | -3.70 | NA | NA | NA | 0.00 | NA | NA | NA | NA | NA | NA | NA | NA | NA | NA | NA | NA | NA | |
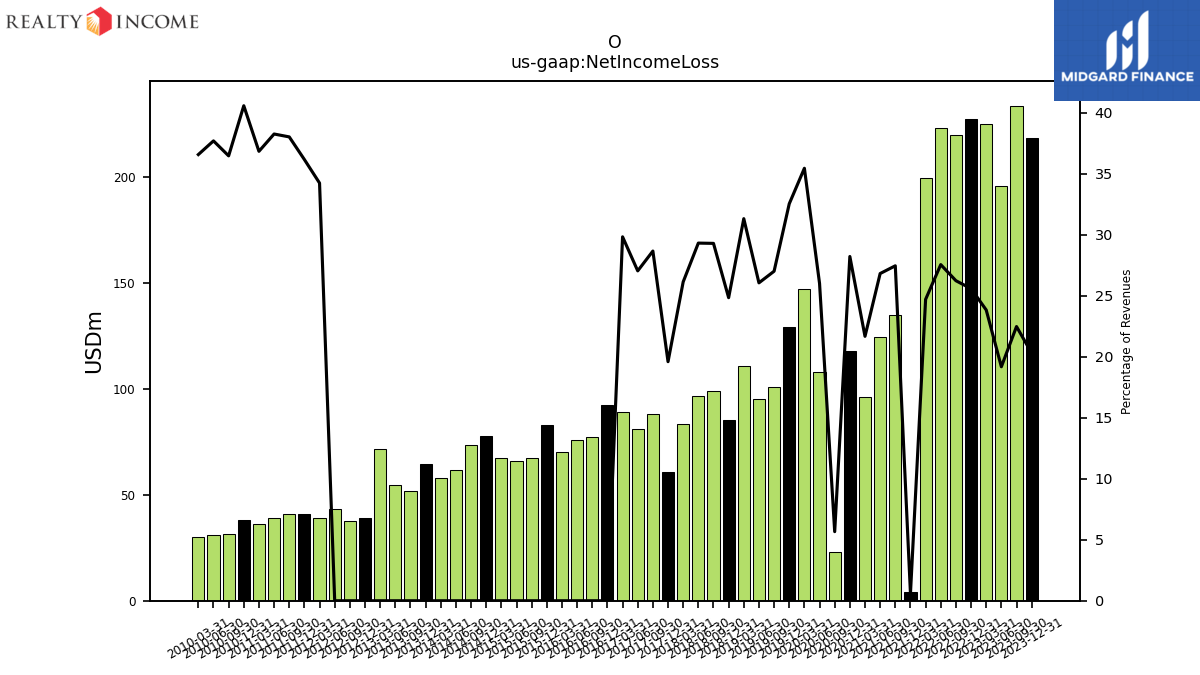
| Net Income Loss | 218.41 | 233.47 | 195.41 | 225.02 | 227.26 | 219.57 | 223.21 | 199.37 | 4.04 | 135.00 | 124.48 | 95.94 | 117.93 | 22.90 | 107.82 | 146.83 | 129.30 | 101.05 | 95.19 | 110.94 | 85.07 | 99.00 | 96.38 | 83.16 | 60.85 | 87.94 | 81.14 | 88.87 | 39.26 | 41.01 | 40.78 | 39.25 | 36.00 | 37.88 | 31.65 | 31.05 | 30.20 | |
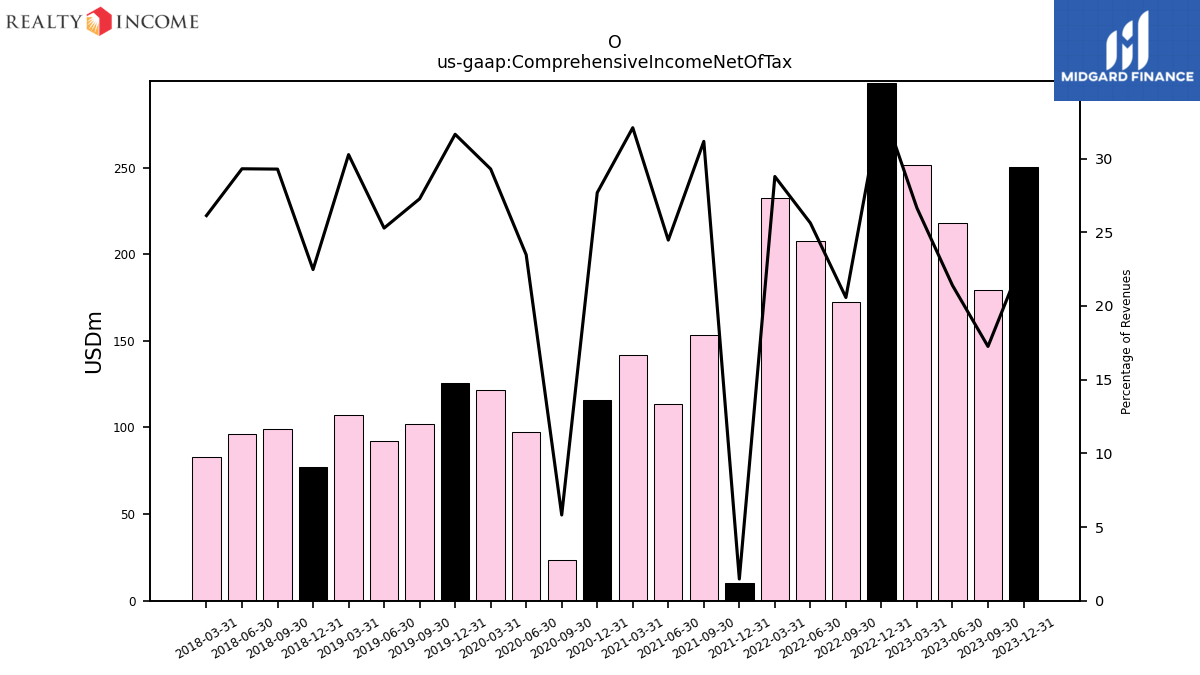
| Comprehensive Income Net Of Tax | 250.45 | 179.26 | 218.05 | 251.60 | 299.04 | 172.25 | 207.67 | 232.35 | 10.05 | 153.29 | 113.60 | 142.09 | 115.74 | 23.54 | 97.31 | 121.36 | 125.79 | 102.05 | 92.39 | 107.24 | 76.97 | 99.00 | 96.38 | 83.16 | NA | NA | NA | NA | NA | NA | NA | NA | NA | NA | NA | NA | NA |
| 2023-12-31 | 2023-09-30 | 2023-06-30 | 2023-03-31 | 2022-12-31 | 2022-09-30 | 2022-06-30 | 2022-03-31 | 2021-12-31 | 2021-09-30 | 2021-06-30 | 2021-03-31 | 2020-12-31 | 2020-09-30 | 2020-06-30 | 2020-03-31 | 2019-12-31 | 2019-09-30 | 2019-06-30 | 2019-03-31 | 2018-12-31 | 2018-09-30 | 2018-06-30 | 2018-03-31 | 2017-12-31 | 2017-09-30 | 2017-06-30 | 2017-03-31 | 2012-03-31 | 2011-12-31 | 2011-09-30 | 2011-06-30 | 2011-03-31 | 2010-12-31 | 2010-09-30 | 2010-06-30 | 2010-03-31 | ||
|---|---|---|---|---|---|---|---|---|---|---|---|---|---|---|---|---|---|---|---|---|---|---|---|---|---|---|---|---|---|---|---|---|---|---|---|---|---|---|
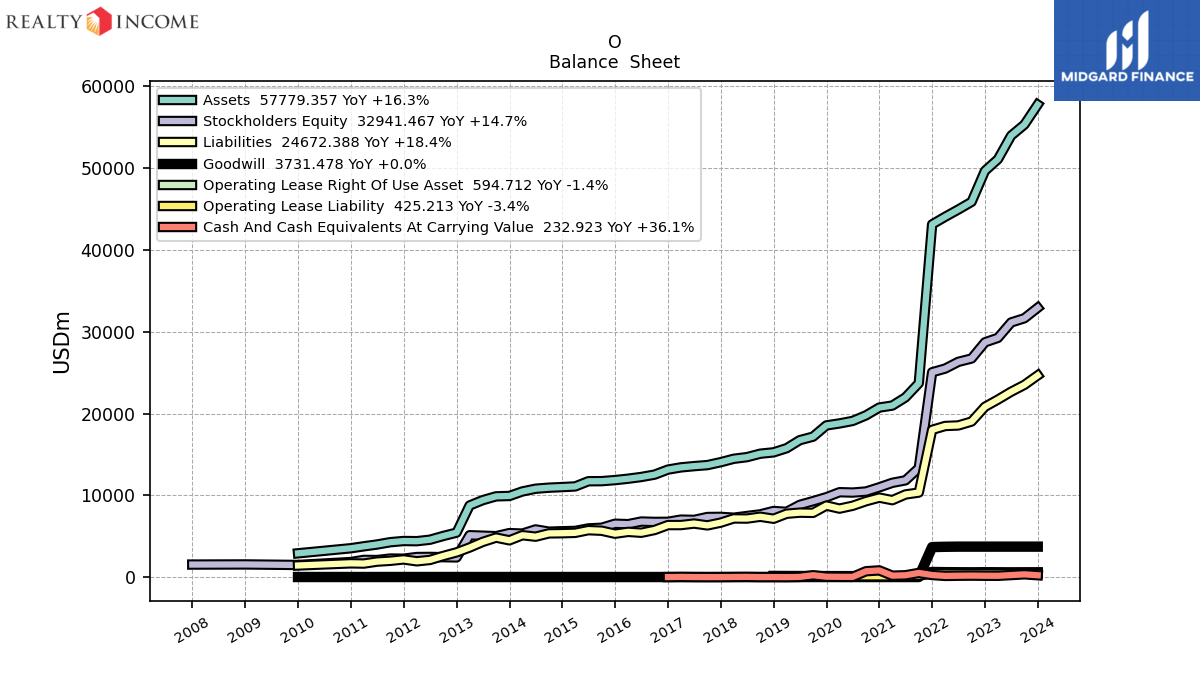
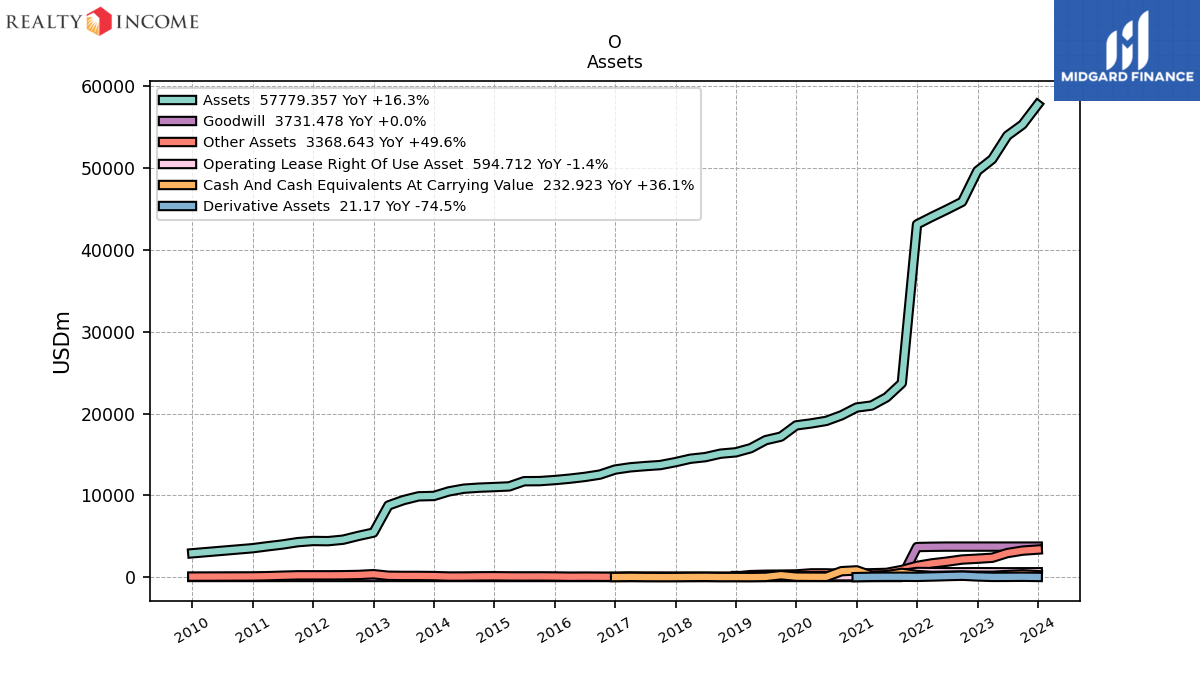
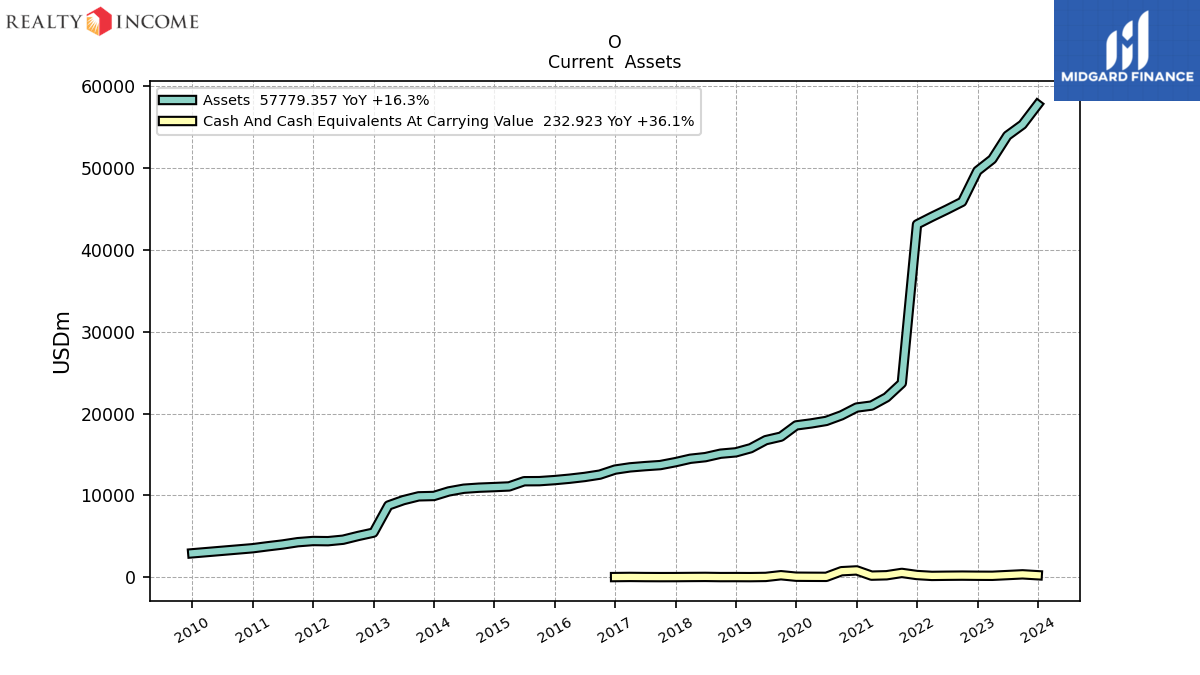
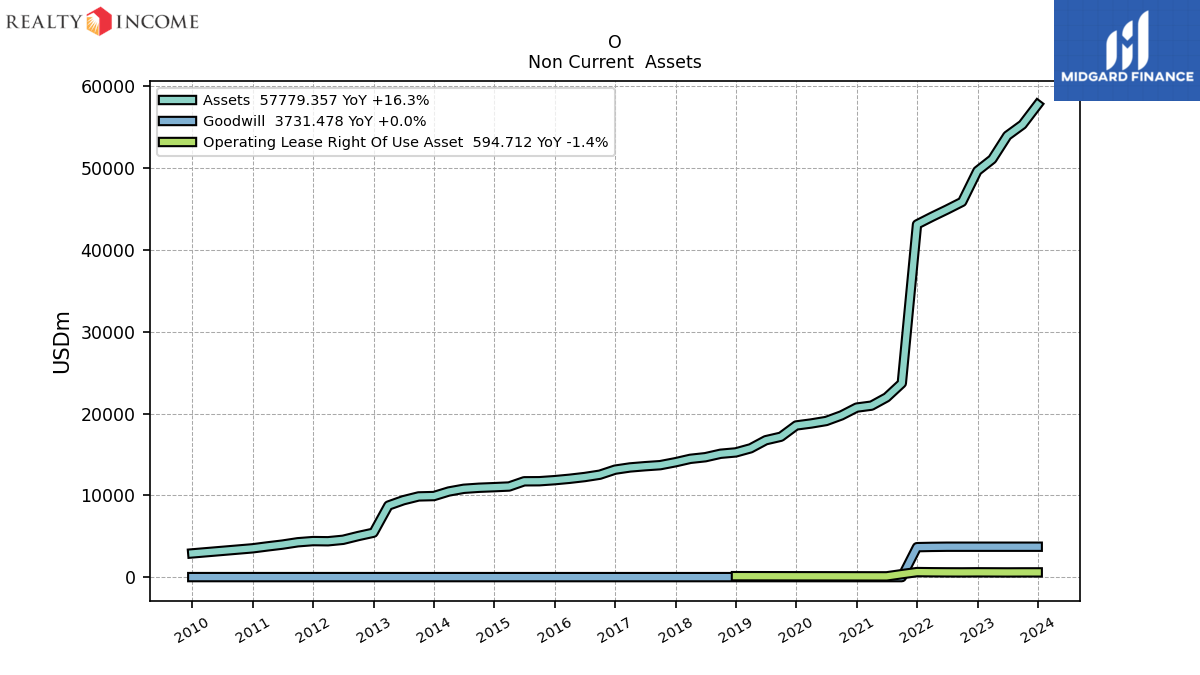
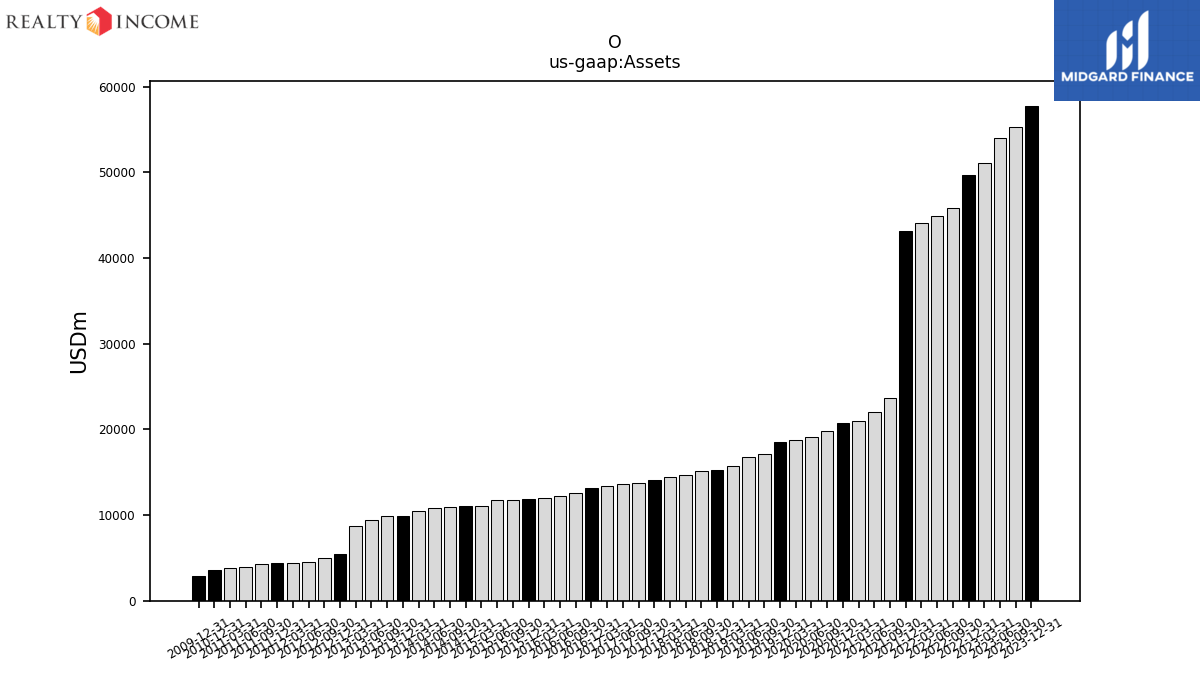
| Assets | 57779.36 | 55336.92 | 53980.67 | 51101.44 | 49673.09 | 45892.47 | 44951.92 | 44062.02 | 43137.50 | 23711.09 | 21984.94 | 20979.57 | 20740.28 | 19785.37 | 19102.55 | 18796.44 | 18554.80 | 17179.90 | 16748.63 | 15762.91 | 15260.48 | 15095.33 | 14674.07 | 14474.09 | 14058.17 | 13701.42 | 13574.12 | 13422.19 | 4398.43 | 4419.39 | 4274.77 | 3991.05 | 3770.56 | 3535.59 | NA | NA | NA | |
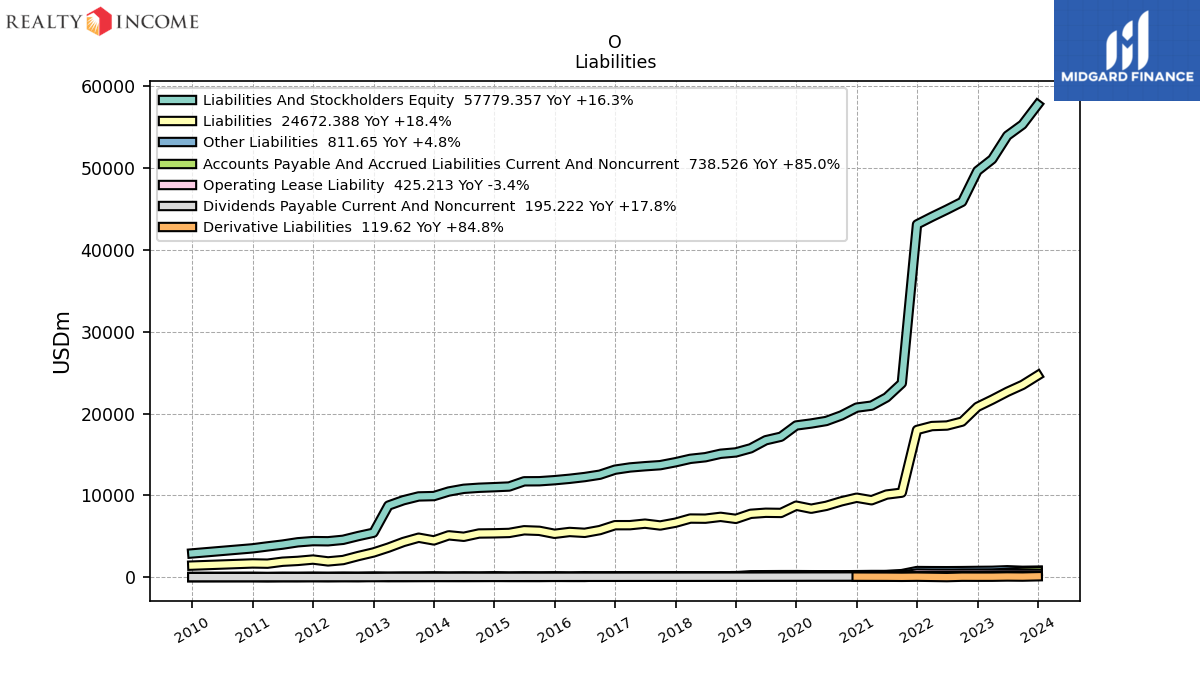
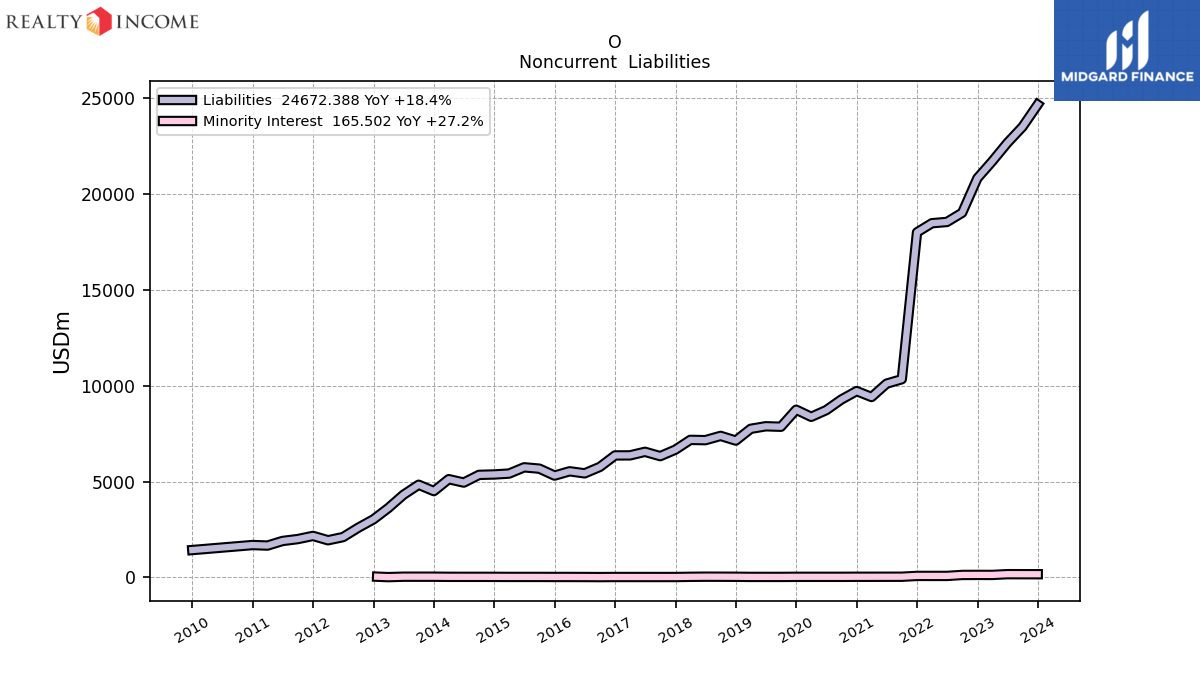
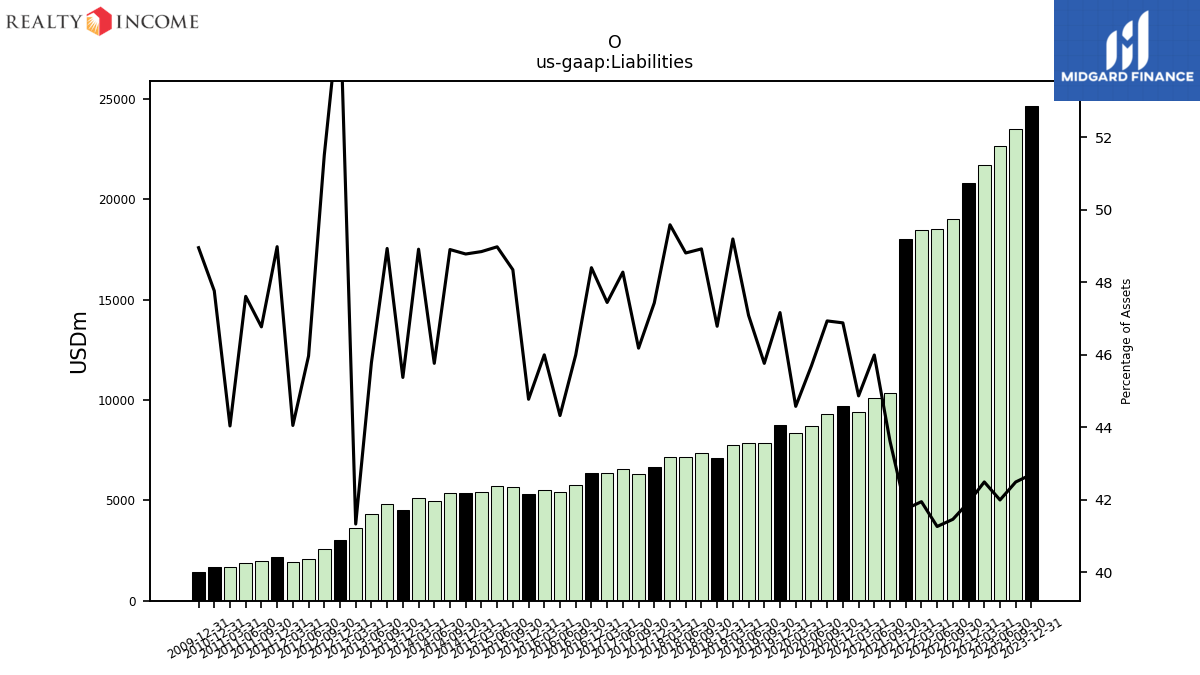
| Liabilities | 24672.39 | 23513.50 | 22669.52 | 21714.10 | 20829.80 | 19028.22 | 18549.04 | 18483.29 | 18008.10 | 10341.98 | 10111.26 | 9412.56 | 9722.56 | 9285.58 | 8728.63 | 8378.80 | 8750.64 | 7861.81 | 7886.04 | 7753.83 | 7139.51 | 7384.07 | 7161.60 | 7176.43 | 6667.46 | 6327.49 | 6553.06 | 6367.46 | 1937.49 | 2164.53 | 1999.23 | 1900.06 | 1660.41 | 1688.62 | NA | NA | NA | |
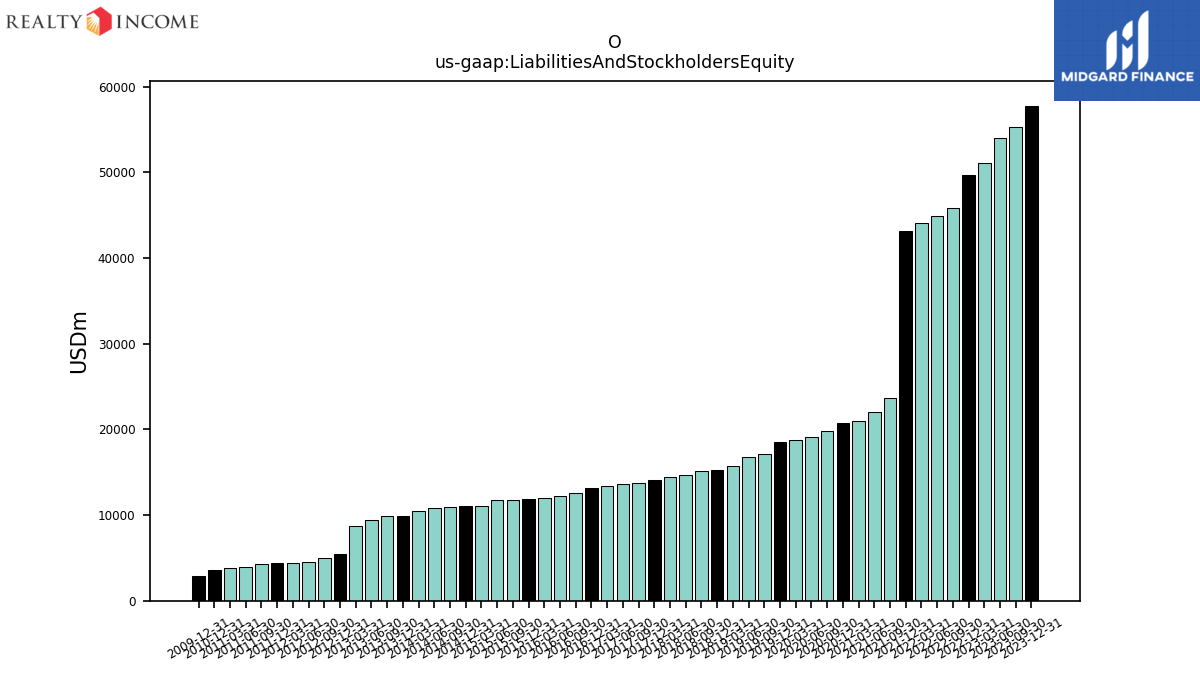
| Liabilities And Stockholders Equity | 57779.36 | 55336.92 | 53980.67 | 51101.44 | 49673.09 | 45892.47 | 44951.92 | 44062.02 | 43137.50 | 23711.09 | 21984.94 | 20979.57 | 20740.28 | 19785.37 | 19102.55 | 18796.44 | 18554.80 | 17179.90 | 16748.63 | 15762.91 | 15260.48 | 15095.33 | 14674.07 | 14474.09 | 14058.17 | 13701.42 | 13574.12 | 13422.19 | 4398.43 | 4419.39 | 4274.77 | 3991.05 | 3770.56 | 3535.59 | NA | NA | NA | |
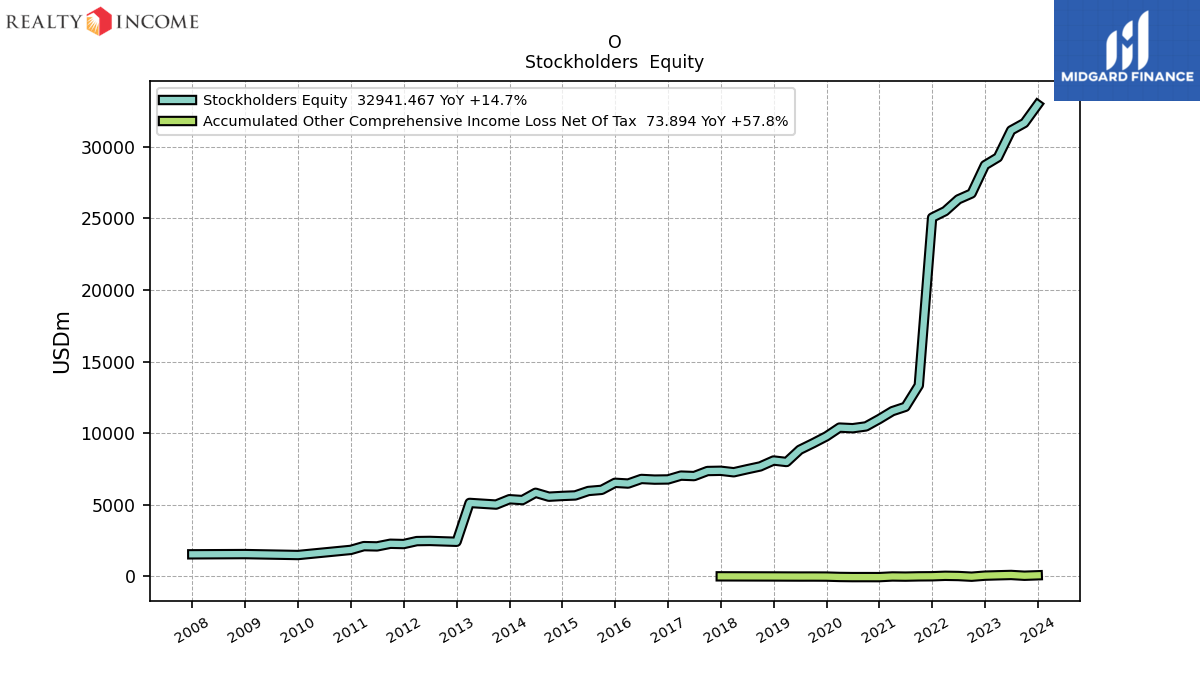
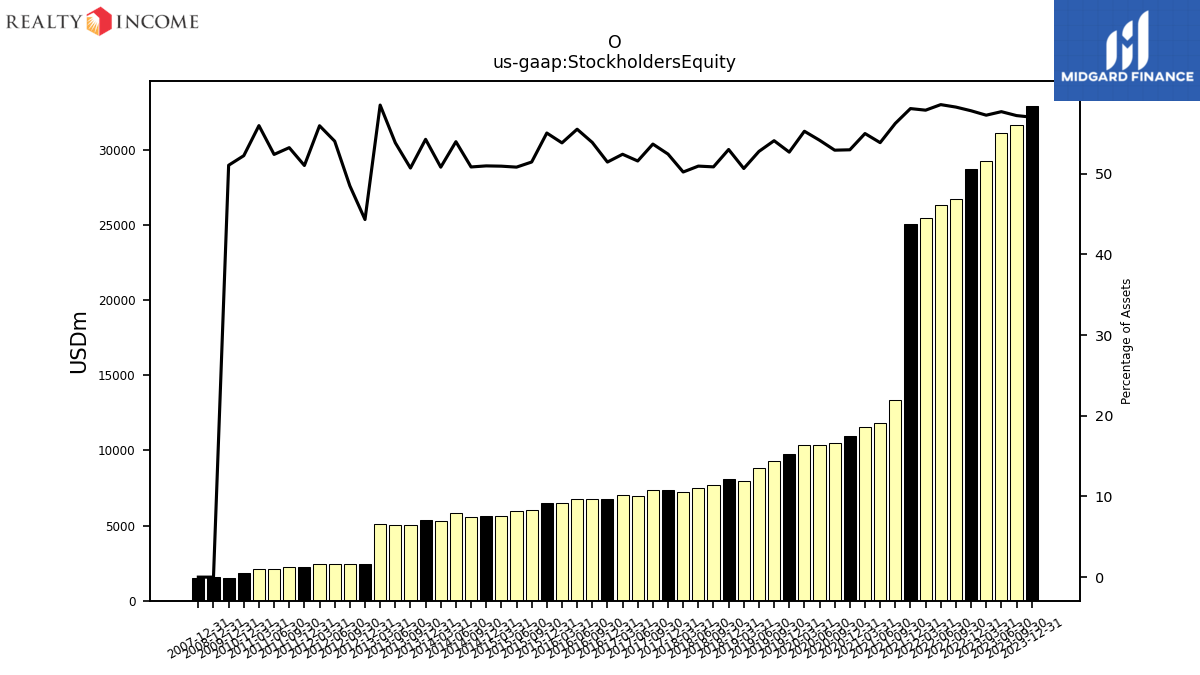
| Stockholders Equity | 32941.47 | 31657.14 | 31143.21 | 29259.11 | 28713.15 | 26737.12 | 26326.61 | 25502.18 | 25052.57 | 13335.09 | 11839.53 | 11534.87 | 10985.48 | 10470.53 | 10344.45 | 10388.01 | 9774.46 | 9293.42 | 8837.50 | 7983.90 | 8088.74 | 7676.24 | 7475.75 | 7267.98 | 7371.50 | 7354.43 | 7001.41 | 7034.94 | 2460.94 | 2254.85 | 2275.54 | 2090.99 | 2110.15 | 1846.96 | NA | NA | NA |
| 2023-12-31 | 2023-09-30 | 2023-06-30 | 2023-03-31 | 2022-12-31 | 2022-09-30 | 2022-06-30 | 2022-03-31 | 2021-12-31 | 2021-09-30 | 2021-06-30 | 2021-03-31 | 2020-12-31 | 2020-09-30 | 2020-06-30 | 2020-03-31 | 2019-12-31 | 2019-09-30 | 2019-06-30 | 2019-03-31 | 2018-12-31 | 2018-09-30 | 2018-06-30 | 2018-03-31 | 2017-12-31 | 2017-09-30 | 2017-06-30 | 2017-03-31 | 2012-03-31 | 2011-12-31 | 2011-09-30 | 2011-06-30 | 2011-03-31 | 2010-12-31 | 2010-09-30 | 2010-06-30 | 2010-03-31 | ||
|---|---|---|---|---|---|---|---|---|---|---|---|---|---|---|---|---|---|---|---|---|---|---|---|---|---|---|---|---|---|---|---|---|---|---|---|---|---|---|
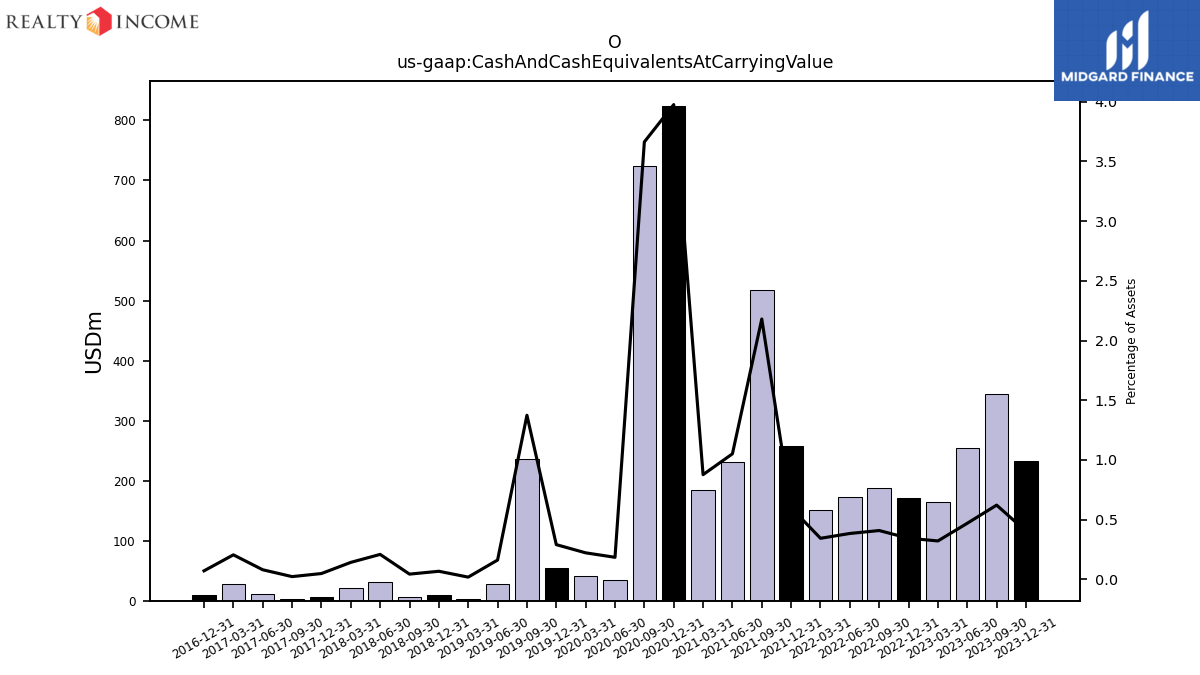
| Cash And Cash Equivalents At Carrying Value | 232.92 | 344.13 | 253.69 | 164.58 | 171.10 | 187.75 | 172.85 | 151.62 | 258.58 | 516.98 | 231.16 | 183.98 | 824.48 | 724.75 | 35.34 | 41.80 | 54.01 | 236.06 | 27.14 | 3.00 | 10.39 | 6.67 | 30.72 | 20.63 | 6.90 | 3.20 | 10.95 | 27.60 | NA | NA | NA | NA | NA | NA | NA | NA | NA | |
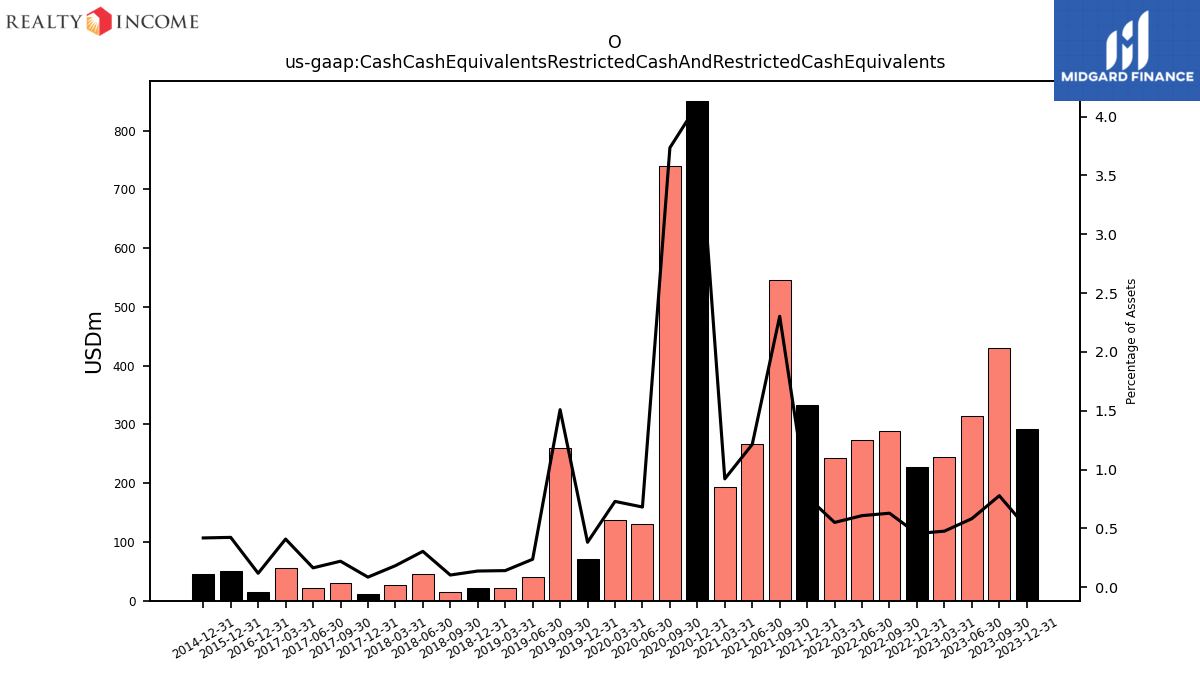
| Cash Cash Equivalents Restricted Cash And Restricted Cash Equivalents | 292.18 | 430.66 | 314.86 | 243.76 | 226.88 | 288.91 | 273.67 | 242.85 | 332.37 | 546.10 | 266.99 | 193.33 | 850.68 | 739.01 | 130.32 | 137.16 | 71.00 | 259.29 | 39.89 | 22.33 | 21.07 | 15.73 | 44.80 | 26.58 | 12.14 | 30.36 | 22.41 | 55.00 | NA | NA | NA | NA | NA | NA | NA | NA | NA | |
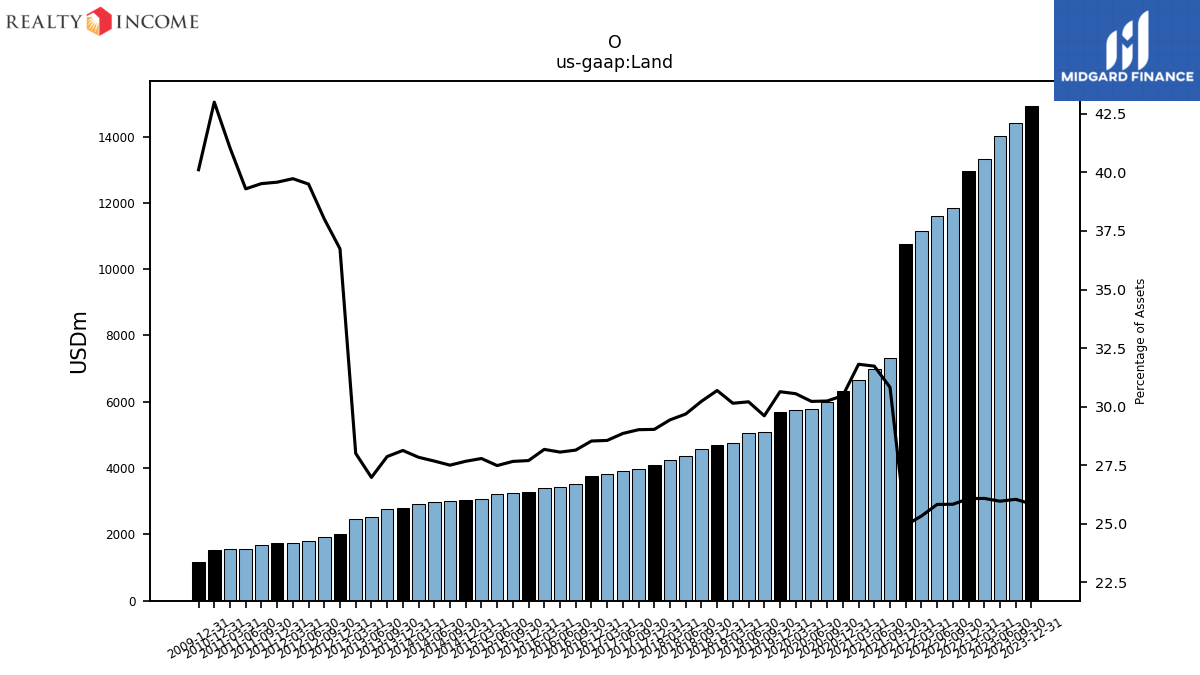
| Land | 14929.31 | 14408.32 | 14011.33 | 13324.93 | 12948.83 | 11852.06 | 11605.93 | 11158.55 | 10753.75 | 7308.05 | 6975.01 | 6672.89 | 6318.93 | 5982.49 | 5772.73 | 5742.02 | 5684.03 | 5085.95 | 5058.57 | 4751.09 | 4682.66 | 4562.34 | 4355.45 | 4259.91 | 4080.40 | 3974.97 | 3916.22 | 3832.45 | 1747.66 | 1749.38 | 1689.52 | 1568.48 | 1547.90 | 1520.41 | NA | NA | NA |
| 2023-12-31 | 2023-09-30 | 2023-06-30 | 2023-03-31 | 2022-12-31 | 2022-09-30 | 2022-06-30 | 2022-03-31 | 2021-12-31 | 2021-09-30 | 2021-06-30 | 2021-03-31 | 2020-12-31 | 2020-09-30 | 2020-06-30 | 2020-03-31 | 2019-12-31 | 2019-09-30 | 2019-06-30 | 2019-03-31 | 2018-12-31 | 2018-09-30 | 2018-06-30 | 2018-03-31 | 2017-12-31 | 2017-09-30 | 2017-06-30 | 2017-03-31 | 2012-03-31 | 2011-12-31 | 2011-09-30 | 2011-06-30 | 2011-03-31 | 2010-12-31 | 2010-09-30 | 2010-06-30 | 2010-03-31 | ||
|---|---|---|---|---|---|---|---|---|---|---|---|---|---|---|---|---|---|---|---|---|---|---|---|---|---|---|---|---|---|---|---|---|---|---|---|---|---|---|
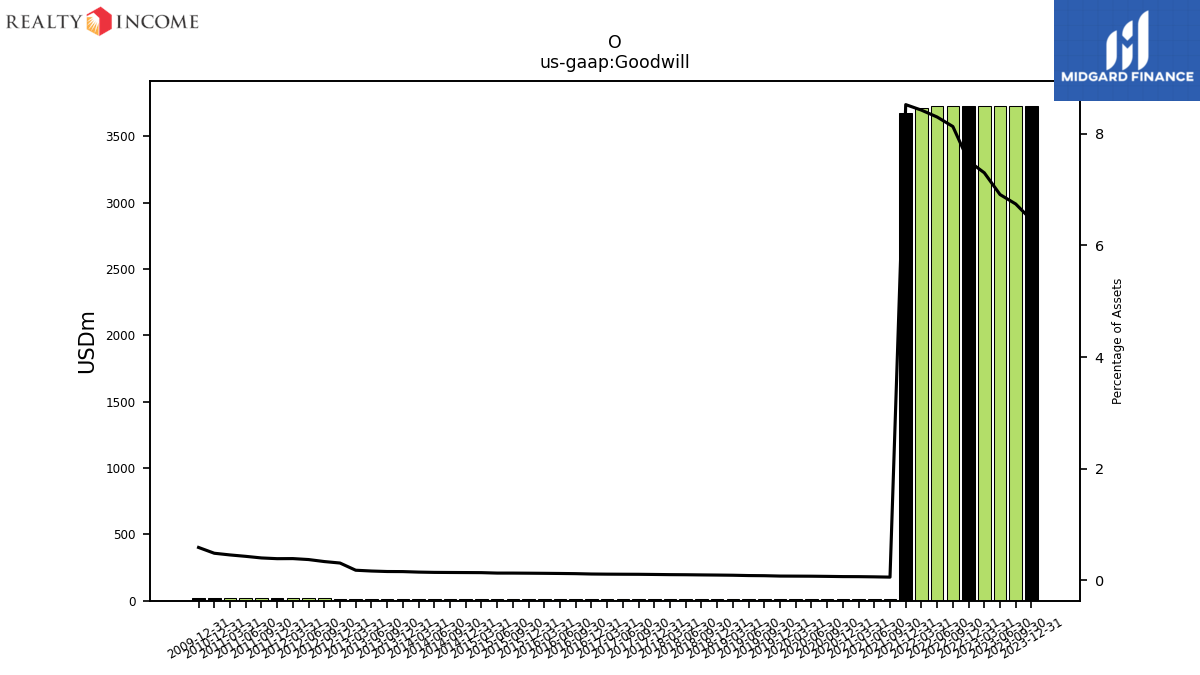
| Goodwill | 3731.48 | 3731.48 | 3731.48 | 3731.48 | 3731.48 | 3731.48 | 3731.48 | 3711.98 | 3676.70 | 13.95 | 14.02 | 14.11 | 14.18 | 14.28 | 14.38 | 14.40 | 14.43 | 14.50 | 14.54 | 14.60 | 14.63 | 14.86 | 14.90 | 14.94 | 14.97 | 14.99 | 15.00 | 15.04 | 17.19 | 17.21 | 17.21 | 17.21 | 17.21 | 17.21 | NA | NA | NA | |
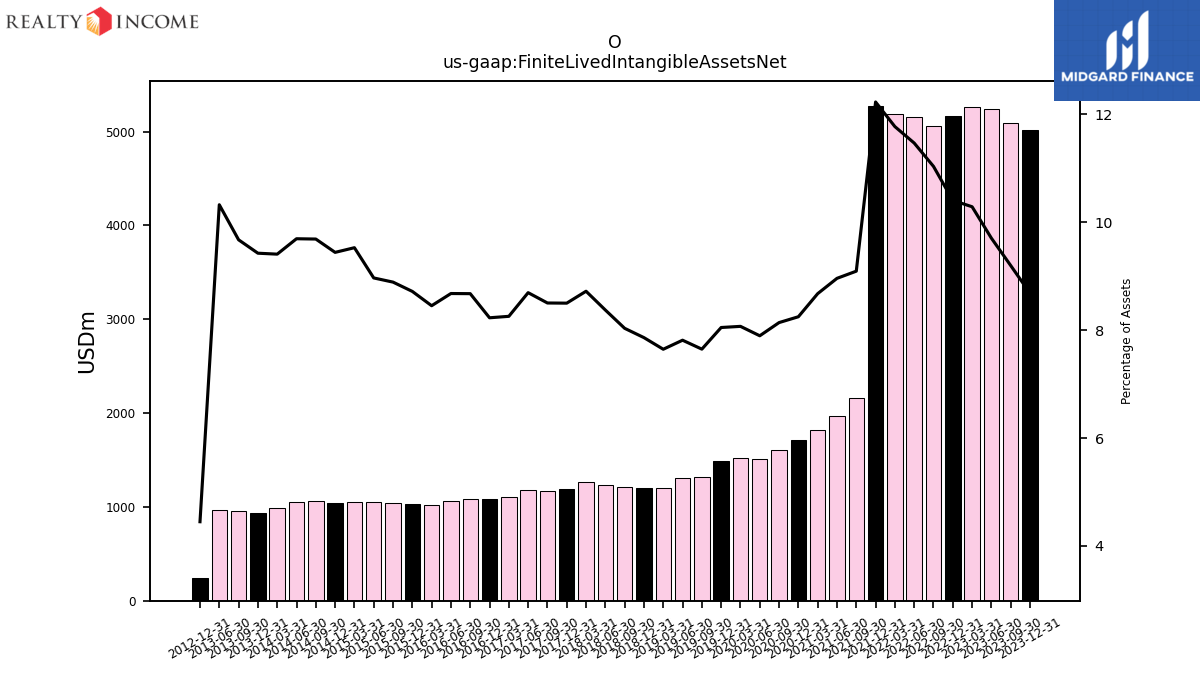
| Finite Lived Intangible Assets Net | 5017.91 | 5089.29 | 5238.40 | 5256.80 | 5168.37 | 5064.32 | 5154.99 | 5187.28 | 5275.30 | 2156.01 | 1969.79 | 1820.15 | 1710.65 | 1610.46 | 1508.18 | 1516.82 | 1493.38 | 1313.80 | 1308.56 | 1205.15 | 1199.60 | 1212.68 | 1228.58 | 1262.25 | 1194.93 | 1165.01 | 1180.18 | 1108.10 | NA | NA | NA | NA | NA | NA | NA | NA | NA |
| 2023-12-31 | 2023-09-30 | 2023-06-30 | 2023-03-31 | 2022-12-31 | 2022-09-30 | 2022-06-30 | 2022-03-31 | 2021-12-31 | 2021-09-30 | 2021-06-30 | 2021-03-31 | 2020-12-31 | 2020-09-30 | 2020-06-30 | 2020-03-31 | 2019-12-31 | 2019-09-30 | 2019-06-30 | 2019-03-31 | 2018-12-31 | 2018-09-30 | 2018-06-30 | 2018-03-31 | 2017-12-31 | 2017-09-30 | 2017-06-30 | 2017-03-31 | 2012-03-31 | 2011-12-31 | 2011-09-30 | 2011-06-30 | 2011-03-31 | 2010-12-31 | 2010-09-30 | 2010-06-30 | 2010-03-31 | ||
|---|---|---|---|---|---|---|---|---|---|---|---|---|---|---|---|---|---|---|---|---|---|---|---|---|---|---|---|---|---|---|---|---|---|---|---|---|---|---|
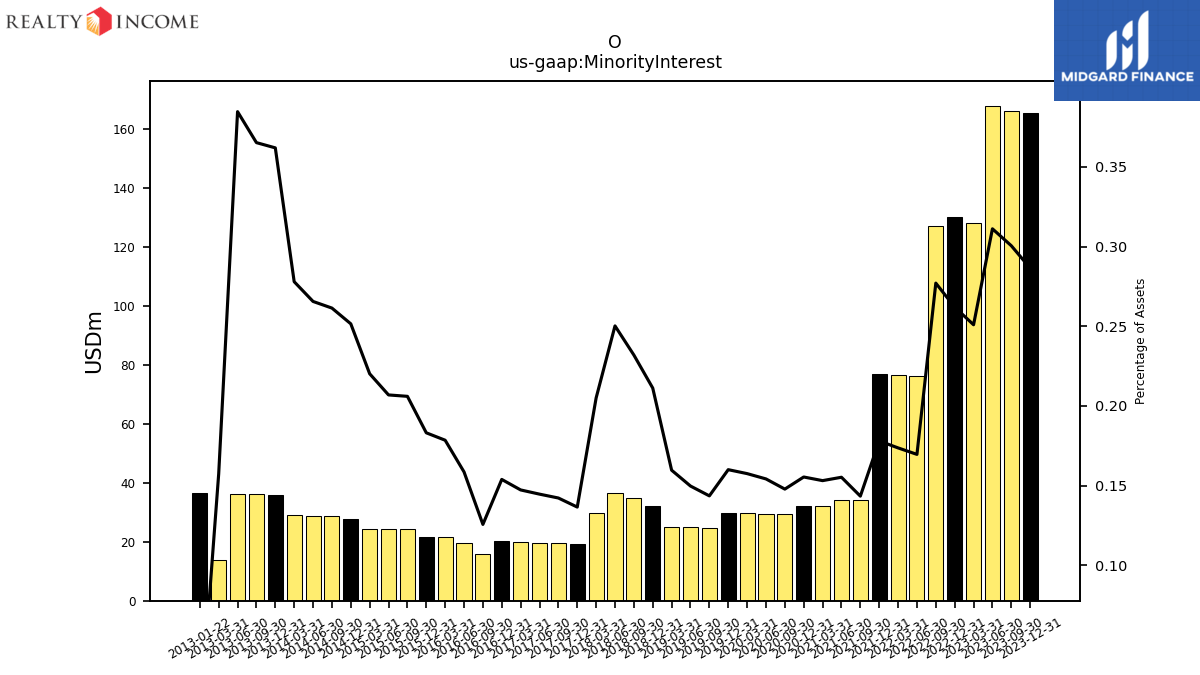
| Minority Interest | 165.50 | 166.27 | 167.93 | 128.23 | 130.14 | 127.14 | 76.27 | 76.55 | 76.83 | 34.02 | 34.15 | 32.14 | 32.25 | 29.26 | 29.47 | 29.62 | 29.70 | 24.68 | 25.09 | 25.18 | 32.24 | 35.01 | 36.72 | 29.68 | 19.21 | 19.50 | 19.65 | 19.78 | NA | NA | NA | NA | NA | NA | NA | NA | NA |
| 2023-12-31 | 2023-09-30 | 2023-06-30 | 2023-03-31 | 2022-12-31 | 2022-09-30 | 2022-06-30 | 2022-03-31 | 2021-12-31 | 2021-09-30 | 2021-06-30 | 2021-03-31 | 2020-12-31 | 2020-09-30 | 2020-06-30 | 2020-03-31 | 2019-12-31 | 2019-09-30 | 2019-06-30 | 2019-03-31 | 2018-12-31 | 2018-09-30 | 2018-06-30 | 2018-03-31 | 2017-12-31 | 2017-09-30 | 2017-06-30 | 2017-03-31 | 2012-03-31 | 2011-12-31 | 2011-09-30 | 2011-06-30 | 2011-03-31 | 2010-12-31 | 2010-09-30 | 2010-06-30 | 2010-03-31 | ||
|---|---|---|---|---|---|---|---|---|---|---|---|---|---|---|---|---|---|---|---|---|---|---|---|---|---|---|---|---|---|---|---|---|---|---|---|---|---|---|
| Stockholders Equity | 32941.47 | 31657.14 | 31143.21 | 29259.11 | 28713.15 | 26737.12 | 26326.61 | 25502.18 | 25052.57 | 13335.09 | 11839.53 | 11534.87 | 10985.48 | 10470.53 | 10344.45 | 10388.01 | 9774.46 | 9293.42 | 8837.50 | 7983.90 | 8088.74 | 7676.24 | 7475.75 | 7267.98 | 7371.50 | 7354.43 | 7001.41 | 7034.94 | 2460.94 | 2254.85 | 2275.54 | 2090.99 | 2110.15 | 1846.96 | NA | NA | NA | |
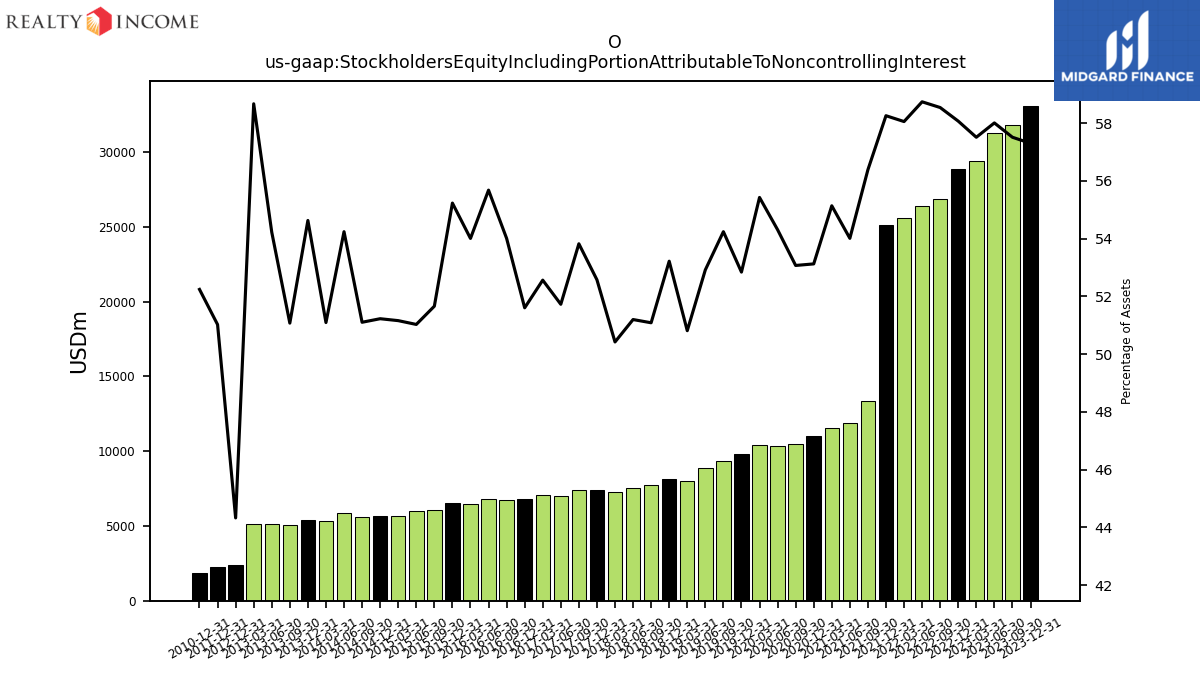
| Stockholders Equity Including Portion Attributable To Noncontrolling Interest | 33106.97 | 31823.42 | 31311.14 | 29387.34 | 28843.29 | 26864.26 | 26402.88 | 25578.72 | 25129.40 | 13369.11 | 11873.68 | 11567.01 | 11017.73 | 10499.79 | 10373.92 | 10417.64 | 9804.16 | 9318.10 | 8862.59 | 8009.08 | 8120.98 | 7711.25 | 7512.47 | 7297.66 | 7390.71 | 7373.93 | 7021.05 | 7054.72 | NA | 2254.85 | NA | NA | NA | 1846.96 | NA | NA | NA | |
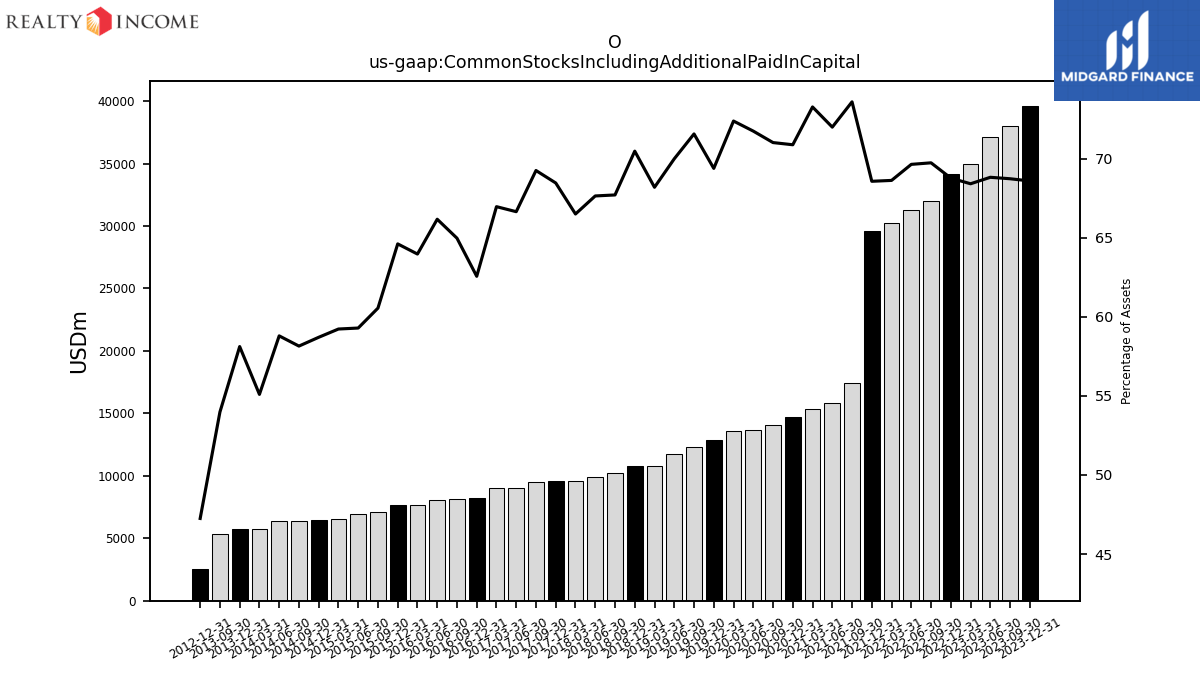
| Common Stocks Including Additional Paid In Capital | 39629.71 | 38031.83 | 37149.38 | 34958.61 | 34159.51 | 32003.07 | 31303.38 | 30236.37 | 29578.21 | 17449.12 | 15827.23 | 15371.02 | 14700.05 | 14050.49 | 13704.12 | 13604.06 | 12873.85 | 12294.14 | 11722.04 | 10748.47 | 10754.50 | 10220.09 | 9925.54 | 9625.20 | 9624.26 | 9488.04 | 9046.53 | 8987.93 | NA | NA | NA | NA | NA | NA | NA | NA | NA | |
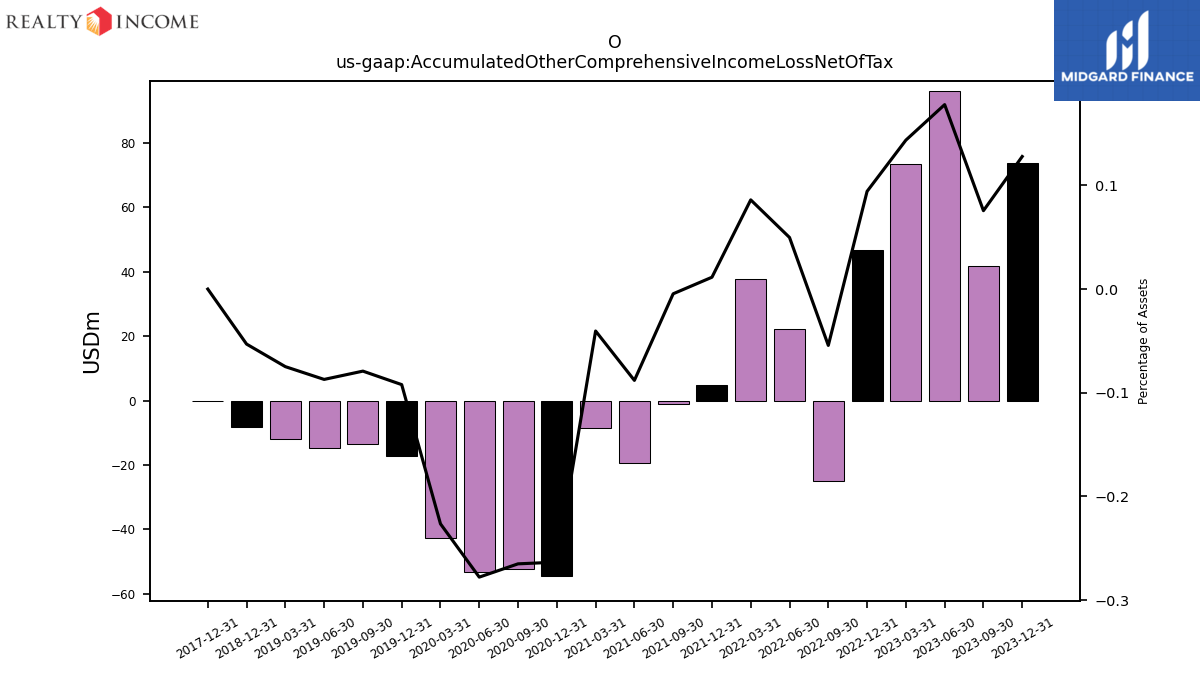
| Accumulated Other Comprehensive Income Loss Net Of Tax | 73.89 | 41.85 | 96.06 | 73.42 | 46.83 | -24.94 | 22.38 | 37.92 | 4.93 | -1.08 | -19.37 | -8.48 | -54.63 | -52.45 | -53.08 | -42.57 | -17.10 | -13.60 | -14.60 | -11.80 | -8.10 | NA | NA | NA | 0.00 | NA | NA | NA | NA | NA | NA | NA | NA | NA | NA | NA | NA | |
| Minority Interest | 165.50 | 166.27 | 167.93 | 128.23 | 130.14 | 127.14 | 76.27 | 76.55 | 76.83 | 34.02 | 34.15 | 32.14 | 32.25 | 29.26 | 29.47 | 29.62 | 29.70 | 24.68 | 25.09 | 25.18 | 32.24 | 35.01 | 36.72 | 29.68 | 19.21 | 19.50 | 19.65 | 19.78 | NA | NA | NA | NA | NA | NA | NA | NA | NA | |
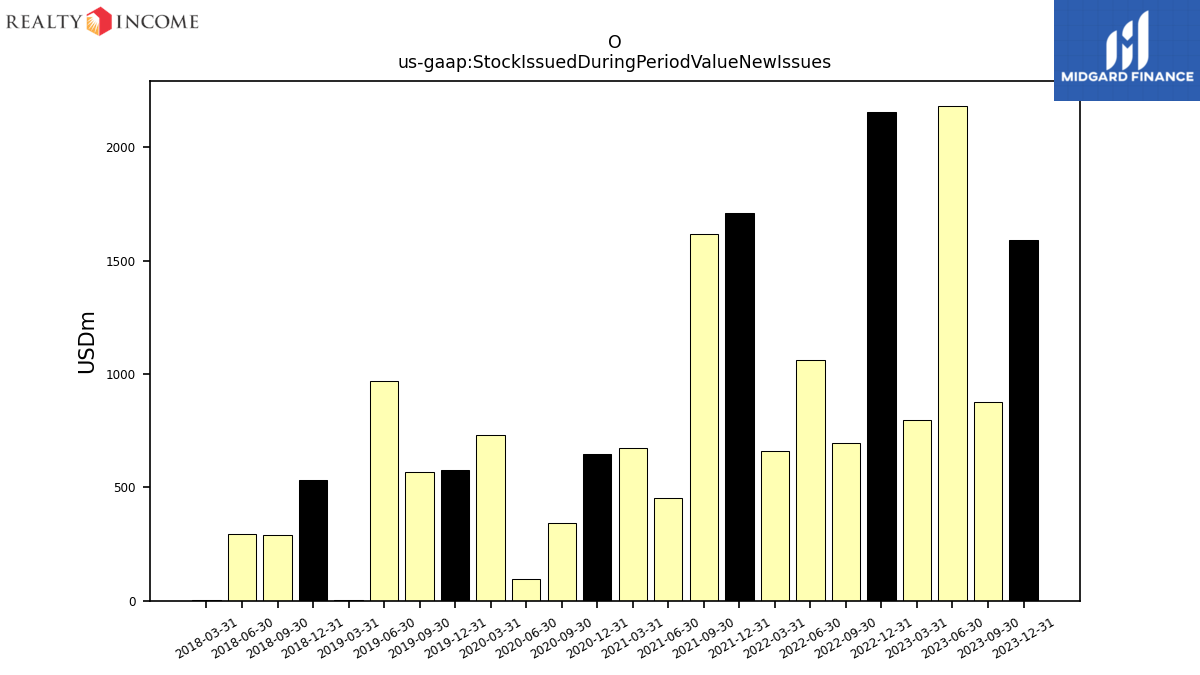
| Stock Issued During Period Value New Issues | 1592.63 | 876.25 | 2183.19 | 798.90 | 2155.49 | 694.71 | 1060.53 | 660.04 | 1710.91 | 1618.46 | 452.36 | 672.22 | 646.87 | 343.33 | 97.00 | 730.78 | 577.05 | 569.62 | 969.16 | 2.15 | 531.73 | 289.45 | 295.90 | 2.22 | NA | NA | NA | NA | NA | NA | NA | NA | NA | NA | NA | NA | NA | |
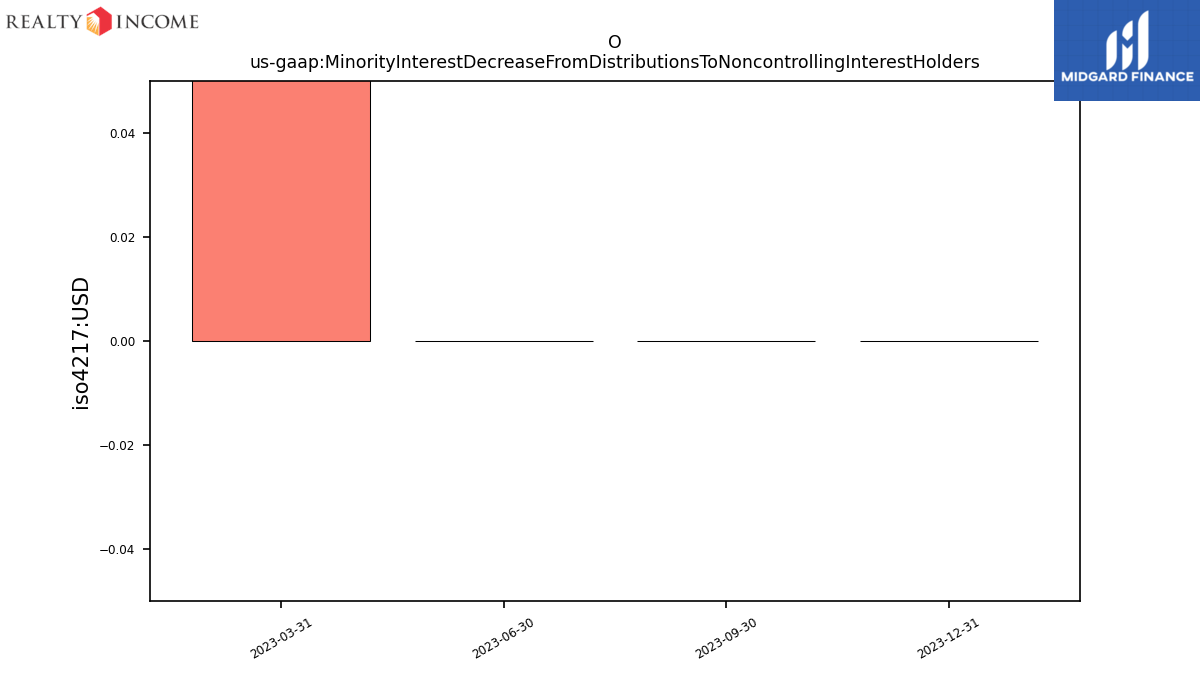
| Minority Interest Decrease From Distributions To Noncontrolling Interest Holders | 0.00 | 0.00 | 0.00 | 1.50 | NA | NA | NA | NA | NA | NA | NA | NA | NA | NA | NA | NA | NA | NA | NA | NA | NA | NA | NA | NA | NA | NA | NA | NA | NA | NA | NA | NA | NA | NA | NA | NA | NA |
| 2023-12-31 | 2023-09-30 | 2023-06-30 | 2023-03-31 | 2022-12-31 | 2022-09-30 | 2022-06-30 | 2022-03-31 | 2021-12-31 | 2021-09-30 | 2021-06-30 | 2021-03-31 | 2020-12-31 | 2020-09-30 | 2020-06-30 | 2020-03-31 | 2019-12-31 | 2019-09-30 | 2019-06-30 | 2019-03-31 | 2018-12-31 | 2018-09-30 | 2018-06-30 | 2018-03-31 | 2017-12-31 | 2017-09-30 | 2017-06-30 | 2017-03-31 | 2012-03-31 | 2011-12-31 | 2011-09-30 | 2011-06-30 | 2011-03-31 | 2010-12-31 | 2010-09-30 | 2010-06-30 | 2010-03-31 | ||
|---|---|---|---|---|---|---|---|---|---|---|---|---|---|---|---|---|---|---|---|---|---|---|---|---|---|---|---|---|---|---|---|---|---|---|---|---|---|---|
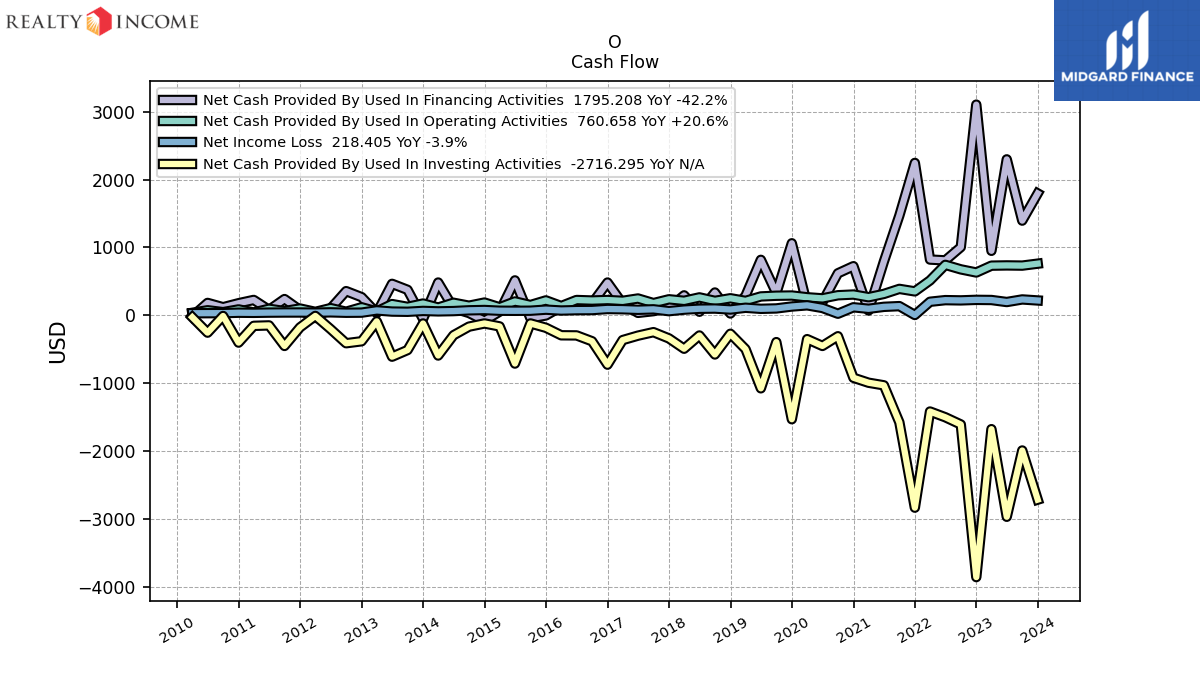
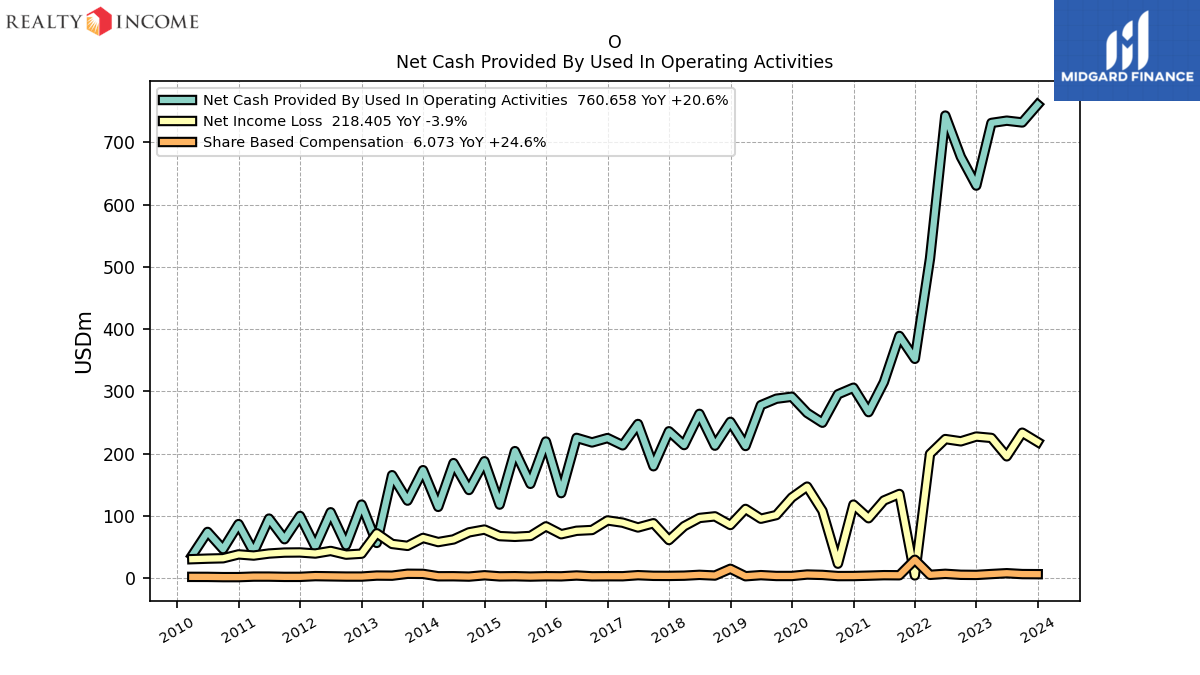
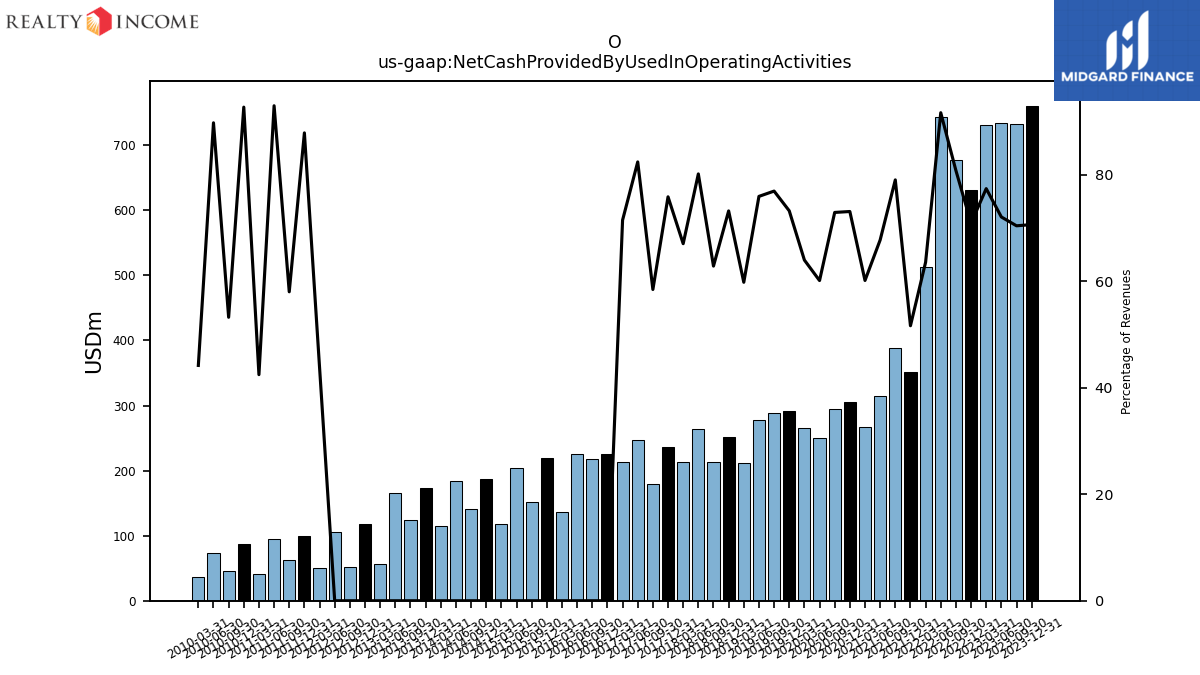
| Net Cash Provided By Used In Operating Activities | 760.66 | 732.00 | 734.88 | 731.23 | 630.49 | 676.80 | 743.08 | 513.48 | 352.12 | 388.93 | 314.68 | 266.45 | 305.74 | 295.16 | 249.43 | 265.22 | 291.23 | 288.04 | 277.64 | 212.03 | 250.90 | 212.57 | 263.74 | 213.53 | 235.75 | 179.48 | 247.49 | 213.13 | 50.33 | 99.70 | 62.28 | 95.44 | 41.53 | 86.61 | 46.24 | 73.99 | 36.53 | |
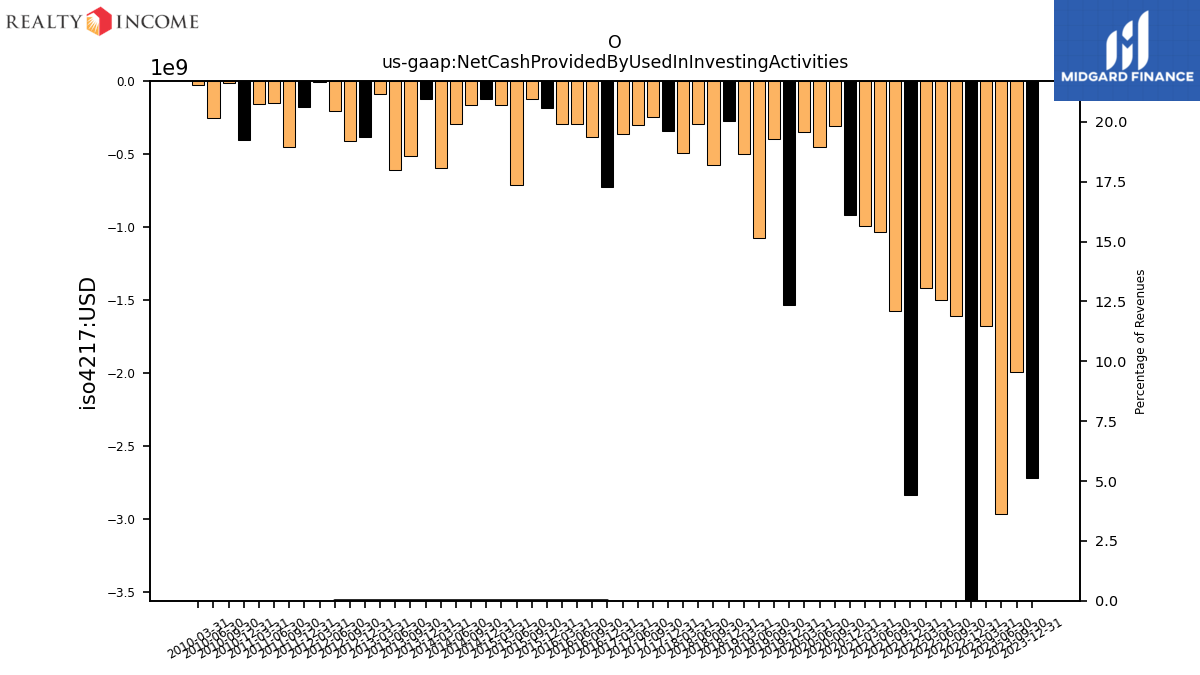
| Net Cash Provided By Used In Investing Activities | -2716.30 | -1991.95 | -2968.89 | -1677.72 | -3857.94 | -1608.64 | -1502.49 | -1418.01 | -2834.74 | -1577.38 | -1031.85 | -993.73 | -920.55 | -308.69 | -451.72 | -351.41 | -1531.74 | -395.16 | -1076.39 | -498.51 | -272.01 | -577.47 | -297.37 | -492.83 | -340.83 | -248.42 | -299.95 | -365.31 | -9.29 | -178.36 | -451.79 | -149.02 | -155.69 | -402.35 | -10.32 | -256.17 | -28.52 | |
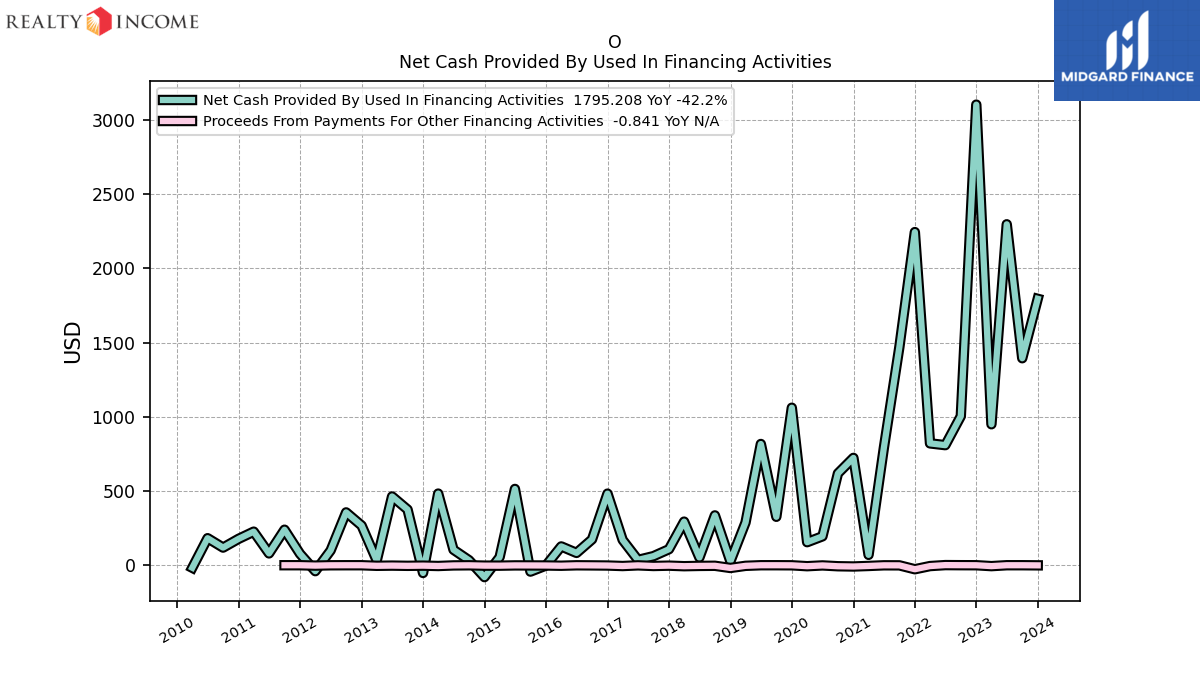
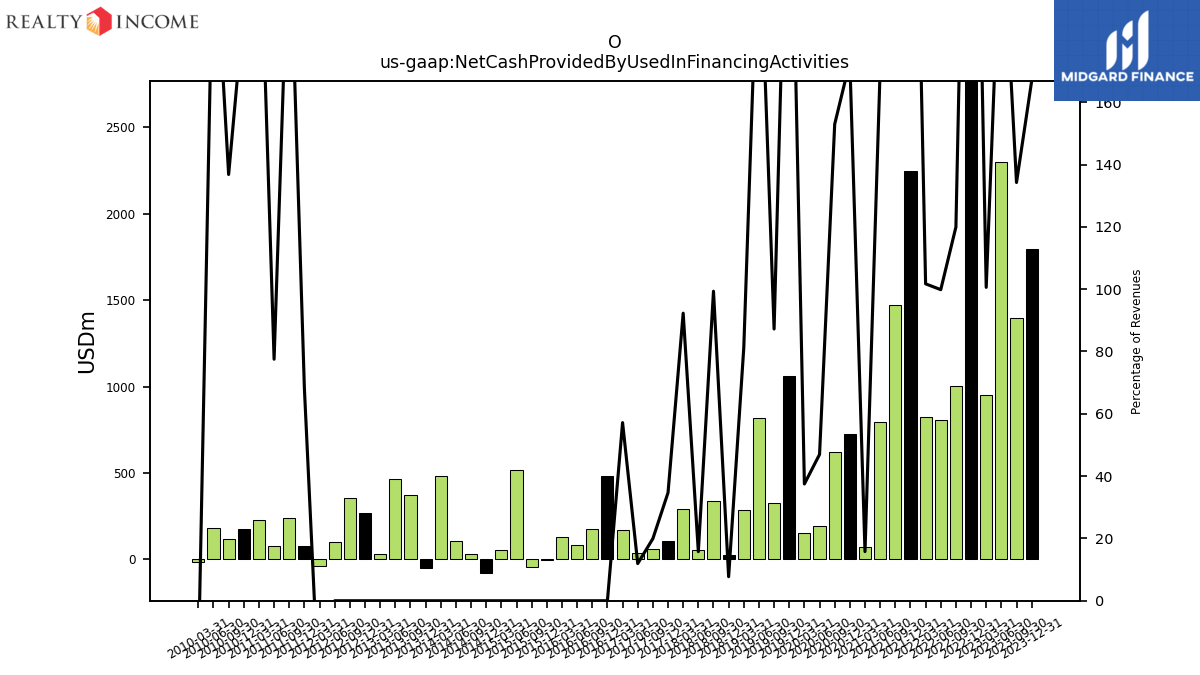
| Net Cash Provided By Used In Financing Activities | 1795.21 | 1394.75 | 2297.58 | 949.82 | 3103.91 | 1004.14 | 809.11 | 821.07 | 2245.10 | 1470.24 | 791.90 | 69.88 | 723.32 | 618.78 | 194.70 | 155.28 | 1061.41 | 326.39 | 817.05 | 287.75 | 26.45 | 335.82 | 51.85 | 293.75 | 107.76 | 61.19 | 35.81 | 170.36 | -40.01 | 77.28 | 239.38 | 79.55 | 226.27 | 177.77 | 118.78 | 182.20 | -17.18 |
| 2023-12-31 | 2023-09-30 | 2023-06-30 | 2023-03-31 | 2022-12-31 | 2022-09-30 | 2022-06-30 | 2022-03-31 | 2021-12-31 | 2021-09-30 | 2021-06-30 | 2021-03-31 | 2020-12-31 | 2020-09-30 | 2020-06-30 | 2020-03-31 | 2019-12-31 | 2019-09-30 | 2019-06-30 | 2019-03-31 | 2018-12-31 | 2018-09-30 | 2018-06-30 | 2018-03-31 | 2017-12-31 | 2017-09-30 | 2017-06-30 | 2017-03-31 | 2012-03-31 | 2011-12-31 | 2011-09-30 | 2011-06-30 | 2011-03-31 | 2010-12-31 | 2010-09-30 | 2010-06-30 | 2010-03-31 | ||
|---|---|---|---|---|---|---|---|---|---|---|---|---|---|---|---|---|---|---|---|---|---|---|---|---|---|---|---|---|---|---|---|---|---|---|---|---|---|---|
| Net Cash Provided By Used In Operating Activities | 760.66 | 732.00 | 734.88 | 731.23 | 630.49 | 676.80 | 743.08 | 513.48 | 352.12 | 388.93 | 314.68 | 266.45 | 305.74 | 295.16 | 249.43 | 265.22 | 291.23 | 288.04 | 277.64 | 212.03 | 250.90 | 212.57 | 263.74 | 213.53 | 235.75 | 179.48 | 247.49 | 213.13 | 50.33 | 99.70 | 62.28 | 95.44 | 41.53 | 86.61 | 46.24 | 73.99 | 36.53 | |
| Net Income Loss | 218.41 | 233.47 | 195.41 | 225.02 | 227.26 | 219.57 | 223.21 | 199.37 | 4.04 | 135.00 | 124.48 | 95.94 | 117.93 | 22.90 | 107.82 | 146.83 | 129.30 | 101.05 | 95.19 | 110.94 | 85.07 | 99.00 | 96.38 | 83.16 | 60.85 | 87.94 | 81.14 | 88.87 | 39.26 | 41.01 | 40.78 | 39.25 | 36.00 | 37.88 | 31.65 | 31.05 | 30.20 | |
| Profit Loss | 219.76 | 233.88 | 197.15 | 226.12 | 228.34 | 220.29 | 223.82 | 199.97 | 4.47 | 135.28 | 124.77 | 96.24 | 118.15 | 23.14 | 108.07 | 147.14 | 129.55 | 101.28 | 95.42 | 111.23 | 85.30 | 99.28 | 96.70 | 83.31 | 60.95 | 88.07 | 81.26 | 89.03 | 39.26 | NA | NA | NA | NA | NA | NA | NA | NA | |
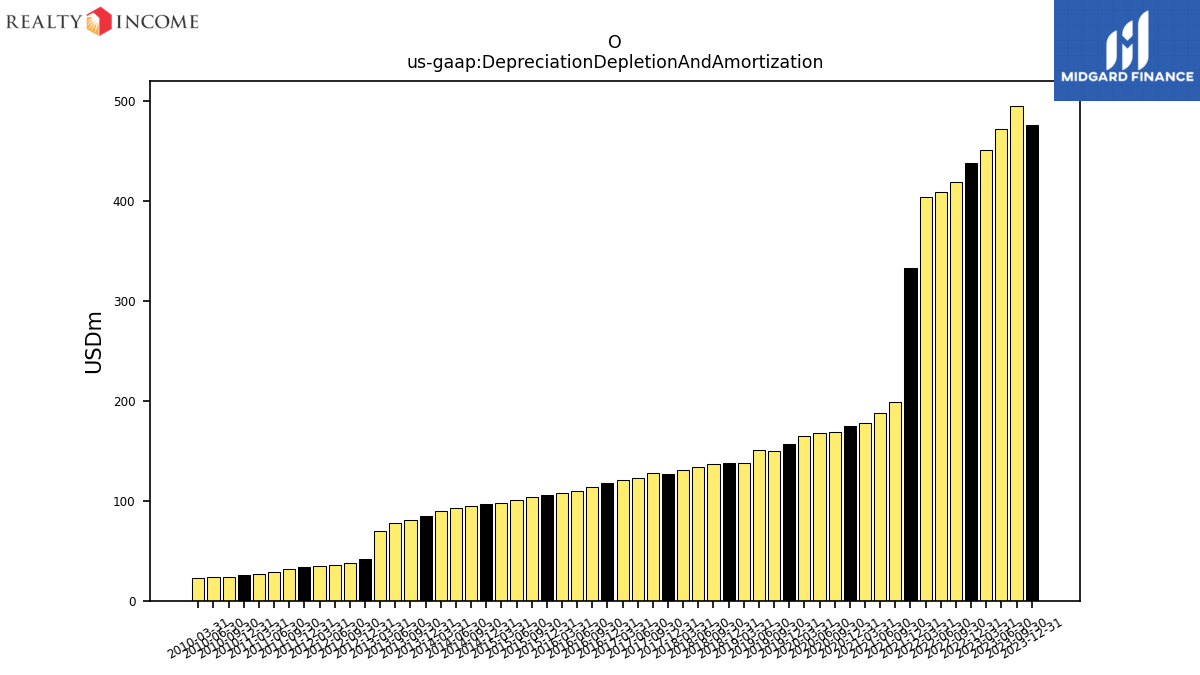
| Depreciation Depletion And Amortization | 475.86 | 495.57 | 472.28 | 451.48 | 438.17 | 419.02 | 409.44 | 403.76 | 333.23 | 198.83 | 187.79 | 177.99 | 175.04 | 169.08 | 168.33 | 164.59 | 156.59 | 149.42 | 150.43 | 137.52 | 137.71 | 136.97 | 134.00 | 131.10 | 127.03 | 127.57 | 123.09 | 121.10 | 35.25 | 34.21 | 31.87 | 29.00 | 26.81 | 25.37 | 23.94 | 23.29 | 23.04 | |
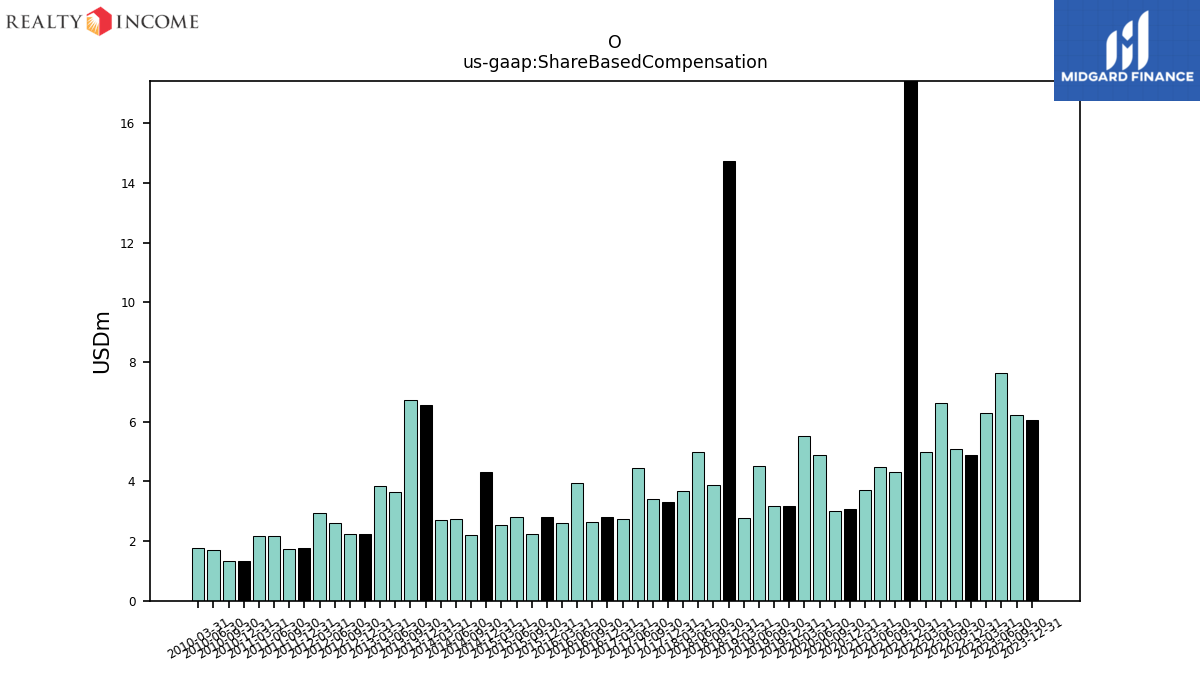
| Share Based Compensation | 6.07 | 6.23 | 7.62 | 6.30 | 4.88 | 5.10 | 6.64 | 5.00 | 29.29 | 4.32 | 4.47 | 3.70 | 3.08 | 3.02 | 4.88 | 5.52 | 3.18 | 3.19 | 4.53 | 2.76 | 14.74 | 3.87 | 5.00 | 3.66 | 3.31 | 3.43 | 4.46 | 2.75 | 2.96 | 1.77 | 1.75 | 2.17 | 2.18 | 1.34 | 1.35 | 1.72 | 1.76 | |
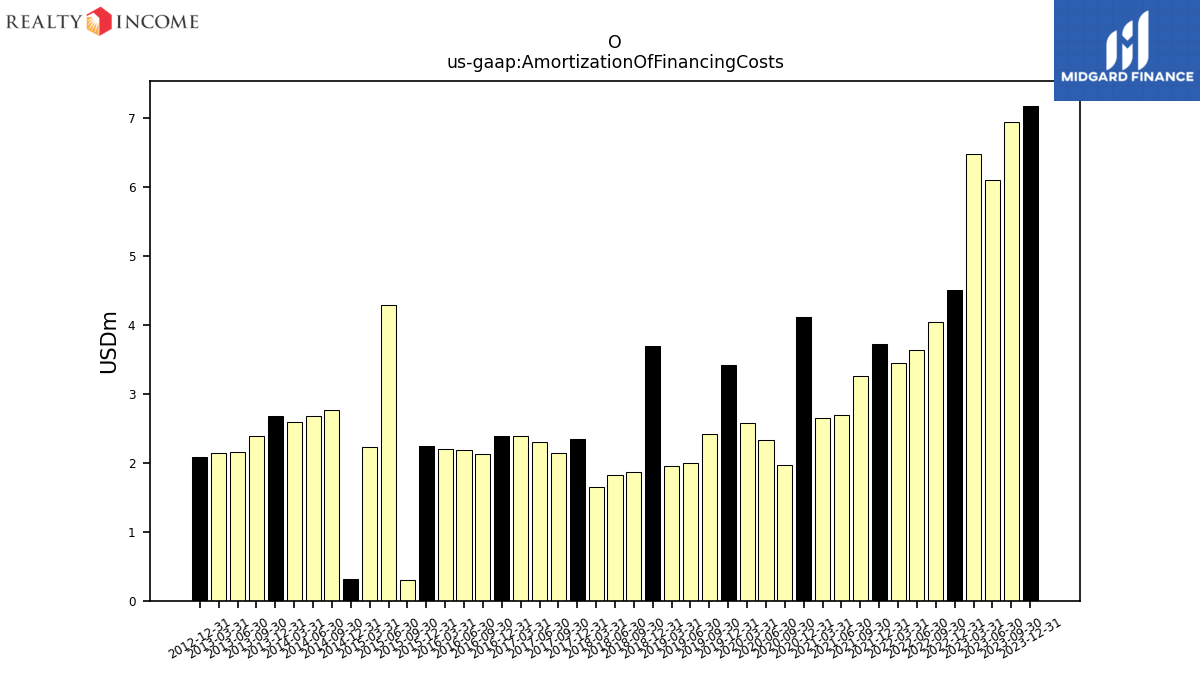
| Amortization Of Financing Costs | 7.17 | 6.93 | 6.09 | 6.47 | 4.50 | 4.04 | 3.64 | 3.44 | 3.72 | 3.26 | 2.70 | 2.65 | 4.12 | 1.97 | 2.33 | 2.58 | 3.42 | 2.42 | 2.00 | 1.96 | 3.68 | 1.87 | 1.82 | 1.65 | 2.34 | 2.13 | 2.29 | 2.39 | NA | NA | NA | NA | NA | NA | NA | NA | NA |
| 2023-12-31 | 2023-09-30 | 2023-06-30 | 2023-03-31 | 2022-12-31 | 2022-09-30 | 2022-06-30 | 2022-03-31 | 2021-12-31 | 2021-09-30 | 2021-06-30 | 2021-03-31 | 2020-12-31 | 2020-09-30 | 2020-06-30 | 2020-03-31 | 2019-12-31 | 2019-09-30 | 2019-06-30 | 2019-03-31 | 2018-12-31 | 2018-09-30 | 2018-06-30 | 2018-03-31 | 2017-12-31 | 2017-09-30 | 2017-06-30 | 2017-03-31 | 2012-03-31 | 2011-12-31 | 2011-09-30 | 2011-06-30 | 2011-03-31 | 2010-12-31 | 2010-09-30 | 2010-06-30 | 2010-03-31 | ||
|---|---|---|---|---|---|---|---|---|---|---|---|---|---|---|---|---|---|---|---|---|---|---|---|---|---|---|---|---|---|---|---|---|---|---|---|---|---|---|
| Net Cash Provided By Used In Investing Activities | -2716.30 | -1991.95 | -2968.89 | -1677.72 | -3857.94 | -1608.64 | -1502.49 | -1418.01 | -2834.74 | -1577.38 | -1031.85 | -993.73 | -920.55 | -308.69 | -451.72 | -351.41 | -1531.74 | -395.16 | -1076.39 | -498.51 | -272.01 | -577.47 | -297.37 | -492.83 | -340.83 | -248.42 | -299.95 | -365.31 | -9.29 | -178.36 | -451.79 | -149.02 | -155.69 | -402.35 | -10.32 | -256.17 | -28.52 |
| 2023-12-31 | 2023-09-30 | 2023-06-30 | 2023-03-31 | 2022-12-31 | 2022-09-30 | 2022-06-30 | 2022-03-31 | 2021-12-31 | 2021-09-30 | 2021-06-30 | 2021-03-31 | 2020-12-31 | 2020-09-30 | 2020-06-30 | 2020-03-31 | 2019-12-31 | 2019-09-30 | 2019-06-30 | 2019-03-31 | 2018-12-31 | 2018-09-30 | 2018-06-30 | 2018-03-31 | 2017-12-31 | 2017-09-30 | 2017-06-30 | 2017-03-31 | 2012-03-31 | 2011-12-31 | 2011-09-30 | 2011-06-30 | 2011-03-31 | 2010-12-31 | 2010-09-30 | 2010-06-30 | 2010-03-31 | ||
|---|---|---|---|---|---|---|---|---|---|---|---|---|---|---|---|---|---|---|---|---|---|---|---|---|---|---|---|---|---|---|---|---|---|---|---|---|---|---|
| Net Cash Provided By Used In Financing Activities | 1795.21 | 1394.75 | 2297.58 | 949.82 | 3103.91 | 1004.14 | 809.11 | 821.07 | 2245.10 | 1470.24 | 791.90 | 69.88 | 723.32 | 618.78 | 194.70 | 155.28 | 1061.41 | 326.39 | 817.05 | 287.75 | 26.45 | 335.82 | 51.85 | 293.75 | 107.76 | 61.19 | 35.81 | 170.36 | -40.01 | 77.28 | 239.38 | 79.55 | 226.27 | 177.77 | 118.78 | 182.20 | -17.18 | |
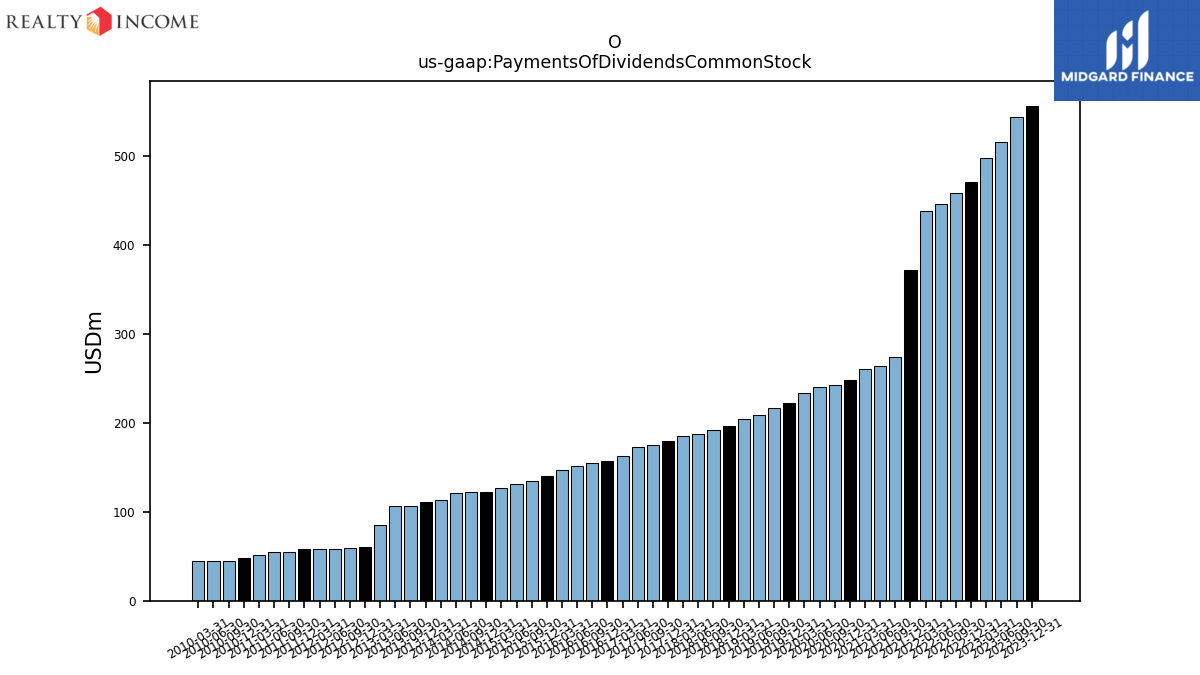
| Payments Of Dividends Common Stock | 556.11 | 543.34 | 515.09 | 497.25 | 470.74 | 458.59 | 445.83 | 438.28 | 371.18 | 273.79 | 263.36 | 260.70 | 247.63 | 242.24 | 240.47 | 233.82 | 222.48 | 216.25 | 208.86 | 204.55 | 196.84 | 191.70 | 187.49 | 185.56 | 179.31 | 174.61 | 172.87 | 162.51 | 58.19 | 58.02 | 55.15 | 55.01 | 51.12 | 47.80 | 45.03 | 44.91 | 44.76 |
| 2023-12-31 | 2023-09-30 | 2023-06-30 | 2023-03-31 | 2022-12-31 | 2022-09-30 | 2022-06-30 | 2022-03-31 | 2021-12-31 | 2021-09-30 | 2021-06-30 | 2021-03-31 | 2020-12-31 | 2020-09-30 | 2020-06-30 | 2020-03-31 | 2019-12-31 | 2019-09-30 | 2019-06-30 | 2019-03-31 | 2018-12-31 | 2018-09-30 | 2018-06-30 | 2018-03-31 | 2017-12-31 | 2017-09-30 | 2017-06-30 | 2017-03-31 | 2012-03-31 | 2011-12-31 | 2011-09-30 | 2011-06-30 | 2011-03-31 | 2010-12-31 | 2010-09-30 | 2010-06-30 | 2010-03-31 | ||
|---|---|---|---|---|---|---|---|---|---|---|---|---|---|---|---|---|---|---|---|---|---|---|---|---|---|---|---|---|---|---|---|---|---|---|---|---|---|---|
| Revenues | 1076.29 | 1039.10 | 1019.21 | 944.40 | 888.65 | 837.27 | 810.42 | 807.34 | 681.50 | 491.88 | 464.28 | 442.80 | 418.08 | 404.57 | 414.64 | 414.34 | 397.53 | 374.25 | 365.45 | 354.37 | 342.58 | 338.08 | 328.89 | 318.30 | 310.65 | 306.92 | 300.17 | 298.02 | 114.72 | 113.43 | 107.30 | 102.63 | 97.76 | 93.39 | 86.83 | 82.40 | 82.62 | |
| Revenue From Contract With Customer Excluding Assessed Tax | 1076.29 | 1039.10 | 1019.21 | 944.40 | 888.65 | 837.27 | 810.42 | 807.34 | 681.50 | 491.88 | 464.28 | 442.80 | 418.08 | 404.57 | 414.64 | 414.34 | 397.53 | 374.25 | 365.45 | 354.37 | 342.58 | 338.08 | 328.89 | 318.30 | 310.65 | 306.92 | 300.17 | 298.02 | 114.72 | 113.43 | 107.30 | 102.63 | 97.76 | 93.39 | 86.83 | 82.40 | 82.62 |