
| 2023-12-31 | 2023-09-30 | 2023-06-30 | 2023-03-31 | 2022-12-31 | 2022-09-30 | 2022-06-30 | 2022-03-31 | 2021-12-31 | 2021-09-30 | 2021-06-30 | 2021-03-31 | 2020-12-31 | 2020-09-30 | 2020-06-30 | 2020-03-31 | 2019-12-31 | 2019-09-30 | 2019-06-30 | 2019-03-31 | 2018-12-31 | 2018-09-30 | 2018-06-30 | 2018-03-31 | 2017-12-31 | 2017-09-30 | 2017-06-30 | 2017-03-31 | ||
|---|---|---|---|---|---|---|---|---|---|---|---|---|---|---|---|---|---|---|---|---|---|---|---|---|---|---|---|---|---|
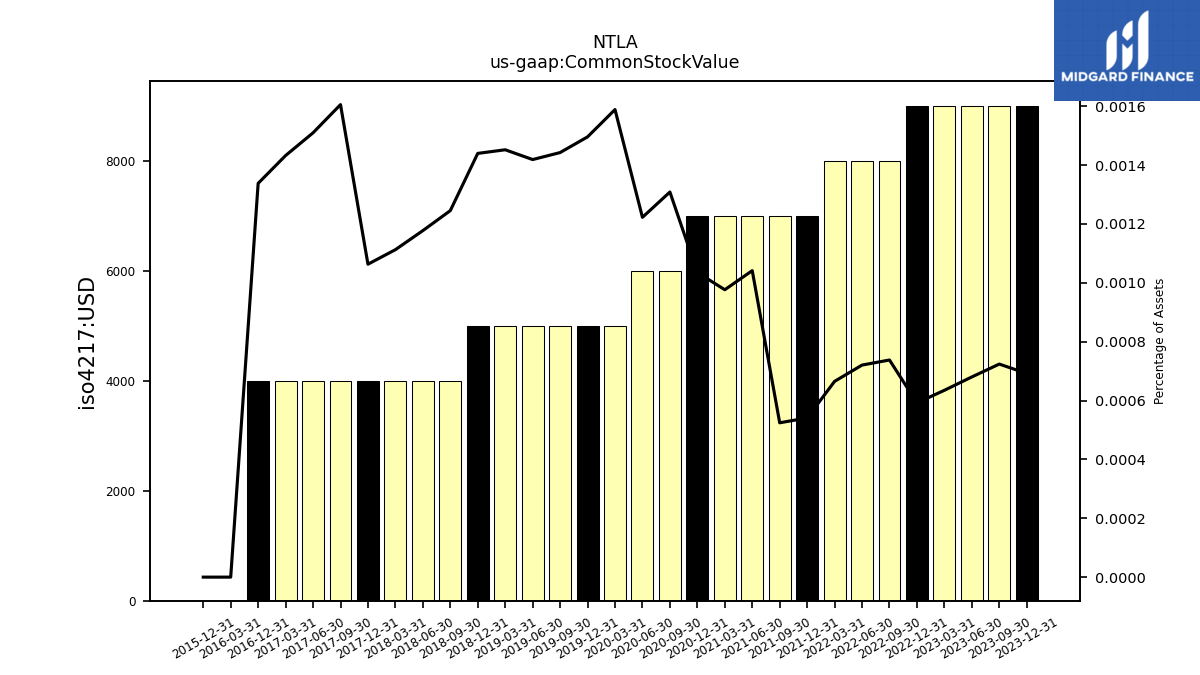
| Common Stock Value | 0.01 | 0.01 | 0.01 | 0.01 | 0.01 | 0.01 | 0.01 | 0.01 | 0.01 | 0.01 | 0.01 | 0.01 | 0.01 | 0.01 | 0.01 | 0.01 | 0.01 | 0.01 | 0.01 | 0.01 | 0.01 | 0.00 | 0.00 | 0.00 | 0.00 | 0.00 | 0.00 | 0.00 | |
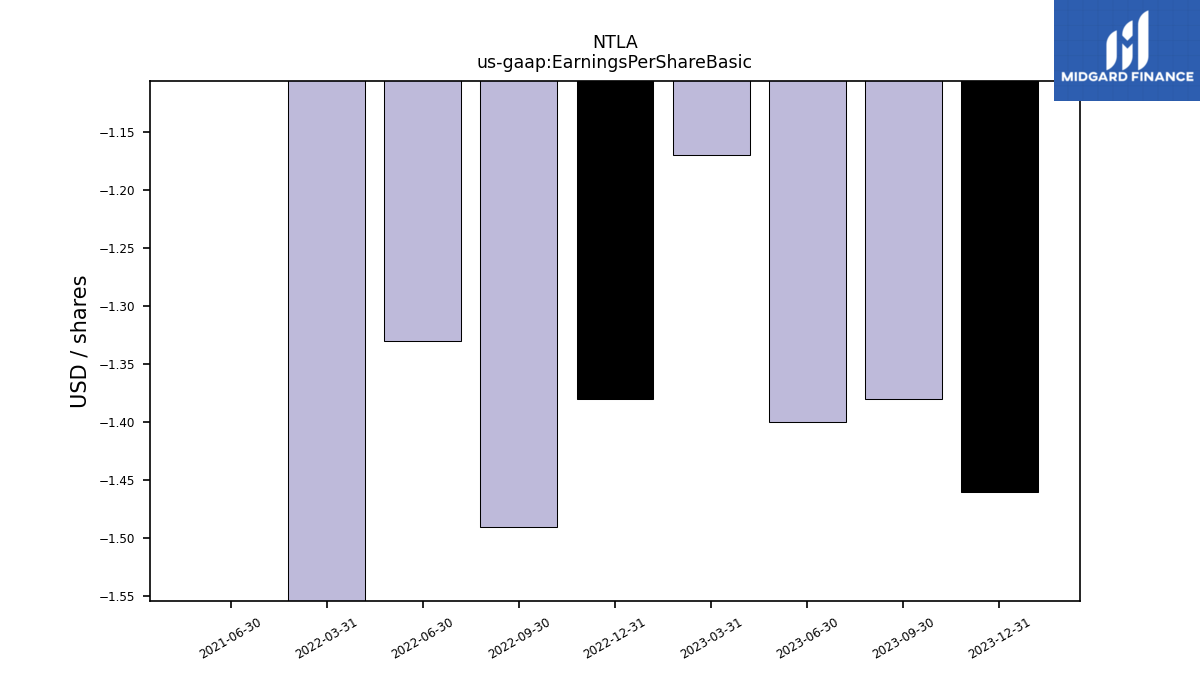
| Earnings Per Share Basic | -1.46 | -1.38 | -1.40 | -1.17 | -1.38 | -1.49 | -1.33 | -1.96 | NA | NA | -1.01 | NA | NA | NA | NA | NA | NA | NA | NA | NA | NA | NA | NA | NA | NA | NA | NA | NA | |
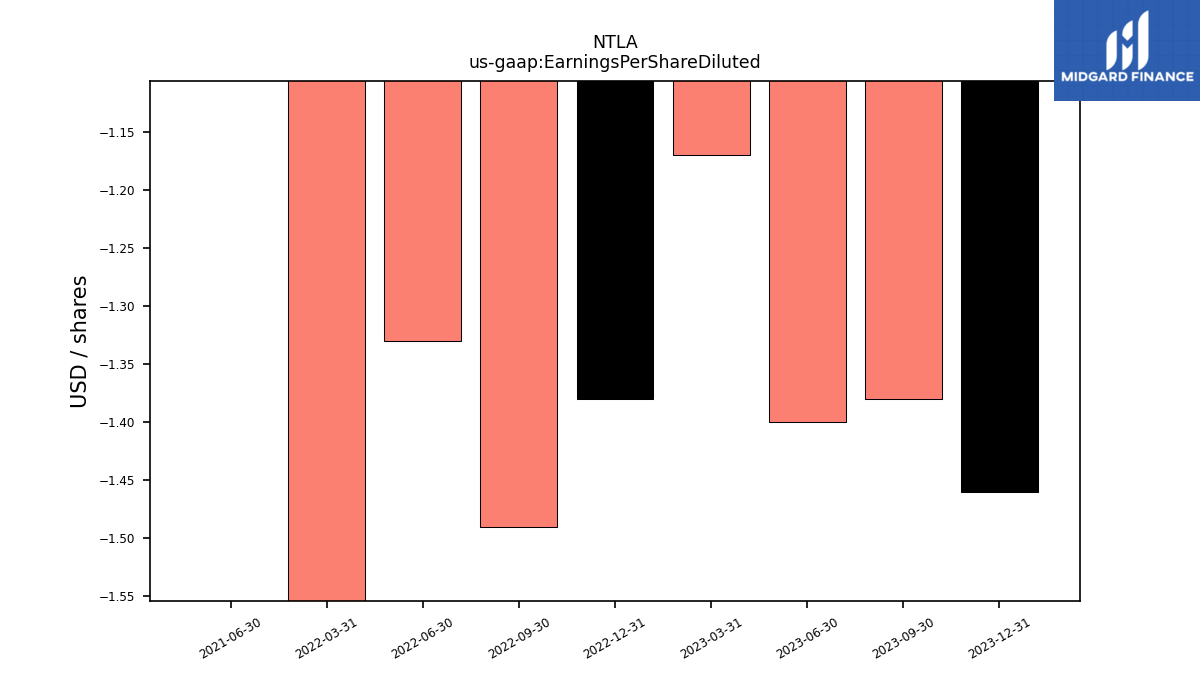
| Earnings Per Share Diluted | -1.46 | -1.38 | -1.40 | -1.17 | -1.38 | -1.49 | -1.33 | -1.96 | NA | NA | -1.01 | NA | NA | NA | NA | NA | NA | NA | NA | NA | NA | NA | NA | NA | NA | NA | NA | NA |
| 2023-12-31 | 2023-09-30 | 2023-06-30 | 2023-03-31 | 2022-12-31 | 2022-09-30 | 2022-06-30 | 2022-03-31 | 2021-12-31 | 2021-09-30 | 2021-06-30 | 2021-03-31 | 2020-12-31 | 2020-09-30 | 2020-06-30 | 2020-03-31 | 2019-12-31 | 2019-09-30 | 2019-06-30 | 2019-03-31 | 2018-12-31 | 2018-09-30 | 2018-06-30 | 2018-03-31 | 2017-12-31 | 2017-09-30 | 2017-06-30 | 2017-03-31 | ||
|---|---|---|---|---|---|---|---|---|---|---|---|---|---|---|---|---|---|---|---|---|---|---|---|---|---|---|---|---|---|
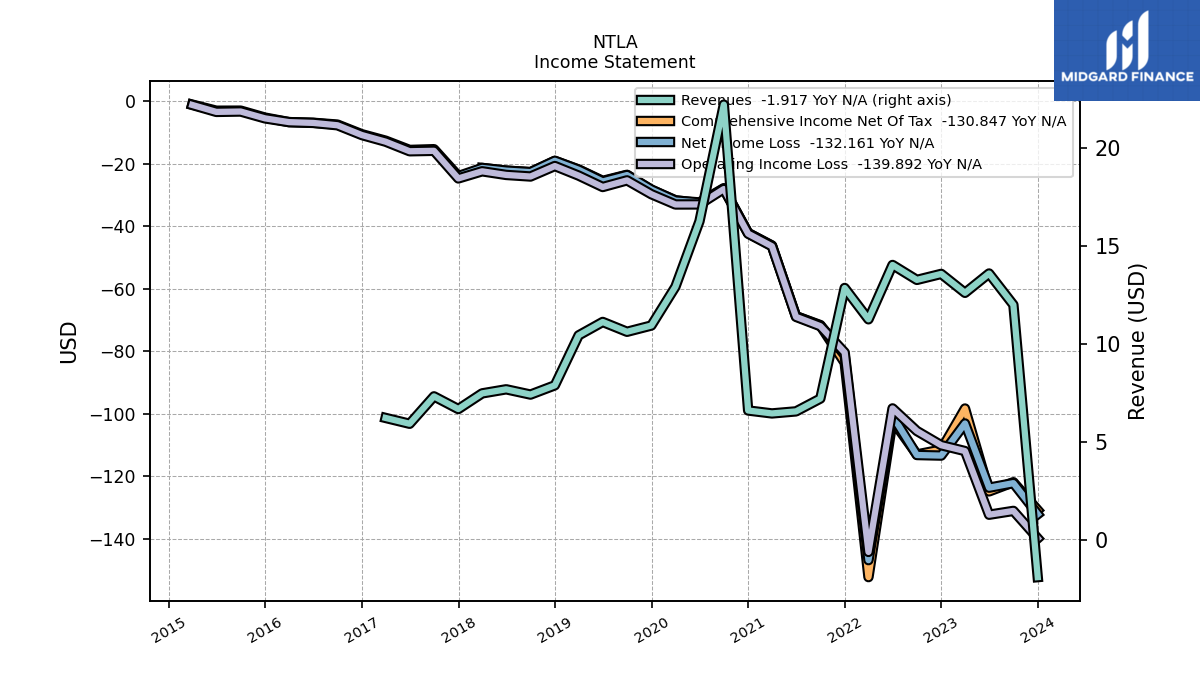
| Revenue From Contract With Customer Excluding Assessed Tax | -1.92 | 11.99 | 13.59 | 12.61 | 13.57 | 13.27 | 14.03 | 11.25 | 12.85 | 7.20 | 6.55 | 6.45 | 6.59 | 22.22 | 16.26 | 12.92 | 10.94 | 10.62 | 11.12 | 10.43 | 7.88 | 7.41 | 7.68 | 7.47 | 6.67 | 7.32 | 5.92 | 6.21 | |
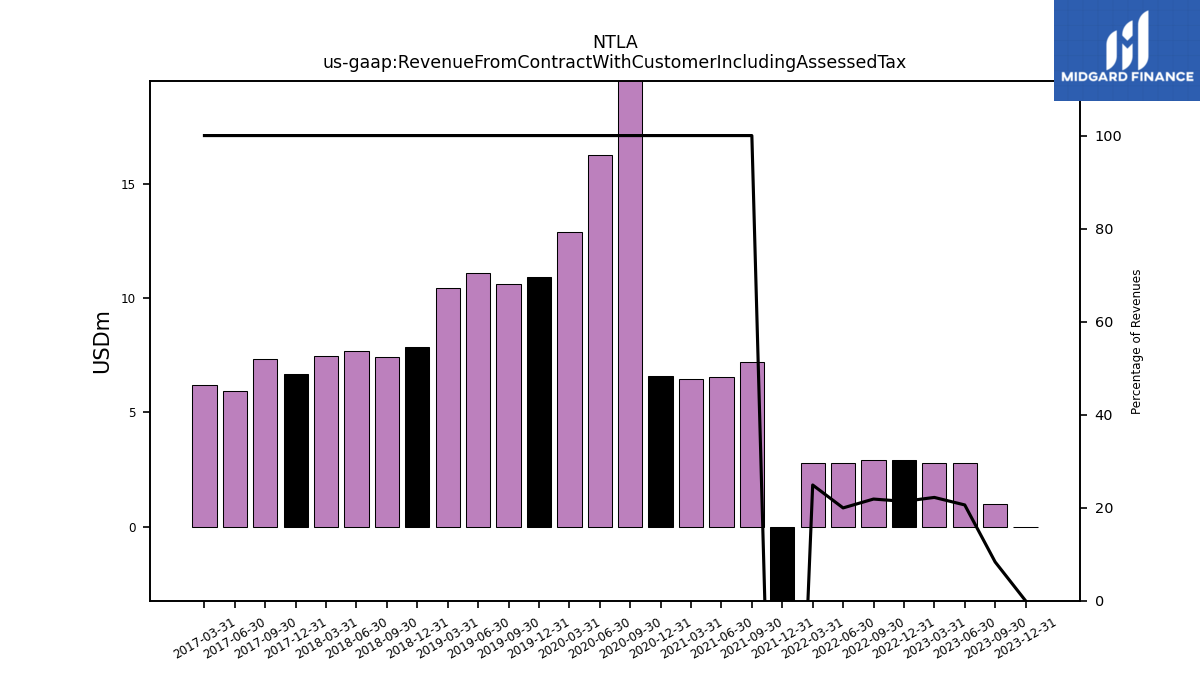
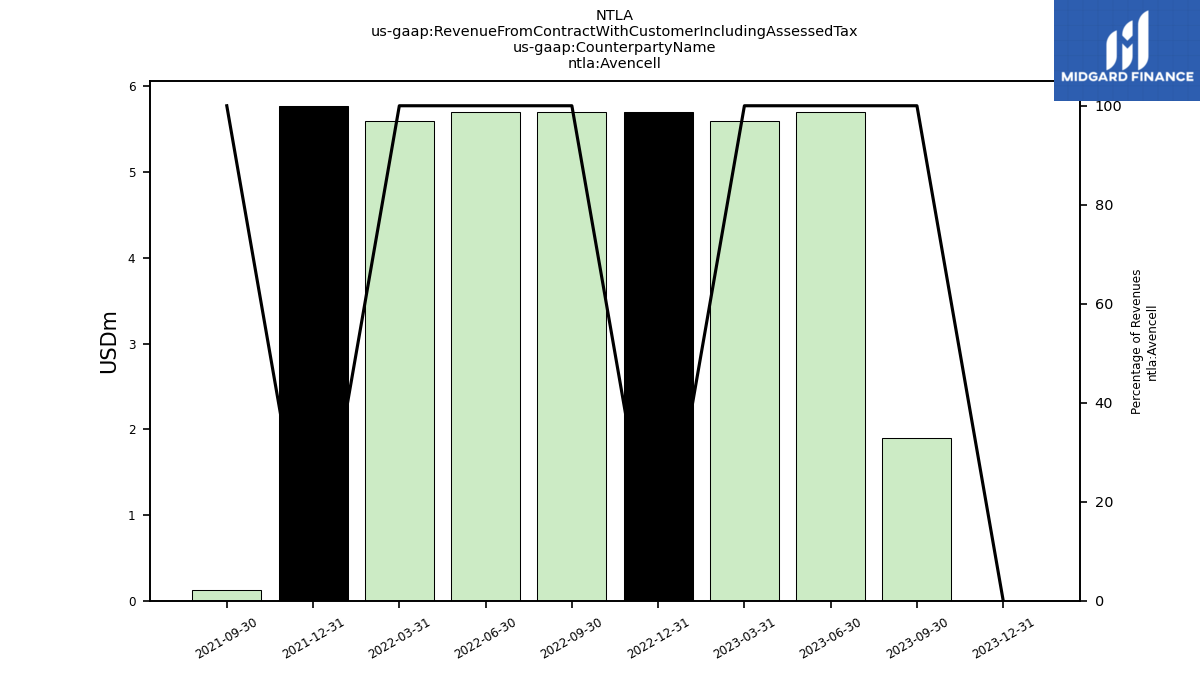
| Revenue From Contract With Customer Including Assessed Tax | 0.00 | 1.00 | 2.80 | 2.80 | 2.90 | 2.90 | 2.80 | 2.80 | -17.30 | 7.20 | 6.55 | 6.45 | 6.59 | 22.22 | 16.26 | 12.92 | 10.94 | 10.62 | 11.12 | 10.43 | 7.88 | 7.41 | 7.68 | 7.47 | 6.67 | 7.32 | 5.92 | 6.21 | |
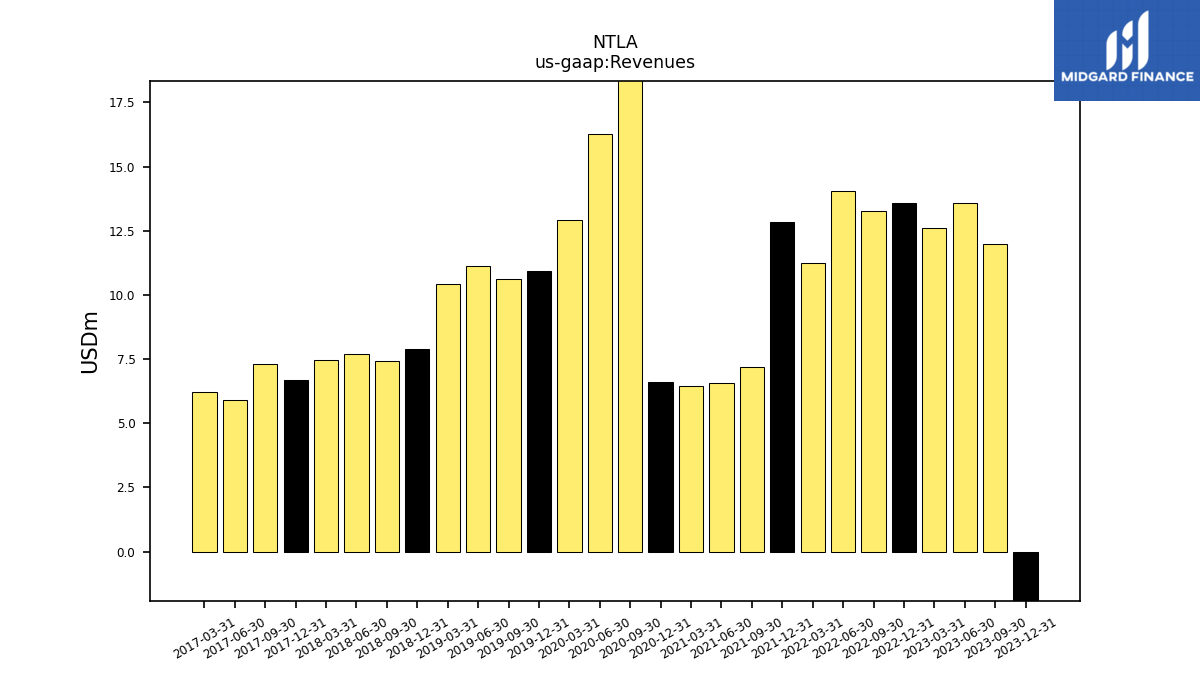
| Revenues | -1.92 | 11.99 | 13.59 | 12.61 | 13.57 | 13.27 | 14.03 | 11.25 | 12.85 | 7.20 | 6.55 | 6.45 | 6.59 | 22.22 | 16.26 | 12.92 | 10.94 | 10.62 | 11.12 | 10.43 | 7.88 | 7.41 | 7.68 | 7.47 | 6.67 | 7.32 | 5.92 | 6.21 | |
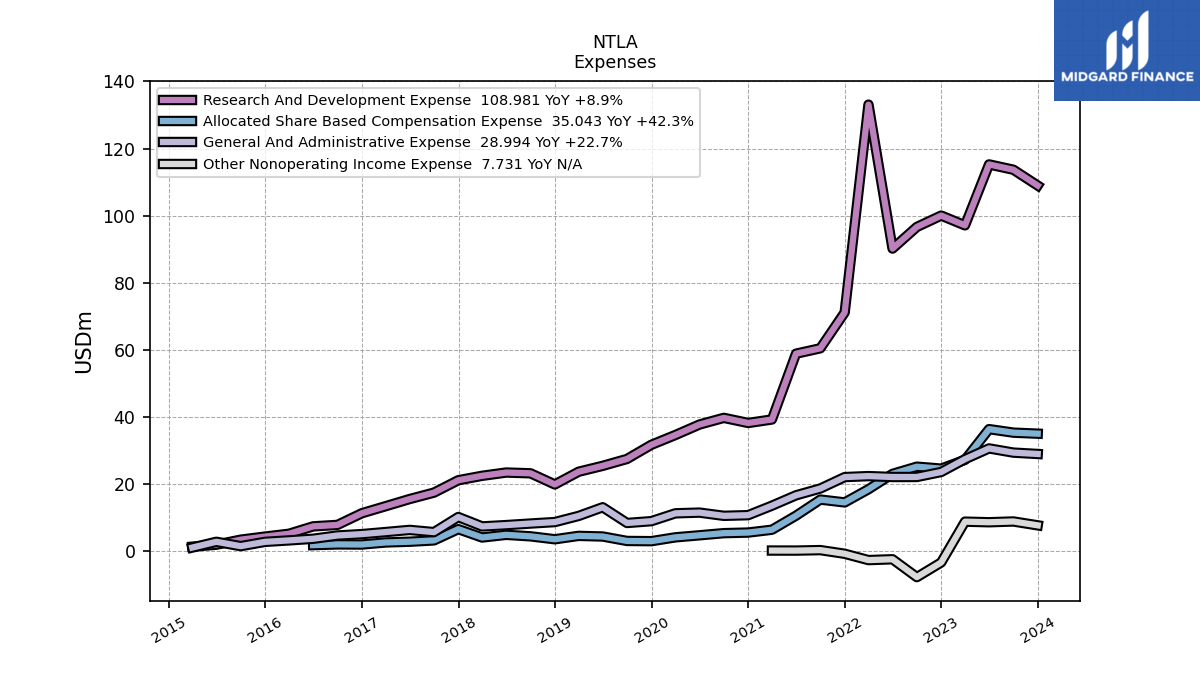
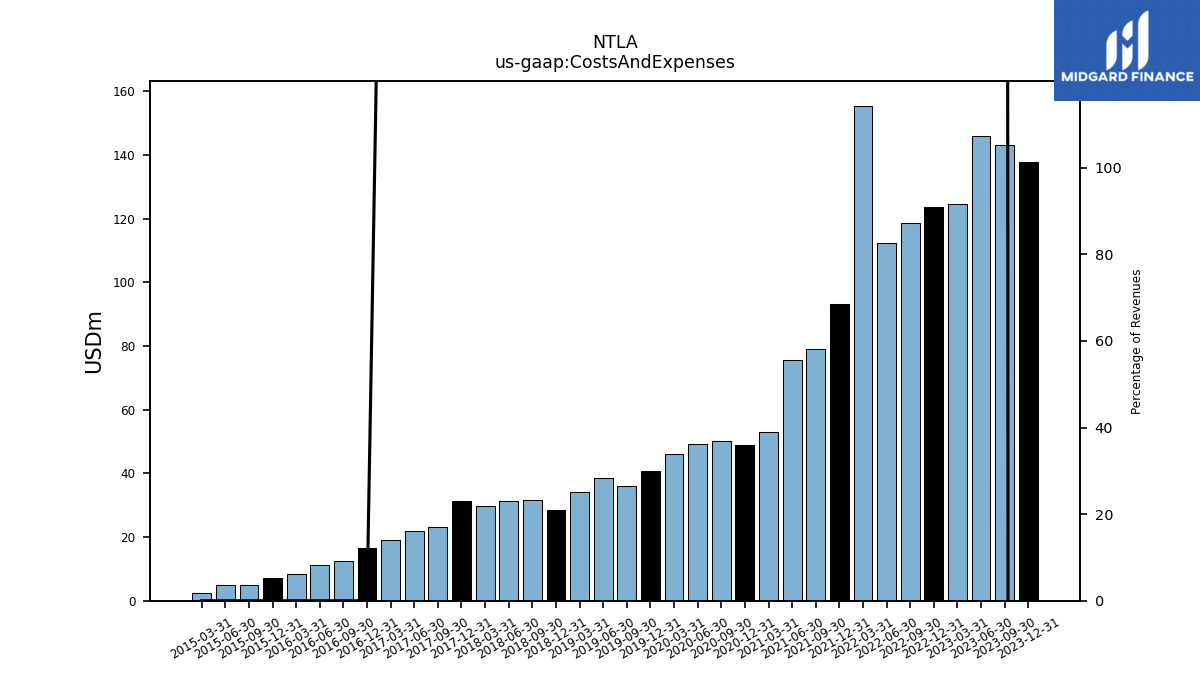
| Costs And Expenses | 137.97 | 143.10 | 145.93 | 124.56 | 123.66 | 118.80 | 112.33 | 155.50 | 93.27 | 79.20 | 75.57 | 52.87 | 48.99 | 50.32 | 49.30 | 45.96 | 40.71 | 35.94 | 38.58 | 34.24 | 28.63 | 31.51 | 31.27 | 29.90 | 31.38 | 23.19 | 21.93 | 19.16 | |
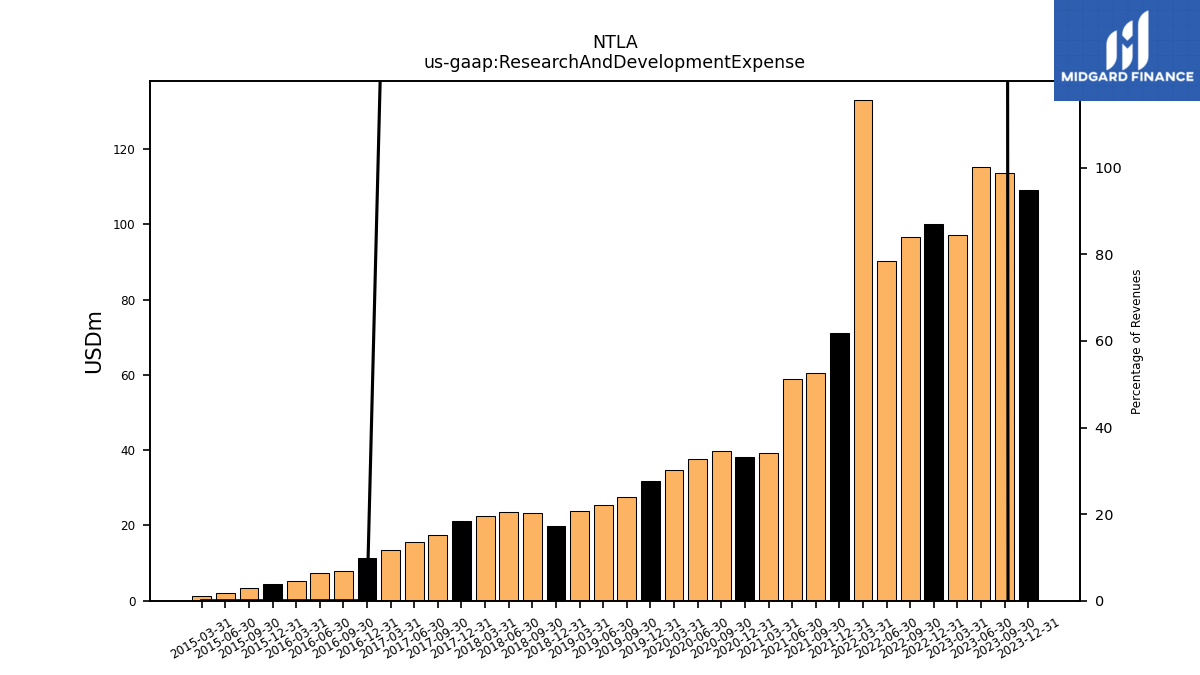
| Research And Development Expense | 108.98 | 113.70 | 115.28 | 97.12 | 100.03 | 96.65 | 90.20 | 133.09 | 71.16 | 60.49 | 58.88 | 39.28 | 38.23 | 39.76 | 37.77 | 34.65 | 31.73 | 27.51 | 25.46 | 23.71 | 19.92 | 23.24 | 23.47 | 22.49 | 21.17 | 17.48 | 15.56 | 13.43 | |
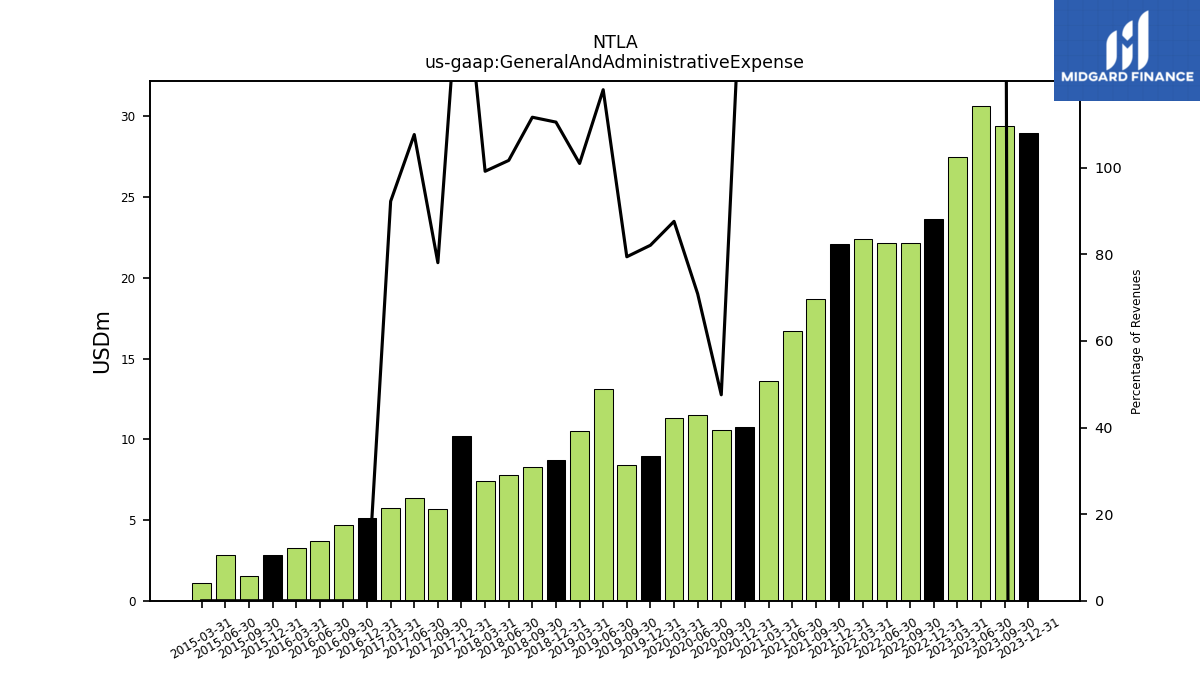
| General And Administrative Expense | 28.99 | 29.40 | 30.65 | 27.45 | 23.63 | 22.14 | 22.13 | 22.40 | 22.11 | 18.71 | 16.68 | 13.59 | 10.76 | 10.57 | 11.53 | 11.31 | 8.98 | 8.43 | 13.12 | 10.53 | 8.71 | 8.27 | 7.80 | 7.41 | 10.21 | 5.71 | 6.37 | 5.73 | |
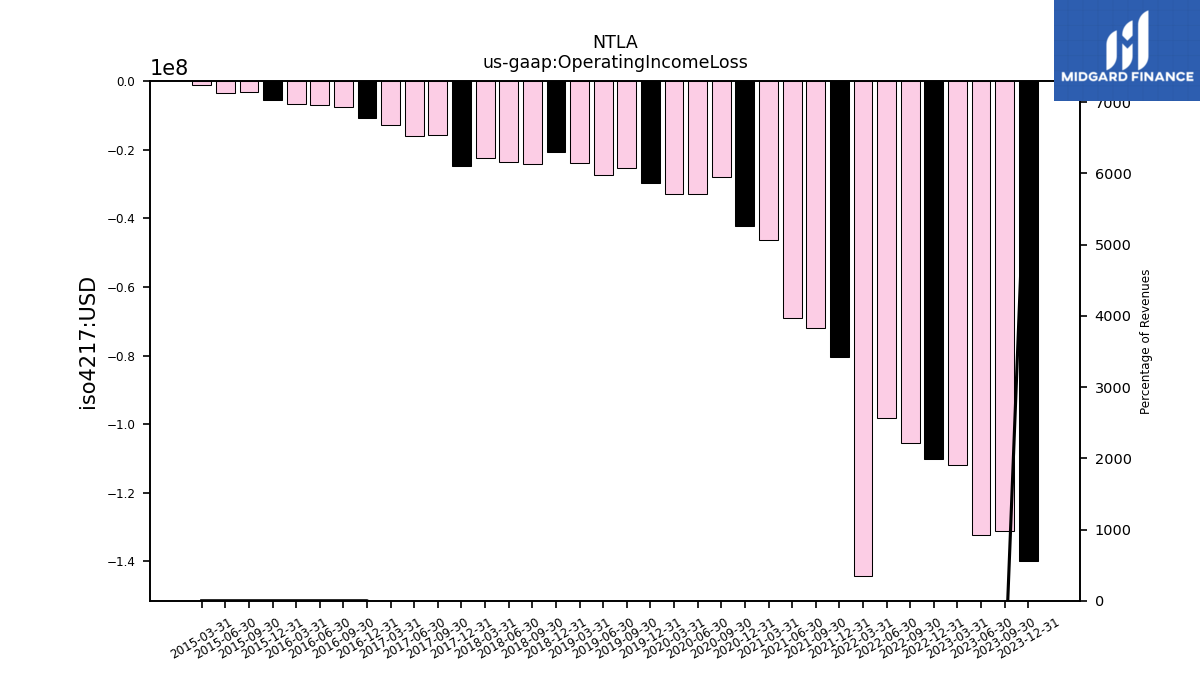
| Operating Income Loss | -139.89 | -131.11 | -132.33 | -111.96 | -110.09 | -105.53 | -98.30 | -144.25 | -80.42 | -71.99 | -69.02 | -46.42 | -42.40 | -28.10 | -33.03 | -33.05 | -29.77 | -25.33 | -27.46 | -23.81 | -20.75 | -24.10 | -23.59 | -22.43 | -24.71 | -15.88 | -16.02 | -12.95 | |
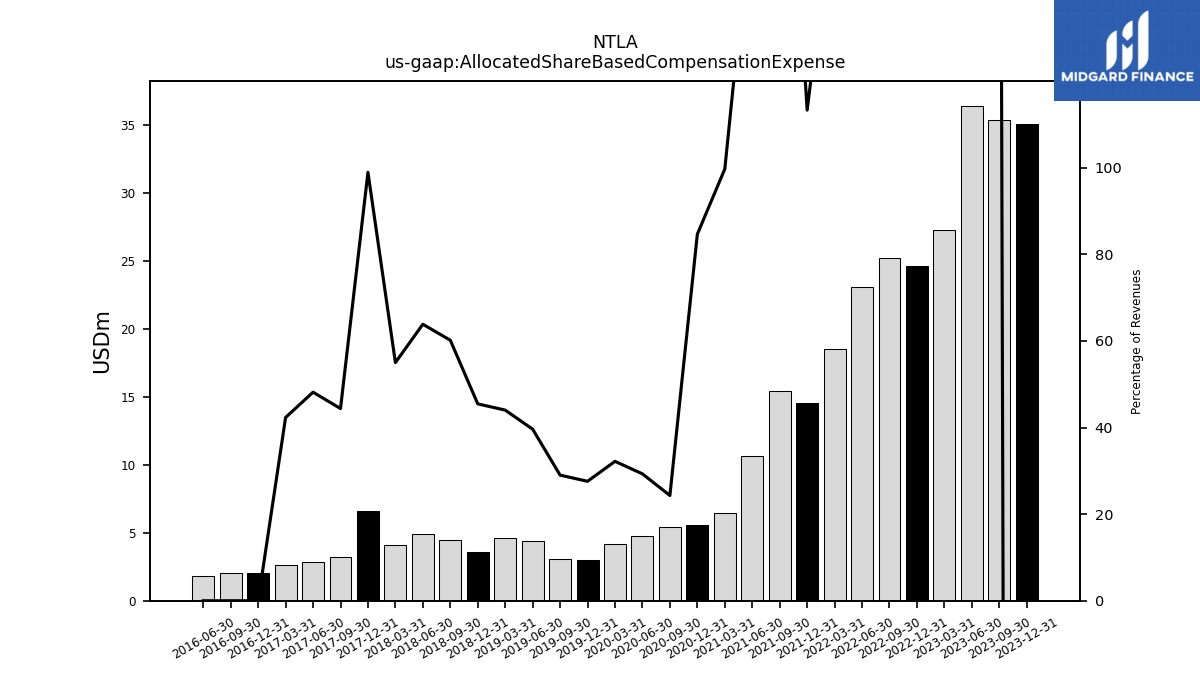
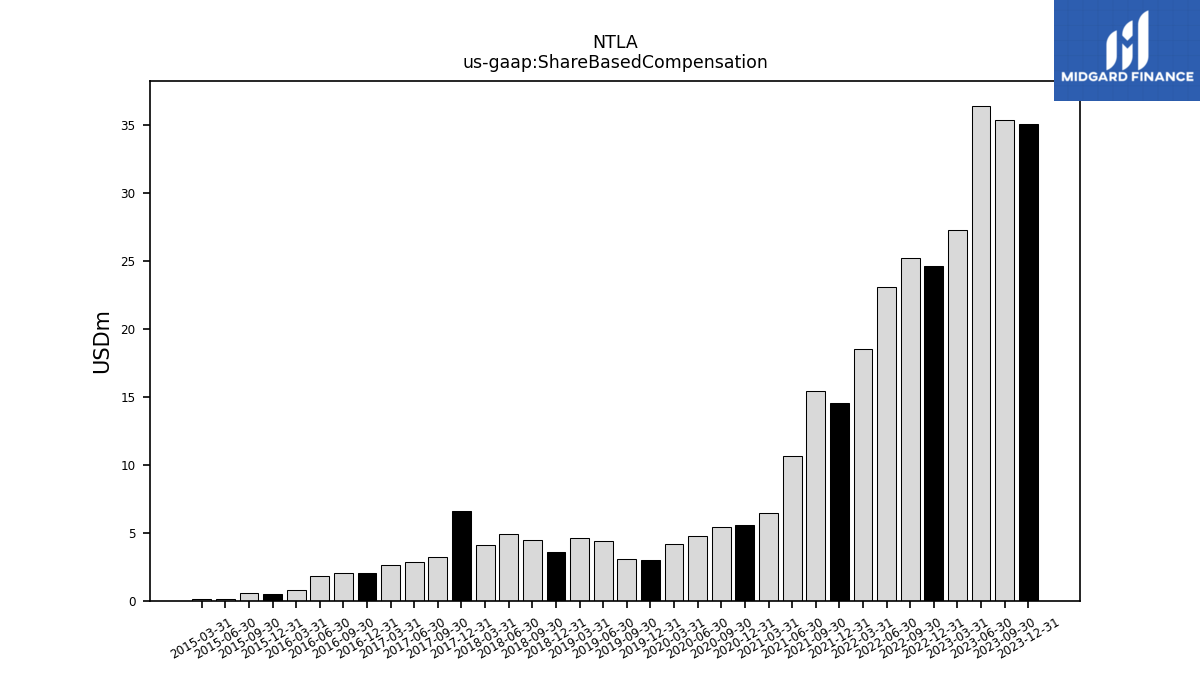
| Allocated Share Based Compensation Expense | 35.04 | 35.35 | 36.40 | 27.25 | 24.63 | 25.21 | 23.07 | 18.49 | 14.56 | 15.41 | 10.61 | 6.42 | 5.58 | 5.40 | 4.76 | 4.16 | 3.02 | 3.08 | 4.40 | 4.59 | 3.58 | 4.46 | 4.90 | 4.11 | 6.60 | 3.25 | 2.85 | 2.63 | |
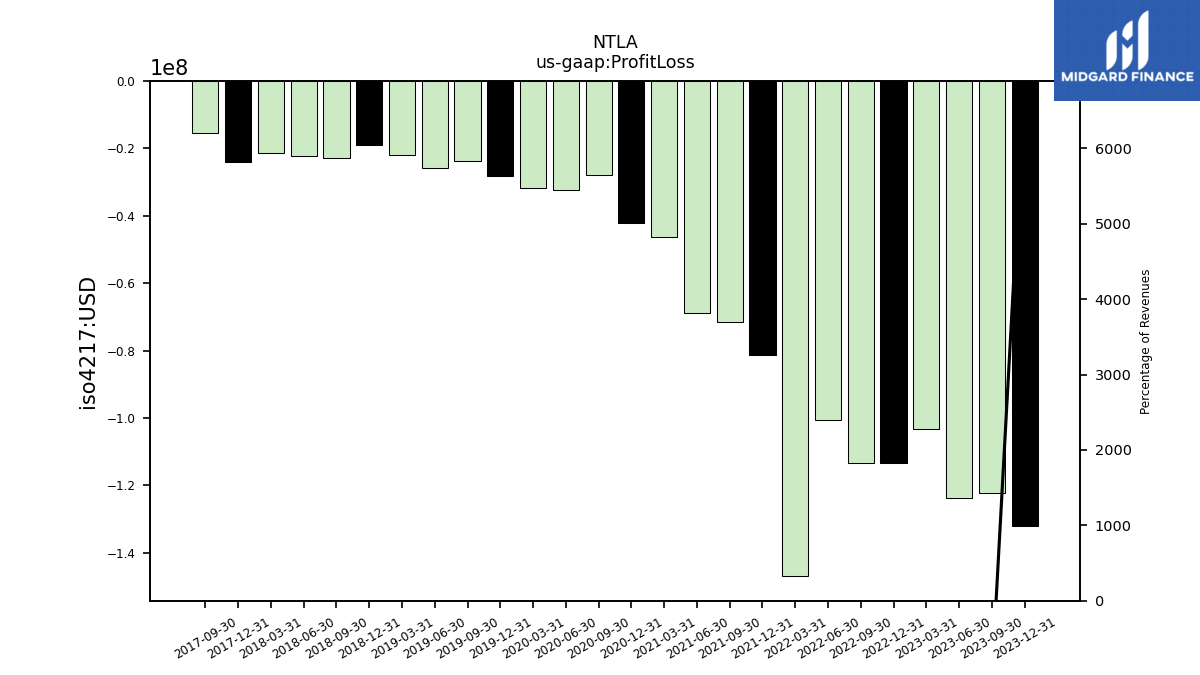
| Profit Loss | -132.16 | -122.22 | -123.68 | -103.13 | -113.41 | -113.23 | -100.68 | -146.87 | -81.24 | -71.64 | -68.81 | -46.20 | -42.19 | -27.84 | -32.39 | -31.81 | -28.28 | -23.63 | -25.68 | -21.94 | -19.07 | -22.70 | -22.22 | -21.36 | -23.96 | -15.36 | NA | NA | |
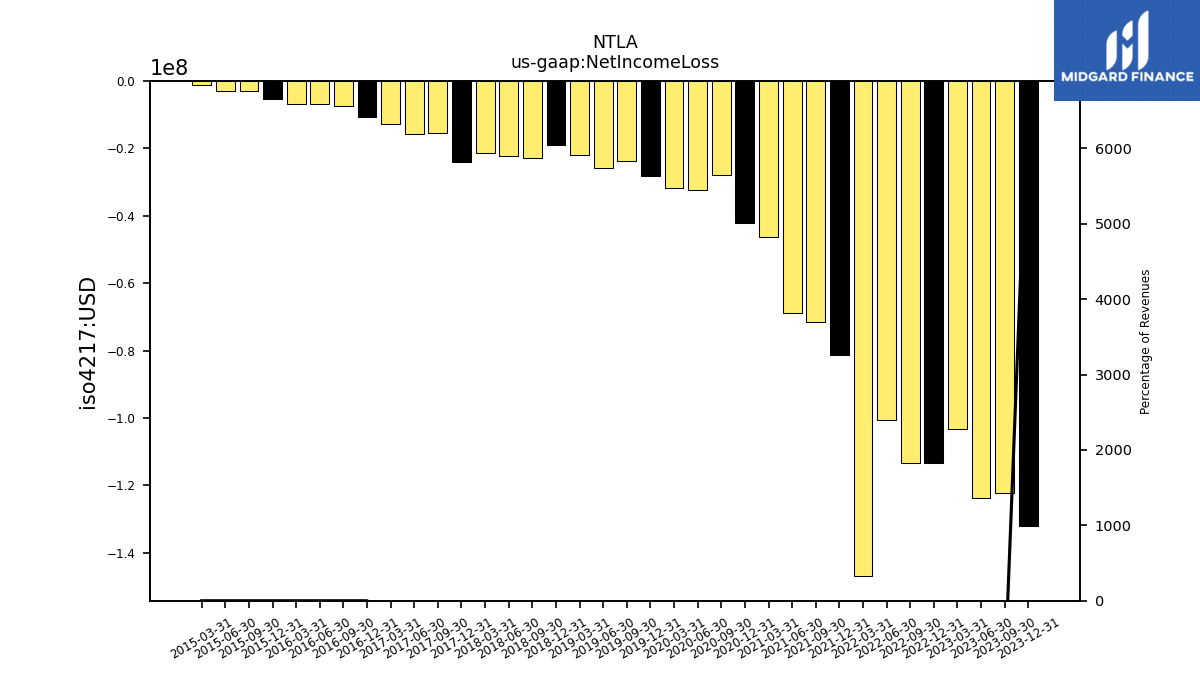
| Net Income Loss | -132.16 | -122.22 | -123.68 | -103.13 | -113.41 | -113.23 | -100.68 | -146.87 | -81.24 | -71.64 | -68.81 | -46.20 | -42.19 | -27.84 | -32.39 | -31.81 | -28.28 | -23.63 | -25.68 | -21.94 | -19.07 | -22.70 | -22.22 | -21.36 | -23.96 | -15.36 | -15.59 | -12.63 | |
| Comprehensive Income Net Of Tax | -130.85 | -121.93 | -124.87 | -98.34 | -111.50 | -113.04 | -102.17 | -152.30 | -83.69 | -71.81 | -68.81 | -46.22 | -42.22 | -27.96 | -32.61 | -31.69 | -28.35 | -23.55 | -25.49 | -21.85 | -19.09 | -22.70 | -22.22 | -21.36 | NA | NA | NA | NA |
| 2023-12-31 | 2023-09-30 | 2023-06-30 | 2023-03-31 | 2022-12-31 | 2022-09-30 | 2022-06-30 | 2022-03-31 | 2021-12-31 | 2021-09-30 | 2021-06-30 | 2021-03-31 | 2020-12-31 | 2020-09-30 | 2020-06-30 | 2020-03-31 | 2019-12-31 | 2019-09-30 | 2019-06-30 | 2019-03-31 | 2018-12-31 | 2018-09-30 | 2018-06-30 | 2018-03-31 | 2017-12-31 | 2017-09-30 | 2017-06-30 | 2017-03-31 | ||
|---|---|---|---|---|---|---|---|---|---|---|---|---|---|---|---|---|---|---|---|---|---|---|---|---|---|---|---|---|---|
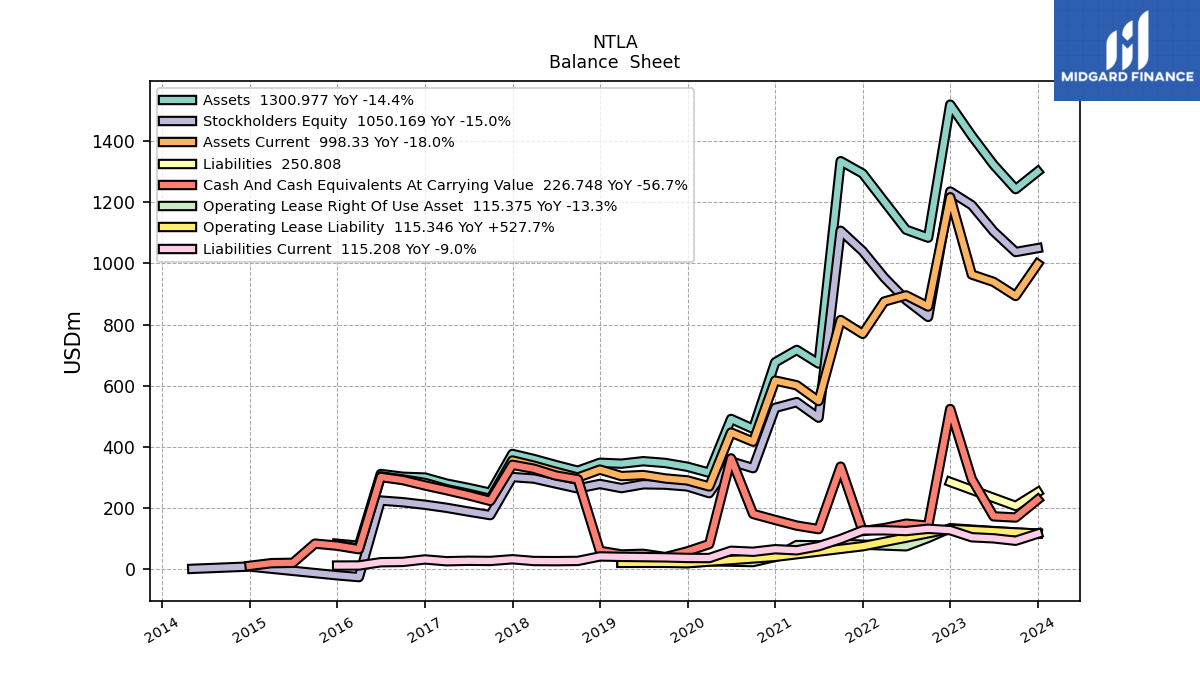
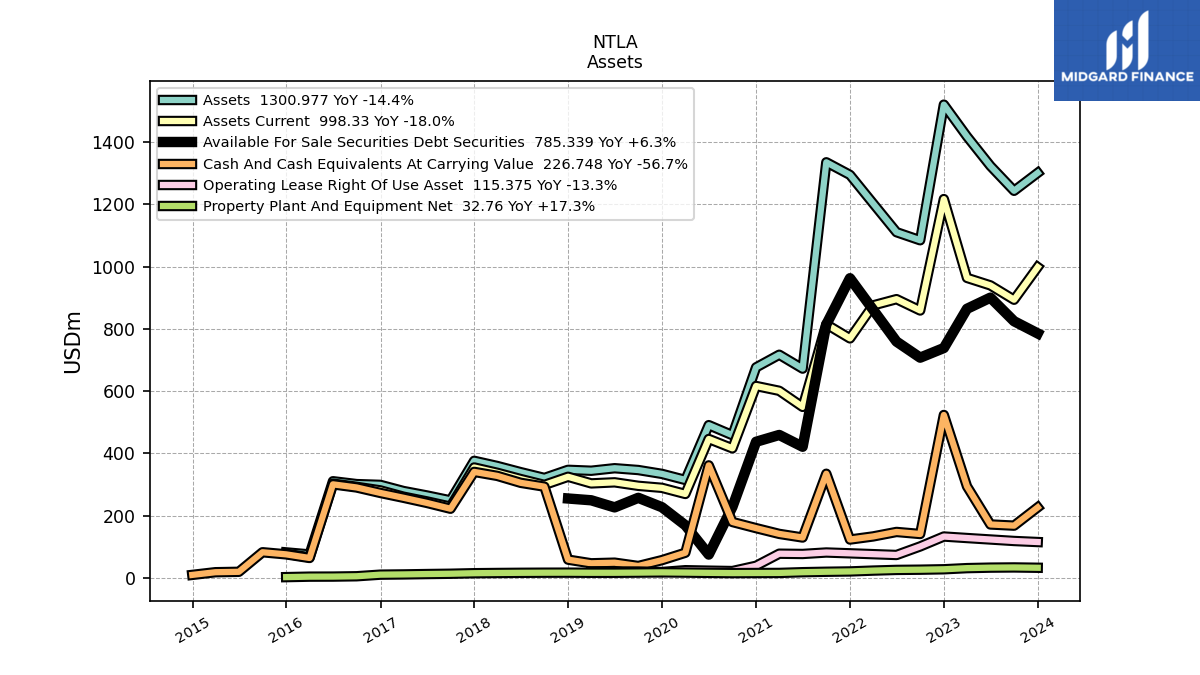
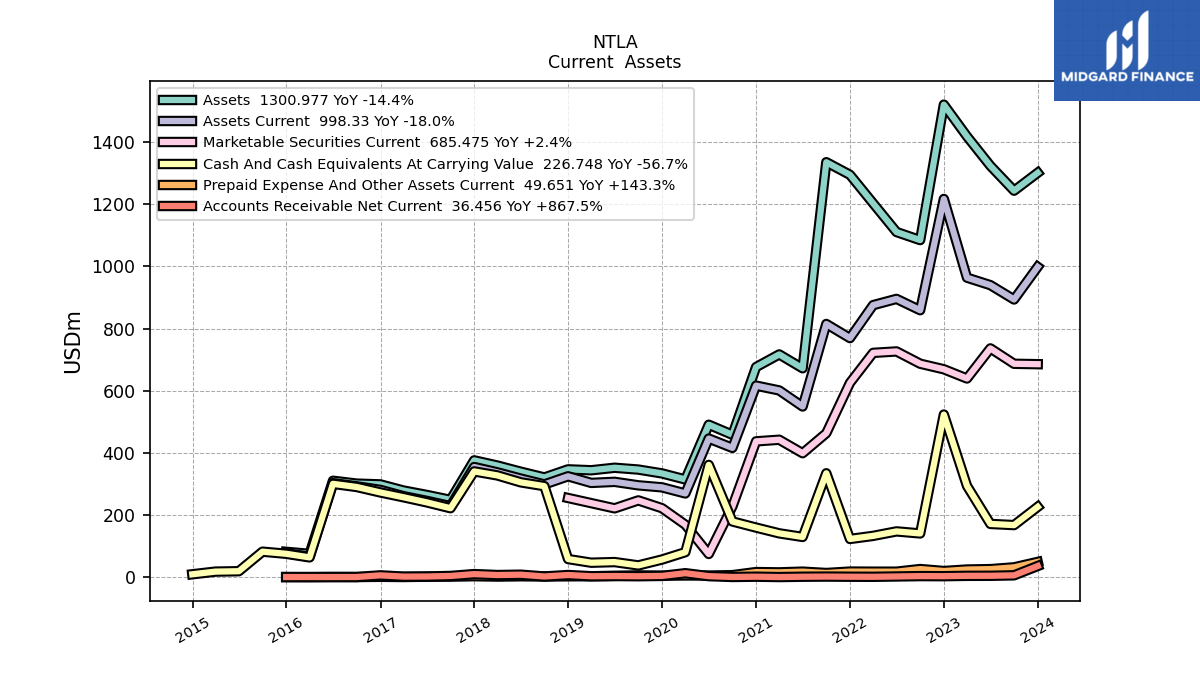
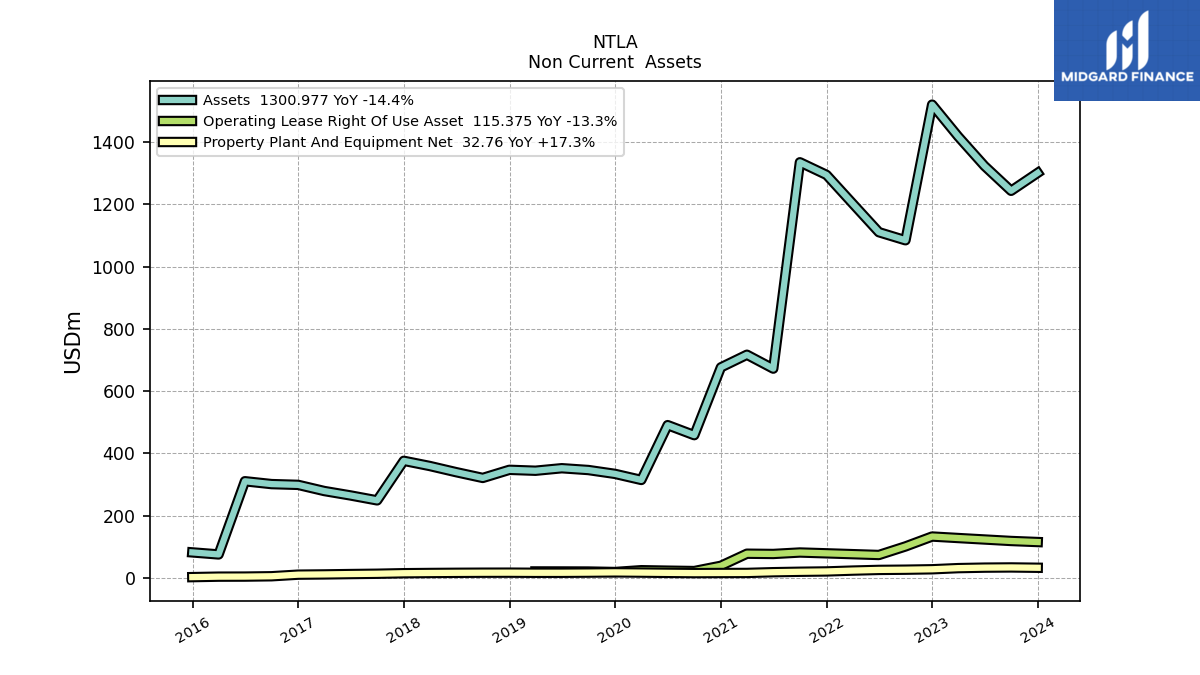
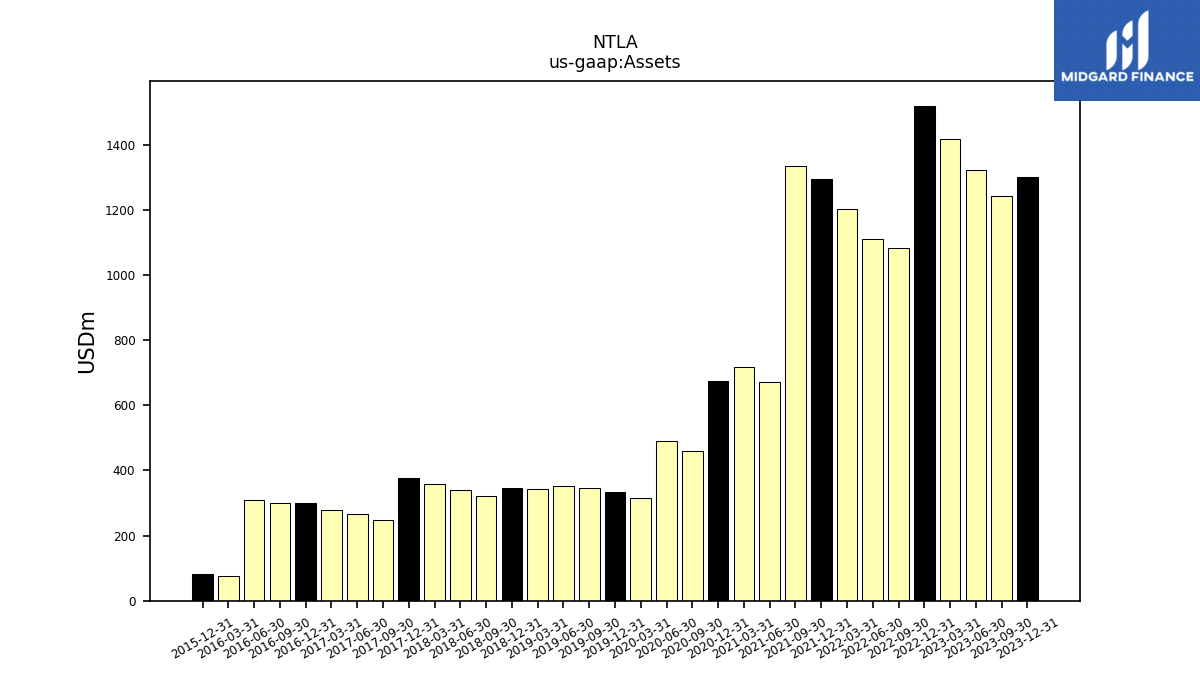
| Assets | 1300.98 | 1243.35 | 1323.24 | 1417.89 | 1520.11 | 1084.46 | 1110.42 | 1202.79 | 1294.46 | 1334.96 | 672.24 | 716.89 | 676.32 | 458.56 | 490.83 | 314.75 | 334.28 | 346.63 | 352.44 | 344.36 | 347.31 | 321.23 | 339.78 | 359.55 | 376.24 | 249.17 | 264.98 | 279.26 | |
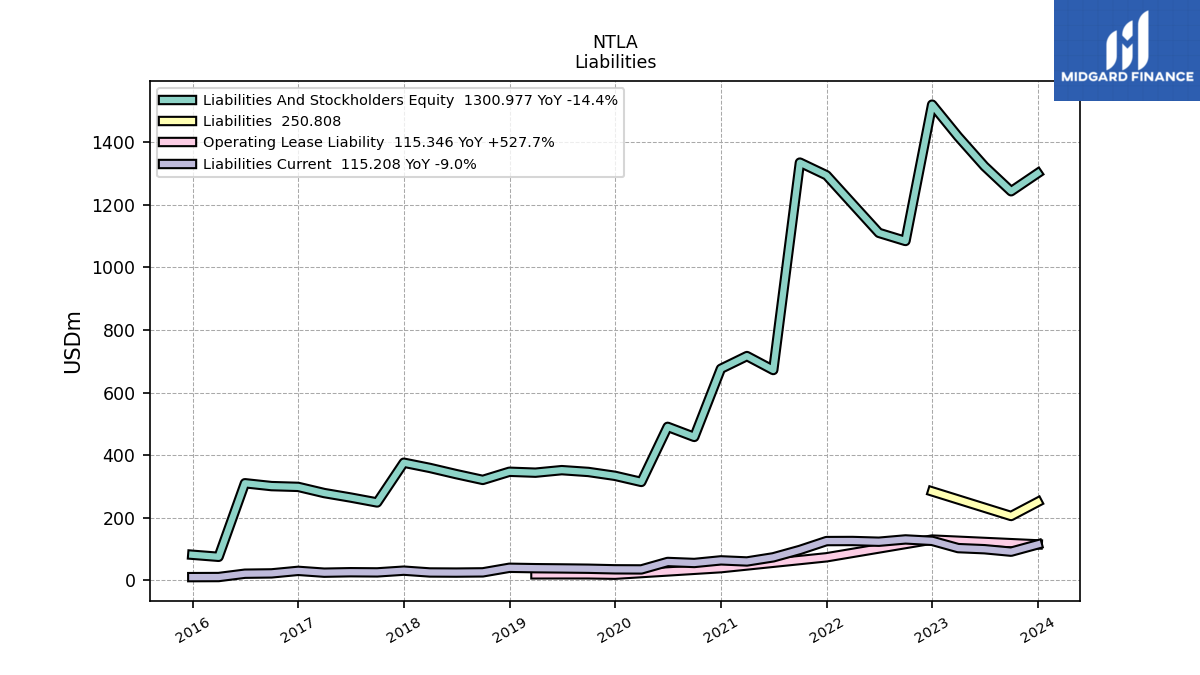
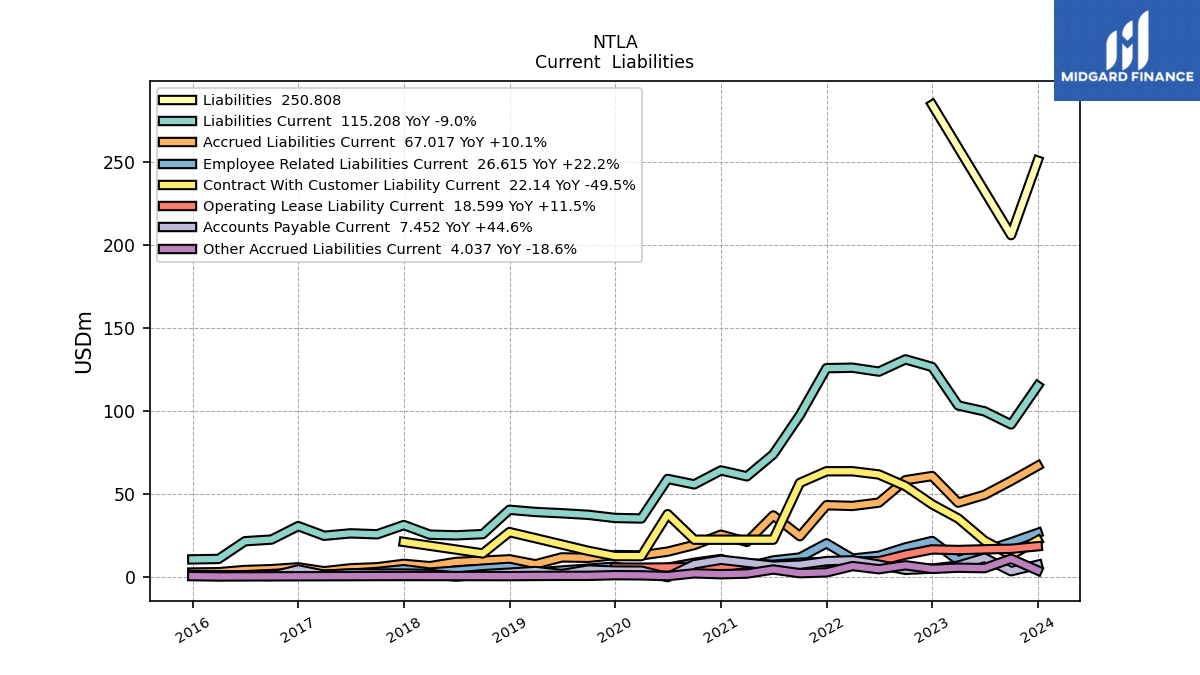
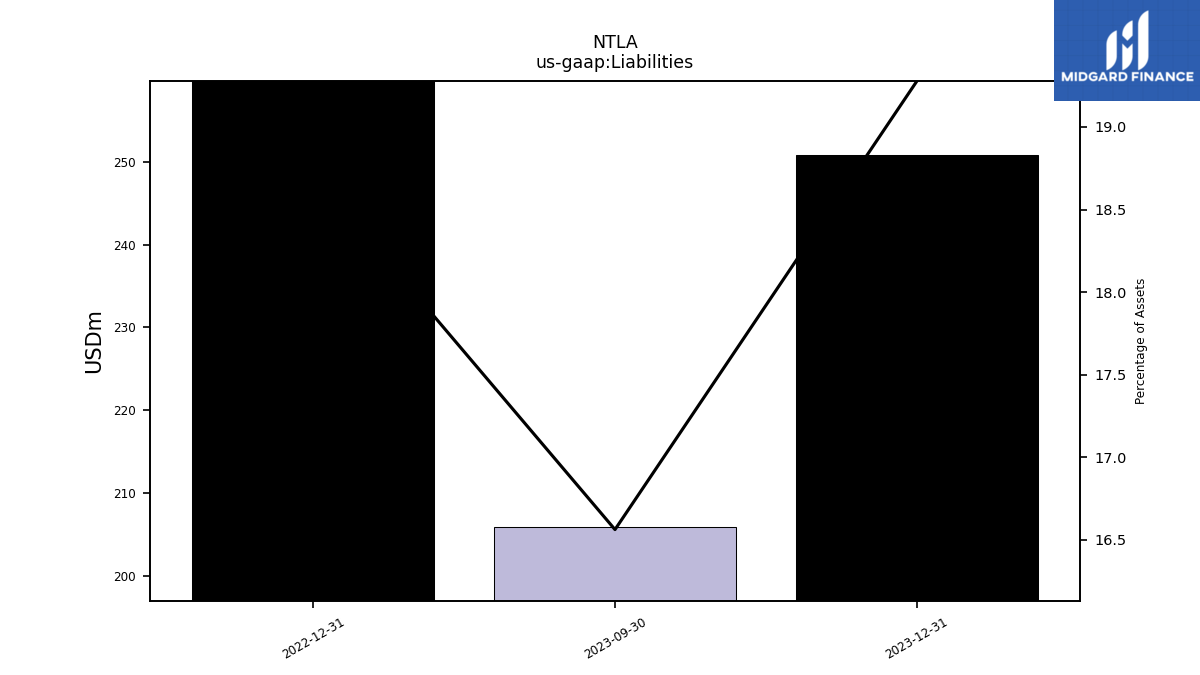
| Liabilities | 250.81 | 205.94 | NA | NA | 284.53 | NA | NA | NA | NA | NA | NA | NA | NA | NA | NA | NA | NA | NA | NA | NA | NA | NA | NA | NA | NA | NA | NA | NA | |
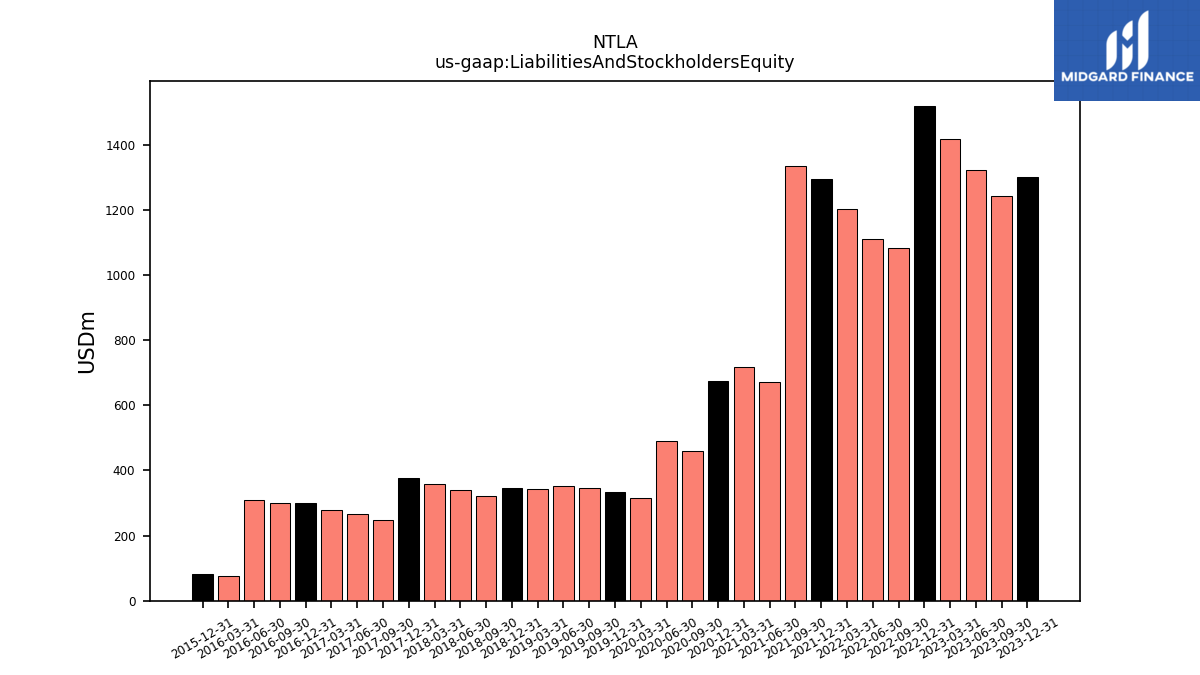
| Liabilities And Stockholders Equity | 1300.98 | 1243.35 | 1323.24 | 1417.89 | 1520.11 | 1084.46 | 1110.42 | 1202.79 | 1294.46 | 1334.96 | 672.24 | 716.89 | 676.32 | 458.56 | 490.83 | 314.75 | 334.28 | 346.63 | 352.44 | 344.36 | 347.31 | 321.23 | 339.78 | 359.55 | 376.24 | 249.17 | 264.98 | 279.26 | |
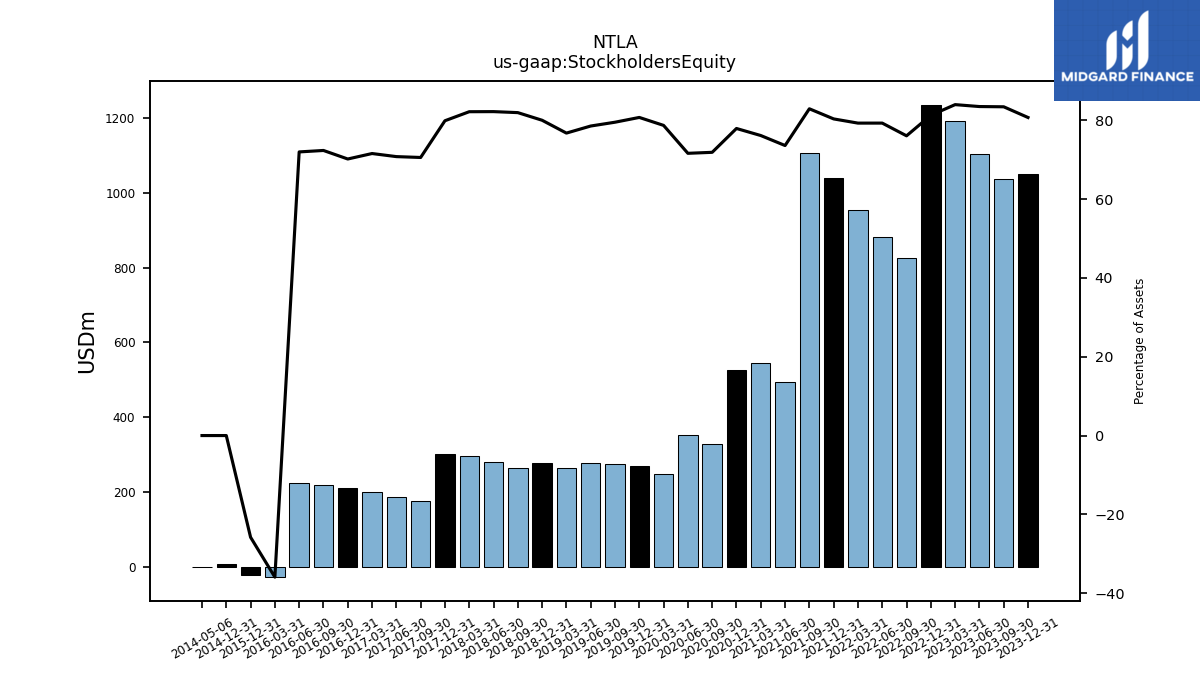
| Stockholders Equity | 1050.17 | 1037.41 | 1104.89 | 1190.84 | 1235.58 | 824.95 | 880.55 | 953.75 | 1040.24 | 1107.10 | 494.81 | 545.87 | 527.07 | 329.62 | 351.59 | 247.76 | 269.88 | 275.65 | 276.87 | 264.34 | 277.92 | 263.27 | 279.34 | 295.50 | 300.60 | 175.85 | 187.59 | 199.88 |
| 2023-12-31 | 2023-09-30 | 2023-06-30 | 2023-03-31 | 2022-12-31 | 2022-09-30 | 2022-06-30 | 2022-03-31 | 2021-12-31 | 2021-09-30 | 2021-06-30 | 2021-03-31 | 2020-12-31 | 2020-09-30 | 2020-06-30 | 2020-03-31 | 2019-12-31 | 2019-09-30 | 2019-06-30 | 2019-03-31 | 2018-12-31 | 2018-09-30 | 2018-06-30 | 2018-03-31 | 2017-12-31 | 2017-09-30 | 2017-06-30 | 2017-03-31 | ||
|---|---|---|---|---|---|---|---|---|---|---|---|---|---|---|---|---|---|---|---|---|---|---|---|---|---|---|---|---|---|
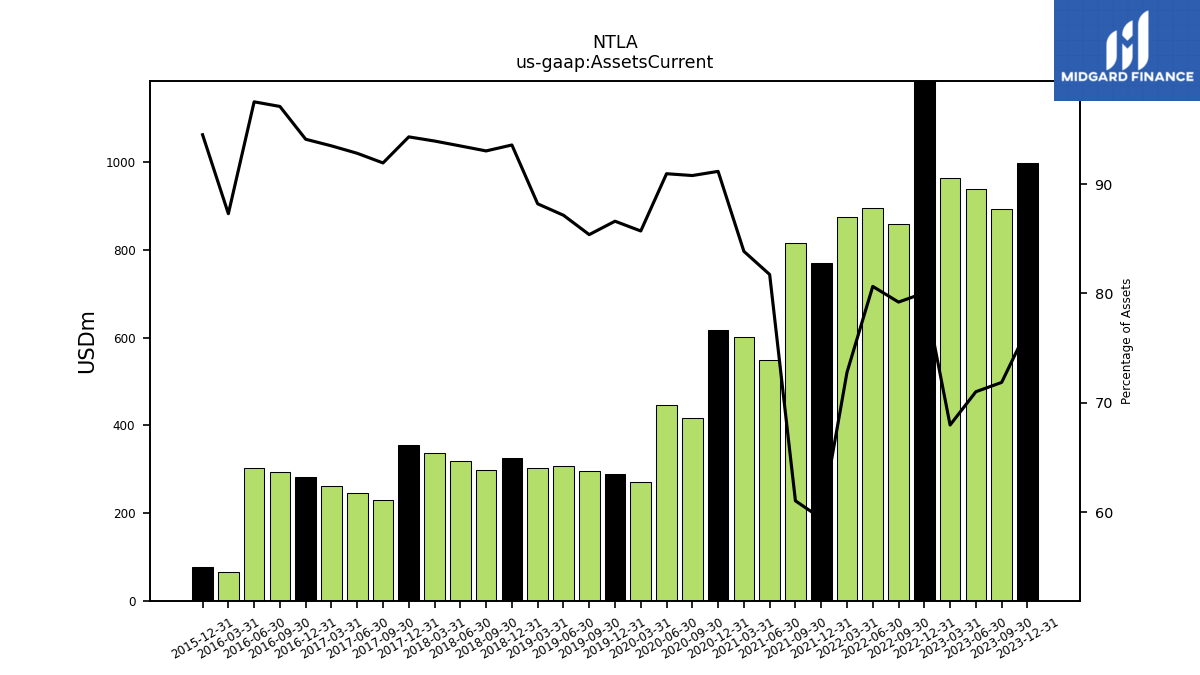
| Assets Current | 998.33 | 893.49 | 939.62 | 963.67 | 1216.80 | 858.95 | 895.43 | 875.37 | 769.30 | 814.77 | 549.40 | 601.08 | 616.52 | 416.25 | 446.37 | 269.76 | 289.48 | 295.94 | 307.14 | 303.69 | 324.98 | 298.83 | 317.63 | 337.72 | 354.83 | 229.05 | 245.92 | 261.08 | |
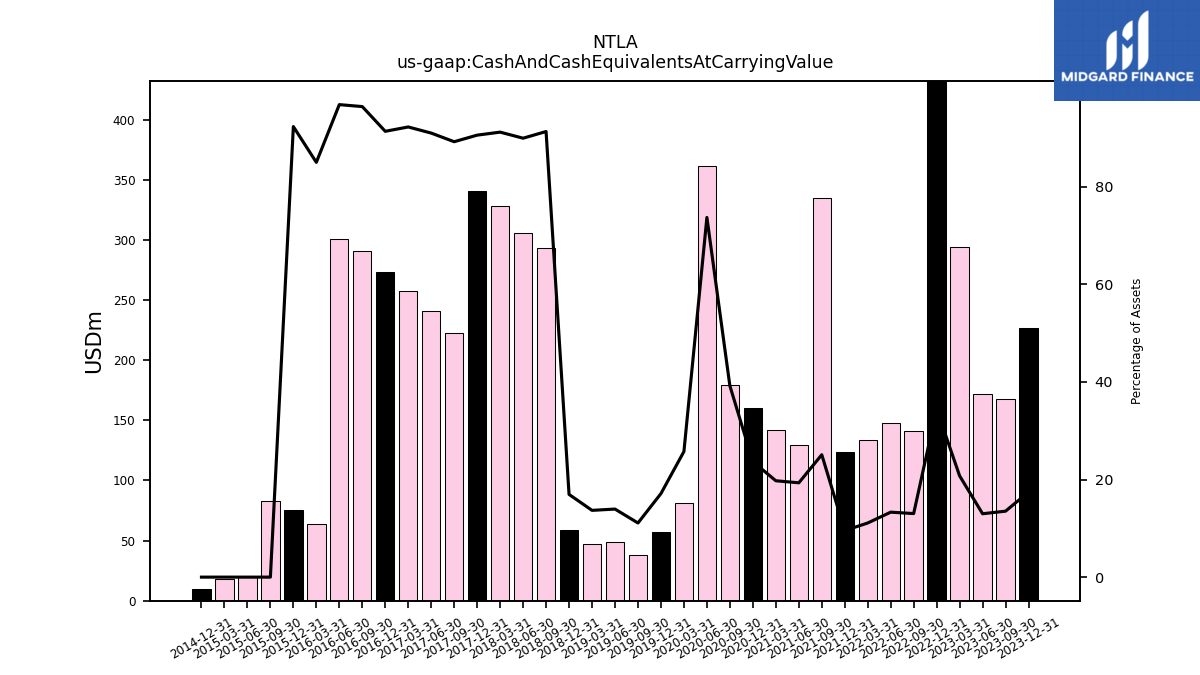
| Cash And Cash Equivalents At Carrying Value | 226.75 | 168.03 | 171.81 | 294.15 | 523.51 | 141.19 | 147.78 | 133.38 | 123.41 | 334.74 | 129.88 | 141.54 | 160.02 | 179.75 | 361.69 | 80.99 | 57.23 | 38.44 | 49.14 | 47.10 | 58.86 | 293.25 | 305.54 | 327.78 | 340.68 | 222.26 | 241.05 | 257.55 | |
| Marketable Securities Current | 685.48 | 686.76 | 736.27 | 639.39 | 669.12 | 687.00 | 726.49 | 721.87 | 625.28 | 463.53 | 399.14 | 442.52 | 437.35 | 228.20 | 75.12 | 169.27 | 222.50 | 247.48 | 221.96 | NA | 255.20 | NA | NA | NA | NA | NA | NA | NA | |
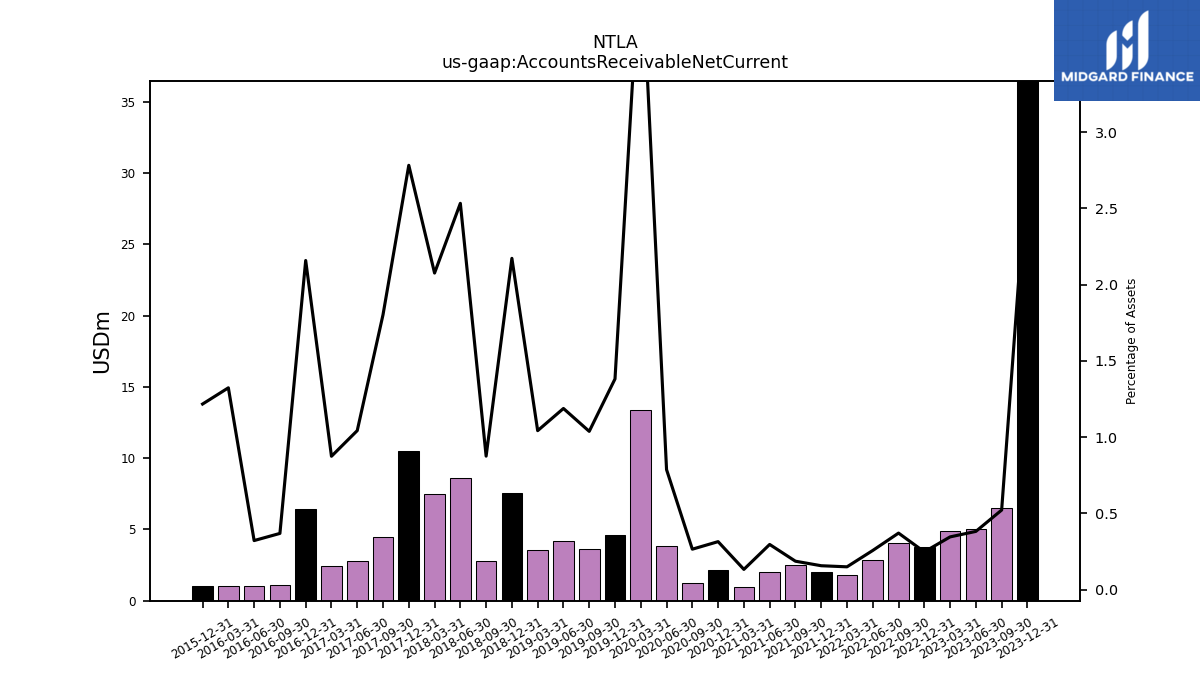
| Accounts Receivable Net Current | 36.46 | 6.49 | 5.06 | 4.91 | 3.77 | 4.02 | 2.85 | 1.80 | 2.03 | 2.49 | 1.99 | 0.95 | 2.13 | 1.22 | 3.86 | 13.37 | 4.62 | 3.60 | 4.19 | 3.59 | 7.55 | 2.81 | 8.61 | 7.47 | 10.47 | 4.49 | 2.76 | 2.44 | |
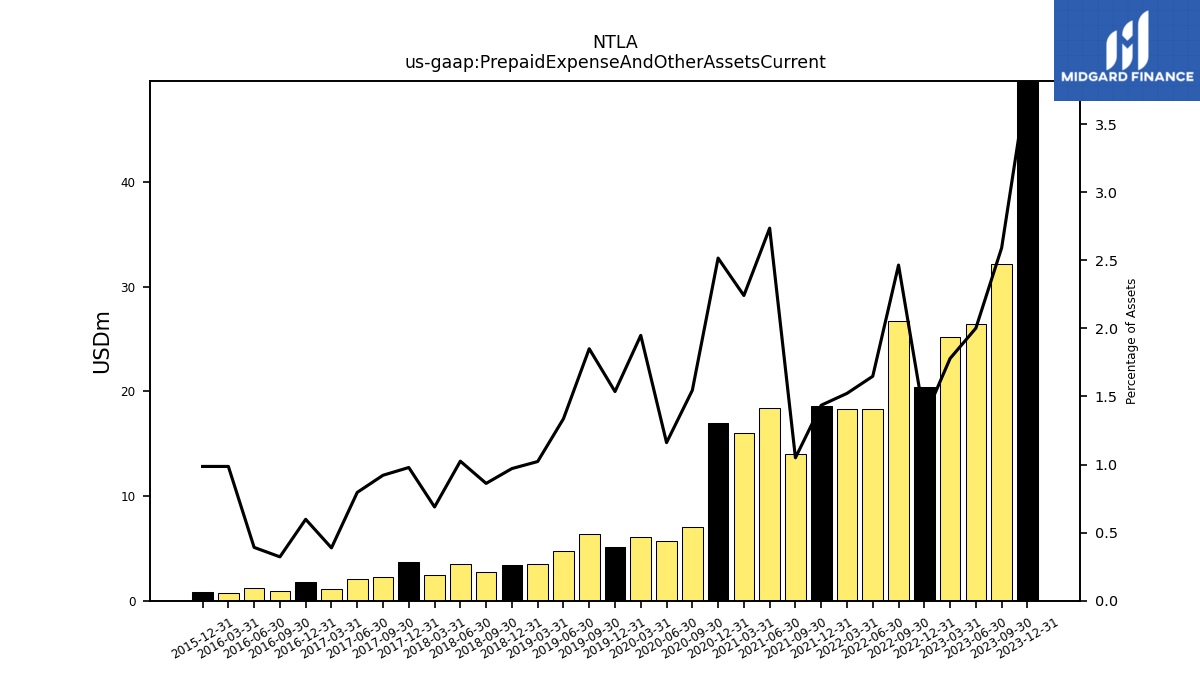
| Prepaid Expense And Other Assets Current | 49.65 | 32.21 | 26.48 | 25.22 | 20.41 | 26.73 | 18.30 | 18.32 | 18.58 | 14.02 | 18.39 | 16.07 | 17.02 | 7.09 | 5.70 | 6.13 | 5.13 | 6.41 | 4.71 | 3.52 | 3.37 | 2.77 | 3.48 | 2.48 | 3.68 | 2.30 | 2.11 | 1.08 | |
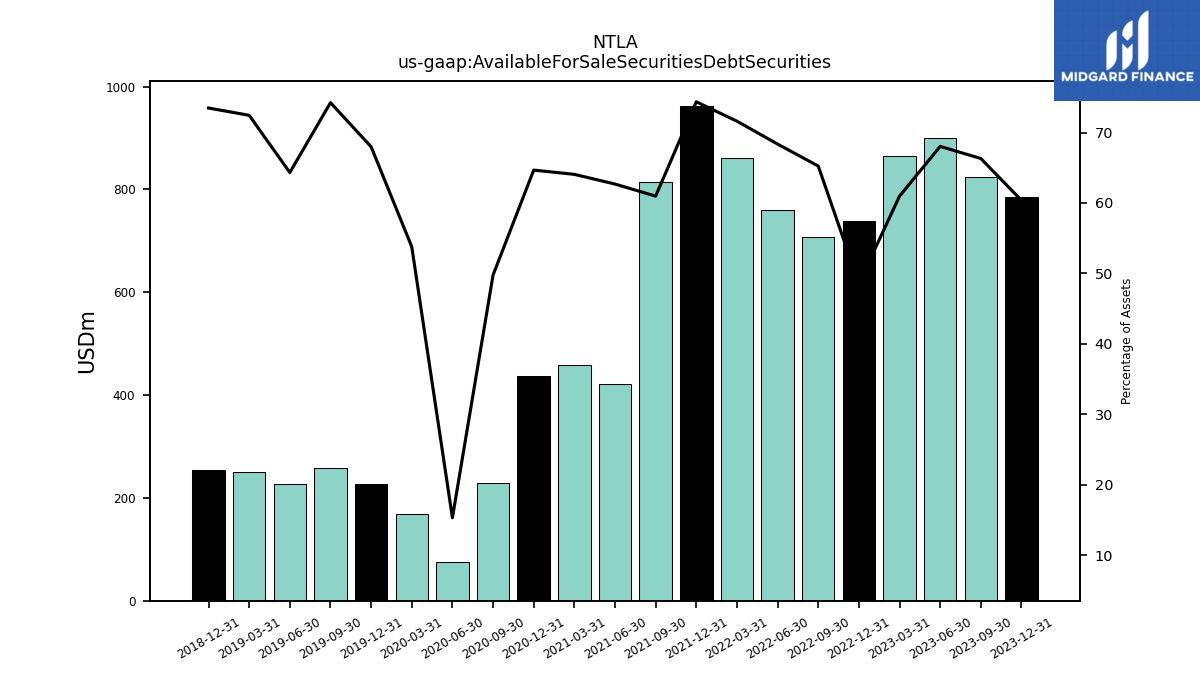
| Available For Sale Securities Debt Securities | 785.34 | 824.51 | 900.28 | 864.43 | 738.45 | 707.53 | 759.10 | 861.36 | 962.64 | 813.98 | 421.40 | 459.26 | 437.35 | 228.20 | 75.12 | 169.27 | 227.25 | 257.35 | 226.70 | 249.49 | 255.20 | NA | NA | NA | NA | NA | NA | NA |
| 2023-12-31 | 2023-09-30 | 2023-06-30 | 2023-03-31 | 2022-12-31 | 2022-09-30 | 2022-06-30 | 2022-03-31 | 2021-12-31 | 2021-09-30 | 2021-06-30 | 2021-03-31 | 2020-12-31 | 2020-09-30 | 2020-06-30 | 2020-03-31 | 2019-12-31 | 2019-09-30 | 2019-06-30 | 2019-03-31 | 2018-12-31 | 2018-09-30 | 2018-06-30 | 2018-03-31 | 2017-12-31 | 2017-09-30 | 2017-06-30 | 2017-03-31 | ||
|---|---|---|---|---|---|---|---|---|---|---|---|---|---|---|---|---|---|---|---|---|---|---|---|---|---|---|---|---|---|
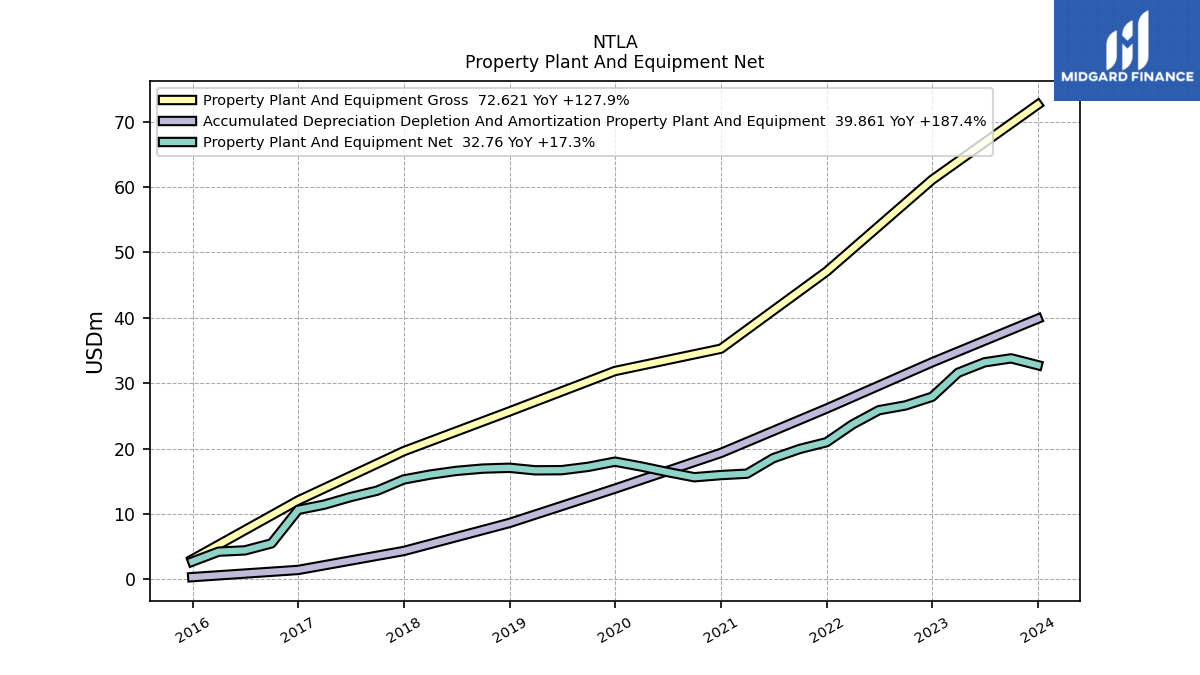
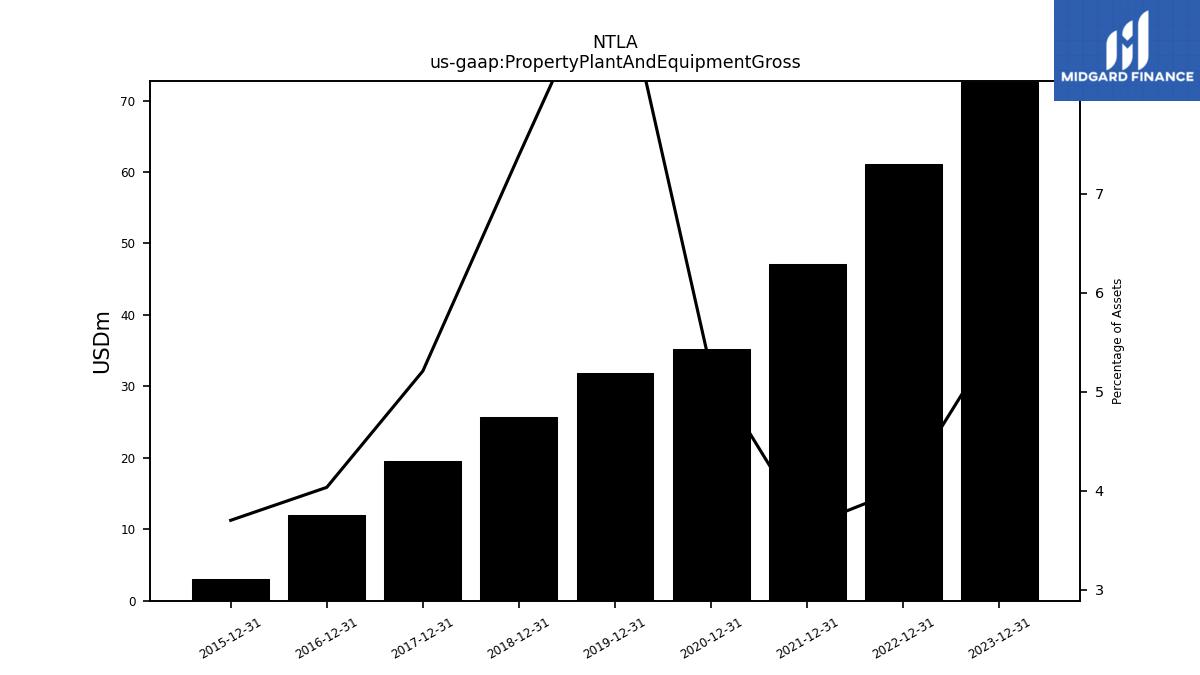
| Property Plant And Equipment Gross | 72.62 | NA | NA | NA | 61.12 | NA | NA | NA | 47.08 | NA | NA | NA | 35.27 | NA | NA | NA | 31.86 | NA | NA | NA | 25.67 | NA | NA | NA | 19.60 | NA | NA | NA | |
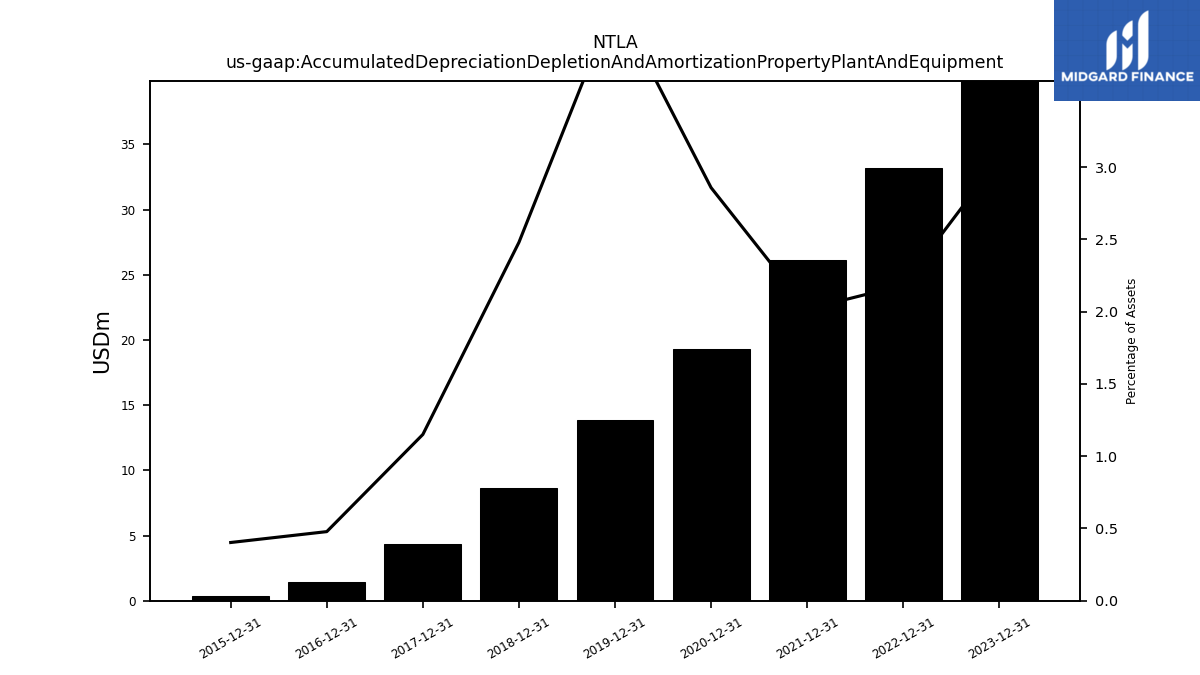
| Accumulated Depreciation Depletion And Amortization Property Plant And Equipment | 39.86 | NA | NA | NA | 33.20 | NA | NA | NA | 26.11 | NA | NA | NA | 19.33 | NA | NA | NA | 13.87 | NA | NA | NA | 8.61 | NA | NA | NA | 4.33 | NA | NA | NA | |
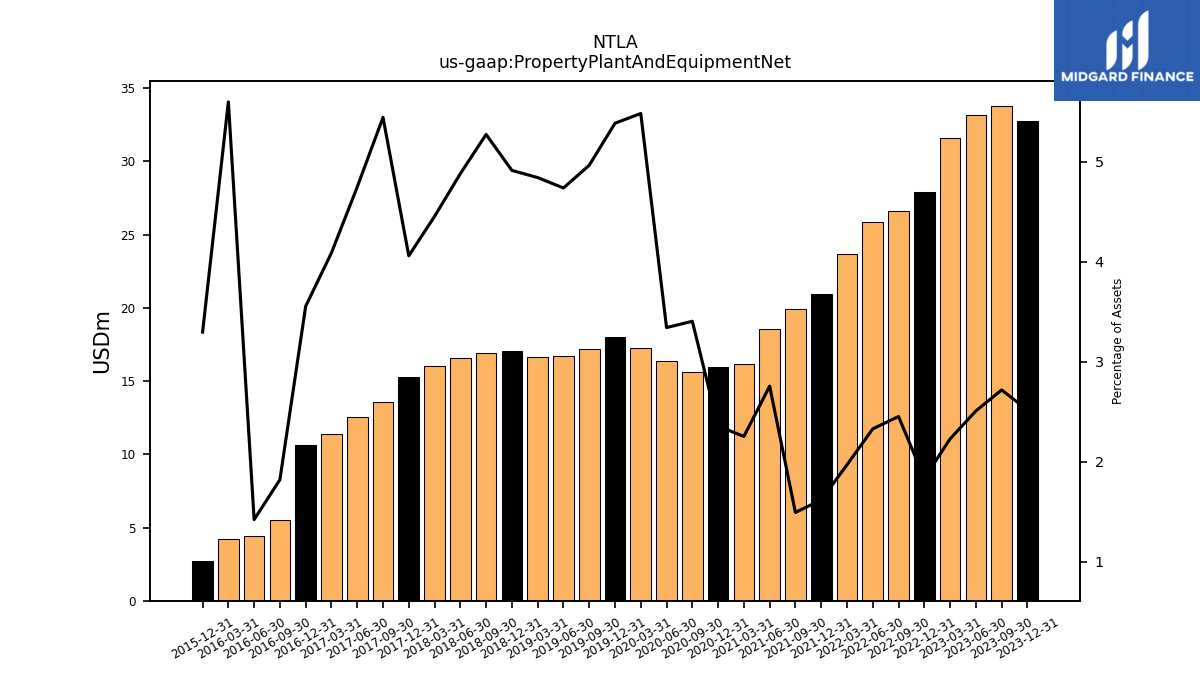
| Property Plant And Equipment Net | 32.76 | 33.80 | 33.19 | 31.61 | 27.92 | 26.60 | 25.87 | 23.70 | 20.97 | 19.95 | 18.53 | 16.16 | 15.94 | 15.61 | 16.40 | 17.25 | 18.00 | 17.21 | 16.69 | 16.67 | 17.06 | 16.93 | 16.58 | 16.01 | 15.27 | 13.56 | 12.58 | 11.42 | |
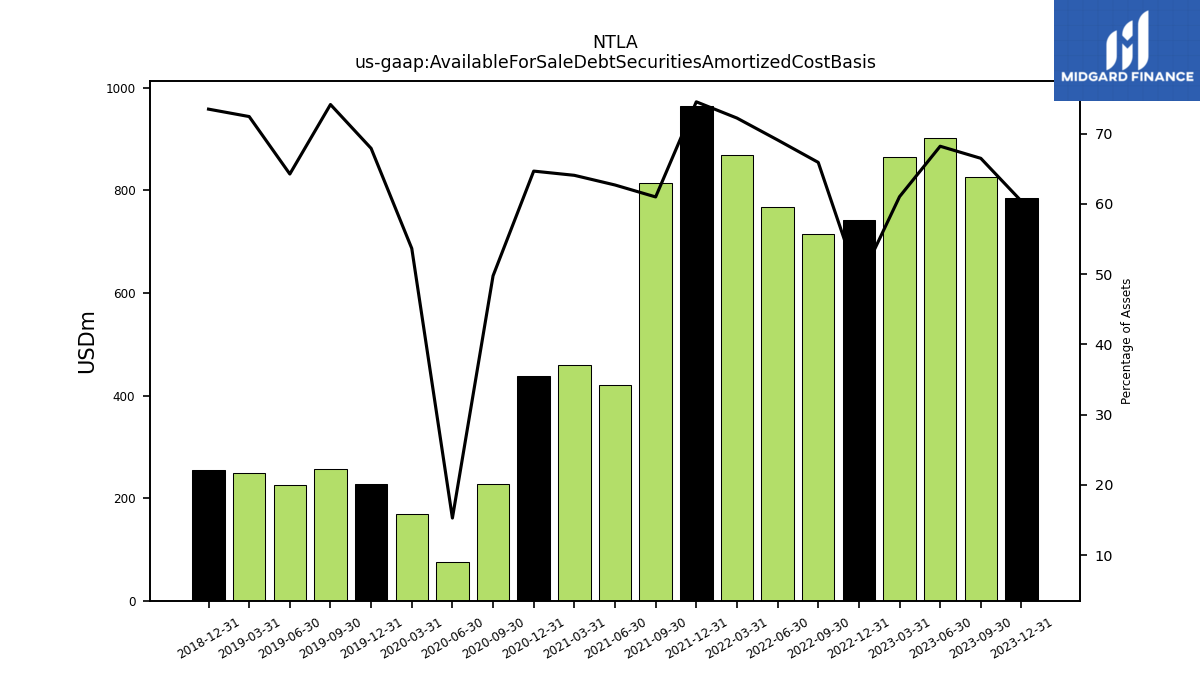
| Available For Sale Debt Securities Amortized Cost Basis | 785.47 | 826.63 | 902.54 | 865.20 | 742.22 | 714.73 | 767.28 | 868.61 | 964.77 | 814.15 | 421.41 | 459.27 | 437.35 | 228.17 | 74.96 | 168.89 | 226.99 | 257.01 | 226.44 | 249.43 | 255.23 | NA | NA | NA | NA | NA | NA | NA |
| 2023-12-31 | 2023-09-30 | 2023-06-30 | 2023-03-31 | 2022-12-31 | 2022-09-30 | 2022-06-30 | 2022-03-31 | 2021-12-31 | 2021-09-30 | 2021-06-30 | 2021-03-31 | 2020-12-31 | 2020-09-30 | 2020-06-30 | 2020-03-31 | 2019-12-31 | 2019-09-30 | 2019-06-30 | 2019-03-31 | 2018-12-31 | 2018-09-30 | 2018-06-30 | 2018-03-31 | 2017-12-31 | 2017-09-30 | 2017-06-30 | 2017-03-31 | ||
|---|---|---|---|---|---|---|---|---|---|---|---|---|---|---|---|---|---|---|---|---|---|---|---|---|---|---|---|---|---|
| Liabilities Current | 115.21 | 91.95 | 99.85 | 103.38 | 126.55 | 131.13 | 123.76 | 126.11 | 125.83 | 97.57 | 73.96 | 60.70 | 64.25 | 55.87 | 59.14 | 35.30 | 35.63 | 37.52 | 38.46 | 39.23 | 40.57 | 25.91 | 25.17 | 25.58 | 31.36 | 25.79 | 26.37 | 24.91 | |
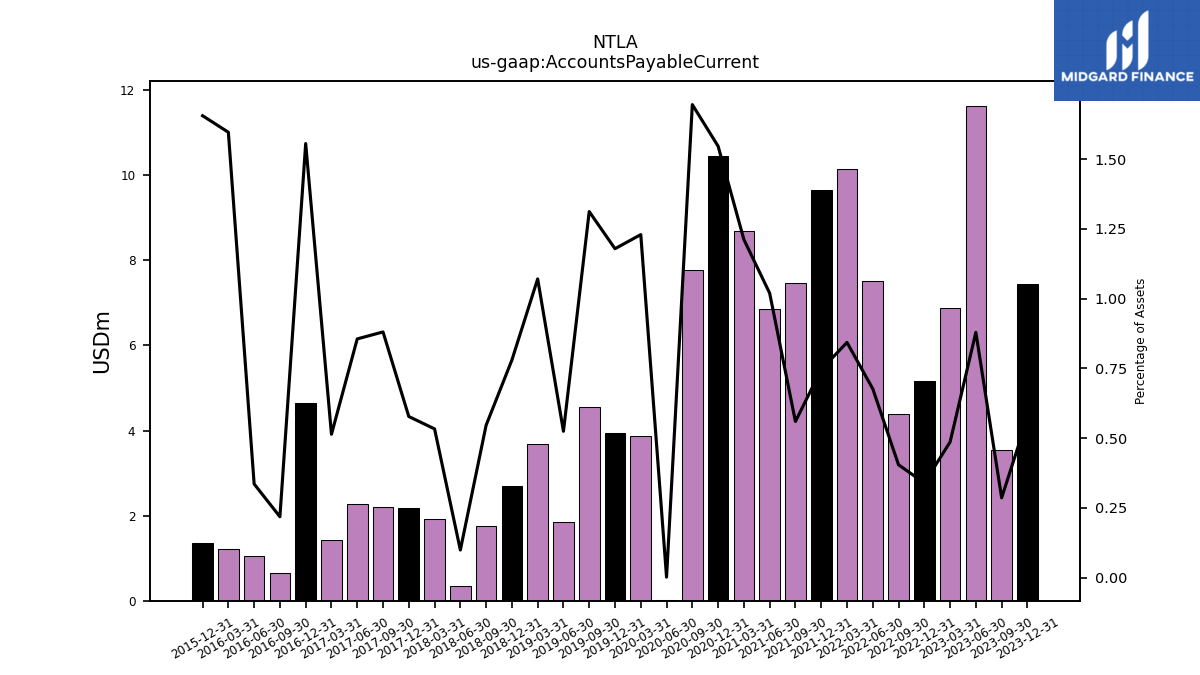
| Accounts Payable Current | 7.45 | 3.55 | 11.63 | 6.89 | 5.15 | 4.38 | 7.51 | 10.14 | 9.65 | 7.47 | 6.85 | 8.69 | 10.46 | 7.78 | 0.01 | 3.87 | 3.94 | 4.55 | 1.85 | 3.69 | 2.71 | 1.75 | 0.34 | 1.92 | 2.17 | 2.19 | 2.27 | 1.43 | |
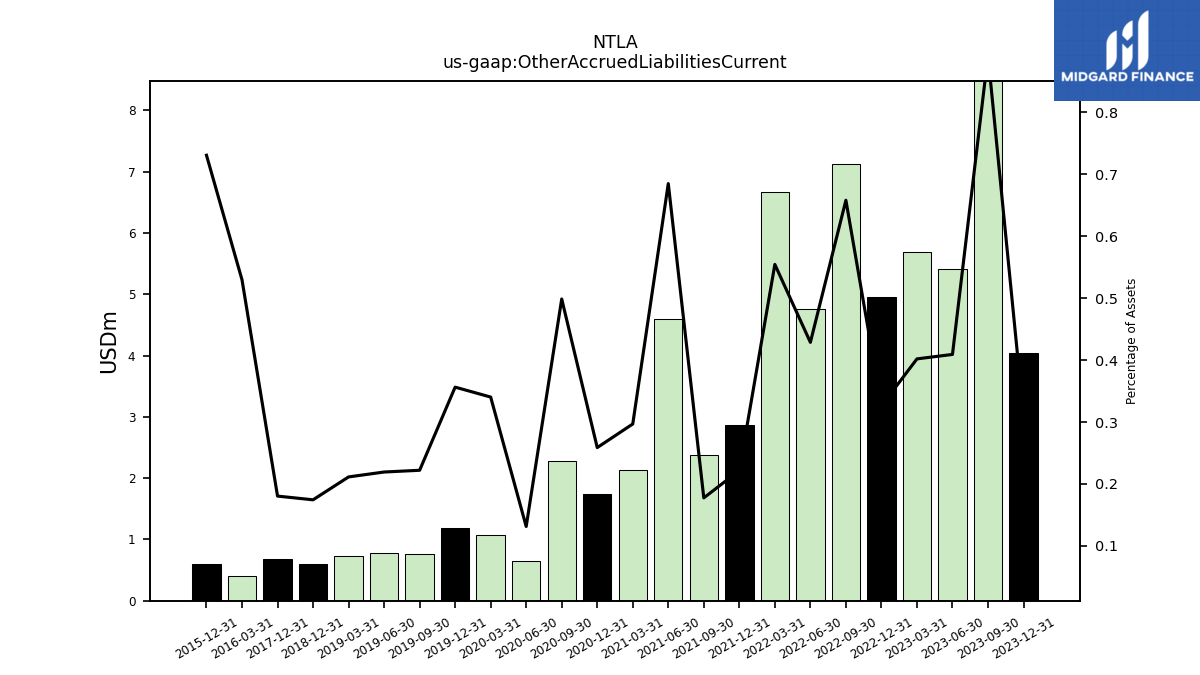
| Other Accrued Liabilities Current | 4.04 | 11.08 | 5.41 | 5.70 | 4.96 | 7.13 | 4.76 | 6.67 | 2.87 | 2.37 | 4.60 | 2.13 | 1.75 | 2.29 | 0.65 | 1.07 | 1.19 | 0.77 | 0.77 | 0.73 | 0.61 | NA | NA | NA | 0.68 | NA | NA | NA | |
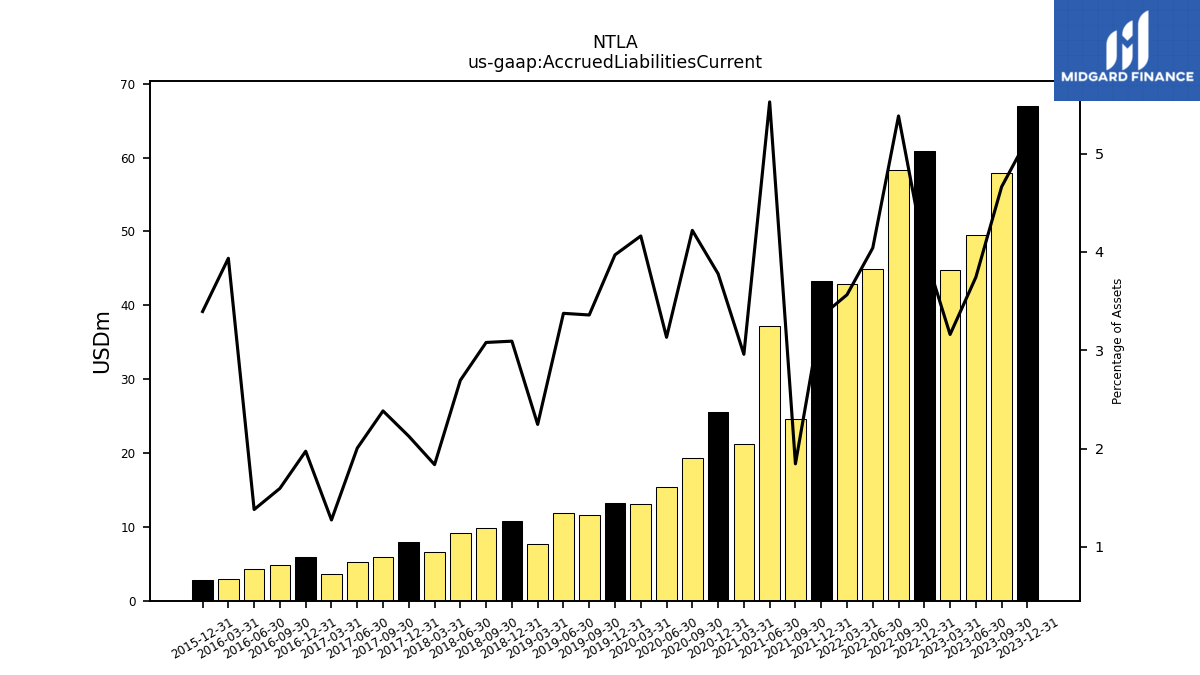
| Accrued Liabilities Current | 67.02 | 57.98 | 49.53 | 44.82 | 60.88 | 58.38 | 44.87 | 42.88 | 43.31 | 24.63 | 37.15 | 21.21 | 25.55 | 19.35 | 15.37 | 13.10 | 13.27 | 11.64 | 11.90 | 7.74 | 10.74 | 9.89 | 9.16 | 6.61 | 8.00 | 5.94 | 5.31 | 3.56 | |
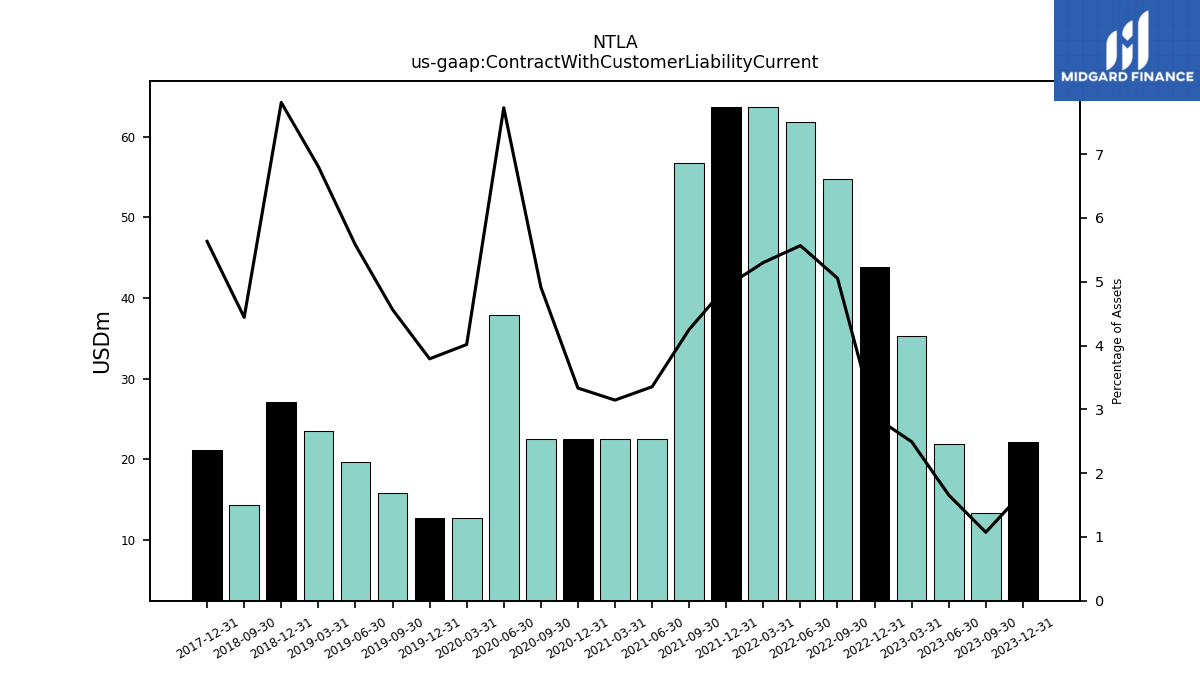
| Contract With Customer Liability Current | 22.14 | 13.35 | 21.93 | 35.34 | 43.84 | 54.82 | 61.81 | 63.76 | 63.76 | 56.76 | 22.54 | 22.54 | 22.54 | 22.54 | 37.93 | 12.64 | 12.67 | 15.82 | 19.65 | 23.43 | 27.12 | 14.27 | NA | NA | 21.19 | NA | NA | NA |
| 2023-12-31 | 2023-09-30 | 2023-06-30 | 2023-03-31 | 2022-12-31 | 2022-09-30 | 2022-06-30 | 2022-03-31 | 2021-12-31 | 2021-09-30 | 2021-06-30 | 2021-03-31 | 2020-12-31 | 2020-09-30 | 2020-06-30 | 2020-03-31 | 2019-12-31 | 2019-09-30 | 2019-06-30 | 2019-03-31 | 2018-12-31 | 2018-09-30 | 2018-06-30 | 2018-03-31 | 2017-12-31 | 2017-09-30 | 2017-06-30 | 2017-03-31 | ||
|---|---|---|---|---|---|---|---|---|---|---|---|---|---|---|---|---|---|---|---|---|---|---|---|---|---|---|---|---|---|
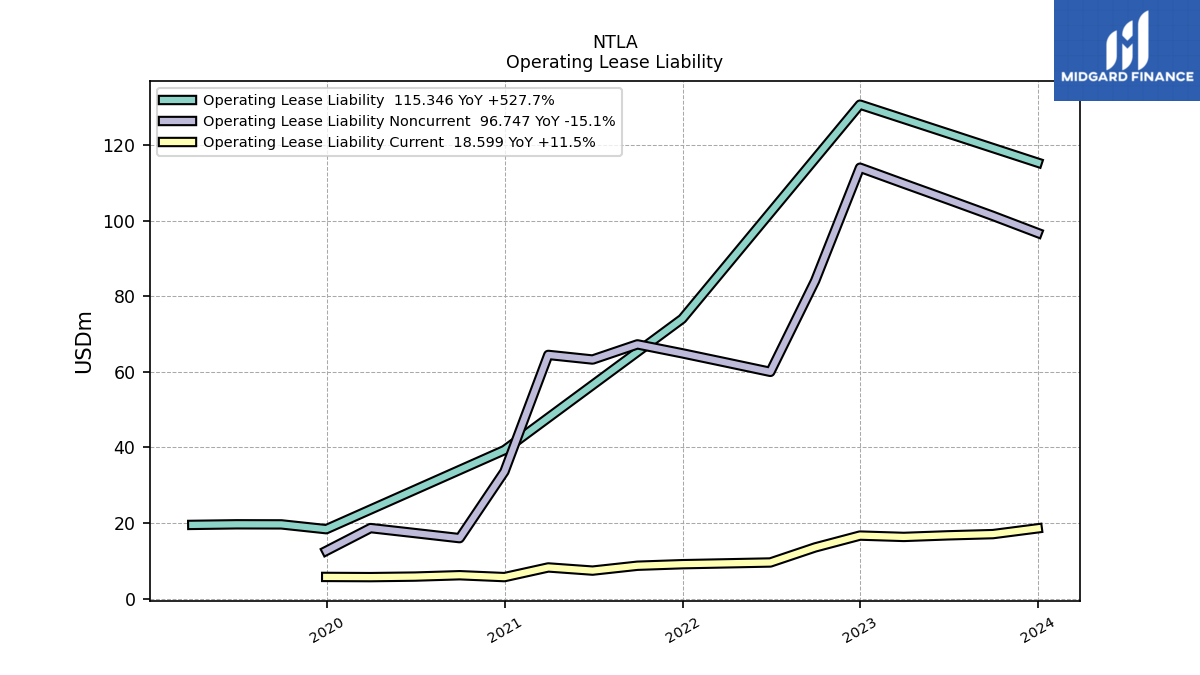
| Operating Lease Liability Noncurrent | 96.75 | 101.26 | 105.58 | 109.80 | 114.02 | 84.10 | 60.00 | 62.48 | 64.91 | 67.27 | 63.26 | 64.49 | 33.61 | 16.00 | 17.35 | 18.67 | 12.63 | NA | NA | NA | NA | NA | NA | NA | NA | NA | NA | NA |
| 2023-12-31 | 2023-09-30 | 2023-06-30 | 2023-03-31 | 2022-12-31 | 2022-09-30 | 2022-06-30 | 2022-03-31 | 2021-12-31 | 2021-09-30 | 2021-06-30 | 2021-03-31 | 2020-12-31 | 2020-09-30 | 2020-06-30 | 2020-03-31 | 2019-12-31 | 2019-09-30 | 2019-06-30 | 2019-03-31 | 2018-12-31 | 2018-09-30 | 2018-06-30 | 2018-03-31 | 2017-12-31 | 2017-09-30 | 2017-06-30 | 2017-03-31 | ||
|---|---|---|---|---|---|---|---|---|---|---|---|---|---|---|---|---|---|---|---|---|---|---|---|---|---|---|---|---|---|
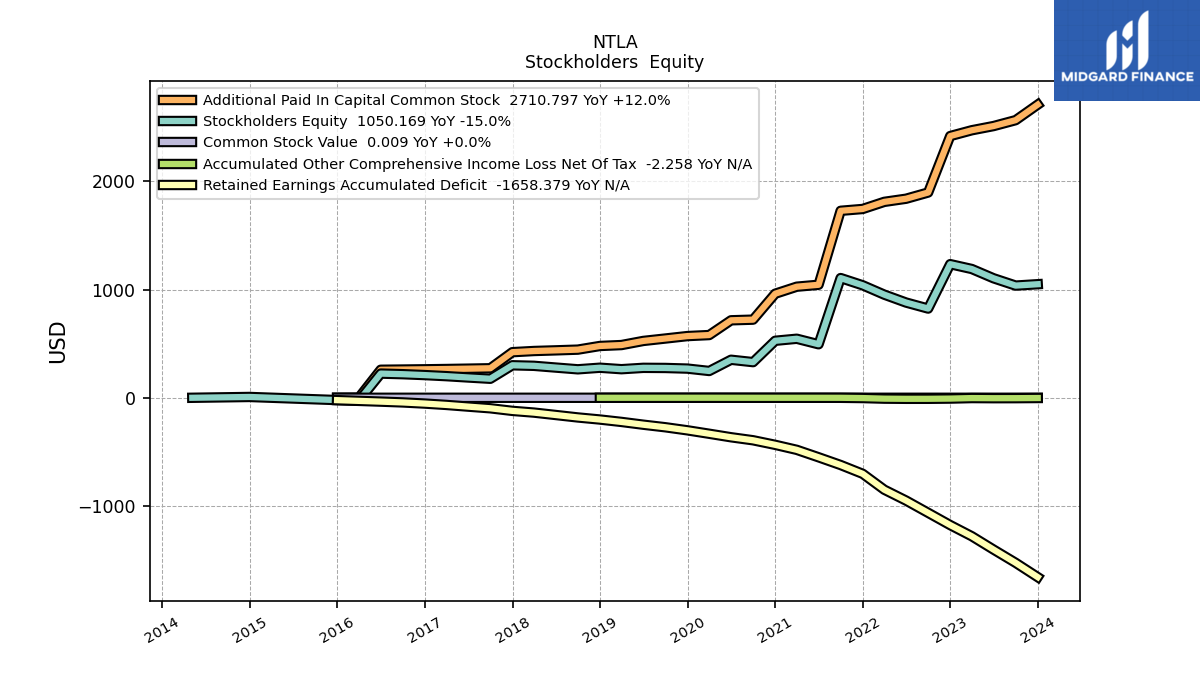
| Stockholders Equity | 1050.17 | 1037.41 | 1104.89 | 1190.84 | 1235.58 | 824.95 | 880.55 | 953.75 | 1040.24 | 1107.10 | 494.81 | 545.87 | 527.07 | 329.62 | 351.59 | 247.76 | 269.88 | 275.65 | 276.87 | 264.34 | 277.92 | 263.27 | 279.34 | 295.50 | 300.60 | 175.85 | 187.59 | 199.88 | |
| Common Stock Value | 0.01 | 0.01 | 0.01 | 0.01 | 0.01 | 0.01 | 0.01 | 0.01 | 0.01 | 0.01 | 0.01 | 0.01 | 0.01 | 0.01 | 0.01 | 0.01 | 0.01 | 0.01 | 0.01 | 0.01 | 0.01 | 0.00 | 0.00 | 0.00 | 0.00 | 0.00 | 0.00 | 0.00 | |
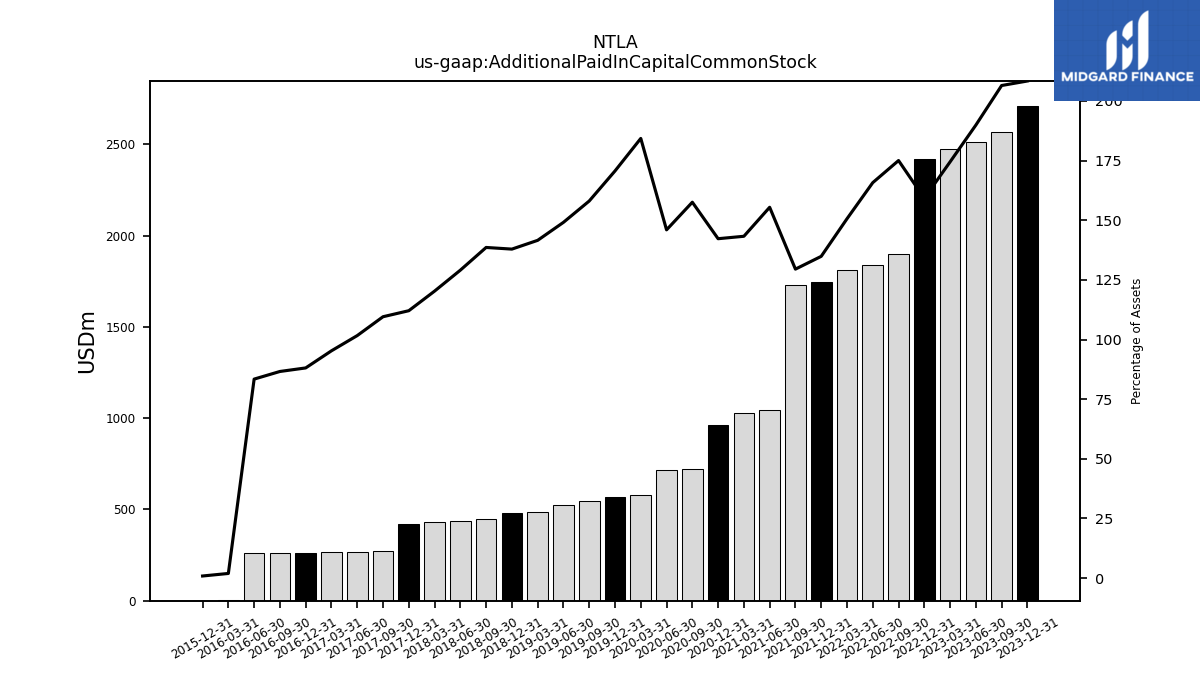
| Additional Paid In Capital Common Stock | 2710.80 | 2567.20 | 2512.74 | 2473.82 | 2420.22 | 1898.09 | 1840.64 | 1811.68 | 1745.87 | 1729.03 | 1044.94 | 1027.19 | 962.17 | 722.50 | 716.50 | 580.07 | 570.49 | 547.91 | 525.57 | 487.56 | 478.97 | 445.23 | 438.59 | 432.53 | 421.71 | 272.99 | 269.38 | 266.08 | |
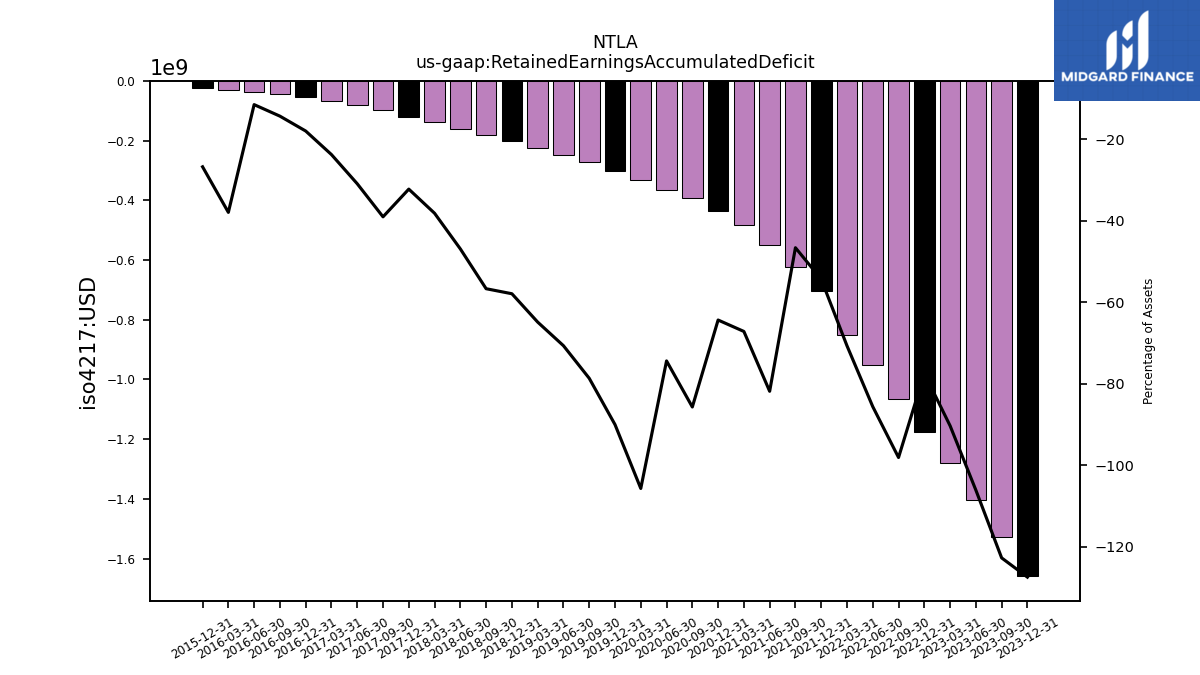
| Retained Earnings Accumulated Deficit | -1658.38 | -1526.22 | -1403.99 | -1280.31 | -1177.19 | -1063.78 | -950.55 | -849.87 | -703.00 | -621.76 | -550.12 | -481.31 | -435.11 | -392.92 | -365.08 | -332.68 | -300.88 | -272.60 | -248.97 | -223.28 | -201.03 | -181.96 | -159.26 | -137.04 | -121.11 | -97.15 | -81.79 | -66.20 | |
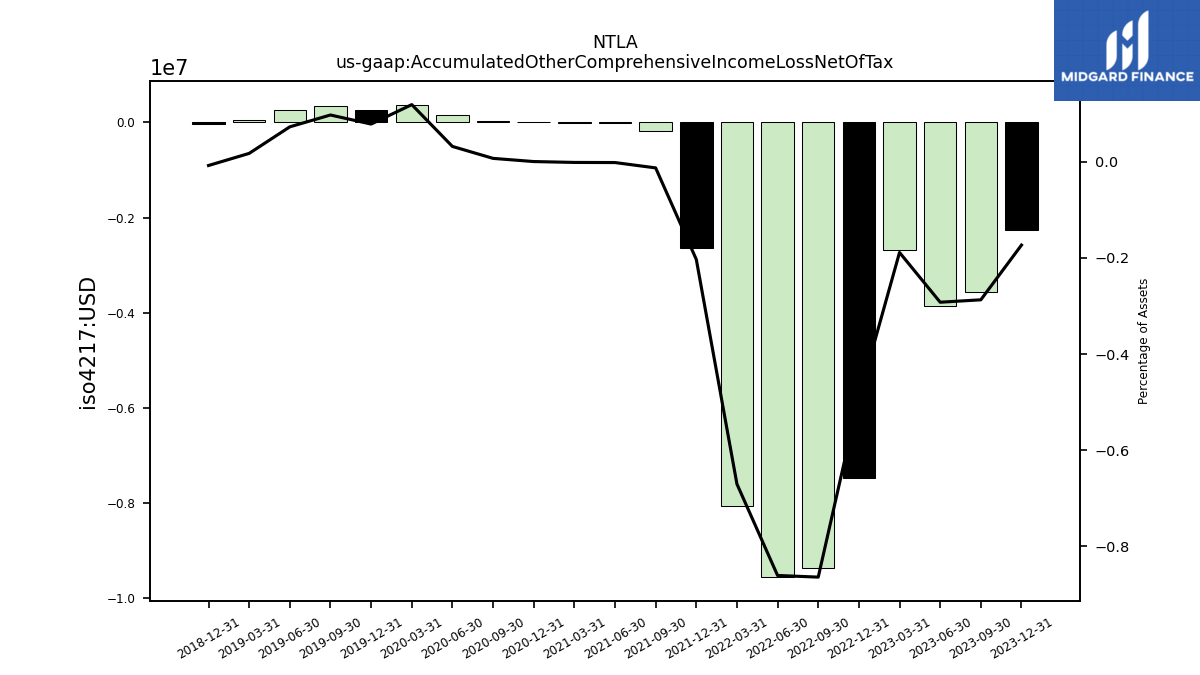
| Accumulated Other Comprehensive Income Loss Net Of Tax | -2.26 | -3.57 | -3.87 | -2.68 | -7.46 | -9.37 | -9.55 | -8.06 | -2.63 | -0.17 | -0.01 | -0.01 | 0.00 | 0.03 | 0.15 | 0.37 | 0.26 | 0.34 | 0.26 | 0.06 | -0.03 | NA | NA | NA | NA | NA | NA | NA |
| 2023-12-31 | 2023-09-30 | 2023-06-30 | 2023-03-31 | 2022-12-31 | 2022-09-30 | 2022-06-30 | 2022-03-31 | 2021-12-31 | 2021-09-30 | 2021-06-30 | 2021-03-31 | 2020-12-31 | 2020-09-30 | 2020-06-30 | 2020-03-31 | 2019-12-31 | 2019-09-30 | 2019-06-30 | 2019-03-31 | 2018-12-31 | 2018-09-30 | 2018-06-30 | 2018-03-31 | 2017-12-31 | 2017-09-30 | 2017-06-30 | 2017-03-31 | ||
|---|---|---|---|---|---|---|---|---|---|---|---|---|---|---|---|---|---|---|---|---|---|---|---|---|---|---|---|---|---|
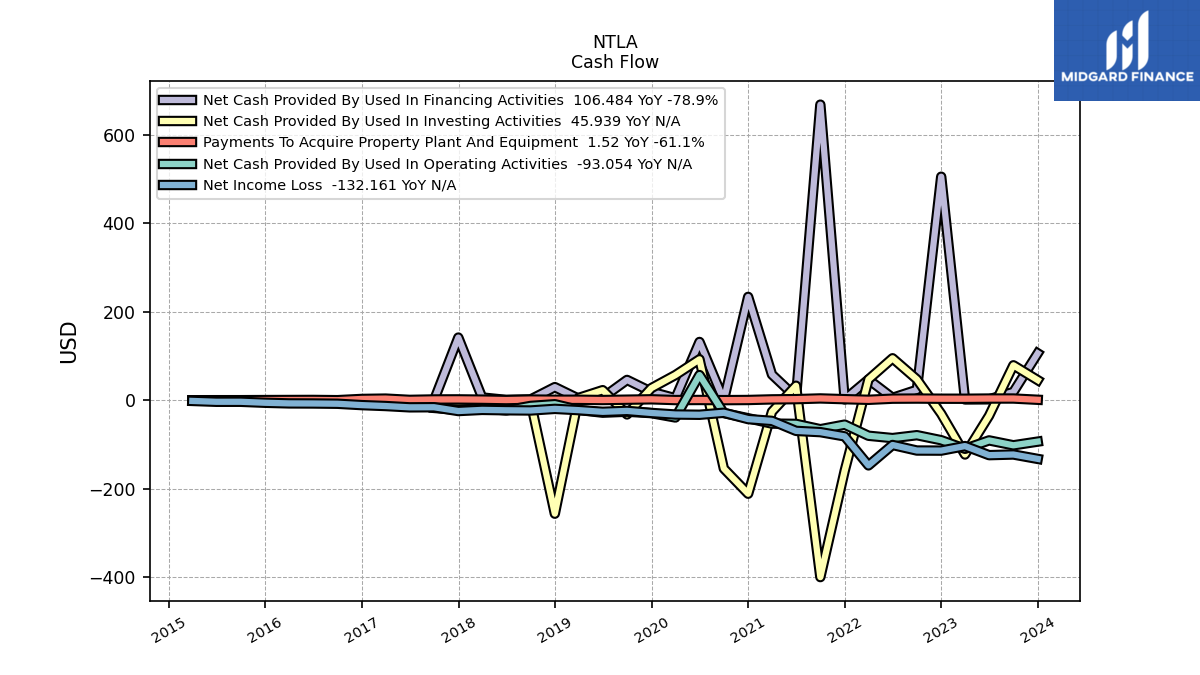
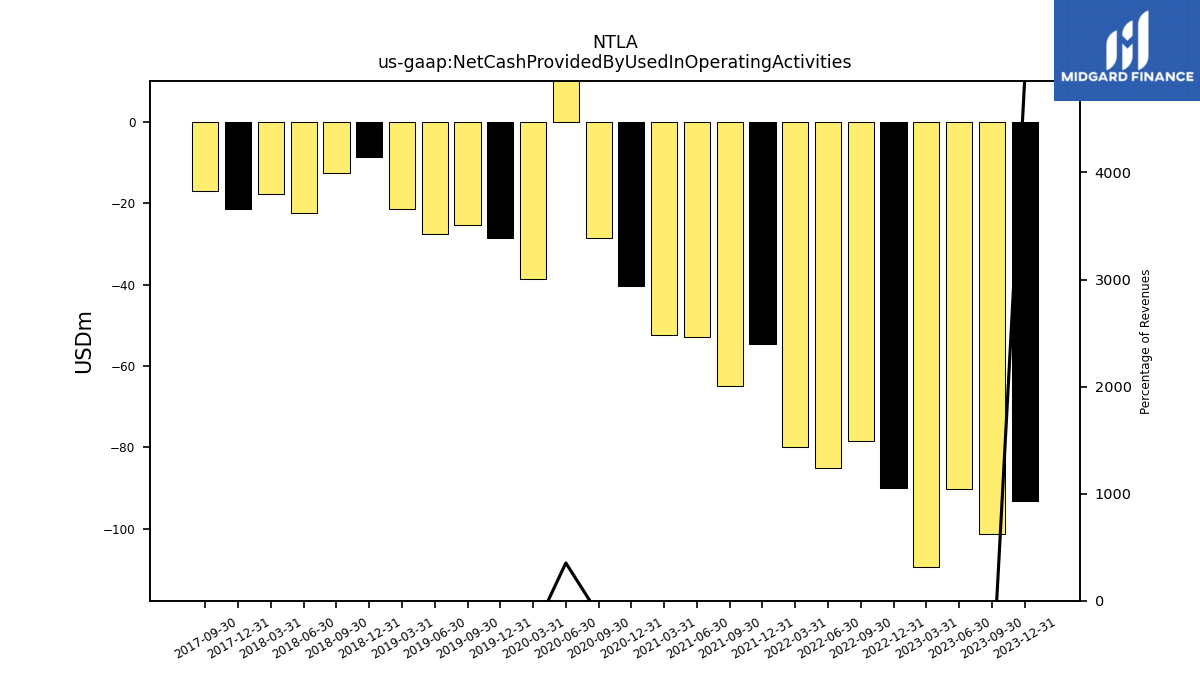
| Net Cash Provided By Used In Operating Activities | -93.05 | -101.38 | -90.32 | -109.33 | -89.87 | -78.53 | -85.09 | -79.80 | -54.65 | -65.02 | -52.98 | -52.38 | -40.23 | -28.56 | 57.42 | -38.55 | -28.66 | -25.45 | -27.68 | -21.45 | -8.54 | -12.45 | -22.50 | -17.77 | -21.31 | -16.89 | NA | NA | |
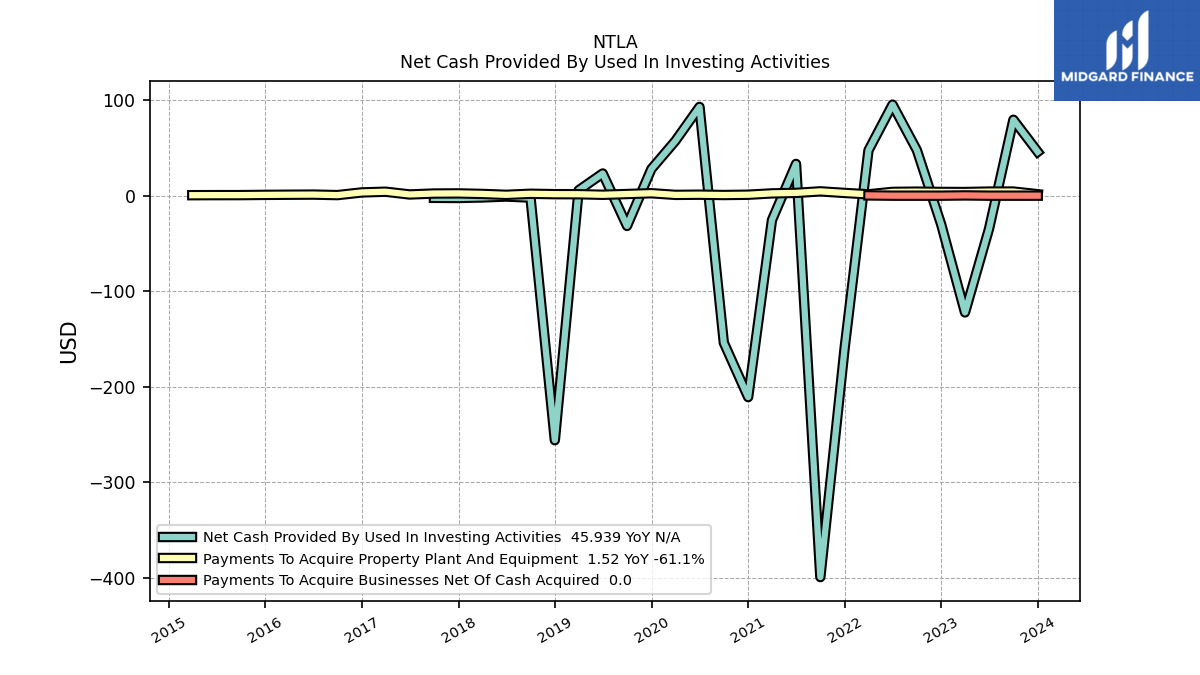
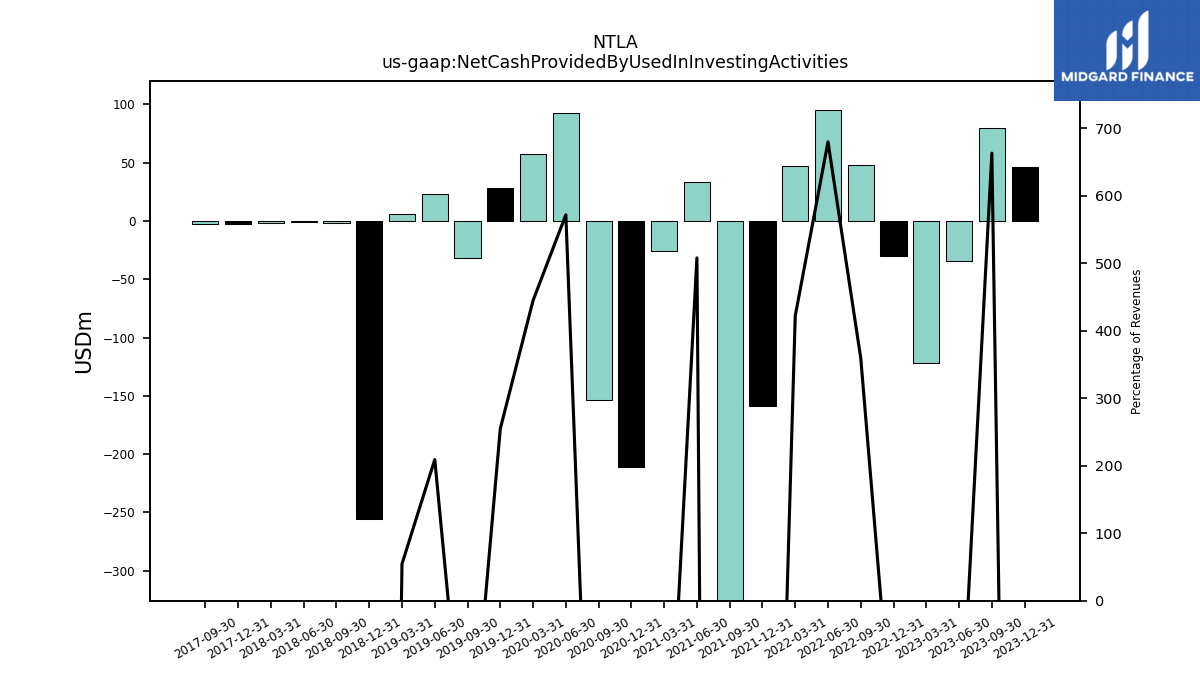
| Net Cash Provided By Used In Investing Activities | 45.94 | 79.50 | -34.54 | -122.25 | -30.15 | 47.64 | 95.34 | 47.47 | -159.12 | -399.38 | 33.26 | -25.54 | -210.92 | -153.98 | 92.96 | 57.45 | 27.88 | -31.65 | 23.25 | 5.70 | -256.02 | -2.02 | -0.90 | -1.85 | -2.40 | -2.26 | NA | NA | |
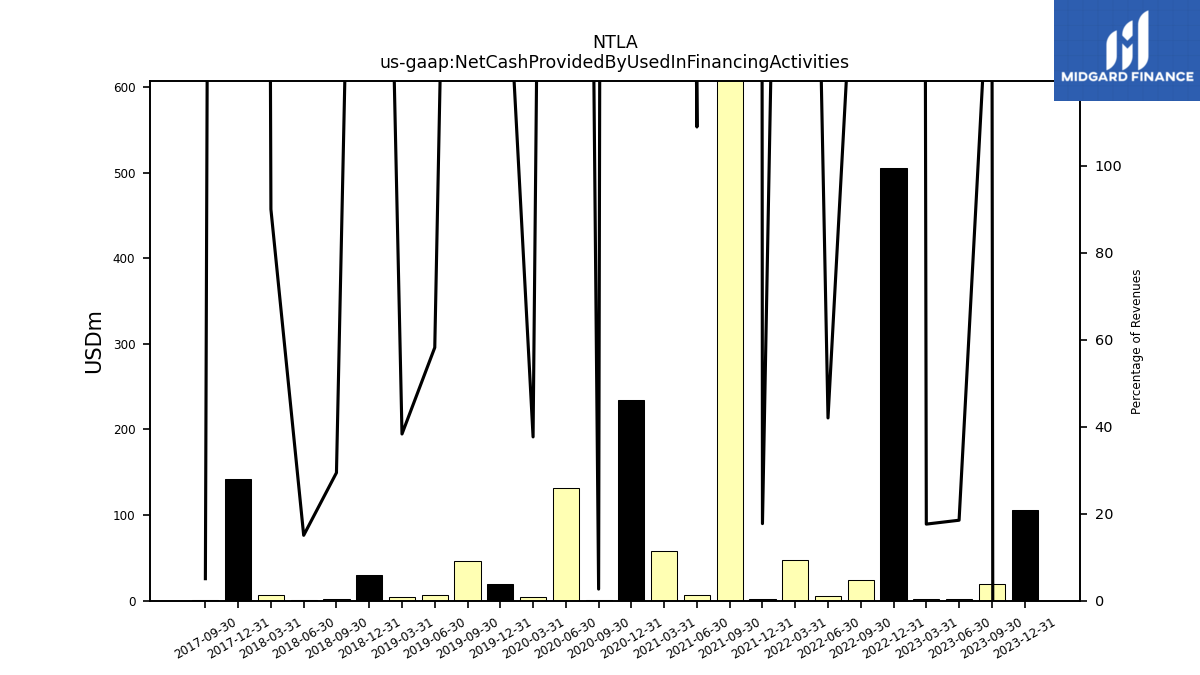
| Net Cash Provided By Used In Financing Activities | 106.48 | 19.10 | 2.52 | 2.22 | 505.76 | 23.98 | 5.89 | 47.32 | 2.28 | 668.68 | 7.13 | 58.59 | 234.09 | 0.60 | 132.22 | 4.86 | 19.56 | 46.40 | 6.47 | 4.00 | 30.16 | 2.18 | 1.16 | 6.72 | 142.12 | 0.37 | NA | NA |
| 2023-12-31 | 2023-09-30 | 2023-06-30 | 2023-03-31 | 2022-12-31 | 2022-09-30 | 2022-06-30 | 2022-03-31 | 2021-12-31 | 2021-09-30 | 2021-06-30 | 2021-03-31 | 2020-12-31 | 2020-09-30 | 2020-06-30 | 2020-03-31 | 2019-12-31 | 2019-09-30 | 2019-06-30 | 2019-03-31 | 2018-12-31 | 2018-09-30 | 2018-06-30 | 2018-03-31 | 2017-12-31 | 2017-09-30 | 2017-06-30 | 2017-03-31 | ||
|---|---|---|---|---|---|---|---|---|---|---|---|---|---|---|---|---|---|---|---|---|---|---|---|---|---|---|---|---|---|
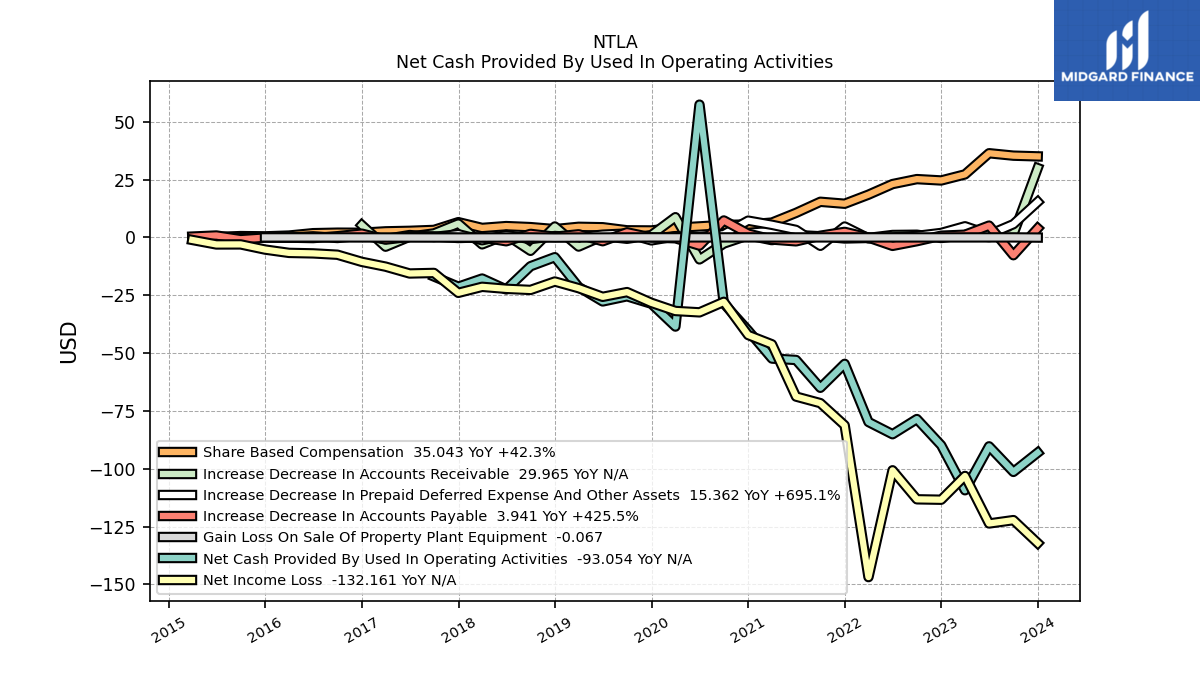
| Net Cash Provided By Used In Operating Activities | -93.05 | -101.38 | -90.32 | -109.33 | -89.87 | -78.53 | -85.09 | -79.80 | -54.65 | -65.02 | -52.98 | -52.38 | -40.23 | -28.56 | 57.42 | -38.55 | -28.66 | -25.45 | -27.68 | -21.45 | -8.54 | -12.45 | -22.50 | -17.77 | -21.31 | -16.89 | NA | NA | |
| Net Income Loss | -132.16 | -122.22 | -123.68 | -103.13 | -113.41 | -113.23 | -100.68 | -146.87 | -81.24 | -71.64 | -68.81 | -46.20 | -42.19 | -27.84 | -32.39 | -31.81 | -28.28 | -23.63 | -25.68 | -21.94 | -19.07 | -22.70 | -22.22 | -21.36 | -23.96 | -15.36 | -15.59 | -12.63 | |
| Profit Loss | -132.16 | -122.22 | -123.68 | -103.13 | -113.41 | -113.23 | -100.68 | -146.87 | -81.24 | -71.64 | -68.81 | -46.20 | -42.19 | -27.84 | -32.39 | -31.81 | -28.28 | -23.63 | -25.68 | -21.94 | -19.07 | -22.70 | -22.22 | -21.36 | -23.96 | -15.36 | NA | NA | |
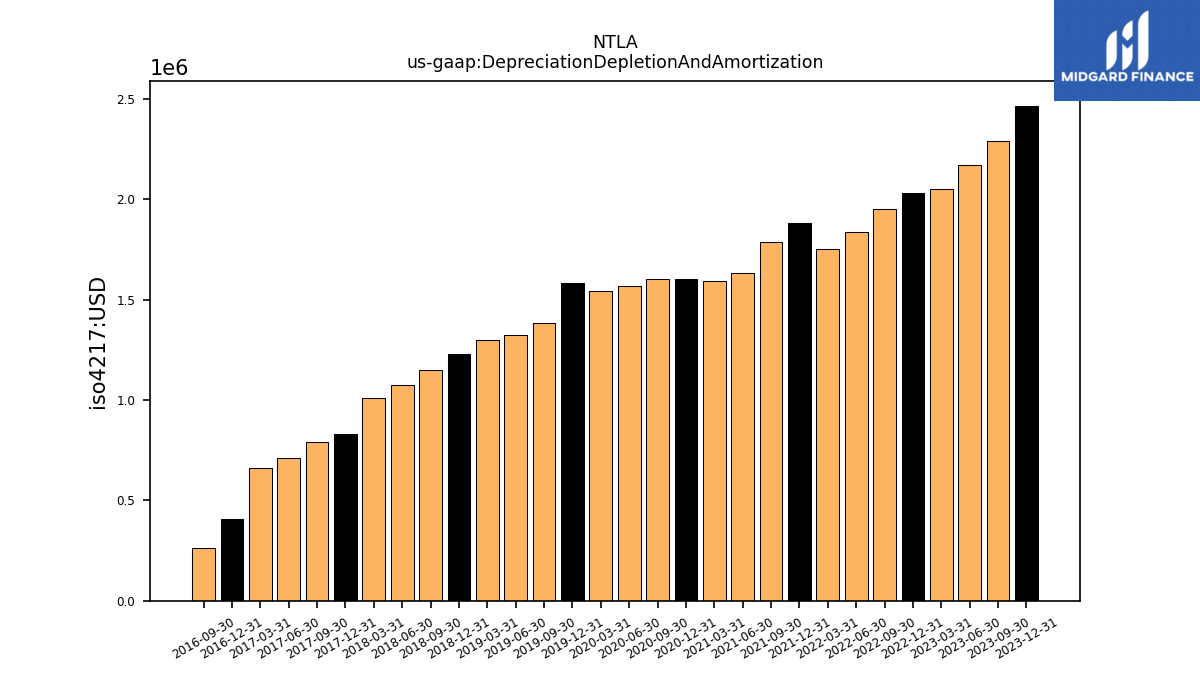
| Depreciation Depletion And Amortization | 2.47 | 2.29 | 2.17 | 2.05 | 2.03 | 1.95 | 1.84 | 1.75 | 1.88 | 1.79 | 1.63 | 1.59 | 1.60 | 1.60 | 1.57 | 1.54 | 1.58 | 1.38 | 1.32 | 1.30 | 1.23 | 1.15 | 1.07 | 1.01 | 0.83 | 0.79 | 0.71 | 0.66 | |
| Increase Decrease In Accounts Receivable | 29.96 | 1.43 | 0.15 | 1.14 | -0.26 | 1.17 | 1.05 | -0.23 | -0.46 | 0.50 | 1.04 | -1.18 | 0.91 | -2.65 | -9.50 | 8.75 | 1.02 | -0.59 | 0.60 | -3.96 | 4.73 | -5.80 | 1.14 | -3.00 | 5.98 | 1.73 | 0.32 | -4.01 | |
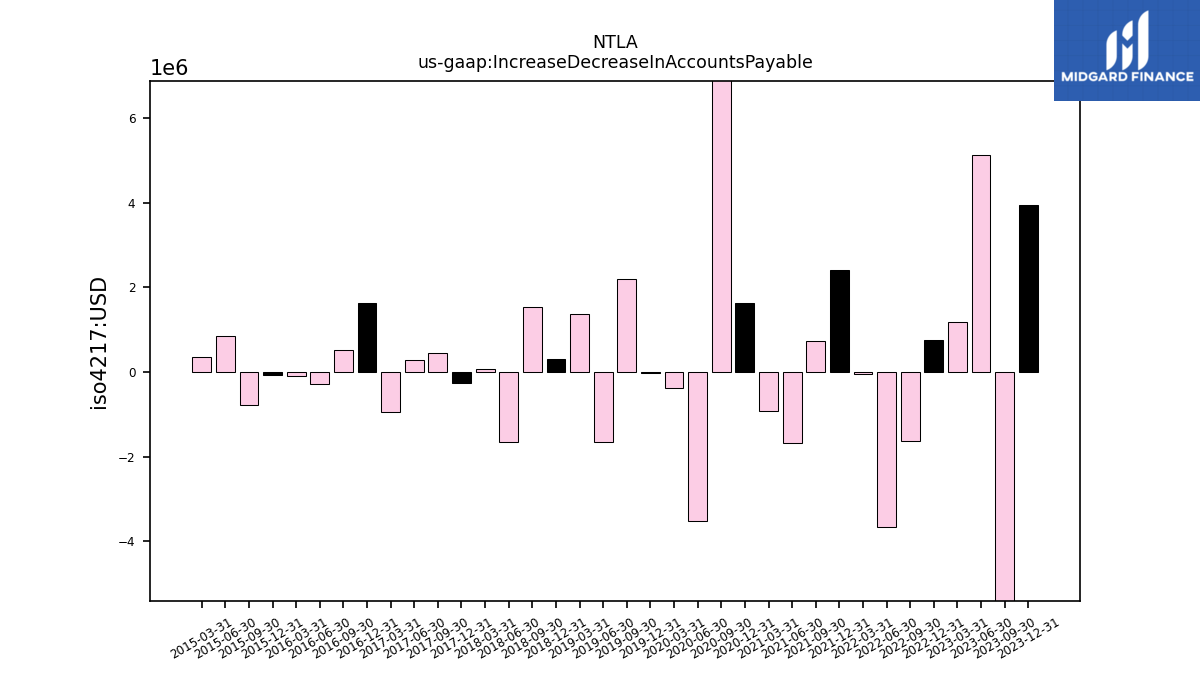
| Increase Decrease In Accounts Payable | 3.94 | -7.71 | 5.12 | 1.17 | 0.75 | -1.62 | -3.65 | -0.06 | 2.40 | 0.74 | -1.69 | -0.92 | 1.61 | 7.34 | -3.53 | -0.37 | -0.03 | 2.20 | -1.65 | 1.36 | 0.30 | 1.53 | -1.66 | 0.06 | -0.26 | 0.44 | 0.28 | -0.95 | |
| Share Based Compensation | 35.04 | 35.35 | 36.40 | 27.25 | 24.63 | 25.21 | 23.07 | 18.49 | 14.56 | 15.41 | 10.61 | 6.42 | 5.58 | 5.40 | 4.76 | 4.16 | 3.02 | 3.08 | 4.40 | 4.59 | 3.58 | 4.46 | 4.90 | 4.11 | 6.60 | 3.25 | 2.85 | 2.63 |
| 2023-12-31 | 2023-09-30 | 2023-06-30 | 2023-03-31 | 2022-12-31 | 2022-09-30 | 2022-06-30 | 2022-03-31 | 2021-12-31 | 2021-09-30 | 2021-06-30 | 2021-03-31 | 2020-12-31 | 2020-09-30 | 2020-06-30 | 2020-03-31 | 2019-12-31 | 2019-09-30 | 2019-06-30 | 2019-03-31 | 2018-12-31 | 2018-09-30 | 2018-06-30 | 2018-03-31 | 2017-12-31 | 2017-09-30 | 2017-06-30 | 2017-03-31 | ||
|---|---|---|---|---|---|---|---|---|---|---|---|---|---|---|---|---|---|---|---|---|---|---|---|---|---|---|---|---|---|
| Net Cash Provided By Used In Investing Activities | 45.94 | 79.50 | -34.54 | -122.25 | -30.15 | 47.64 | 95.34 | 47.47 | -159.12 | -399.38 | 33.26 | -25.54 | -210.92 | -153.98 | 92.96 | 57.45 | 27.88 | -31.65 | 23.25 | 5.70 | -256.02 | -2.02 | -0.90 | -1.85 | -2.40 | -2.26 | NA | NA | |
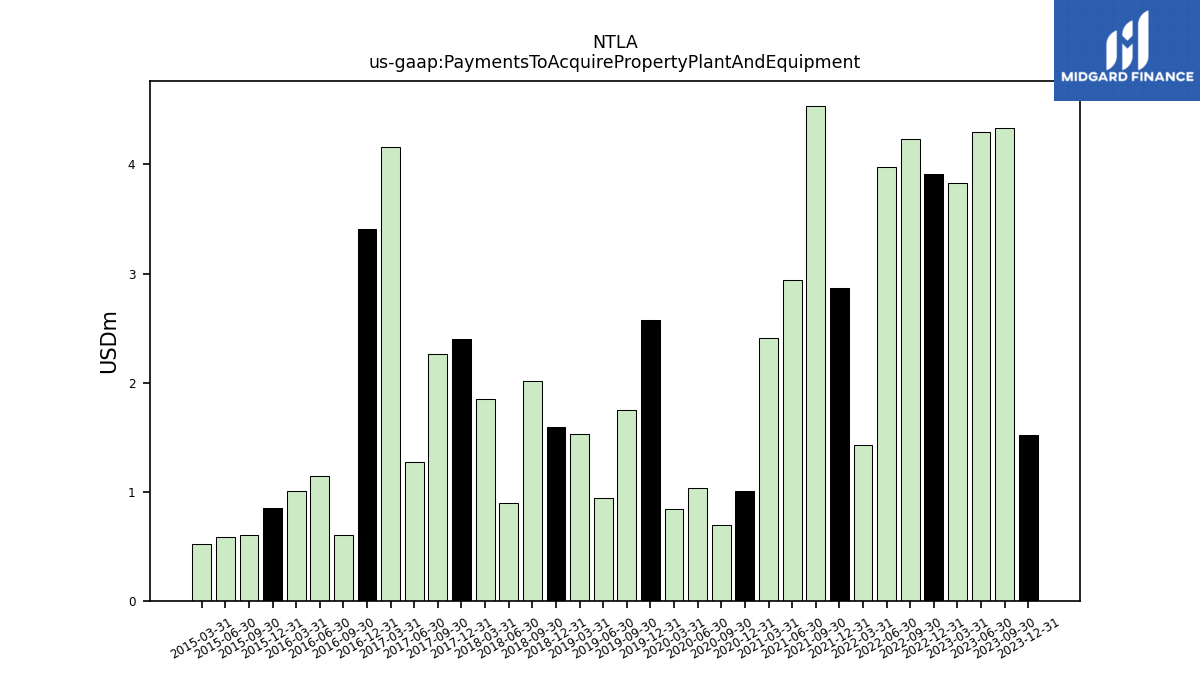
| Payments To Acquire Property Plant And Equipment | 1.52 | 4.33 | 4.30 | 3.83 | 3.91 | 4.24 | 3.98 | 1.43 | 2.87 | 4.54 | 2.94 | 2.41 | 1.01 | 0.70 | 1.04 | 0.84 | 2.57 | 1.75 | 0.94 | 1.53 | 1.59 | 2.02 | 0.90 | 1.85 | 2.40 | 2.26 | 1.27 | 4.16 |
| 2023-12-31 | 2023-09-30 | 2023-06-30 | 2023-03-31 | 2022-12-31 | 2022-09-30 | 2022-06-30 | 2022-03-31 | 2021-12-31 | 2021-09-30 | 2021-06-30 | 2021-03-31 | 2020-12-31 | 2020-09-30 | 2020-06-30 | 2020-03-31 | 2019-12-31 | 2019-09-30 | 2019-06-30 | 2019-03-31 | 2018-12-31 | 2018-09-30 | 2018-06-30 | 2018-03-31 | 2017-12-31 | 2017-09-30 | 2017-06-30 | 2017-03-31 | ||
|---|---|---|---|---|---|---|---|---|---|---|---|---|---|---|---|---|---|---|---|---|---|---|---|---|---|---|---|---|---|
| Net Cash Provided By Used In Financing Activities | 106.48 | 19.10 | 2.52 | 2.22 | 505.76 | 23.98 | 5.89 | 47.32 | 2.28 | 668.68 | 7.13 | 58.59 | 234.09 | 0.60 | 132.22 | 4.86 | 19.56 | 46.40 | 6.47 | 4.00 | 30.16 | 2.18 | 1.16 | 6.72 | 142.12 | 0.37 | NA | NA |
| 2023-12-31 | 2023-09-30 | 2023-06-30 | 2023-03-31 | 2022-12-31 | 2022-09-30 | 2022-06-30 | 2022-03-31 | 2021-12-31 | 2021-09-30 | 2021-06-30 | 2021-03-31 | 2020-12-31 | 2020-09-30 | 2020-06-30 | 2020-03-31 | 2019-12-31 | 2019-09-30 | 2019-06-30 | 2019-03-31 | 2018-12-31 | 2018-09-30 | 2018-06-30 | 2018-03-31 | 2017-12-31 | 2017-09-30 | 2017-06-30 | 2017-03-31 | ||
|---|---|---|---|---|---|---|---|---|---|---|---|---|---|---|---|---|---|---|---|---|---|---|---|---|---|---|---|---|---|
| Revenues | -1.92 | 11.99 | 13.59 | 12.61 | 13.57 | 13.27 | 14.03 | 11.25 | 12.85 | 7.20 | 6.55 | 6.45 | 6.59 | 22.22 | 16.26 | 12.92 | 10.94 | 10.62 | 11.12 | 10.43 | 7.88 | 7.41 | 7.68 | 7.47 | 6.67 | 7.32 | 5.92 | 6.21 | |
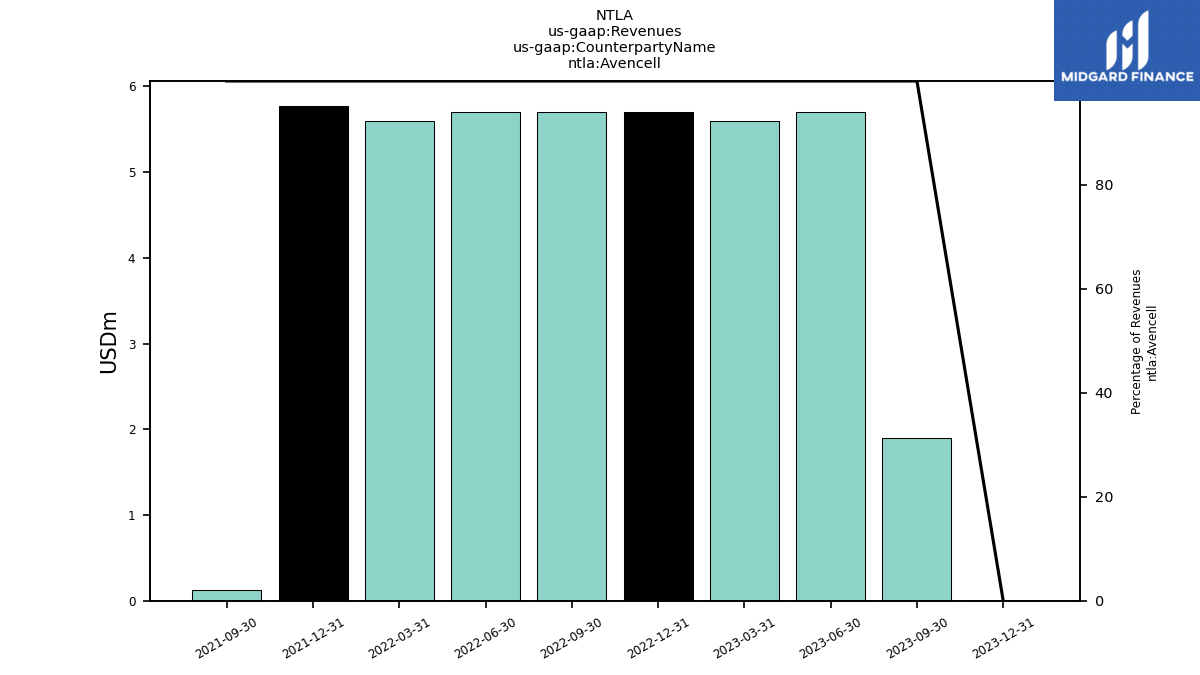
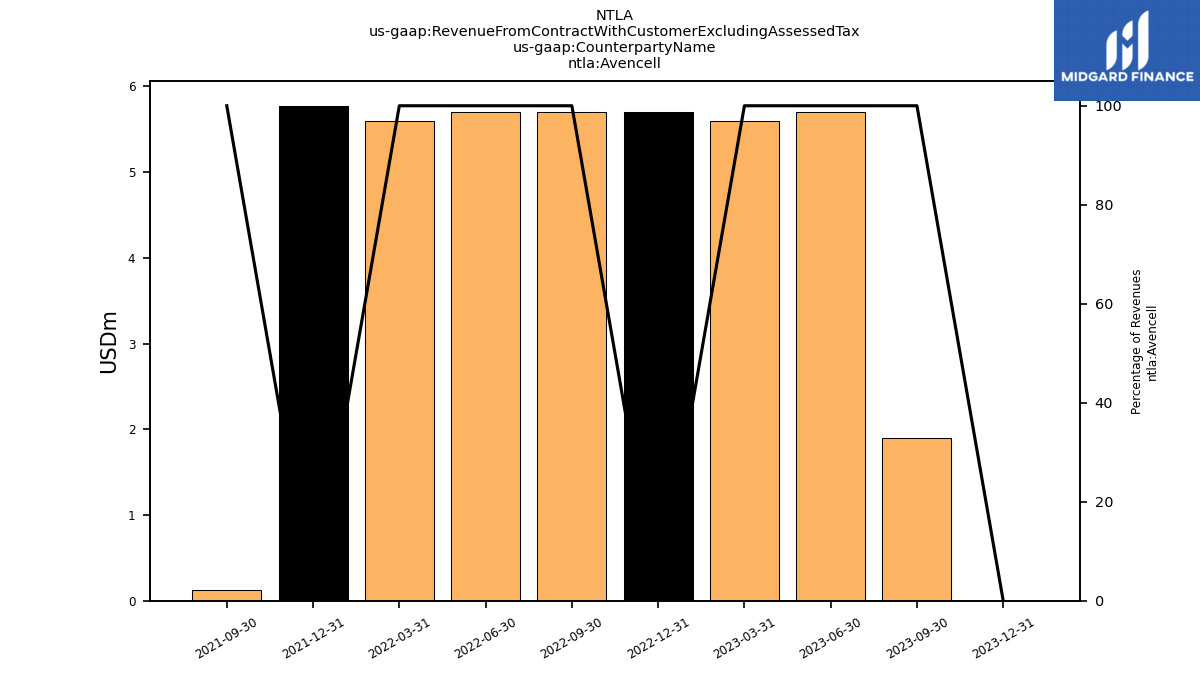
| Avencell | 0.00 | 1.90 | 5.70 | 5.60 | 5.70 | 5.70 | 5.70 | 5.60 | 5.78 | 0.12 | NA | NA | NA | NA | NA | NA | NA | NA | NA | NA | NA | NA | NA | NA | NA | NA | NA | NA | |
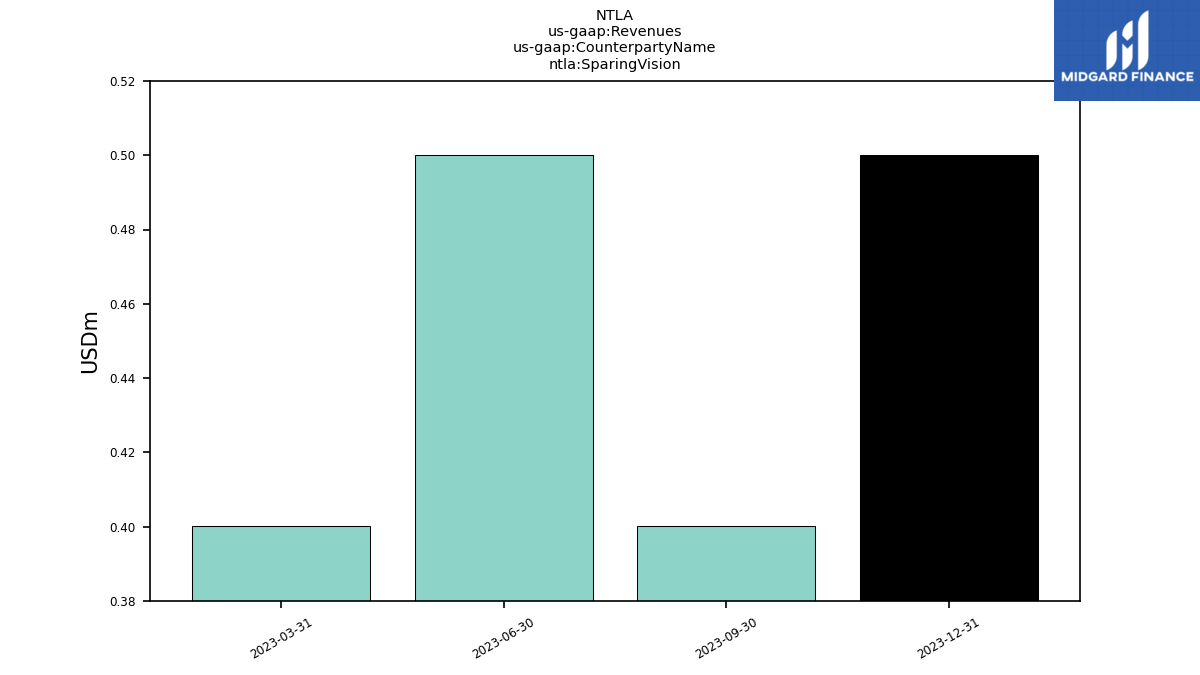
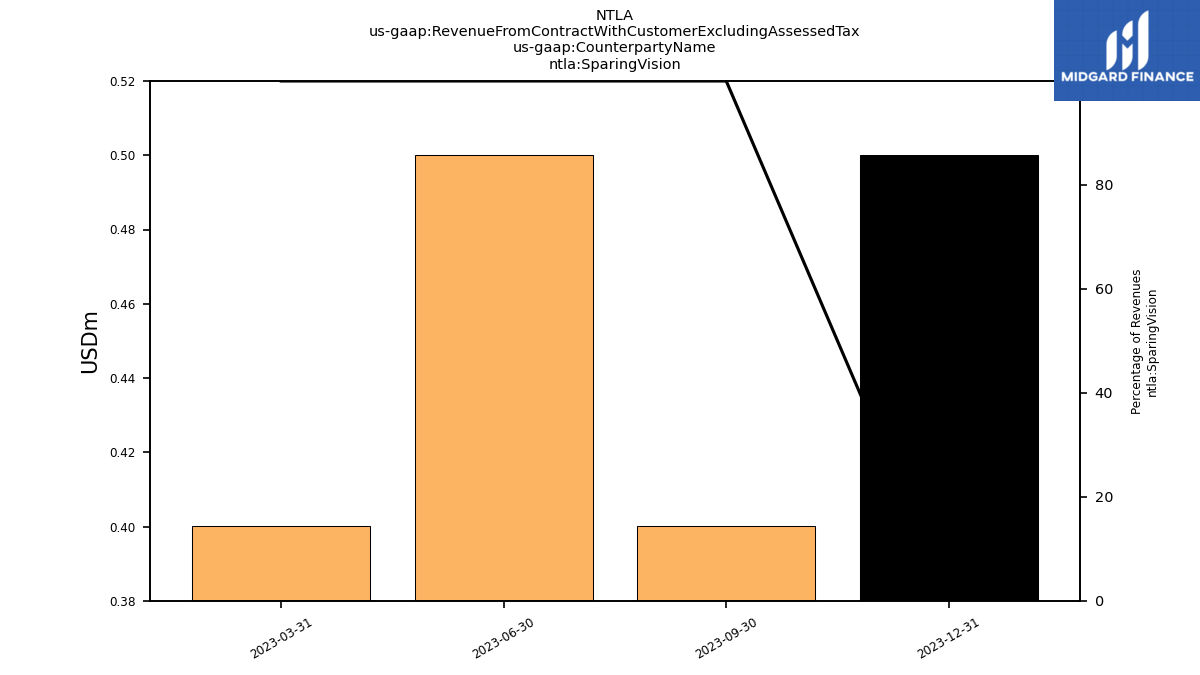
| Sparing Vision | 0.50 | 0.40 | 0.50 | 0.40 | NA | NA | NA | NA | NA | NA | NA | NA | NA | NA | NA | NA | NA | NA | NA | NA | NA | NA | NA | NA | NA | NA | NA | NA | |
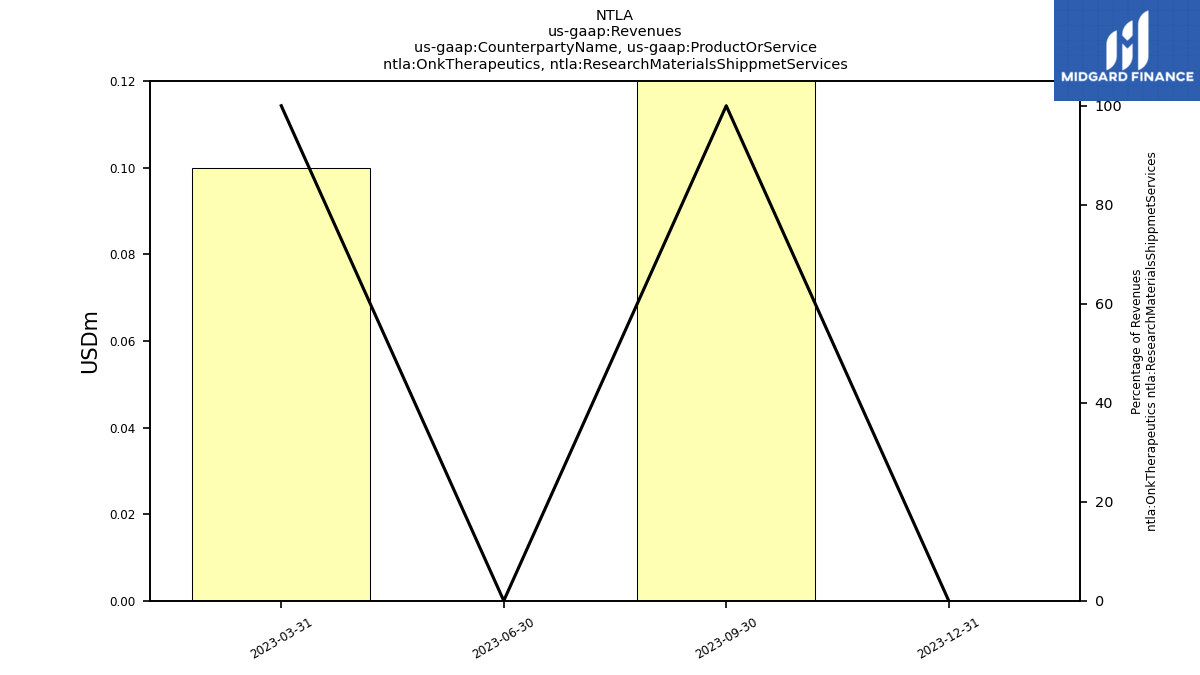
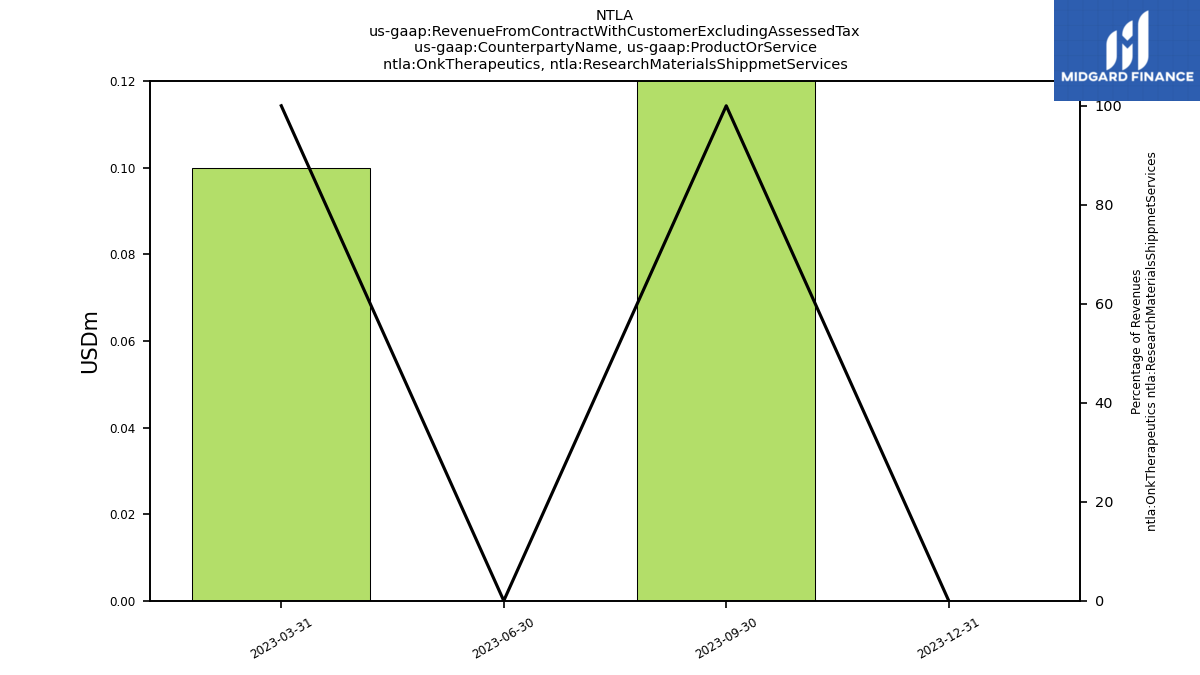
| Onk Therapeutics, Research Materials Shippmet Services | 0.00 | 0.20 | 0.00 | 0.10 | NA | NA | NA | NA | NA | NA | NA | NA | NA | NA | NA | NA | NA | NA | NA | NA | NA | NA | NA | NA | NA | NA | NA | NA | |
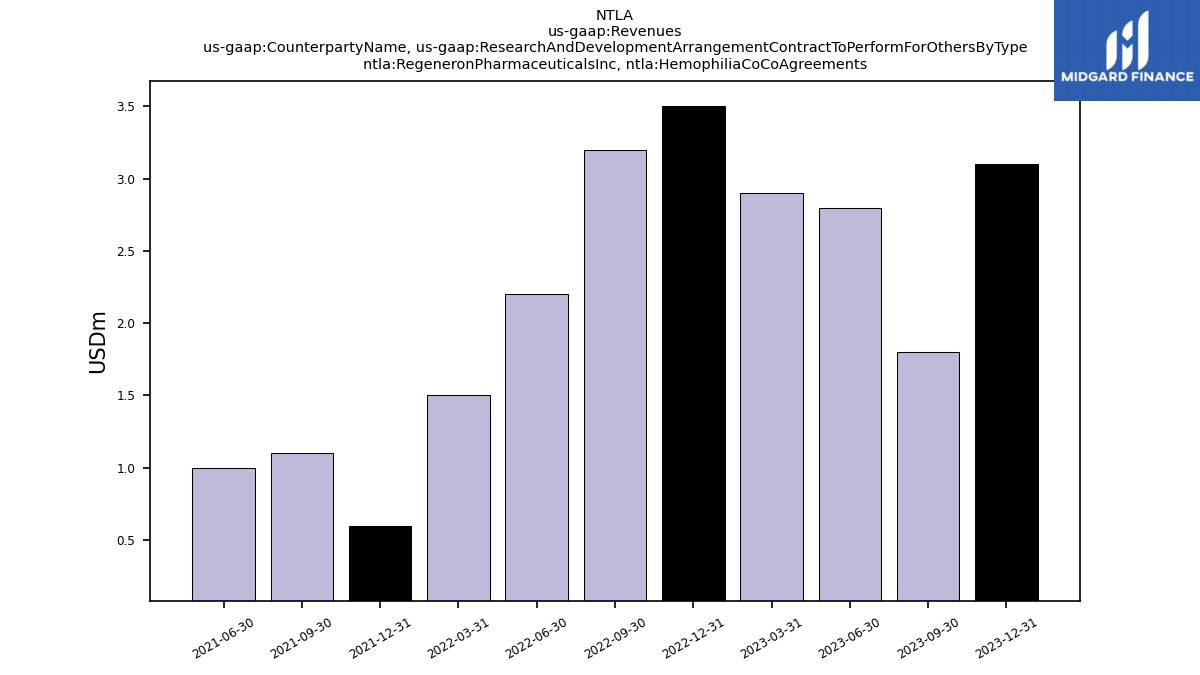
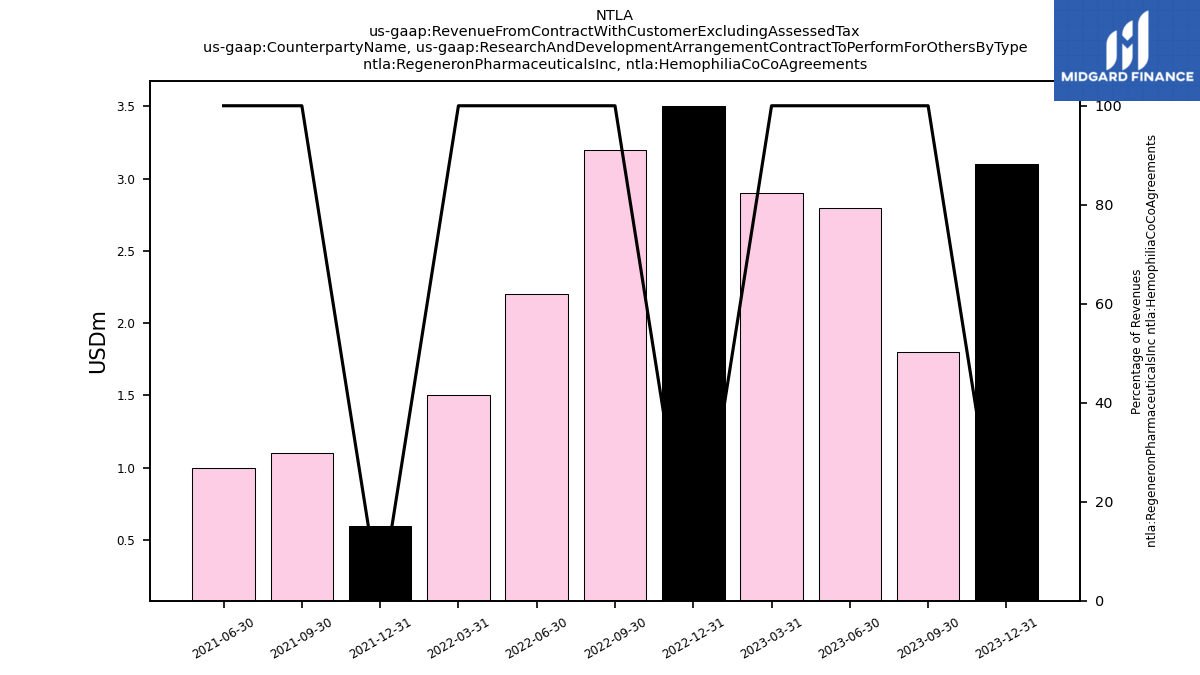
| Regeneron Pharmaceuticals Inc, Hemophilia Co Co Agreements | 3.10 | 1.80 | 2.80 | 2.90 | 3.50 | 3.20 | 2.20 | 1.50 | 0.60 | 1.10 | 1.00 | NA | NA | NA | NA | NA | NA | NA | NA | NA | NA | NA | NA | NA | NA | NA | NA | NA | |
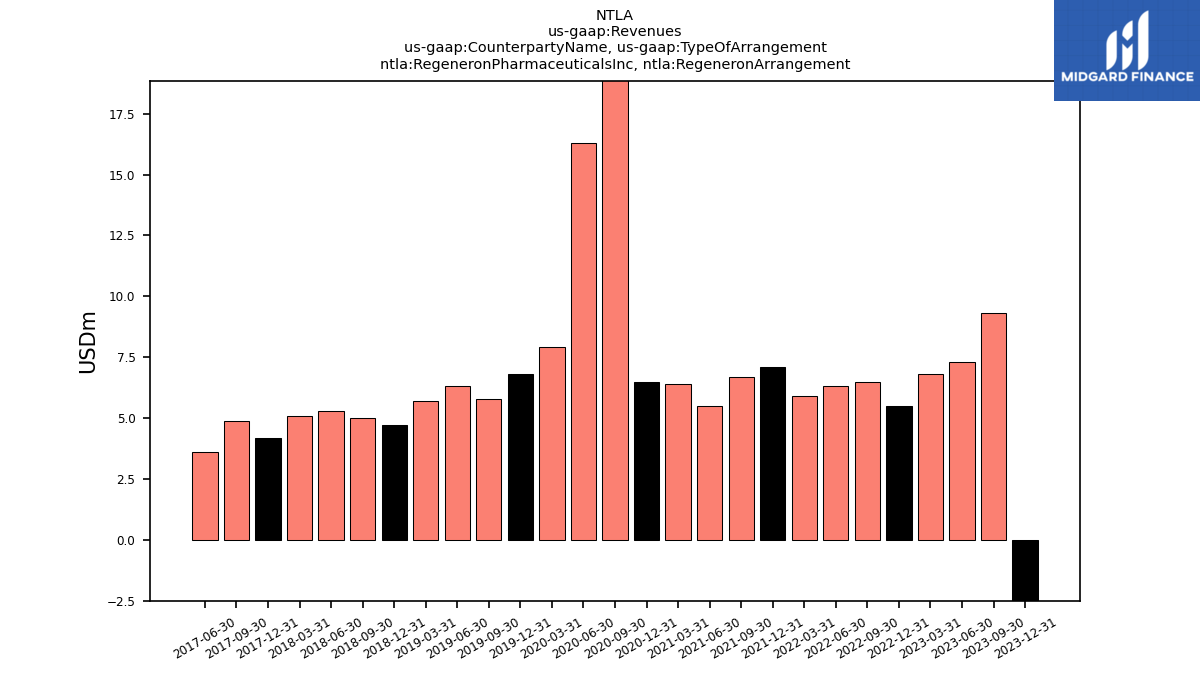
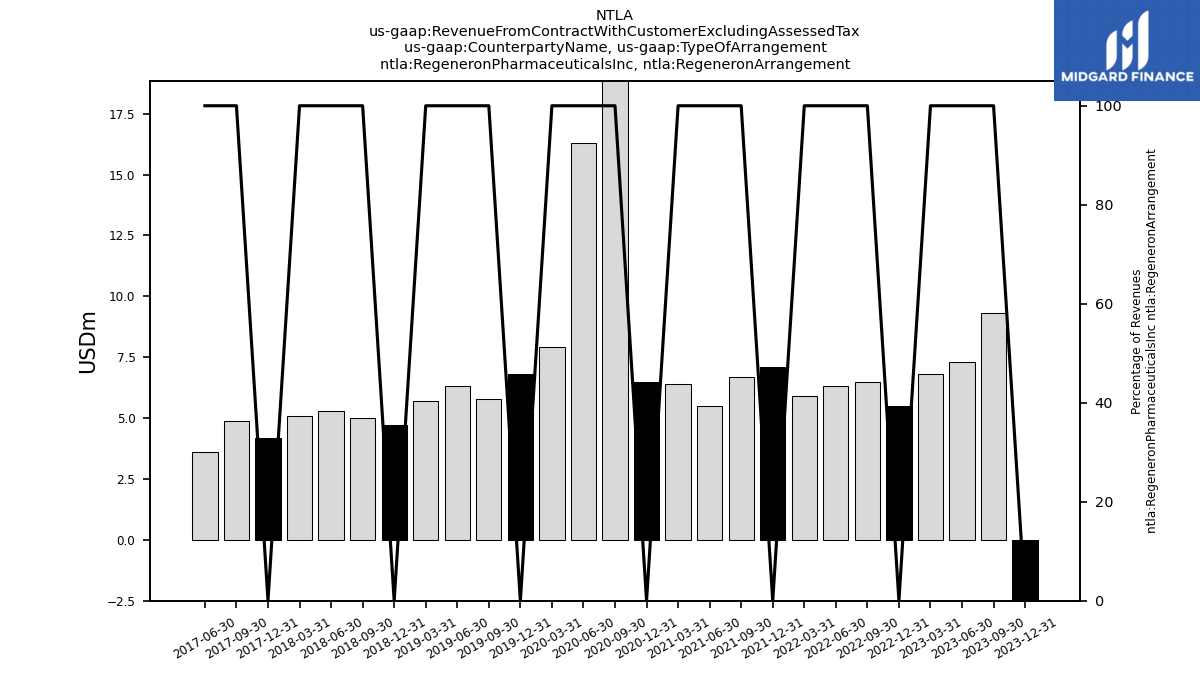
| Regeneron Pharmaceuticals Inc, Regeneron Arrangement | -2.50 | 9.30 | 7.30 | 6.80 | 5.50 | 6.50 | 6.30 | 5.90 | 7.10 | 6.70 | 5.50 | 6.40 | 6.50 | 22.20 | 16.30 | 7.90 | 6.80 | 5.80 | 6.30 | 5.70 | 4.70 | 5.00 | 5.30 | 5.10 | 4.20 | 4.90 | 3.60 | NA | |
| Revenue From Contract With Customer Excluding Assessed Tax | -1.92 | 11.99 | 13.59 | 12.61 | 13.57 | 13.27 | 14.03 | 11.25 | 12.85 | 7.20 | 6.55 | 6.45 | 6.59 | 22.22 | 16.26 | 12.92 | 10.94 | 10.62 | 11.12 | 10.43 | 7.88 | 7.41 | 7.68 | 7.47 | 6.67 | 7.32 | 5.92 | 6.21 | |
| Avencell | 0.00 | 1.90 | 5.70 | 5.60 | 5.70 | 5.70 | 5.70 | 5.60 | 5.78 | 0.12 | NA | NA | NA | NA | NA | NA | NA | NA | NA | NA | NA | NA | NA | NA | NA | NA | NA | NA | |
| Sparing Vision | 0.50 | 0.40 | 0.50 | 0.40 | NA | NA | NA | NA | NA | NA | NA | NA | NA | NA | NA | NA | NA | NA | NA | NA | NA | NA | NA | NA | NA | NA | NA | NA | |
| Onk Therapeutics, Research Materials Shippmet Services | 0.00 | 0.20 | 0.00 | 0.10 | NA | NA | NA | NA | NA | NA | NA | NA | NA | NA | NA | NA | NA | NA | NA | NA | NA | NA | NA | NA | NA | NA | NA | NA | |
| Regeneron Pharmaceuticals Inc, Hemophilia Co Co Agreements | 3.10 | 1.80 | 2.80 | 2.90 | 3.50 | 3.20 | 2.20 | 1.50 | 0.60 | 1.10 | 1.00 | NA | NA | NA | NA | NA | NA | NA | NA | NA | NA | NA | NA | NA | NA | NA | NA | NA | |
| Regeneron Pharmaceuticals Inc, Regeneron Arrangement | -2.50 | 9.30 | 7.30 | 6.80 | 5.50 | 6.50 | 6.30 | 5.90 | 7.10 | 6.70 | 5.50 | 6.40 | 6.50 | 22.20 | 16.30 | 7.90 | 6.80 | 5.80 | 6.30 | 5.70 | 4.70 | 5.00 | 5.30 | 5.10 | 4.20 | 4.90 | 3.60 | NA | |
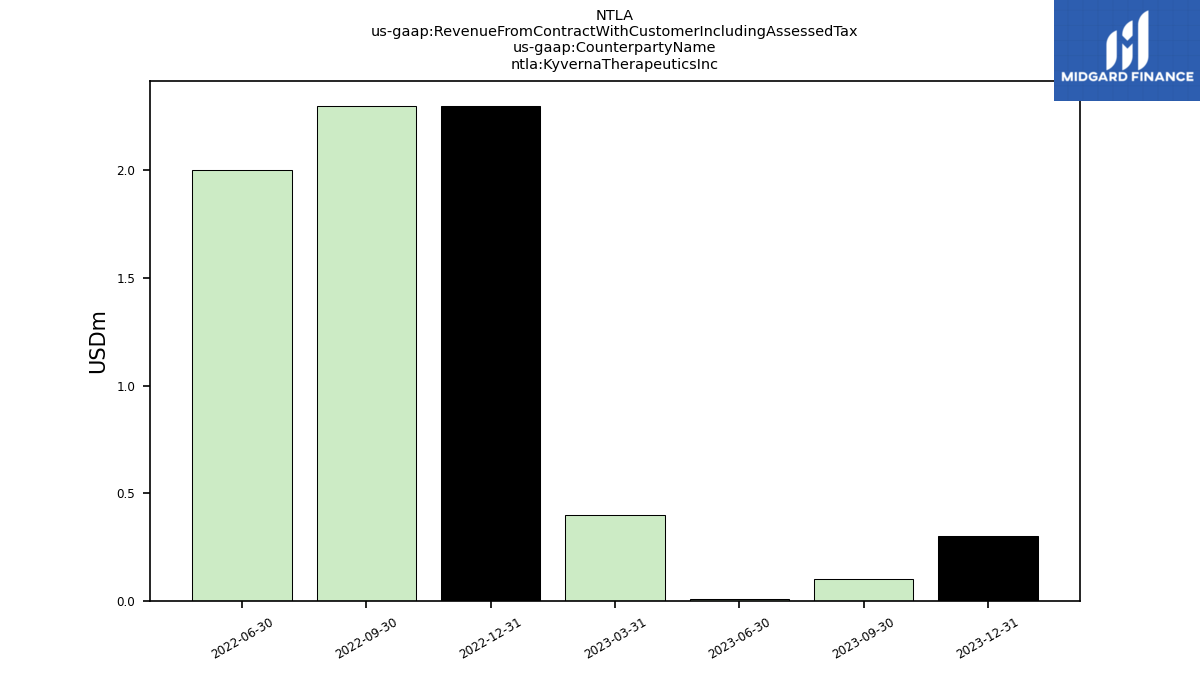
| Revenue From Contract With Customer Including Assessed Tax | 0.00 | 1.00 | 2.80 | 2.80 | 2.90 | 2.90 | 2.80 | 2.80 | -17.30 | 7.20 | 6.55 | 6.45 | 6.59 | 22.22 | 16.26 | 12.92 | 10.94 | 10.62 | 11.12 | 10.43 | 7.88 | 7.41 | 7.68 | 7.47 | 6.67 | 7.32 | 5.92 | 6.21 | |
| Avencell | 0.00 | 1.90 | 5.70 | 5.60 | 5.70 | 5.70 | 5.70 | 5.60 | 5.78 | 0.12 | NA | NA | NA | NA | NA | NA | NA | NA | NA | NA | NA | NA | NA | NA | NA | NA | NA | NA | |
| Kyverna Therapeutics Inc | 0.30 | 0.10 | 0.01 | 0.40 | 2.30 | 2.30 | 2.00 | NA | NA | NA | NA | NA | NA | NA | NA | NA | NA | NA | NA | NA | NA | NA | NA | NA | NA | NA | NA | NA |