
| 2023-09-30 | 2023-06-30 | 2023-03-31 | 2022-12-31 | 2022-09-30 | 2022-06-30 | 2022-03-31 | 2021-12-31 | 2021-09-30 | 2021-06-30 | 2021-03-31 | 2020-12-31 | 2020-09-30 | 2020-06-30 | 2019-12-31 | ||
|---|---|---|---|---|---|---|---|---|---|---|---|---|---|---|---|---|
| Common Stock Value | 0.01 | 0.01 | 0.01 | 0.01 | 0.01 | 0.01 | 0.00 | 0.00 | 0.00 | 0.00 | 0.00 | 0.00 | 0.00 | 0.00 | 0.00 | |
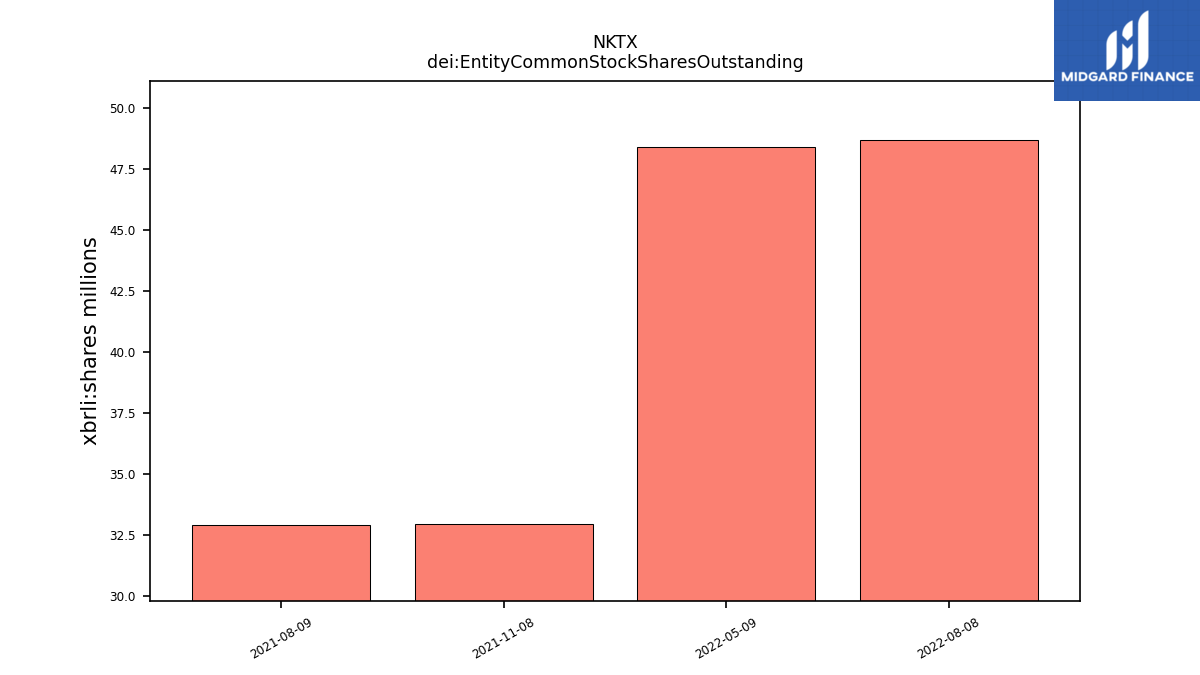
| dei: Entity Common Stock Shares Outstanding | NA | NA | NA | NA | NA | NA | NA | NA | NA | NA | NA | NA | NA | NA | NA | |
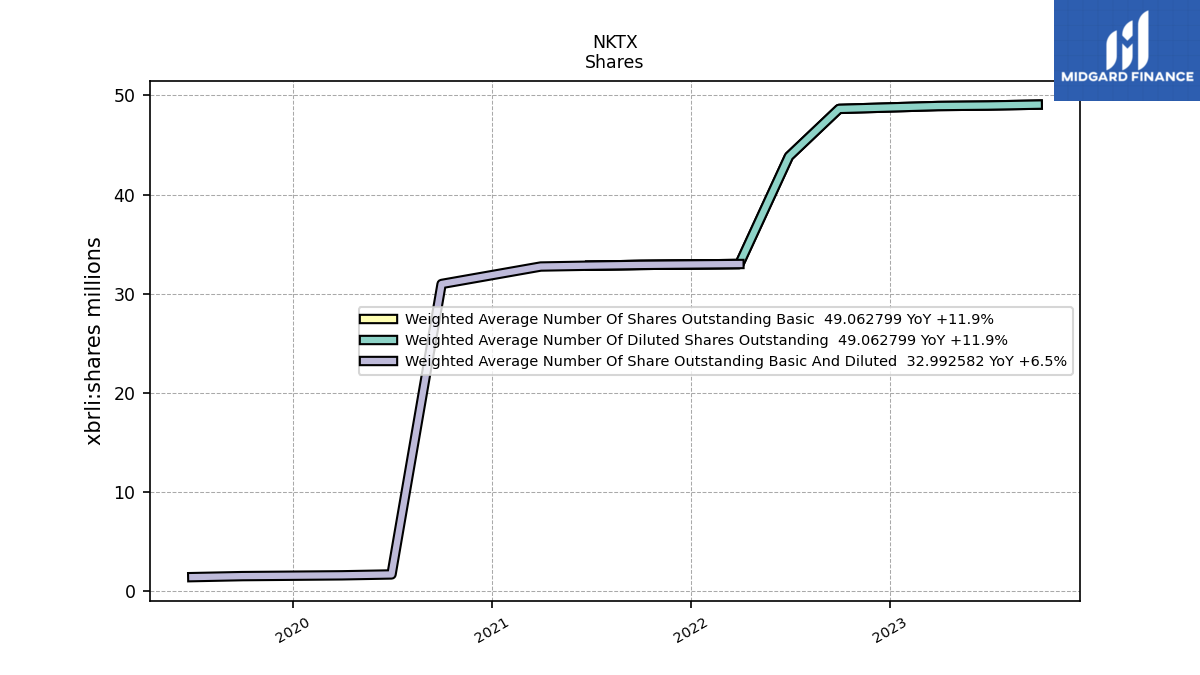
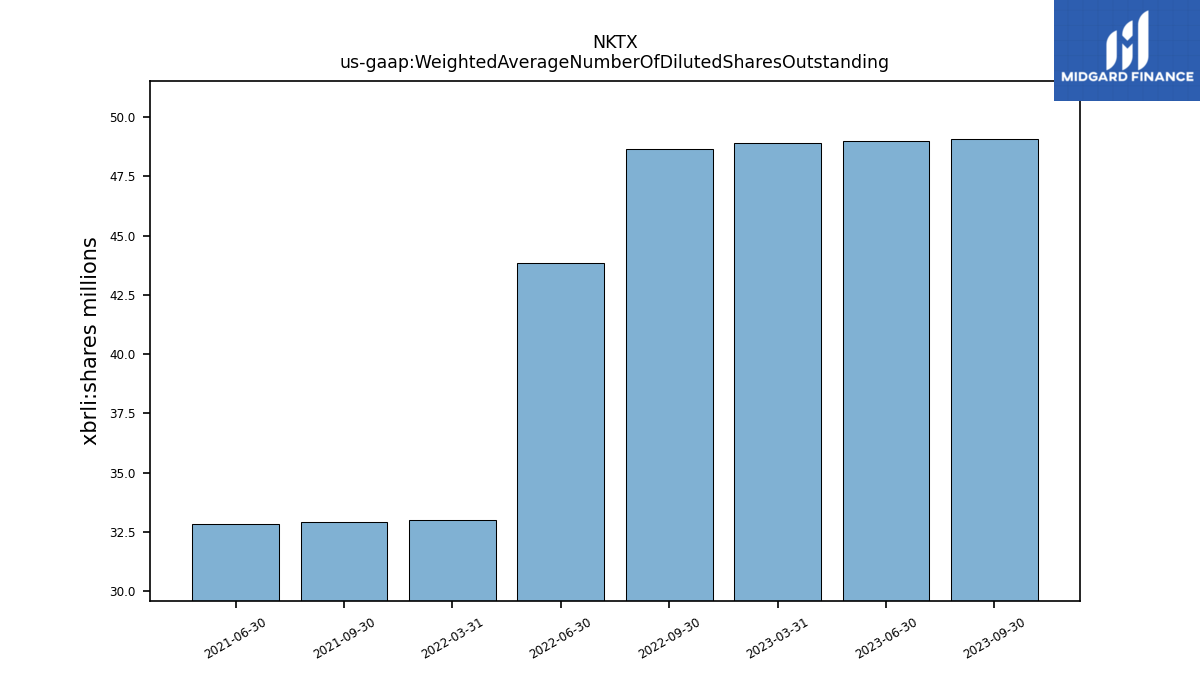
| Weighted Average Number Of Diluted Shares Outstanding | 49.06 | 48.97 | 48.92 | NA | 48.63 | 43.84 | 32.99 | NA | 32.90 | 32.83 | NA | NA | NA | NA | NA | |
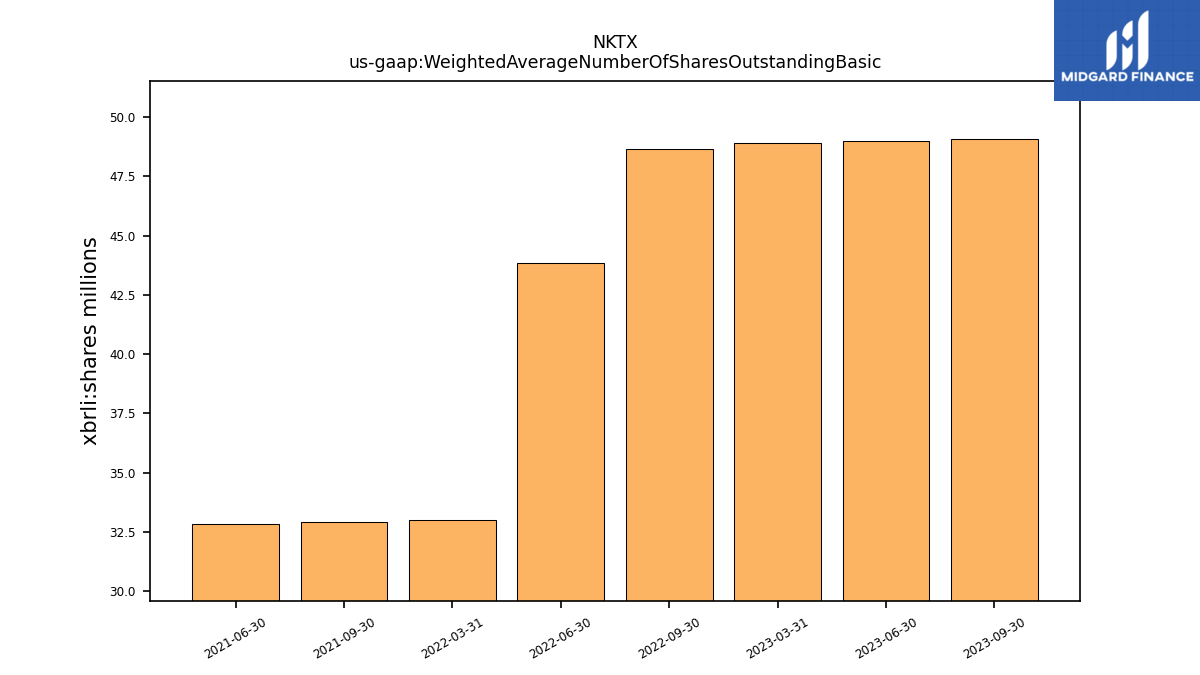
| Weighted Average Number Of Shares Outstanding Basic | 49.06 | 48.97 | 48.92 | NA | 48.63 | 43.84 | 32.99 | NA | 32.90 | 32.83 | NA | NA | NA | NA | NA | |
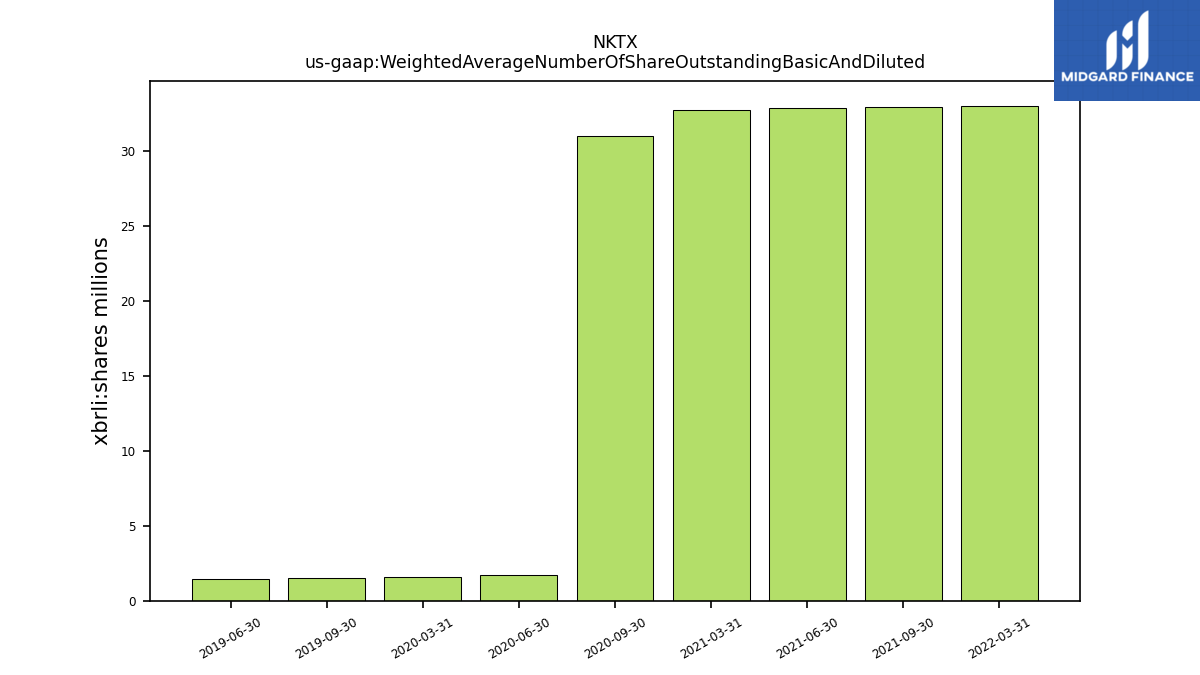
| Weighted Average Number Of Share Outstanding Basic And Diluted | NA | NA | NA | NA | NA | NA | 32.99 | NA | 32.90 | 32.83 | 32.74 | NA | 30.98 | 1.70 | NA | |
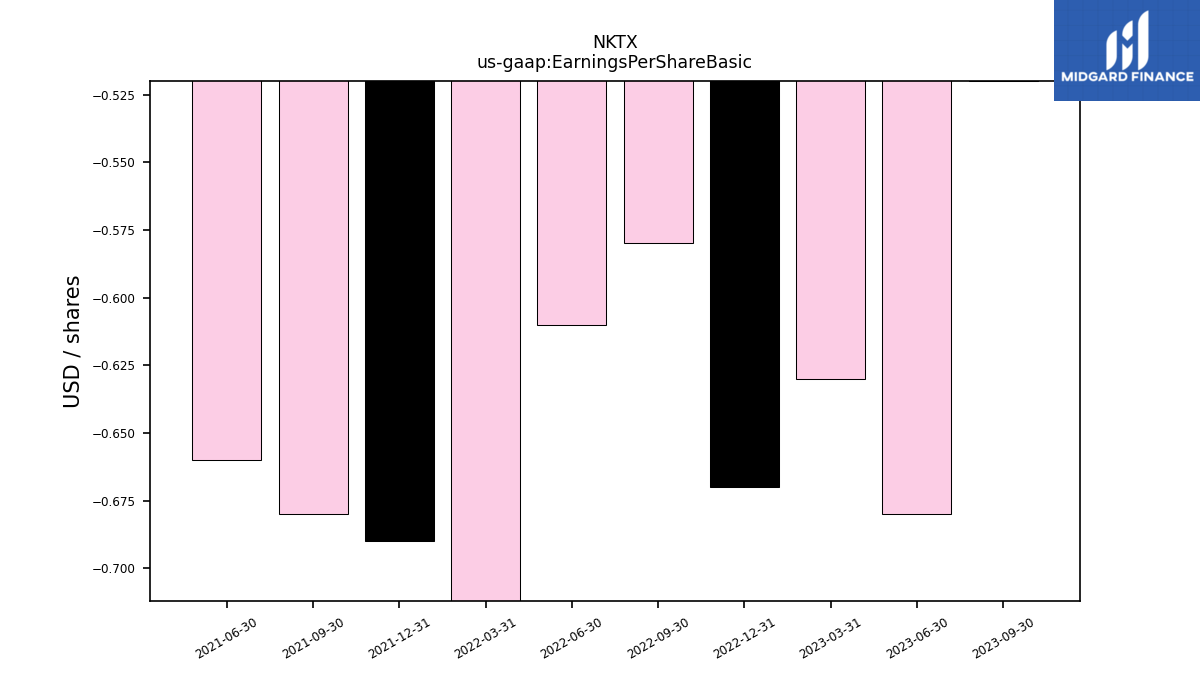
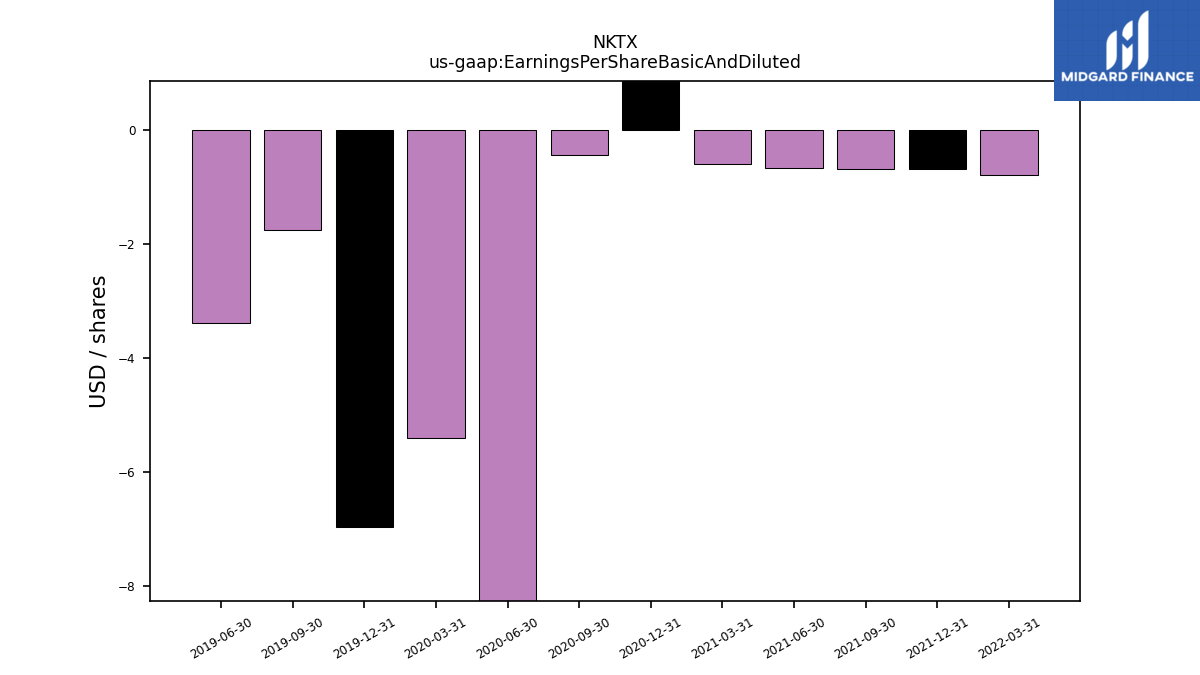
| Earnings Per Share Basic | -0.52 | -0.68 | -0.63 | -0.67 | -0.58 | -0.61 | -0.79 | -0.69 | -0.68 | -0.66 | NA | NA | NA | NA | NA | |
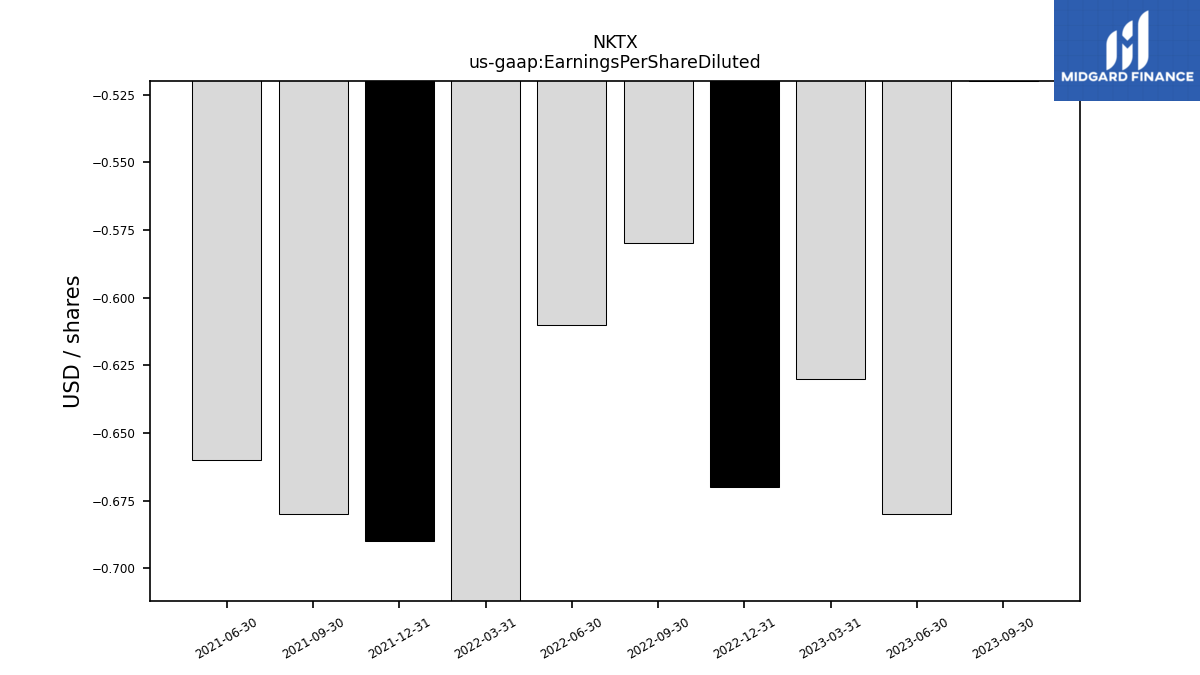
| Earnings Per Share Diluted | -0.52 | -0.68 | -0.63 | -0.67 | -0.58 | -0.61 | -0.79 | -0.69 | -0.68 | -0.66 | NA | NA | NA | NA | NA | |
| Earnings Per Share Basic And Diluted | NA | NA | NA | NA | NA | NA | -0.79 | -0.69 | -0.68 | -0.66 | -0.59 | 0.95 | -0.44 | -30.06 | -6.96 |
| 2023-09-30 | 2023-06-30 | 2023-03-31 | 2022-12-31 | 2022-09-30 | 2022-06-30 | 2022-03-31 | 2021-12-31 | 2021-09-30 | 2021-06-30 | 2021-03-31 | 2020-12-31 | 2020-09-30 | 2020-06-30 | 2019-12-31 | ||
|---|---|---|---|---|---|---|---|---|---|---|---|---|---|---|---|---|
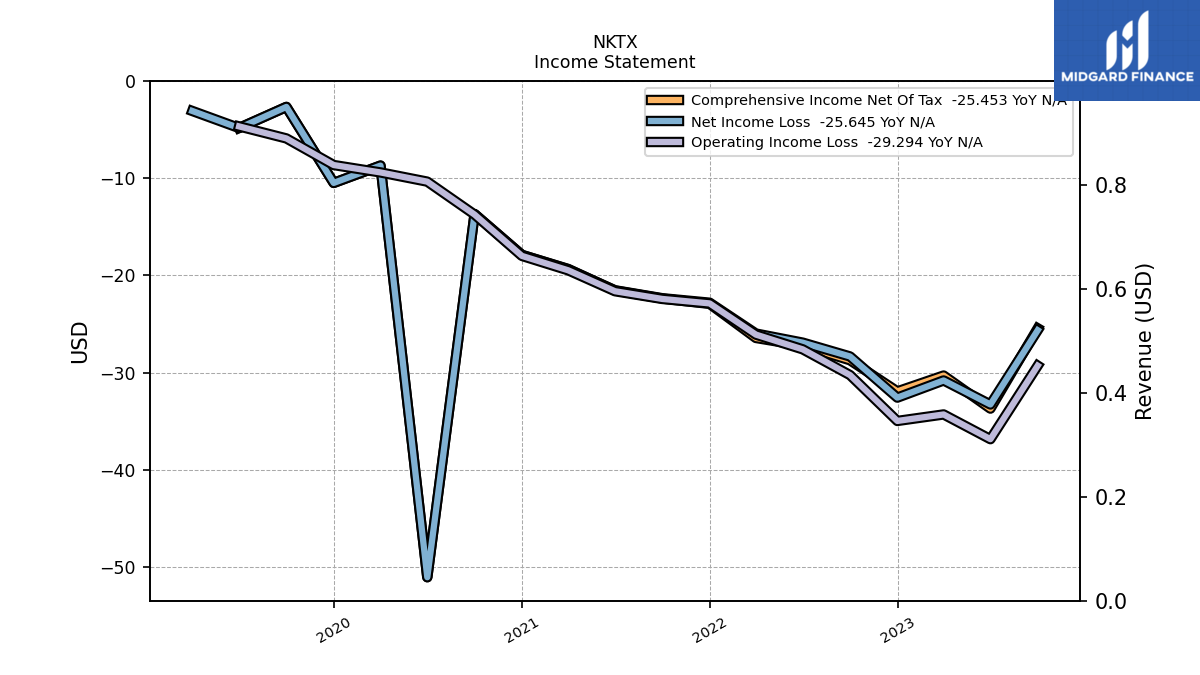
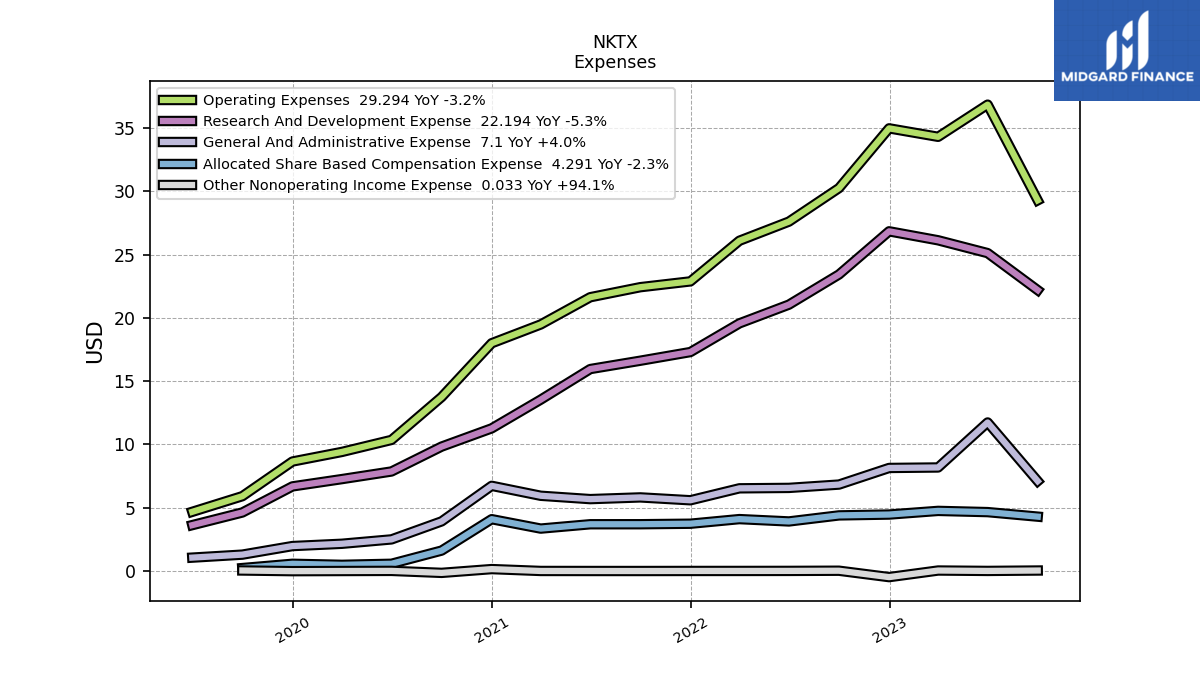
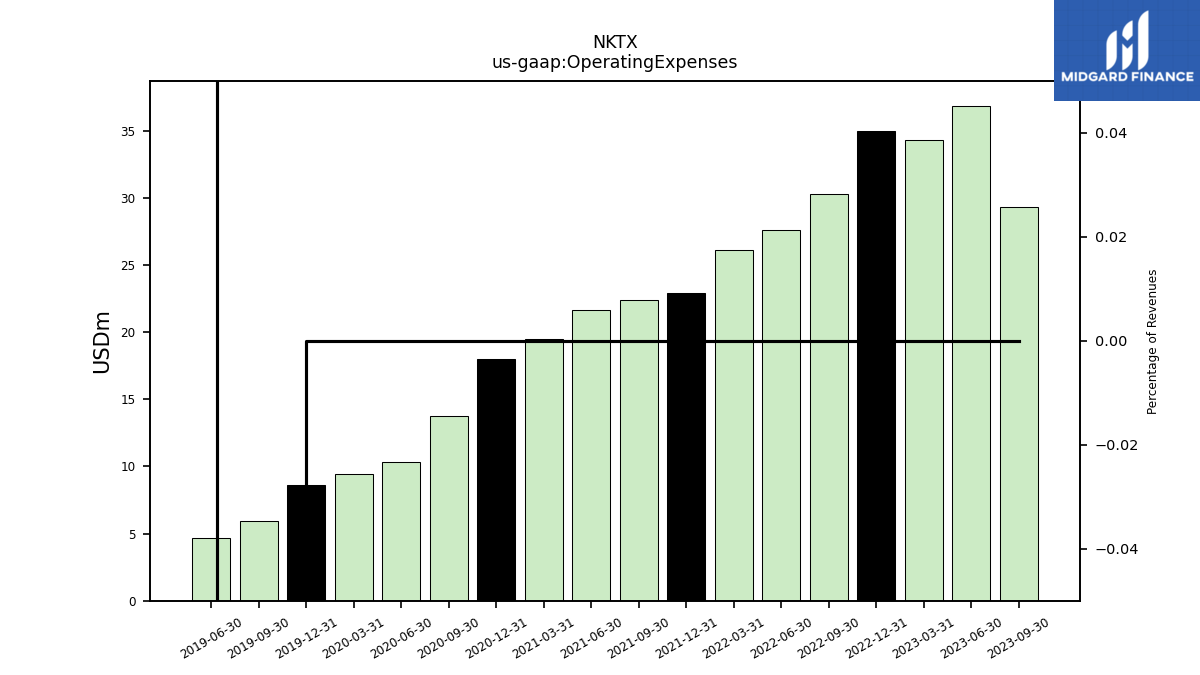
| Operating Expenses | 29.29 | 36.86 | 34.31 | 34.98 | 30.26 | 27.61 | 26.10 | 22.89 | 22.43 | 21.63 | 19.48 | 18.00 | 13.75 | 10.36 | 8.65 | |
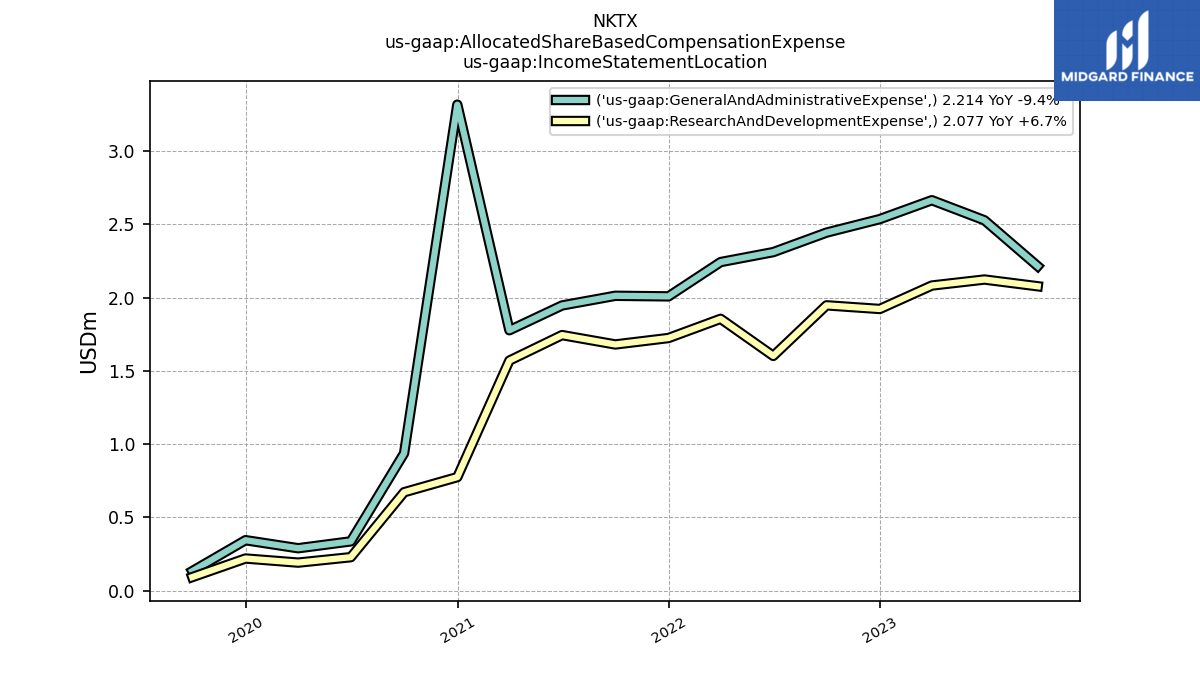
| Research And Development Expense | 22.19 | 25.12 | 26.14 | 26.84 | 23.43 | 21.05 | 19.57 | 17.30 | 16.62 | 15.96 | 13.54 | 11.27 | 9.83 | 7.86 | 6.68 | |
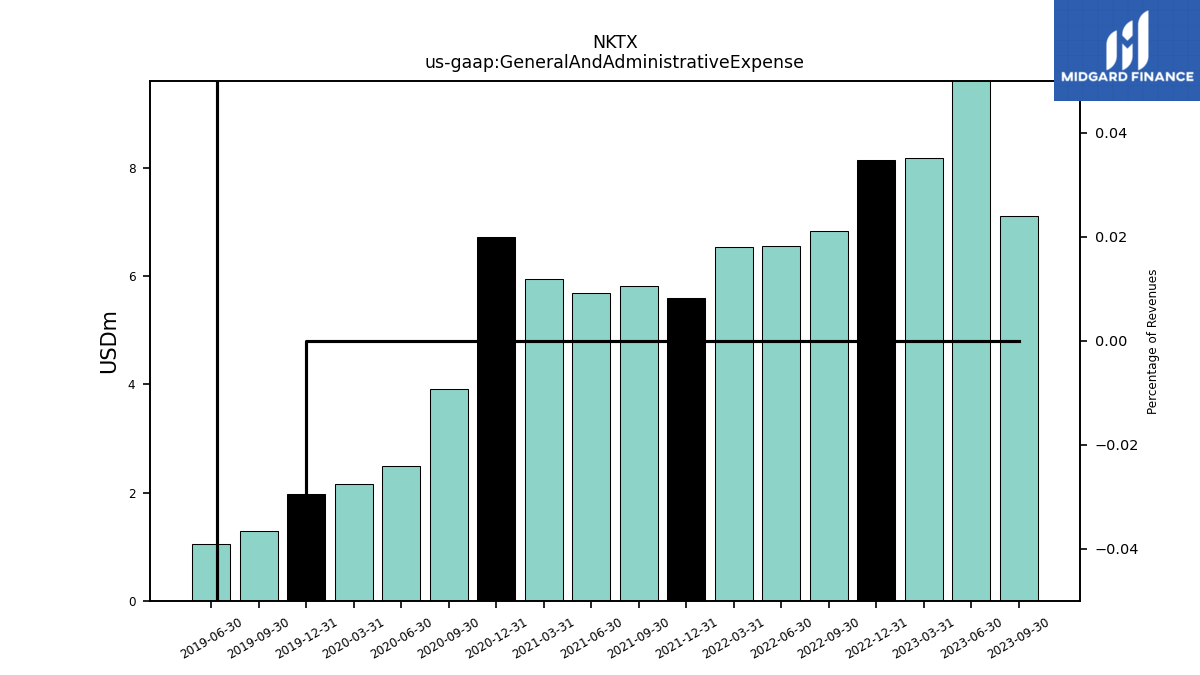
| General And Administrative Expense | 7.10 | 11.74 | 8.18 | 8.14 | 6.83 | 6.56 | 6.53 | 5.59 | 5.81 | 5.68 | 5.94 | 6.73 | 3.92 | 2.49 | 1.97 | |
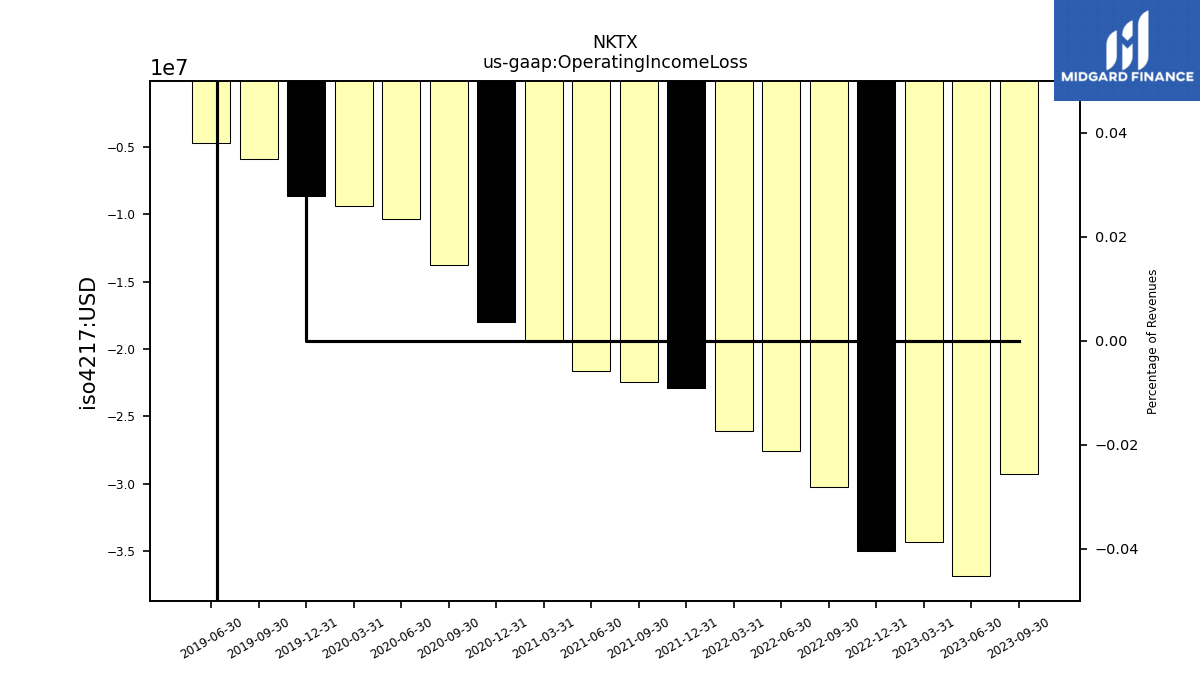
| Operating Income Loss | -29.29 | -36.86 | -34.31 | -34.98 | -30.26 | -27.61 | -26.10 | -22.89 | -22.43 | -21.63 | -19.48 | -18.00 | -13.75 | -10.36 | -8.65 | |
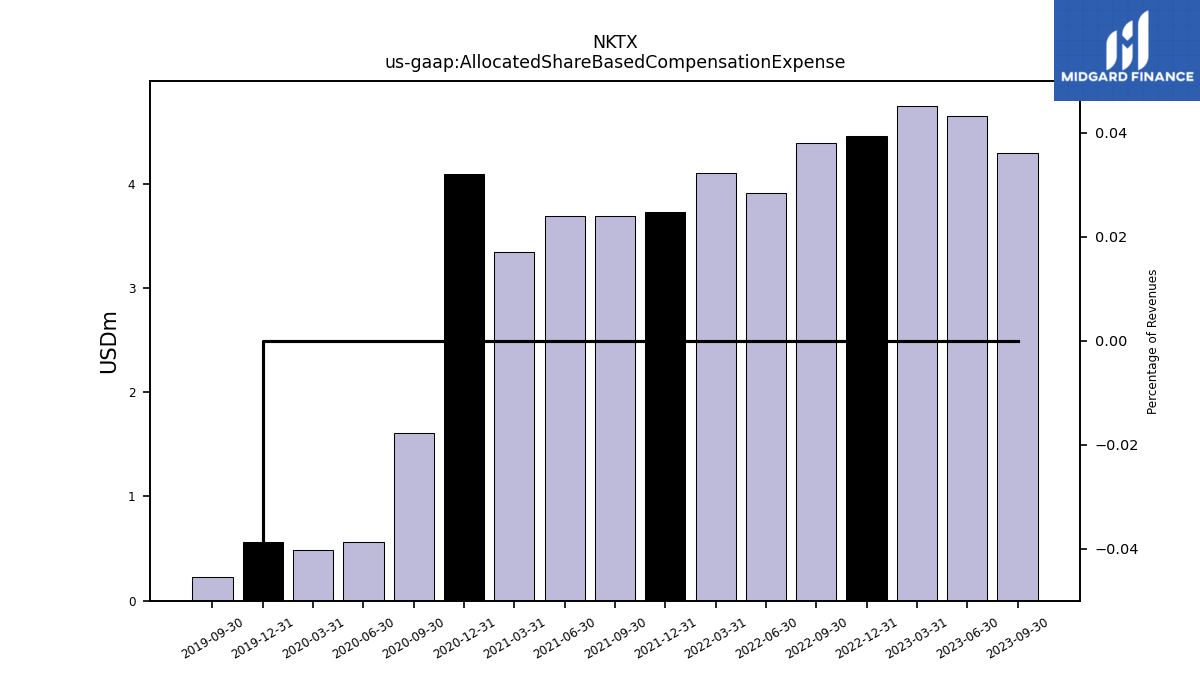
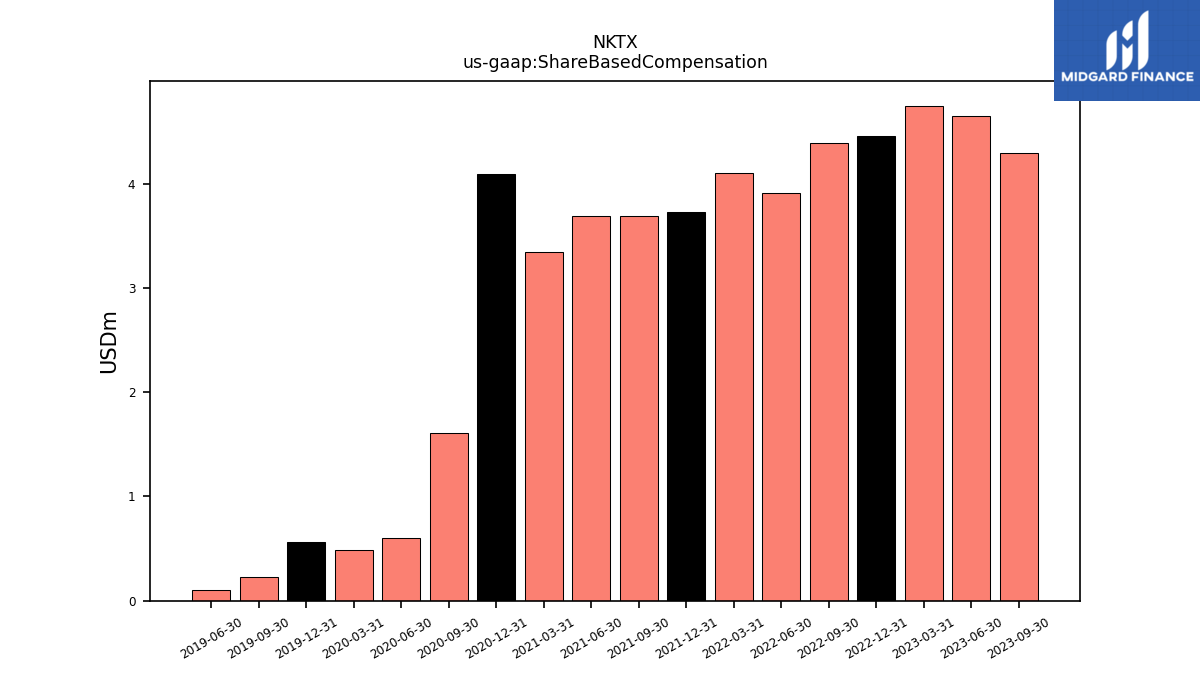
| Allocated Share Based Compensation Expense | 4.29 | 4.65 | 4.75 | 4.46 | 4.39 | 3.91 | 4.10 | 3.73 | 3.69 | 3.69 | 3.35 | 4.09 | 1.61 | 0.57 | 0.56 | |
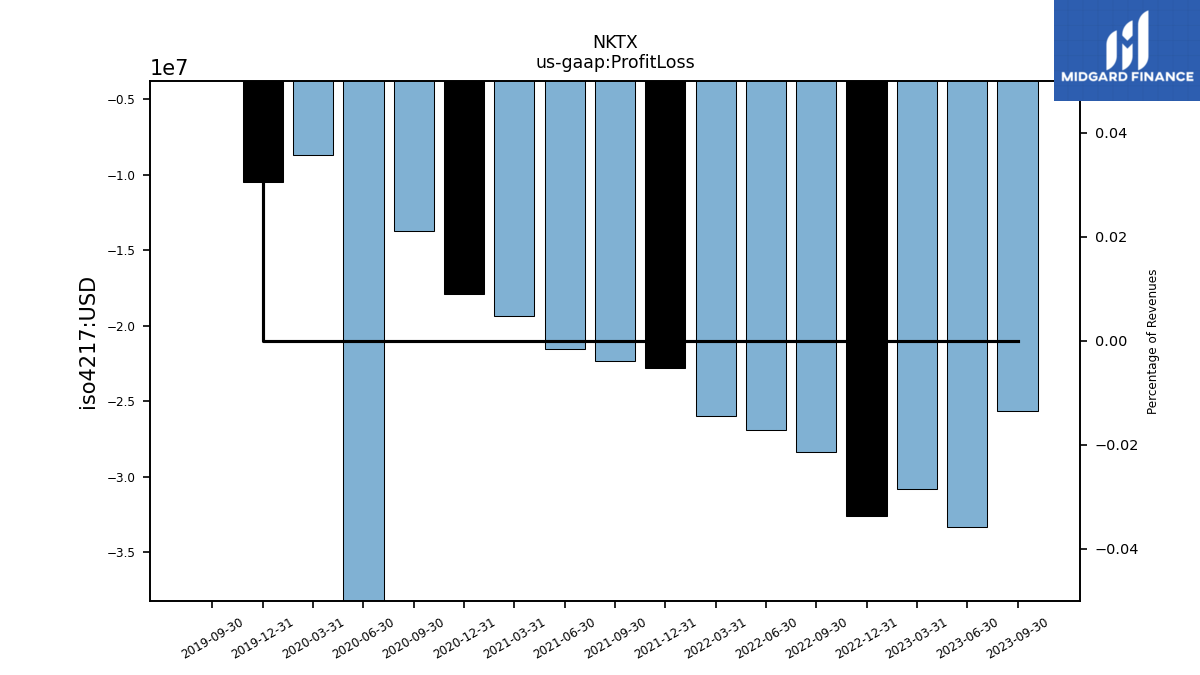
| Profit Loss | -25.64 | -33.29 | -30.82 | -32.58 | -28.34 | -26.92 | -25.99 | -22.81 | -22.35 | -21.54 | -19.37 | -17.90 | -13.69 | -51.07 | -10.49 | |
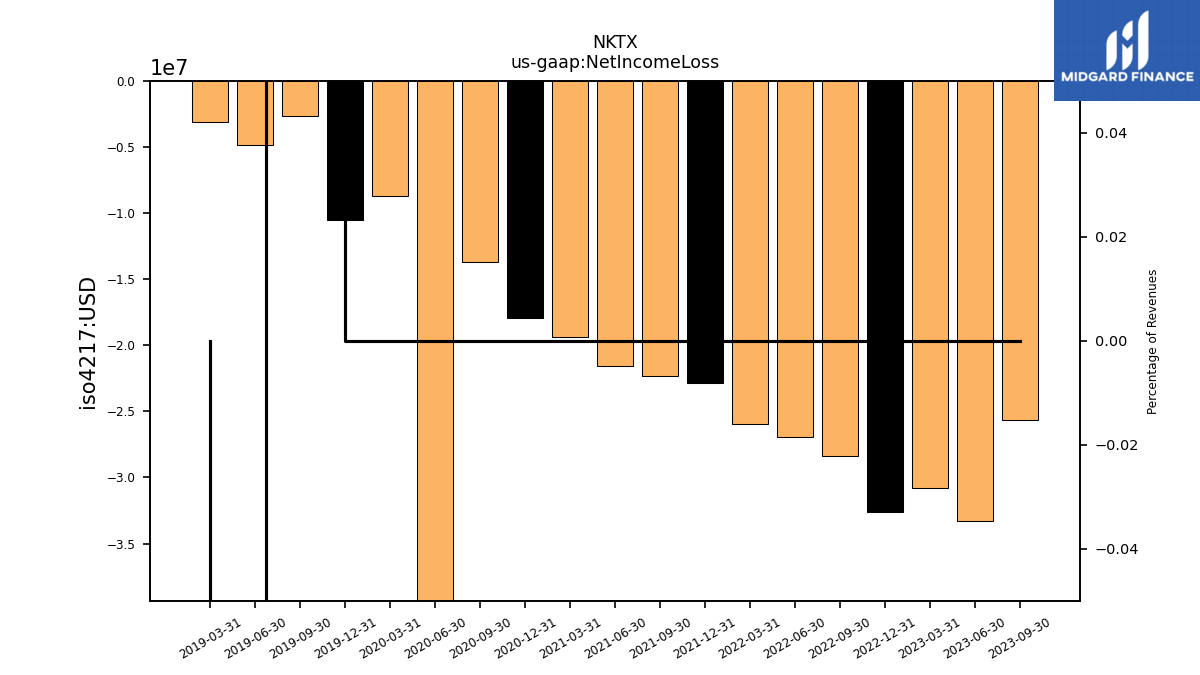
| Net Income Loss | -25.64 | -33.29 | -30.82 | -32.58 | -28.34 | -26.92 | -25.99 | -22.81 | -22.35 | -21.54 | -19.37 | -17.90 | -13.69 | -51.07 | -10.49 | |
| Comprehensive Income Net Of Tax | -25.45 | -33.71 | -30.31 | -31.94 | -28.73 | -27.25 | -26.44 | -22.93 | -22.39 | -21.56 | -19.34 | -17.90 | -13.69 | -51.06 | -10.49 |
| 2023-09-30 | 2023-06-30 | 2023-03-31 | 2022-12-31 | 2022-09-30 | 2022-06-30 | 2022-03-31 | 2021-12-31 | 2021-09-30 | 2021-06-30 | 2021-03-31 | 2020-12-31 | 2020-09-30 | 2020-06-30 | 2019-12-31 | ||
|---|---|---|---|---|---|---|---|---|---|---|---|---|---|---|---|---|
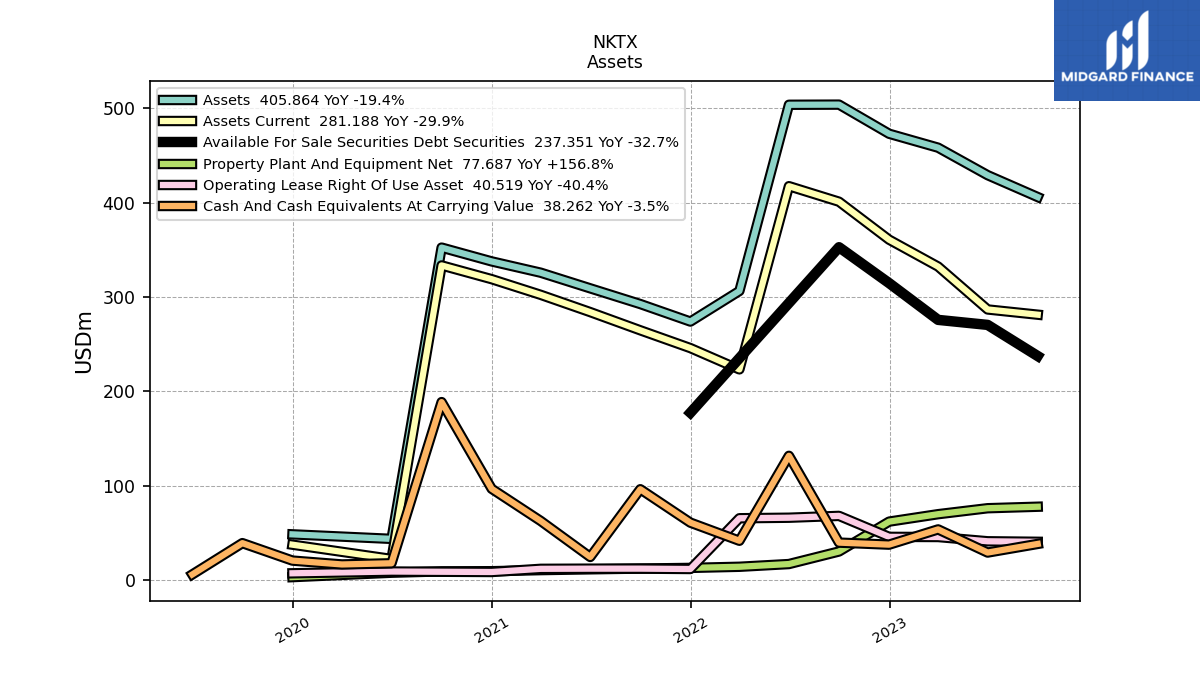
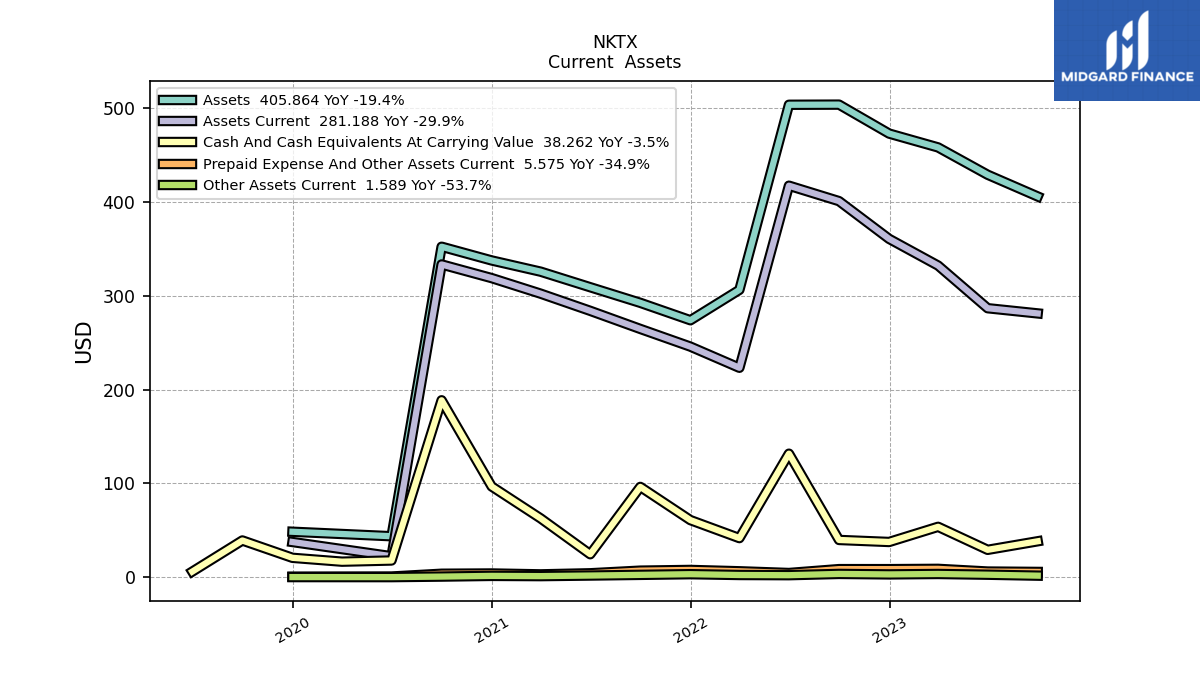
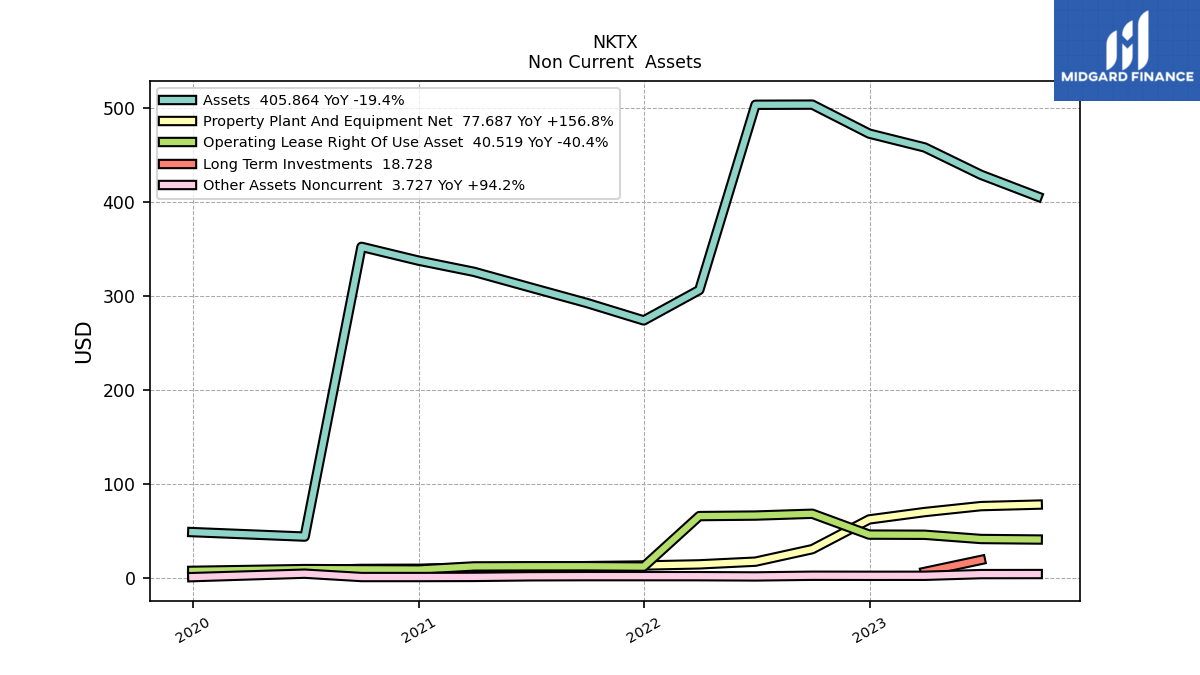
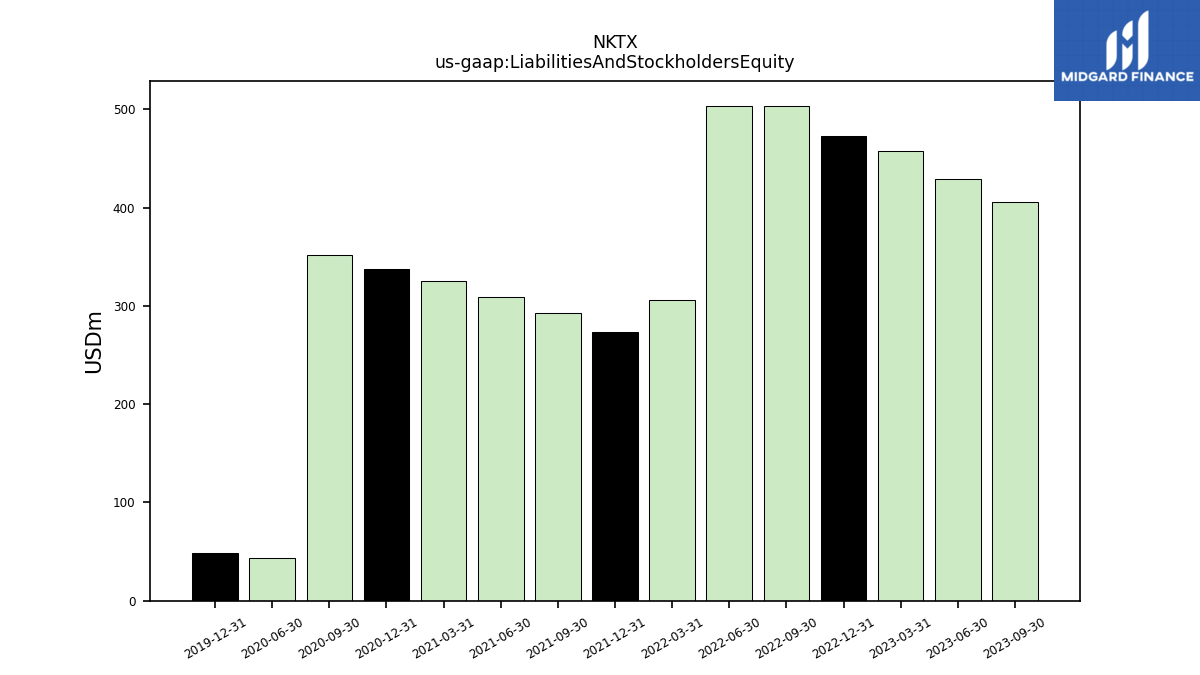
| Assets | 405.86 | 429.04 | 458.17 | 472.94 | 503.80 | 503.64 | 306.30 | 273.90 | 292.46 | 309.11 | 325.69 | 337.65 | 352.30 | 43.62 | 48.41 | |
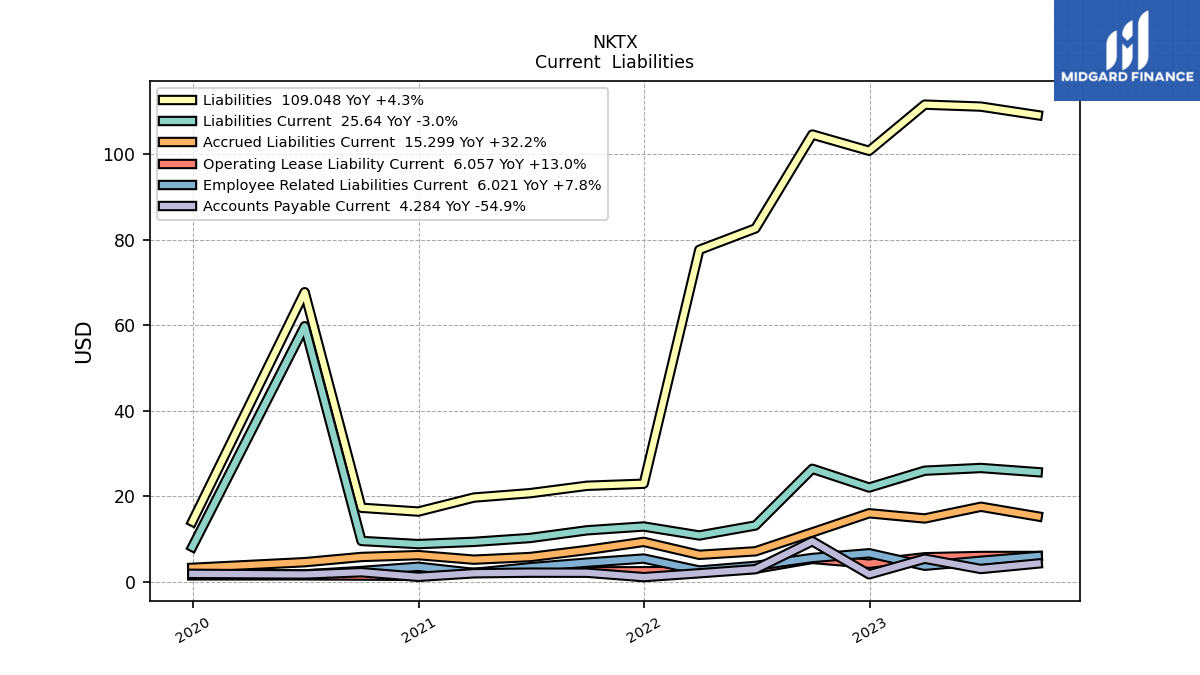
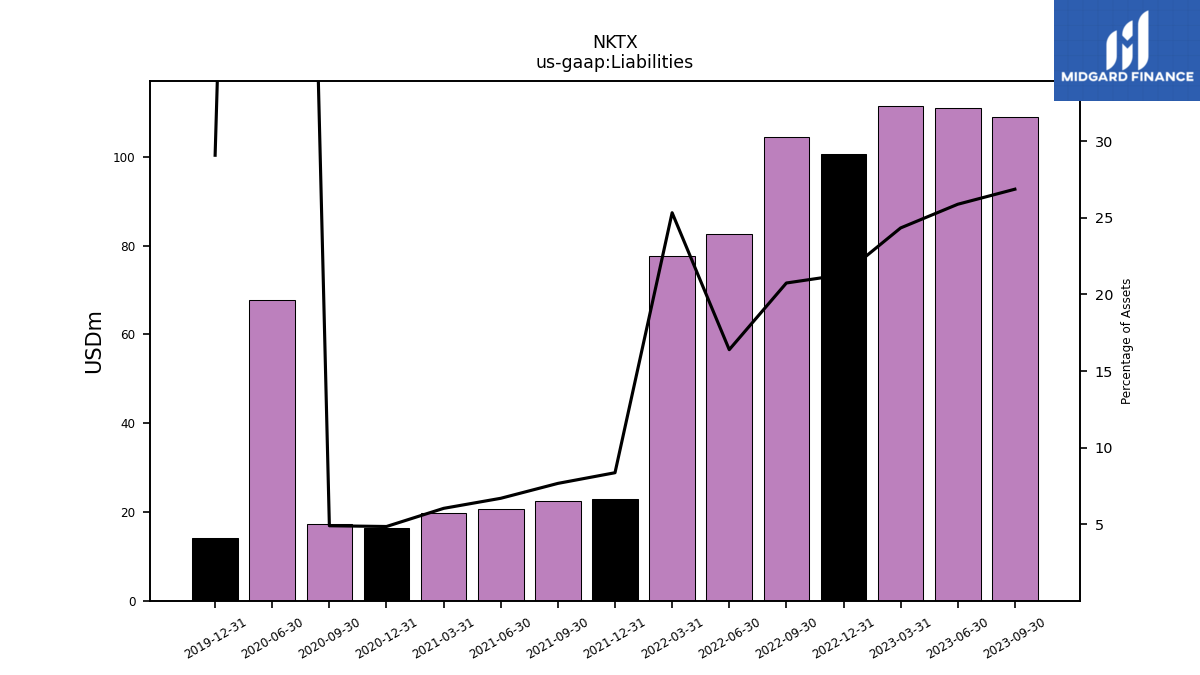
| Liabilities | 109.05 | 111.06 | 111.52 | 100.73 | 104.53 | 82.60 | 77.59 | 22.94 | 22.45 | 20.73 | 19.70 | 16.43 | 17.31 | 67.69 | 14.08 | |
| Liabilities And Stockholders Equity | 405.86 | 429.04 | 458.17 | 472.94 | 503.80 | 503.64 | 306.30 | 273.90 | 292.46 | 309.11 | 325.69 | 337.65 | 352.30 | 43.62 | 48.41 | |
| Stockholders Equity | 296.82 | 317.98 | 346.65 | 372.21 | 399.26 | 421.04 | 228.71 | 250.97 | 270.01 | 288.38 | 305.99 | 321.22 | 334.98 | -83.89 | -25.48 |
| 2023-09-30 | 2023-06-30 | 2023-03-31 | 2022-12-31 | 2022-09-30 | 2022-06-30 | 2022-03-31 | 2021-12-31 | 2021-09-30 | 2021-06-30 | 2021-03-31 | 2020-12-31 | 2020-09-30 | 2020-06-30 | 2019-12-31 | ||
|---|---|---|---|---|---|---|---|---|---|---|---|---|---|---|---|---|
| Assets Current | 281.19 | 286.74 | 332.19 | 360.69 | 400.92 | 417.38 | 223.22 | 245.78 | 264.64 | 283.94 | 302.23 | 318.83 | 333.39 | 22.30 | 37.47 | |
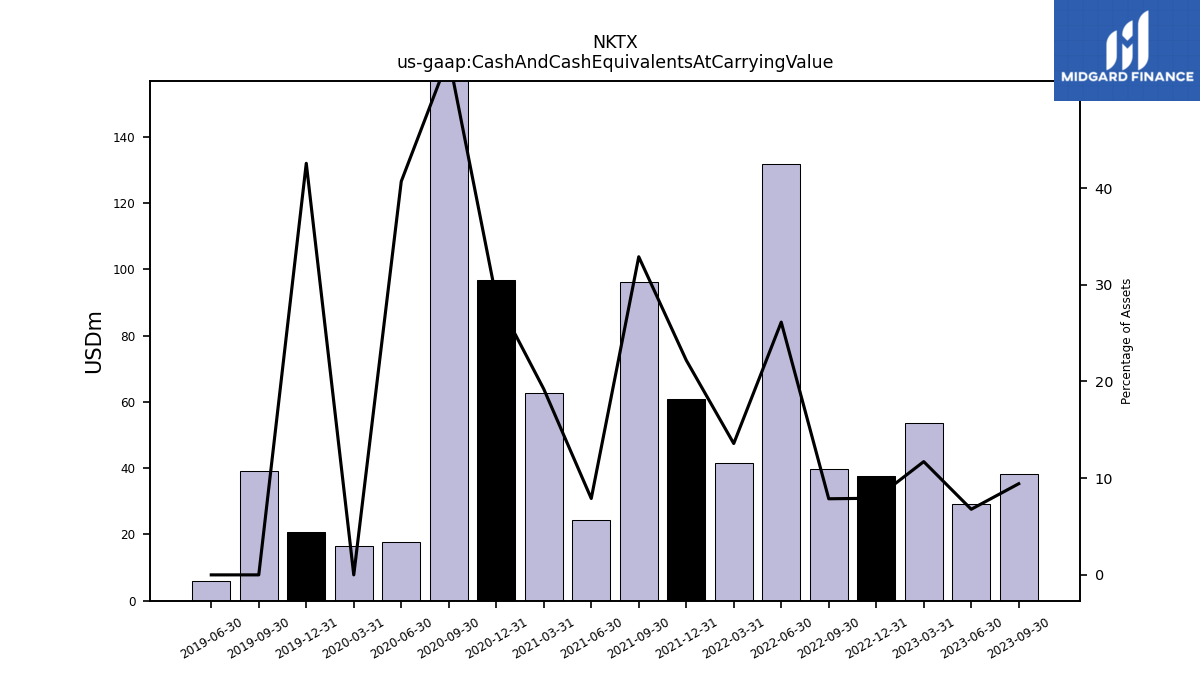
| Cash And Cash Equivalents At Carrying Value | 38.26 | 29.12 | 53.67 | 37.49 | 39.65 | 131.65 | 41.61 | 60.82 | 96.22 | 24.42 | 62.61 | 96.69 | 188.57 | 17.75 | 20.61 | |
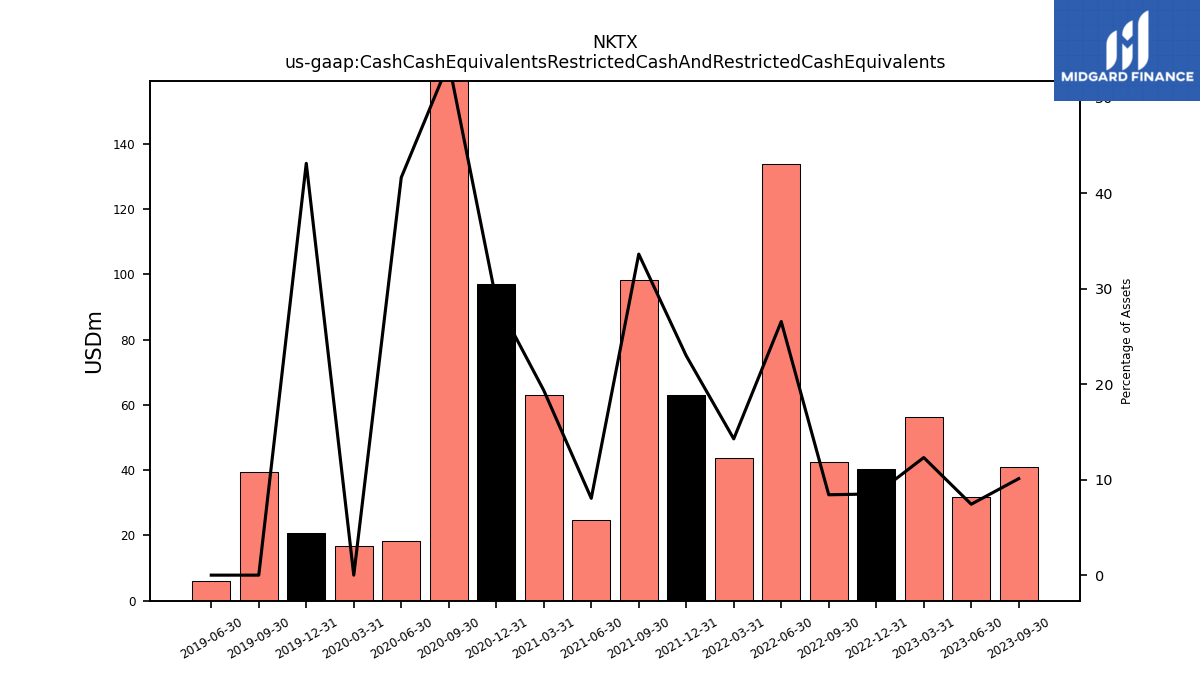
| Cash Cash Equivalents Restricted Cash And Restricted Cash Equivalents | 41.01 | 31.86 | 56.41 | 40.24 | 42.40 | 133.74 | 43.71 | 62.91 | 98.32 | 24.87 | 63.02 | 97.11 | 188.98 | 18.16 | 20.88 | |
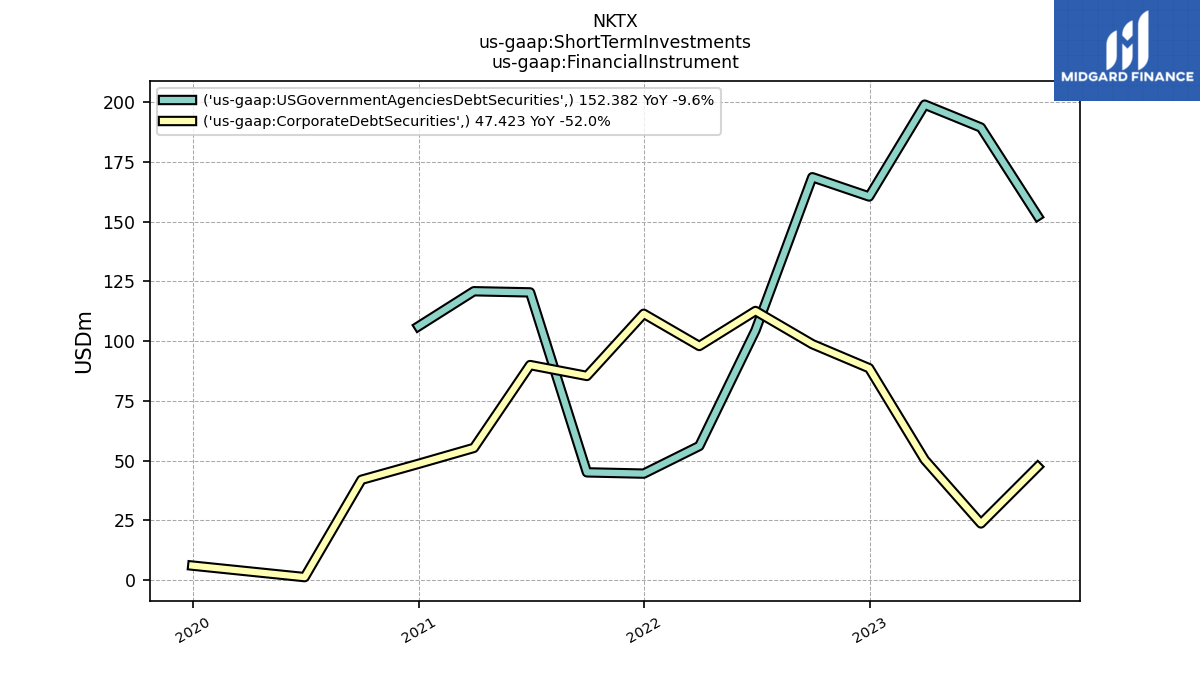
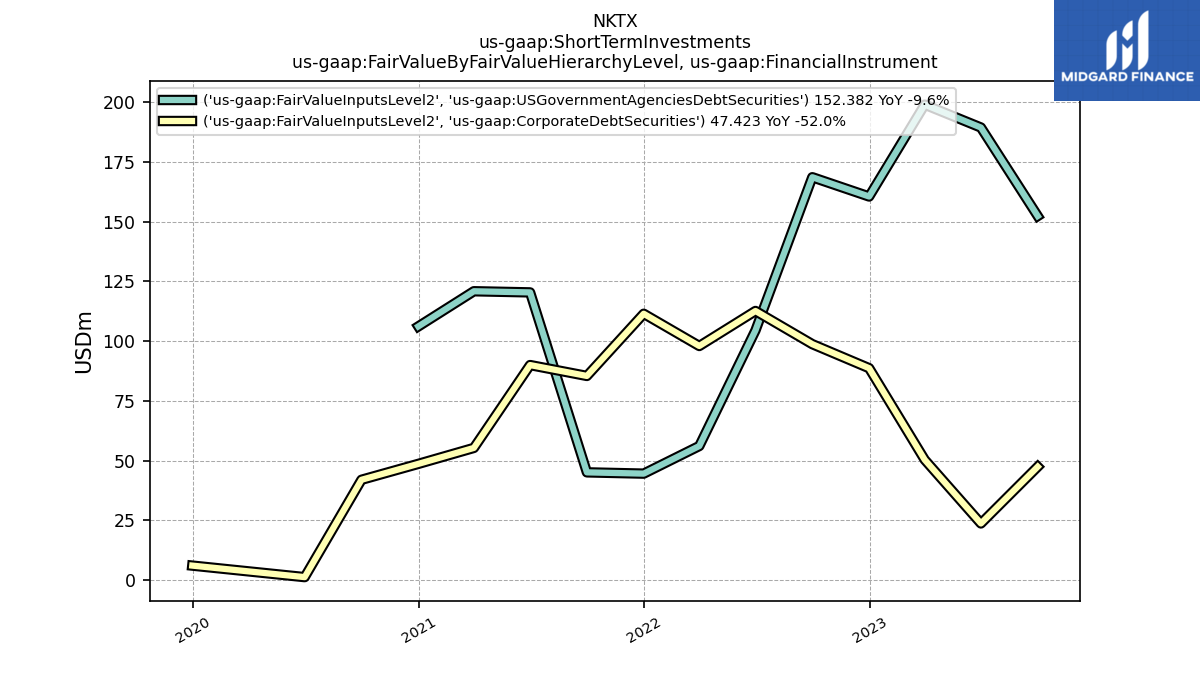
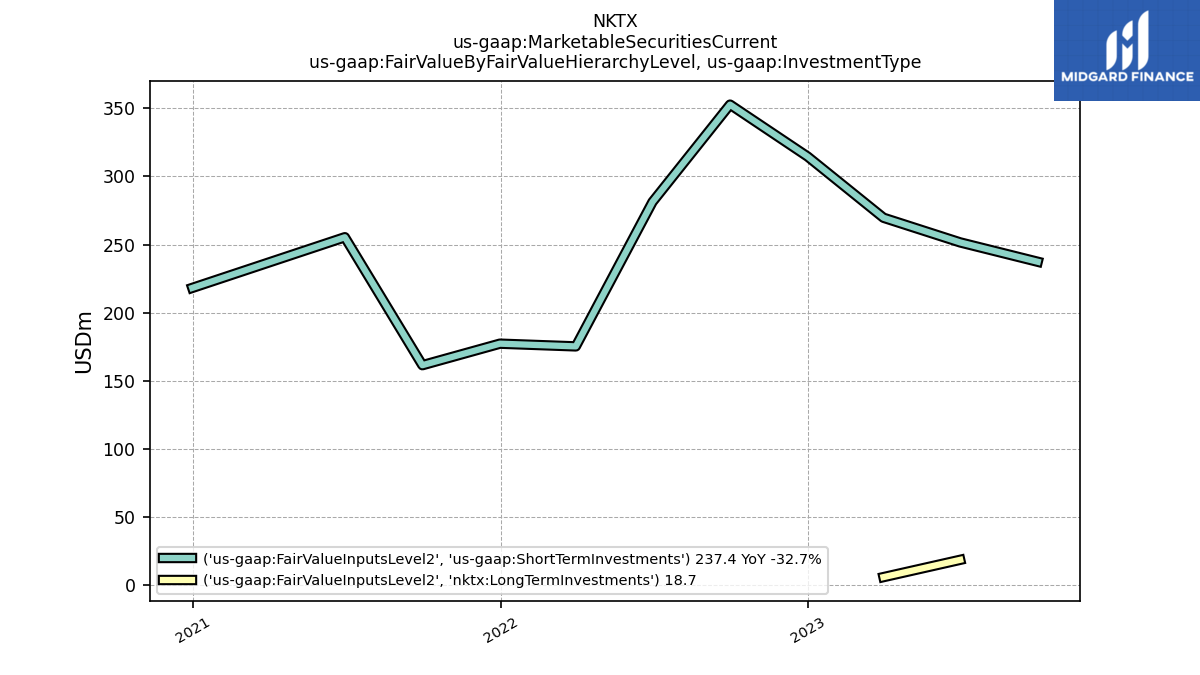
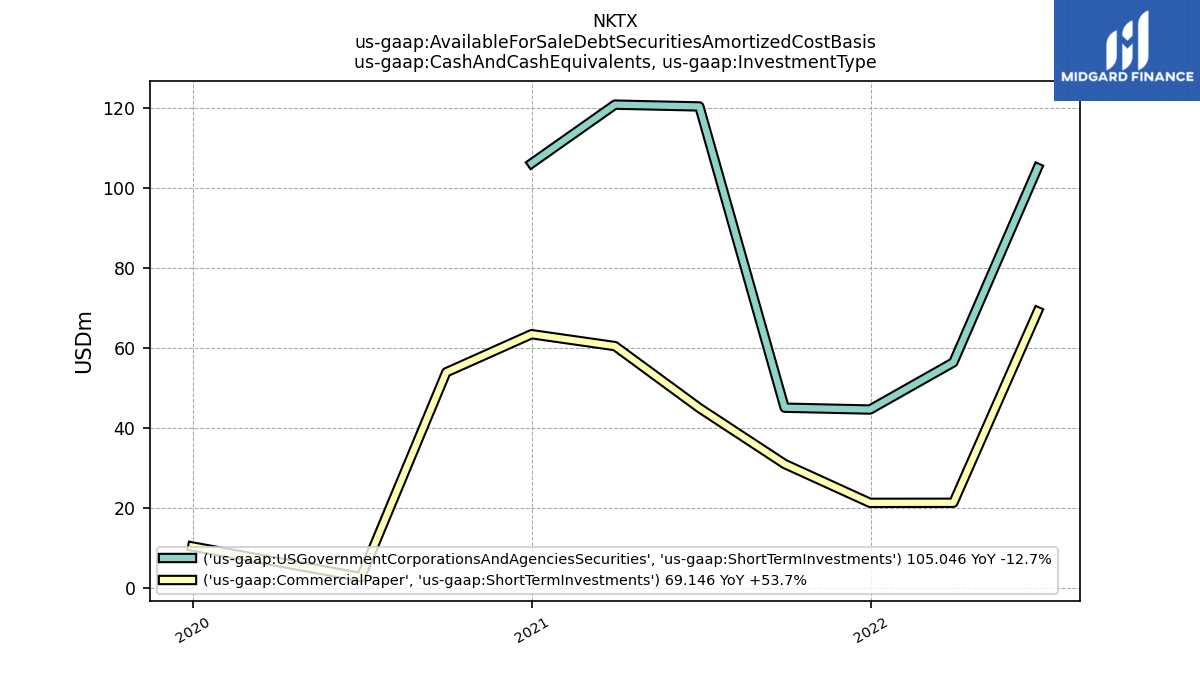
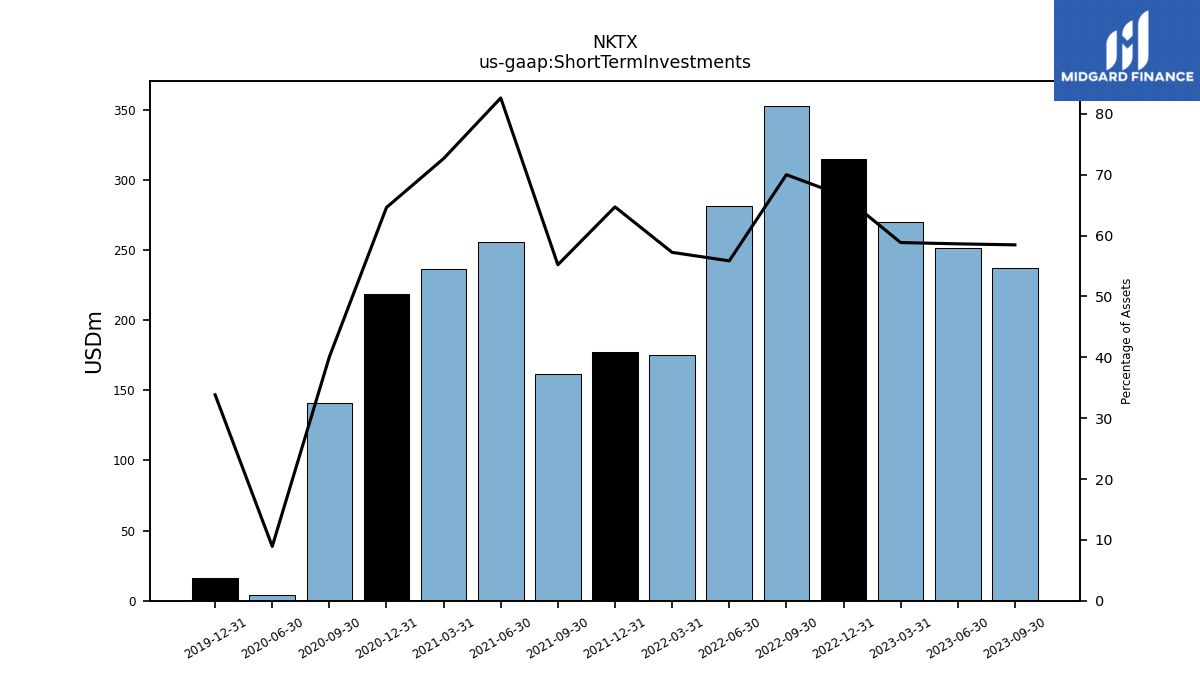
| Short Term Investments | 237.35 | 251.64 | 269.68 | 314.65 | 352.70 | 281.31 | 175.35 | 177.27 | 161.48 | 255.38 | 236.66 | 218.22 | 141.19 | 3.90 | 16.38 | |
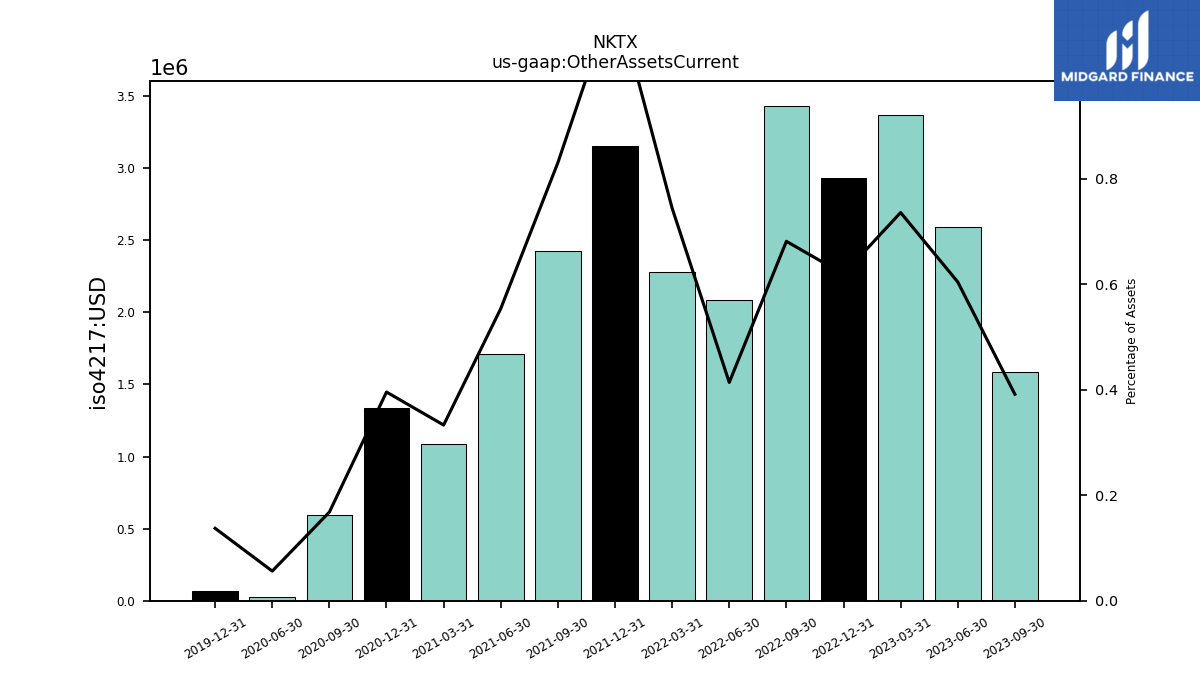
| Other Assets Current | 1.59 | 2.59 | 3.37 | 2.93 | 3.43 | 2.08 | 2.28 | 3.15 | 2.43 | 1.71 | 1.08 | 1.34 | 0.59 | 0.02 | 0.07 | |
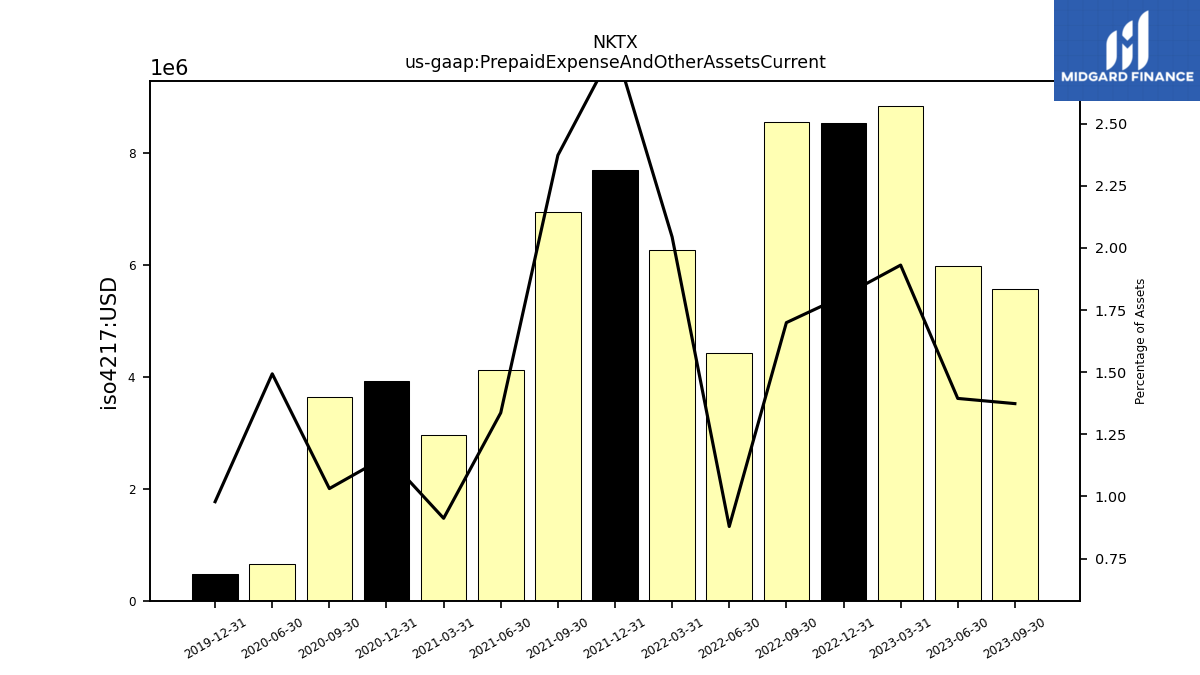
| Prepaid Expense And Other Assets Current | 5.58 | 5.98 | 8.85 | 8.54 | 8.56 | 4.43 | 6.26 | 7.69 | 6.94 | 4.13 | 2.97 | 3.92 | 3.63 | 0.65 | 0.47 | |
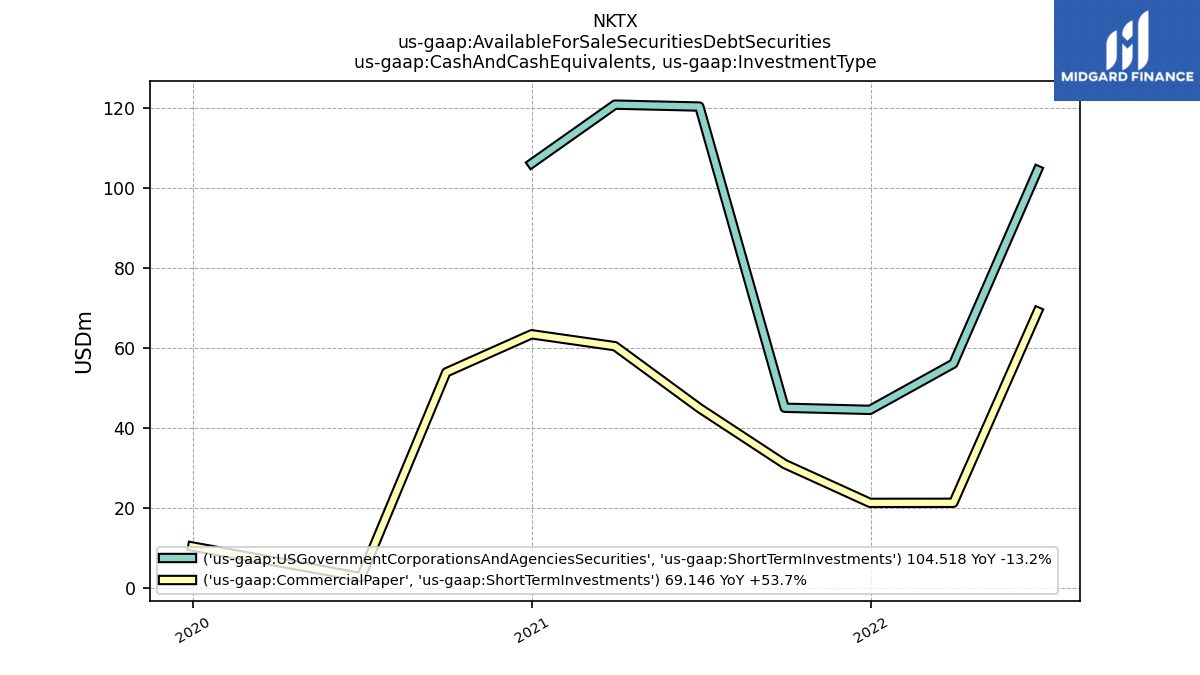
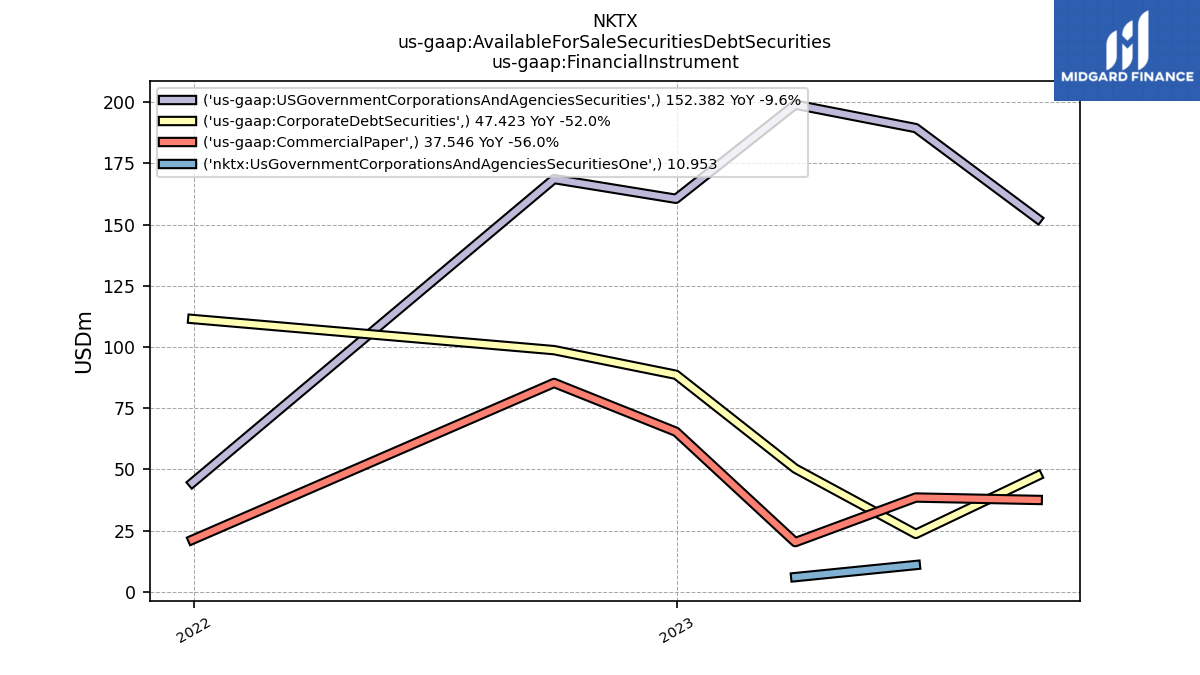
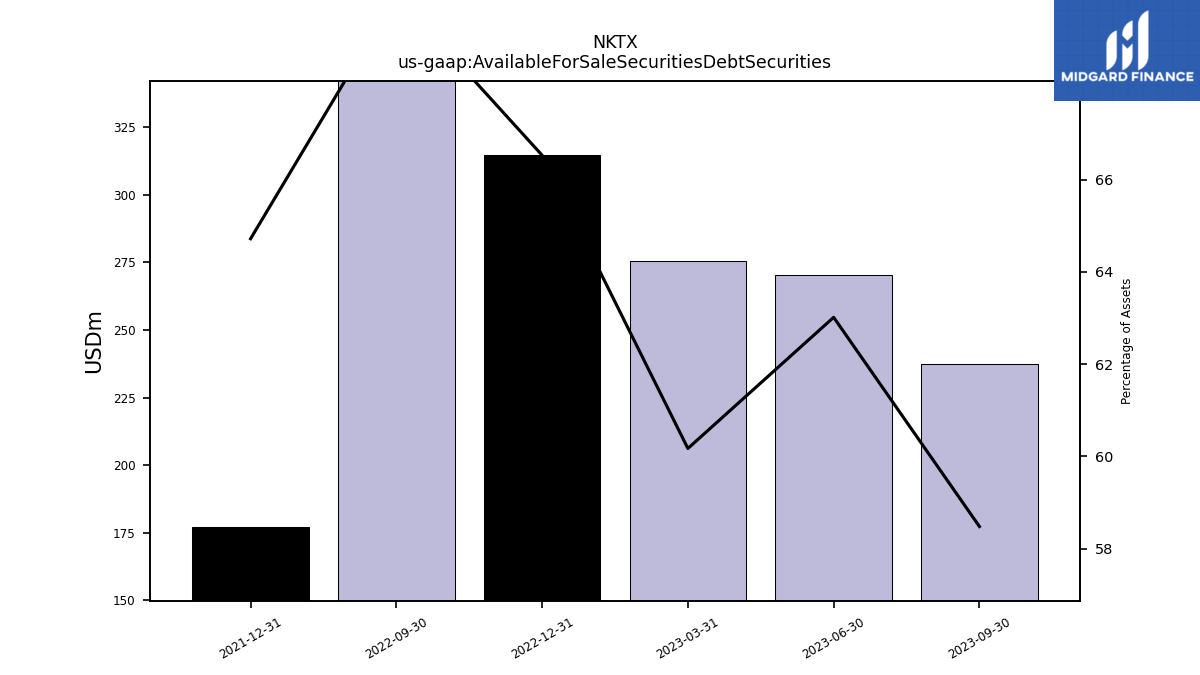
| Available For Sale Securities Debt Securities | 237.35 | 270.36 | 275.69 | 314.65 | 352.70 | NA | NA | 177.27 | NA | NA | NA | NA | NA | NA | NA |
| 2023-09-30 | 2023-06-30 | 2023-03-31 | 2022-12-31 | 2022-09-30 | 2022-06-30 | 2022-03-31 | 2021-12-31 | 2021-09-30 | 2021-06-30 | 2021-03-31 | 2020-12-31 | 2020-09-30 | 2020-06-30 | 2019-12-31 | ||
|---|---|---|---|---|---|---|---|---|---|---|---|---|---|---|---|---|
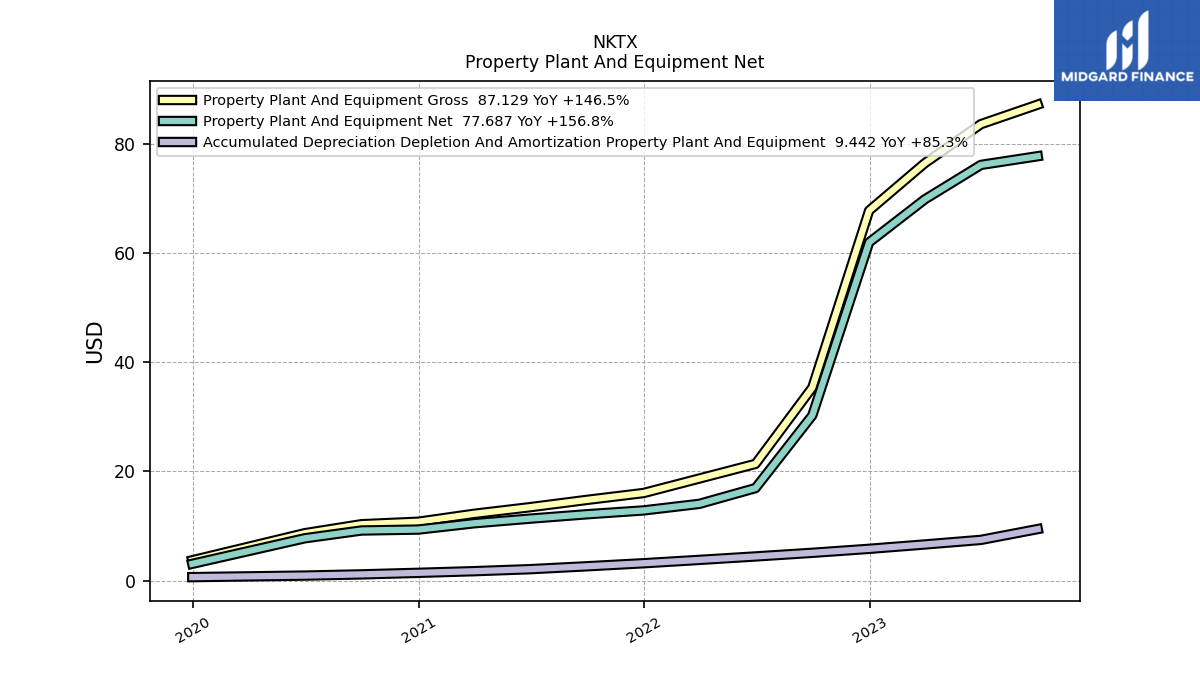
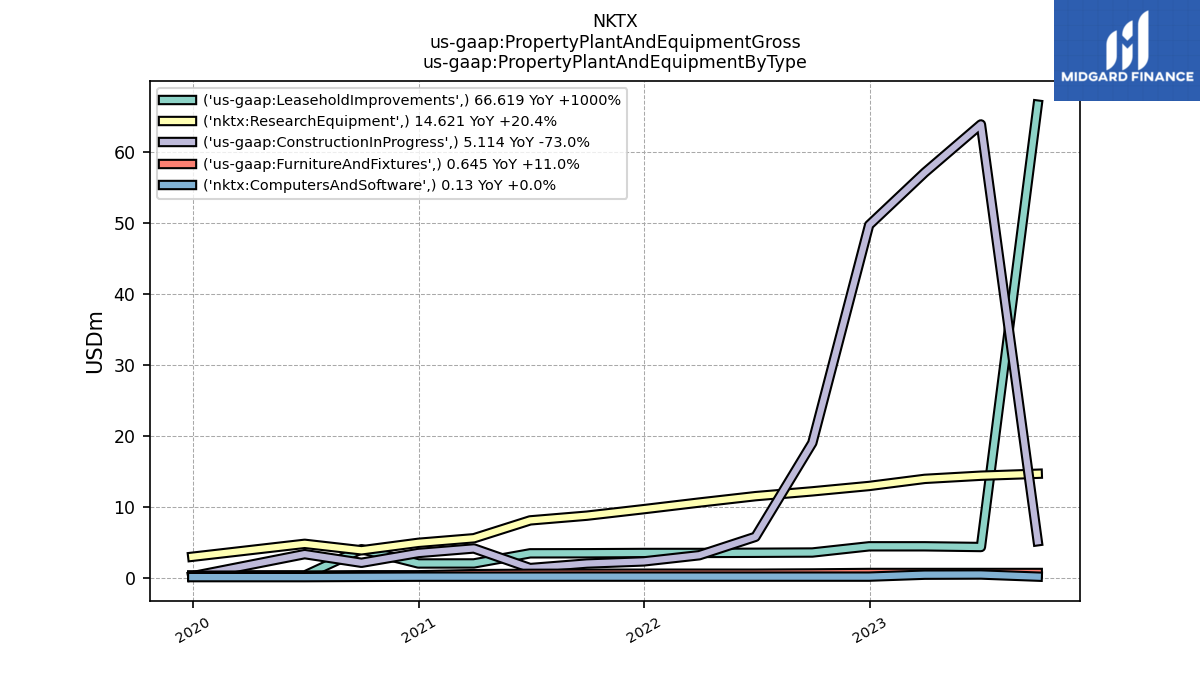
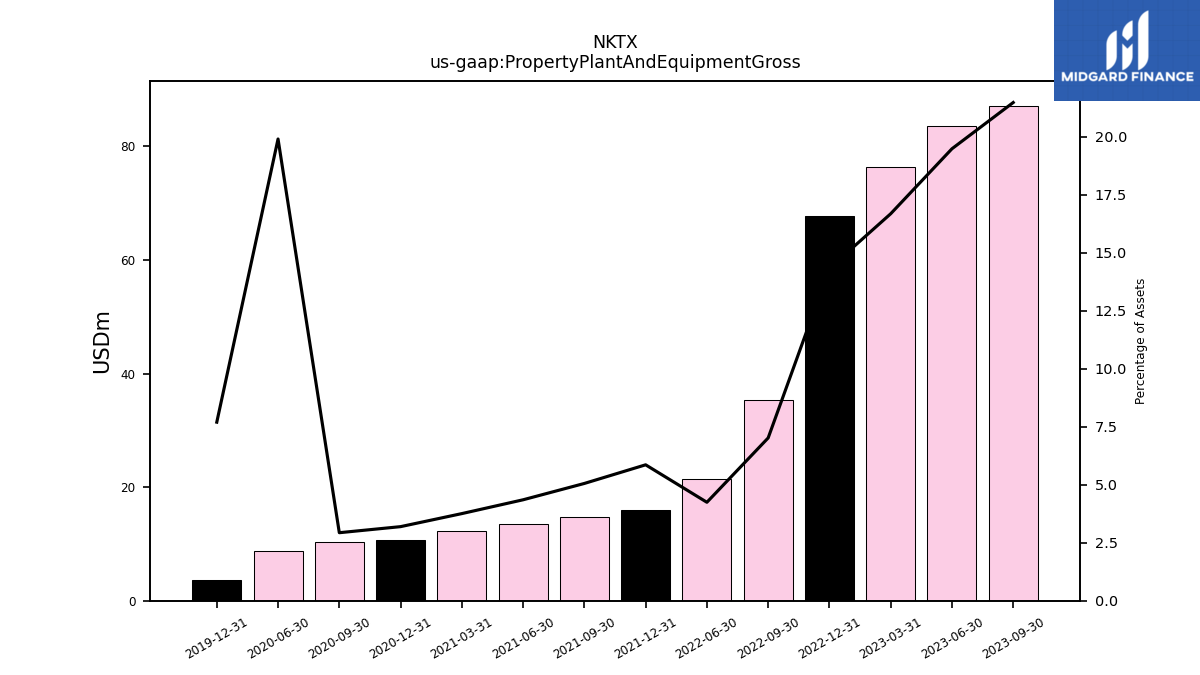
| Property Plant And Equipment Gross | 87.13 | 83.55 | 76.40 | 67.73 | 35.34 | 21.37 | NA | 16.04 | 14.78 | 13.45 | 12.23 | 10.78 | 10.33 | 8.68 | 3.72 | |
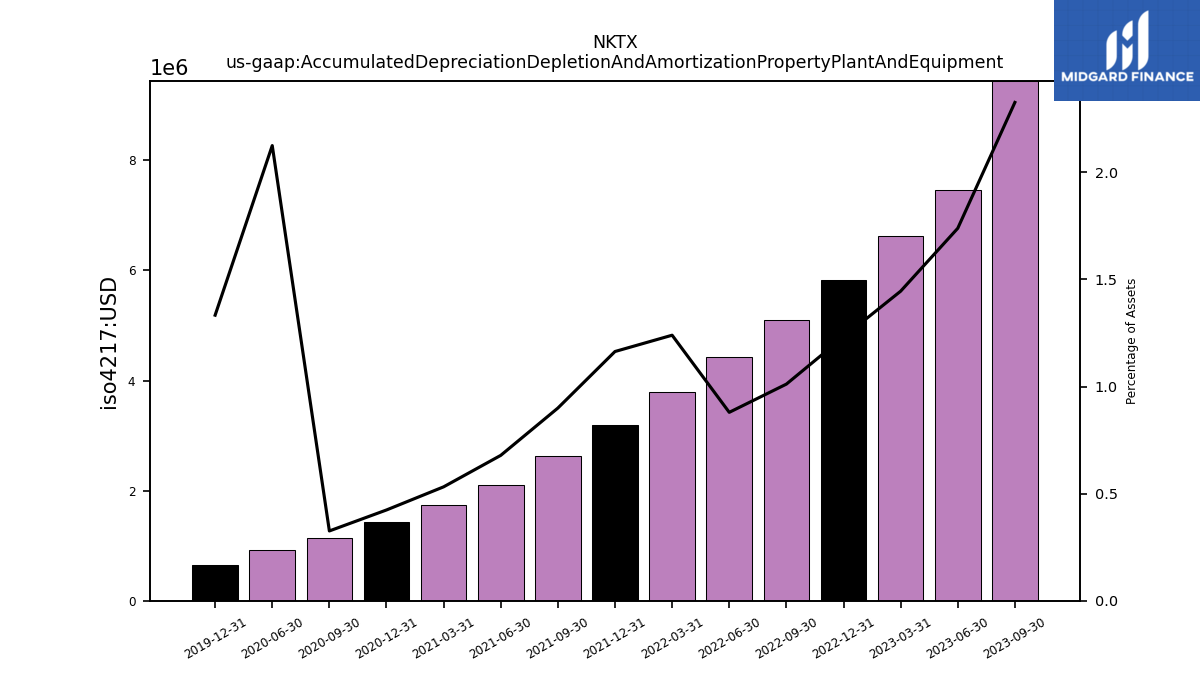
| Accumulated Depreciation Depletion And Amortization Property Plant And Equipment | 9.44 | 7.46 | 6.62 | 5.82 | 5.09 | 4.43 | 3.80 | 3.19 | 2.63 | 2.10 | 1.73 | 1.43 | 1.15 | 0.93 | 0.65 | |
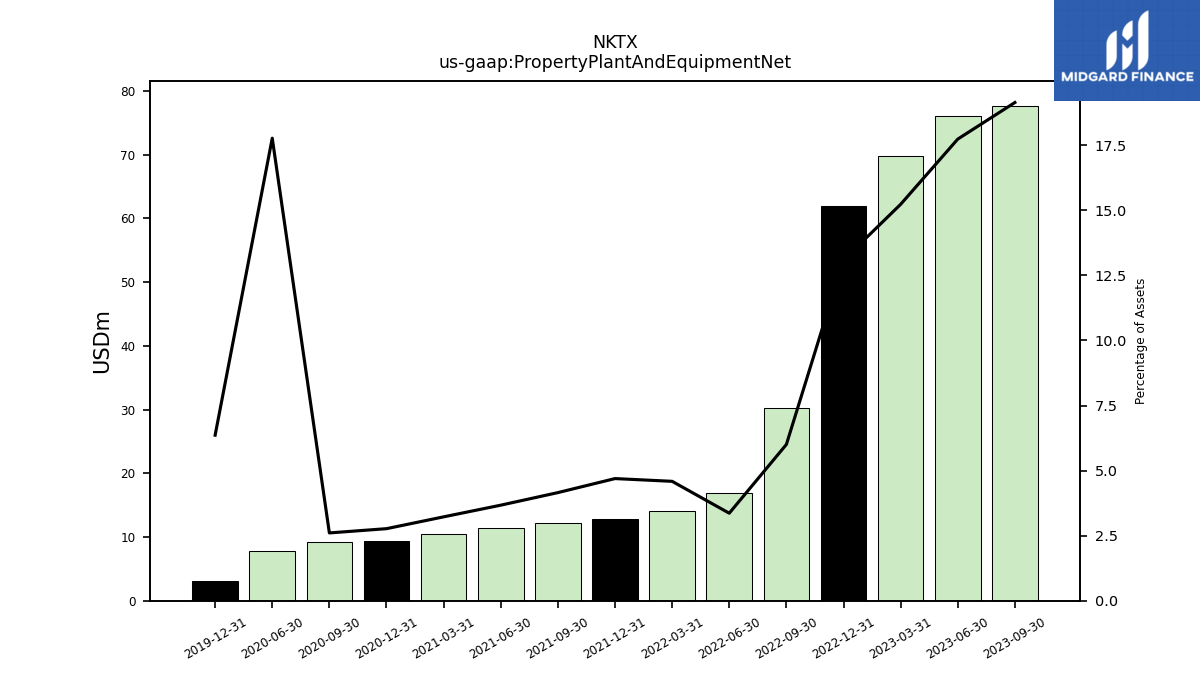
| Property Plant And Equipment Net | 77.69 | 76.09 | 69.78 | 61.91 | 30.25 | 16.94 | 14.05 | 12.86 | 12.15 | 11.35 | 10.50 | 9.35 | 9.18 | 7.75 | 3.08 | |
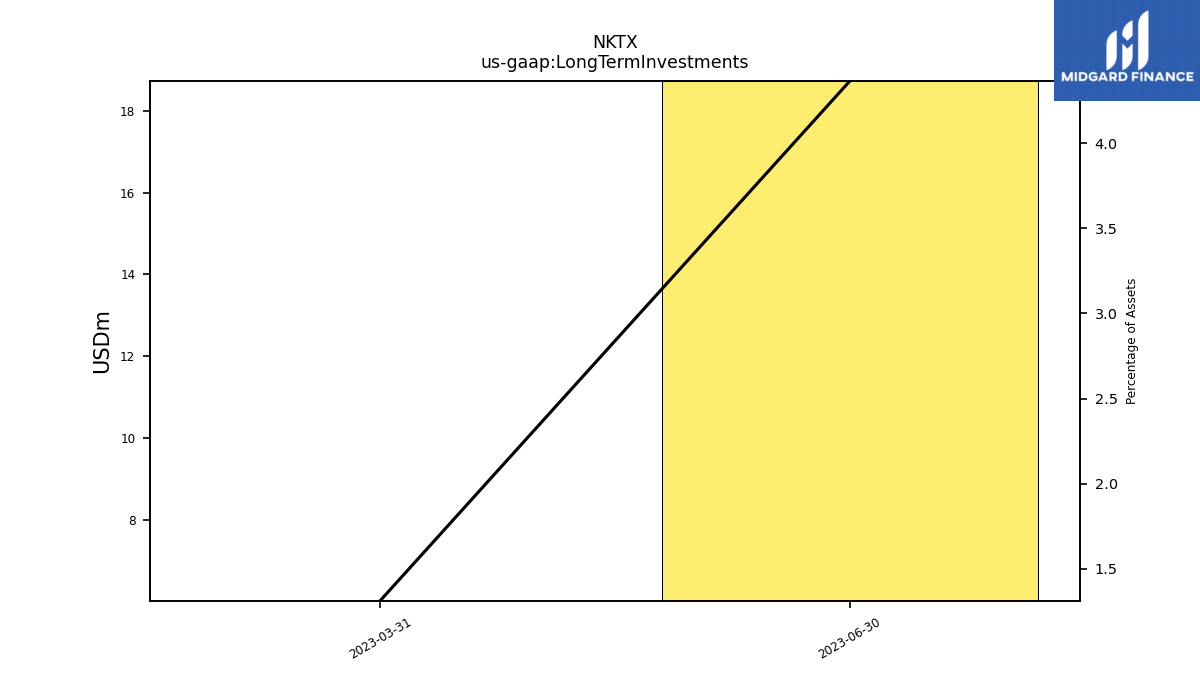
| Long Term Investments | NA | 18.73 | 6.02 | NA | NA | NA | NA | NA | NA | NA | NA | NA | NA | NA | NA | |
| Other Assets Noncurrent | 3.73 | 3.67 | 1.87 | 1.85 | 1.92 | 1.20 | 1.46 | 1.49 | 1.50 | 1.32 | 0.67 | 0.55 | 0.55 | 4.14 | 0.46 | |
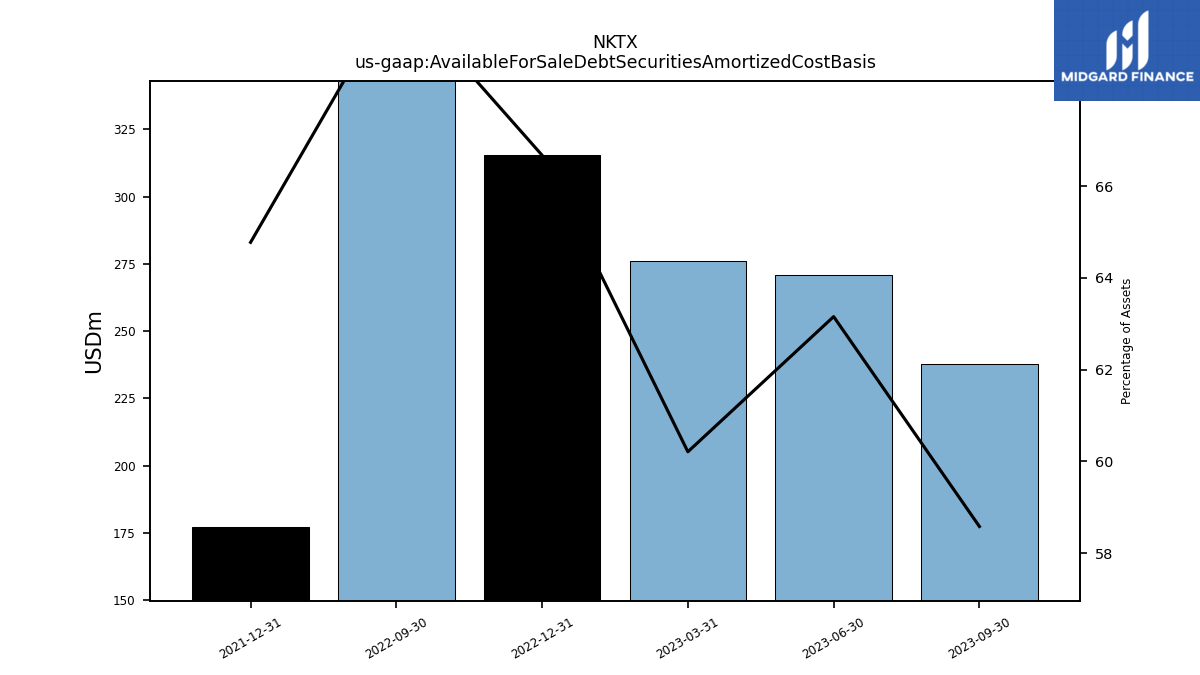
| Available For Sale Debt Securities Amortized Cost Basis | 237.76 | 270.96 | 275.87 | 315.33 | 354.02 | NA | NA | 177.42 | NA | NA | NA | NA | NA | NA | NA |
| 2023-09-30 | 2023-06-30 | 2023-03-31 | 2022-12-31 | 2022-09-30 | 2022-06-30 | 2022-03-31 | 2021-12-31 | 2021-09-30 | 2021-06-30 | 2021-03-31 | 2020-12-31 | 2020-09-30 | 2020-06-30 | 2019-12-31 | ||
|---|---|---|---|---|---|---|---|---|---|---|---|---|---|---|---|---|
| Liabilities Current | 25.64 | 26.61 | 25.98 | 22.05 | 26.43 | 13.18 | 10.84 | 12.94 | 12.05 | 10.26 | 9.35 | 8.83 | 9.56 | 59.74 | 8.16 | |
| Accounts Payable Current | 4.28 | 3.01 | 5.41 | 1.76 | 9.49 | 2.97 | 2.02 | 1.11 | 2.14 | 2.16 | 2.01 | 1.18 | 2.26 | 1.73 | 1.88 | |
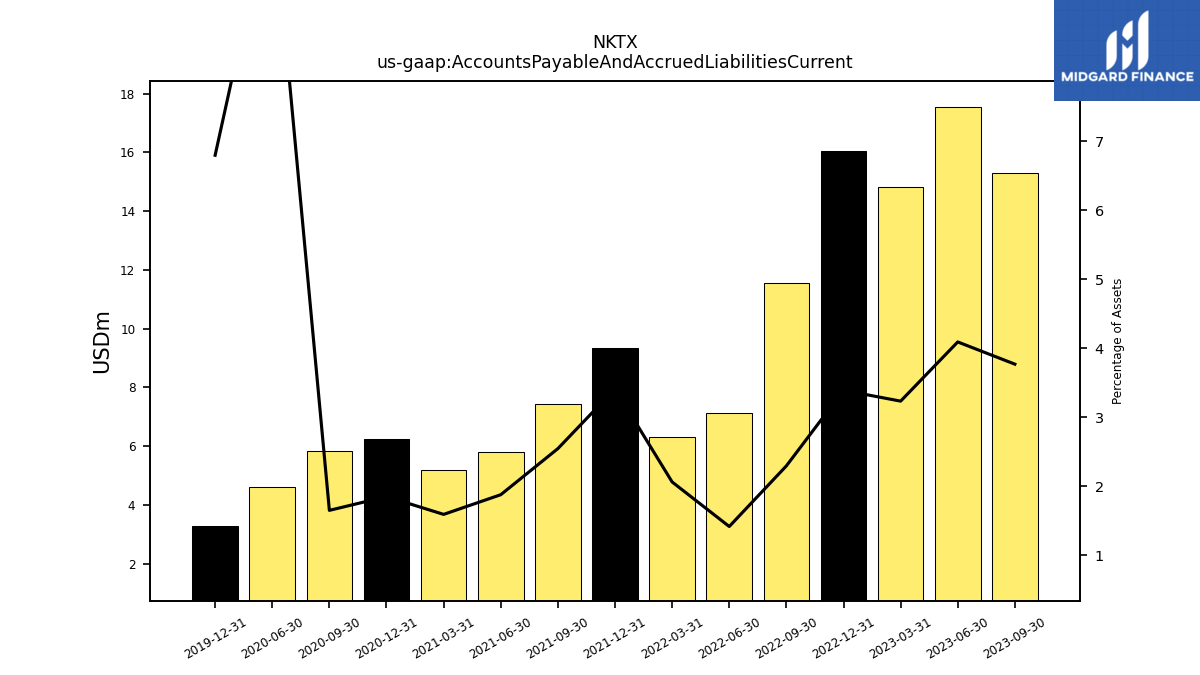
| Accounts Payable And Accrued Liabilities Current | 15.30 | 17.55 | 14.82 | 16.04 | 11.57 | 7.14 | 6.32 | 9.35 | 7.45 | 5.81 | 5.19 | 6.25 | 5.82 | 4.60 | 3.29 | |
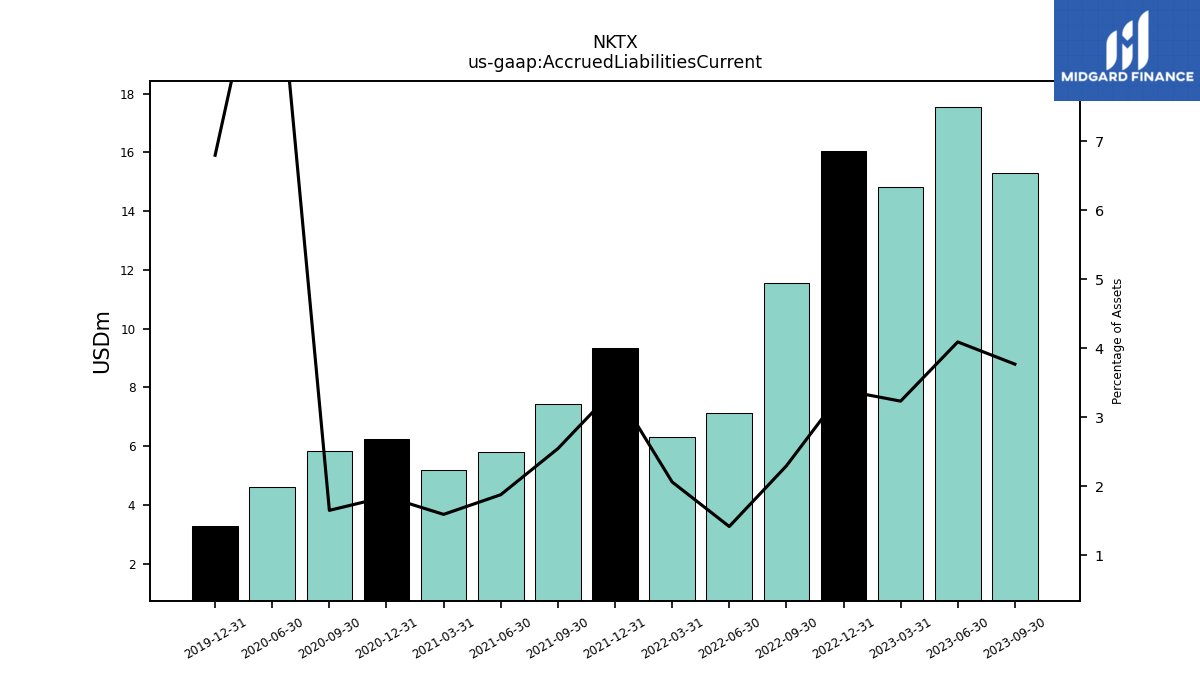
| Accrued Liabilities Current | 15.30 | 17.55 | 14.82 | 16.04 | 11.57 | 7.14 | 6.32 | 9.35 | 7.45 | 5.81 | 5.19 | 6.25 | 5.82 | 4.60 | 3.29 |
| 2023-09-30 | 2023-06-30 | 2023-03-31 | 2022-12-31 | 2022-09-30 | 2022-06-30 | 2022-03-31 | 2021-12-31 | 2021-09-30 | 2021-06-30 | 2021-03-31 | 2020-12-31 | 2020-09-30 | 2020-06-30 | 2019-12-31 | ||
|---|---|---|---|---|---|---|---|---|---|---|---|---|---|---|---|---|
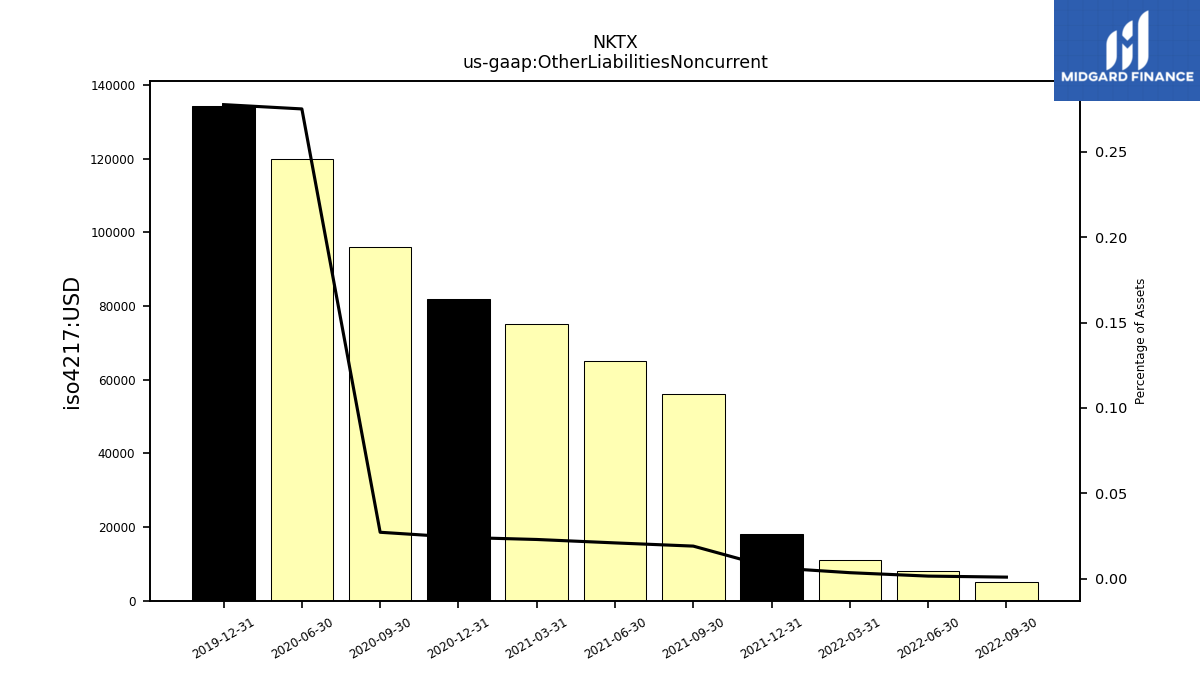
| Other Liabilities Noncurrent | NA | NA | NA | NA | 0.01 | 0.01 | 0.01 | 0.02 | 0.06 | 0.07 | 0.07 | 0.08 | 0.10 | 0.12 | 0.13 | |
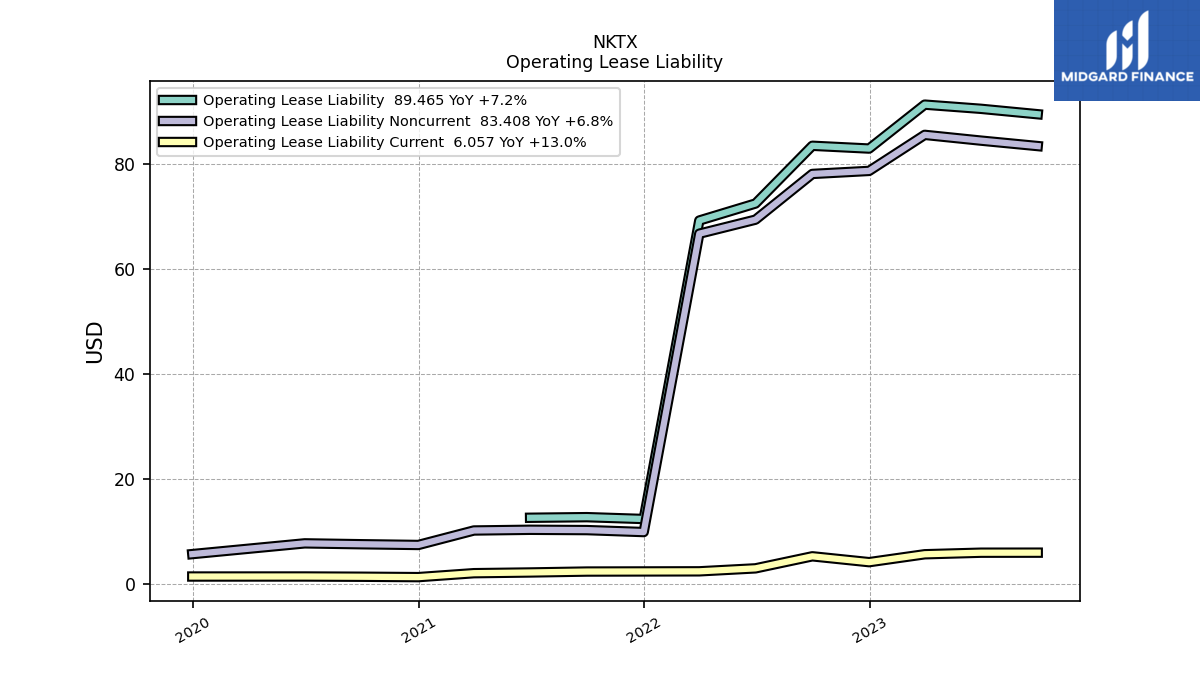
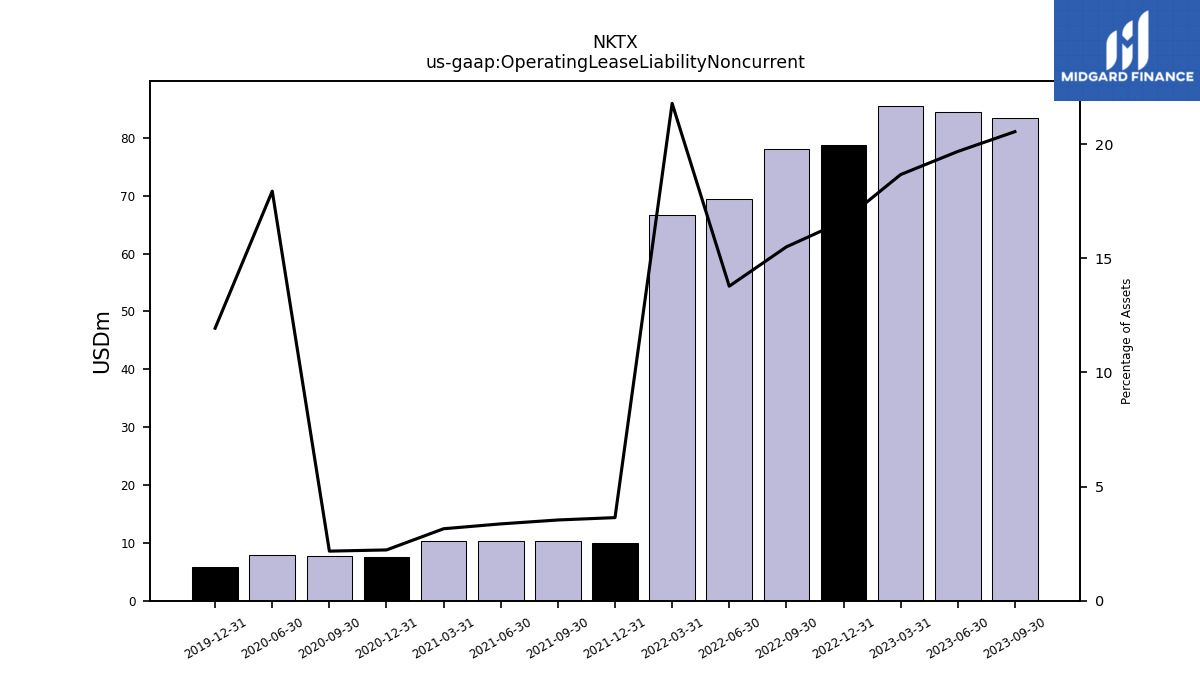
| Operating Lease Liability Noncurrent | 83.41 | 84.45 | 85.54 | 78.69 | 78.11 | 69.41 | 66.74 | 9.97 | 10.35 | 10.41 | 10.27 | 7.52 | 7.66 | 7.83 | 5.78 |
| 2023-09-30 | 2023-06-30 | 2023-03-31 | 2022-12-31 | 2022-09-30 | 2022-06-30 | 2022-03-31 | 2021-12-31 | 2021-09-30 | 2021-06-30 | 2021-03-31 | 2020-12-31 | 2020-09-30 | 2020-06-30 | 2019-12-31 | ||
|---|---|---|---|---|---|---|---|---|---|---|---|---|---|---|---|---|
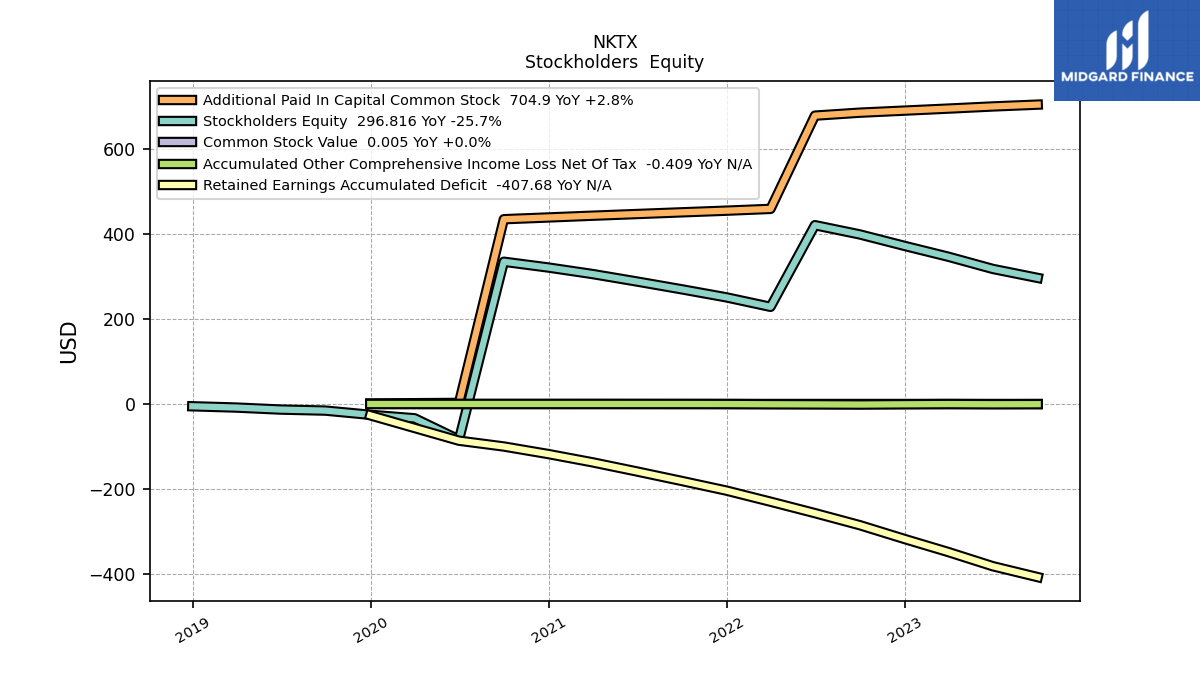
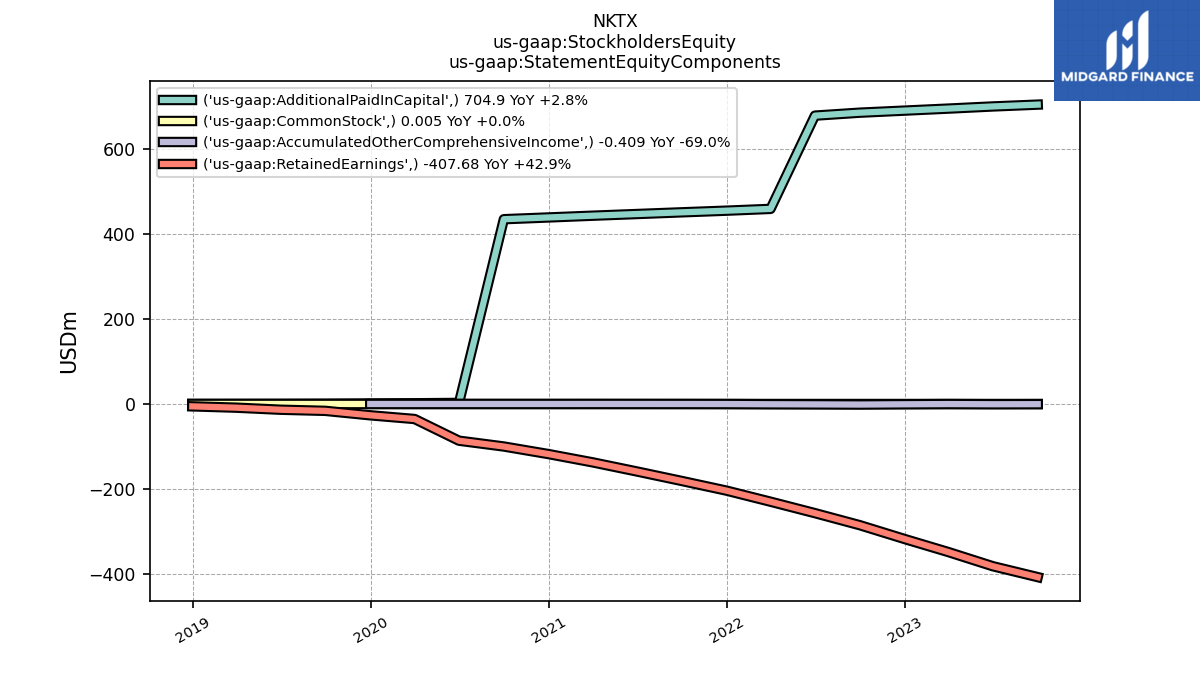
| Stockholders Equity | 296.82 | 317.98 | 346.65 | 372.21 | 399.26 | 421.04 | 228.71 | 250.97 | 270.01 | 288.38 | 305.99 | 321.22 | 334.98 | -83.89 | -25.48 | |
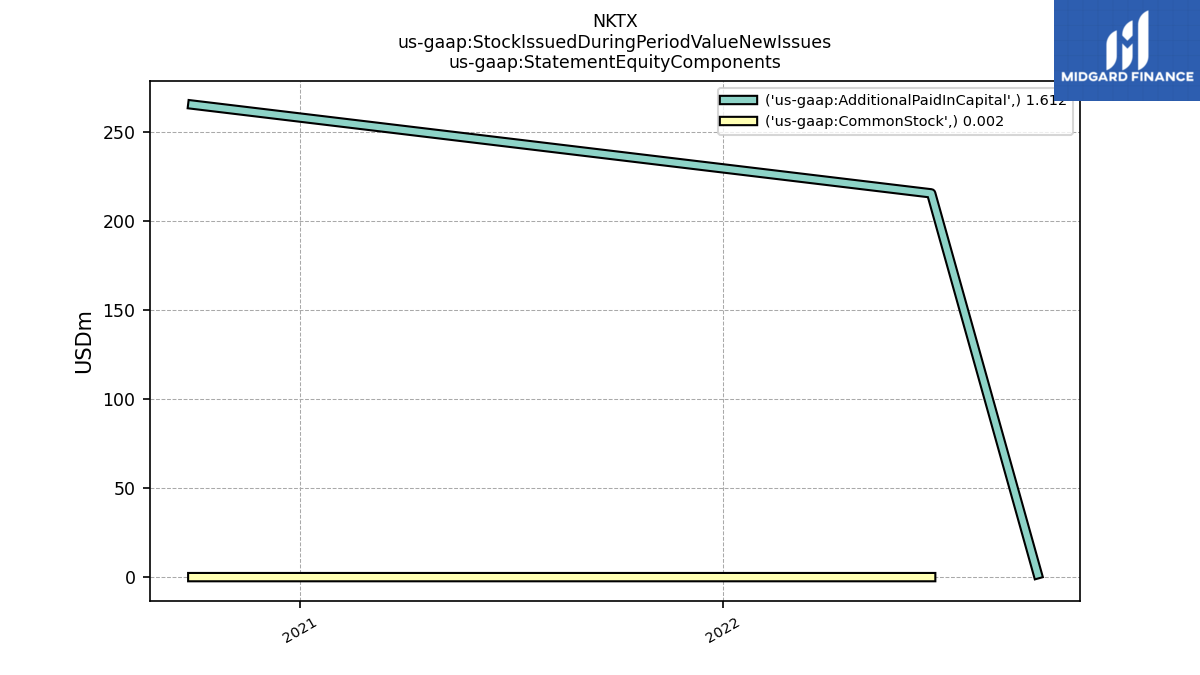
| Common Stock Value | 0.01 | 0.01 | 0.01 | 0.01 | 0.01 | 0.01 | 0.00 | 0.00 | 0.00 | 0.00 | 0.00 | 0.00 | 0.00 | 0.00 | 0.00 | |
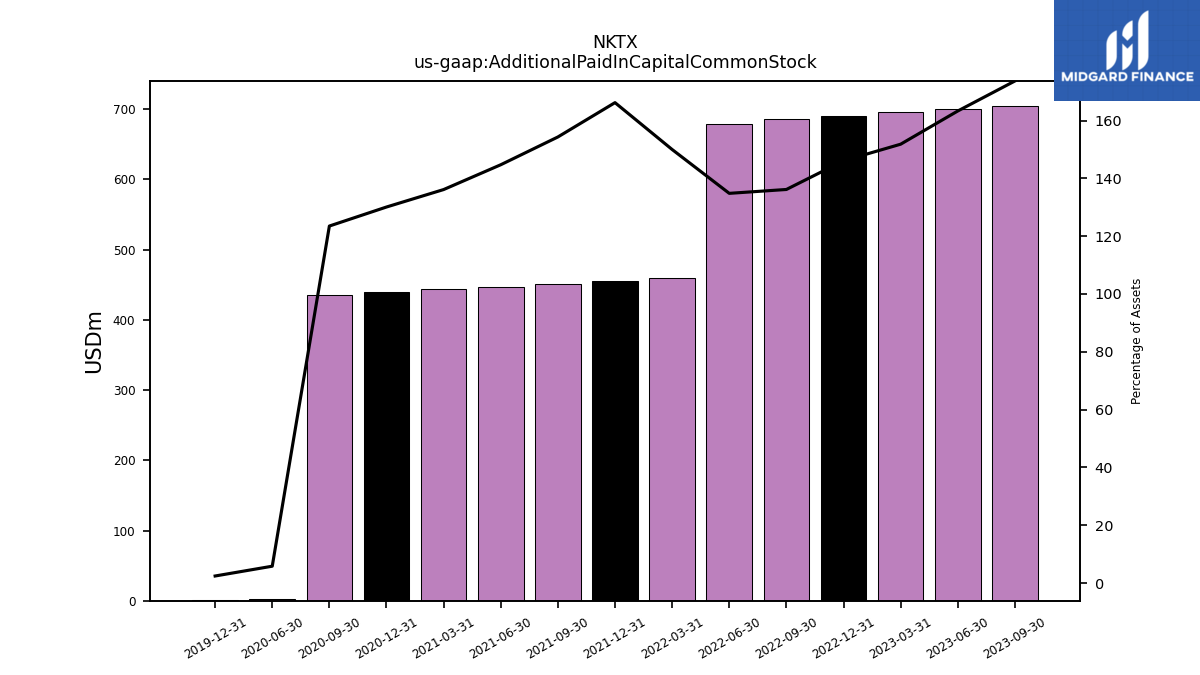
| Additional Paid In Capital Common Stock | 704.90 | 700.61 | 695.56 | 690.81 | 685.93 | 678.97 | 459.39 | 455.21 | 451.32 | 447.30 | 443.35 | 439.24 | 435.10 | 2.54 | 1.18 | |
| Retained Earnings Accumulated Deficit | -407.68 | -382.04 | -348.75 | -317.93 | -285.35 | -257.01 | -230.08 | -204.10 | -181.28 | -158.93 | -137.39 | -118.02 | -100.12 | -86.43 | -26.66 | |
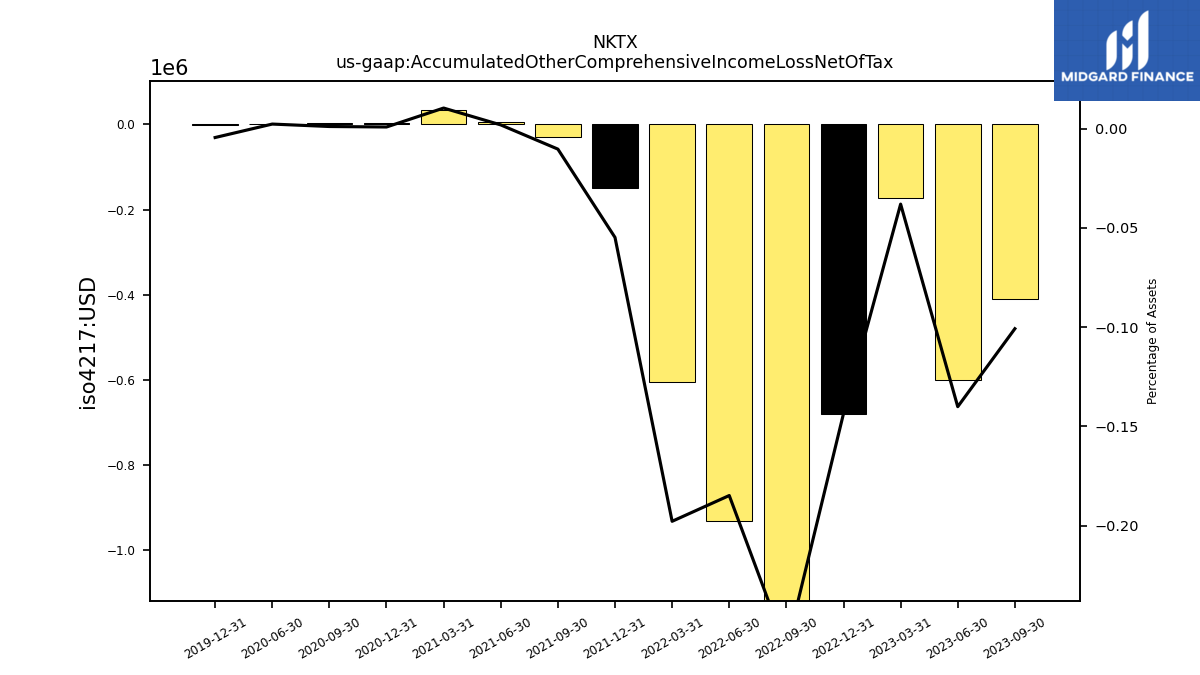
| Accumulated Other Comprehensive Income Loss Net Of Tax | -0.41 | -0.60 | -0.17 | -0.68 | -1.32 | -0.93 | -0.61 | -0.15 | -0.03 | 0.01 | 0.03 | 0.00 | 0.00 | 0.00 | -0.00 | |
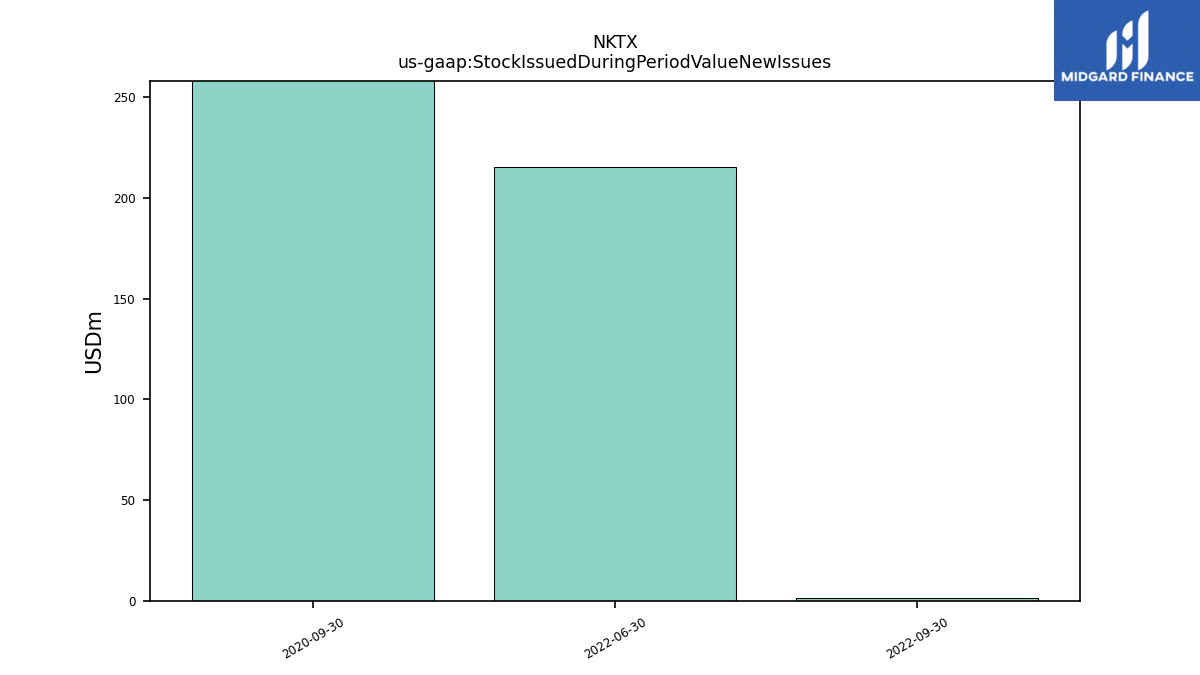
| Stock Issued During Period Value New Issues | NA | NA | NA | NA | 1.61 | 215.33 | NA | NA | NA | NA | NA | NA | 265.13 | NA | NA | |
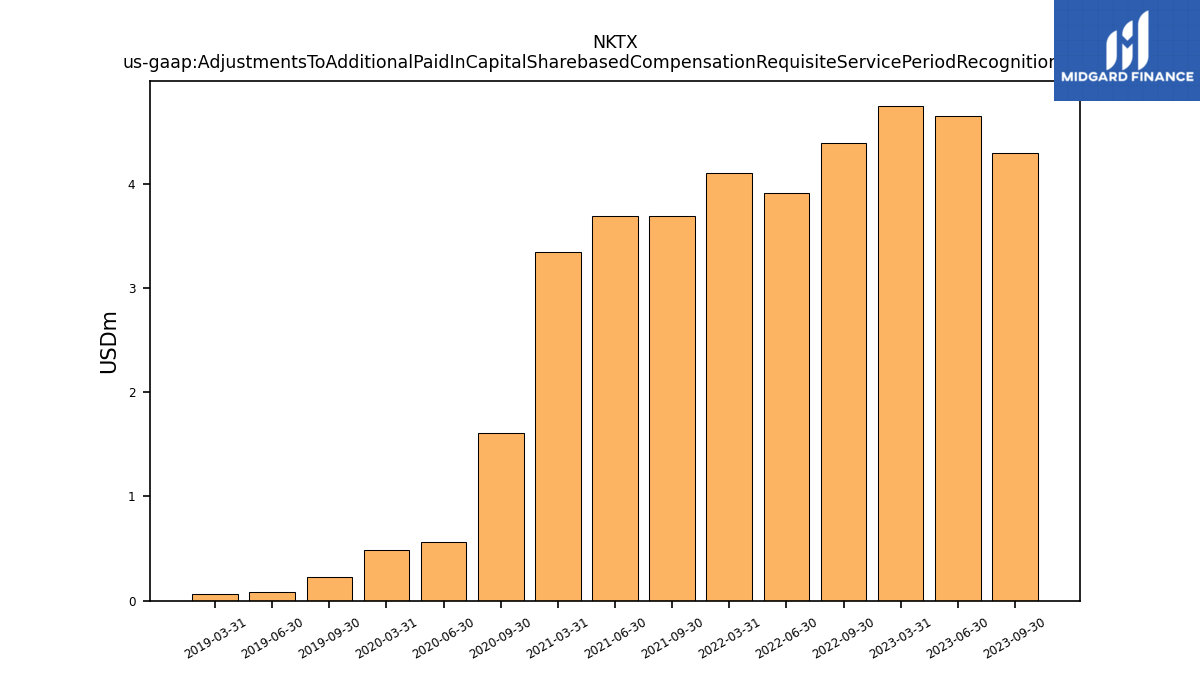
| Adjustments To Additional Paid In Capital Sharebased Compensation Requisite Service Period Recognition Value | 4.29 | 4.65 | 4.75 | NA | 4.39 | 3.91 | 4.10 | NA | 3.69 | 3.69 | 3.35 | NA | 1.61 | 0.57 | NA |
| 2023-09-30 | 2023-06-30 | 2023-03-31 | 2022-12-31 | 2022-09-30 | 2022-06-30 | 2022-03-31 | 2021-12-31 | 2021-09-30 | 2021-06-30 | 2021-03-31 | 2020-12-31 | 2020-09-30 | 2020-06-30 | 2019-12-31 | ||
|---|---|---|---|---|---|---|---|---|---|---|---|---|---|---|---|---|
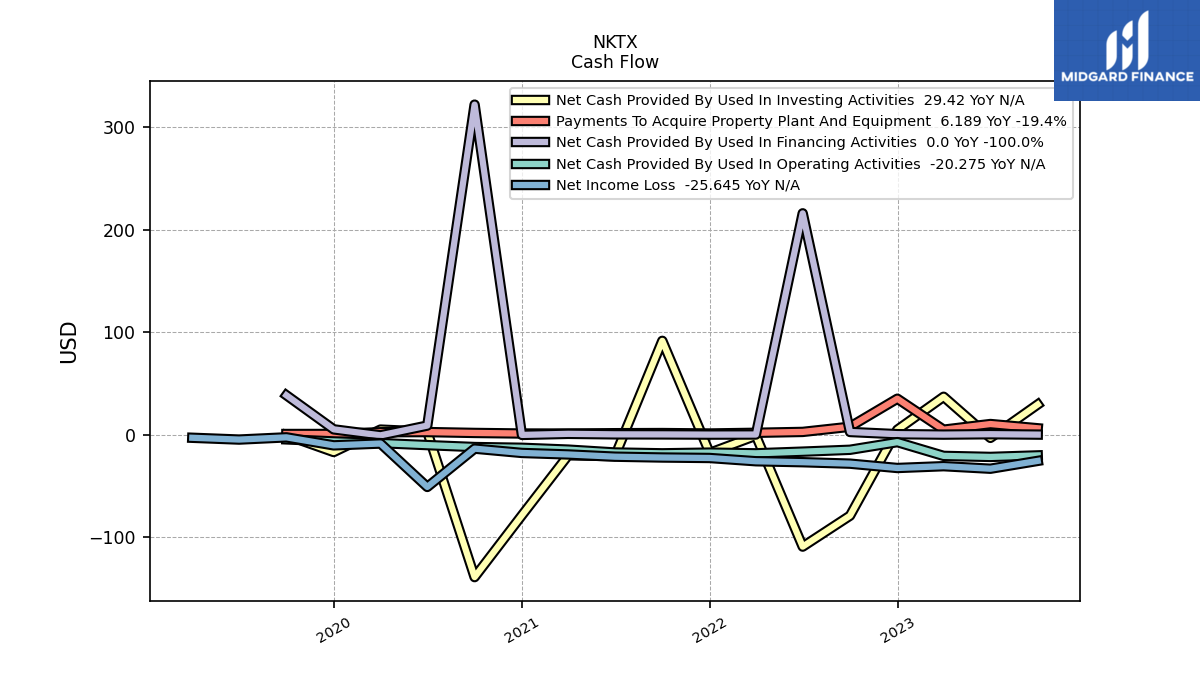
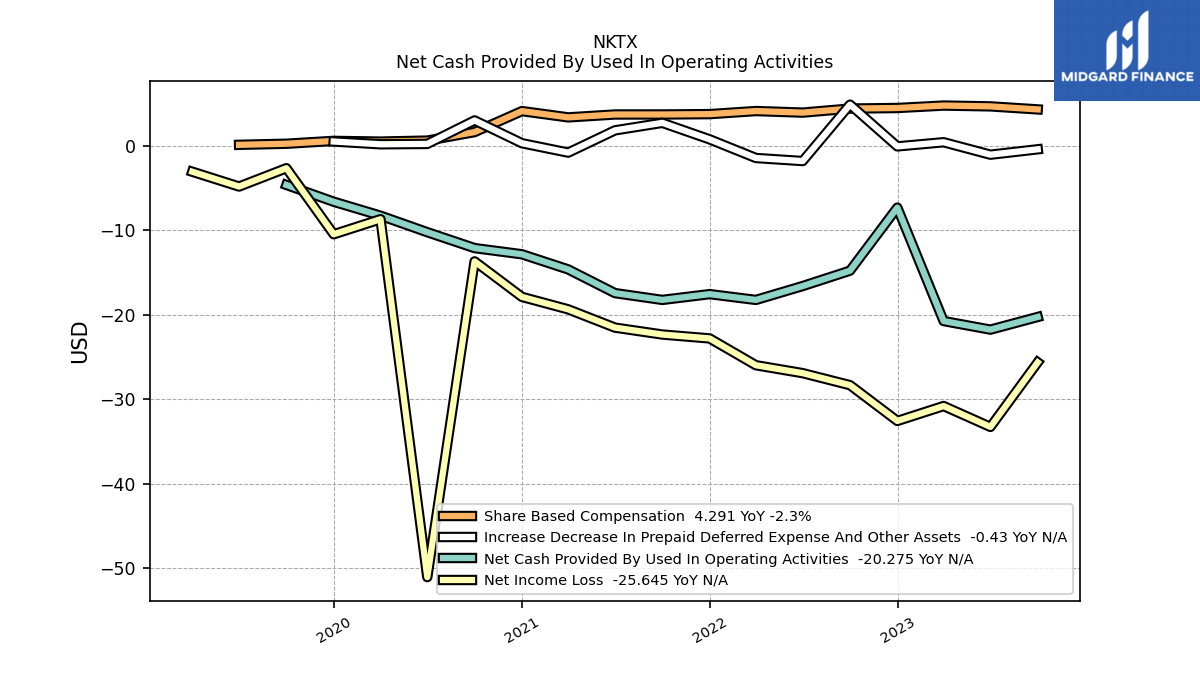
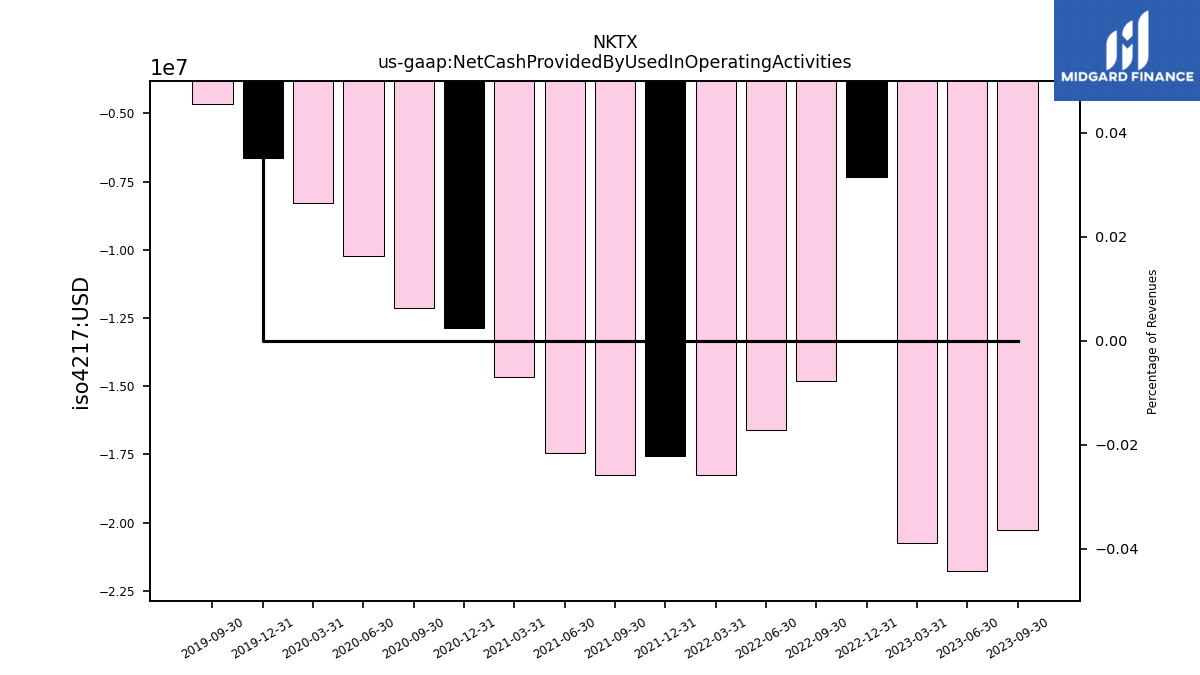
| Net Cash Provided By Used In Operating Activities | -20.27 | -21.77 | -20.76 | -7.33 | -14.80 | -16.61 | -18.26 | -17.57 | -18.26 | -17.45 | -14.65 | -12.85 | -12.12 | -10.24 | -6.64 | |
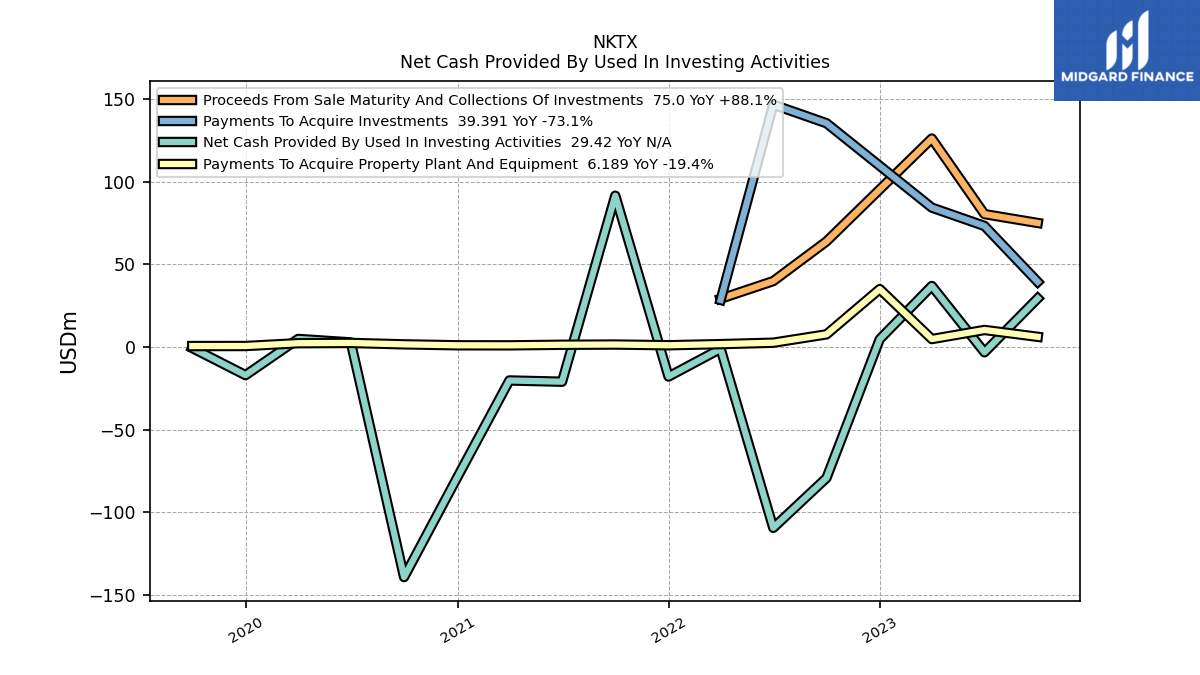
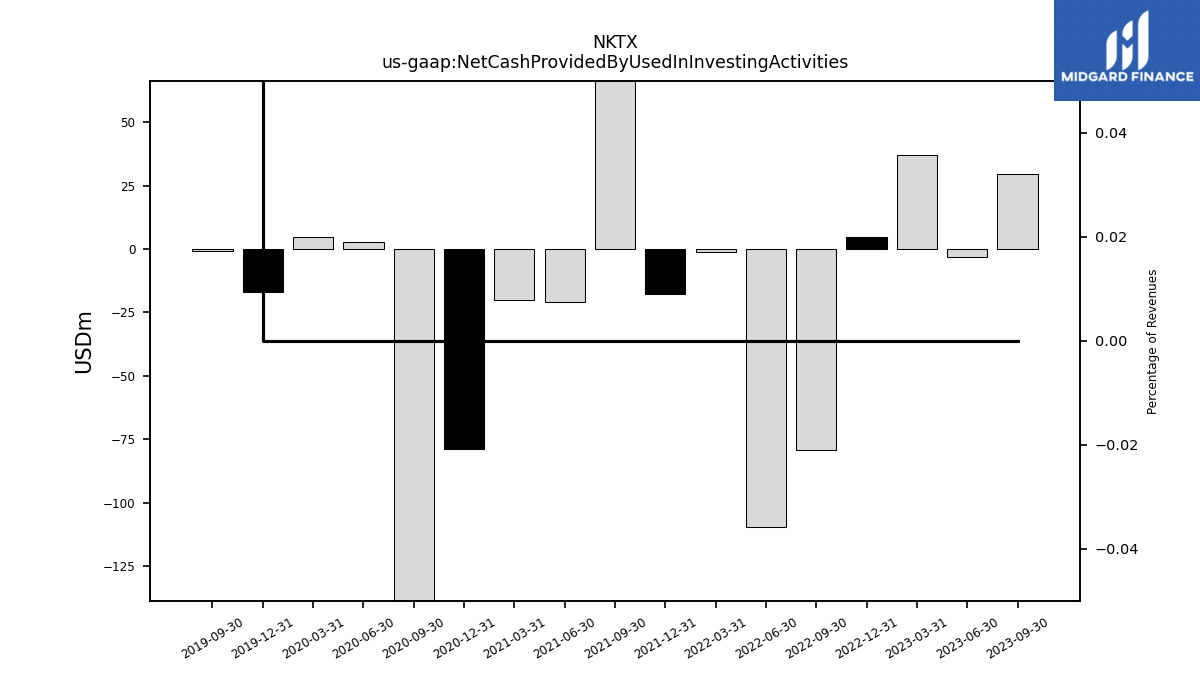
| Net Cash Provided By Used In Investing Activities | 29.42 | -3.17 | 36.93 | 4.75 | -79.11 | -109.30 | -1.03 | -17.84 | 91.51 | -20.95 | -20.19 | -78.72 | -139.07 | 2.81 | -16.99 | |
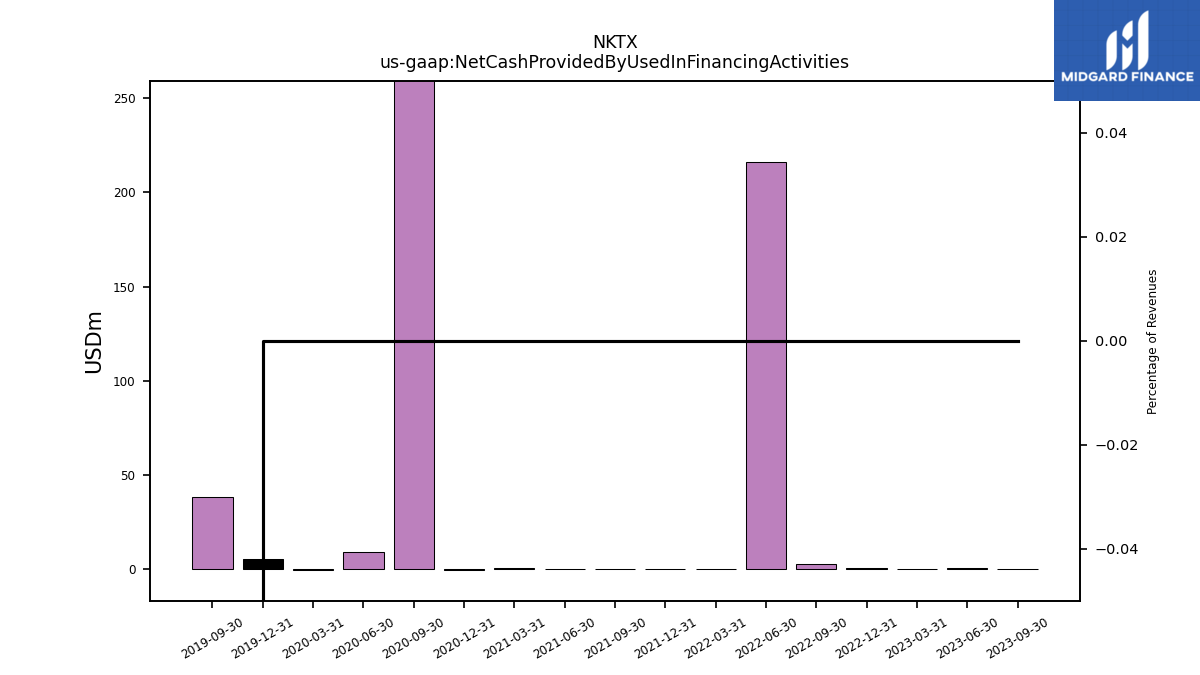
| Net Cash Provided By Used In Financing Activities | 0.00 | 0.40 | 0.00 | 0.42 | 2.56 | 215.94 | 0.08 | 0.00 | 0.19 | 0.26 | 0.76 | -0.30 | 322.01 | 8.81 | 5.14 |
| 2023-09-30 | 2023-06-30 | 2023-03-31 | 2022-12-31 | 2022-09-30 | 2022-06-30 | 2022-03-31 | 2021-12-31 | 2021-09-30 | 2021-06-30 | 2021-03-31 | 2020-12-31 | 2020-09-30 | 2020-06-30 | 2019-12-31 | ||
|---|---|---|---|---|---|---|---|---|---|---|---|---|---|---|---|---|
| Net Cash Provided By Used In Operating Activities | -20.27 | -21.77 | -20.76 | -7.33 | -14.80 | -16.61 | -18.26 | -17.57 | -18.26 | -17.45 | -14.65 | -12.85 | -12.12 | -10.24 | -6.64 | |
| Net Income Loss | -25.64 | -33.29 | -30.82 | -32.58 | -28.34 | -26.92 | -25.99 | -22.81 | -22.35 | -21.54 | -19.37 | -17.90 | -13.69 | -51.07 | -10.49 | |
| Profit Loss | -25.64 | -33.29 | -30.82 | -32.58 | -28.34 | -26.92 | -25.99 | -22.81 | -22.35 | -21.54 | -19.37 | -17.90 | -13.69 | -51.07 | -10.49 | |
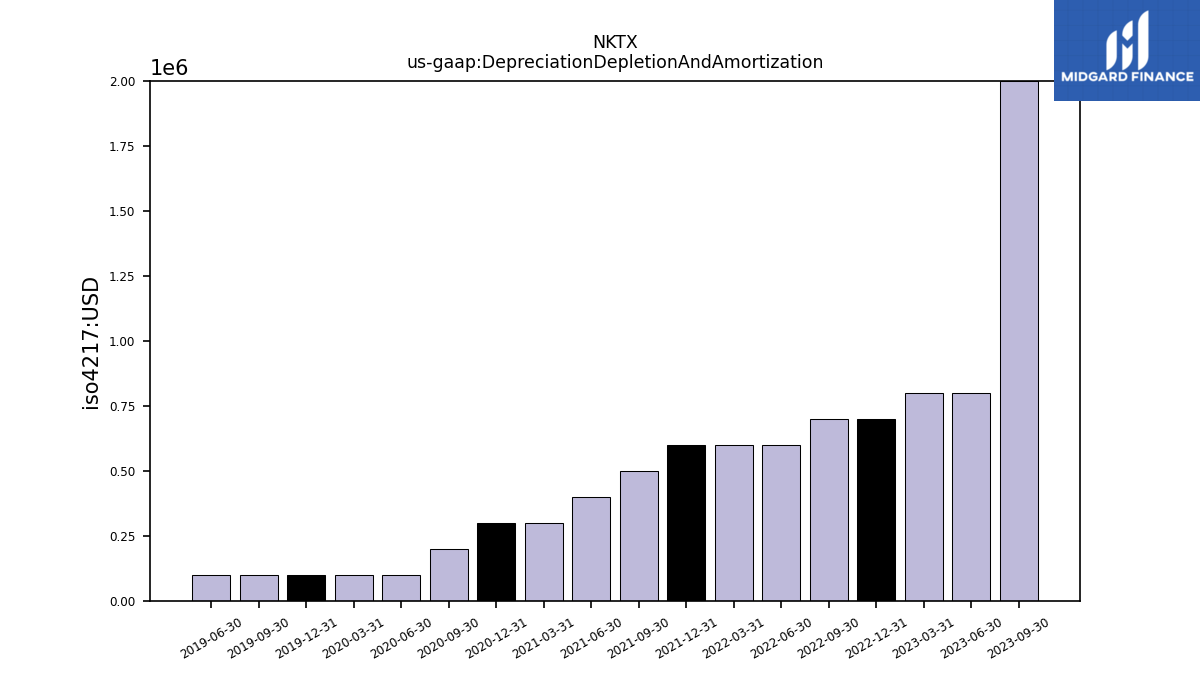
| Depreciation Depletion And Amortization | 2.00 | 0.80 | 0.80 | 0.70 | 0.70 | 0.60 | 0.60 | 0.60 | 0.50 | 0.40 | 0.30 | 0.30 | 0.20 | 0.10 | 0.10 | |
| Share Based Compensation | 4.29 | 4.65 | 4.75 | 4.46 | 4.39 | 3.91 | 4.10 | 3.73 | 3.69 | 3.69 | 3.35 | 4.09 | 1.61 | 0.60 | 0.56 |
| 2023-09-30 | 2023-06-30 | 2023-03-31 | 2022-12-31 | 2022-09-30 | 2022-06-30 | 2022-03-31 | 2021-12-31 | 2021-09-30 | 2021-06-30 | 2021-03-31 | 2020-12-31 | 2020-09-30 | 2020-06-30 | 2019-12-31 | ||
|---|---|---|---|---|---|---|---|---|---|---|---|---|---|---|---|---|
| Net Cash Provided By Used In Investing Activities | 29.42 | -3.17 | 36.93 | 4.75 | -79.11 | -109.30 | -1.03 | -17.84 | 91.51 | -20.95 | -20.19 | -78.72 | -139.07 | 2.81 | -16.99 | |
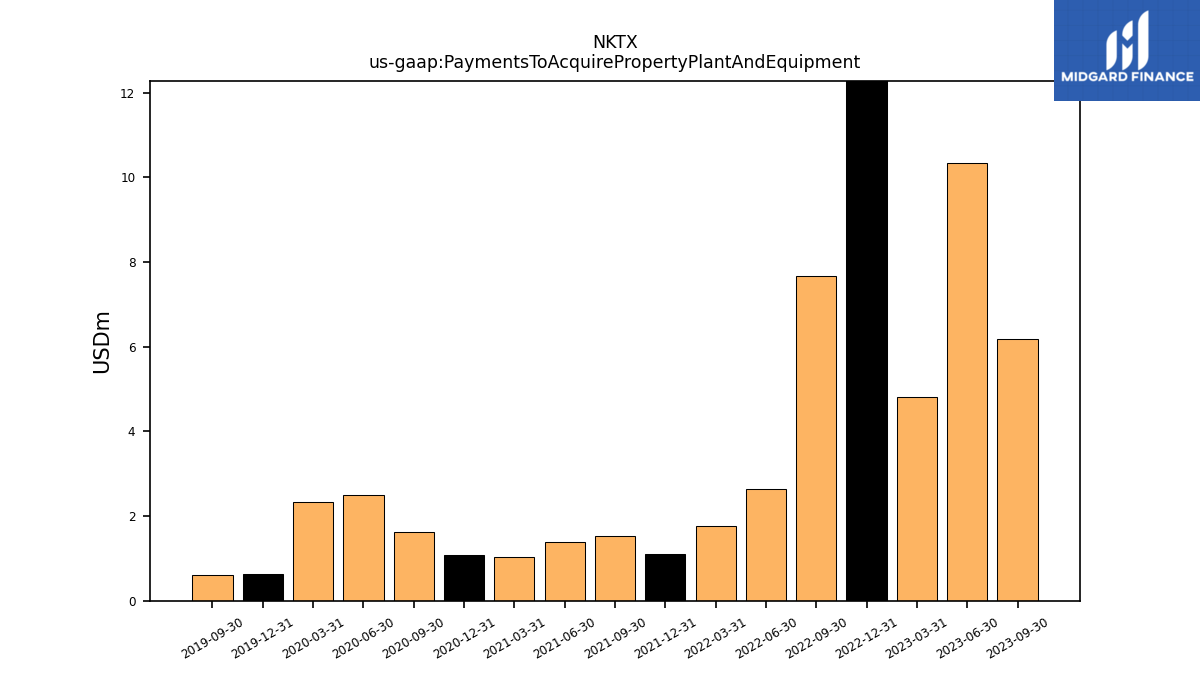
| Payments To Acquire Property Plant And Equipment | 6.19 | 10.33 | 4.82 | 35.04 | 7.67 | 2.63 | 1.77 | 1.09 | 1.52 | 1.38 | 1.03 | 1.07 | 1.63 | 2.49 | 0.62 | |
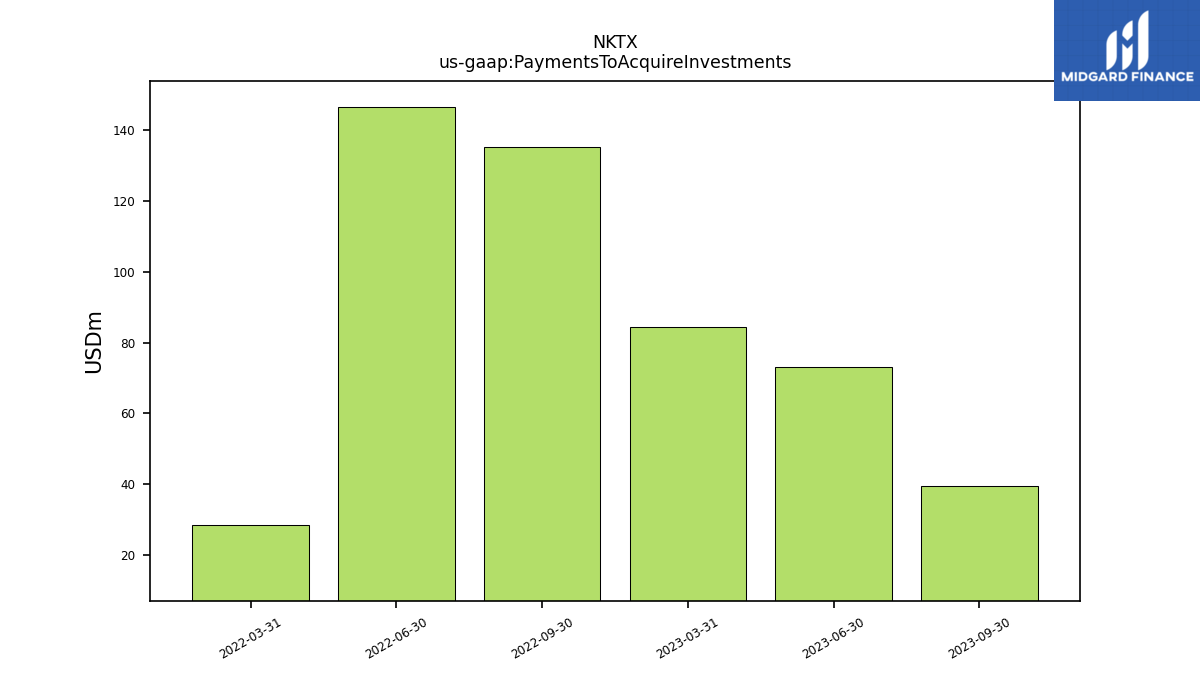
| Payments To Acquire Investments | 39.39 | 73.20 | 84.29 | NA | 135.30 | 146.54 | 28.47 | NA | NA | NA | NA | NA | NA | NA | NA |
| 2023-09-30 | 2023-06-30 | 2023-03-31 | 2022-12-31 | 2022-09-30 | 2022-06-30 | 2022-03-31 | 2021-12-31 | 2021-09-30 | 2021-06-30 | 2021-03-31 | 2020-12-31 | 2020-09-30 | 2020-06-30 | 2019-12-31 | ||
|---|---|---|---|---|---|---|---|---|---|---|---|---|---|---|---|---|
| Net Cash Provided By Used In Financing Activities | 0.00 | 0.40 | 0.00 | 0.42 | 2.56 | 215.94 | 0.08 | 0.00 | 0.19 | 0.26 | 0.76 | -0.30 | 322.01 | 8.81 | 5.14 |


