
| 2023-09-30 | 2023-06-30 | 2023-03-31 | 2022-09-30 | 2022-06-30 | 2022-03-31 | ||
|---|---|---|---|---|---|---|---|
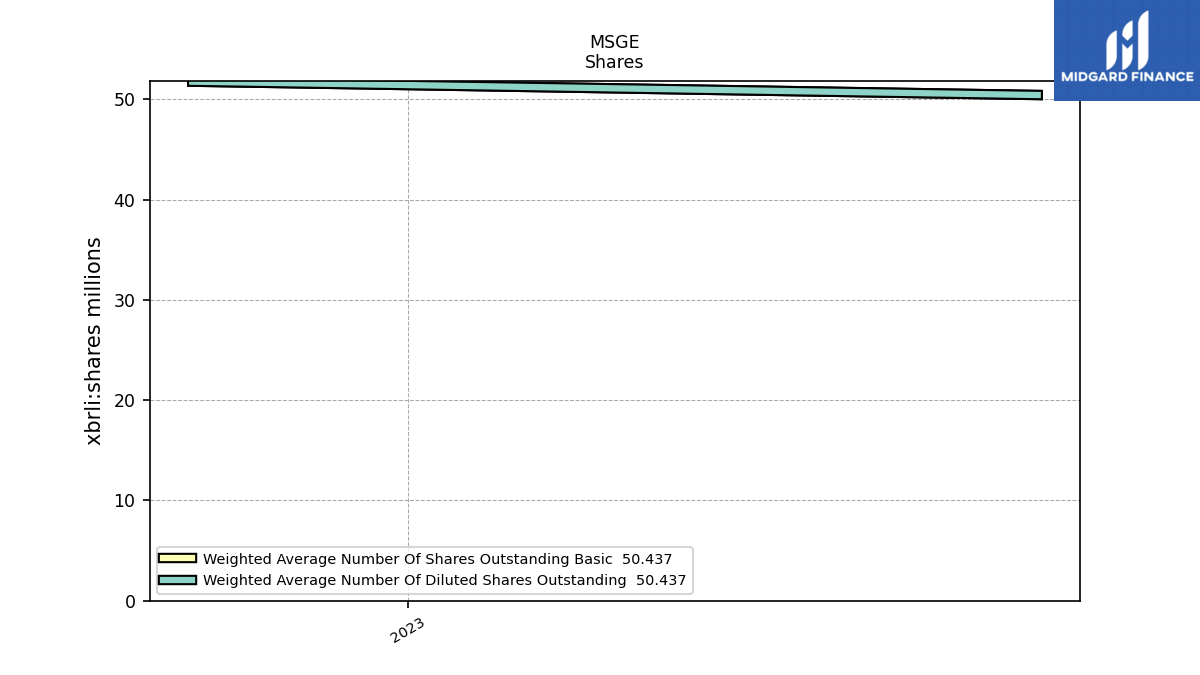
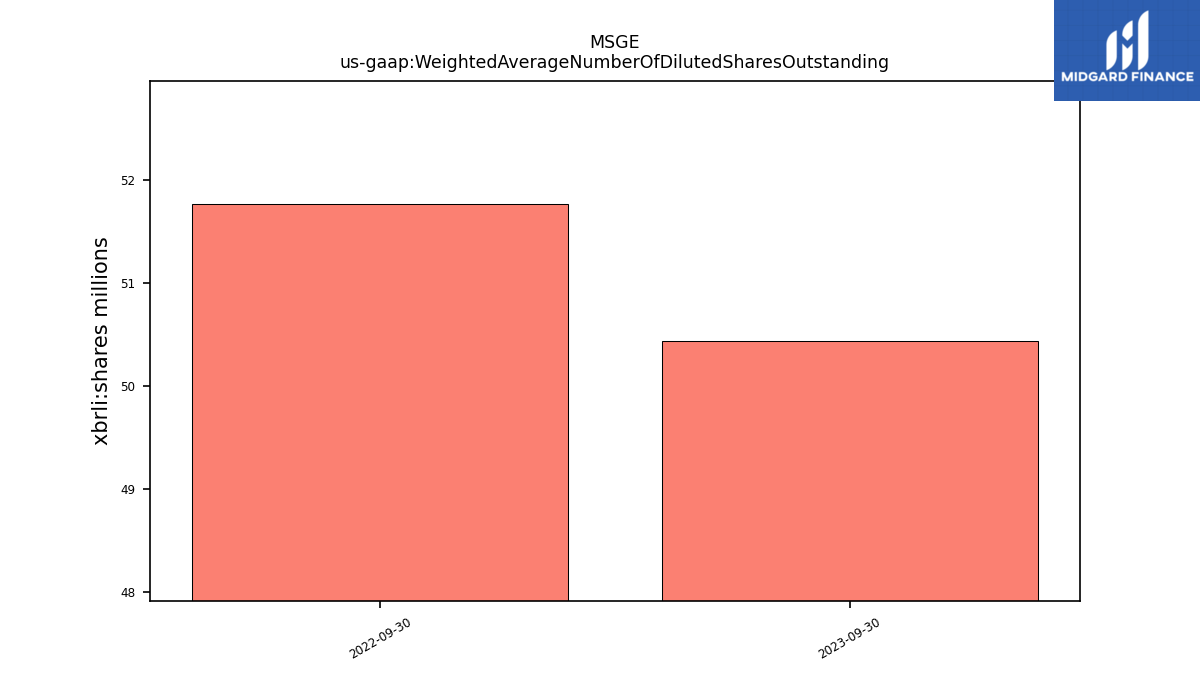
| Weighted Average Number Of Diluted Shares Outstanding | 50.44 | NA | NA | 51.77 | NA | NA | |
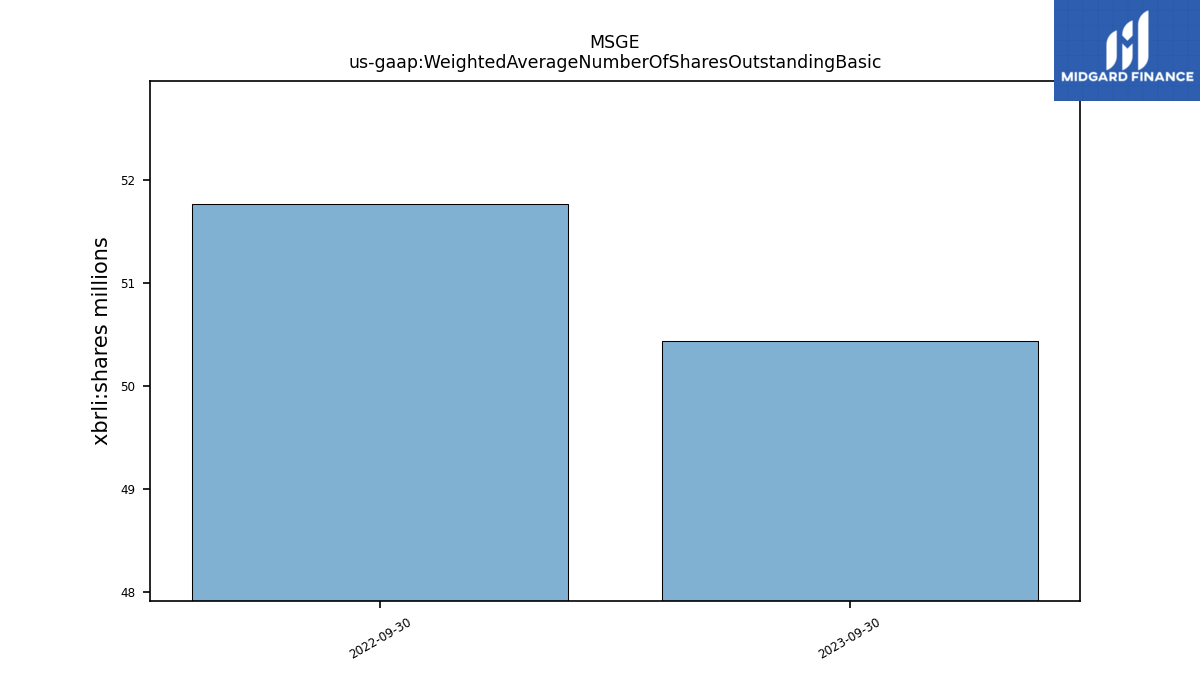
| Weighted Average Number Of Shares Outstanding Basic | 50.44 | NA | NA | 51.77 | NA | NA | |
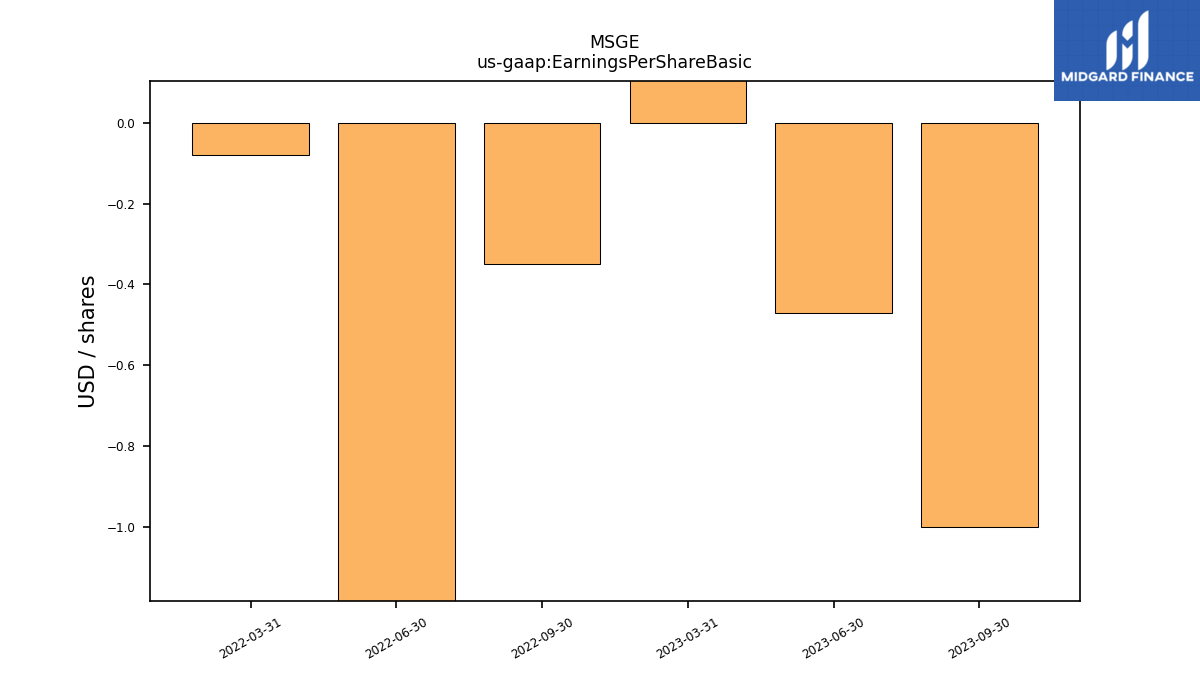
| Earnings Per Share Basic | -1.00 | -0.47 | 0.42 | -0.35 | -1.38 | -0.08 | |
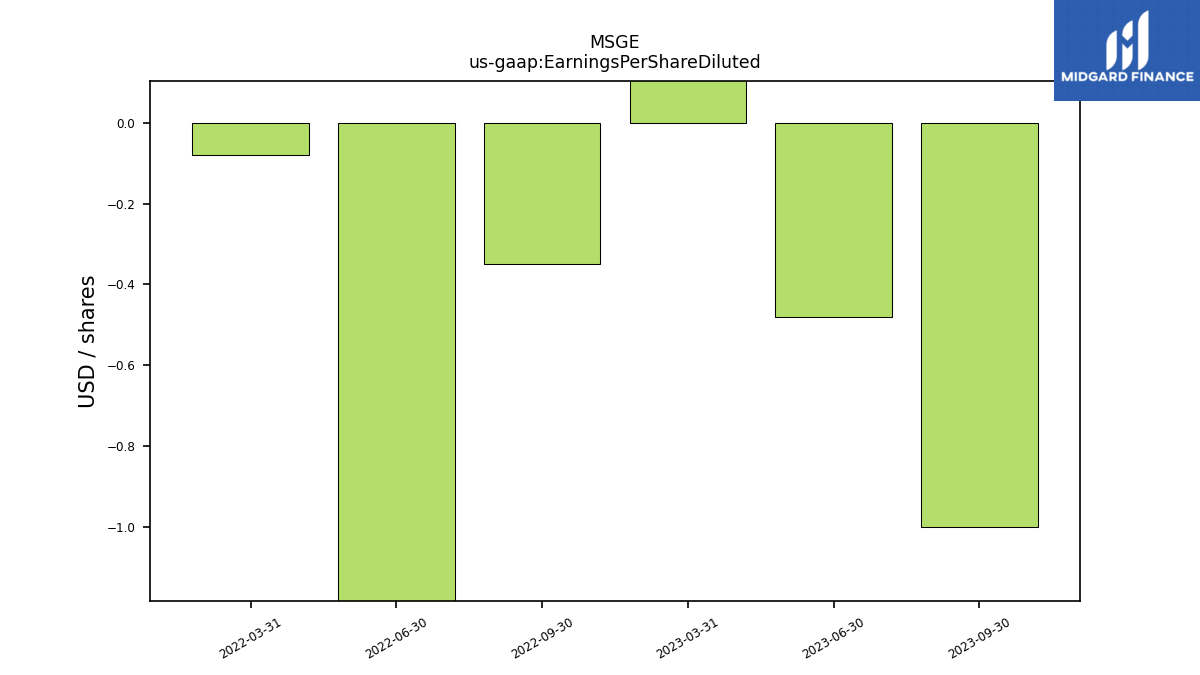
| Earnings Per Share Diluted | -1.00 | -0.48 | 0.42 | -0.35 | -1.38 | -0.08 |
| 2023-09-30 | 2023-06-30 | 2023-03-31 | 2022-09-30 | 2022-06-30 | 2022-03-31 | ||
|---|---|---|---|---|---|---|---|
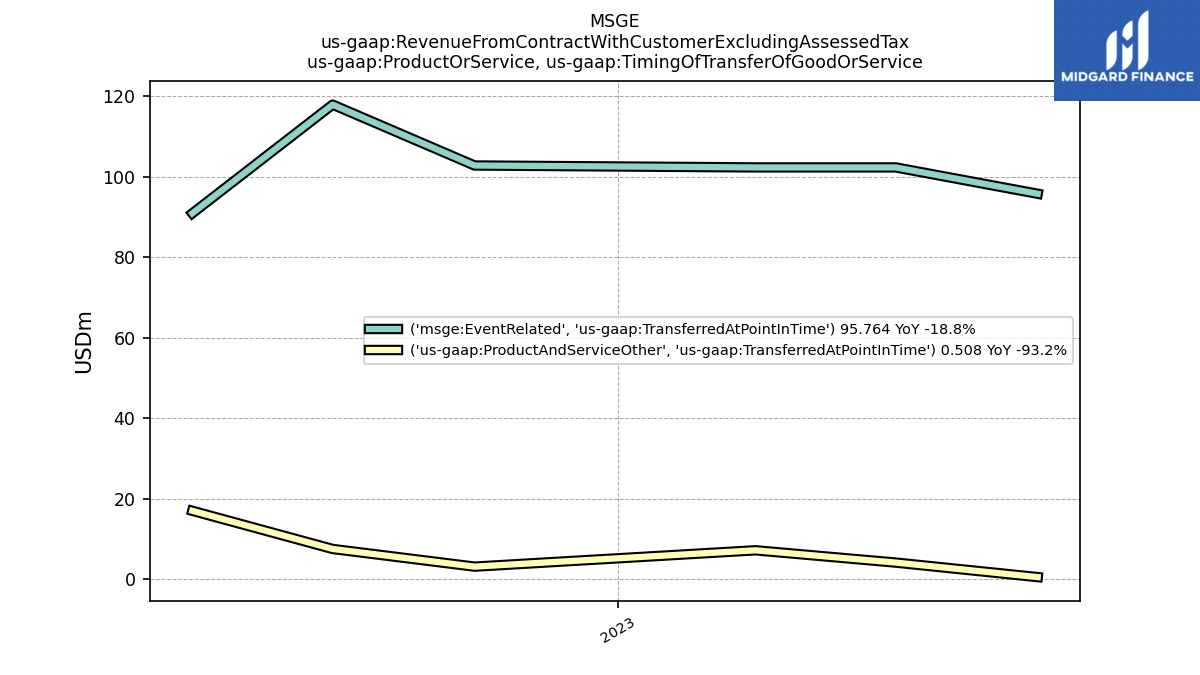
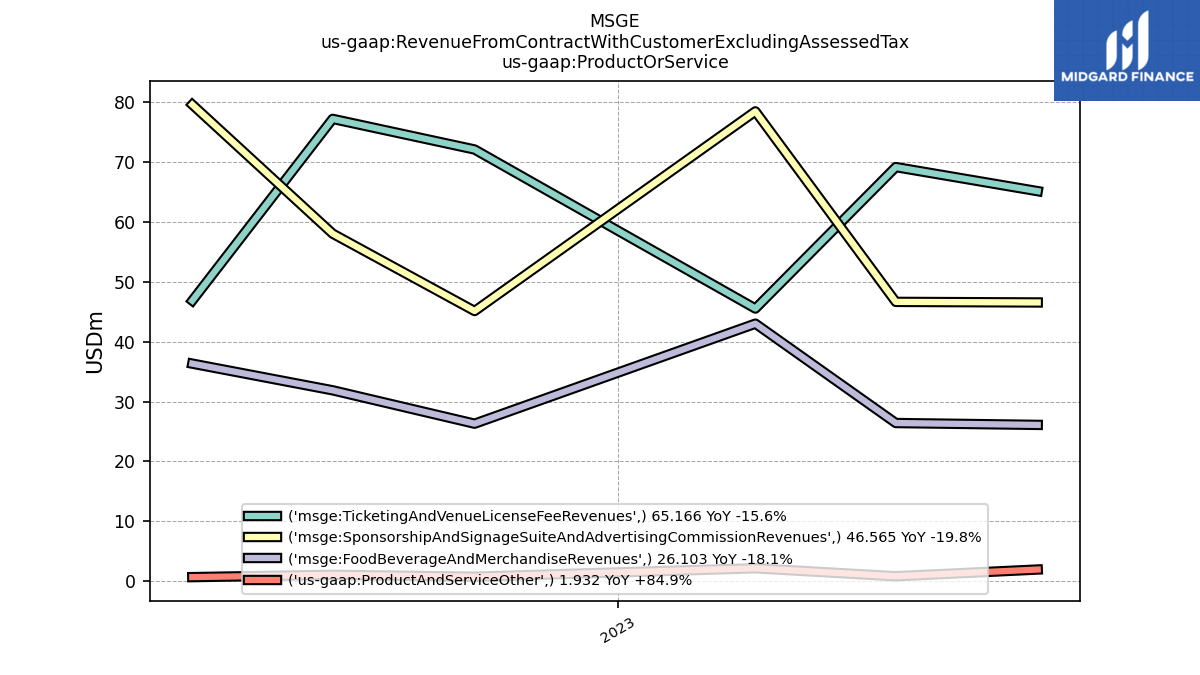
| Revenue From Contract With Customer Excluding Assessed Tax | 139.77 | 143.08 | 169.21 | 144.30 | 168.24 | 163.50 | |
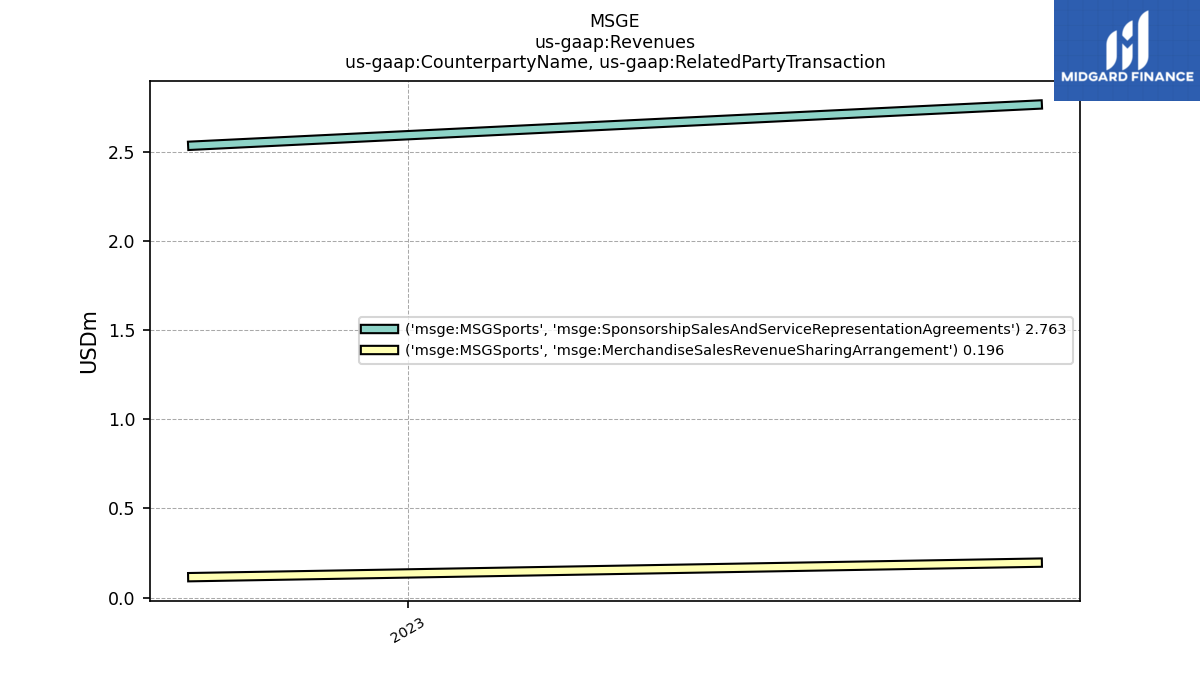
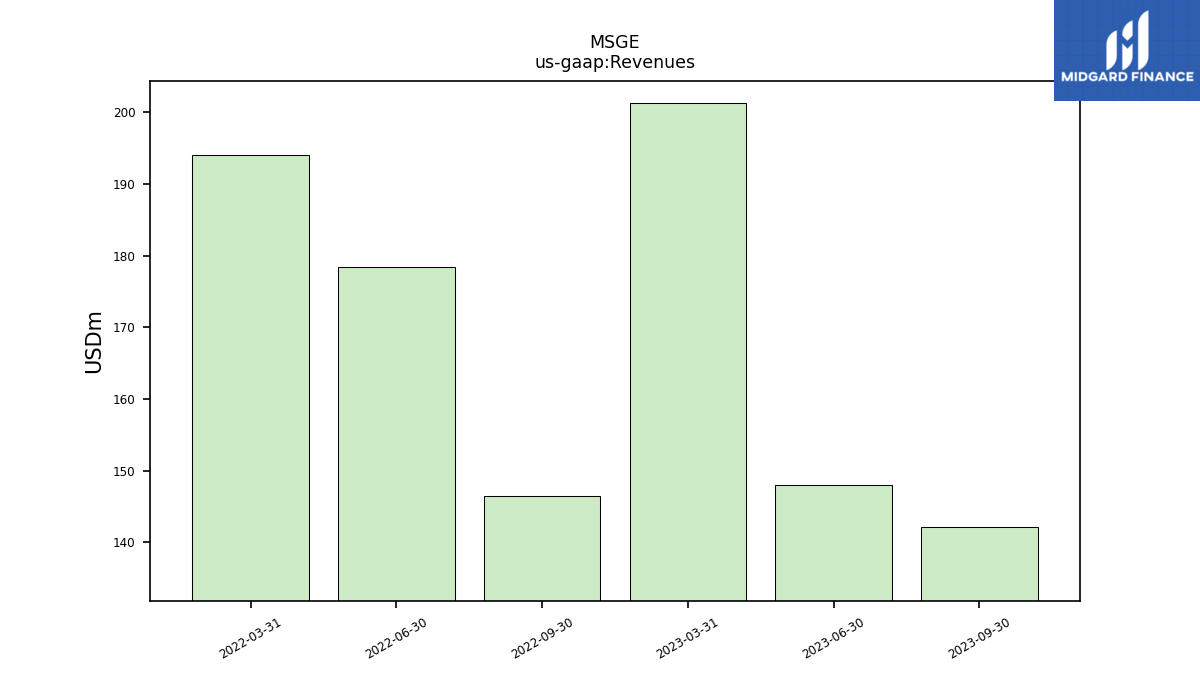
| Revenues | 142.21 | 147.94 | 201.23 | 146.45 | 178.34 | 193.99 | |
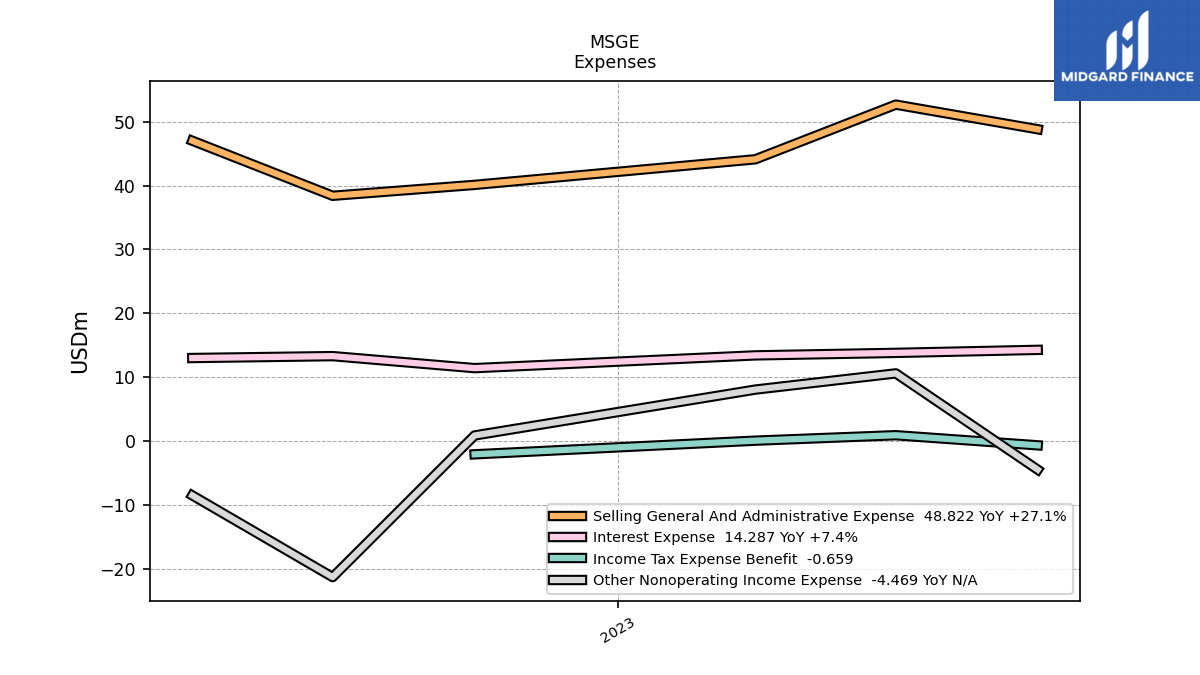
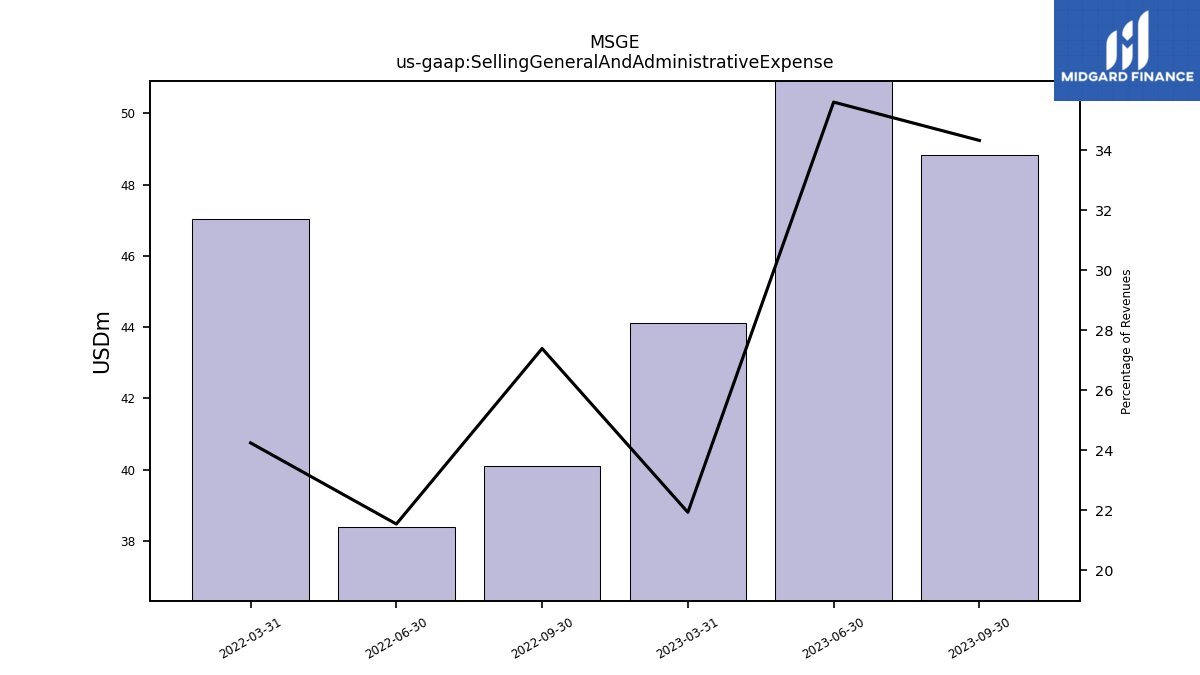
| Selling General And Administrative Expense | 48.82 | 52.68 | 44.12 | 40.11 | 38.41 | 47.03 | |
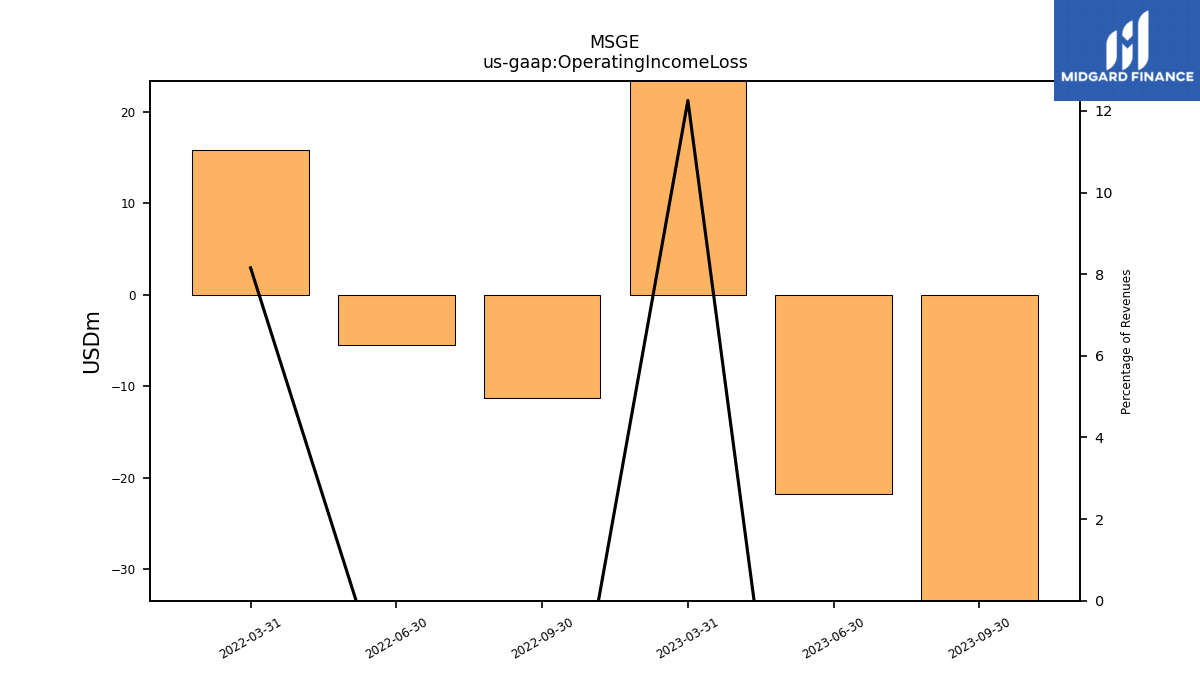
| Operating Income Loss | -33.42 | -21.79 | 24.66 | -11.31 | -5.54 | 15.82 | |
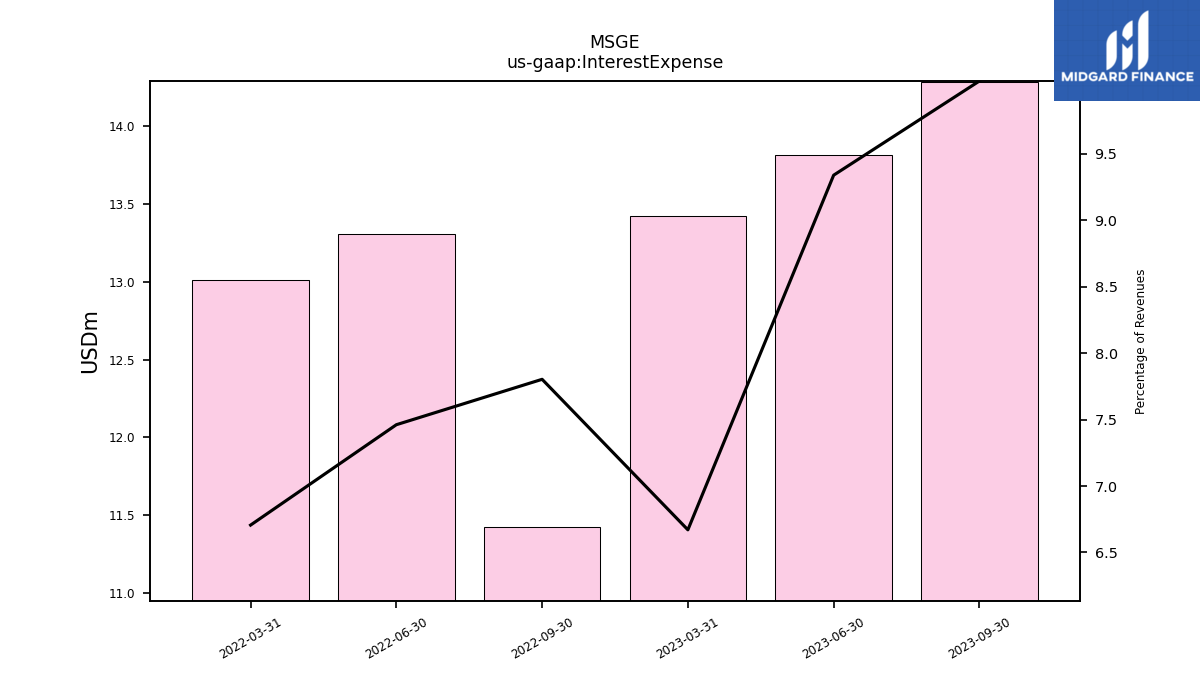
| Interest Expense | 14.29 | 13.81 | 13.42 | 11.43 | 13.31 | 13.01 | |
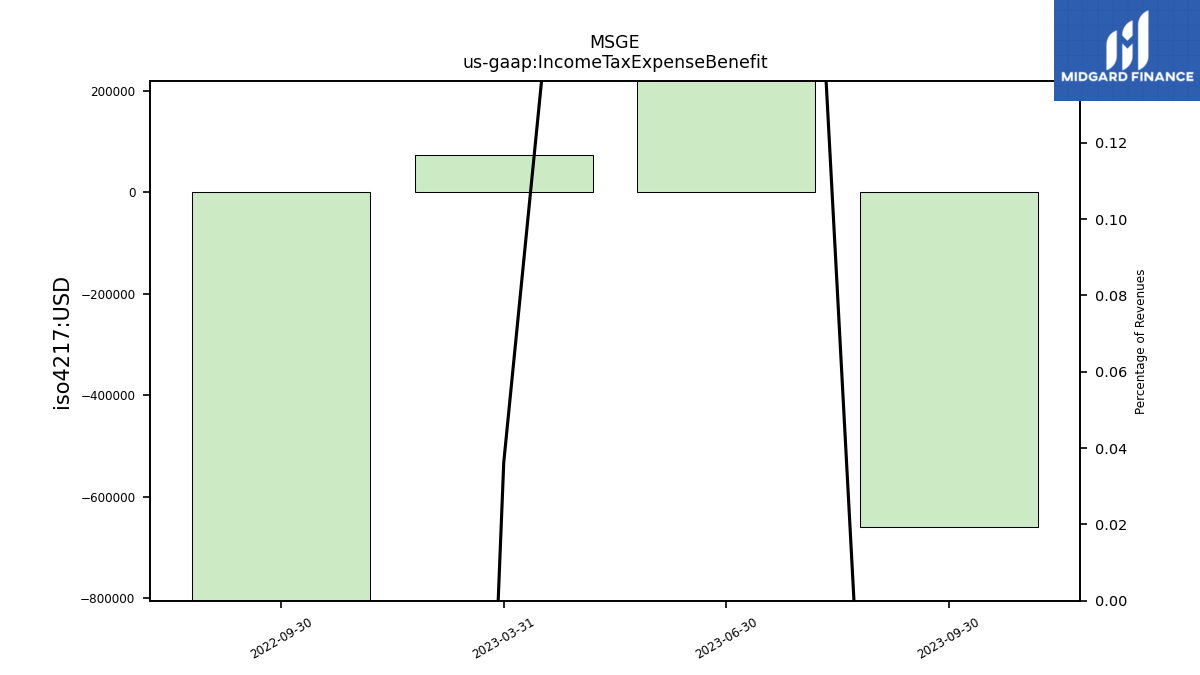
| Income Tax Expense Benefit | -0.66 | 0.92 | 0.07 | -2.07 | NA | NA | |
| Profit Loss | -50.67 | -24.48 | 21.72 | -18.27 | -73.69 | -4.14 | |
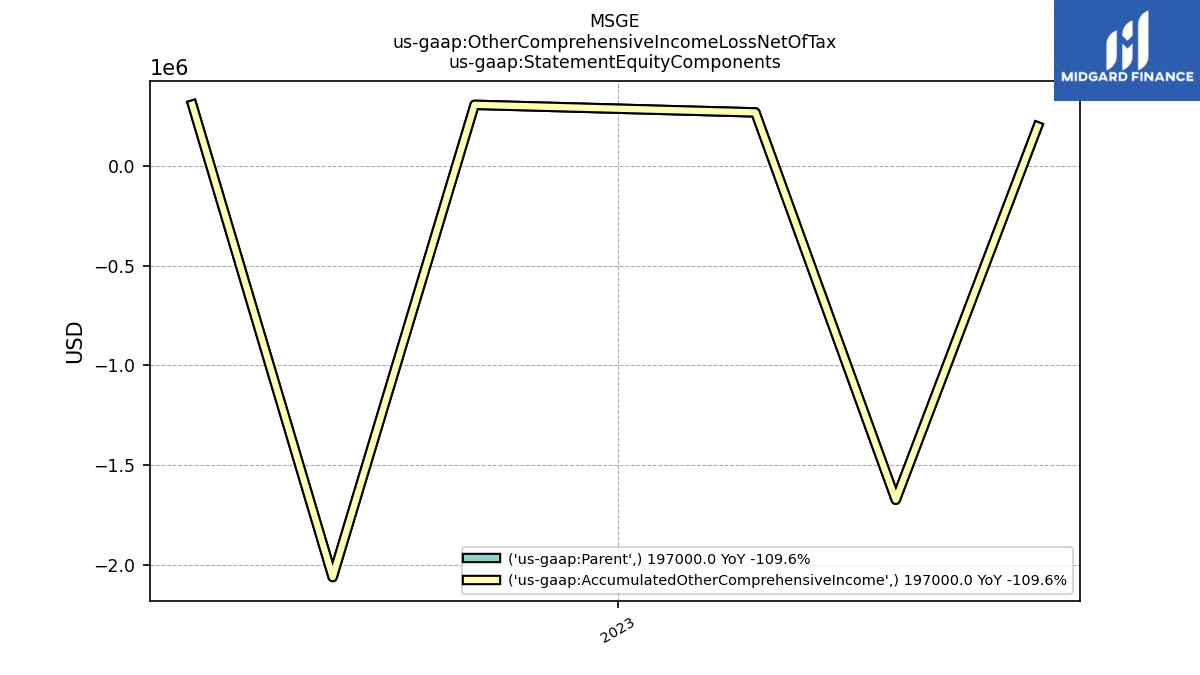
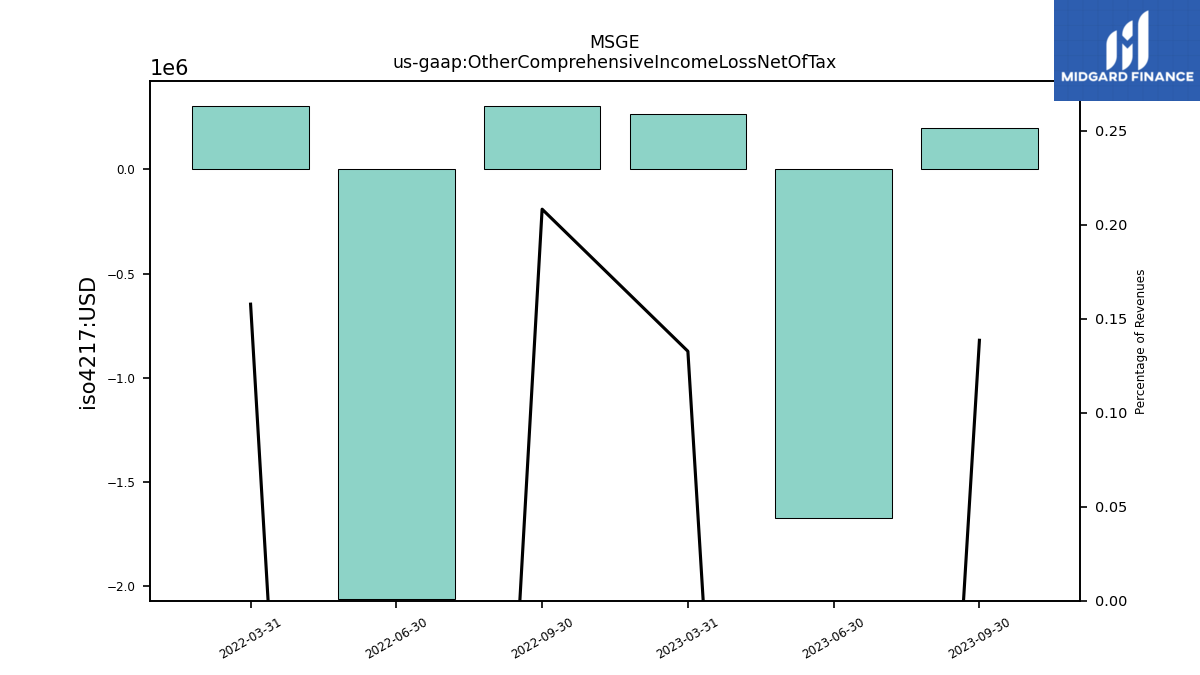
| Other Comprehensive Income Loss Net Of Tax | 0.20 | -1.67 | 0.27 | 0.30 | -2.06 | 0.31 | |
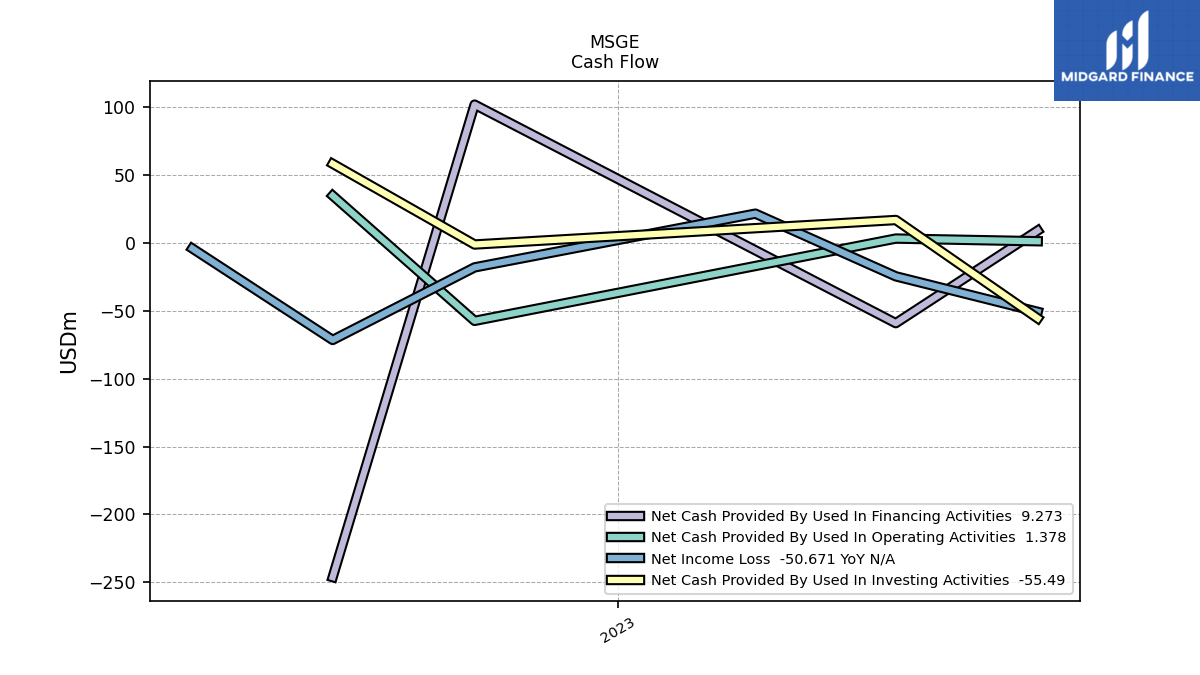
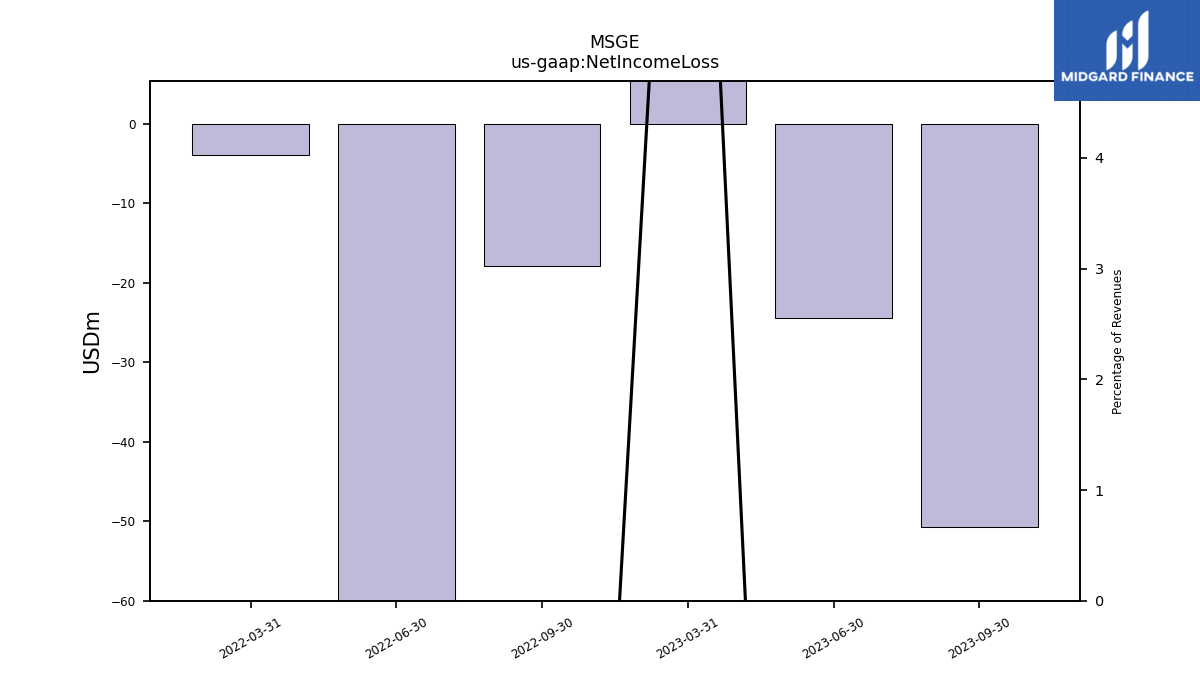
| Net Income Loss | -50.67 | -24.48 | 21.72 | -17.90 | -71.40 | -3.93 | |
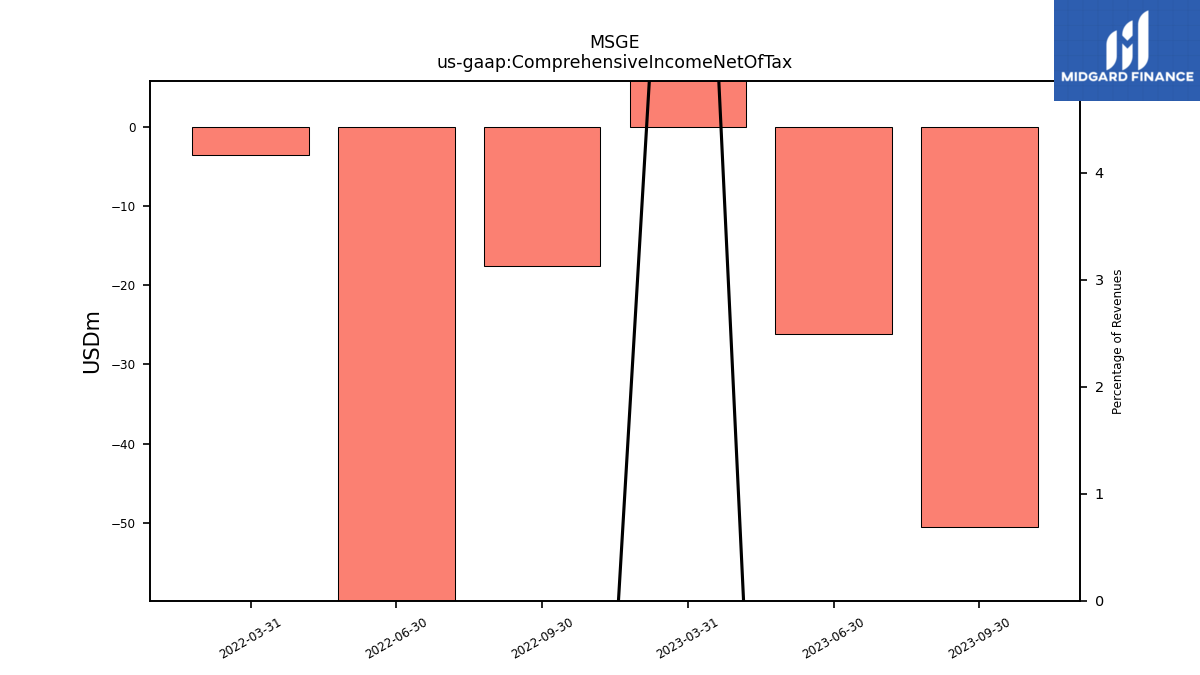
| Comprehensive Income Net Of Tax | -50.47 | -26.16 | 21.99 | -17.60 | -73.46 | -3.62 |
| 2023-09-30 | 2023-06-30 | 2023-03-31 | 2022-09-30 | 2022-06-30 | 2022-03-31 | ||
|---|---|---|---|---|---|---|---|
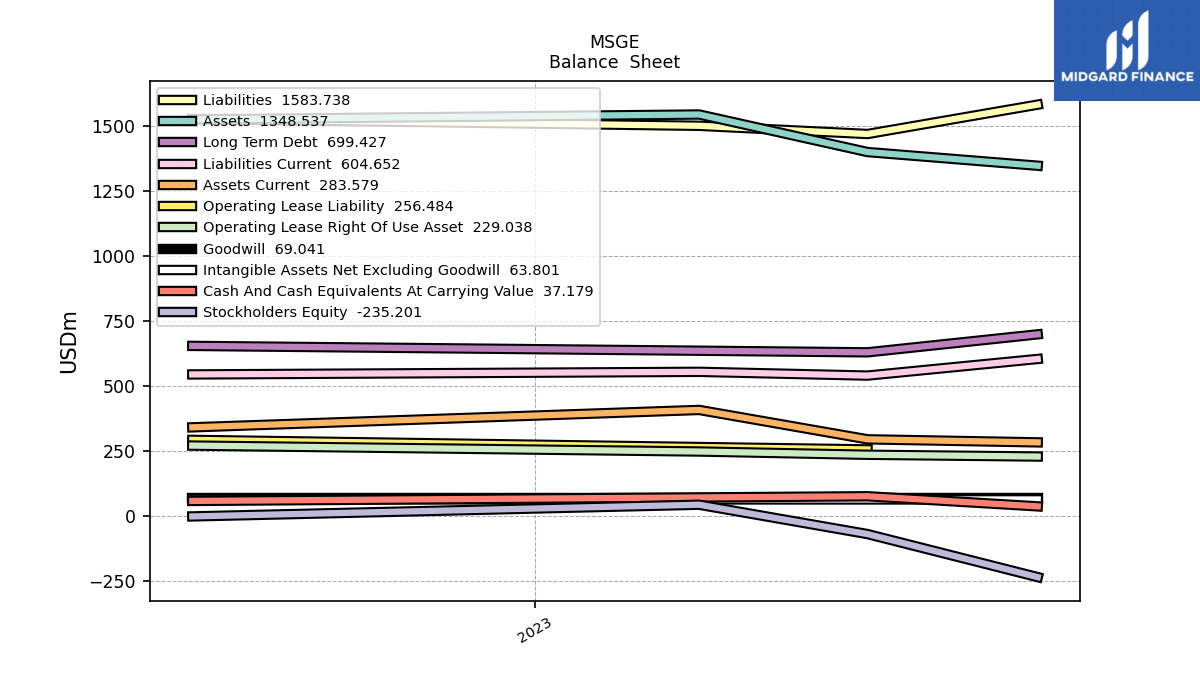
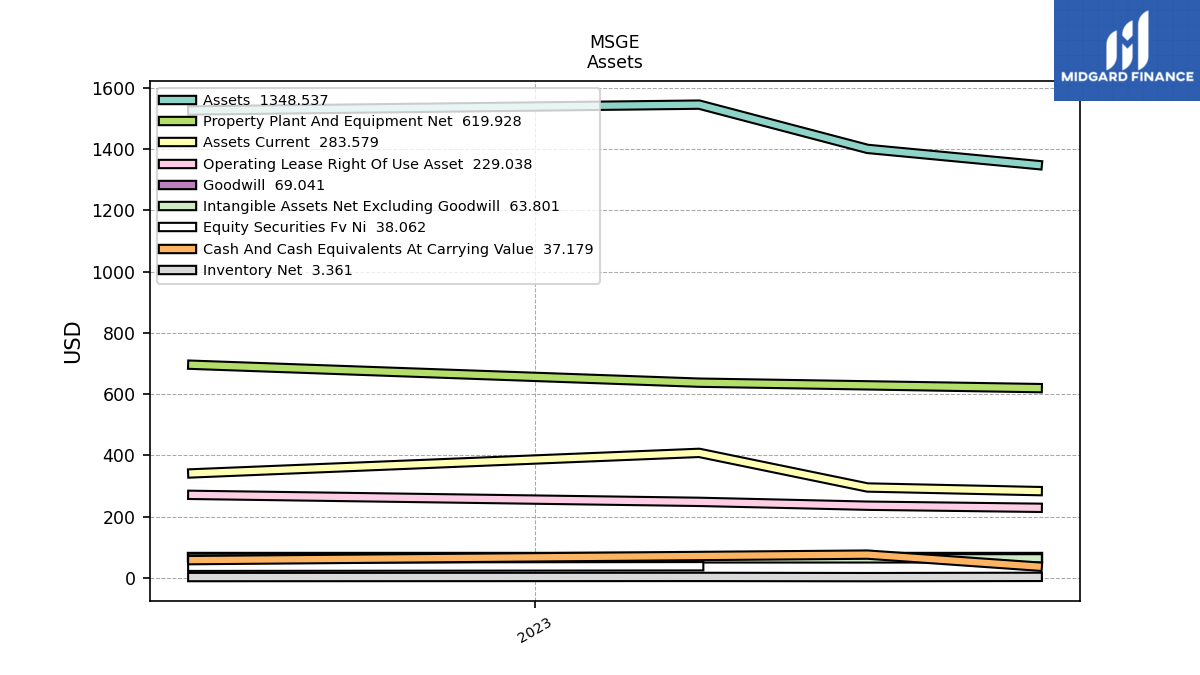
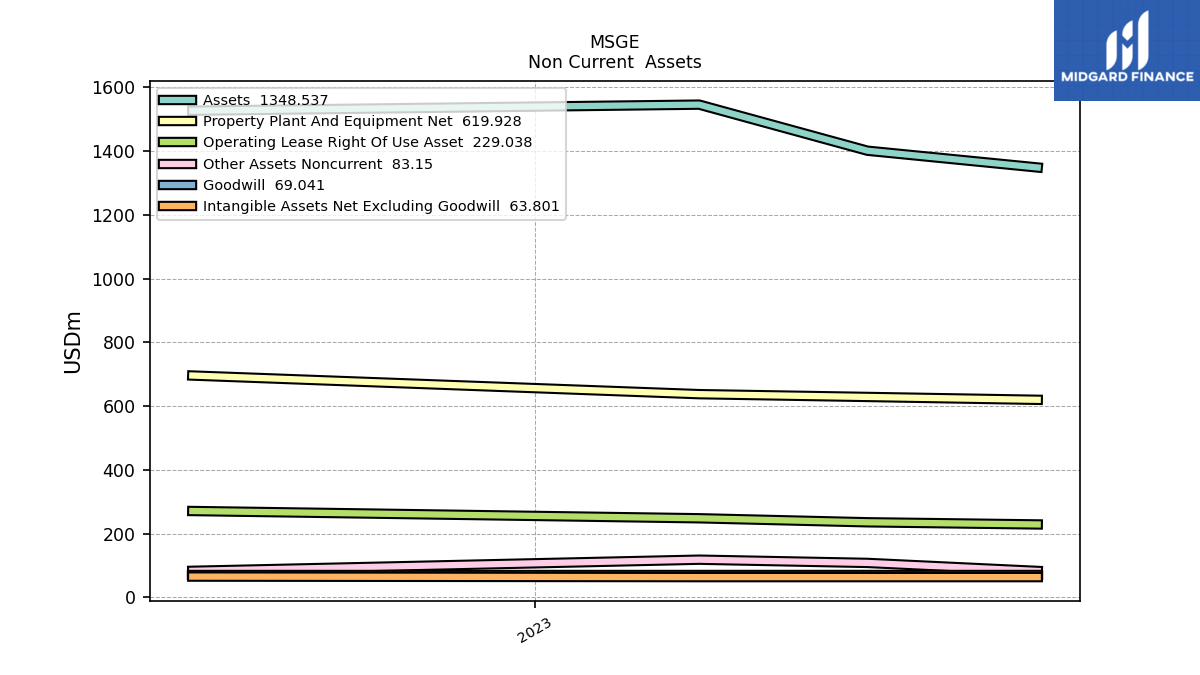
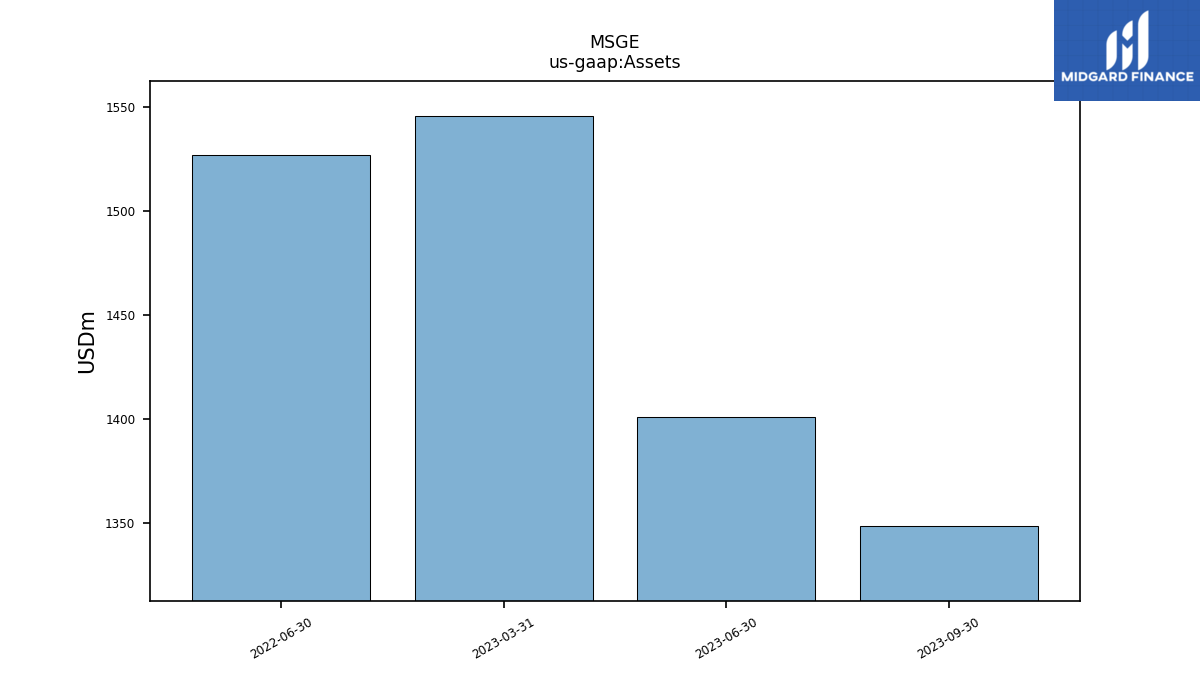
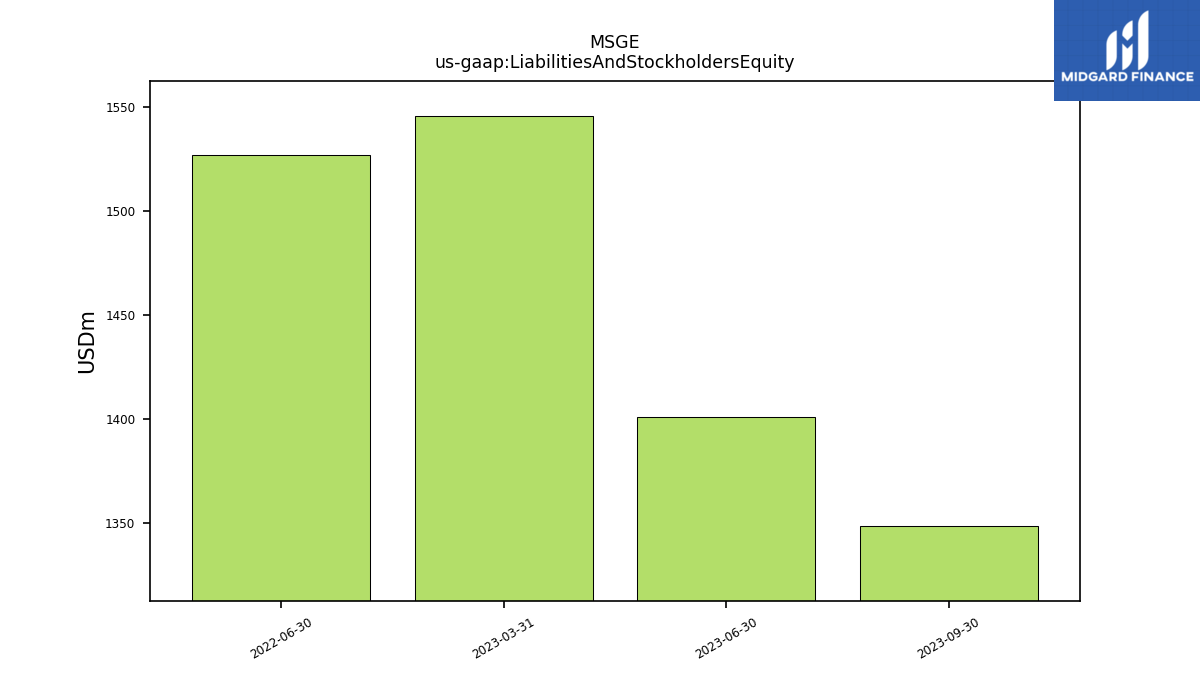
| Assets | 1348.54 | 1401.16 | 1545.73 | NA | 1526.70 | NA | |
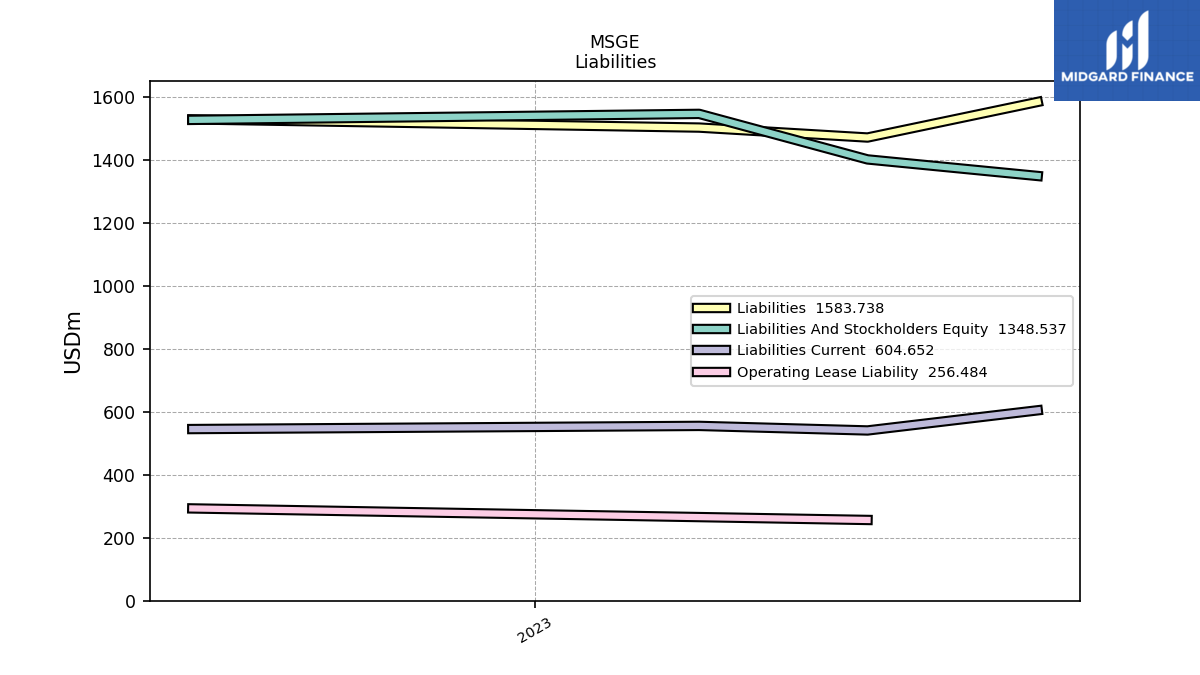
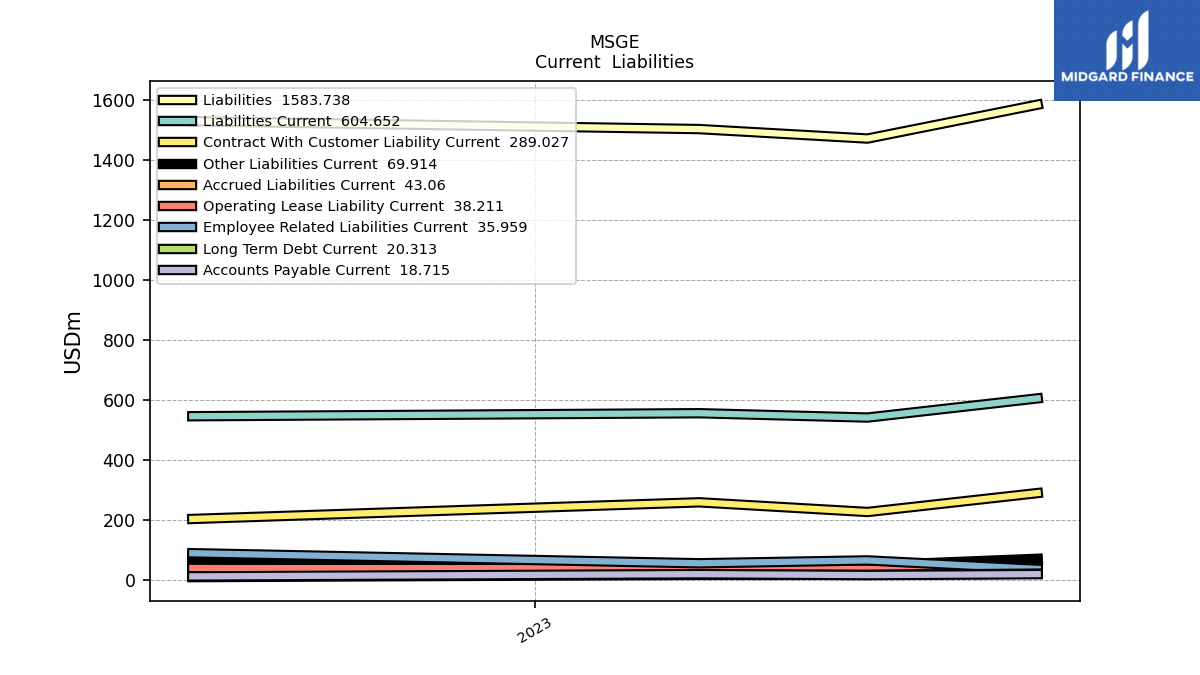
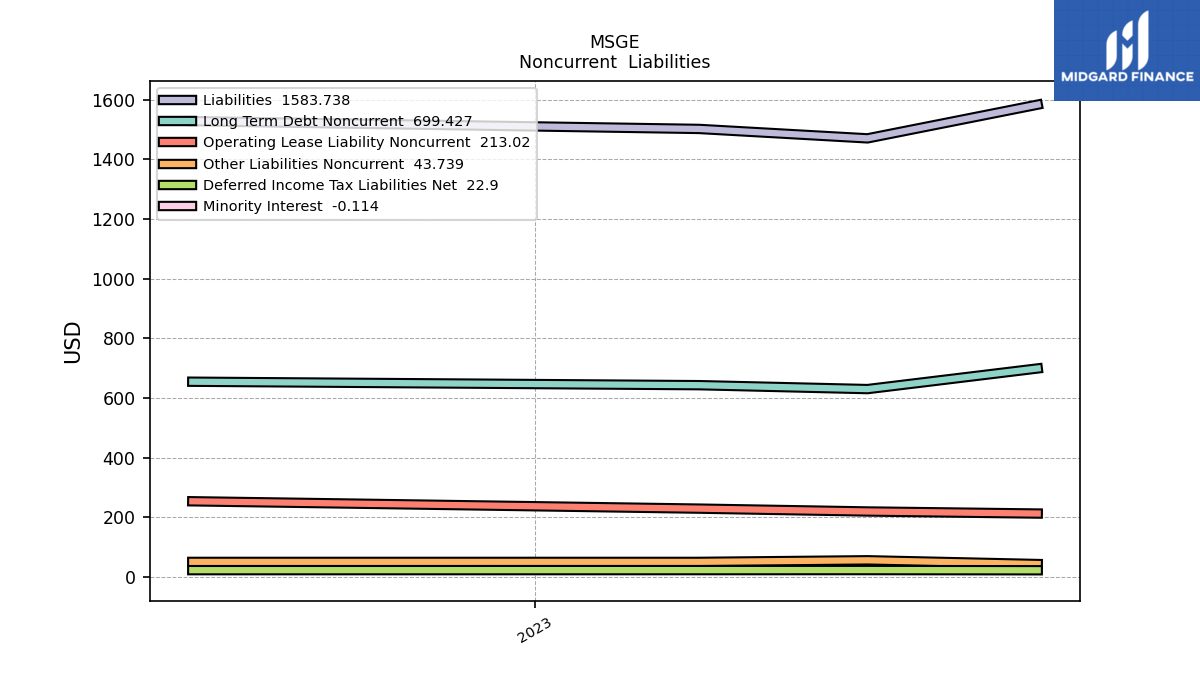
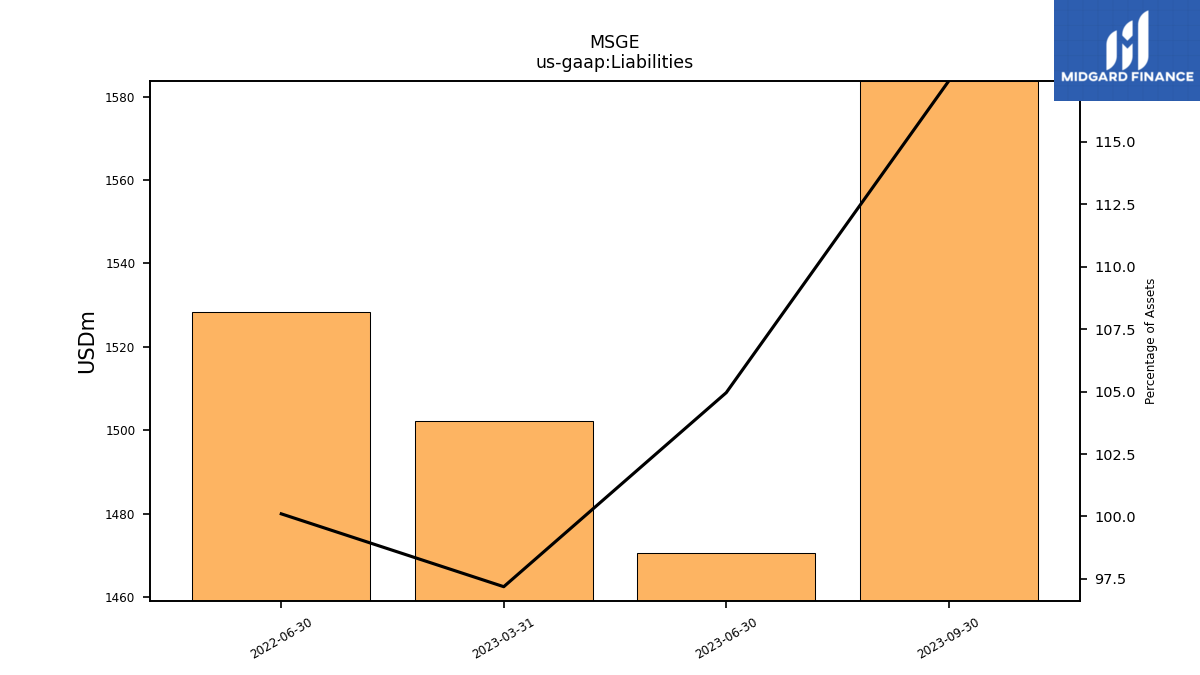
| Liabilities | 1583.74 | 1470.63 | 1502.23 | NA | 1528.29 | NA | |
| Liabilities And Stockholders Equity | 1348.54 | 1401.16 | 1545.73 | NA | 1526.70 | NA | |
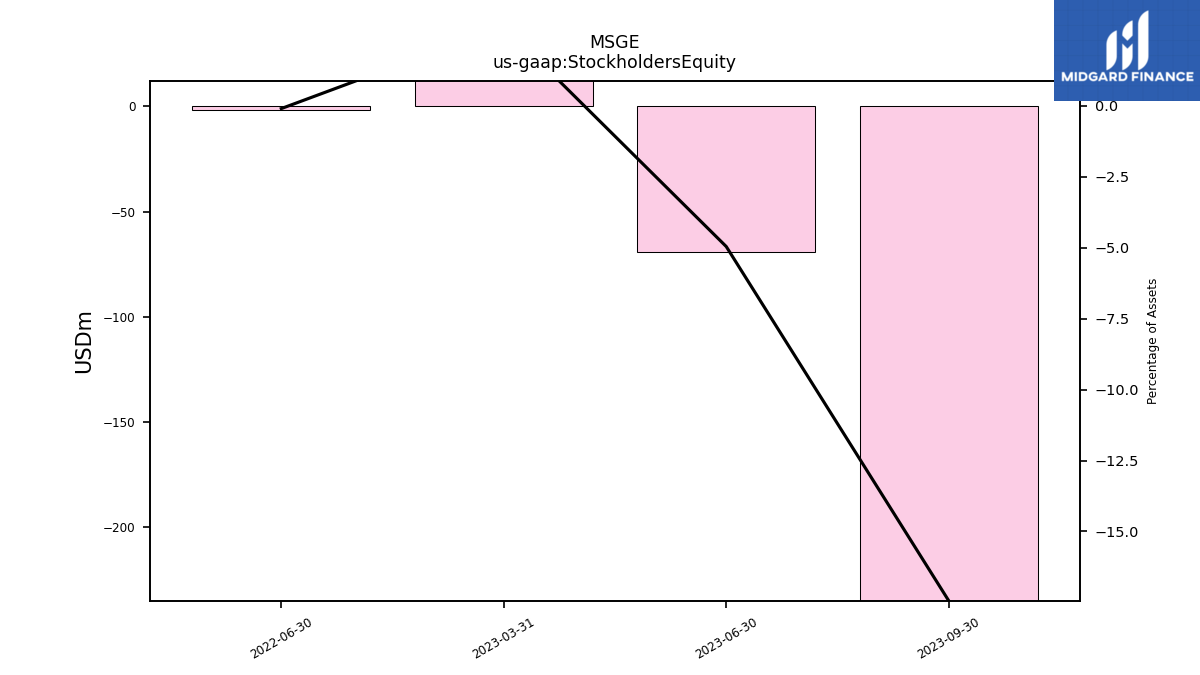
| Stockholders Equity | -235.20 | -69.47 | 43.50 | NA | -1.48 | NA |
| 2023-09-30 | 2023-06-30 | 2023-03-31 | 2022-09-30 | 2022-06-30 | 2022-03-31 | ||
|---|---|---|---|---|---|---|---|
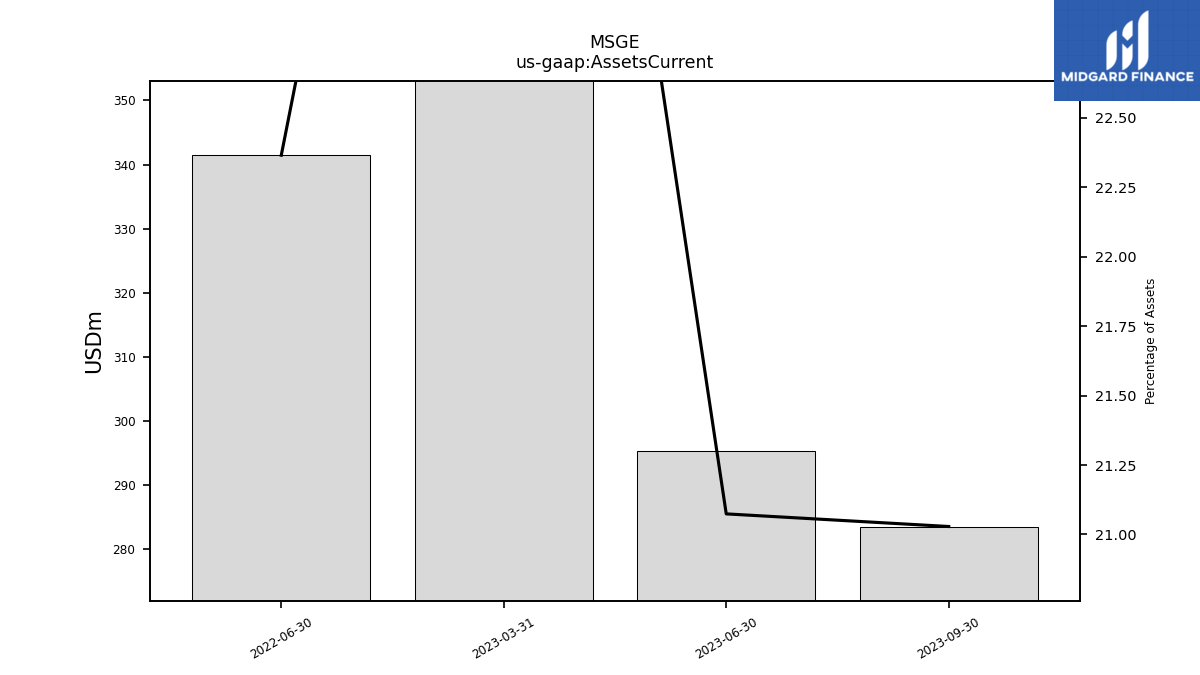
| Assets Current | 283.58 | 295.28 | 408.38 | NA | 341.45 | NA | |
| Cash And Cash Equivalents At Carrying Value | 37.18 | 76.09 | NA | NA | 58.10 | NA | |
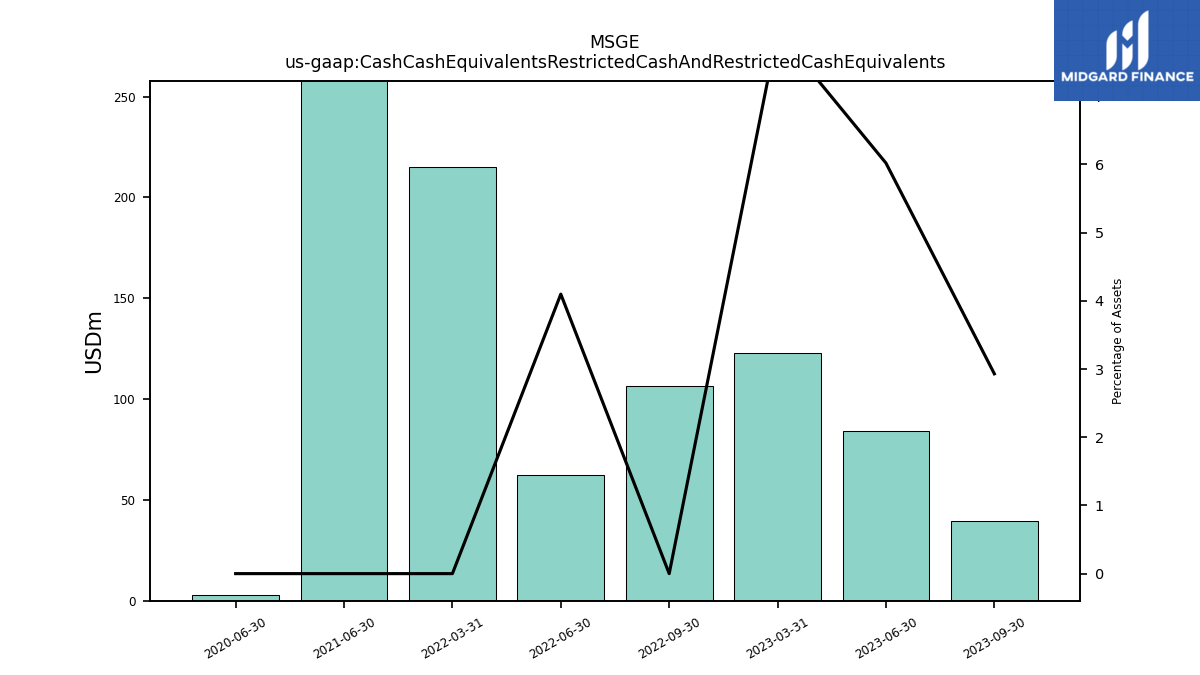
| Cash Cash Equivalents Restricted Cash And Restricted Cash Equivalents | 39.52 | 84.36 | 122.98 | 106.31 | 62.57 | 215.31 | |
| Accounts Receivable Net Current | 100.20 | 63.90 | 130.64 | NA | 102.50 | NA | |
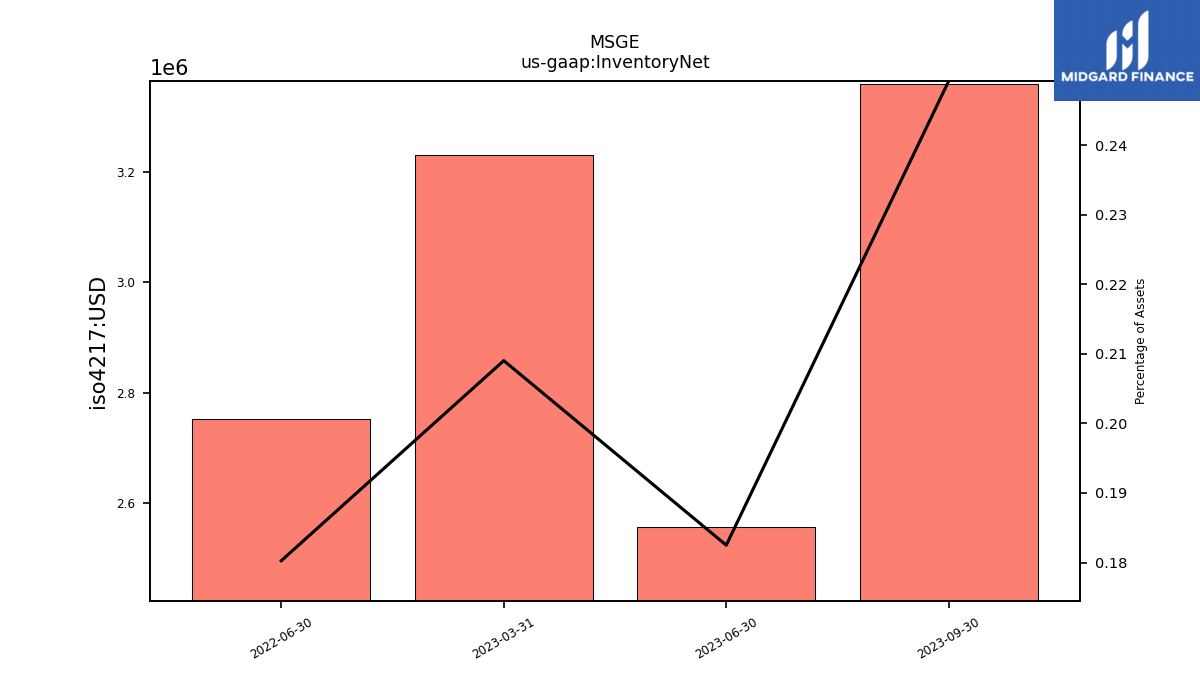
| Inventory Net | 3.36 | 2.56 | 3.23 | NA | 2.75 | NA | |
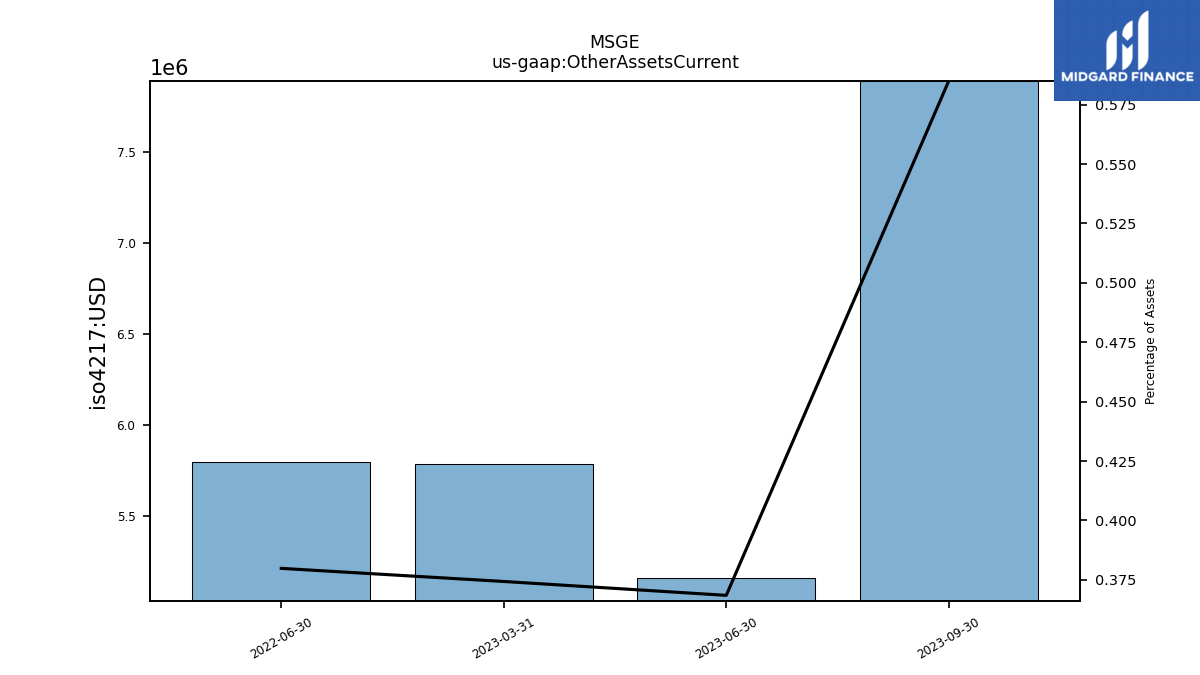
| Other Assets Current | 7.89 | 5.16 | 5.79 | NA | 5.80 | NA | |
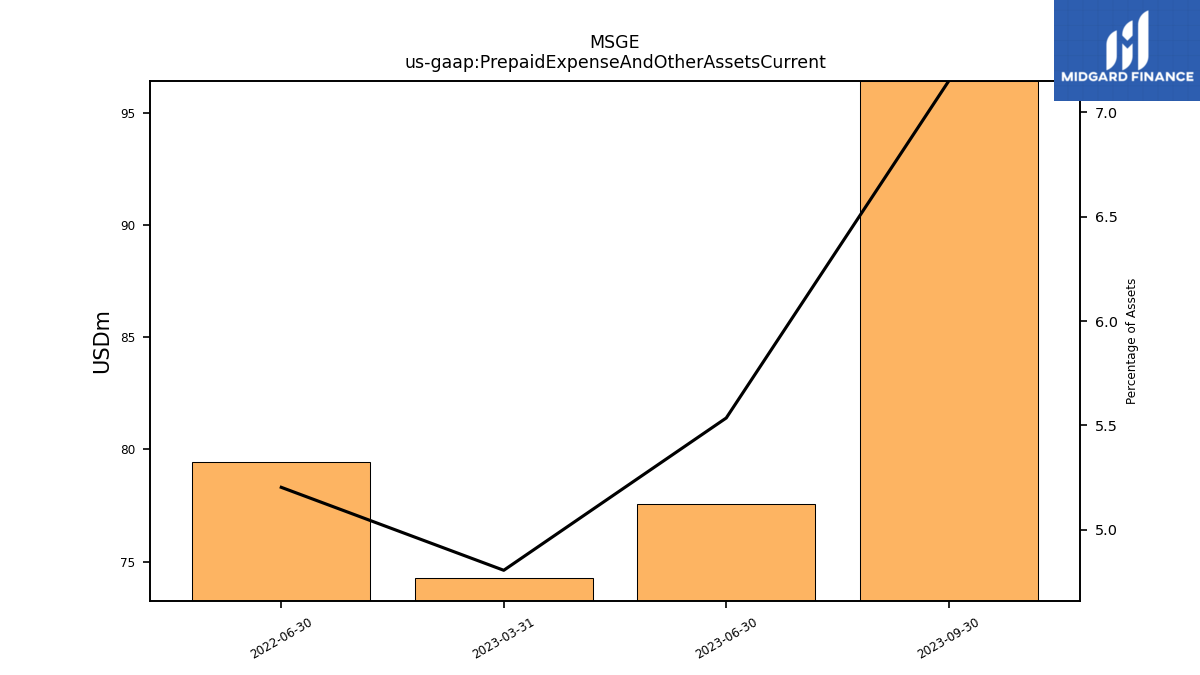
| Prepaid Expense And Other Assets Current | 96.42 | 77.56 | 74.29 | NA | 79.44 | NA | |
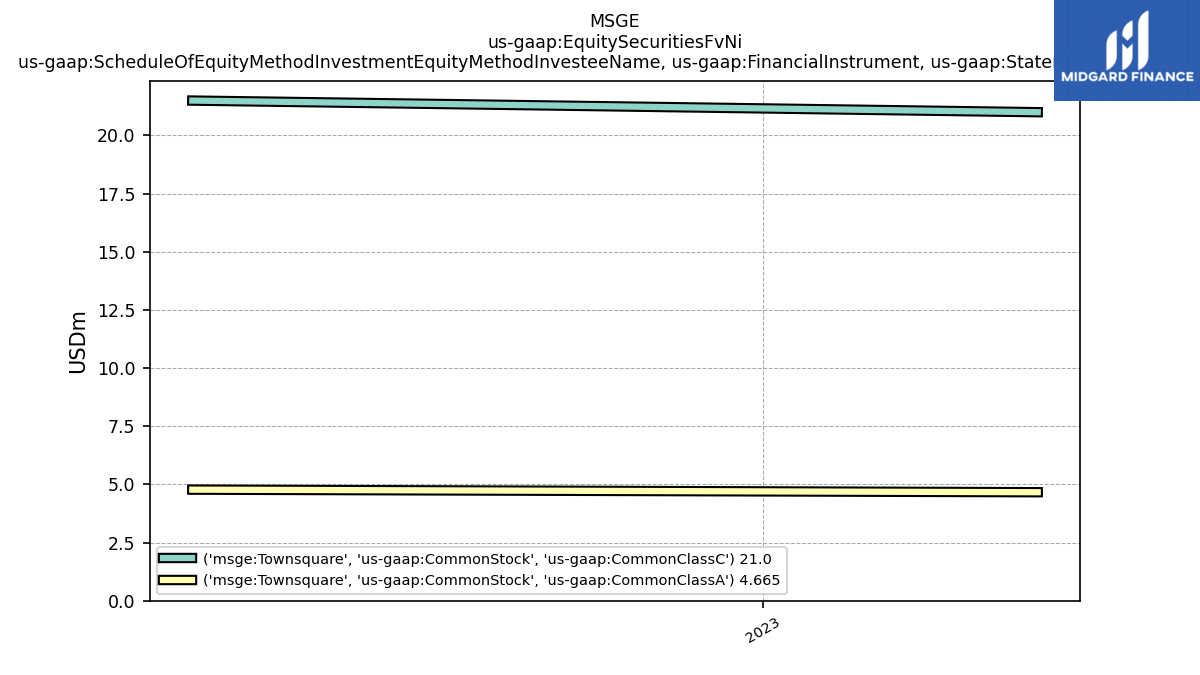
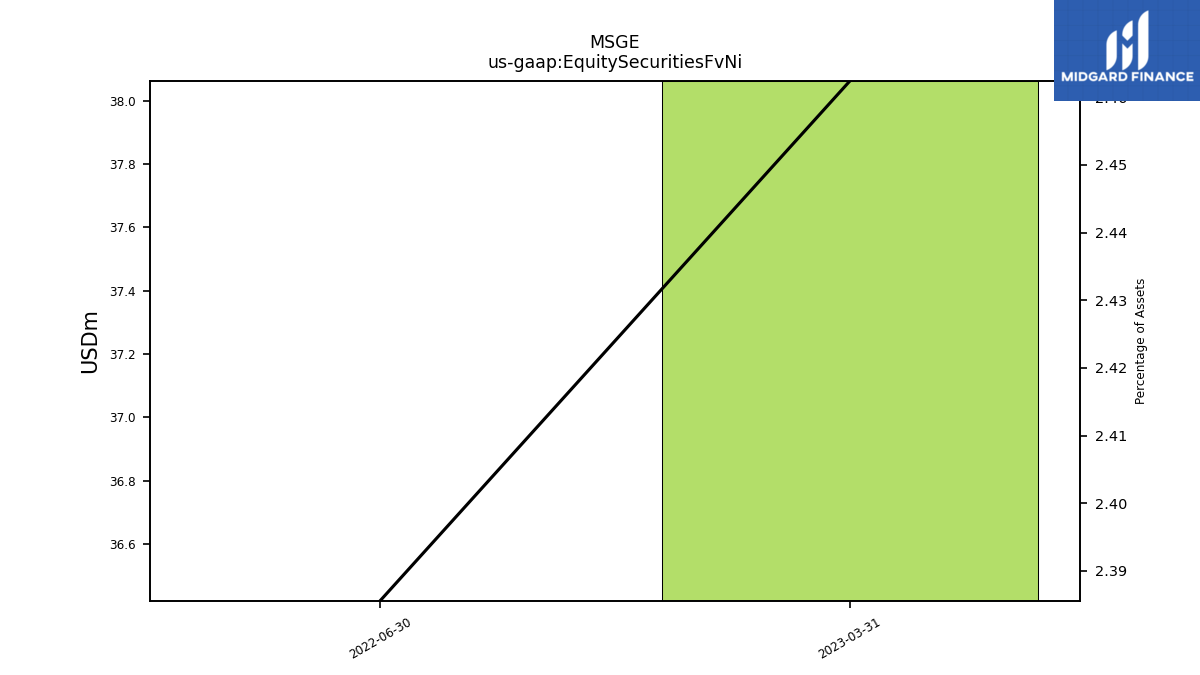
| Equity Securities Fv Ni | NA | NA | 38.06 | NA | 36.42 | NA |
| 2023-09-30 | 2023-06-30 | 2023-03-31 | 2022-09-30 | 2022-06-30 | 2022-03-31 | ||
|---|---|---|---|---|---|---|---|
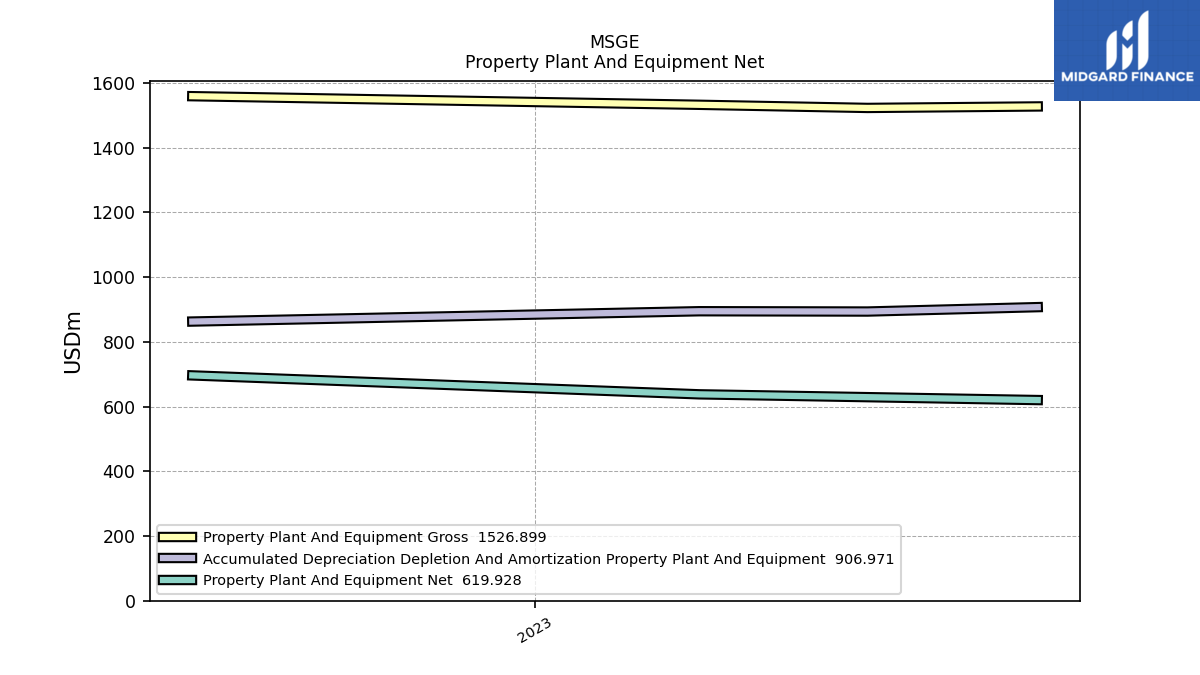
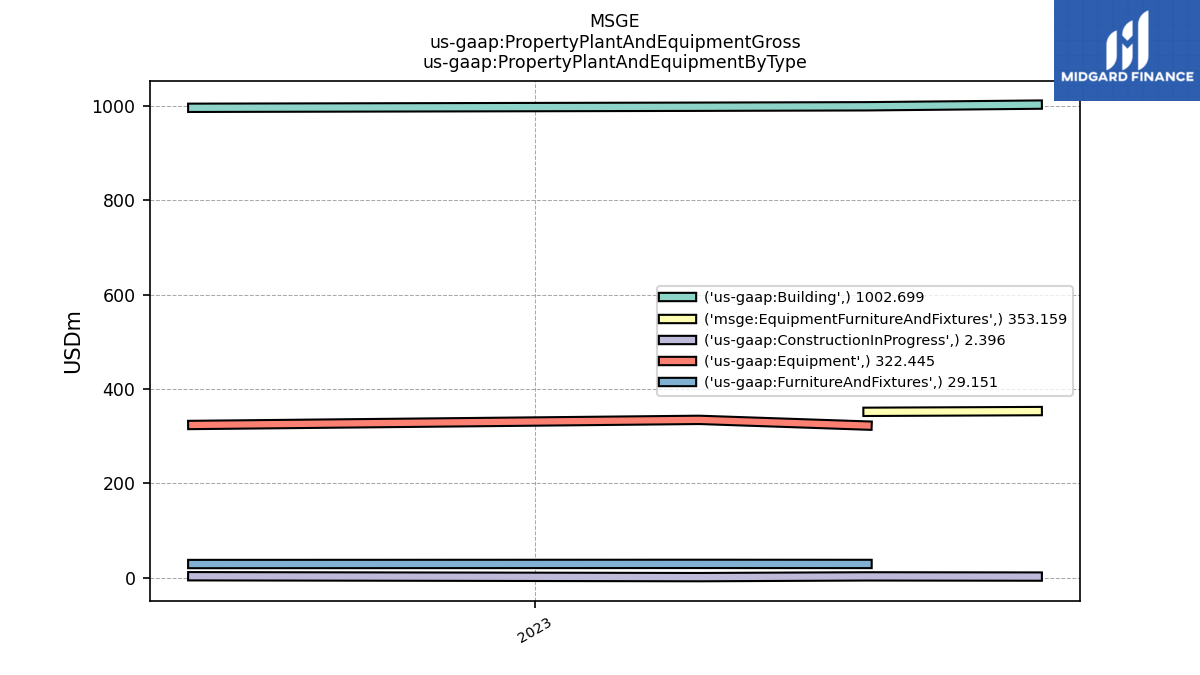
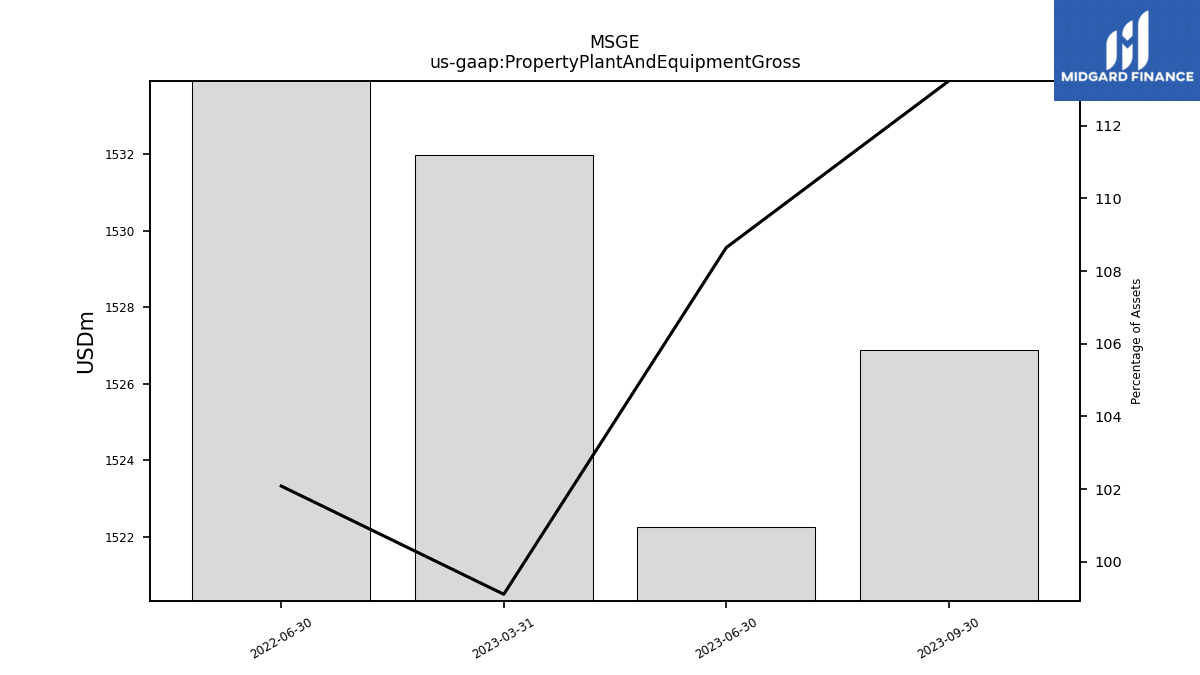
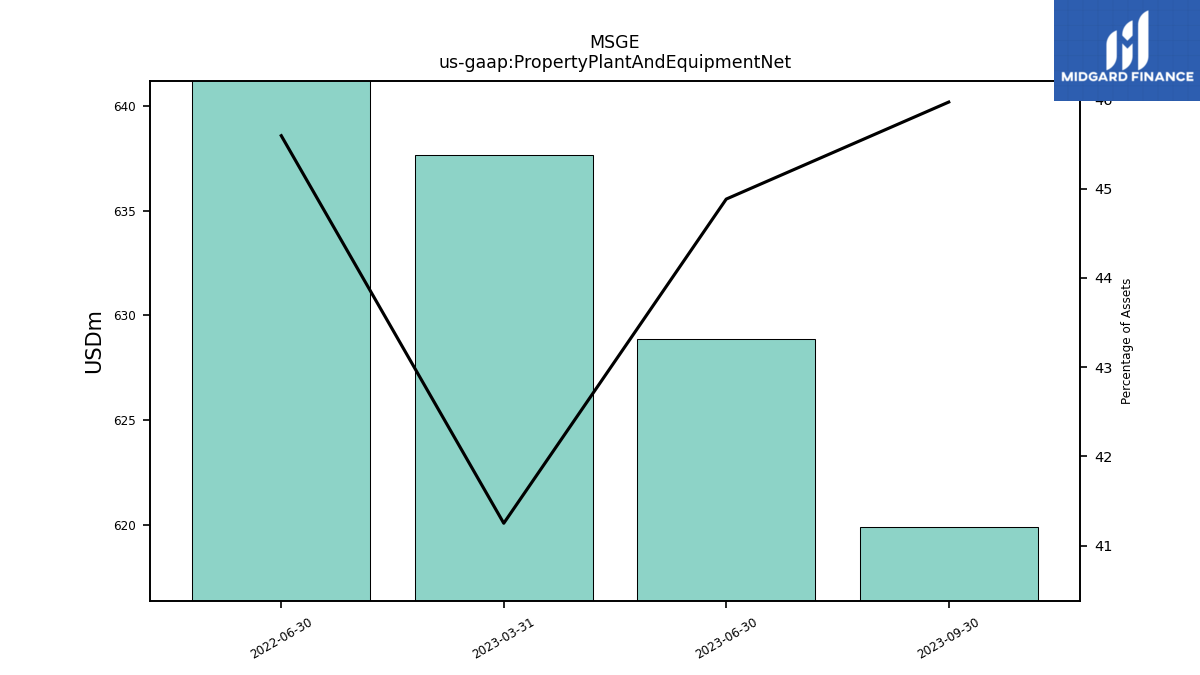
| Property Plant And Equipment Gross | 1526.90 | 1522.27 | 1531.98 | NA | 1558.56 | NA | |
| Accumulated Depreciation Depletion And Amortization Property Plant And Equipment | 906.97 | 893.39 | 894.34 | NA | 862.48 | NA | |
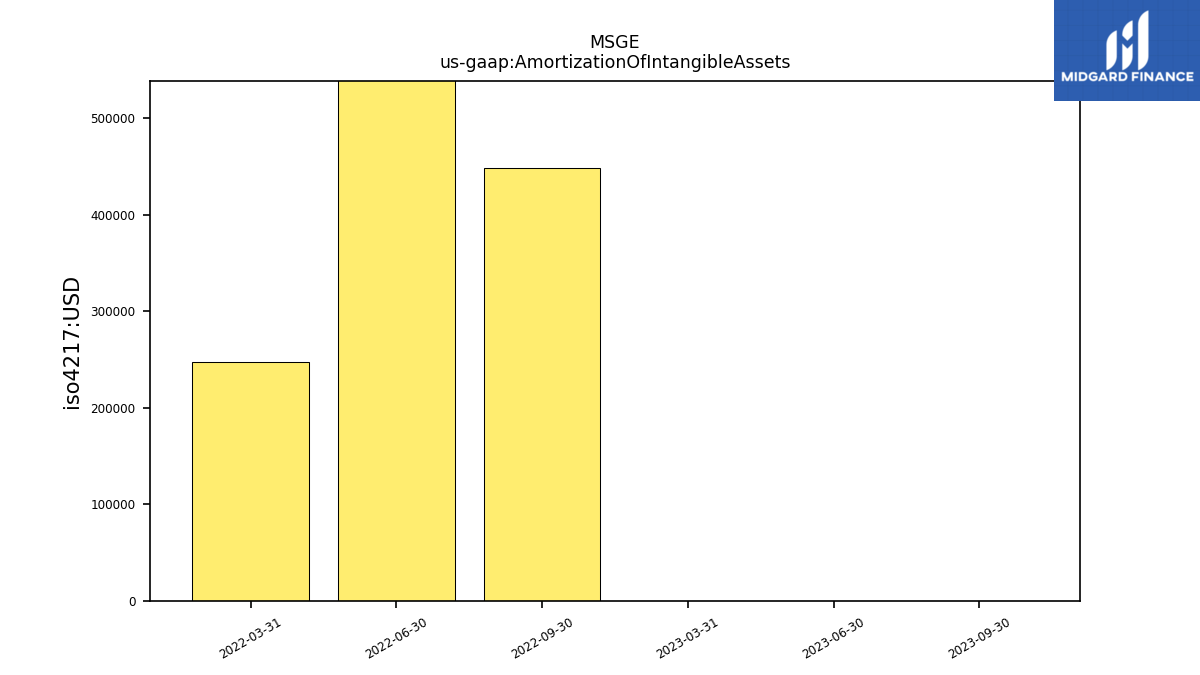
| Amortization Of Intangible Assets | 0.00 | 0.00 | 0.00 | 0.45 | 5.10 | 0.25 | |
| Property Plant And Equipment Net | 619.93 | 628.89 | 637.64 | NA | 696.08 | NA | |
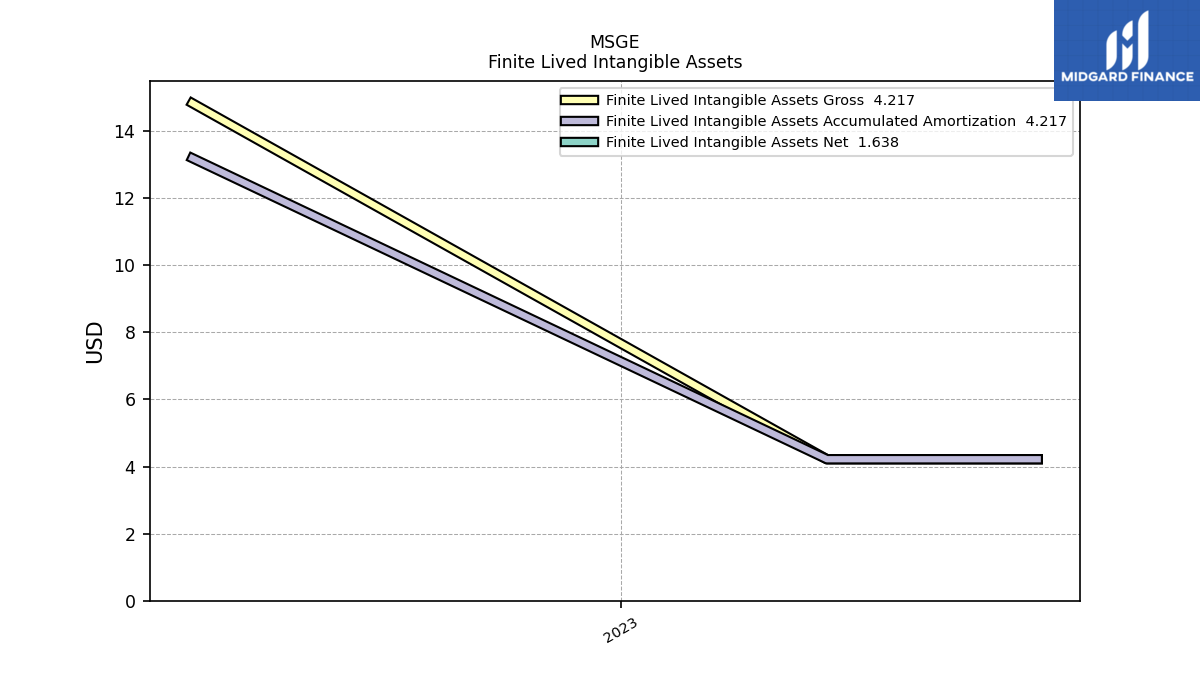
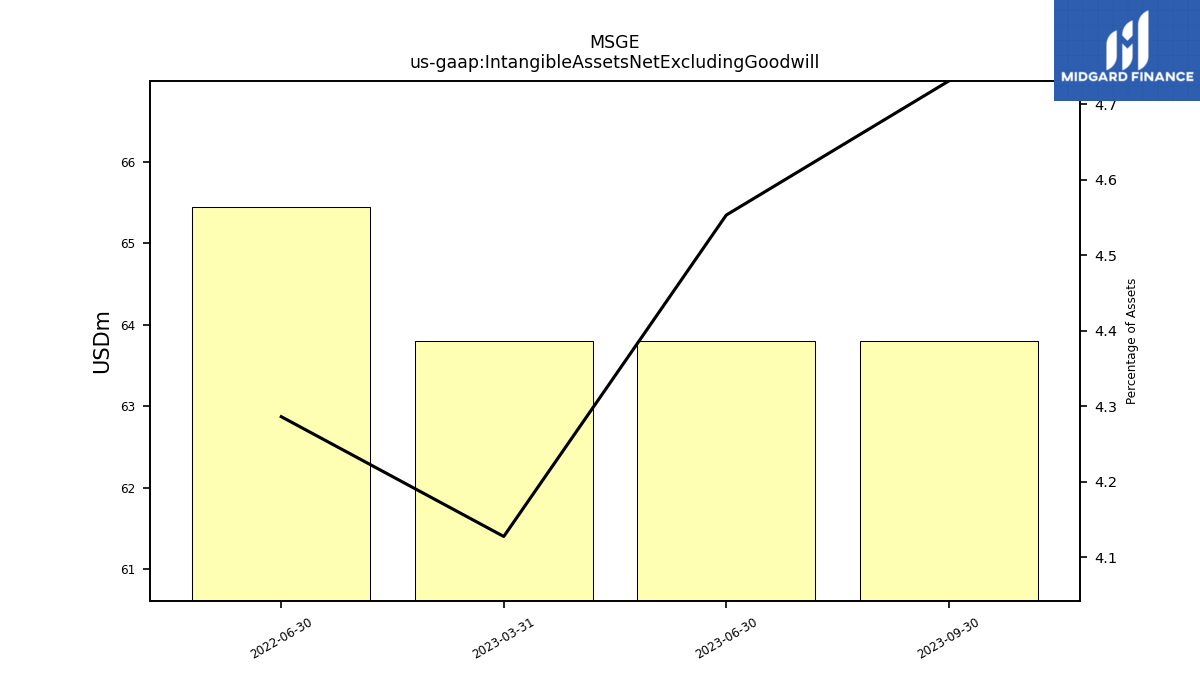
| Intangible Assets Net Excluding Goodwill | 63.80 | 63.80 | 63.80 | NA | 65.44 | NA | |
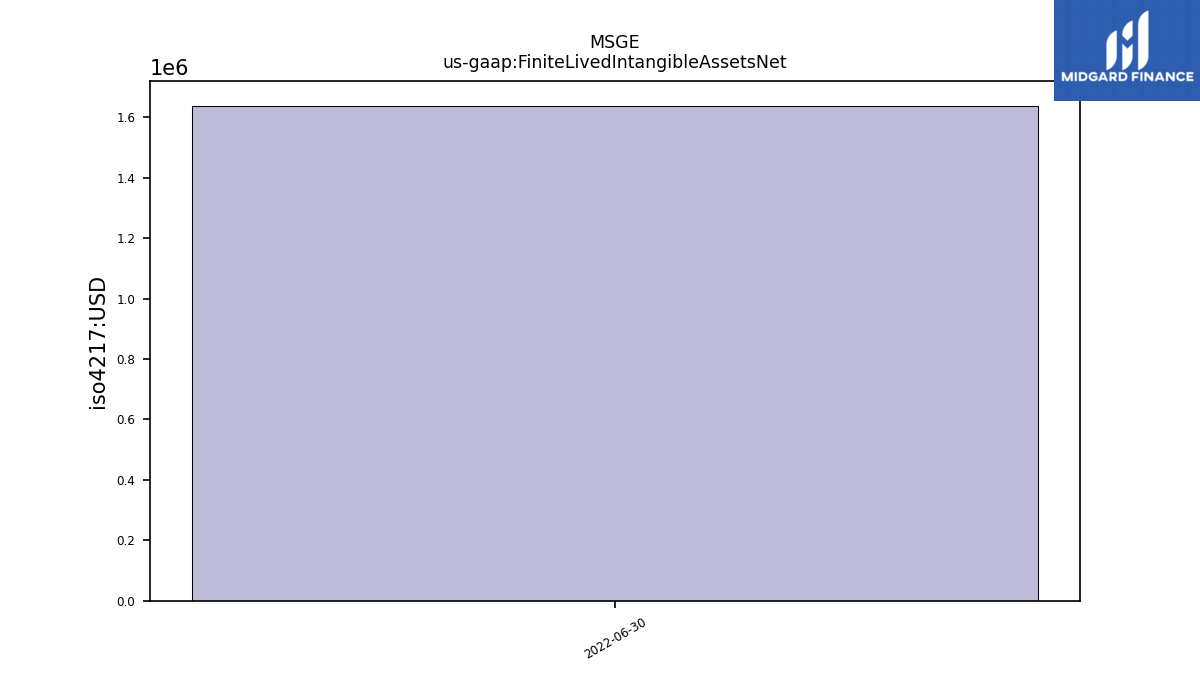
| Finite Lived Intangible Assets Net | NA | NA | NA | NA | 1.64 | NA | |
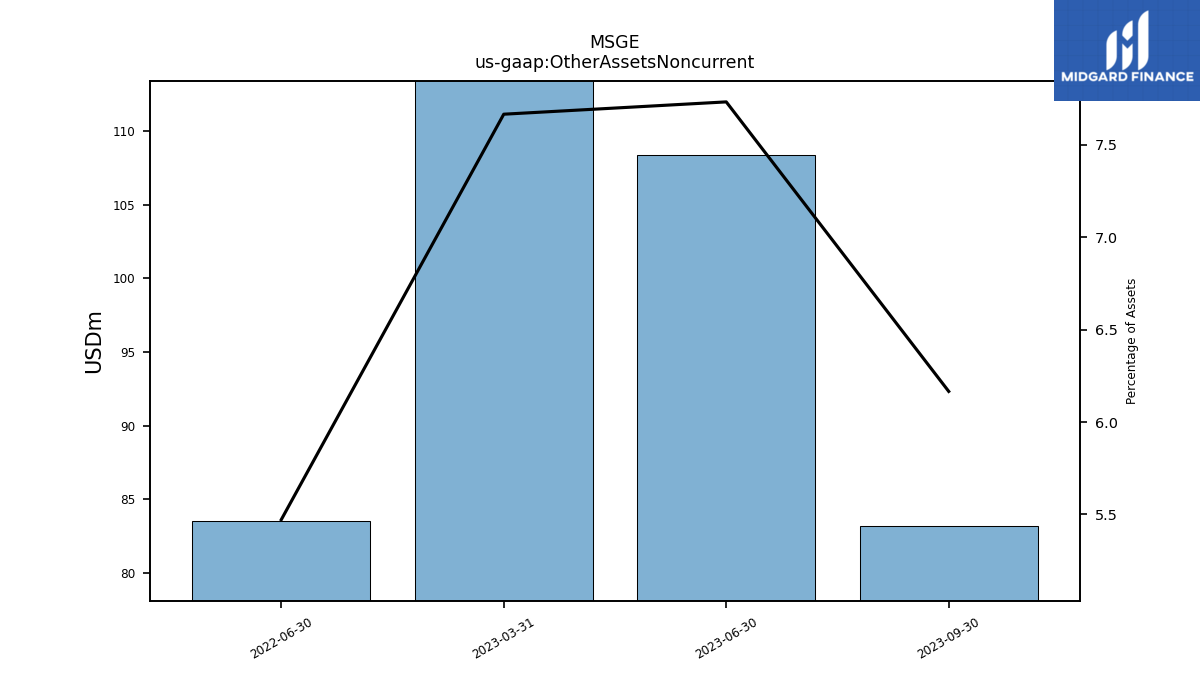
| Other Assets Noncurrent | 83.15 | 108.36 | 118.51 | NA | 83.53 | NA | |
| Equity Securities Fv Ni | NA | NA | 38.06 | NA | 36.42 | NA |
| 2023-09-30 | 2023-06-30 | 2023-03-31 | 2022-09-30 | 2022-06-30 | 2022-03-31 | ||
|---|---|---|---|---|---|---|---|
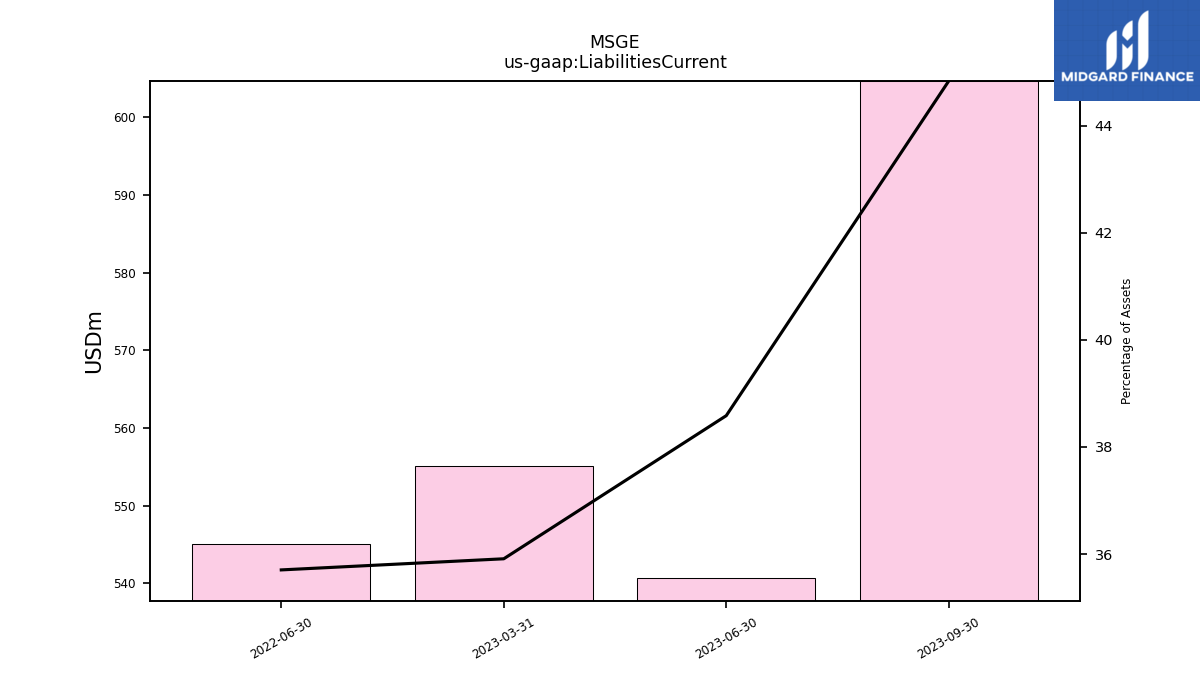
| Liabilities Current | 604.65 | 540.64 | 555.10 | NA | 545.09 | NA | |
| Long Term Debt Current | 20.31 | 16.25 | 16.25 | NA | 8.76 | NA | |
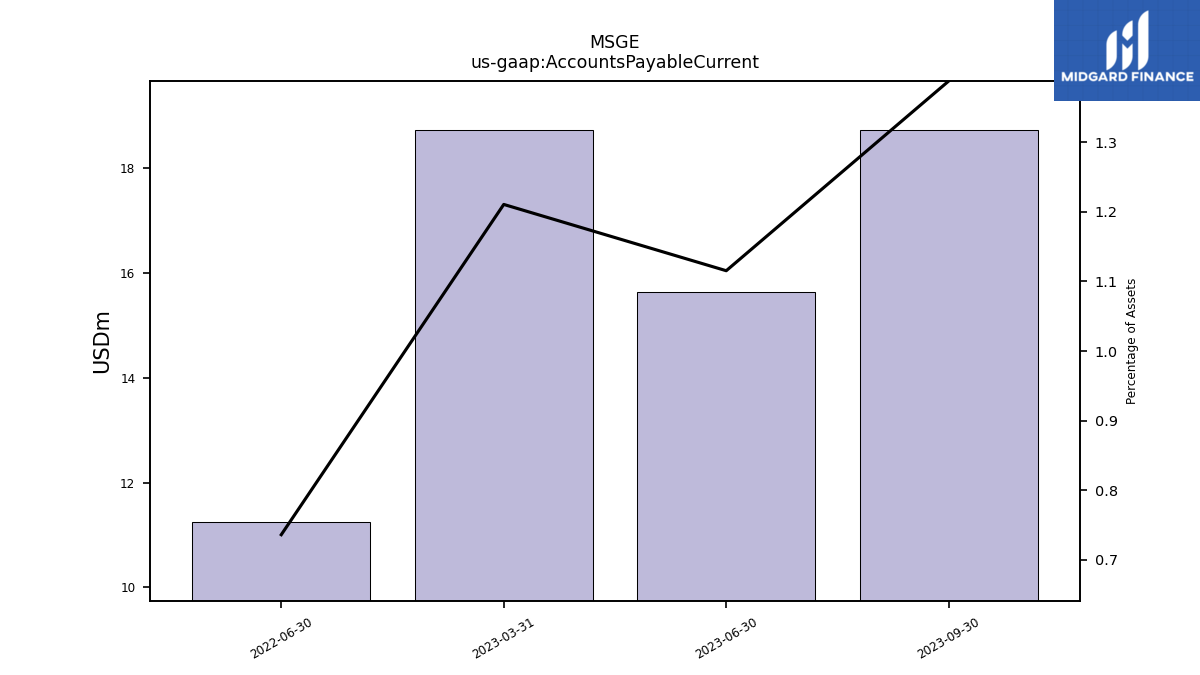
| Accounts Payable Current | 18.71 | 15.63 | 18.71 | NA | 11.24 | NA | |
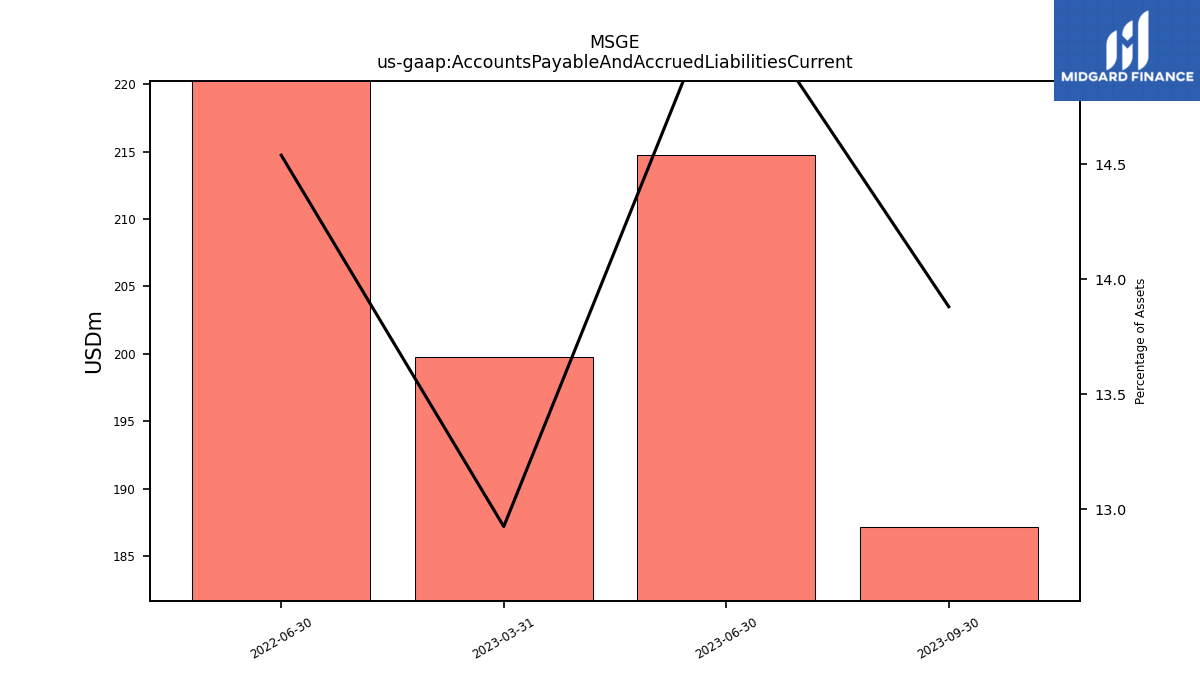
| Accounts Payable And Accrued Liabilities Current | 187.19 | 214.72 | 199.80 | NA | 221.96 | NA | |
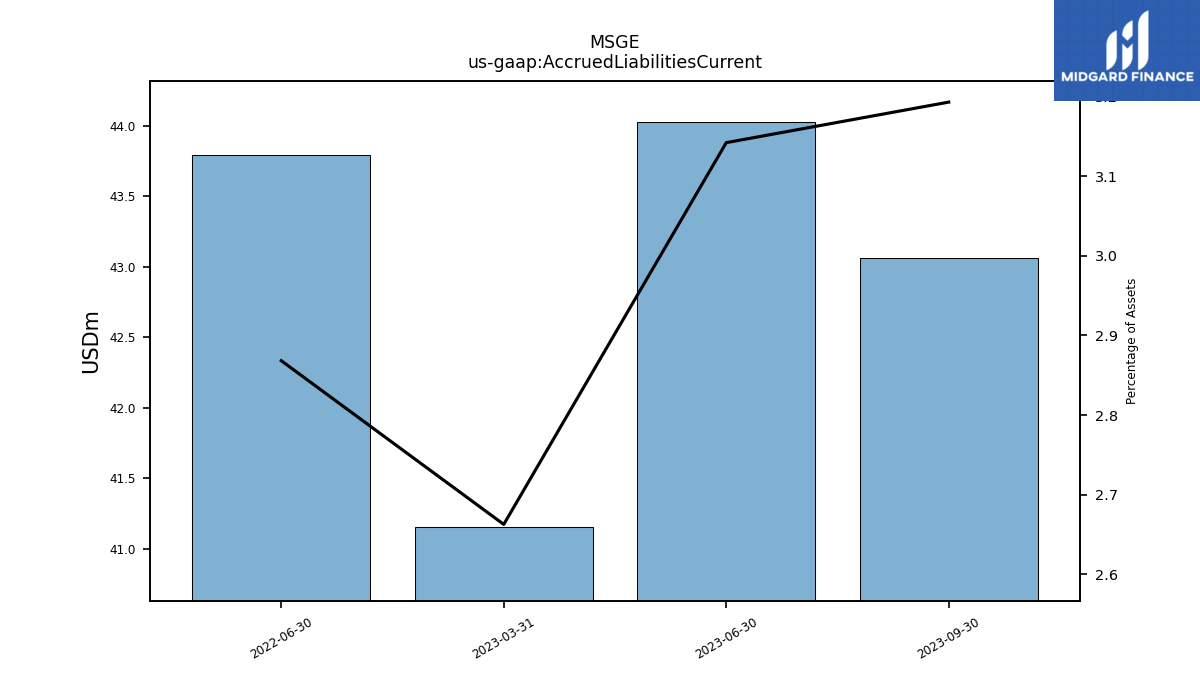
| Accrued Liabilities Current | 43.06 | 44.03 | 41.16 | NA | 43.79 | NA | |
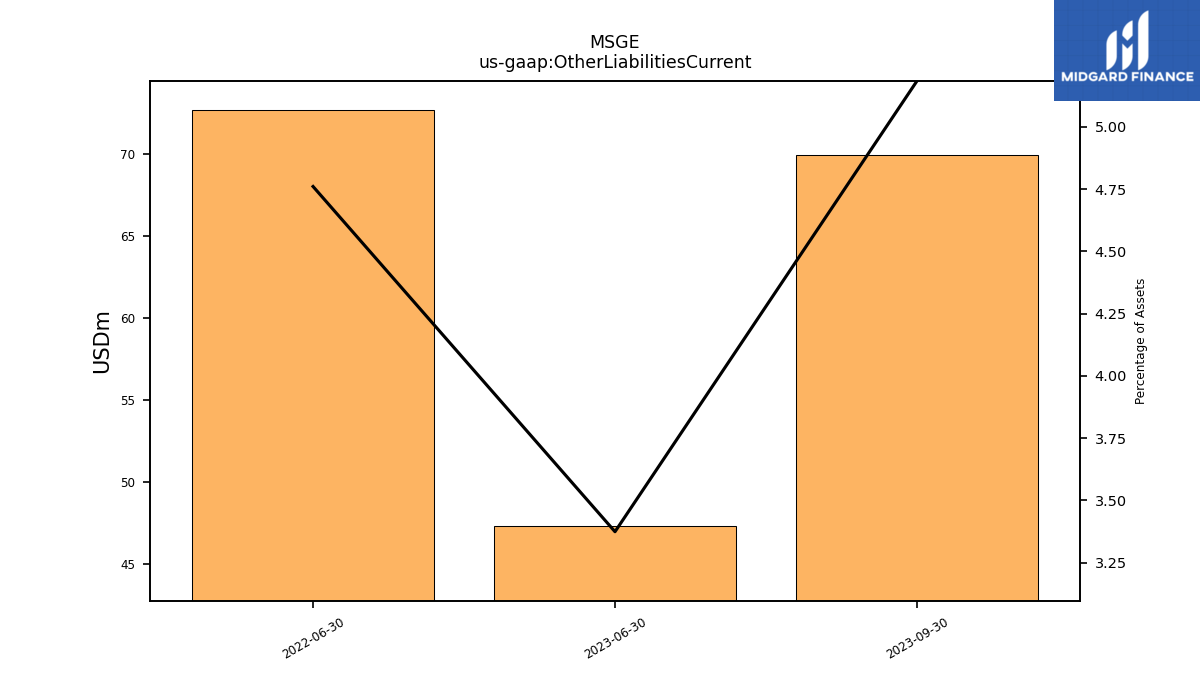
| Other Liabilities Current | 69.91 | 47.28 | NA | NA | 72.68 | NA | |
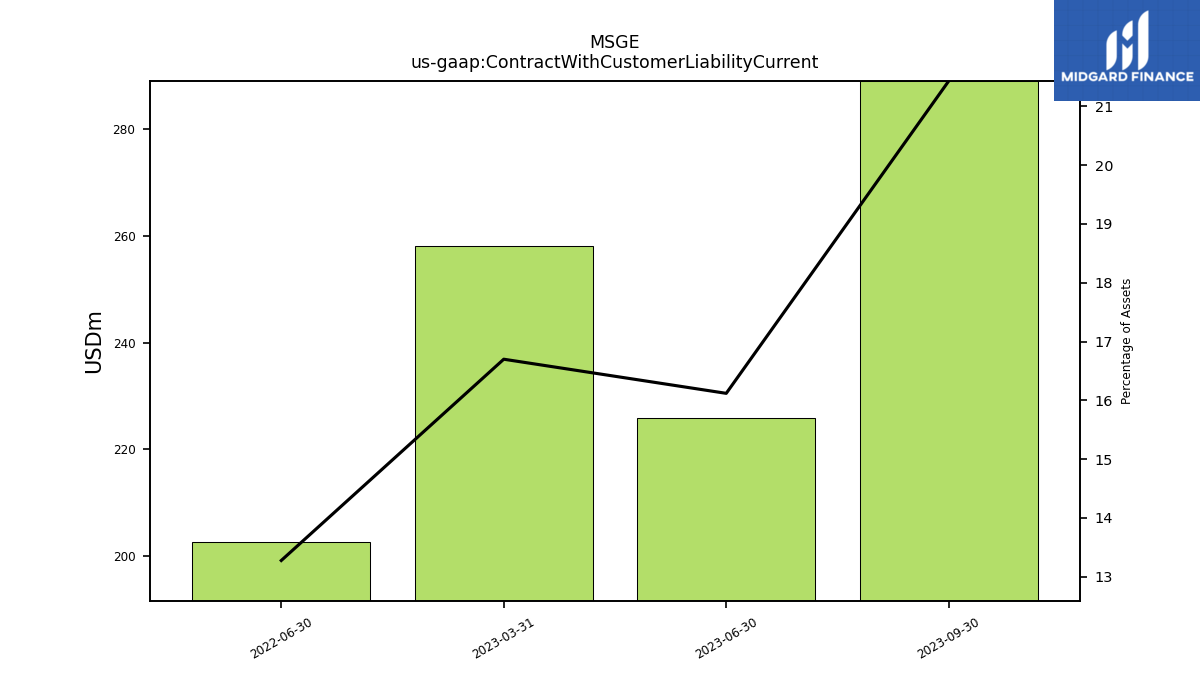
| Contract With Customer Liability Current | 289.03 | 225.85 | 258.13 | NA | 202.68 | NA |
| 2023-09-30 | 2023-06-30 | 2023-03-31 | 2022-09-30 | 2022-06-30 | 2022-03-31 | ||
|---|---|---|---|---|---|---|---|
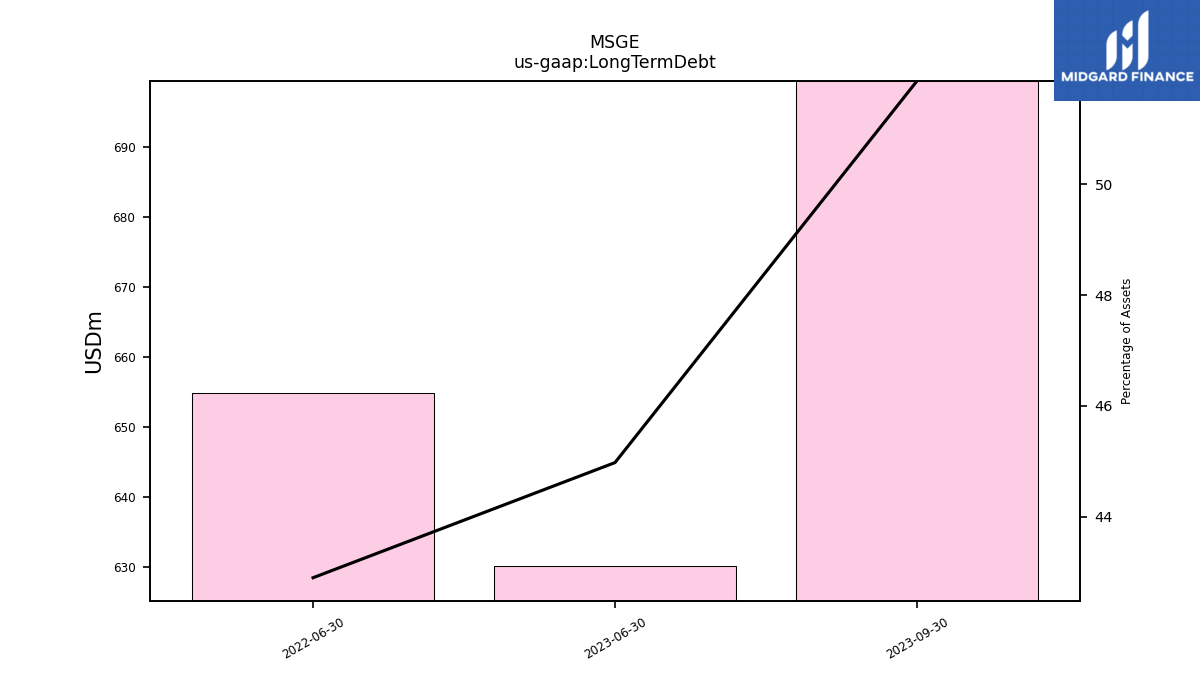
| Long Term Debt | 699.43 | 630.18 | NA | NA | 654.91 | NA | |
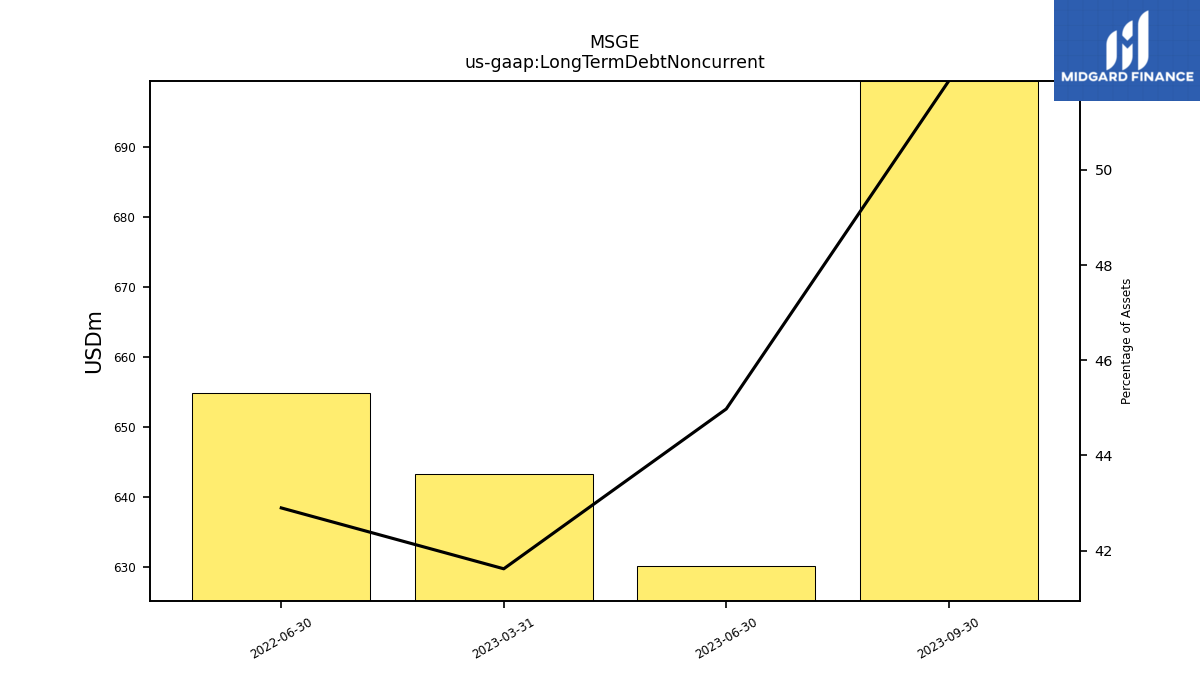
| Long Term Debt Noncurrent | 699.43 | 630.18 | 643.31 | NA | 654.91 | NA | |
| Deferred Income Tax Liabilities Net | 22.90 | 23.52 | 23.38 | NA | 23.25 | NA | |
| Minority Interest | NA | NA | NA | NA | -0.11 | NA | |
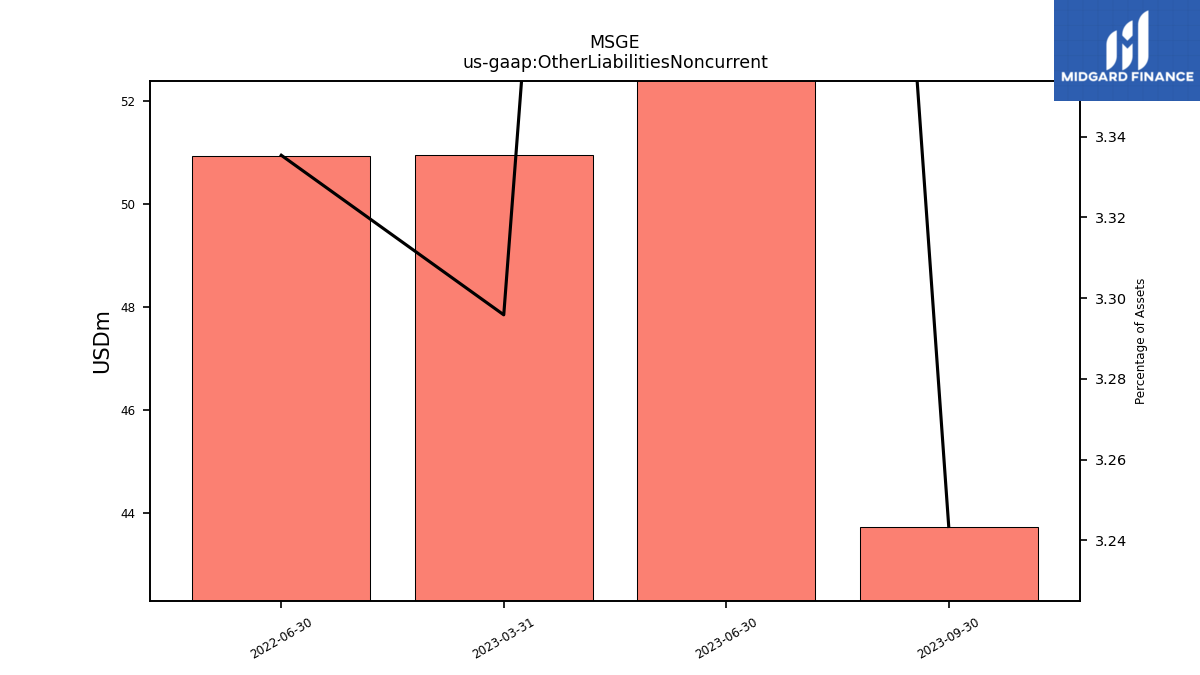
| Other Liabilities Noncurrent | 43.74 | 56.33 | 50.95 | NA | 50.92 | NA | |
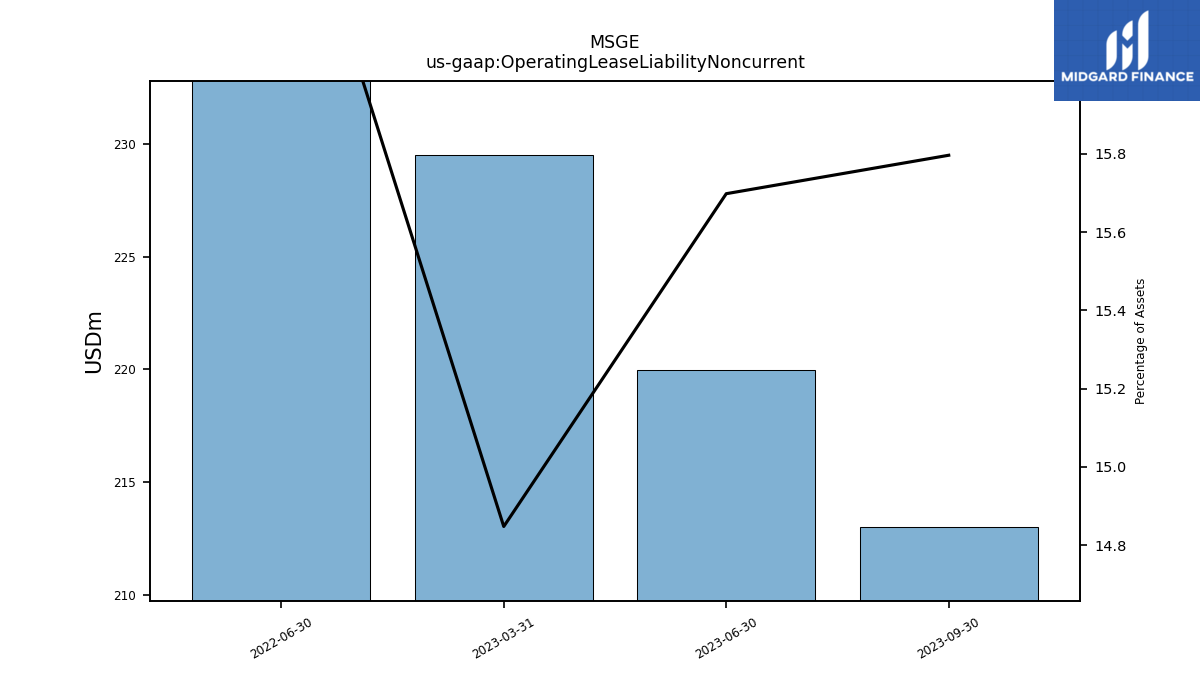
| Operating Lease Liability Noncurrent | 213.02 | 219.96 | 229.50 | NA | 254.11 | NA |
| 2023-09-30 | 2023-06-30 | 2023-03-31 | 2022-09-30 | 2022-06-30 | 2022-03-31 | ||
|---|---|---|---|---|---|---|---|
| Stockholders Equity | -235.20 | -69.47 | 43.50 | NA | -1.48 | NA | |
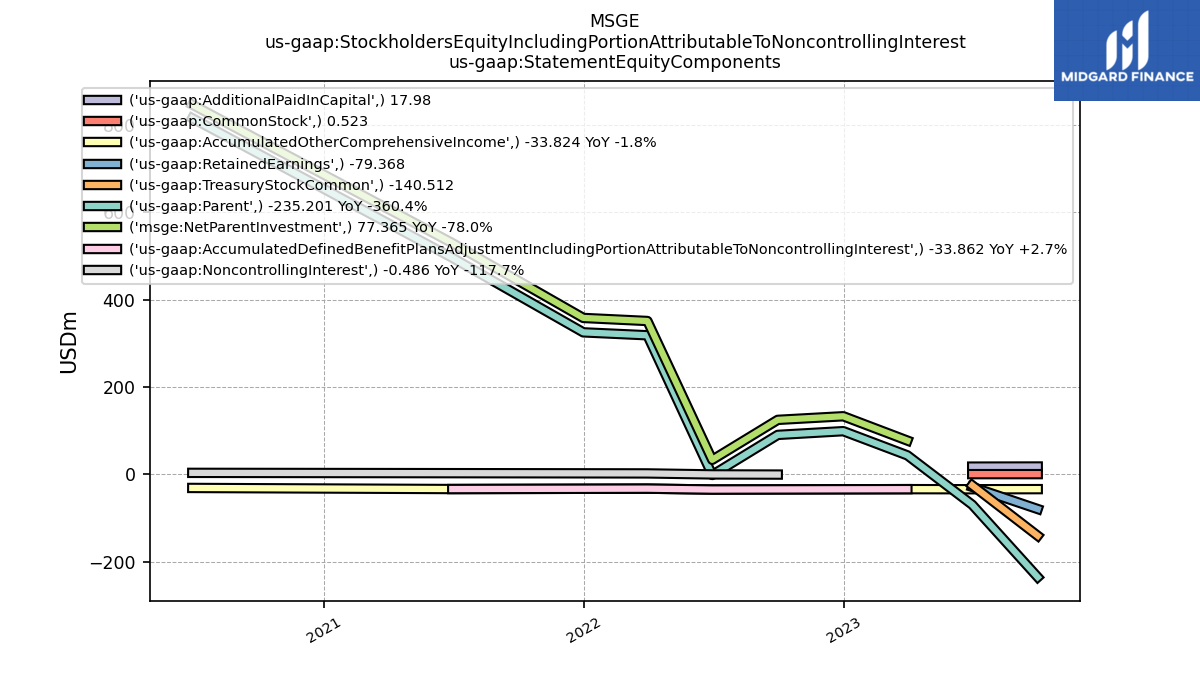
| Stockholders Equity Including Portion Attributable To Noncontrolling Interest | -235.20 | -69.47 | 43.50 | 89.83 | -1.59 | 320.50 | |
| Additional Paid In Capital Common Stock | 17.98 | 17.73 | NA | NA | NA | NA | |
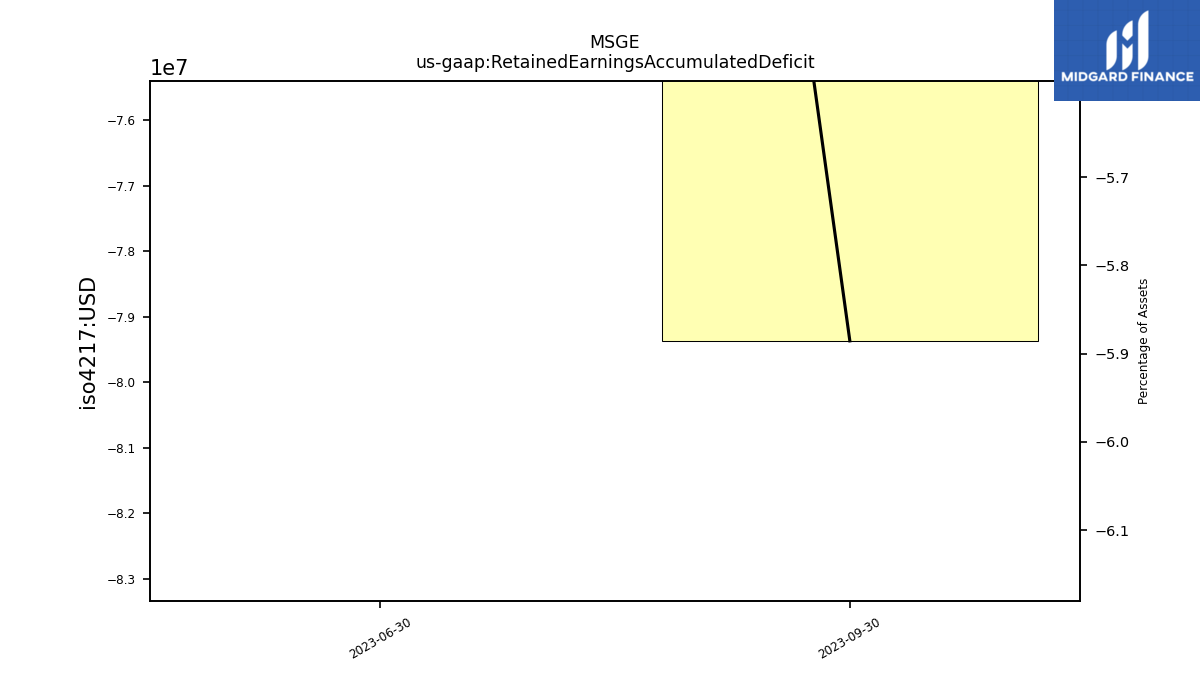
| Retained Earnings Accumulated Deficit | -79.37 | -28.70 | NA | NA | NA | NA | |
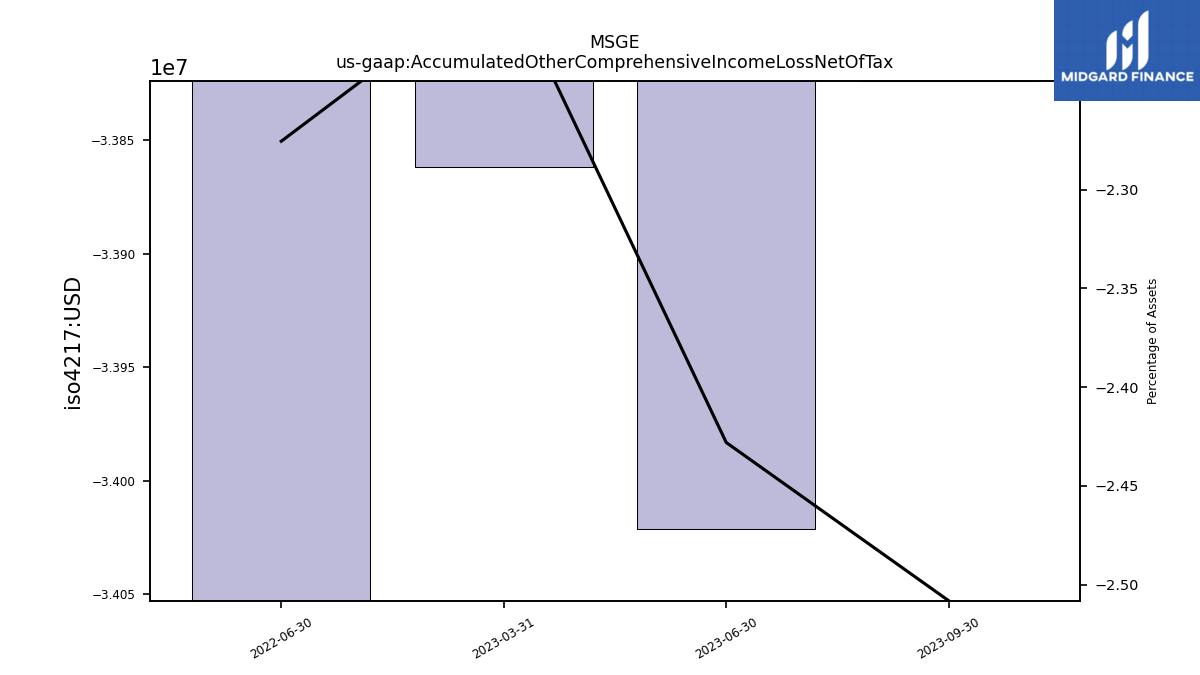
| Accumulated Other Comprehensive Income Loss Net Of Tax | -33.82 | -34.02 | -33.86 | NA | -34.74 | NA | |
| Minority Interest | NA | NA | NA | NA | -0.11 | NA | |
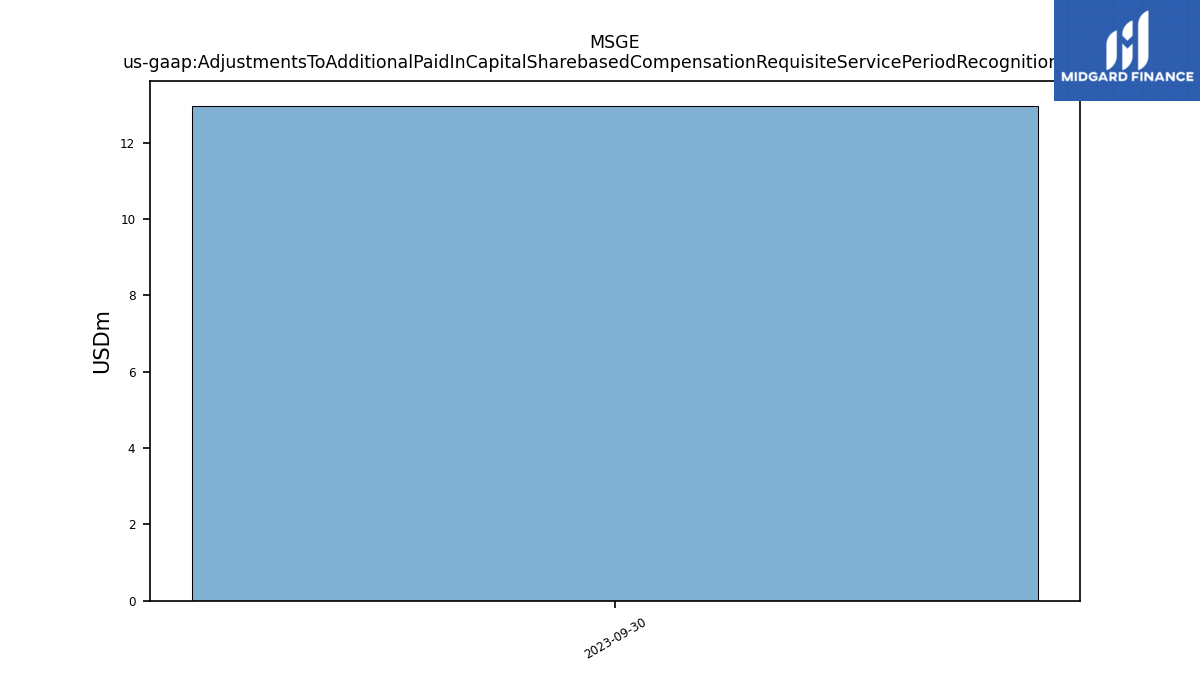
| Adjustments To Additional Paid In Capital Sharebased Compensation Requisite Service Period Recognition Value | 12.96 | NA | NA | NA | NA | NA |
| 2023-09-30 | 2023-06-30 | 2023-03-31 | 2022-09-30 | 2022-06-30 | 2022-03-31 | ||
|---|---|---|---|---|---|---|---|
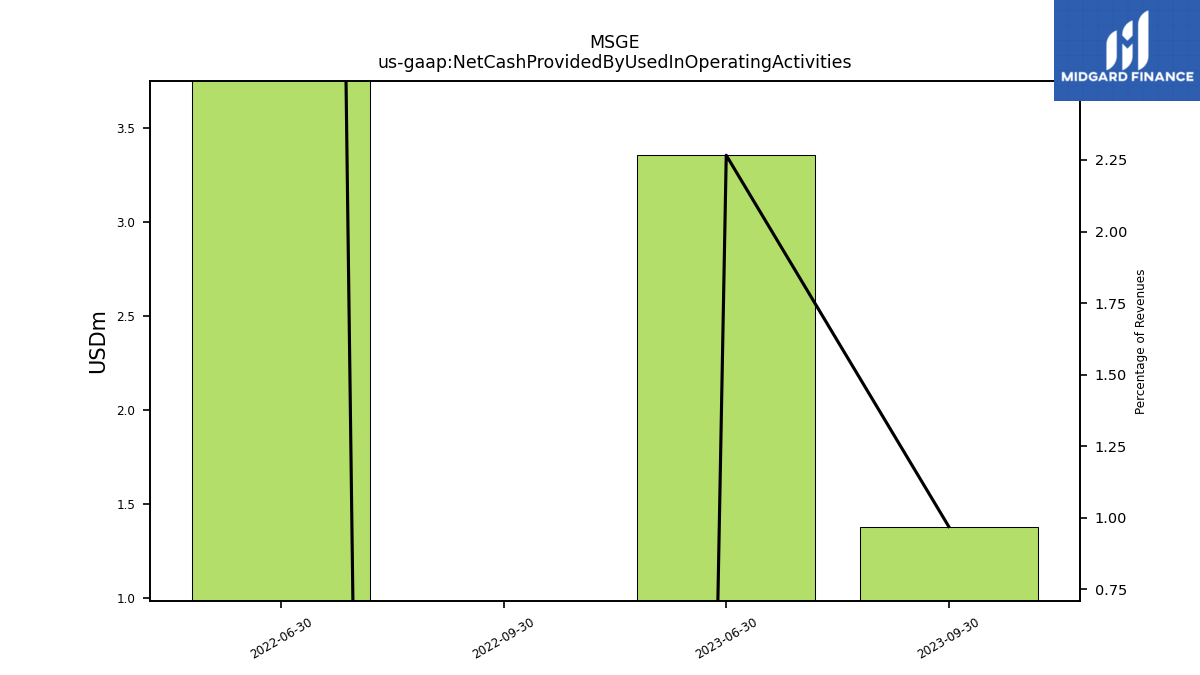
| Net Cash Provided By Used In Operating Activities | 1.38 | 3.35 | NA | -57.33 | 35.01 | NA | |
| Net Cash Provided By Used In Investing Activities | -55.49 | 17.04 | NA | -1.04 | 58.50 | NA | |
| Net Cash Provided By Used In Financing Activities | 9.27 | -59.02 | NA | 102.10 | -246.25 | NA |
| 2023-09-30 | 2023-06-30 | 2023-03-31 | 2022-09-30 | 2022-06-30 | 2022-03-31 | ||
|---|---|---|---|---|---|---|---|
| Net Cash Provided By Used In Operating Activities | 1.38 | 3.35 | NA | -57.33 | 35.01 | NA | |
| Net Income Loss | -50.67 | -24.48 | 21.72 | -17.90 | -71.40 | -3.93 | |
| Profit Loss | -50.67 | -24.48 | 21.72 | -18.27 | -73.69 | -4.14 | |
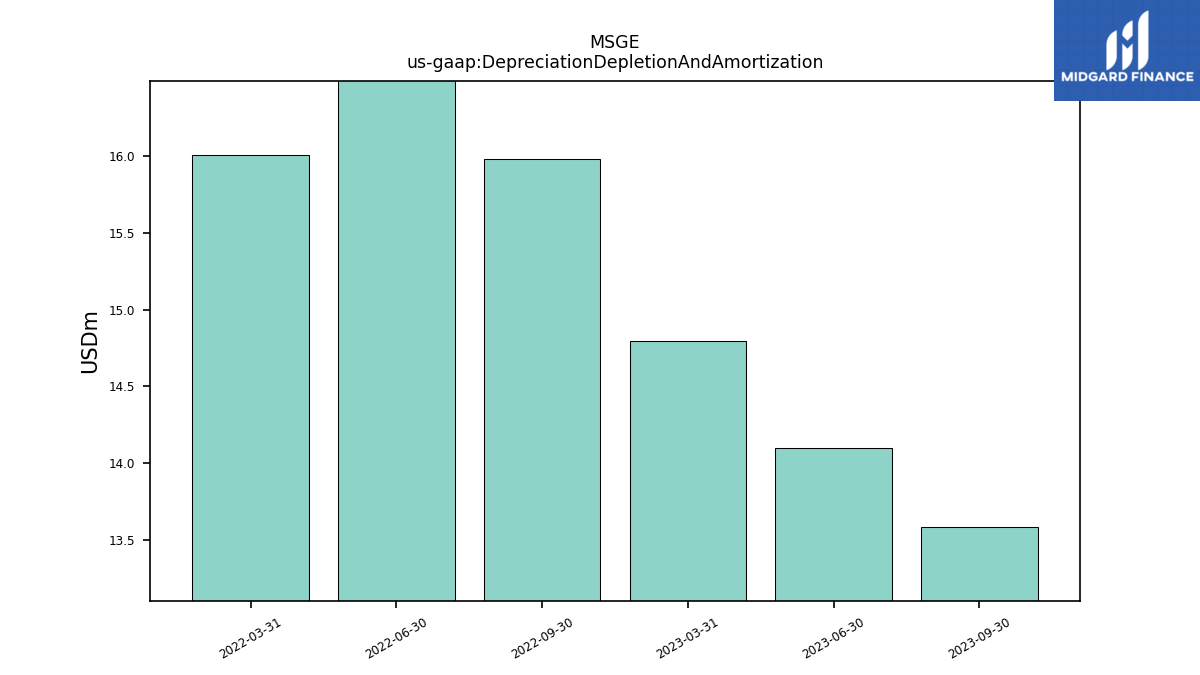
| Depreciation Depletion And Amortization | 13.59 | 14.09 | 14.80 | 15.98 | 20.37 | 16.01 | |
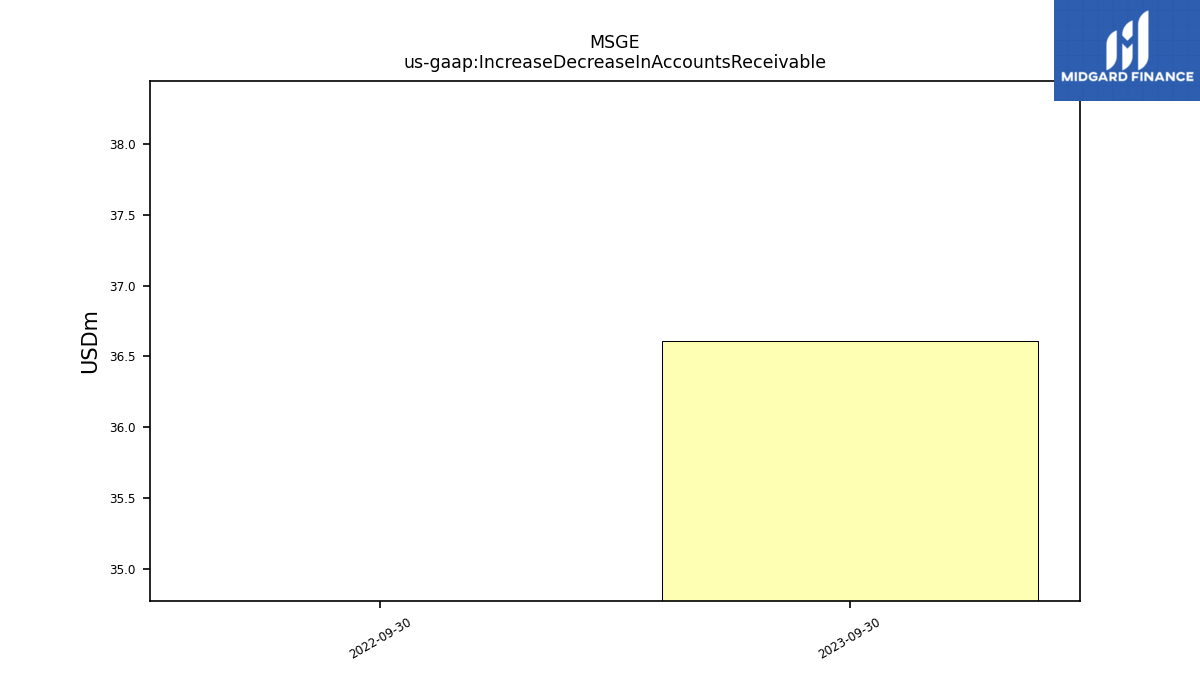
| Increase Decrease In Accounts Receivable | 36.61 | NA | NA | -9.93 | NA | NA | |
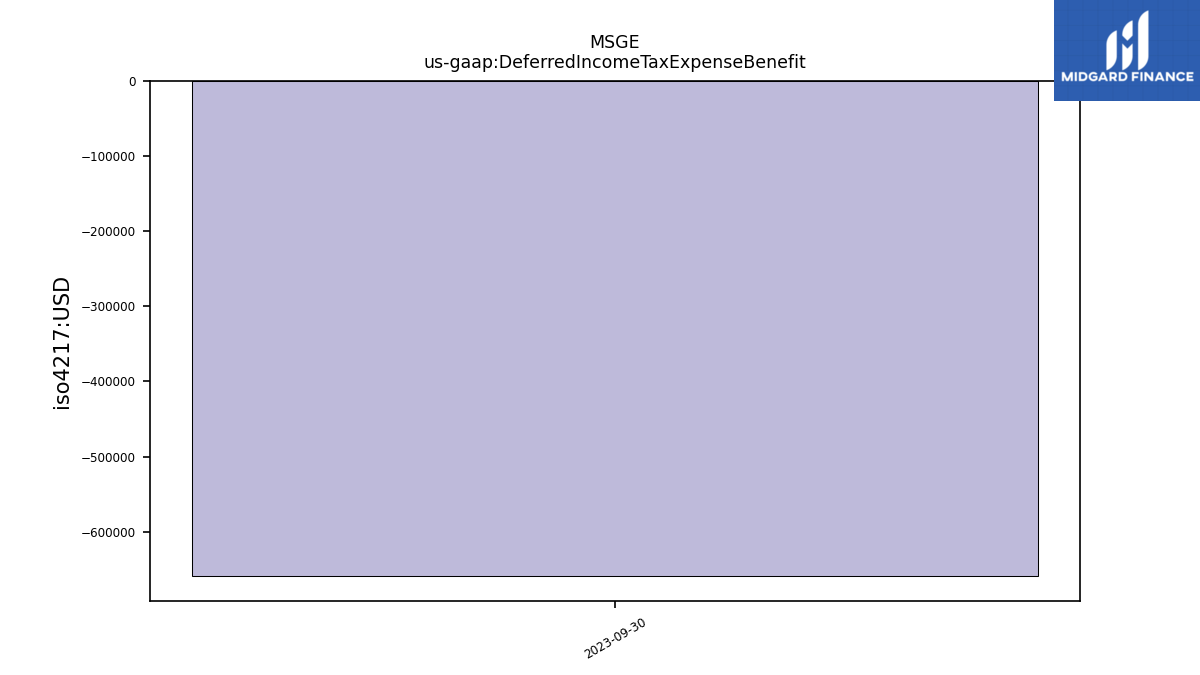
| Deferred Income Tax Expense Benefit | -0.66 | NA | NA | NA | NA | NA | |
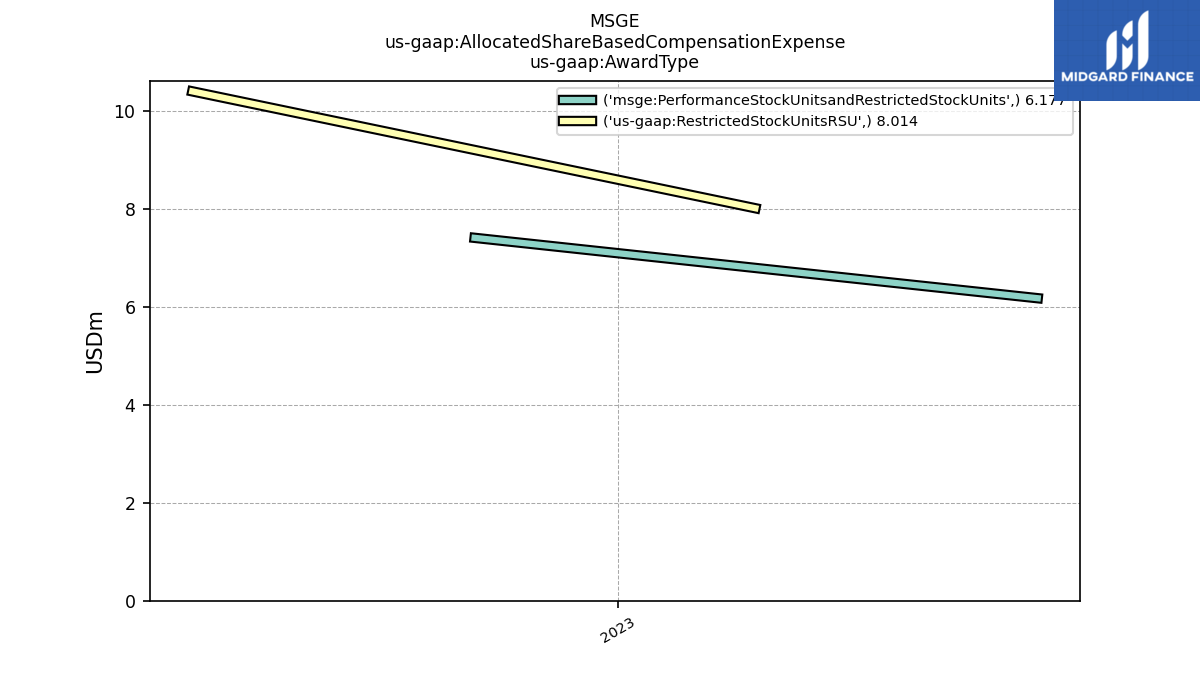
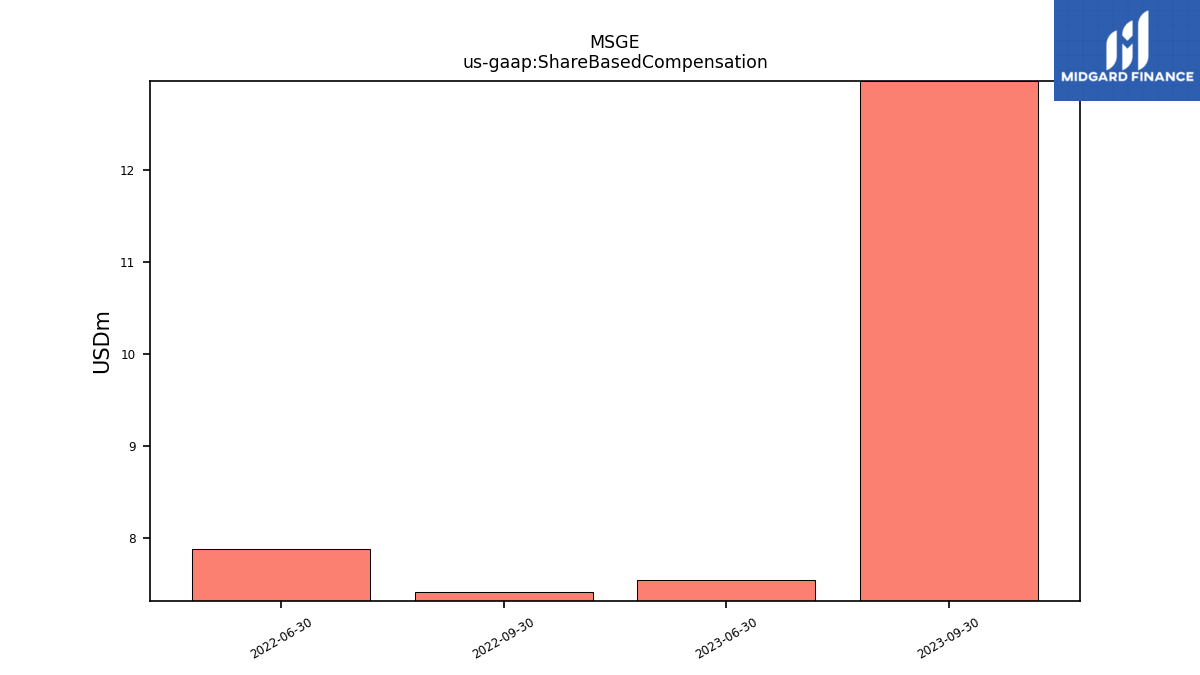
| Share Based Compensation | 12.96 | 7.54 | NA | 7.41 | 7.88 | NA | |
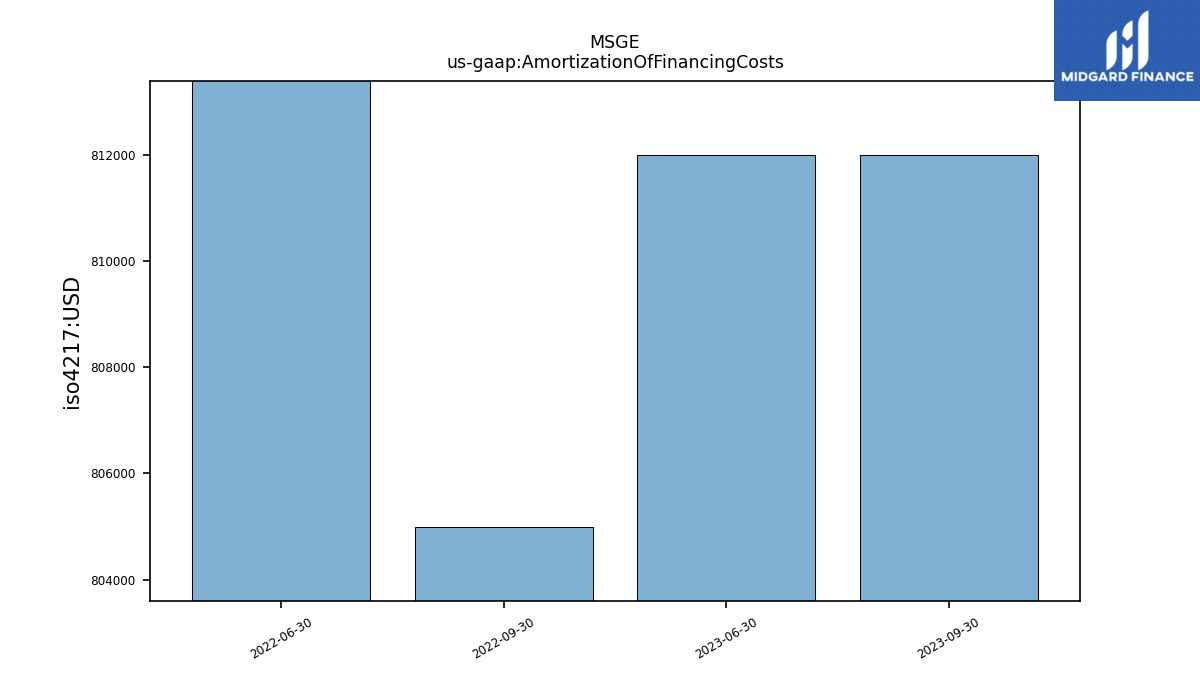
| Amortization Of Financing Costs | 0.81 | 0.81 | NA | 0.81 | 1.69 | NA |
| 2023-09-30 | 2023-06-30 | 2023-03-31 | 2022-09-30 | 2022-06-30 | 2022-03-31 | ||
|---|---|---|---|---|---|---|---|
| Net Cash Provided By Used In Investing Activities | -55.49 | 17.04 | NA | -1.04 | 58.50 | NA |
| 2023-09-30 | 2023-06-30 | 2023-03-31 | 2022-09-30 | 2022-06-30 | 2022-03-31 | ||
|---|---|---|---|---|---|---|---|
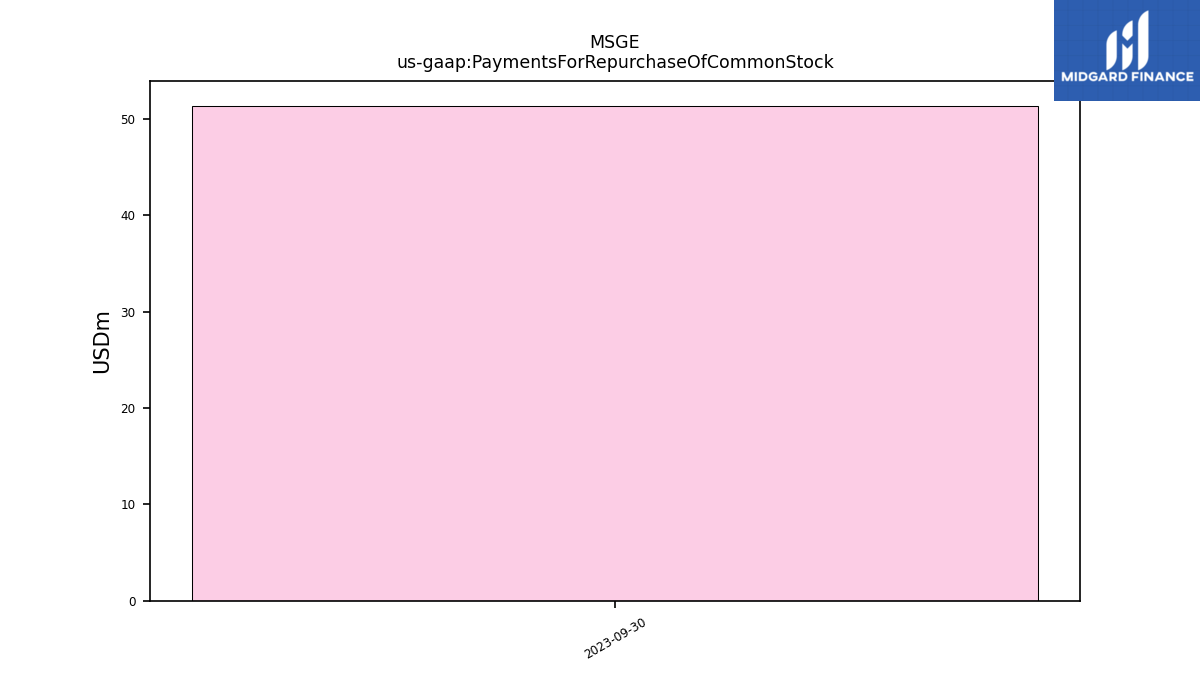
| Net Cash Provided By Used In Financing Activities | 9.27 | -59.02 | NA | 102.10 | -246.25 | NA | |
| Payments For Repurchase Of Common Stock | 51.39 | NA | NA | NA | NA | NA |


