
| 2024-02-25 | 2023-11-26 | 2023-08-27 | 2023-05-28 | 2023-02-26 | 2022-11-27 | 2022-08-28 | 2022-05-29 | 2022-02-27 | 2021-11-28 | 2021-08-29 | 2021-05-30 | 2021-02-28 | 2020-11-29 | 2020-08-30 | 2020-05-31 | 2020-02-23 | 2019-11-24 | 2019-08-25 | 2019-05-26 | 2019-02-24 | 2018-11-25 | 2018-08-26 | 2018-05-27 | 2018-02-25 | 2017-11-26 | 2017-08-27 | 2017-05-28 | 2017-02-26 | 2016-11-27 | 2016-08-28 | 2016-05-29 | 2016-02-28 | 2015-11-29 | 2015-08-30 | ||
|---|---|---|---|---|---|---|---|---|---|---|---|---|---|---|---|---|---|---|---|---|---|---|---|---|---|---|---|---|---|---|---|---|---|---|---|---|
| Common Stock Value | 150.70 | 150.70 | 150.70 | 150.30 | 148.30 | 148.30 | 148.30 | 148.00 | 148.00 | 148.00 | 148.00 | 147.60 | 147.60 | 147.50 | 147.40 | 147.00 | 147.00 | 146.80 | 146.80 | 146.70 | 146.60 | 146.60 | 146.60 | 146.40 | 146.30 | 146.30 | 146.20 | 146.10 | NA | NA | NA | NA | NA | NA | NA | |
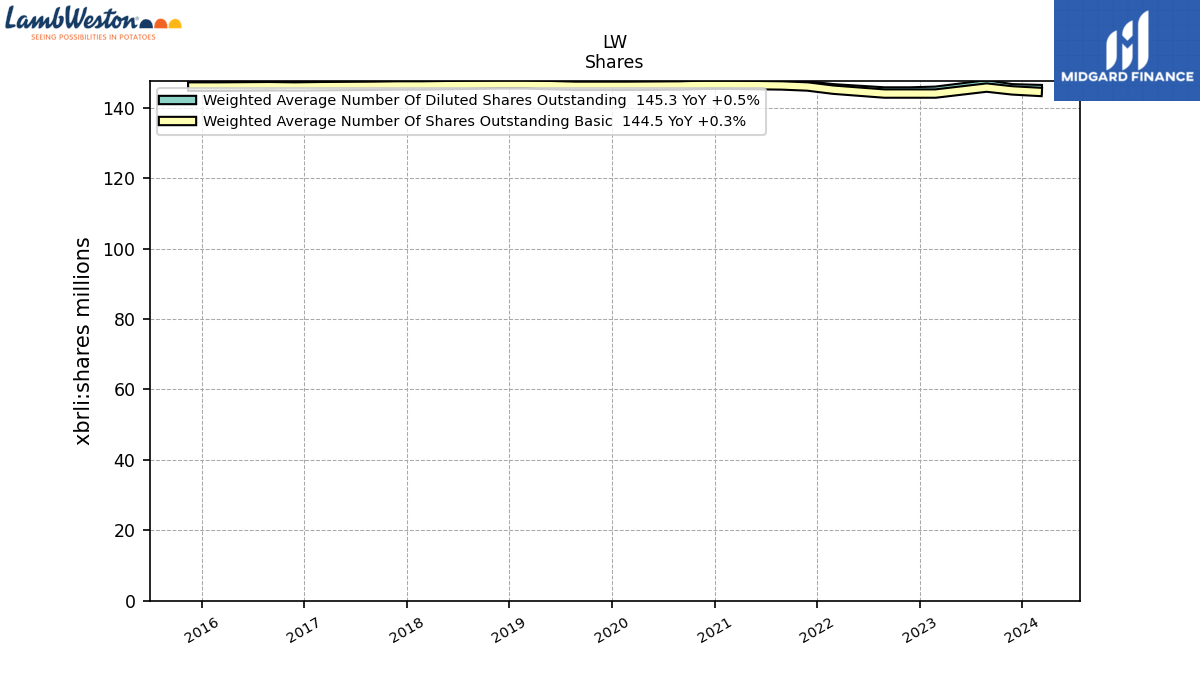
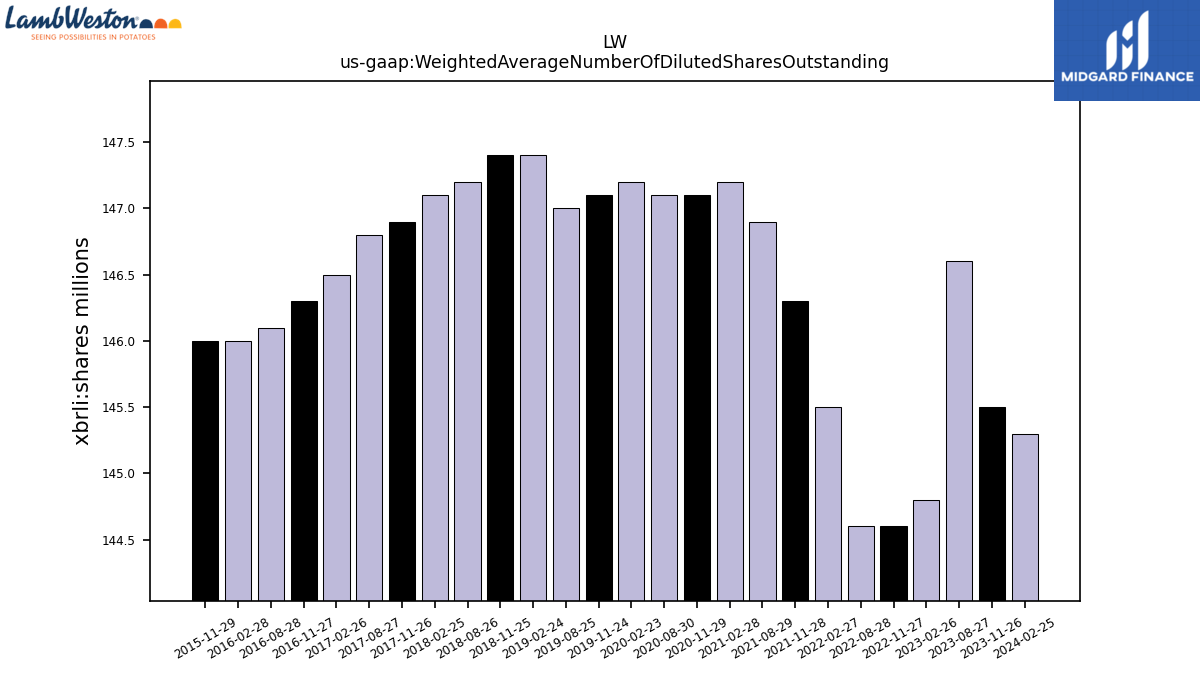
| Weighted Average Number Of Diluted Shares Outstanding | 145.30 | 145.50 | 146.60 | NA | 144.80 | 144.60 | 144.60 | NA | 145.50 | 146.30 | 146.90 | NA | 147.20 | 147.10 | 147.10 | NA | 147.20 | 147.10 | 147.00 | NA | 147.40 | 147.40 | 147.20 | NA | 147.10 | 146.90 | 146.80 | NA | 146.50 | 146.30 | 146.10 | NA | 146.00 | 146.00 | NA | |
| Weighted Average Number Of Shares Outstanding Basic | 144.50 | 144.90 | 145.70 | NA | 144.00 | 144.00 | 144.00 | NA | 145.10 | 146.00 | 146.30 | NA | 146.50 | 146.50 | 146.30 | NA | 146.20 | 146.20 | 146.20 | NA | 146.60 | 146.60 | 146.50 | NA | 146.30 | 146.30 | 146.20 | NA | 146.10 | 146.00 | 146.10 | NA | 146.00 | 146.00 | NA | |
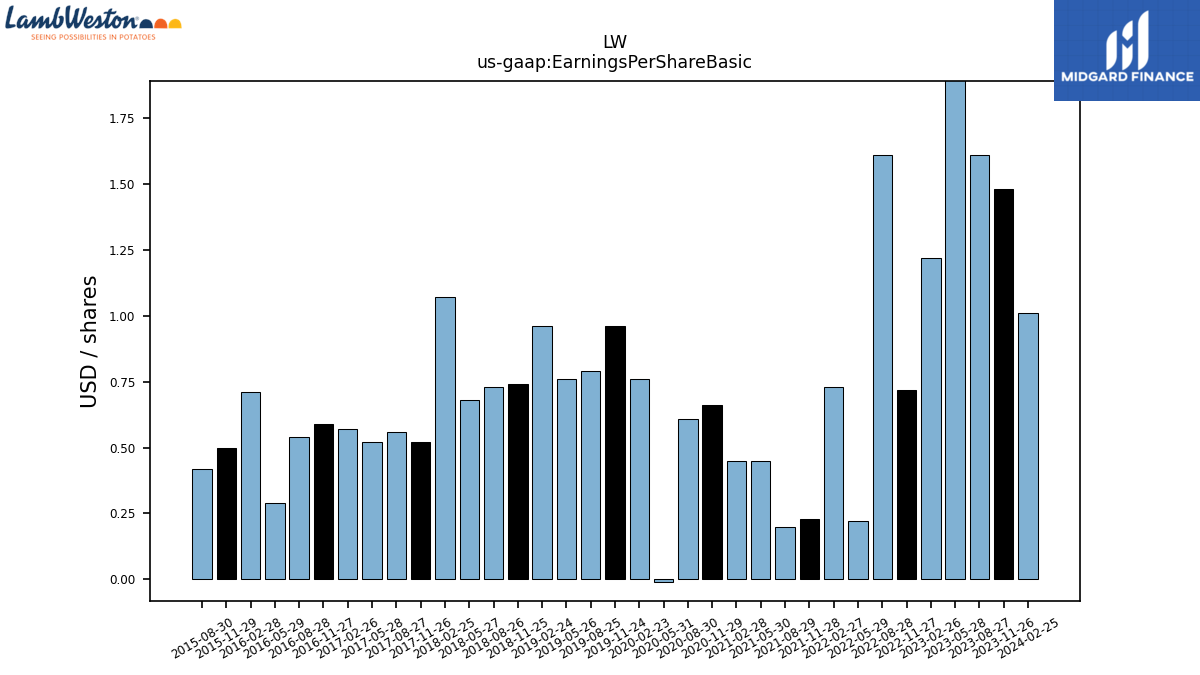
| Earnings Per Share Basic | 1.01 | 1.48 | 1.61 | 3.44 | 1.22 | 0.72 | 1.61 | 0.22 | 0.73 | 0.23 | 0.20 | 0.45 | 0.45 | 0.66 | 0.61 | -0.01 | 0.76 | 0.96 | 0.79 | 0.76 | 0.96 | 0.74 | 0.73 | 0.68 | 1.07 | 0.52 | 0.56 | 0.52 | 0.57 | 0.59 | 0.54 | 0.29 | 0.71 | 0.50 | 0.42 | |
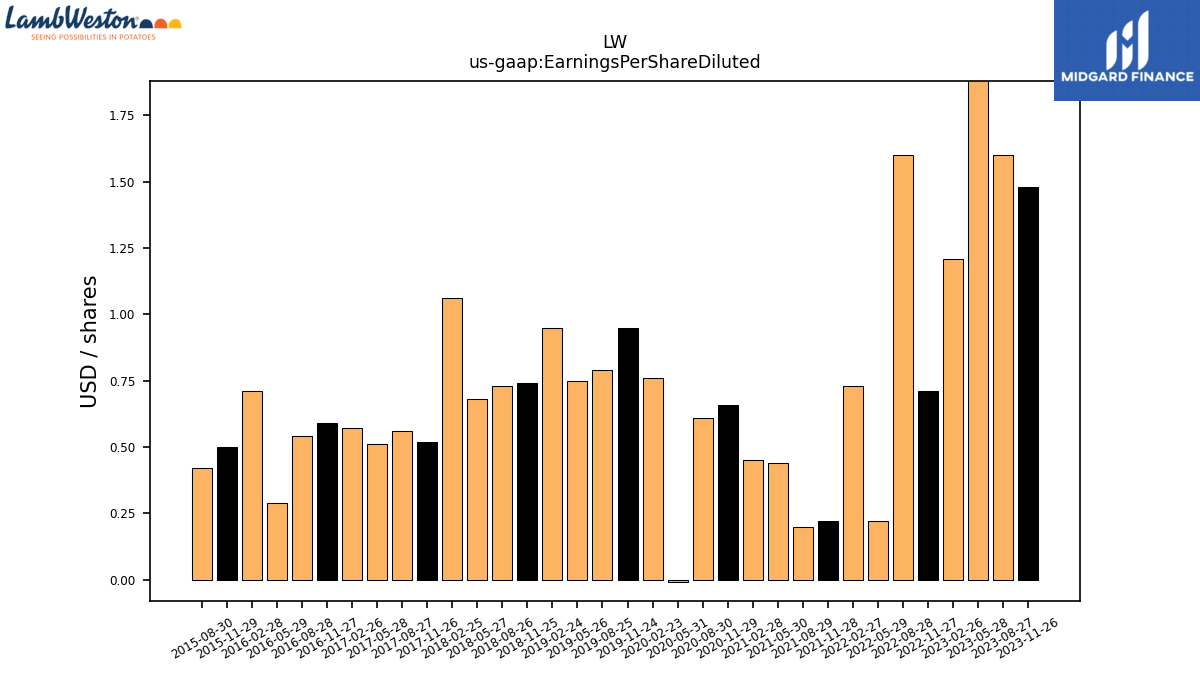
| Earnings Per Share Diluted | 1.01 | 1.48 | 1.60 | 3.42 | 1.21 | 0.71 | 1.60 | 0.22 | 0.73 | 0.22 | 0.20 | 0.44 | 0.45 | 0.66 | 0.61 | -0.01 | 0.76 | 0.95 | 0.79 | 0.75 | 0.95 | 0.74 | 0.73 | 0.68 | 1.06 | 0.52 | 0.56 | 0.51 | 0.57 | 0.59 | 0.54 | 0.29 | 0.71 | 0.50 | 0.42 |
| 2024-02-25 | 2023-11-26 | 2023-08-27 | 2023-05-28 | 2023-02-26 | 2022-11-27 | 2022-08-28 | 2022-05-29 | 2022-02-27 | 2021-11-28 | 2021-08-29 | 2021-05-30 | 2021-02-28 | 2020-11-29 | 2020-08-30 | 2020-05-31 | 2020-02-23 | 2019-11-24 | 2019-08-25 | 2019-05-26 | 2019-02-24 | 2018-11-25 | 2018-08-26 | 2018-05-27 | 2018-02-25 | 2017-11-26 | 2017-08-27 | 2017-05-28 | 2017-02-26 | 2016-11-27 | 2016-08-28 | 2016-05-29 | 2016-02-28 | 2015-11-29 | 2015-08-30 | ||
|---|---|---|---|---|---|---|---|---|---|---|---|---|---|---|---|---|---|---|---|---|---|---|---|---|---|---|---|---|---|---|---|---|---|---|---|---|
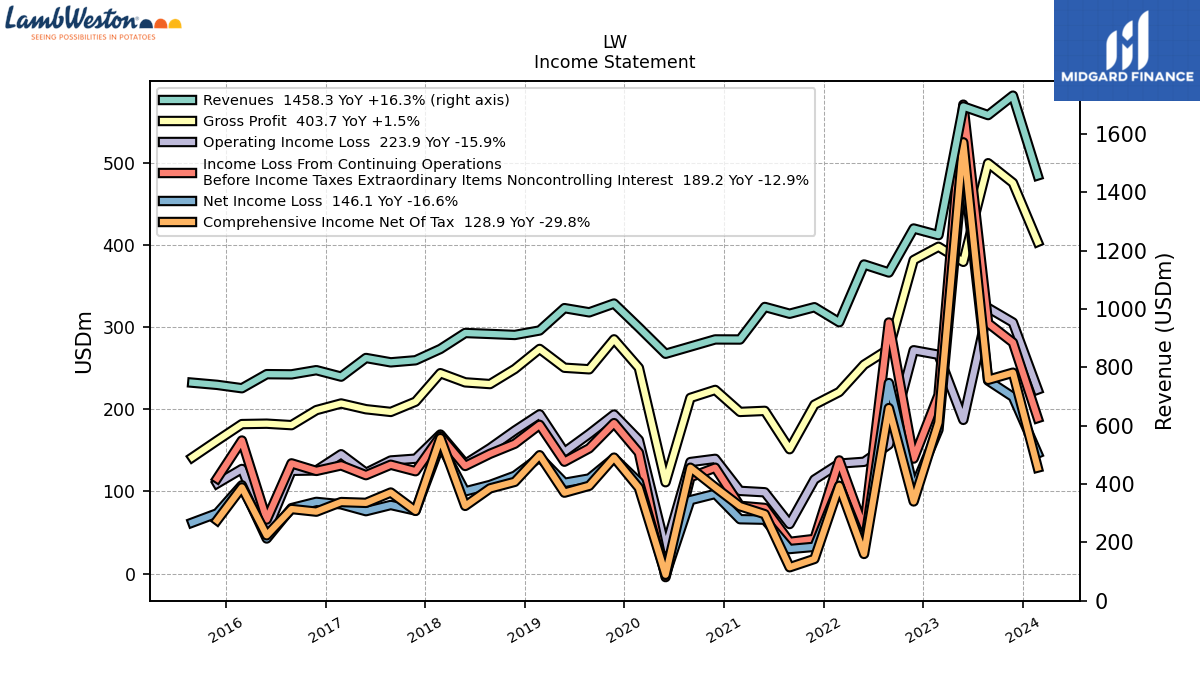
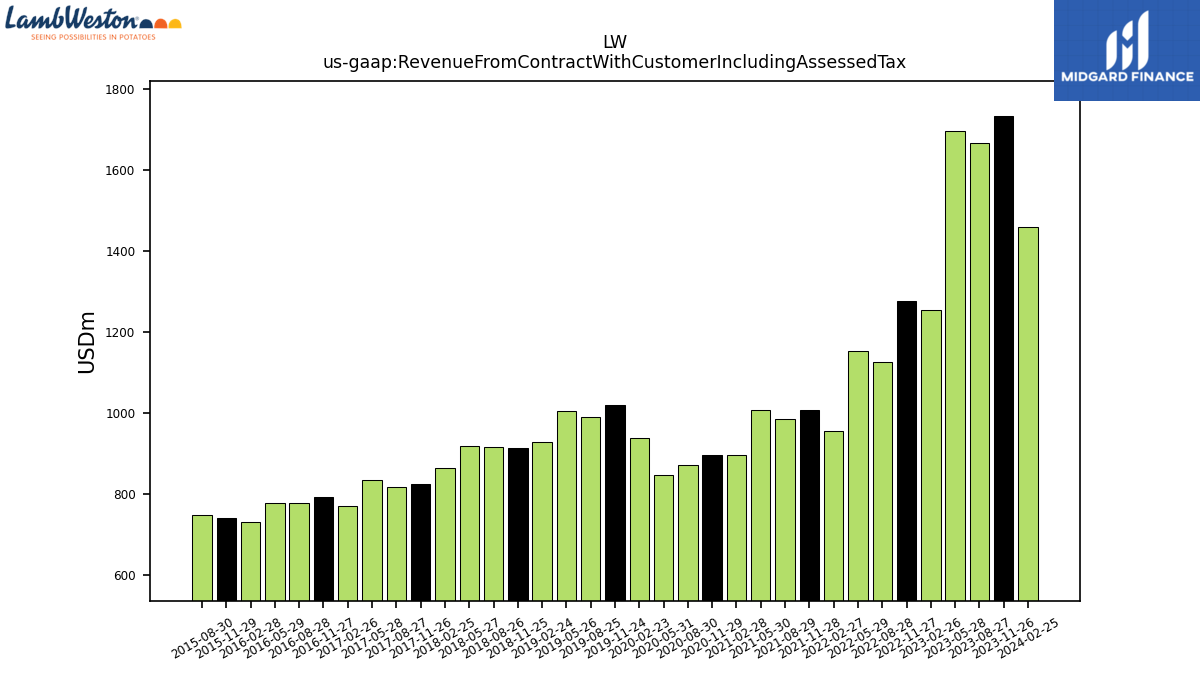
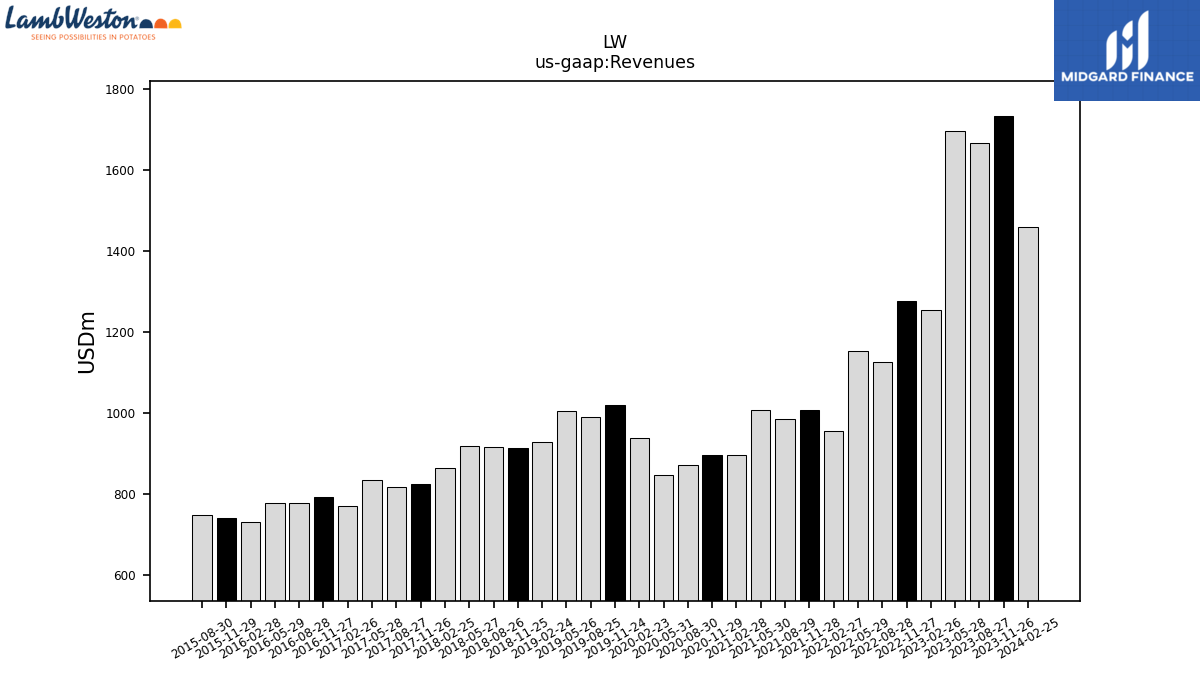
| Revenue From Contract With Customer Including Assessed Tax | 1458.30 | 1732.10 | 1665.30 | 1694.90 | 1253.60 | 1276.50 | 1125.60 | 1153.10 | 955.00 | 1006.60 | 984.20 | 1007.50 | 895.80 | 896.10 | 871.50 | 846.90 | 937.30 | 1019.20 | 989.00 | 1003.40 | 926.80 | 911.40 | 914.90 | 918.20 | 863.40 | 824.60 | 817.50 | 832.50 | 768.50 | 790.70 | 776.30 | 777.00 | 728.70 | 740.30 | 747.80 | |
| Revenues | 1458.30 | 1732.10 | 1665.30 | 1694.90 | 1253.60 | 1276.50 | 1125.60 | 1153.10 | 955.00 | 1006.60 | 984.20 | 1007.50 | 895.80 | 896.10 | 871.50 | 846.90 | 937.30 | 1019.20 | 989.00 | 1003.40 | 926.80 | 911.40 | 914.90 | 918.20 | 863.40 | 824.60 | 817.50 | 832.50 | 768.50 | 790.70 | 776.30 | 777.00 | 728.70 | 740.30 | 747.80 | |
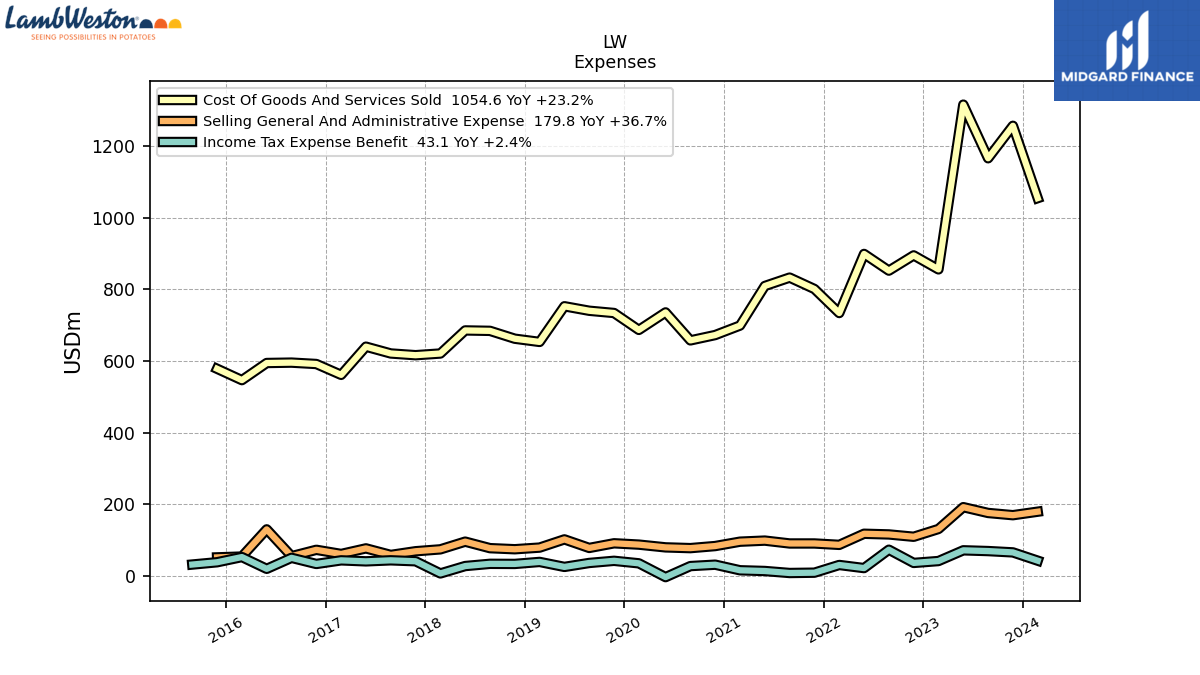
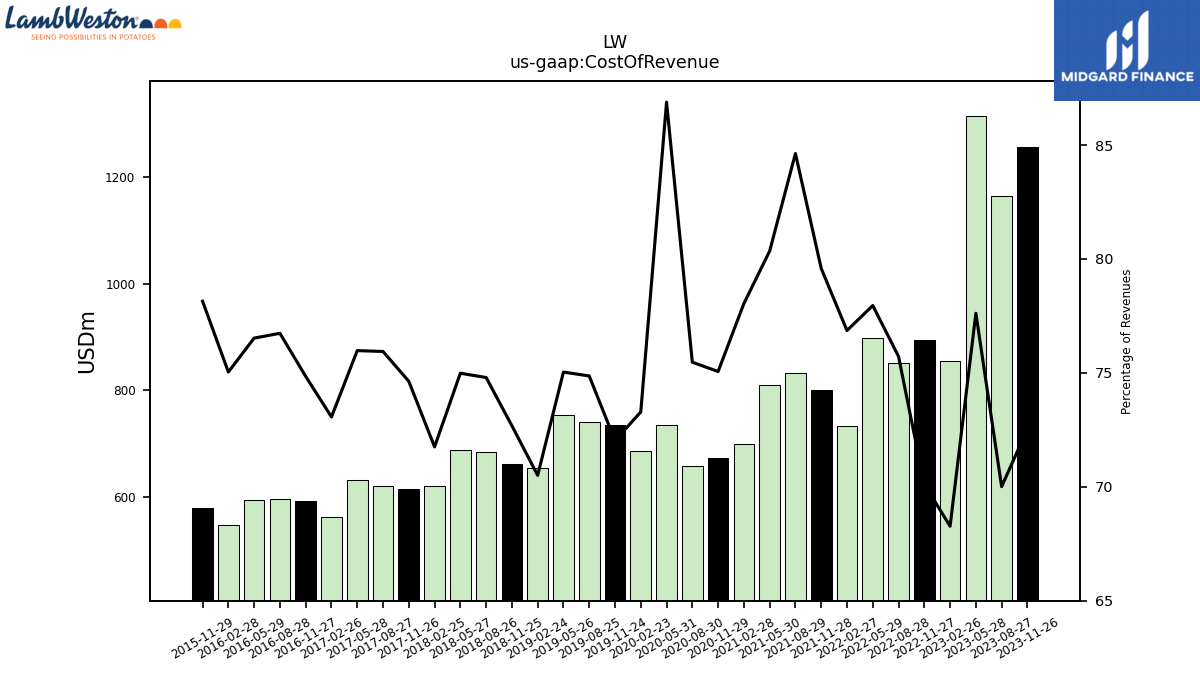
| Cost Of Revenue | 1054.60 | 1256.50 | 1165.80 | 1315.50 | 855.80 | 894.90 | 852.30 | 898.90 | 734.00 | 801.10 | 832.90 | 809.50 | 699.10 | 672.60 | 657.70 | 735.80 | 686.90 | 734.10 | 740.40 | 752.90 | 653.40 | 662.40 | 684.30 | 688.50 | 619.50 | 615.40 | 620.80 | 632.50 | 561.50 | 591.80 | 595.70 | 594.60 | 546.80 | 578.50 | NA | |
| Cost Of Goods And Services Sold | 1054.60 | 1256.50 | 1165.80 | 1315.50 | 855.80 | 894.90 | 852.30 | 898.90 | 734.00 | 801.10 | 832.90 | 809.50 | 699.10 | 672.60 | 657.70 | 735.80 | 686.90 | 734.10 | 740.40 | 752.90 | 653.40 | 662.40 | 684.30 | 685.50 | 621.10 | 616.40 | 621.20 | 640.20 | 561.50 | 591.80 | 595.70 | 594.60 | 546.80 | 578.50 | NA | |
| Gross Profit | 403.70 | 475.60 | 499.50 | 379.40 | 397.80 | 381.60 | 273.30 | 254.20 | 221.00 | 205.50 | 151.30 | 198.00 | 196.70 | 223.50 | 213.80 | 111.10 | 250.40 | 285.10 | 248.60 | 250.50 | 273.40 | 249.00 | 230.60 | 232.70 | 243.90 | 209.20 | 196.70 | 200.00 | 207.00 | 198.90 | 180.60 | 182.40 | 181.90 | 161.80 | 141.30 | |
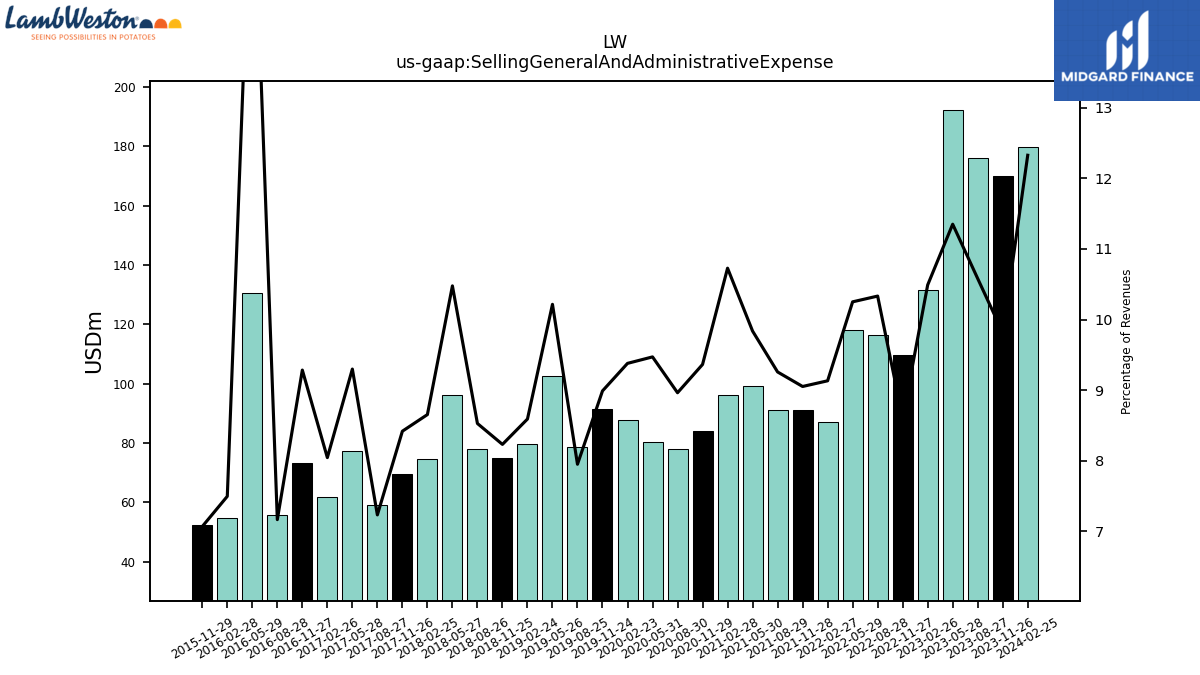
| Selling General And Administrative Expense | 179.80 | 170.00 | 176.20 | 192.40 | 131.50 | 109.80 | 116.30 | 118.20 | 87.20 | 91.10 | 91.10 | 99.10 | 96.10 | 83.90 | 78.10 | 80.20 | 87.90 | 91.60 | 78.60 | 102.50 | 79.60 | 75.00 | 78.00 | 96.20 | 74.70 | 69.40 | 59.10 | 77.40 | 61.80 | 73.40 | 55.60 | 130.50 | 54.60 | 52.30 | NA | |
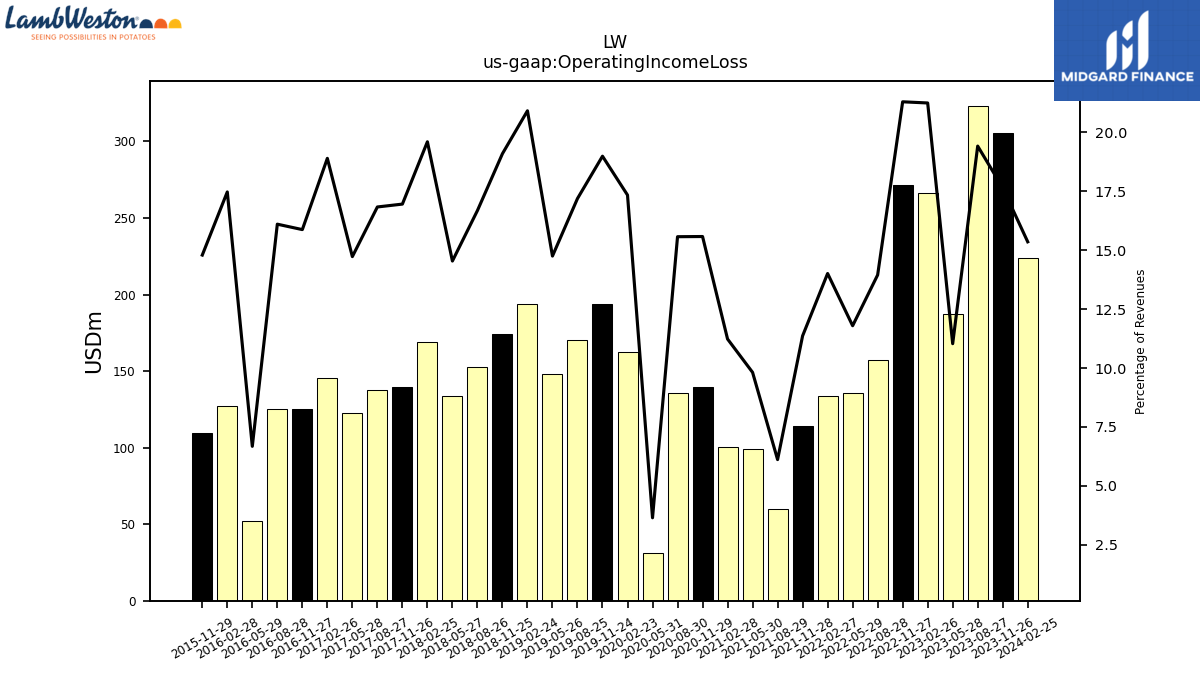
| Operating Income Loss | 223.90 | 305.60 | 323.30 | 187.00 | 266.30 | 271.80 | 157.00 | 136.00 | 133.80 | 114.40 | 60.20 | 98.90 | 100.60 | 139.60 | 135.70 | 30.90 | 162.50 | 193.50 | 170.00 | 148.00 | 193.80 | 174.00 | 152.60 | 133.50 | 169.20 | 139.80 | 137.60 | 122.60 | 145.20 | 125.50 | 125.00 | 51.90 | 127.30 | 109.50 | NA | |
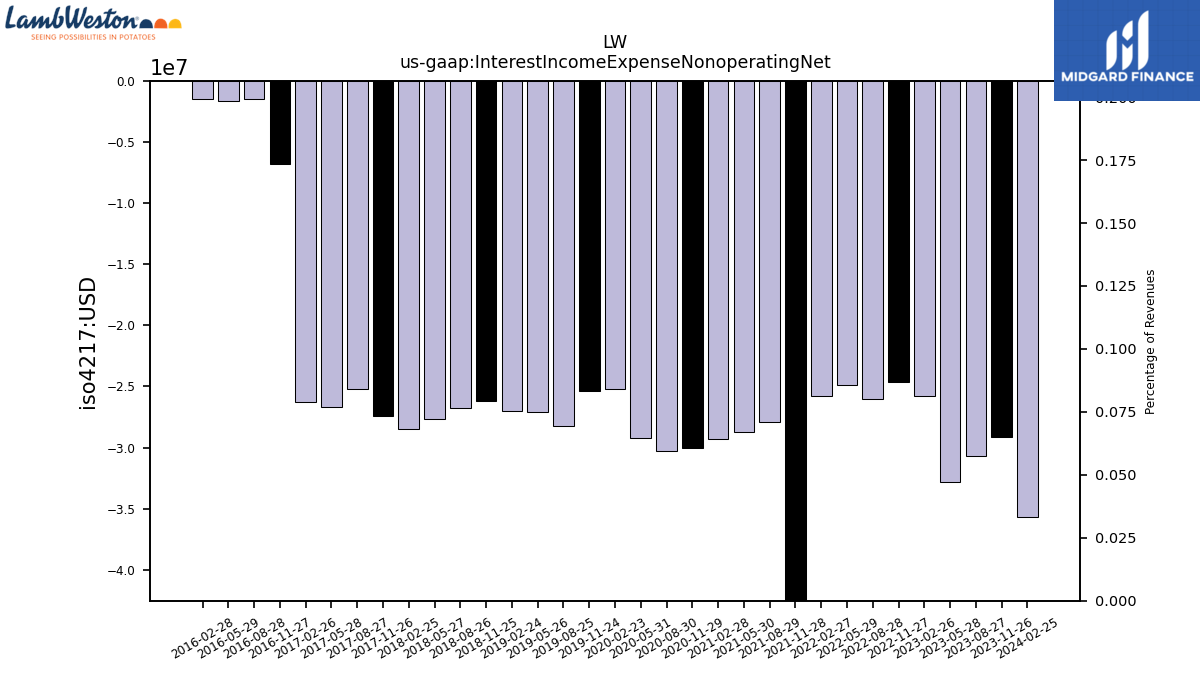
| Interest Income Expense Nonoperating Net | -35.70 | -29.10 | -30.70 | -32.80 | -25.80 | -24.60 | -26.00 | -24.90 | -25.80 | -82.40 | -27.90 | -28.70 | -29.30 | -30.00 | -30.30 | -29.20 | -25.20 | -25.40 | -28.20 | -27.10 | -27.00 | -26.20 | -26.80 | -27.70 | -28.50 | -27.40 | -25.20 | -26.70 | -26.30 | -6.80 | -1.50 | -1.60 | -1.50 | NA | NA | |
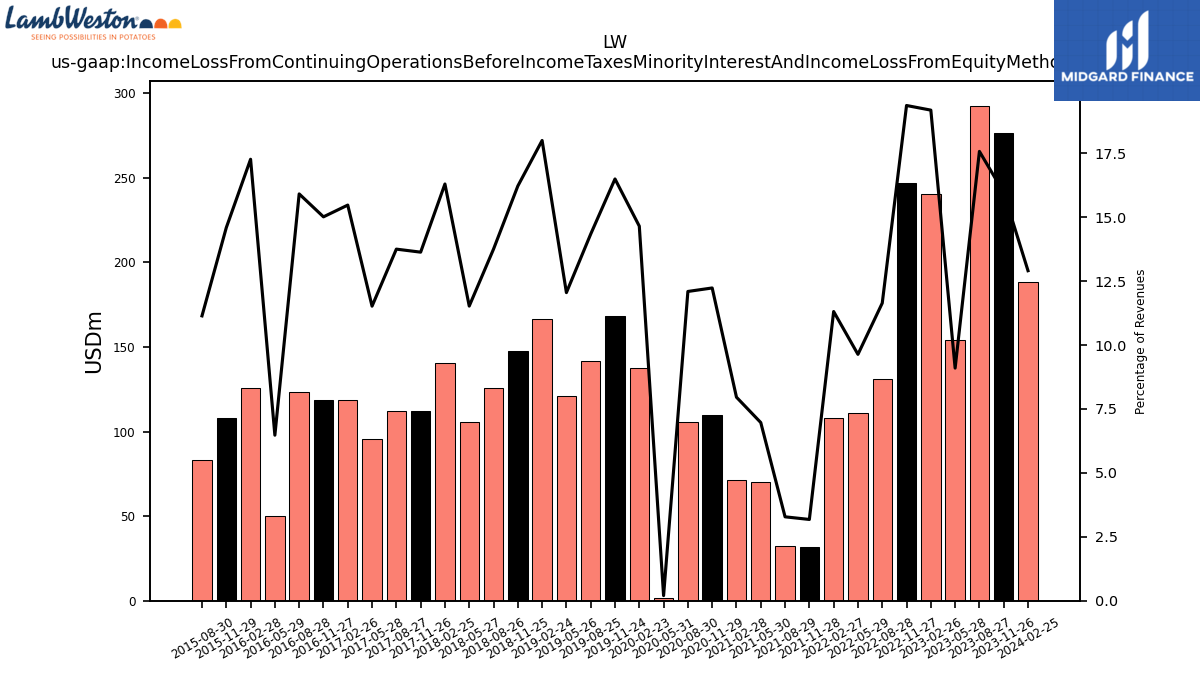
| Income Loss From Continuing Operations Before Income Taxes Minority Interest And Income Loss From Equity Method Investments | 188.20 | 276.50 | 292.60 | 154.20 | 240.50 | 247.20 | 131.00 | 111.10 | 108.00 | 32.00 | 32.30 | 70.20 | 71.30 | 109.60 | 105.40 | 1.70 | 137.30 | 168.10 | 141.80 | 120.90 | 166.80 | 147.80 | 125.80 | 105.80 | 140.70 | 112.40 | 112.40 | 95.90 | 118.90 | 118.70 | 123.50 | 50.30 | 125.80 | 108.00 | 83.30 | |
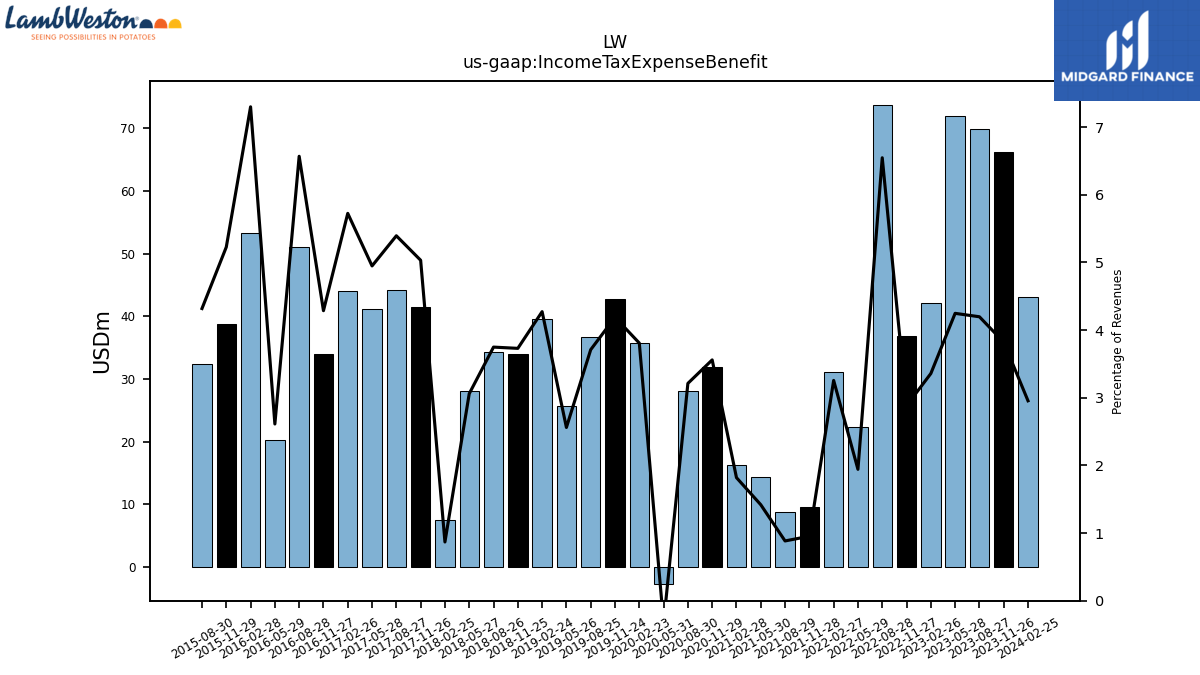
| Income Tax Expense Benefit | 43.10 | 66.20 | 69.90 | 72.00 | 42.10 | 36.80 | 73.70 | 22.40 | 31.10 | 9.60 | 8.70 | 14.30 | 16.30 | 31.90 | 28.00 | -2.80 | 35.70 | 42.70 | 36.70 | 25.70 | 39.60 | 34.00 | 34.30 | 28.10 | 7.50 | 41.50 | 44.10 | 41.20 | 44.00 | 33.90 | 51.00 | 20.30 | 53.20 | 38.70 | 32.30 | |
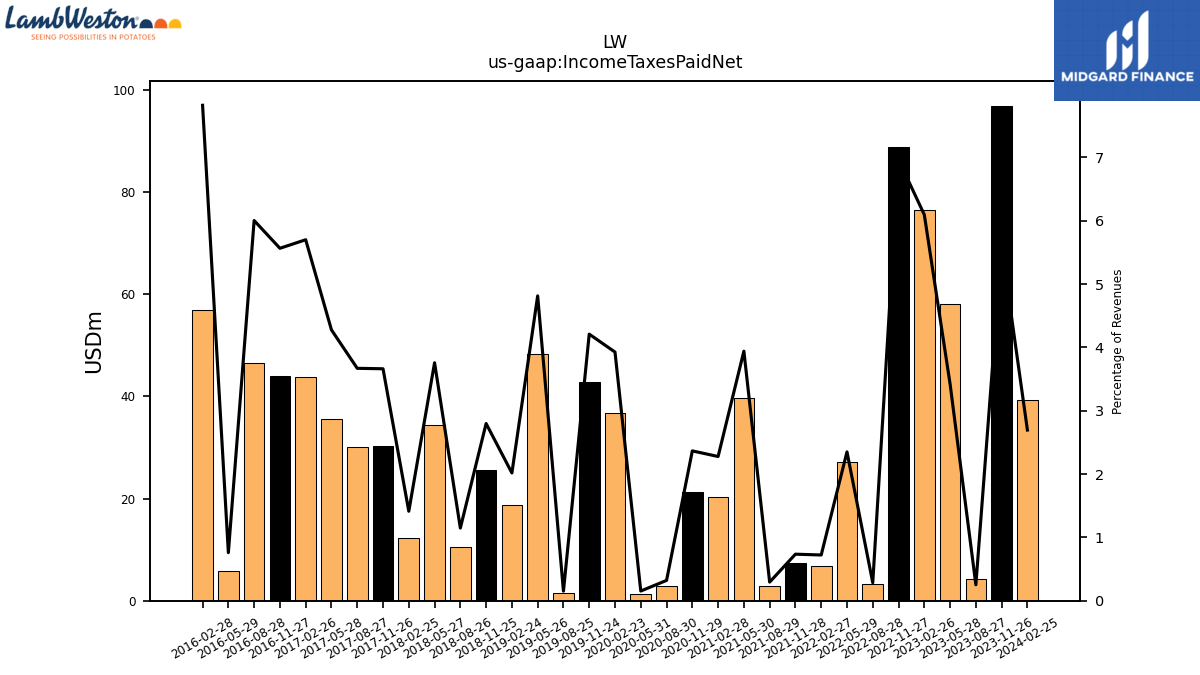
| Income Taxes Paid Net | 39.30 | 96.90 | 4.20 | 58.00 | 76.40 | 88.90 | 3.20 | 27.10 | 6.90 | 7.40 | 2.90 | 39.70 | 20.40 | 21.20 | 2.80 | 1.30 | 36.80 | 42.90 | 1.50 | 48.30 | 18.70 | 25.50 | 10.50 | 34.50 | 12.20 | 30.20 | 30.00 | 35.60 | 43.80 | 44.00 | 46.60 | 5.90 | 57.00 | NA | NA | |
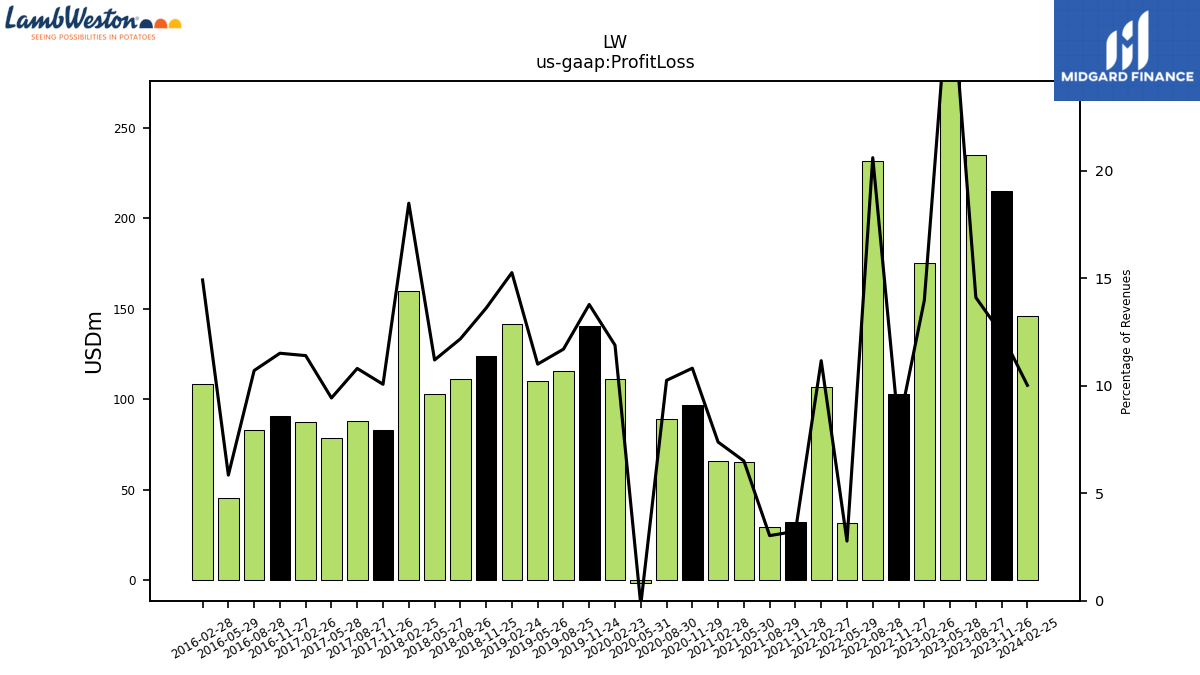
| Profit Loss | 146.10 | 215.00 | 234.80 | 498.80 | 175.10 | 103.10 | 231.90 | 32.00 | 106.60 | 32.50 | 29.80 | 65.50 | 66.10 | 96.90 | 89.30 | -1.60 | 111.40 | 140.40 | 115.70 | 110.40 | 141.40 | 124.00 | 111.40 | 102.80 | 159.60 | 83.00 | 88.30 | 78.50 | 87.60 | 91.00 | 83.10 | 45.40 | 108.70 | NA | NA | |
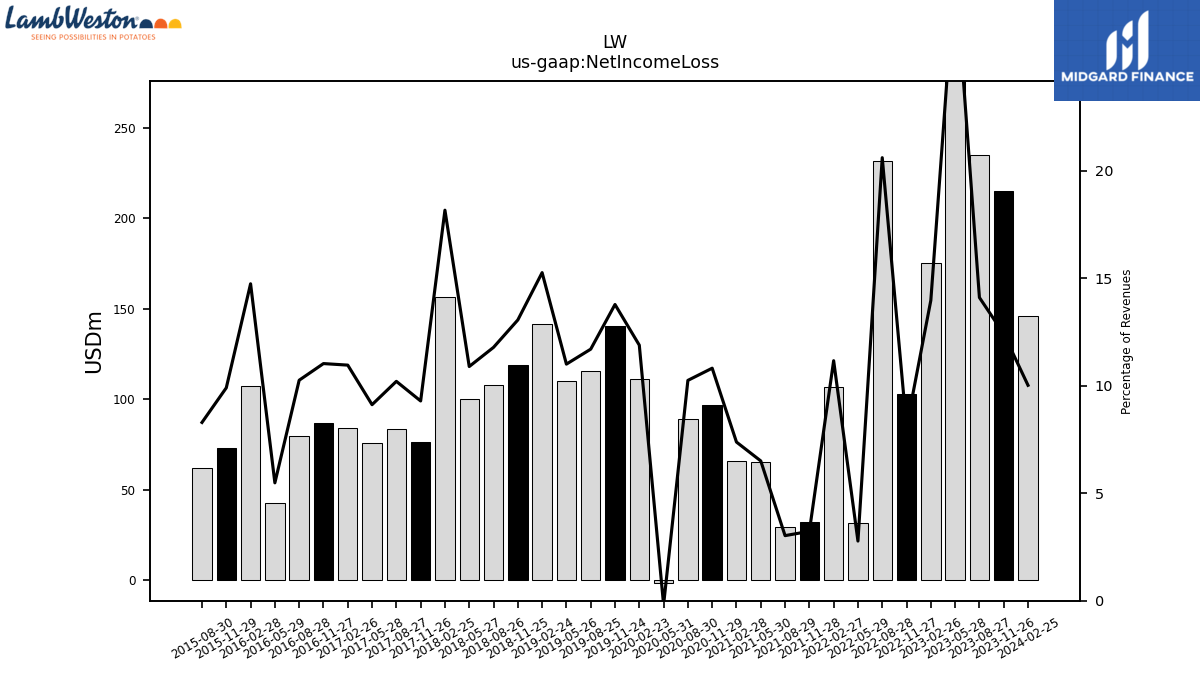
| Net Income Loss | 146.10 | 215.00 | 234.80 | 498.80 | 175.10 | 103.10 | 231.90 | 32.00 | 106.60 | 32.50 | 29.80 | 65.50 | 66.10 | 96.90 | 89.30 | -1.60 | 111.40 | 140.40 | 115.70 | 110.40 | 141.40 | 119.00 | 107.80 | 100.00 | 156.80 | 76.60 | 83.40 | 75.90 | 84.20 | 87.20 | 79.60 | 42.60 | 107.40 | 73.30 | 62.00 | |
| Comprehensive Income Net Of Tax | 128.90 | 244.50 | 235.80 | 524.90 | 183.70 | 87.70 | 201.40 | 23.80 | 106.70 | 17.70 | 7.60 | 72.20 | 81.90 | 104.90 | 128.80 | -1.50 | 104.30 | 141.10 | 106.80 | 98.40 | 144.00 | 111.60 | 103.60 | 82.30 | 164.80 | 76.20 | 98.60 | 86.00 | 87.00 | 75.30 | 78.50 | 46.50 | 104.80 | 64.70 | NA | |
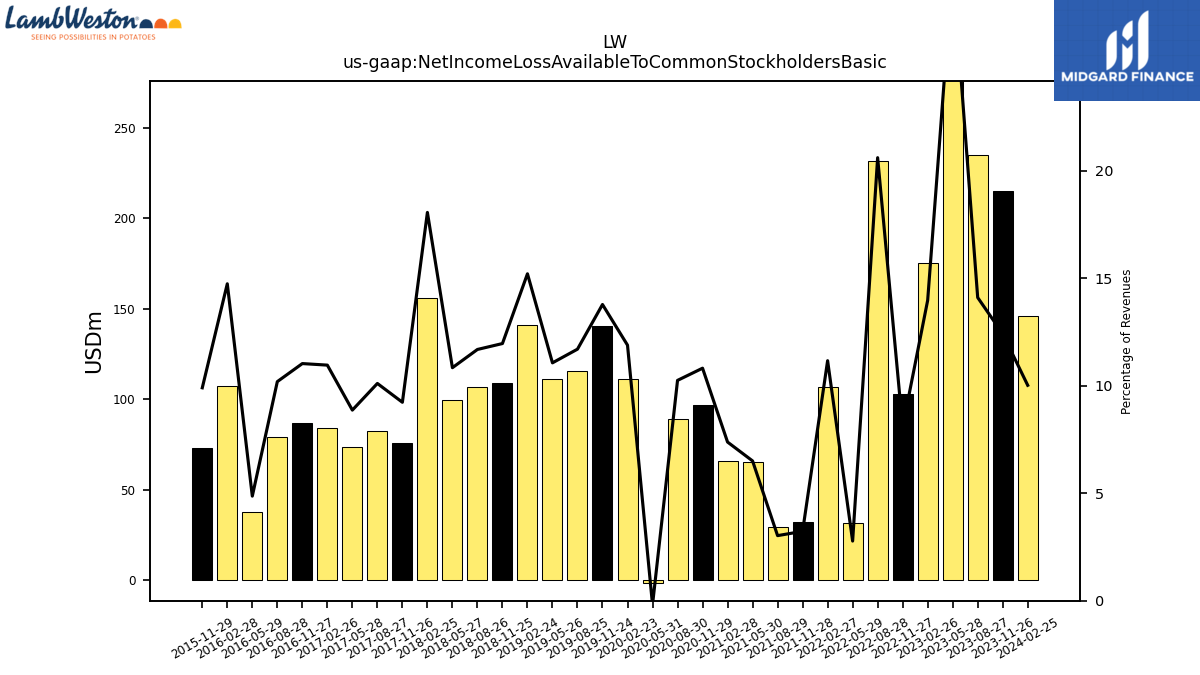
| Net Income Loss Available To Common Stockholders Basic | 146.10 | 215.00 | 234.80 | 498.80 | 175.10 | 103.10 | 231.90 | 32.00 | 106.60 | 32.50 | 29.80 | 65.50 | 66.10 | 96.90 | 89.30 | -1.60 | 111.40 | 140.40 | 115.70 | 111.00 | 140.90 | 109.00 | 106.90 | 99.50 | 155.90 | 76.10 | 82.60 | 73.80 | 84.20 | 87.20 | 79.10 | 37.80 | 107.40 | 73.30 | NA | |
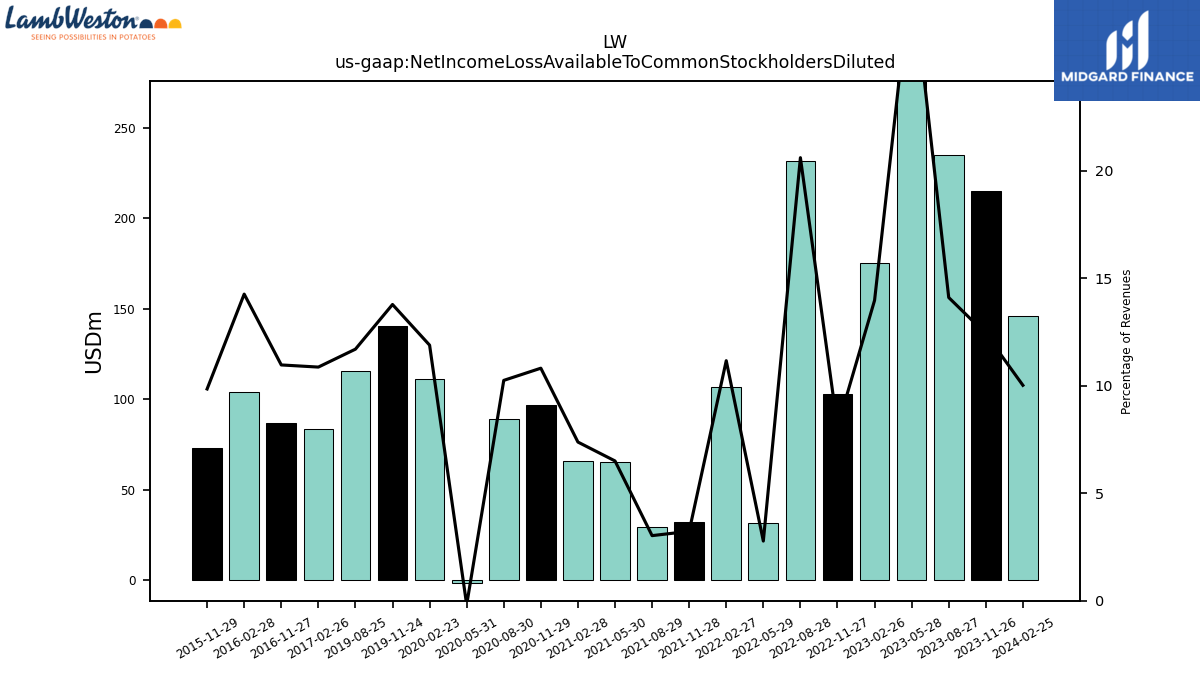
| Net Income Loss Available To Common Stockholders Diluted | 146.10 | 215.00 | 234.80 | 498.80 | 175.10 | 103.10 | 231.90 | 32.00 | 106.60 | 32.50 | 29.80 | 65.50 | 66.10 | 96.90 | 89.30 | -1.60 | 111.40 | 140.40 | 115.70 | NA | NA | NA | NA | NA | NA | NA | NA | NA | 83.50 | 86.70 | NA | NA | 103.90 | 72.90 | NA |
| 2024-02-25 | 2023-11-26 | 2023-08-27 | 2023-05-28 | 2023-02-26 | 2022-11-27 | 2022-08-28 | 2022-05-29 | 2022-02-27 | 2021-11-28 | 2021-08-29 | 2021-05-30 | 2021-02-28 | 2020-11-29 | 2020-08-30 | 2020-05-31 | 2020-02-23 | 2019-11-24 | 2019-08-25 | 2019-05-26 | 2019-02-24 | 2018-11-25 | 2018-08-26 | 2018-05-27 | 2018-02-25 | 2017-11-26 | 2017-08-27 | 2017-05-28 | 2017-02-26 | 2016-11-27 | 2016-08-28 | 2016-05-29 | 2016-02-28 | 2015-11-29 | 2015-08-30 | ||
|---|---|---|---|---|---|---|---|---|---|---|---|---|---|---|---|---|---|---|---|---|---|---|---|---|---|---|---|---|---|---|---|---|---|---|---|---|
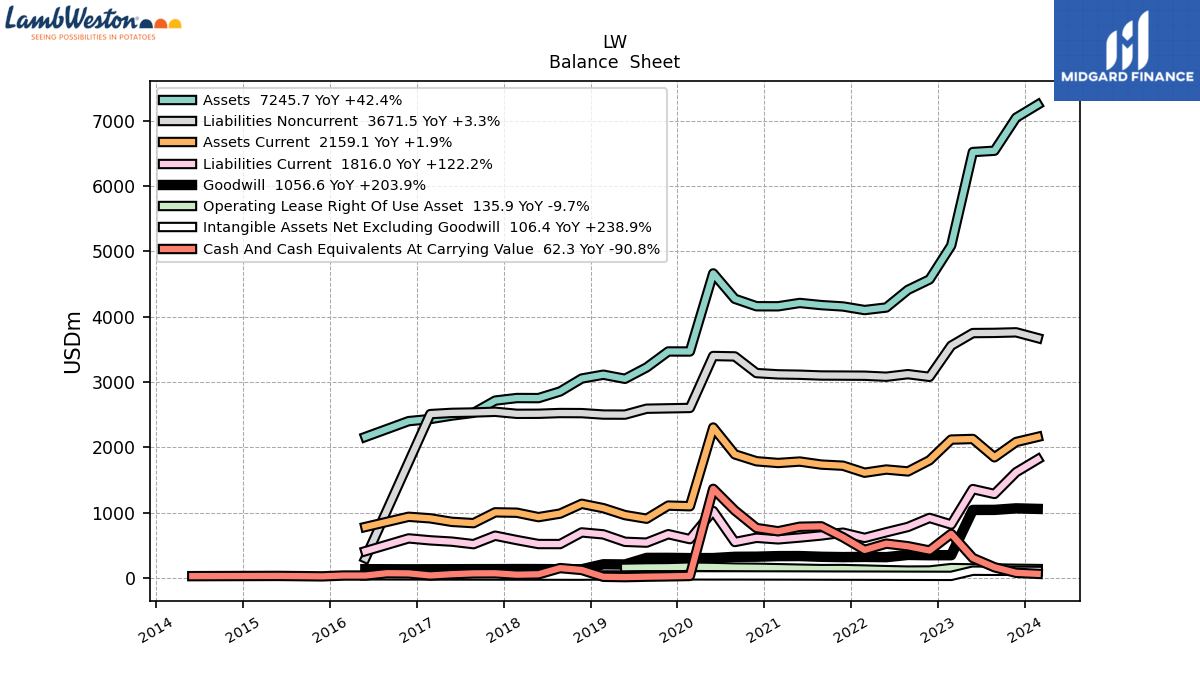
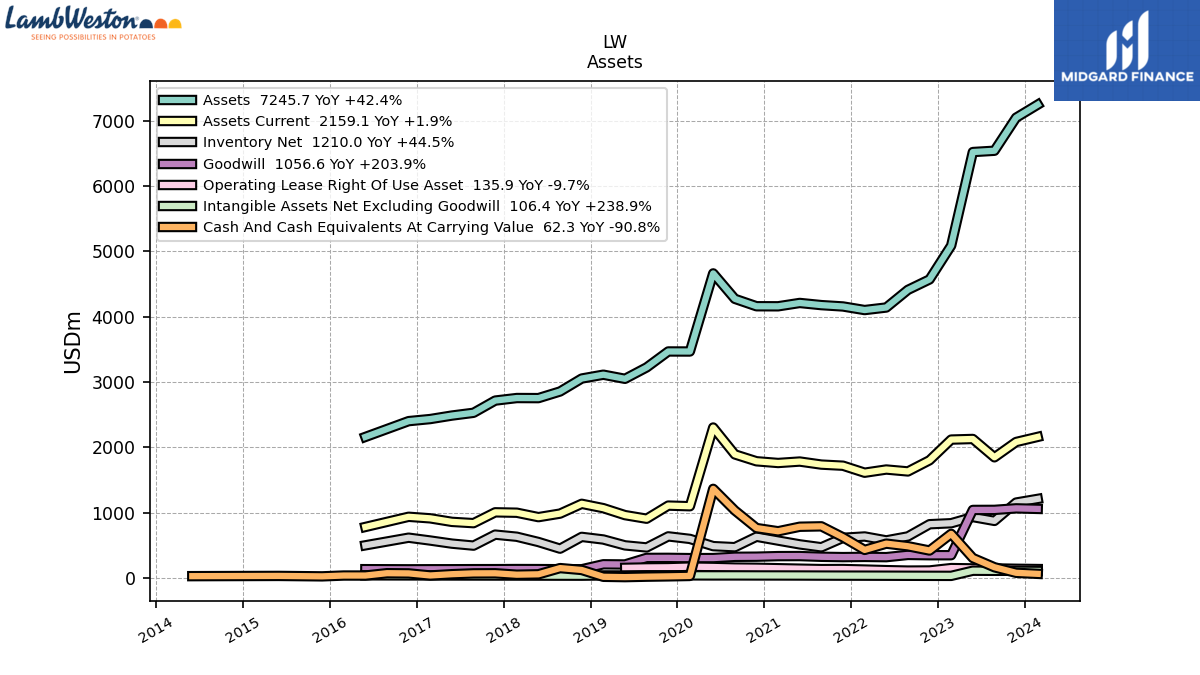
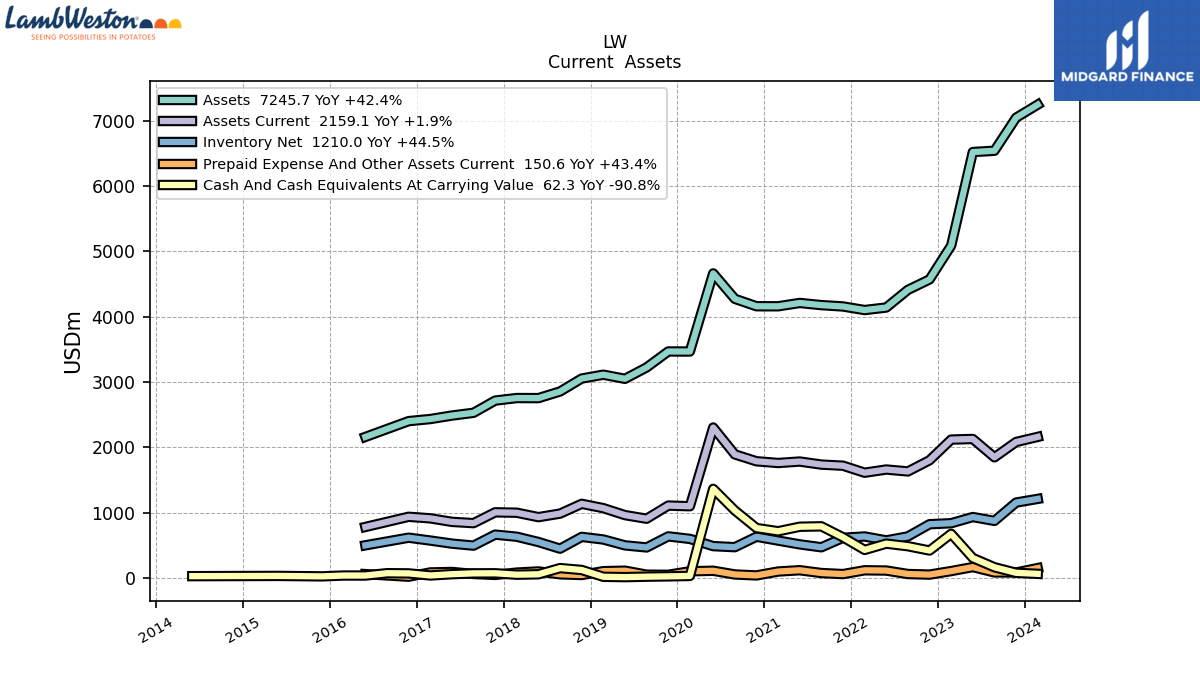
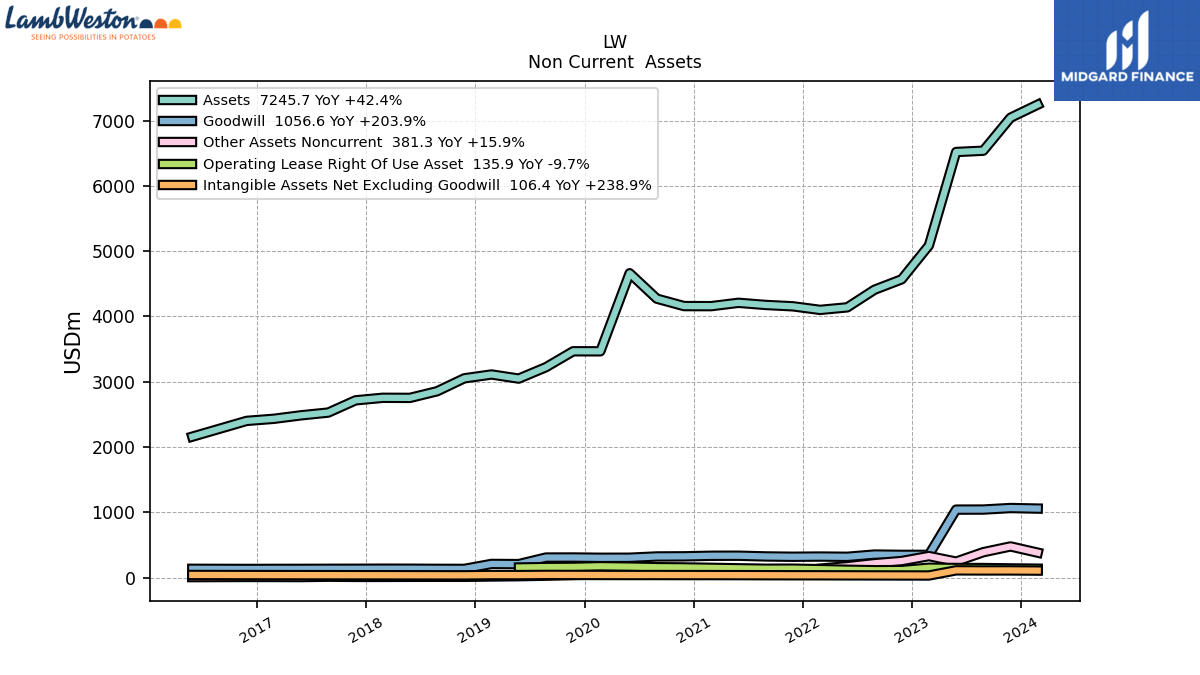
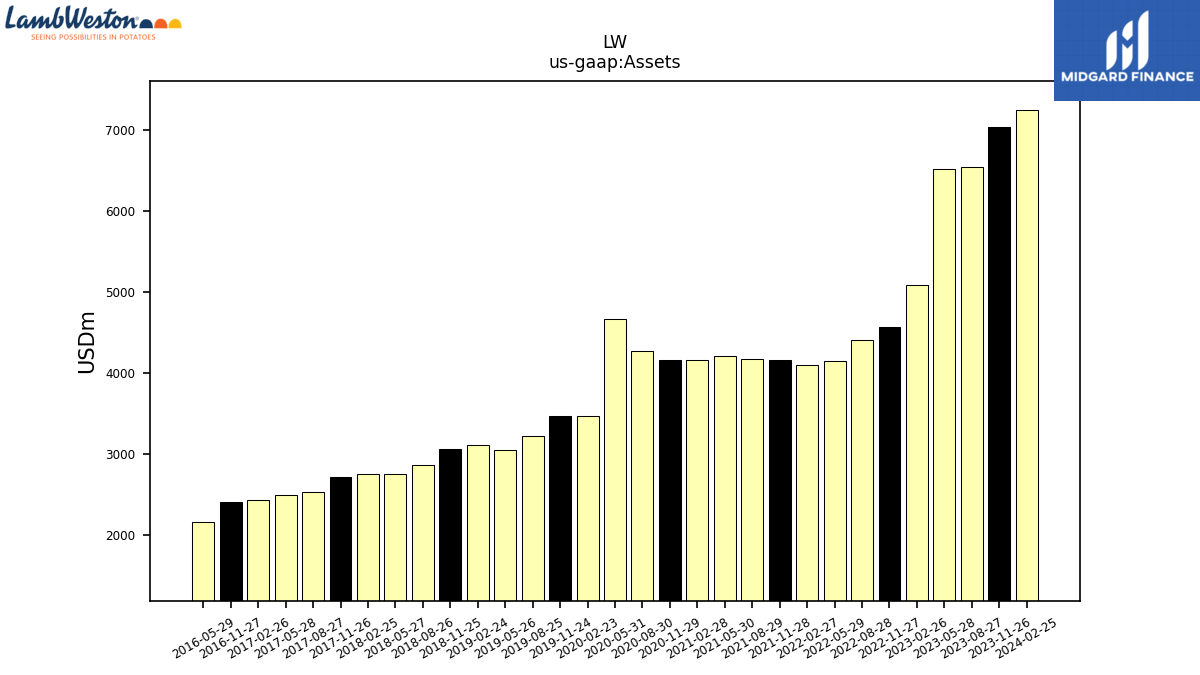
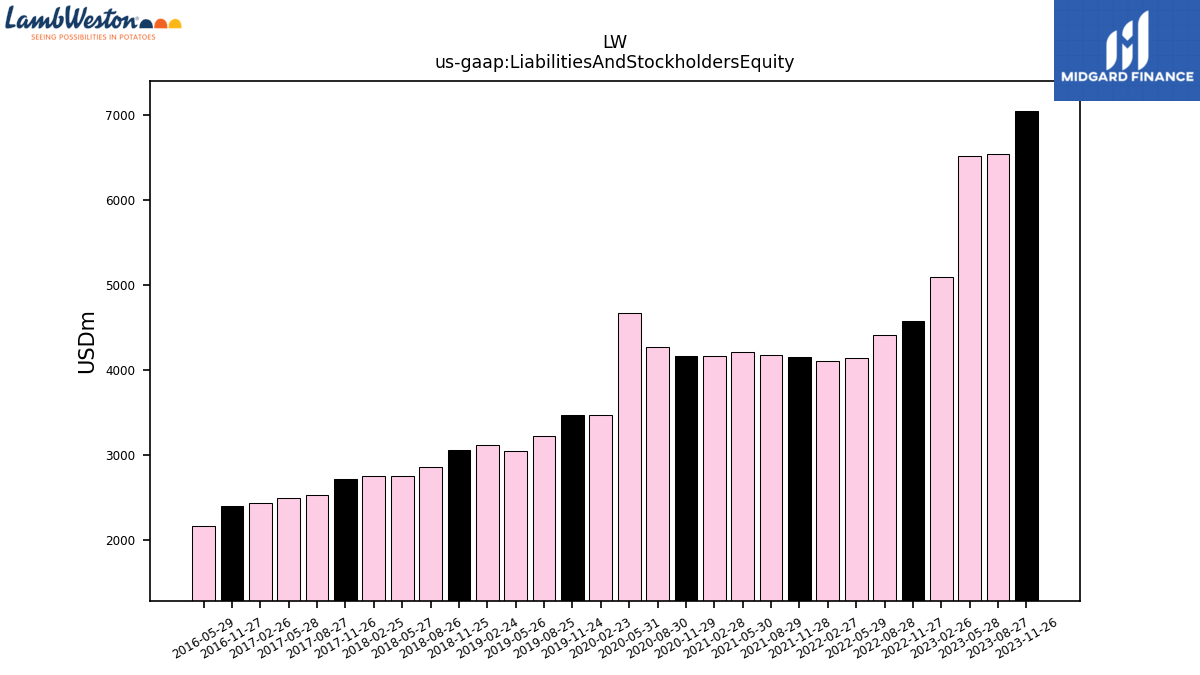
| Assets | 7245.70 | 7045.30 | 6539.60 | 6519.80 | 5087.30 | 4569.60 | 4409.70 | 4139.80 | 4100.80 | 4155.60 | 4176.30 | 4209.40 | 4158.20 | 4159.10 | 4272.60 | 4662.30 | 3466.20 | 3466.80 | 3222.60 | 3048.10 | 3111.20 | 3052.50 | 2854.30 | 2752.60 | 2753.90 | 2714.90 | 2527.80 | 2485.60 | 2432.20 | 2400.20 | NA | 2158.30 | NA | NA | NA | |
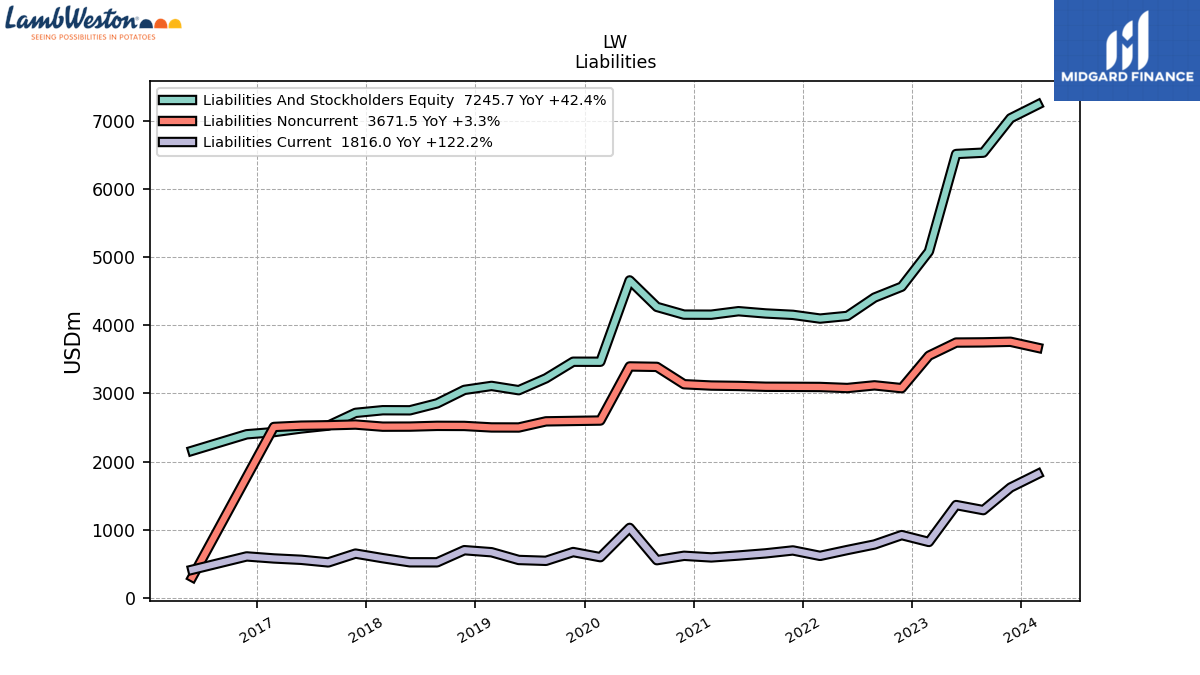
| Liabilities And Stockholders Equity | 7245.70 | 7045.30 | 6539.60 | 6519.80 | 5087.30 | 4569.60 | 4409.70 | 4139.80 | 4100.80 | 4155.60 | 4176.30 | 4209.40 | 4158.20 | 4159.10 | 4272.60 | 4662.30 | 3466.20 | 3466.80 | 3222.60 | 3048.10 | 3111.20 | 3052.50 | 2854.30 | 2752.60 | 2753.90 | 2714.90 | 2527.80 | 2485.60 | 2432.20 | 2400.20 | NA | 2158.30 | NA | NA | NA |
| 2024-02-25 | 2023-11-26 | 2023-08-27 | 2023-05-28 | 2023-02-26 | 2022-11-27 | 2022-08-28 | 2022-05-29 | 2022-02-27 | 2021-11-28 | 2021-08-29 | 2021-05-30 | 2021-02-28 | 2020-11-29 | 2020-08-30 | 2020-05-31 | 2020-02-23 | 2019-11-24 | 2019-08-25 | 2019-05-26 | 2019-02-24 | 2018-11-25 | 2018-08-26 | 2018-05-27 | 2018-02-25 | 2017-11-26 | 2017-08-27 | 2017-05-28 | 2017-02-26 | 2016-11-27 | 2016-08-28 | 2016-05-29 | 2016-02-28 | 2015-11-29 | 2015-08-30 | ||
|---|---|---|---|---|---|---|---|---|---|---|---|---|---|---|---|---|---|---|---|---|---|---|---|---|---|---|---|---|---|---|---|---|---|---|---|---|
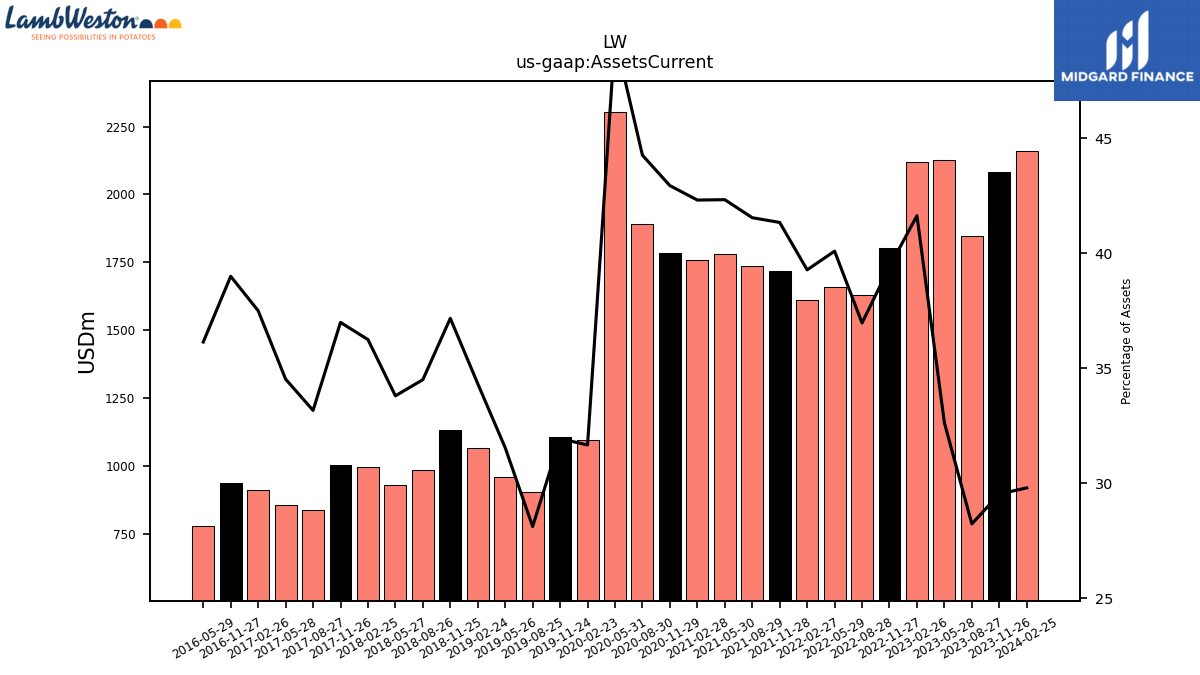
| Assets Current | 2159.10 | 2080.90 | 1846.30 | 2127.20 | 2117.90 | 1801.10 | 1630.20 | 1659.60 | 1610.70 | 1717.80 | 1735.00 | 1781.70 | 1759.40 | 1785.80 | 1891.00 | 2302.60 | 1097.50 | 1107.30 | 906.20 | 961.50 | 1068.00 | 1134.60 | 984.80 | 930.40 | 998.20 | 1004.30 | 838.40 | 858.20 | 912.10 | 936.00 | NA | 780.00 | NA | NA | NA | |
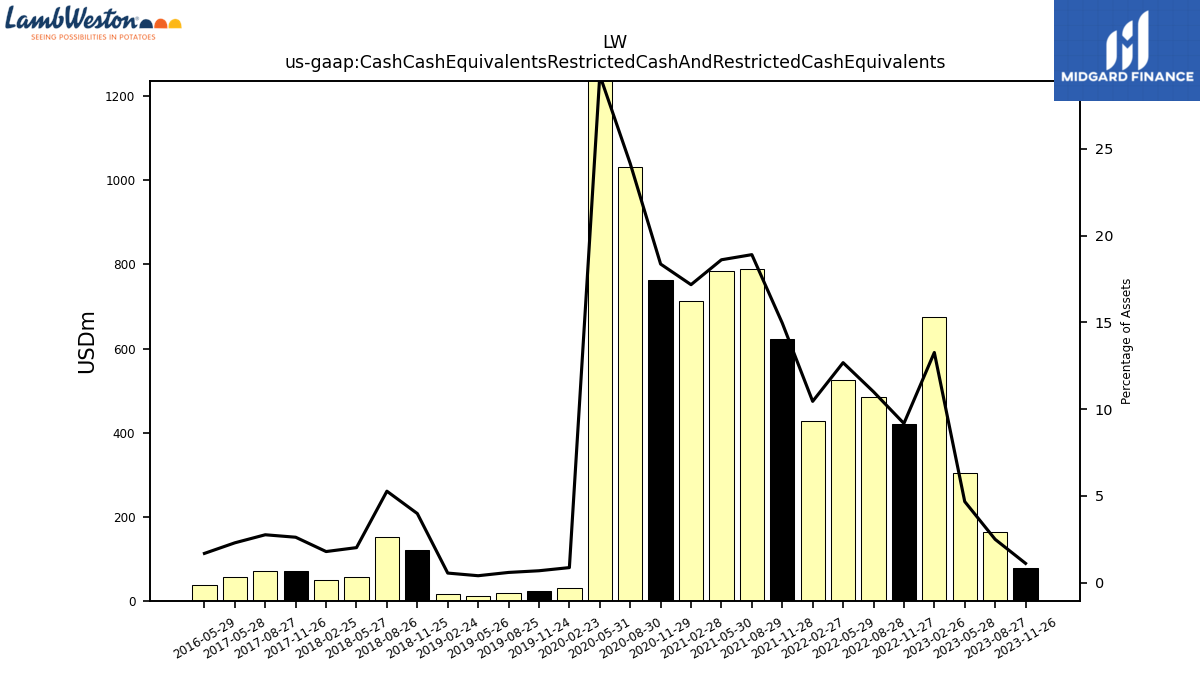
| Cash And Cash Equivalents At Carrying Value | 62.30 | 78.30 | 163.30 | 304.80 | 675.00 | 419.40 | 485.30 | 525.00 | 428.60 | 621.90 | 789.70 | 783.50 | 714.30 | 763.90 | 1032.50 | 1364.00 | 30.10 | 23.80 | 19.00 | 12.20 | 17.20 | 121.60 | 150.50 | 55.60 | 49.40 | 71.10 | 69.80 | 57.10 | 37.50 | 69.40 | 72.40 | 36.40 | 36.60 | 23.90 | NA | |
| Cash Cash Equivalents Restricted Cash And Restricted Cash Equivalents | 62.30 | 78.30 | 163.30 | 304.80 | 675.00 | 419.40 | 485.30 | 525.00 | 428.60 | 621.90 | 789.70 | 783.50 | 714.30 | 763.90 | 1032.50 | 1364.00 | 30.10 | 23.80 | 19.00 | 12.20 | 17.20 | 121.60 | 150.50 | 55.60 | 49.40 | 71.10 | 69.80 | 57.10 | NA | NA | NA | 36.40 | NA | NA | NA | |
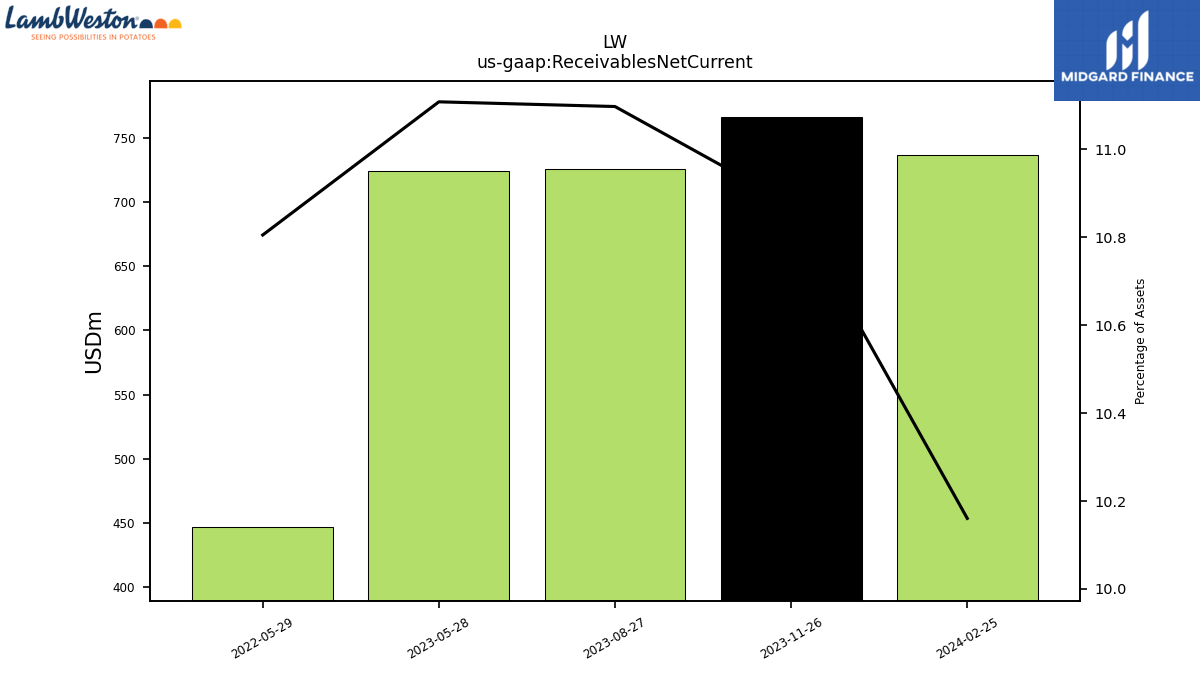
| Receivables Net Current | 736.20 | 766.20 | 725.70 | 724.20 | NA | NA | NA | 447.30 | NA | NA | NA | NA | NA | NA | NA | NA | NA | NA | NA | NA | NA | NA | NA | NA | NA | NA | NA | NA | NA | NA | NA | NA | NA | NA | NA | |
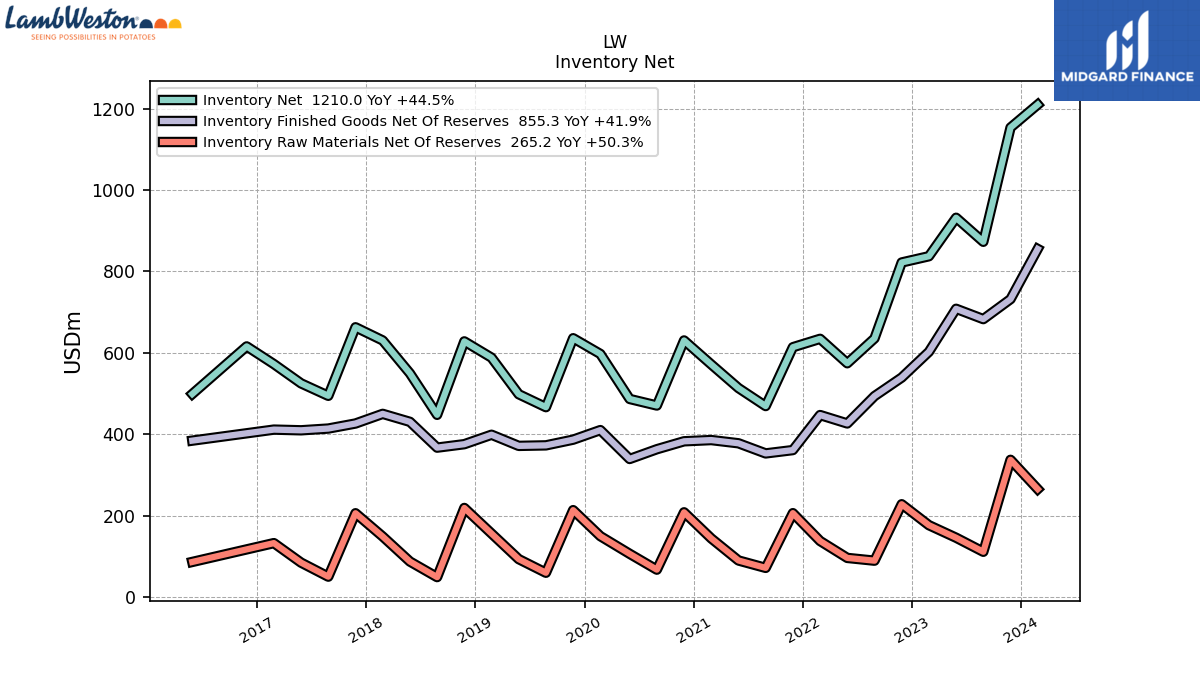
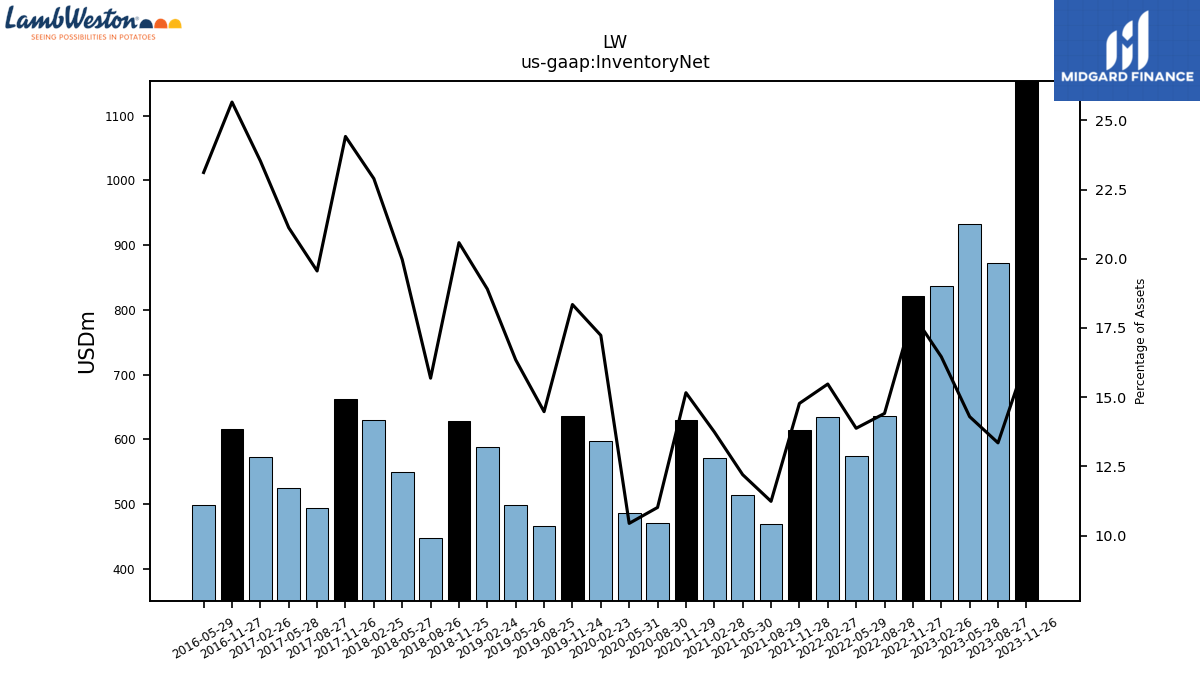
| Inventory Net | 1210.00 | 1153.60 | 872.90 | 932.00 | 837.40 | 822.10 | 635.50 | 574.40 | 634.50 | 613.90 | 469.20 | 513.50 | 571.50 | 630.50 | 470.60 | 486.70 | 597.30 | 636.00 | 466.50 | 498.30 | 588.20 | 628.20 | 447.70 | 549.70 | 630.50 | 662.90 | 494.40 | 525.00 | 572.40 | 615.90 | NA | 498.90 | NA | NA | NA | |
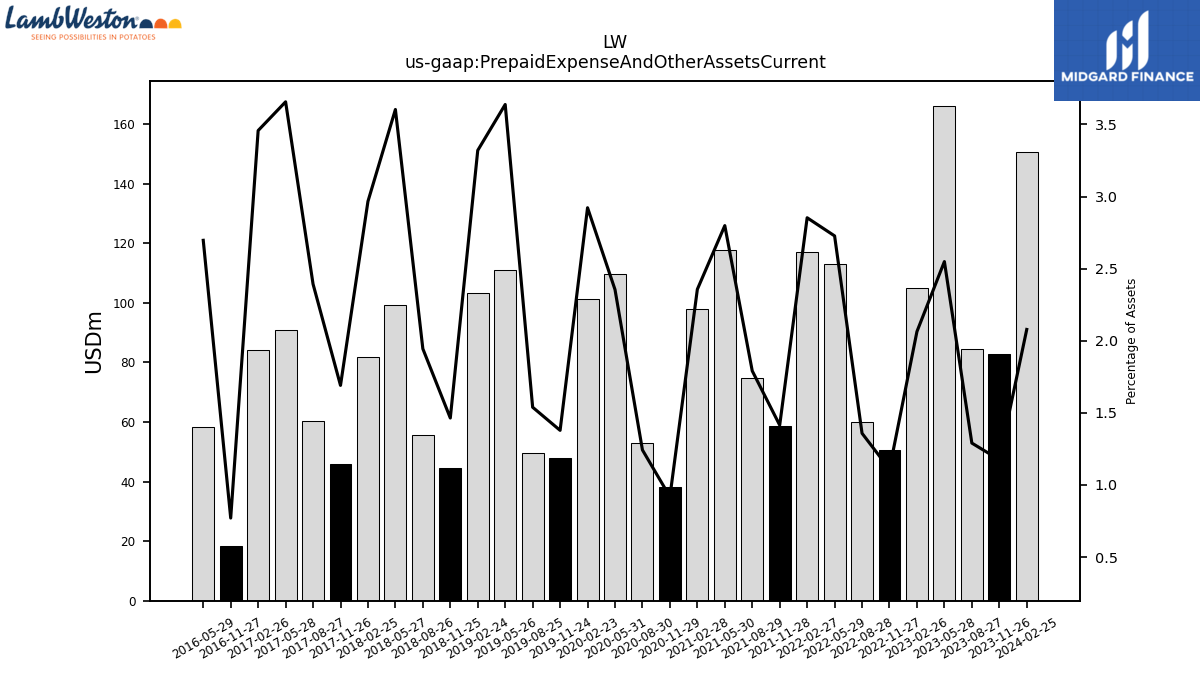
| Prepaid Expense And Other Assets Current | 150.60 | 82.80 | 84.40 | 166.20 | 105.00 | 50.70 | 59.90 | 112.90 | 117.00 | 58.80 | 74.80 | 117.80 | 98.00 | 38.20 | 53.10 | 109.80 | 101.30 | 47.80 | 49.60 | 110.90 | 103.30 | 44.70 | 55.50 | 99.20 | 81.70 | 45.90 | 60.50 | 90.90 | 84.10 | 18.50 | NA | 58.20 | NA | NA | NA |
| 2024-02-25 | 2023-11-26 | 2023-08-27 | 2023-05-28 | 2023-02-26 | 2022-11-27 | 2022-08-28 | 2022-05-29 | 2022-02-27 | 2021-11-28 | 2021-08-29 | 2021-05-30 | 2021-02-28 | 2020-11-29 | 2020-08-30 | 2020-05-31 | 2020-02-23 | 2019-11-24 | 2019-08-25 | 2019-05-26 | 2019-02-24 | 2018-11-25 | 2018-08-26 | 2018-05-27 | 2018-02-25 | 2017-11-26 | 2017-08-27 | 2017-05-28 | 2017-02-26 | 2016-11-27 | 2016-08-28 | 2016-05-29 | 2016-02-28 | 2015-11-29 | 2015-08-30 | ||
|---|---|---|---|---|---|---|---|---|---|---|---|---|---|---|---|---|---|---|---|---|---|---|---|---|---|---|---|---|---|---|---|---|---|---|---|---|
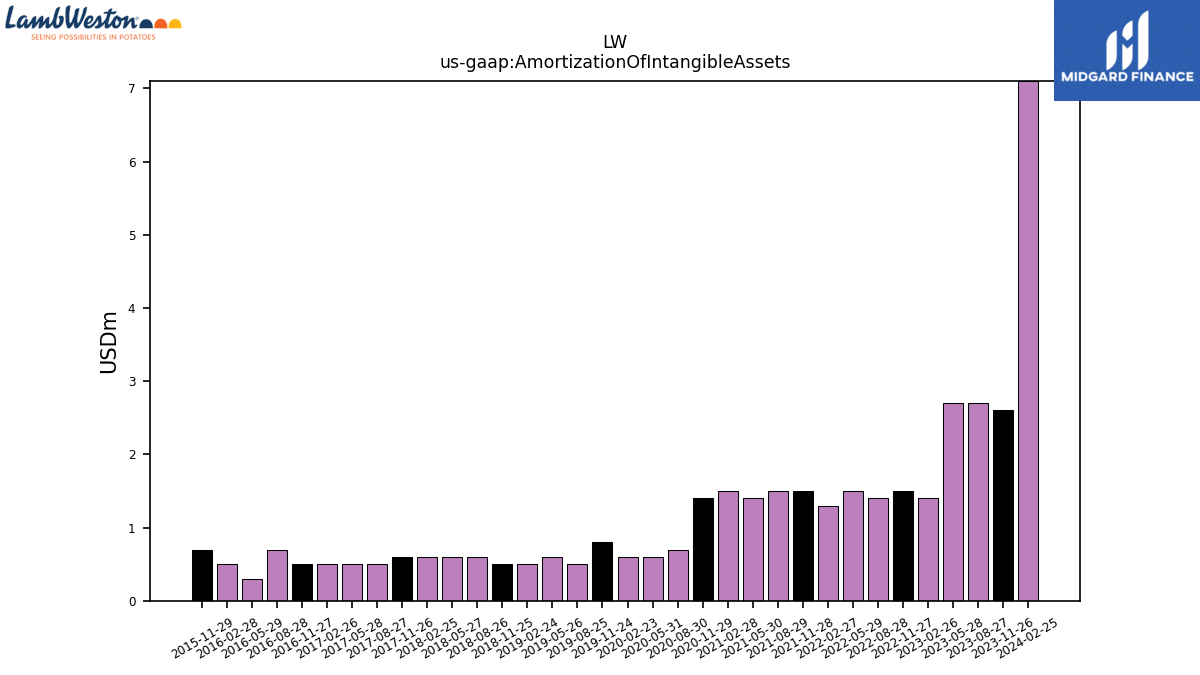
| Amortization Of Intangible Assets | 7.10 | 2.60 | 2.70 | 2.70 | 1.40 | 1.50 | 1.40 | 1.50 | 1.30 | 1.50 | 1.50 | 1.40 | 1.50 | 1.40 | 0.70 | 0.60 | 0.60 | 0.80 | 0.50 | 0.60 | 0.50 | 0.50 | 0.60 | 0.60 | 0.60 | 0.60 | 0.50 | 0.50 | 0.50 | 0.50 | 0.70 | 0.30 | 0.50 | 0.70 | NA | |
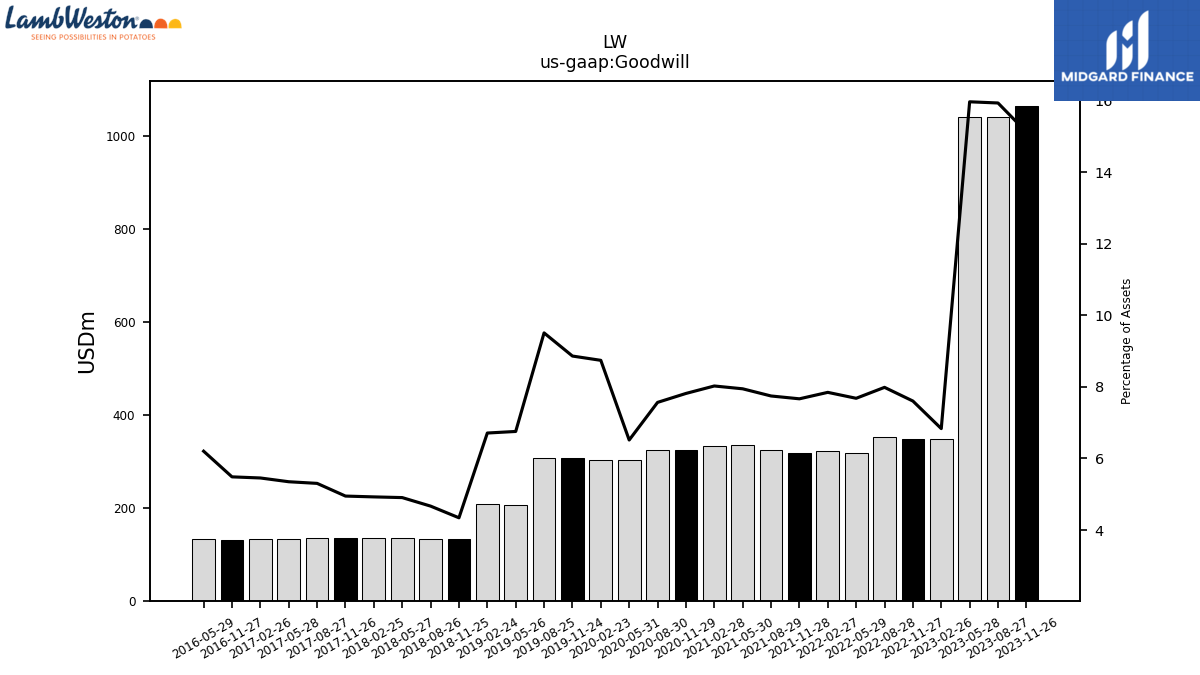
| Goodwill | 1056.60 | 1065.10 | 1041.70 | 1040.70 | 347.70 | 347.50 | 352.20 | 318.00 | 321.80 | 318.60 | 323.50 | 334.50 | 333.70 | 325.10 | 323.30 | 303.80 | 303.00 | 307.20 | 306.40 | 205.90 | 208.80 | 132.60 | 133.30 | 135.10 | 135.70 | 134.40 | 134.10 | 133.00 | 132.70 | 131.70 | NA | 133.90 | NA | NA | NA | |
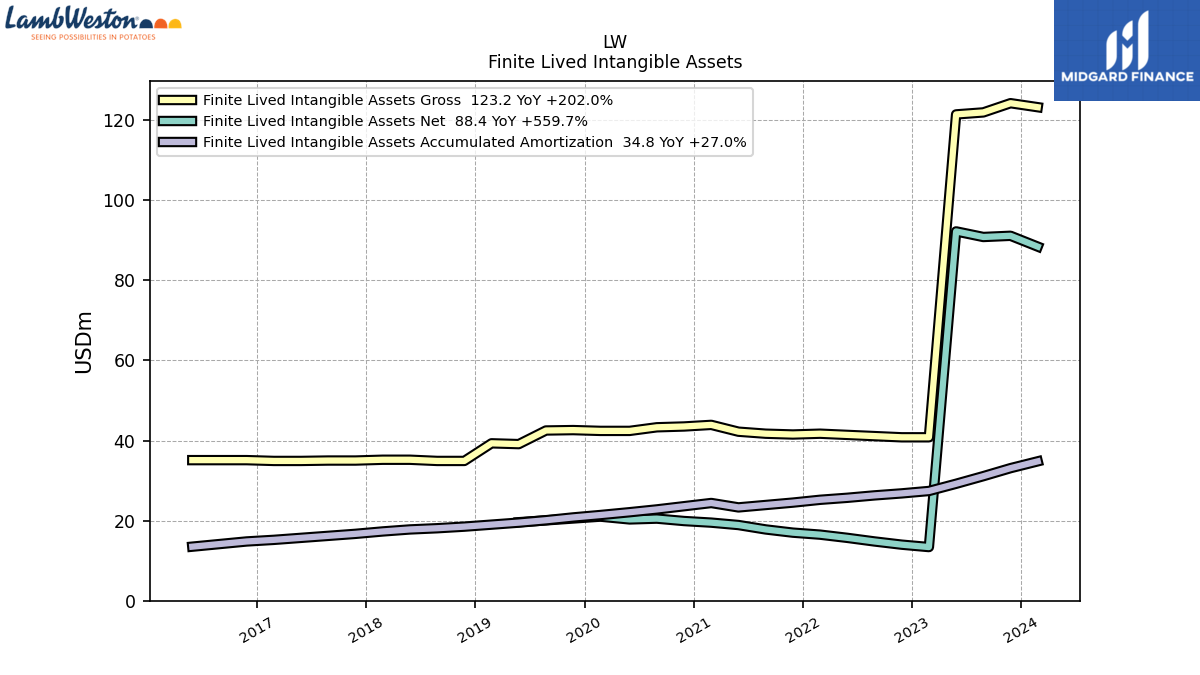
| Intangible Assets Net Excluding Goodwill | 106.40 | 109.10 | 108.80 | 110.20 | 31.40 | 32.00 | 32.80 | 33.70 | 34.50 | 35.00 | 35.80 | 36.90 | 37.50 | 37.90 | 38.50 | 38.30 | 39.00 | 39.80 | 40.40 | 37.60 | 38.30 | 34.40 | 34.80 | 35.40 | 35.90 | 36.30 | 36.80 | 37.20 | 37.70 | 38.30 | NA | 39.60 | NA | NA | NA | |
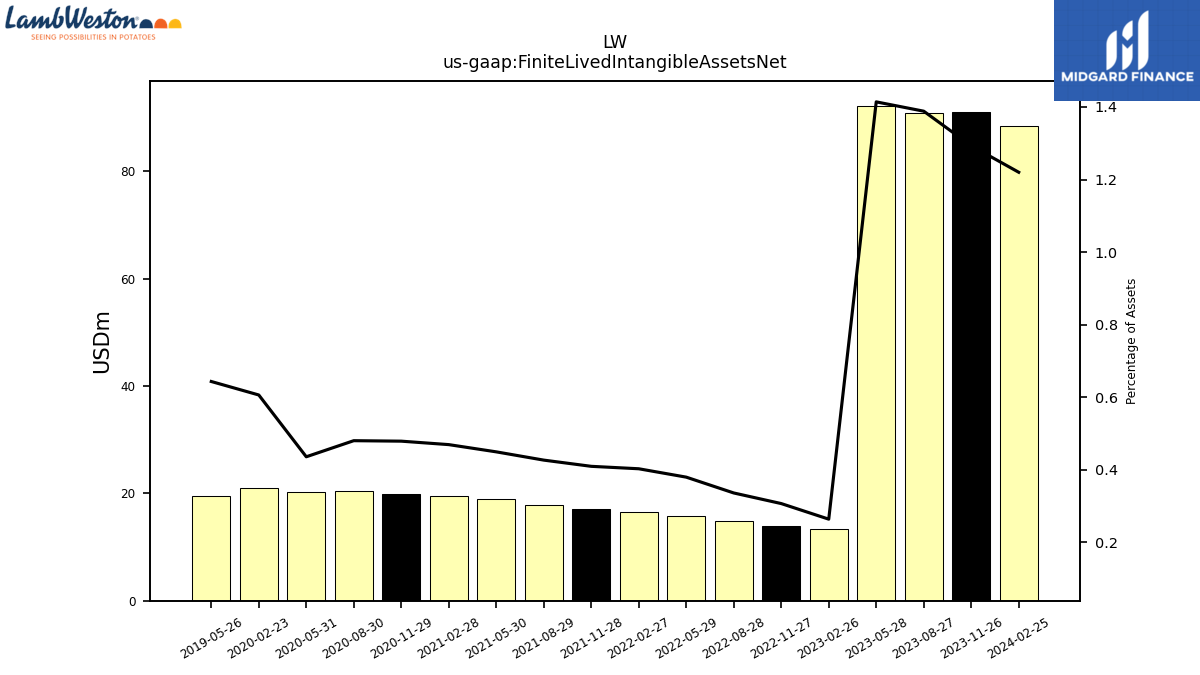
| Finite Lived Intangible Assets Net | 88.40 | 91.10 | 90.80 | 92.20 | 13.40 | 14.00 | 14.80 | 15.70 | 16.50 | 17.00 | 17.80 | 18.90 | 19.50 | 19.90 | 20.50 | 20.30 | 21.00 | NA | NA | 19.60 | NA | NA | NA | NA | NA | NA | NA | NA | NA | NA | NA | NA | NA | NA | NA | |
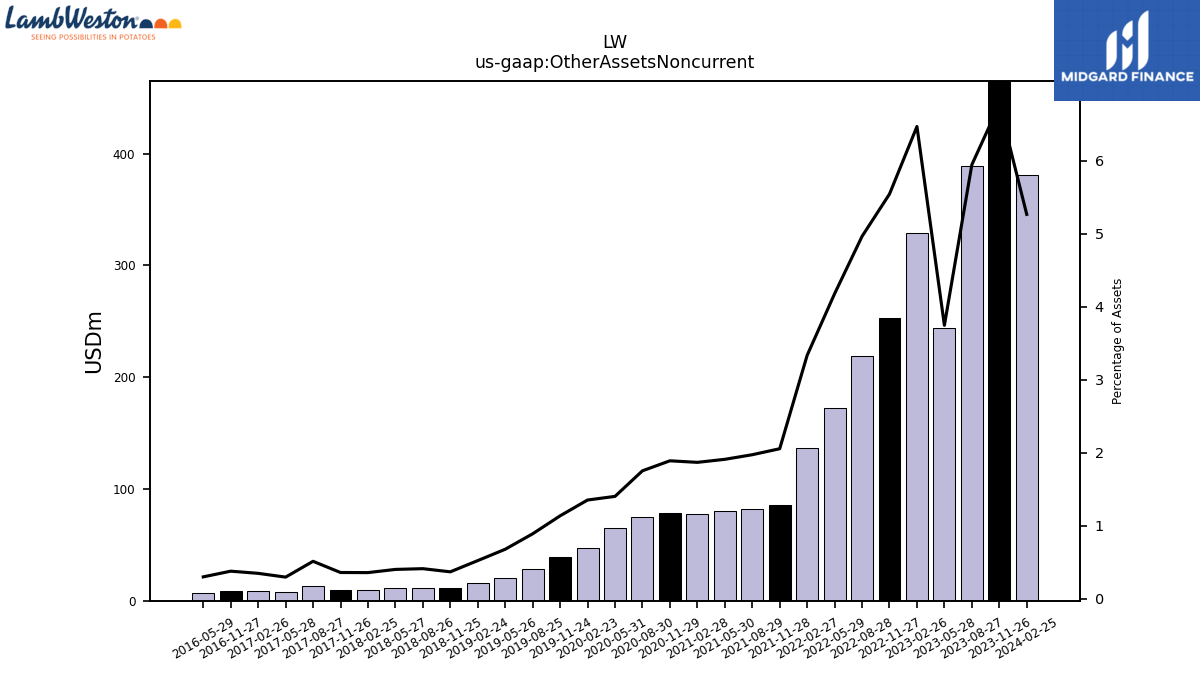
| Other Assets Noncurrent | 381.30 | 476.60 | 388.60 | 244.10 | 328.90 | 253.20 | 218.80 | 172.90 | 136.70 | 85.40 | 82.40 | 80.40 | 77.70 | 78.60 | 74.90 | 65.40 | 46.90 | 39.40 | 28.70 | 20.70 | 16.30 | 11.30 | 11.80 | 11.10 | 9.90 | 9.80 | 13.00 | 7.40 | 8.50 | 9.10 | NA | 6.50 | NA | NA | NA |
| 2024-02-25 | 2023-11-26 | 2023-08-27 | 2023-05-28 | 2023-02-26 | 2022-11-27 | 2022-08-28 | 2022-05-29 | 2022-02-27 | 2021-11-28 | 2021-08-29 | 2021-05-30 | 2021-02-28 | 2020-11-29 | 2020-08-30 | 2020-05-31 | 2020-02-23 | 2019-11-24 | 2019-08-25 | 2019-05-26 | 2019-02-24 | 2018-11-25 | 2018-08-26 | 2018-05-27 | 2018-02-25 | 2017-11-26 | 2017-08-27 | 2017-05-28 | 2017-02-26 | 2016-11-27 | 2016-08-28 | 2016-05-29 | 2016-02-28 | 2015-11-29 | 2015-08-30 | ||
|---|---|---|---|---|---|---|---|---|---|---|---|---|---|---|---|---|---|---|---|---|---|---|---|---|---|---|---|---|---|---|---|---|---|---|---|---|
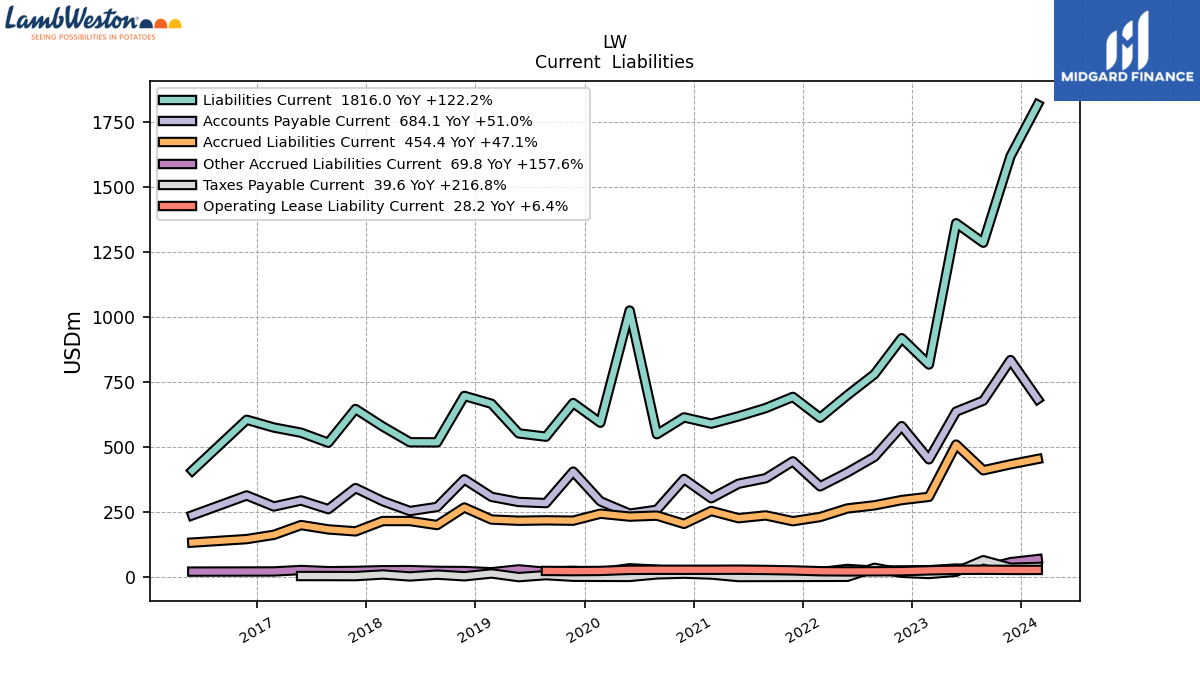
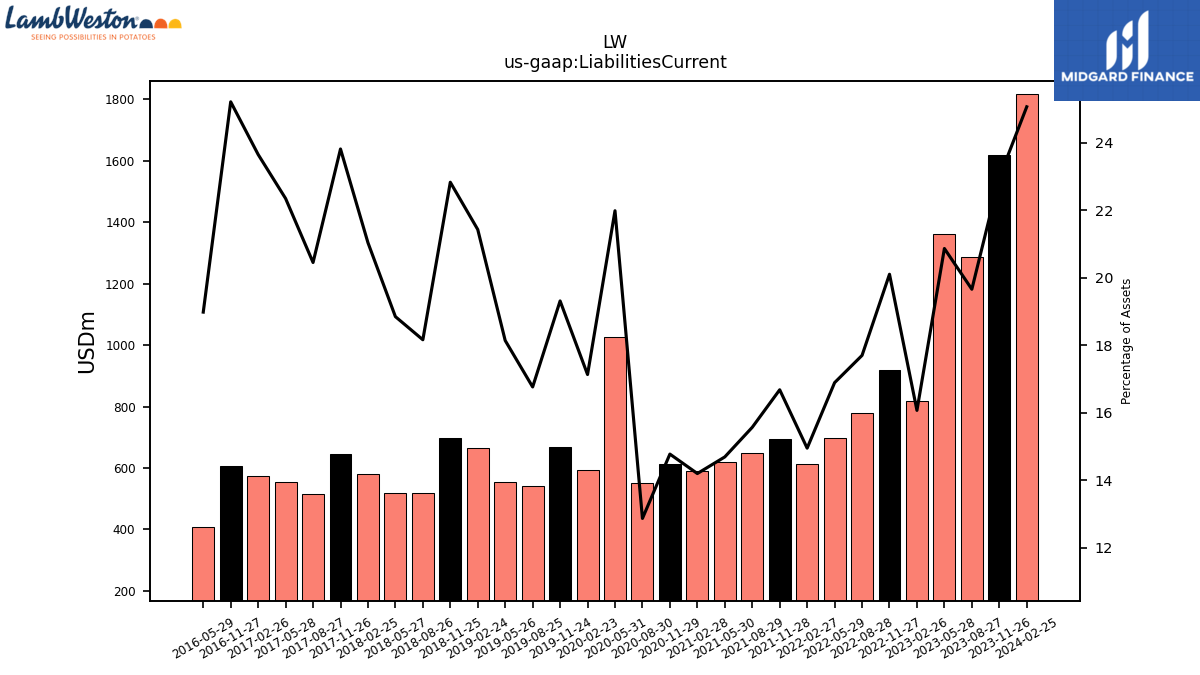
| Liabilities Current | 1816.00 | 1617.80 | 1285.40 | 1360.20 | 817.30 | 918.50 | 780.30 | 699.10 | 612.90 | 693.00 | 650.00 | 618.20 | 590.20 | 614.30 | 549.60 | 1024.90 | 593.70 | 669.40 | 540.10 | 552.80 | 666.60 | 696.80 | 518.30 | 518.70 | 579.30 | 646.50 | 516.90 | 555.40 | 575.20 | 605.10 | NA | 409.60 | NA | NA | NA | |
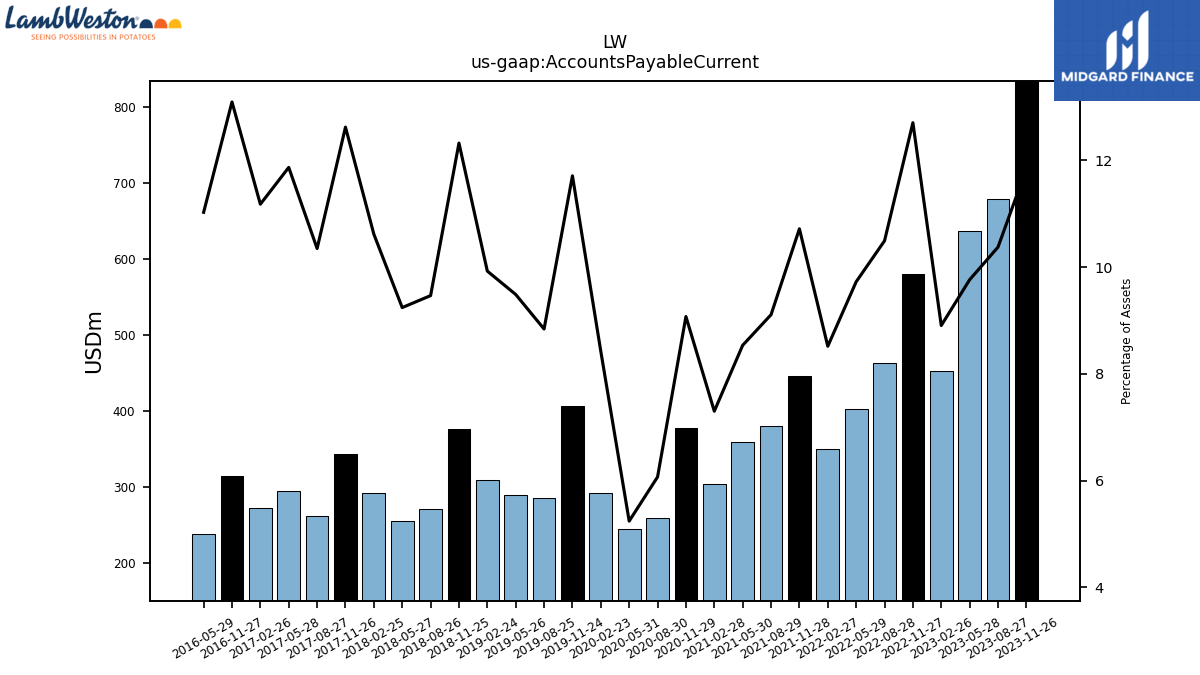
| Accounts Payable Current | 684.10 | 834.50 | 678.50 | 636.60 | 453.10 | 580.60 | 462.70 | 402.60 | 349.30 | 445.40 | 380.40 | 359.30 | 303.60 | 377.40 | 259.30 | 244.40 | 291.90 | 406.00 | 284.90 | 289.20 | 308.80 | 376.20 | 270.20 | 254.40 | 292.40 | 342.70 | 261.60 | 295.00 | 271.90 | 314.30 | NA | 238.00 | NA | NA | NA | |
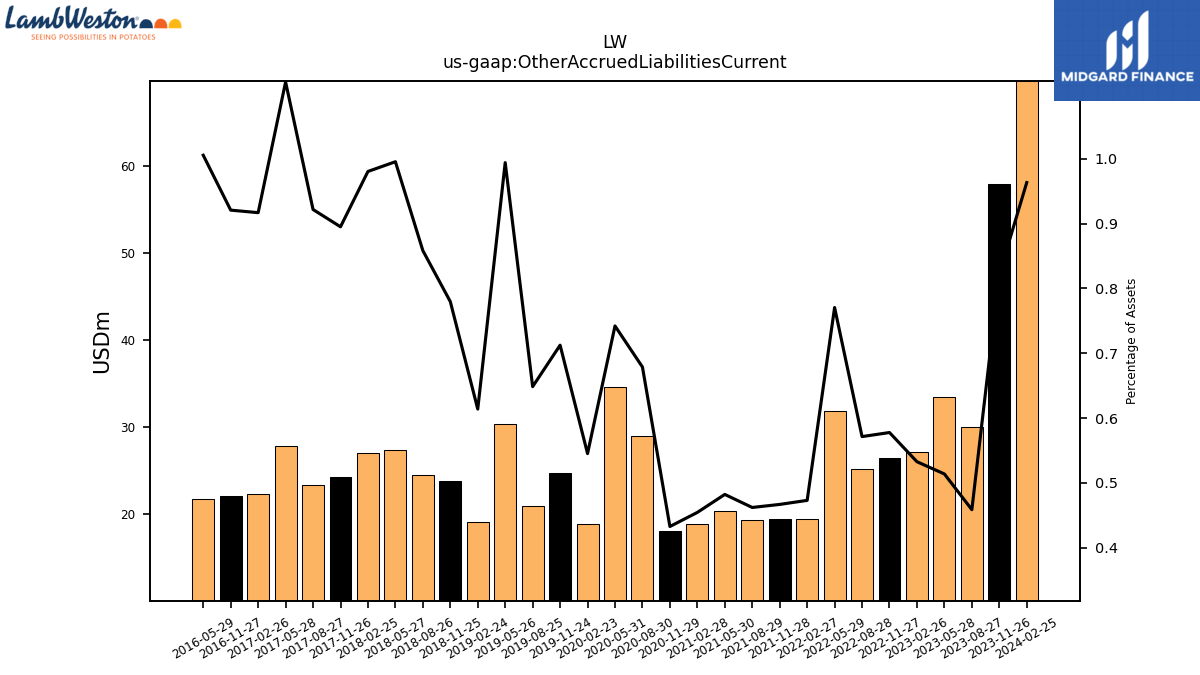
| Other Accrued Liabilities Current | 69.80 | 57.90 | 30.00 | 33.50 | 27.10 | 26.40 | 25.20 | 31.90 | 19.40 | 19.40 | 19.30 | 20.30 | 18.90 | 18.00 | 29.00 | 34.60 | 18.90 | 24.70 | 20.90 | 30.30 | 19.10 | 23.80 | 24.50 | 27.40 | 27.00 | 24.30 | 23.30 | 27.80 | 22.30 | 22.10 | NA | 21.70 | NA | NA | NA | |
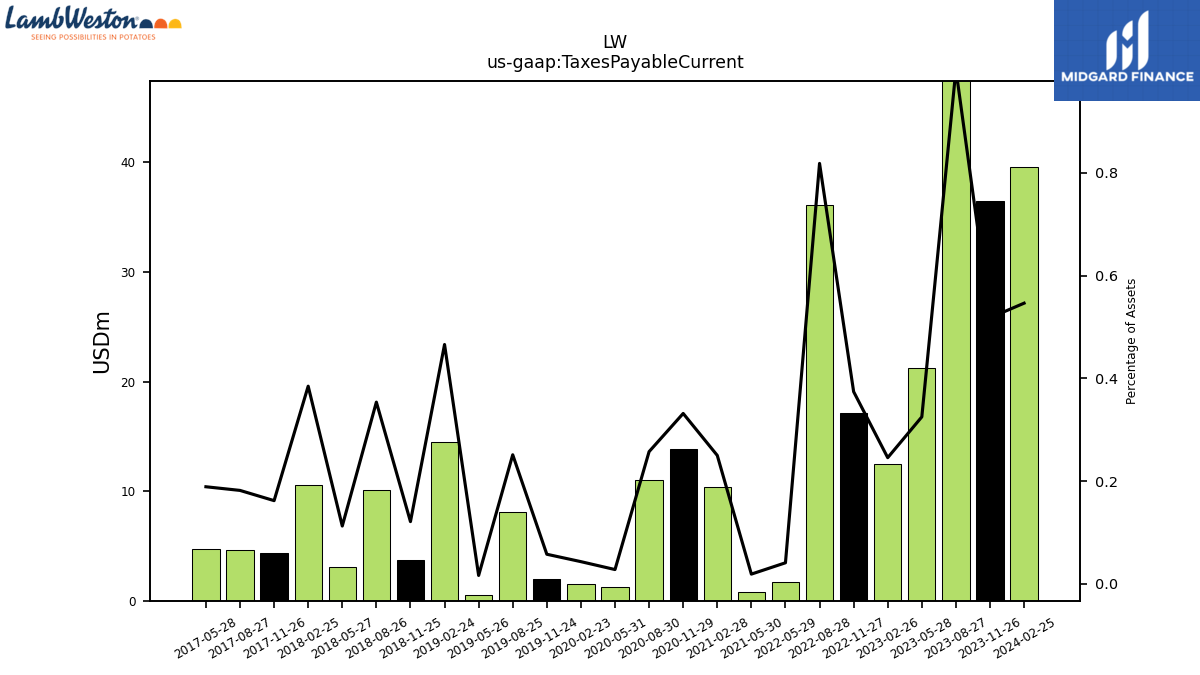
| Taxes Payable Current | 39.60 | 36.50 | 65.50 | 21.20 | 12.50 | 17.10 | 36.10 | 1.70 | NA | NA | NA | 0.80 | 10.40 | 13.80 | 11.00 | 1.30 | 1.50 | 2.00 | 8.10 | 0.50 | 14.50 | 3.70 | 10.10 | 3.10 | 10.60 | 4.40 | 4.60 | 4.70 | NA | NA | NA | NA | NA | NA | NA | |
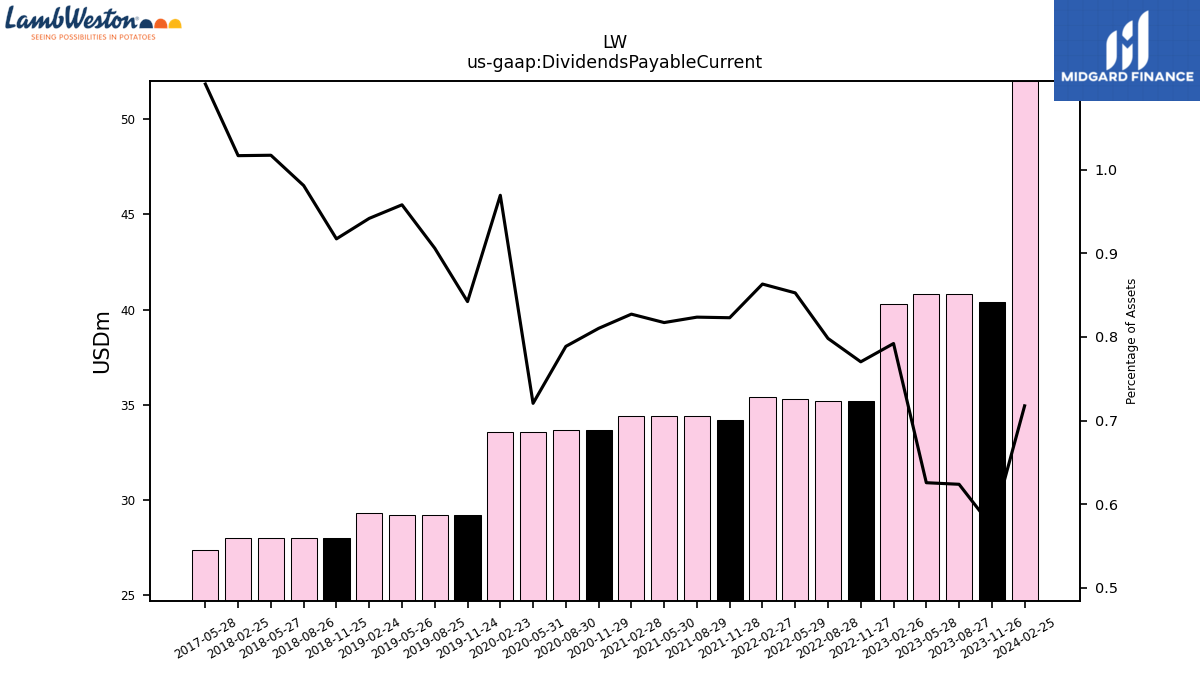
| Dividends Payable Current | 52.00 | 40.40 | 40.80 | 40.80 | 40.30 | 35.20 | 35.20 | 35.30 | 35.40 | 34.20 | 34.40 | 34.40 | 34.40 | 33.70 | 33.70 | 33.60 | 33.60 | 29.20 | 29.20 | 29.20 | 29.30 | 28.00 | 28.00 | 28.00 | 28.00 | NA | NA | 27.40 | NA | NA | NA | NA | NA | NA | NA | |
| Accrued Liabilities Current | 454.40 | 434.00 | 411.00 | 509.80 | 308.90 | 296.70 | 276.30 | 264.30 | 231.40 | 215.40 | 237.60 | 226.90 | 254.60 | 205.10 | 236.80 | 233.00 | 244.20 | 217.40 | 218.70 | 217.20 | 221.70 | 268.00 | 200.60 | 216.00 | 216.00 | 176.30 | 183.90 | 200.50 | 163.00 | 146.60 | NA | 133.20 | NA | NA | NA |
| 2024-02-25 | 2023-11-26 | 2023-08-27 | 2023-05-28 | 2023-02-26 | 2022-11-27 | 2022-08-28 | 2022-05-29 | 2022-02-27 | 2021-11-28 | 2021-08-29 | 2021-05-30 | 2021-02-28 | 2020-11-29 | 2020-08-30 | 2020-05-31 | 2020-02-23 | 2019-11-24 | 2019-08-25 | 2019-05-26 | 2019-02-24 | 2018-11-25 | 2018-08-26 | 2018-05-27 | 2018-02-25 | 2017-11-26 | 2017-08-27 | 2017-05-28 | 2017-02-26 | 2016-11-27 | 2016-08-28 | 2016-05-29 | 2016-02-28 | 2015-11-29 | 2015-08-30 | ||
|---|---|---|---|---|---|---|---|---|---|---|---|---|---|---|---|---|---|---|---|---|---|---|---|---|---|---|---|---|---|---|---|---|---|---|---|---|
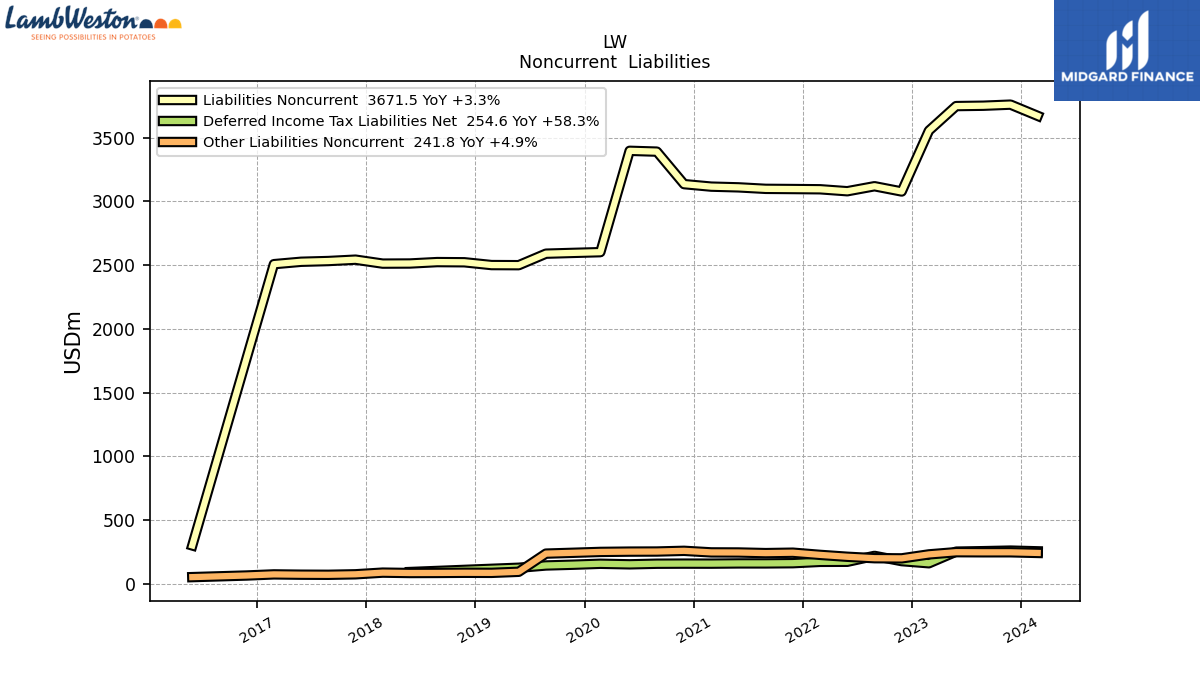
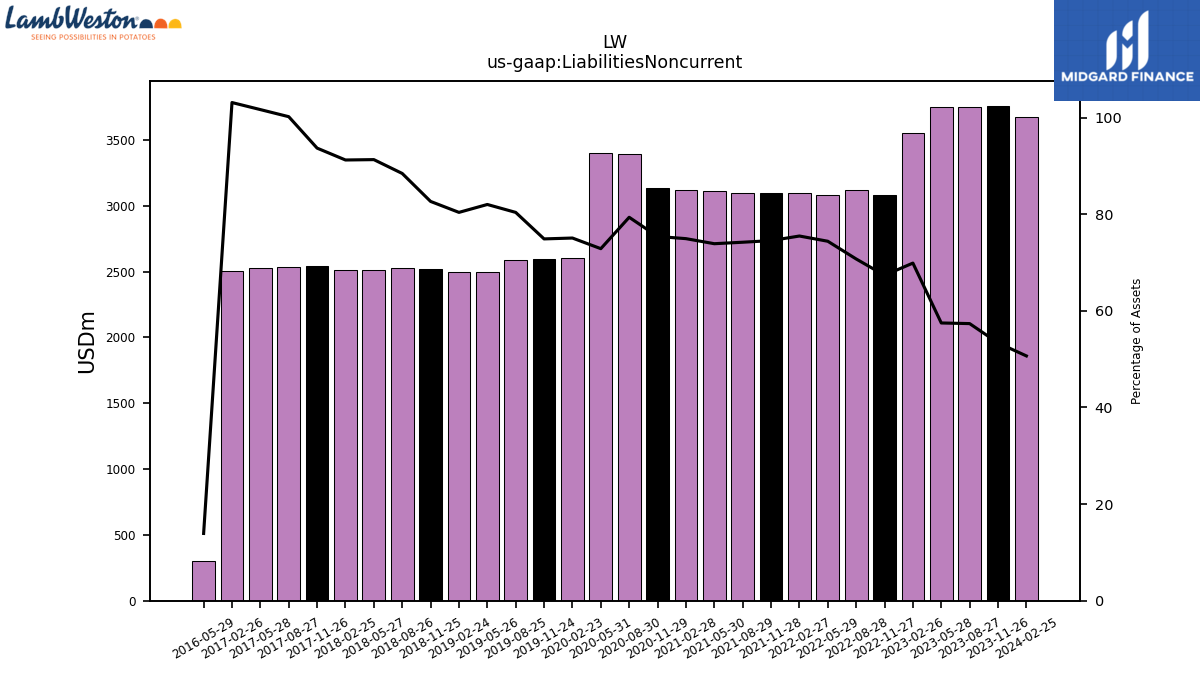
| Liabilities Noncurrent | 3671.50 | 3759.80 | 3751.20 | 3748.30 | 3555.20 | 3078.10 | 3119.40 | 3080.20 | 3095.60 | 3097.40 | 3098.90 | 3110.60 | 3116.30 | 3135.90 | 3391.00 | 3397.40 | 2602.10 | 2596.30 | 2590.20 | 2499.90 | 2500.80 | 2522.80 | 2524.20 | 2513.10 | 2512.20 | 2543.30 | 2532.50 | 2526.70 | 2507.90 | NA | NA | 300.70 | NA | NA | NA | |
| Long Term Debt And Capital Lease Obligations | 3175.10 | 3252.50 | 3248.50 | 3248.40 | 3163.90 | 2701.10 | 2700.10 | 2695.80 | 2697.00 | 2692.10 | 2698.60 | 2705.40 | 2712.30 | 2719.40 | 2980.80 | 2992.60 | 2195.30 | 2203.70 | 2210.10 | 2280.20 | 2288.60 | 2321.80 | 2329.50 | 2336.70 | 2344.40 | 2353.20 | 2360.10 | 2365.00 | 2372.70 | 2382.00 | NA | 104.60 | NA | NA | NA | |
| Deferred Income Tax Liabilities Net | 254.60 | 260.30 | 255.80 | 252.10 | 160.80 | 177.70 | 218.70 | 172.50 | 171.90 | 161.40 | 159.70 | 159.70 | 157.80 | 158.00 | 157.20 | 152.50 | 156.90 | 149.50 | 143.50 | 125.70 | NA | NA | NA | 92.10 | NA | NA | NA | NA | NA | NA | NA | NA | NA | NA | NA | |
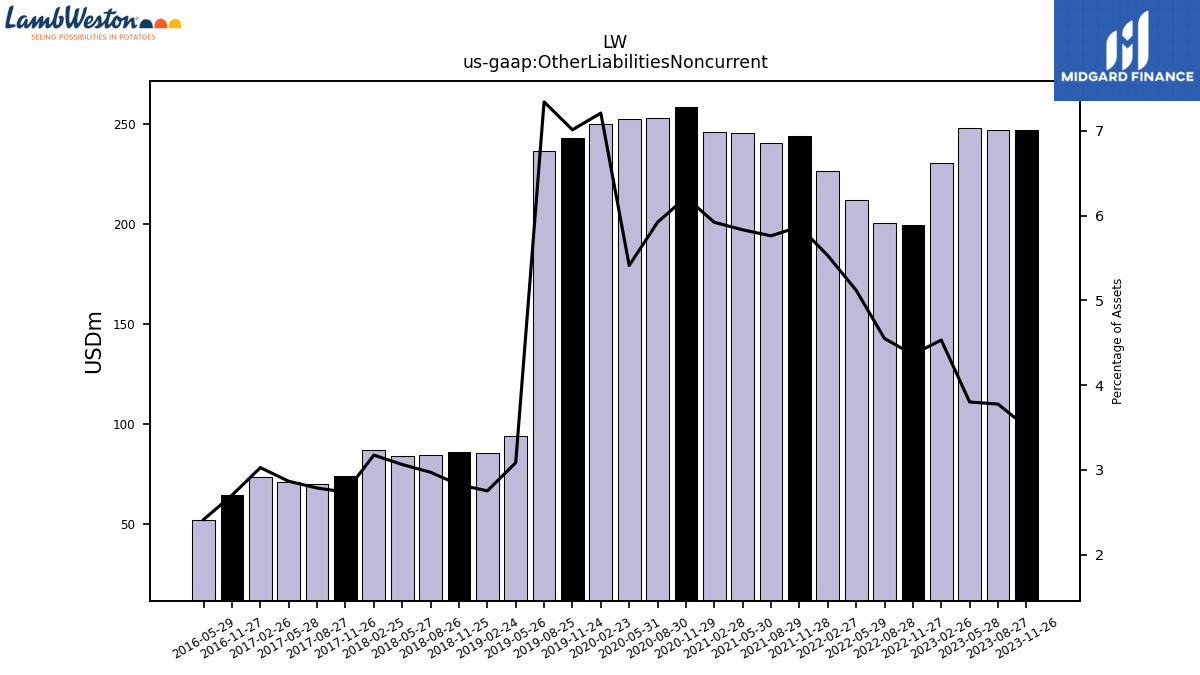
| Other Liabilities Noncurrent | 241.80 | 247.00 | 246.90 | 247.80 | 230.50 | 199.30 | 200.60 | 211.90 | 226.70 | 243.90 | 240.60 | 245.50 | 246.20 | 258.50 | 253.00 | 252.30 | 249.90 | 243.10 | 236.60 | 94.00 | 85.60 | 86.20 | 84.80 | 84.30 | 87.40 | 74.30 | 70.40 | 71.20 | 73.60 | 64.80 | NA | 52.10 | NA | NA | NA |
| 2024-02-25 | 2023-11-26 | 2023-08-27 | 2023-05-28 | 2023-02-26 | 2022-11-27 | 2022-08-28 | 2022-05-29 | 2022-02-27 | 2021-11-28 | 2021-08-29 | 2021-05-30 | 2021-02-28 | 2020-11-29 | 2020-08-30 | 2020-05-31 | 2020-02-23 | 2019-11-24 | 2019-08-25 | 2019-05-26 | 2019-02-24 | 2018-11-25 | 2018-08-26 | 2018-05-27 | 2018-02-25 | 2017-11-26 | 2017-08-27 | 2017-05-28 | 2017-02-26 | 2016-11-27 | 2016-08-28 | 2016-05-29 | 2016-02-28 | 2015-11-29 | 2015-08-30 | ||
|---|---|---|---|---|---|---|---|---|---|---|---|---|---|---|---|---|---|---|---|---|---|---|---|---|---|---|---|---|---|---|---|---|---|---|---|---|
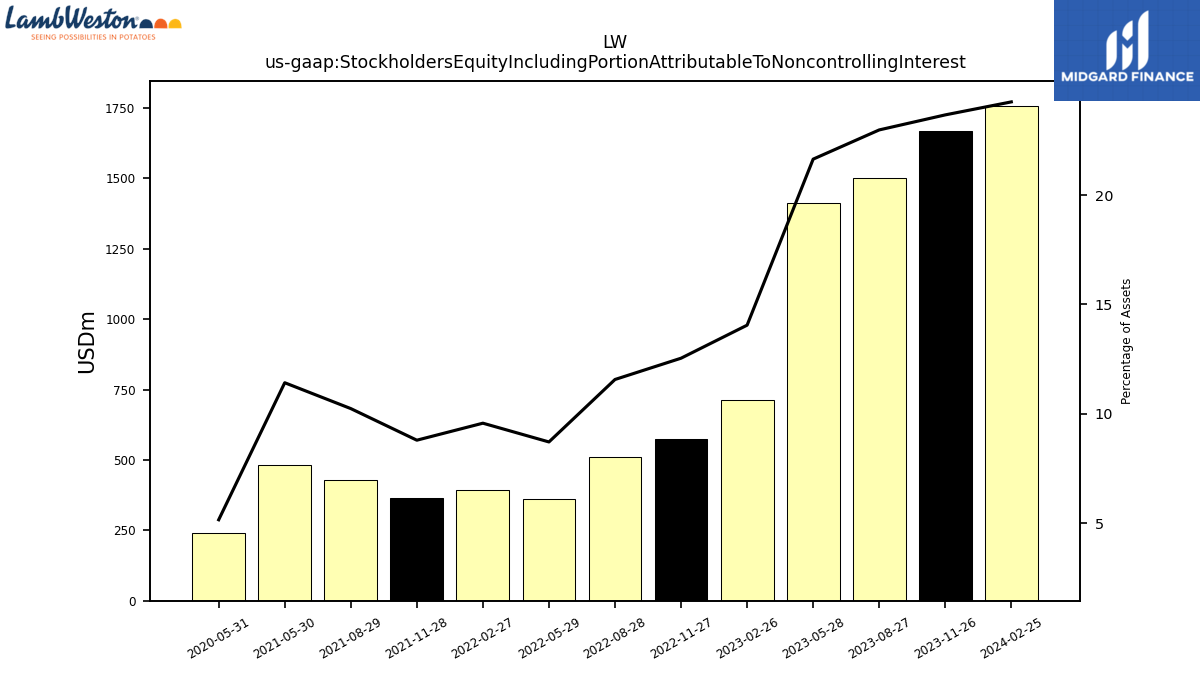
| Stockholders Equity Including Portion Attributable To Noncontrolling Interest | 1758.20 | 1667.70 | 1503.00 | 1411.30 | 714.80 | 573.00 | 510.00 | 360.50 | 392.30 | 365.20 | 427.40 | 480.60 | NA | NA | NA | 240.00 | NA | NA | NA | NA | NA | NA | NA | NA | NA | NA | NA | NA | NA | NA | NA | NA | NA | NA | NA | |
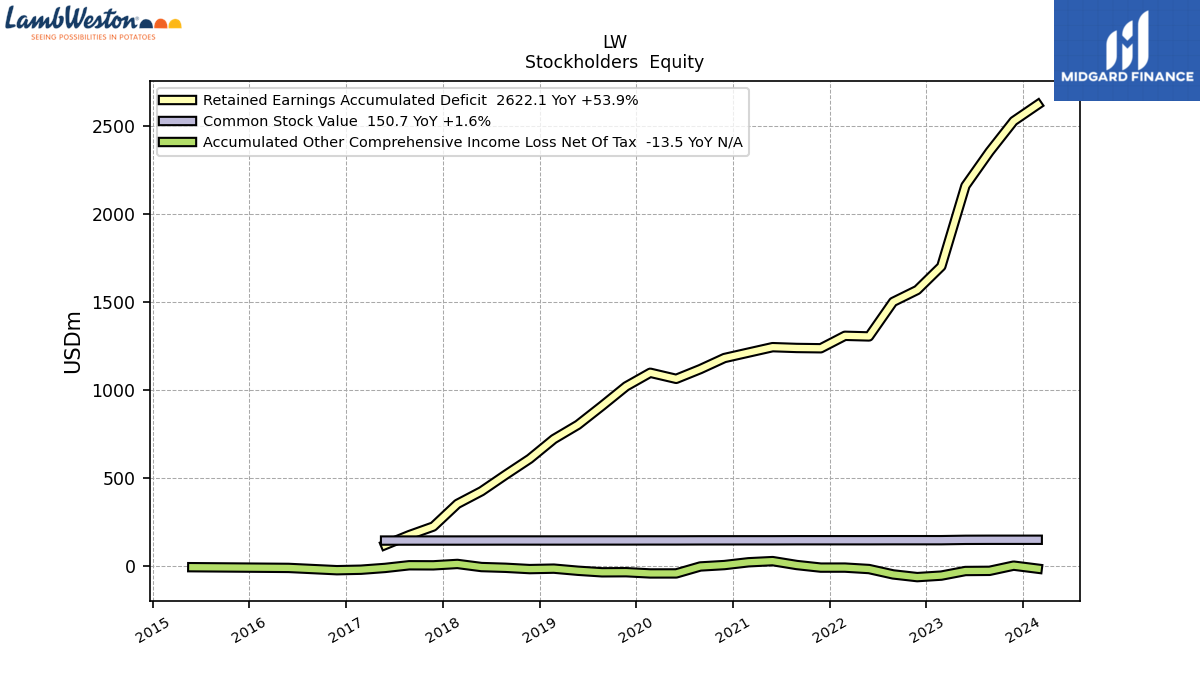
| Common Stock Value | 150.70 | 150.70 | 150.70 | 150.30 | 148.30 | 148.30 | 148.30 | 148.00 | 148.00 | 148.00 | 148.00 | 147.60 | 147.60 | 147.50 | 147.40 | 147.00 | 147.00 | 146.80 | 146.80 | 146.70 | 146.60 | 146.60 | 146.60 | 146.40 | 146.30 | 146.30 | 146.20 | 146.10 | NA | NA | NA | NA | NA | NA | NA | |
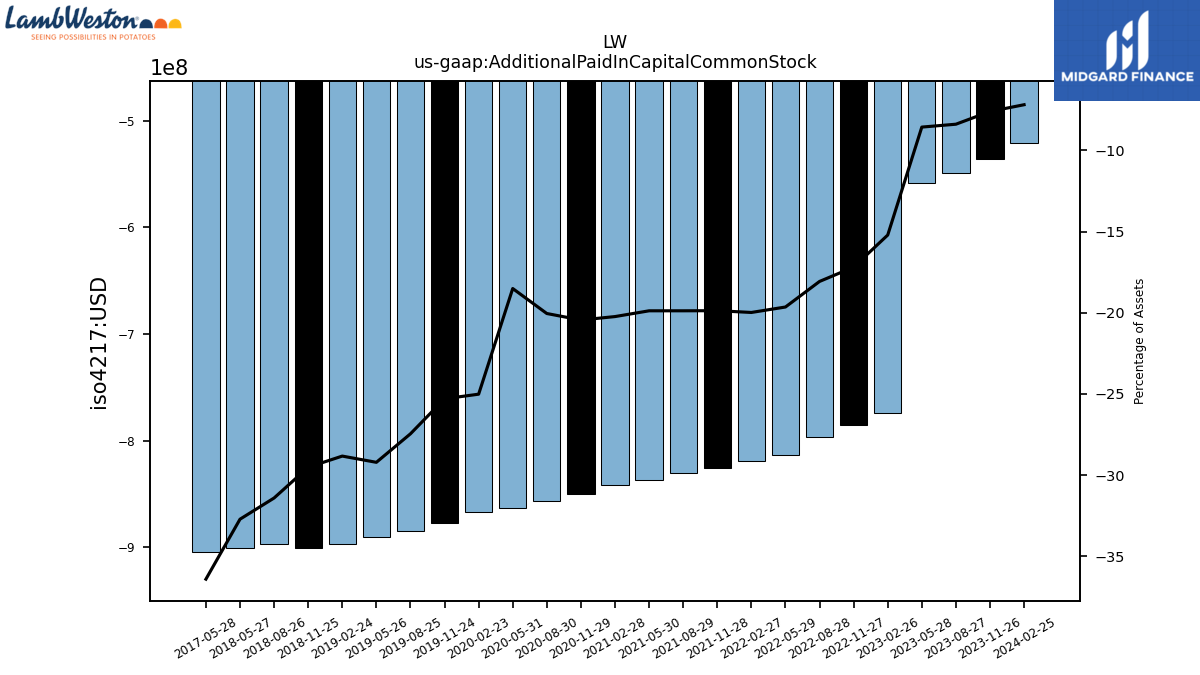
| Additional Paid In Capital Common Stock | -521.00 | -535.90 | -548.70 | -558.60 | -774.00 | -785.50 | -796.90 | -813.30 | -819.40 | -825.80 | -830.20 | -836.80 | -841.40 | -850.40 | -856.50 | -862.90 | -867.00 | -877.00 | -884.70 | -890.30 | -896.80 | -900.90 | -896.40 | -900.40 | NA | NA | NA | -904.80 | NA | NA | NA | NA | NA | NA | NA | |
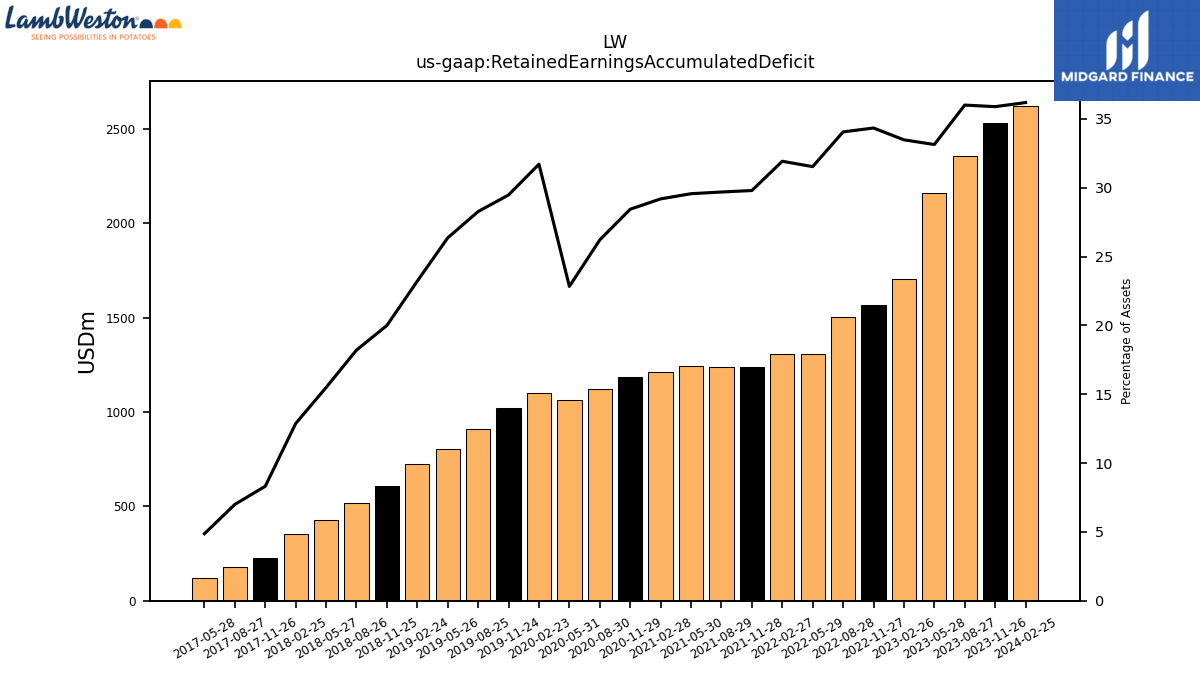
| Retained Earnings Accumulated Deficit | 2622.10 | 2528.60 | 2354.60 | 2160.70 | 1703.30 | 1569.20 | 1501.80 | 1305.50 | 1309.10 | 1238.30 | 1240.00 | 1244.60 | 1213.80 | 1182.80 | 1119.90 | 1064.60 | 1099.20 | 1021.90 | 911.10 | 803.60 | 722.50 | 610.40 | 519.70 | 426.40 | 354.50 | 225.80 | 176.90 | 121.00 | NA | NA | NA | NA | NA | NA | NA | |
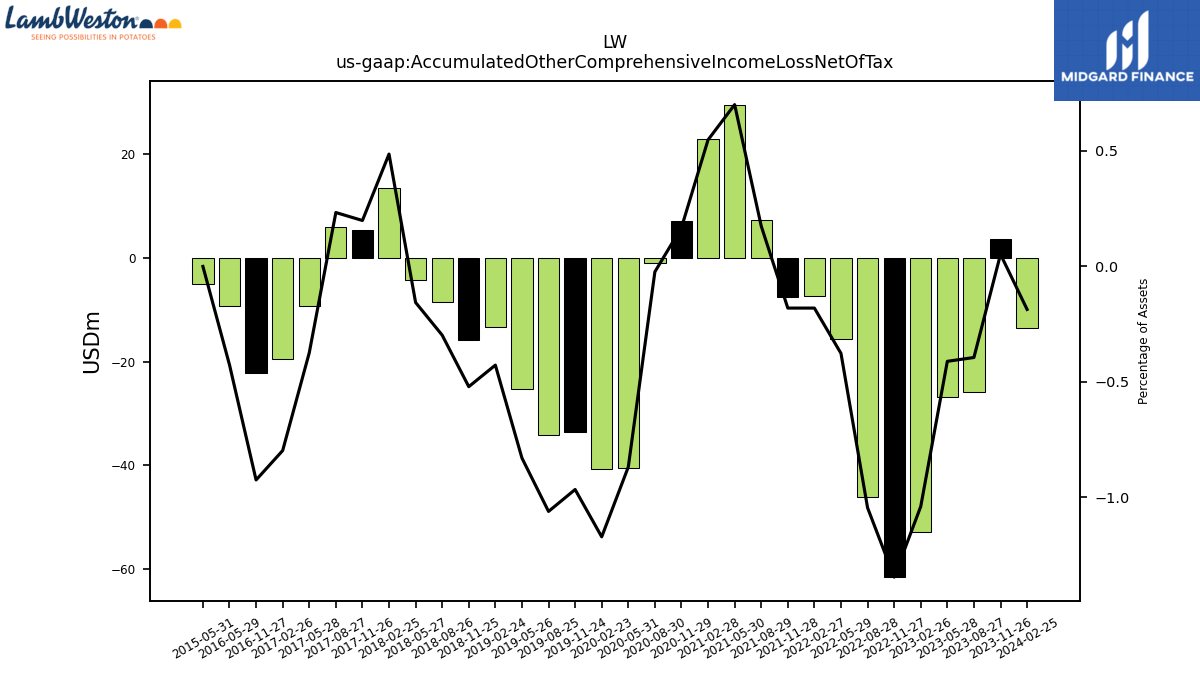
| Accumulated Other Comprehensive Income Loss Net Of Tax | -13.50 | 3.70 | -25.80 | -26.80 | -52.90 | -61.50 | -46.10 | -15.60 | -7.40 | -7.50 | 7.30 | 29.50 | 22.80 | 7.00 | -1.00 | -40.50 | -40.60 | -33.50 | -34.20 | -25.30 | -13.30 | -15.90 | -8.50 | -4.30 | 13.40 | 5.40 | 5.90 | -9.30 | -19.40 | -22.20 | NA | -9.20 | NA | NA | NA | |
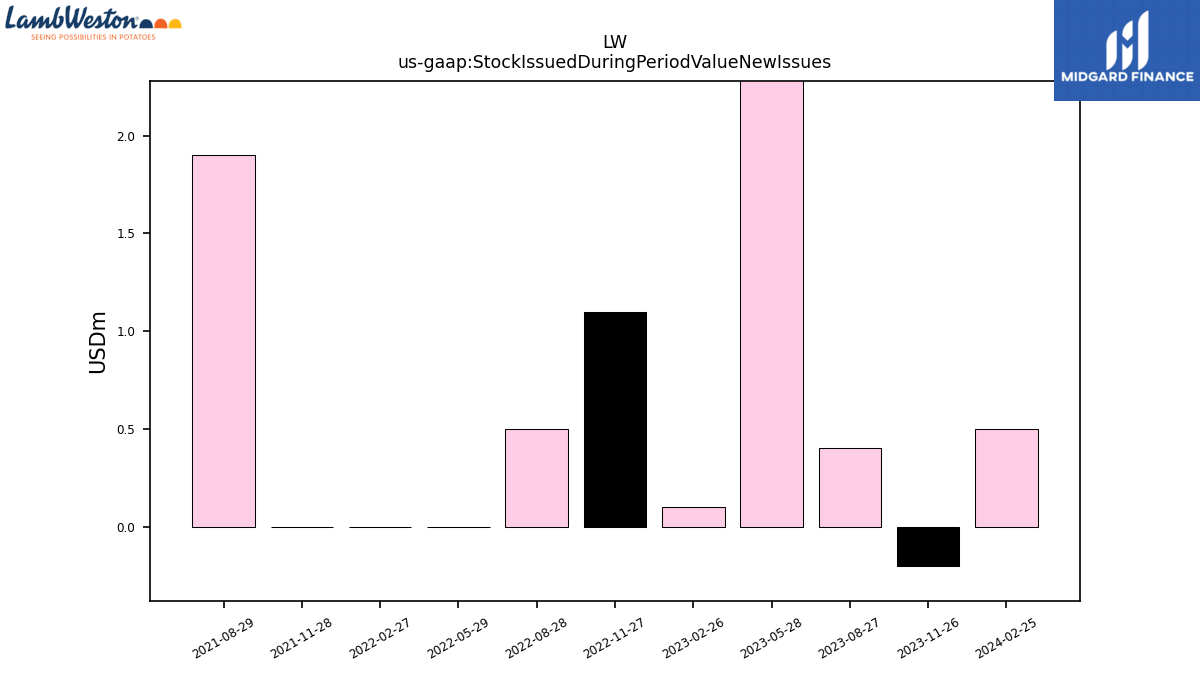
| Stock Issued During Period Value New Issues | 0.50 | -0.20 | 0.40 | 197.30 | 0.10 | 1.10 | 0.50 | 0.00 | 0.00 | 0.00 | 1.90 | NA | NA | NA | NA | NA | NA | NA | NA | NA | NA | NA | NA | NA | NA | NA | NA | NA | NA | NA | NA | NA | NA | NA | NA |
| 2024-02-25 | 2023-11-26 | 2023-08-27 | 2023-05-28 | 2023-02-26 | 2022-11-27 | 2022-08-28 | 2022-05-29 | 2022-02-27 | 2021-11-28 | 2021-08-29 | 2021-05-30 | 2021-02-28 | 2020-11-29 | 2020-08-30 | 2020-05-31 | 2020-02-23 | 2019-11-24 | 2019-08-25 | 2019-05-26 | 2019-02-24 | 2018-11-25 | 2018-08-26 | 2018-05-27 | 2018-02-25 | 2017-11-26 | 2017-08-27 | 2017-05-28 | 2017-02-26 | 2016-11-27 | 2016-08-28 | 2016-05-29 | 2016-02-28 | 2015-11-29 | 2015-08-30 | ||
|---|---|---|---|---|---|---|---|---|---|---|---|---|---|---|---|---|---|---|---|---|---|---|---|---|---|---|---|---|---|---|---|---|---|---|---|---|
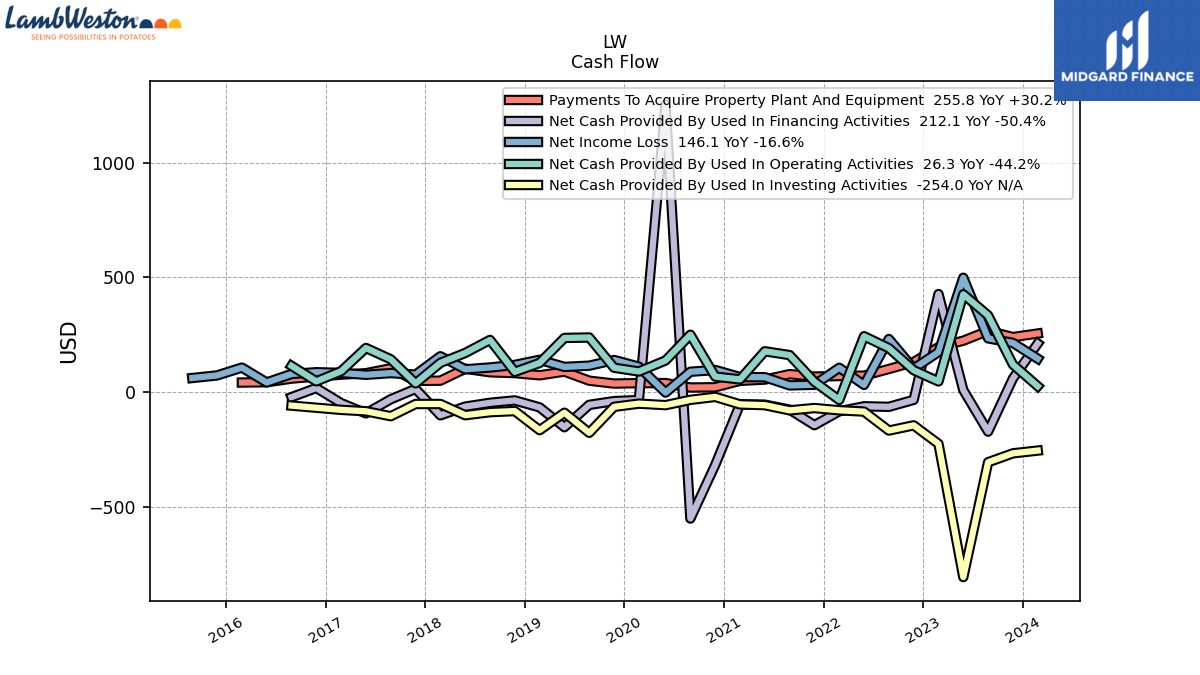
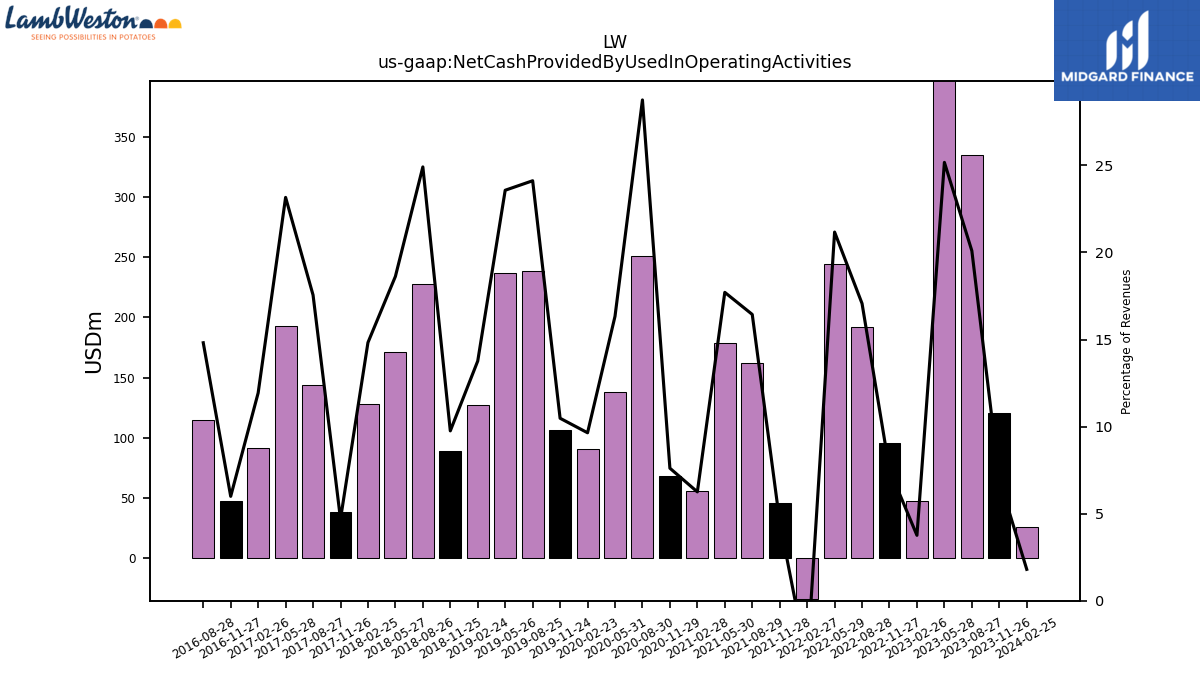
| Net Cash Provided By Used In Operating Activities | 26.30 | 120.60 | 334.60 | 426.60 | 47.10 | 95.90 | 192.10 | 244.10 | -33.50 | 45.70 | 161.80 | 178.40 | 56.00 | 68.20 | 250.60 | 138.30 | 90.40 | 106.80 | 238.50 | 236.50 | 127.60 | 88.90 | 227.90 | 171.00 | 128.00 | 38.70 | 143.50 | 192.80 | 91.70 | 47.40 | 115.00 | NA | NA | NA | NA | |
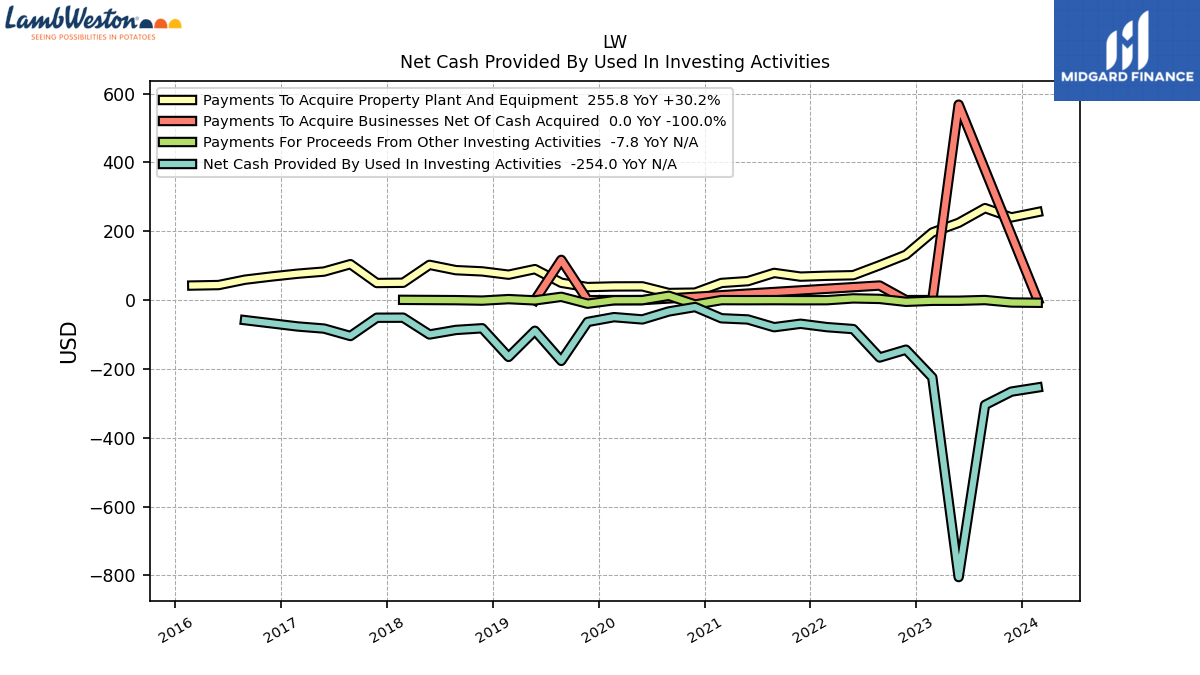
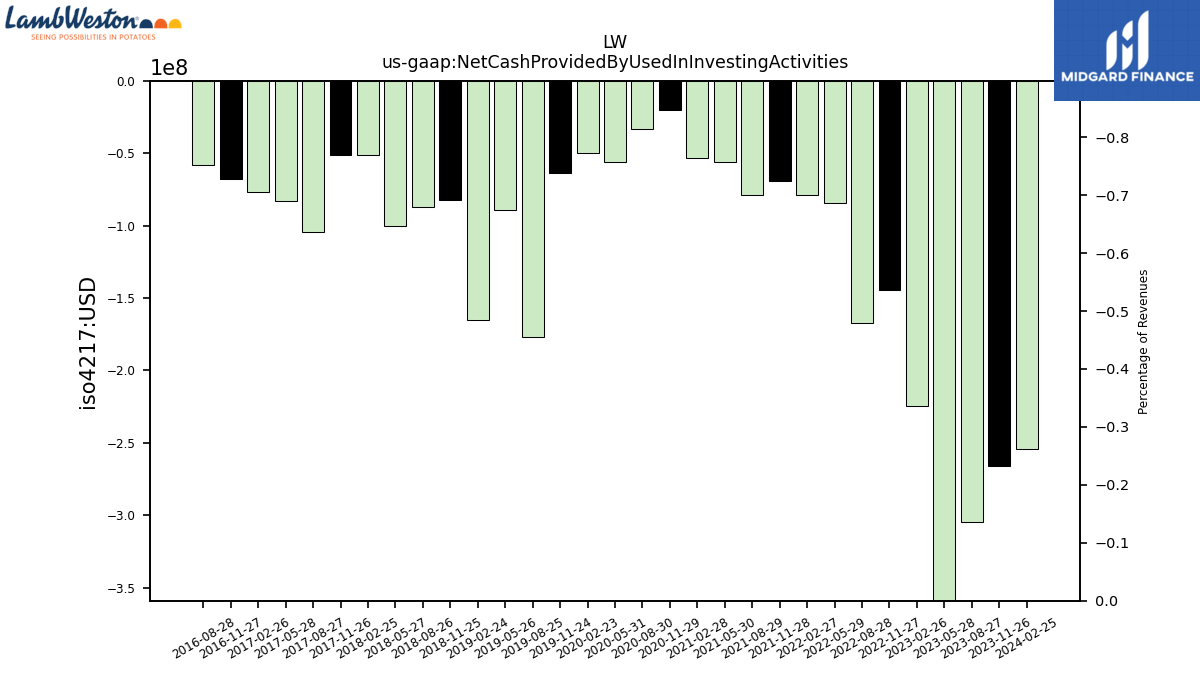
| Net Cash Provided By Used In Investing Activities | -254.00 | -266.00 | -304.80 | -805.20 | -224.70 | -144.10 | -166.90 | -84.30 | -78.60 | -68.80 | -78.80 | -56.30 | -52.90 | -20.20 | -33.10 | -56.20 | -49.60 | -63.50 | -176.70 | -89.10 | -165.20 | -81.90 | -86.80 | -100.00 | -51.10 | -51.30 | -104.40 | -82.80 | -76.70 | -67.50 | -58.30 | NA | NA | NA | NA | |
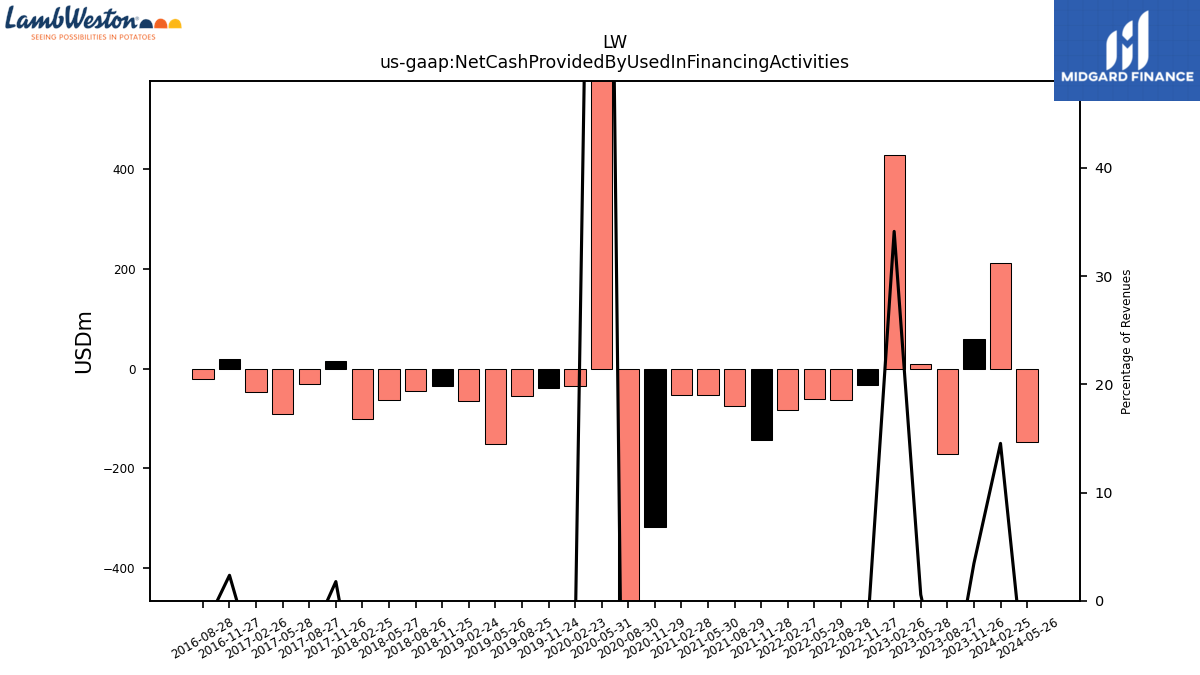
| Net Cash Provided By Used In Financing Activities | 212.10 | 59.70 | -171.70 | 9.50 | 427.90 | -33.10 | -63.50 | -61.20 | -82.90 | -143.50 | -75.80 | -54.10 | -52.70 | -317.00 | -550.20 | 1252.70 | -34.10 | -38.70 | -54.90 | -152.30 | -65.90 | -35.50 | -45.90 | -62.50 | -100.50 | 14.60 | -30.50 | -91.90 | -47.30 | 18.60 | -21.40 | NA | NA | NA | NA |
| 2024-02-25 | 2023-11-26 | 2023-08-27 | 2023-05-28 | 2023-02-26 | 2022-11-27 | 2022-08-28 | 2022-05-29 | 2022-02-27 | 2021-11-28 | 2021-08-29 | 2021-05-30 | 2021-02-28 | 2020-11-29 | 2020-08-30 | 2020-05-31 | 2020-02-23 | 2019-11-24 | 2019-08-25 | 2019-05-26 | 2019-02-24 | 2018-11-25 | 2018-08-26 | 2018-05-27 | 2018-02-25 | 2017-11-26 | 2017-08-27 | 2017-05-28 | 2017-02-26 | 2016-11-27 | 2016-08-28 | 2016-05-29 | 2016-02-28 | 2015-11-29 | 2015-08-30 | ||
|---|---|---|---|---|---|---|---|---|---|---|---|---|---|---|---|---|---|---|---|---|---|---|---|---|---|---|---|---|---|---|---|---|---|---|---|---|
| Net Cash Provided By Used In Operating Activities | 26.30 | 120.60 | 334.60 | 426.60 | 47.10 | 95.90 | 192.10 | 244.10 | -33.50 | 45.70 | 161.80 | 178.40 | 56.00 | 68.20 | 250.60 | 138.30 | 90.40 | 106.80 | 238.50 | 236.50 | 127.60 | 88.90 | 227.90 | 171.00 | 128.00 | 38.70 | 143.50 | 192.80 | 91.70 | 47.40 | 115.00 | NA | NA | NA | NA | |
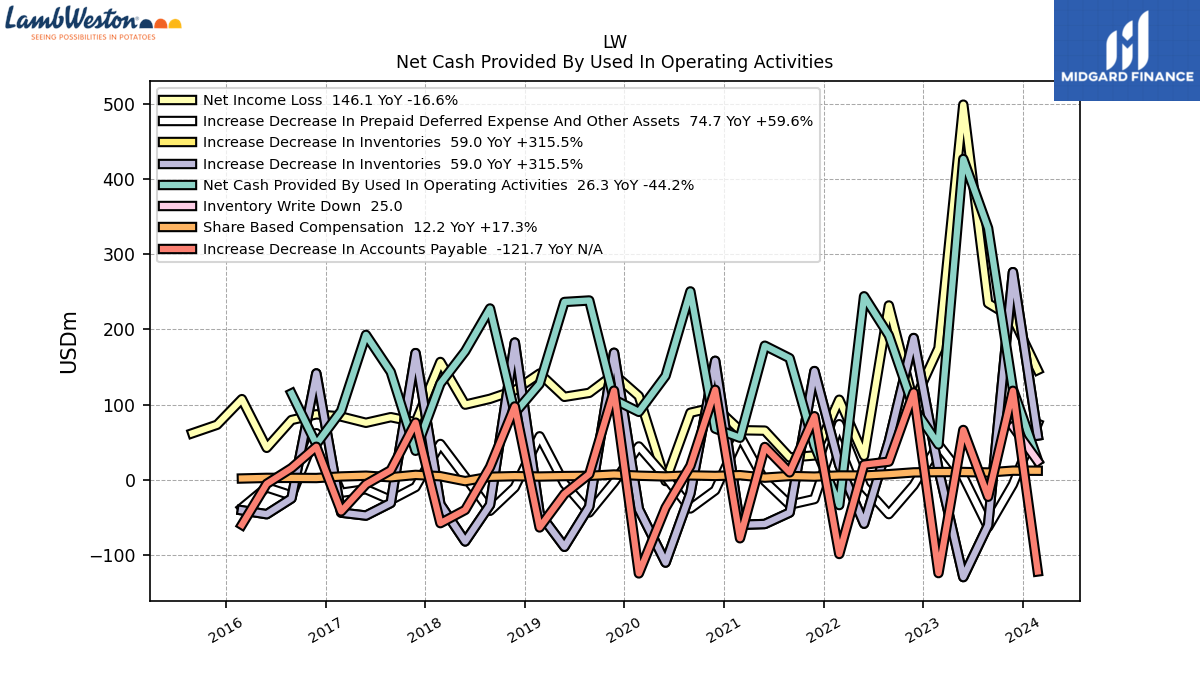
| Net Income Loss | 146.10 | 215.00 | 234.80 | 498.80 | 175.10 | 103.10 | 231.90 | 32.00 | 106.60 | 32.50 | 29.80 | 65.50 | 66.10 | 96.90 | 89.30 | -1.60 | 111.40 | 140.40 | 115.70 | 110.40 | 141.40 | 119.00 | 107.80 | 100.00 | 156.80 | 76.60 | 83.40 | 75.90 | 84.20 | 87.20 | 79.60 | 42.60 | 107.40 | 73.30 | 62.00 | |
| Profit Loss | 146.10 | 215.00 | 234.80 | 498.80 | 175.10 | 103.10 | 231.90 | 32.00 | 106.60 | 32.50 | 29.80 | 65.50 | 66.10 | 96.90 | 89.30 | -1.60 | 111.40 | 140.40 | 115.70 | 110.40 | 141.40 | 124.00 | 111.40 | 102.80 | 159.60 | 83.00 | 88.30 | 78.50 | 87.60 | 91.00 | 83.10 | 45.40 | 108.70 | NA | NA | |
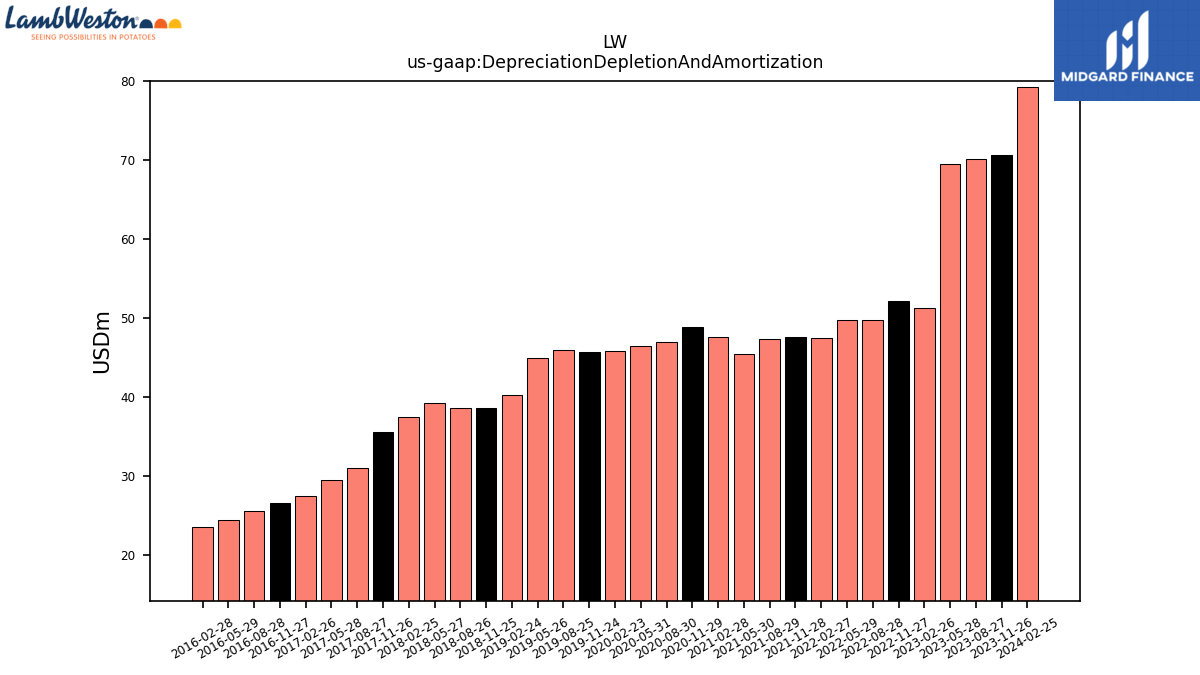
| Depreciation Depletion And Amortization | 79.30 | 70.60 | 70.10 | 69.50 | 51.30 | 52.20 | 49.80 | 49.70 | 47.50 | 47.60 | 47.30 | 45.50 | 47.60 | 48.80 | 46.90 | 46.50 | 45.80 | 45.70 | 46.00 | 44.90 | 40.30 | 38.60 | 38.60 | 39.20 | 37.50 | 35.60 | 31.00 | 29.50 | 27.50 | 26.60 | 25.50 | 24.40 | 23.60 | NA | NA | |
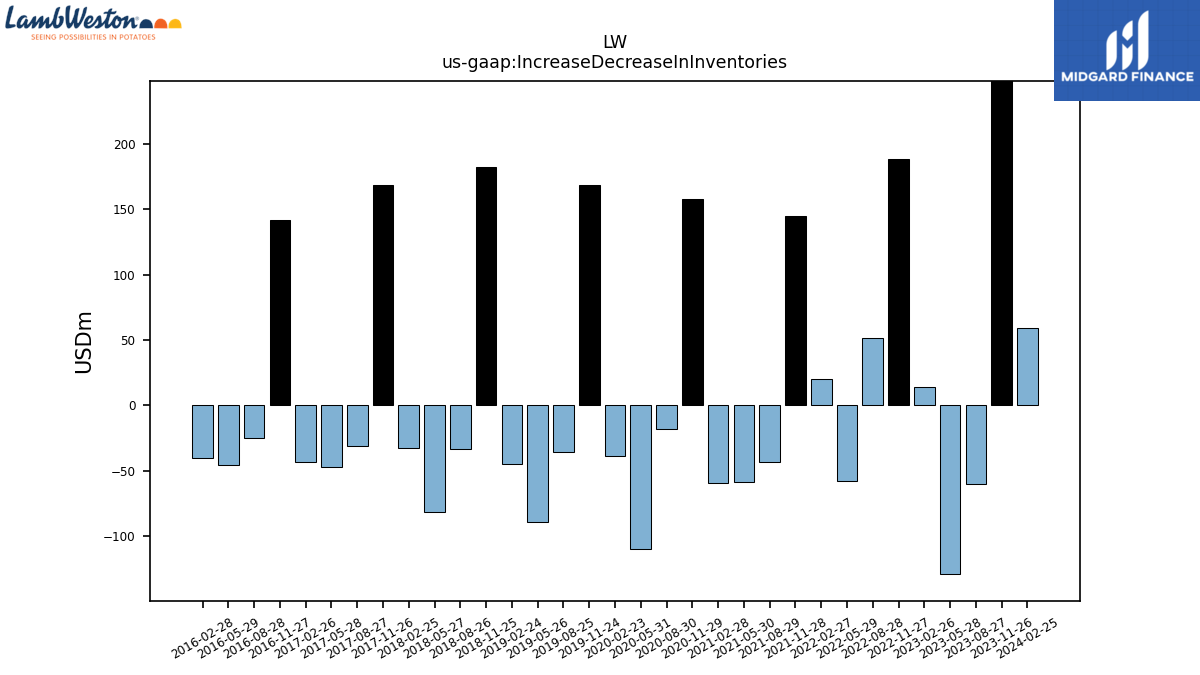
| Increase Decrease In Inventories | 59.00 | 276.20 | -60.20 | -129.20 | 14.20 | 188.60 | 51.50 | -58.20 | 19.90 | 144.70 | -43.40 | -58.60 | -59.70 | 158.30 | -18.00 | -109.90 | -38.80 | 169.00 | -35.60 | -88.90 | -44.70 | 182.60 | -33.20 | -81.80 | -32.50 | 168.60 | -30.70 | -47.40 | -43.50 | 141.60 | -24.60 | -45.60 | -40.40 | NA | NA | |
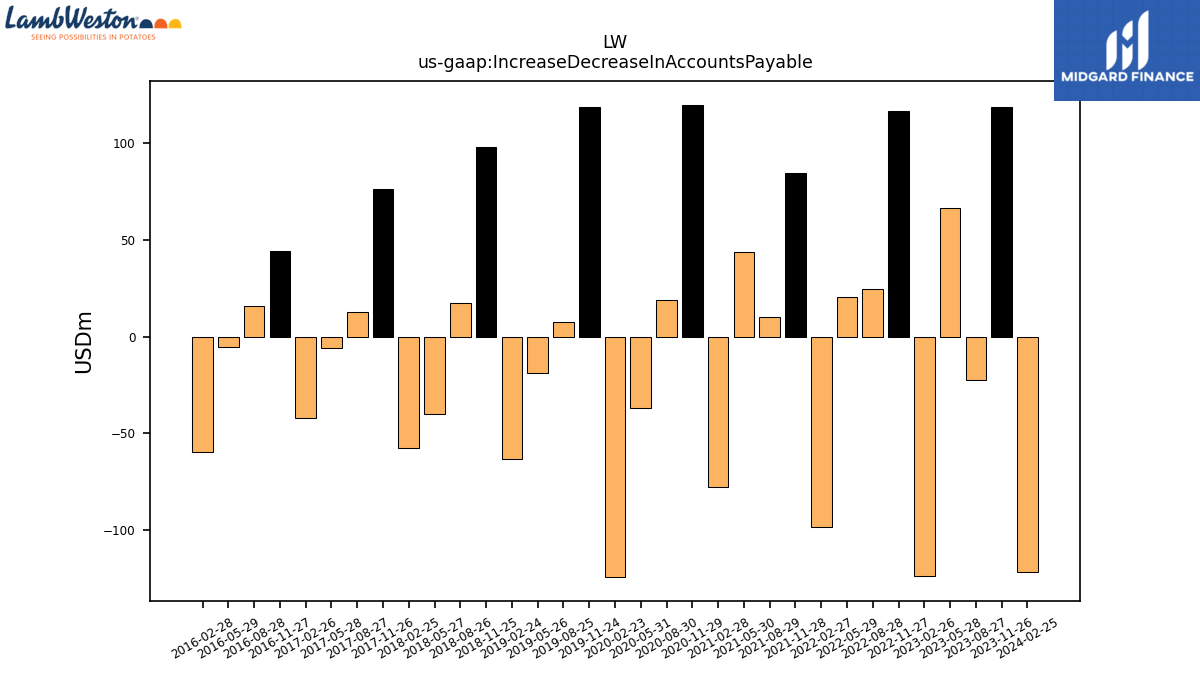
| Increase Decrease In Accounts Payable | -121.70 | 118.50 | -22.40 | 66.40 | -123.90 | 116.30 | 24.30 | 20.30 | -98.50 | 84.70 | 10.00 | 43.80 | -77.60 | 119.80 | 18.70 | -37.00 | -124.30 | 118.70 | 7.70 | -18.70 | -63.20 | 97.70 | 17.10 | -39.90 | -57.50 | 76.20 | 12.90 | -5.80 | -41.90 | 44.10 | 15.70 | -5.20 | -59.70 | NA | NA | |
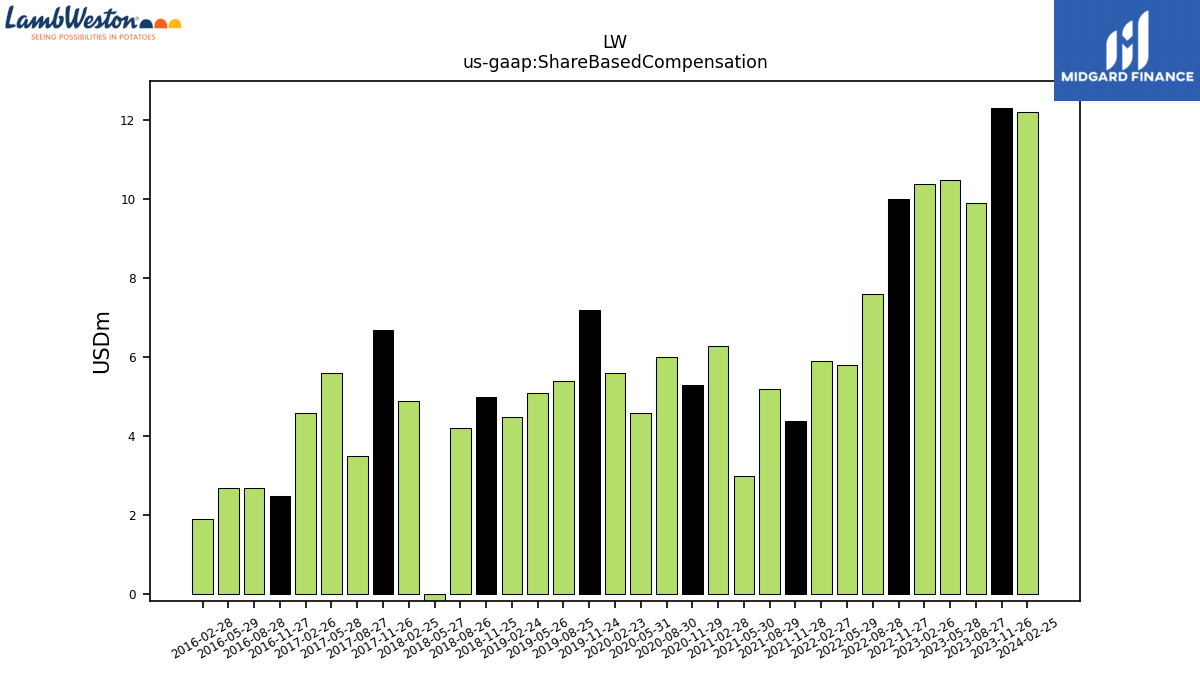
| Share Based Compensation | 12.20 | 12.30 | 9.90 | 10.50 | 10.40 | 10.00 | 7.60 | 5.80 | 5.90 | 4.40 | 5.20 | 3.00 | 6.30 | 5.30 | 6.00 | 4.60 | 5.60 | 7.20 | 5.40 | 5.10 | 4.50 | 5.00 | 4.20 | -1.60 | 4.90 | 6.70 | 3.50 | 5.60 | 4.60 | 2.50 | 2.70 | 2.70 | 1.90 | NA | NA |
| 2024-02-25 | 2023-11-26 | 2023-08-27 | 2023-05-28 | 2023-02-26 | 2022-11-27 | 2022-08-28 | 2022-05-29 | 2022-02-27 | 2021-11-28 | 2021-08-29 | 2021-05-30 | 2021-02-28 | 2020-11-29 | 2020-08-30 | 2020-05-31 | 2020-02-23 | 2019-11-24 | 2019-08-25 | 2019-05-26 | 2019-02-24 | 2018-11-25 | 2018-08-26 | 2018-05-27 | 2018-02-25 | 2017-11-26 | 2017-08-27 | 2017-05-28 | 2017-02-26 | 2016-11-27 | 2016-08-28 | 2016-05-29 | 2016-02-28 | 2015-11-29 | 2015-08-30 | ||
|---|---|---|---|---|---|---|---|---|---|---|---|---|---|---|---|---|---|---|---|---|---|---|---|---|---|---|---|---|---|---|---|---|---|---|---|---|
| Net Cash Provided By Used In Investing Activities | -254.00 | -266.00 | -304.80 | -805.20 | -224.70 | -144.10 | -166.90 | -84.30 | -78.60 | -68.80 | -78.80 | -56.30 | -52.90 | -20.20 | -33.10 | -56.20 | -49.60 | -63.50 | -176.70 | -89.10 | -165.20 | -81.90 | -86.80 | -100.00 | -51.10 | -51.30 | -104.40 | -82.80 | -76.70 | -67.50 | -58.30 | NA | NA | NA | NA | |
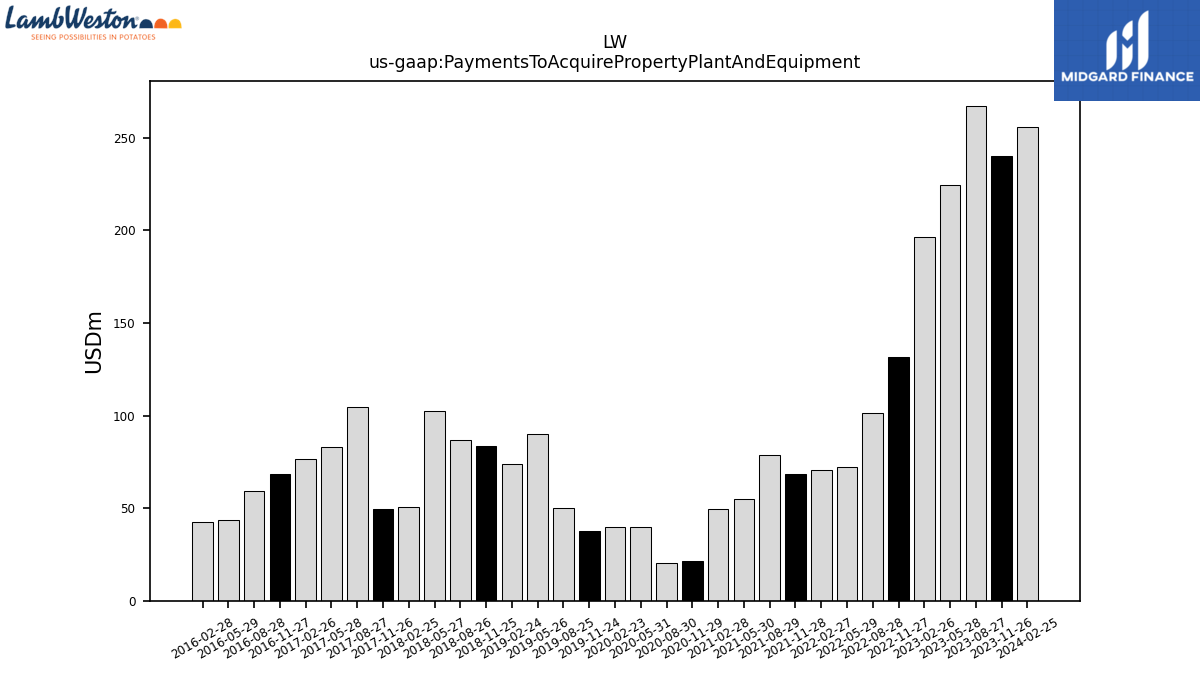
| Payments To Acquire Property Plant And Equipment | 255.80 | 240.30 | 267.30 | 224.60 | 196.50 | 131.70 | 101.20 | 72.30 | 70.70 | 68.20 | 78.90 | 55.10 | 49.80 | 21.70 | 20.60 | 39.90 | 39.70 | 37.80 | 50.30 | 90.00 | 73.80 | 83.40 | 87.00 | 102.40 | 50.40 | 49.60 | 104.40 | 82.90 | 76.70 | 68.50 | 59.30 | 43.70 | 42.30 | NA | NA |
| 2024-02-25 | 2023-11-26 | 2023-08-27 | 2023-05-28 | 2023-02-26 | 2022-11-27 | 2022-08-28 | 2022-05-29 | 2022-02-27 | 2021-11-28 | 2021-08-29 | 2021-05-30 | 2021-02-28 | 2020-11-29 | 2020-08-30 | 2020-05-31 | 2020-02-23 | 2019-11-24 | 2019-08-25 | 2019-05-26 | 2019-02-24 | 2018-11-25 | 2018-08-26 | 2018-05-27 | 2018-02-25 | 2017-11-26 | 2017-08-27 | 2017-05-28 | 2017-02-26 | 2016-11-27 | 2016-08-28 | 2016-05-29 | 2016-02-28 | 2015-11-29 | 2015-08-30 | ||
|---|---|---|---|---|---|---|---|---|---|---|---|---|---|---|---|---|---|---|---|---|---|---|---|---|---|---|---|---|---|---|---|---|---|---|---|---|
| Net Cash Provided By Used In Financing Activities | 212.10 | 59.70 | -171.70 | 9.50 | 427.90 | -33.10 | -63.50 | -61.20 | -82.90 | -143.50 | -75.80 | -54.10 | -52.70 | -317.00 | -550.20 | 1252.70 | -34.10 | -38.70 | -54.90 | -152.30 | -65.90 | -35.50 | -45.90 | -62.50 | -100.50 | 14.60 | -30.50 | -91.90 | -47.30 | 18.60 | -21.40 | NA | NA | NA | NA | |
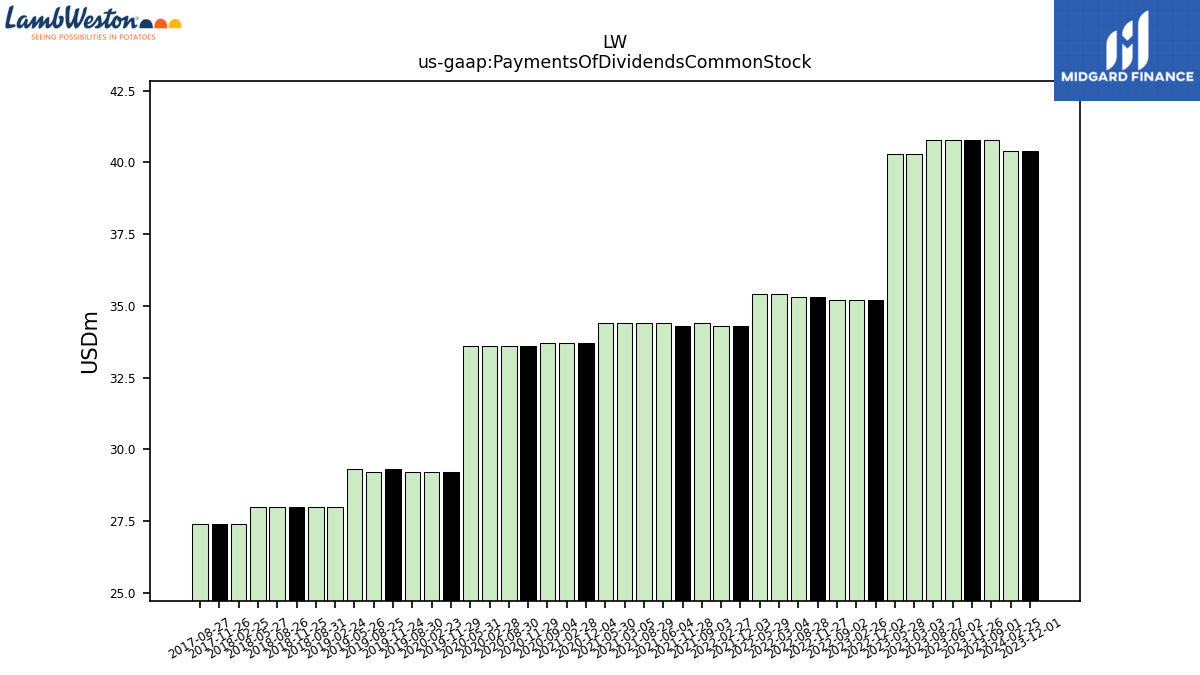
| Payments Of Dividends Common Stock | 40.40 | 40.80 | 40.80 | 40.30 | 35.20 | 35.30 | 35.30 | 35.40 | 34.30 | 34.30 | 34.40 | 34.40 | 33.70 | 33.60 | 33.60 | 33.60 | 29.20 | 29.30 | 29.20 | 29.30 | 28.00 | 28.00 | 28.00 | 28.00 | 27.40 | 27.40 | 27.40 | NA | NA | NA | NA | NA | NA | NA | NA |
| 2024-02-25 | 2023-11-26 | 2023-08-27 | 2023-05-28 | 2023-02-26 | 2022-11-27 | 2022-08-28 | 2022-05-29 | 2022-02-27 | 2021-11-28 | 2021-08-29 | 2021-05-30 | 2021-02-28 | 2020-11-29 | 2020-08-30 | 2020-05-31 | 2020-02-23 | 2019-11-24 | 2019-08-25 | 2019-05-26 | 2019-02-24 | 2018-11-25 | 2018-08-26 | 2018-05-27 | 2018-02-25 | 2017-11-26 | 2017-08-27 | 2017-05-28 | 2017-02-26 | 2016-11-27 | 2016-08-28 | 2016-05-29 | 2016-02-28 | 2015-11-29 | 2015-08-30 | ||
|---|---|---|---|---|---|---|---|---|---|---|---|---|---|---|---|---|---|---|---|---|---|---|---|---|---|---|---|---|---|---|---|---|---|---|---|---|
| Revenues | 1458.30 | 1732.10 | 1665.30 | 1694.90 | 1253.60 | 1276.50 | 1125.60 | 1153.10 | 955.00 | 1006.60 | 984.20 | 1007.50 | 895.80 | 896.10 | 871.50 | 846.90 | 937.30 | 1019.20 | 989.00 | 1003.40 | 926.80 | 911.40 | 914.90 | 918.20 | 863.40 | 824.60 | 817.50 | 832.50 | 768.50 | 790.70 | 776.30 | 777.00 | 728.70 | 740.30 | 747.80 | |
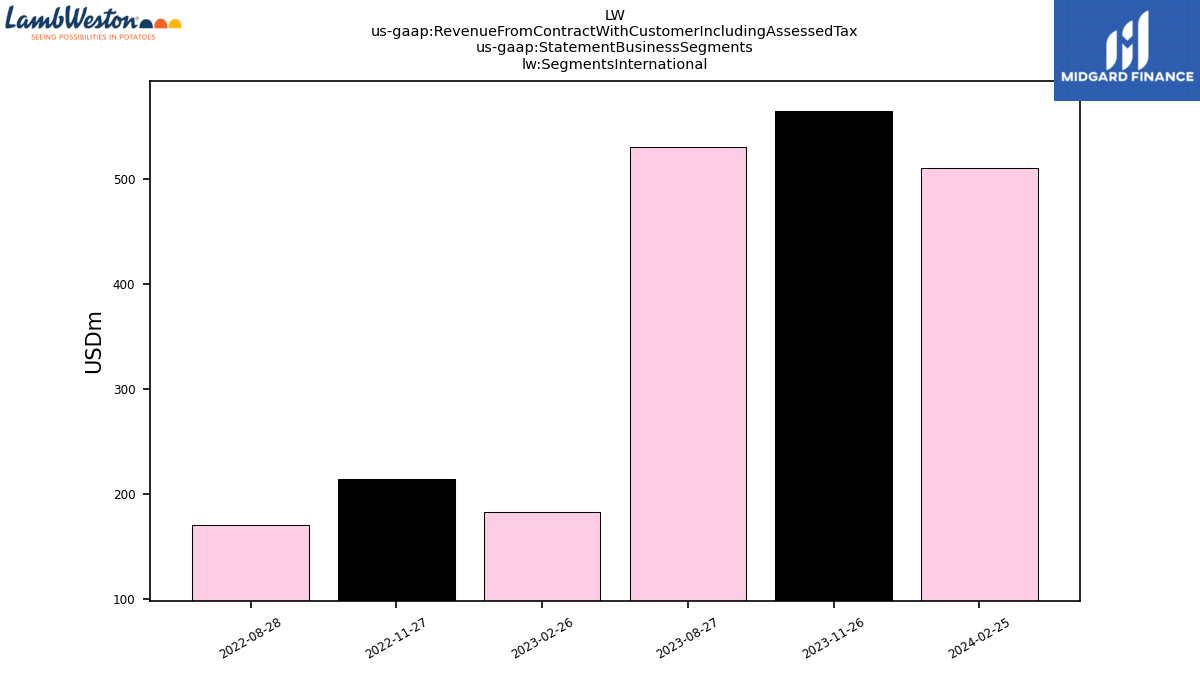
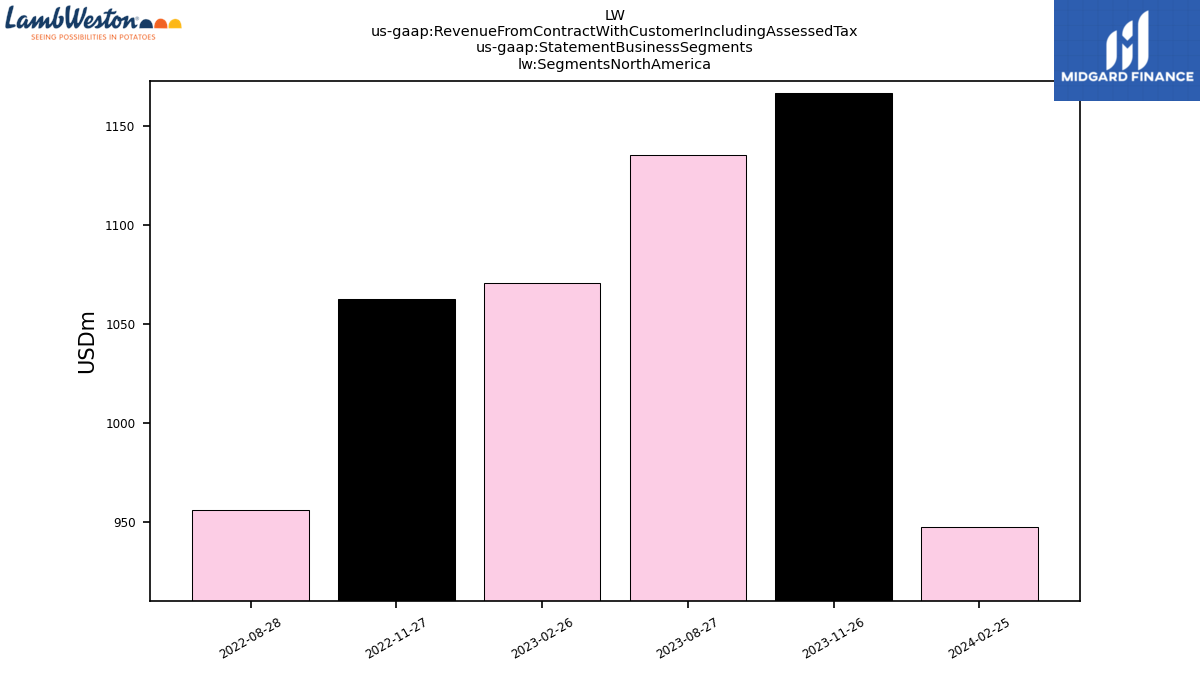
| Revenue From Contract With Customer Including Assessed Tax | 1458.30 | 1732.10 | 1665.30 | 1694.90 | 1253.60 | 1276.50 | 1125.60 | 1153.10 | 955.00 | 1006.60 | 984.20 | 1007.50 | 895.80 | 896.10 | 871.50 | 846.90 | 937.30 | 1019.20 | 989.00 | 1003.40 | 926.80 | 911.40 | 914.90 | 918.20 | 863.40 | 824.60 | 817.50 | 832.50 | 768.50 | 790.70 | 776.30 | 777.00 | 728.70 | 740.30 | 747.80 | |
| Segments International | 510.80 | 565.00 | 529.90 | NA | 182.80 | 214.00 | 170.00 | NA | NA | NA | NA | NA | NA | NA | NA | NA | NA | NA | NA | NA | NA | NA | NA | NA | NA | NA | NA | NA | NA | NA | NA | NA | NA | NA | NA | |
| Segments North America | 947.50 | 1167.10 | 1135.40 | NA | 1070.80 | 1062.50 | 955.60 | NA | NA | NA | NA | NA | NA | NA | NA | NA | NA | NA | NA | NA | NA | NA | NA | NA | NA | NA | NA | NA | NA | NA | NA | NA | NA | NA | NA |