
| 2023-12-29 | 2023-09-29 | 2023-06-30 | 2023-03-31 | 2022-12-30 | 2022-09-30 | 2022-07-01 | 2022-04-01 | 2021-12-31 | 2021-10-01 | 2021-07-02 | 2021-04-02 | 2021-01-01 | 2020-10-02 | 2020-06-28 | 2020-06-26 | 2020-03-27 | 2019-12-27 | 2019-09-27 | 2019-06-28 | 2019-03-29 | 2018-12-28 | 2018-09-28 | 2018-06-29 | 2018-03-30 | 2017-12-29 | 2017-09-29 | 2017-06-30 | 2017-03-31 | 2016-12-30 | 2016-09-30 | 2016-07-01 | 2016-04-01 | 2016-01-01 | 2015-10-02 | 2015-07-03 | 2015-04-03 | 2015-01-02 | 2014-10-03 | 2014-06-27 | 2014-03-28 | 2013-12-27 | 2013-09-27 | 2013-06-28 | 2013-03-29 | 2012-12-28 | 2012-09-28 | 2012-06-29 | 2012-03-30 | 2011-12-30 | 2011-09-30 | 2011-07-01 | 2011-04-01 | 2010-12-31 | 2010-10-01 | 2010-07-02 | 2010-04-02 | 2010-01-01 | ||
|---|---|---|---|---|---|---|---|---|---|---|---|---|---|---|---|---|---|---|---|---|---|---|---|---|---|---|---|---|---|---|---|---|---|---|---|---|---|---|---|---|---|---|---|---|---|---|---|---|---|---|---|---|---|---|---|---|---|---|---|
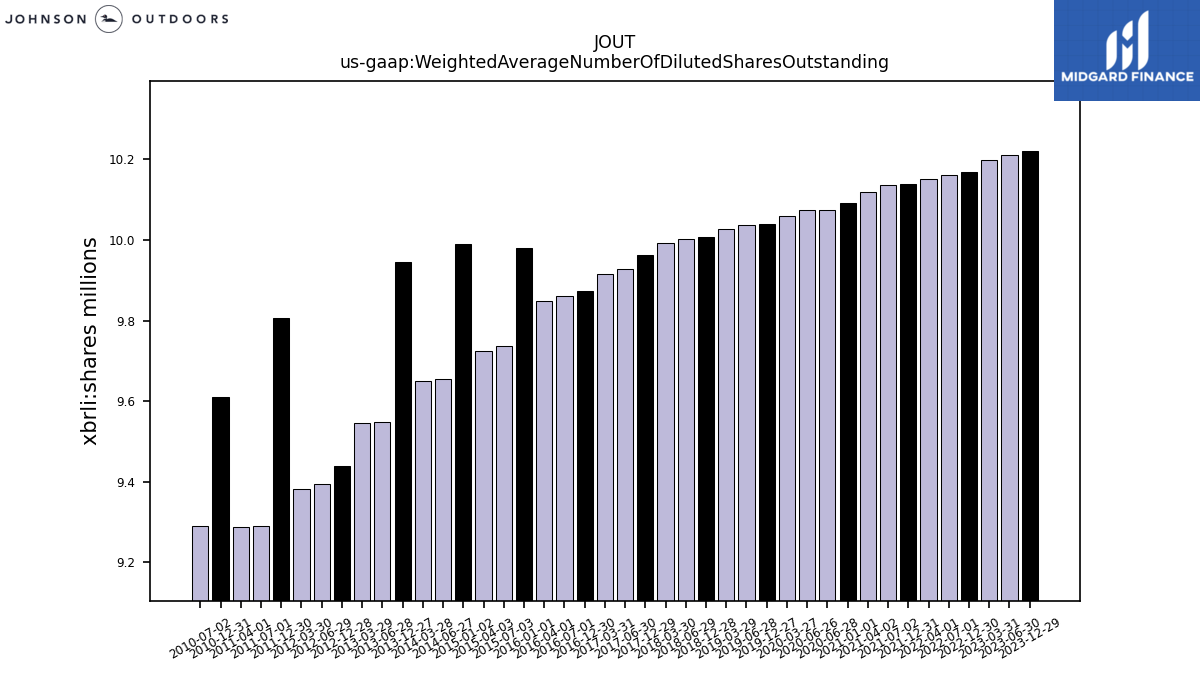
| Weighted Average Number Of Diluted Shares Outstanding | 10.22 | NA | 10.21 | 10.20 | 10.17 | NA | 10.16 | 10.15 | 10.14 | NA | 10.14 | 10.12 | 10.09 | NA | 10.07 | 10.07 | 10.06 | 10.04 | NA | 10.04 | 10.03 | 10.01 | NA | 10.00 | 9.99 | 9.96 | NA | 9.93 | 9.91 | 9.87 | NA | 9.86 | 9.85 | 9.98 | NA | 9.74 | 9.72 | 9.99 | NA | 9.65 | 9.65 | 9.95 | NA | 9.55 | 9.55 | 9.44 | NA | 9.39 | 9.38 | 9.81 | NA | 9.29 | 9.29 | 9.61 | NA | 9.29 | NA | NA |
| 2023-12-29 | 2023-09-29 | 2023-06-30 | 2023-03-31 | 2022-12-30 | 2022-09-30 | 2022-07-01 | 2022-04-01 | 2021-12-31 | 2021-10-01 | 2021-07-02 | 2021-04-02 | 2021-01-01 | 2020-10-02 | 2020-06-28 | 2020-06-26 | 2020-03-27 | 2019-12-27 | 2019-09-27 | 2019-06-28 | 2019-03-29 | 2018-12-28 | 2018-09-28 | 2018-06-29 | 2018-03-30 | 2017-12-29 | 2017-09-29 | 2017-06-30 | 2017-03-31 | 2016-12-30 | 2016-09-30 | 2016-07-01 | 2016-04-01 | 2016-01-01 | 2015-10-02 | 2015-07-03 | 2015-04-03 | 2015-01-02 | 2014-10-03 | 2014-06-27 | 2014-03-28 | 2013-12-27 | 2013-09-27 | 2013-06-28 | 2013-03-29 | 2012-12-28 | 2012-09-28 | 2012-06-29 | 2012-03-30 | 2011-12-30 | 2011-09-30 | 2011-07-01 | 2011-04-01 | 2010-12-31 | 2010-10-01 | 2010-07-02 | 2010-04-02 | 2010-01-01 | ||
|---|---|---|---|---|---|---|---|---|---|---|---|---|---|---|---|---|---|---|---|---|---|---|---|---|---|---|---|---|---|---|---|---|---|---|---|---|---|---|---|---|---|---|---|---|---|---|---|---|---|---|---|---|---|---|---|---|---|---|---|
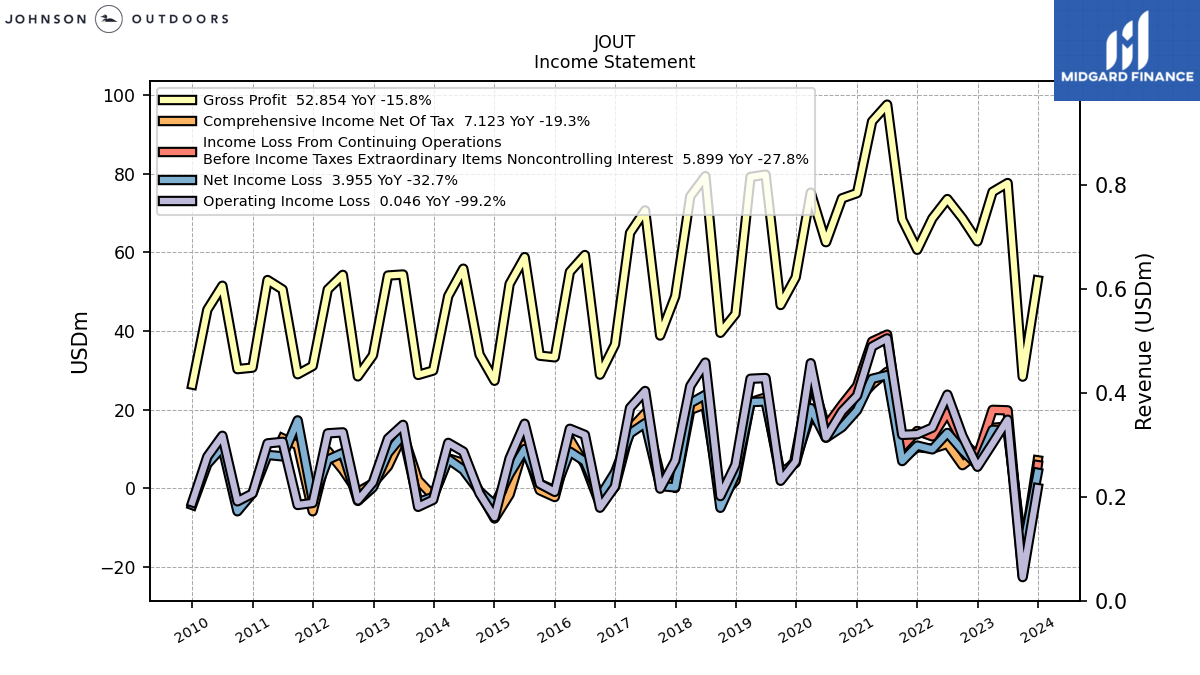
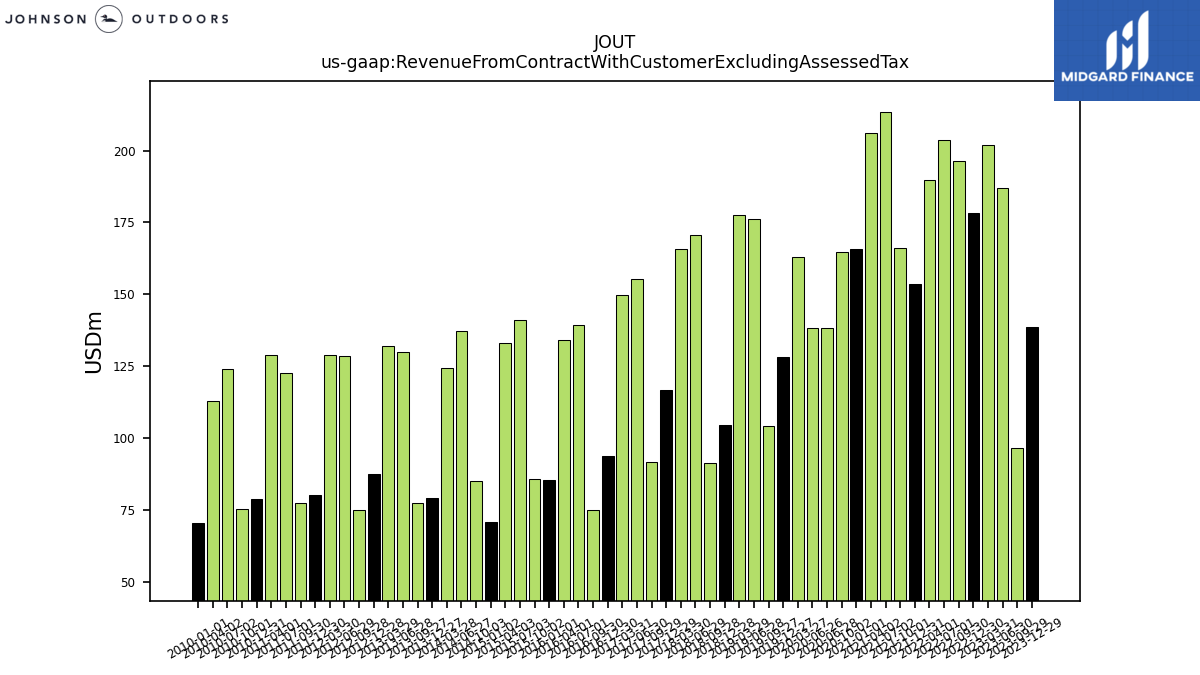
| Revenue From Contract With Customer Excluding Assessed Tax | 138.64 | 96.34 | 187.05 | 202.12 | 178.34 | 196.39 | 203.82 | 189.62 | 153.52 | 166.26 | 213.57 | 206.16 | 165.67 | 164.68 | 138.39 | 138.39 | 163.08 | 128.05 | 104.02 | 176.25 | 177.71 | 104.44 | 91.13 | 170.78 | 165.78 | 116.58 | 91.75 | 155.27 | 149.81 | 93.73 | 74.94 | 139.30 | 134.19 | 85.30 | 85.67 | 140.88 | 133.11 | 70.82 | 84.90 | 137.13 | 124.27 | 79.10 | 77.31 | 129.77 | 132.10 | 87.27 | 74.80 | 128.59 | 128.73 | 80.18 | 77.38 | 122.48 | 128.86 | 78.70 | 75.12 | 123.95 | 112.90 | 70.46 | |
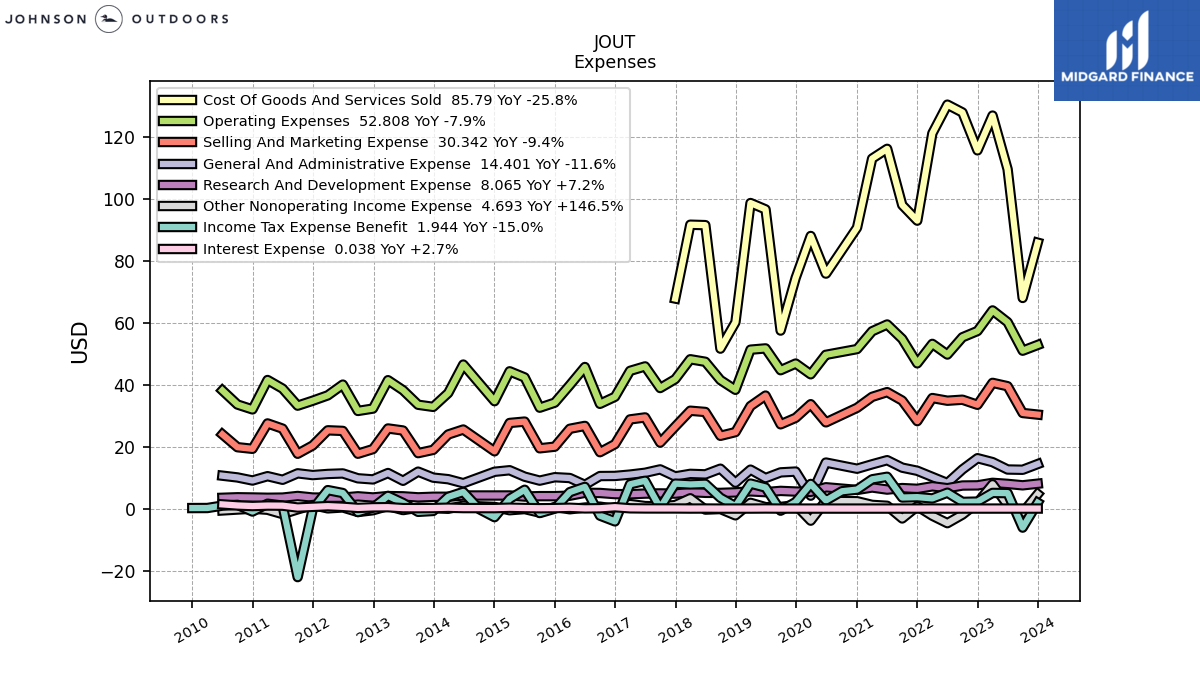
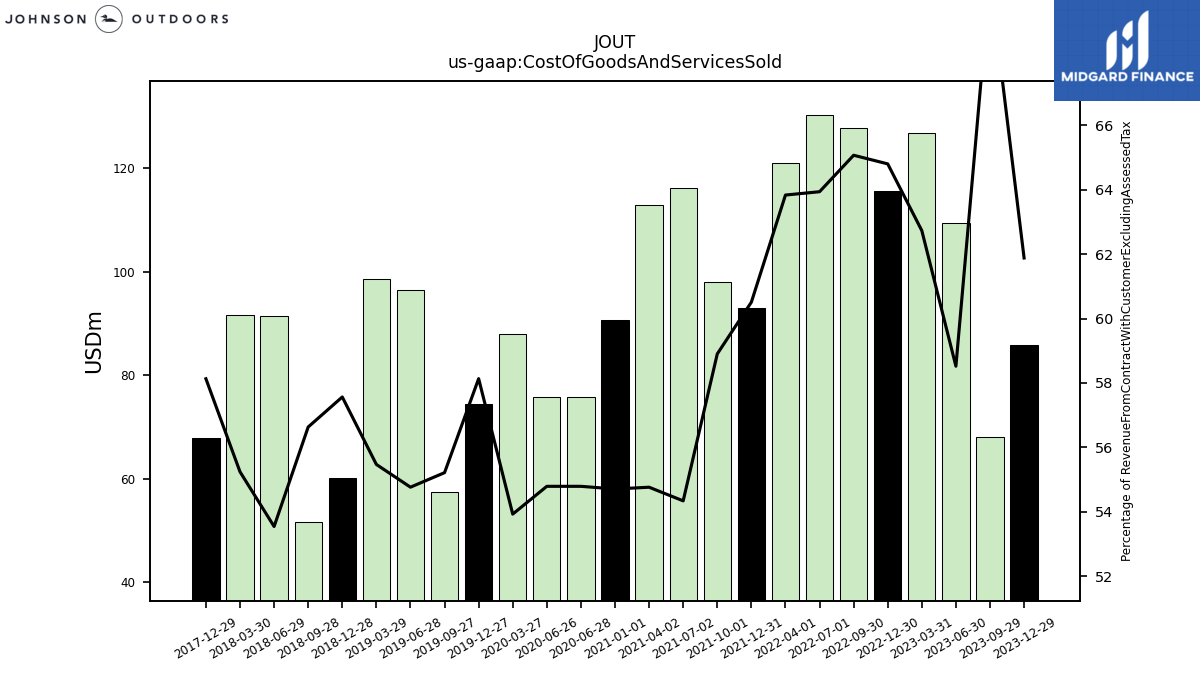
| Cost Of Goods And Services Sold | 85.79 | 67.96 | 109.46 | 126.78 | 115.56 | 127.78 | 130.31 | 121.04 | 92.89 | 97.93 | 116.06 | 112.90 | 90.64 | NA | 75.83 | 75.83 | 87.95 | 74.44 | 57.44 | 96.53 | 98.58 | 60.12 | 51.61 | 91.45 | 91.58 | 67.77 | NA | NA | NA | NA | NA | NA | NA | NA | NA | NA | NA | NA | NA | NA | NA | NA | NA | NA | NA | NA | NA | NA | NA | NA | NA | NA | NA | NA | NA | NA | NA | NA | |
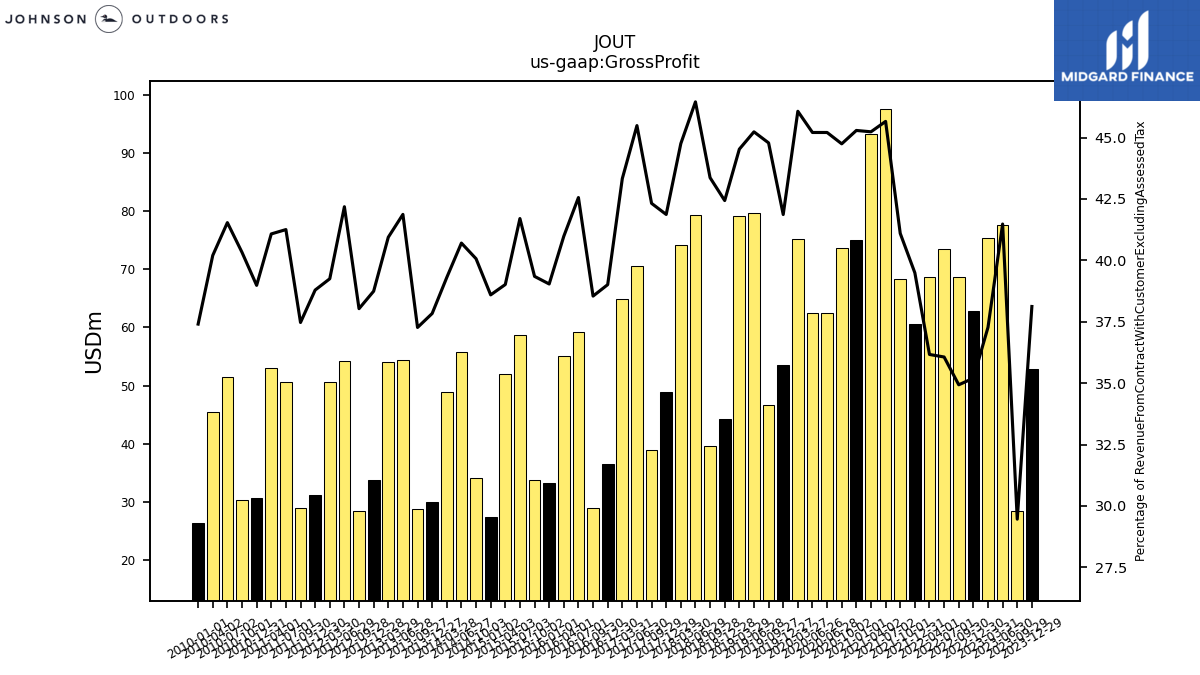
| Gross Profit | 52.85 | 28.39 | 77.59 | 75.33 | 62.78 | 68.61 | 73.51 | 68.58 | 60.63 | 68.33 | 97.51 | 93.25 | 75.03 | 73.69 | 62.56 | 62.56 | 75.13 | 53.61 | 46.58 | 79.72 | 79.13 | 44.32 | 39.52 | 79.33 | 74.19 | 48.81 | 38.83 | 70.63 | 64.91 | 36.56 | 28.89 | 59.28 | 54.99 | 33.30 | 33.71 | 58.75 | 51.94 | 27.33 | 34.02 | 55.82 | 48.85 | 29.93 | 28.81 | 54.34 | 54.08 | 33.81 | 28.45 | 54.25 | 50.53 | 31.10 | 28.99 | 50.53 | 52.93 | 30.68 | 30.29 | 51.49 | 45.39 | 26.36 | |
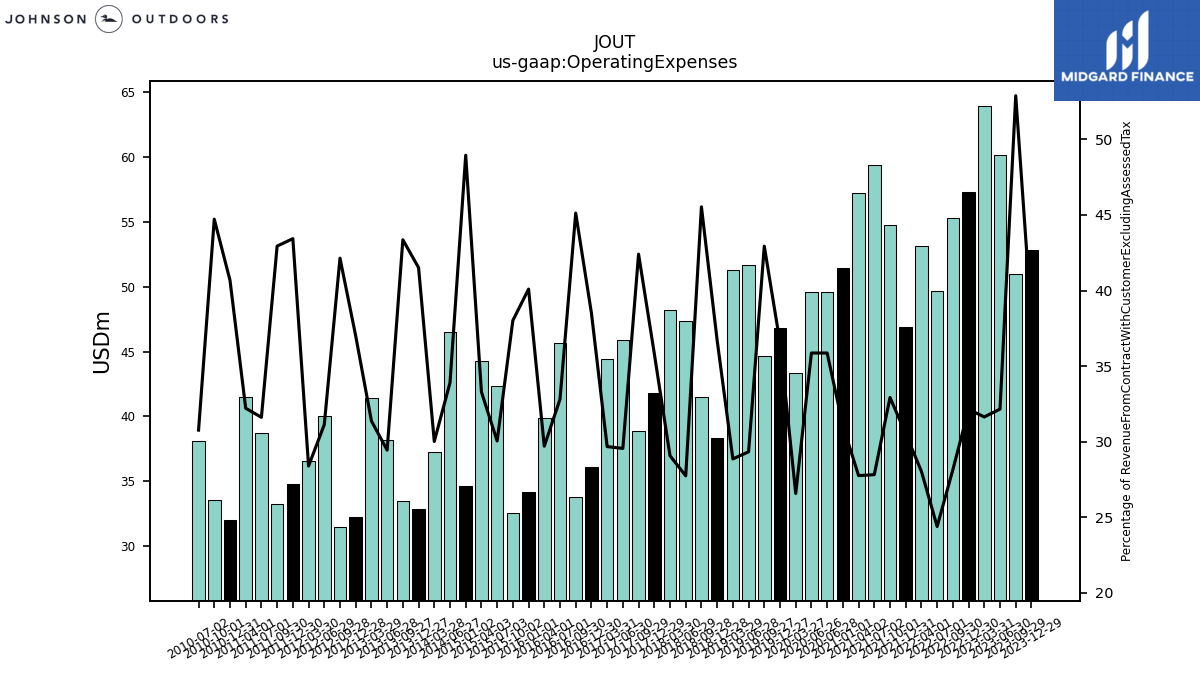
| Operating Expenses | 52.81 | 50.95 | 60.14 | 63.95 | 57.31 | 55.28 | 49.71 | 53.16 | 46.87 | 54.74 | 59.41 | 57.22 | 51.47 | NA | 49.63 | 49.63 | 43.34 | 46.81 | 44.66 | 51.70 | 51.28 | 38.34 | 41.49 | 47.38 | 48.19 | 41.77 | 38.91 | 45.89 | 44.45 | 36.09 | 33.81 | 45.70 | 39.86 | 34.20 | 32.57 | 42.33 | 44.31 | 34.66 | NA | 46.49 | 37.30 | 32.84 | 33.52 | 38.20 | 41.45 | 32.29 | 31.52 | 40.02 | 36.55 | 34.82 | 33.22 | 38.72 | 41.51 | 32.02 | 33.59 | 38.13 | NA | NA | |
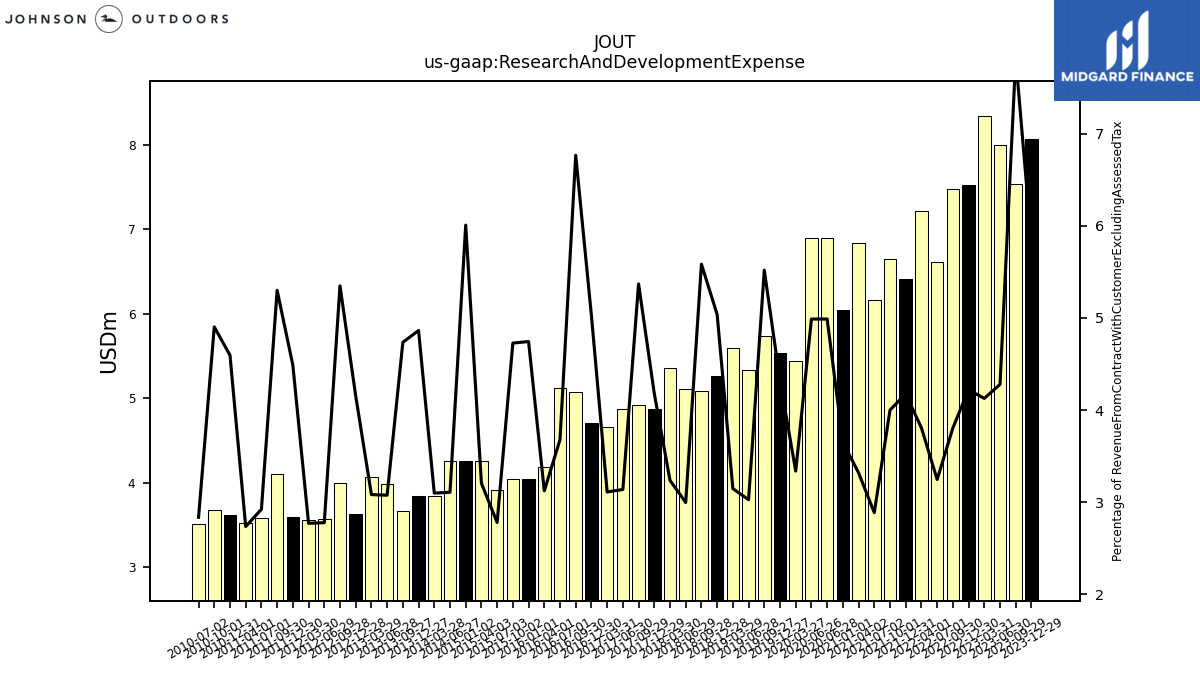
| Research And Development Expense | 8.06 | 7.54 | 8.00 | 8.34 | 7.53 | 7.47 | 6.61 | 7.22 | 6.41 | 6.65 | 6.16 | 6.84 | 6.05 | NA | 6.90 | 6.90 | 5.44 | 5.53 | 5.74 | 5.33 | 5.59 | 5.26 | 5.09 | 5.12 | 5.36 | 4.87 | 4.93 | 4.87 | 4.66 | 4.71 | 5.07 | 5.12 | 4.19 | 4.05 | 4.05 | 3.91 | 4.26 | 4.25 | NA | 4.26 | 3.85 | 3.85 | 3.66 | 3.99 | 4.07 | 3.62 | 4.00 | 3.57 | 3.56 | 3.60 | 4.10 | 3.58 | 3.52 | 3.62 | 3.68 | 3.51 | NA | NA | |
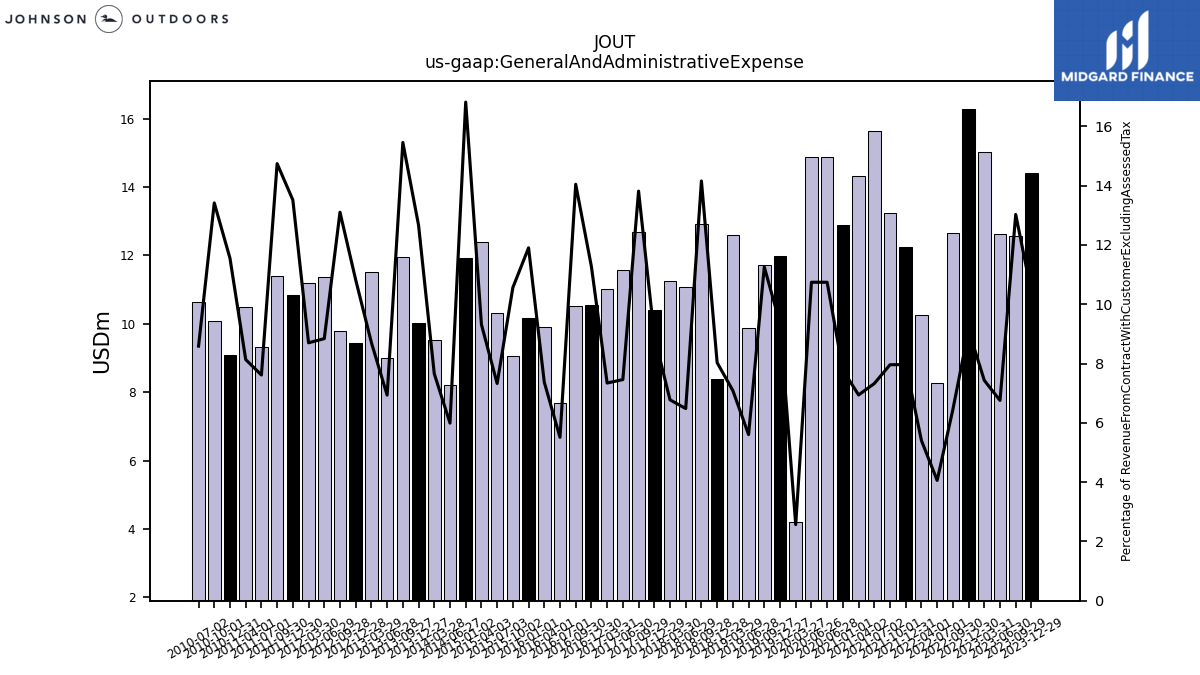
| General And Administrative Expense | 14.40 | 12.55 | 12.64 | 15.02 | 16.28 | 12.67 | 8.27 | 10.25 | 12.23 | 13.23 | 15.65 | 14.31 | 12.89 | NA | 14.87 | 14.87 | 4.19 | 11.97 | 11.71 | 9.88 | 12.60 | 8.39 | 12.90 | 11.07 | 11.23 | 10.41 | 12.68 | 11.58 | 11.00 | 10.56 | 10.53 | 7.68 | 9.89 | 10.15 | 9.05 | 10.32 | 12.40 | 11.91 | NA | 8.22 | 9.51 | 10.02 | 11.95 | 9.00 | 11.50 | 9.45 | 9.80 | 11.37 | 11.20 | 10.84 | 11.41 | 9.33 | 10.48 | 9.09 | 10.08 | 10.65 | NA | NA | |
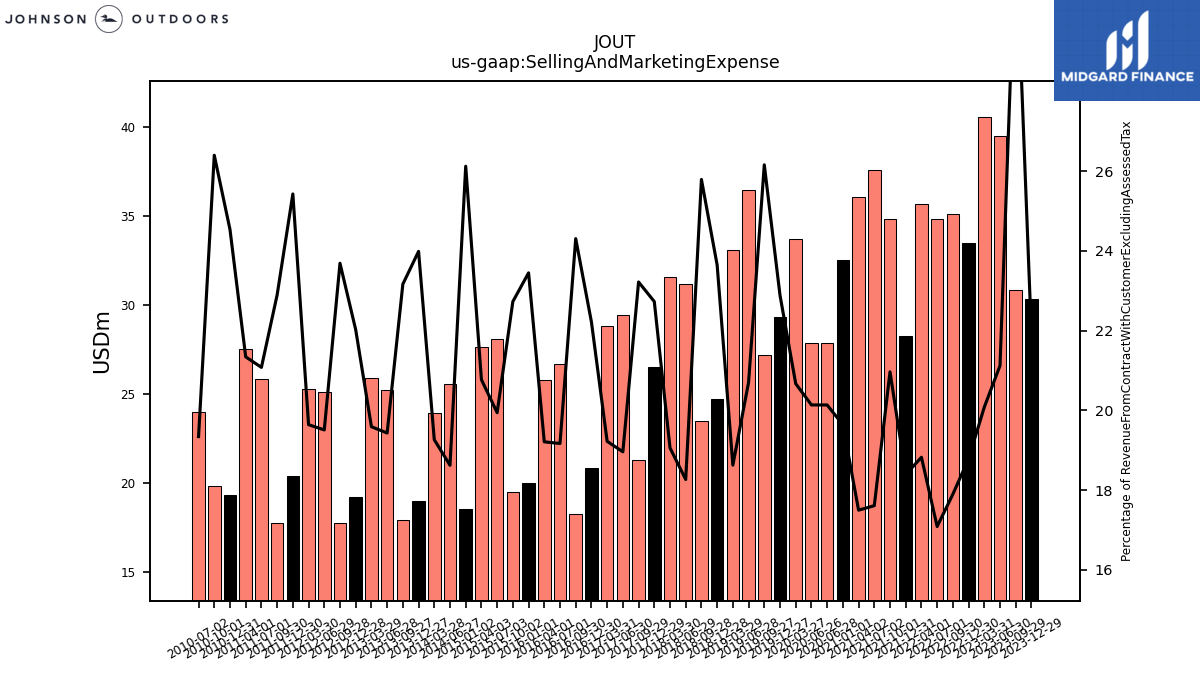
| Selling And Marketing Expense | 30.34 | 30.86 | 39.50 | 40.58 | 33.50 | 35.15 | 34.82 | 35.69 | 28.23 | 34.85 | 37.60 | 36.07 | 32.53 | NA | 27.86 | 27.86 | 33.71 | 29.30 | 27.21 | 36.48 | 33.10 | 24.69 | 23.50 | 31.19 | 31.59 | 26.50 | 21.30 | 29.44 | 28.80 | 20.82 | 18.21 | 26.70 | 25.78 | 20.00 | 19.47 | 28.09 | 27.64 | 18.50 | NA | 25.54 | 23.94 | 18.97 | 17.91 | 25.21 | 25.88 | 19.22 | 17.72 | 25.09 | 25.28 | 20.39 | 17.71 | 25.81 | 27.50 | 19.31 | 19.83 | 23.97 | NA | NA | |
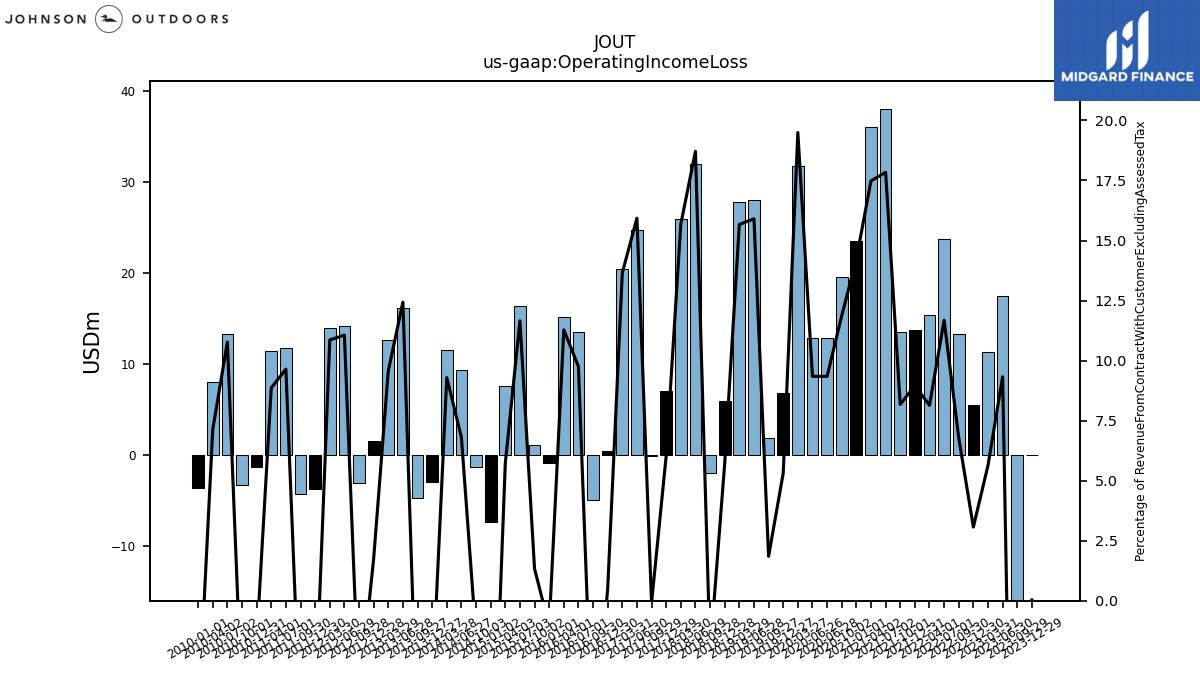
| Operating Income Loss | 0.05 | -22.57 | 17.44 | 11.39 | 5.47 | 13.32 | 23.80 | 15.43 | 13.76 | 13.59 | 38.10 | 36.04 | 23.56 | 19.55 | 12.93 | 12.93 | 31.79 | 6.80 | 1.92 | 28.03 | 27.84 | 5.98 | -1.97 | 31.95 | 26.00 | 7.04 | -0.08 | 24.74 | 20.46 | 0.47 | -4.93 | 13.58 | 15.14 | -0.90 | 1.14 | 16.42 | 7.62 | -7.33 | -1.28 | 9.33 | 11.55 | -2.91 | -4.71 | 16.13 | 12.64 | 1.53 | -3.07 | 14.22 | 13.98 | -3.72 | -4.23 | 11.81 | 11.42 | -1.33 | -3.30 | 13.35 | 8.05 | -3.56 | |
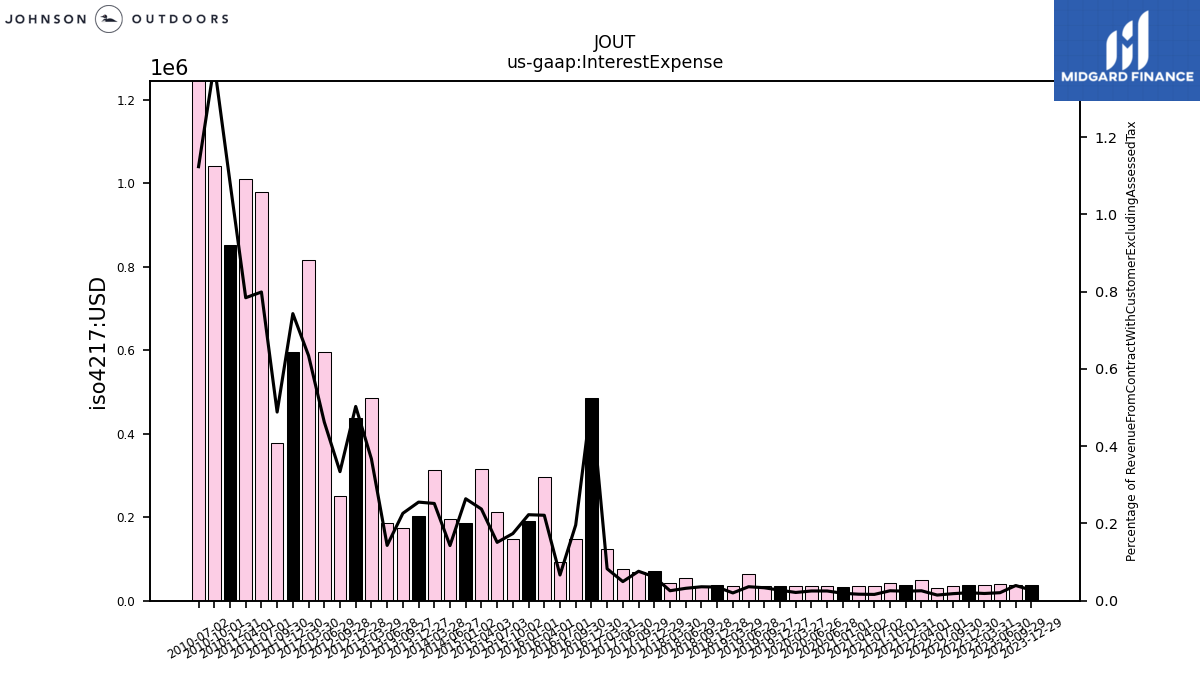
| Interest Expense | 0.04 | 0.04 | 0.04 | 0.04 | 0.04 | 0.04 | 0.03 | 0.05 | 0.04 | 0.04 | 0.04 | 0.04 | 0.03 | NA | 0.04 | 0.04 | 0.04 | 0.04 | 0.04 | 0.06 | 0.04 | 0.04 | 0.03 | 0.06 | 0.04 | 0.07 | 0.07 | 0.08 | 0.12 | 0.49 | 0.15 | 0.09 | 0.30 | 0.19 | 0.15 | 0.21 | 0.32 | 0.19 | NA | 0.20 | 0.31 | 0.20 | 0.17 | 0.19 | 0.48 | 0.44 | 0.25 | 0.59 | 0.82 | 0.60 | 0.38 | 0.98 | 1.01 | 0.85 | 1.04 | 1.39 | NA | NA | |
| Interest Paid Net | 0.03 | 0.03 | 0.03 | 0.03 | 0.03 | 0.03 | 0.03 | NA | 0.03 | 0.03 | 0.00 | NA | 0.03 | NA | 0.03 | 0.03 | 0.03 | 0.03 | 0.03 | 0.06 | 0.03 | 0.03 | 0.03 | 0.05 | 0.03 | 0.04 | NA | NA | NA | NA | NA | NA | NA | NA | NA | NA | NA | NA | NA | NA | NA | NA | NA | NA | NA | NA | NA | NA | NA | NA | NA | NA | NA | NA | NA | NA | NA | NA | |
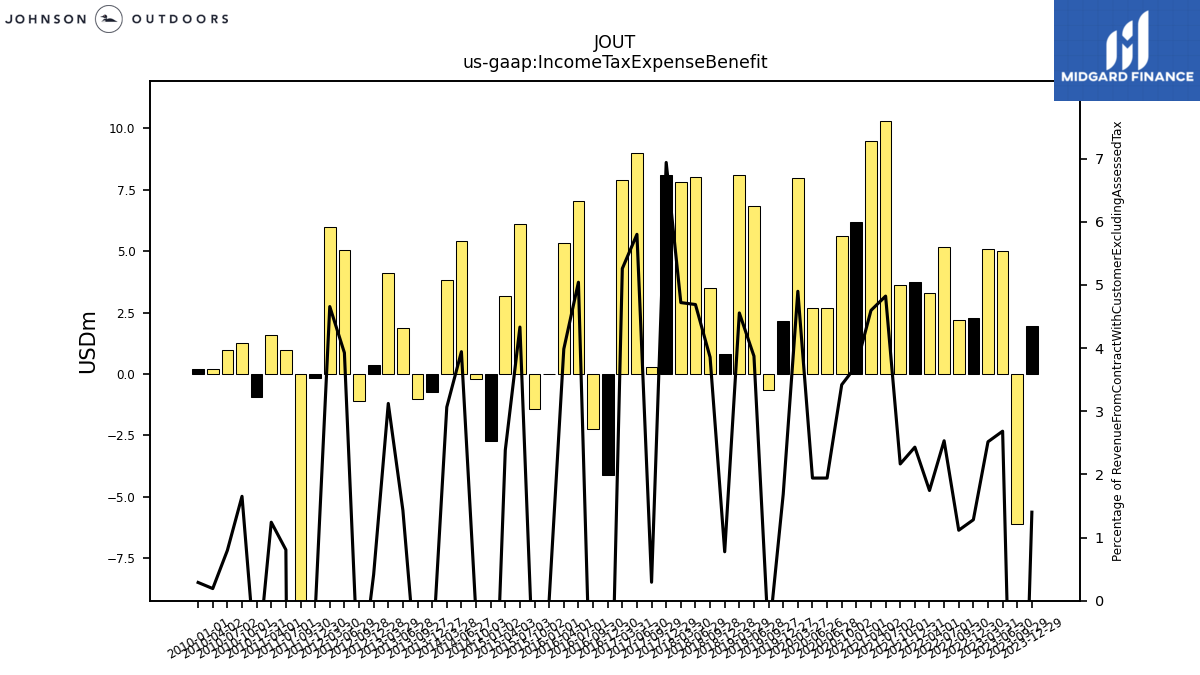
| Income Tax Expense Benefit | 1.94 | -6.11 | 5.02 | 5.09 | 2.29 | 2.19 | 5.16 | 3.31 | 3.73 | 3.60 | 10.30 | 9.48 | 6.16 | 5.63 | 2.69 | 2.69 | 7.99 | 2.16 | -0.64 | 6.83 | 8.10 | 0.81 | 3.51 | 8.01 | 7.83 | 8.09 | 0.27 | 9.01 | 7.88 | -4.10 | -2.23 | 7.02 | 5.35 | 0.01 | -1.41 | 6.10 | 3.17 | -2.73 | -0.19 | 5.41 | 3.81 | -0.73 | -1.01 | 1.86 | 4.13 | 0.36 | -1.09 | 5.05 | 6.00 | -0.16 | -22.07 | 0.99 | 1.60 | -0.92 | 1.24 | 0.99 | 0.22 | 0.20 | |
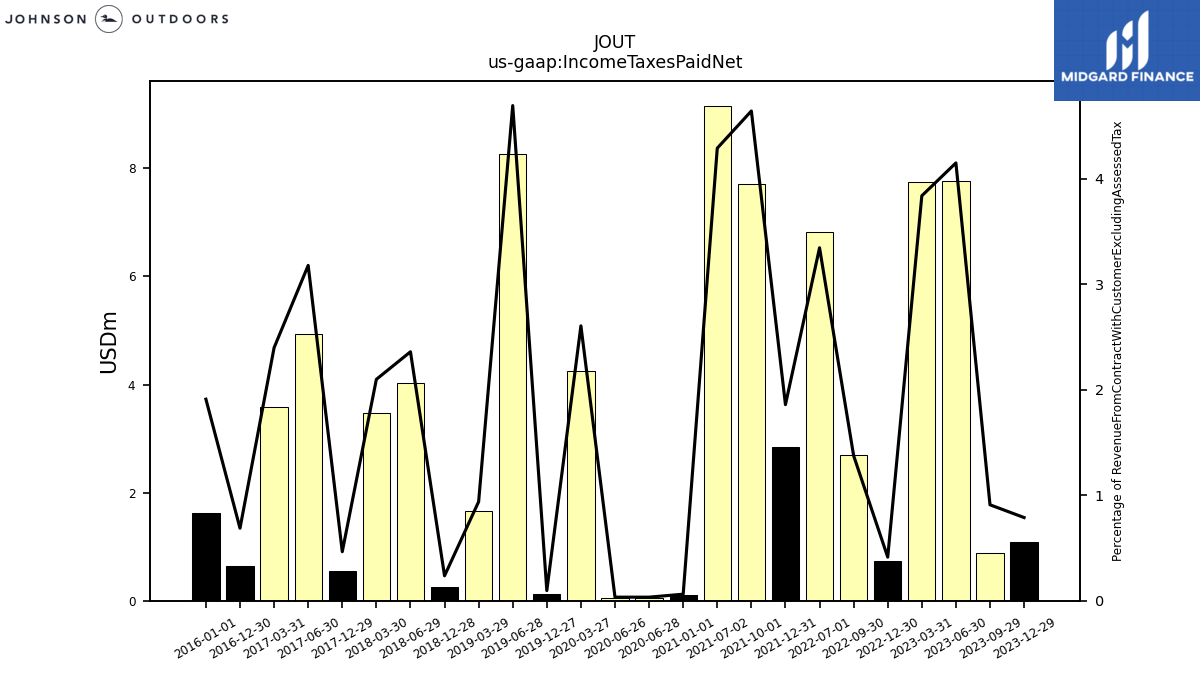
| Income Taxes Paid Net | 1.09 | 0.88 | 7.76 | 7.76 | 0.74 | 2.70 | 6.82 | NA | 2.85 | 7.72 | 9.16 | NA | 0.10 | NA | 0.05 | 0.05 | 4.25 | 0.12 | NA | 8.27 | 1.67 | 0.25 | NA | 4.03 | 3.48 | 0.54 | NA | 4.93 | 3.59 | 0.64 | NA | NA | NA | 1.63 | NA | NA | NA | NA | NA | NA | NA | NA | NA | NA | NA | NA | NA | NA | NA | NA | NA | NA | NA | NA | NA | NA | NA | NA | |
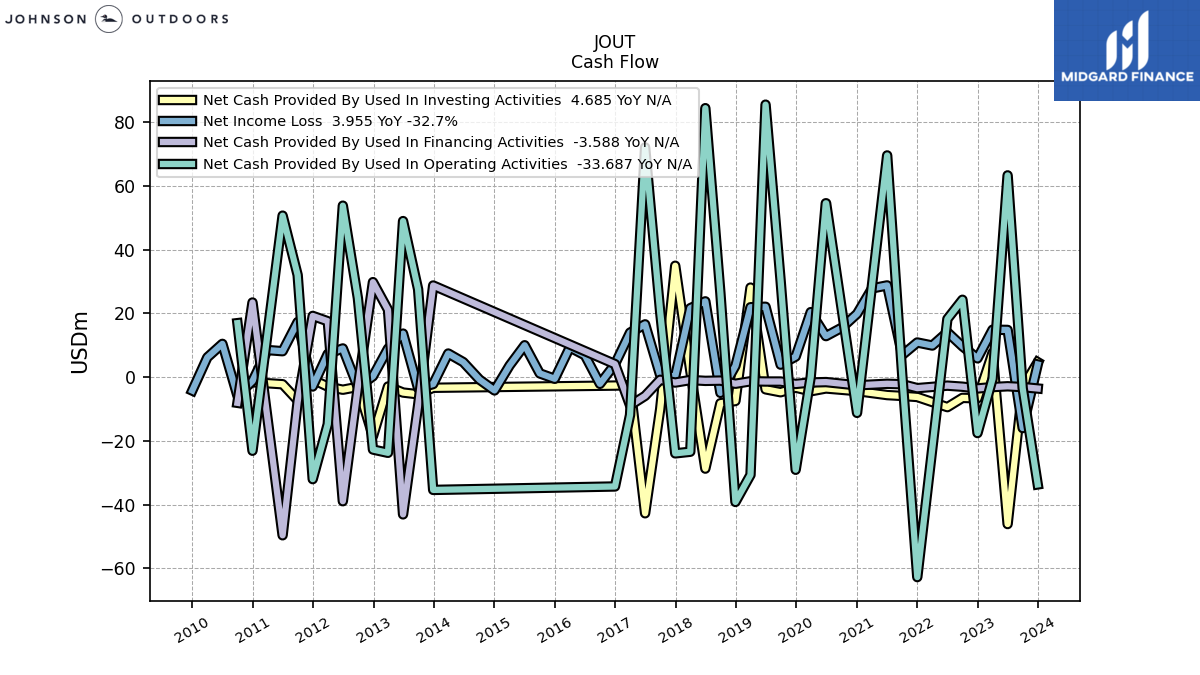
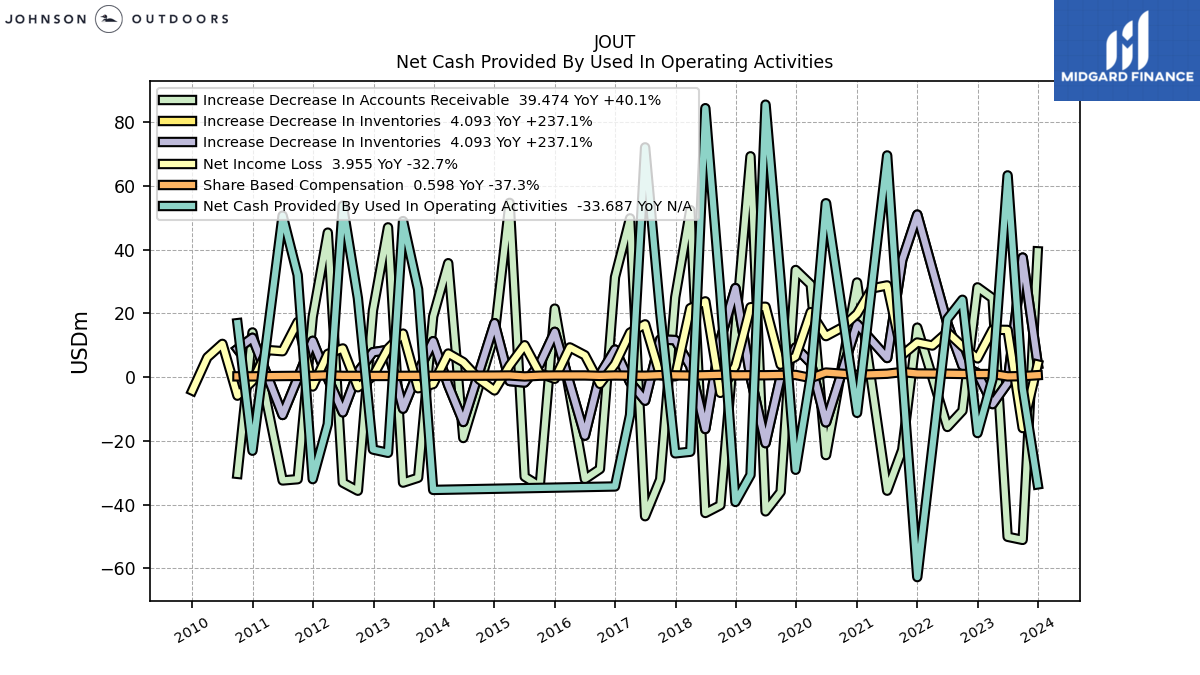
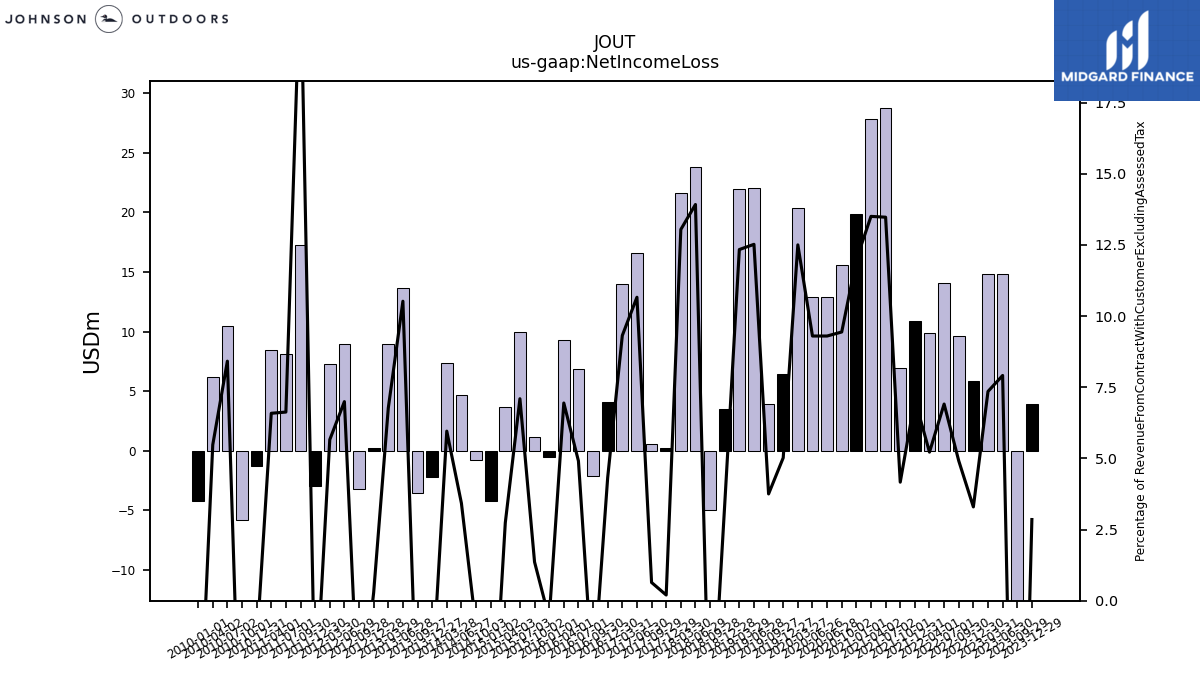
| Net Income Loss | 3.96 | -16.01 | 14.80 | 14.86 | 5.88 | 9.65 | 14.08 | 9.90 | 10.86 | 6.93 | 28.77 | 27.83 | 19.85 | 15.55 | 12.87 | 12.87 | 20.39 | 6.43 | 3.90 | 22.07 | 21.92 | 3.52 | -4.96 | 23.77 | 21.62 | 0.23 | 0.59 | 16.55 | 13.96 | 4.06 | -2.13 | 6.84 | 9.32 | -0.53 | 1.17 | 10.00 | 3.65 | -4.19 | -0.79 | 4.70 | 7.40 | -2.19 | -3.51 | 13.65 | 8.94 | 0.25 | -3.20 | 8.99 | 7.28 | -2.94 | 17.28 | 8.12 | 8.49 | -1.24 | -5.84 | 10.43 | 6.18 | -4.24 | |
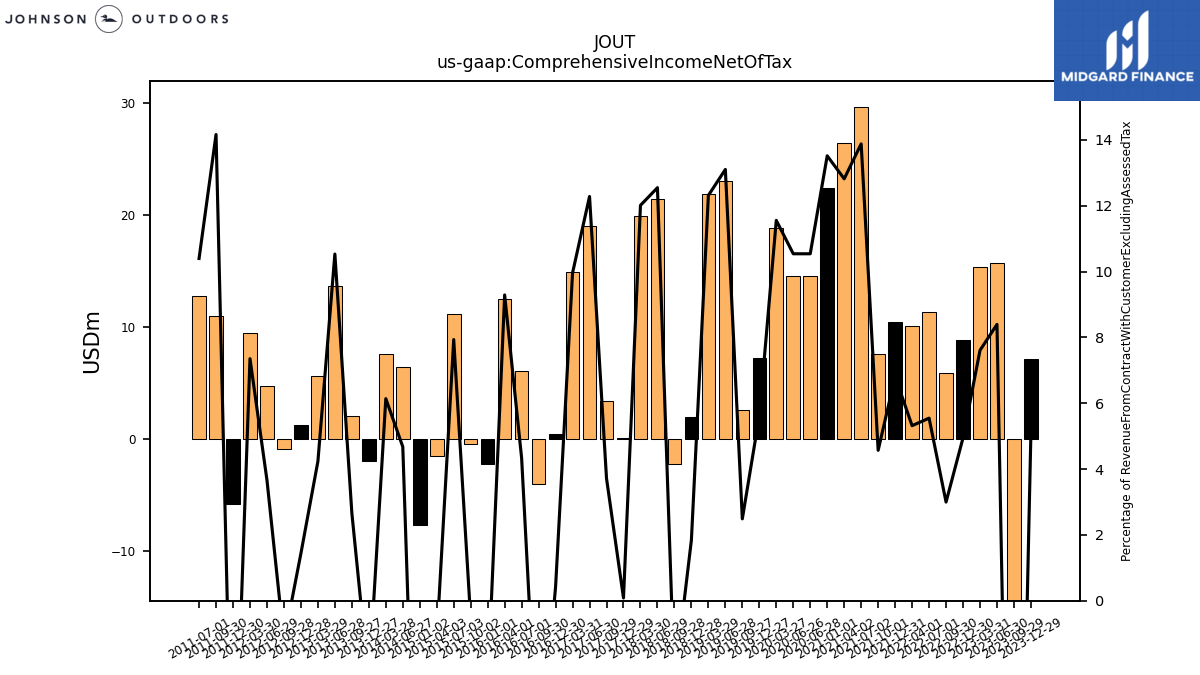
| Comprehensive Income Net Of Tax | 7.12 | -17.66 | 15.70 | 15.38 | 8.82 | 5.89 | 11.30 | 10.08 | 10.45 | 7.60 | 29.64 | 26.42 | 22.39 | NA | 14.59 | 14.59 | 18.84 | 7.19 | 2.59 | 23.09 | 21.88 | 1.93 | -2.27 | 21.43 | 19.91 | 0.10 | 3.41 | 19.07 | 14.92 | 0.40 | -4.07 | 6.04 | 12.47 | -2.21 | -0.48 | 11.18 | -1.56 | -7.66 | NA | 6.42 | 7.63 | -1.97 | 2.06 | 13.67 | 5.59 | 1.26 | -0.92 | 4.71 | 9.47 | -5.84 | 10.96 | 12.73 | NA | NA | NA | NA | NA | NA |
| 2023-12-29 | 2023-09-29 | 2023-06-30 | 2023-03-31 | 2022-12-30 | 2022-09-30 | 2022-07-01 | 2022-04-01 | 2021-12-31 | 2021-10-01 | 2021-07-02 | 2021-04-02 | 2021-01-01 | 2020-10-02 | 2020-06-28 | 2020-06-26 | 2020-03-27 | 2019-12-27 | 2019-09-27 | 2019-06-28 | 2019-03-29 | 2018-12-28 | 2018-09-28 | 2018-06-29 | 2018-03-30 | 2017-12-29 | 2017-09-29 | 2017-06-30 | 2017-03-31 | 2016-12-30 | 2016-09-30 | 2016-07-01 | 2016-04-01 | 2016-01-01 | 2015-10-02 | 2015-07-03 | 2015-04-03 | 2015-01-02 | 2014-10-03 | 2014-06-27 | 2014-03-28 | 2013-12-27 | 2013-09-27 | 2013-06-28 | 2013-03-29 | 2012-12-28 | 2012-09-28 | 2012-06-29 | 2012-03-30 | 2011-12-30 | 2011-09-30 | 2011-07-01 | 2011-04-01 | 2010-12-31 | 2010-10-01 | 2010-07-02 | 2010-04-02 | 2010-01-01 | ||
|---|---|---|---|---|---|---|---|---|---|---|---|---|---|---|---|---|---|---|---|---|---|---|---|---|---|---|---|---|---|---|---|---|---|---|---|---|---|---|---|---|---|---|---|---|---|---|---|---|---|---|---|---|---|---|---|---|---|---|---|
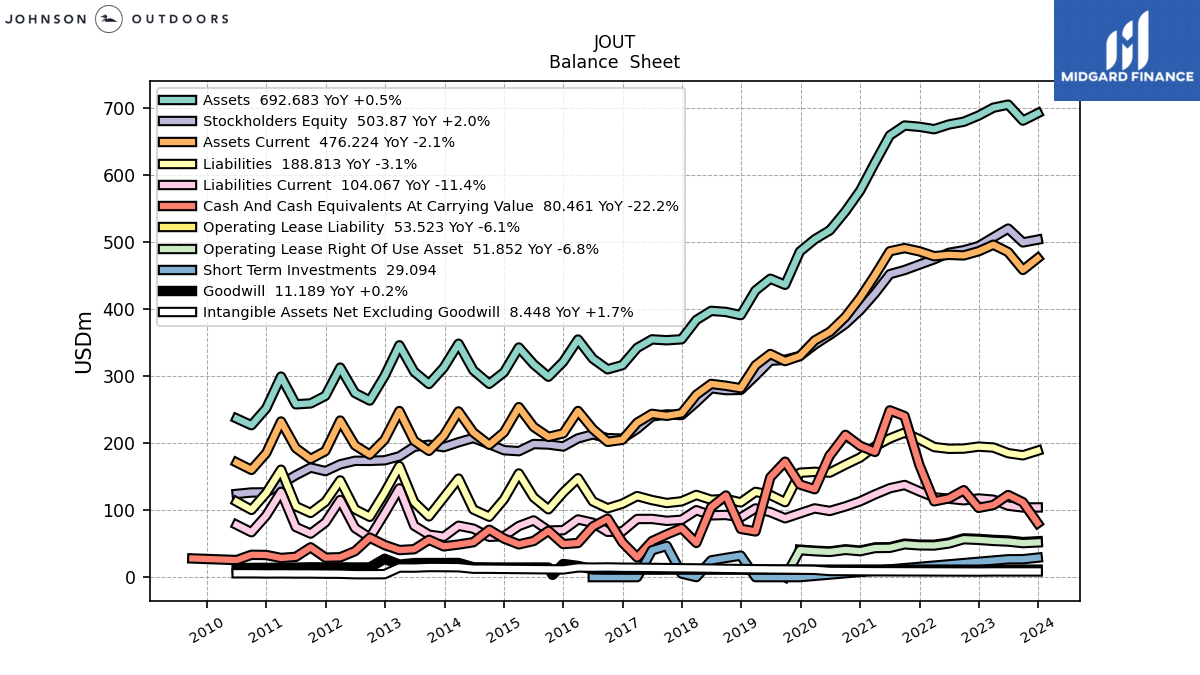
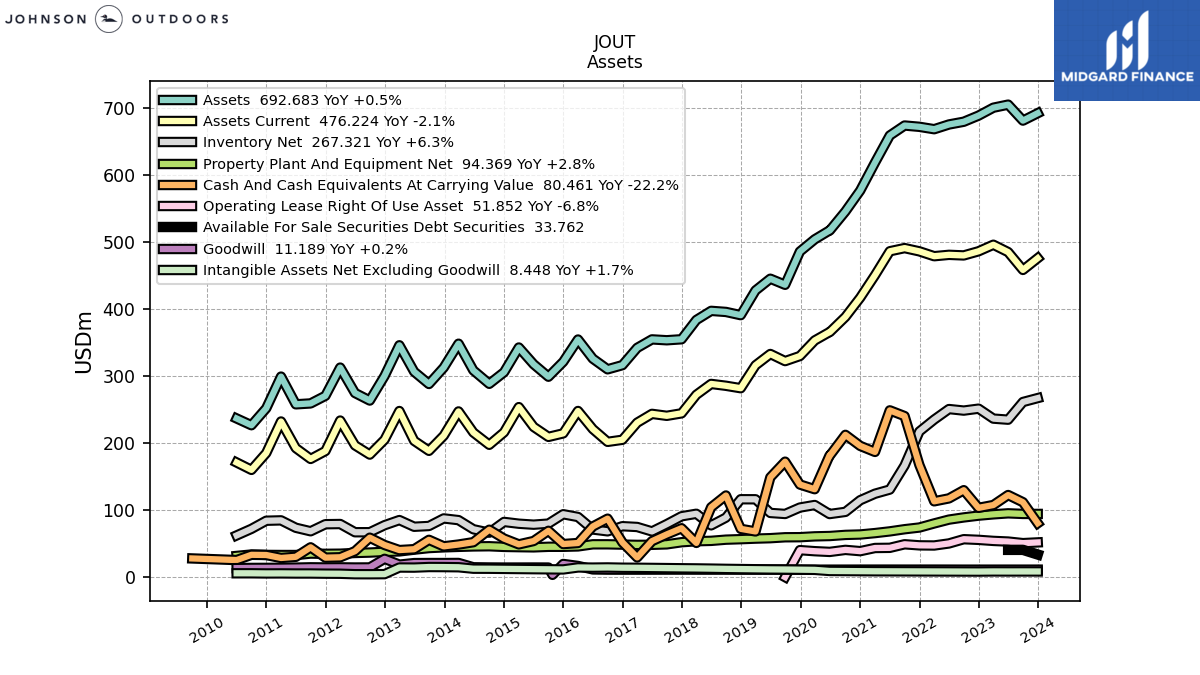
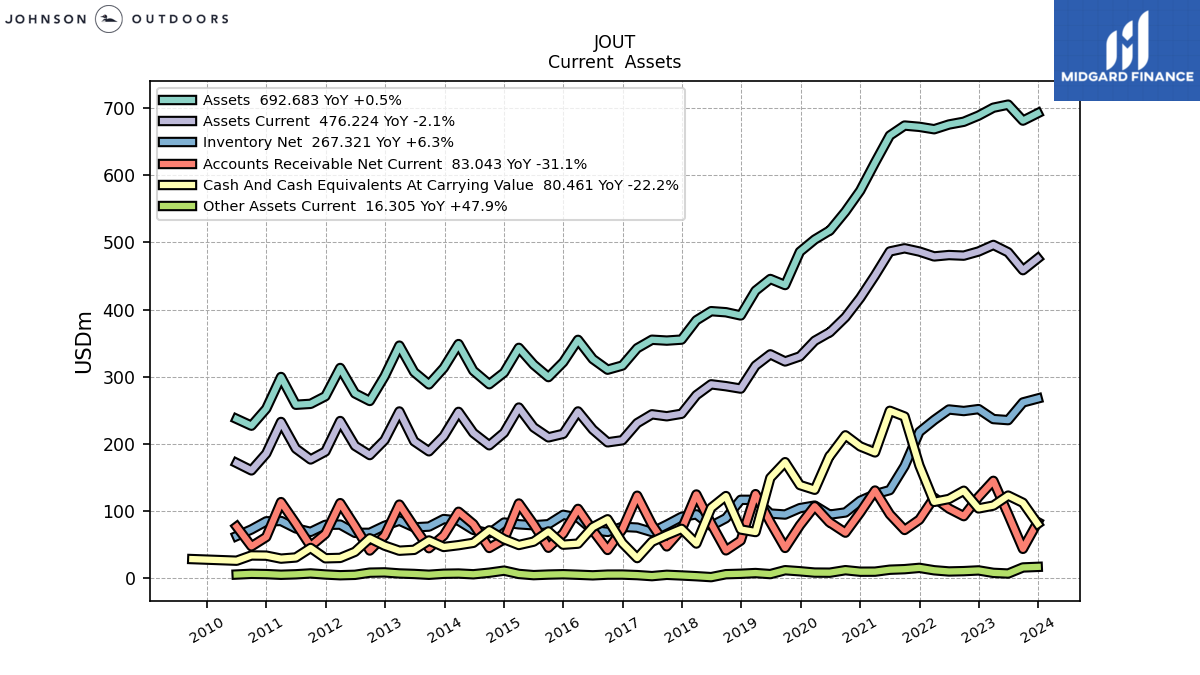
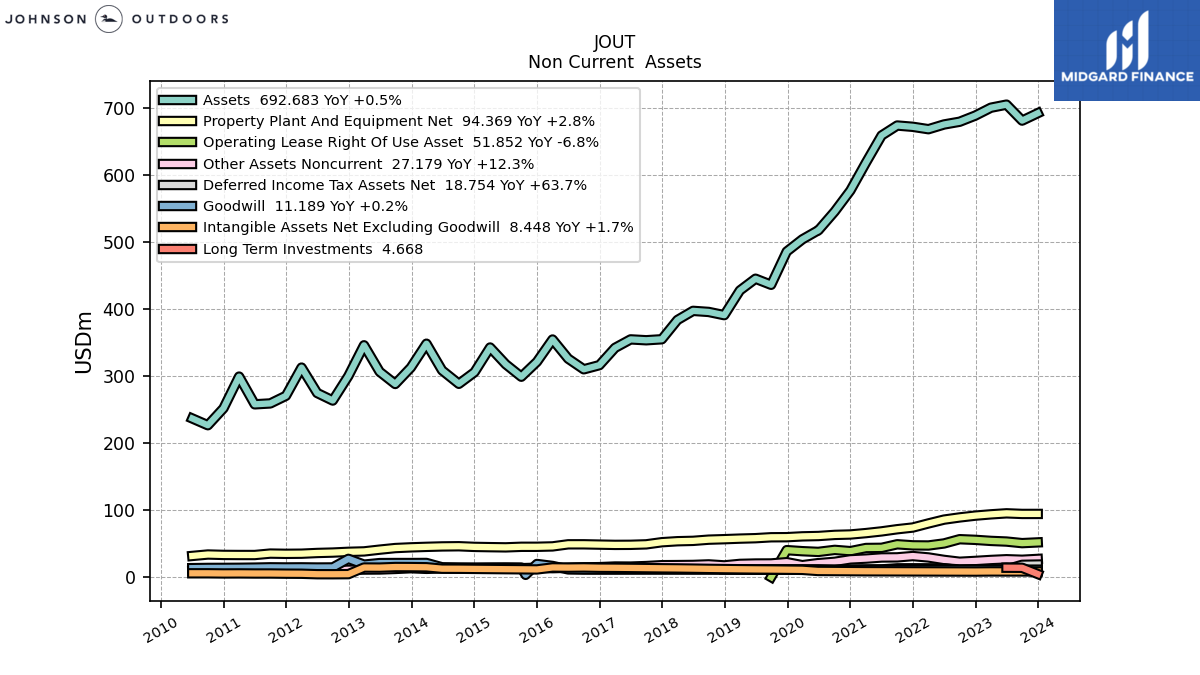
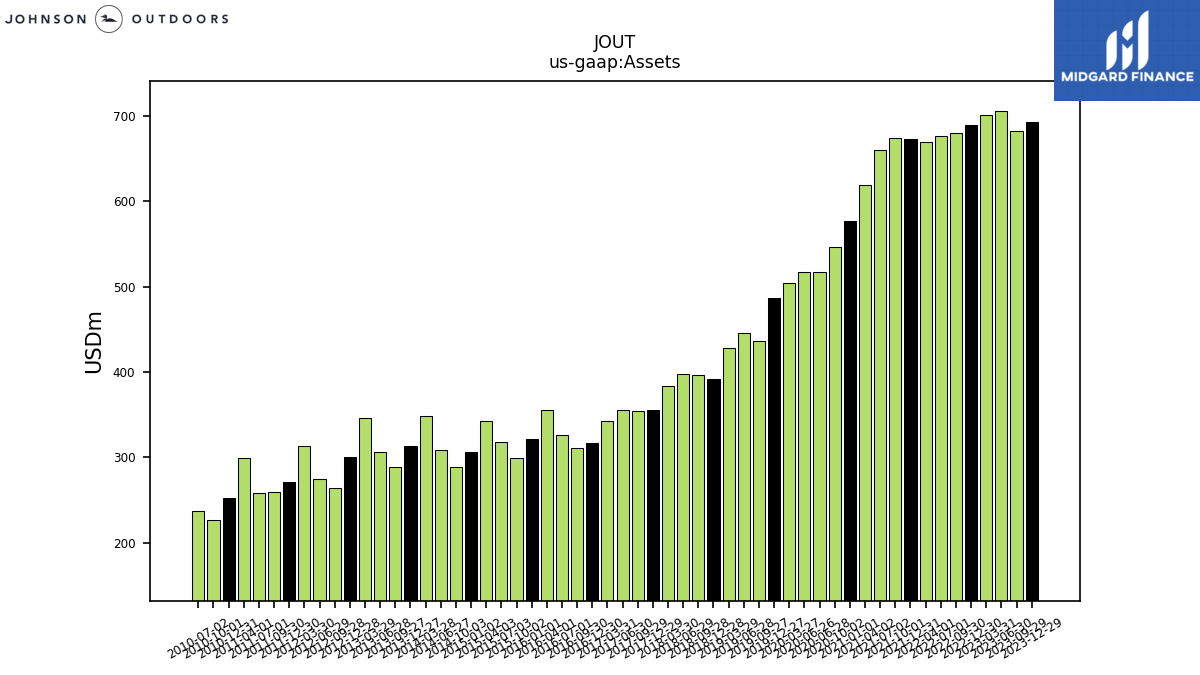
| Assets | 692.68 | 681.61 | 705.48 | 700.88 | 689.10 | 679.93 | 675.84 | 668.79 | 672.35 | 674.29 | 659.39 | 618.98 | 577.18 | 546.03 | 517.61 | 517.61 | 504.30 | 486.12 | 436.44 | 445.56 | 427.99 | 391.11 | 395.94 | 397.55 | 383.93 | 355.13 | 353.66 | 354.96 | 342.30 | 316.47 | 310.28 | 326.16 | 354.79 | 321.47 | 299.20 | 317.85 | 342.85 | 305.92 | 288.63 | 308.73 | 348.53 | 312.89 | 288.35 | 306.69 | 346.18 | 300.36 | 263.63 | 274.91 | 312.88 | 270.73 | 259.36 | 258.00 | 299.41 | 252.08 | 226.76 | 236.89 | NA | NA | |
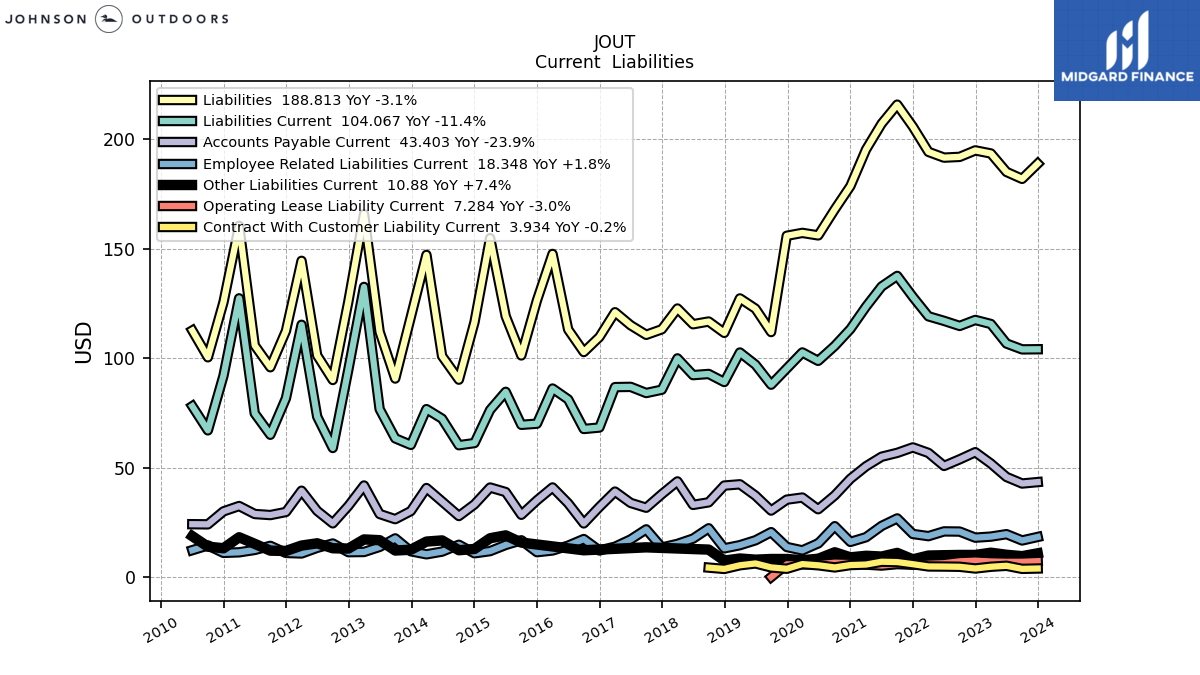
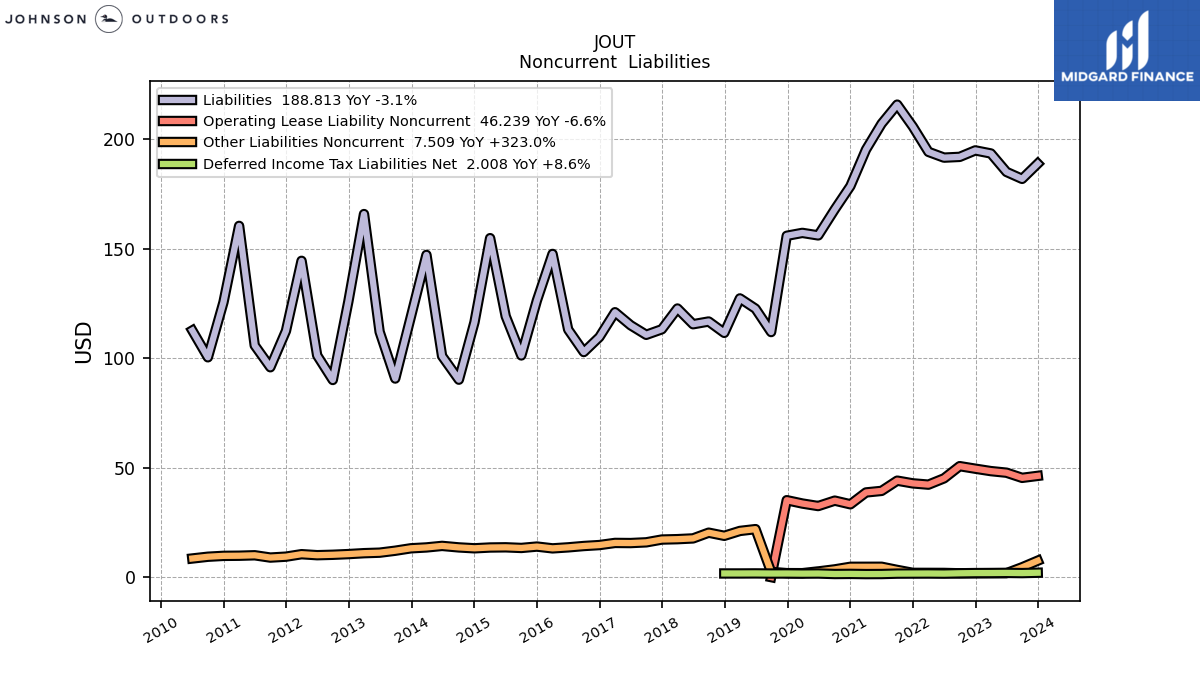
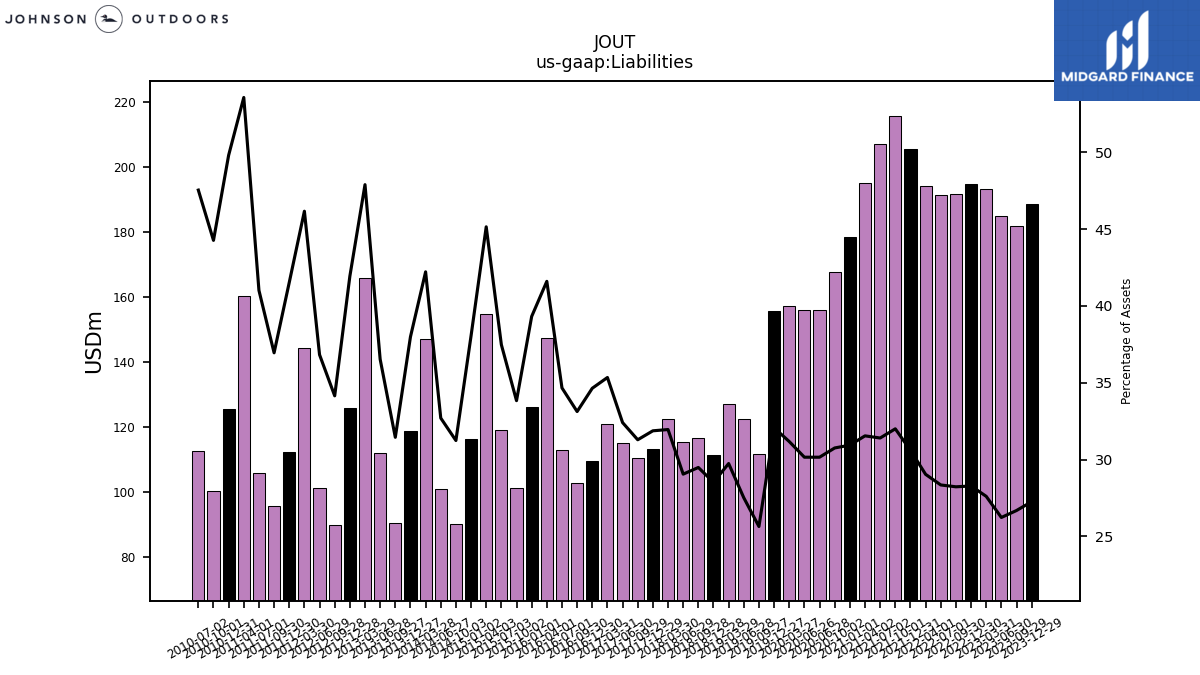
| Liabilities | 188.81 | 181.87 | 185.04 | 193.47 | 194.88 | 191.92 | 191.58 | 194.20 | 205.74 | 215.78 | 207.07 | 195.24 | 178.57 | 167.93 | 156.07 | 156.07 | 157.20 | 155.88 | 111.91 | 122.59 | 127.29 | 111.55 | 116.74 | 115.49 | 122.68 | 113.19 | 110.66 | 115.03 | 120.98 | 109.63 | 102.78 | 113.06 | 147.60 | 126.39 | 101.24 | 119.12 | 154.81 | 116.42 | 90.17 | 100.96 | 147.16 | 118.86 | 90.68 | 112.05 | 165.81 | 125.95 | 90.03 | 101.24 | 144.45 | 112.42 | 95.83 | 105.82 | 160.41 | 125.57 | 100.39 | 112.63 | NA | NA | |
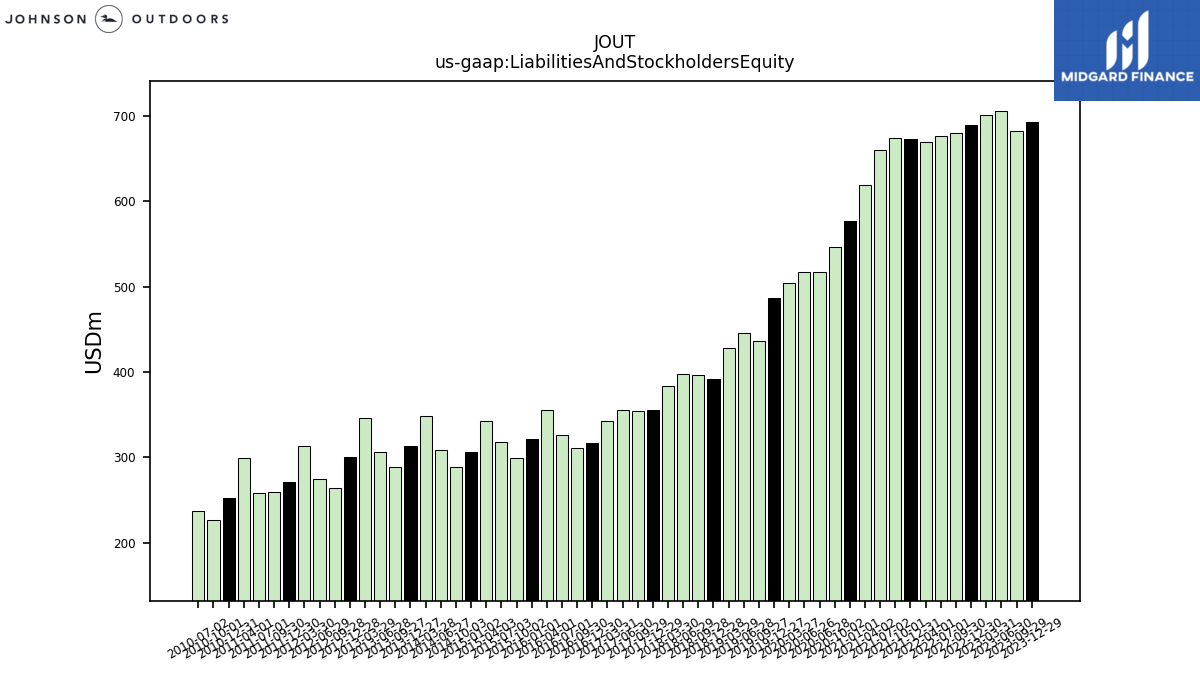
| Liabilities And Stockholders Equity | 692.68 | 681.61 | 705.48 | 700.88 | 689.10 | 679.93 | 675.84 | 668.79 | 672.35 | 674.29 | 659.39 | 618.98 | 577.18 | 546.03 | 517.61 | 517.61 | 504.30 | 486.12 | 436.44 | 445.56 | 427.99 | 391.11 | 395.94 | 397.55 | 383.93 | 355.13 | 353.66 | 354.96 | 342.30 | 316.47 | 310.28 | 326.16 | 354.79 | 321.47 | 299.20 | 317.85 | 342.85 | 305.92 | 288.63 | 308.73 | 348.53 | 312.89 | 288.35 | 306.69 | 346.18 | 300.36 | 263.63 | 274.91 | 312.88 | 270.73 | 259.36 | 258.00 | 299.41 | 252.08 | 226.76 | 236.89 | NA | NA | |
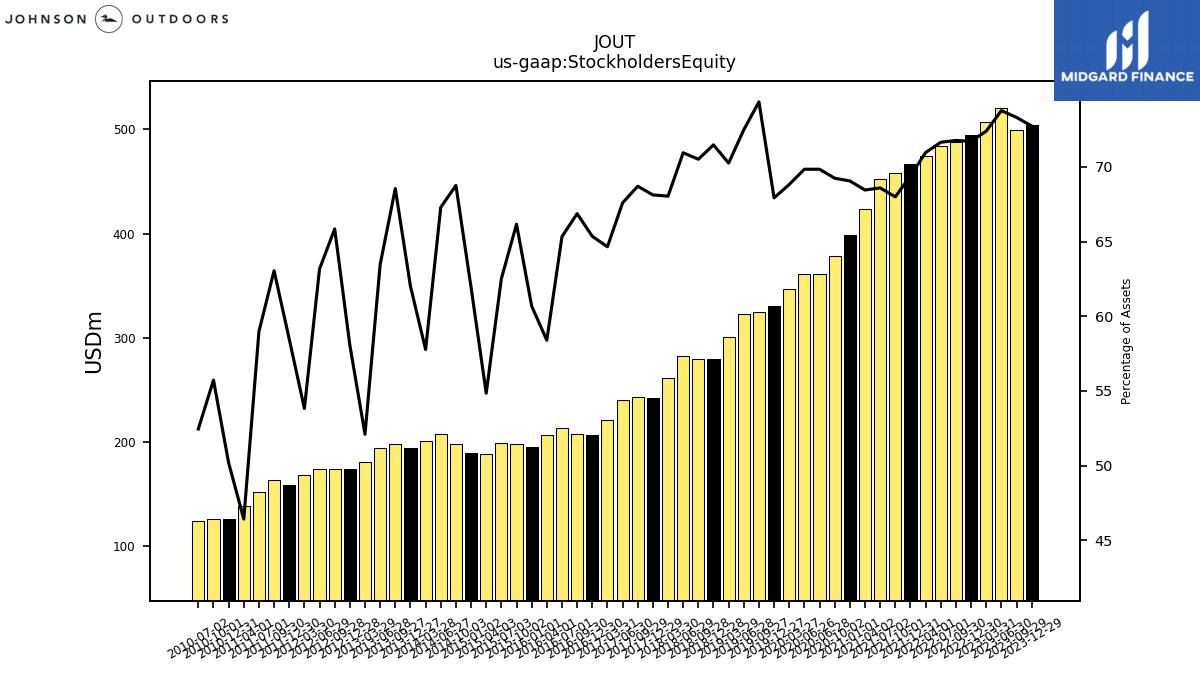
| Stockholders Equity | 503.87 | 499.74 | 520.44 | 507.41 | 494.22 | 488.01 | 484.27 | 474.59 | 466.61 | 458.50 | 452.32 | 423.74 | 398.61 | 378.10 | 361.53 | 361.53 | 347.10 | 330.24 | 324.53 | 322.97 | 300.70 | 279.57 | 279.20 | 282.06 | 261.25 | 241.95 | 243.00 | 239.92 | 221.32 | 206.84 | 207.50 | 213.10 | 207.19 | 195.08 | 197.97 | 198.72 | 188.04 | 189.50 | 198.46 | 207.77 | 201.37 | 194.02 | 197.67 | 194.64 | 180.37 | 174.42 | 173.60 | 173.67 | 168.43 | 158.30 | 163.53 | 152.18 | 139.00 | 126.51 | 126.37 | 124.26 | NA | NA |
| 2023-12-29 | 2023-09-29 | 2023-06-30 | 2023-03-31 | 2022-12-30 | 2022-09-30 | 2022-07-01 | 2022-04-01 | 2021-12-31 | 2021-10-01 | 2021-07-02 | 2021-04-02 | 2021-01-01 | 2020-10-02 | 2020-06-28 | 2020-06-26 | 2020-03-27 | 2019-12-27 | 2019-09-27 | 2019-06-28 | 2019-03-29 | 2018-12-28 | 2018-09-28 | 2018-06-29 | 2018-03-30 | 2017-12-29 | 2017-09-29 | 2017-06-30 | 2017-03-31 | 2016-12-30 | 2016-09-30 | 2016-07-01 | 2016-04-01 | 2016-01-01 | 2015-10-02 | 2015-07-03 | 2015-04-03 | 2015-01-02 | 2014-10-03 | 2014-06-27 | 2014-03-28 | 2013-12-27 | 2013-09-27 | 2013-06-28 | 2013-03-29 | 2012-12-28 | 2012-09-28 | 2012-06-29 | 2012-03-30 | 2011-12-30 | 2011-09-30 | 2011-07-01 | 2011-04-01 | 2010-12-31 | 2010-10-01 | 2010-07-02 | 2010-04-02 | 2010-01-01 | ||
|---|---|---|---|---|---|---|---|---|---|---|---|---|---|---|---|---|---|---|---|---|---|---|---|---|---|---|---|---|---|---|---|---|---|---|---|---|---|---|---|---|---|---|---|---|---|---|---|---|---|---|---|---|---|---|---|---|---|---|---|
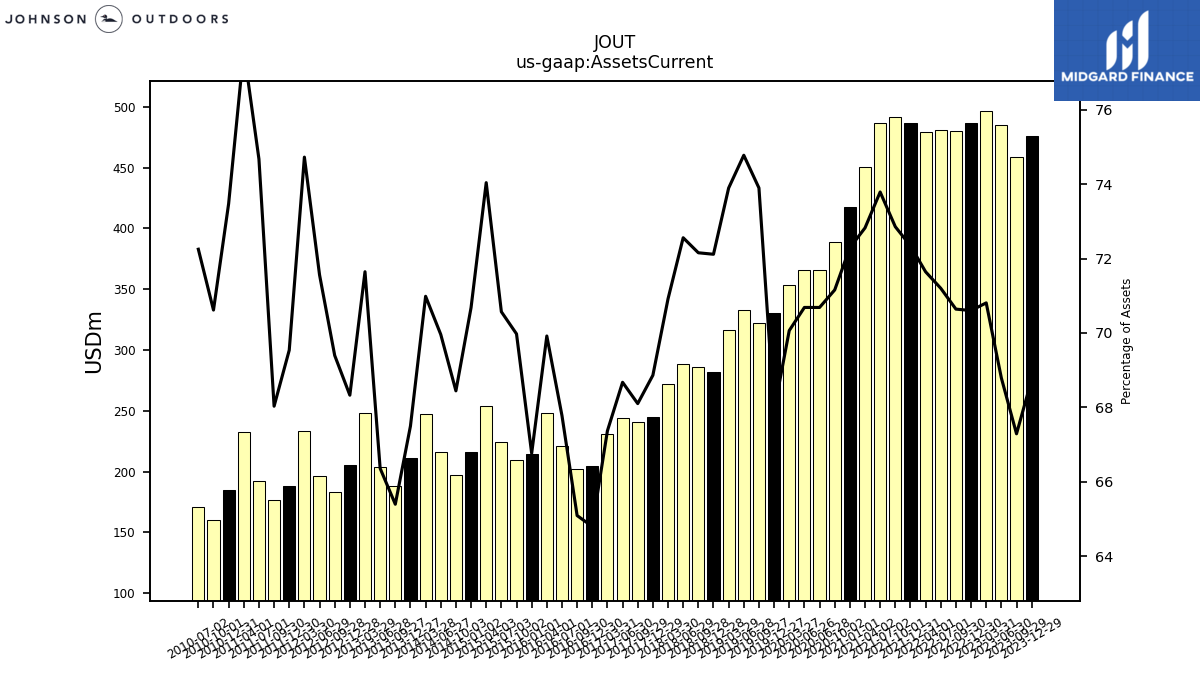
| Assets Current | 476.22 | 458.66 | 485.31 | 496.29 | 486.52 | 480.32 | 481.21 | 479.15 | 486.41 | 491.26 | 486.56 | 450.77 | 417.26 | 388.54 | 365.88 | 365.88 | 353.34 | 330.13 | 322.53 | 333.18 | 316.27 | 282.06 | 285.69 | 288.46 | 272.27 | 244.56 | 240.85 | 243.77 | 230.61 | 205.06 | 201.97 | 221.07 | 248.07 | 214.63 | 209.37 | 224.31 | 253.85 | 216.23 | 197.55 | 215.99 | 247.41 | 211.19 | 188.57 | 203.52 | 248.02 | 205.23 | 182.95 | 196.73 | 233.81 | 188.26 | 176.44 | 192.66 | 232.38 | 185.22 | 160.13 | 171.16 | NA | NA | |
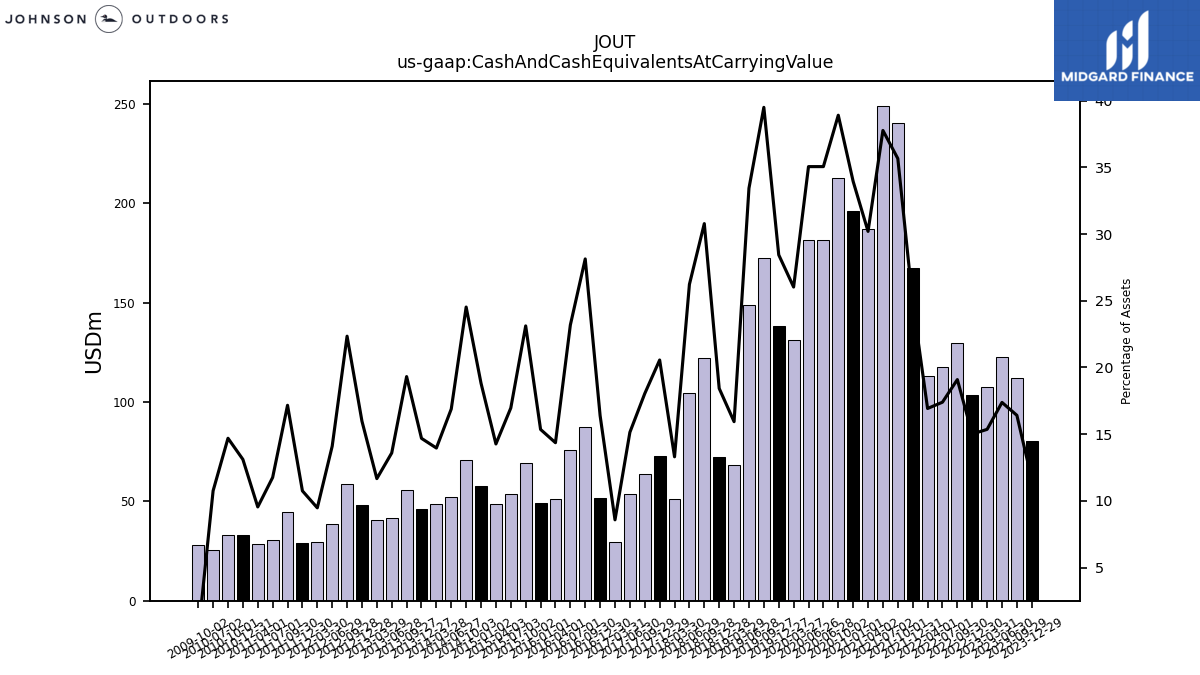
| Cash And Cash Equivalents At Carrying Value | 80.46 | 111.85 | 122.60 | 107.65 | 103.42 | 129.80 | 117.57 | 113.19 | 167.47 | 240.45 | 249.02 | 186.92 | 195.92 | 212.44 | 181.44 | 181.44 | 131.26 | 138.26 | 172.38 | 148.97 | 68.20 | 72.08 | 121.88 | 104.28 | 51.07 | 73.01 | 63.81 | 53.74 | 29.36 | 51.86 | 87.29 | 75.60 | 50.94 | 49.36 | 69.16 | 53.92 | 48.91 | 57.55 | 70.79 | 52.14 | 48.65 | 45.94 | 55.69 | 41.68 | 40.39 | 47.97 | 58.90 | 38.74 | 29.65 | 29.10 | 44.51 | 30.32 | 28.58 | 33.04 | 33.32 | 25.48 | NA | NA | |
| Cash Cash Equivalents Restricted Cash And Restricted Cash Equivalents | 80.46 | 111.85 | 122.60 | 107.65 | 103.42 | 129.80 | 117.57 | 113.19 | 167.47 | 240.45 | 249.02 | 186.92 | 195.92 | 212.44 | 181.44 | 181.44 | 131.26 | 138.26 | 172.38 | 148.97 | 68.20 | 72.08 | 121.88 | 104.28 | NA | NA | 63.81 | NA | NA | NA | 87.29 | NA | NA | NA | NA | NA | NA | NA | NA | NA | NA | NA | NA | NA | NA | NA | NA | NA | NA | NA | NA | NA | NA | NA | NA | NA | NA | NA | |
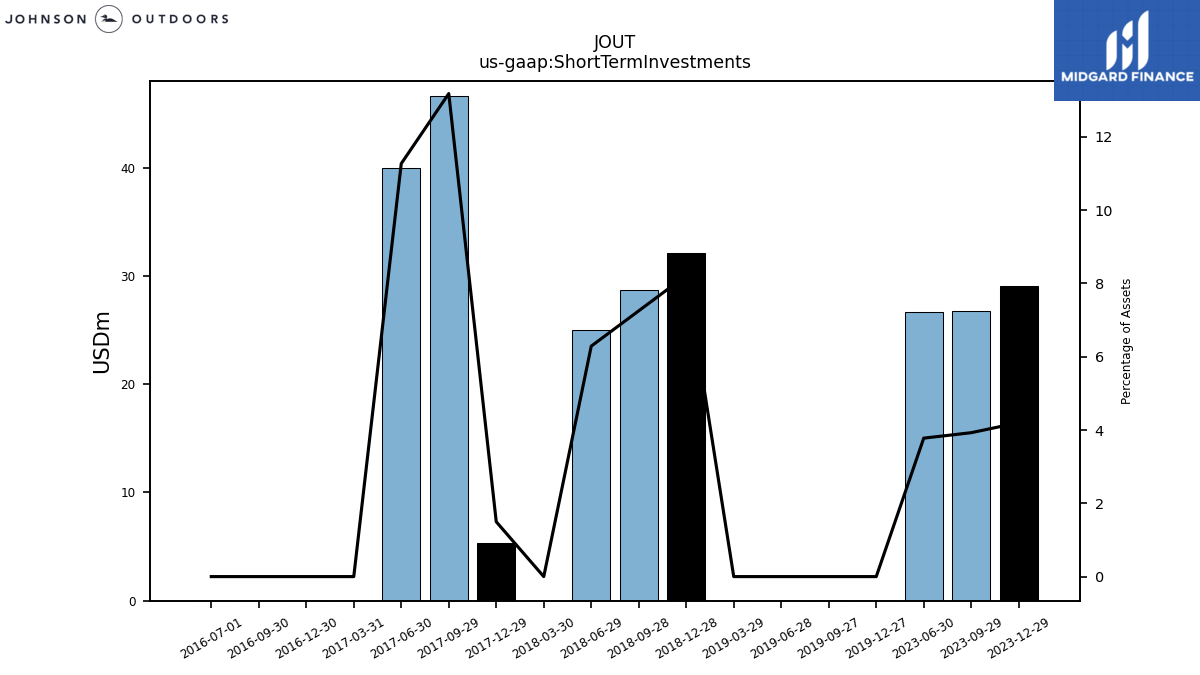
| Short Term Investments | 29.09 | 26.76 | 26.65 | NA | NA | NA | NA | NA | NA | NA | NA | NA | NA | NA | NA | NA | NA | 0.00 | 0.00 | 0.00 | 0.00 | 32.14 | 28.71 | 25.00 | 0.00 | 5.31 | 46.61 | 40.00 | 0.00 | 0.00 | 0.00 | 0.00 | NA | NA | NA | NA | NA | NA | NA | NA | NA | NA | NA | NA | NA | NA | NA | NA | NA | NA | NA | NA | NA | NA | NA | NA | NA | NA | |
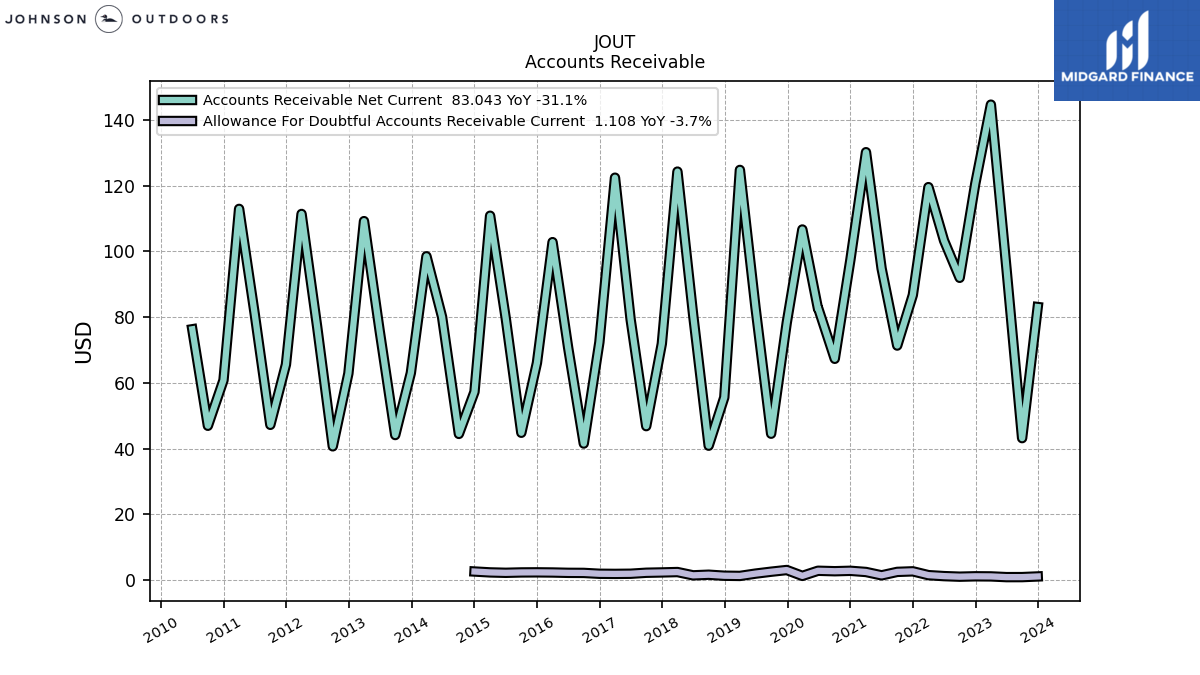
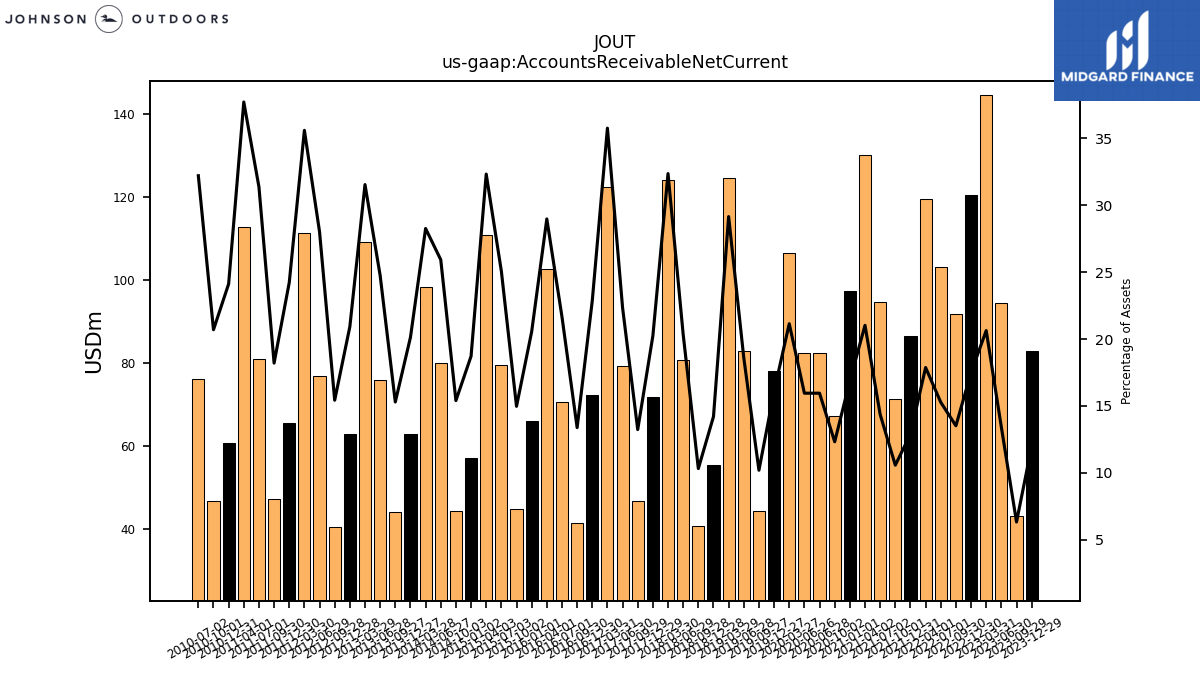
| Accounts Receivable Net Current | 83.04 | 43.16 | 94.64 | 144.60 | 120.55 | 91.92 | 103.24 | 119.52 | 86.69 | 71.32 | 94.75 | 130.14 | 97.39 | 67.29 | 82.58 | 82.58 | 106.63 | 78.25 | 44.51 | 82.86 | 124.75 | 55.56 | 40.87 | 80.88 | 124.24 | 71.89 | 46.81 | 79.29 | 122.39 | 72.35 | 41.52 | 70.66 | 102.79 | 66.06 | 44.80 | 79.66 | 110.82 | 57.25 | 44.45 | 80.04 | 98.48 | 62.98 | 44.10 | 75.89 | 109.18 | 62.85 | 40.67 | 77.01 | 111.36 | 65.56 | 47.21 | 80.92 | 112.90 | 60.79 | 46.93 | 76.28 | NA | NA | |
| Inventory Net | 267.32 | 261.47 | 235.07 | 236.67 | 251.53 | 248.65 | 250.96 | 235.22 | 217.43 | 166.62 | 130.74 | 124.54 | 114.85 | 97.44 | 94.22 | 94.22 | 107.68 | 103.89 | 94.30 | 95.83 | 116.23 | 116.28 | 88.86 | 77.30 | 94.61 | 90.86 | 79.15 | 68.24 | 74.86 | 76.04 | 68.40 | 71.13 | 89.77 | 93.90 | 79.92 | 78.32 | 79.75 | 82.43 | 66.34 | 71.50 | 85.09 | 87.65 | 76.36 | 75.21 | 85.19 | 77.52 | 67.06 | 67.02 | 79.30 | 79.02 | 68.46 | 73.69 | 84.75 | 84.19 | 72.09 | 62.28 | NA | NA | |
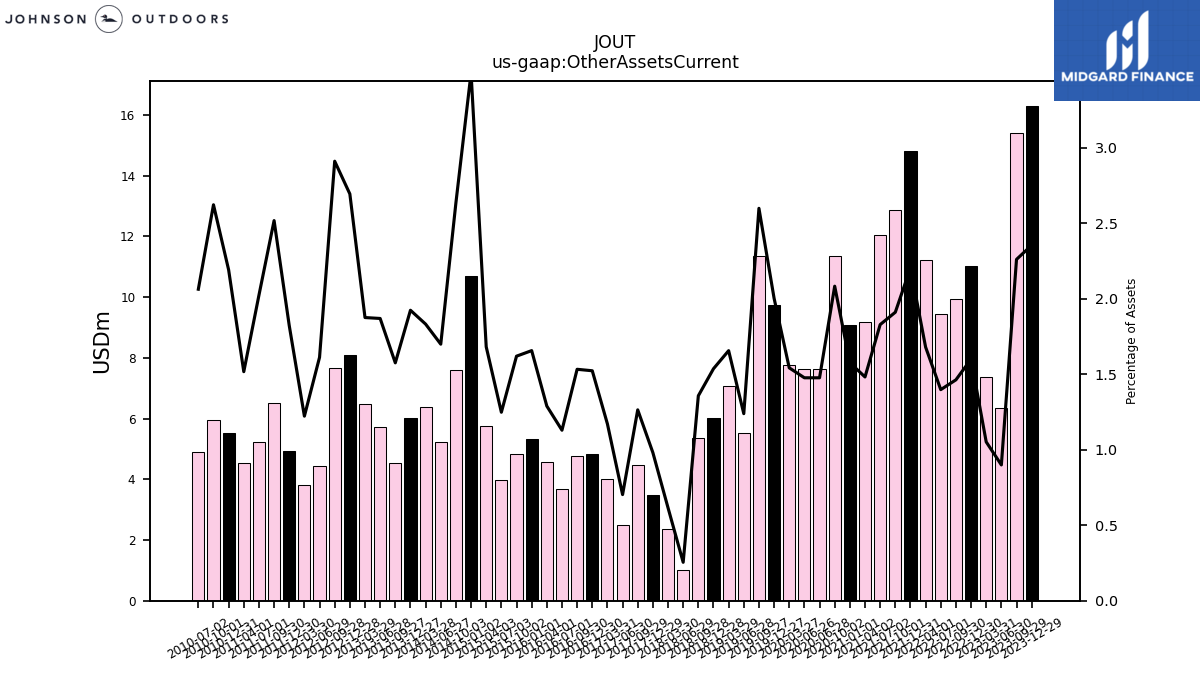
| Other Assets Current | 16.30 | 15.40 | 6.34 | 7.37 | 11.02 | 9.95 | 9.45 | 11.23 | 14.81 | 12.88 | 12.06 | 9.17 | 9.10 | 11.37 | 7.64 | 7.64 | 7.78 | 9.73 | 11.34 | 5.52 | 7.09 | 6.01 | 5.37 | 1.01 | 2.36 | 3.48 | 4.47 | 2.50 | 4.01 | 4.82 | 4.75 | 3.68 | 4.57 | 5.32 | 4.84 | 3.97 | 5.76 | 10.69 | 7.60 | 5.25 | 6.38 | 6.02 | 4.54 | 5.73 | 6.49 | 8.09 | 7.67 | 4.43 | 3.82 | 4.93 | 6.53 | 5.22 | 4.54 | 5.52 | 5.95 | 4.89 | NA | NA | |
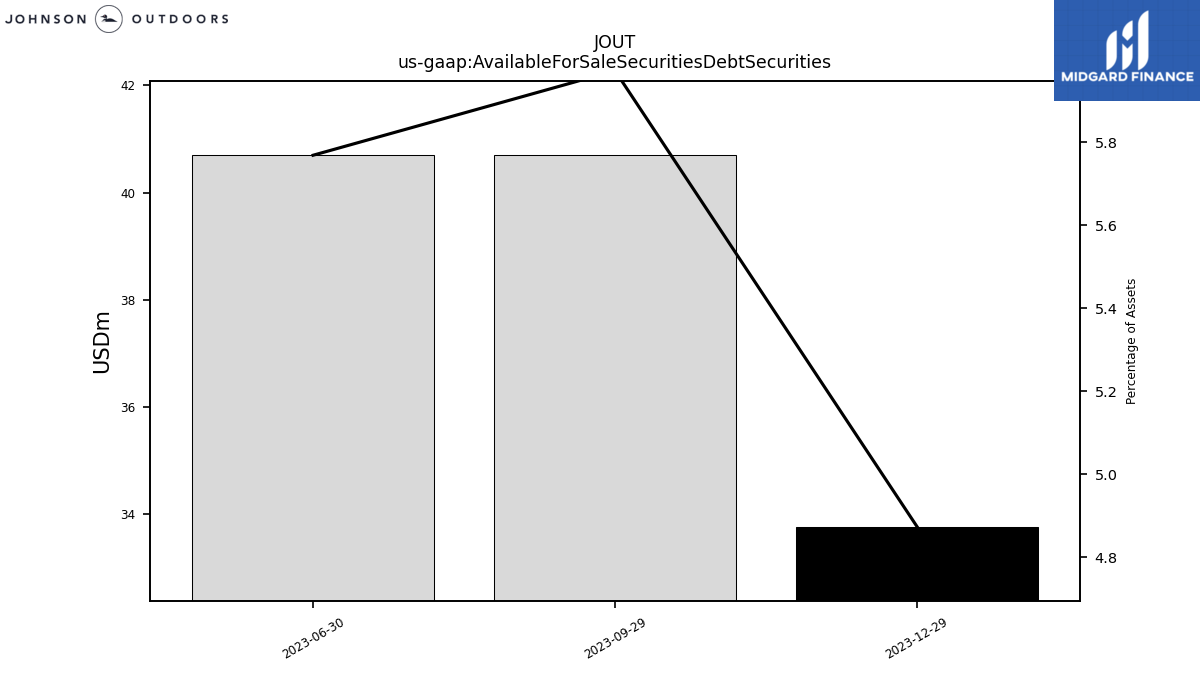
| Available For Sale Securities Debt Securities | 33.76 | 40.71 | 40.70 | NA | NA | NA | NA | NA | NA | NA | NA | NA | NA | NA | NA | NA | NA | NA | NA | NA | NA | NA | NA | NA | NA | NA | NA | NA | NA | NA | NA | NA | NA | NA | NA | NA | NA | NA | NA | NA | NA | NA | NA | NA | NA | NA | NA | NA | NA | NA | NA | NA | NA | NA | NA | NA | NA | NA |
| 2023-12-29 | 2023-09-29 | 2023-06-30 | 2023-03-31 | 2022-12-30 | 2022-09-30 | 2022-07-01 | 2022-04-01 | 2021-12-31 | 2021-10-01 | 2021-07-02 | 2021-04-02 | 2021-01-01 | 2020-10-02 | 2020-06-28 | 2020-06-26 | 2020-03-27 | 2019-12-27 | 2019-09-27 | 2019-06-28 | 2019-03-29 | 2018-12-28 | 2018-09-28 | 2018-06-29 | 2018-03-30 | 2017-12-29 | 2017-09-29 | 2017-06-30 | 2017-03-31 | 2016-12-30 | 2016-09-30 | 2016-07-01 | 2016-04-01 | 2016-01-01 | 2015-10-02 | 2015-07-03 | 2015-04-03 | 2015-01-02 | 2014-10-03 | 2014-06-27 | 2014-03-28 | 2013-12-27 | 2013-09-27 | 2013-06-28 | 2013-03-29 | 2012-12-28 | 2012-09-28 | 2012-06-29 | 2012-03-30 | 2011-12-30 | 2011-09-30 | 2011-07-01 | 2011-04-01 | 2010-12-31 | 2010-10-01 | 2010-07-02 | 2010-04-02 | 2010-01-01 | ||
|---|---|---|---|---|---|---|---|---|---|---|---|---|---|---|---|---|---|---|---|---|---|---|---|---|---|---|---|---|---|---|---|---|---|---|---|---|---|---|---|---|---|---|---|---|---|---|---|---|---|---|---|---|---|---|---|---|---|---|---|
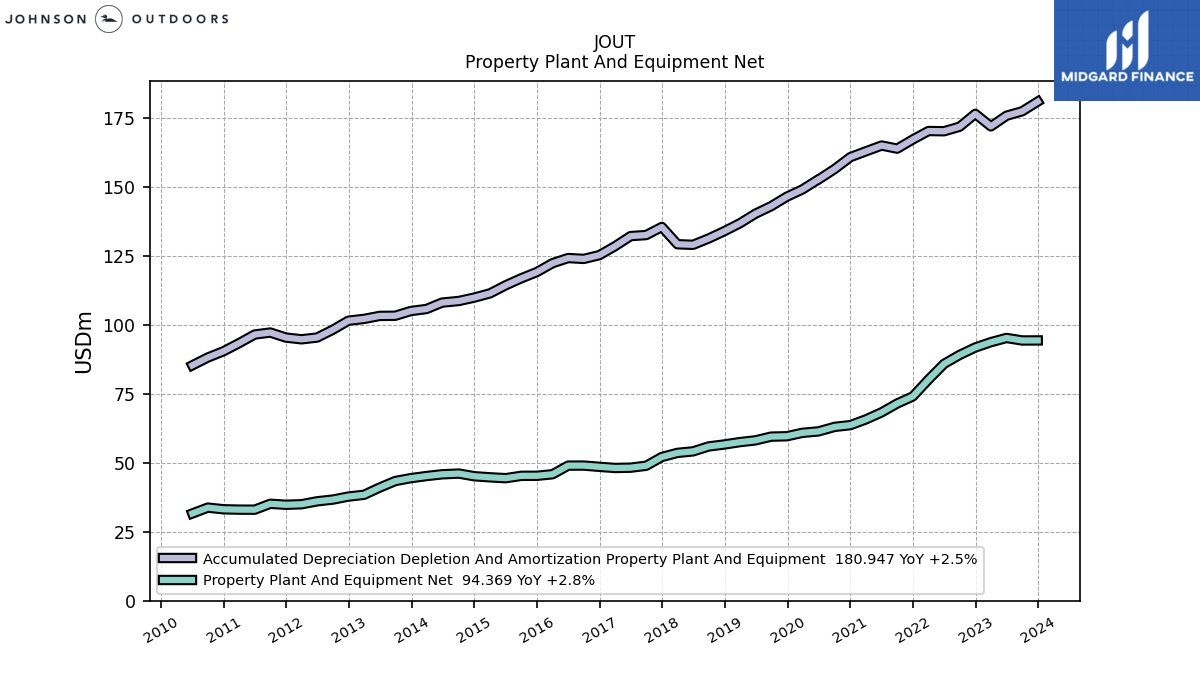
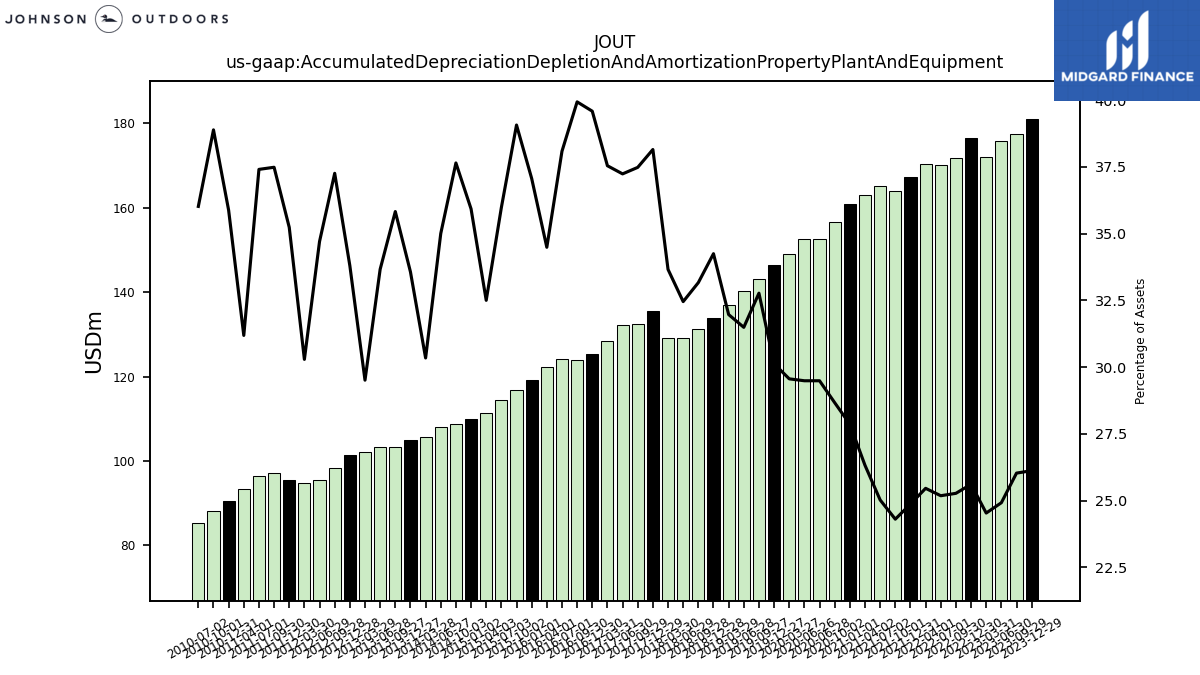
| Accumulated Depreciation Depletion And Amortization Property Plant And Equipment | 180.95 | 177.43 | 175.82 | 171.96 | 176.50 | 171.84 | 170.20 | 170.28 | 167.22 | 163.89 | 165.02 | 162.93 | 160.82 | 156.54 | 152.65 | 152.65 | 149.08 | 146.45 | 143.03 | 140.32 | 136.83 | 133.96 | 131.32 | 129.03 | 129.24 | 135.50 | 132.57 | 132.19 | 128.52 | 125.29 | 123.92 | 124.23 | 122.37 | 119.17 | 116.90 | 114.36 | 111.44 | 109.92 | 108.67 | 108.08 | 105.76 | 105.03 | 103.31 | 103.25 | 102.17 | 101.53 | 98.23 | 95.42 | 94.78 | 95.40 | 97.23 | 96.51 | 93.38 | 90.44 | 88.19 | 85.33 | NA | NA | |
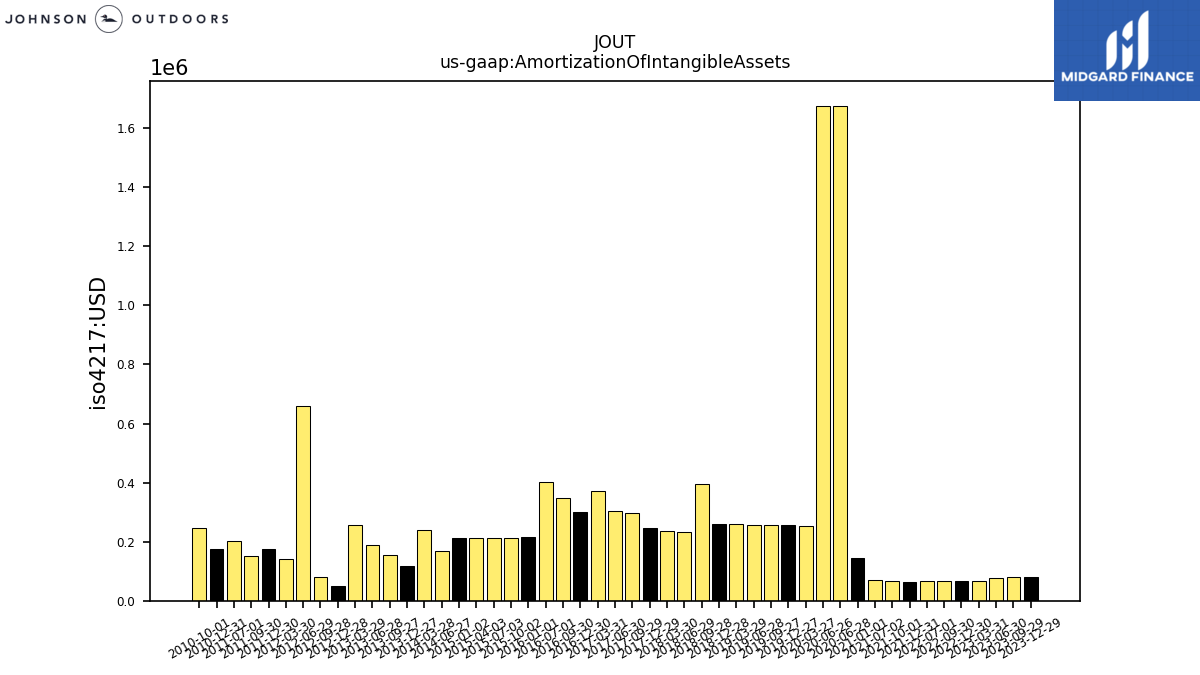
| Amortization Of Intangible Assets | 0.08 | 0.08 | 0.08 | 0.07 | 0.07 | 0.07 | 0.07 | NA | 0.06 | 0.07 | 0.07 | NA | 0.14 | NA | 1.68 | 1.68 | 0.25 | 0.26 | 0.26 | 0.26 | 0.26 | 0.26 | 0.40 | 0.23 | 0.23 | 0.25 | 0.30 | 0.30 | 0.37 | 0.30 | 0.35 | 0.40 | NA | 0.21 | 0.21 | 0.21 | 0.21 | 0.21 | NA | 0.17 | 0.24 | 0.12 | 0.15 | 0.19 | 0.26 | 0.05 | 0.08 | 0.66 | 0.14 | 0.18 | 0.15 | 0.20 | NA | 0.17 | 0.25 | NA | NA | NA | |
| Property Plant And Equipment Net | 94.37 | 94.35 | 95.26 | 93.74 | 91.80 | 89.12 | 85.88 | 80.16 | 74.06 | 71.51 | 68.30 | 65.75 | 63.66 | 63.04 | 61.37 | 61.37 | 60.87 | 59.63 | 59.50 | 58.14 | 57.50 | 56.65 | 55.93 | 54.15 | 53.60 | 52.11 | 48.94 | 48.24 | 48.13 | 48.54 | 49.00 | 48.98 | 45.86 | 45.30 | 45.29 | 44.43 | 44.74 | 45.13 | 46.10 | 45.84 | 45.20 | 44.44 | 43.39 | 41.02 | 38.40 | 37.77 | 36.67 | 36.05 | 34.98 | 34.79 | 35.16 | 33.01 | 33.03 | 33.16 | 33.77 | 31.63 | NA | NA | |
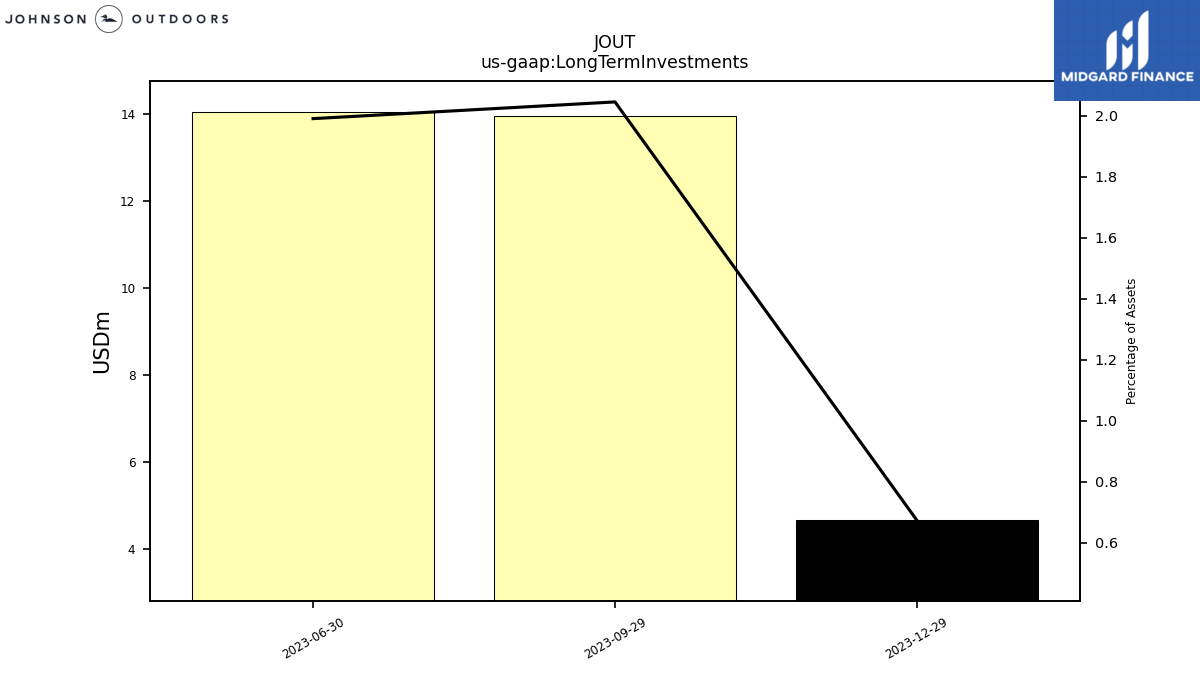
| Long Term Investments | 4.67 | 13.94 | 14.04 | NA | NA | NA | NA | NA | NA | NA | NA | NA | NA | NA | NA | NA | NA | NA | NA | NA | NA | NA | NA | NA | NA | NA | NA | NA | NA | NA | NA | NA | NA | NA | NA | NA | NA | NA | NA | NA | NA | NA | NA | NA | NA | NA | NA | NA | NA | NA | NA | NA | NA | NA | NA | NA | NA | NA | |
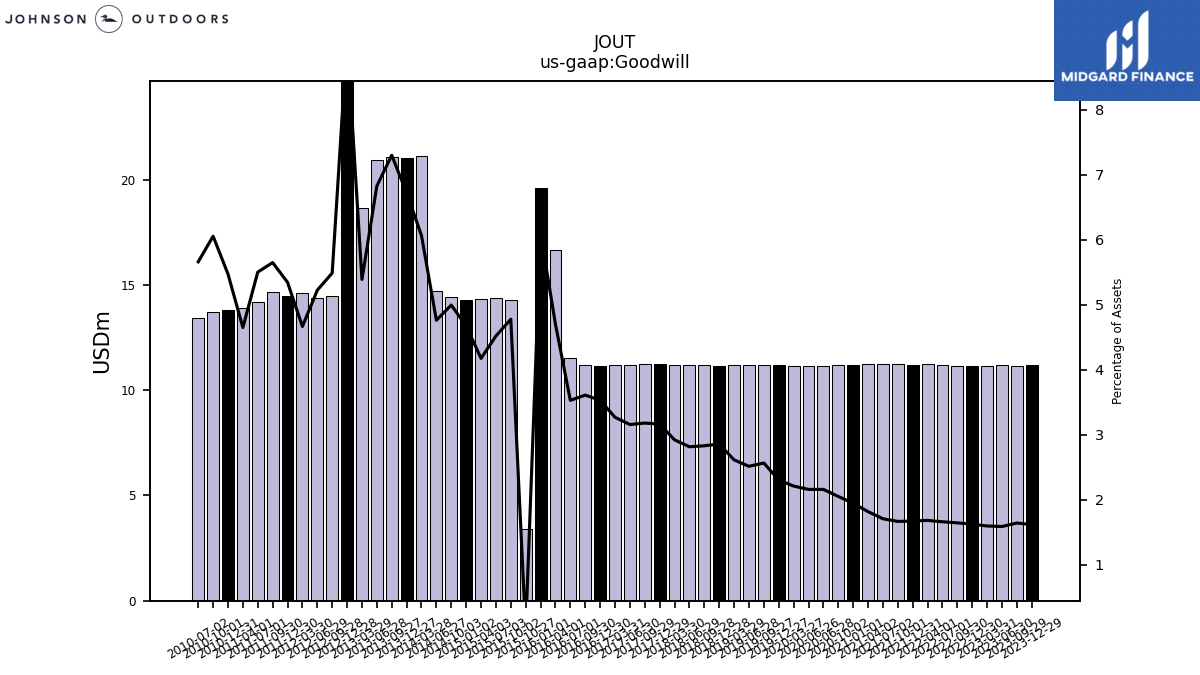
| Goodwill | 11.19 | 11.17 | 11.19 | 11.17 | 11.17 | 11.16 | 11.21 | 11.23 | 11.22 | 11.22 | 11.24 | 11.23 | 11.22 | 11.18 | 11.16 | 11.16 | 11.13 | 11.19 | 11.19 | 11.20 | 11.18 | 11.16 | 11.20 | 11.18 | 11.21 | 11.23 | 11.24 | 11.20 | 11.18 | 11.17 | 11.20 | 11.51 | 16.67 | 19.62 | 14.29 | 14.36 | 14.31 | 14.29 | 14.42 | 14.70 | 21.14 | 21.04 | 21.05 | 20.94 | 18.66 | 27.32 | 14.47 | 14.36 | 14.60 | 14.47 | 14.65 | 14.20 | 13.92 | 13.79 | 13.73 | 13.41 | NA | NA | |
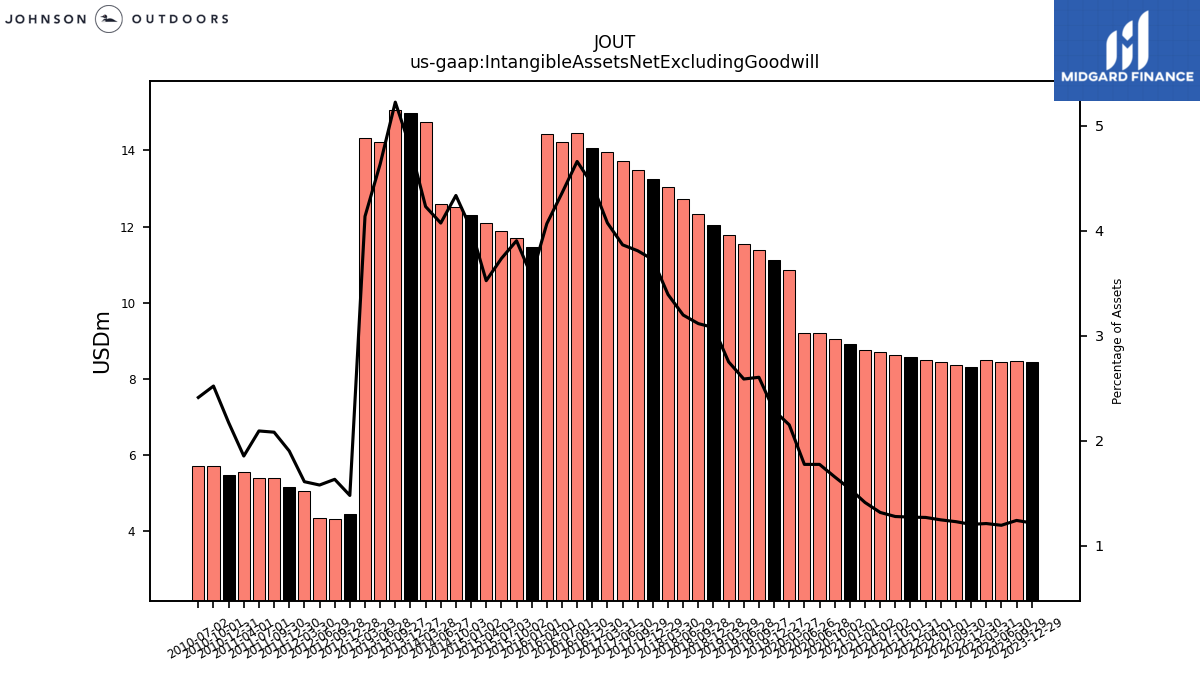
| Intangible Assets Net Excluding Goodwill | 8.45 | 8.47 | 8.44 | 8.51 | 8.31 | 8.37 | 8.44 | 8.50 | 8.57 | 8.63 | 8.70 | 8.75 | 8.91 | 9.05 | 9.20 | 9.20 | 10.86 | 11.13 | 11.37 | 11.54 | 11.78 | 12.05 | 12.34 | 12.72 | 13.03 | 13.23 | 13.48 | 13.73 | 13.95 | 14.06 | 14.46 | 14.22 | 14.44 | 11.47 | 11.69 | 11.88 | 12.09 | 12.30 | 12.52 | 12.58 | 14.75 | 14.99 | 15.07 | 14.22 | 14.32 | 4.45 | 4.31 | 4.34 | 5.04 | 5.16 | 5.40 | 5.41 | 5.56 | 5.48 | 5.72 | 5.72 | NA | NA | |
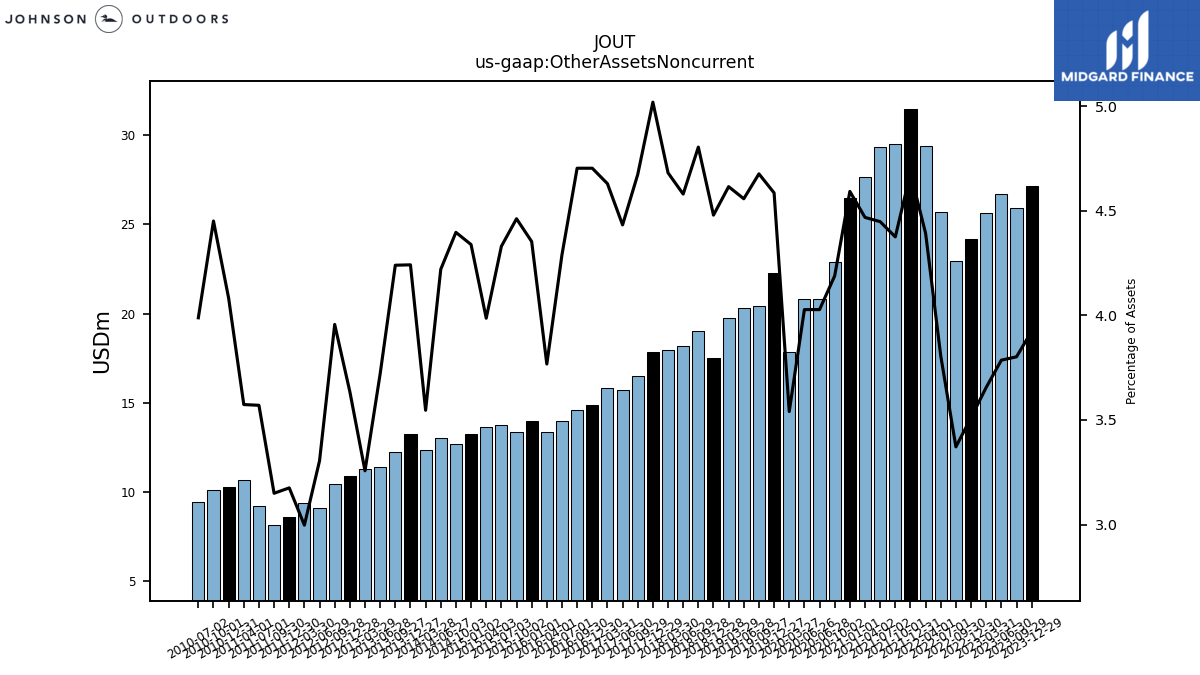
| Other Assets Noncurrent | 27.18 | 25.91 | 26.71 | 25.62 | 24.19 | 22.92 | 25.72 | 29.37 | 31.46 | 29.50 | 29.33 | 27.66 | 26.50 | 22.87 | 20.84 | 20.84 | 17.85 | 22.29 | 20.41 | 20.30 | 19.75 | 17.52 | 19.02 | 18.20 | 17.97 | 17.82 | 16.53 | 15.73 | 15.85 | 14.88 | 14.59 | 13.99 | 13.37 | 13.99 | 13.35 | 13.76 | 13.67 | 13.27 | 12.69 | 13.03 | 12.36 | 13.27 | 12.22 | 11.41 | 11.27 | 10.92 | 10.43 | 9.09 | 9.38 | 8.60 | 8.17 | 9.21 | 10.70 | 10.29 | 10.09 | 9.45 | NA | NA | |
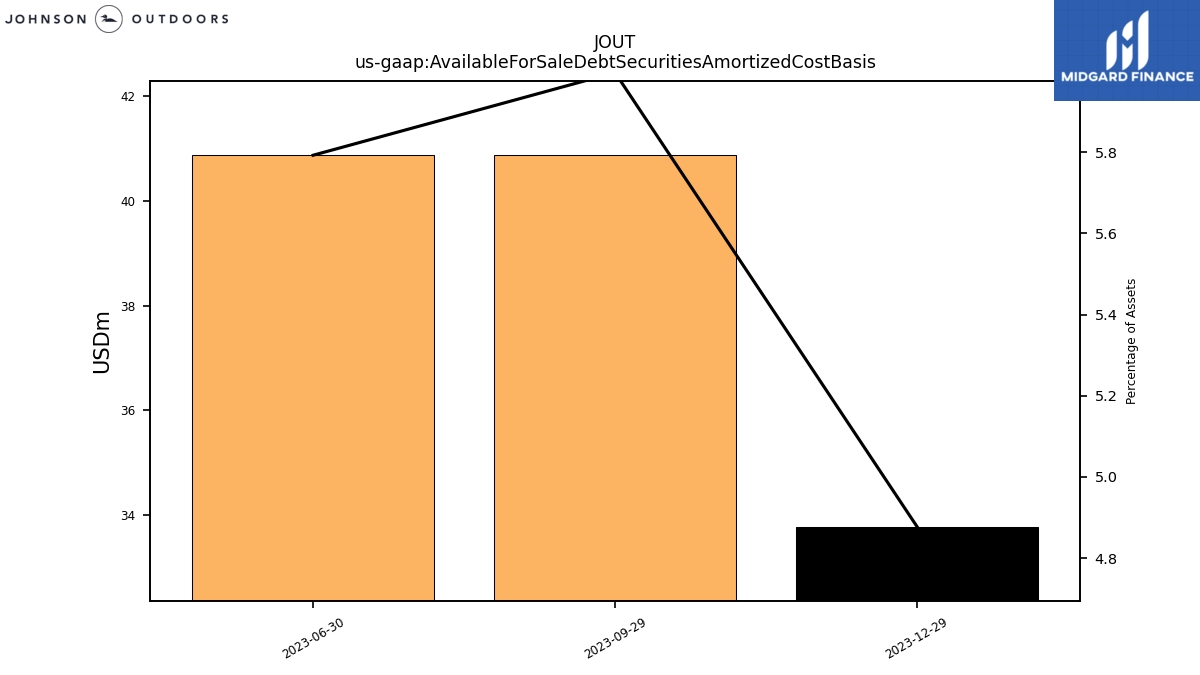
| Available For Sale Debt Securities Amortized Cost Basis | 33.79 | 40.87 | 40.87 | NA | NA | NA | NA | NA | NA | NA | NA | NA | NA | NA | NA | NA | NA | NA | NA | NA | NA | NA | NA | NA | NA | NA | NA | NA | NA | NA | NA | NA | NA | NA | NA | NA | NA | NA | NA | NA | NA | NA | NA | NA | NA | NA | NA | NA | NA | NA | NA | NA | NA | NA | NA | NA | NA | NA |
| 2023-12-29 | 2023-09-29 | 2023-06-30 | 2023-03-31 | 2022-12-30 | 2022-09-30 | 2022-07-01 | 2022-04-01 | 2021-12-31 | 2021-10-01 | 2021-07-02 | 2021-04-02 | 2021-01-01 | 2020-10-02 | 2020-06-28 | 2020-06-26 | 2020-03-27 | 2019-12-27 | 2019-09-27 | 2019-06-28 | 2019-03-29 | 2018-12-28 | 2018-09-28 | 2018-06-29 | 2018-03-30 | 2017-12-29 | 2017-09-29 | 2017-06-30 | 2017-03-31 | 2016-12-30 | 2016-09-30 | 2016-07-01 | 2016-04-01 | 2016-01-01 | 2015-10-02 | 2015-07-03 | 2015-04-03 | 2015-01-02 | 2014-10-03 | 2014-06-27 | 2014-03-28 | 2013-12-27 | 2013-09-27 | 2013-06-28 | 2013-03-29 | 2012-12-28 | 2012-09-28 | 2012-06-29 | 2012-03-30 | 2011-12-30 | 2011-09-30 | 2011-07-01 | 2011-04-01 | 2010-12-31 | 2010-10-01 | 2010-07-02 | 2010-04-02 | 2010-01-01 | ||
|---|---|---|---|---|---|---|---|---|---|---|---|---|---|---|---|---|---|---|---|---|---|---|---|---|---|---|---|---|---|---|---|---|---|---|---|---|---|---|---|---|---|---|---|---|---|---|---|---|---|---|---|---|---|---|---|---|---|---|---|
| Liabilities Current | 104.07 | 104.01 | 106.67 | 115.61 | 117.44 | 114.71 | 117.03 | 119.11 | 128.00 | 137.57 | 132.72 | 123.50 | 113.29 | 105.61 | 98.80 | 98.80 | 102.62 | 95.26 | 87.87 | 97.00 | 102.58 | 89.09 | 92.78 | 92.25 | 99.90 | 85.59 | 84.08 | 86.89 | 86.78 | 68.31 | 67.65 | 81.17 | 86.13 | 70.07 | 69.55 | 84.63 | 76.34 | 61.22 | 60.23 | 72.36 | 76.73 | 60.38 | 63.37 | 76.73 | 132.53 | 94.87 | 58.97 | 73.30 | 115.25 | 81.68 | 65.00 | 74.79 | 127.33 | 92.00 | 67.02 | 78.07 | NA | NA | |
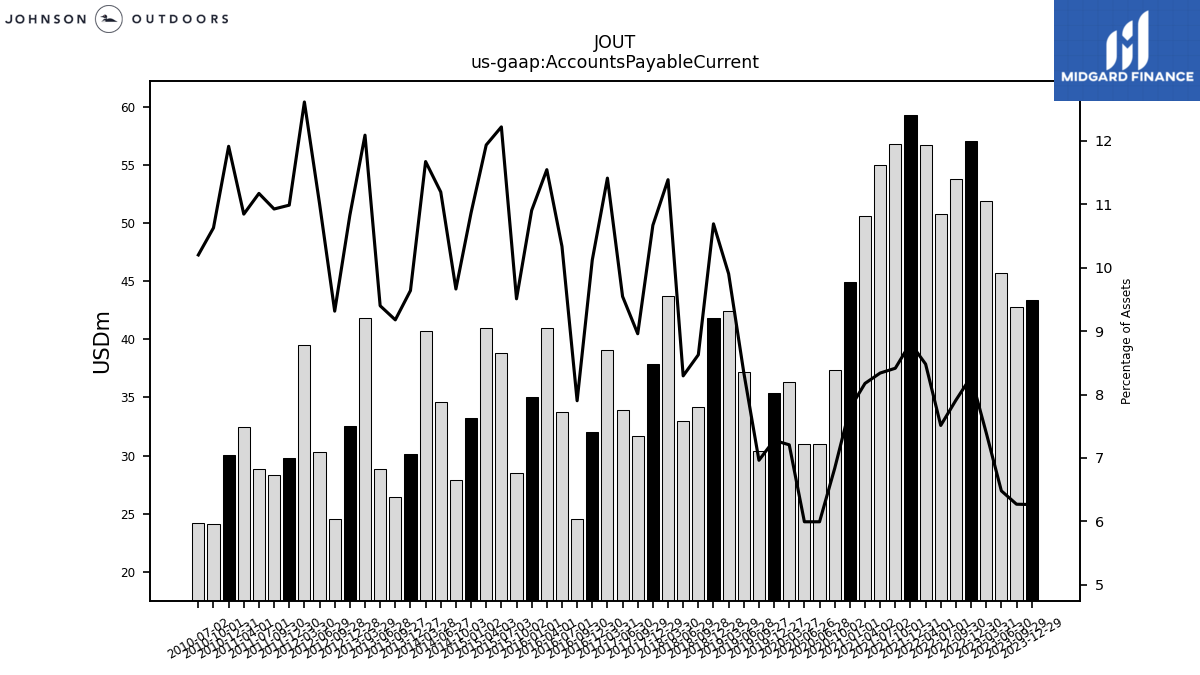
| Accounts Payable Current | 43.40 | 42.74 | 45.73 | 51.85 | 57.06 | 53.80 | 50.78 | 56.72 | 59.24 | 56.74 | 54.99 | 50.61 | 44.91 | 37.33 | 31.03 | 31.03 | 36.35 | 35.38 | 30.39 | 37.19 | 42.39 | 41.82 | 34.16 | 32.98 | 43.72 | 37.89 | 31.69 | 33.89 | 39.07 | 32.03 | 24.52 | 33.72 | 40.97 | 35.05 | 28.45 | 38.84 | 40.92 | 33.24 | 27.90 | 34.56 | 40.69 | 30.16 | 26.47 | 28.83 | 41.86 | 32.52 | 24.56 | 30.27 | 39.47 | 29.75 | 28.34 | 28.82 | 32.47 | 30.04 | 24.10 | 24.17 | NA | NA | |
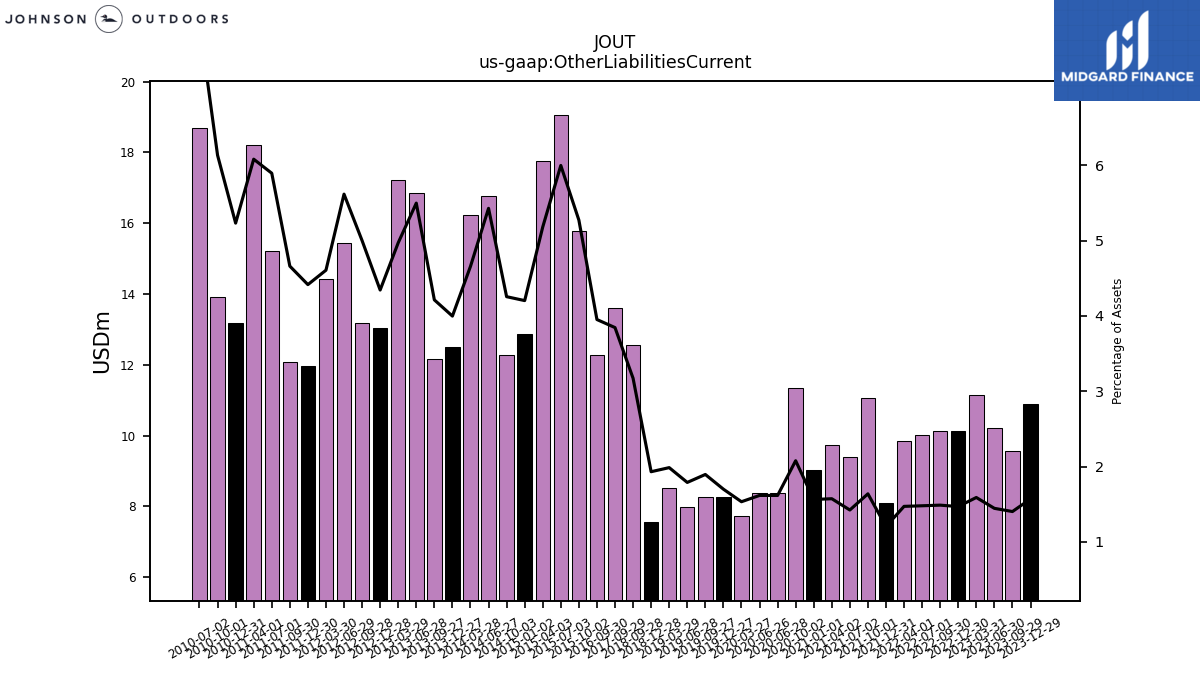
| Other Liabilities Current | 10.88 | 9.57 | 10.21 | 11.15 | 10.13 | 10.12 | 10.01 | 9.85 | 8.10 | 11.05 | 9.39 | 9.74 | 9.03 | 11.35 | 8.37 | 8.37 | 7.74 | 8.27 | 8.28 | 7.98 | 8.50 | 7.56 | 12.57 | NA | NA | NA | 13.60 | NA | NA | NA | 12.27 | NA | NA | NA | 15.78 | 19.07 | 17.76 | 12.86 | 12.29 | 16.76 | 16.24 | 12.51 | 12.15 | 16.86 | 17.21 | 13.05 | 13.18 | 15.44 | 14.42 | 11.96 | 12.09 | 15.21 | 18.21 | 13.19 | 13.91 | 18.70 | NA | NA | |
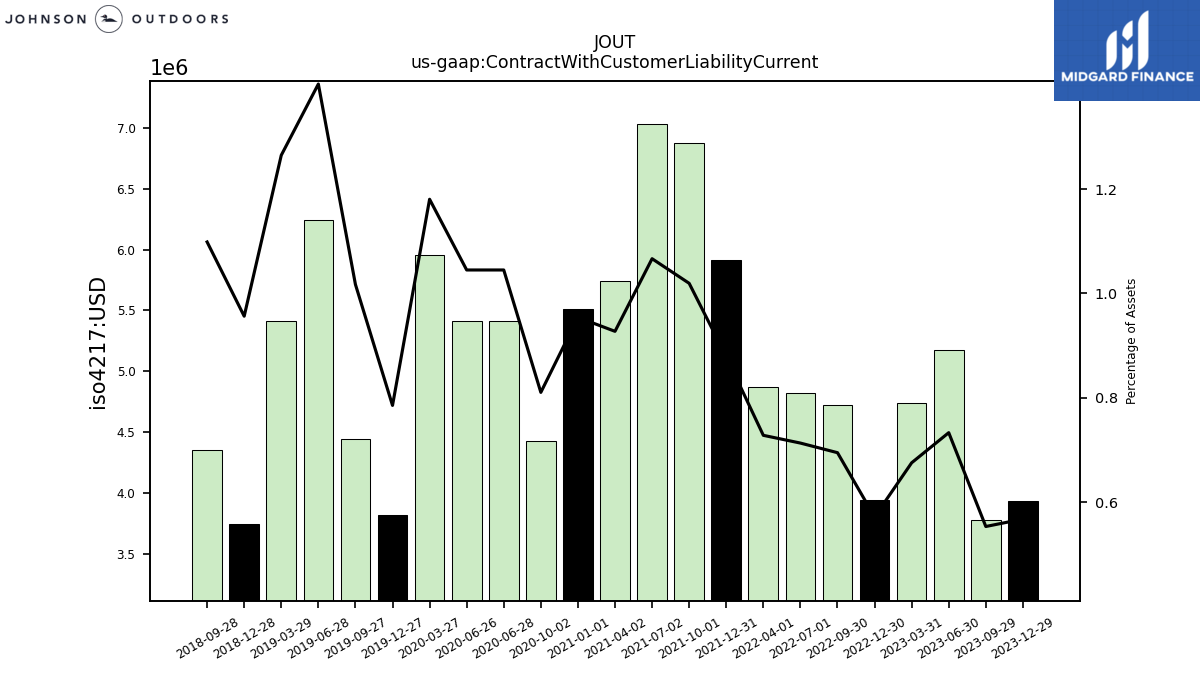
| Contract With Customer Liability Current | 3.93 | 3.77 | 5.17 | 4.74 | 3.94 | 4.73 | 4.82 | 4.87 | 5.91 | 6.87 | 7.03 | 5.74 | 5.51 | 4.43 | 5.41 | 5.41 | 5.95 | 3.82 | 4.44 | 6.24 | 5.41 | 3.74 | 4.35 | NA | NA | NA | NA | NA | NA | NA | NA | NA | NA | NA | NA | NA | NA | NA | NA | NA | NA | NA | NA | NA | NA | NA | NA | NA | NA | NA | NA | NA | NA | NA | NA | NA | NA | NA |
| 2023-12-29 | 2023-09-29 | 2023-06-30 | 2023-03-31 | 2022-12-30 | 2022-09-30 | 2022-07-01 | 2022-04-01 | 2021-12-31 | 2021-10-01 | 2021-07-02 | 2021-04-02 | 2021-01-01 | 2020-10-02 | 2020-06-28 | 2020-06-26 | 2020-03-27 | 2019-12-27 | 2019-09-27 | 2019-06-28 | 2019-03-29 | 2018-12-28 | 2018-09-28 | 2018-06-29 | 2018-03-30 | 2017-12-29 | 2017-09-29 | 2017-06-30 | 2017-03-31 | 2016-12-30 | 2016-09-30 | 2016-07-01 | 2016-04-01 | 2016-01-01 | 2015-10-02 | 2015-07-03 | 2015-04-03 | 2015-01-02 | 2014-10-03 | 2014-06-27 | 2014-03-28 | 2013-12-27 | 2013-09-27 | 2013-06-28 | 2013-03-29 | 2012-12-28 | 2012-09-28 | 2012-06-29 | 2012-03-30 | 2011-12-30 | 2011-09-30 | 2011-07-01 | 2011-04-01 | 2010-12-31 | 2010-10-01 | 2010-07-02 | 2010-04-02 | 2010-01-01 | ||
|---|---|---|---|---|---|---|---|---|---|---|---|---|---|---|---|---|---|---|---|---|---|---|---|---|---|---|---|---|---|---|---|---|---|---|---|---|---|---|---|---|---|---|---|---|---|---|---|---|---|---|---|---|---|---|---|---|---|---|---|
| Deferred Income Tax Liabilities Net | 2.01 | 1.84 | 1.93 | 1.87 | 1.85 | 1.75 | 1.60 | 1.65 | 1.63 | 1.60 | 1.41 | 1.38 | 1.48 | 1.42 | 1.64 | 1.64 | 1.60 | 1.66 | 1.64 | 1.70 | 1.67 | 1.67 | NA | NA | NA | NA | NA | NA | NA | NA | NA | NA | NA | NA | NA | NA | NA | NA | NA | NA | NA | NA | NA | NA | NA | NA | NA | NA | NA | NA | NA | NA | NA | NA | NA | NA | NA | NA | |
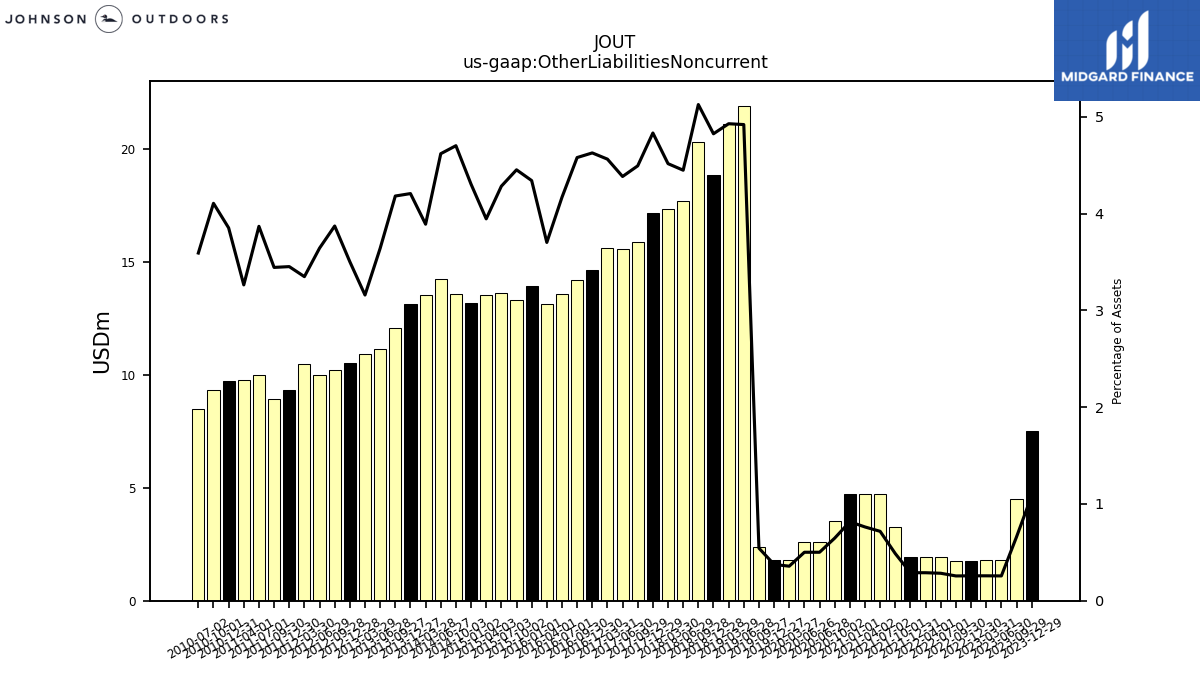
| Other Liabilities Noncurrent | 7.51 | 4.50 | 1.81 | 1.81 | 1.77 | 1.74 | 1.92 | 1.94 | 1.95 | 3.28 | 4.73 | 4.72 | 4.71 | 3.53 | 2.59 | 2.59 | 1.80 | 1.82 | 2.37 | 21.92 | 21.09 | 18.87 | 20.30 | 17.68 | 17.34 | 17.16 | 15.89 | 15.56 | 15.62 | 14.64 | 14.21 | 13.59 | 13.13 | 13.95 | 13.32 | 13.61 | 13.53 | 13.16 | 13.57 | 14.26 | 13.56 | 13.16 | 12.06 | 11.16 | 10.93 | 10.52 | 10.21 | 10.01 | 10.48 | 9.35 | 8.93 | 9.98 | 9.77 | 9.71 | 9.31 | 8.51 | NA | NA | |
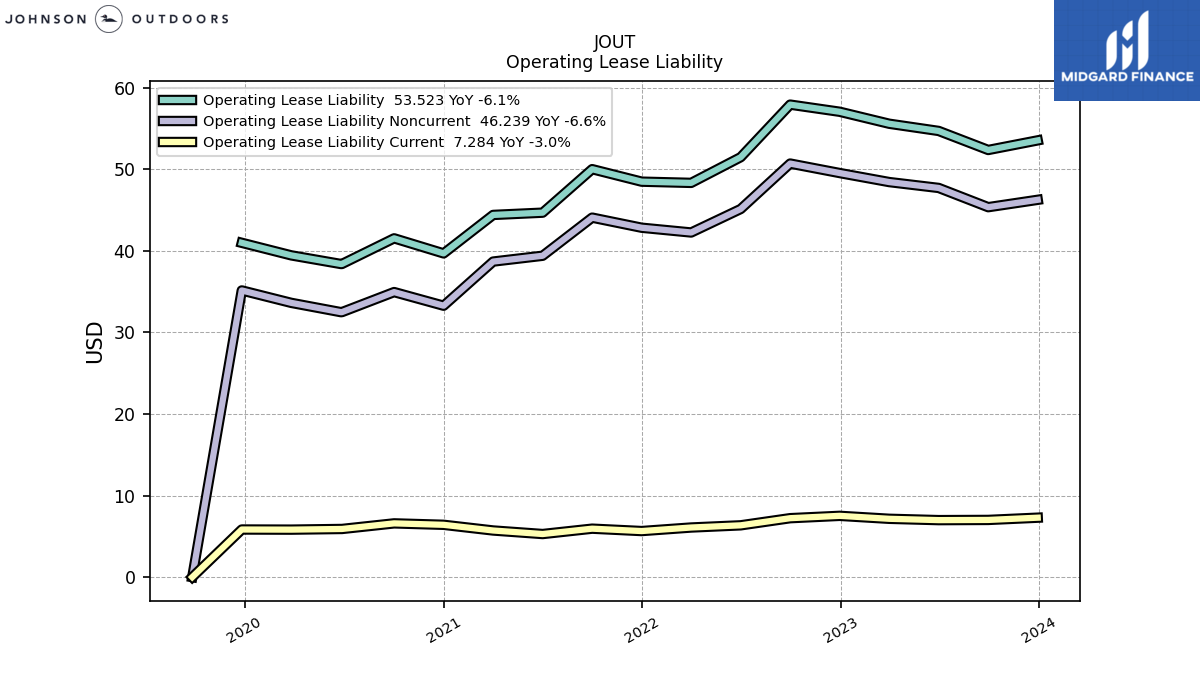
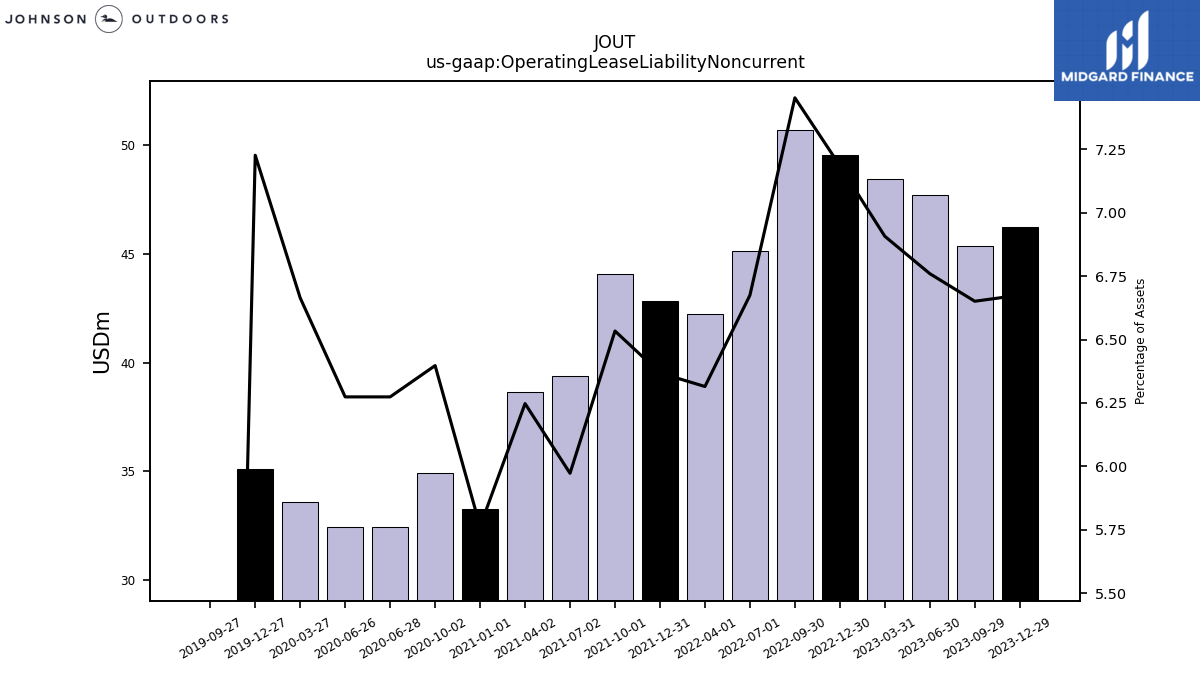
| Operating Lease Liability Noncurrent | 46.24 | 45.34 | 47.69 | 48.41 | 49.52 | 50.68 | 45.11 | 42.23 | 42.82 | 44.06 | 39.38 | 38.67 | 33.26 | 34.93 | 32.47 | 32.47 | 33.61 | 35.13 | 0.00 | NA | NA | NA | NA | NA | NA | NA | NA | NA | NA | NA | NA | NA | NA | NA | NA | NA | NA | NA | NA | NA | NA | NA | NA | NA | NA | NA | NA | NA | NA | NA | NA | NA | NA | NA | NA | NA | NA | NA |
| 2023-12-29 | 2023-09-29 | 2023-06-30 | 2023-03-31 | 2022-12-30 | 2022-09-30 | 2022-07-01 | 2022-04-01 | 2021-12-31 | 2021-10-01 | 2021-07-02 | 2021-04-02 | 2021-01-01 | 2020-10-02 | 2020-06-28 | 2020-06-26 | 2020-03-27 | 2019-12-27 | 2019-09-27 | 2019-06-28 | 2019-03-29 | 2018-12-28 | 2018-09-28 | 2018-06-29 | 2018-03-30 | 2017-12-29 | 2017-09-29 | 2017-06-30 | 2017-03-31 | 2016-12-30 | 2016-09-30 | 2016-07-01 | 2016-04-01 | 2016-01-01 | 2015-10-02 | 2015-07-03 | 2015-04-03 | 2015-01-02 | 2014-10-03 | 2014-06-27 | 2014-03-28 | 2013-12-27 | 2013-09-27 | 2013-06-28 | 2013-03-29 | 2012-12-28 | 2012-09-28 | 2012-06-29 | 2012-03-30 | 2011-12-30 | 2011-09-30 | 2011-07-01 | 2011-04-01 | 2010-12-31 | 2010-10-01 | 2010-07-02 | 2010-04-02 | 2010-01-01 | ||
|---|---|---|---|---|---|---|---|---|---|---|---|---|---|---|---|---|---|---|---|---|---|---|---|---|---|---|---|---|---|---|---|---|---|---|---|---|---|---|---|---|---|---|---|---|---|---|---|---|---|---|---|---|---|---|---|---|---|---|---|
| Stockholders Equity | 503.87 | 499.74 | 520.44 | 507.41 | 494.22 | 488.01 | 484.27 | 474.59 | 466.61 | 458.50 | 452.32 | 423.74 | 398.61 | 378.10 | 361.53 | 361.53 | 347.10 | 330.24 | 324.53 | 322.97 | 300.70 | 279.57 | 279.20 | 282.06 | 261.25 | 241.95 | 243.00 | 239.92 | 221.32 | 206.84 | 207.50 | 213.10 | 207.19 | 195.08 | 197.97 | 198.72 | 188.04 | 189.50 | 198.46 | 207.77 | 201.37 | 194.02 | 197.67 | 194.64 | 180.37 | 174.42 | 173.60 | 173.67 | 168.43 | 158.30 | 163.53 | 152.18 | 139.00 | 126.51 | 126.37 | 124.26 | NA | NA | |
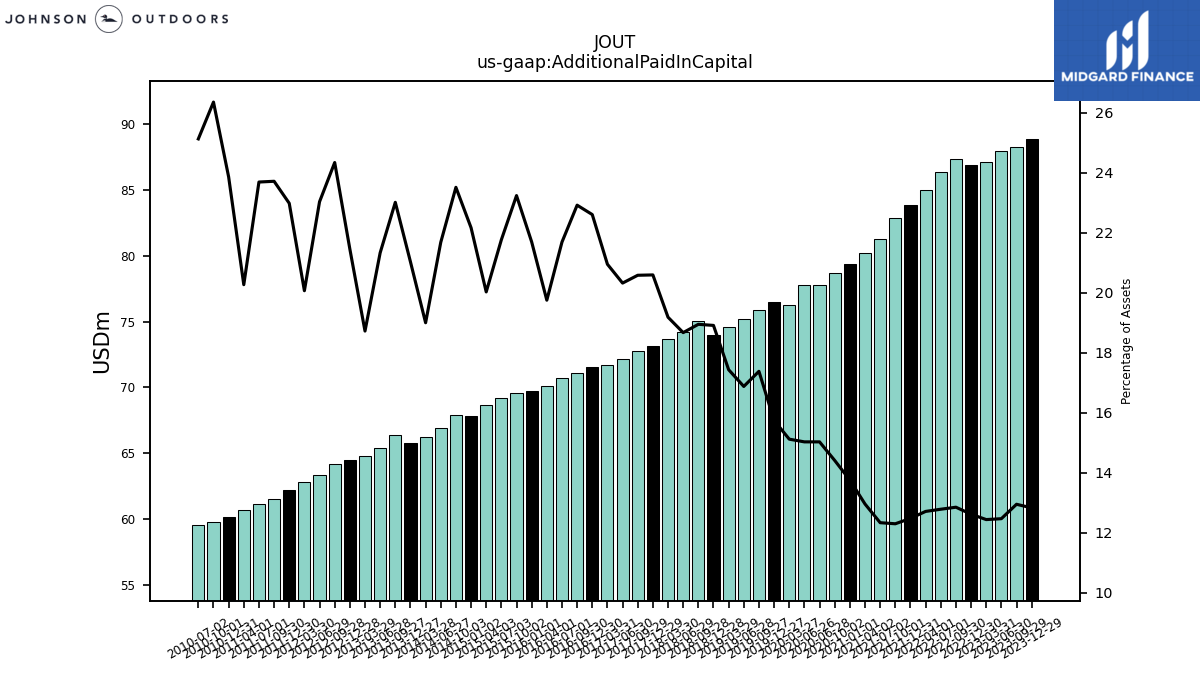
| Additional Paid In Capital | 88.83 | 88.23 | 87.93 | 87.15 | 86.92 | 87.35 | 86.37 | 84.98 | 83.87 | 82.90 | 81.31 | 80.18 | 79.38 | 78.67 | 77.78 | 77.78 | 76.24 | 76.52 | 75.86 | 75.19 | 74.62 | 73.97 | 75.03 | 74.23 | 73.66 | 73.14 | 72.80 | 72.14 | 71.72 | 71.55 | 71.13 | 70.75 | 70.08 | 69.75 | 69.55 | 69.19 | 68.67 | 67.83 | 67.88 | 66.94 | 66.22 | 65.81 | 66.37 | 65.43 | 64.82 | 64.46 | 64.18 | 63.33 | 62.79 | 62.23 | 61.52 | 61.13 | 60.69 | 60.16 | 59.78 | 59.54 | NA | NA | |
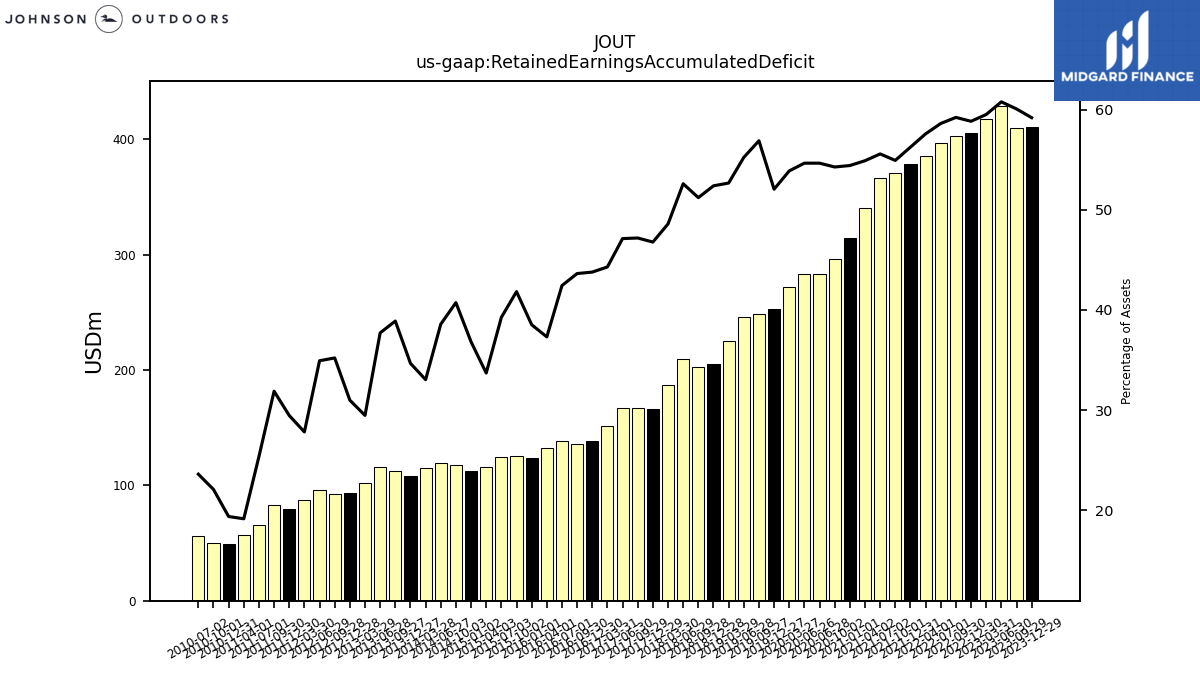
| Retained Earnings Accumulated Deficit | 410.18 | 409.57 | 428.93 | 417.27 | 405.57 | 402.82 | 396.29 | 385.23 | 378.35 | 370.50 | 366.58 | 339.91 | 314.18 | 296.43 | 282.98 | 282.98 | 271.81 | 253.11 | 248.38 | 246.16 | 225.49 | 204.97 | 202.83 | 209.17 | 186.58 | 166.15 | 166.91 | 167.30 | 151.64 | 138.57 | 135.41 | 138.42 | 132.37 | 123.85 | 125.17 | 124.80 | 115.54 | 112.64 | 117.57 | 119.10 | 115.14 | 108.48 | 112.14 | 115.66 | 102.00 | 93.06 | 92.82 | 96.02 | 87.02 | 79.74 | 82.68 | 65.41 | 57.29 | 48.80 | 50.04 | 55.89 | NA | NA | |
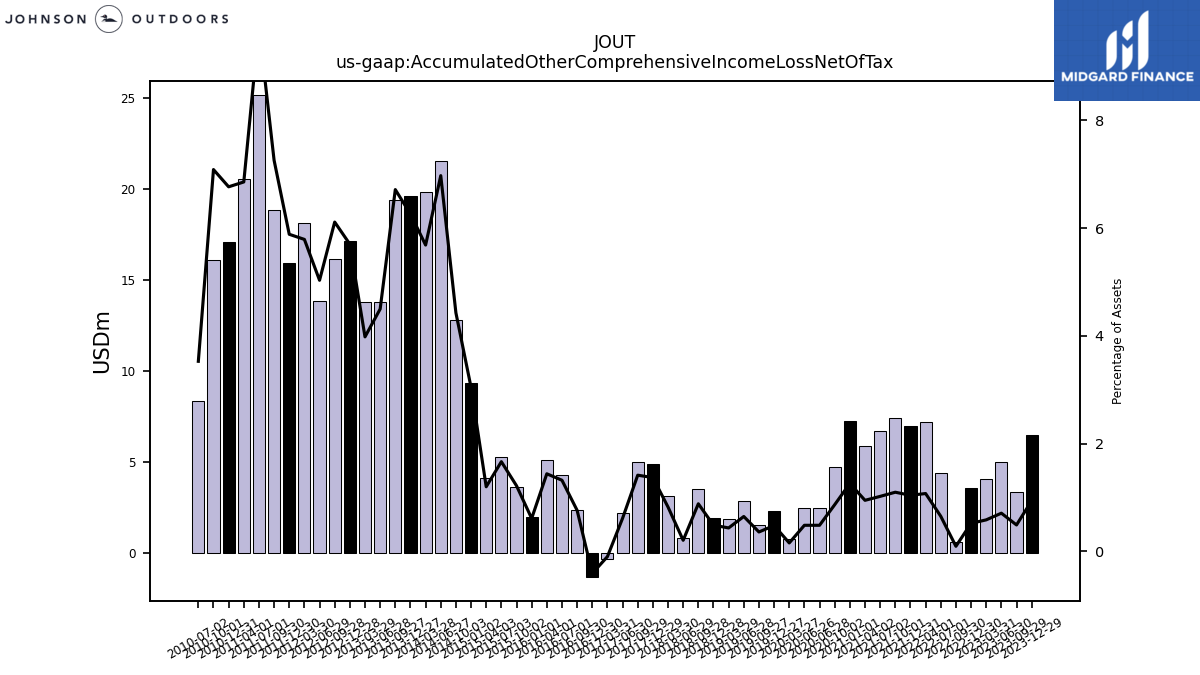
| Accumulated Other Comprehensive Income Loss Net Of Tax | 6.49 | 3.32 | 4.98 | 4.08 | 3.56 | 0.62 | 4.39 | 7.16 | 6.98 | 7.39 | 6.71 | 5.85 | 7.26 | 4.72 | 2.49 | 2.49 | 0.77 | 2.32 | 1.56 | 2.87 | 1.85 | 1.89 | 3.49 | 0.81 | 3.15 | 4.86 | 4.99 | 2.17 | -0.34 | -1.30 | 2.35 | 4.30 | 5.10 | 1.96 | 3.64 | 5.29 | 4.10 | 9.31 | 12.78 | 21.54 | 19.82 | 19.59 | 19.37 | 13.79 | 13.78 | 17.13 | 16.12 | 13.83 | 18.12 | 15.94 | 18.83 | 25.15 | 20.53 | 17.06 | 16.07 | 8.36 | NA | NA |
| 2023-12-29 | 2023-09-29 | 2023-06-30 | 2023-03-31 | 2022-12-30 | 2022-09-30 | 2022-07-01 | 2022-04-01 | 2021-12-31 | 2021-10-01 | 2021-07-02 | 2021-04-02 | 2021-01-01 | 2020-10-02 | 2020-06-28 | 2020-06-26 | 2020-03-27 | 2019-12-27 | 2019-09-27 | 2019-06-28 | 2019-03-29 | 2018-12-28 | 2018-09-28 | 2018-06-29 | 2018-03-30 | 2017-12-29 | 2017-09-29 | 2017-06-30 | 2017-03-31 | 2016-12-30 | 2016-09-30 | 2016-07-01 | 2016-04-01 | 2016-01-01 | 2015-10-02 | 2015-07-03 | 2015-04-03 | 2015-01-02 | 2014-10-03 | 2014-06-27 | 2014-03-28 | 2013-12-27 | 2013-09-27 | 2013-06-28 | 2013-03-29 | 2012-12-28 | 2012-09-28 | 2012-06-29 | 2012-03-30 | 2011-12-30 | 2011-09-30 | 2011-07-01 | 2011-04-01 | 2010-12-31 | 2010-10-01 | 2010-07-02 | 2010-04-02 | 2010-01-01 | ||
|---|---|---|---|---|---|---|---|---|---|---|---|---|---|---|---|---|---|---|---|---|---|---|---|---|---|---|---|---|---|---|---|---|---|---|---|---|---|---|---|---|---|---|---|---|---|---|---|---|---|---|---|---|---|---|---|---|---|---|---|
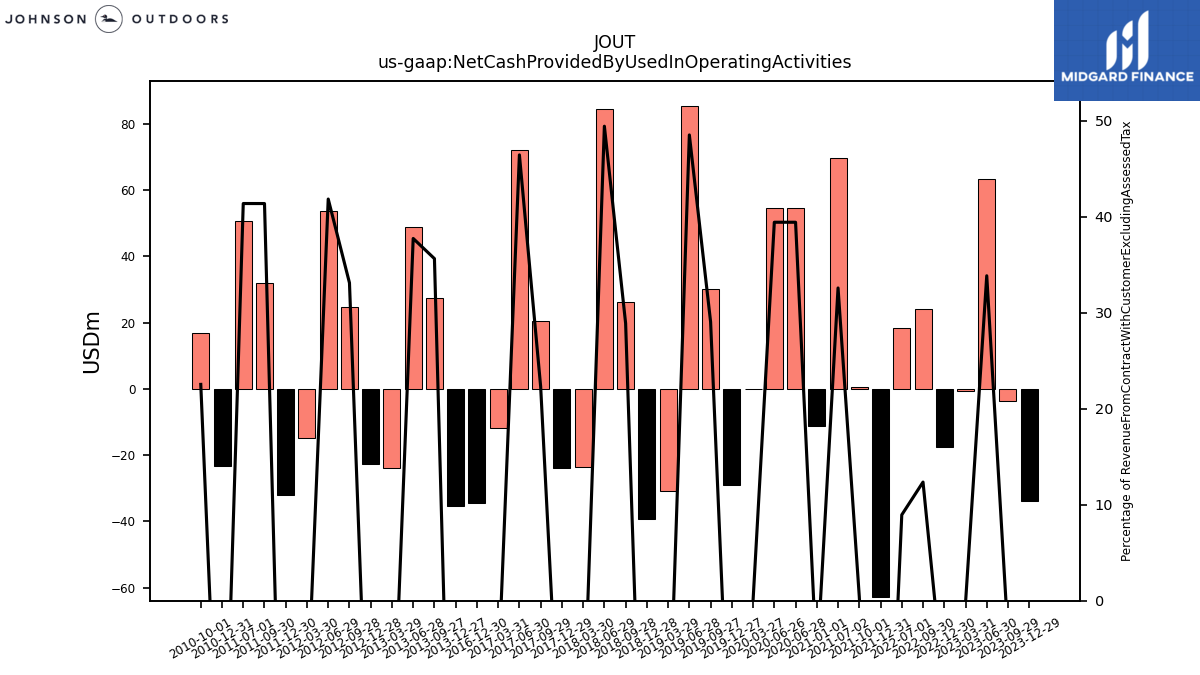
| Net Cash Provided By Used In Operating Activities | -33.69 | -3.50 | 63.30 | -0.53 | -17.57 | 24.27 | 18.23 | NA | -62.77 | 0.71 | 69.57 | NA | -11.24 | NA | 54.55 | 54.55 | 0.10 | -29.09 | 30.22 | 85.50 | -30.69 | -39.20 | 26.33 | 84.40 | -23.43 | -23.94 | 20.46 | 72.10 | -11.88 | -34.33 | NA | NA | NA | NA | NA | NA | NA | NA | NA | NA | NA | -35.41 | 27.55 | 48.96 | -23.77 | -22.73 | 24.76 | 53.80 | -14.76 | -32.03 | 32.01 | 50.67 | NA | -23.12 | 16.93 | NA | NA | NA | |
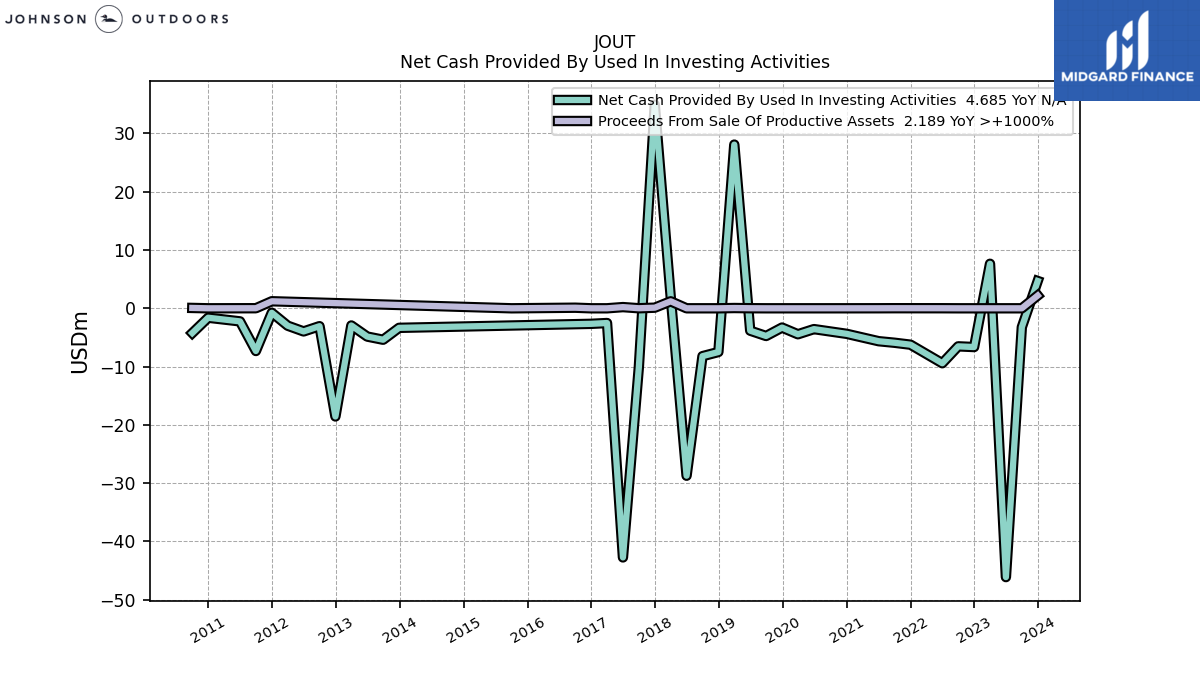
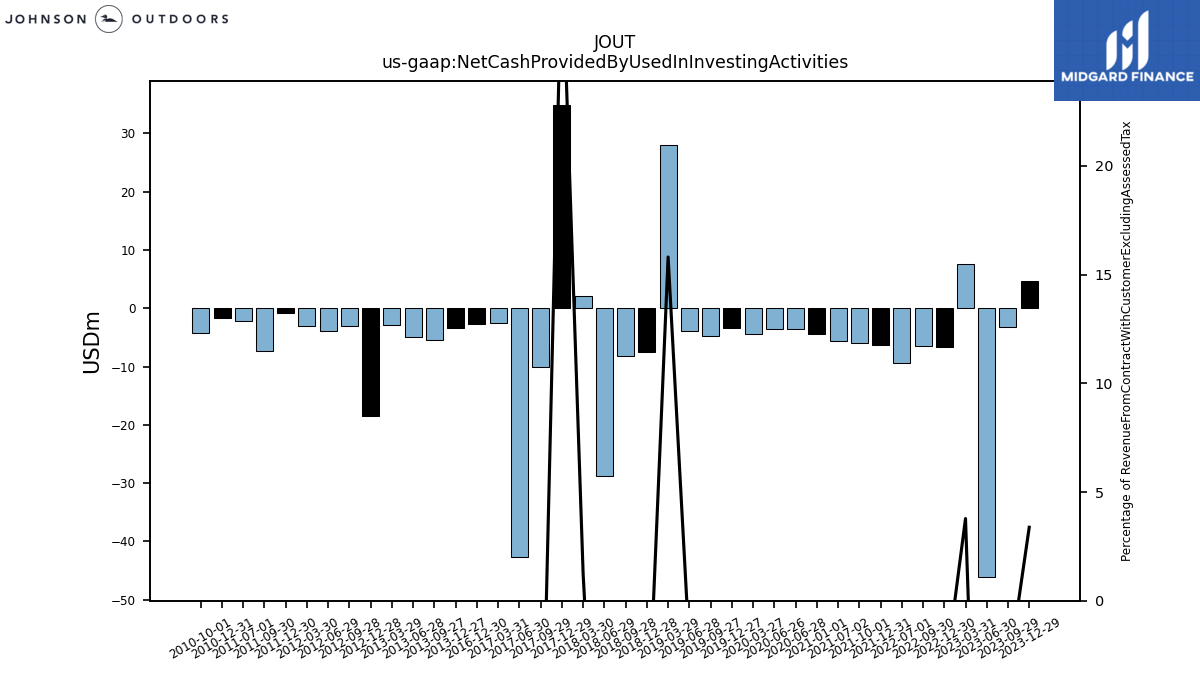
| Net Cash Provided By Used In Investing Activities | 4.68 | -3.24 | -46.12 | 7.64 | -6.65 | -6.53 | -9.43 | NA | -6.24 | -5.91 | -5.65 | NA | -4.39 | NA | -3.58 | -3.58 | -4.46 | -3.31 | -4.75 | -3.84 | 28.09 | -7.50 | -8.21 | -28.73 | 2.04 | 34.95 | -10.07 | -42.75 | -2.53 | -2.67 | NA | NA | NA | NA | NA | NA | NA | NA | NA | NA | NA | -3.35 | -5.39 | -4.85 | -2.95 | -18.56 | -3.07 | -3.97 | -2.99 | -0.77 | -7.33 | -2.24 | NA | -1.62 | -4.25 | NA | NA | NA | |
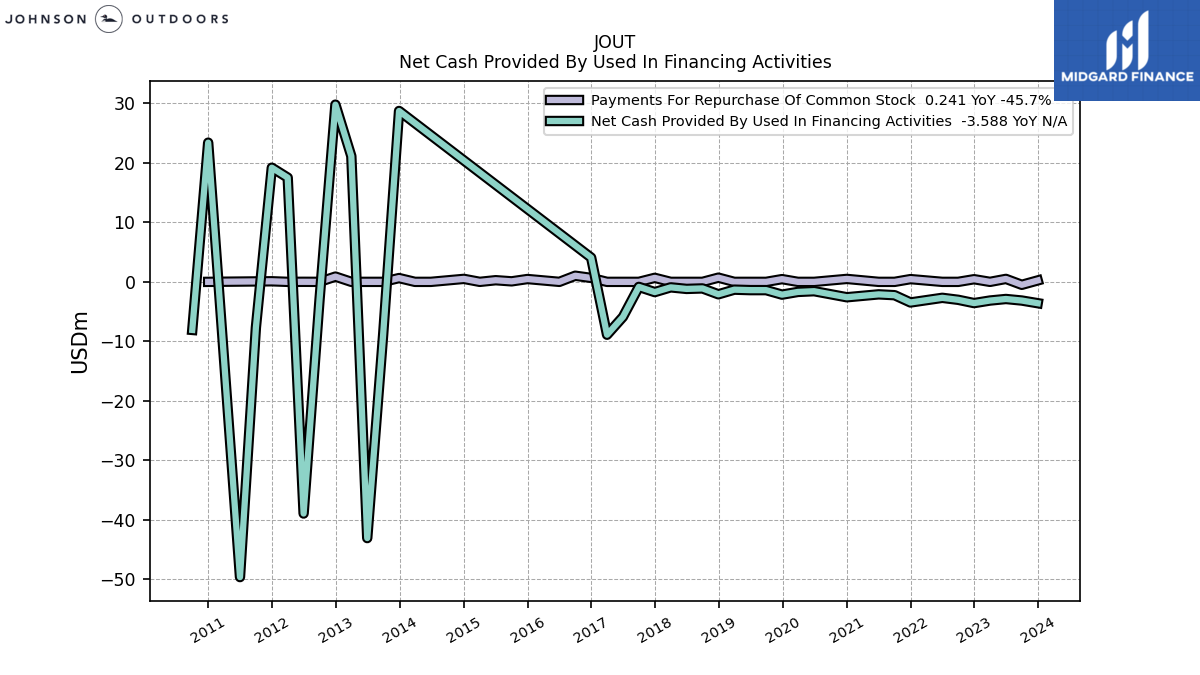
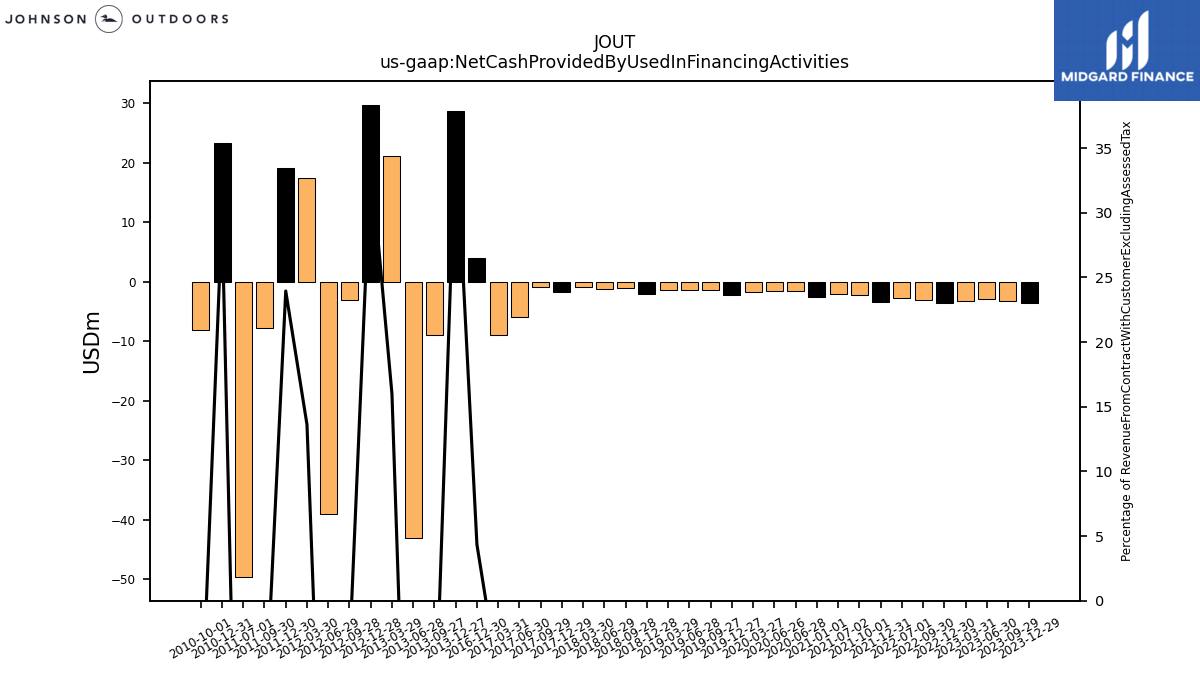
| Net Cash Provided By Used In Financing Activities | -3.59 | -3.14 | -2.88 | -3.14 | -3.57 | -3.02 | -2.69 | NA | -3.47 | -2.24 | -2.10 | NA | -2.59 | NA | -1.57 | -1.57 | -1.69 | -2.15 | -1.39 | -1.39 | -1.31 | -2.09 | -1.10 | -1.19 | -0.92 | -1.72 | -0.84 | -5.89 | -8.89 | 4.08 | NA | NA | NA | NA | NA | NA | NA | NA | NA | NA | NA | 28.74 | -8.89 | -43.09 | 21.14 | 29.80 | -3.02 | -38.96 | 17.53 | 19.20 | -7.67 | -49.65 | NA | 23.41 | -8.08 | NA | NA | NA |
| 2023-12-29 | 2023-09-29 | 2023-06-30 | 2023-03-31 | 2022-12-30 | 2022-09-30 | 2022-07-01 | 2022-04-01 | 2021-12-31 | 2021-10-01 | 2021-07-02 | 2021-04-02 | 2021-01-01 | 2020-10-02 | 2020-06-28 | 2020-06-26 | 2020-03-27 | 2019-12-27 | 2019-09-27 | 2019-06-28 | 2019-03-29 | 2018-12-28 | 2018-09-28 | 2018-06-29 | 2018-03-30 | 2017-12-29 | 2017-09-29 | 2017-06-30 | 2017-03-31 | 2016-12-30 | 2016-09-30 | 2016-07-01 | 2016-04-01 | 2016-01-01 | 2015-10-02 | 2015-07-03 | 2015-04-03 | 2015-01-02 | 2014-10-03 | 2014-06-27 | 2014-03-28 | 2013-12-27 | 2013-09-27 | 2013-06-28 | 2013-03-29 | 2012-12-28 | 2012-09-28 | 2012-06-29 | 2012-03-30 | 2011-12-30 | 2011-09-30 | 2011-07-01 | 2011-04-01 | 2010-12-31 | 2010-10-01 | 2010-07-02 | 2010-04-02 | 2010-01-01 | ||
|---|---|---|---|---|---|---|---|---|---|---|---|---|---|---|---|---|---|---|---|---|---|---|---|---|---|---|---|---|---|---|---|---|---|---|---|---|---|---|---|---|---|---|---|---|---|---|---|---|---|---|---|---|---|---|---|---|---|---|---|
| Net Cash Provided By Used In Operating Activities | -33.69 | -3.50 | 63.30 | -0.53 | -17.57 | 24.27 | 18.23 | NA | -62.77 | 0.71 | 69.57 | NA | -11.24 | NA | 54.55 | 54.55 | 0.10 | -29.09 | 30.22 | 85.50 | -30.69 | -39.20 | 26.33 | 84.40 | -23.43 | -23.94 | 20.46 | 72.10 | -11.88 | -34.33 | NA | NA | NA | NA | NA | NA | NA | NA | NA | NA | NA | -35.41 | 27.55 | 48.96 | -23.77 | -22.73 | 24.76 | 53.80 | -14.76 | -32.03 | 32.01 | 50.67 | NA | -23.12 | 16.93 | NA | NA | NA | |
| Net Income Loss | 3.96 | -16.01 | 14.80 | 14.86 | 5.88 | 9.65 | 14.08 | 9.90 | 10.86 | 6.93 | 28.77 | 27.83 | 19.85 | 15.55 | 12.87 | 12.87 | 20.39 | 6.43 | 3.90 | 22.07 | 21.92 | 3.52 | -4.96 | 23.77 | 21.62 | 0.23 | 0.59 | 16.55 | 13.96 | 4.06 | -2.13 | 6.84 | 9.32 | -0.53 | 1.17 | 10.00 | 3.65 | -4.19 | -0.79 | 4.70 | 7.40 | -2.19 | -3.51 | 13.65 | 8.94 | 0.25 | -3.20 | 8.99 | 7.28 | -2.94 | 17.28 | 8.12 | 8.49 | -1.24 | -5.84 | 10.43 | 6.18 | -4.24 | |
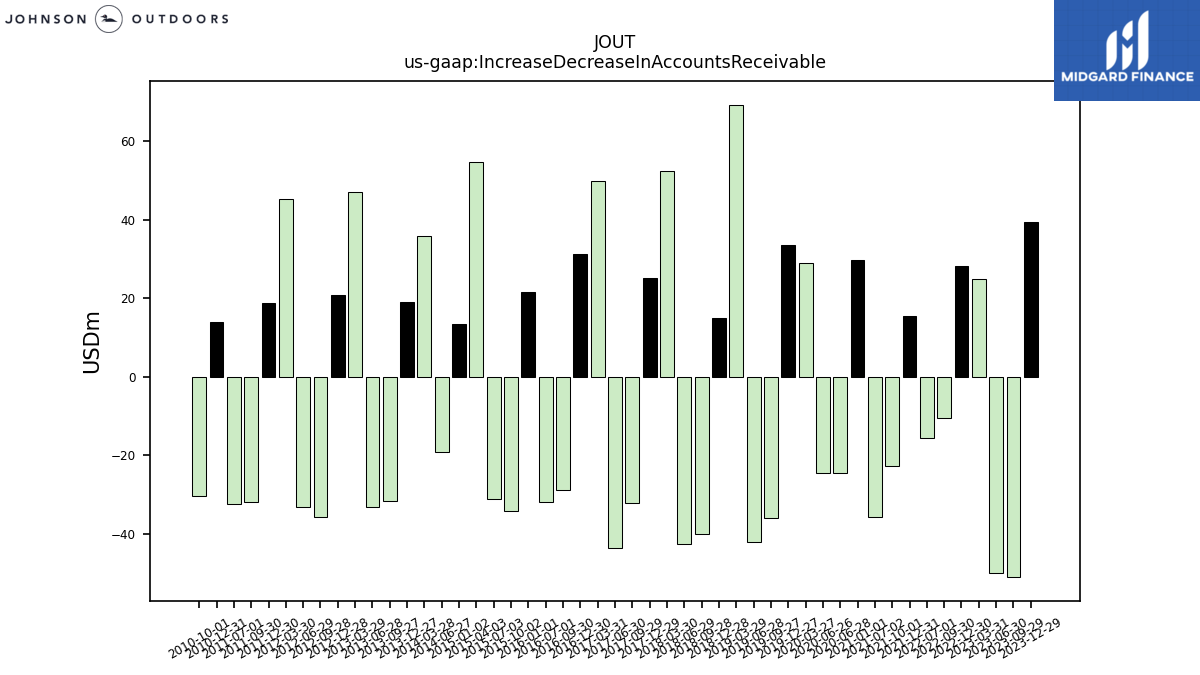
| Increase Decrease In Accounts Receivable | 39.47 | -51.10 | -50.11 | 24.75 | 28.17 | -10.56 | -15.65 | NA | 15.53 | -22.84 | -35.65 | NA | 29.69 | NA | -24.47 | -24.47 | 29.07 | 33.62 | -36.04 | -42.15 | 69.29 | 15.00 | -40.21 | -42.65 | 52.42 | 25.03 | -32.14 | -43.67 | 49.81 | 31.36 | -28.84 | -32.03 | NA | 21.50 | -34.20 | -31.25 | 54.68 | 13.30 | NA | -19.13 | 35.75 | 19.00 | -31.59 | -33.12 | 46.99 | 20.87 | -35.67 | -33.13 | 45.34 | 18.87 | -32.05 | -32.44 | NA | 14.02 | -30.37 | NA | NA | NA | |
| Increase Decrease In Inventories | 4.09 | 37.51 | -1.86 | -8.48 | 1.21 | 3.59 | 16.82 | NA | 50.99 | 36.73 | 5.99 | NA | 16.63 | NA | -14.19 | -14.19 | 4.47 | 9.30 | 0.11 | -20.74 | 0.06 | 27.93 | 11.71 | -16.30 | 3.48 | 11.61 | 11.79 | -7.41 | -1.60 | 8.63 | 0.79 | -18.39 | NA | 14.20 | 4.00 | -1.70 | -1.24 | 16.93 | NA | -14.09 | -2.56 | 11.27 | 1.69 | -9.91 | 8.54 | 7.81 | 1.55 | -11.07 | -0.36 | 11.38 | -0.40 | -11.89 | NA | 12.33 | 8.81 | NA | NA | NA | |
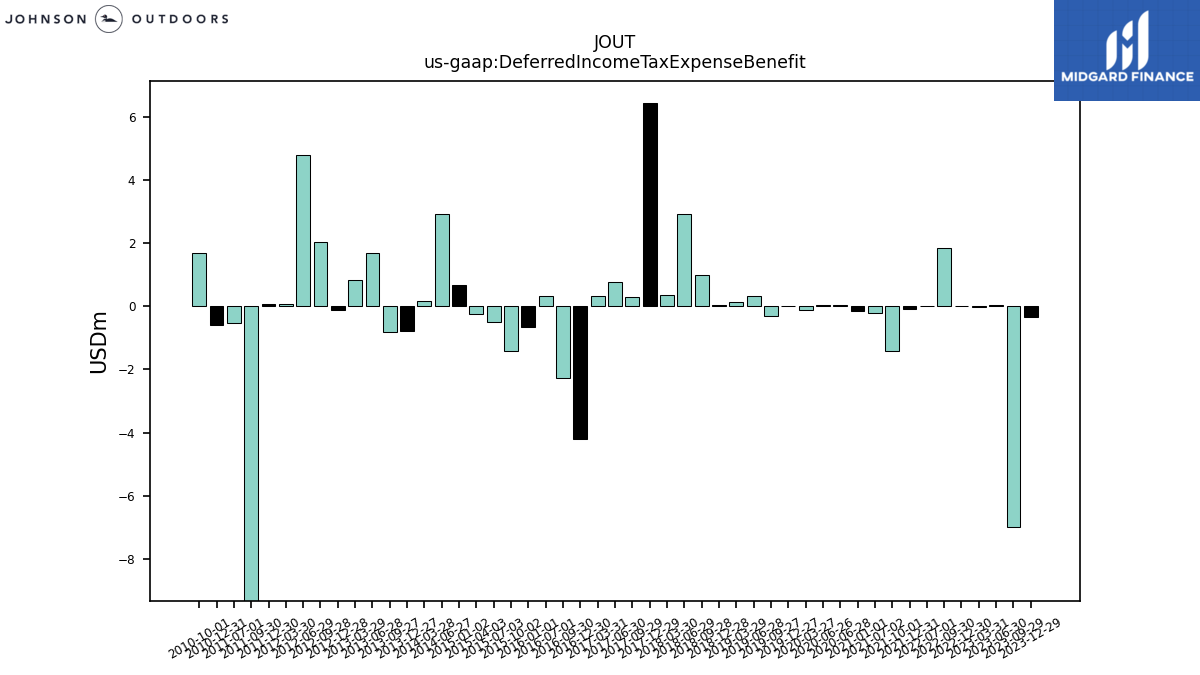
| Deferred Income Tax Expense Benefit | -0.35 | -6.98 | 0.06 | -0.01 | 0.01 | 1.84 | 0.01 | NA | -0.07 | -1.42 | -0.20 | NA | -0.15 | NA | 0.05 | 0.05 | -0.12 | 0.00 | -0.31 | 0.32 | 0.15 | 0.05 | 0.99 | 2.95 | 0.36 | 6.47 | 0.29 | 0.79 | 0.34 | -4.20 | -2.25 | 0.34 | NA | -0.65 | -1.42 | -0.50 | -0.25 | 0.68 | NA | 2.94 | 0.18 | -0.78 | -0.82 | 1.71 | 0.85 | -0.13 | 2.04 | 4.80 | 0.06 | 0.09 | -21.42 | -0.52 | NA | -0.59 | 1.68 | NA | NA | NA | |
| Share Based Compensation | 0.60 | 0.30 | 0.22 | 0.97 | 0.95 | 0.98 | 1.06 | NA | 1.13 | 1.59 | 1.05 | NA | 0.71 | NA | 1.42 | 1.42 | -0.29 | 0.67 | 0.66 | 0.57 | 0.57 | 0.53 | 0.71 | 0.58 | 0.47 | 0.54 | 0.61 | 0.42 | 0.45 | 0.50 | 0.37 | 0.51 | NA | 0.50 | 0.44 | 0.20 | 0.50 | 0.46 | NA | 0.43 | 0.43 | 0.40 | 0.39 | 0.38 | 0.36 | 0.35 | 0.37 | 0.37 | 0.55 | 0.38 | 0.38 | 0.34 | NA | 0.22 | 0.23 | NA | NA | NA | |
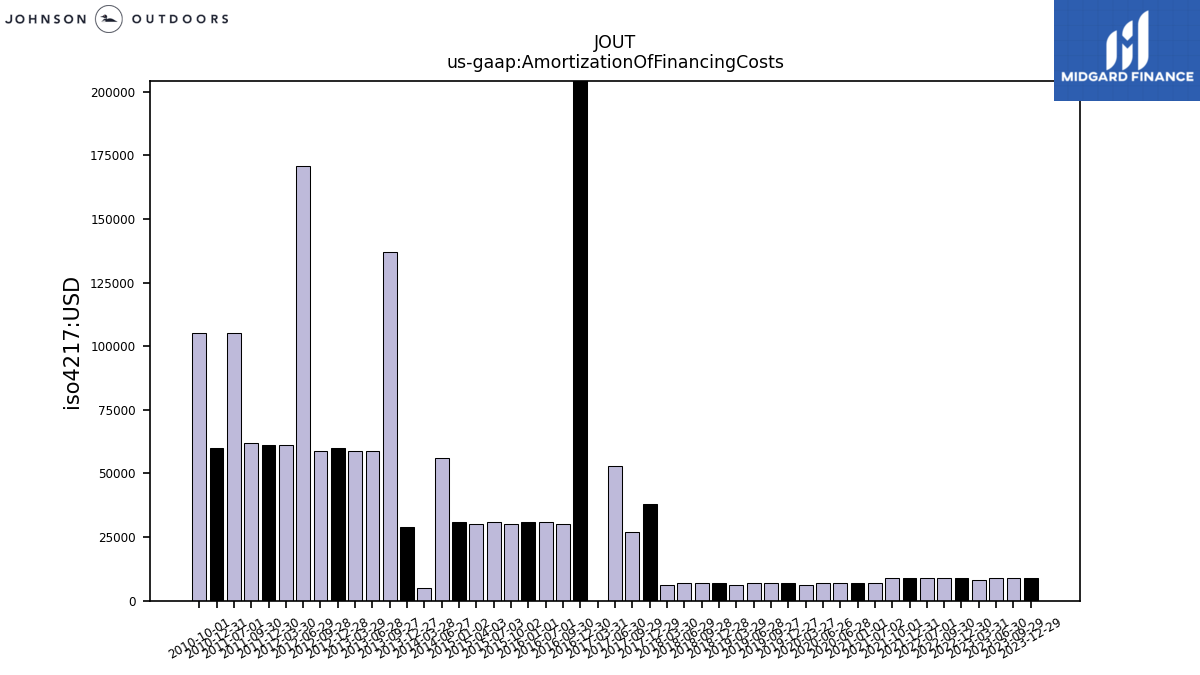
| Amortization Of Financing Costs | 0.01 | 0.01 | 0.01 | 0.01 | 0.01 | 0.01 | 0.01 | NA | 0.01 | 0.01 | 0.01 | NA | 0.01 | NA | 0.01 | 0.01 | 0.01 | 0.01 | 0.01 | 0.01 | 0.01 | 0.01 | 0.01 | 0.01 | 0.01 | 0.04 | 0.03 | 0.05 | 0.00 | 0.22 | 0.03 | 0.03 | NA | 0.03 | 0.03 | 0.03 | 0.03 | 0.03 | NA | 0.06 | 0.01 | 0.03 | 0.14 | 0.06 | 0.06 | 0.06 | 0.06 | 0.17 | 0.06 | 0.06 | 0.06 | 0.10 | NA | 0.06 | 0.10 | NA | NA | NA |
| 2023-12-29 | 2023-09-29 | 2023-06-30 | 2023-03-31 | 2022-12-30 | 2022-09-30 | 2022-07-01 | 2022-04-01 | 2021-12-31 | 2021-10-01 | 2021-07-02 | 2021-04-02 | 2021-01-01 | 2020-10-02 | 2020-06-28 | 2020-06-26 | 2020-03-27 | 2019-12-27 | 2019-09-27 | 2019-06-28 | 2019-03-29 | 2018-12-28 | 2018-09-28 | 2018-06-29 | 2018-03-30 | 2017-12-29 | 2017-09-29 | 2017-06-30 | 2017-03-31 | 2016-12-30 | 2016-09-30 | 2016-07-01 | 2016-04-01 | 2016-01-01 | 2015-10-02 | 2015-07-03 | 2015-04-03 | 2015-01-02 | 2014-10-03 | 2014-06-27 | 2014-03-28 | 2013-12-27 | 2013-09-27 | 2013-06-28 | 2013-03-29 | 2012-12-28 | 2012-09-28 | 2012-06-29 | 2012-03-30 | 2011-12-30 | 2011-09-30 | 2011-07-01 | 2011-04-01 | 2010-12-31 | 2010-10-01 | 2010-07-02 | 2010-04-02 | 2010-01-01 | ||
|---|---|---|---|---|---|---|---|---|---|---|---|---|---|---|---|---|---|---|---|---|---|---|---|---|---|---|---|---|---|---|---|---|---|---|---|---|---|---|---|---|---|---|---|---|---|---|---|---|---|---|---|---|---|---|---|---|---|---|---|
| Net Cash Provided By Used In Investing Activities | 4.68 | -3.24 | -46.12 | 7.64 | -6.65 | -6.53 | -9.43 | NA | -6.24 | -5.91 | -5.65 | NA | -4.39 | NA | -3.58 | -3.58 | -4.46 | -3.31 | -4.75 | -3.84 | 28.09 | -7.50 | -8.21 | -28.73 | 2.04 | 34.95 | -10.07 | -42.75 | -2.53 | -2.67 | NA | NA | NA | NA | NA | NA | NA | NA | NA | NA | NA | -3.35 | -5.39 | -4.85 | -2.95 | -18.56 | -3.07 | -3.97 | -2.99 | -0.77 | -7.33 | -2.24 | NA | -1.62 | -4.25 | NA | NA | NA | |
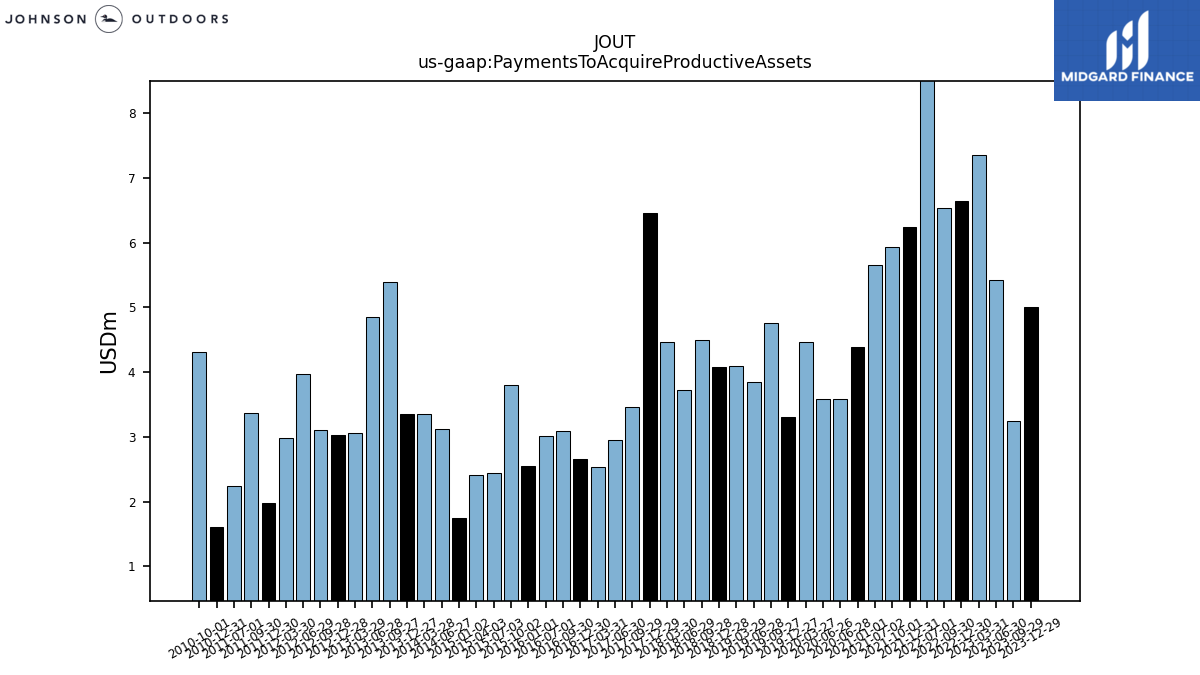
| Payments To Acquire Productive Assets | 5.00 | 3.24 | 5.43 | 7.35 | 6.65 | 6.53 | 9.44 | NA | 6.24 | 5.93 | 5.65 | NA | 4.39 | NA | 3.58 | 3.58 | 4.46 | 3.31 | 4.75 | 3.85 | 4.10 | 4.08 | 4.50 | 3.73 | 4.47 | 6.45 | 3.47 | 2.95 | 2.53 | 2.67 | 3.09 | 3.01 | NA | 2.55 | 3.80 | 2.44 | 2.41 | 1.75 | NA | 3.12 | 3.35 | 3.35 | 5.39 | 4.85 | 3.06 | 3.03 | 3.10 | 3.97 | 2.99 | 1.97 | 3.37 | 2.24 | NA | 1.62 | 4.31 | NA | NA | NA |
| 2023-12-29 | 2023-09-29 | 2023-06-30 | 2023-03-31 | 2022-12-30 | 2022-09-30 | 2022-07-01 | 2022-04-01 | 2021-12-31 | 2021-10-01 | 2021-07-02 | 2021-04-02 | 2021-01-01 | 2020-10-02 | 2020-06-28 | 2020-06-26 | 2020-03-27 | 2019-12-27 | 2019-09-27 | 2019-06-28 | 2019-03-29 | 2018-12-28 | 2018-09-28 | 2018-06-29 | 2018-03-30 | 2017-12-29 | 2017-09-29 | 2017-06-30 | 2017-03-31 | 2016-12-30 | 2016-09-30 | 2016-07-01 | 2016-04-01 | 2016-01-01 | 2015-10-02 | 2015-07-03 | 2015-04-03 | 2015-01-02 | 2014-10-03 | 2014-06-27 | 2014-03-28 | 2013-12-27 | 2013-09-27 | 2013-06-28 | 2013-03-29 | 2012-12-28 | 2012-09-28 | 2012-06-29 | 2012-03-30 | 2011-12-30 | 2011-09-30 | 2011-07-01 | 2011-04-01 | 2010-12-31 | 2010-10-01 | 2010-07-02 | 2010-04-02 | 2010-01-01 | ||
|---|---|---|---|---|---|---|---|---|---|---|---|---|---|---|---|---|---|---|---|---|---|---|---|---|---|---|---|---|---|---|---|---|---|---|---|---|---|---|---|---|---|---|---|---|---|---|---|---|---|---|---|---|---|---|---|---|---|---|---|
| Net Cash Provided By Used In Financing Activities | -3.59 | -3.14 | -2.88 | -3.14 | -3.57 | -3.02 | -2.69 | NA | -3.47 | -2.24 | -2.10 | NA | -2.59 | NA | -1.57 | -1.57 | -1.69 | -2.15 | -1.39 | -1.39 | -1.31 | -2.09 | -1.10 | -1.19 | -0.92 | -1.72 | -0.84 | -5.89 | -8.89 | 4.08 | NA | NA | NA | NA | NA | NA | NA | NA | NA | NA | NA | 28.74 | -8.89 | -43.09 | 21.14 | 29.80 | -3.02 | -38.96 | 17.53 | 19.20 | -7.67 | -49.65 | NA | 23.41 | -8.08 | NA | NA | NA | |
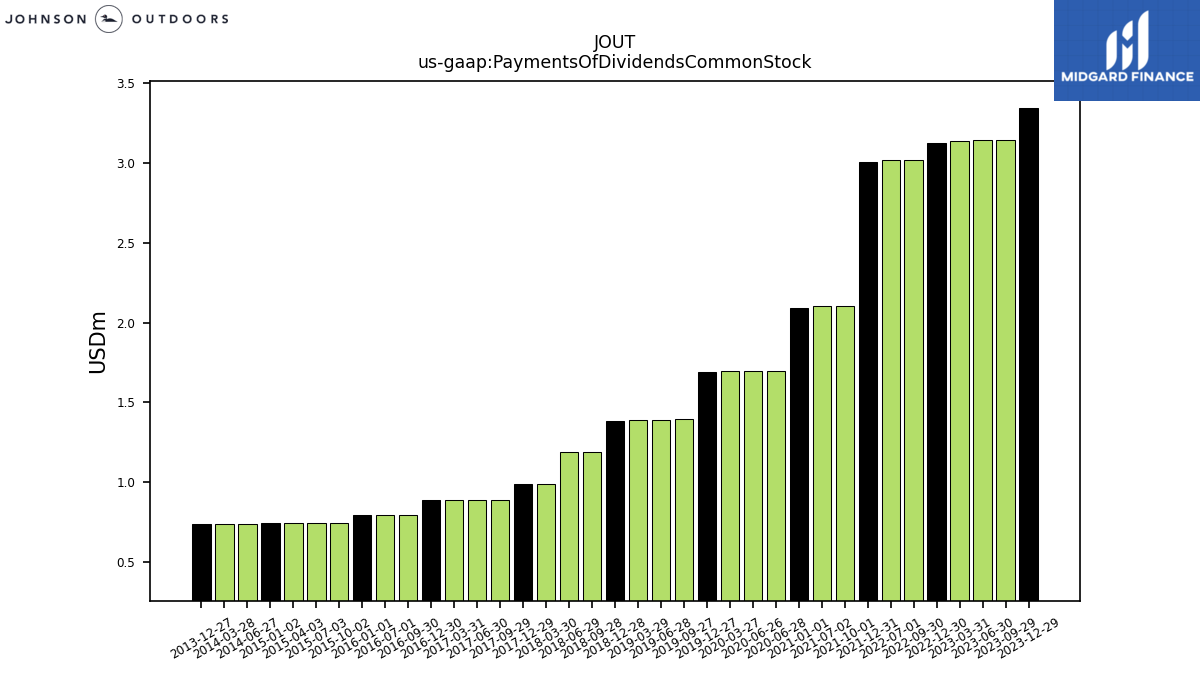
| Payments Of Dividends Common Stock | 3.35 | 3.14 | 3.15 | 3.14 | 3.13 | 3.02 | 3.02 | NA | 3.00 | 2.10 | 2.10 | NA | 2.09 | NA | 1.70 | 1.70 | 1.69 | 1.69 | 1.39 | 1.39 | 1.39 | 1.38 | 1.19 | 1.19 | 0.99 | 0.99 | 0.89 | 0.89 | 0.89 | 0.89 | 0.79 | 0.79 | NA | 0.79 | 0.74 | 0.74 | 0.74 | 0.74 | NA | 0.74 | 0.74 | 0.74 | NA | NA | NA | NA | NA | NA | NA | NA | NA | NA | NA | NA | NA | NA | NA | NA | |
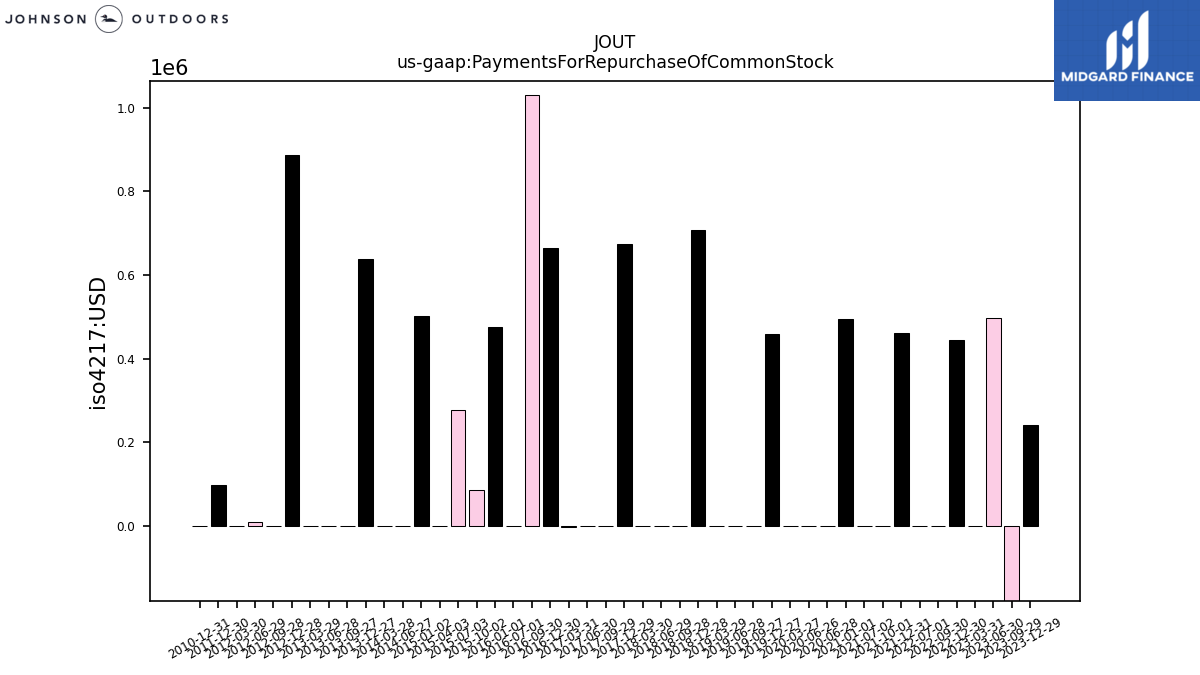
| Payments For Repurchase Of Common Stock | 0.24 | -0.50 | 0.50 | 0.00 | 0.44 | 0.00 | 0.00 | NA | 0.46 | 0.00 | 0.00 | NA | 0.49 | NA | 0.00 | 0.00 | 0.00 | 0.46 | 0.00 | 0.00 | 0.00 | 0.71 | 0.00 | 0.00 | 0.00 | 0.68 | 0.00 | 0.00 | -0.00 | 0.66 | 1.03 | 0.00 | NA | 0.48 | 0.09 | 0.28 | 0.00 | 0.50 | NA | 0.00 | 0.00 | 0.64 | 0.00 | 0.00 | 0.00 | 0.89 | 0.00 | 0.01 | 0.00 | 0.10 | NA | NA | NA | 0.00 | NA | NA | NA | NA |
| 2023-12-29 | 2023-09-29 | 2023-06-30 | 2023-03-31 | 2022-12-30 | 2022-09-30 | 2022-07-01 | 2022-04-01 | 2021-12-31 | 2021-10-01 | 2021-07-02 | 2021-04-02 | 2021-01-01 | 2020-10-02 | 2020-06-28 | 2020-06-26 | 2020-03-27 | 2019-12-27 | 2019-09-27 | 2019-06-28 | 2019-03-29 | 2018-12-28 | 2018-09-28 | 2018-06-29 | 2018-03-30 | 2017-12-29 | 2017-09-29 | 2017-06-30 | 2017-03-31 | 2016-12-30 | 2016-09-30 | 2016-07-01 | 2016-04-01 | 2016-01-01 | 2015-10-02 | 2015-07-03 | 2015-04-03 | 2015-01-02 | 2014-10-03 | 2014-06-27 | 2014-03-28 | 2013-12-27 | 2013-09-27 | 2013-06-28 | 2013-03-29 | 2012-12-28 | 2012-09-28 | 2012-06-29 | 2012-03-30 | 2011-12-30 | 2011-09-30 | 2011-07-01 | 2011-04-01 | 2010-12-31 | 2010-10-01 | 2010-07-02 | 2010-04-02 | 2010-01-01 | ||
|---|---|---|---|---|---|---|---|---|---|---|---|---|---|---|---|---|---|---|---|---|---|---|---|---|---|---|---|---|---|---|---|---|---|---|---|---|---|---|---|---|---|---|---|---|---|---|---|---|---|---|---|---|---|---|---|---|---|---|---|
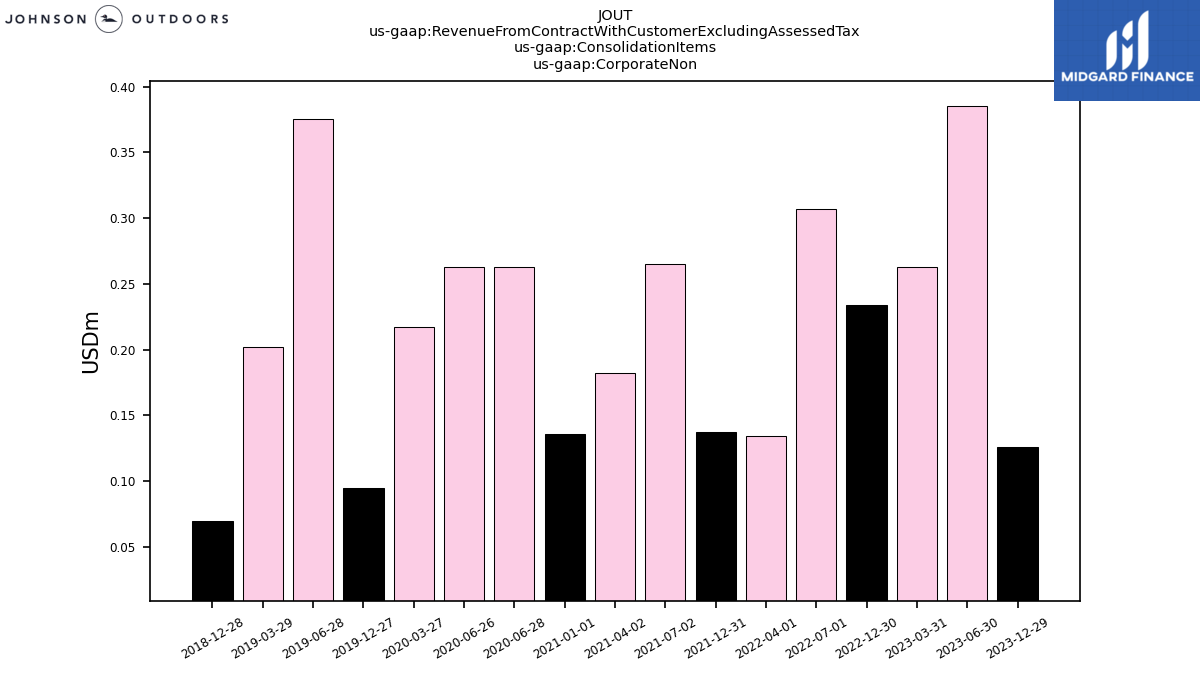
| Revenue From Contract With Customer Excluding Assessed Tax | 138.64 | 96.34 | 187.05 | 202.12 | 178.34 | 196.39 | 203.82 | 189.62 | 153.52 | 166.26 | 213.57 | 206.16 | 165.67 | 164.68 | 138.39 | 138.39 | 163.08 | 128.05 | 104.02 | 176.25 | 177.71 | 104.44 | 91.13 | 170.78 | 165.78 | 116.58 | 91.75 | 155.27 | 149.81 | 93.73 | 74.94 | 139.30 | 134.19 | 85.30 | 85.67 | 140.88 | 133.11 | 70.82 | 84.90 | 137.13 | 124.27 | 79.10 | 77.31 | 129.77 | 132.10 | 87.27 | 74.80 | 128.59 | 128.73 | 80.18 | 77.38 | 122.48 | 128.86 | 78.70 | 75.12 | 123.95 | 112.90 | 70.46 | |
| Corporate Non | 0.13 | NA | 0.39 | 0.26 | 0.23 | NA | 0.31 | 0.13 | 0.14 | NA | 0.27 | 0.18 | 0.14 | NA | 0.26 | 0.26 | 0.22 | 0.10 | NA | 0.38 | 0.20 | 0.07 | NA | NA | NA | NA | NA | NA | NA | NA | NA | NA | NA | NA | NA | NA | NA | NA | NA | NA | NA | NA | NA | NA | NA | NA | NA | NA | NA | NA | NA | NA | NA | NA | NA | NA | NA | NA | |
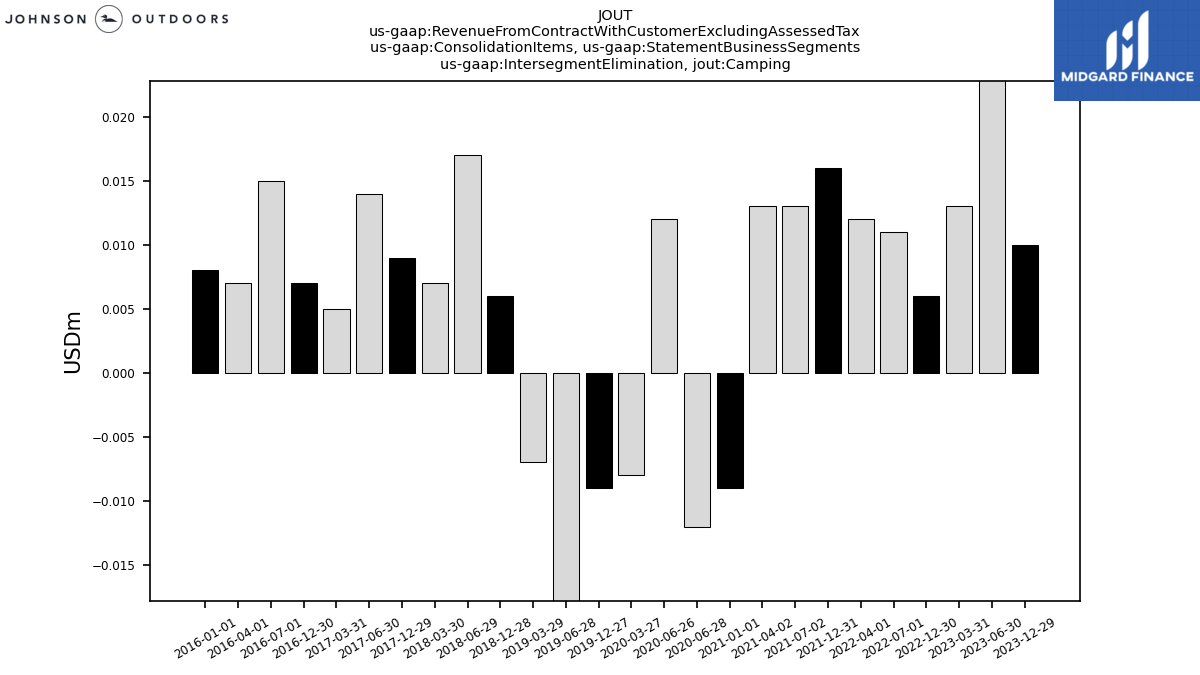
| Intersegment Elimination | -0.18 | -0.23 | -0.41 | -0.41 | -0.27 | -0.13 | -0.60 | -0.20 | -0.19 | -0.36 | -0.35 | -0.27 | -0.20 | NA | -0.24 | -0.24 | -0.26 | -0.10 | -0.12 | -0.30 | -0.19 | -0.11 | -0.09 | -0.29 | -0.18 | -0.08 | -0.26 | -0.44 | -0.25 | -0.23 | -0.23 | -0.38 | -0.38 | -0.34 | -0.31 | -0.48 | -0.34 | -0.12 | NA | -0.40 | -0.34 | -0.31 | -0.35 | -0.49 | -0.46 | NA | NA | NA | NA | NA | NA | NA | NA | NA | NA | NA | NA | NA | |
| Intersegment Elimination, Camping | 0.01 | NA | 0.04 | 0.01 | 0.01 | NA | 0.01 | 0.01 | 0.02 | NA | 0.01 | 0.01 | -0.01 | NA | -0.01 | 0.01 | -0.01 | -0.01 | NA | -0.02 | -0.01 | 0.01 | NA | 0.02 | 0.01 | 0.01 | NA | 0.01 | 0.01 | 0.01 | NA | 0.01 | 0.01 | 0.01 | NA | NA | NA | NA | NA | NA | NA | NA | NA | NA | NA | NA | NA | NA | NA | NA | NA | NA | NA | NA | NA | NA | NA | NA | |
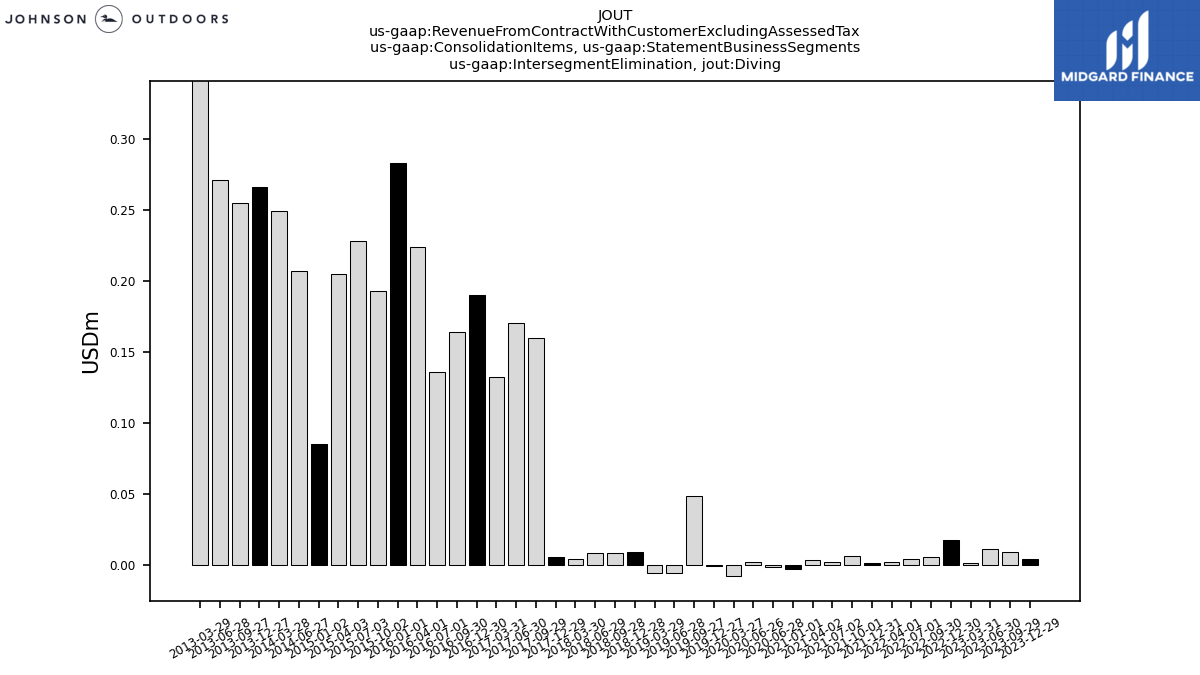
| Intersegment Elimination, Diving | 0.00 | 0.01 | 0.01 | 0.00 | 0.02 | 0.01 | 0.00 | 0.00 | 0.00 | 0.01 | 0.00 | 0.00 | -0.00 | NA | -0.00 | 0.00 | -0.01 | -0.00 | 0.05 | -0.01 | -0.01 | 0.01 | 0.01 | 0.01 | 0.00 | 0.01 | 0.16 | 0.17 | 0.13 | 0.19 | 0.16 | 0.14 | 0.22 | 0.28 | 0.19 | 0.23 | 0.20 | 0.09 | NA | 0.21 | 0.25 | 0.27 | 0.26 | 0.27 | 0.34 | NA | NA | NA | NA | NA | NA | NA | NA | NA | NA | NA | NA | NA | |
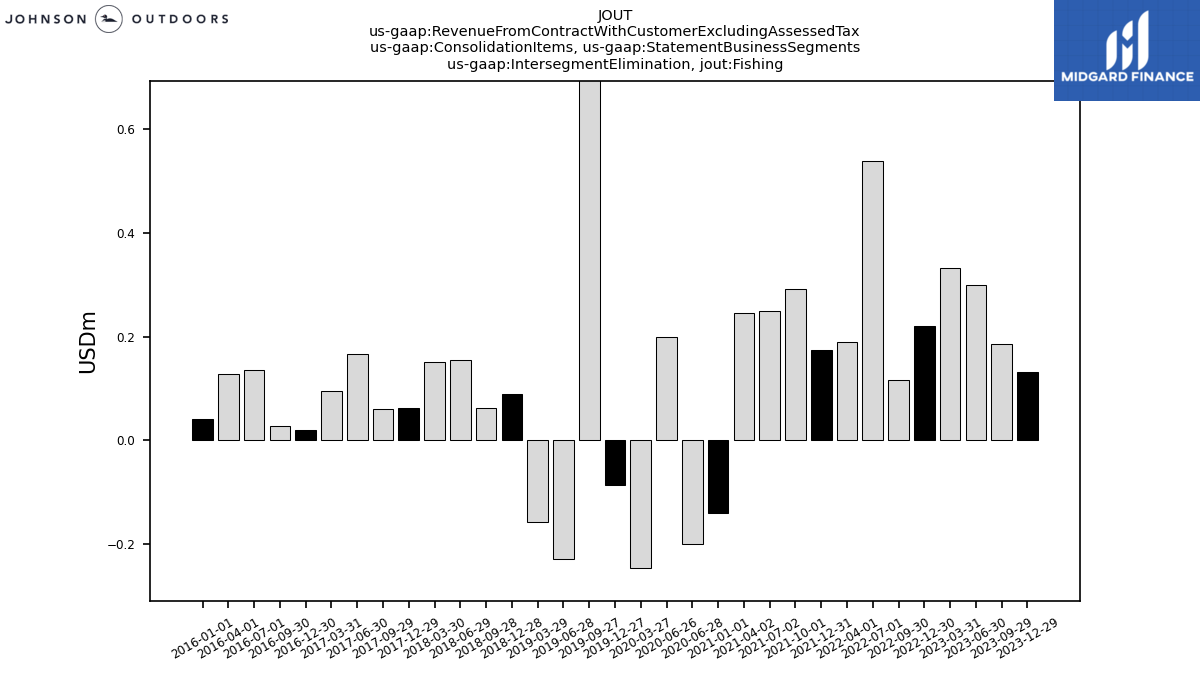
| Intersegment Elimination, Fishing | 0.13 | 0.19 | 0.30 | 0.33 | 0.22 | 0.12 | 0.54 | 0.19 | 0.17 | 0.29 | 0.25 | 0.25 | -0.14 | NA | -0.20 | 0.20 | -0.24 | -0.09 | 1.03 | -0.23 | -0.16 | 0.09 | 0.06 | 0.15 | 0.15 | 0.06 | 0.06 | 0.17 | 0.10 | 0.02 | 0.03 | 0.14 | 0.13 | 0.04 | NA | NA | NA | NA | NA | NA | NA | NA | NA | NA | NA | NA | NA | NA | NA | NA | NA | NA | NA | NA | NA | NA | NA | NA | |
| Intersegment Elimination, Watercraft Recreation | 0.03 | NA | 0.06 | 0.07 | 0.03 | NA | 0.05 | 0.00 | 0.00 | NA | 0.09 | 0.01 | -0.05 | NA | -0.03 | 0.03 | -0.00 | -0.01 | NA | -0.04 | -0.02 | 0.01 | NA | 0.12 | 0.02 | 0.01 | NA | 0.09 | 0.02 | 0.01 | NA | 0.10 | 0.02 | 0.01 | NA | NA | NA | NA | NA | NA | NA | NA | NA | NA | NA | NA | NA | NA | NA | NA | NA | NA | NA | NA | NA | NA | NA | NA | |
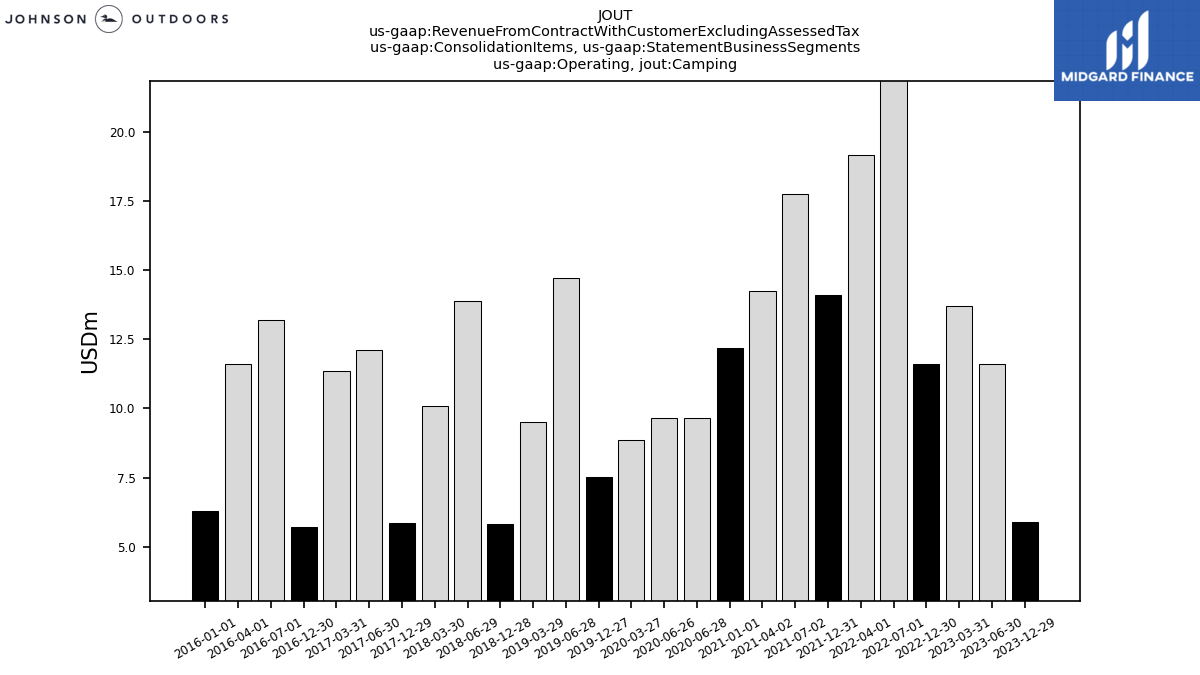
| Operating, Camping | 5.90 | NA | 11.62 | 13.71 | 11.61 | NA | 23.47 | 19.16 | 14.12 | NA | 17.74 | 14.23 | 12.19 | NA | 9.65 | 9.65 | 8.84 | 7.50 | NA | 14.71 | 9.52 | 5.81 | NA | 13.90 | 10.07 | 5.84 | NA | 12.12 | 11.37 | 5.73 | NA | 13.20 | 11.61 | 6.31 | NA | NA | NA | NA | NA | NA | NA | NA | NA | NA | NA | NA | NA | NA | NA | NA | NA | NA | NA | NA | NA | NA | NA | NA | |
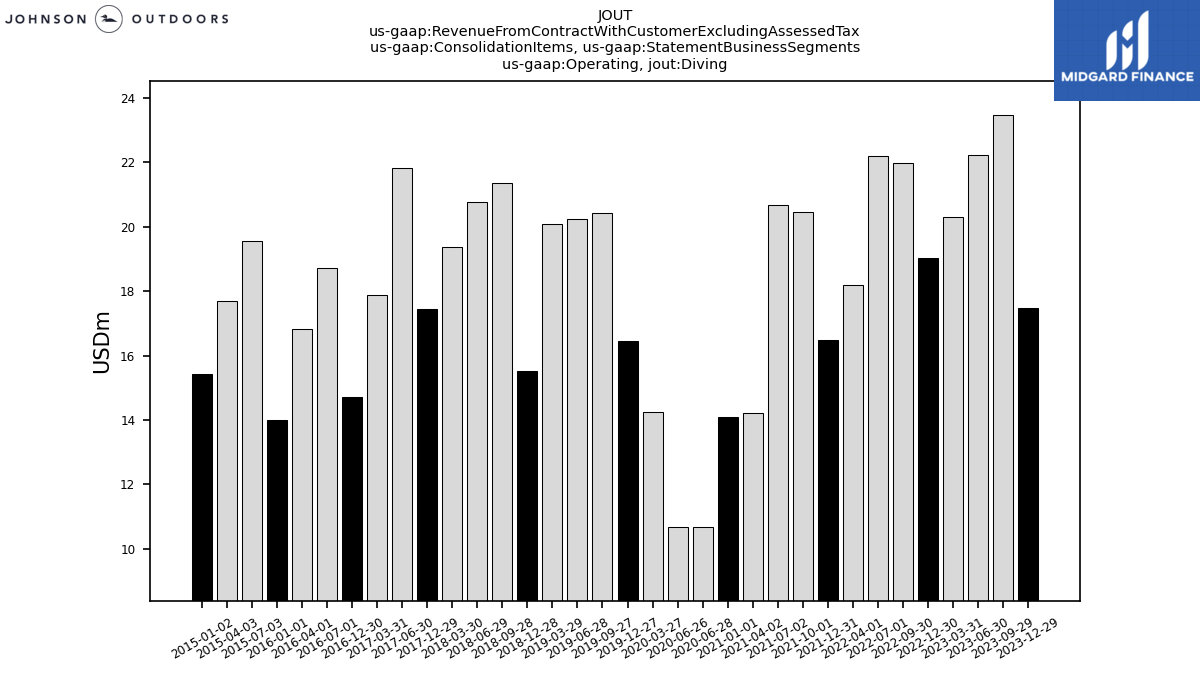
| Operating, Diving | 17.47 | 23.47 | 22.22 | 20.31 | 19.04 | 21.98 | 22.20 | 18.19 | 16.49 | 20.46 | 20.68 | 14.21 | 14.09 | NA | 10.69 | 10.69 | 14.25 | 16.46 | 20.43 | 20.24 | 20.08 | 15.53 | 21.34 | 20.77 | 19.37 | 17.43 | NA | 21.81 | 17.89 | 14.70 | NA | 18.71 | 16.84 | 14.01 | NA | 19.56 | 17.71 | 15.43 | NA | NA | NA | NA | NA | NA | NA | NA | NA | NA | NA | NA | NA | NA | NA | NA | NA | NA | NA | NA | |
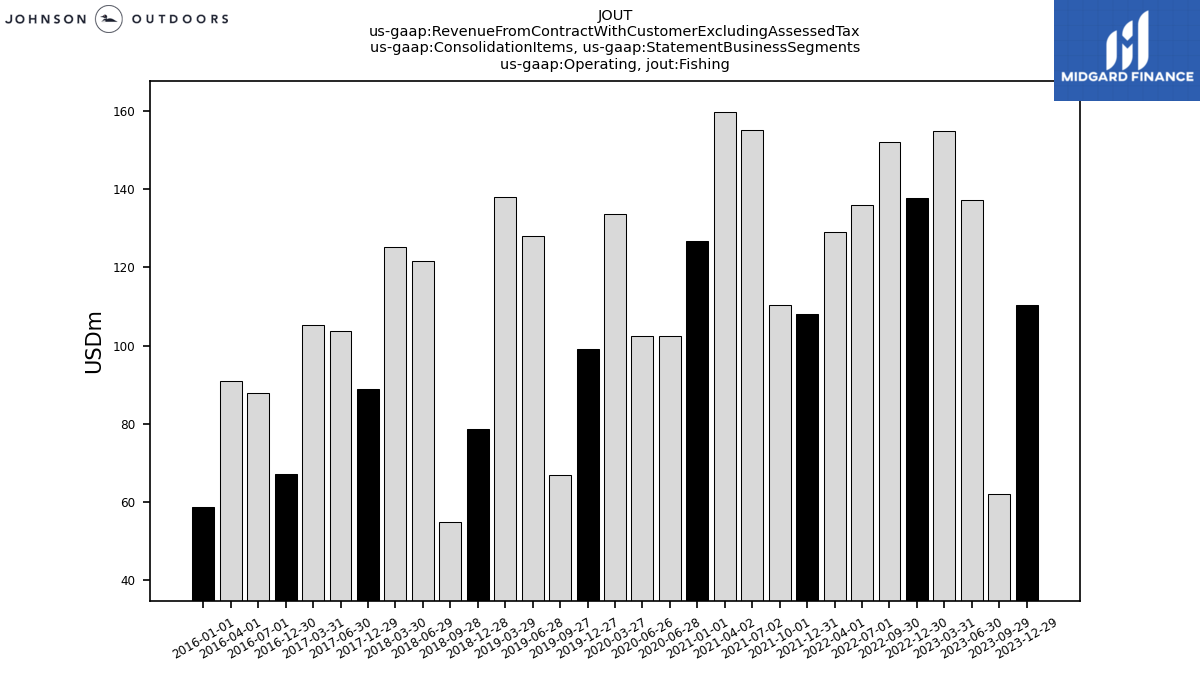
| Operating, Fishing | 110.36 | 61.90 | 137.16 | 155.01 | 137.82 | 152.22 | 136.03 | 129.13 | 108.18 | 110.35 | 155.10 | 159.77 | 126.86 | NA | 102.54 | 102.54 | 133.71 | 99.19 | 66.82 | 127.97 | 138.07 | 78.71 | 54.71 | 121.77 | 125.36 | 88.84 | NA | 103.81 | 105.33 | 67.05 | NA | 87.93 | 90.86 | 58.56 | NA | NA | NA | NA | NA | NA | NA | NA | NA | NA | NA | NA | NA | NA | NA | NA | NA | NA | NA | NA | NA | NA | NA | NA | |
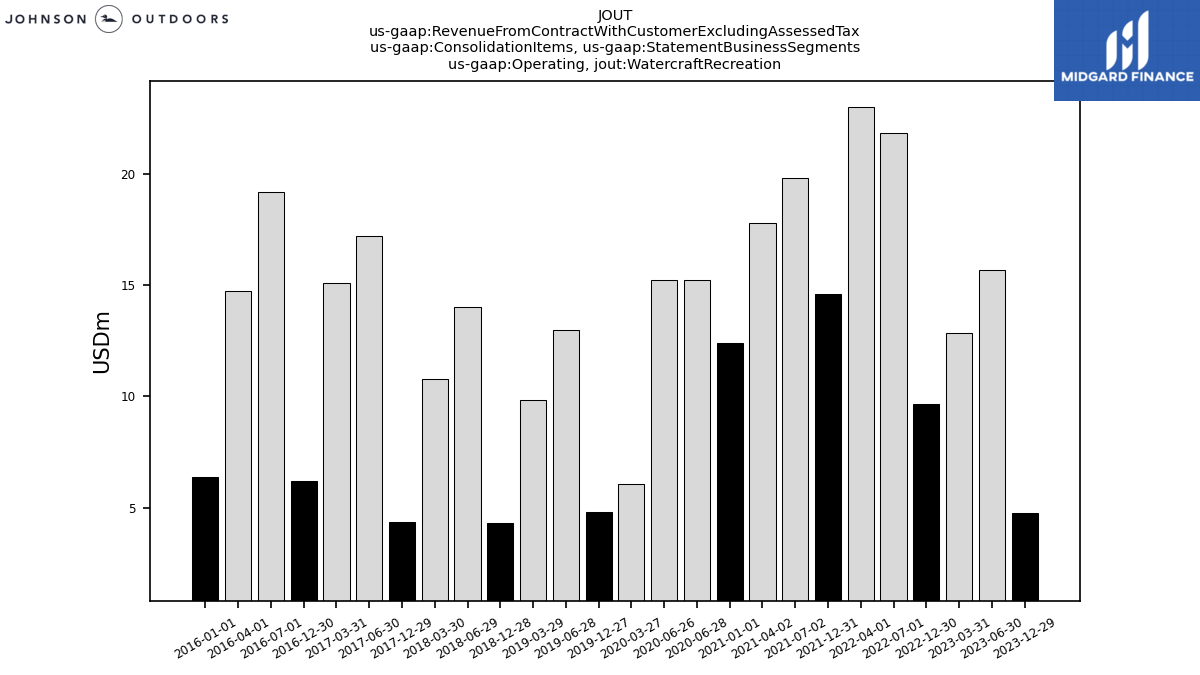
| Operating, Watercraft Recreation | 4.78 | NA | 15.66 | 12.82 | 9.63 | NA | 21.82 | 23.01 | 14.60 | NA | 19.78 | 17.77 | 12.40 | NA | 15.24 | 15.24 | 6.06 | 4.80 | NA | 12.96 | 9.83 | 4.32 | NA | 14.00 | 10.79 | 4.35 | NA | 17.20 | 15.07 | 6.21 | NA | 19.17 | 14.73 | 6.37 | NA | NA | NA | NA | NA | NA | NA | NA | NA | NA | NA | NA | NA | NA | NA | NA | NA | NA | NA | NA | NA | NA | NA | NA | |
| Two Customers, Revenue From Contract With Customer Segment Benchmark, Customer Concentration Risk | 54.15 | NA | NA | NA | 50.06 | NA | NA | NA | NA | NA | NA | NA | NA | NA | NA | NA | NA | NA | NA | NA | NA | NA | NA | NA | NA | NA | NA | NA | NA | NA | NA | NA | NA | NA | NA | NA | NA | NA | NA | NA | NA | NA | NA | NA | NA | NA | NA | NA | NA | NA | NA | NA | NA | NA | NA | NA | NA | NA |


