
| 2024-01-31 | 2023-10-31 | 2023-07-31 | 2023-04-30 | 2023-01-31 | 2022-10-31 | 2022-07-31 | 2022-04-30 | 2022-01-31 | 2021-10-31 | 2021-07-31 | 2021-04-30 | 2021-01-31 | 2020-10-31 | 2020-07-31 | 2020-04-30 | 2020-01-31 | 2019-10-31 | 2019-07-31 | 2019-04-30 | 2019-01-31 | 2018-10-31 | 2018-07-31 | 2018-04-30 | 2018-01-31 | 2017-10-31 | 2017-07-31 | 2017-04-30 | 2017-01-31 | 2016-10-31 | 2016-07-31 | 2016-04-30 | 2016-01-31 | 2015-10-31 | 2015-07-31 | 2015-04-30 | 2015-01-31 | 2014-10-31 | 2014-07-31 | 2014-04-30 | 2014-01-31 | 2013-10-31 | 2013-07-31 | 2013-04-30 | 2013-01-31 | 2012-10-31 | 2012-07-31 | 2012-04-30 | 2012-01-31 | 2011-10-31 | 2011-07-31 | 2011-04-30 | 2011-01-31 | 2010-10-31 | 2010-07-31 | ||
|---|---|---|---|---|---|---|---|---|---|---|---|---|---|---|---|---|---|---|---|---|---|---|---|---|---|---|---|---|---|---|---|---|---|---|---|---|---|---|---|---|---|---|---|---|---|---|---|---|---|---|---|---|---|---|---|---|
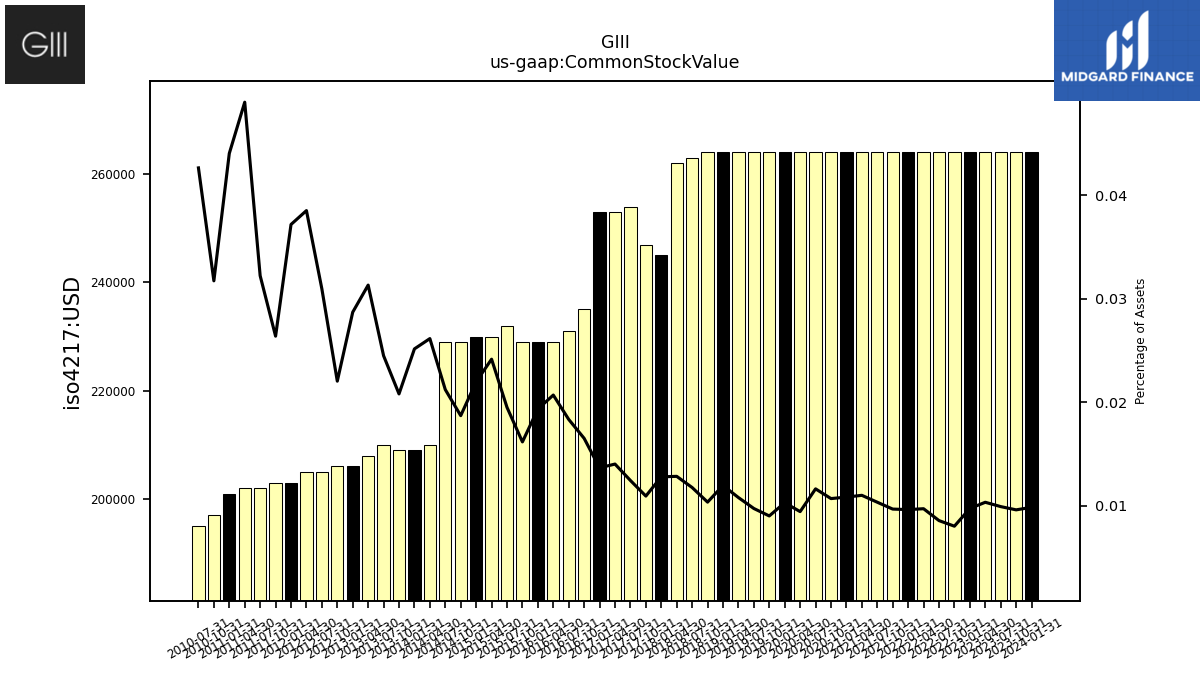
| Common Stock Value | 0.26 | 0.26 | 0.26 | 0.26 | 0.26 | 0.26 | 0.26 | 0.26 | 0.26 | 0.26 | 0.26 | 0.26 | 0.26 | 0.26 | 0.26 | 0.26 | 0.26 | 0.26 | 0.26 | 0.26 | 0.26 | 0.26 | 0.26 | 0.26 | 0.24 | 0.25 | 0.25 | 0.25 | 0.25 | 0.23 | 0.23 | 0.23 | 0.23 | 0.23 | 0.23 | 0.23 | 0.23 | 0.23 | 0.23 | 0.21 | 0.21 | 0.21 | 0.21 | 0.21 | 0.21 | 0.21 | 0.20 | 0.20 | 0.20 | 0.20 | 0.20 | 0.20 | 0.20 | 0.20 | 0.20 | |
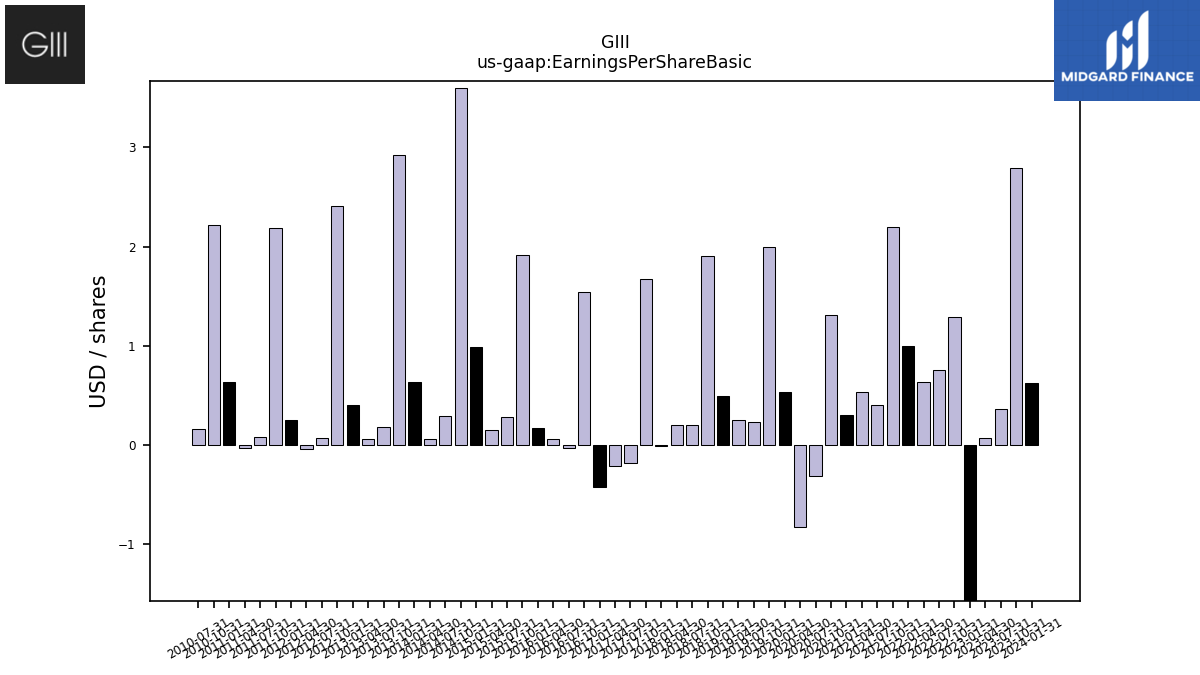
| Earnings Per Share Basic | 0.63 | 2.79 | 0.36 | 0.07 | -5.47 | 1.29 | 0.76 | 0.64 | 1.00 | 2.20 | 0.40 | 0.54 | 0.30 | 1.31 | -0.31 | -0.82 | 0.53 | 2.00 | 0.23 | 0.25 | 0.49 | 1.91 | 0.20 | 0.20 | -0.01 | 1.67 | -0.18 | -0.21 | -0.42 | 1.54 | -0.03 | 0.06 | 0.17 | 1.92 | 0.28 | 0.15 | 0.99 | 3.60 | 0.29 | 0.06 | 0.64 | 2.92 | 0.18 | 0.06 | 0.40 | 2.41 | 0.07 | -0.04 | 0.25 | 2.19 | 0.08 | -0.03 | 0.64 | 2.22 | 0.16 | |
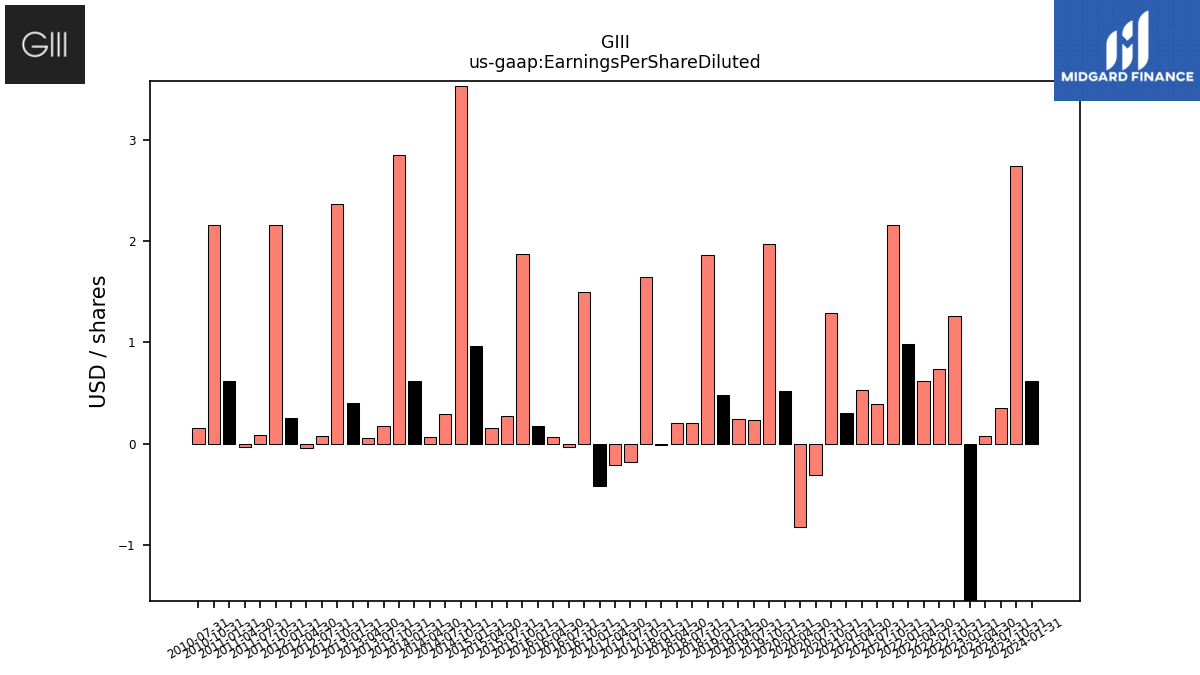
| Earnings Per Share Diluted | 0.62 | 2.74 | 0.35 | 0.07 | -5.41 | 1.26 | 0.74 | 0.62 | 0.98 | 2.16 | 0.39 | 0.53 | 0.30 | 1.29 | -0.31 | -0.82 | 0.52 | 1.97 | 0.23 | 0.24 | 0.48 | 1.86 | 0.20 | 0.20 | -0.01 | 1.65 | -0.18 | -0.21 | -0.42 | 1.50 | -0.03 | 0.06 | 0.17 | 1.87 | 0.27 | 0.15 | 0.96 | 3.53 | 0.29 | 0.06 | 0.62 | 2.85 | 0.17 | 0.05 | 0.40 | 2.37 | 0.07 | -0.04 | 0.25 | 2.16 | 0.08 | -0.03 | 0.62 | 2.16 | 0.15 |
| 2024-01-31 | 2023-10-31 | 2023-07-31 | 2023-04-30 | 2023-01-31 | 2022-10-31 | 2022-07-31 | 2022-04-30 | 2022-01-31 | 2021-10-31 | 2021-07-31 | 2021-04-30 | 2021-01-31 | 2020-10-31 | 2020-07-31 | 2020-04-30 | 2020-01-31 | 2019-10-31 | 2019-07-31 | 2019-04-30 | 2019-01-31 | 2018-10-31 | 2018-07-31 | 2018-04-30 | 2018-01-31 | 2017-10-31 | 2017-07-31 | 2017-04-30 | 2017-01-31 | 2016-10-31 | 2016-07-31 | 2016-04-30 | 2016-01-31 | 2015-10-31 | 2015-07-31 | 2015-04-30 | 2015-01-31 | 2014-10-31 | 2014-07-31 | 2014-04-30 | 2014-01-31 | 2013-10-31 | 2013-07-31 | 2013-04-30 | 2013-01-31 | 2012-10-31 | 2012-07-31 | 2012-04-30 | 2012-01-31 | 2011-10-31 | 2011-07-31 | 2011-04-30 | 2011-01-31 | 2010-10-31 | 2010-07-31 | ||
|---|---|---|---|---|---|---|---|---|---|---|---|---|---|---|---|---|---|---|---|---|---|---|---|---|---|---|---|---|---|---|---|---|---|---|---|---|---|---|---|---|---|---|---|---|---|---|---|---|---|---|---|---|---|---|---|---|
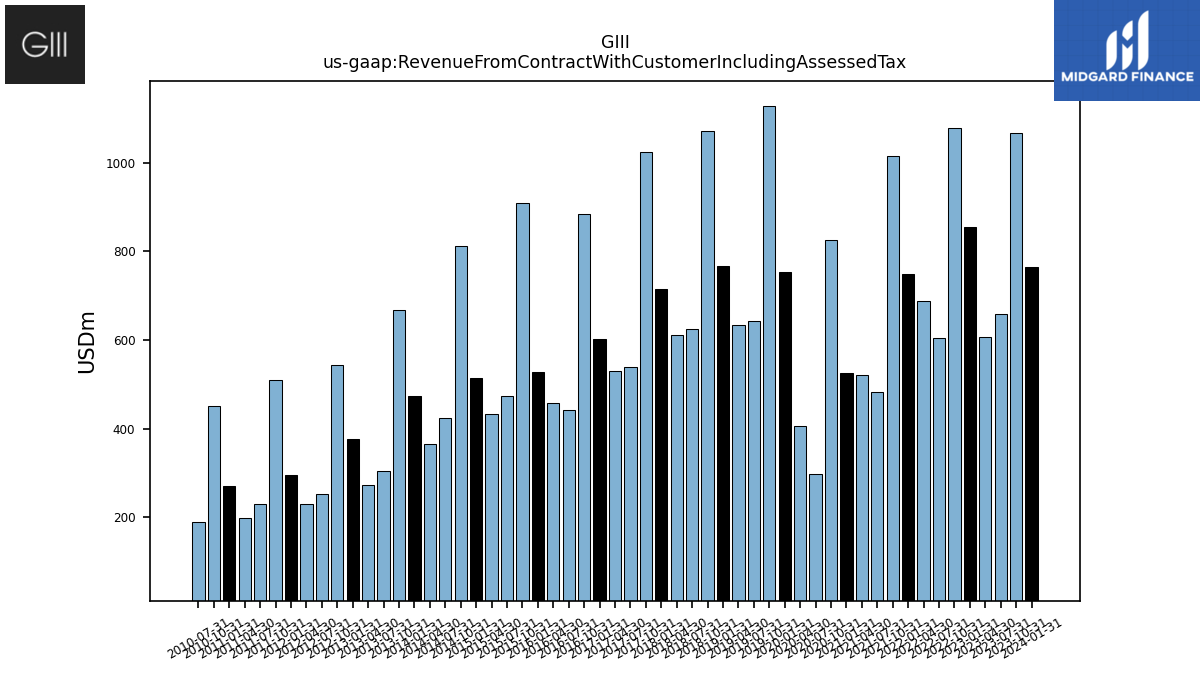
| Revenue From Contract With Customer Including Assessed Tax | 764.78 | 1067.11 | 659.76 | 606.59 | 854.43 | 1078.30 | 605.24 | 688.76 | 748.15 | 1015.39 | 483.08 | 519.91 | 526.24 | 826.56 | 297.21 | 405.13 | 754.62 | 1128.40 | 643.89 | 633.55 | 766.78 | 1072.98 | 624.70 | 611.74 | 714.90 | 1024.99 | 538.01 | 529.04 | 603.29 | 883.48 | 442.27 | 457.40 | 527.43 | 909.87 | 473.88 | 432.96 | 514.32 | 812.33 | 424.01 | 366.19 | 472.76 | 668.70 | 304.16 | 272.62 | 375.28 | 543.51 | 251.48 | 229.45 | 294.35 | 510.01 | 229.97 | 196.87 | 270.17 | 450.00 | 188.96 | |
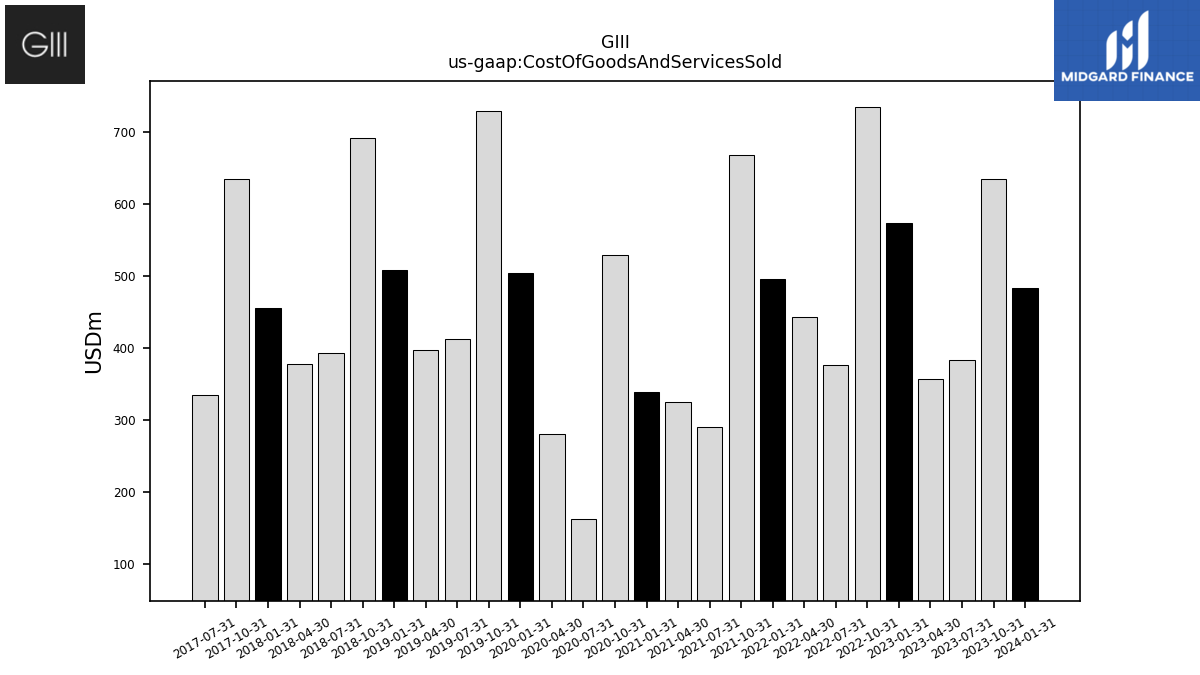
| Cost Of Goods And Services Sold | 482.80 | 633.70 | 383.11 | 356.79 | 572.88 | 733.67 | 376.32 | 442.72 | 495.82 | 667.88 | 290.20 | 324.44 | 338.65 | 528.81 | 162.52 | 280.73 | 503.53 | 729.38 | 412.12 | 397.49 | 507.85 | 690.88 | 393.15 | 377.22 | 455.96 | 633.90 | 335.02 | NA | NA | NA | NA | NA | NA | NA | NA | NA | NA | NA | NA | NA | NA | NA | NA | NA | NA | NA | NA | NA | NA | NA | NA | NA | NA | NA | NA | |
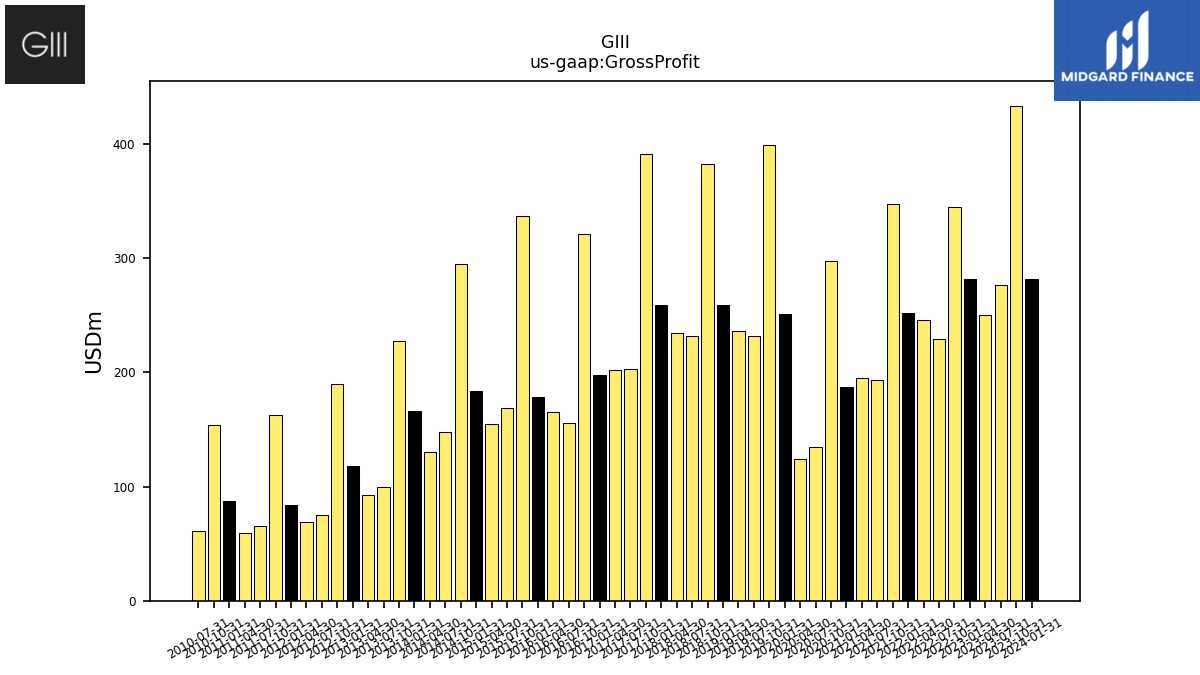
| Gross Profit | 281.98 | 433.41 | 276.65 | 249.80 | 281.55 | 344.63 | 228.93 | 246.04 | 252.33 | 347.51 | 192.88 | 195.47 | 187.59 | 297.75 | 134.69 | 124.40 | 251.09 | 399.02 | 231.77 | 236.06 | 258.94 | 382.10 | 231.54 | 234.53 | 259.29 | 390.87 | 202.89 | 201.86 | 198.10 | 321.45 | 155.64 | 165.67 | 178.81 | 337.06 | 168.34 | 154.43 | 183.49 | 295.25 | 148.06 | 130.18 | 166.52 | 227.30 | 99.42 | 92.39 | 117.90 | 190.21 | 74.84 | 68.69 | 83.42 | 162.28 | 65.57 | 59.45 | 87.31 | 153.95 | 60.75 | |
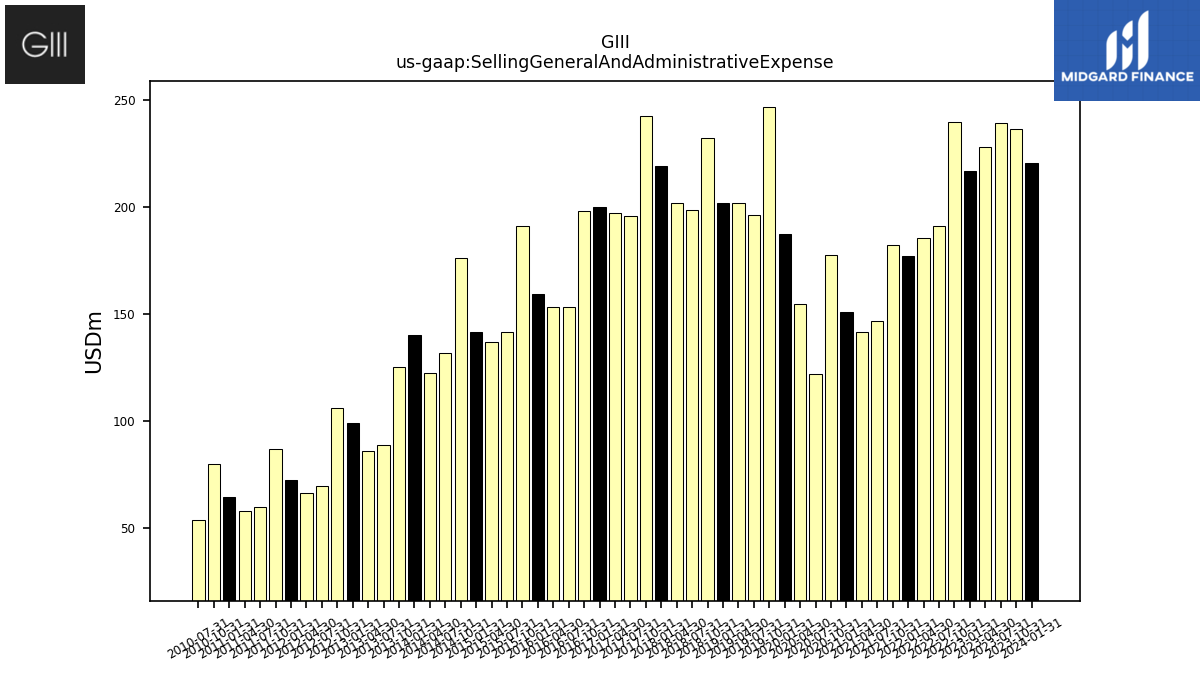
| Selling General And Administrative Expense | 220.75 | 236.31 | 239.21 | 227.96 | 216.80 | 239.89 | 191.04 | 185.41 | 177.21 | 182.36 | 146.84 | 141.60 | 150.75 | 177.62 | 122.10 | 154.62 | 187.29 | 246.58 | 196.45 | 201.86 | 201.78 | 232.05 | 198.86 | 202.07 | 219.25 | 242.74 | 195.85 | 197.41 | 199.89 | 198.27 | 153.17 | 153.10 | 159.20 | 191.04 | 141.48 | 137.03 | 141.56 | 176.38 | 131.61 | 122.44 | 140.18 | 125.46 | 89.04 | 85.83 | 98.89 | 106.29 | 69.45 | 66.61 | 72.31 | 86.96 | 59.83 | 57.92 | 64.72 | 80.14 | 53.84 | |
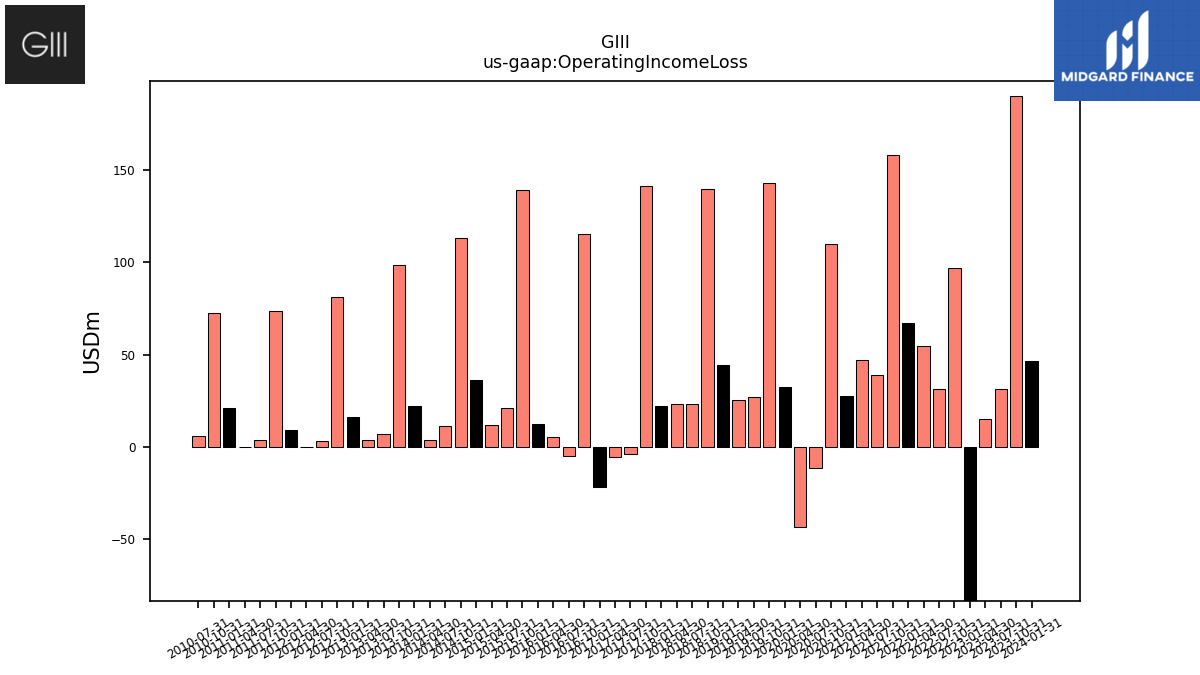
| Operating Income Loss | 46.30 | 190.29 | 31.49 | 15.26 | -292.47 | 97.21 | 31.26 | 54.54 | 67.20 | 158.13 | 38.94 | 46.82 | 27.46 | 110.06 | -11.40 | -43.27 | 32.31 | 142.86 | 26.93 | 25.56 | 44.39 | 140.01 | 23.23 | 23.08 | 21.86 | 141.22 | -3.69 | -5.39 | -21.86 | 115.14 | -5.20 | 5.37 | 12.43 | 139.40 | 20.94 | 11.71 | 36.33 | 113.28 | 11.49 | 3.51 | 22.19 | 98.69 | 7.13 | 3.44 | 16.07 | 81.11 | 3.29 | 0.02 | 8.88 | 73.44 | 3.89 | 0.01 | 20.93 | 72.30 | 5.63 | |
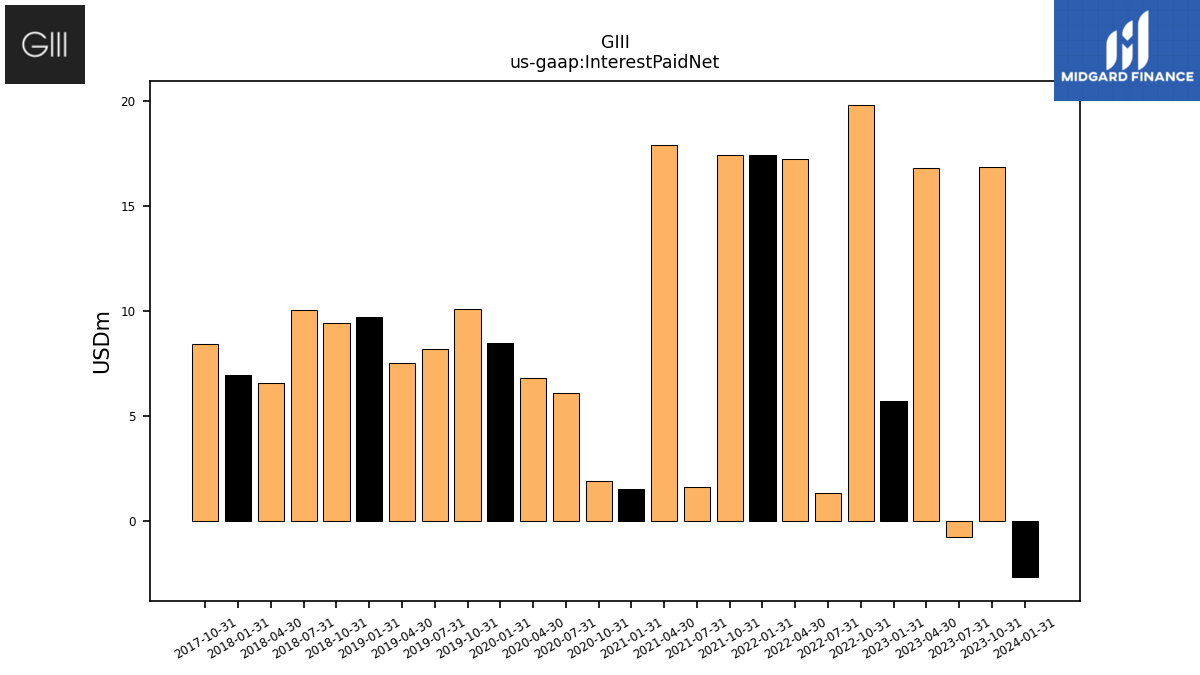
| Interest Paid Net | -2.65 | 16.83 | -0.73 | 16.78 | 5.72 | 19.82 | 1.34 | 17.24 | 17.44 | 17.41 | 1.64 | 17.90 | 1.55 | 1.93 | 6.10 | 6.84 | 8.49 | 10.09 | 8.19 | 7.54 | 9.74 | 9.42 | 10.07 | 6.58 | 6.98 | 8.44 | NA | NA | NA | NA | NA | NA | NA | NA | NA | NA | NA | NA | NA | NA | NA | NA | NA | NA | NA | NA | NA | NA | NA | NA | NA | NA | NA | NA | NA | |
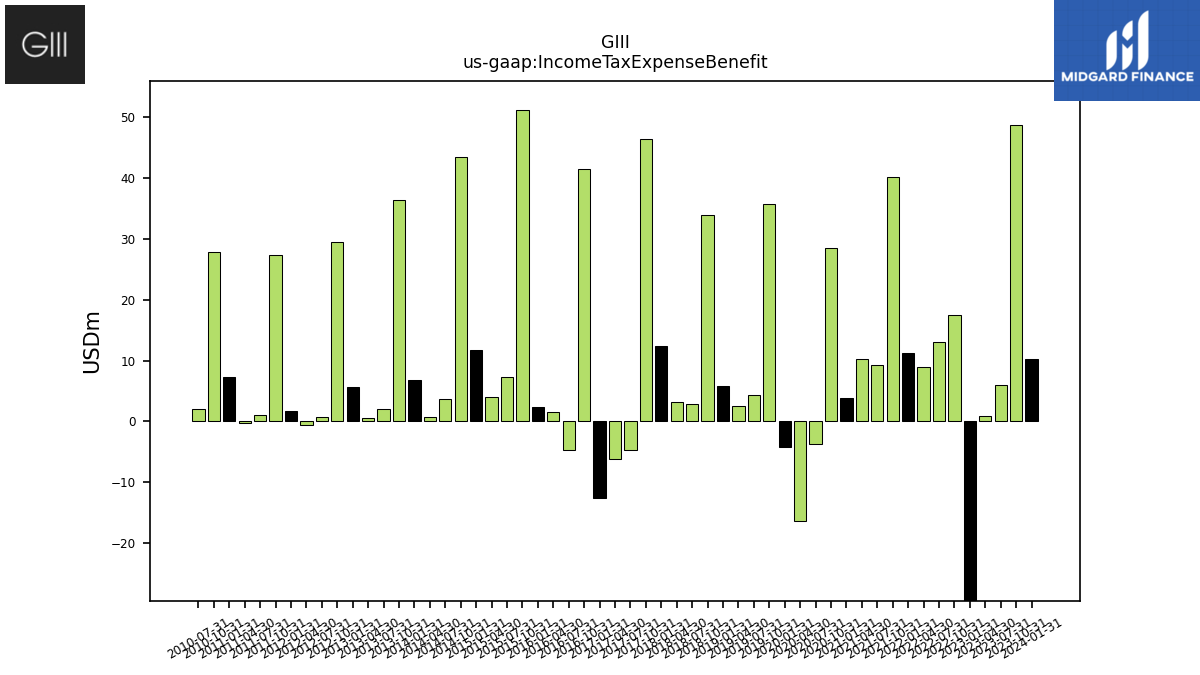
| Income Tax Expense Benefit | 10.21 | 48.76 | 5.95 | 0.94 | -43.28 | 17.52 | 12.97 | 9.00 | 11.18 | 40.20 | 9.23 | 10.26 | 3.85 | 28.43 | -3.66 | -16.41 | -4.19 | 35.63 | 4.27 | 2.55 | 5.89 | 33.84 | 2.91 | 3.12 | 12.47 | 46.32 | -4.76 | -6.10 | -12.63 | 41.44 | -4.61 | 1.63 | 2.33 | 51.19 | 7.31 | 3.97 | 11.69 | 43.47 | 3.62 | 0.67 | 6.77 | 36.38 | 2.04 | 0.63 | 5.61 | 29.55 | 0.80 | -0.52 | 1.70 | 27.25 | 1.00 | -0.33 | 7.27 | 27.87 | 2.00 | |
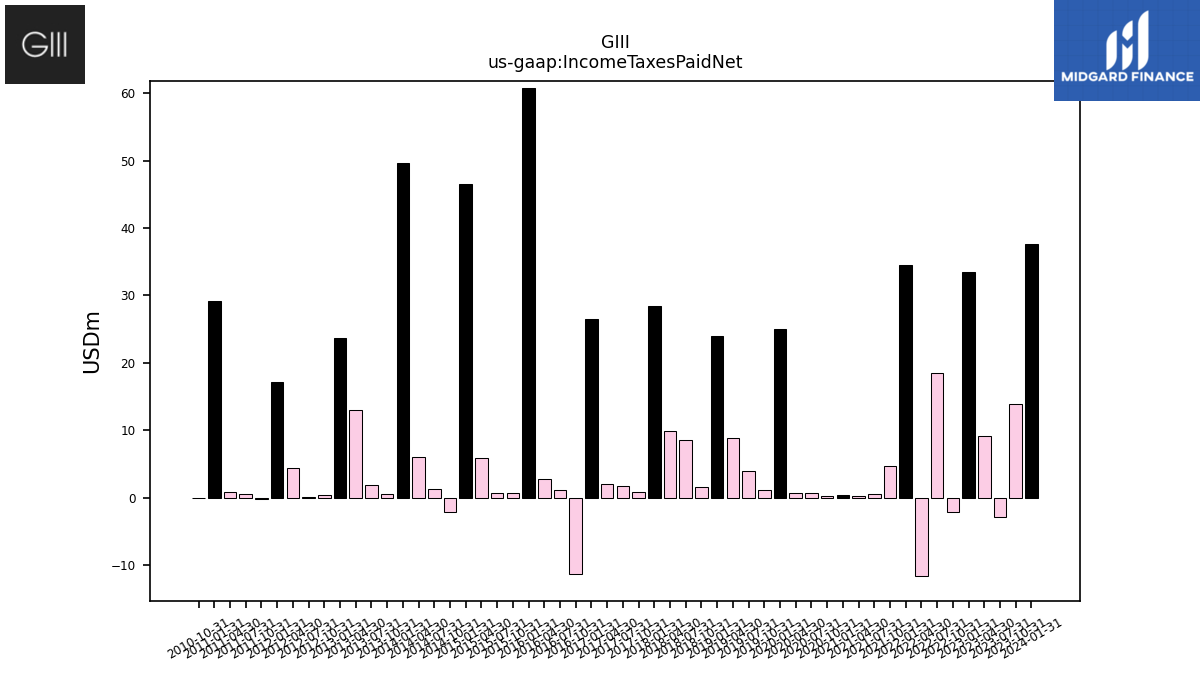
| Income Taxes Paid Net | 37.66 | 13.92 | -2.90 | 9.18 | 33.43 | -2.09 | 18.43 | -11.69 | 34.45 | 4.69 | 0.49 | 0.19 | 0.34 | 0.24 | 0.73 | 0.65 | 25.05 | 1.18 | 3.95 | 8.84 | 24.00 | 1.58 | 8.54 | 9.93 | 28.37 | 0.81 | 1.77 | 1.98 | 26.45 | -11.41 | 1.10 | 2.77 | 60.86 | 0.70 | 0.70 | 5.80 | 46.48 | -2.13 | 1.22 | 6.05 | 49.63 | 0.57 | 1.91 | 12.96 | 23.75 | 0.43 | 0.02 | 4.42 | 17.11 | -0.20 | 0.55 | 0.79 | 29.14 | 0.00 | NA | |
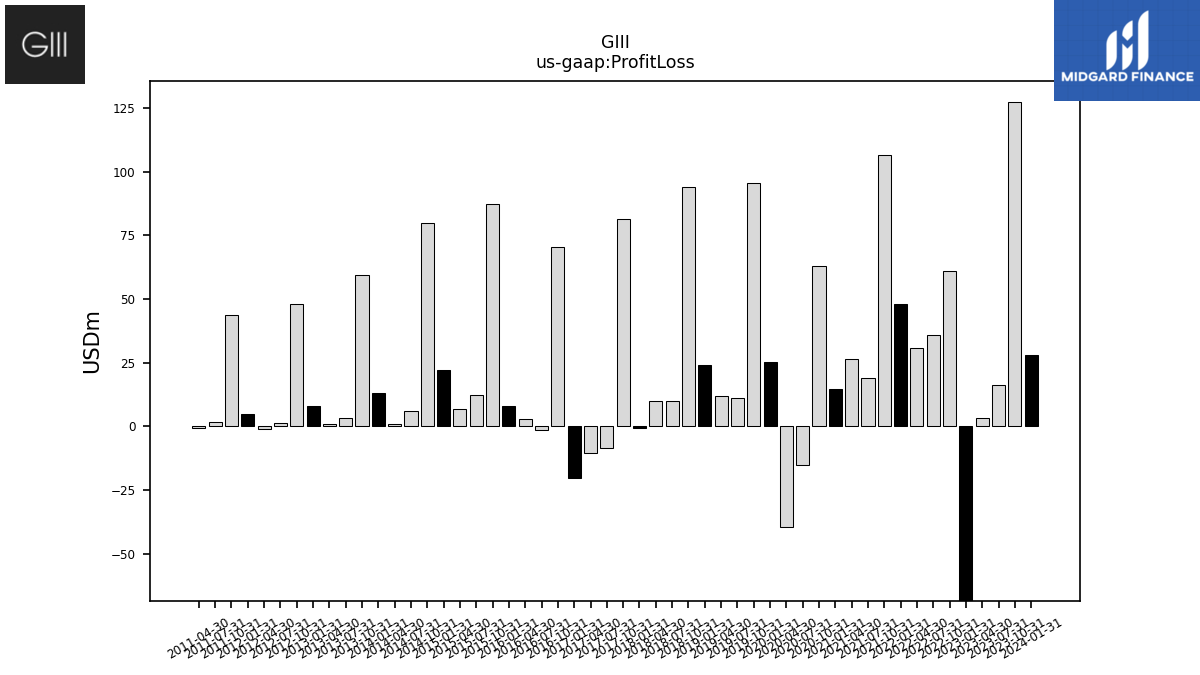
| Profit Loss | 27.98 | 127.38 | 16.24 | 3.14 | -261.92 | 60.85 | 36.06 | 30.63 | 48.14 | 106.47 | 19.11 | 26.38 | 14.62 | 63.17 | -14.98 | -39.30 | 25.29 | 95.39 | 11.12 | 12.04 | 24.08 | 94.03 | 10.08 | 9.88 | -0.54 | 81.62 | -8.57 | -10.39 | -20.10 | 70.56 | -1.29 | 2.77 | 7.96 | 87.16 | 12.45 | 6.76 | 22.22 | 79.77 | 5.91 | 1.09 | 13.05 | 59.36 | 3.34 | 1.03 | 8.07 | 48.21 | 1.36 | -0.85 | 5.02 | 43.55 | 1.56 | -0.52 | NA | NA | NA | |
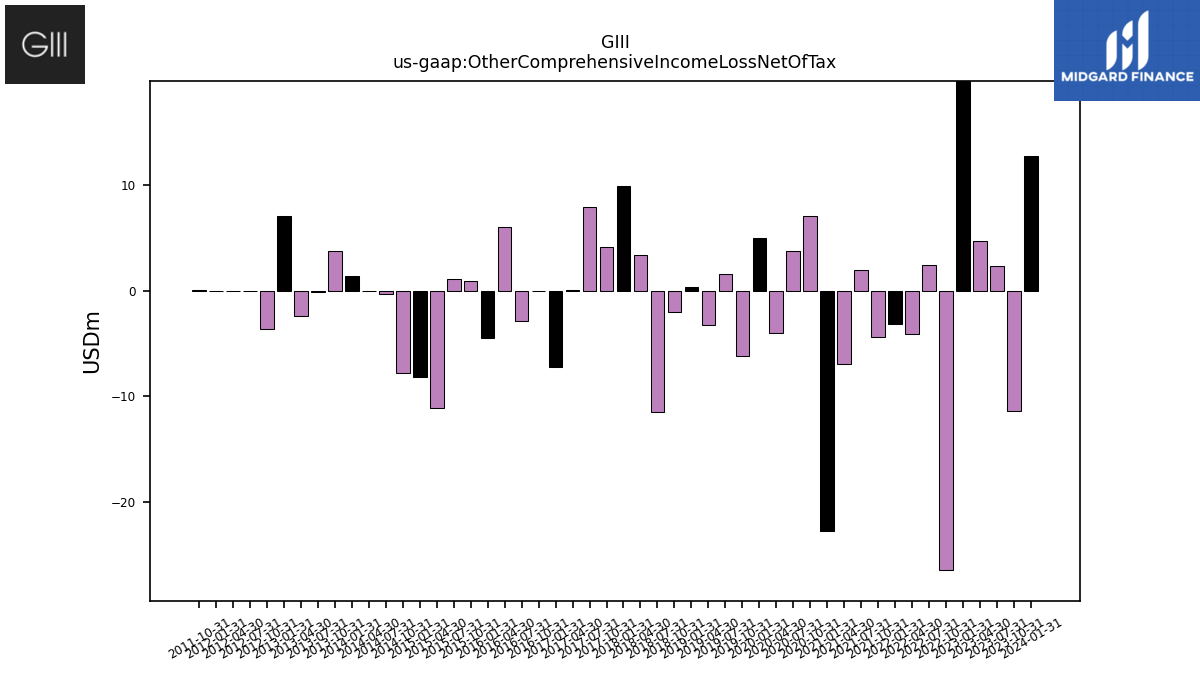
| Other Comprehensive Income Loss Net Of Tax | 12.78 | -11.39 | 2.36 | 4.71 | 31.08 | -26.47 | 2.49 | -4.13 | -3.12 | -4.40 | 2.02 | -6.96 | -22.70 | 7.07 | 3.77 | -4.03 | 5.05 | -6.21 | 1.57 | -3.23 | 0.37 | -1.98 | -11.50 | 3.44 | 9.98 | 4.18 | 7.97 | 0.07 | -7.20 | -0.06 | -2.81 | 6.03 | -4.51 | 0.93 | 1.12 | -11.12 | -8.14 | -7.80 | -0.29 | -0.04 | 1.40 | 3.76 | -0.14 | -2.38 | 7.07 | -3.61 | -0.06 | 0.00 | -0.06 | 0.04 | NA | NA | NA | NA | NA | |
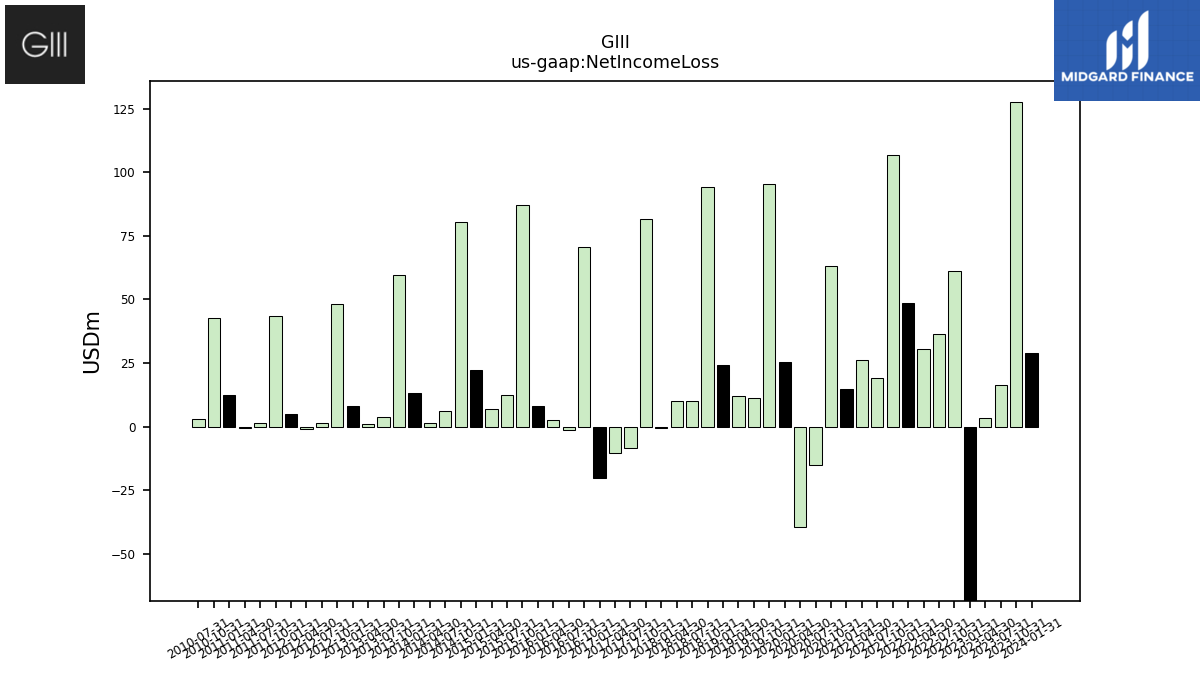
| Net Income Loss | 28.85 | 127.64 | 16.44 | 3.24 | -261.12 | 61.10 | 36.32 | 30.63 | 48.43 | 106.67 | 19.17 | 26.32 | 14.64 | 63.17 | -14.98 | -39.30 | 25.29 | 95.39 | 11.12 | 12.04 | 24.08 | 94.03 | 10.08 | 9.88 | -0.54 | 81.62 | -8.57 | -10.39 | -20.10 | 70.56 | -1.29 | 2.77 | 7.96 | 87.16 | 12.45 | 6.76 | 22.22 | 80.61 | 6.24 | 1.29 | 13.05 | 59.59 | 3.59 | 1.12 | 8.07 | 48.29 | 1.31 | -0.85 | 5.02 | 43.55 | 1.56 | -0.52 | 12.33 | 42.72 | 3.00 | |
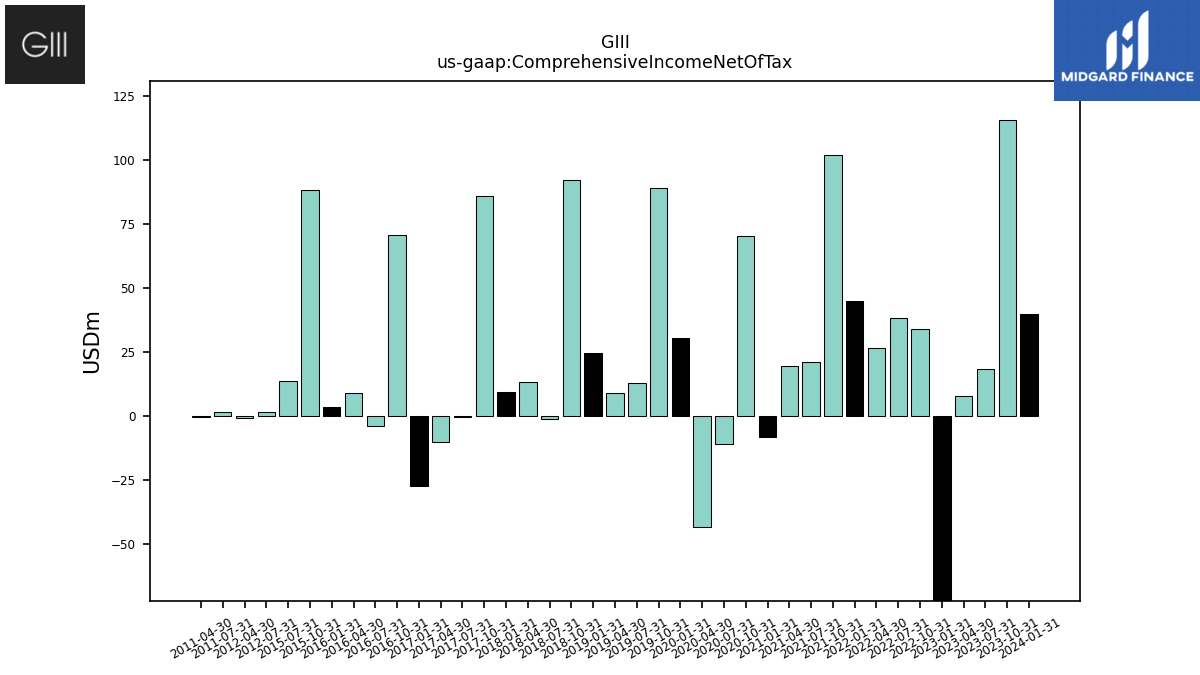
| Comprehensive Income Net Of Tax | 39.90 | 115.73 | 18.37 | 7.76 | -231.63 | 34.07 | 38.24 | 26.49 | 44.76 | 101.87 | 21.07 | 19.47 | -8.13 | 70.24 | -11.20 | -43.32 | 30.34 | 89.17 | 12.69 | 8.82 | 24.45 | 92.05 | -1.42 | 13.32 | 9.44 | 85.81 | -0.59 | -10.32 | -27.30 | 70.50 | -4.10 | 8.80 | 3.46 | 88.08 | 13.57 | NA | NA | NA | NA | NA | NA | NA | NA | NA | NA | NA | 1.30 | -0.84 | NA | NA | 1.55 | -0.54 | NA | NA | NA |
| 2024-01-31 | 2023-10-31 | 2023-07-31 | 2023-04-30 | 2023-01-31 | 2022-10-31 | 2022-07-31 | 2022-04-30 | 2022-01-31 | 2021-10-31 | 2021-07-31 | 2021-04-30 | 2021-01-31 | 2020-10-31 | 2020-07-31 | 2020-04-30 | 2020-01-31 | 2019-10-31 | 2019-07-31 | 2019-04-30 | 2019-01-31 | 2018-10-31 | 2018-07-31 | 2018-04-30 | 2018-01-31 | 2017-10-31 | 2017-07-31 | 2017-04-30 | 2017-01-31 | 2016-10-31 | 2016-07-31 | 2016-04-30 | 2016-01-31 | 2015-10-31 | 2015-07-31 | 2015-04-30 | 2015-01-31 | 2014-10-31 | 2014-07-31 | 2014-04-30 | 2014-01-31 | 2013-10-31 | 2013-07-31 | 2013-04-30 | 2013-01-31 | 2012-10-31 | 2012-07-31 | 2012-04-30 | 2012-01-31 | 2011-10-31 | 2011-07-31 | 2011-04-30 | 2011-01-31 | 2010-10-31 | 2010-07-31 | ||
|---|---|---|---|---|---|---|---|---|---|---|---|---|---|---|---|---|---|---|---|---|---|---|---|---|---|---|---|---|---|---|---|---|---|---|---|---|---|---|---|---|---|---|---|---|---|---|---|---|---|---|---|---|---|---|---|---|
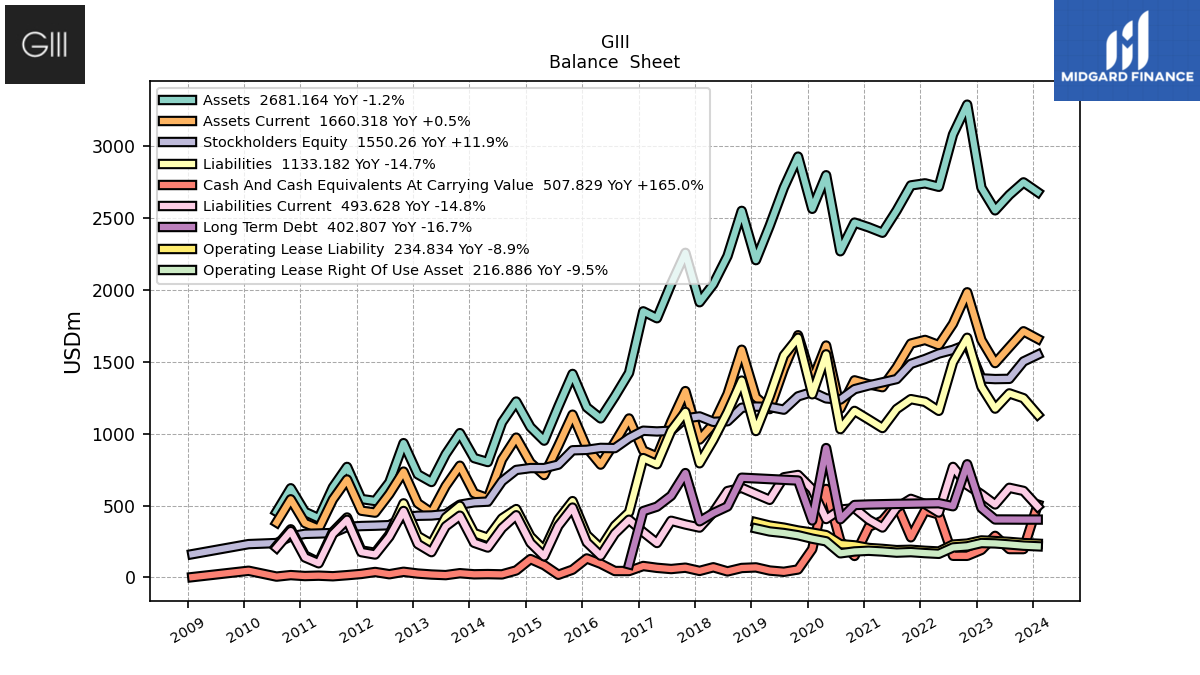
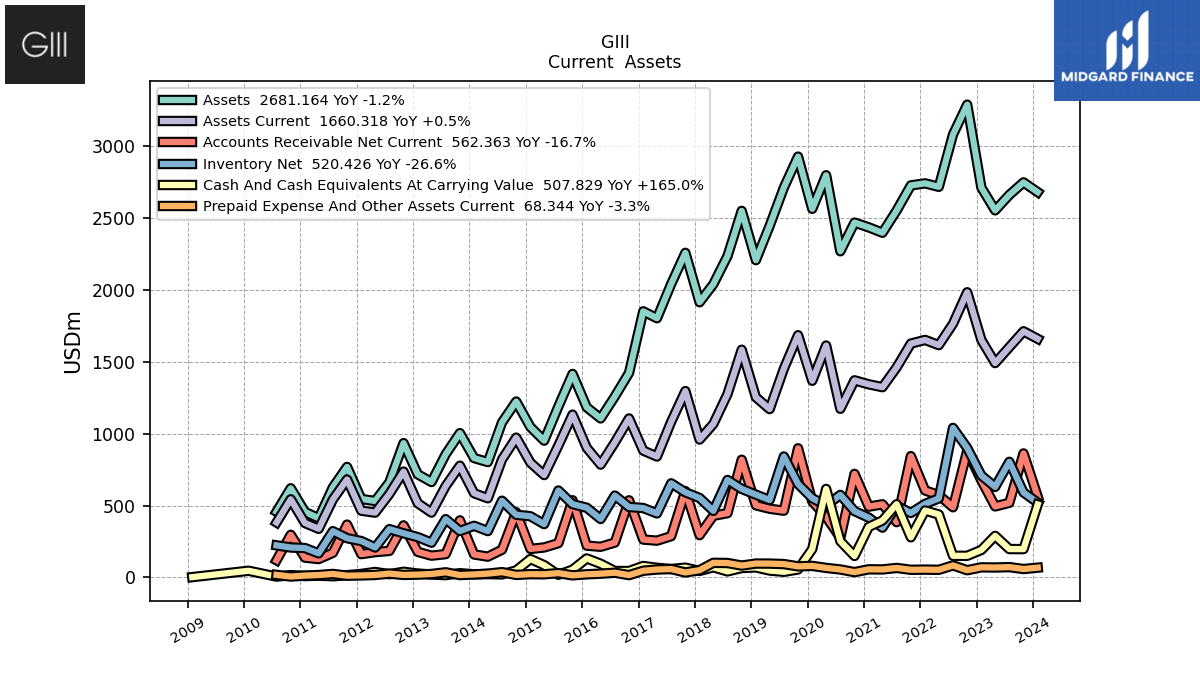
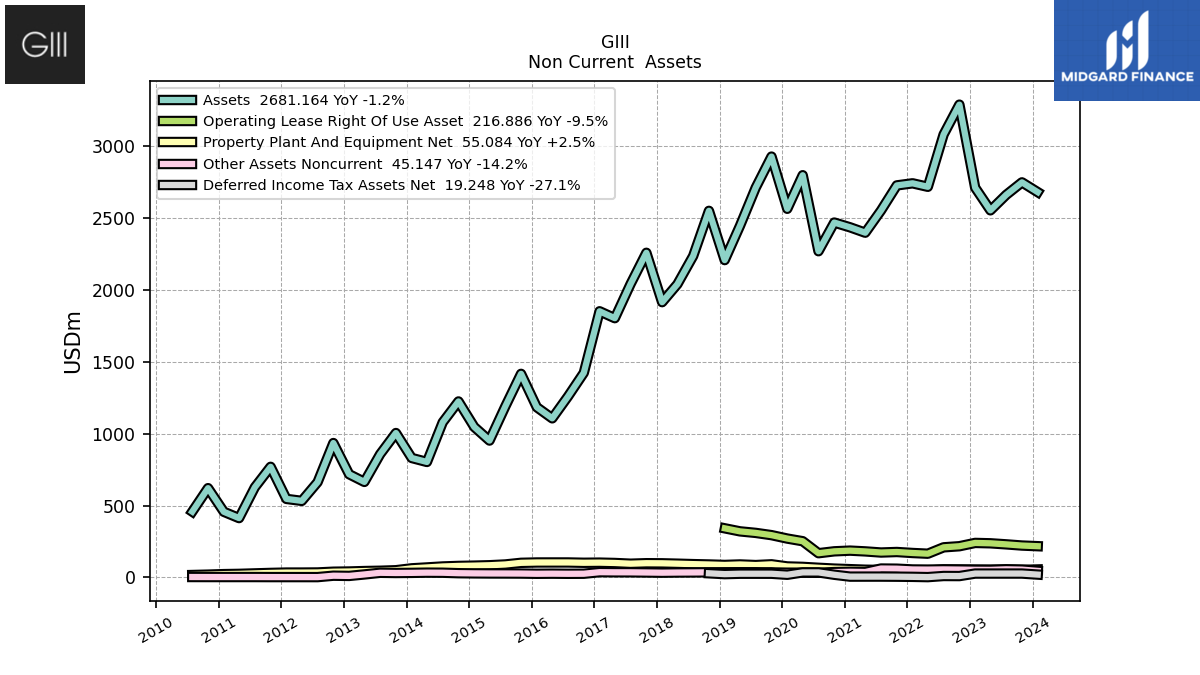
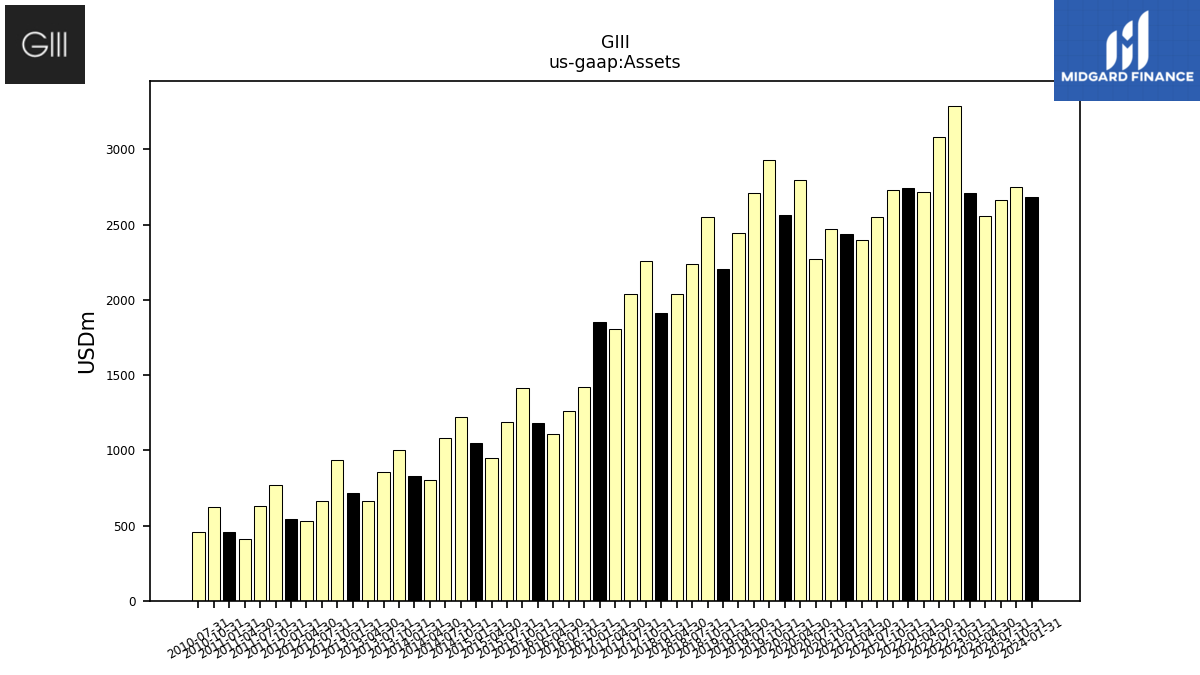
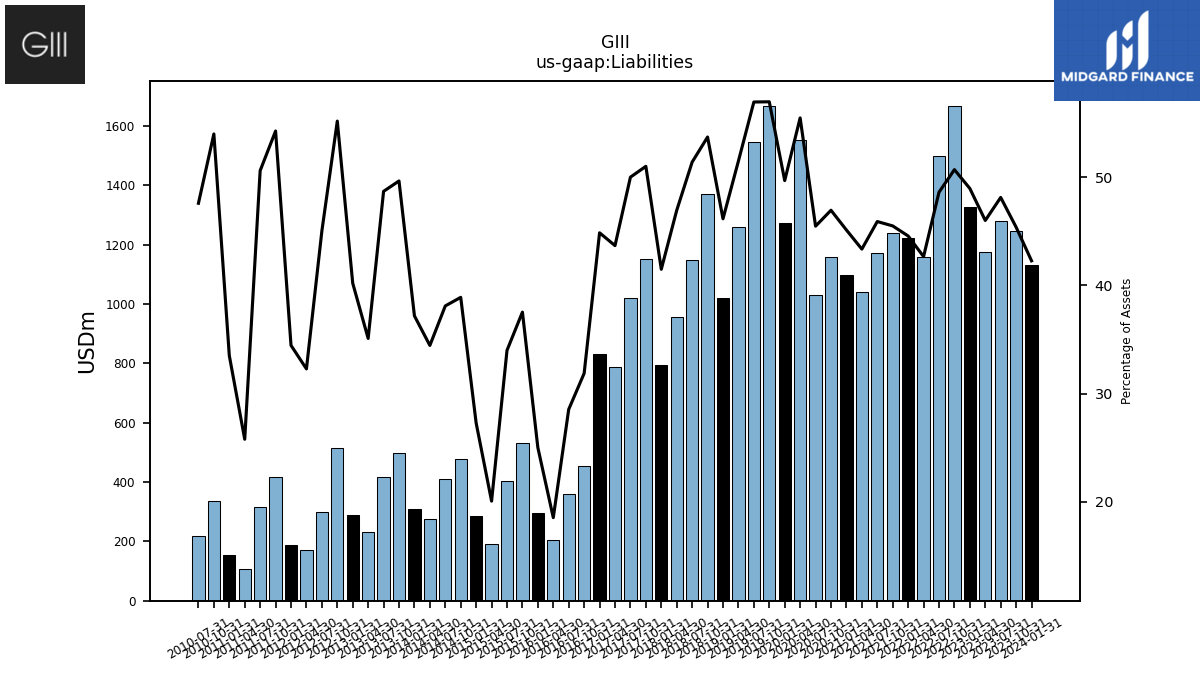
| Assets | 2681.16 | 2749.33 | 2662.05 | 2554.48 | 2712.41 | 3290.22 | 3082.35 | 2718.27 | 2742.53 | 2728.02 | 2553.59 | 2398.72 | 2436.39 | 2469.42 | 2269.81 | 2798.96 | 2565.14 | 2928.61 | 2712.44 | 2446.54 | 2208.06 | 2551.07 | 2236.63 | 2040.56 | 1915.18 | 2259.05 | 2042.05 | 1803.79 | 1851.94 | 1423.44 | 1259.52 | 1106.68 | 1184.07 | 1416.49 | 1189.48 | 952.05 | 1046.72 | 1224.40 | 1079.17 | 803.13 | 830.90 | 1004.60 | 857.36 | 664.23 | 717.77 | 934.88 | 662.34 | 532.27 | 546.10 | 769.46 | 626.88 | 412.36 | 456.40 | 620.91 | 457.33 | |
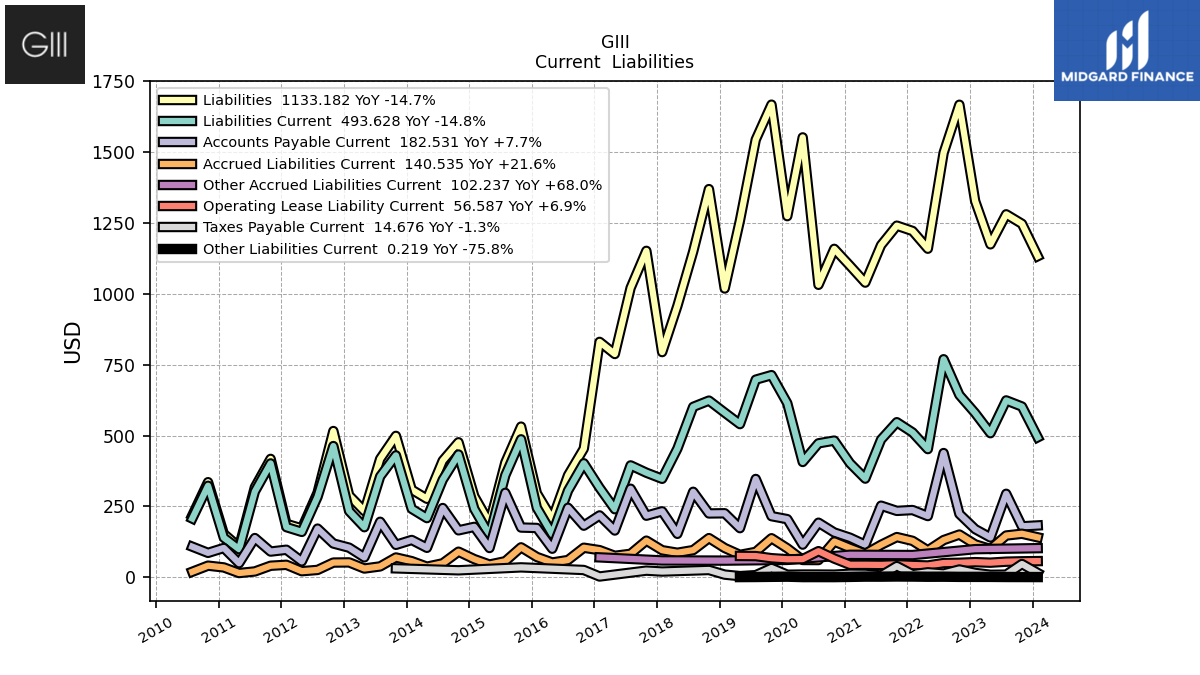
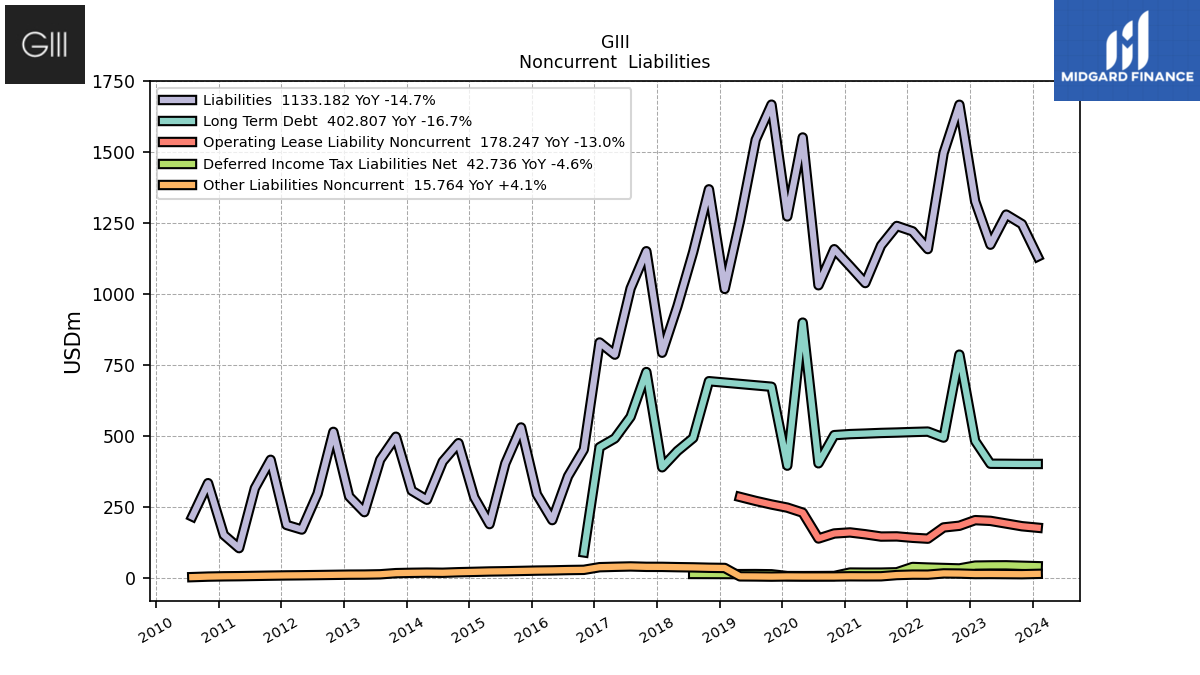
| Liabilities | 1133.18 | 1247.52 | 1281.08 | 1174.98 | 1327.81 | 1667.92 | 1498.14 | 1159.52 | 1222.14 | 1241.02 | 1172.01 | 1039.82 | 1099.18 | 1159.15 | 1032.07 | 1552.73 | 1274.46 | 1668.31 | 1544.62 | 1259.72 | 1019.05 | 1370.11 | 1149.42 | 957.64 | 794.49 | 1152.12 | 1021.02 | 787.73 | 830.71 | 453.54 | 359.42 | 205.03 | 295.94 | 531.50 | 404.30 | 190.90 | 285.46 | 476.16 | 411.11 | 276.63 | 308.90 | 498.76 | 417.42 | 233.07 | 288.53 | 515.88 | 298.17 | 171.80 | 188.13 | 417.54 | 317.20 | 106.27 | 152.91 | 335.25 | 217.62 | |
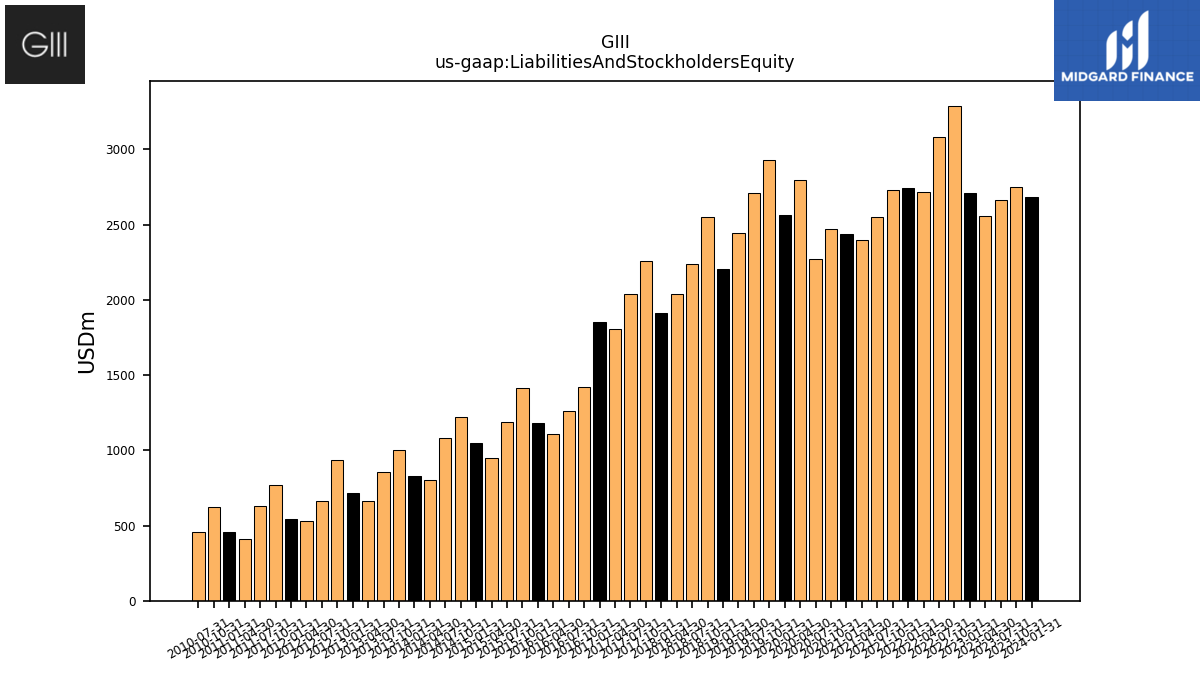
| Liabilities And Stockholders Equity | 2681.16 | 2749.33 | 2662.05 | 2554.48 | 2712.41 | 3290.22 | 3082.35 | 2718.27 | 2742.53 | 2728.02 | 2553.59 | 2398.72 | 2436.39 | 2469.42 | 2269.81 | 2798.96 | 2565.14 | 2928.61 | 2712.44 | 2446.54 | 2208.06 | 2551.07 | 2236.63 | 2040.56 | 1915.18 | 2259.05 | 2042.05 | 1803.79 | 1851.94 | 1423.44 | 1259.52 | 1106.68 | 1184.07 | 1416.49 | 1189.48 | 952.05 | 1046.72 | 1224.40 | 1079.17 | 803.13 | 830.90 | 1004.60 | 857.36 | 664.23 | 717.77 | 934.88 | 662.34 | 532.27 | 546.10 | 769.46 | 626.88 | 412.36 | 456.40 | 620.91 | 457.33 | |
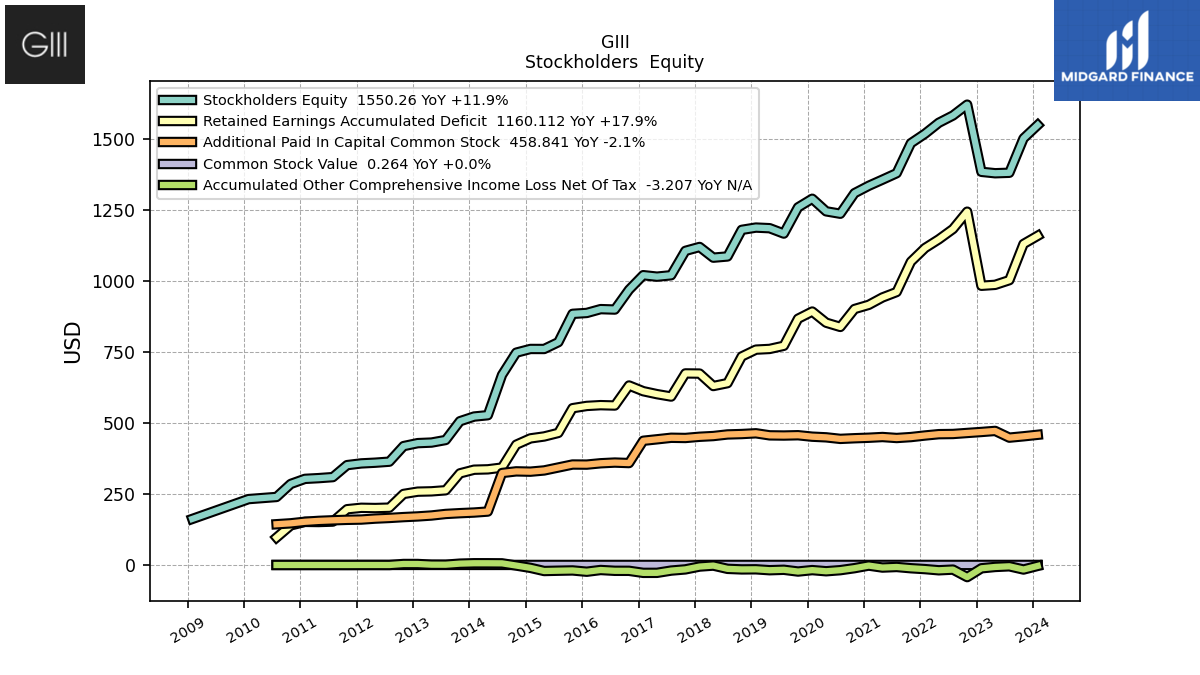
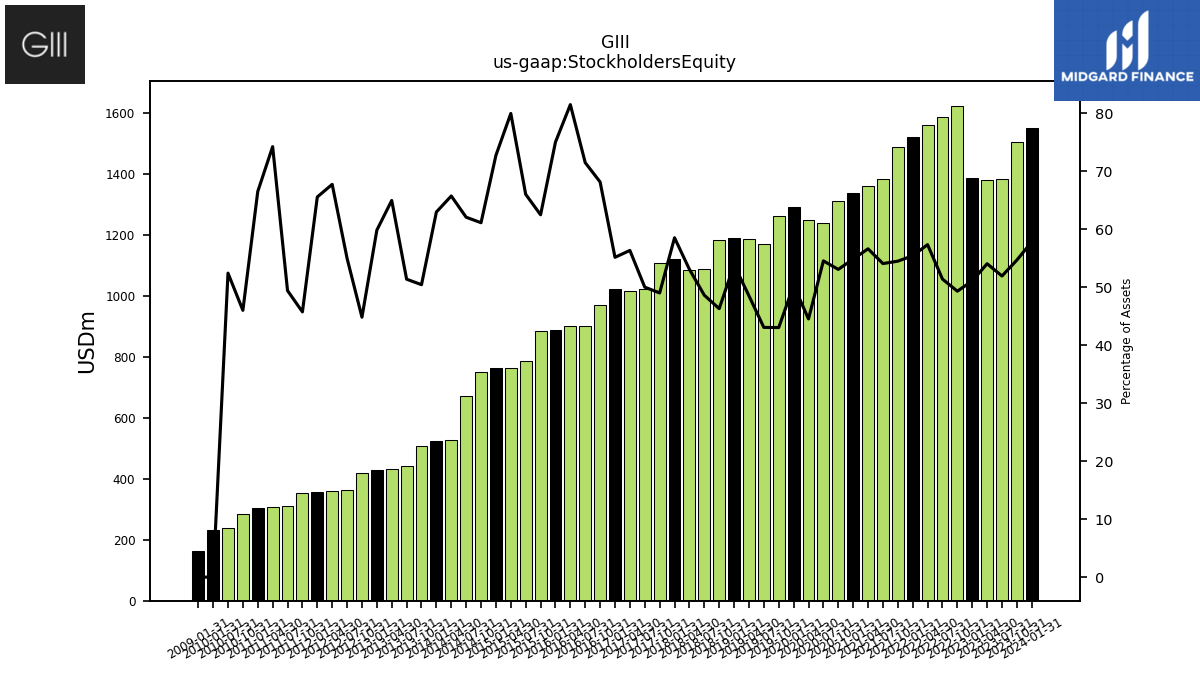
| Stockholders Equity | 1550.26 | 1503.22 | 1382.12 | 1380.45 | 1385.45 | 1622.26 | 1584.00 | 1558.29 | 1519.91 | 1486.24 | 1380.61 | 1357.88 | 1336.24 | 1310.27 | 1237.75 | 1246.23 | 1290.67 | 1260.30 | 1167.82 | 1186.83 | 1189.01 | 1180.95 | 1087.22 | 1082.92 | 1120.69 | 1106.93 | 1021.03 | 1016.06 | 1021.24 | 969.90 | 900.11 | 901.65 | 888.13 | 885.00 | 785.17 | 761.15 | 761.26 | 748.24 | 669.70 | 527.82 | 523.11 | 506.58 | 440.44 | 431.40 | 429.40 | 418.99 | 364.08 | 360.47 | 357.97 | 351.92 | 309.68 | 306.09 | 303.49 | 285.66 | 239.71 |
| 2024-01-31 | 2023-10-31 | 2023-07-31 | 2023-04-30 | 2023-01-31 | 2022-10-31 | 2022-07-31 | 2022-04-30 | 2022-01-31 | 2021-10-31 | 2021-07-31 | 2021-04-30 | 2021-01-31 | 2020-10-31 | 2020-07-31 | 2020-04-30 | 2020-01-31 | 2019-10-31 | 2019-07-31 | 2019-04-30 | 2019-01-31 | 2018-10-31 | 2018-07-31 | 2018-04-30 | 2018-01-31 | 2017-10-31 | 2017-07-31 | 2017-04-30 | 2017-01-31 | 2016-10-31 | 2016-07-31 | 2016-04-30 | 2016-01-31 | 2015-10-31 | 2015-07-31 | 2015-04-30 | 2015-01-31 | 2014-10-31 | 2014-07-31 | 2014-04-30 | 2014-01-31 | 2013-10-31 | 2013-07-31 | 2013-04-30 | 2013-01-31 | 2012-10-31 | 2012-07-31 | 2012-04-30 | 2012-01-31 | 2011-10-31 | 2011-07-31 | 2011-04-30 | 2011-01-31 | 2010-10-31 | 2010-07-31 | ||
|---|---|---|---|---|---|---|---|---|---|---|---|---|---|---|---|---|---|---|---|---|---|---|---|---|---|---|---|---|---|---|---|---|---|---|---|---|---|---|---|---|---|---|---|---|---|---|---|---|---|---|---|---|---|---|---|---|
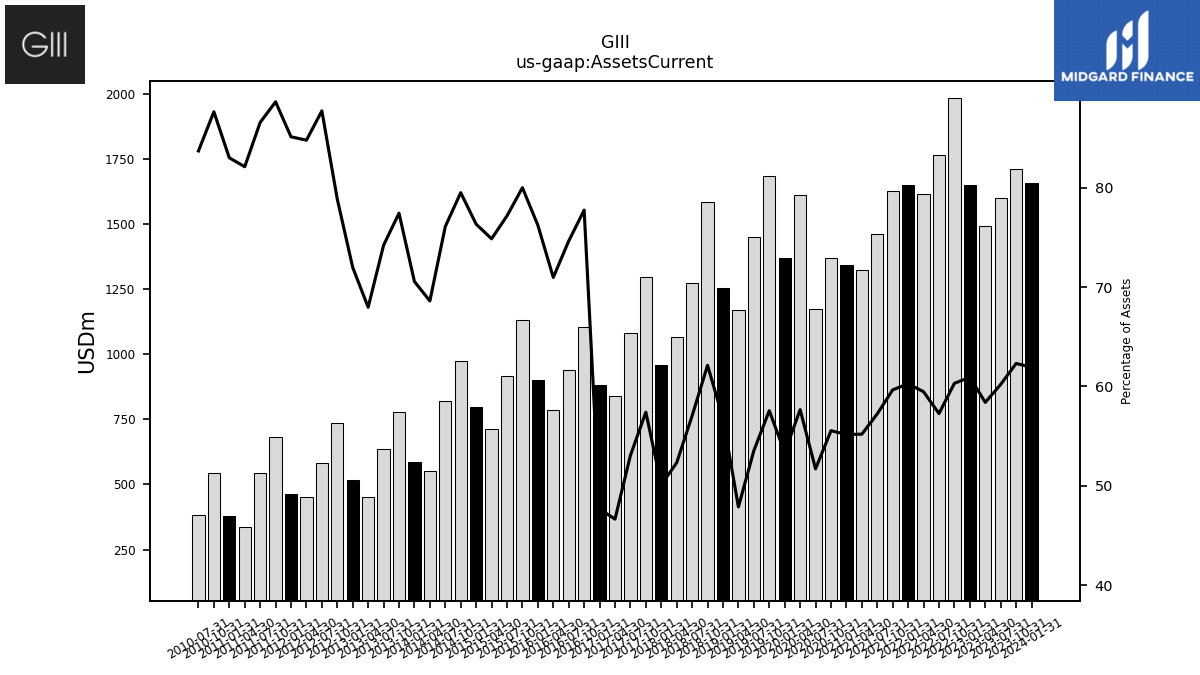
| Assets Current | 1660.32 | 1713.14 | 1602.68 | 1491.76 | 1652.50 | 1984.55 | 1765.41 | 1616.58 | 1652.86 | 1627.46 | 1461.83 | 1324.12 | 1344.04 | 1371.81 | 1173.72 | 1614.05 | 1368.69 | 1685.73 | 1452.22 | 1171.55 | 1253.89 | 1584.81 | 1276.10 | 1067.86 | 959.60 | 1297.07 | 1083.62 | 841.63 | 882.94 | 1106.52 | 939.91 | 785.36 | 902.44 | 1132.98 | 917.79 | 712.62 | 798.87 | 973.26 | 821.03 | 550.93 | 586.19 | 777.82 | 636.18 | 451.44 | 516.59 | 736.98 | 580.96 | 451.18 | 464.78 | 681.90 | 542.56 | 338.55 | 378.79 | 544.05 | 382.71 | |
| Cash And Cash Equivalents At Carrying Value | 507.83 | 197.39 | 197.74 | 289.73 | 191.65 | 150.72 | 150.98 | 438.41 | 465.98 | 279.56 | 509.99 | 396.31 | 351.93 | 149.75 | 252.80 | 616.18 | 197.37 | 55.80 | 39.57 | 48.31 | 70.14 | 66.08 | 42.31 | 71.05 | 45.78 | 68.23 | 58.78 | 67.13 | 79.96 | 45.00 | 44.95 | 95.45 | 132.59 | 54.30 | 18.81 | 85.71 | 128.35 | 49.16 | 21.53 | 23.61 | 22.09 | 29.81 | 16.45 | 20.62 | 27.36 | 39.65 | 22.65 | 38.34 | 24.66 | 16.08 | 8.57 | 12.70 | 10.04 | 16.59 | 6.15 | |
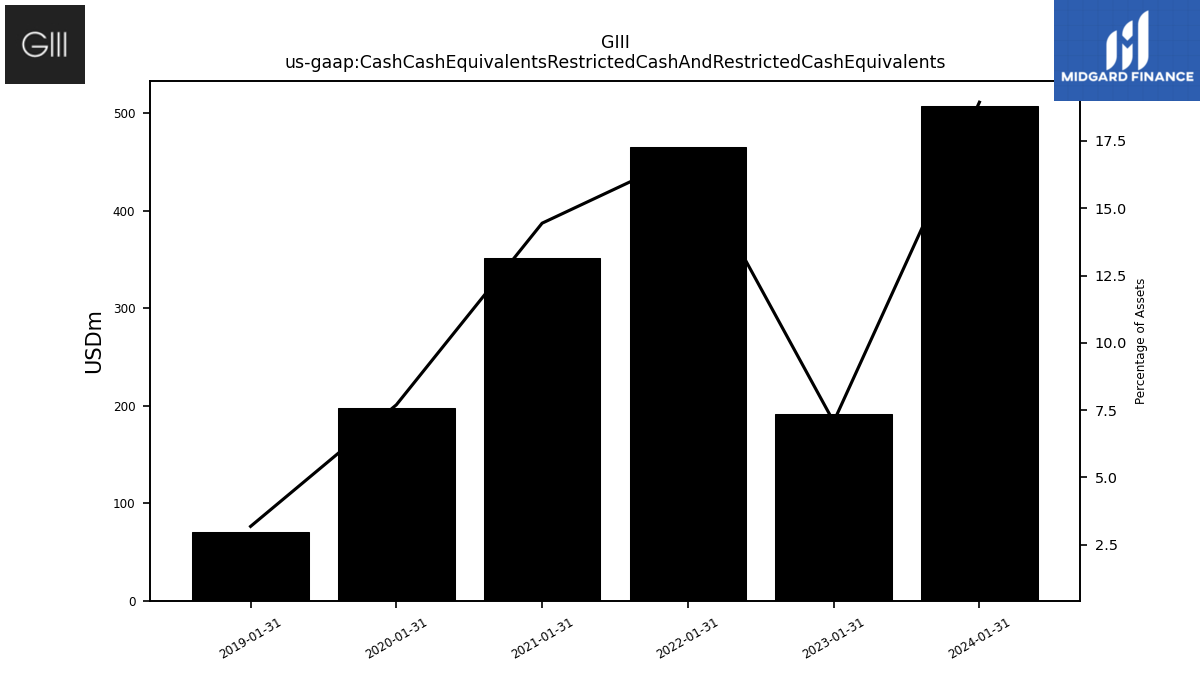
| Cash Cash Equivalents Restricted Cash And Restricted Cash Equivalents | 507.83 | NA | NA | NA | 191.65 | NA | NA | NA | 465.98 | NA | NA | NA | 351.93 | NA | NA | NA | 197.37 | NA | NA | NA | 70.14 | NA | NA | NA | NA | NA | NA | NA | NA | NA | NA | NA | NA | NA | NA | NA | NA | NA | NA | NA | NA | NA | NA | NA | NA | NA | NA | NA | NA | NA | NA | NA | NA | NA | NA | |
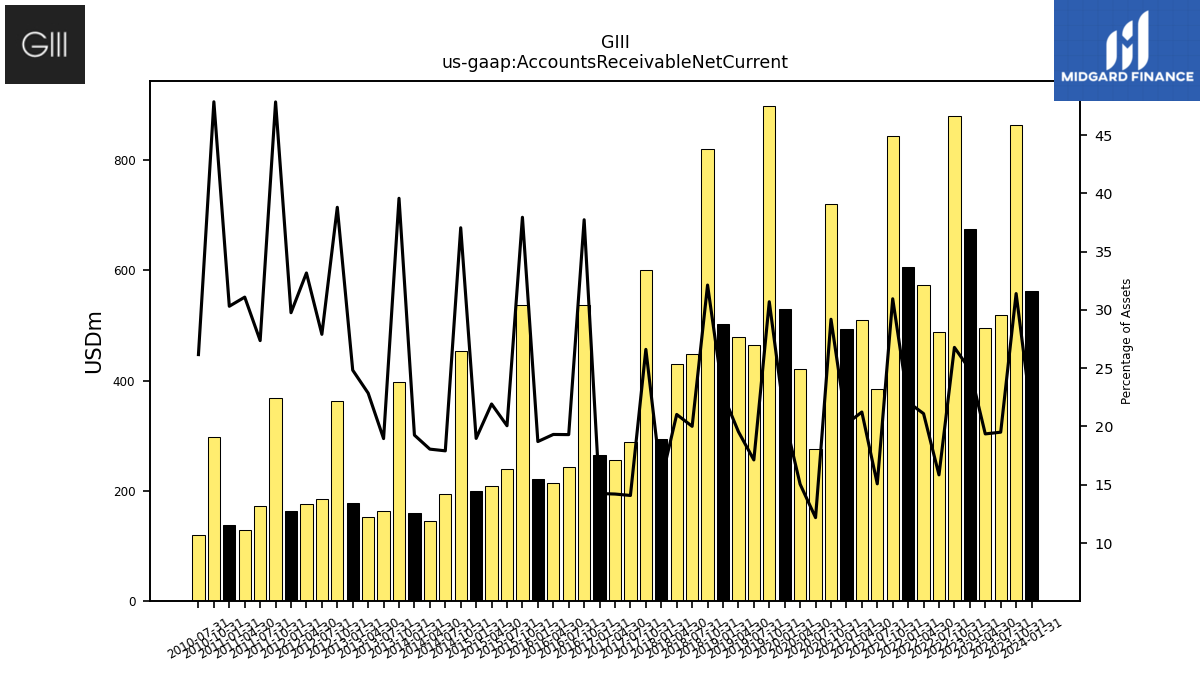
| Accounts Receivable Net Current | 562.36 | 863.22 | 519.36 | 494.60 | 674.96 | 881.13 | 488.52 | 573.61 | 605.51 | 844.38 | 385.05 | 509.43 | 492.70 | 720.98 | 276.50 | 421.14 | 530.14 | 899.03 | 464.66 | 478.37 | 502.13 | 819.64 | 447.58 | 429.15 | 294.43 | 601.18 | 287.57 | 256.21 | 263.88 | 537.07 | 243.11 | 213.75 | 221.50 | 537.46 | 238.66 | 208.77 | 198.63 | 453.57 | 193.28 | 145.01 | 160.01 | 397.55 | 162.56 | 151.84 | 178.22 | 362.72 | 184.82 | 176.53 | 162.51 | 368.09 | 171.54 | 128.22 | 138.34 | 297.10 | 119.66 | |
| Inventory Net | 520.43 | 591.53 | 804.86 | 630.31 | 709.35 | 900.99 | 1040.81 | 550.06 | 512.15 | 448.99 | 499.34 | 346.67 | 416.50 | 461.77 | 574.77 | 500.41 | 551.92 | 650.63 | 842.14 | 538.96 | 576.38 | 616.16 | 678.57 | 463.46 | 553.32 | 592.82 | 655.27 | 445.97 | 483.27 | 490.56 | 570.00 | 406.72 | 485.31 | 510.37 | 605.21 | 371.22 | 426.18 | 436.37 | 534.19 | 322.66 | 359.64 | 323.33 | 406.25 | 242.07 | 280.93 | 307.48 | 336.39 | 208.75 | 253.52 | 273.16 | 322.39 | 167.75 | 205.00 | 208.51 | 223.54 | |
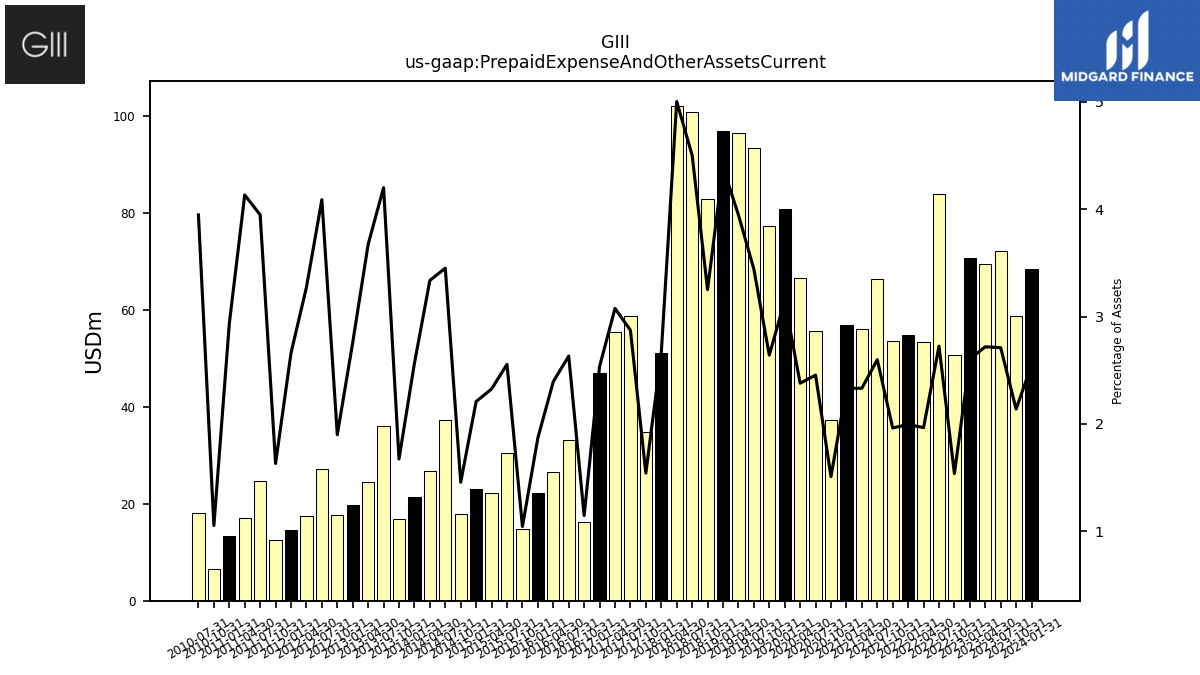
| Prepaid Expense And Other Assets Current | 68.34 | 58.78 | 72.14 | 69.43 | 70.65 | 50.59 | 83.95 | 53.42 | 54.70 | 53.53 | 66.34 | 55.95 | 56.80 | 37.27 | 55.71 | 66.59 | 80.69 | 77.33 | 93.35 | 96.55 | 96.93 | 82.93 | 100.69 | 102.07 | 51.01 | 34.84 | 58.65 | 55.47 | 46.95 | 16.33 | 33.15 | 26.50 | 22.13 | 14.80 | 30.39 | 22.14 | 23.12 | 17.83 | 37.23 | 26.80 | 21.31 | 16.81 | 36.01 | 24.39 | 19.80 | 17.76 | 27.07 | 17.42 | 14.53 | 12.56 | 24.74 | 17.04 | 13.39 | 6.54 | 18.05 |
| 2024-01-31 | 2023-10-31 | 2023-07-31 | 2023-04-30 | 2023-01-31 | 2022-10-31 | 2022-07-31 | 2022-04-30 | 2022-01-31 | 2021-10-31 | 2021-07-31 | 2021-04-30 | 2021-01-31 | 2020-10-31 | 2020-07-31 | 2020-04-30 | 2020-01-31 | 2019-10-31 | 2019-07-31 | 2019-04-30 | 2019-01-31 | 2018-10-31 | 2018-07-31 | 2018-04-30 | 2018-01-31 | 2017-10-31 | 2017-07-31 | 2017-04-30 | 2017-01-31 | 2016-10-31 | 2016-07-31 | 2016-04-30 | 2016-01-31 | 2015-10-31 | 2015-07-31 | 2015-04-30 | 2015-01-31 | 2014-10-31 | 2014-07-31 | 2014-04-30 | 2014-01-31 | 2013-10-31 | 2013-07-31 | 2013-04-30 | 2013-01-31 | 2012-10-31 | 2012-07-31 | 2012-04-30 | 2012-01-31 | 2011-10-31 | 2011-07-31 | 2011-04-30 | 2011-01-31 | 2010-10-31 | 2010-07-31 | ||
|---|---|---|---|---|---|---|---|---|---|---|---|---|---|---|---|---|---|---|---|---|---|---|---|---|---|---|---|---|---|---|---|---|---|---|---|---|---|---|---|---|---|---|---|---|---|---|---|---|---|---|---|---|---|---|---|---|
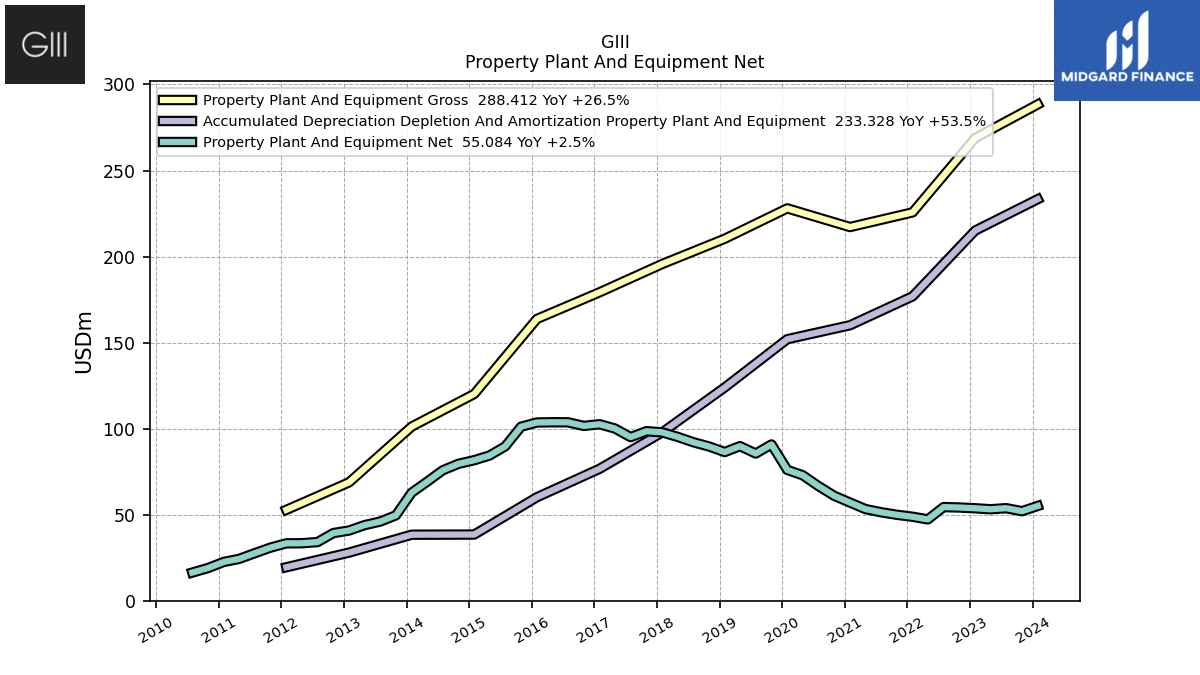
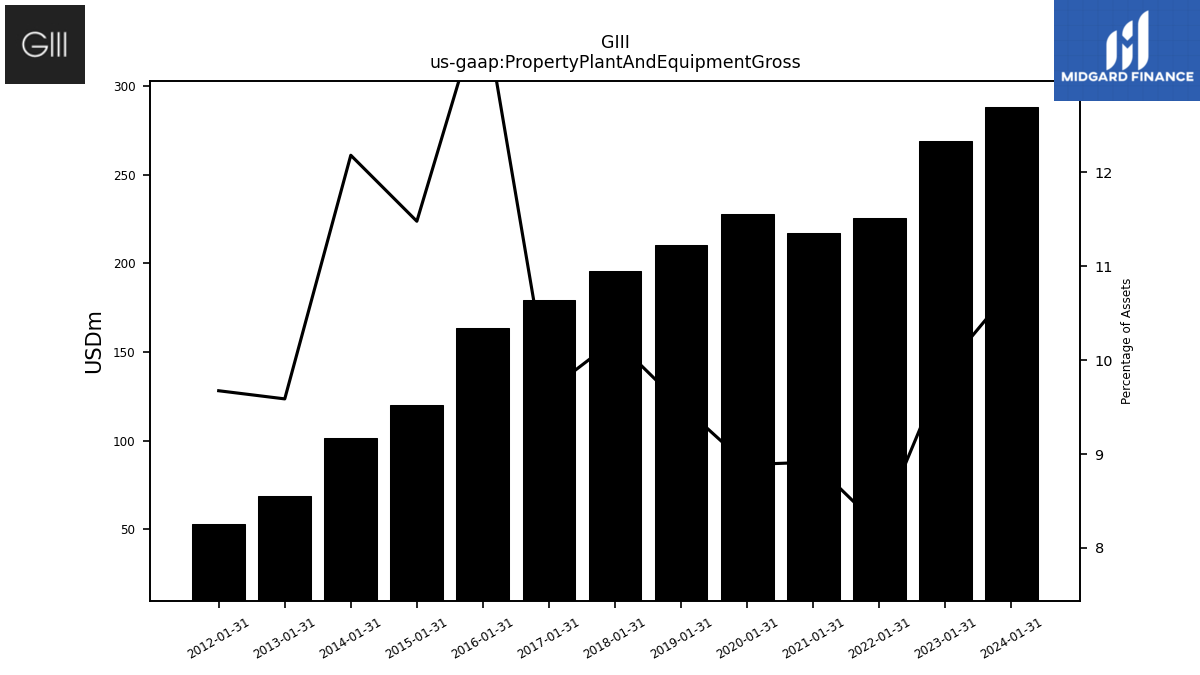
| Property Plant And Equipment Gross | 288.41 | NA | NA | NA | 268.84 | NA | NA | NA | 225.67 | NA | NA | NA | 217.15 | NA | NA | NA | 228.00 | NA | NA | NA | 210.34 | NA | NA | NA | 195.65 | NA | NA | NA | 179.23 | NA | NA | NA | 163.71 | NA | NA | NA | 120.14 | NA | NA | NA | 101.21 | NA | NA | NA | 68.81 | NA | NA | NA | 52.83 | NA | NA | NA | NA | NA | NA | |
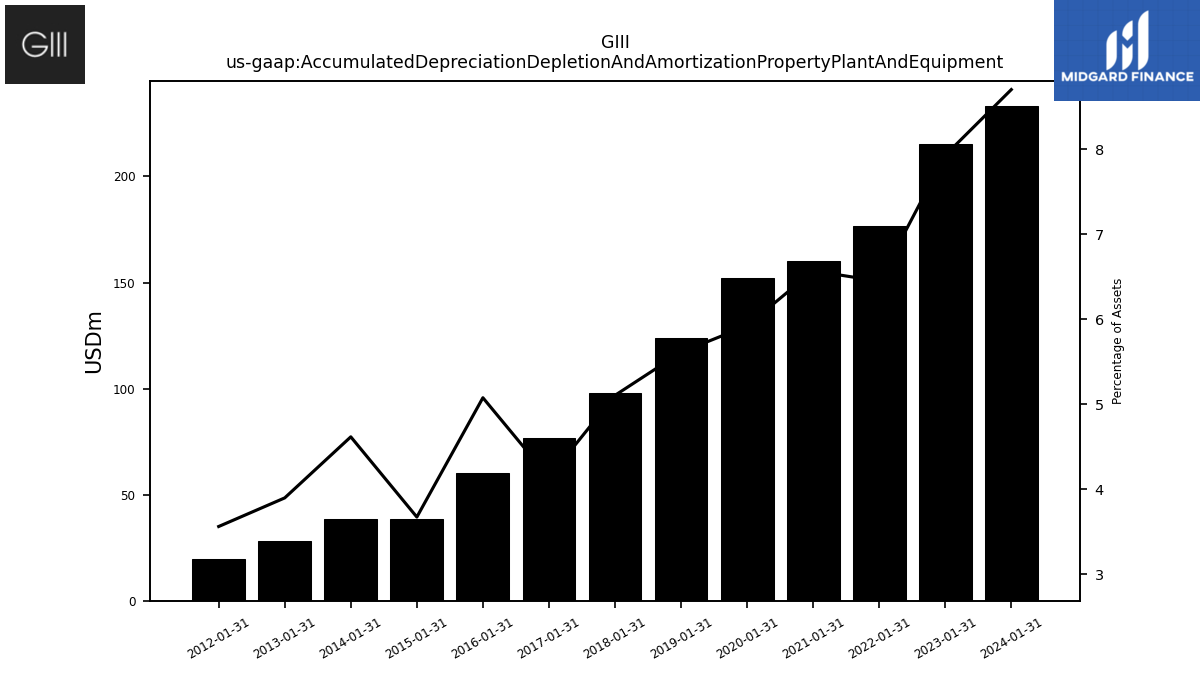
| Accumulated Depreciation Depletion And Amortization Property Plant And Equipment | 233.33 | NA | NA | NA | 215.10 | NA | NA | NA | 176.87 | NA | NA | NA | 160.09 | NA | NA | NA | 151.98 | NA | NA | NA | 123.94 | NA | NA | NA | 97.80 | NA | NA | NA | 76.66 | NA | NA | NA | 60.13 | NA | NA | NA | 38.47 | NA | NA | NA | 38.37 | NA | NA | NA | 28.00 | NA | NA | NA | 19.46 | NA | NA | NA | NA | NA | NA | |
| Property Plant And Equipment Net | 55.08 | 52.03 | 53.79 | 53.16 | 53.74 | 54.19 | 54.42 | 47.27 | 48.80 | 49.95 | 51.42 | 53.30 | 57.06 | 60.97 | 66.63 | 72.92 | 76.02 | 90.83 | 85.55 | 89.85 | 86.41 | 89.66 | 92.13 | 95.27 | 97.86 | 98.52 | 95.07 | 100.10 | 102.57 | 101.58 | 103.70 | 103.72 | 103.58 | 101.14 | 89.74 | 84.40 | 81.67 | 79.58 | 75.81 | 69.08 | 62.83 | 49.64 | 46.02 | 43.91 | 40.82 | 39.32 | 34.11 | 33.41 | 33.37 | 30.90 | 27.65 | 24.32 | 22.56 | 19.02 | 16.37 | |
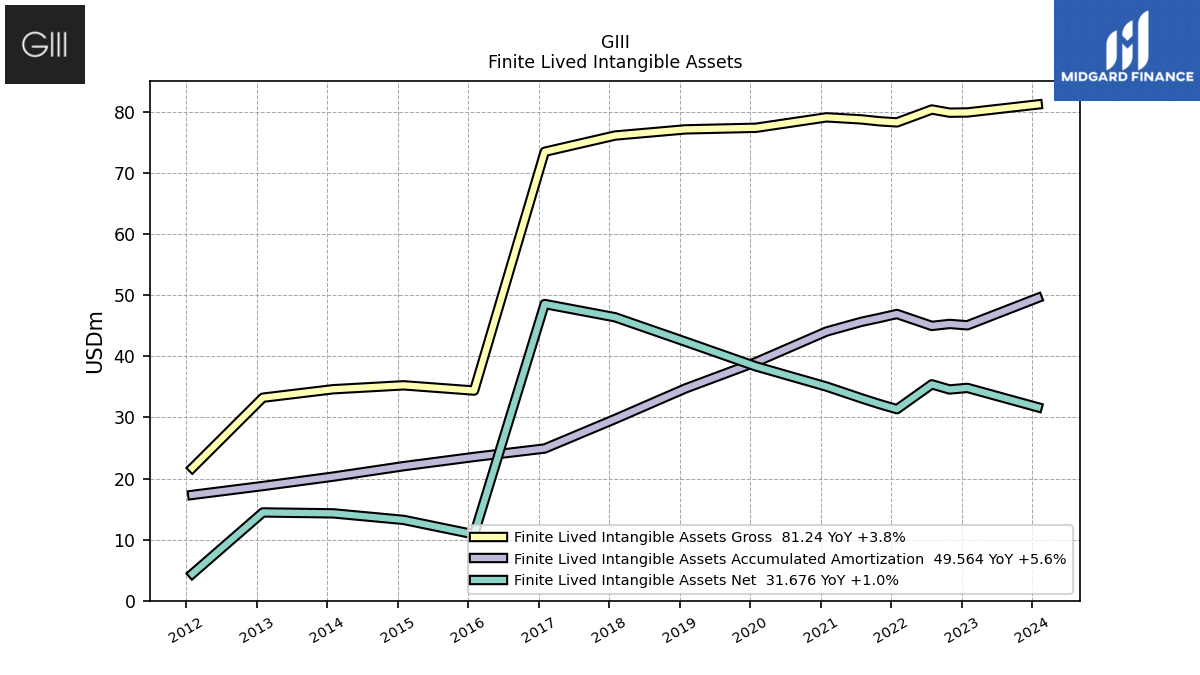
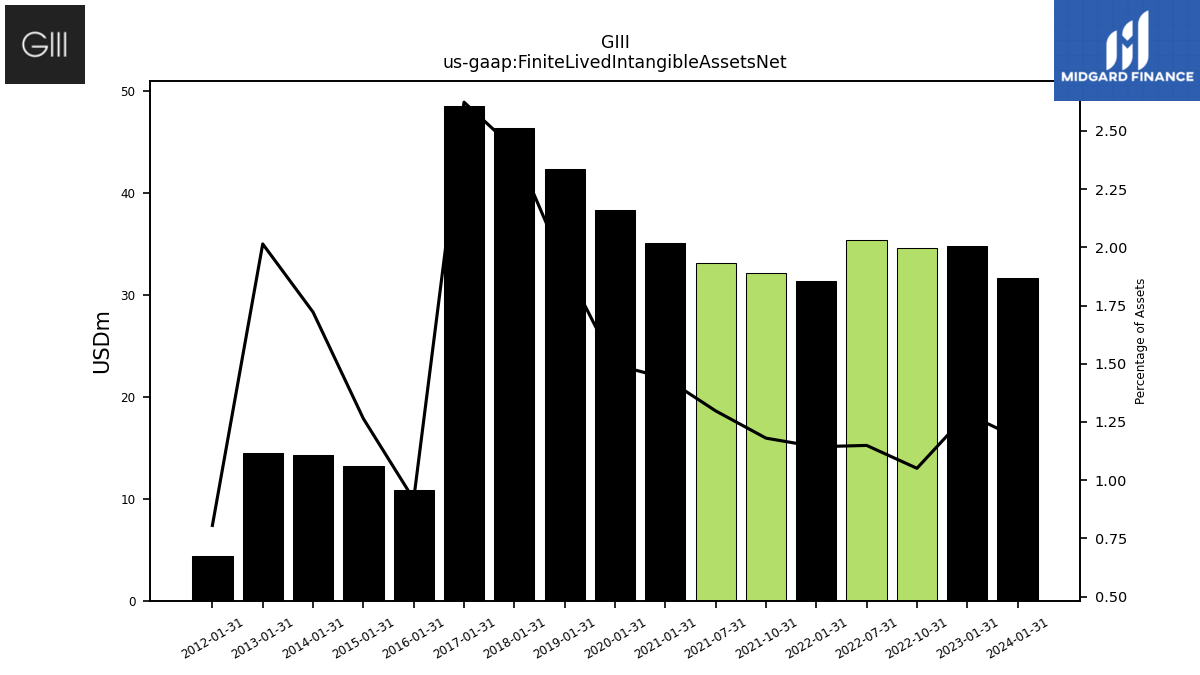
| Finite Lived Intangible Assets Net | 31.68 | NA | NA | NA | 34.84 | 34.59 | 35.43 | NA | 31.36 | 32.21 | 33.14 | NA | 35.06 | NA | NA | NA | 38.36 | NA | NA | NA | 42.40 | NA | NA | NA | 46.41 | NA | NA | NA | 48.58 | NA | NA | NA | 10.87 | NA | NA | NA | 13.23 | NA | NA | NA | 14.30 | NA | NA | NA | 14.46 | NA | NA | NA | 4.40 | NA | NA | NA | NA | NA | NA | |
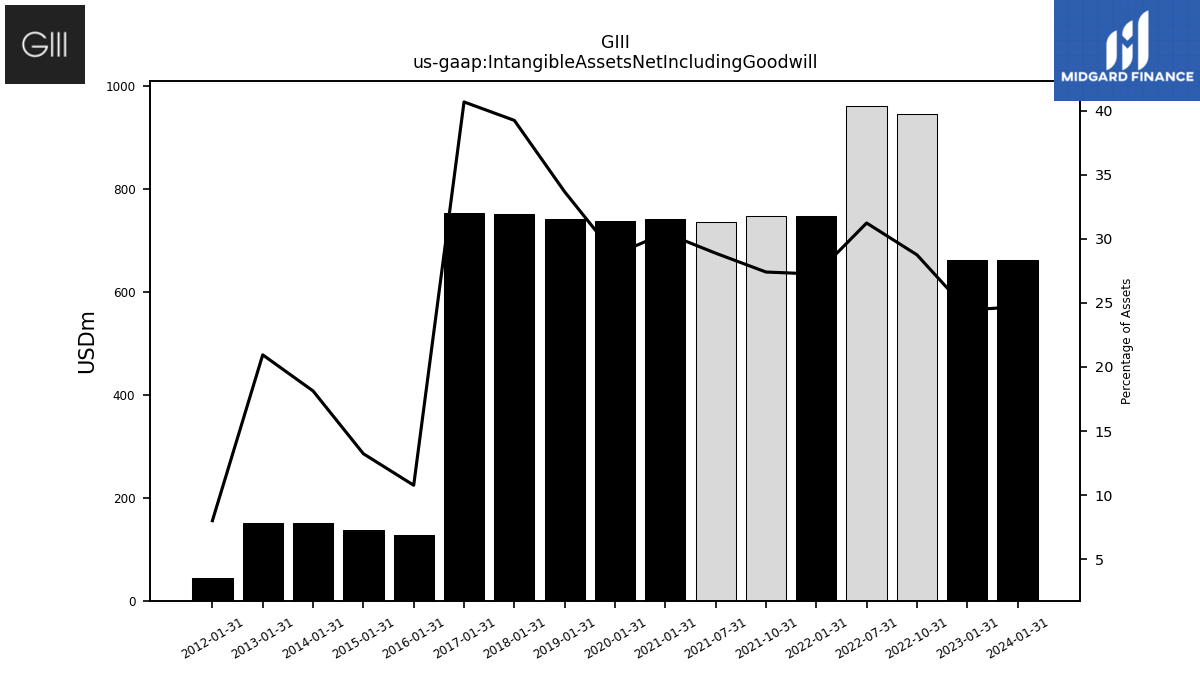
| Intangible Assets Net Including Goodwill | 662.01 | NA | NA | NA | 663.00 | 945.78 | 962.54 | NA | 747.22 | 747.58 | 737.30 | NA | 741.81 | NA | NA | NA | 737.64 | NA | NA | NA | 743.28 | NA | NA | NA | 751.38 | NA | NA | NA | 753.23 | NA | NA | NA | 127.50 | NA | NA | NA | 138.46 | NA | NA | NA | 150.62 | NA | NA | NA | 150.32 | NA | NA | NA | 43.71 | NA | NA | NA | NA | NA | NA | |
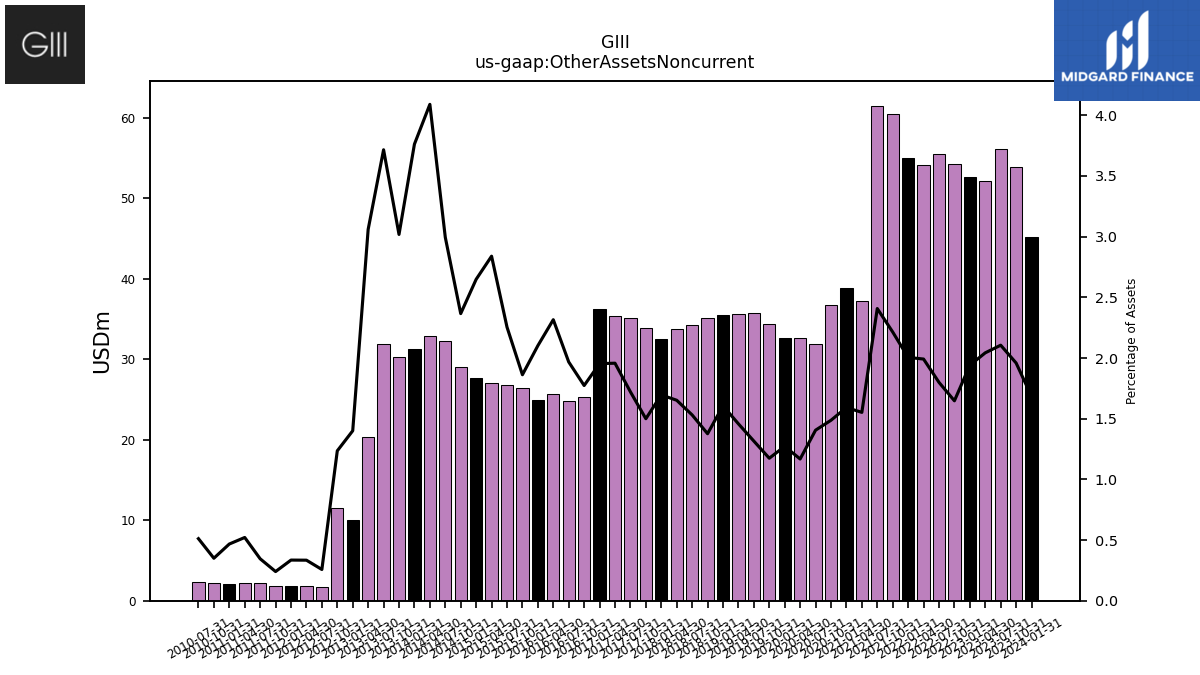
| Other Assets Noncurrent | 45.15 | 53.85 | 56.05 | 52.18 | 52.64 | 54.21 | 55.46 | 54.13 | 54.99 | 60.41 | 61.48 | 37.23 | 38.78 | 36.72 | 31.90 | 32.69 | 32.63 | 34.39 | 35.68 | 35.66 | 35.46 | 35.11 | 34.24 | 33.71 | 32.48 | 33.88 | 35.15 | 35.30 | 36.18 | 25.24 | 24.78 | 25.63 | 24.89 | 26.38 | 26.82 | 27.03 | 27.72 | 28.97 | 32.32 | 32.85 | 31.26 | 30.32 | 31.86 | 20.32 | 10.05 | 11.55 | 1.71 | 1.78 | 1.83 | 1.85 | 2.17 | 2.15 | 2.13 | 2.17 | 2.34 |
| 2024-01-31 | 2023-10-31 | 2023-07-31 | 2023-04-30 | 2023-01-31 | 2022-10-31 | 2022-07-31 | 2022-04-30 | 2022-01-31 | 2021-10-31 | 2021-07-31 | 2021-04-30 | 2021-01-31 | 2020-10-31 | 2020-07-31 | 2020-04-30 | 2020-01-31 | 2019-10-31 | 2019-07-31 | 2019-04-30 | 2019-01-31 | 2018-10-31 | 2018-07-31 | 2018-04-30 | 2018-01-31 | 2017-10-31 | 2017-07-31 | 2017-04-30 | 2017-01-31 | 2016-10-31 | 2016-07-31 | 2016-04-30 | 2016-01-31 | 2015-10-31 | 2015-07-31 | 2015-04-30 | 2015-01-31 | 2014-10-31 | 2014-07-31 | 2014-04-30 | 2014-01-31 | 2013-10-31 | 2013-07-31 | 2013-04-30 | 2013-01-31 | 2012-10-31 | 2012-07-31 | 2012-04-30 | 2012-01-31 | 2011-10-31 | 2011-07-31 | 2011-04-30 | 2011-01-31 | 2010-10-31 | 2010-07-31 | ||
|---|---|---|---|---|---|---|---|---|---|---|---|---|---|---|---|---|---|---|---|---|---|---|---|---|---|---|---|---|---|---|---|---|---|---|---|---|---|---|---|---|---|---|---|---|---|---|---|---|---|---|---|---|---|---|---|---|
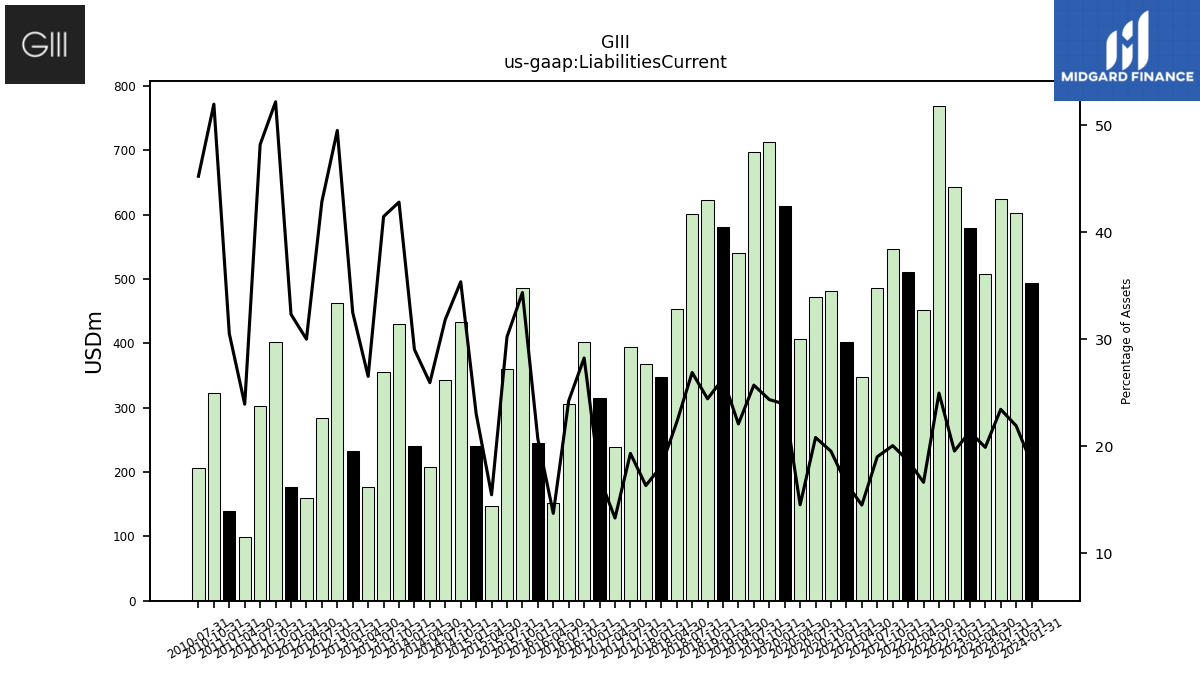
| Liabilities Current | 493.63 | 602.34 | 624.01 | 508.10 | 579.07 | 643.18 | 769.39 | 451.98 | 510.81 | 547.00 | 485.54 | 347.76 | 402.00 | 482.08 | 472.42 | 406.53 | 613.96 | 713.25 | 697.23 | 540.23 | 580.79 | 623.30 | 601.25 | 453.61 | 347.17 | 368.70 | 394.58 | 239.72 | 315.42 | 402.01 | 305.33 | 151.85 | 244.80 | 486.63 | 359.45 | 147.16 | 241.16 | 433.01 | 343.63 | 208.32 | 241.23 | 430.03 | 355.49 | 176.17 | 233.22 | 462.81 | 283.82 | 159.70 | 176.52 | 401.53 | 302.13 | 98.64 | 139.29 | 322.65 | 206.84 | |
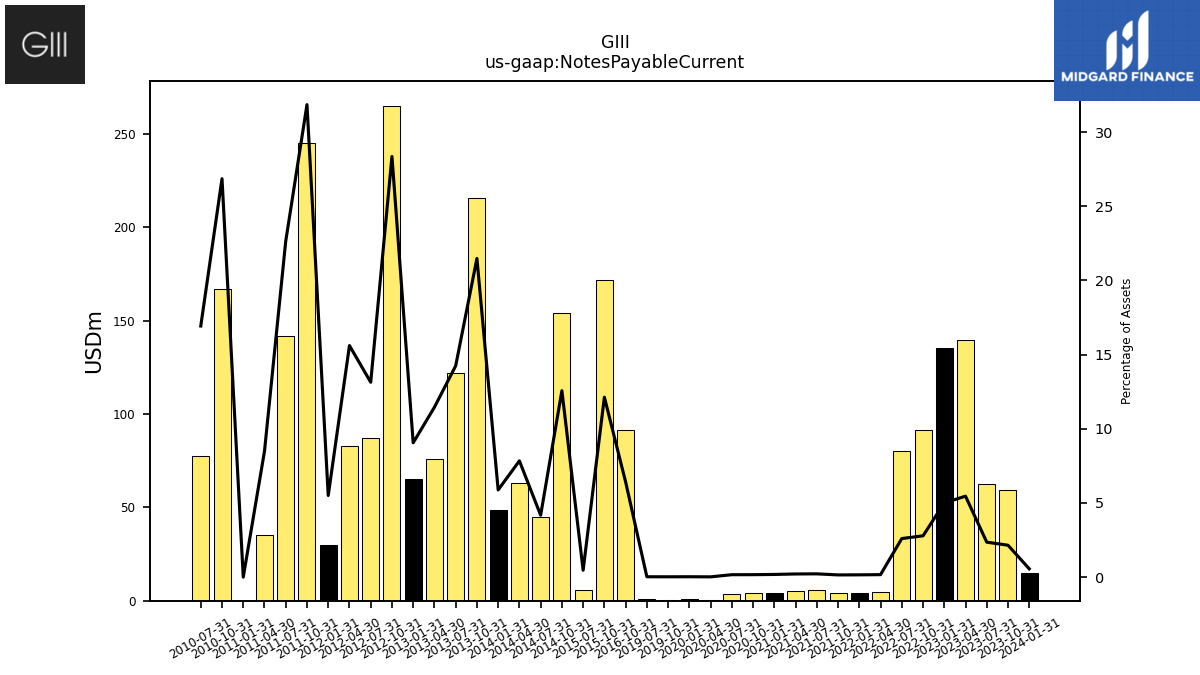
| Notes Payable Current | 15.03 | 59.10 | 62.73 | 139.42 | 135.52 | 91.61 | 80.11 | 4.55 | 4.24 | 4.06 | 5.62 | 5.11 | 4.40 | 4.08 | 3.72 | 0.51 | 0.67 | 0.66 | 0.68 | NA | NA | NA | NA | NA | NA | NA | NA | NA | NA | 91.33 | NA | NA | NA | 171.84 | 5.50 | NA | NA | 153.85 | 45.03 | 62.95 | 48.84 | 215.78 | 122.09 | 76.09 | 65.00 | 265.09 | 87.01 | 83.07 | 30.05 | 245.06 | 141.97 | 35.00 | 0.00 | 166.74 | 77.41 | |
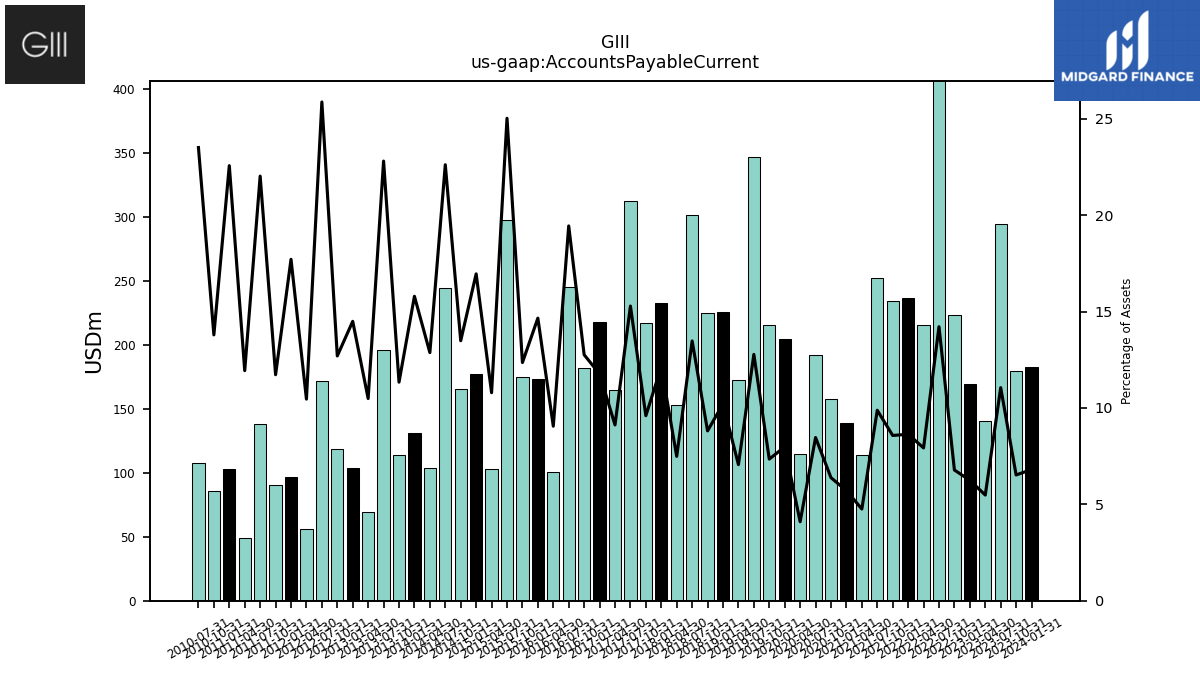
| Accounts Payable Current | 182.53 | 179.40 | 294.29 | 140.06 | 169.51 | 223.15 | 438.17 | 215.49 | 236.92 | 233.89 | 252.31 | 114.12 | 139.18 | 157.65 | 192.19 | 114.75 | 204.79 | 215.22 | 346.64 | 172.81 | 225.50 | 224.83 | 301.43 | 152.85 | 232.36 | 216.86 | 312.19 | 164.52 | 217.90 | 181.65 | 244.90 | 100.22 | 173.59 | 175.06 | 297.72 | 102.76 | 177.50 | 165.16 | 244.10 | 103.38 | 131.24 | 113.91 | 195.55 | 69.68 | 104.04 | 118.73 | 171.37 | 55.68 | 96.73 | 90.22 | 138.09 | 49.22 | 103.01 | 85.64 | 107.52 | |
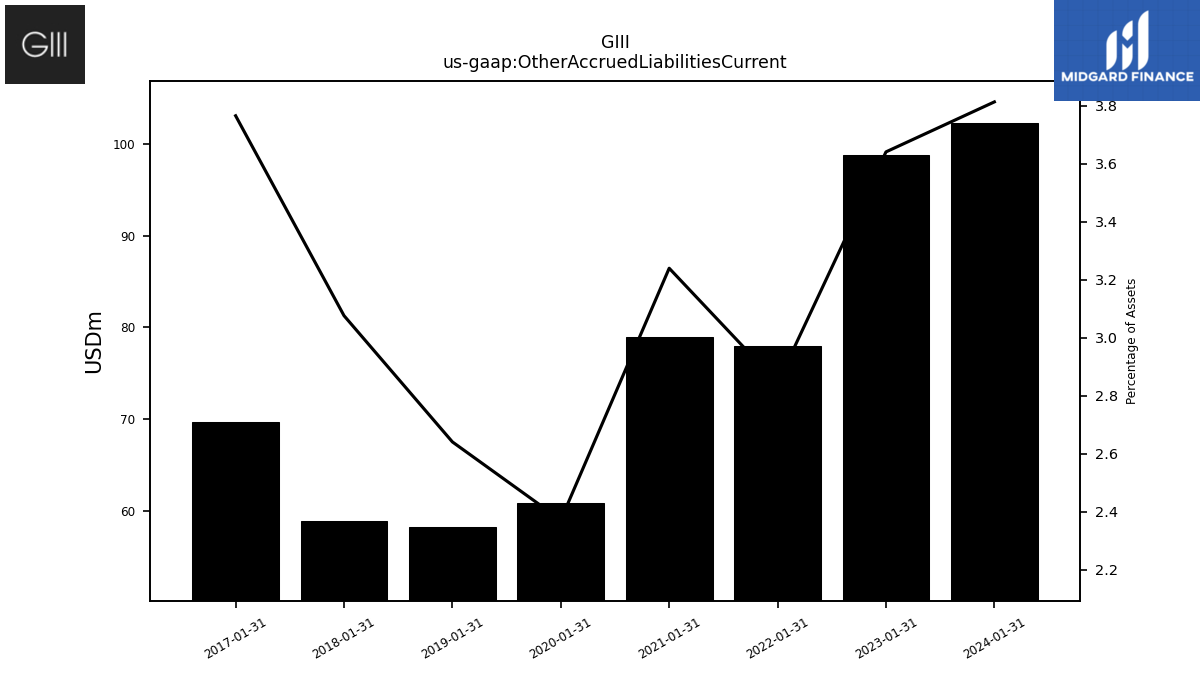
| Other Accrued Liabilities Current | 102.24 | NA | NA | NA | 98.75 | NA | NA | NA | 78.00 | NA | NA | NA | 78.94 | NA | NA | NA | 60.86 | NA | NA | NA | 58.32 | NA | NA | NA | 58.92 | NA | NA | NA | 69.73 | NA | NA | NA | NA | NA | NA | NA | NA | NA | NA | NA | NA | NA | NA | NA | NA | NA | NA | NA | NA | NA | NA | NA | NA | NA | NA | |
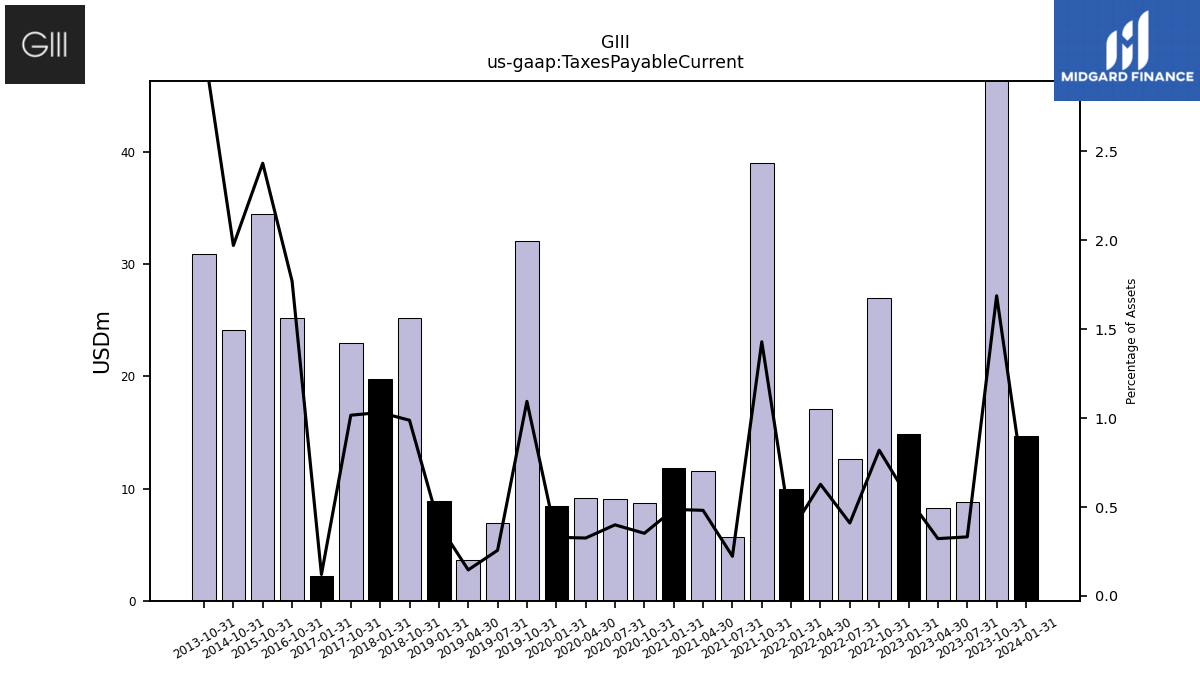
| Taxes Payable Current | 14.68 | 46.38 | 8.84 | 8.23 | 14.88 | 26.96 | 12.64 | 17.06 | 9.99 | 38.97 | 5.70 | 11.55 | 11.85 | 8.70 | 9.07 | 9.12 | 8.47 | 32.03 | 6.97 | 3.59 | 8.86 | 25.19 | NA | NA | 19.75 | 22.95 | NA | NA | 2.24 | 25.18 | NA | NA | NA | 34.44 | NA | NA | NA | 24.12 | NA | NA | NA | 30.91 | NA | NA | NA | NA | NA | NA | NA | NA | NA | NA | NA | NA | NA | |
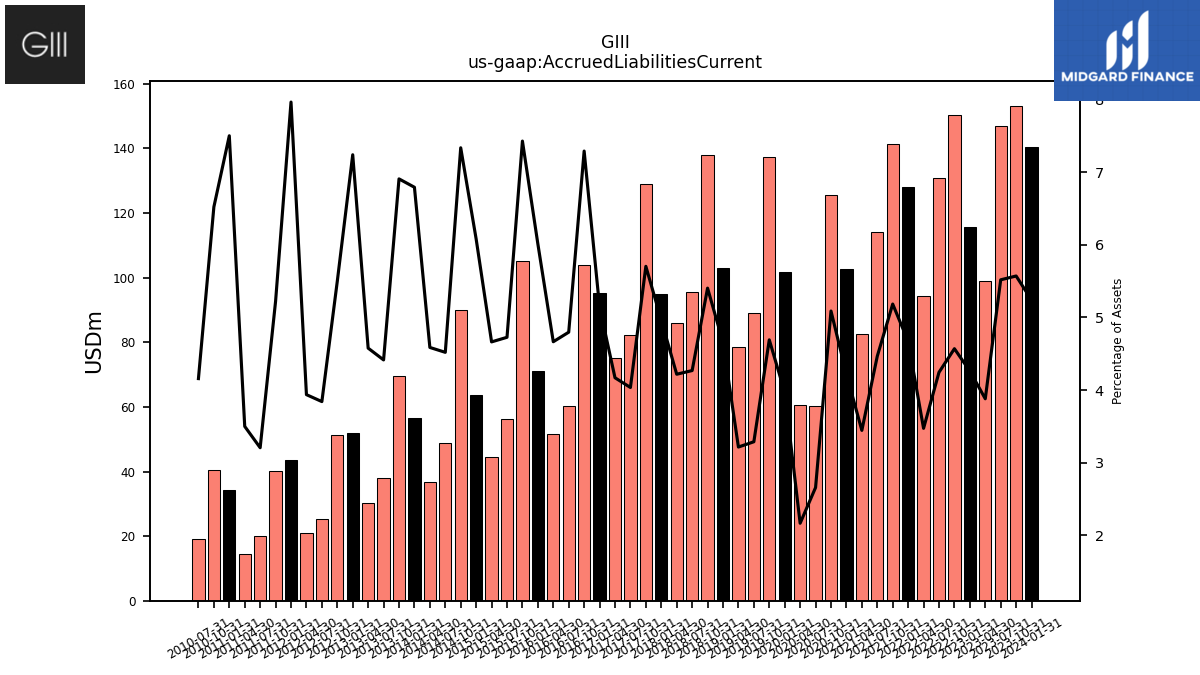
| Accrued Liabilities Current | 140.53 | 153.20 | 146.93 | 99.09 | 115.59 | 150.35 | 130.81 | 94.36 | 128.12 | 141.46 | 114.03 | 82.59 | 102.79 | 125.67 | 60.26 | 60.52 | 101.84 | 137.40 | 89.14 | 78.62 | 102.84 | 137.88 | 95.46 | 86.06 | 95.06 | 128.89 | 82.39 | 75.20 | 95.28 | 103.84 | 60.42 | 51.63 | 71.22 | 105.29 | 56.23 | 44.40 | 63.66 | 89.88 | 48.77 | 36.84 | 56.47 | 69.43 | 37.85 | 30.40 | 52.00 | 51.42 | 25.43 | 20.95 | 43.53 | 40.19 | 20.09 | 14.43 | 34.26 | 40.51 | 19.01 | |
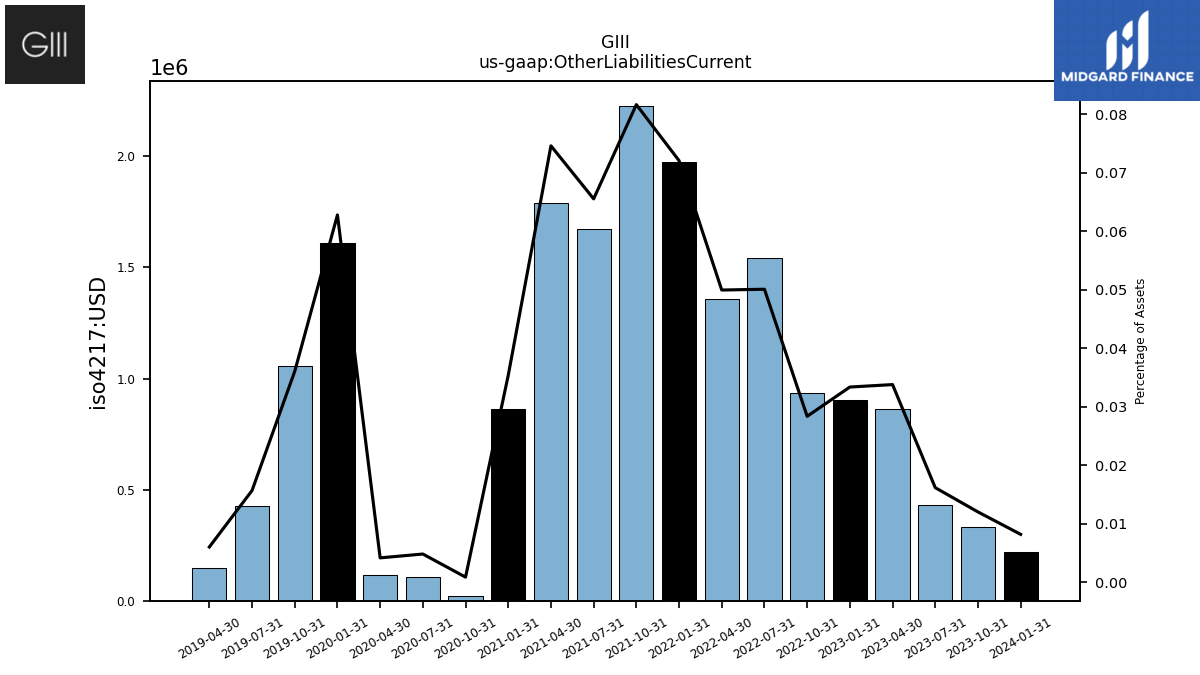
| Other Liabilities Current | 0.22 | 0.33 | 0.43 | 0.86 | 0.91 | 0.93 | 1.54 | 1.36 | 1.98 | 2.23 | 1.67 | 1.79 | 0.86 | 0.02 | 0.11 | 0.12 | 1.61 | 1.06 | 0.42 | 0.15 | NA | NA | NA | NA | NA | NA | NA | NA | NA | NA | NA | NA | NA | NA | NA | NA | NA | NA | NA | NA | NA | NA | NA | NA | NA | NA | NA | NA | NA | NA | NA | NA | NA | NA | NA |
| 2024-01-31 | 2023-10-31 | 2023-07-31 | 2023-04-30 | 2023-01-31 | 2022-10-31 | 2022-07-31 | 2022-04-30 | 2022-01-31 | 2021-10-31 | 2021-07-31 | 2021-04-30 | 2021-01-31 | 2020-10-31 | 2020-07-31 | 2020-04-30 | 2020-01-31 | 2019-10-31 | 2019-07-31 | 2019-04-30 | 2019-01-31 | 2018-10-31 | 2018-07-31 | 2018-04-30 | 2018-01-31 | 2017-10-31 | 2017-07-31 | 2017-04-30 | 2017-01-31 | 2016-10-31 | 2016-07-31 | 2016-04-30 | 2016-01-31 | 2015-10-31 | 2015-07-31 | 2015-04-30 | 2015-01-31 | 2014-10-31 | 2014-07-31 | 2014-04-30 | 2014-01-31 | 2013-10-31 | 2013-07-31 | 2013-04-30 | 2013-01-31 | 2012-10-31 | 2012-07-31 | 2012-04-30 | 2012-01-31 | 2011-10-31 | 2011-07-31 | 2011-04-30 | 2011-01-31 | 2010-10-31 | 2010-07-31 | ||
|---|---|---|---|---|---|---|---|---|---|---|---|---|---|---|---|---|---|---|---|---|---|---|---|---|---|---|---|---|---|---|---|---|---|---|---|---|---|---|---|---|---|---|---|---|---|---|---|---|---|---|---|---|---|---|---|---|
| Long Term Debt | 402.81 | 402.85 | 403.30 | 403.59 | 483.84 | 787.89 | 495.67 | 516.83 | 515.34 | 513.47 | 512.02 | 509.78 | 507.95 | 504.33 | 405.00 | 900.68 | 396.79 | 674.74 | NA | NA | NA | 694.28 | 494.21 | 448.26 | 391.04 | 726.61 | 568.83 | 492.80 | 461.76 | 91.33 | NA | NA | NA | NA | NA | NA | NA | NA | NA | NA | NA | NA | NA | NA | NA | NA | NA | NA | NA | NA | NA | NA | NA | NA | NA | |
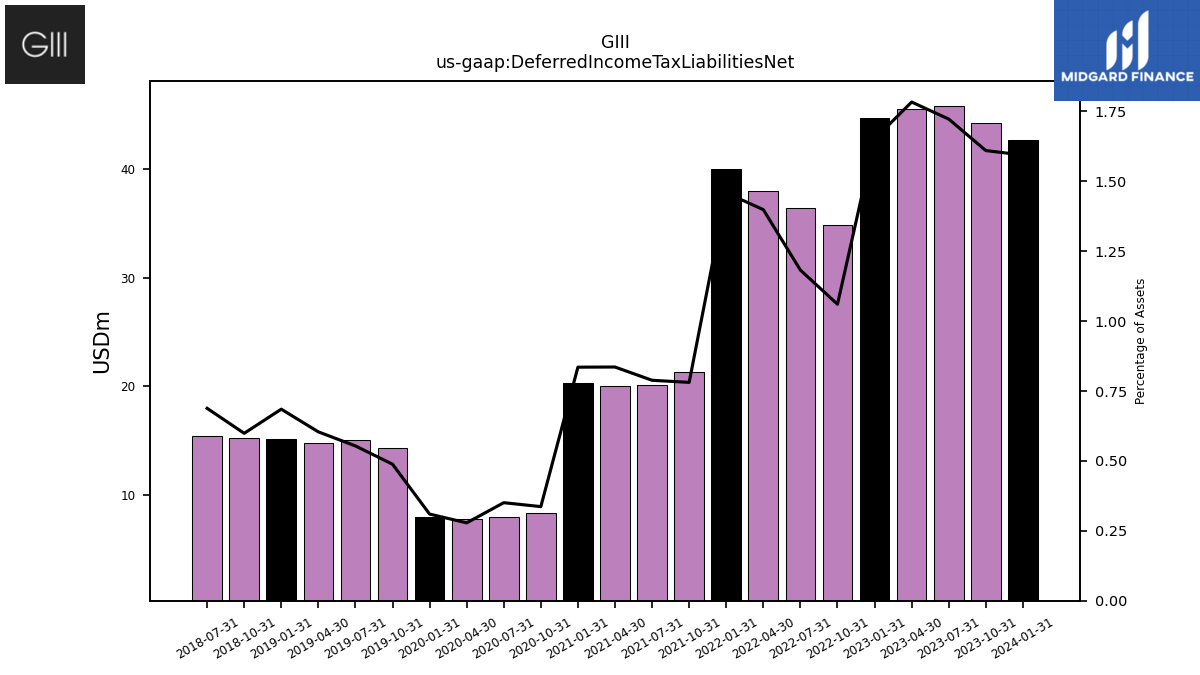
| Deferred Income Tax Liabilities Net | 42.74 | 44.27 | 45.86 | 45.56 | 44.78 | 34.89 | 36.45 | 38.02 | 40.01 | 21.31 | 20.13 | 20.05 | 20.35 | 8.31 | 7.96 | 7.80 | 7.95 | 14.30 | 15.02 | 14.78 | 15.13 | 15.28 | 15.39 | NA | NA | NA | NA | NA | NA | NA | NA | NA | NA | NA | NA | NA | NA | NA | NA | NA | NA | NA | NA | NA | NA | NA | NA | NA | NA | NA | NA | NA | NA | NA | NA | |
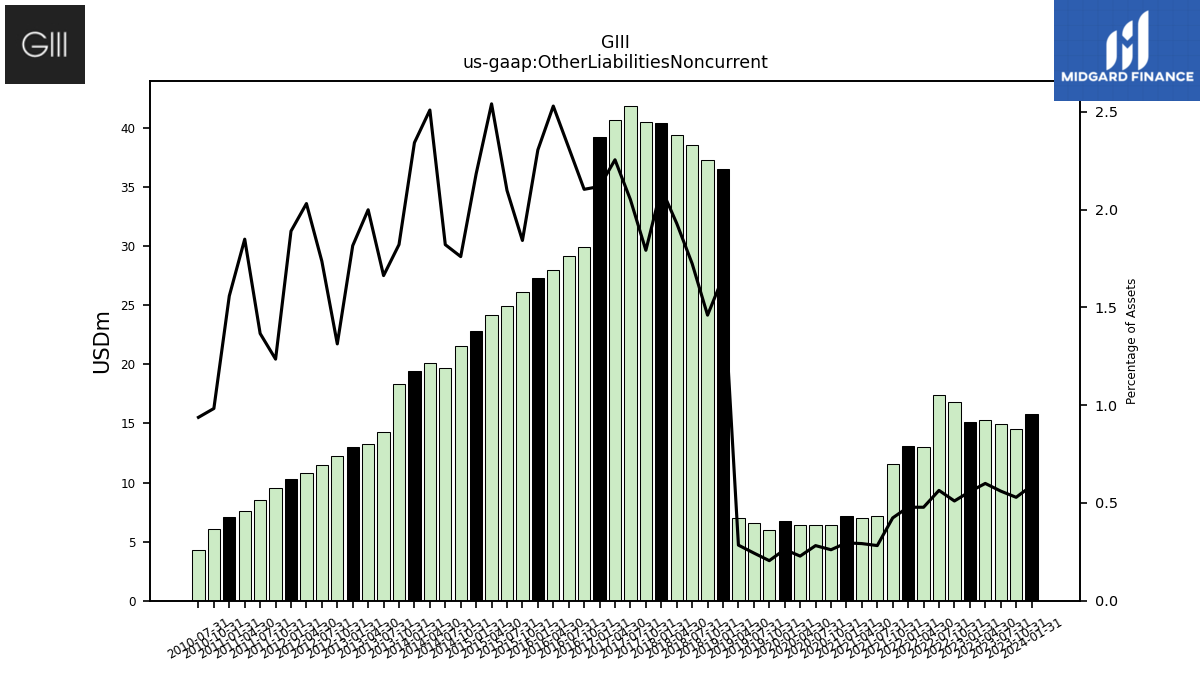
| Other Liabilities Noncurrent | 15.76 | 14.54 | 14.93 | 15.32 | 15.14 | 16.79 | 17.40 | 13.00 | 13.12 | 11.56 | 7.20 | 7.01 | 7.21 | 6.44 | 6.40 | 6.39 | 6.72 | 6.00 | 6.62 | 6.96 | 36.53 | 37.26 | 38.57 | 39.38 | 40.39 | 40.49 | 41.88 | 40.68 | 39.23 | 29.95 | 29.19 | 28.00 | 27.30 | 26.10 | 24.96 | 24.19 | 22.85 | 21.55 | 19.65 | 20.15 | 19.46 | 18.30 | 14.26 | 13.28 | 13.03 | 12.28 | 11.50 | 10.81 | 10.32 | 9.51 | 8.57 | 7.62 | 7.12 | 6.11 | 4.29 | |
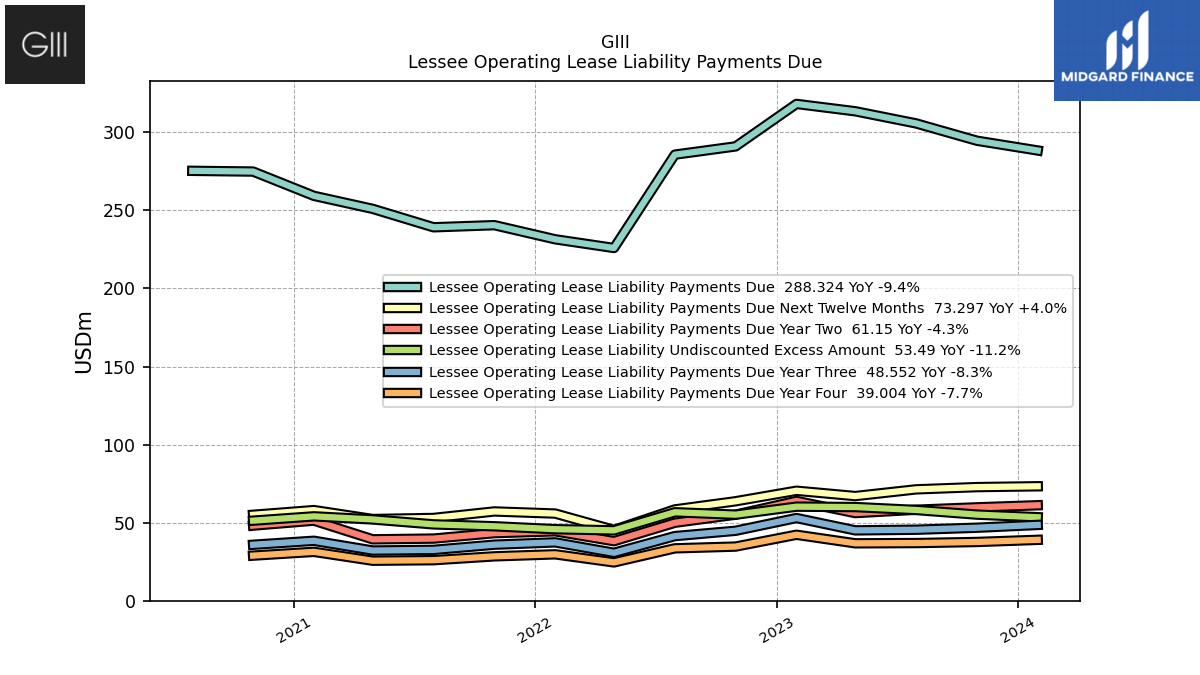
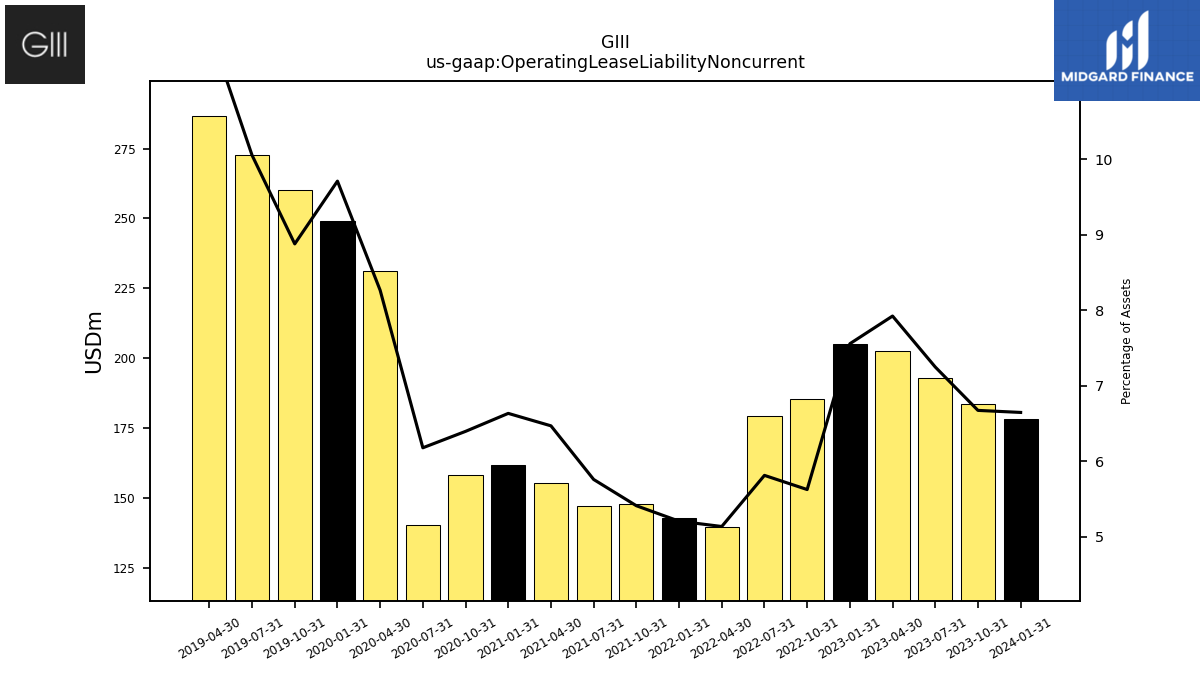
| Operating Lease Liability Noncurrent | 178.25 | 183.52 | 192.98 | 202.41 | 204.97 | 185.17 | 179.25 | 139.69 | 142.87 | 147.69 | 147.12 | 155.22 | 161.67 | 157.98 | 140.28 | 231.32 | 249.04 | 260.01 | 272.63 | 286.66 | NA | NA | NA | NA | NA | NA | NA | NA | NA | NA | NA | NA | NA | NA | NA | NA | NA | NA | NA | NA | NA | NA | NA | NA | NA | NA | NA | NA | NA | NA | NA | NA | NA | NA | NA |
| 2024-01-31 | 2023-10-31 | 2023-07-31 | 2023-04-30 | 2023-01-31 | 2022-10-31 | 2022-07-31 | 2022-04-30 | 2022-01-31 | 2021-10-31 | 2021-07-31 | 2021-04-30 | 2021-01-31 | 2020-10-31 | 2020-07-31 | 2020-04-30 | 2020-01-31 | 2019-10-31 | 2019-07-31 | 2019-04-30 | 2019-01-31 | 2018-10-31 | 2018-07-31 | 2018-04-30 | 2018-01-31 | 2017-10-31 | 2017-07-31 | 2017-04-30 | 2017-01-31 | 2016-10-31 | 2016-07-31 | 2016-04-30 | 2016-01-31 | 2015-10-31 | 2015-07-31 | 2015-04-30 | 2015-01-31 | 2014-10-31 | 2014-07-31 | 2014-04-30 | 2014-01-31 | 2013-10-31 | 2013-07-31 | 2013-04-30 | 2013-01-31 | 2012-10-31 | 2012-07-31 | 2012-04-30 | 2012-01-31 | 2011-10-31 | 2011-07-31 | 2011-04-30 | 2011-01-31 | 2010-10-31 | 2010-07-31 | ||
|---|---|---|---|---|---|---|---|---|---|---|---|---|---|---|---|---|---|---|---|---|---|---|---|---|---|---|---|---|---|---|---|---|---|---|---|---|---|---|---|---|---|---|---|---|---|---|---|---|---|---|---|---|---|---|---|---|
| Stockholders Equity | 1550.26 | 1503.22 | 1382.12 | 1380.45 | 1385.45 | 1622.26 | 1584.00 | 1558.29 | 1519.91 | 1486.24 | 1380.61 | 1357.88 | 1336.24 | 1310.27 | 1237.75 | 1246.23 | 1290.67 | 1260.30 | 1167.82 | 1186.83 | 1189.01 | 1180.95 | 1087.22 | 1082.92 | 1120.69 | 1106.93 | 1021.03 | 1016.06 | 1021.24 | 969.90 | 900.11 | 901.65 | 888.13 | 885.00 | 785.17 | 761.15 | 761.26 | 748.24 | 669.70 | 527.82 | 523.11 | 506.58 | 440.44 | 431.40 | 429.40 | 418.99 | 364.08 | 360.47 | 357.97 | 351.92 | 309.68 | 306.09 | 303.49 | 285.66 | 239.71 | |
| Common Stock Value | 0.26 | 0.26 | 0.26 | 0.26 | 0.26 | 0.26 | 0.26 | 0.26 | 0.26 | 0.26 | 0.26 | 0.26 | 0.26 | 0.26 | 0.26 | 0.26 | 0.26 | 0.26 | 0.26 | 0.26 | 0.26 | 0.26 | 0.26 | 0.26 | 0.24 | 0.25 | 0.25 | 0.25 | 0.25 | 0.23 | 0.23 | 0.23 | 0.23 | 0.23 | 0.23 | 0.23 | 0.23 | 0.23 | 0.23 | 0.21 | 0.21 | 0.21 | 0.21 | 0.21 | 0.21 | 0.21 | 0.20 | 0.20 | 0.20 | 0.20 | 0.20 | 0.20 | 0.20 | 0.20 | 0.20 | |
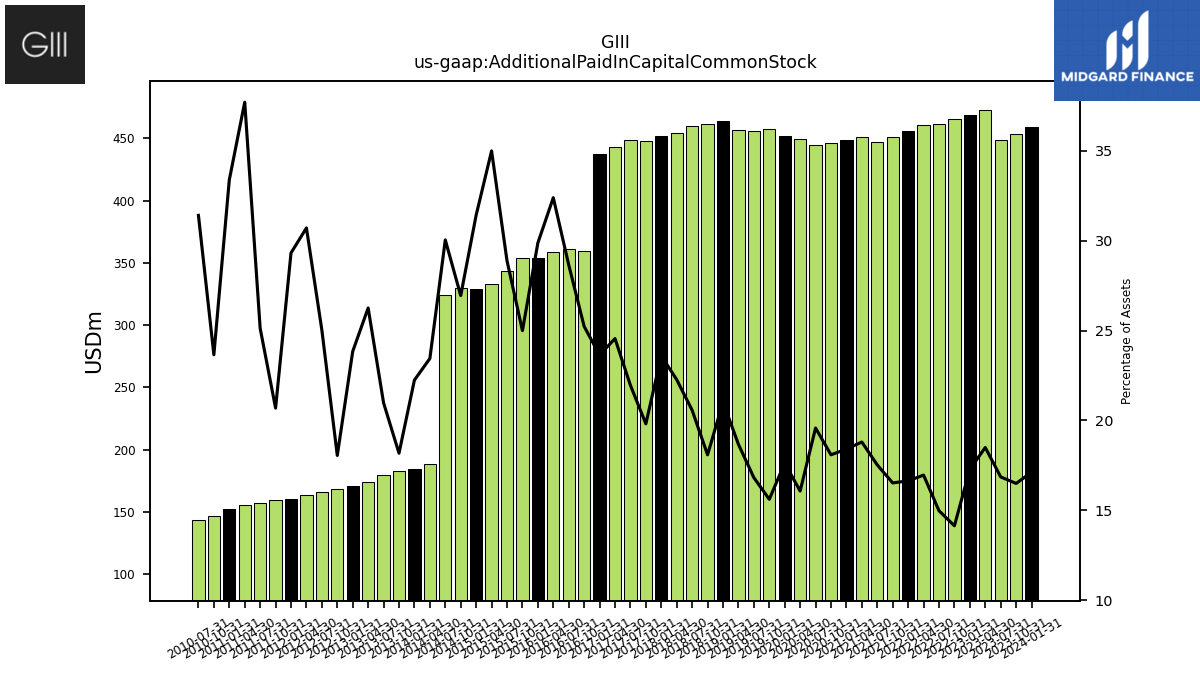
| Additional Paid In Capital Common Stock | 458.84 | 453.50 | 448.76 | 472.47 | 468.71 | 465.23 | 461.62 | 461.00 | 456.33 | 450.77 | 447.48 | 450.96 | 448.42 | 446.66 | 444.38 | 449.84 | 452.14 | 457.28 | 456.19 | 456.83 | 464.11 | 461.46 | 460.00 | 454.40 | 451.84 | 447.56 | 448.32 | 442.90 | 437.78 | 359.15 | 360.95 | 358.46 | 353.74 | 354.06 | 343.58 | 333.16 | 328.87 | 329.94 | 324.21 | 188.29 | 184.84 | 182.60 | 179.83 | 174.39 | 171.13 | 168.75 | 165.75 | 163.44 | 160.10 | 159.17 | 157.51 | 155.48 | 152.34 | 146.87 | 143.64 | |
| Retained Earnings Accumulated Deficit | 1160.11 | 1131.26 | 1003.62 | 987.18 | 983.94 | 1245.06 | 1183.96 | 1147.64 | 1117.01 | 1068.58 | 961.90 | 942.73 | 916.68 | 902.04 | 838.87 | 853.84 | 893.14 | 867.85 | 772.46 | 761.34 | 758.88 | 734.80 | 640.77 | 630.63 | 674.54 | 675.08 | 593.50 | 602.03 | 612.42 | 632.53 | 561.97 | 563.26 | 560.49 | 552.53 | 465.37 | 452.90 | 446.16 | 423.94 | 343.32 | 337.09 | 335.80 | 322.89 | 263.29 | 259.56 | 258.44 | 250.37 | 202.08 | 200.72 | 201.56 | 196.54 | 152.99 | 151.42 | 151.94 | 139.61 | 96.89 | |
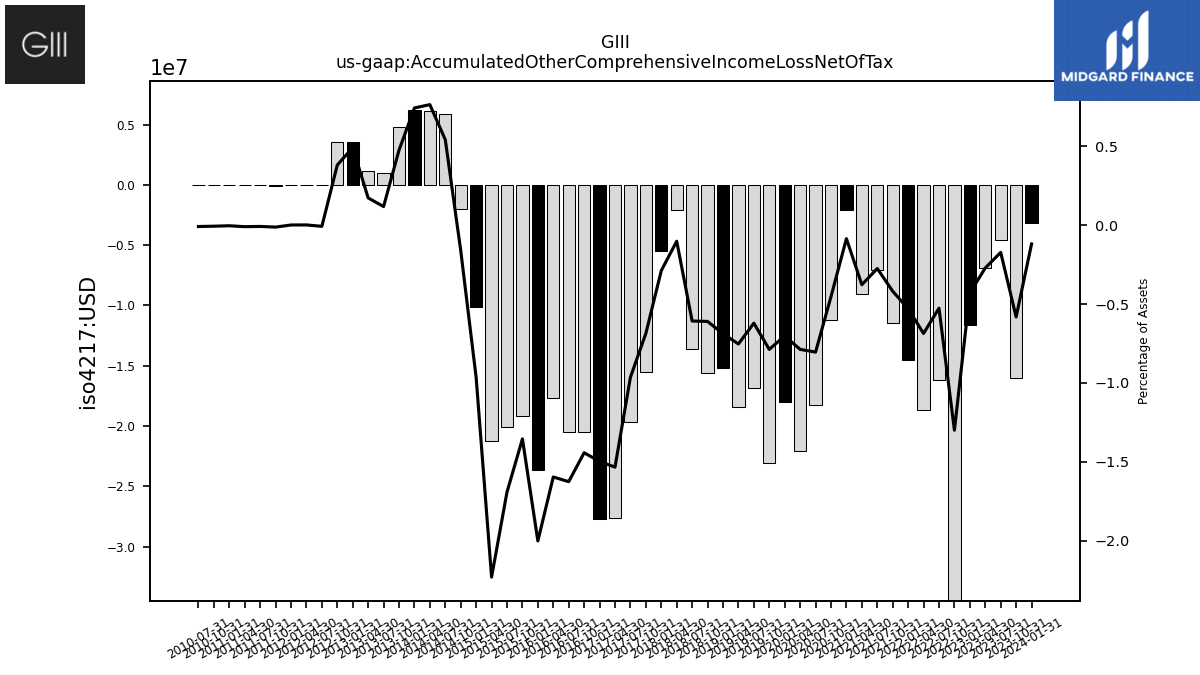
| Accumulated Other Comprehensive Income Loss Net Of Tax | -3.21 | -15.99 | -4.60 | -6.94 | -11.65 | -42.74 | -16.23 | -18.66 | -14.53 | -11.43 | -7.03 | -9.06 | -2.09 | -11.19 | -18.26 | -22.03 | -18.01 | -23.06 | -16.85 | -18.42 | -15.19 | -15.57 | -13.59 | -2.09 | -5.52 | -15.50 | -19.68 | -27.65 | -27.72 | -20.53 | -20.47 | -17.66 | -23.69 | -19.18 | -20.11 | -21.23 | -10.11 | -1.97 | 5.84 | 6.13 | 6.17 | 4.77 | 1.01 | 1.14 | 3.52 | 3.56 | -0.05 | 0.01 | 0.00 | -0.10 | -0.05 | -0.04 | -0.02 | -0.04 | -0.04 | |
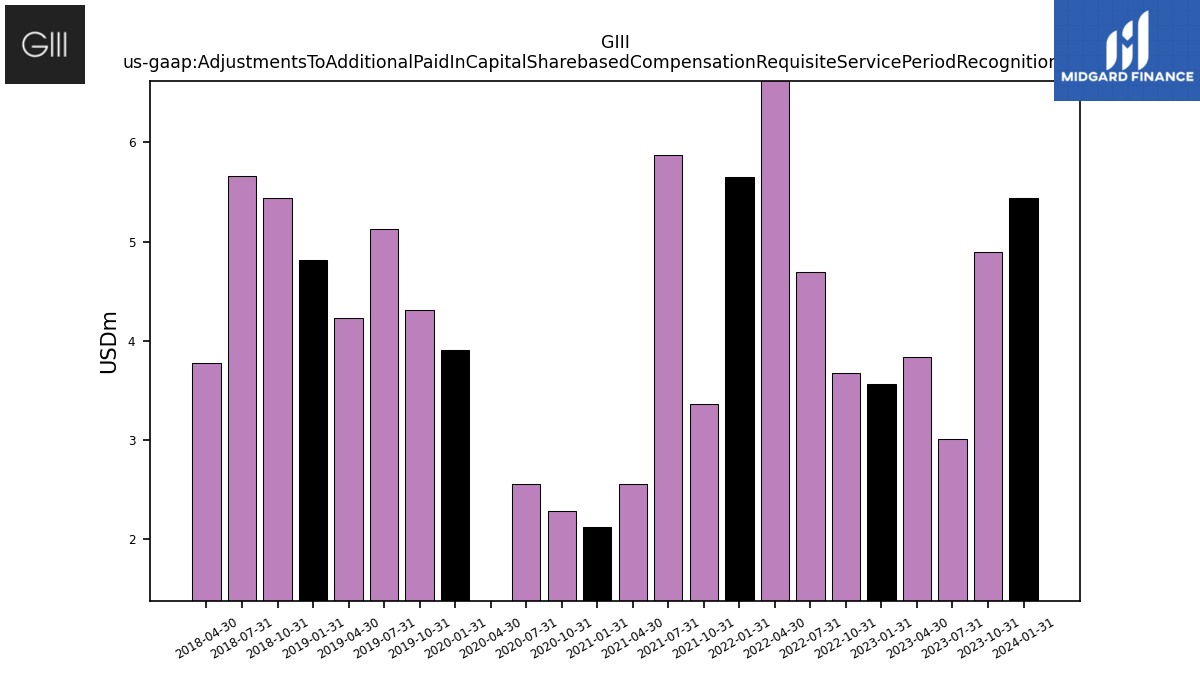
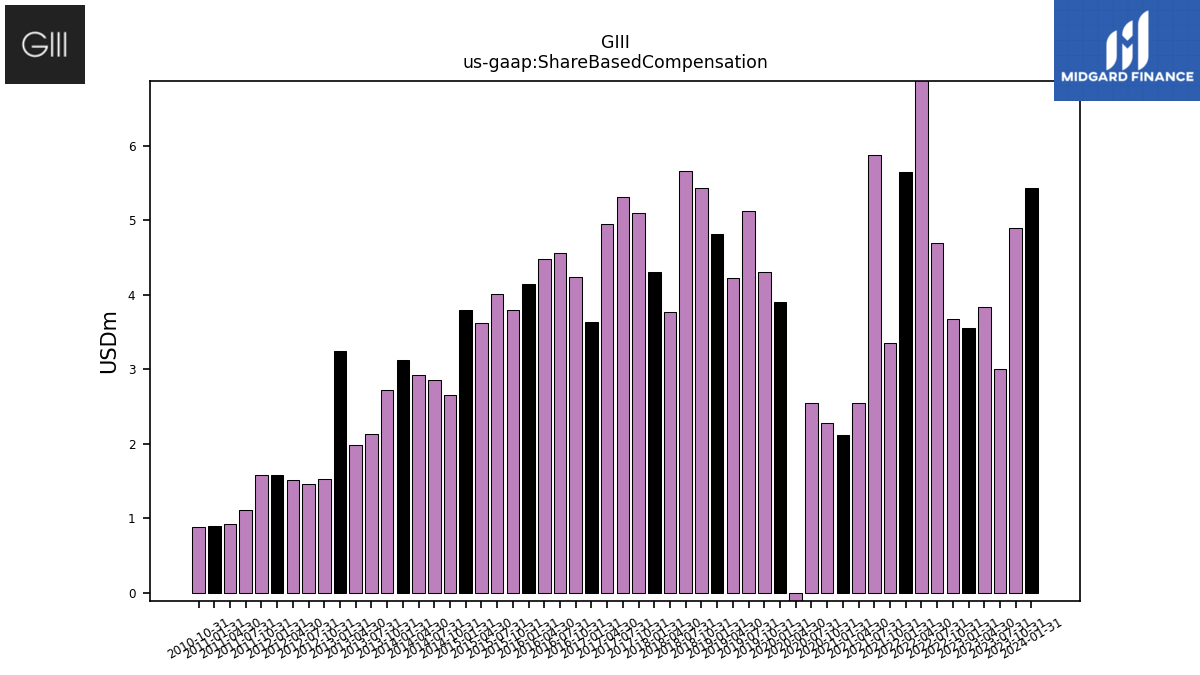
| Adjustments To Additional Paid In Capital Sharebased Compensation Requisite Service Period Recognition Value | 5.44 | 4.89 | 3.00 | 3.84 | 3.56 | 3.67 | 4.70 | 20.55 | 5.65 | 3.35 | 5.87 | 2.55 | 2.12 | 2.28 | 2.55 | -0.81 | 3.90 | 4.31 | 5.12 | 4.23 | 4.82 | 5.44 | 5.67 | 3.77 | NA | NA | NA | NA | NA | NA | NA | NA | NA | NA | NA | NA | NA | NA | NA | NA | NA | NA | NA | NA | NA | NA | NA | NA | NA | NA | NA | NA | NA | NA | NA |
| 2024-01-31 | 2023-10-31 | 2023-07-31 | 2023-04-30 | 2023-01-31 | 2022-10-31 | 2022-07-31 | 2022-04-30 | 2022-01-31 | 2021-10-31 | 2021-07-31 | 2021-04-30 | 2021-01-31 | 2020-10-31 | 2020-07-31 | 2020-04-30 | 2020-01-31 | 2019-10-31 | 2019-07-31 | 2019-04-30 | 2019-01-31 | 2018-10-31 | 2018-07-31 | 2018-04-30 | 2018-01-31 | 2017-10-31 | 2017-07-31 | 2017-04-30 | 2017-01-31 | 2016-10-31 | 2016-07-31 | 2016-04-30 | 2016-01-31 | 2015-10-31 | 2015-07-31 | 2015-04-30 | 2015-01-31 | 2014-10-31 | 2014-07-31 | 2014-04-30 | 2014-01-31 | 2013-10-31 | 2013-07-31 | 2013-04-30 | 2013-01-31 | 2012-10-31 | 2012-07-31 | 2012-04-30 | 2012-01-31 | 2011-10-31 | 2011-07-31 | 2011-04-30 | 2011-01-31 | 2010-10-31 | 2010-07-31 | ||
|---|---|---|---|---|---|---|---|---|---|---|---|---|---|---|---|---|---|---|---|---|---|---|---|---|---|---|---|---|---|---|---|---|---|---|---|---|---|---|---|---|---|---|---|---|---|---|---|---|---|---|---|---|---|---|---|---|
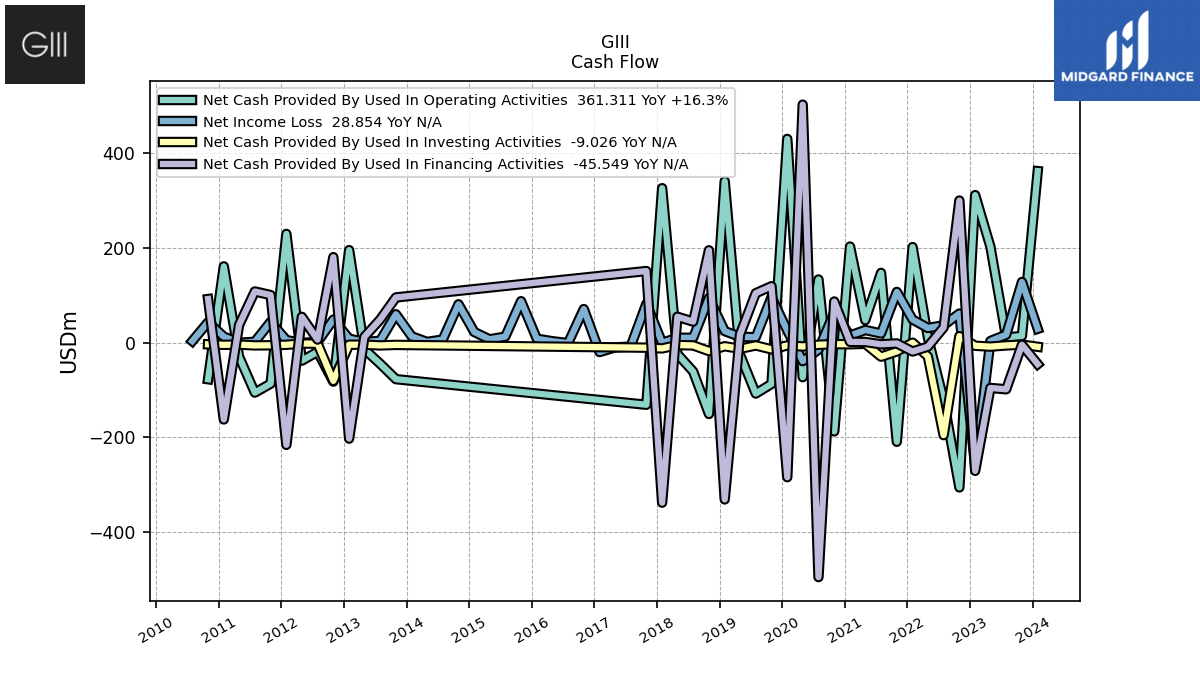
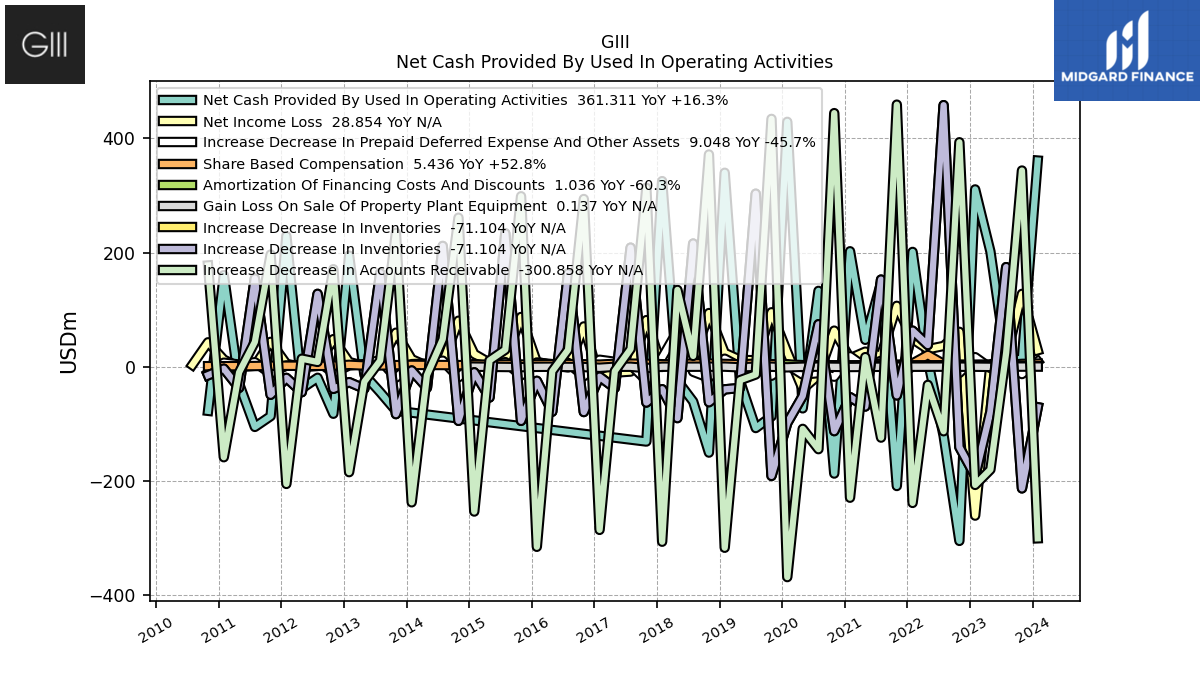
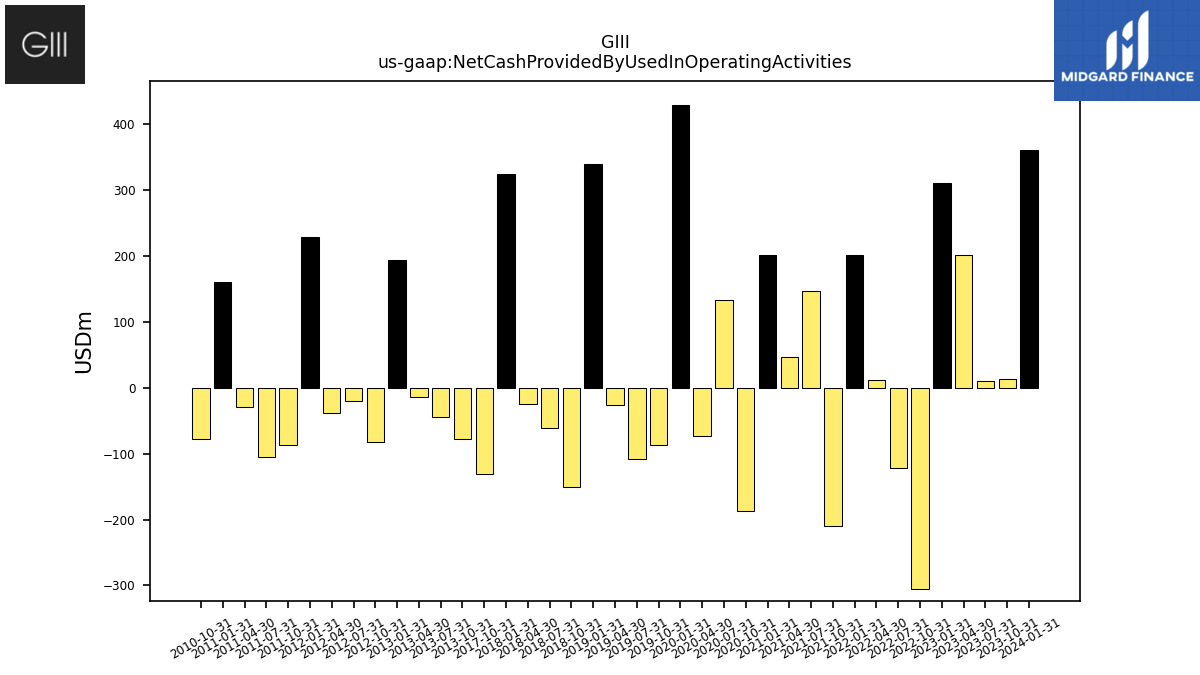
| Net Cash Provided By Used In Operating Activities | 361.31 | 13.79 | 10.65 | 201.83 | 310.73 | -305.44 | -121.06 | 11.17 | 201.19 | -209.21 | 146.78 | 47.04 | 202.33 | -187.38 | 132.90 | -73.10 | 429.19 | -87.26 | -107.58 | -25.33 | 339.94 | -150.63 | -61.16 | -24.32 | 325.33 | -131.23 | NA | NA | NA | NA | NA | NA | NA | NA | NA | NA | NA | NA | NA | NA | NA | -77.23 | -44.78 | -14.16 | 194.75 | -82.52 | -19.44 | -38.30 | 228.97 | -86.75 | -105.60 | -29.85 | 160.48 | -77.41 | NA | |
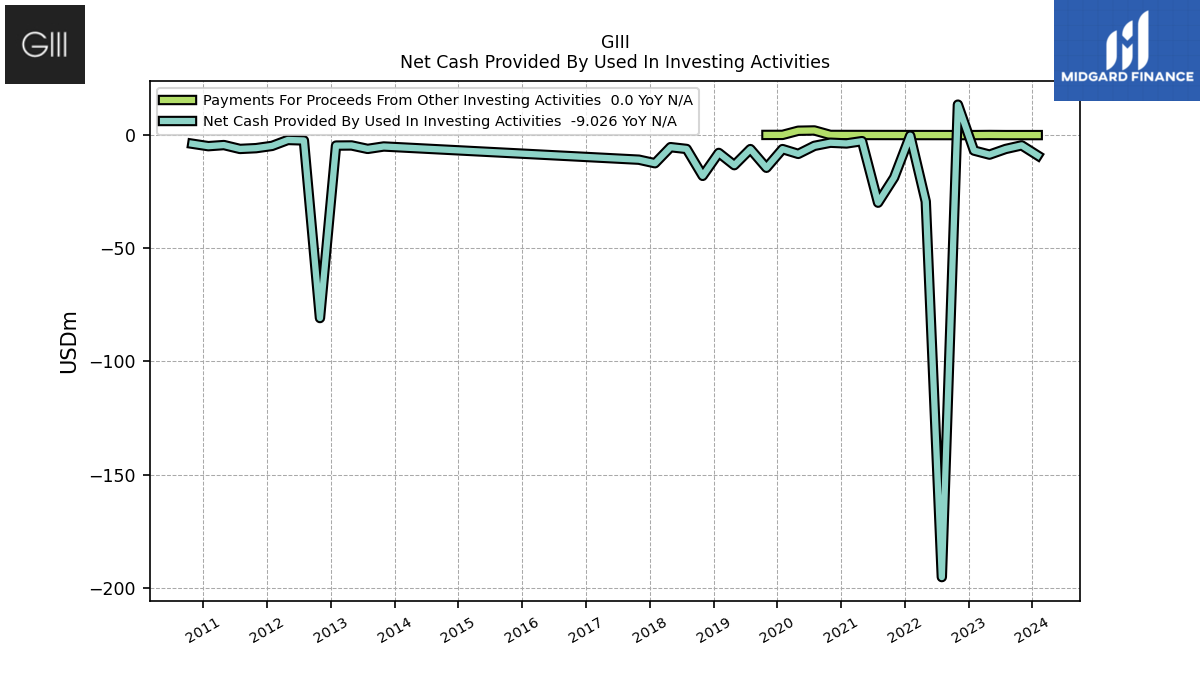
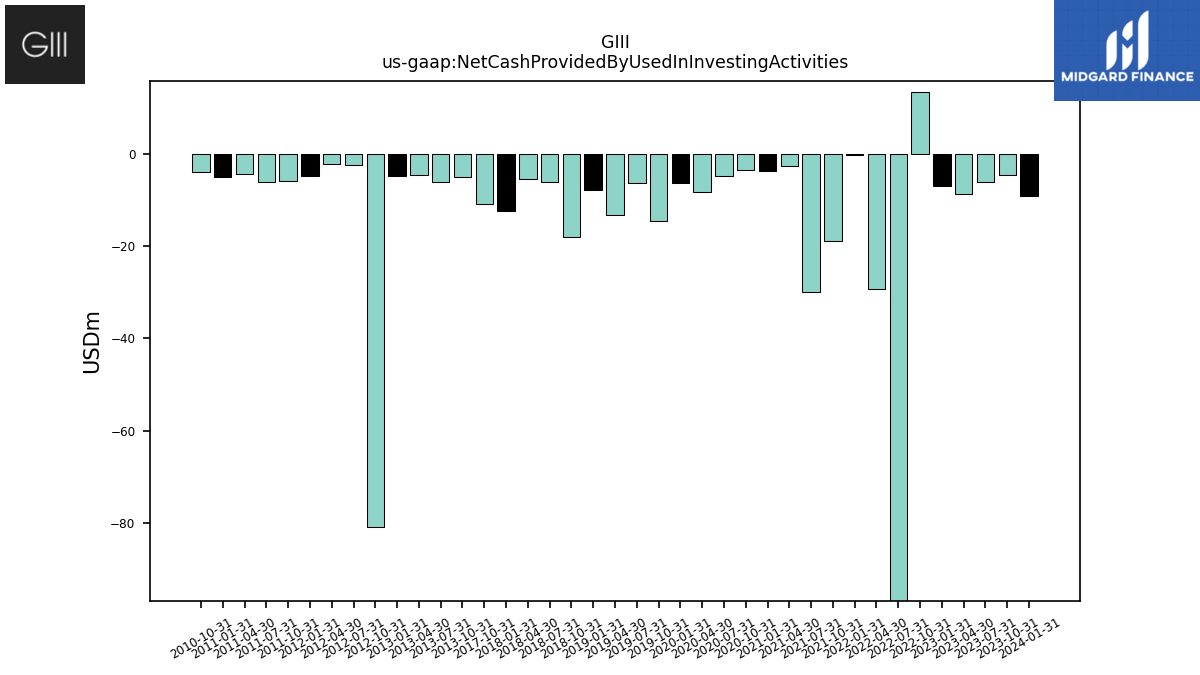
| Net Cash Provided By Used In Investing Activities | -9.03 | -4.54 | -6.14 | -8.63 | -6.83 | 13.46 | -195.25 | -29.33 | -0.23 | -18.74 | -29.86 | -2.67 | -3.69 | -3.36 | -4.76 | -8.31 | -6.18 | -14.45 | -6.18 | -13.29 | -7.87 | -18.01 | -6.12 | -5.33 | -12.44 | -10.87 | NA | NA | NA | NA | NA | NA | NA | NA | NA | NA | NA | NA | NA | NA | NA | -5.03 | -6.10 | -4.58 | -4.64 | -80.83 | -2.36 | -2.16 | -4.77 | -5.77 | -6.12 | -4.40 | -4.89 | -3.82 | NA | |
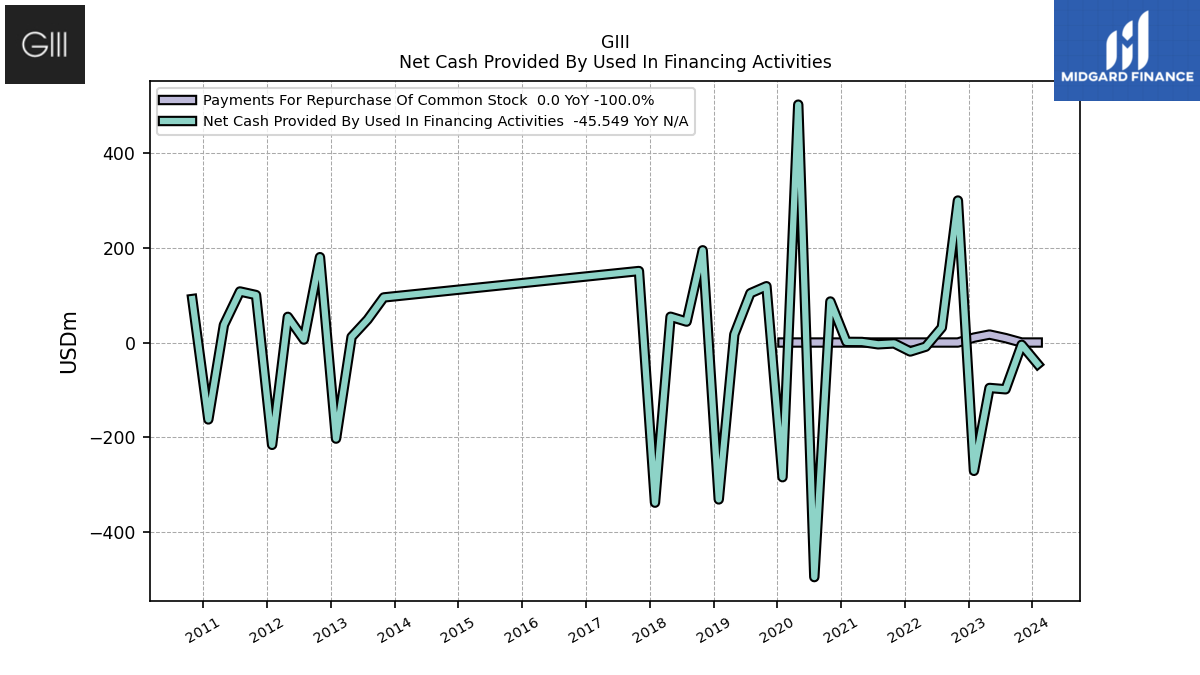
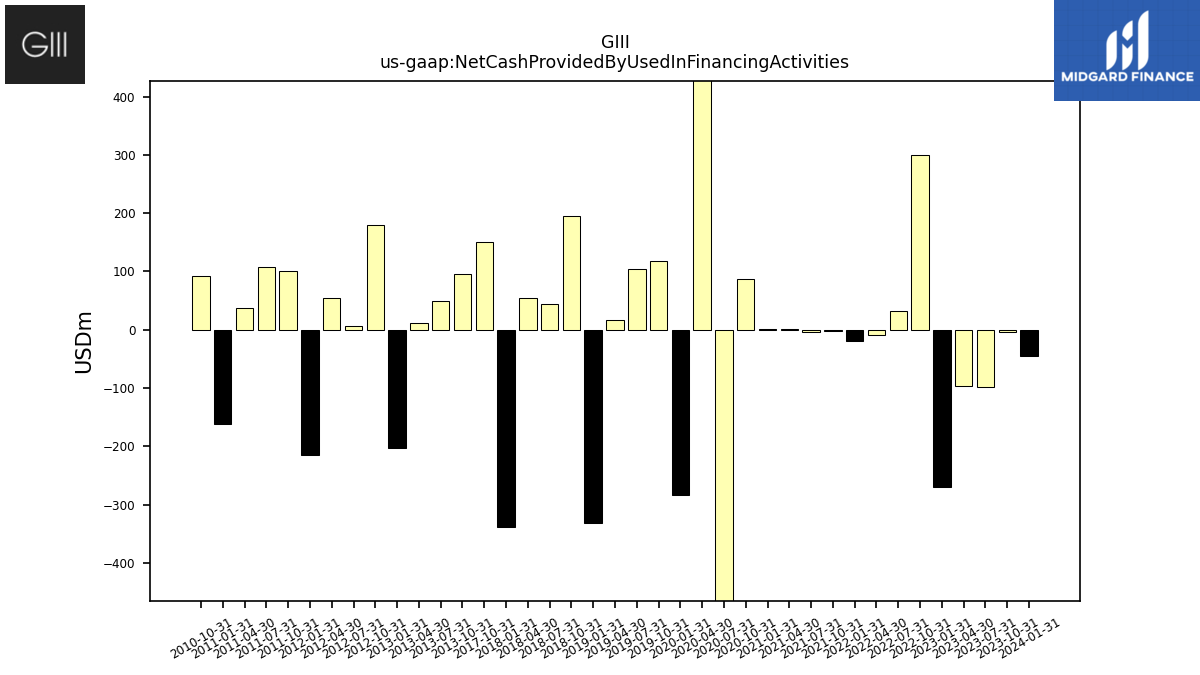
| Net Cash Provided By Used In Financing Activities | -45.55 | -4.76 | -98.57 | -95.75 | -270.54 | 299.31 | 31.61 | -8.74 | -18.93 | -1.88 | -3.78 | 1.15 | 1.35 | 86.49 | -494.47 | 501.41 | -283.94 | 118.68 | 103.91 | 16.86 | -330.76 | 194.43 | 44.04 | 54.34 | -337.60 | 150.70 | NA | NA | NA | NA | NA | NA | NA | NA | NA | NA | NA | NA | NA | NA | NA | 95.02 | 48.45 | 11.76 | -202.59 | 179.95 | 6.18 | 54.13 | -215.73 | 100.09 | 107.59 | 36.93 | -162.15 | 91.67 | NA |
| 2024-01-31 | 2023-10-31 | 2023-07-31 | 2023-04-30 | 2023-01-31 | 2022-10-31 | 2022-07-31 | 2022-04-30 | 2022-01-31 | 2021-10-31 | 2021-07-31 | 2021-04-30 | 2021-01-31 | 2020-10-31 | 2020-07-31 | 2020-04-30 | 2020-01-31 | 2019-10-31 | 2019-07-31 | 2019-04-30 | 2019-01-31 | 2018-10-31 | 2018-07-31 | 2018-04-30 | 2018-01-31 | 2017-10-31 | 2017-07-31 | 2017-04-30 | 2017-01-31 | 2016-10-31 | 2016-07-31 | 2016-04-30 | 2016-01-31 | 2015-10-31 | 2015-07-31 | 2015-04-30 | 2015-01-31 | 2014-10-31 | 2014-07-31 | 2014-04-30 | 2014-01-31 | 2013-10-31 | 2013-07-31 | 2013-04-30 | 2013-01-31 | 2012-10-31 | 2012-07-31 | 2012-04-30 | 2012-01-31 | 2011-10-31 | 2011-07-31 | 2011-04-30 | 2011-01-31 | 2010-10-31 | 2010-07-31 | ||
|---|---|---|---|---|---|---|---|---|---|---|---|---|---|---|---|---|---|---|---|---|---|---|---|---|---|---|---|---|---|---|---|---|---|---|---|---|---|---|---|---|---|---|---|---|---|---|---|---|---|---|---|---|---|---|---|---|
| Net Cash Provided By Used In Operating Activities | 361.31 | 13.79 | 10.65 | 201.83 | 310.73 | -305.44 | -121.06 | 11.17 | 201.19 | -209.21 | 146.78 | 47.04 | 202.33 | -187.38 | 132.90 | -73.10 | 429.19 | -87.26 | -107.58 | -25.33 | 339.94 | -150.63 | -61.16 | -24.32 | 325.33 | -131.23 | NA | NA | NA | NA | NA | NA | NA | NA | NA | NA | NA | NA | NA | NA | NA | -77.23 | -44.78 | -14.16 | 194.75 | -82.52 | -19.44 | -38.30 | 228.97 | -86.75 | -105.60 | -29.85 | 160.48 | -77.41 | NA | |
| Net Income Loss | 28.85 | 127.64 | 16.44 | 3.24 | -261.12 | 61.10 | 36.32 | 30.63 | 48.43 | 106.67 | 19.17 | 26.32 | 14.64 | 63.17 | -14.98 | -39.30 | 25.29 | 95.39 | 11.12 | 12.04 | 24.08 | 94.03 | 10.08 | 9.88 | -0.54 | 81.62 | -8.57 | -10.39 | -20.10 | 70.56 | -1.29 | 2.77 | 7.96 | 87.16 | 12.45 | 6.76 | 22.22 | 80.61 | 6.24 | 1.29 | 13.05 | 59.59 | 3.59 | 1.12 | 8.07 | 48.29 | 1.31 | -0.85 | 5.02 | 43.55 | 1.56 | -0.52 | 12.33 | 42.72 | 3.00 | |
| Profit Loss | 27.98 | 127.38 | 16.24 | 3.14 | -261.92 | 60.85 | 36.06 | 30.63 | 48.14 | 106.47 | 19.11 | 26.38 | 14.62 | 63.17 | -14.98 | -39.30 | 25.29 | 95.39 | 11.12 | 12.04 | 24.08 | 94.03 | 10.08 | 9.88 | -0.54 | 81.62 | -8.57 | -10.39 | -20.10 | 70.56 | -1.29 | 2.77 | 7.96 | 87.16 | 12.45 | 6.76 | 22.22 | 79.77 | 5.91 | 1.09 | 13.05 | 59.36 | 3.34 | 1.03 | 8.07 | 48.21 | 1.36 | -0.85 | 5.02 | 43.55 | 1.56 | -0.52 | NA | NA | NA | |
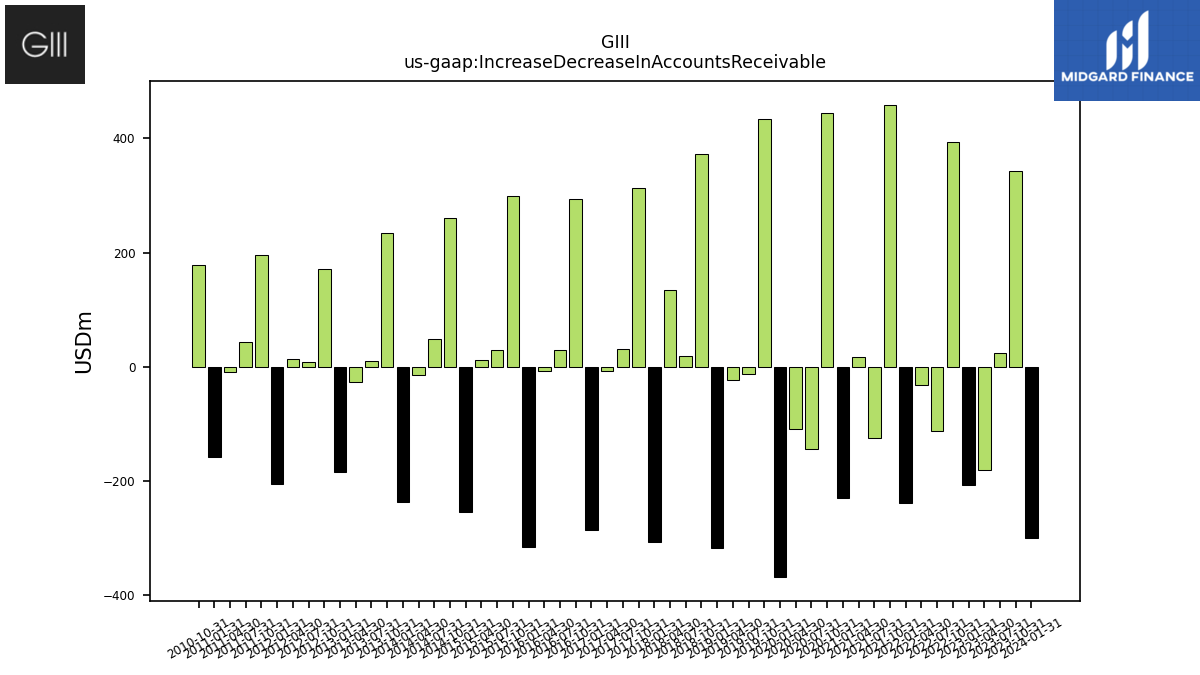
| Increase Decrease In Accounts Receivable | -300.86 | 343.86 | 24.76 | -180.36 | -207.29 | 393.41 | -113.24 | -31.90 | -238.87 | 459.33 | -124.38 | 16.73 | -229.74 | 444.47 | -144.64 | -108.99 | -368.89 | 434.37 | -13.71 | -23.76 | -317.45 | 371.94 | 18.81 | 134.59 | -306.87 | 313.64 | 30.92 | -7.74 | -286.12 | 293.92 | 29.47 | -7.97 | -315.80 | 298.74 | 29.80 | 10.88 | -253.98 | 261.15 | 48.30 | -14.95 | -237.81 | 234.77 | 10.66 | -26.23 | -184.93 | 170.88 | 8.29 | 14.02 | -205.58 | 196.55 | 43.32 | -10.12 | -158.76 | 177.44 | NA | |
| Increase Decrease In Inventories | -71.10 | -213.33 | 174.55 | -79.04 | -191.64 | -141.04 | 458.45 | 37.90 | 63.16 | -50.35 | 152.67 | -69.83 | -53.38 | -113.00 | 74.36 | -51.51 | -98.72 | -191.50 | 303.18 | -37.43 | -39.74 | -62.33 | 215.82 | -90.18 | -39.51 | -62.89 | 208.62 | -37.45 | -17.62 | -79.55 | 163.54 | -79.00 | -24.79 | -94.98 | 233.78 | -54.10 | -9.89 | -94.96 | 211.63 | -37.01 | -6.65 | -83.20 | 164.08 | -38.65 | -27.14 | -38.86 | 127.63 | -44.77 | -19.64 | -49.23 | 154.64 | -37.24 | -3.51 | -15.04 | NA | |
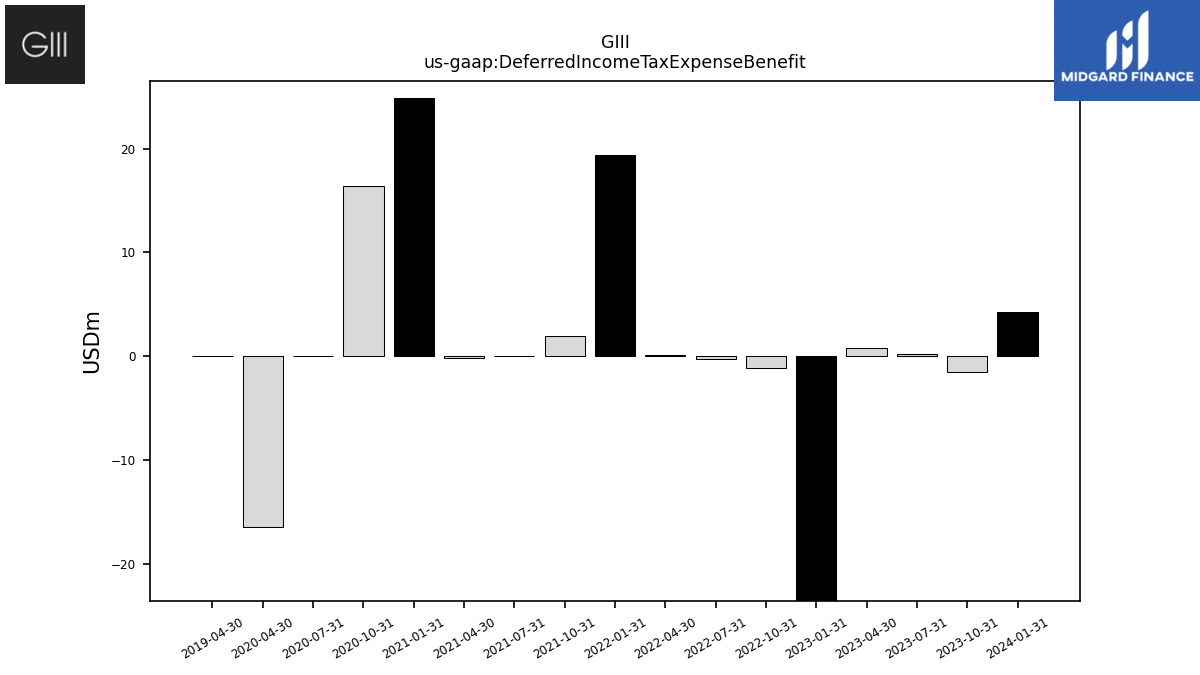
| Deferred Income Tax Expense Benefit | 4.26 | -1.55 | 0.25 | 0.78 | -53.80 | -1.12 | -0.30 | 0.07 | 19.37 | 1.91 | -0.02 | -0.14 | 24.84 | 16.42 | 0.00 | -16.41 | NA | NA | NA | 0.01 | NA | NA | NA | NA | NA | NA | NA | NA | NA | NA | NA | NA | NA | NA | NA | NA | NA | NA | NA | NA | NA | NA | NA | NA | NA | NA | NA | NA | NA | NA | NA | NA | NA | NA | NA | |
| Share Based Compensation | 5.44 | 4.89 | 3.00 | 3.84 | 3.56 | 3.67 | 4.70 | 20.55 | 5.65 | 3.35 | 5.87 | 2.55 | 2.12 | 2.28 | 2.55 | -0.81 | 3.90 | 4.31 | 5.12 | 4.23 | 4.82 | 5.44 | 5.67 | 3.77 | 4.30 | 5.10 | 5.31 | 4.96 | 3.64 | 4.24 | 4.55 | 4.47 | 4.15 | 3.80 | 4.01 | 3.62 | 3.79 | 2.65 | 2.86 | 2.92 | 3.13 | 2.72 | 2.13 | 1.98 | 3.25 | 1.53 | 1.45 | 1.51 | 1.58 | 1.58 | 1.12 | 0.92 | 0.89 | 0.89 | NA |
| 2024-01-31 | 2023-10-31 | 2023-07-31 | 2023-04-30 | 2023-01-31 | 2022-10-31 | 2022-07-31 | 2022-04-30 | 2022-01-31 | 2021-10-31 | 2021-07-31 | 2021-04-30 | 2021-01-31 | 2020-10-31 | 2020-07-31 | 2020-04-30 | 2020-01-31 | 2019-10-31 | 2019-07-31 | 2019-04-30 | 2019-01-31 | 2018-10-31 | 2018-07-31 | 2018-04-30 | 2018-01-31 | 2017-10-31 | 2017-07-31 | 2017-04-30 | 2017-01-31 | 2016-10-31 | 2016-07-31 | 2016-04-30 | 2016-01-31 | 2015-10-31 | 2015-07-31 | 2015-04-30 | 2015-01-31 | 2014-10-31 | 2014-07-31 | 2014-04-30 | 2014-01-31 | 2013-10-31 | 2013-07-31 | 2013-04-30 | 2013-01-31 | 2012-10-31 | 2012-07-31 | 2012-04-30 | 2012-01-31 | 2011-10-31 | 2011-07-31 | 2011-04-30 | 2011-01-31 | 2010-10-31 | 2010-07-31 | ||
|---|---|---|---|---|---|---|---|---|---|---|---|---|---|---|---|---|---|---|---|---|---|---|---|---|---|---|---|---|---|---|---|---|---|---|---|---|---|---|---|---|---|---|---|---|---|---|---|---|---|---|---|---|---|---|---|---|
| Net Cash Provided By Used In Investing Activities | -9.03 | -4.54 | -6.14 | -8.63 | -6.83 | 13.46 | -195.25 | -29.33 | -0.23 | -18.74 | -29.86 | -2.67 | -3.69 | -3.36 | -4.76 | -8.31 | -6.18 | -14.45 | -6.18 | -13.29 | -7.87 | -18.01 | -6.12 | -5.33 | -12.44 | -10.87 | NA | NA | NA | NA | NA | NA | NA | NA | NA | NA | NA | NA | NA | NA | NA | -5.03 | -6.10 | -4.58 | -4.64 | -80.83 | -2.36 | -2.16 | -4.77 | -5.77 | -6.12 | -4.40 | -4.89 | -3.82 | NA | |
| Payments To Acquire Productive Assets | 9.03 | 4.54 | 6.14 | 4.98 | 6.72 | 6.28 | 4.19 | 4.33 | 5.26 | 5.48 | 4.86 | 2.67 | 3.64 | 3.29 | 2.71 | 6.39 | 6.09 | 14.37 | 4.24 | 13.29 | 9.69 | 8.06 | 6.12 | 5.33 | 13.08 | 10.82 | 4.88 | 5.73 | 6.53 | 5.78 | 6.52 | 6.10 | 7.86 | 17.71 | 8.91 | 7.69 | 8.67 | 12.53 | 11.24 | 10.12 | 13.57 | 5.03 | 6.10 | 4.58 | NA | NA | NA | NA | NA | NA | NA | NA | NA | NA | NA |
| 2024-01-31 | 2023-10-31 | 2023-07-31 | 2023-04-30 | 2023-01-31 | 2022-10-31 | 2022-07-31 | 2022-04-30 | 2022-01-31 | 2021-10-31 | 2021-07-31 | 2021-04-30 | 2021-01-31 | 2020-10-31 | 2020-07-31 | 2020-04-30 | 2020-01-31 | 2019-10-31 | 2019-07-31 | 2019-04-30 | 2019-01-31 | 2018-10-31 | 2018-07-31 | 2018-04-30 | 2018-01-31 | 2017-10-31 | 2017-07-31 | 2017-04-30 | 2017-01-31 | 2016-10-31 | 2016-07-31 | 2016-04-30 | 2016-01-31 | 2015-10-31 | 2015-07-31 | 2015-04-30 | 2015-01-31 | 2014-10-31 | 2014-07-31 | 2014-04-30 | 2014-01-31 | 2013-10-31 | 2013-07-31 | 2013-04-30 | 2013-01-31 | 2012-10-31 | 2012-07-31 | 2012-04-30 | 2012-01-31 | 2011-10-31 | 2011-07-31 | 2011-04-30 | 2011-01-31 | 2010-10-31 | 2010-07-31 | ||
|---|---|---|---|---|---|---|---|---|---|---|---|---|---|---|---|---|---|---|---|---|---|---|---|---|---|---|---|---|---|---|---|---|---|---|---|---|---|---|---|---|---|---|---|---|---|---|---|---|---|---|---|---|---|---|---|---|
| Net Cash Provided By Used In Financing Activities | -45.55 | -4.76 | -98.57 | -95.75 | -270.54 | 299.31 | 31.61 | -8.74 | -18.93 | -1.88 | -3.78 | 1.15 | 1.35 | 86.49 | -494.47 | 501.41 | -283.94 | 118.68 | 103.91 | 16.86 | -330.76 | 194.43 | 44.04 | 54.34 | -337.60 | 150.70 | NA | NA | NA | NA | NA | NA | NA | NA | NA | NA | NA | NA | NA | NA | NA | 95.02 | 48.45 | 11.76 | -202.59 | 179.95 | 6.18 | 54.13 | -215.73 | 100.09 | 107.59 | 36.93 | -162.15 | 91.67 | NA | |
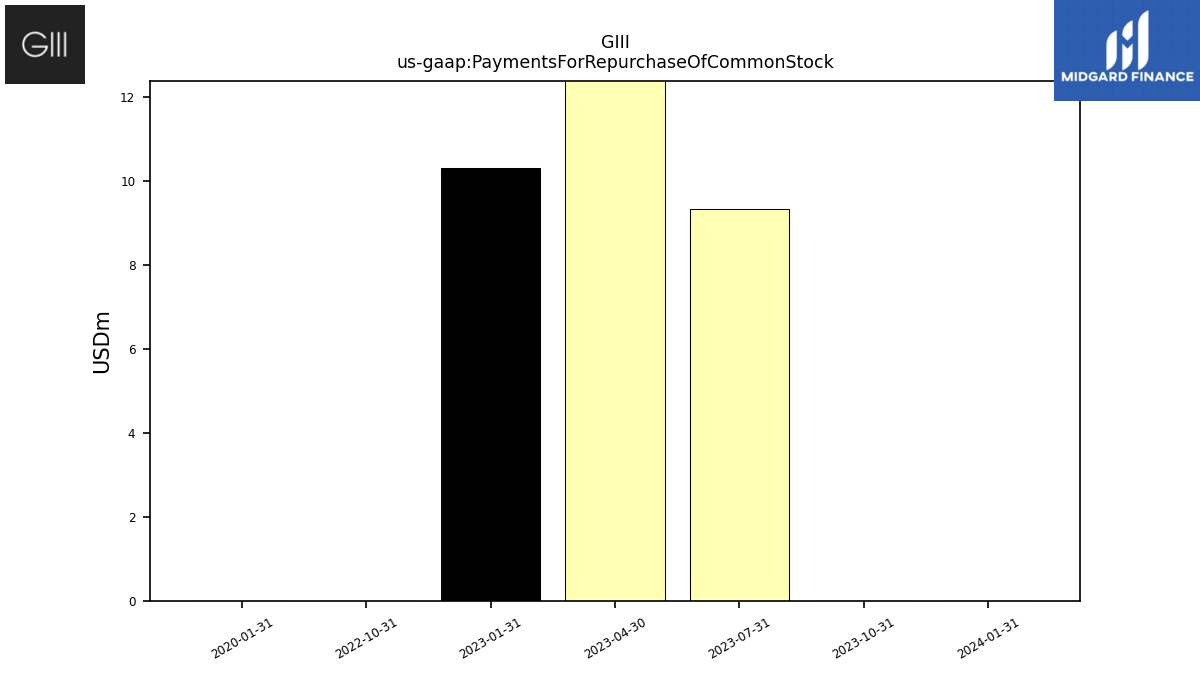
| Payments For Repurchase Of Common Stock | 0.00 | 0.00 | 9.33 | 16.77 | 10.33 | 0.00 | NA | NA | NA | NA | NA | NA | NA | NA | NA | NA | 0.00 | NA | NA | NA | NA | NA | NA | NA | NA | NA | NA | NA | NA | NA | NA | NA | NA | NA | NA | NA | NA | NA | NA | NA | NA | NA | NA | NA | NA | NA | NA | NA | NA | NA | NA | NA | NA | NA | NA |
| 2024-01-31 | 2023-10-31 | 2023-07-31 | 2023-04-30 | 2023-01-31 | 2022-10-31 | 2022-07-31 | 2022-04-30 | 2022-01-31 | 2021-10-31 | 2021-07-31 | 2021-04-30 | 2021-01-31 | 2020-10-31 | 2020-07-31 | 2020-04-30 | 2020-01-31 | 2019-10-31 | 2019-07-31 | 2019-04-30 | 2019-01-31 | 2018-10-31 | 2018-07-31 | 2018-04-30 | 2018-01-31 | 2017-10-31 | 2017-07-31 | 2017-04-30 | 2017-01-31 | 2016-10-31 | 2016-07-31 | 2016-04-30 | 2016-01-31 | 2015-10-31 | 2015-07-31 | 2015-04-30 | 2015-01-31 | 2014-10-31 | 2014-07-31 | 2014-04-30 | 2014-01-31 | 2013-10-31 | 2013-07-31 | 2013-04-30 | 2013-01-31 | 2012-10-31 | 2012-07-31 | 2012-04-30 | 2012-01-31 | 2011-10-31 | 2011-07-31 | 2011-04-30 | 2011-01-31 | 2010-10-31 | 2010-07-31 | ||
|---|---|---|---|---|---|---|---|---|---|---|---|---|---|---|---|---|---|---|---|---|---|---|---|---|---|---|---|---|---|---|---|---|---|---|---|---|---|---|---|---|---|---|---|---|---|---|---|---|---|---|---|---|---|---|---|---|
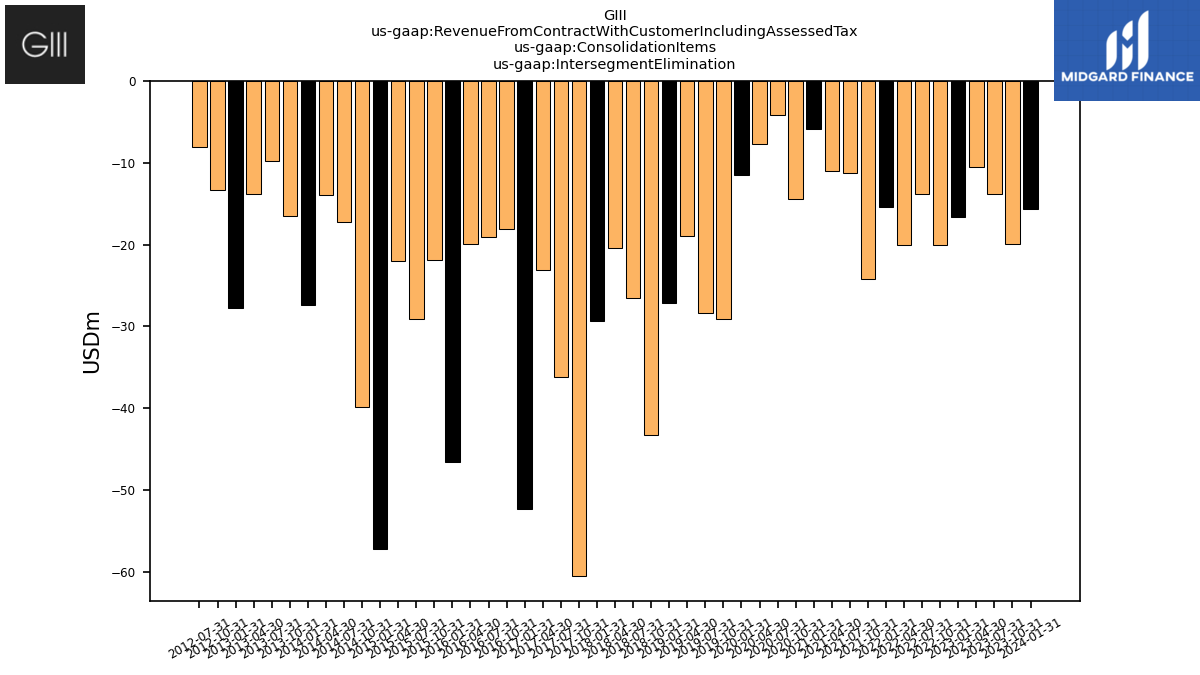
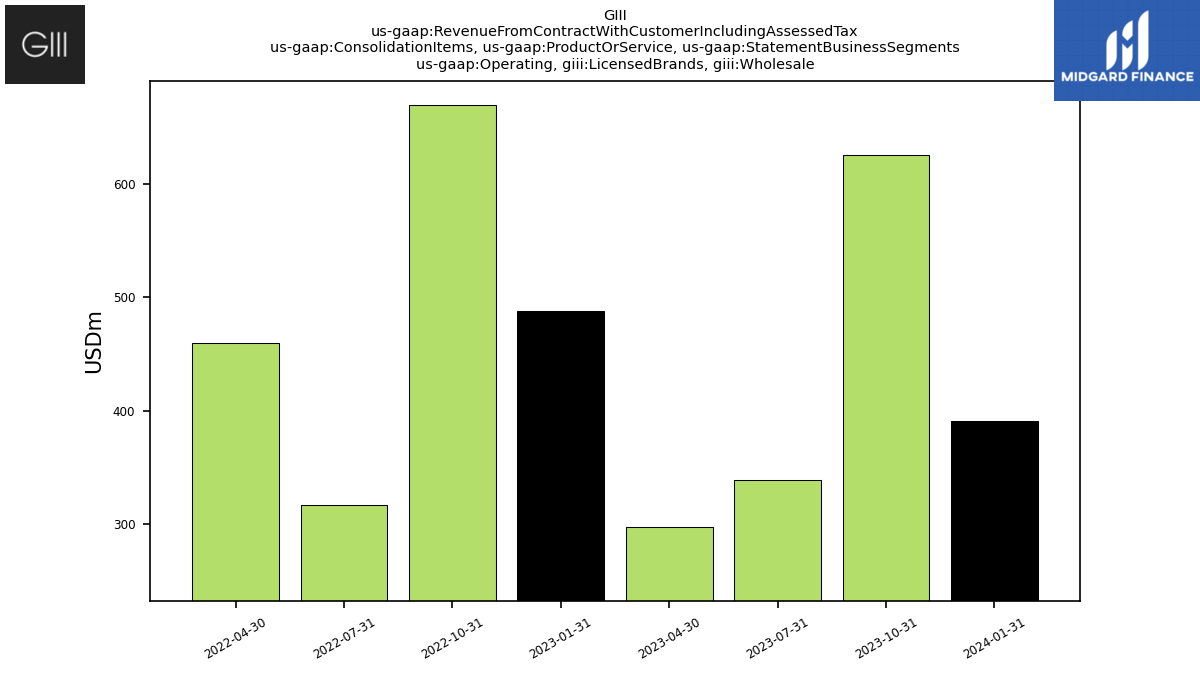
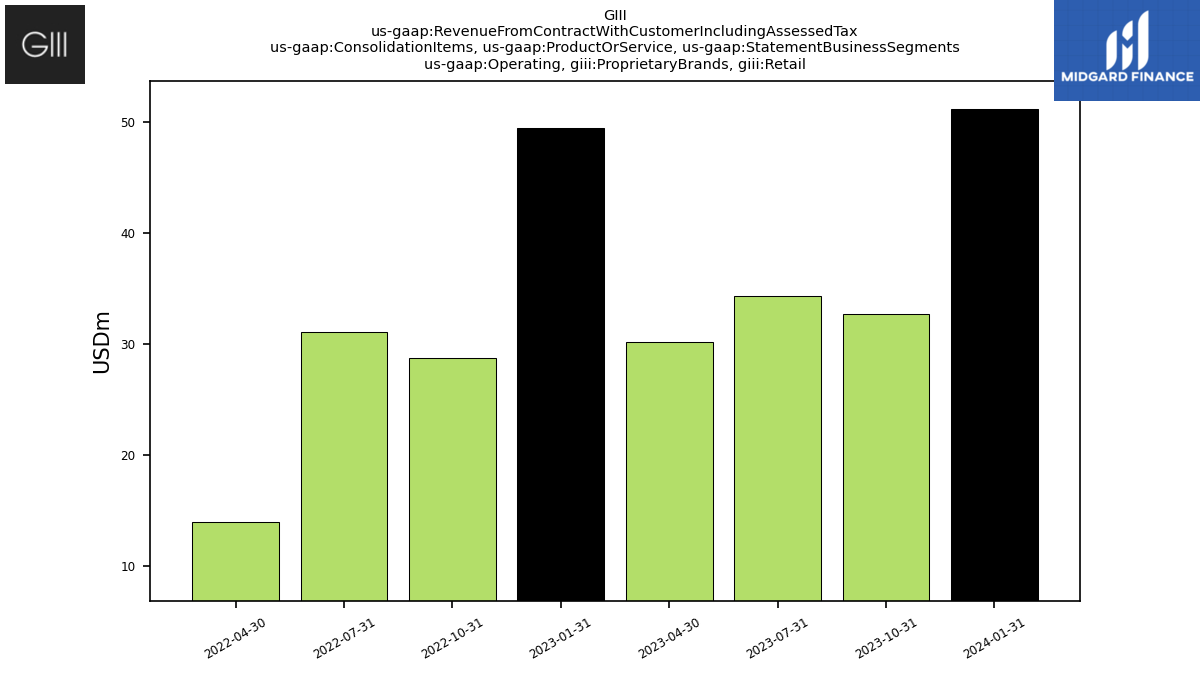
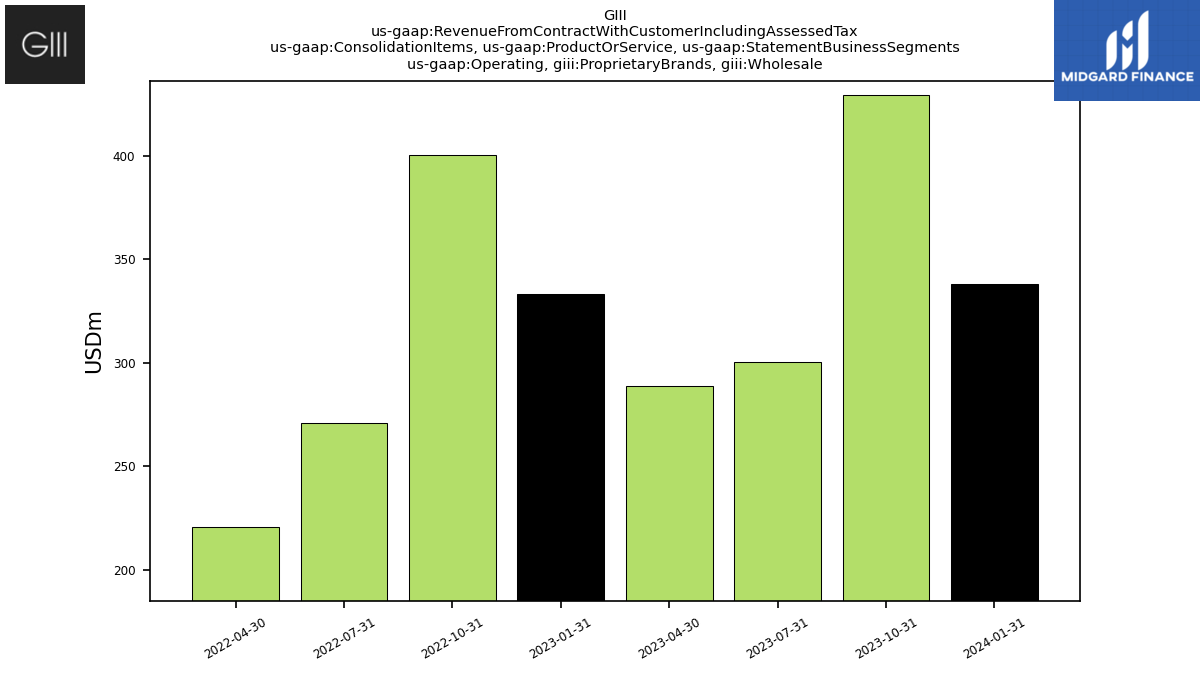
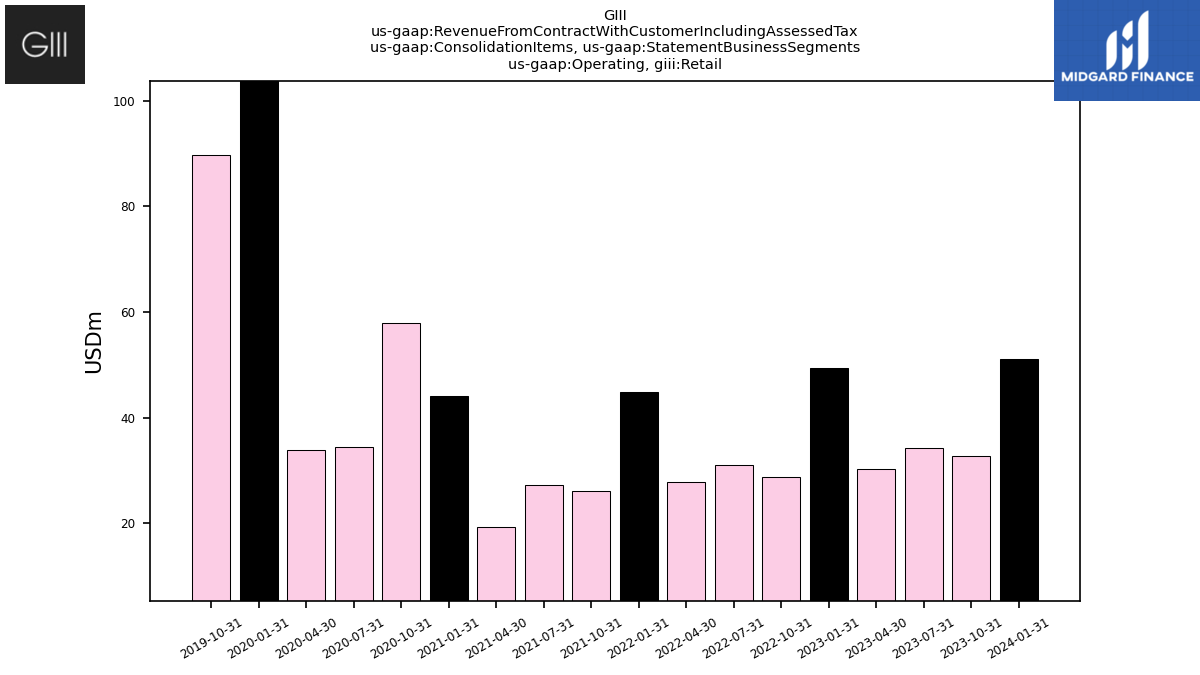
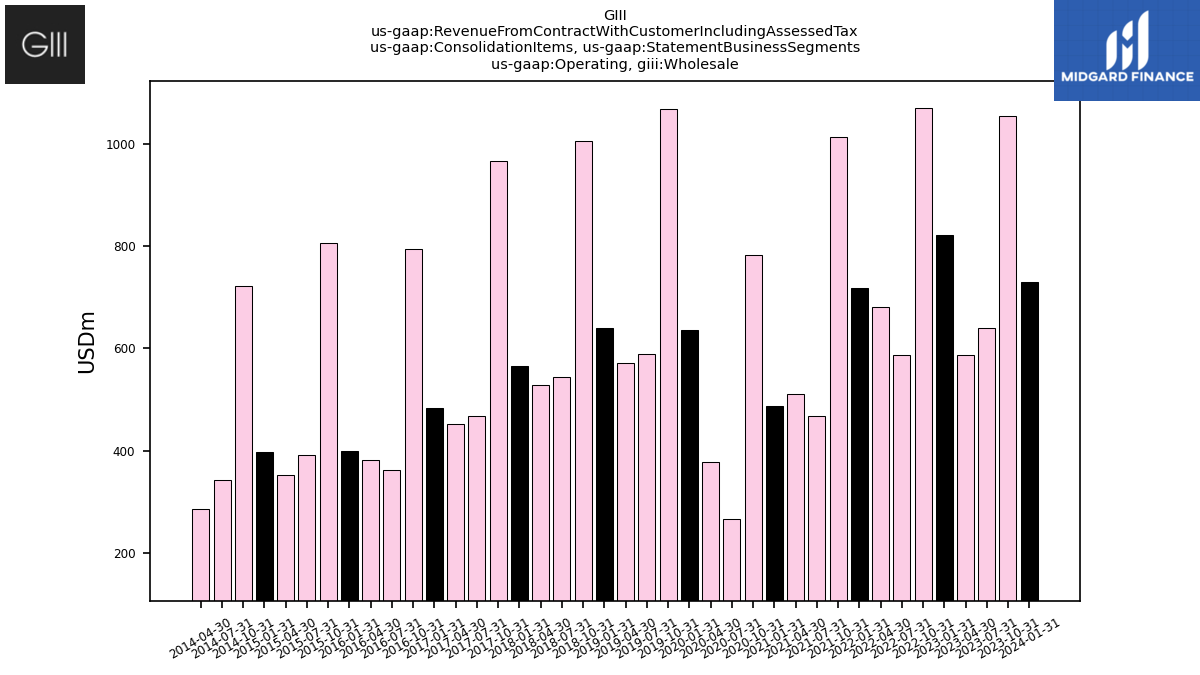
| Revenue From Contract With Customer Including Assessed Tax | 764.78 | 1067.11 | 659.76 | 606.59 | 854.43 | 1078.30 | 605.24 | 688.76 | 748.15 | 1015.39 | 483.08 | 519.91 | 526.24 | 826.56 | 297.21 | 405.13 | 754.62 | 1128.40 | 643.89 | 633.55 | 766.78 | 1072.98 | 624.70 | 611.74 | 714.90 | 1024.99 | 538.01 | 529.04 | 603.29 | 883.48 | 442.27 | 457.40 | 527.43 | 909.87 | 473.88 | 432.96 | 514.32 | 812.33 | 424.01 | 366.19 | 472.76 | 668.70 | 304.16 | 272.62 | 375.28 | 543.51 | 251.48 | 229.45 | 294.35 | 510.01 | 229.97 | 196.87 | 270.17 | 450.00 | 188.96 | |
| Intersegment Elimination | -15.60 | -19.90 | -13.76 | -10.53 | -16.64 | -20.04 | -13.82 | -20.03 | -15.45 | -24.21 | -11.22 | -11.02 | -5.83 | -14.45 | -4.10 | -7.65 | -11.50 | -29.13 | -28.41 | -18.99 | -27.19 | -43.31 | -26.56 | -20.45 | -29.37 | -60.54 | -36.20 | -23.16 | -52.38 | -18.14 | -19.04 | -19.96 | -46.57 | -21.84 | -29.07 | -22.05 | -57.26 | -39.91 | -17.25 | -13.90 | -27.44 | -16.57 | -9.79 | -13.83 | -27.77 | -13.33 | -8.12 | NA | NA | NA | NA | NA | NA | NA | NA | |
| Operating, Licensed Brands, Wholesale | 391.37 | 625.23 | 338.66 | 298.00 | 488.38 | 669.41 | 317.08 | 459.98 | NA | NA | NA | NA | NA | NA | NA | NA | NA | NA | NA | NA | NA | NA | NA | NA | NA | NA | NA | NA | NA | NA | NA | NA | NA | NA | NA | NA | NA | NA | NA | NA | NA | NA | NA | NA | NA | NA | NA | NA | NA | NA | NA | NA | NA | NA | NA | |
| Operating, Proprietary Brands, Retail | 51.16 | 32.71 | 34.34 | 30.22 | 49.47 | 28.76 | 31.11 | 13.96 | NA | NA | NA | NA | NA | NA | NA | NA | NA | NA | NA | NA | NA | NA | NA | NA | NA | NA | NA | NA | NA | NA | NA | NA | NA | NA | NA | NA | NA | NA | NA | NA | NA | NA | NA | NA | NA | NA | NA | NA | NA | NA | NA | NA | NA | NA | NA | |
| Operating, Proprietary Brands, Wholesale | 337.86 | 429.07 | 300.53 | 288.90 | 333.21 | 400.17 | 270.87 | 220.92 | NA | NA | NA | NA | NA | NA | NA | NA | NA | NA | NA | NA | NA | NA | NA | NA | NA | NA | NA | NA | NA | NA | NA | NA | NA | NA | NA | NA | NA | NA | NA | NA | NA | NA | NA | NA | NA | NA | NA | NA | NA | NA | NA | NA | NA | NA | NA | |
| Operating, Retail | 51.16 | 32.71 | 34.34 | 30.22 | 49.47 | 28.76 | 31.11 | 27.89 | 44.79 | 26.16 | 27.29 | 19.42 | 44.02 | 57.98 | 34.51 | 33.91 | 130.63 | 89.67 | NA | NA | NA | NA | NA | NA | NA | NA | NA | NA | NA | NA | NA | NA | NA | NA | NA | NA | NA | NA | NA | NA | NA | NA | NA | NA | NA | NA | NA | NA | NA | NA | NA | NA | NA | NA | NA | |
| Operating, Wholesale | 729.22 | 1054.30 | 639.18 | 586.90 | 821.59 | 1069.57 | 587.96 | 680.90 | 718.82 | 1013.44 | 467.01 | 511.51 | 488.05 | 783.03 | 266.81 | 378.87 | 635.49 | 1067.86 | 588.60 | 570.64 | 639.33 | 1005.36 | 544.60 | 527.67 | 566.11 | 966.82 | 467.77 | 453.02 | 483.64 | 794.38 | 361.34 | 382.37 | 398.67 | 807.03 | 391.46 | 352.49 | 396.82 | 722.13 | 341.87 | 285.07 | NA | NA | NA | NA | NA | NA | NA | NA | NA | NA | NA | NA | NA | NA | NA |


