
| 2023-12-31 | 2023-09-30 | 2023-06-30 | 2023-03-31 | 2022-12-31 | 2022-09-30 | 2022-06-30 | 2022-03-31 | 2021-12-31 | 2021-09-30 | 2021-06-30 | 2021-03-31 | 2020-12-31 | 2020-09-30 | 2020-06-30 | 2020-03-31 | 2019-12-31 | 2019-09-30 | 2019-06-30 | 2019-03-31 | 2018-12-31 | 2018-09-30 | 2018-06-30 | 2018-03-31 | 2017-12-31 | 2017-09-30 | 2017-06-30 | 2017-03-31 | 2016-12-31 | 2016-09-30 | 2016-06-30 | 2016-03-31 | 2015-12-31 | 2015-09-30 | 2015-06-30 | 2015-03-31 | 2014-12-31 | 2014-09-30 | 2014-06-30 | 2014-03-31 | 2013-12-31 | 2013-09-30 | 2013-06-30 | 2013-03-31 | 2012-12-31 | 2012-09-30 | 2012-06-30 | 2012-03-31 | 2011-12-31 | 2011-09-30 | 2011-06-30 | 2011-03-31 | 2010-12-31 | 2010-09-30 | 2010-06-30 | ||
|---|---|---|---|---|---|---|---|---|---|---|---|---|---|---|---|---|---|---|---|---|---|---|---|---|---|---|---|---|---|---|---|---|---|---|---|---|---|---|---|---|---|---|---|---|---|---|---|---|---|---|---|---|---|---|---|---|
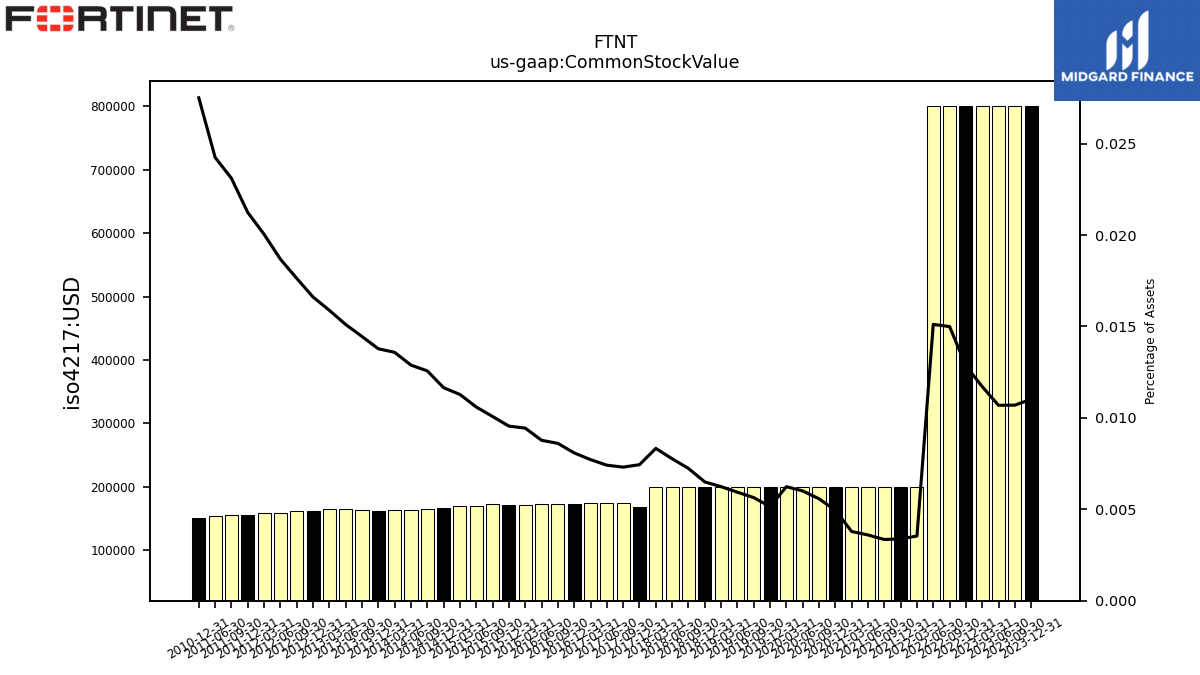
| Common Stock Value | 0.80 | 0.80 | 0.80 | 0.80 | 0.80 | 0.80 | 0.80 | 0.20 | 0.20 | 0.20 | 0.20 | 0.20 | 0.20 | 0.20 | 0.20 | 0.20 | 0.20 | 0.20 | 0.20 | 0.20 | 0.20 | 0.20 | 0.20 | 0.20 | 0.17 | 0.17 | 0.17 | 0.17 | 0.17 | 0.17 | 0.17 | 0.17 | 0.17 | 0.17 | 0.17 | 0.17 | 0.17 | 0.17 | 0.16 | 0.16 | 0.16 | 0.16 | 0.16 | 0.16 | 0.16 | 0.16 | 0.16 | 0.16 | 0.16 | 0.15 | 0.15 | NA | 0.15 | NA | NA | |
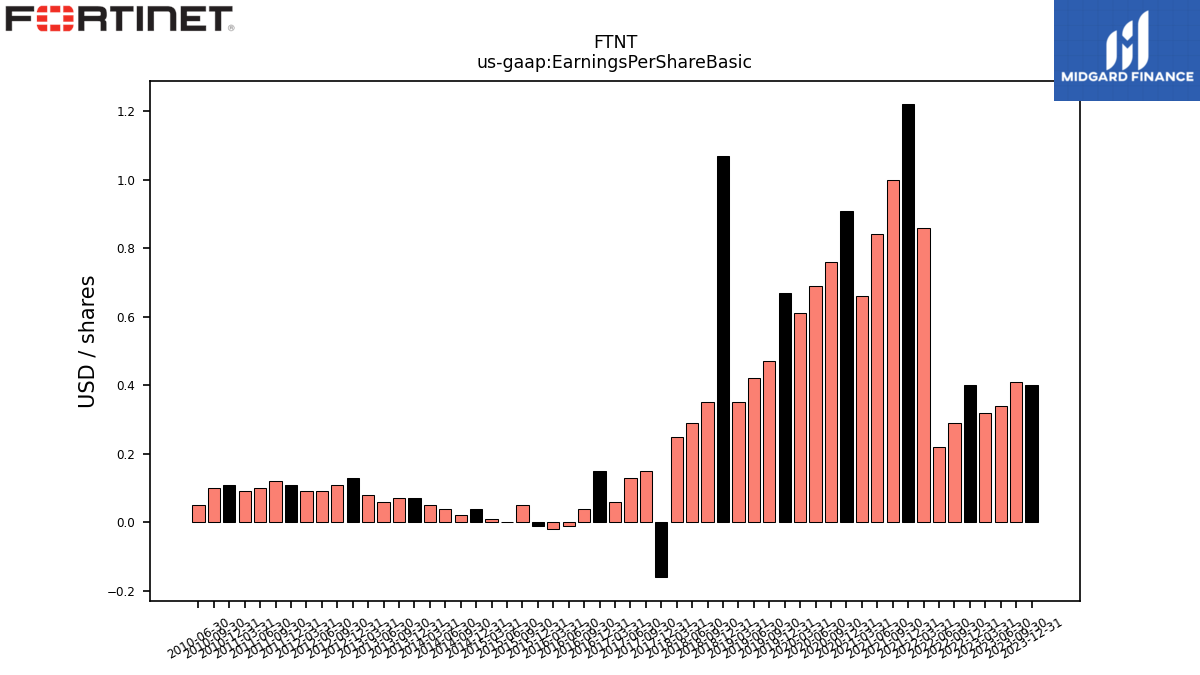
| Earnings Per Share Basic | 0.40 | 0.41 | 0.34 | 0.32 | 0.40 | 0.29 | 0.22 | 0.86 | 1.22 | 1.00 | 0.84 | 0.66 | 0.91 | 0.76 | 0.69 | 0.61 | 0.67 | 0.47 | 0.42 | 0.35 | 1.07 | 0.35 | 0.29 | 0.25 | -0.16 | 0.15 | 0.13 | 0.06 | 0.15 | 0.04 | -0.01 | -0.02 | -0.01 | 0.05 | 0.00 | 0.01 | 0.04 | 0.02 | 0.04 | 0.05 | 0.07 | 0.07 | 0.06 | 0.08 | 0.13 | 0.11 | 0.09 | 0.09 | 0.11 | 0.12 | 0.10 | 0.09 | 0.11 | 0.10 | 0.05 | |
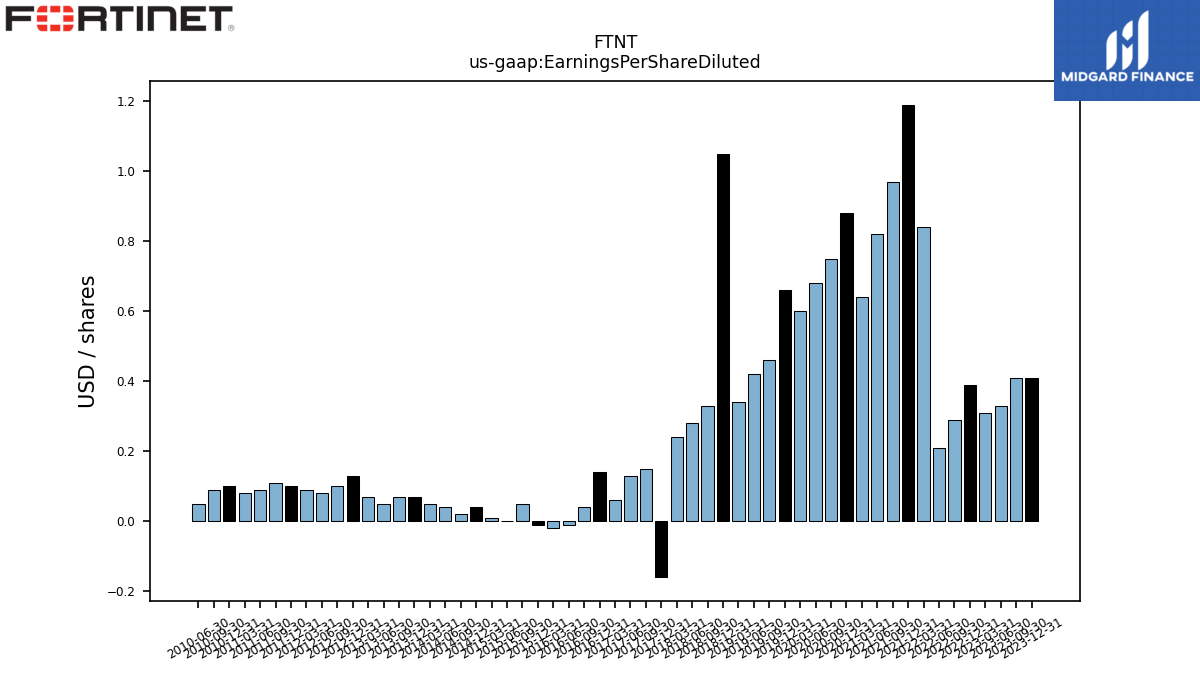
| Earnings Per Share Diluted | 0.41 | 0.41 | 0.33 | 0.31 | 0.39 | 0.29 | 0.21 | 0.84 | 1.19 | 0.97 | 0.82 | 0.64 | 0.88 | 0.75 | 0.68 | 0.60 | 0.66 | 0.46 | 0.42 | 0.34 | 1.05 | 0.33 | 0.28 | 0.24 | -0.16 | 0.15 | 0.13 | 0.06 | 0.14 | 0.04 | -0.01 | -0.02 | -0.01 | 0.05 | 0.00 | 0.01 | 0.04 | 0.02 | 0.04 | 0.05 | 0.07 | 0.07 | 0.05 | 0.07 | 0.13 | 0.10 | 0.08 | 0.09 | 0.10 | 0.11 | 0.09 | 0.08 | 0.10 | 0.09 | 0.05 |
| 2023-12-31 | 2023-09-30 | 2023-06-30 | 2023-03-31 | 2022-12-31 | 2022-09-30 | 2022-06-30 | 2022-03-31 | 2021-12-31 | 2021-09-30 | 2021-06-30 | 2021-03-31 | 2020-12-31 | 2020-09-30 | 2020-06-30 | 2020-03-31 | 2019-12-31 | 2019-09-30 | 2019-06-30 | 2019-03-31 | 2018-12-31 | 2018-09-30 | 2018-06-30 | 2018-03-31 | 2017-12-31 | 2017-09-30 | 2017-06-30 | 2017-03-31 | 2016-12-31 | 2016-09-30 | 2016-06-30 | 2016-03-31 | 2015-12-31 | 2015-09-30 | 2015-06-30 | 2015-03-31 | 2014-12-31 | 2014-09-30 | 2014-06-30 | 2014-03-31 | 2013-12-31 | 2013-09-30 | 2013-06-30 | 2013-03-31 | 2012-12-31 | 2012-09-30 | 2012-06-30 | 2012-03-31 | 2011-12-31 | 2011-09-30 | 2011-06-30 | 2011-03-31 | 2010-12-31 | 2010-09-30 | 2010-06-30 | ||
|---|---|---|---|---|---|---|---|---|---|---|---|---|---|---|---|---|---|---|---|---|---|---|---|---|---|---|---|---|---|---|---|---|---|---|---|---|---|---|---|---|---|---|---|---|---|---|---|---|---|---|---|---|---|---|---|---|
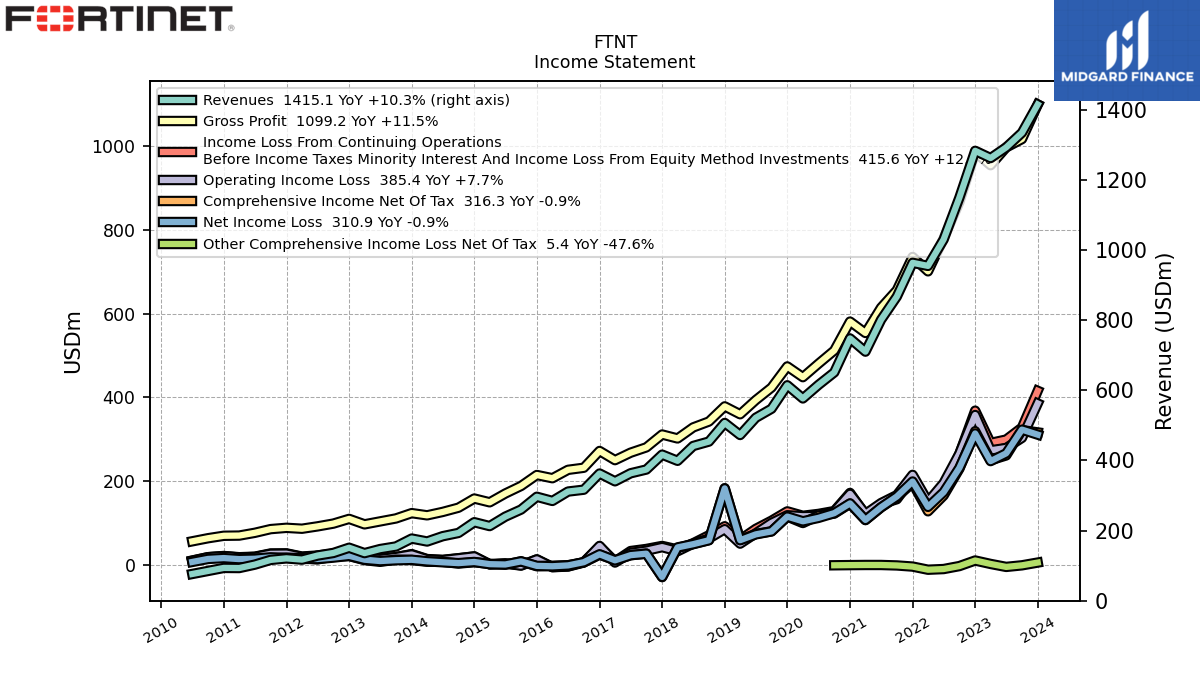
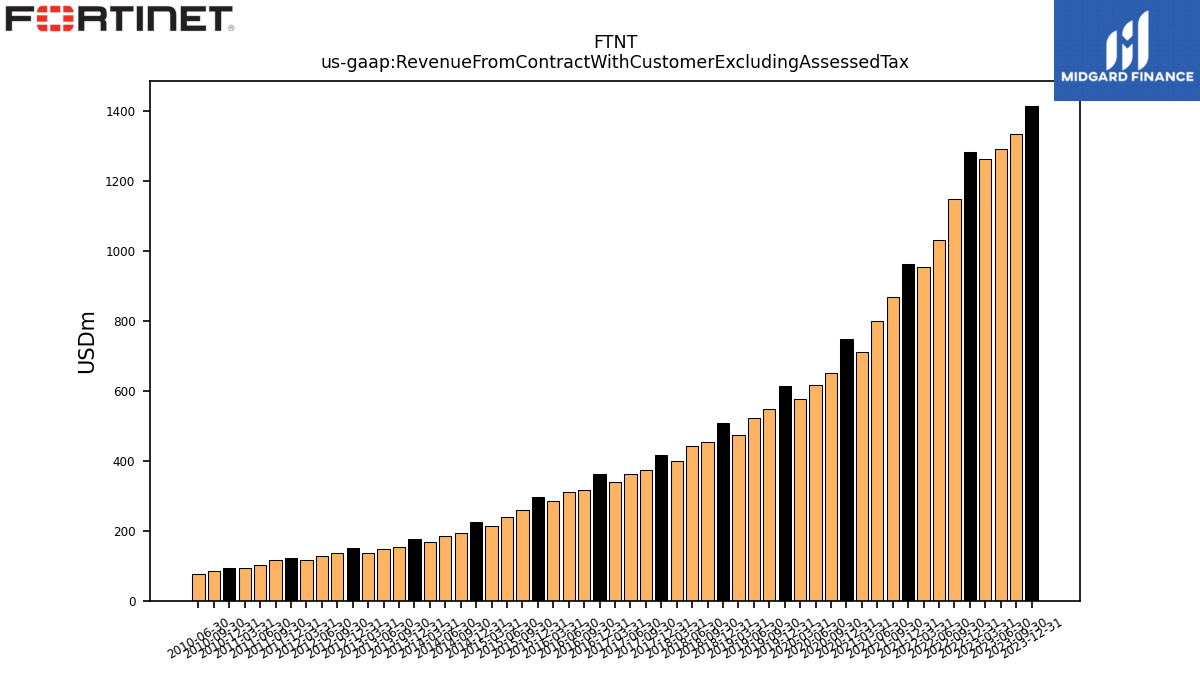
| Revenue From Contract With Customer Excluding Assessed Tax | 1415.10 | 1334.60 | 1292.80 | 1262.30 | 1283.00 | 1149.50 | 1030.10 | 954.80 | 963.60 | 867.20 | 801.10 | 710.30 | 748.00 | 651.10 | 615.50 | 576.90 | 614.40 | 547.50 | 521.70 | 472.60 | 507.00 | 453.90 | 441.30 | 399.00 | 416.64 | 374.22 | 363.47 | 340.58 | 362.83 | 316.65 | 311.39 | 284.58 | 296.53 | 260.07 | 239.78 | 212.89 | 223.97 | 193.35 | 184.10 | 168.95 | 177.35 | 154.70 | 147.43 | 135.82 | 151.16 | 136.27 | 128.96 | 117.25 | 120.86 | 116.43 | 103.02 | 93.27 | 93.60 | 84.97 | 76.33 | |
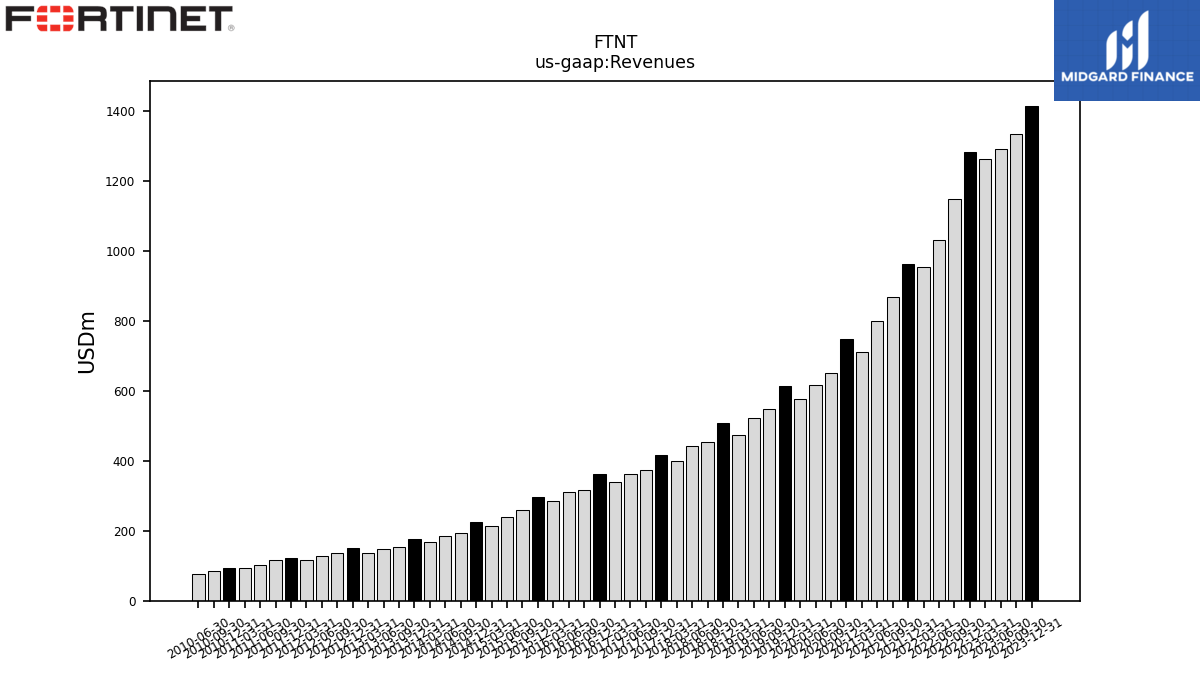
| Revenues | 1415.10 | 1334.60 | 1292.80 | 1262.30 | 1283.00 | 1149.50 | 1030.10 | 954.80 | 963.60 | 867.20 | 801.10 | 710.30 | 748.00 | 651.10 | 615.50 | 576.90 | 614.40 | 547.50 | 521.70 | 472.60 | 507.00 | 453.90 | 441.30 | 399.00 | 416.64 | 374.22 | 363.47 | 340.58 | 362.83 | 316.65 | 311.39 | 284.58 | 296.53 | 260.07 | 239.78 | 212.89 | 223.97 | 193.35 | 184.10 | 168.95 | 177.35 | 154.70 | 147.43 | 135.82 | 151.16 | 136.27 | 128.96 | 117.25 | 120.86 | 116.43 | 103.02 | 93.27 | 93.60 | 84.97 | 76.33 | |
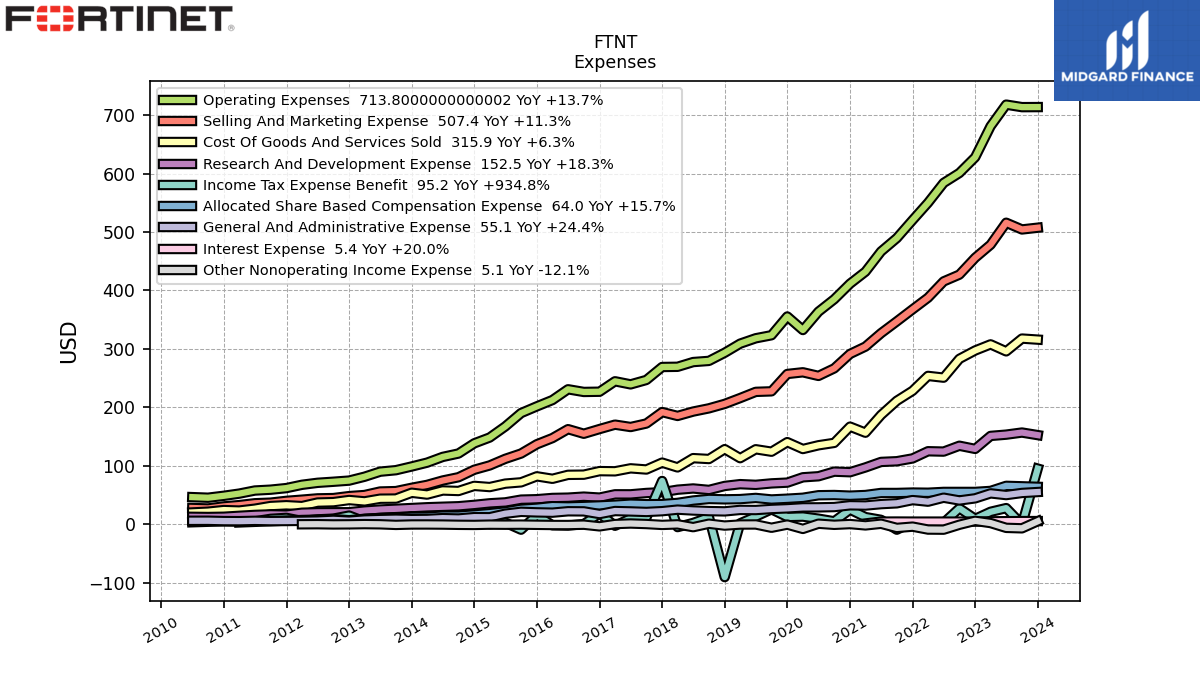
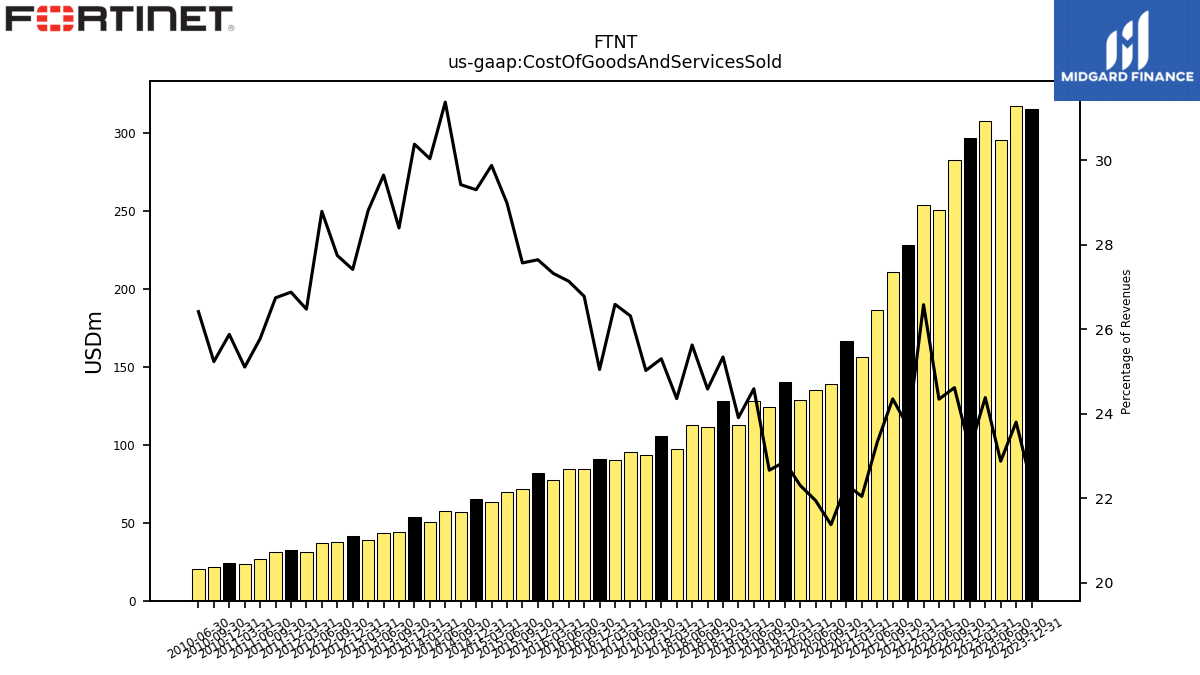
| Cost Of Goods And Services Sold | 315.90 | 317.70 | 295.80 | 307.80 | 297.30 | 283.00 | 250.80 | 253.80 | 228.30 | 211.20 | 186.90 | 156.60 | 167.00 | 139.20 | 135.10 | 128.70 | 140.50 | 124.10 | 128.30 | 113.00 | 128.50 | 111.60 | 113.10 | 97.20 | 105.42 | 93.65 | 95.65 | 90.56 | 90.89 | 84.80 | 84.50 | 77.75 | 81.98 | 71.70 | 69.50 | 63.60 | 65.62 | 56.88 | 57.76 | 50.74 | 53.88 | 43.93 | 43.71 | 39.13 | 41.44 | 37.81 | 37.13 | 31.04 | 32.48 | 31.14 | 26.56 | 23.42 | 24.22 | 21.44 | 20.16 | |
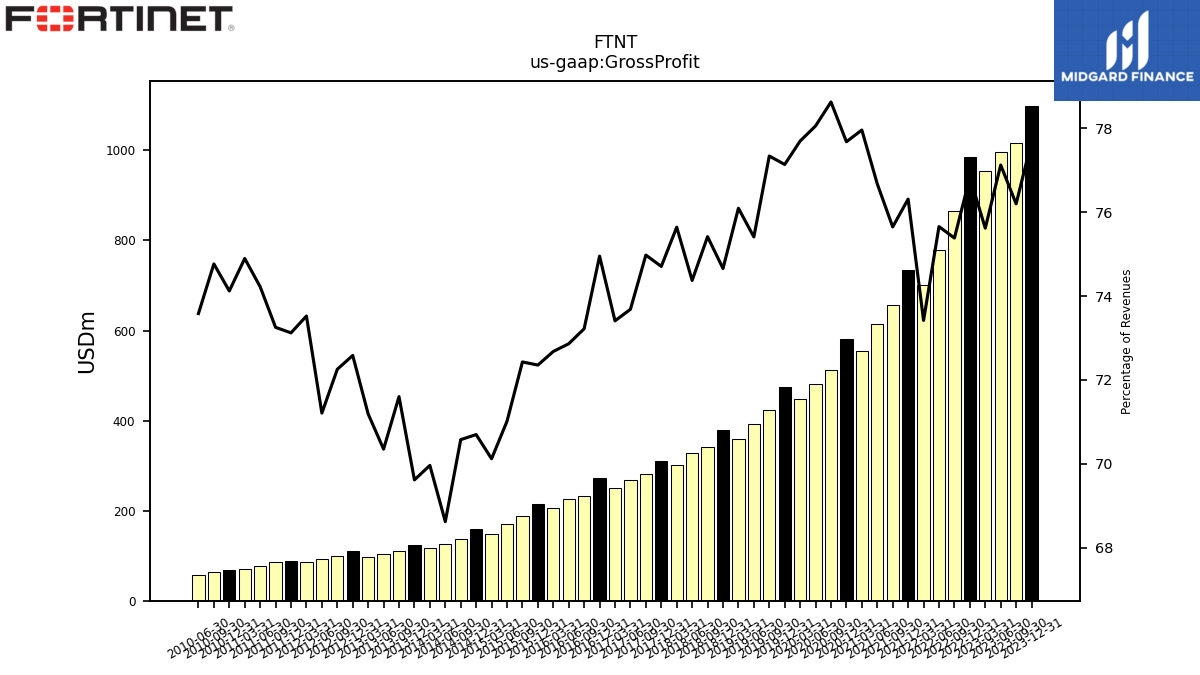
| Gross Profit | 1099.20 | 1016.90 | 997.00 | 954.50 | 985.70 | 866.50 | 779.30 | 701.00 | 735.30 | 656.00 | 614.20 | 553.70 | 581.00 | 511.90 | 480.40 | 448.20 | 473.90 | 423.40 | 393.40 | 359.60 | 378.50 | 342.30 | 328.20 | 301.80 | 311.25 | 280.57 | 267.82 | 250.01 | 271.94 | 231.85 | 226.89 | 206.83 | 214.55 | 188.37 | 170.29 | 149.28 | 158.34 | 136.46 | 126.34 | 118.21 | 123.47 | 110.77 | 103.72 | 96.69 | 109.72 | 98.46 | 91.83 | 86.20 | 88.38 | 85.29 | 76.47 | 69.85 | 69.38 | 63.53 | 56.17 | |
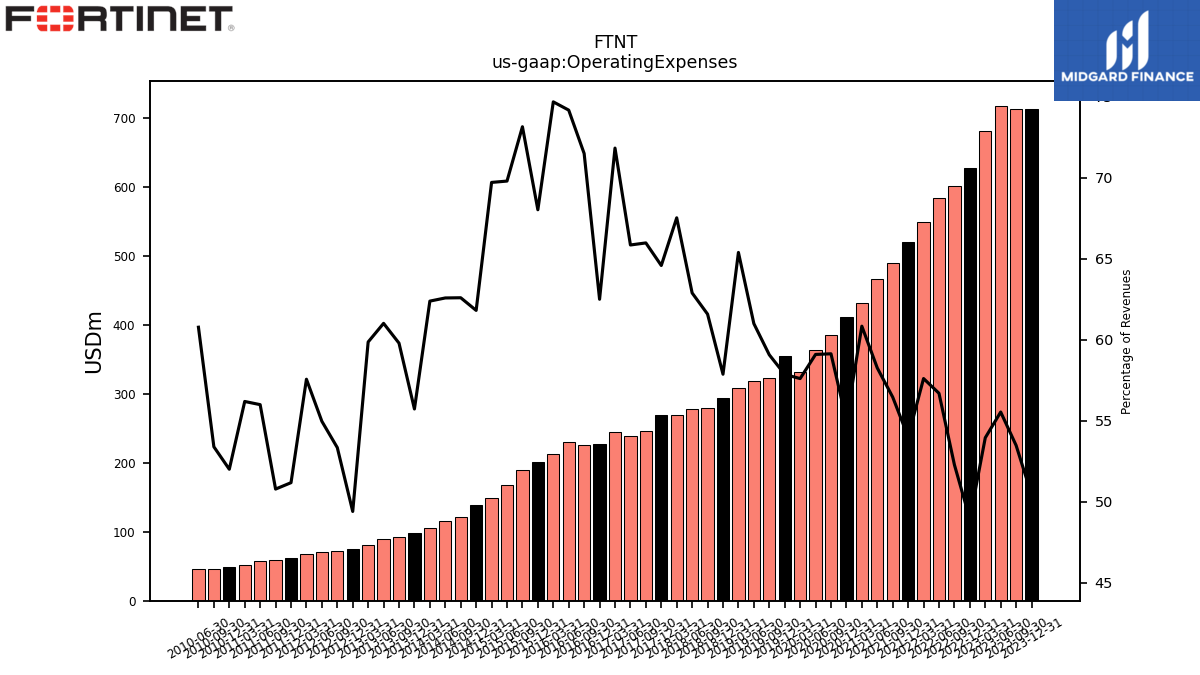
| Operating Expenses | 713.80 | 713.70 | 718.00 | 681.00 | 627.90 | 601.00 | 584.00 | 550.00 | 520.40 | 489.60 | 466.70 | 432.10 | 411.60 | 385.00 | 363.70 | 332.30 | 355.50 | 323.40 | 318.20 | 309.00 | 293.40 | 279.50 | 277.50 | 269.40 | 269.05 | 246.87 | 239.32 | 244.60 | 226.75 | 226.36 | 230.93 | 212.50 | 201.69 | 190.21 | 167.34 | 148.39 | 138.43 | 121.01 | 115.20 | 105.39 | 98.83 | 92.49 | 89.94 | 81.30 | 74.68 | 72.69 | 70.89 | 67.49 | 61.86 | 59.13 | 57.69 | 52.41 | 48.68 | 45.37 | 46.39 | |
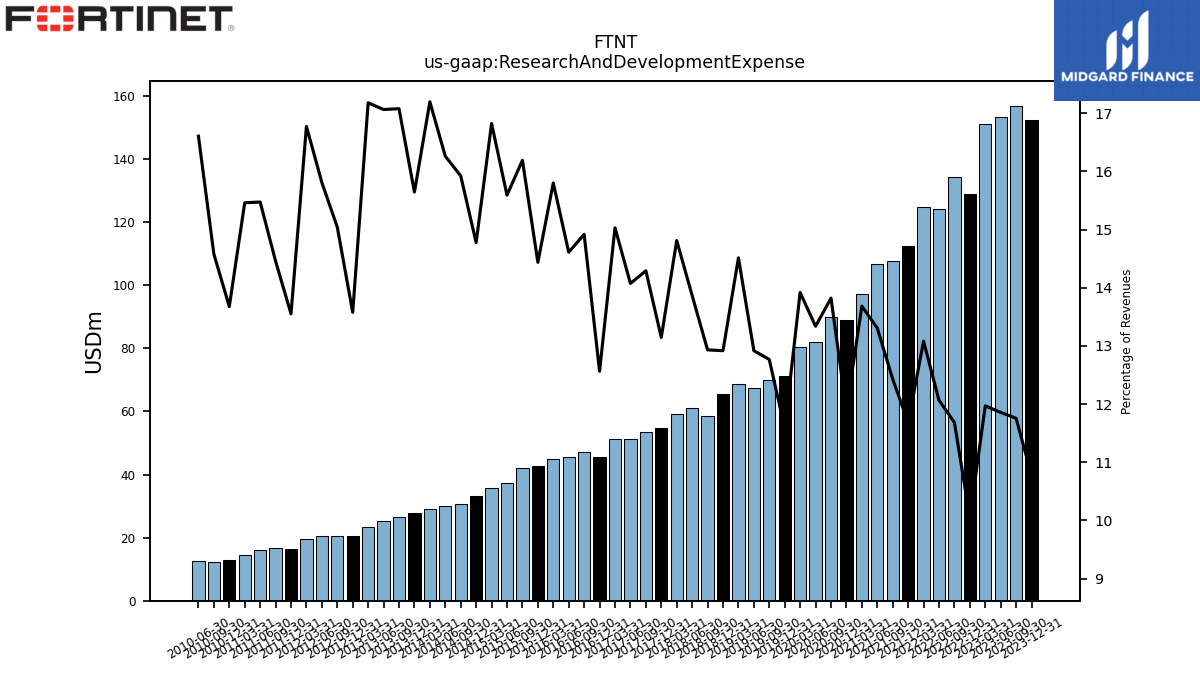
| Research And Development Expense | 152.50 | 156.90 | 153.30 | 151.10 | 128.90 | 134.30 | 124.30 | 124.90 | 112.60 | 107.80 | 106.60 | 97.20 | 89.00 | 90.00 | 82.10 | 80.30 | 71.20 | 69.90 | 67.40 | 68.60 | 65.50 | 58.70 | 61.20 | 59.10 | 54.77 | 53.49 | 51.16 | 51.20 | 45.59 | 47.24 | 45.50 | 44.97 | 42.81 | 42.11 | 37.39 | 35.82 | 33.10 | 30.79 | 29.94 | 29.05 | 27.75 | 26.42 | 25.16 | 23.33 | 20.52 | 20.50 | 20.39 | 19.67 | 16.38 | 16.83 | 15.94 | 14.42 | 12.80 | 12.39 | 12.68 | |
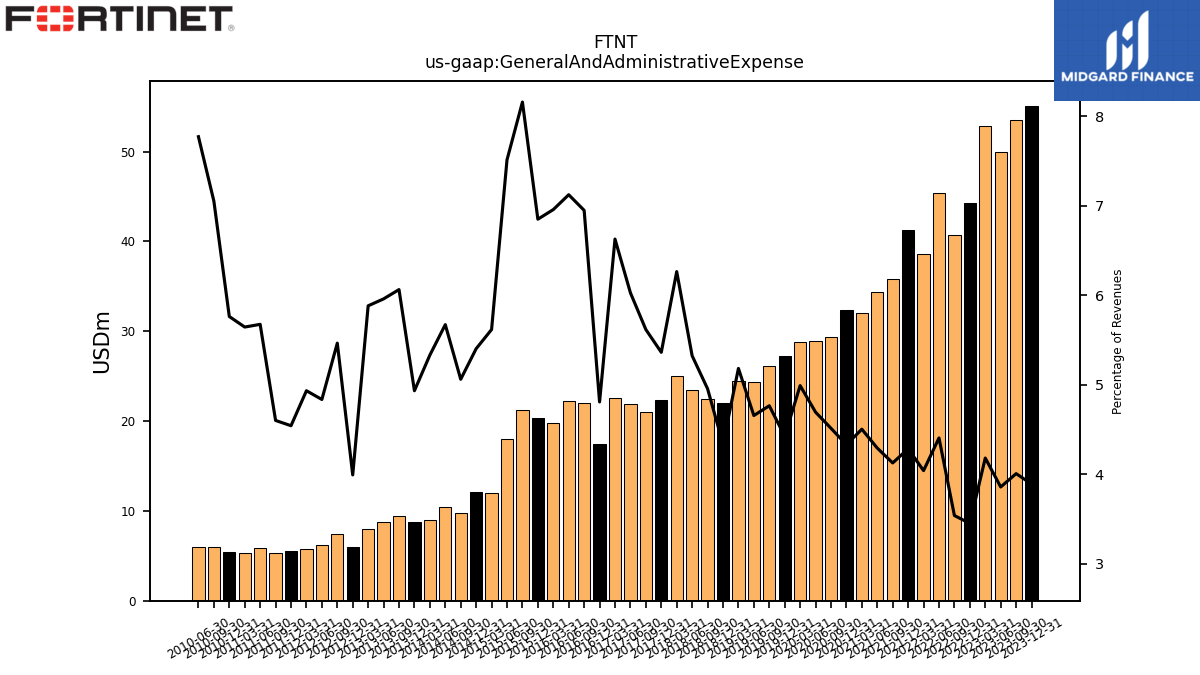
| General And Administrative Expense | 55.10 | 53.50 | 49.90 | 52.80 | 44.30 | 40.70 | 45.40 | 38.60 | 41.30 | 35.80 | 34.40 | 32.00 | 32.40 | 29.40 | 28.90 | 28.80 | 27.20 | 26.10 | 24.30 | 24.50 | 22.00 | 22.50 | 23.50 | 25.00 | 22.35 | 21.02 | 21.91 | 22.58 | 17.45 | 22.01 | 22.18 | 19.80 | 20.32 | 21.22 | 18.02 | 11.96 | 12.10 | 9.79 | 10.44 | 9.01 | 8.75 | 9.38 | 8.79 | 7.99 | 6.04 | 7.45 | 6.24 | 5.79 | 5.49 | 5.36 | 5.85 | 5.27 | 5.39 | 5.99 | 5.93 | |
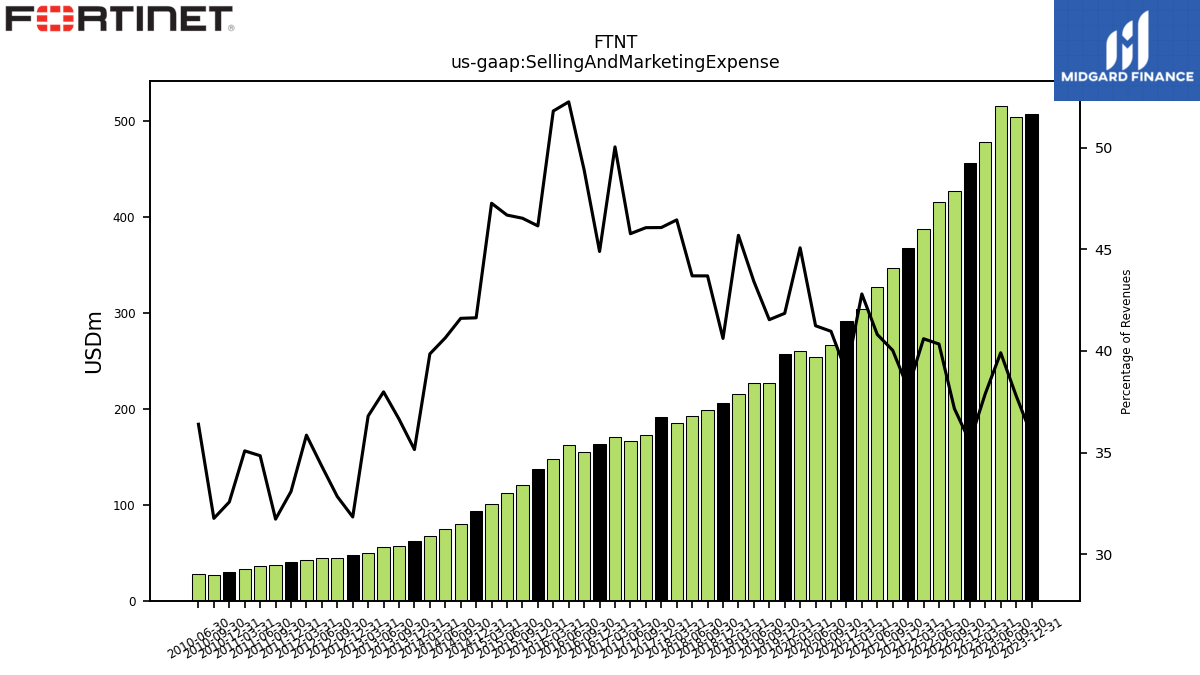
| Selling And Marketing Expense | 507.40 | 504.40 | 515.90 | 478.30 | 455.90 | 427.10 | 415.50 | 387.60 | 367.70 | 347.10 | 326.90 | 304.00 | 291.40 | 266.70 | 253.80 | 260.00 | 257.10 | 227.40 | 226.50 | 215.90 | 205.90 | 198.30 | 192.80 | 185.30 | 191.93 | 172.36 | 166.34 | 170.40 | 162.87 | 154.83 | 162.69 | 147.40 | 136.84 | 120.99 | 111.93 | 100.61 | 93.23 | 80.43 | 74.82 | 67.33 | 62.33 | 56.69 | 56.00 | 49.98 | 48.12 | 44.74 | 44.26 | 42.04 | 39.98 | 36.93 | 35.90 | 32.72 | 30.48 | 26.99 | 27.78 | |
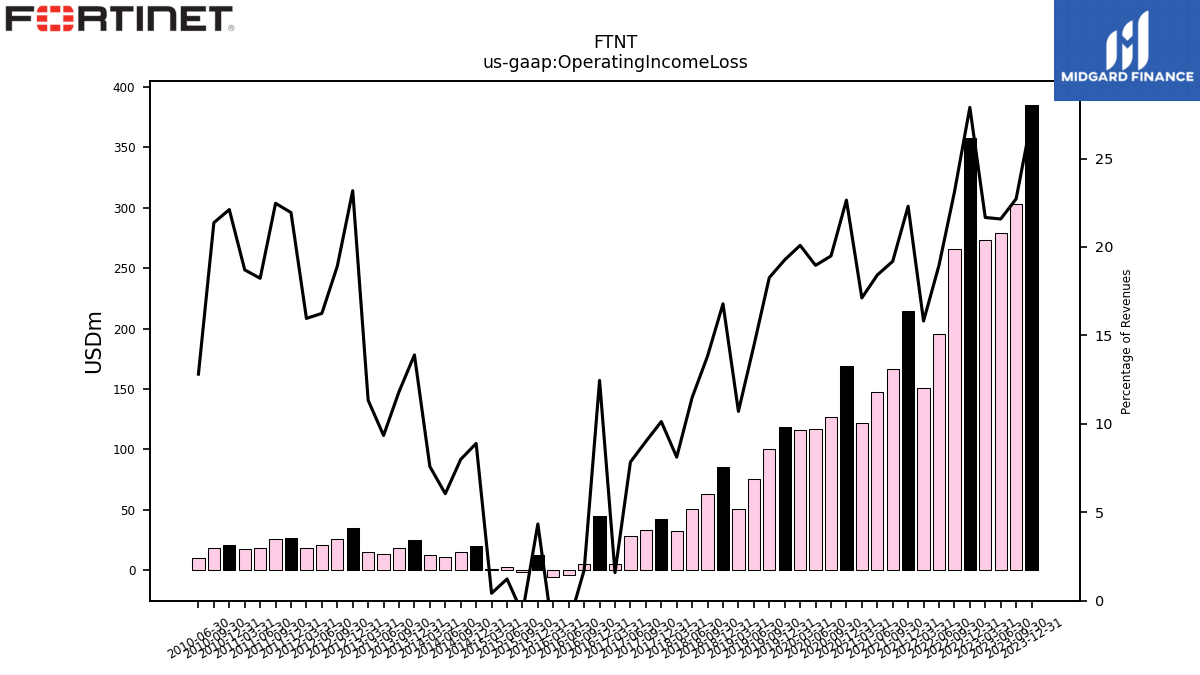
| Operating Income Loss | 385.40 | 303.20 | 279.00 | 273.50 | 357.80 | 265.50 | 195.30 | 151.00 | 214.90 | 166.40 | 147.50 | 121.60 | 169.40 | 126.90 | 116.70 | 115.90 | 118.40 | 100.00 | 75.20 | 50.60 | 85.10 | 62.80 | 50.70 | 32.40 | 42.20 | 33.70 | 28.50 | 5.41 | 45.19 | 5.49 | -4.04 | -5.67 | 12.87 | -1.84 | 2.95 | 0.90 | 19.92 | 15.45 | 11.14 | 12.81 | 24.64 | 18.28 | 13.78 | 15.39 | 35.04 | 25.77 | 20.95 | 18.71 | 26.52 | 26.16 | 18.78 | 17.45 | 20.70 | 18.16 | 9.78 | |
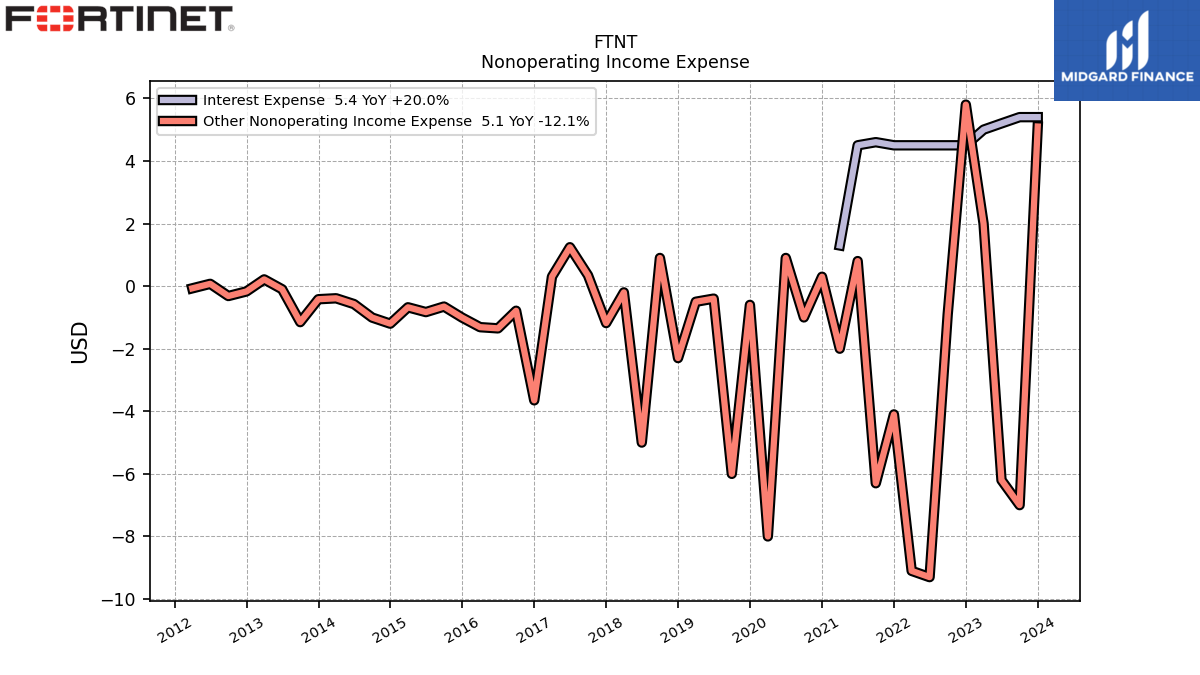
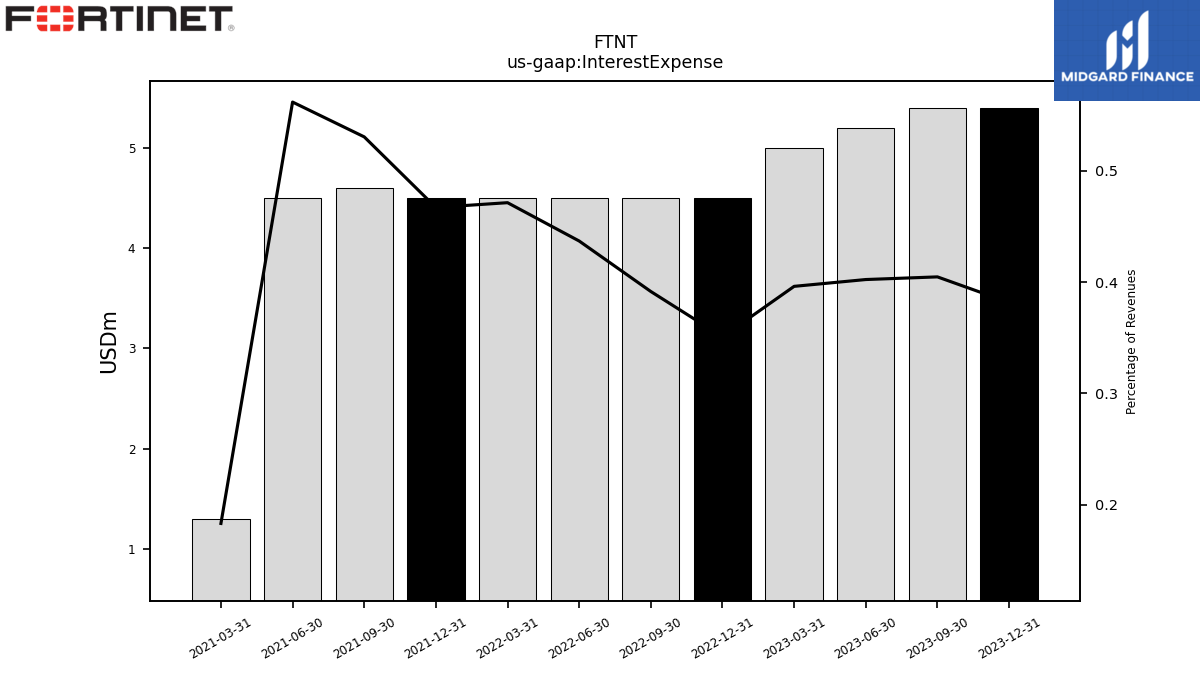
| Interest Expense | 5.40 | 5.40 | 5.20 | 5.00 | 4.50 | 4.50 | 4.50 | 4.50 | 4.50 | 4.60 | 4.50 | 1.30 | NA | NA | NA | NA | NA | NA | NA | NA | NA | NA | NA | NA | NA | NA | NA | NA | NA | NA | NA | NA | NA | NA | NA | NA | NA | NA | NA | NA | NA | NA | NA | NA | NA | NA | NA | NA | NA | NA | NA | NA | NA | NA | NA | |
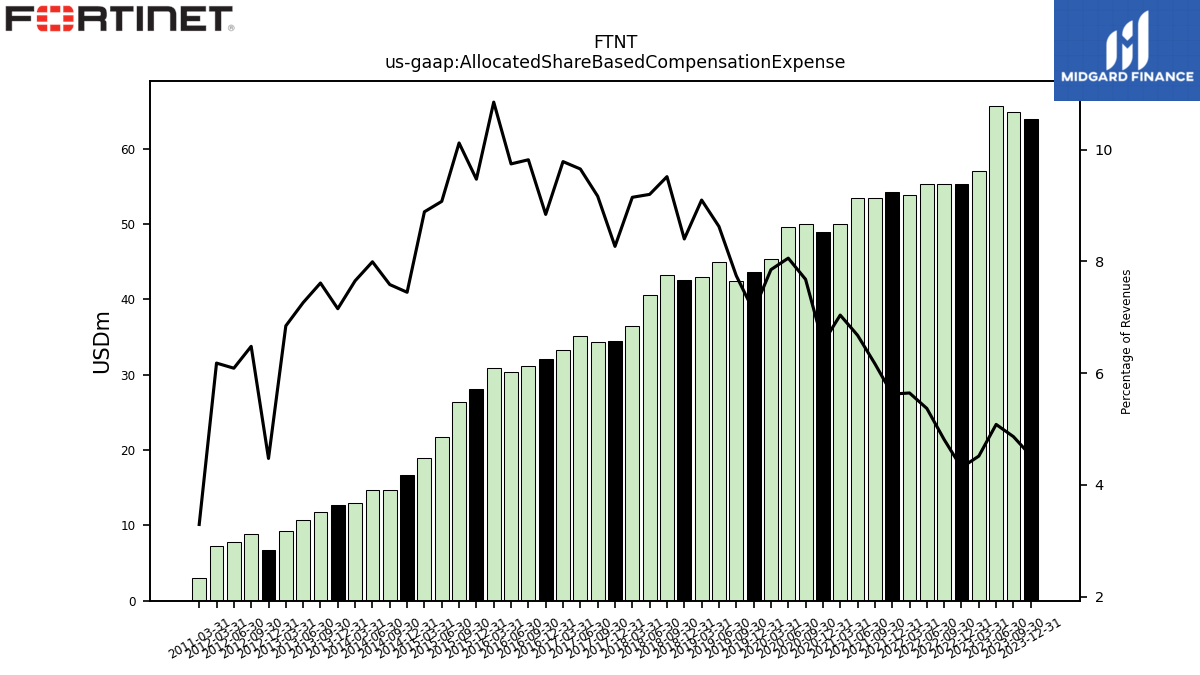
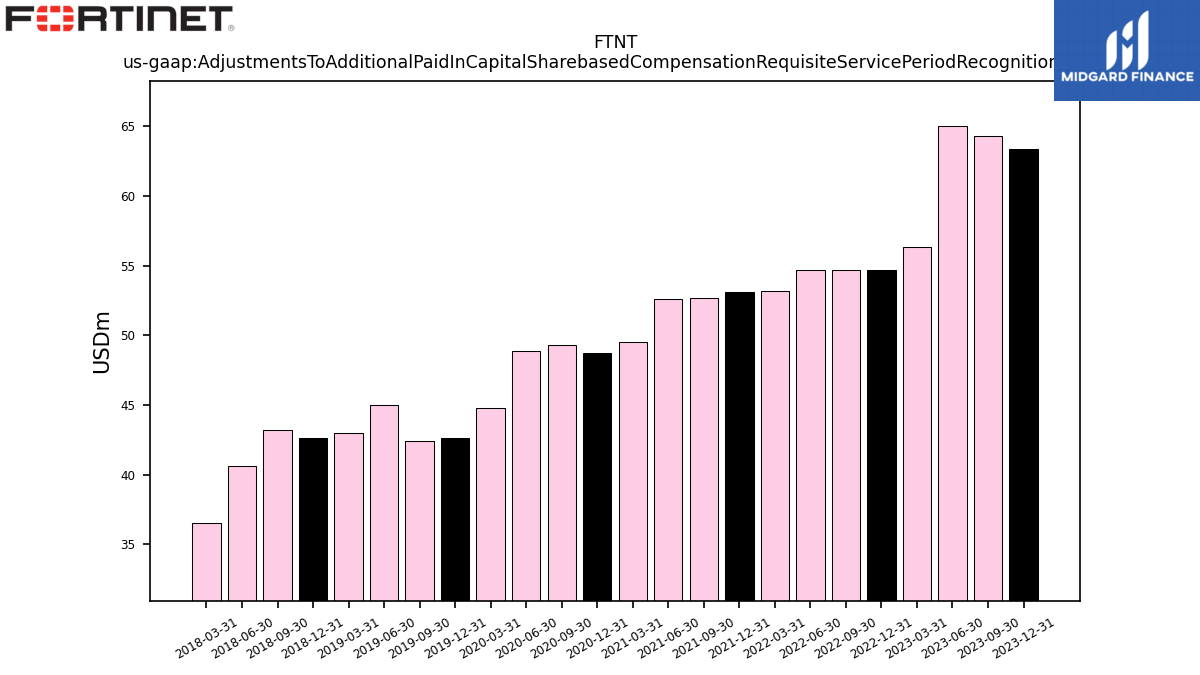
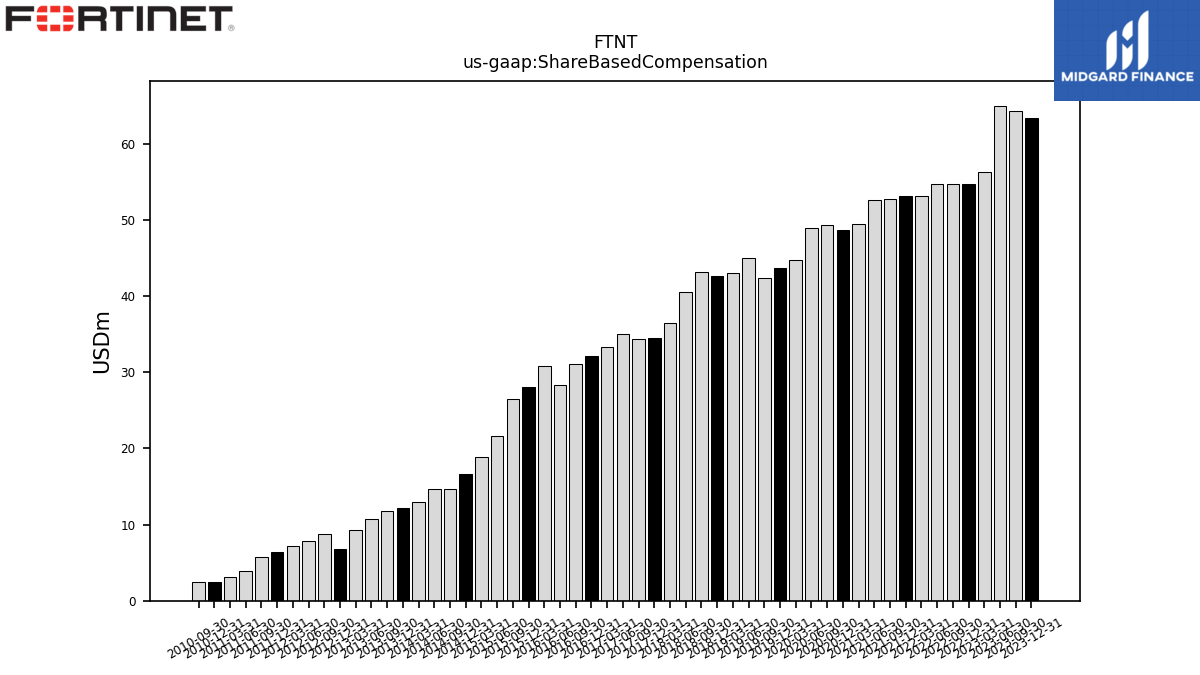
| Allocated Share Based Compensation Expense | 64.00 | 64.90 | 65.70 | 57.00 | 55.30 | 55.30 | 55.30 | 53.90 | 54.20 | 53.50 | 53.50 | 50.00 | 48.90 | 50.00 | 49.60 | 45.30 | 43.70 | 42.40 | 45.00 | 43.00 | 42.60 | 43.20 | 40.60 | 36.50 | 34.45 | 34.31 | 35.09 | 33.33 | 32.08 | 31.09 | 30.35 | 30.88 | 28.09 | 26.32 | 21.76 | 18.92 | 16.68 | 14.67 | 14.72 | 12.93 | 12.69 | 11.78 | 10.71 | 9.30 | 6.76 | 8.83 | 7.85 | 7.25 | NA | NA | NA | 3.07 | NA | NA | NA | |
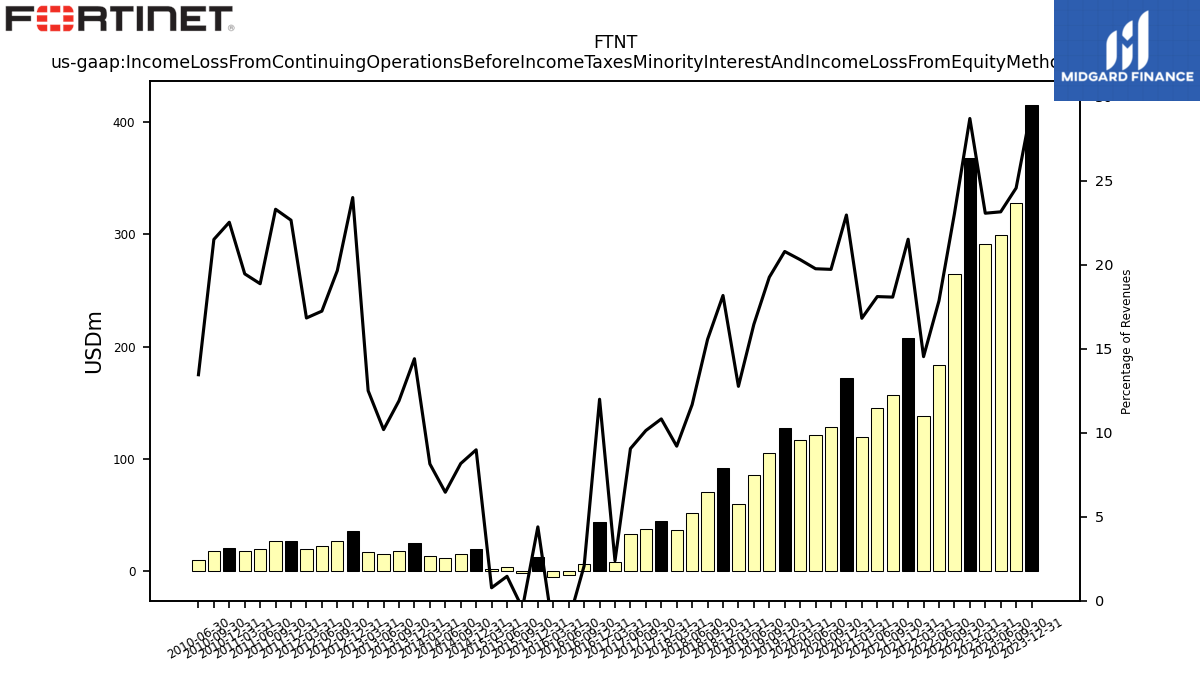
| Income Loss From Continuing Operations Before Income Taxes Minority Interest And Income Loss From Equity Method Investments | 415.60 | 327.80 | 299.20 | 291.10 | 368.20 | 264.70 | 183.90 | 138.70 | 207.30 | 156.70 | 145.00 | 119.40 | 171.70 | 128.40 | 121.60 | 117.10 | 127.70 | 105.40 | 85.80 | 60.30 | 92.10 | 70.60 | 51.50 | 36.70 | 45.08 | 37.91 | 32.91 | 8.10 | 43.51 | 6.59 | -3.69 | -5.24 | 13.04 | -1.16 | 3.49 | 1.64 | 20.12 | 15.79 | 11.89 | 13.76 | 25.54 | 18.41 | 15.01 | 16.98 | 36.27 | 26.77 | 22.23 | 19.73 | 27.37 | 27.12 | 19.43 | 18.14 | 21.08 | 18.27 | 10.27 | |
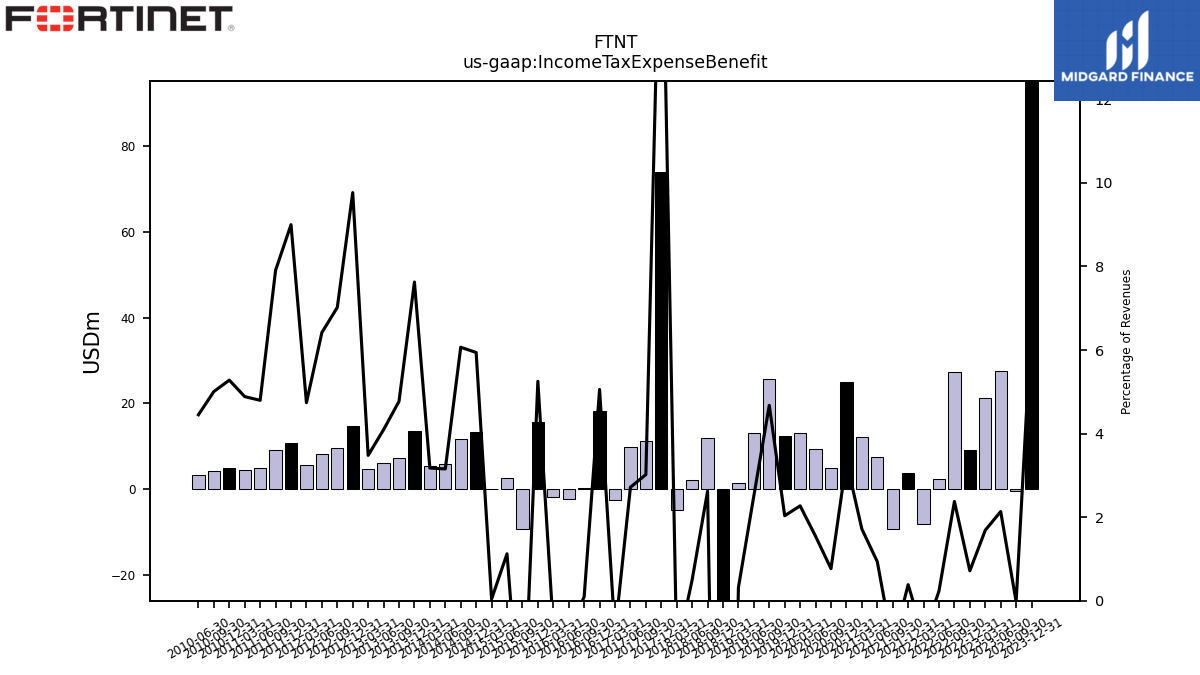
| Income Tax Expense Benefit | 95.20 | -0.30 | 27.60 | 21.30 | 9.20 | 27.30 | 2.40 | -8.10 | 3.70 | -9.30 | 7.50 | 12.20 | 25.00 | 5.00 | 9.50 | 13.10 | 12.50 | 25.60 | 13.10 | 1.50 | -90.50 | 11.90 | 2.20 | -4.90 | 74.04 | 11.30 | 9.87 | -2.61 | 18.34 | 0.30 | -2.30 | -1.81 | 15.57 | -9.33 | 2.69 | 0.08 | 13.30 | 11.73 | 5.81 | 5.37 | 13.53 | 7.38 | 6.04 | 4.73 | 14.76 | 9.56 | 8.28 | 5.56 | 10.88 | 9.21 | 4.94 | 4.56 | 4.94 | 4.25 | 3.40 | |
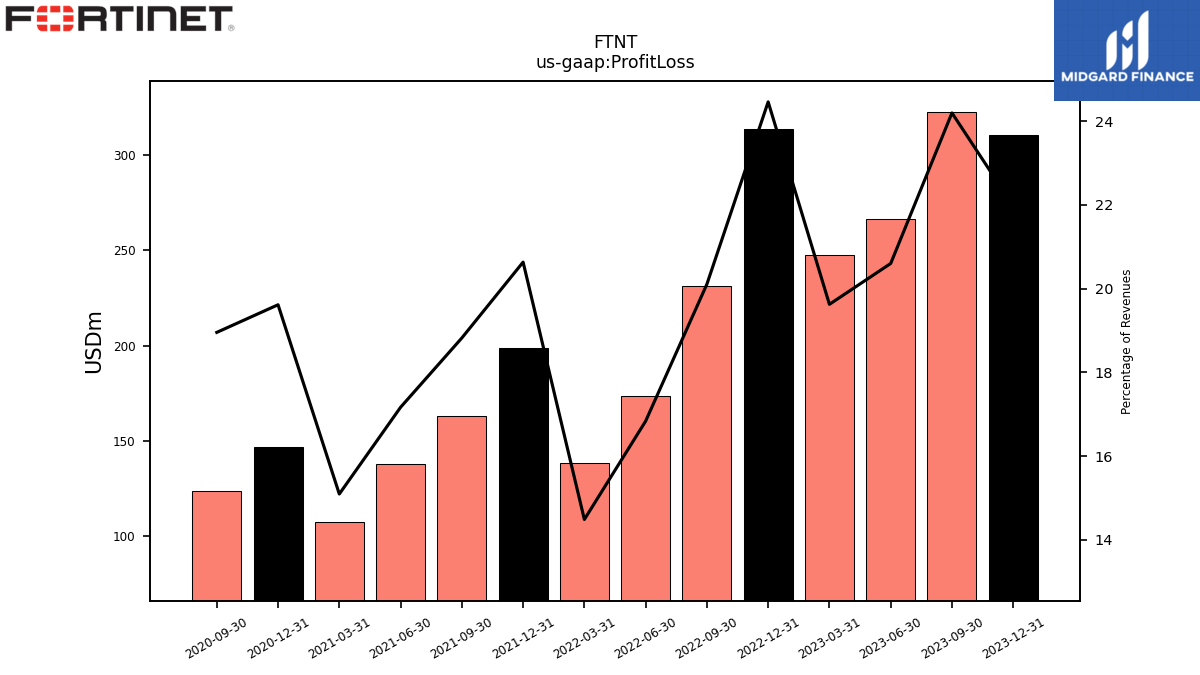
| Profit Loss | 310.90 | 322.90 | 266.30 | 247.70 | 313.80 | 231.10 | 173.40 | 138.30 | 198.80 | 163.20 | 137.50 | 107.20 | 146.70 | 123.40 | NA | NA | NA | NA | NA | NA | NA | NA | NA | NA | NA | NA | NA | NA | NA | NA | NA | NA | NA | NA | NA | NA | NA | NA | NA | NA | NA | NA | NA | NA | NA | NA | NA | NA | NA | NA | NA | NA | NA | NA | NA | |
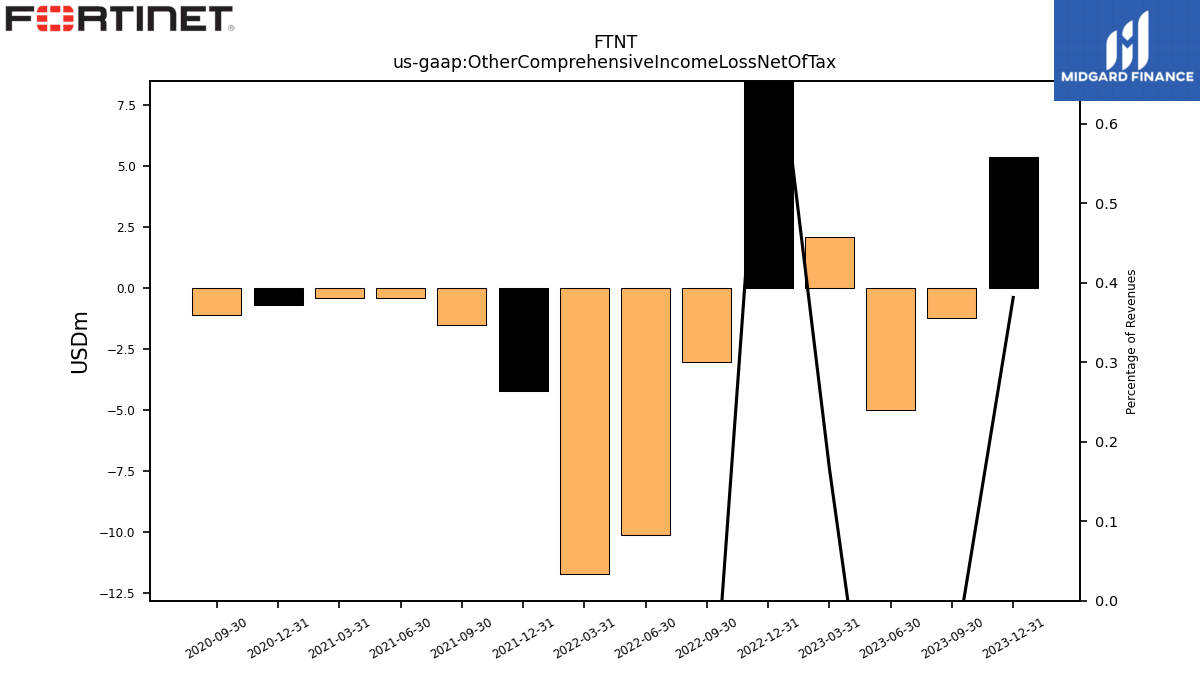
| Other Comprehensive Income Loss Net Of Tax | 5.40 | -1.20 | -5.00 | 2.10 | 10.30 | -3.00 | -10.10 | -11.70 | -4.20 | -1.50 | -0.40 | -0.40 | -0.70 | -1.10 | NA | NA | NA | NA | NA | NA | NA | NA | NA | NA | NA | NA | NA | NA | NA | NA | NA | NA | NA | NA | NA | NA | NA | NA | NA | NA | NA | NA | NA | NA | NA | NA | NA | NA | NA | NA | NA | NA | NA | NA | NA | |
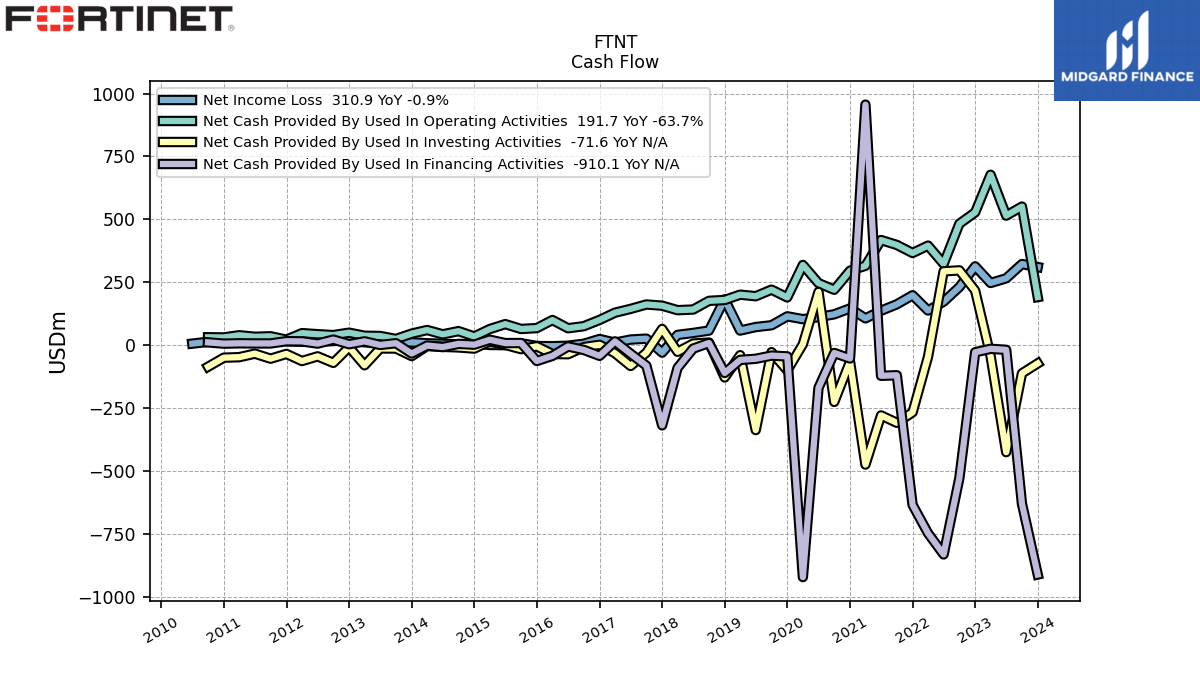
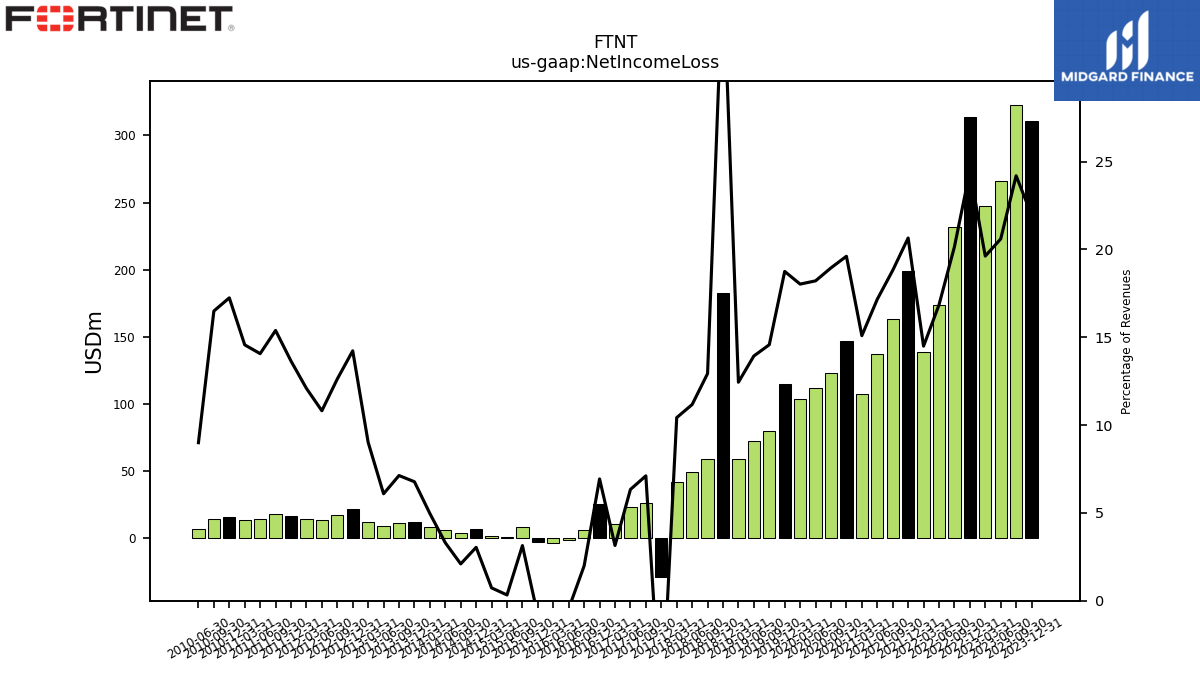
| Net Income Loss | 310.90 | 322.90 | 266.30 | 247.70 | 313.80 | 231.60 | 173.50 | 138.40 | 199.00 | 163.10 | 137.50 | 107.20 | 146.70 | 123.40 | 112.10 | 104.00 | 115.20 | 79.80 | 72.70 | 58.80 | 182.60 | 58.70 | 49.30 | 41.60 | -28.96 | 26.61 | 23.03 | 10.72 | 25.17 | 6.29 | -1.39 | -3.43 | -2.53 | 8.17 | 0.79 | 1.56 | 6.81 | 4.06 | 6.08 | 8.39 | 12.02 | 11.03 | 8.98 | 12.25 | 21.51 | 17.21 | 13.95 | 14.17 | 16.49 | 17.92 | 14.49 | 13.59 | 16.14 | 14.02 | 6.87 | |
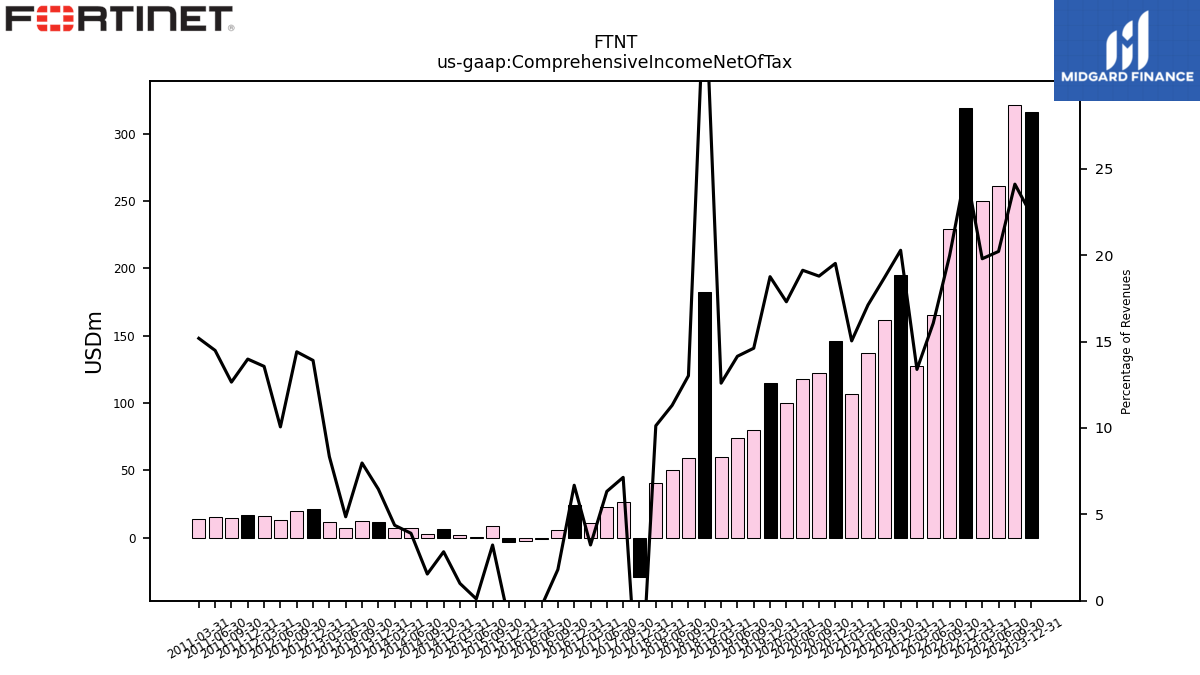
| Comprehensive Income Net Of Tax | 316.30 | 321.70 | 261.30 | 249.80 | 319.10 | 229.50 | 165.50 | 127.80 | 195.40 | 162.00 | 137.10 | 106.80 | 146.00 | 122.30 | 117.70 | 99.80 | 115.20 | 80.00 | 73.80 | 59.50 | 182.80 | 59.10 | 49.90 | 40.40 | -29.39 | 26.72 | 23.00 | 10.99 | 24.25 | 5.72 | -0.96 | -2.20 | -3.38 | 8.39 | 0.26 | 2.13 | 6.35 | 2.99 | 7.18 | 7.38 | 11.46 | 12.33 | 7.16 | 11.32 | 21.02 | 19.63 | 12.97 | 15.90 | 16.90 | 14.73 | 14.92 | 14.16 | NA | NA | NA |
| 2023-12-31 | 2023-09-30 | 2023-06-30 | 2023-03-31 | 2022-12-31 | 2022-09-30 | 2022-06-30 | 2022-03-31 | 2021-12-31 | 2021-09-30 | 2021-06-30 | 2021-03-31 | 2020-12-31 | 2020-09-30 | 2020-06-30 | 2020-03-31 | 2019-12-31 | 2019-09-30 | 2019-06-30 | 2019-03-31 | 2018-12-31 | 2018-09-30 | 2018-06-30 | 2018-03-31 | 2017-12-31 | 2017-09-30 | 2017-06-30 | 2017-03-31 | 2016-12-31 | 2016-09-30 | 2016-06-30 | 2016-03-31 | 2015-12-31 | 2015-09-30 | 2015-06-30 | 2015-03-31 | 2014-12-31 | 2014-09-30 | 2014-06-30 | 2014-03-31 | 2013-12-31 | 2013-09-30 | 2013-06-30 | 2013-03-31 | 2012-12-31 | 2012-09-30 | 2012-06-30 | 2012-03-31 | 2011-12-31 | 2011-09-30 | 2011-06-30 | 2011-03-31 | 2010-12-31 | 2010-09-30 | 2010-06-30 | ||
|---|---|---|---|---|---|---|---|---|---|---|---|---|---|---|---|---|---|---|---|---|---|---|---|---|---|---|---|---|---|---|---|---|---|---|---|---|---|---|---|---|---|---|---|---|---|---|---|---|---|---|---|---|---|---|---|---|
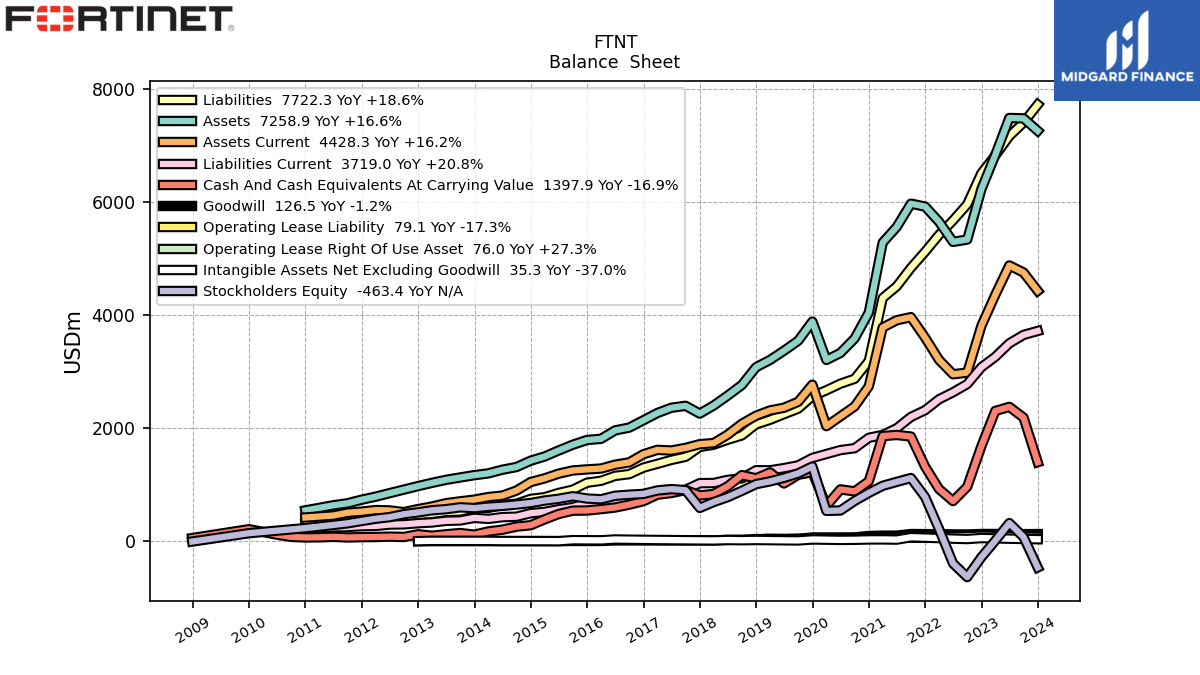
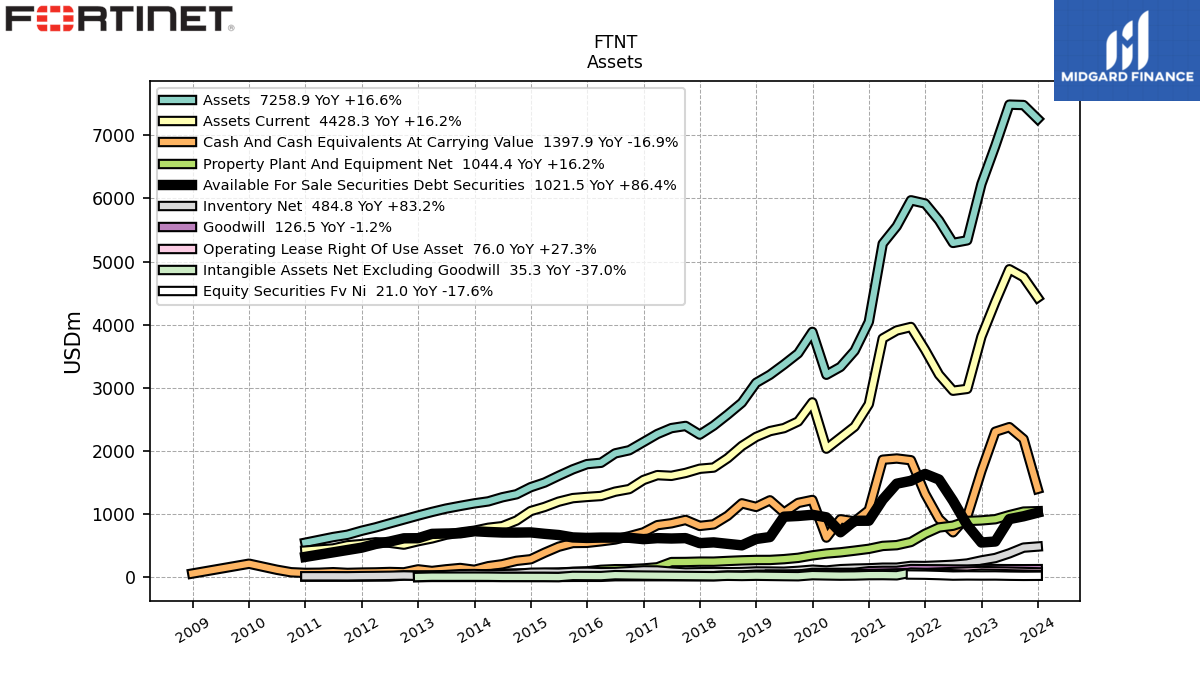
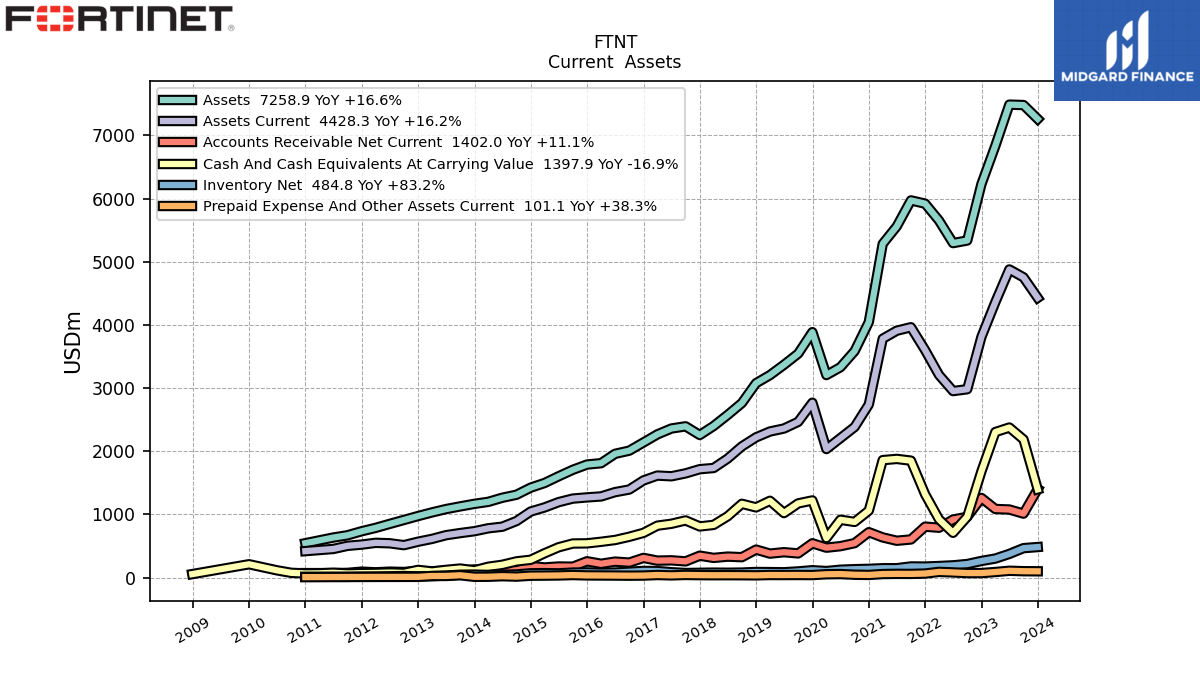
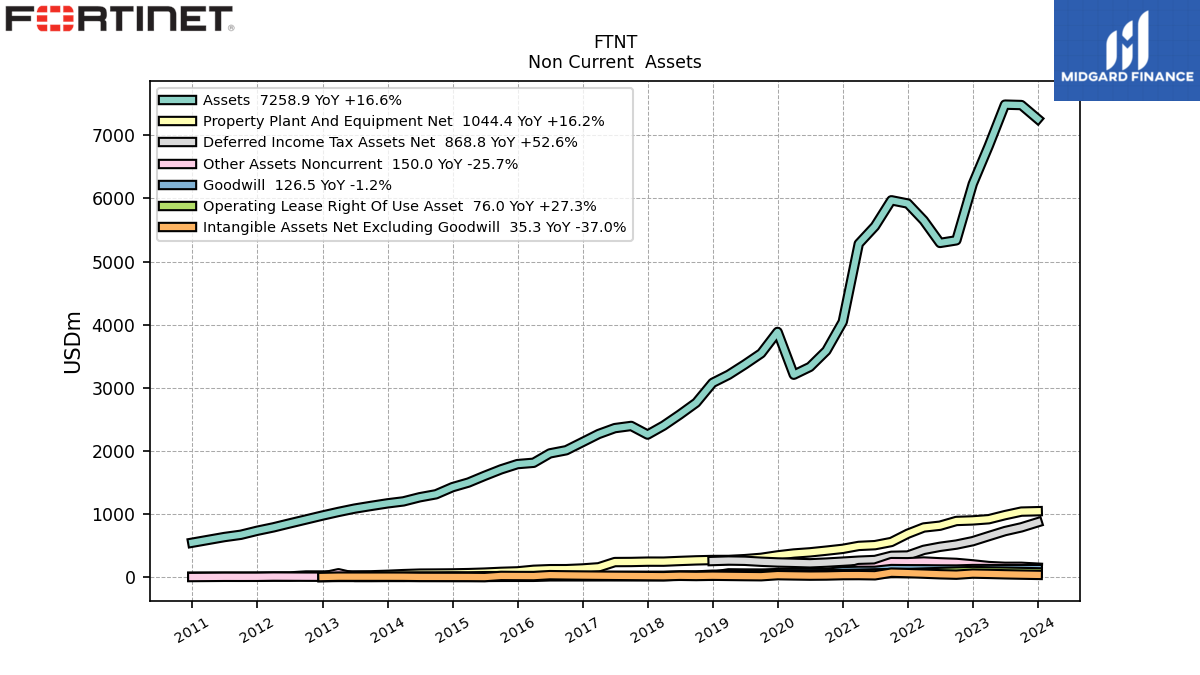
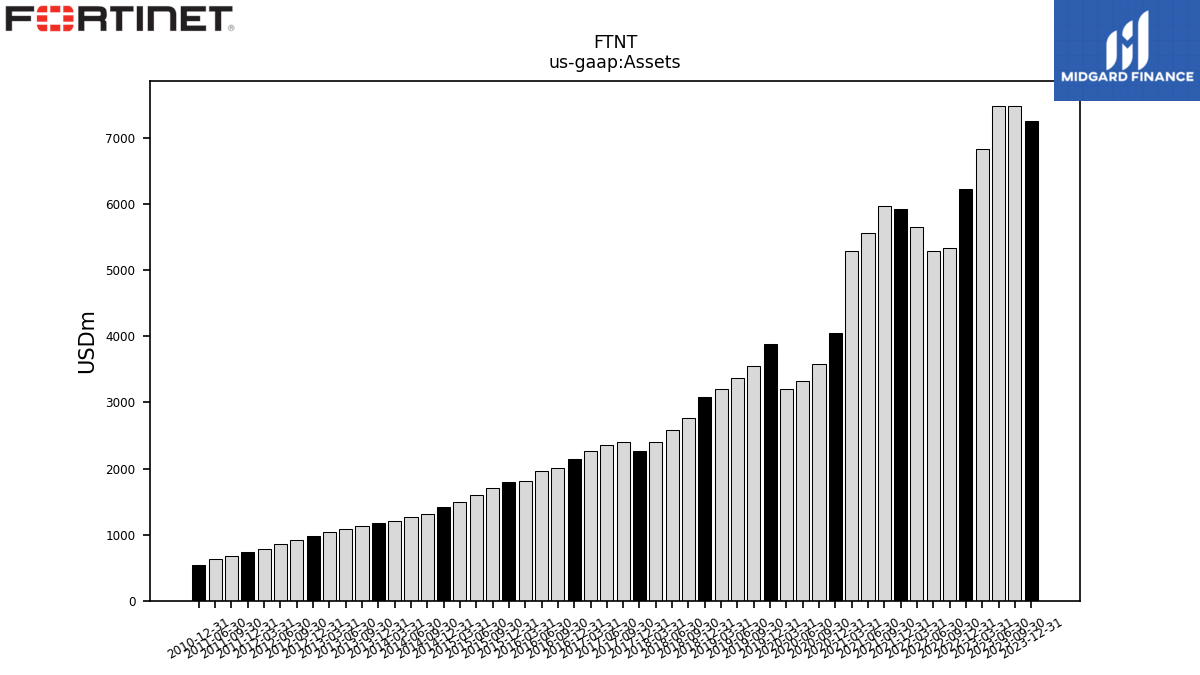
| Assets | 7258.90 | 7479.30 | 7486.10 | 6832.30 | 6228.00 | 5335.90 | 5294.50 | 5651.10 | 5919.10 | 5970.60 | 5558.90 | 5282.20 | 4044.50 | 3586.20 | 3330.60 | 3206.20 | 3885.50 | 3545.60 | 3369.40 | 3205.70 | 3078.00 | 2763.50 | 2575.70 | 2400.70 | 2257.92 | 2395.28 | 2360.69 | 2267.38 | 2139.94 | 2010.16 | 1960.18 | 1811.52 | 1790.51 | 1707.17 | 1604.88 | 1498.30 | 1424.77 | 1312.60 | 1265.11 | 1200.03 | 1168.46 | 1128.14 | 1085.75 | 1032.73 | 975.50 | 913.27 | 851.25 | 788.44 | 734.75 | 670.99 | 635.24 | NA | 545.42 | NA | NA | |
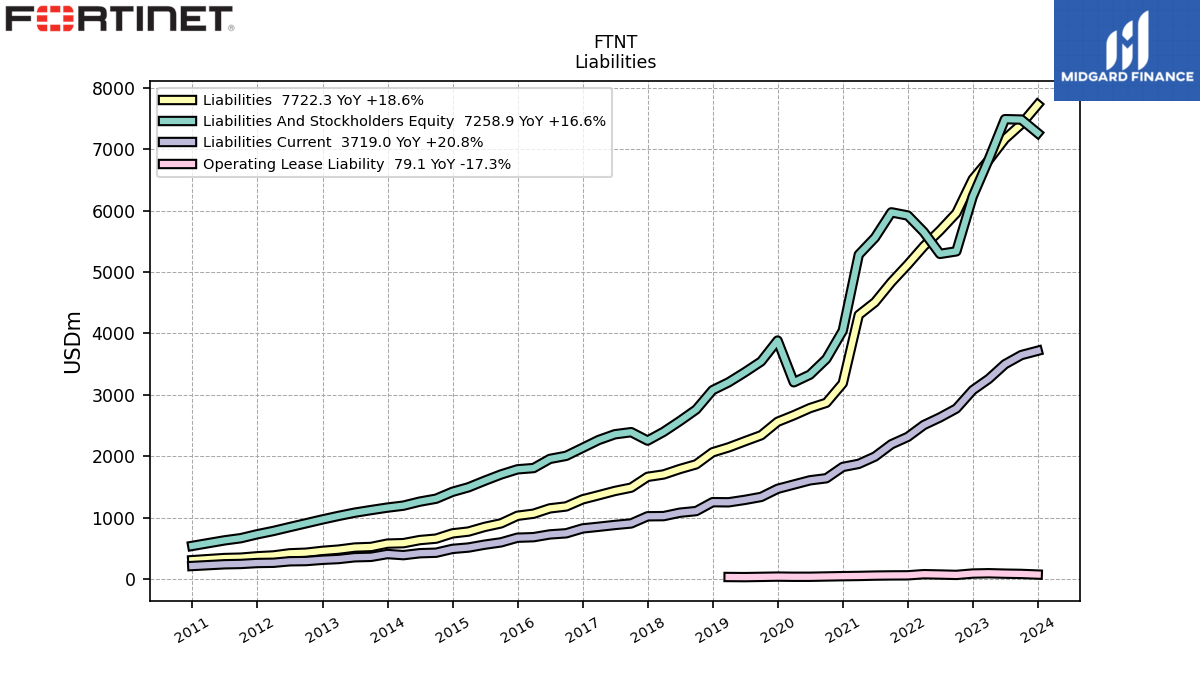
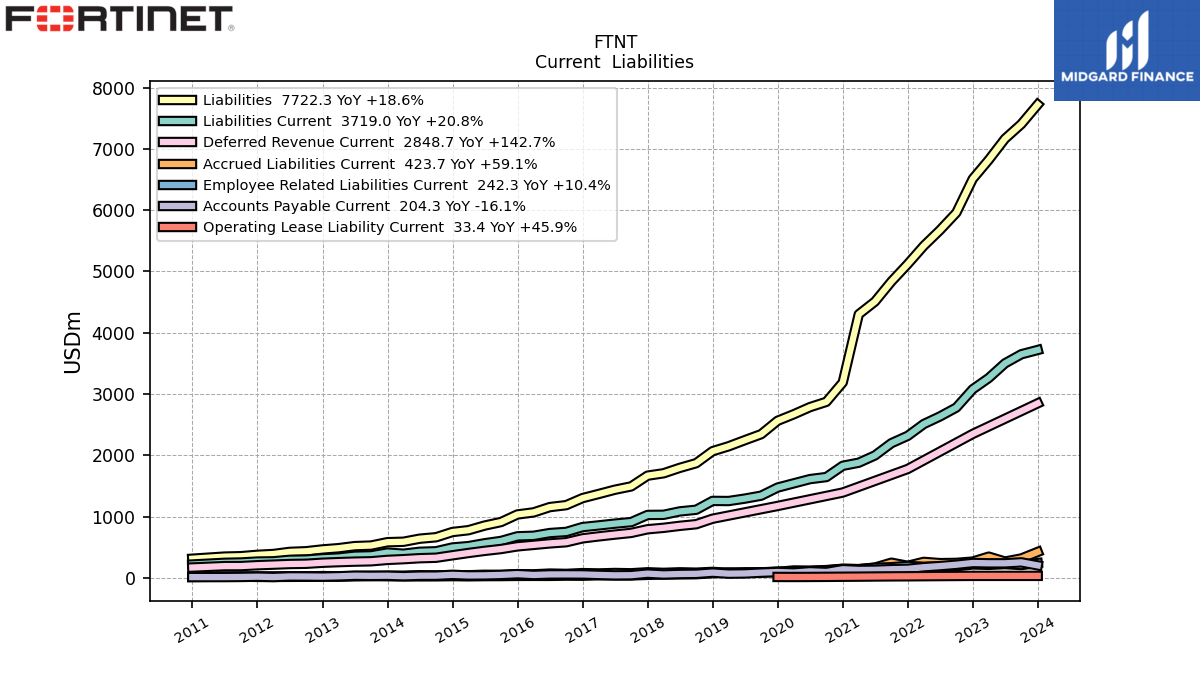
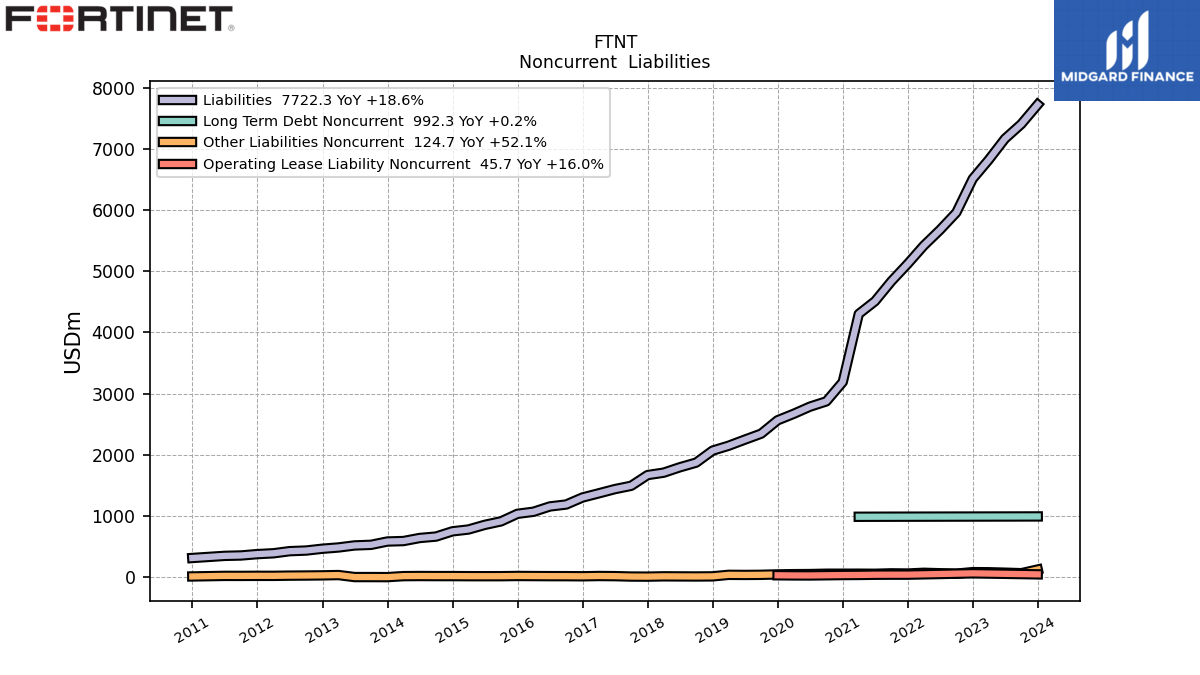
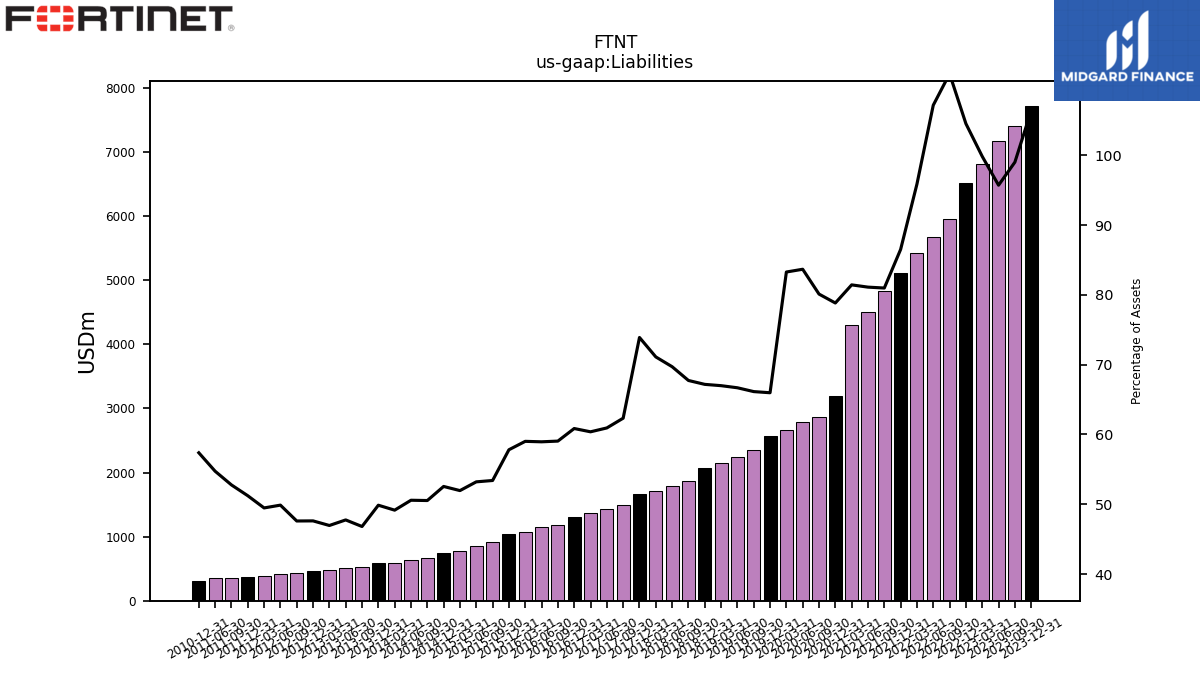
| Liabilities | 7722.30 | 7405.20 | 7164.90 | 6820.90 | 6509.60 | 5958.70 | 5674.10 | 5417.90 | 5120.70 | 4835.00 | 4508.70 | 4301.40 | 3188.50 | 2873.00 | 2786.70 | 2669.90 | 2563.60 | 2345.20 | 2247.10 | 2147.60 | 2067.80 | 1871.90 | 1795.50 | 1707.20 | 1668.54 | 1493.05 | 1438.55 | 1369.13 | 1302.26 | 1187.07 | 1155.55 | 1069.12 | 1035.13 | 911.79 | 854.05 | 778.56 | 748.81 | 663.38 | 639.89 | 589.94 | 582.70 | 528.19 | 518.56 | 485.02 | 464.56 | 434.80 | 424.60 | 390.12 | 376.39 | 354.12 | 347.71 | NA | 312.97 | NA | NA | |
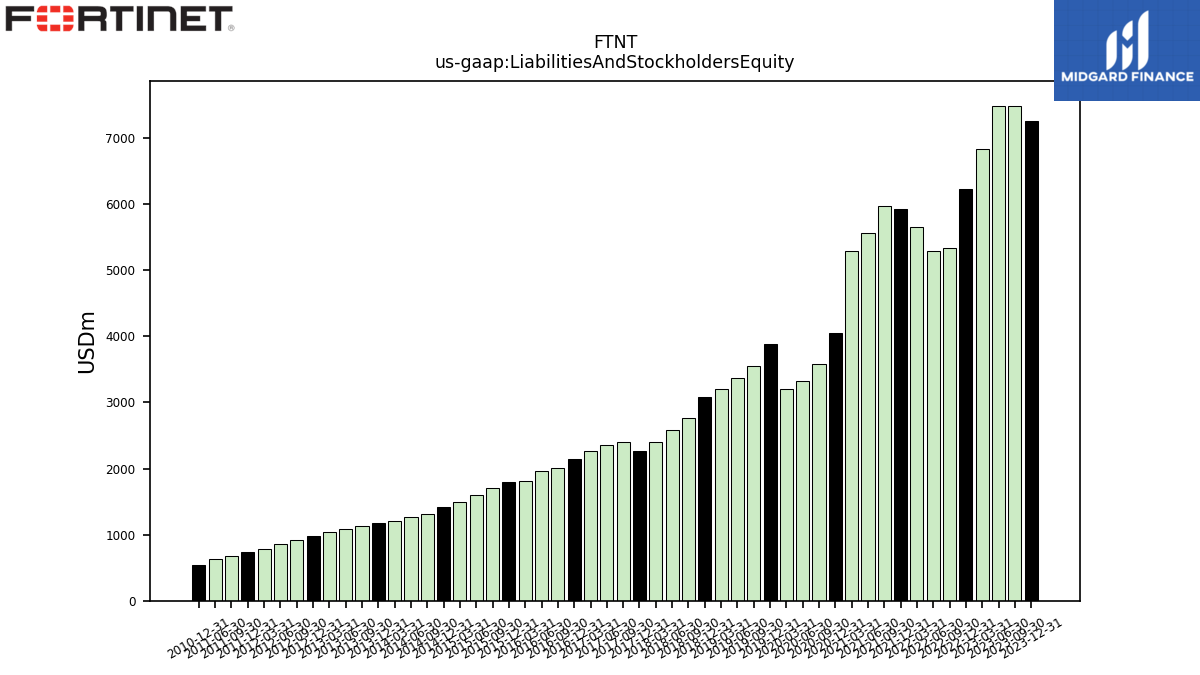
| Liabilities And Stockholders Equity | 7258.90 | 7479.30 | 7486.10 | 6832.30 | 6228.00 | 5335.90 | 5294.50 | 5651.10 | 5919.10 | 5970.60 | 5558.90 | 5282.20 | 4044.50 | 3586.20 | 3330.60 | 3206.20 | 3885.50 | 3545.60 | 3369.40 | 3205.70 | 3078.00 | 2763.50 | 2575.70 | 2400.70 | 2257.92 | 2395.28 | 2360.69 | 2267.38 | 2139.94 | 2010.16 | 1960.18 | 1811.52 | 1790.51 | 1707.17 | 1604.88 | 1498.30 | 1424.77 | 1312.60 | 1265.11 | 1200.03 | 1168.46 | 1128.14 | 1085.75 | 1032.73 | 975.50 | 913.27 | 851.25 | 788.44 | 734.75 | 670.99 | 635.24 | NA | 545.42 | NA | NA | |
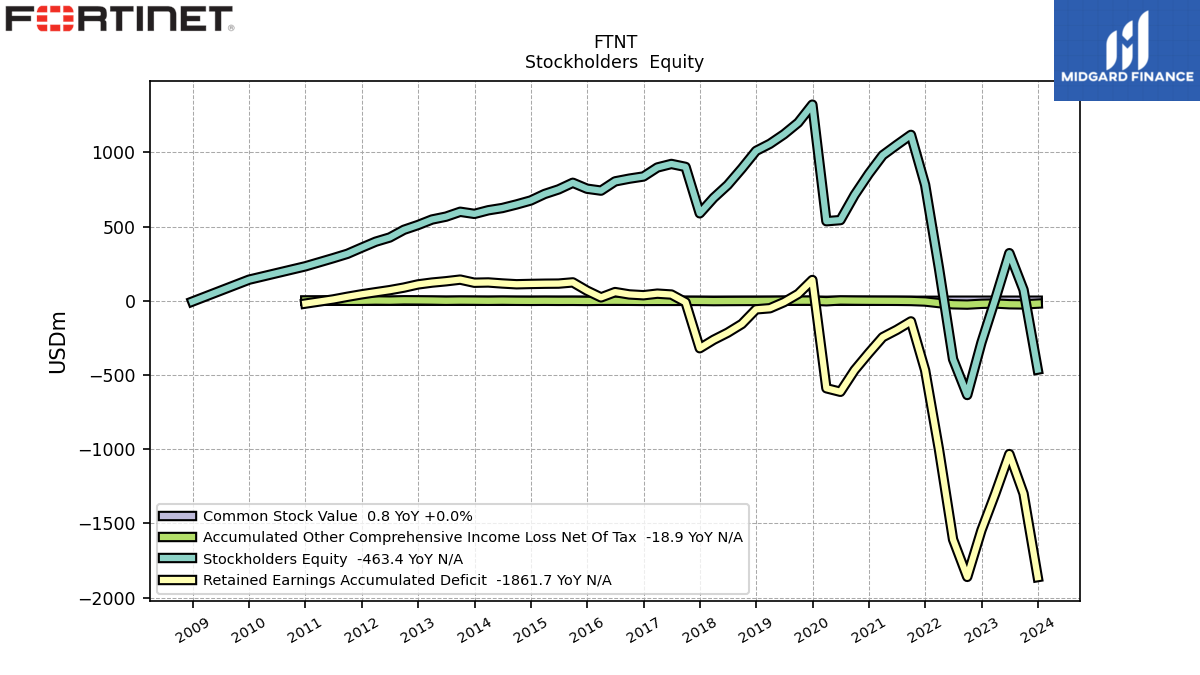
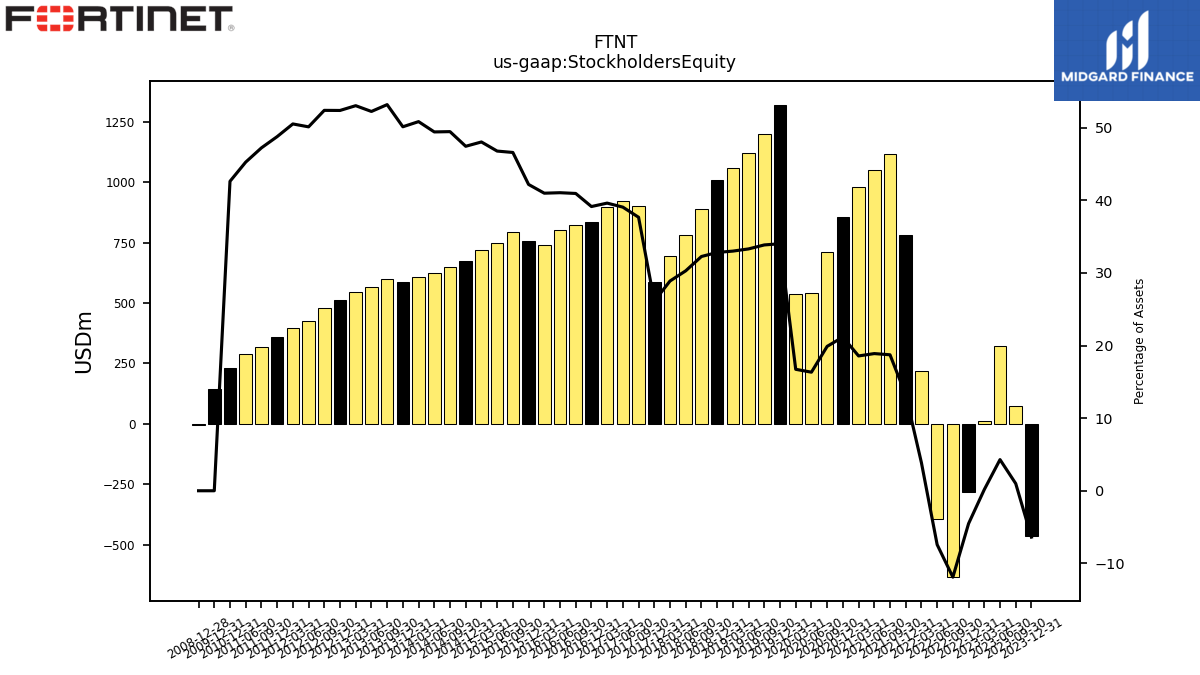
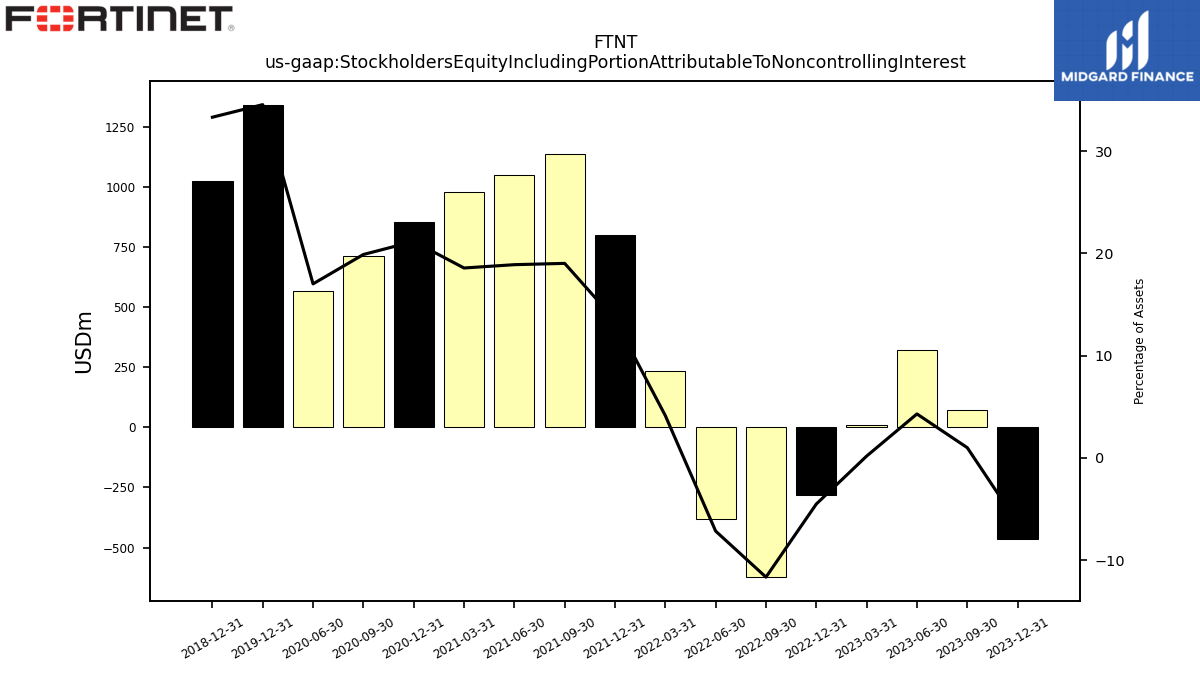
| Stockholders Equity | -463.40 | 74.10 | 321.20 | 11.40 | -281.60 | -634.70 | -392.90 | 217.70 | 781.70 | 1118.10 | 1050.20 | 980.80 | 856.00 | 713.20 | 543.90 | 536.30 | 1321.90 | 1200.40 | 1122.30 | 1058.10 | 1010.20 | 891.60 | 780.20 | 693.50 | 589.38 | 902.23 | 922.14 | 898.25 | 837.68 | 823.09 | 804.63 | 742.40 | 755.38 | 795.39 | 750.83 | 719.75 | 675.97 | 649.23 | 625.22 | 610.09 | 585.76 | 599.95 | 567.18 | 547.71 | 510.93 | 478.47 | 426.64 | 398.33 | 358.35 | 316.87 | 287.52 | NA | 232.45 | NA | NA |
| 2023-12-31 | 2023-09-30 | 2023-06-30 | 2023-03-31 | 2022-12-31 | 2022-09-30 | 2022-06-30 | 2022-03-31 | 2021-12-31 | 2021-09-30 | 2021-06-30 | 2021-03-31 | 2020-12-31 | 2020-09-30 | 2020-06-30 | 2020-03-31 | 2019-12-31 | 2019-09-30 | 2019-06-30 | 2019-03-31 | 2018-12-31 | 2018-09-30 | 2018-06-30 | 2018-03-31 | 2017-12-31 | 2017-09-30 | 2017-06-30 | 2017-03-31 | 2016-12-31 | 2016-09-30 | 2016-06-30 | 2016-03-31 | 2015-12-31 | 2015-09-30 | 2015-06-30 | 2015-03-31 | 2014-12-31 | 2014-09-30 | 2014-06-30 | 2014-03-31 | 2013-12-31 | 2013-09-30 | 2013-06-30 | 2013-03-31 | 2012-12-31 | 2012-09-30 | 2012-06-30 | 2012-03-31 | 2011-12-31 | 2011-09-30 | 2011-06-30 | 2011-03-31 | 2010-12-31 | 2010-09-30 | 2010-06-30 | ||
|---|---|---|---|---|---|---|---|---|---|---|---|---|---|---|---|---|---|---|---|---|---|---|---|---|---|---|---|---|---|---|---|---|---|---|---|---|---|---|---|---|---|---|---|---|---|---|---|---|---|---|---|---|---|---|---|---|
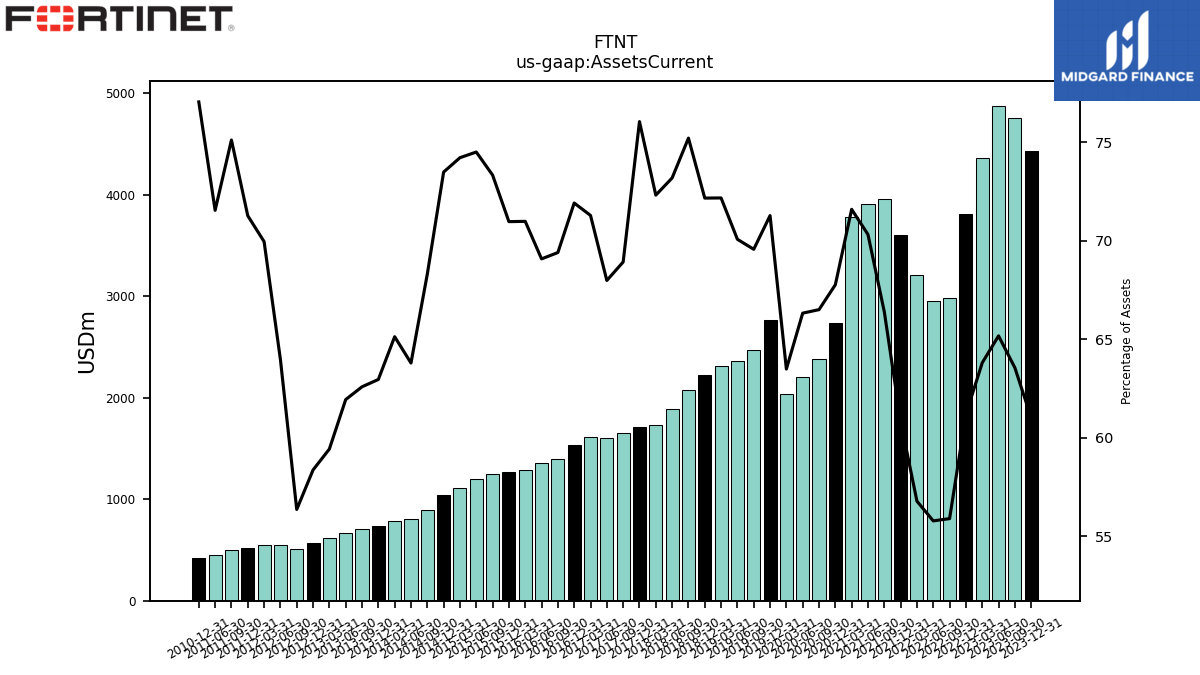
| Assets Current | 4428.30 | 4752.70 | 4878.10 | 4358.70 | 3810.40 | 2982.20 | 2952.90 | 3208.30 | 3600.60 | 3963.50 | 3908.20 | 3781.20 | 2740.40 | 2384.60 | 2208.70 | 2035.30 | 2769.00 | 2466.20 | 2360.70 | 2313.30 | 2220.90 | 2078.10 | 1884.80 | 1735.80 | 1716.82 | 1650.65 | 1604.63 | 1616.08 | 1538.72 | 1394.87 | 1353.88 | 1285.70 | 1270.54 | 1251.74 | 1195.51 | 1111.80 | 1046.87 | 896.44 | 806.95 | 781.46 | 735.55 | 705.97 | 672.40 | 613.66 | 569.27 | 514.65 | 544.51 | 551.50 | 523.57 | 503.93 | 454.41 | NA | 420.16 | NA | NA | |
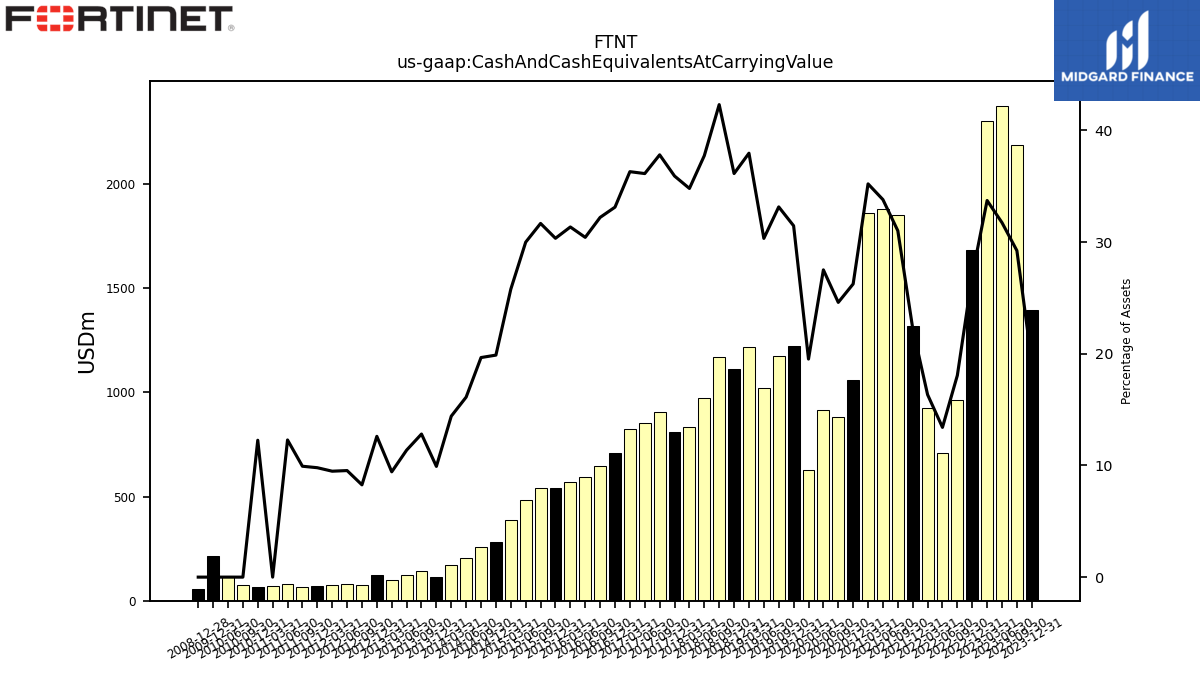
| Cash And Cash Equivalents At Carrying Value | 1397.90 | 2186.80 | 2376.30 | 2304.20 | 1682.90 | 964.00 | 710.00 | 923.50 | 1319.10 | 1852.10 | 1879.30 | 1860.20 | 1061.80 | 882.30 | 916.40 | 626.10 | 1222.50 | 1175.50 | 1022.10 | 1216.90 | 1112.40 | 1169.30 | 972.10 | 835.60 | 811.00 | 905.79 | 853.14 | 823.25 | 709.00 | 647.51 | 596.38 | 568.01 | 543.28 | 540.71 | 481.39 | 386.35 | 283.25 | 258.10 | 203.95 | 172.97 | 115.87 | 144.55 | 123.47 | 97.38 | 122.97 | 75.47 | 81.23 | 74.78 | 71.99 | 66.63 | 78.02 | 68.98 | 66.86 | 77.14 | 116.44 | |
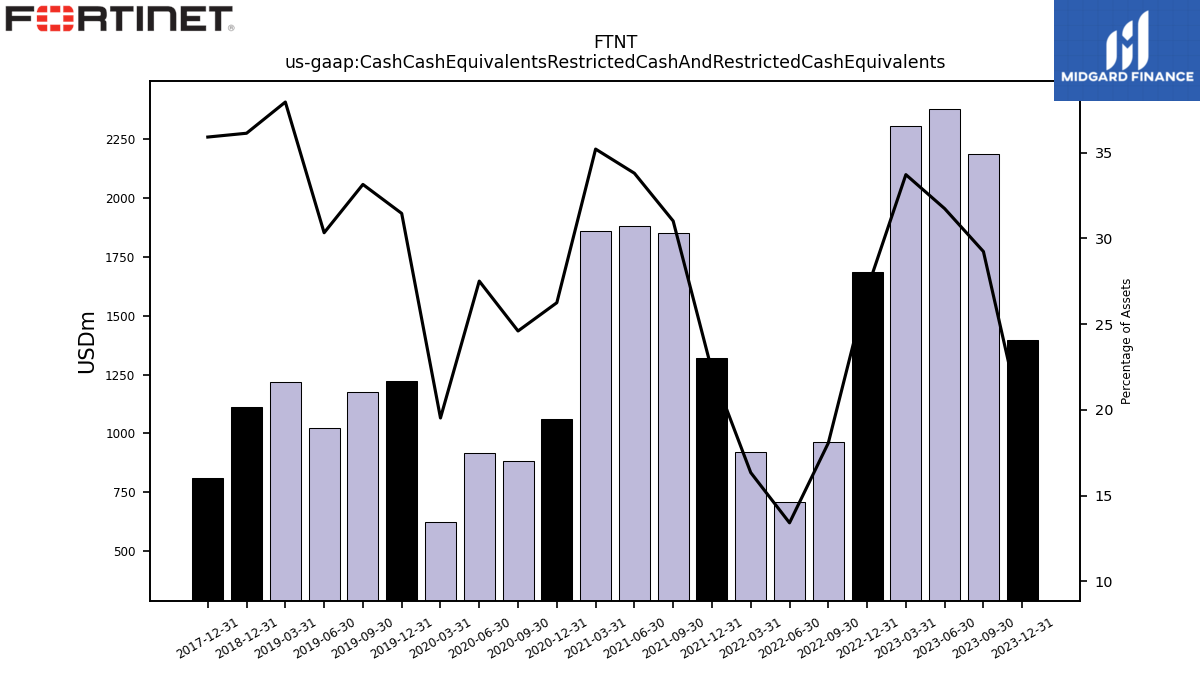
| Cash Cash Equivalents Restricted Cash And Restricted Cash Equivalents | 1397.90 | 2186.80 | 2376.30 | 2304.20 | 1682.90 | 964.00 | 710.00 | 923.50 | 1319.10 | 1852.10 | 1879.30 | 1860.20 | 1061.80 | 882.30 | 916.40 | 626.10 | 1222.50 | 1175.50 | 1022.10 | 1216.90 | 1112.40 | NA | NA | NA | 811.00 | NA | NA | NA | NA | NA | NA | NA | NA | NA | NA | NA | NA | NA | NA | NA | NA | NA | NA | NA | NA | NA | NA | NA | NA | NA | NA | NA | NA | NA | NA | |
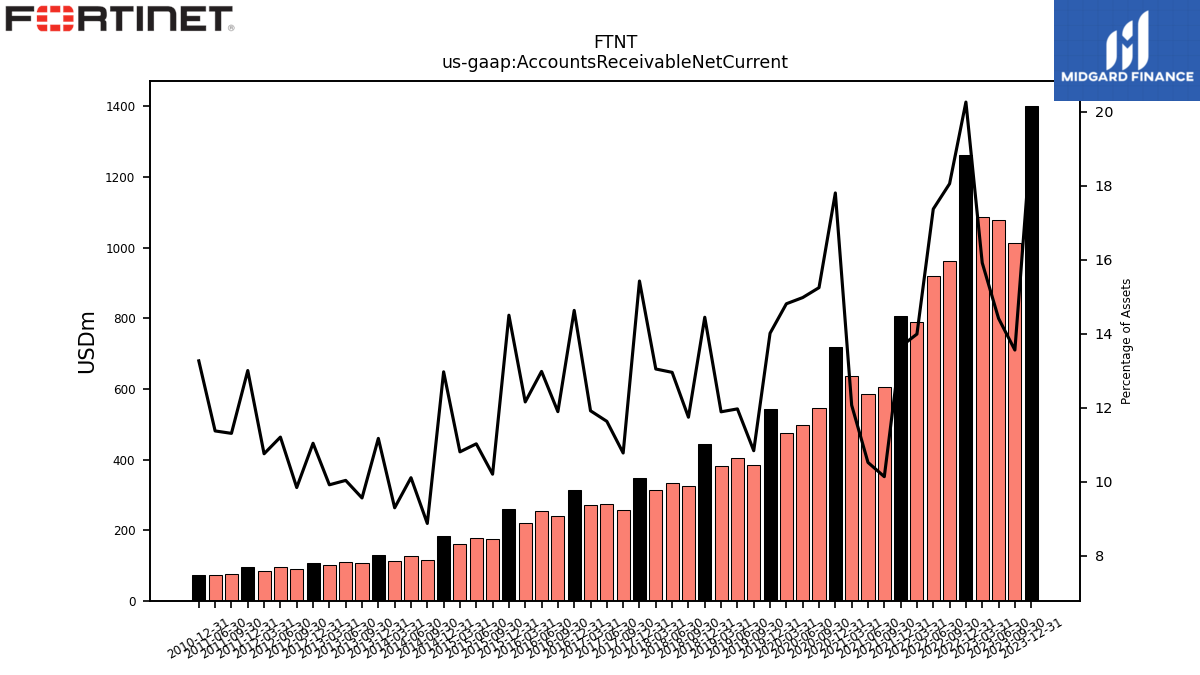
| Accounts Receivable Net Current | 1402.00 | 1013.80 | 1078.80 | 1087.20 | 1261.70 | 963.20 | 919.50 | 790.40 | 807.70 | 604.90 | 584.60 | 637.30 | 720.00 | 546.60 | 498.70 | 474.70 | 544.30 | 384.10 | 403.10 | 381.00 | 444.50 | 324.40 | 333.60 | 313.10 | 348.19 | 258.00 | 274.48 | 270.11 | 313.00 | 238.99 | 254.38 | 220.13 | 259.56 | 174.11 | 176.85 | 161.85 | 184.74 | 116.38 | 127.83 | 111.49 | 130.47 | 107.80 | 108.91 | 102.36 | 107.64 | 89.84 | 95.35 | 84.76 | 95.52 | 75.83 | 72.21 | NA | 72.34 | NA | NA | |
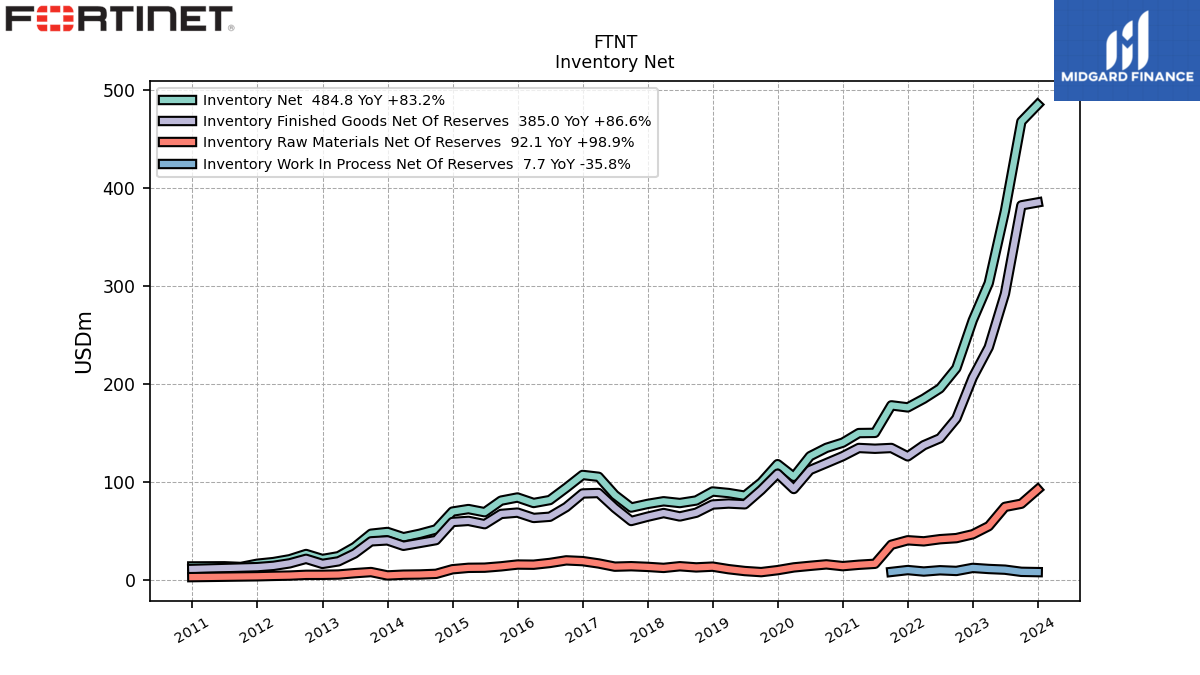
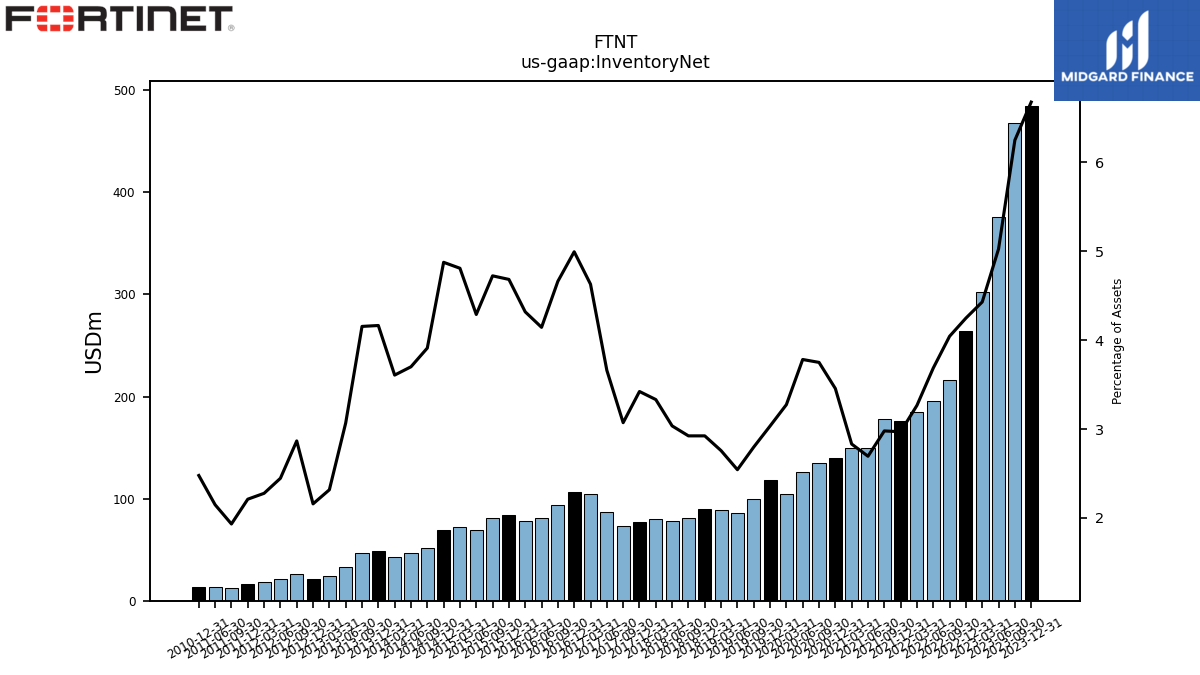
| Inventory Net | 484.80 | 467.50 | 376.30 | 302.70 | 264.60 | 215.80 | 195.20 | 184.60 | 175.80 | 177.90 | 149.80 | 149.60 | 139.80 | 134.50 | 126.00 | 105.00 | 117.90 | 99.20 | 85.70 | 88.40 | 90.00 | 80.80 | 78.20 | 80.00 | 77.29 | 73.59 | 86.44 | 104.98 | 106.89 | 93.73 | 81.25 | 78.24 | 83.87 | 80.65 | 68.84 | 72.06 | 69.48 | 51.34 | 46.82 | 43.29 | 48.67 | 46.88 | 33.32 | 23.93 | 21.06 | 26.18 | 20.83 | 17.96 | 16.25 | 12.97 | 13.65 | NA | 13.52 | NA | NA | |
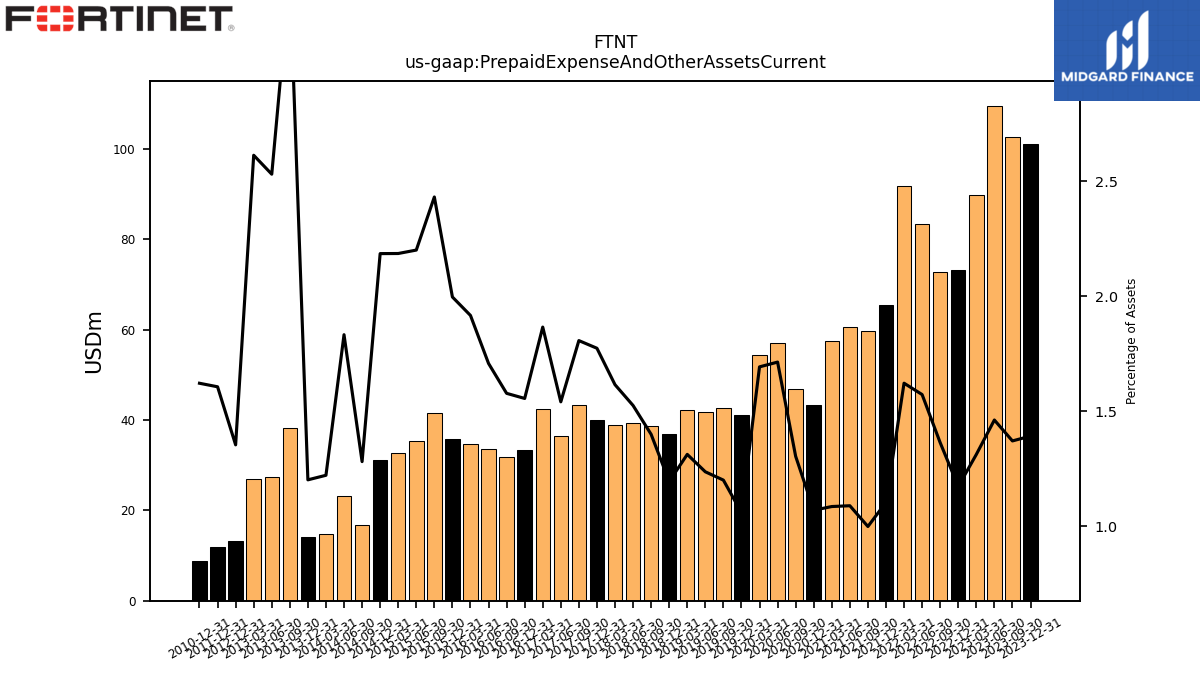
| Prepaid Expense And Other Assets Current | 101.10 | 102.60 | 109.50 | 89.70 | 73.10 | 72.80 | 83.30 | 91.70 | 65.40 | 59.70 | 60.60 | 57.40 | 43.30 | 46.80 | 57.10 | 54.30 | 41.20 | 42.60 | 41.70 | 42.10 | 36.80 | 38.70 | 39.30 | 38.80 | 40.07 | 43.30 | 36.40 | 42.32 | 33.31 | 31.73 | 33.49 | 34.73 | 35.76 | 41.52 | 35.33 | 32.76 | 31.14 | 16.83 | 23.20 | 14.67 | 14.05 | 38.27 | 27.48 | 26.99 | 13.21 | NA | NA | NA | 11.81 | NA | NA | NA | 8.85 | NA | NA | |
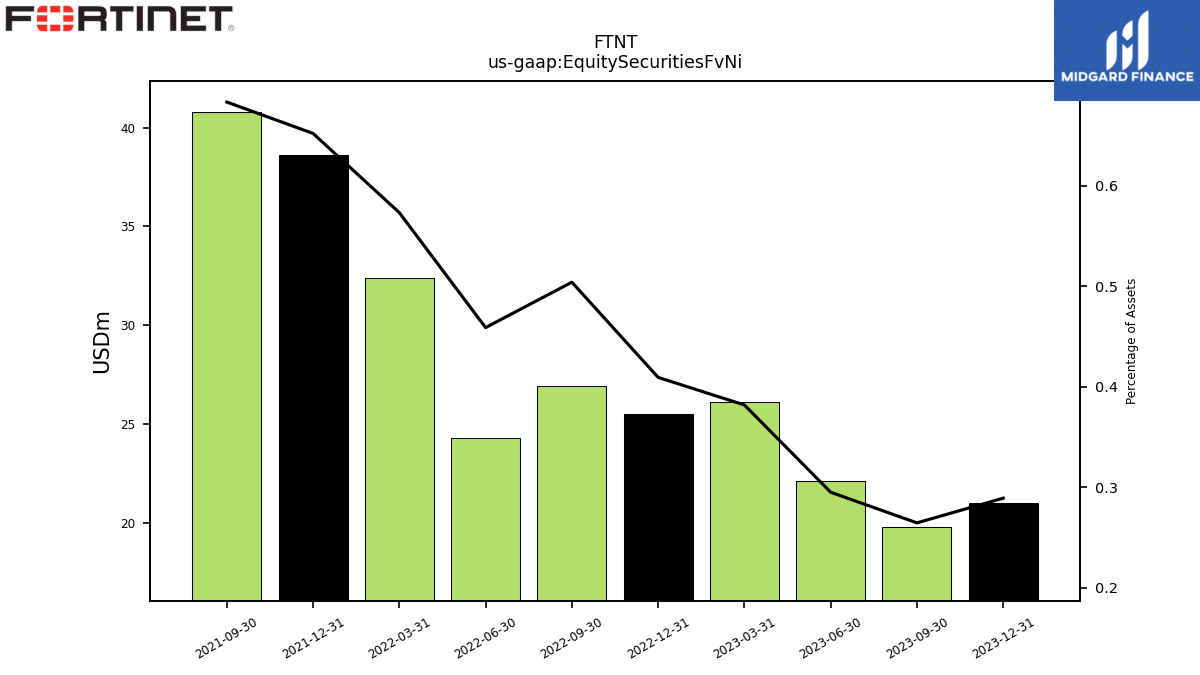
| Equity Securities Fv Ni | 21.00 | 19.80 | 22.10 | 26.10 | 25.50 | 26.90 | 24.30 | 32.40 | 38.60 | 40.80 | NA | NA | NA | NA | NA | NA | NA | NA | NA | NA | NA | NA | NA | NA | NA | NA | NA | NA | NA | NA | NA | NA | NA | NA | NA | NA | NA | NA | NA | NA | NA | NA | NA | NA | NA | NA | NA | NA | NA | NA | NA | NA | NA | NA | NA | |
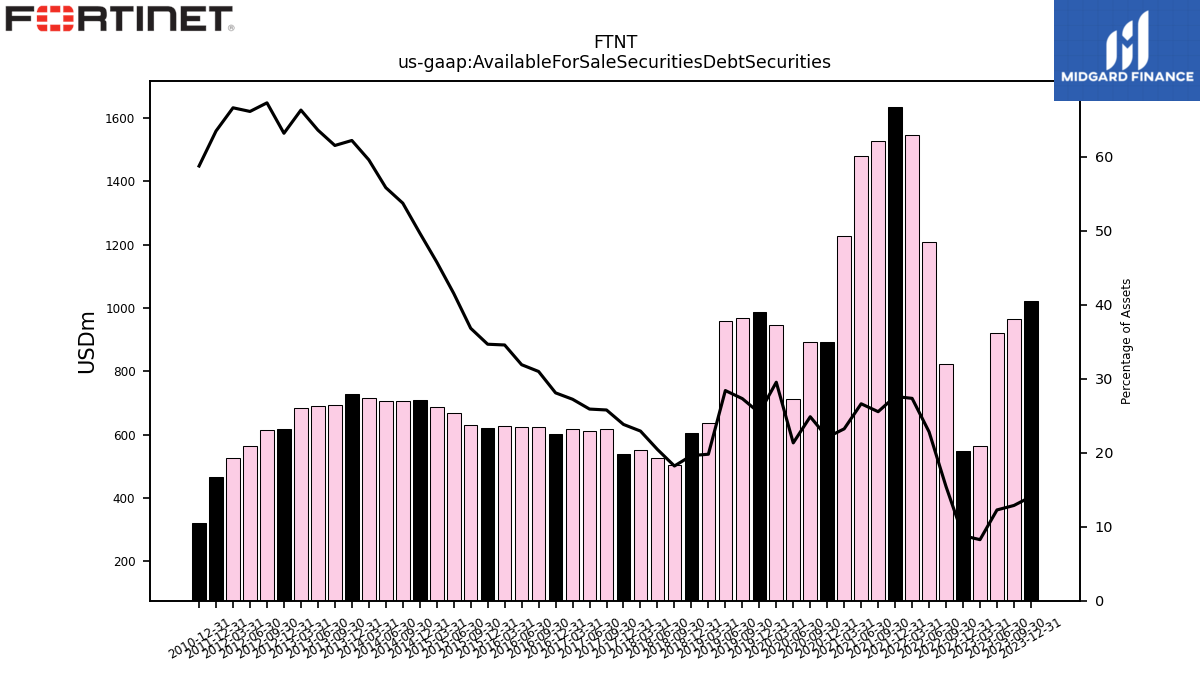
| Available For Sale Securities Debt Securities | 1021.50 | 963.70 | 919.30 | 564.40 | 548.10 | 823.50 | 1209.10 | 1546.50 | 1634.80 | 1526.30 | 1480.50 | 1227.80 | 893.80 | 892.30 | 710.90 | 947.20 | 987.40 | 969.00 | 957.60 | 635.10 | 604.20 | 503.50 | 526.90 | 550.80 | 538.29 | 617.84 | 611.81 | 617.76 | 601.50 | 623.14 | 625.61 | 626.48 | 621.03 | 628.95 | 666.98 | 686.21 | 708.49 | 705.66 | 706.65 | 715.35 | 727.17 | 694.46 | 690.94 | 685.15 | 616.61 | 614.84 | 563.17 | 525.52 | 466.70 | NA | NA | NA | 320.60 | NA | NA |
| 2023-12-31 | 2023-09-30 | 2023-06-30 | 2023-03-31 | 2022-12-31 | 2022-09-30 | 2022-06-30 | 2022-03-31 | 2021-12-31 | 2021-09-30 | 2021-06-30 | 2021-03-31 | 2020-12-31 | 2020-09-30 | 2020-06-30 | 2020-03-31 | 2019-12-31 | 2019-09-30 | 2019-06-30 | 2019-03-31 | 2018-12-31 | 2018-09-30 | 2018-06-30 | 2018-03-31 | 2017-12-31 | 2017-09-30 | 2017-06-30 | 2017-03-31 | 2016-12-31 | 2016-09-30 | 2016-06-30 | 2016-03-31 | 2015-12-31 | 2015-09-30 | 2015-06-30 | 2015-03-31 | 2014-12-31 | 2014-09-30 | 2014-06-30 | 2014-03-31 | 2013-12-31 | 2013-09-30 | 2013-06-30 | 2013-03-31 | 2012-12-31 | 2012-09-30 | 2012-06-30 | 2012-03-31 | 2011-12-31 | 2011-09-30 | 2011-06-30 | 2011-03-31 | 2010-12-31 | 2010-09-30 | 2010-06-30 | ||
|---|---|---|---|---|---|---|---|---|---|---|---|---|---|---|---|---|---|---|---|---|---|---|---|---|---|---|---|---|---|---|---|---|---|---|---|---|---|---|---|---|---|---|---|---|---|---|---|---|---|---|---|---|---|---|---|---|
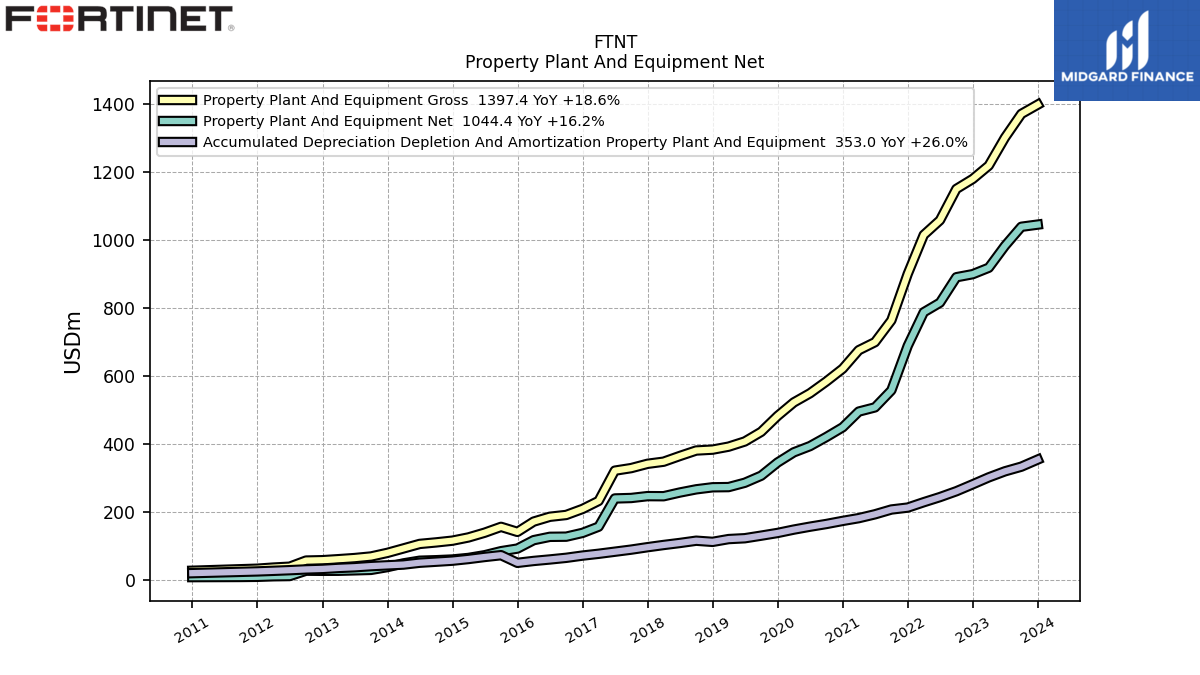
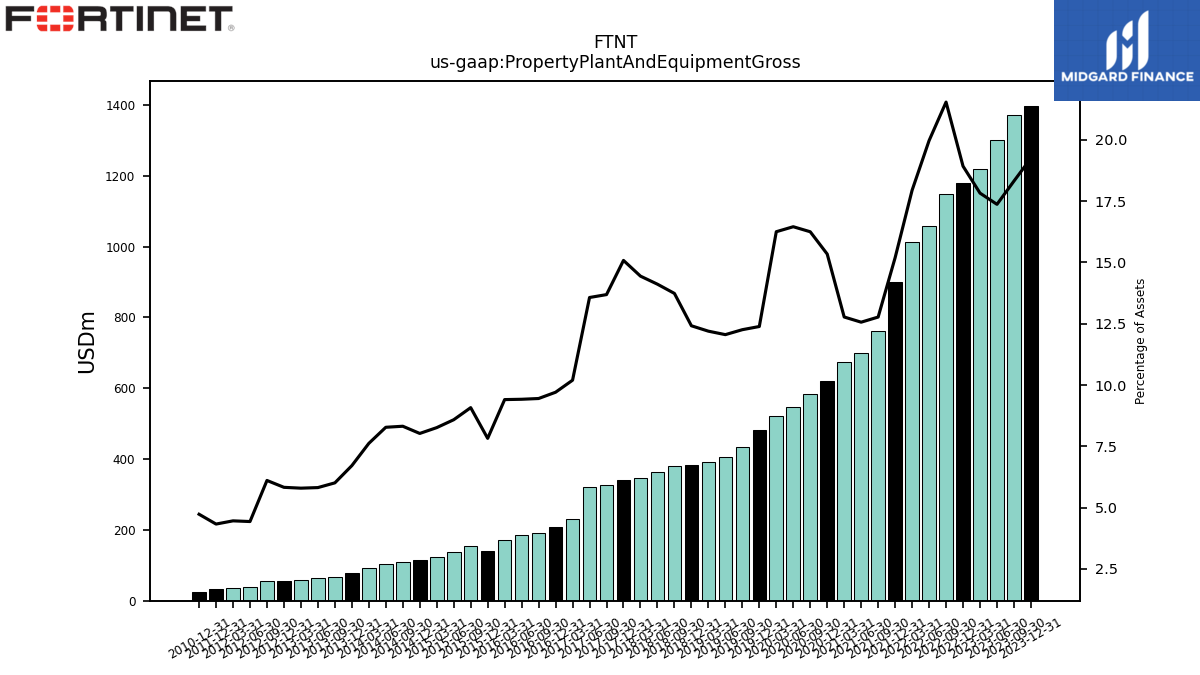
| Property Plant And Equipment Gross | 1397.40 | 1370.10 | 1300.30 | 1218.00 | 1178.70 | 1149.30 | 1057.20 | 1014.00 | 899.30 | 762.60 | 698.40 | 674.80 | 620.50 | 582.80 | 548.10 | 521.10 | 481.30 | 434.60 | 406.20 | 391.00 | 382.20 | 379.60 | 363.50 | 346.70 | 340.55 | 327.87 | 320.35 | 231.22 | 207.72 | 189.97 | 184.65 | 170.40 | 140.13 | 154.98 | 137.78 | 123.81 | 114.35 | 109.21 | 104.72 | 91.46 | 78.45 | 67.81 | 63.17 | 59.84 | 56.86 | 55.79 | 37.74 | 35.18 | 31.82 | NA | NA | NA | 25.80 | NA | NA | |
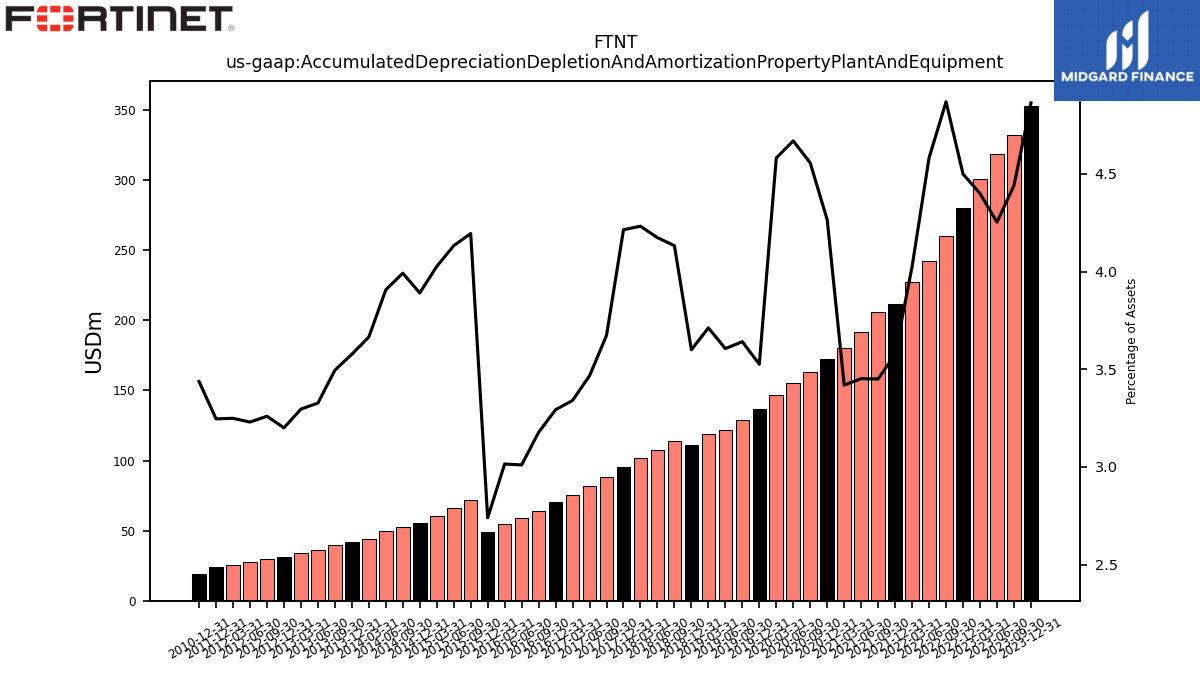
| Accumulated Depreciation Depletion And Amortization Property Plant And Equipment | 353.00 | 332.10 | 318.40 | 300.60 | 280.20 | 259.80 | 242.60 | 227.50 | 211.70 | 206.00 | 191.90 | 180.60 | 172.50 | 163.40 | 155.50 | 146.90 | 137.00 | 129.10 | 121.50 | 119.00 | 110.80 | 114.20 | 107.50 | 101.60 | 95.16 | 87.98 | 81.84 | 75.74 | 70.47 | 63.87 | 59.01 | 54.62 | 49.06 | 71.61 | 66.32 | 60.33 | 55.43 | 52.40 | 49.42 | 43.98 | 41.80 | 39.43 | 36.12 | 34.04 | 31.22 | 29.77 | 27.49 | 25.62 | 23.85 | NA | NA | NA | 18.75 | NA | NA | |
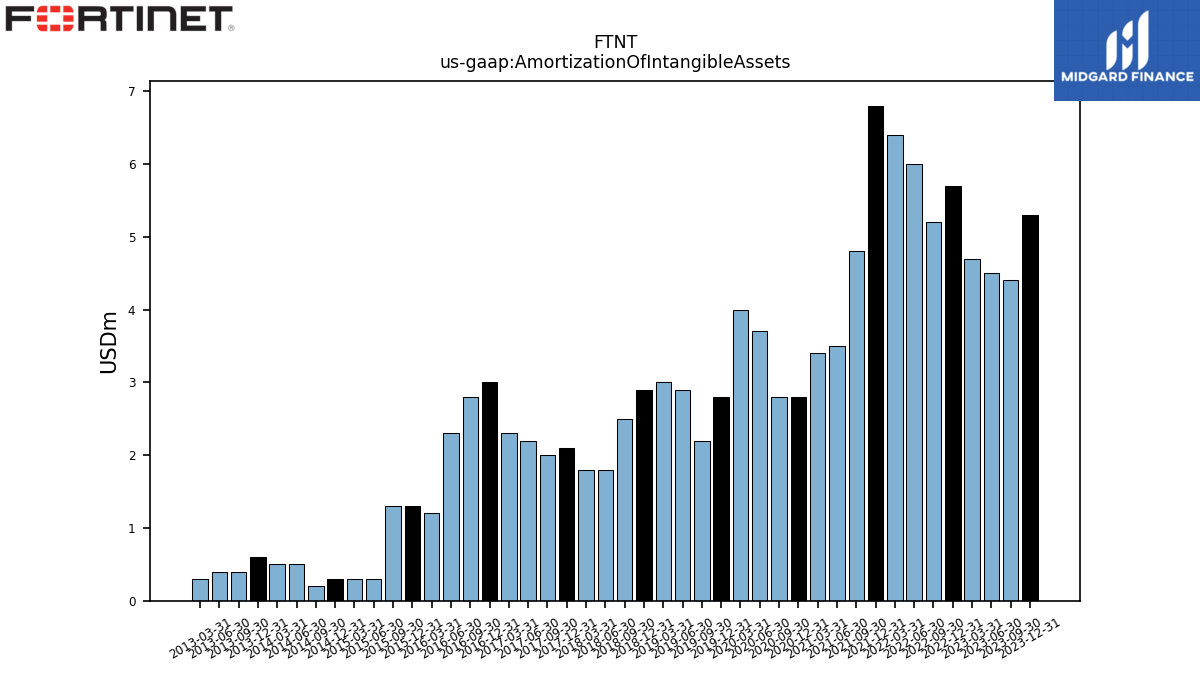
| Amortization Of Intangible Assets | 5.30 | 4.40 | 4.50 | 4.70 | 5.70 | 5.20 | 6.00 | 6.40 | 6.80 | 4.80 | 3.50 | 3.40 | 2.80 | 2.80 | 3.70 | 4.00 | 2.80 | 2.20 | 2.90 | 3.00 | 2.90 | 2.50 | 1.80 | 1.80 | 2.10 | 2.00 | 2.20 | 2.30 | 3.00 | 2.80 | 2.30 | 1.20 | 1.30 | 1.30 | 0.30 | 0.30 | 0.30 | 0.20 | 0.50 | 0.50 | 0.60 | 0.40 | 0.40 | 0.30 | NA | NA | NA | NA | NA | NA | NA | NA | NA | NA | NA | |
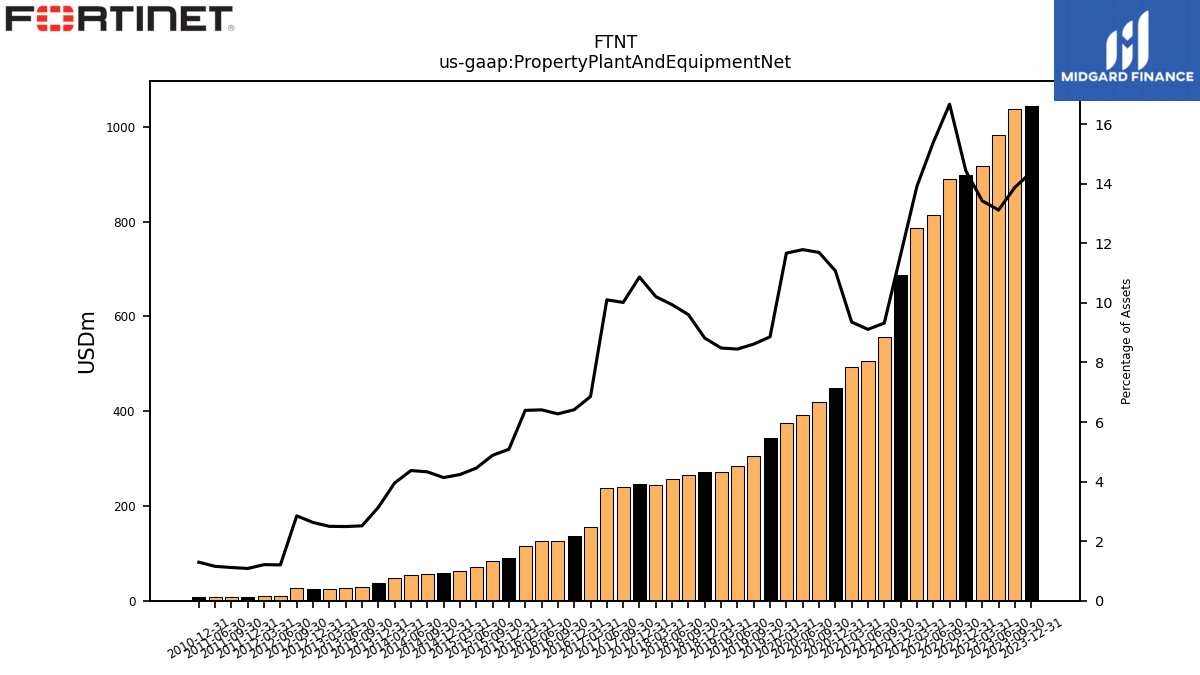
| Property Plant And Equipment Net | 1044.40 | 1038.00 | 981.90 | 917.40 | 898.50 | 889.50 | 814.60 | 786.50 | 687.60 | 556.60 | 506.50 | 494.20 | 448.00 | 419.40 | 392.60 | 374.20 | 344.30 | 305.50 | 284.70 | 272.00 | 271.40 | 265.40 | 256.00 | 245.10 | 245.40 | 239.89 | 238.51 | 155.48 | 137.25 | 126.11 | 125.64 | 115.78 | 91.07 | 83.37 | 71.47 | 63.49 | 58.92 | 56.81 | 55.30 | 47.47 | 36.65 | 28.38 | 27.05 | 25.80 | 25.64 | 26.02 | 10.25 | 9.56 | 7.97 | 7.49 | 7.34 | NA | 7.06 | NA | NA | |
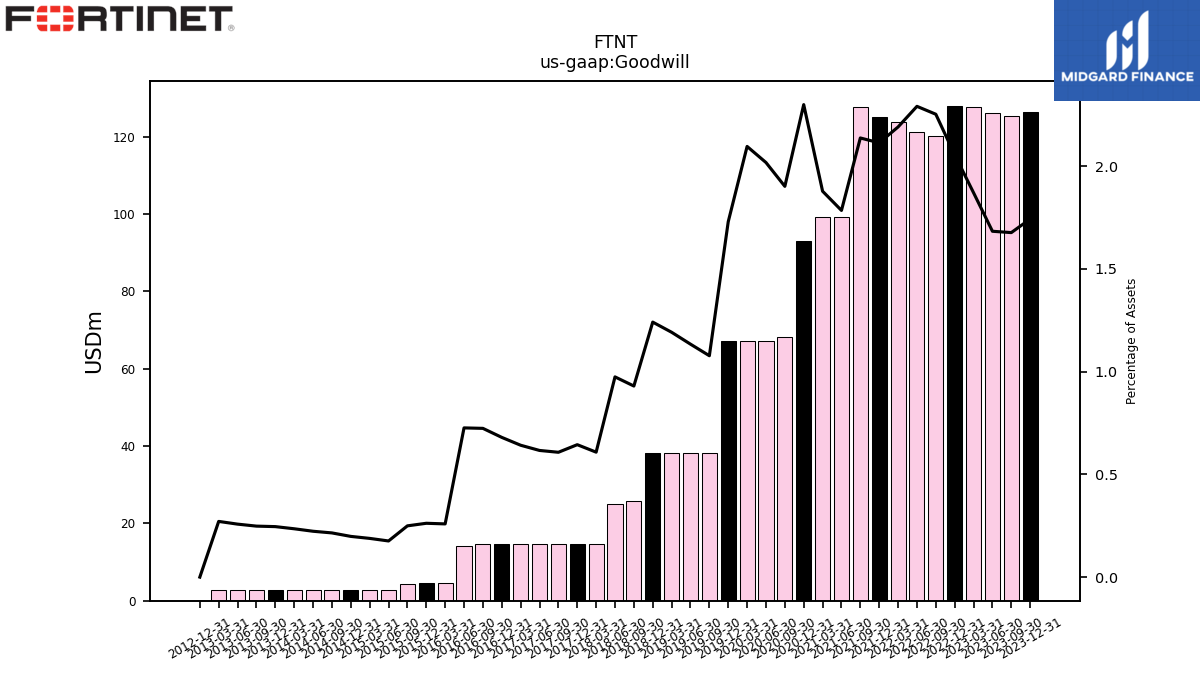
| Goodwill | 126.50 | 125.40 | 126.00 | 127.80 | 128.00 | 120.20 | 121.30 | 123.80 | 125.10 | 127.60 | 99.20 | 99.20 | 93.00 | 68.20 | 67.20 | 67.20 | 67.20 | 38.20 | 38.20 | 38.20 | 38.20 | 25.70 | 25.10 | 14.60 | 14.55 | 14.55 | 14.55 | 14.55 | 14.55 | 14.55 | 14.23 | 4.69 | 4.69 | 4.26 | 2.82 | 2.82 | 2.82 | 2.82 | 2.82 | 2.82 | 2.87 | 2.80 | 2.80 | 2.80 | 0.00 | NA | NA | NA | NA | NA | NA | NA | NA | NA | NA | |
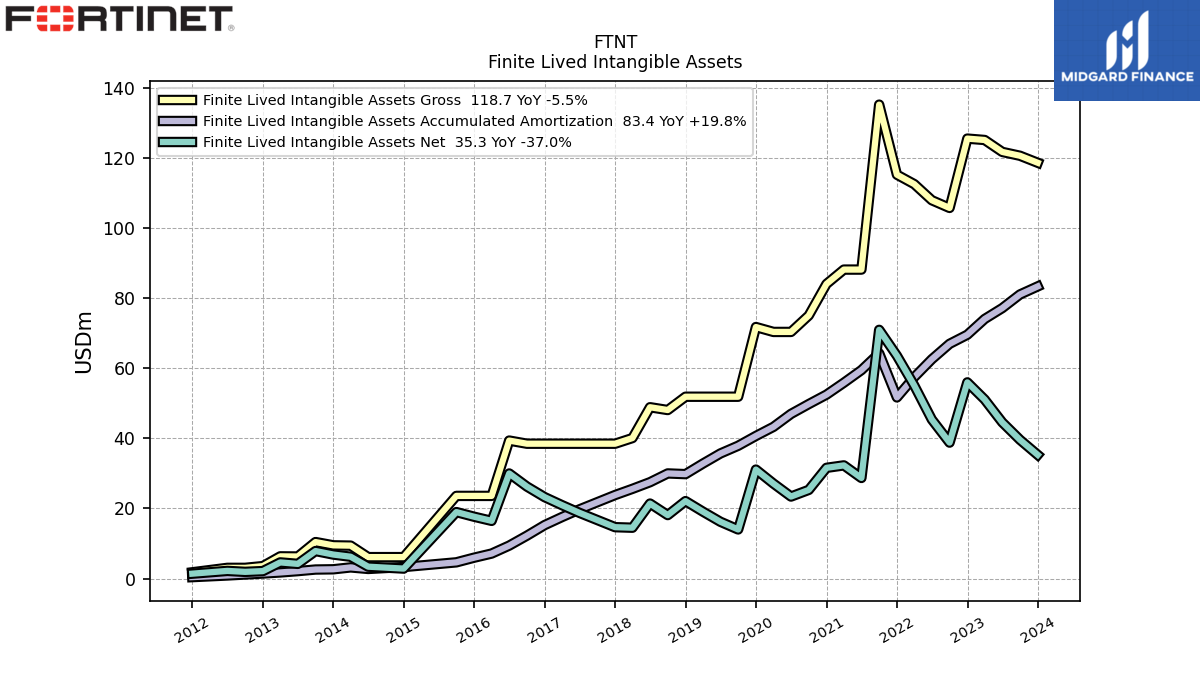
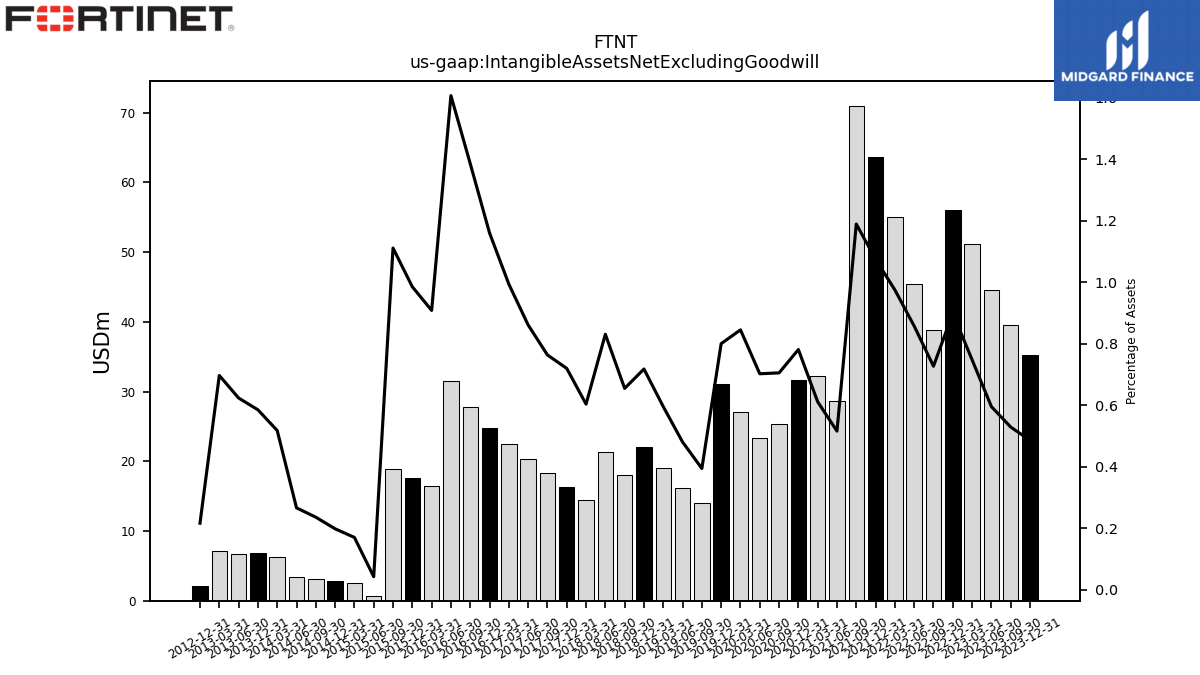
| Intangible Assets Net Excluding Goodwill | 35.30 | 39.60 | 44.60 | 51.10 | 56.00 | 38.80 | 45.40 | 55.10 | 63.60 | 71.00 | 28.70 | 32.30 | 31.60 | 25.30 | 23.40 | 27.10 | 31.10 | 14.00 | 16.20 | 19.10 | 22.10 | 18.10 | 21.40 | 14.50 | 16.25 | 18.29 | 20.33 | 22.54 | 24.83 | 27.85 | 31.49 | 16.46 | 17.64 | 18.97 | 0.69 | 2.56 | 2.83 | 3.10 | 3.38 | 6.22 | 6.84 | NA | 6.77 | 7.20 | 2.12 | NA | NA | NA | NA | NA | NA | NA | NA | NA | NA | |
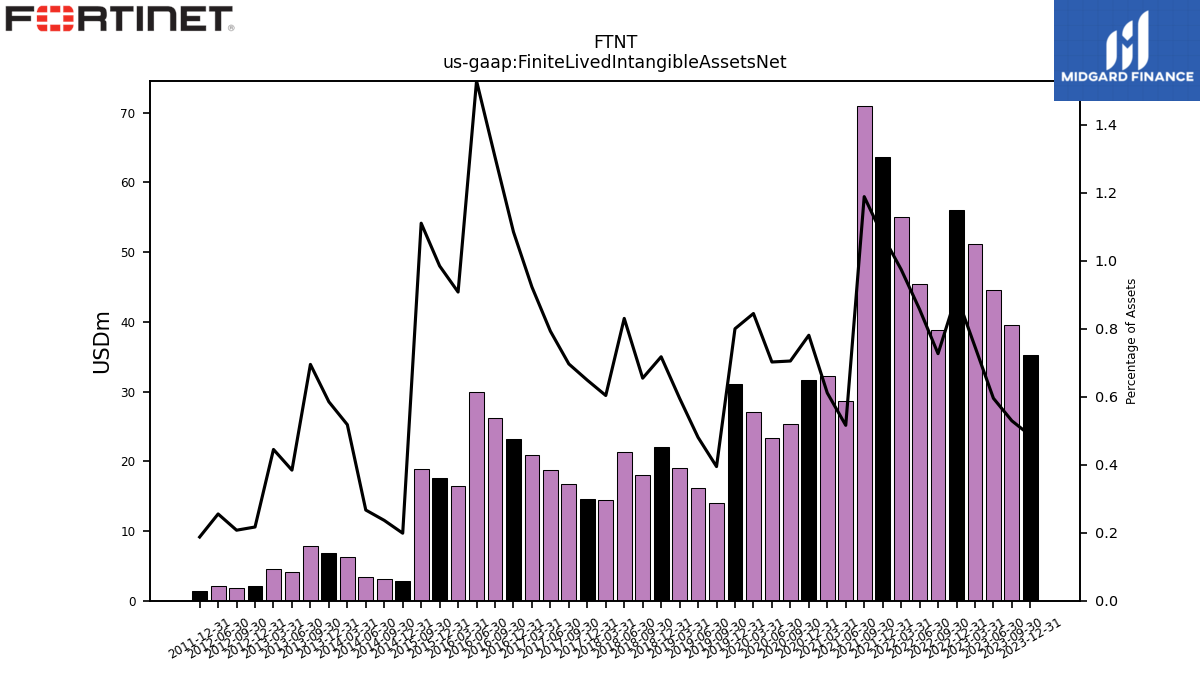
| Finite Lived Intangible Assets Net | 35.30 | 39.60 | 44.60 | 51.10 | 56.00 | 38.80 | 45.40 | 55.10 | 63.60 | 71.00 | 28.70 | 32.30 | 31.60 | 25.30 | 23.40 | 27.10 | 31.10 | 14.00 | 16.20 | 19.10 | 22.10 | 18.10 | 21.40 | 14.50 | 14.65 | 16.69 | 18.73 | 20.93 | 23.23 | 26.25 | 29.99 | 16.46 | 17.64 | 18.97 | NA | NA | 2.83 | 3.10 | 3.38 | 6.22 | 6.84 | 7.85 | 4.17 | 4.60 | 2.12 | 1.90 | 2.17 | NA | 1.38 | NA | NA | NA | NA | NA | NA | |
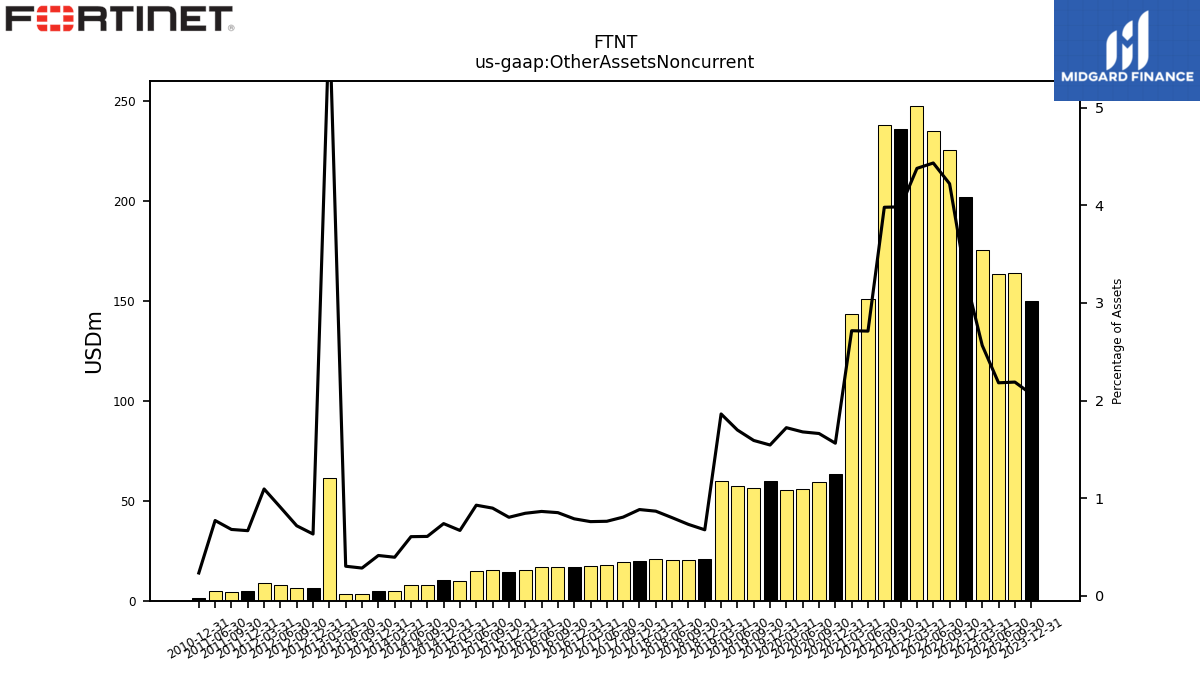
| Other Assets Noncurrent | 150.00 | 163.70 | 163.30 | 175.20 | 202.00 | 225.20 | 234.70 | 247.40 | 235.80 | 237.60 | 150.70 | 143.40 | 63.20 | 59.60 | 55.90 | 55.20 | 60.00 | 56.40 | 57.20 | 59.70 | 20.80 | 20.20 | 20.60 | 20.80 | 19.94 | 19.30 | 18.01 | 17.22 | 16.87 | 17.11 | 16.93 | 15.30 | 14.39 | 15.32 | 14.89 | 10.02 | 10.53 | 7.98 | 7.66 | 4.73 | 4.82 | 3.20 | 3.28 | 61.14 | 6.17 | 6.55 | 7.71 | 8.62 | 4.90 | 4.56 | 4.89 | NA | 1.27 | NA | NA | |
| Equity Securities Fv Ni | 21.00 | 19.80 | 22.10 | 26.10 | 25.50 | 26.90 | 24.30 | 32.40 | 38.60 | 40.80 | NA | NA | NA | NA | NA | NA | NA | NA | NA | NA | NA | NA | NA | NA | NA | NA | NA | NA | NA | NA | NA | NA | NA | NA | NA | NA | NA | NA | NA | NA | NA | NA | NA | NA | NA | NA | NA | NA | NA | NA | NA | NA | NA | NA | NA | |
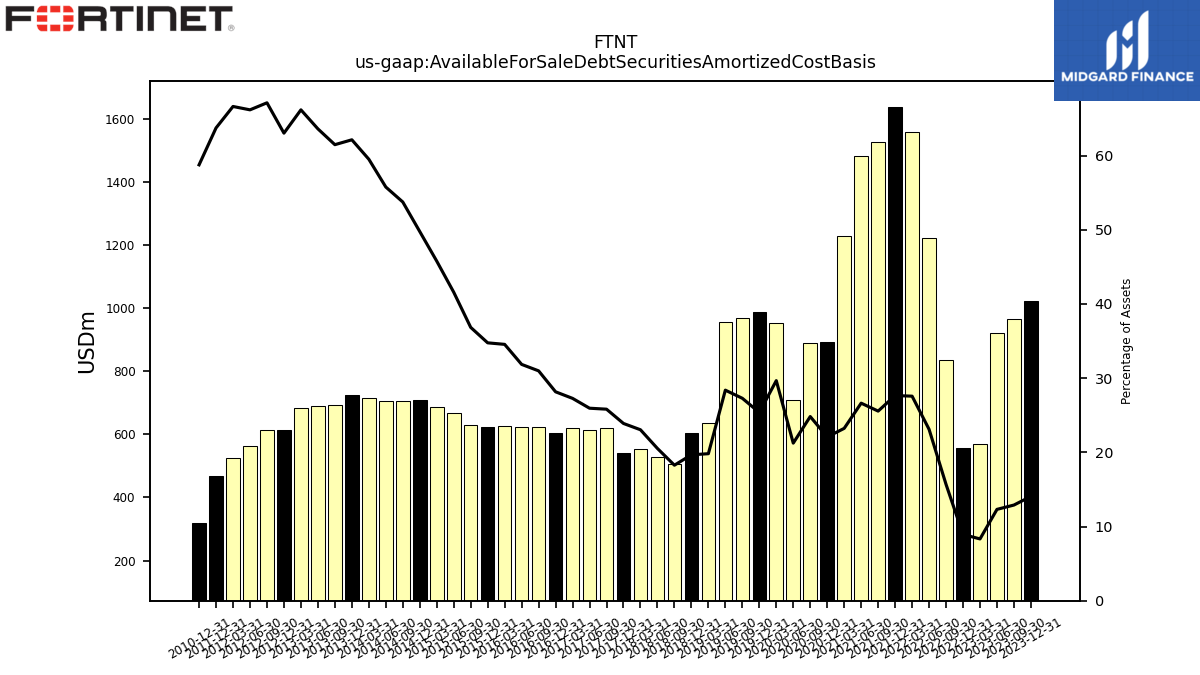
| Available For Sale Debt Securities Amortized Cost Basis | 1021.40 | 964.90 | 922.10 | 569.30 | 556.80 | 836.70 | 1223.30 | 1558.30 | 1637.30 | 1526.30 | 1480.50 | 1227.40 | 892.80 | 890.40 | 707.60 | 951.20 | 986.20 | 967.60 | 956.40 | 635.40 | 605.50 | 504.90 | 528.70 | 553.30 | 539.57 | 618.51 | 612.65 | 618.51 | 602.68 | 622.90 | 624.50 | 626.03 | 622.47 | 629.09 | 667.46 | 685.87 | 709.03 | 705.49 | 705.50 | 714.17 | 726.00 | 693.52 | 690.61 | 683.35 | 614.85 | 612.97 | 563.27 | 525.29 | 468.27 | NA | NA | NA | 320.47 | NA | NA |
| 2023-12-31 | 2023-09-30 | 2023-06-30 | 2023-03-31 | 2022-12-31 | 2022-09-30 | 2022-06-30 | 2022-03-31 | 2021-12-31 | 2021-09-30 | 2021-06-30 | 2021-03-31 | 2020-12-31 | 2020-09-30 | 2020-06-30 | 2020-03-31 | 2019-12-31 | 2019-09-30 | 2019-06-30 | 2019-03-31 | 2018-12-31 | 2018-09-30 | 2018-06-30 | 2018-03-31 | 2017-12-31 | 2017-09-30 | 2017-06-30 | 2017-03-31 | 2016-12-31 | 2016-09-30 | 2016-06-30 | 2016-03-31 | 2015-12-31 | 2015-09-30 | 2015-06-30 | 2015-03-31 | 2014-12-31 | 2014-09-30 | 2014-06-30 | 2014-03-31 | 2013-12-31 | 2013-09-30 | 2013-06-30 | 2013-03-31 | 2012-12-31 | 2012-09-30 | 2012-06-30 | 2012-03-31 | 2011-12-31 | 2011-09-30 | 2011-06-30 | 2011-03-31 | 2010-12-31 | 2010-09-30 | 2010-06-30 | ||
|---|---|---|---|---|---|---|---|---|---|---|---|---|---|---|---|---|---|---|---|---|---|---|---|---|---|---|---|---|---|---|---|---|---|---|---|---|---|---|---|---|---|---|---|---|---|---|---|---|---|---|---|---|---|---|---|---|
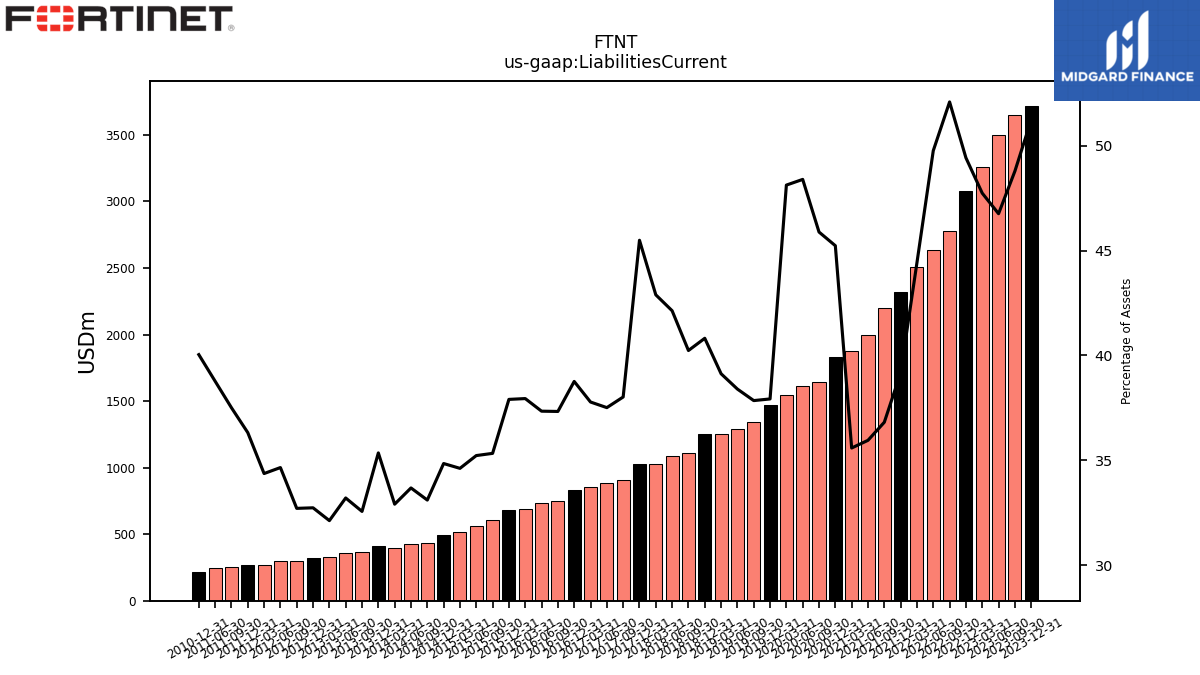
| Liabilities Current | 3719.00 | 3649.00 | 3500.60 | 3261.80 | 3078.40 | 2779.60 | 2634.90 | 2510.50 | 2318.10 | 2198.00 | 1998.50 | 1879.70 | 1829.50 | 1645.60 | 1611.90 | 1543.00 | 1473.60 | 1341.90 | 1293.70 | 1254.30 | 1256.40 | 1111.90 | 1085.20 | 1029.70 | 1027.22 | 910.64 | 885.52 | 856.59 | 829.44 | 750.36 | 731.96 | 687.34 | 678.67 | 603.13 | 565.30 | 518.63 | 496.46 | 434.50 | 426.09 | 394.87 | 413.06 | 367.33 | 360.48 | 331.73 | 319.30 | 298.69 | 294.98 | 270.96 | 266.86 | 251.67 | 246.29 | NA | 218.38 | NA | NA | |
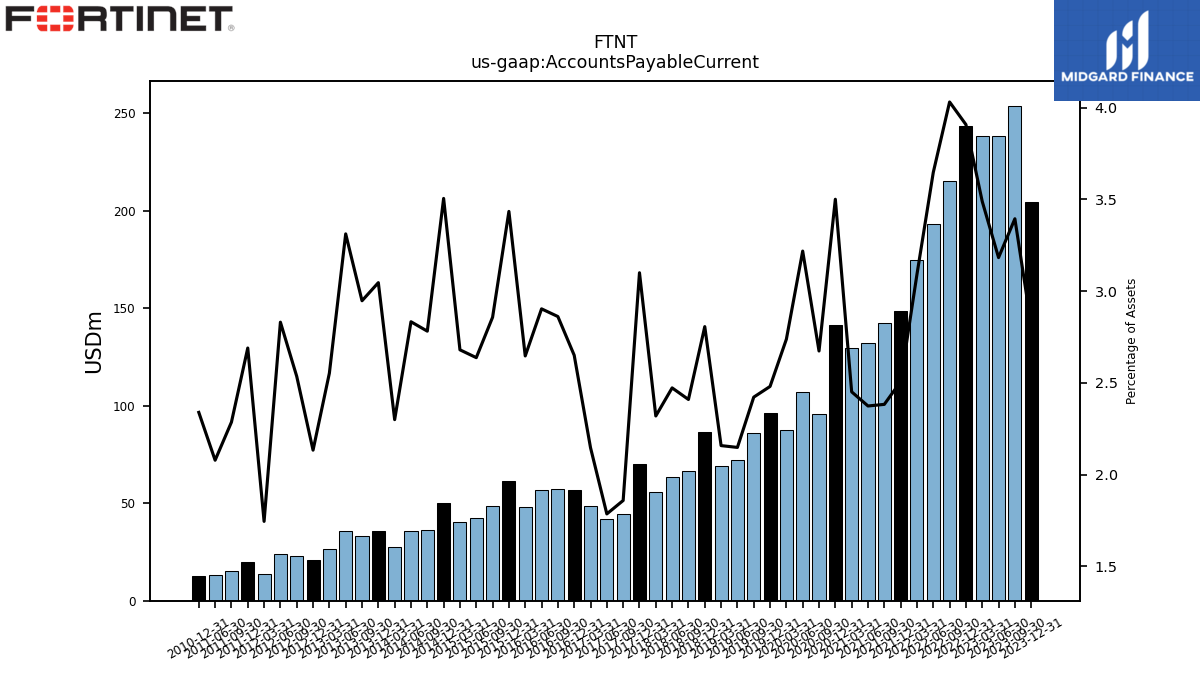
| Accounts Payable Current | 204.30 | 253.90 | 238.30 | 238.40 | 243.40 | 215.10 | 193.10 | 174.70 | 148.40 | 142.30 | 132.00 | 129.50 | 141.60 | 95.90 | 107.20 | 87.80 | 96.40 | 85.90 | 72.40 | 69.20 | 86.40 | 66.60 | 63.70 | 55.70 | 70.01 | 44.54 | 42.17 | 48.69 | 56.73 | 57.53 | 56.92 | 47.95 | 61.50 | 48.79 | 42.34 | 40.16 | 49.95 | 36.52 | 35.85 | 27.60 | 35.60 | 33.26 | 35.96 | 26.37 | 20.82 | 23.16 | 24.10 | 13.76 | 19.77 | 15.34 | 13.21 | NA | 12.76 | NA | NA | |
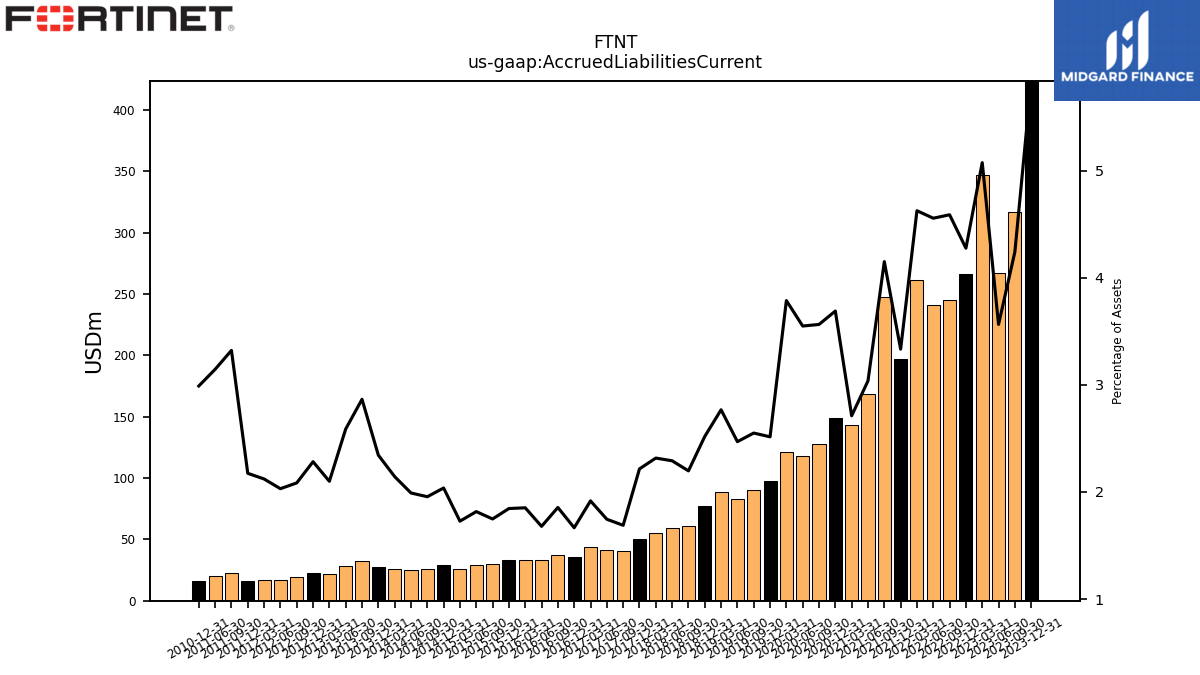
| Accrued Liabilities Current | 423.70 | 317.20 | 266.80 | 346.70 | 266.30 | 244.80 | 241.20 | 261.40 | 197.30 | 247.80 | 168.80 | 143.20 | 149.20 | 127.80 | 118.20 | 121.40 | 97.70 | 90.40 | 83.20 | 88.70 | 77.50 | 60.70 | 59.00 | 55.60 | 50.02 | 40.44 | 41.19 | 43.45 | 35.64 | 37.28 | 32.90 | 33.54 | 33.03 | 29.83 | 29.14 | 25.87 | 29.02 | 25.66 | 25.18 | 25.72 | 27.38 | 32.32 | 28.09 | 21.68 | 22.26 | 19.03 | 17.28 | 16.72 | 15.97 | 22.29 | 19.98 | NA | 16.30 | NA | NA |
| 2023-12-31 | 2023-09-30 | 2023-06-30 | 2023-03-31 | 2022-12-31 | 2022-09-30 | 2022-06-30 | 2022-03-31 | 2021-12-31 | 2021-09-30 | 2021-06-30 | 2021-03-31 | 2020-12-31 | 2020-09-30 | 2020-06-30 | 2020-03-31 | 2019-12-31 | 2019-09-30 | 2019-06-30 | 2019-03-31 | 2018-12-31 | 2018-09-30 | 2018-06-30 | 2018-03-31 | 2017-12-31 | 2017-09-30 | 2017-06-30 | 2017-03-31 | 2016-12-31 | 2016-09-30 | 2016-06-30 | 2016-03-31 | 2015-12-31 | 2015-09-30 | 2015-06-30 | 2015-03-31 | 2014-12-31 | 2014-09-30 | 2014-06-30 | 2014-03-31 | 2013-12-31 | 2013-09-30 | 2013-06-30 | 2013-03-31 | 2012-12-31 | 2012-09-30 | 2012-06-30 | 2012-03-31 | 2011-12-31 | 2011-09-30 | 2011-06-30 | 2011-03-31 | 2010-12-31 | 2010-09-30 | 2010-06-30 | ||
|---|---|---|---|---|---|---|---|---|---|---|---|---|---|---|---|---|---|---|---|---|---|---|---|---|---|---|---|---|---|---|---|---|---|---|---|---|---|---|---|---|---|---|---|---|---|---|---|---|---|---|---|---|---|---|---|---|
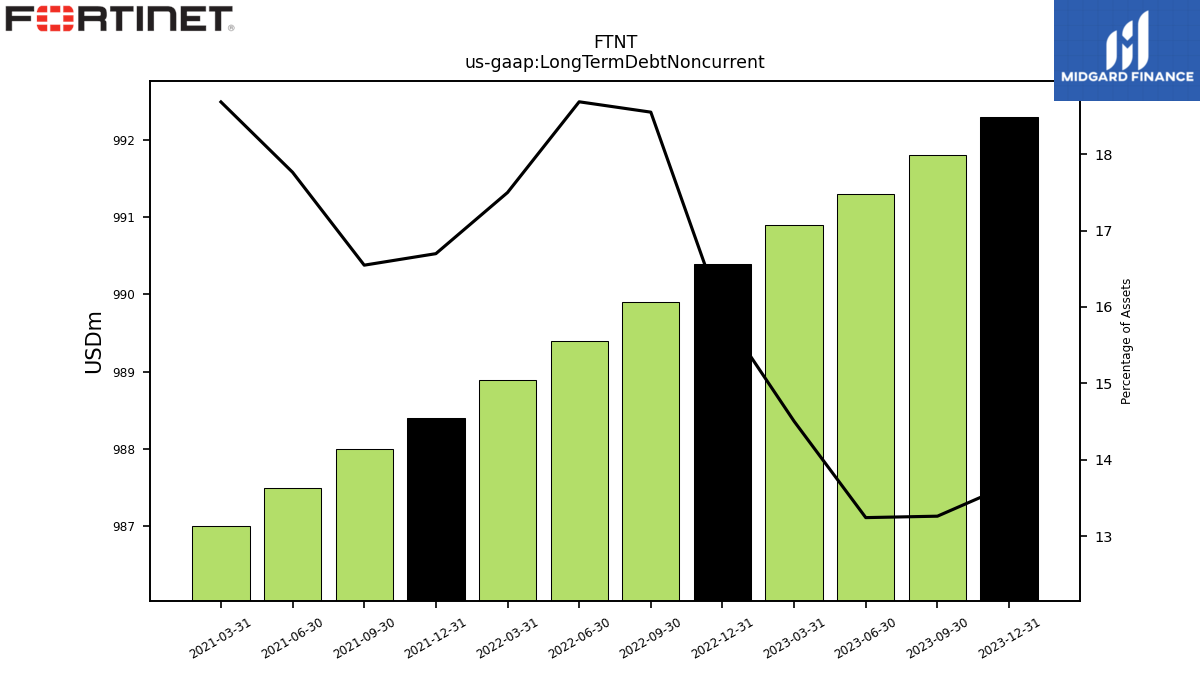
| Long Term Debt Noncurrent | 992.30 | 991.80 | 991.30 | 990.90 | 990.40 | 989.90 | 989.40 | 988.90 | 988.40 | 988.00 | 987.50 | 987.00 | NA | NA | NA | NA | NA | NA | NA | NA | NA | NA | NA | NA | NA | NA | NA | NA | NA | NA | NA | NA | NA | NA | NA | NA | NA | NA | NA | NA | NA | NA | NA | NA | NA | NA | NA | NA | NA | NA | NA | NA | NA | NA | NA | |
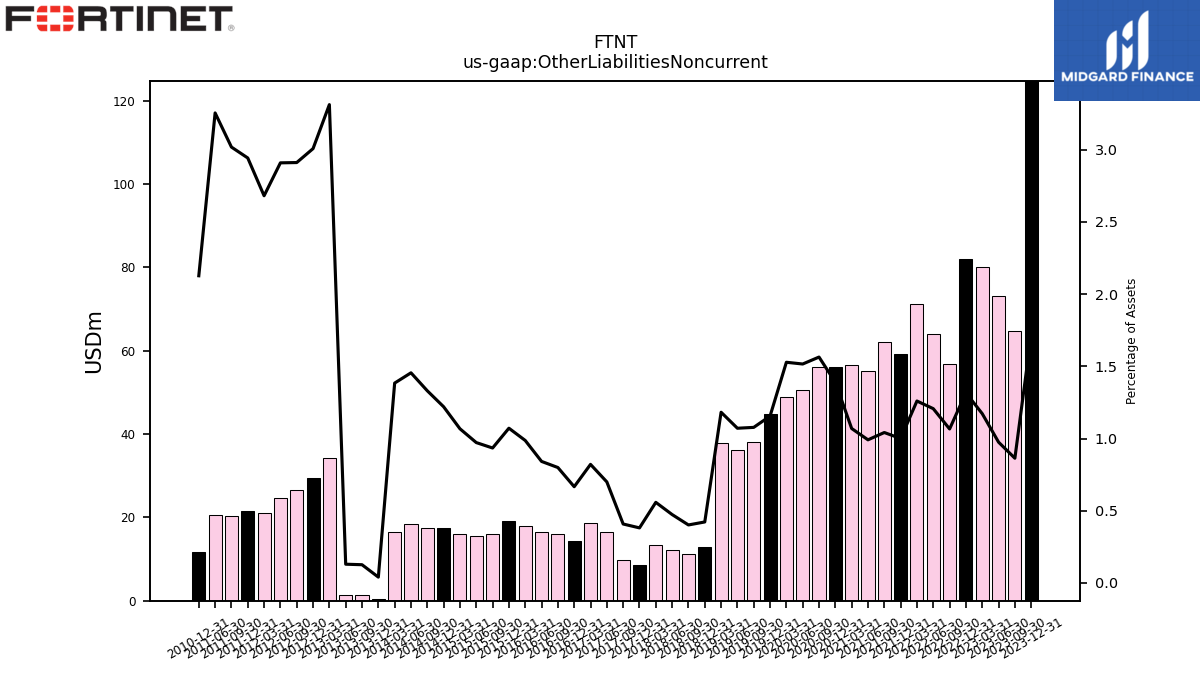
| Other Liabilities Noncurrent | 124.70 | 64.60 | 73.00 | 80.10 | 82.00 | 56.90 | 63.90 | 71.20 | 59.20 | 62.20 | 55.10 | 56.50 | 56.20 | 56.10 | 50.50 | 49.00 | 44.90 | 38.20 | 36.10 | 37.90 | 13.00 | 11.10 | 12.20 | 13.40 | 8.61 | 9.78 | 16.52 | 18.62 | 14.26 | 16.07 | 16.50 | 17.87 | 19.19 | 15.95 | 15.60 | 16.00 | 17.39 | 17.47 | 18.41 | 16.61 | 0.47 | 1.42 | 1.41 | 34.21 | 29.34 | 26.59 | 24.77 | 21.14 | 21.62 | 20.25 | 20.68 | NA | 11.60 | NA | NA | |
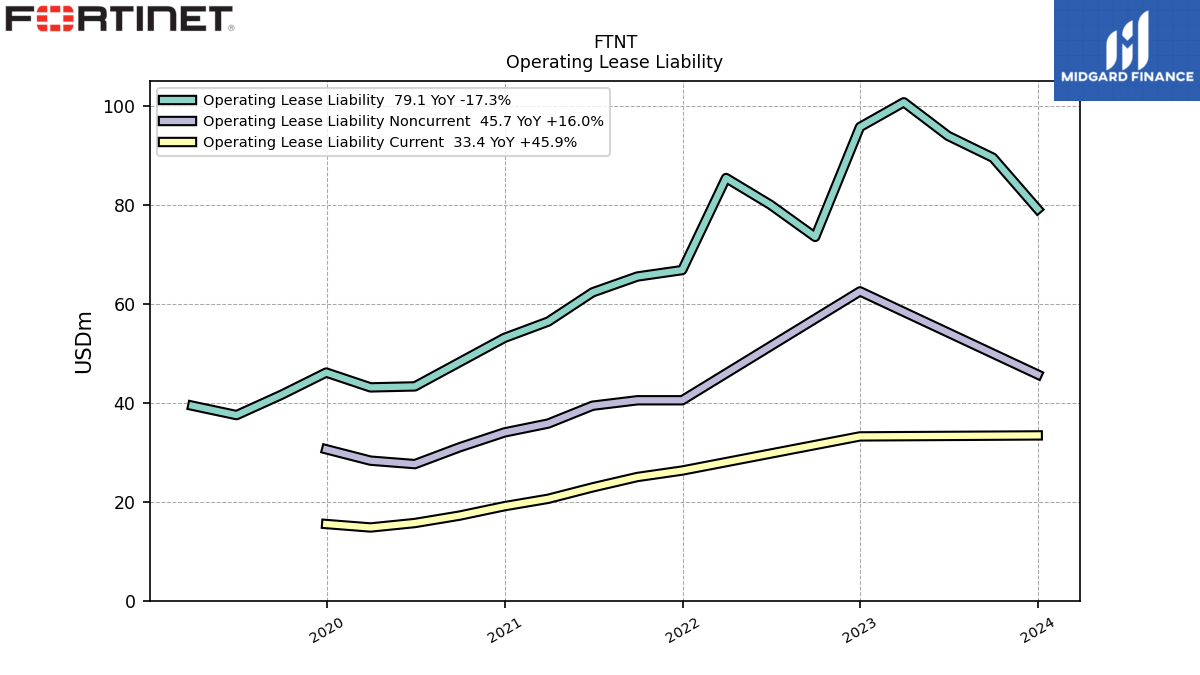
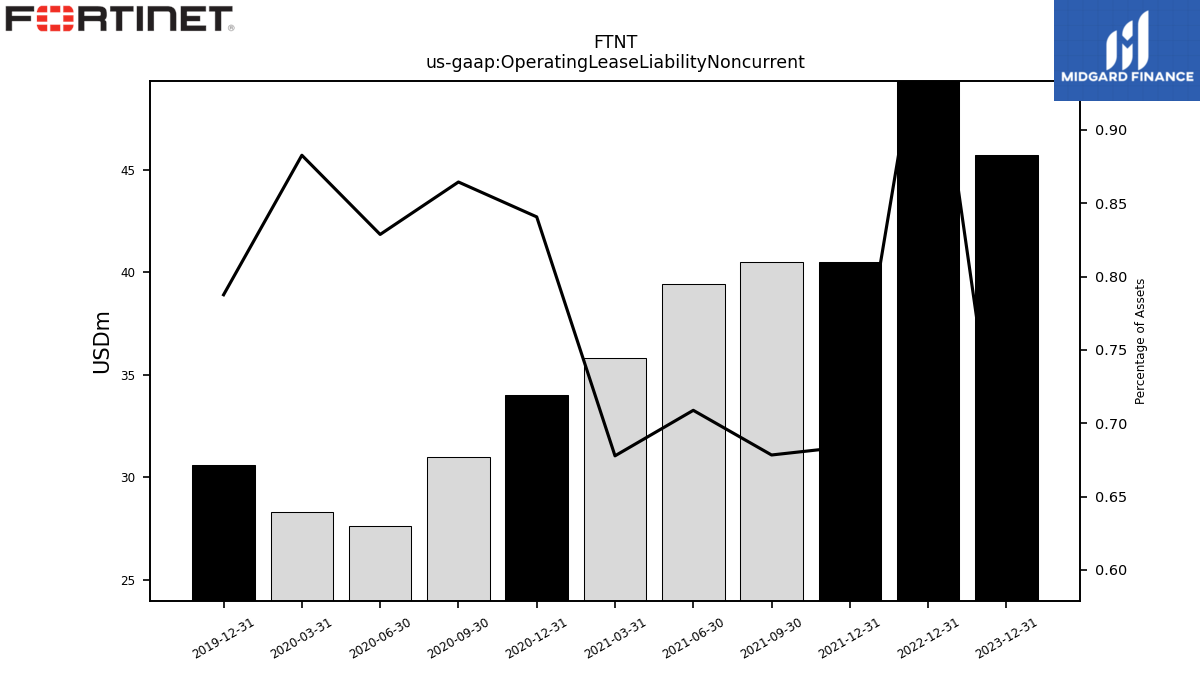
| Operating Lease Liability Noncurrent | 45.70 | NA | NA | NA | 62.50 | NA | NA | NA | 40.50 | 40.50 | 39.40 | 35.80 | 34.00 | 31.00 | 27.60 | 28.30 | 30.60 | NA | NA | NA | NA | NA | NA | NA | NA | NA | NA | NA | NA | NA | NA | NA | NA | NA | NA | NA | NA | NA | NA | NA | NA | NA | NA | NA | NA | NA | NA | NA | NA | NA | NA | NA | NA | NA | NA |
| 2023-12-31 | 2023-09-30 | 2023-06-30 | 2023-03-31 | 2022-12-31 | 2022-09-30 | 2022-06-30 | 2022-03-31 | 2021-12-31 | 2021-09-30 | 2021-06-30 | 2021-03-31 | 2020-12-31 | 2020-09-30 | 2020-06-30 | 2020-03-31 | 2019-12-31 | 2019-09-30 | 2019-06-30 | 2019-03-31 | 2018-12-31 | 2018-09-30 | 2018-06-30 | 2018-03-31 | 2017-12-31 | 2017-09-30 | 2017-06-30 | 2017-03-31 | 2016-12-31 | 2016-09-30 | 2016-06-30 | 2016-03-31 | 2015-12-31 | 2015-09-30 | 2015-06-30 | 2015-03-31 | 2014-12-31 | 2014-09-30 | 2014-06-30 | 2014-03-31 | 2013-12-31 | 2013-09-30 | 2013-06-30 | 2013-03-31 | 2012-12-31 | 2012-09-30 | 2012-06-30 | 2012-03-31 | 2011-12-31 | 2011-09-30 | 2011-06-30 | 2011-03-31 | 2010-12-31 | 2010-09-30 | 2010-06-30 | ||
|---|---|---|---|---|---|---|---|---|---|---|---|---|---|---|---|---|---|---|---|---|---|---|---|---|---|---|---|---|---|---|---|---|---|---|---|---|---|---|---|---|---|---|---|---|---|---|---|---|---|---|---|---|---|---|---|---|
| Stockholders Equity | -463.40 | 74.10 | 321.20 | 11.40 | -281.60 | -634.70 | -392.90 | 217.70 | 781.70 | 1118.10 | 1050.20 | 980.80 | 856.00 | 713.20 | 543.90 | 536.30 | 1321.90 | 1200.40 | 1122.30 | 1058.10 | 1010.20 | 891.60 | 780.20 | 693.50 | 589.38 | 902.23 | 922.14 | 898.25 | 837.68 | 823.09 | 804.63 | 742.40 | 755.38 | 795.39 | 750.83 | 719.75 | 675.97 | 649.23 | 625.22 | 610.09 | 585.76 | 599.95 | 567.18 | 547.71 | 510.93 | 478.47 | 426.64 | 398.33 | 358.35 | 316.87 | 287.52 | NA | 232.45 | NA | NA | |
| Stockholders Equity Including Portion Attributable To Noncontrolling Interest | -463.40 | 74.10 | 321.20 | 11.40 | -281.60 | -622.80 | -379.60 | 233.20 | 798.40 | 1135.60 | 1050.20 | 980.80 | 856.00 | 713.20 | 566.70 | NA | 1342.40 | NA | NA | NA | 1025.50 | NA | NA | NA | NA | NA | NA | NA | NA | NA | NA | NA | NA | NA | NA | NA | NA | NA | NA | NA | NA | NA | NA | NA | NA | NA | NA | NA | NA | NA | NA | NA | NA | NA | NA | |
| Common Stock Value | 0.80 | 0.80 | 0.80 | 0.80 | 0.80 | 0.80 | 0.80 | 0.20 | 0.20 | 0.20 | 0.20 | 0.20 | 0.20 | 0.20 | 0.20 | 0.20 | 0.20 | 0.20 | 0.20 | 0.20 | 0.20 | 0.20 | 0.20 | 0.20 | 0.17 | 0.17 | 0.17 | 0.17 | 0.17 | 0.17 | 0.17 | 0.17 | 0.17 | 0.17 | 0.17 | 0.17 | 0.17 | 0.17 | 0.16 | 0.16 | 0.16 | 0.16 | 0.16 | 0.16 | 0.16 | 0.16 | 0.16 | 0.16 | 0.16 | 0.15 | 0.15 | NA | 0.15 | NA | NA | |
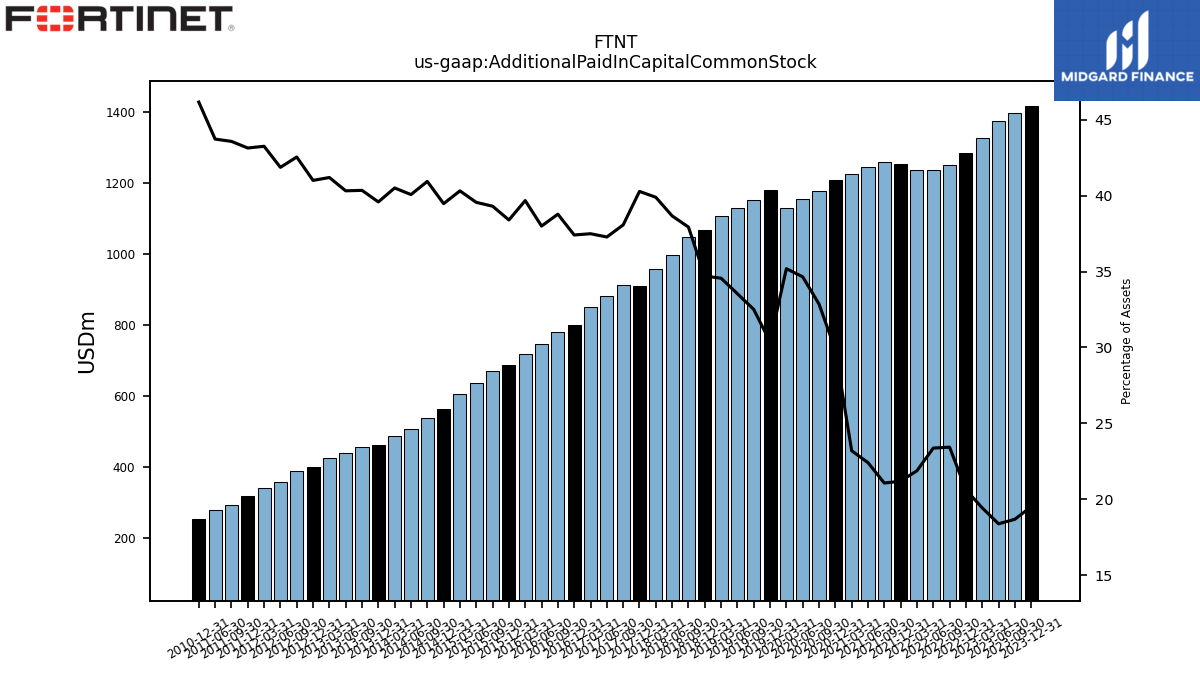
| Additional Paid In Capital Common Stock | 1416.40 | 1397.00 | 1375.90 | 1327.40 | 1284.20 | 1250.20 | 1237.30 | 1236.30 | 1254.20 | 1257.70 | 1245.80 | 1225.20 | 1207.20 | 1178.50 | 1154.30 | 1128.40 | 1180.30 | 1152.60 | 1130.20 | 1108.10 | 1068.30 | 1048.40 | 996.10 | 957.90 | 909.64 | 912.05 | 880.14 | 850.23 | 800.65 | 779.67 | 744.92 | 718.85 | 687.66 | 671.14 | 634.97 | 604.15 | 562.50 | 537.45 | 507.05 | 486.17 | 462.64 | 455.28 | 437.84 | 425.52 | 400.07 | 388.63 | 356.44 | 341.10 | 317.03 | 292.44 | 277.82 | NA | 251.84 | NA | NA | |
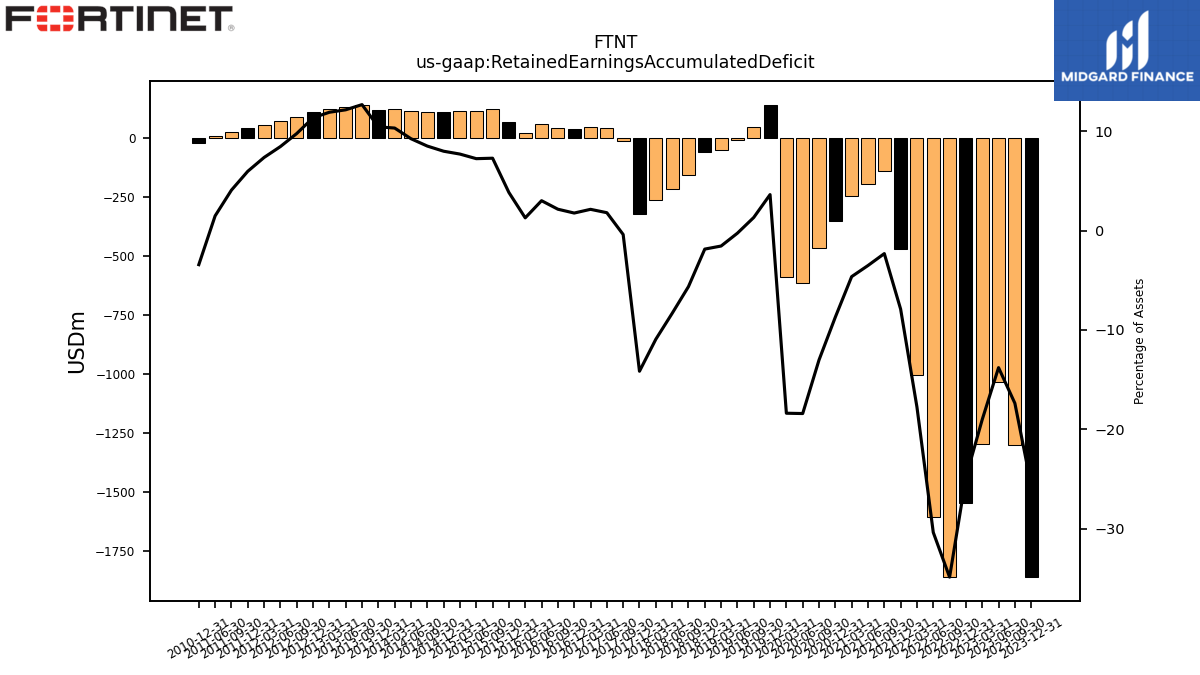
| Retained Earnings Accumulated Deficit | -1861.70 | -1299.40 | -1032.40 | -1298.70 | -1546.40 | -1860.20 | -1607.60 | -1003.40 | -467.90 | -138.60 | -195.70 | -244.90 | -352.10 | -466.90 | -613.10 | -589.20 | 140.30 | 46.50 | -9.00 | -50.00 | -57.50 | -156.00 | -214.70 | -262.60 | -319.58 | -9.59 | 42.34 | 48.34 | 37.62 | 43.09 | 58.81 | 23.09 | 68.48 | 124.17 | 116.00 | 115.20 | 113.64 | 111.50 | 116.82 | 123.68 | 121.86 | 142.86 | 131.83 | 122.85 | 110.60 | 89.09 | 71.89 | 57.94 | 43.77 | 27.27 | 9.35 | NA | -18.73 | NA | NA | |
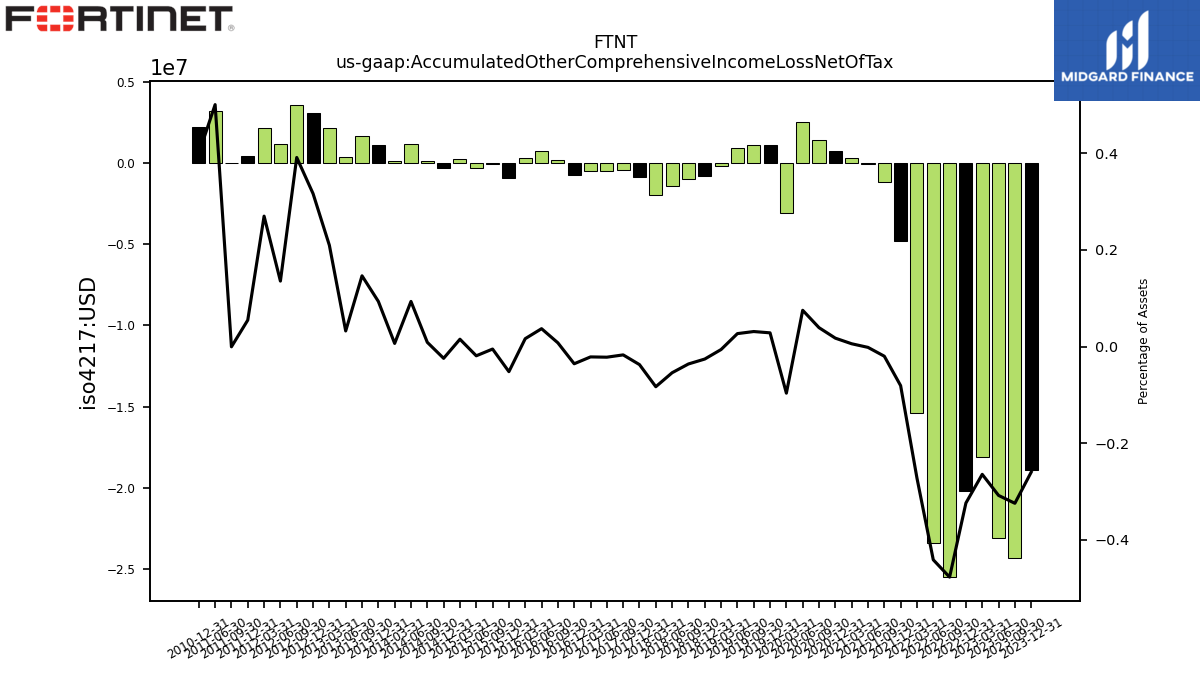
| Accumulated Other Comprehensive Income Loss Net Of Tax | -18.90 | -24.30 | -23.10 | -18.10 | -20.20 | -25.50 | -23.40 | -15.40 | -4.80 | -1.20 | -0.10 | 0.30 | 0.70 | 1.40 | 2.50 | -3.10 | 1.10 | 1.10 | 0.90 | -0.20 | -0.80 | -1.00 | -1.40 | -2.00 | -0.85 | -0.42 | -0.52 | -0.49 | -0.77 | 0.15 | 0.72 | 0.29 | -0.93 | -0.09 | -0.31 | 0.23 | -0.35 | 0.11 | 1.18 | 0.08 | 1.09 | 1.65 | 0.35 | 2.17 | 3.09 | 3.58 | 1.15 | 2.13 | 0.40 | -0.00 | 3.18 | NA | 2.18 | NA | NA | |
| Adjustments To Additional Paid In Capital Sharebased Compensation Requisite Service Period Recognition Value | 63.40 | 64.30 | 65.00 | 56.30 | 54.70 | 54.70 | 54.70 | 53.20 | 53.10 | 52.70 | 52.60 | 49.50 | 48.70 | 49.30 | 48.90 | 44.80 | 42.60 | 42.40 | 45.00 | 43.00 | 42.60 | 43.20 | 40.60 | 36.50 | NA | NA | NA | NA | NA | NA | NA | NA | NA | NA | NA | NA | NA | NA | NA | NA | NA | NA | NA | NA | NA | NA | NA | NA | NA | NA | NA | NA | NA | NA | NA |
| 2023-12-31 | 2023-09-30 | 2023-06-30 | 2023-03-31 | 2022-12-31 | 2022-09-30 | 2022-06-30 | 2022-03-31 | 2021-12-31 | 2021-09-30 | 2021-06-30 | 2021-03-31 | 2020-12-31 | 2020-09-30 | 2020-06-30 | 2020-03-31 | 2019-12-31 | 2019-09-30 | 2019-06-30 | 2019-03-31 | 2018-12-31 | 2018-09-30 | 2018-06-30 | 2018-03-31 | 2017-12-31 | 2017-09-30 | 2017-06-30 | 2017-03-31 | 2016-12-31 | 2016-09-30 | 2016-06-30 | 2016-03-31 | 2015-12-31 | 2015-09-30 | 2015-06-30 | 2015-03-31 | 2014-12-31 | 2014-09-30 | 2014-06-30 | 2014-03-31 | 2013-12-31 | 2013-09-30 | 2013-06-30 | 2013-03-31 | 2012-12-31 | 2012-09-30 | 2012-06-30 | 2012-03-31 | 2011-12-31 | 2011-09-30 | 2011-06-30 | 2011-03-31 | 2010-12-31 | 2010-09-30 | 2010-06-30 | ||
|---|---|---|---|---|---|---|---|---|---|---|---|---|---|---|---|---|---|---|---|---|---|---|---|---|---|---|---|---|---|---|---|---|---|---|---|---|---|---|---|---|---|---|---|---|---|---|---|---|---|---|---|---|---|---|---|---|
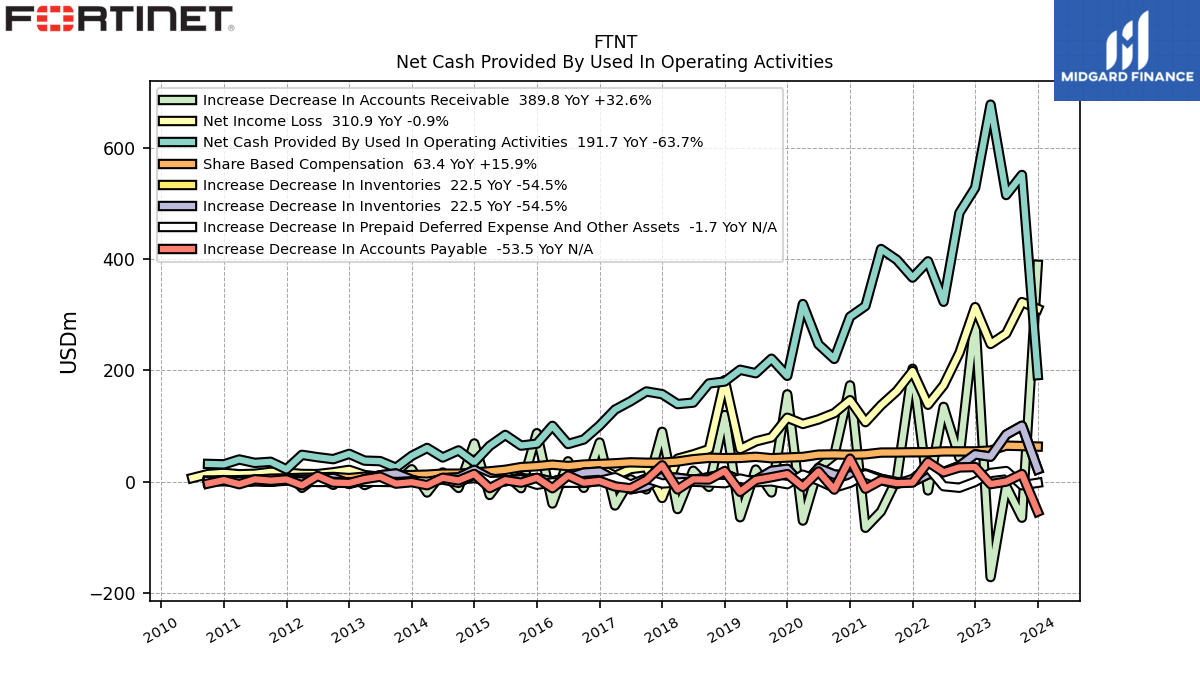
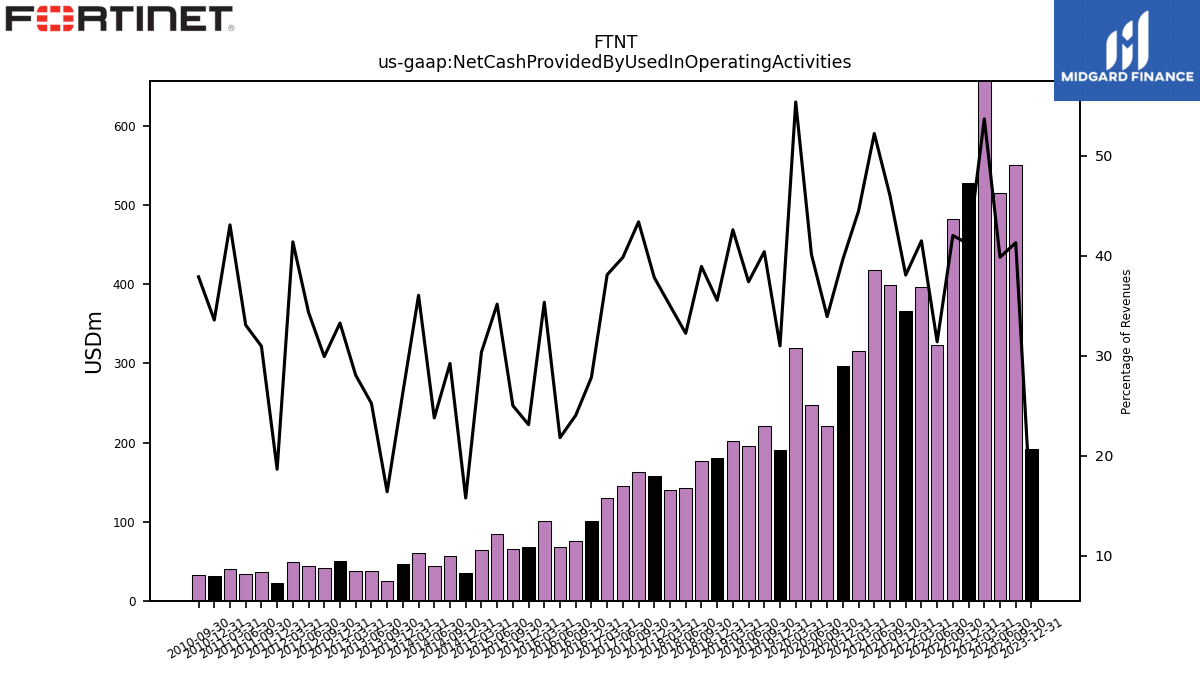
| Net Cash Provided By Used In Operating Activities | 191.70 | 551.20 | 515.10 | 677.50 | 528.10 | 483.00 | 323.40 | 396.10 | 366.80 | 398.80 | 418.20 | 315.90 | 296.50 | 220.80 | 247.00 | 319.40 | 190.40 | 221.20 | 195.10 | 201.30 | 180.20 | 176.70 | 142.30 | 139.70 | 157.54 | 162.34 | 144.77 | 129.75 | 101.04 | 76.14 | 67.94 | 100.59 | 68.56 | 65.06 | 84.31 | 64.62 | 35.36 | 56.52 | 43.80 | 60.90 | 46.67 | 25.38 | 37.22 | 38.11 | 50.29 | 40.77 | 44.28 | 48.52 | 22.56 | 36.04 | 34.07 | 40.18 | 31.42 | 32.19 | NA | |
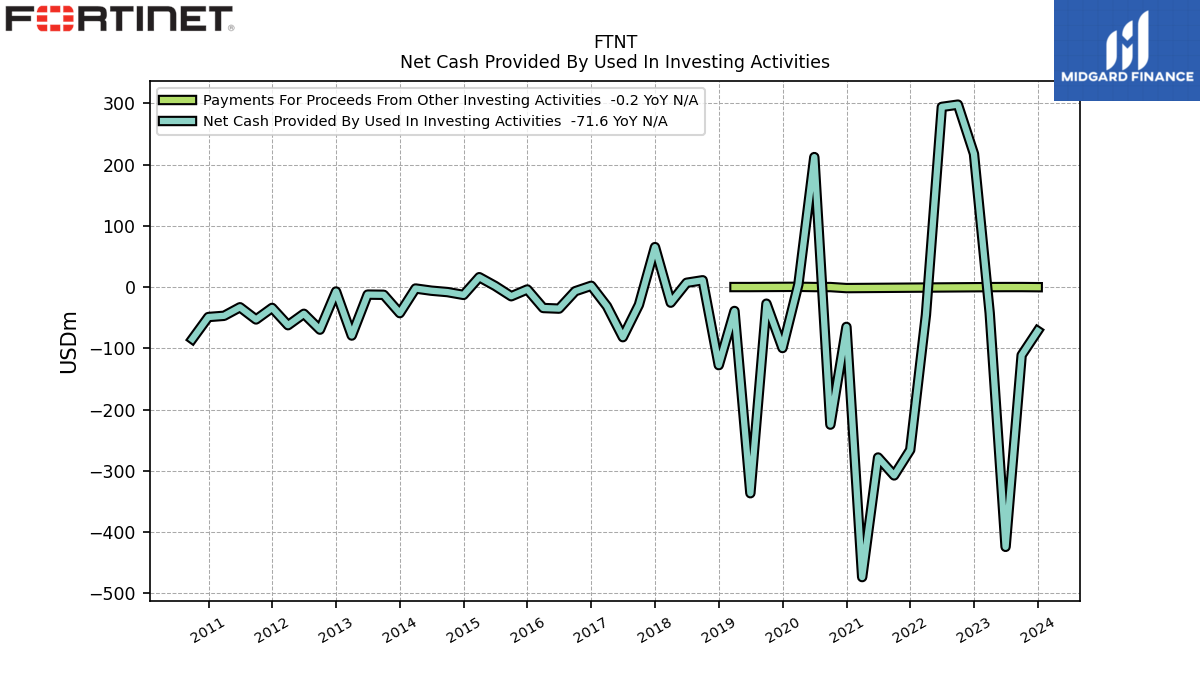
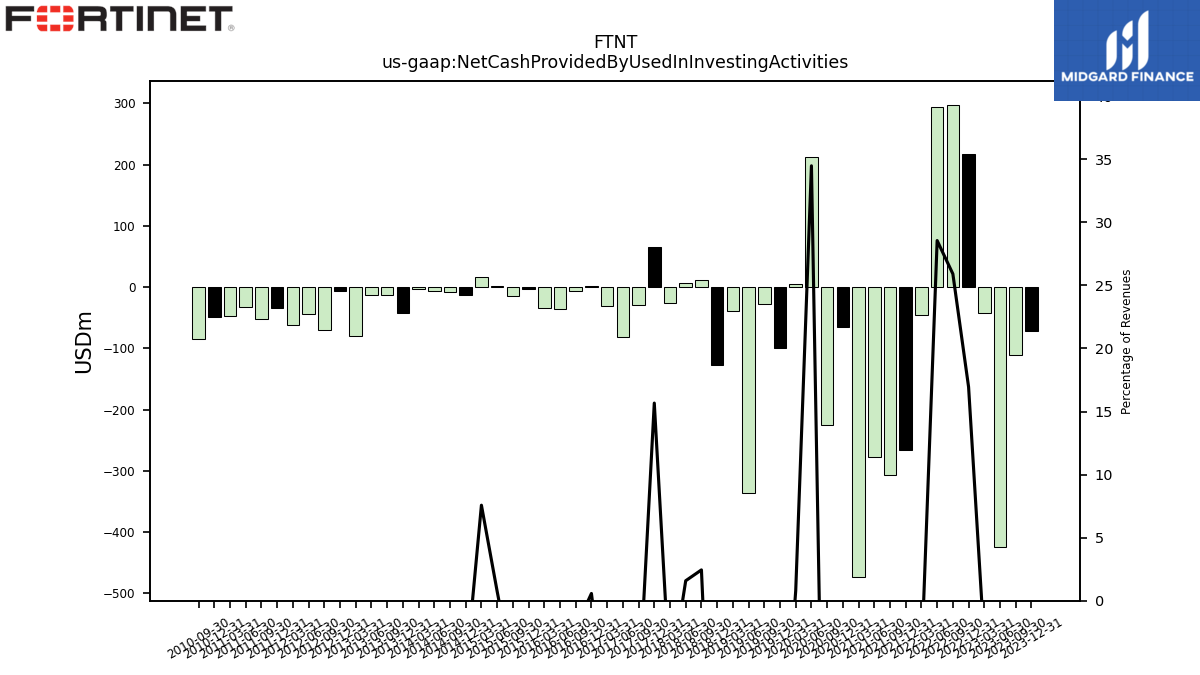
| Net Cash Provided By Used In Investing Activities | -71.60 | -111.20 | -424.10 | -42.40 | 217.40 | 297.80 | 294.10 | -45.40 | -265.90 | -307.50 | -278.20 | -473.50 | -65.00 | -224.60 | 212.20 | 4.60 | -99.60 | -27.10 | -336.60 | -39.00 | -127.50 | 11.10 | 7.00 | -25.50 | 65.28 | -28.91 | -81.84 | -31.32 | 2.09 | -6.80 | -35.21 | -34.20 | -3.88 | -15.02 | 1.81 | 16.12 | -12.84 | -8.21 | -5.93 | -2.36 | -42.59 | -12.63 | -12.34 | -79.18 | -7.23 | -69.55 | -43.63 | -62.30 | -33.99 | -52.95 | -32.95 | -46.93 | -48.91 | -84.94 | NA | |
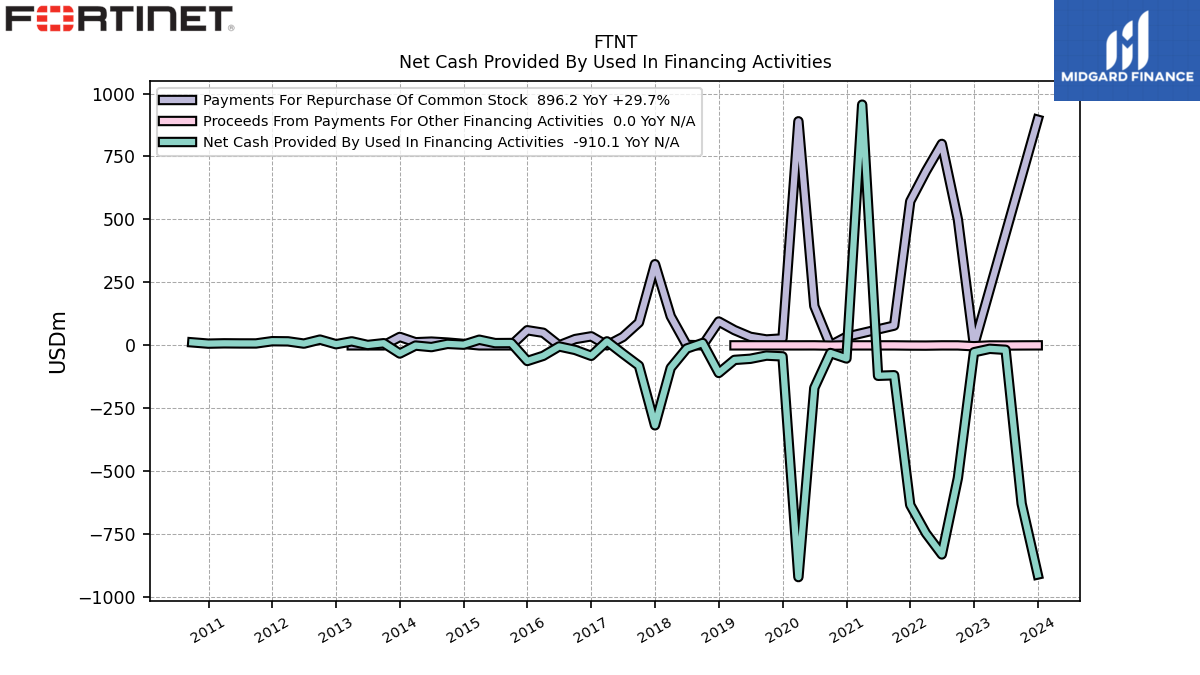
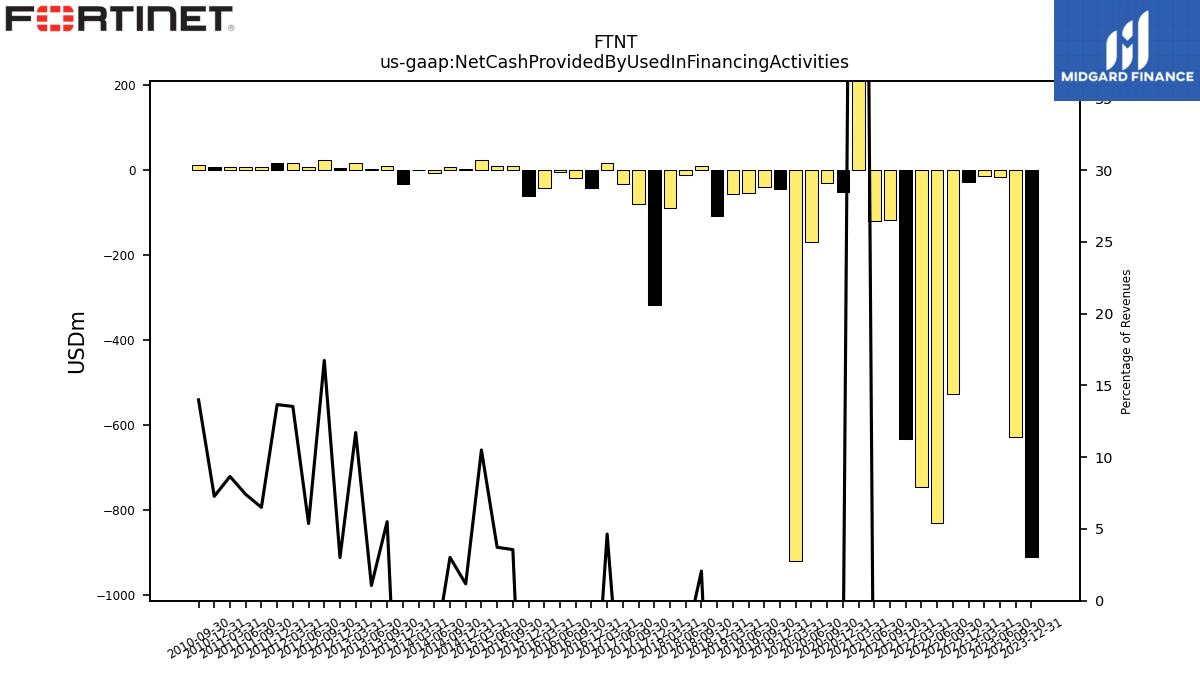
| Net Cash Provided By Used In Financing Activities | -910.10 | -628.90 | -17.70 | -13.70 | -27.40 | -526.60 | -830.30 | -746.00 | -633.60 | -118.70 | -120.90 | 956.00 | -52.00 | -30.30 | -168.90 | -920.40 | -43.80 | -40.70 | -53.30 | -57.80 | -109.60 | 9.40 | -12.80 | -89.60 | -317.61 | -80.77 | -33.04 | 15.82 | -41.64 | -18.21 | -4.36 | -41.66 | -62.11 | 9.27 | 8.93 | 22.36 | 2.64 | 5.84 | -6.84 | -0.89 | -32.43 | 8.52 | 1.57 | 15.92 | 4.54 | 22.81 | 6.94 | 15.87 | 16.52 | 7.57 | 7.63 | 8.07 | 6.81 | 11.89 | NA |
| 2023-12-31 | 2023-09-30 | 2023-06-30 | 2023-03-31 | 2022-12-31 | 2022-09-30 | 2022-06-30 | 2022-03-31 | 2021-12-31 | 2021-09-30 | 2021-06-30 | 2021-03-31 | 2020-12-31 | 2020-09-30 | 2020-06-30 | 2020-03-31 | 2019-12-31 | 2019-09-30 | 2019-06-30 | 2019-03-31 | 2018-12-31 | 2018-09-30 | 2018-06-30 | 2018-03-31 | 2017-12-31 | 2017-09-30 | 2017-06-30 | 2017-03-31 | 2016-12-31 | 2016-09-30 | 2016-06-30 | 2016-03-31 | 2015-12-31 | 2015-09-30 | 2015-06-30 | 2015-03-31 | 2014-12-31 | 2014-09-30 | 2014-06-30 | 2014-03-31 | 2013-12-31 | 2013-09-30 | 2013-06-30 | 2013-03-31 | 2012-12-31 | 2012-09-30 | 2012-06-30 | 2012-03-31 | 2011-12-31 | 2011-09-30 | 2011-06-30 | 2011-03-31 | 2010-12-31 | 2010-09-30 | 2010-06-30 | ||
|---|---|---|---|---|---|---|---|---|---|---|---|---|---|---|---|---|---|---|---|---|---|---|---|---|---|---|---|---|---|---|---|---|---|---|---|---|---|---|---|---|---|---|---|---|---|---|---|---|---|---|---|---|---|---|---|---|
| Net Cash Provided By Used In Operating Activities | 191.70 | 551.20 | 515.10 | 677.50 | 528.10 | 483.00 | 323.40 | 396.10 | 366.80 | 398.80 | 418.20 | 315.90 | 296.50 | 220.80 | 247.00 | 319.40 | 190.40 | 221.20 | 195.10 | 201.30 | 180.20 | 176.70 | 142.30 | 139.70 | 157.54 | 162.34 | 144.77 | 129.75 | 101.04 | 76.14 | 67.94 | 100.59 | 68.56 | 65.06 | 84.31 | 64.62 | 35.36 | 56.52 | 43.80 | 60.90 | 46.67 | 25.38 | 37.22 | 38.11 | 50.29 | 40.77 | 44.28 | 48.52 | 22.56 | 36.04 | 34.07 | 40.18 | 31.42 | 32.19 | NA | |
| Net Income Loss | 310.90 | 322.90 | 266.30 | 247.70 | 313.80 | 231.60 | 173.50 | 138.40 | 199.00 | 163.10 | 137.50 | 107.20 | 146.70 | 123.40 | 112.10 | 104.00 | 115.20 | 79.80 | 72.70 | 58.80 | 182.60 | 58.70 | 49.30 | 41.60 | -28.96 | 26.61 | 23.03 | 10.72 | 25.17 | 6.29 | -1.39 | -3.43 | -2.53 | 8.17 | 0.79 | 1.56 | 6.81 | 4.06 | 6.08 | 8.39 | 12.02 | 11.03 | 8.98 | 12.25 | 21.51 | 17.21 | 13.95 | 14.17 | 16.49 | 17.92 | 14.49 | 13.59 | 16.14 | 14.02 | 6.87 | |
| Profit Loss | 310.90 | 322.90 | 266.30 | 247.70 | 313.80 | 231.10 | 173.40 | 138.30 | 198.80 | 163.20 | 137.50 | 107.20 | 146.70 | 123.40 | NA | NA | NA | NA | NA | NA | NA | NA | NA | NA | NA | NA | NA | NA | NA | NA | NA | NA | NA | NA | NA | NA | NA | NA | NA | NA | NA | NA | NA | NA | NA | NA | NA | NA | NA | NA | NA | NA | NA | NA | NA | |
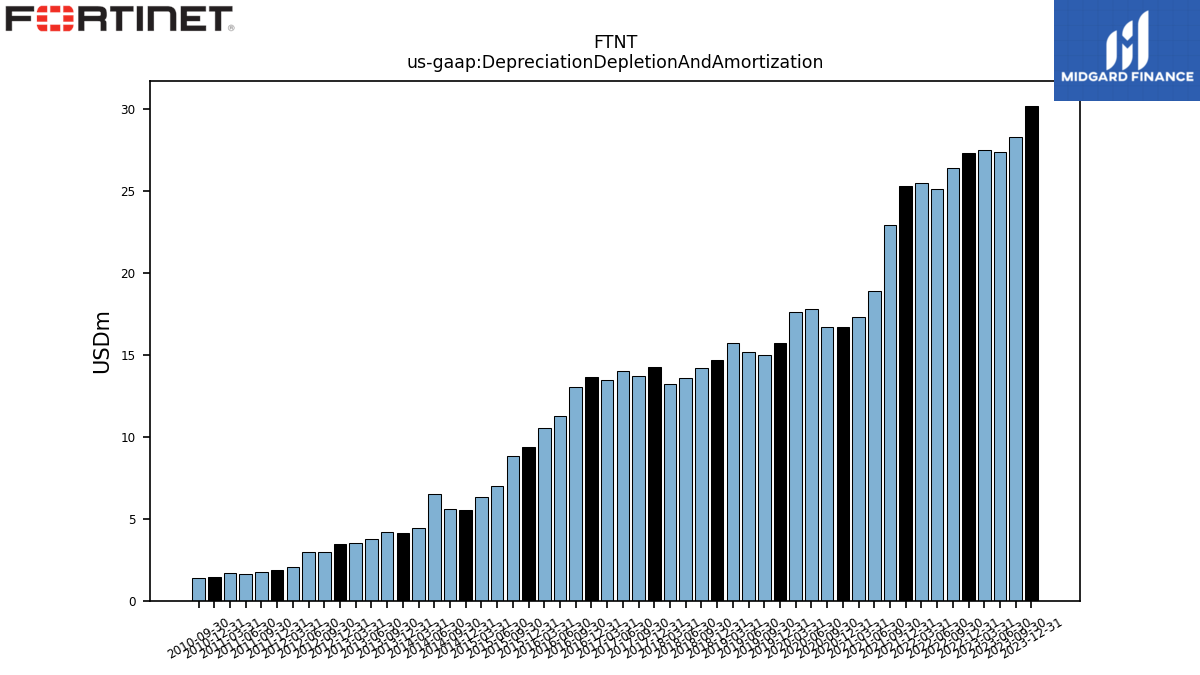
| Depreciation Depletion And Amortization | 30.20 | 28.30 | 27.40 | 27.50 | 27.30 | 26.40 | 25.10 | 25.50 | 25.30 | 22.90 | 18.90 | 17.30 | 16.70 | 16.70 | 17.80 | 17.60 | 15.70 | 15.00 | 15.20 | 15.70 | 14.70 | 14.20 | 13.60 | 13.20 | 14.27 | 13.72 | 14.00 | 13.49 | 13.62 | 13.05 | 11.29 | 10.55 | 9.38 | 8.82 | 7.03 | 6.35 | 5.51 | 5.61 | 6.49 | 4.42 | 4.11 | 4.19 | 3.79 | 3.54 | 3.49 | 3.00 | 3.00 | 2.08 | 1.88 | 1.78 | 1.66 | 1.68 | 1.46 | 1.39 | NA | |
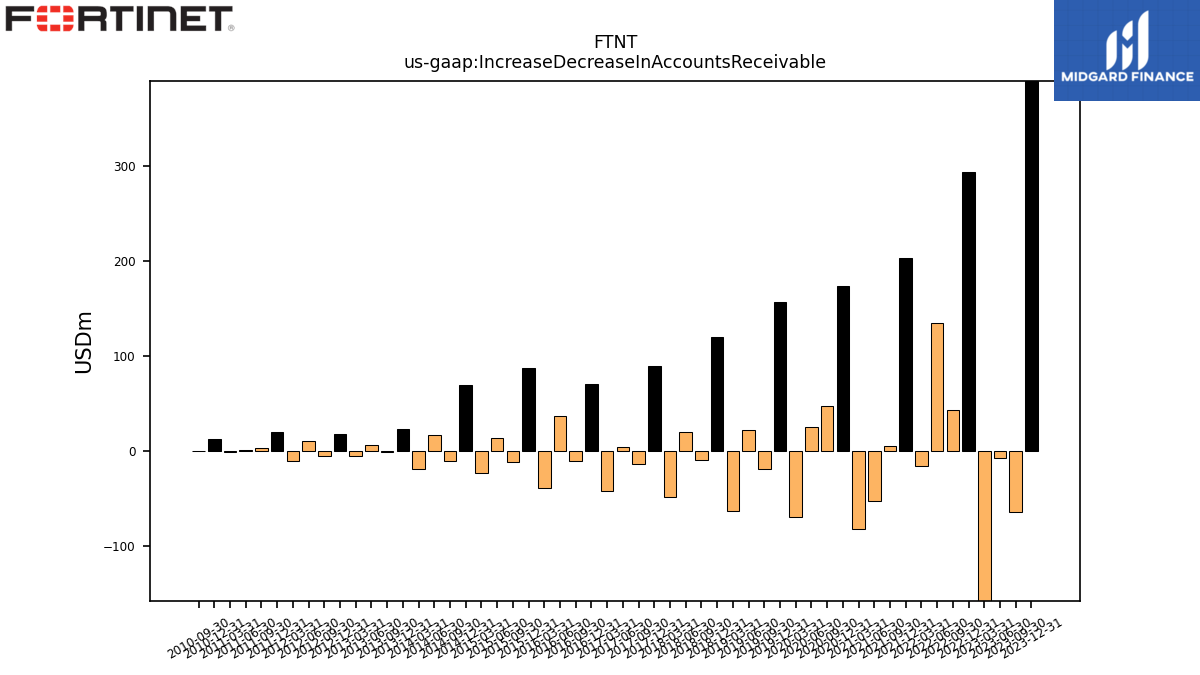
| Increase Decrease In Accounts Receivable | 389.80 | -64.40 | -7.90 | -171.10 | 294.00 | 43.40 | 134.70 | -15.40 | 203.10 | 5.00 | -53.10 | -82.50 | 173.30 | 47.60 | 25.10 | -69.60 | 157.20 | -19.00 | 22.10 | -63.60 | 120.00 | -9.10 | 20.00 | -48.90 | 89.90 | -13.54 | 4.54 | -42.44 | 70.66 | -10.77 | 36.90 | -38.92 | 87.39 | -11.40 | 14.10 | -23.62 | 69.03 | -10.91 | 16.89 | -19.12 | 22.67 | -1.39 | 6.55 | -5.75 | 17.80 | -5.51 | 10.59 | -10.76 | 19.69 | 3.62 | 0.95 | -1.01 | 12.77 | -0.24 | NA | |
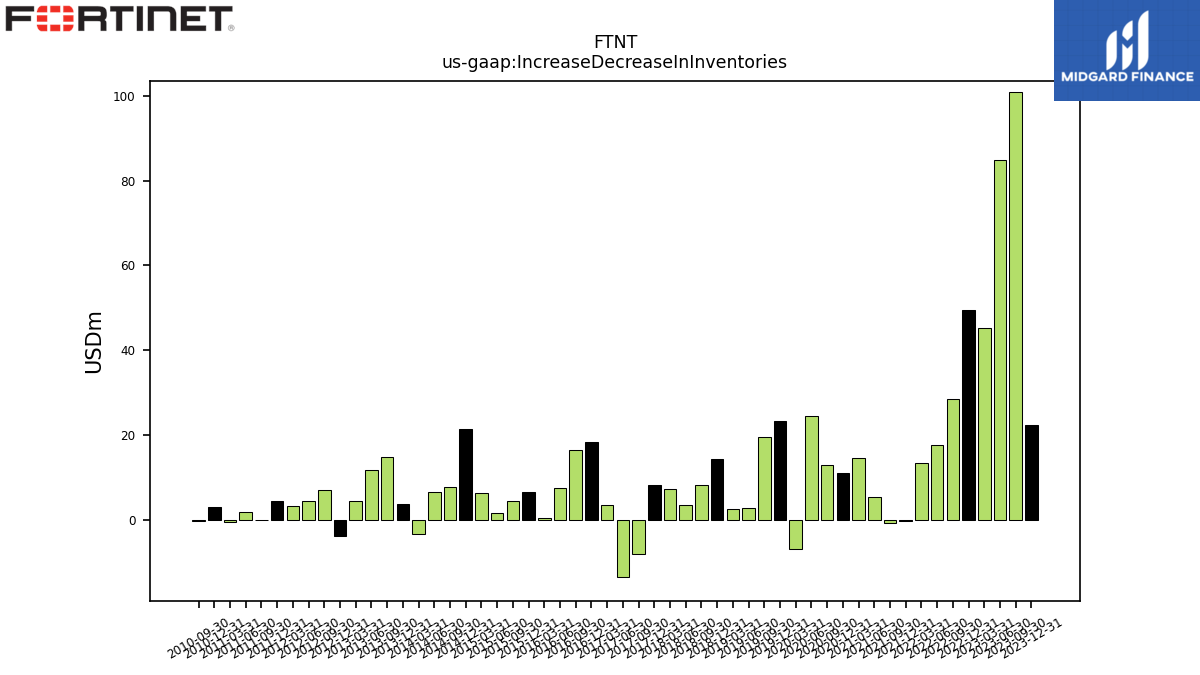
| Increase Decrease In Inventories | 22.50 | 100.80 | 84.90 | 45.30 | 49.40 | 28.50 | 17.70 | 13.50 | -0.10 | -0.60 | 5.40 | 14.70 | 11.20 | 13.10 | 24.60 | -6.70 | 23.30 | 19.70 | 2.90 | 2.60 | 14.40 | 8.20 | 3.50 | 7.30 | 8.26 | -7.93 | -13.30 | 3.54 | 18.47 | 16.54 | 7.49 | 0.53 | 6.66 | 4.51 | 1.62 | 6.30 | 21.36 | 7.79 | 6.63 | -3.33 | 3.75 | 14.97 | 11.86 | 4.52 | -3.67 | 7.03 | 4.54 | 3.41 | 4.56 | 0.02 | 2.00 | -0.55 | 3.13 | -0.19 | NA | |
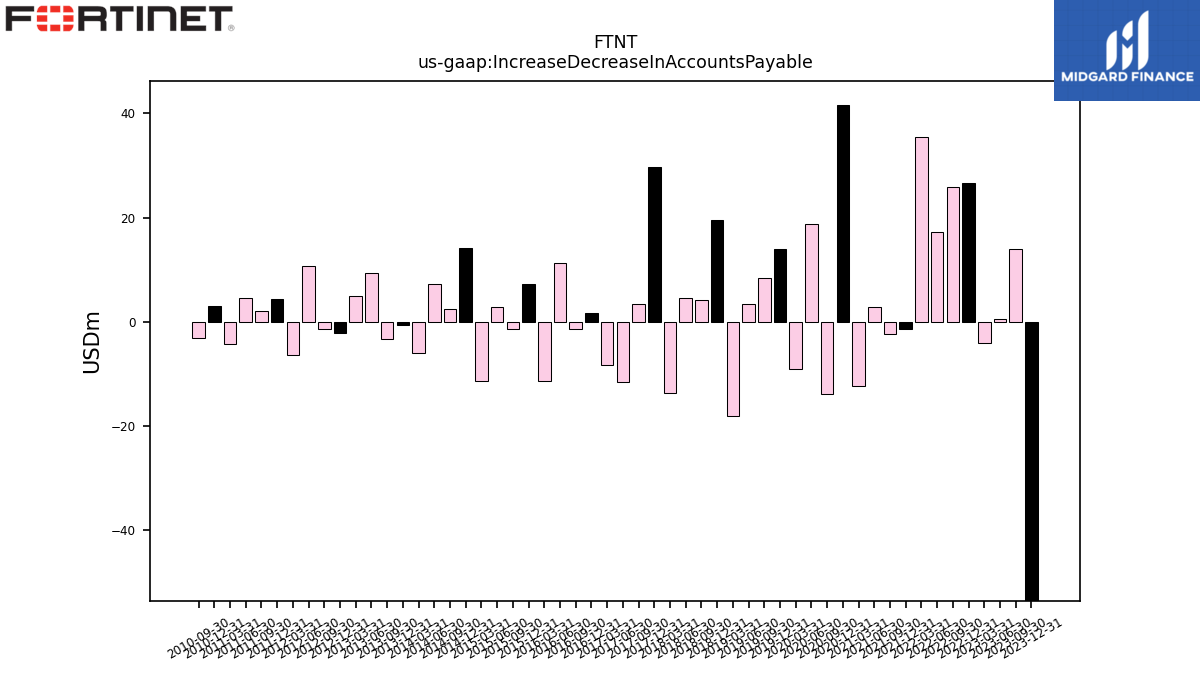
| Increase Decrease In Accounts Payable | -53.50 | 14.00 | 0.50 | -4.10 | 26.60 | 25.90 | 17.20 | 35.50 | -1.30 | -2.30 | 2.90 | -12.40 | 41.60 | -13.90 | 18.70 | -9.00 | 13.90 | 8.40 | 3.40 | -18.00 | 19.50 | 4.20 | 4.50 | -13.60 | 29.63 | 3.34 | -11.59 | -8.29 | 1.62 | -1.45 | 11.30 | -11.43 | 7.33 | -1.46 | 2.92 | -11.30 | 14.23 | 2.55 | 7.29 | -6.04 | -0.57 | -3.20 | 9.30 | 4.96 | -2.09 | -1.29 | 10.66 | -6.32 | 4.29 | 2.16 | 4.58 | -4.22 | 3.13 | -3.04 | NA | |
| Share Based Compensation | 63.40 | 64.30 | 65.00 | 56.30 | 54.70 | 54.70 | 54.70 | 53.20 | 53.10 | 52.70 | 52.60 | 49.50 | 48.70 | 49.30 | 48.90 | 44.80 | 43.70 | 42.40 | 45.00 | 43.00 | 42.60 | 43.20 | 40.60 | 36.50 | 34.45 | 34.31 | 35.09 | 33.33 | 32.08 | 31.09 | 28.37 | 30.88 | 28.09 | 26.48 | 21.64 | 18.88 | 16.68 | 14.67 | 14.72 | 12.93 | 12.12 | 11.78 | 10.71 | 9.30 | 6.76 | 8.83 | 7.85 | 7.25 | 6.34 | 5.73 | 3.87 | 3.07 | 2.47 | 2.43 | NA |
| 2023-12-31 | 2023-09-30 | 2023-06-30 | 2023-03-31 | 2022-12-31 | 2022-09-30 | 2022-06-30 | 2022-03-31 | 2021-12-31 | 2021-09-30 | 2021-06-30 | 2021-03-31 | 2020-12-31 | 2020-09-30 | 2020-06-30 | 2020-03-31 | 2019-12-31 | 2019-09-30 | 2019-06-30 | 2019-03-31 | 2018-12-31 | 2018-09-30 | 2018-06-30 | 2018-03-31 | 2017-12-31 | 2017-09-30 | 2017-06-30 | 2017-03-31 | 2016-12-31 | 2016-09-30 | 2016-06-30 | 2016-03-31 | 2015-12-31 | 2015-09-30 | 2015-06-30 | 2015-03-31 | 2014-12-31 | 2014-09-30 | 2014-06-30 | 2014-03-31 | 2013-12-31 | 2013-09-30 | 2013-06-30 | 2013-03-31 | 2012-12-31 | 2012-09-30 | 2012-06-30 | 2012-03-31 | 2011-12-31 | 2011-09-30 | 2011-06-30 | 2011-03-31 | 2010-12-31 | 2010-09-30 | 2010-06-30 | ||
|---|---|---|---|---|---|---|---|---|---|---|---|---|---|---|---|---|---|---|---|---|---|---|---|---|---|---|---|---|---|---|---|---|---|---|---|---|---|---|---|---|---|---|---|---|---|---|---|---|---|---|---|---|---|---|---|---|
| Net Cash Provided By Used In Investing Activities | -71.60 | -111.20 | -424.10 | -42.40 | 217.40 | 297.80 | 294.10 | -45.40 | -265.90 | -307.50 | -278.20 | -473.50 | -65.00 | -224.60 | 212.20 | 4.60 | -99.60 | -27.10 | -336.60 | -39.00 | -127.50 | 11.10 | 7.00 | -25.50 | 65.28 | -28.91 | -81.84 | -31.32 | 2.09 | -6.80 | -35.21 | -34.20 | -3.88 | -15.02 | 1.81 | 16.12 | -12.84 | -8.21 | -5.93 | -2.36 | -42.59 | -12.63 | -12.34 | -79.18 | -7.23 | -69.55 | -43.63 | -62.30 | -33.99 | -52.95 | -32.95 | -46.93 | -48.91 | -84.94 | NA |
| 2023-12-31 | 2023-09-30 | 2023-06-30 | 2023-03-31 | 2022-12-31 | 2022-09-30 | 2022-06-30 | 2022-03-31 | 2021-12-31 | 2021-09-30 | 2021-06-30 | 2021-03-31 | 2020-12-31 | 2020-09-30 | 2020-06-30 | 2020-03-31 | 2019-12-31 | 2019-09-30 | 2019-06-30 | 2019-03-31 | 2018-12-31 | 2018-09-30 | 2018-06-30 | 2018-03-31 | 2017-12-31 | 2017-09-30 | 2017-06-30 | 2017-03-31 | 2016-12-31 | 2016-09-30 | 2016-06-30 | 2016-03-31 | 2015-12-31 | 2015-09-30 | 2015-06-30 | 2015-03-31 | 2014-12-31 | 2014-09-30 | 2014-06-30 | 2014-03-31 | 2013-12-31 | 2013-09-30 | 2013-06-30 | 2013-03-31 | 2012-12-31 | 2012-09-30 | 2012-06-30 | 2012-03-31 | 2011-12-31 | 2011-09-30 | 2011-06-30 | 2011-03-31 | 2010-12-31 | 2010-09-30 | 2010-06-30 | ||
|---|---|---|---|---|---|---|---|---|---|---|---|---|---|---|---|---|---|---|---|---|---|---|---|---|---|---|---|---|---|---|---|---|---|---|---|---|---|---|---|---|---|---|---|---|---|---|---|---|---|---|---|---|---|---|---|---|
| Net Cash Provided By Used In Financing Activities | -910.10 | -628.90 | -17.70 | -13.70 | -27.40 | -526.60 | -830.30 | -746.00 | -633.60 | -118.70 | -120.90 | 956.00 | -52.00 | -30.30 | -168.90 | -920.40 | -43.80 | -40.70 | -53.30 | -57.80 | -109.60 | 9.40 | -12.80 | -89.60 | -317.61 | -80.77 | -33.04 | 15.82 | -41.64 | -18.21 | -4.36 | -41.66 | -62.11 | 9.27 | 8.93 | 22.36 | 2.64 | 5.84 | -6.84 | -0.89 | -32.43 | 8.52 | 1.57 | 15.92 | 4.54 | 22.81 | 6.94 | 15.87 | 16.52 | 7.57 | 7.63 | 8.07 | 6.81 | 11.89 | NA | |
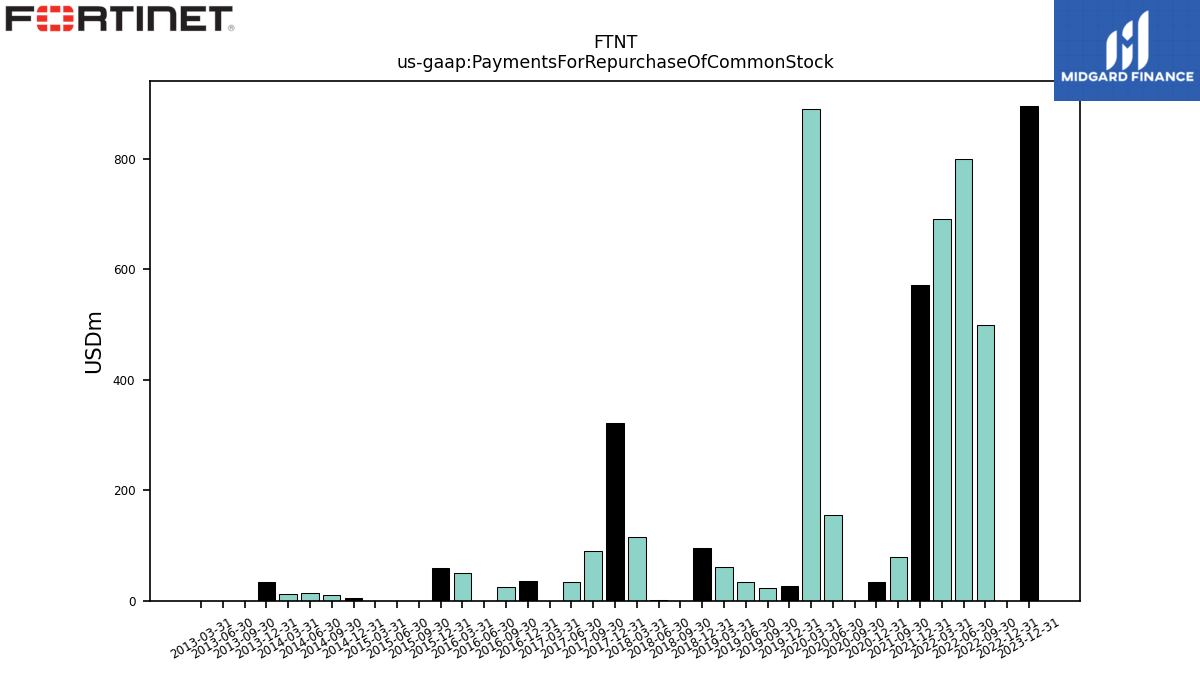
| Payments For Repurchase Of Common Stock | 896.20 | NA | NA | NA | 0.00 | 500.00 | 800.00 | 691.20 | 571.80 | 78.40 | NA | NA | 34.10 | 0.00 | 156.10 | 889.90 | 27.50 | 23.40 | 33.80 | 60.40 | 94.70 | 0.00 | 1.60 | 115.50 | 322.38 | 90.80 | 33.15 | 0.00 | 35.83 | 25.00 | 0.00 | 50.00 | 60.00 | 0.00 | 0.00 | 0.00 | 5.74 | 11.07 | 14.86 | 12.30 | 33.53 | 0.00 | 0.00 | 0.00 | NA | NA | NA | NA | NA | NA | NA | NA | NA | NA | NA |
| 2023-12-31 | 2023-09-30 | 2023-06-30 | 2023-03-31 | 2022-12-31 | 2022-09-30 | 2022-06-30 | 2022-03-31 | 2021-12-31 | 2021-09-30 | 2021-06-30 | 2021-03-31 | 2020-12-31 | 2020-09-30 | 2020-06-30 | 2020-03-31 | 2019-12-31 | 2019-09-30 | 2019-06-30 | 2019-03-31 | 2018-12-31 | 2018-09-30 | 2018-06-30 | 2018-03-31 | 2017-12-31 | 2017-09-30 | 2017-06-30 | 2017-03-31 | 2016-12-31 | 2016-09-30 | 2016-06-30 | 2016-03-31 | 2015-12-31 | 2015-09-30 | 2015-06-30 | 2015-03-31 | 2014-12-31 | 2014-09-30 | 2014-06-30 | 2014-03-31 | 2013-12-31 | 2013-09-30 | 2013-06-30 | 2013-03-31 | 2012-12-31 | 2012-09-30 | 2012-06-30 | 2012-03-31 | 2011-12-31 | 2011-09-30 | 2011-06-30 | 2011-03-31 | 2010-12-31 | 2010-09-30 | 2010-06-30 | ||
|---|---|---|---|---|---|---|---|---|---|---|---|---|---|---|---|---|---|---|---|---|---|---|---|---|---|---|---|---|---|---|---|---|---|---|---|---|---|---|---|---|---|---|---|---|---|---|---|---|---|---|---|---|---|---|---|---|
| Revenues | 1415.10 | 1334.60 | 1292.80 | 1262.30 | 1283.00 | 1149.50 | 1030.10 | 954.80 | 963.60 | 867.20 | 801.10 | 710.30 | 748.00 | 651.10 | 615.50 | 576.90 | 614.40 | 547.50 | 521.70 | 472.60 | 507.00 | 453.90 | 441.30 | 399.00 | 416.64 | 374.22 | 363.47 | 340.58 | 362.83 | 316.65 | 311.39 | 284.58 | 296.53 | 260.07 | 239.78 | 212.89 | 223.97 | 193.35 | 184.10 | 168.95 | 177.35 | 154.70 | 147.43 | 135.82 | 151.16 | 136.27 | 128.96 | 117.25 | 120.86 | 116.43 | 103.02 | 93.27 | 93.60 | 84.97 | 76.33 | |
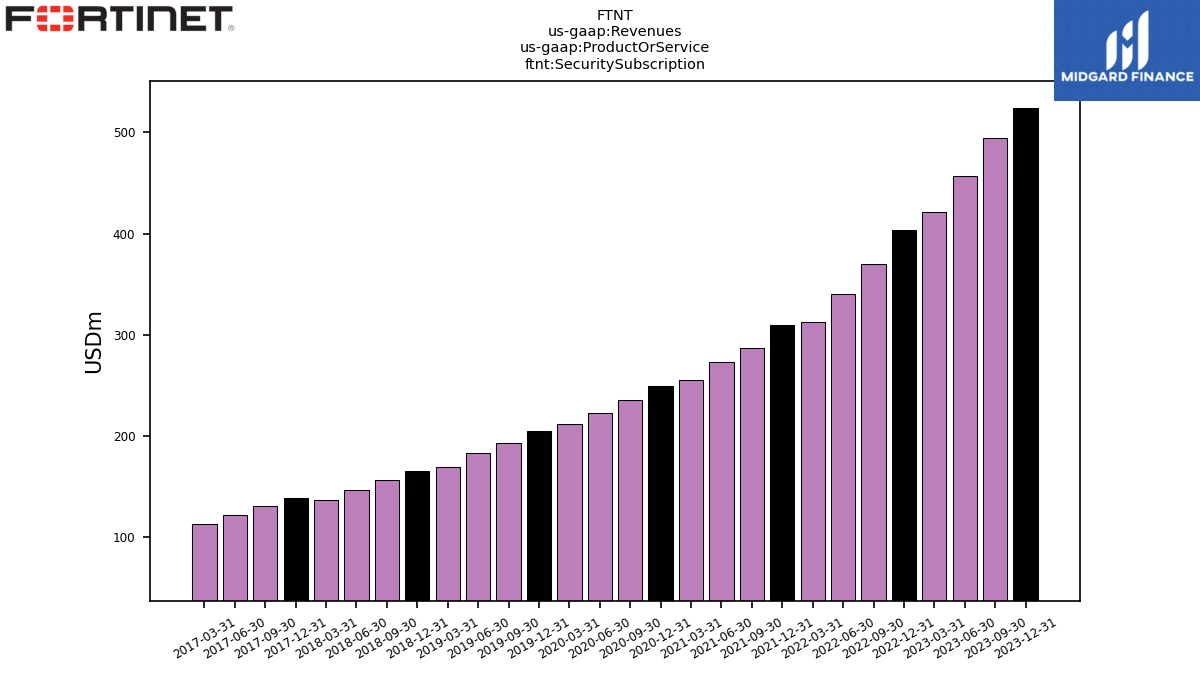
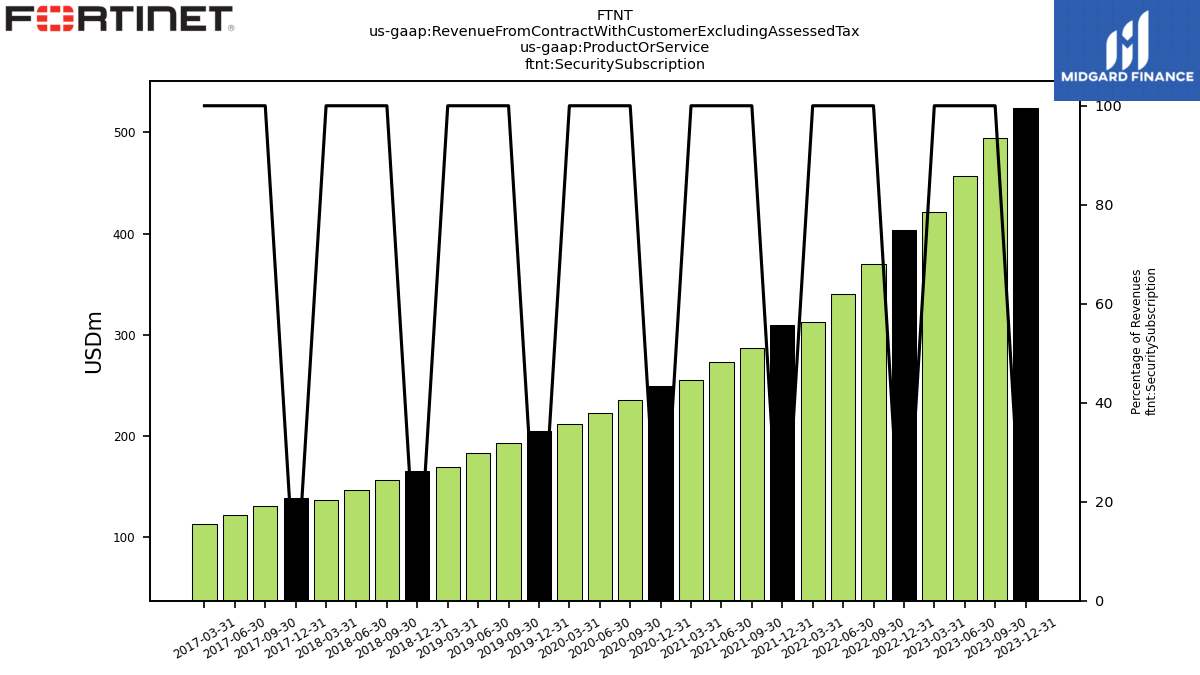
| Security Subscription | 524.50 | 494.60 | 457.30 | 421.70 | 403.90 | 369.80 | 340.40 | 312.90 | 309.40 | 287.40 | 272.90 | 255.30 | 249.30 | 235.40 | 222.60 | 211.40 | 205.40 | 192.80 | 183.10 | 169.60 | 165.40 | 157.00 | 147.10 | 136.60 | 138.50 | 130.80 | 122.00 | 113.50 | NA | NA | NA | NA | NA | NA | NA | NA | NA | NA | NA | NA | NA | NA | NA | NA | NA | NA | NA | NA | NA | NA | NA | NA | NA | NA | NA | |
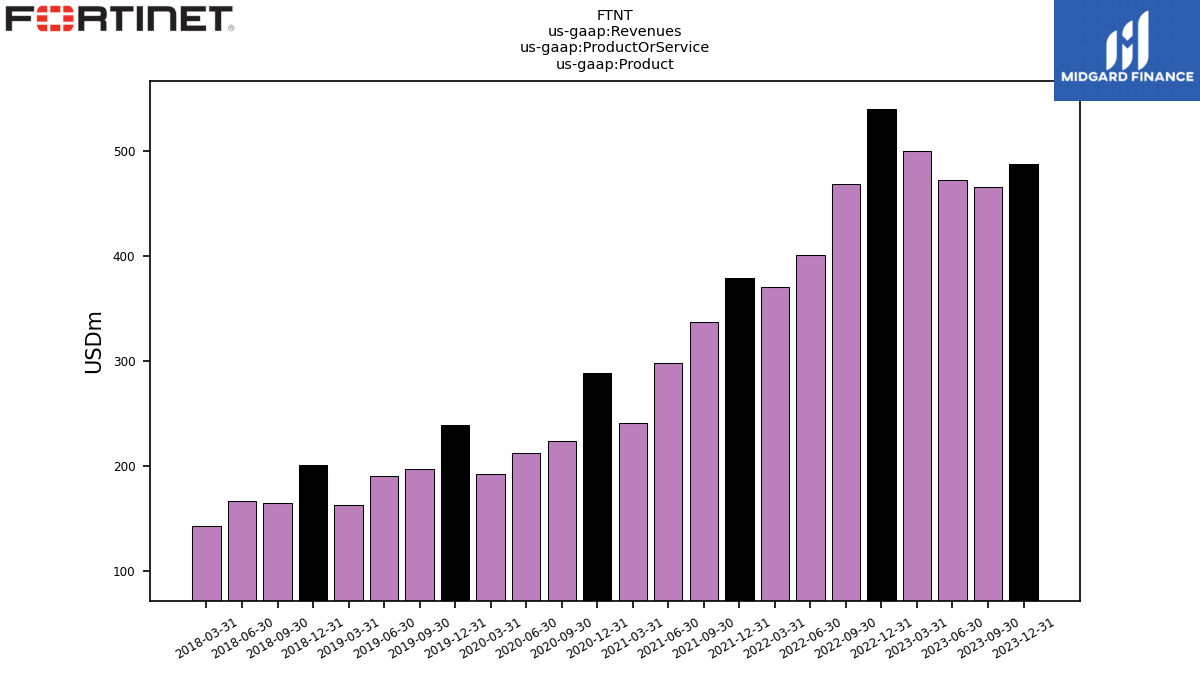
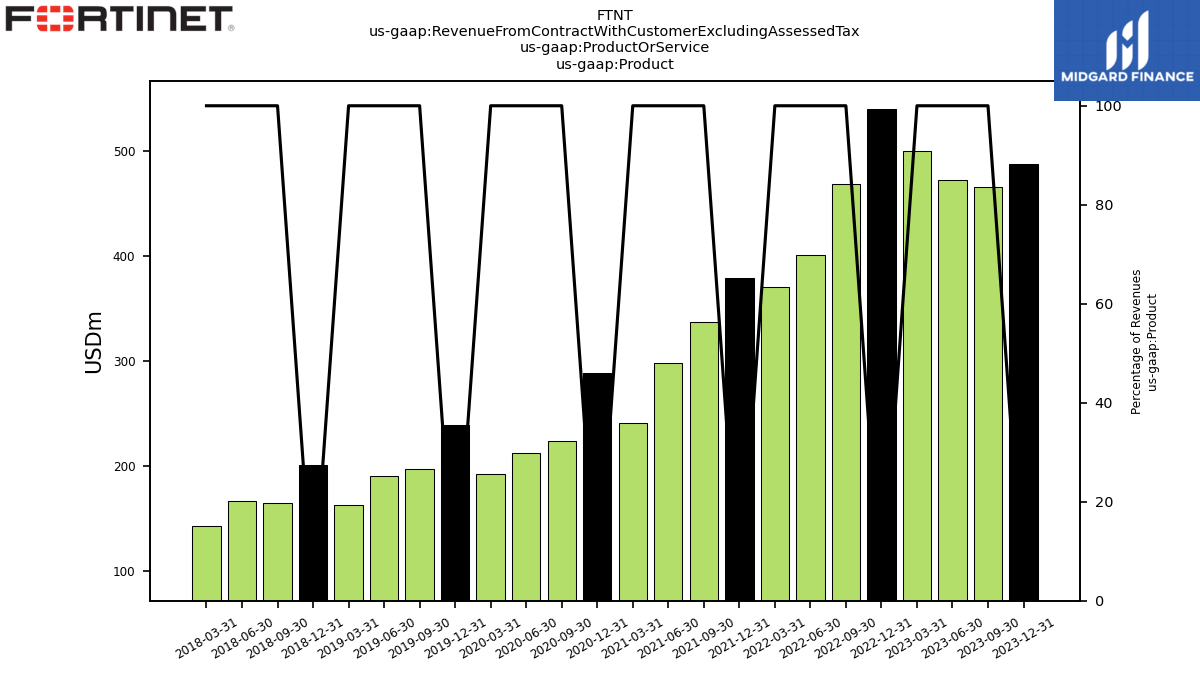
| Product | 488.10 | 465.90 | 472.60 | 500.70 | 540.10 | 468.70 | 400.70 | 371.00 | 378.90 | 337.10 | 298.30 | 240.70 | 288.40 | 223.80 | 211.90 | 192.30 | 238.80 | 197.10 | 189.90 | 162.70 | 200.80 | 164.50 | 166.30 | 142.80 | NA | NA | NA | NA | NA | NA | NA | NA | NA | NA | NA | NA | NA | NA | NA | NA | NA | NA | NA | NA | NA | NA | NA | NA | NA | NA | NA | NA | NA | NA | NA | |
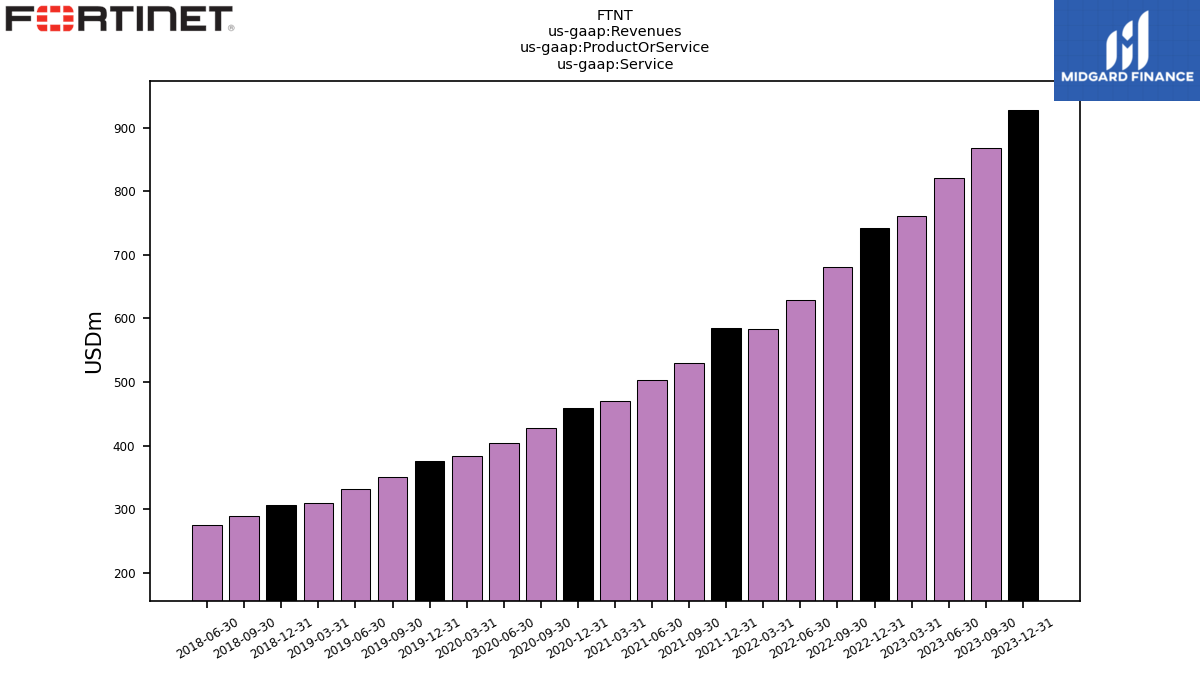
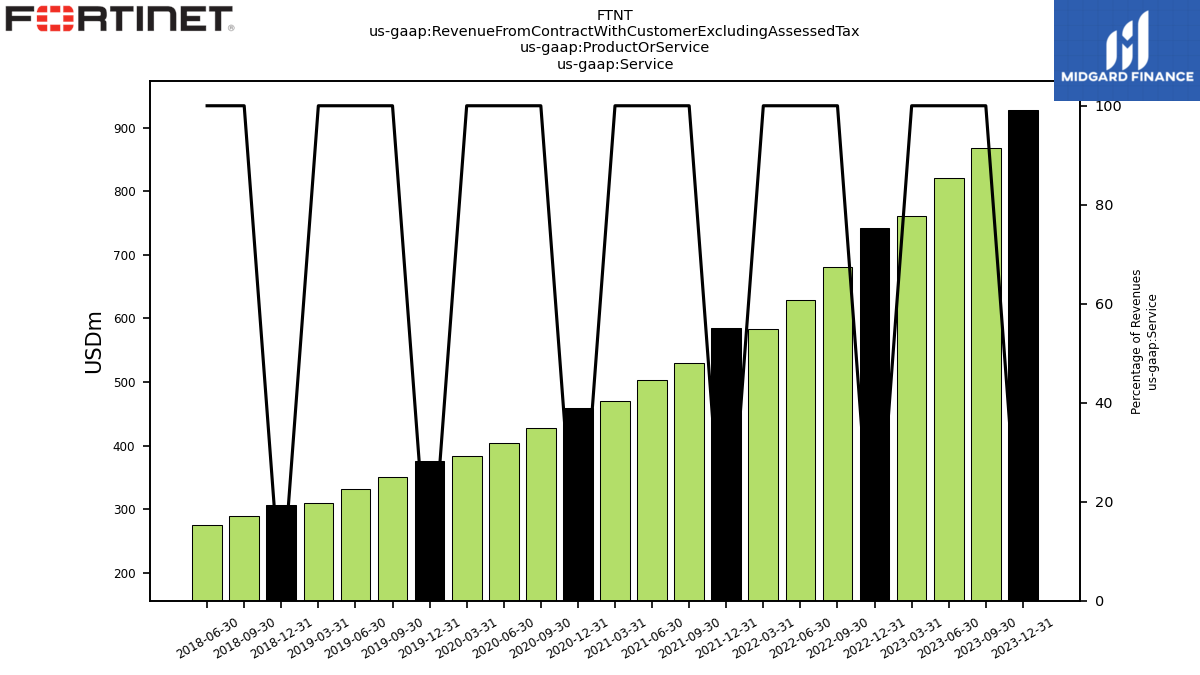
| Service | 927.00 | 868.70 | 820.20 | 761.60 | 742.90 | 680.80 | 629.40 | 583.80 | 584.70 | 530.10 | 502.80 | 469.60 | 459.60 | 427.30 | 403.60 | 384.60 | 375.60 | 350.40 | 331.80 | 309.90 | 306.20 | 289.40 | 275.00 | NA | NA | NA | NA | NA | NA | NA | NA | NA | NA | NA | NA | NA | NA | NA | NA | NA | NA | NA | NA | NA | NA | NA | NA | NA | NA | NA | NA | NA | NA | NA | NA | |
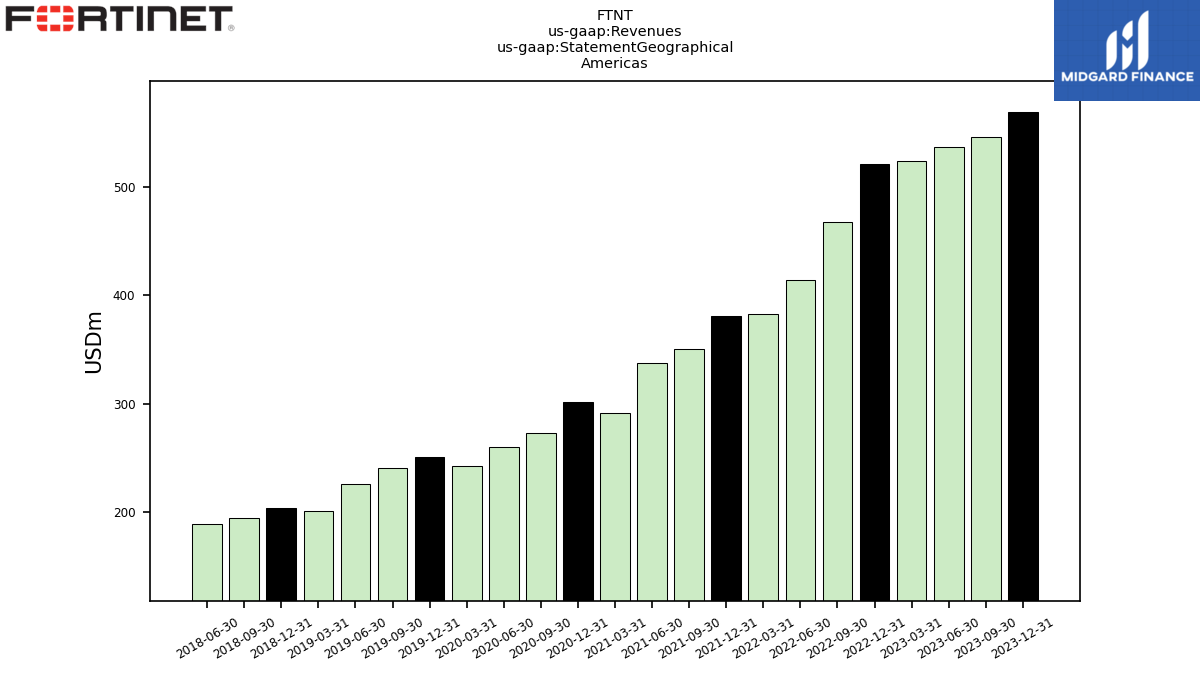
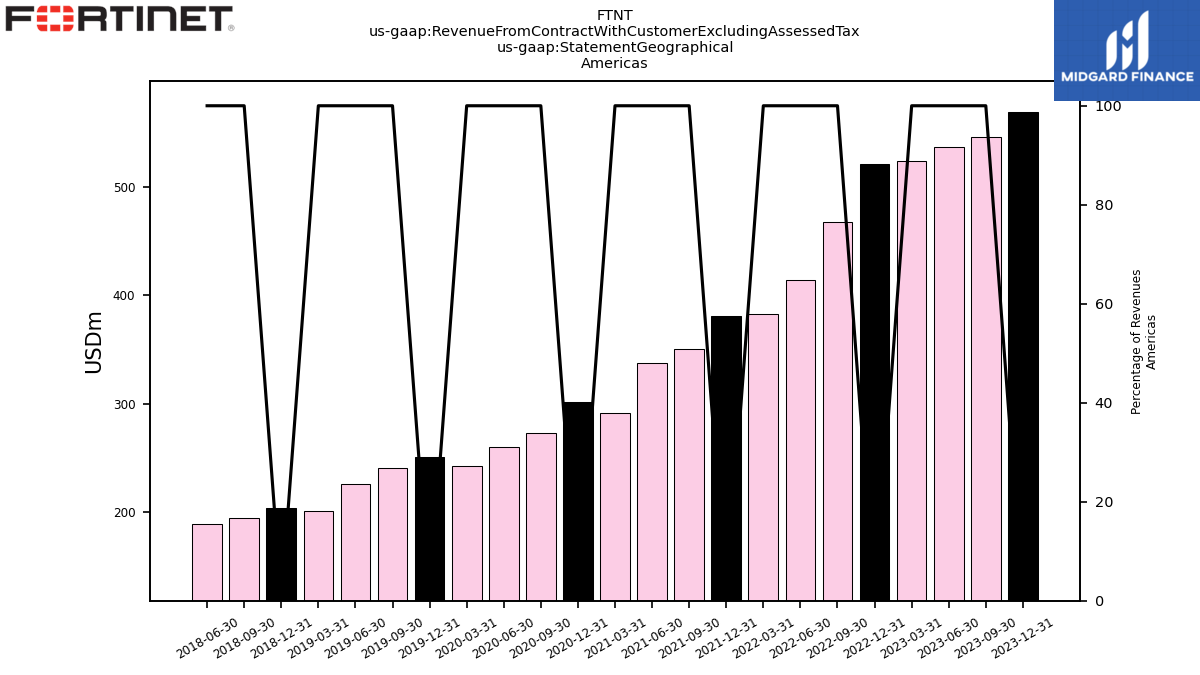
| 569.10 | 545.60 | 537.00 | 523.50 | 521.20 | 467.60 | 413.60 | 382.60 | 380.80 | 350.10 | 337.00 | 290.90 | 301.20 | 272.40 | 260.20 | 242.20 | 250.60 | 240.70 | 225.50 | 200.50 | 203.80 | 194.00 | 189.30 | NA | NA | NA | NA | NA | NA | NA | NA | NA | NA | NA | NA | NA | NA | NA | NA | NA | NA | NA | NA | NA | NA | NA | NA | NA | NA | NA | NA | NA | NA | NA | NA | ||
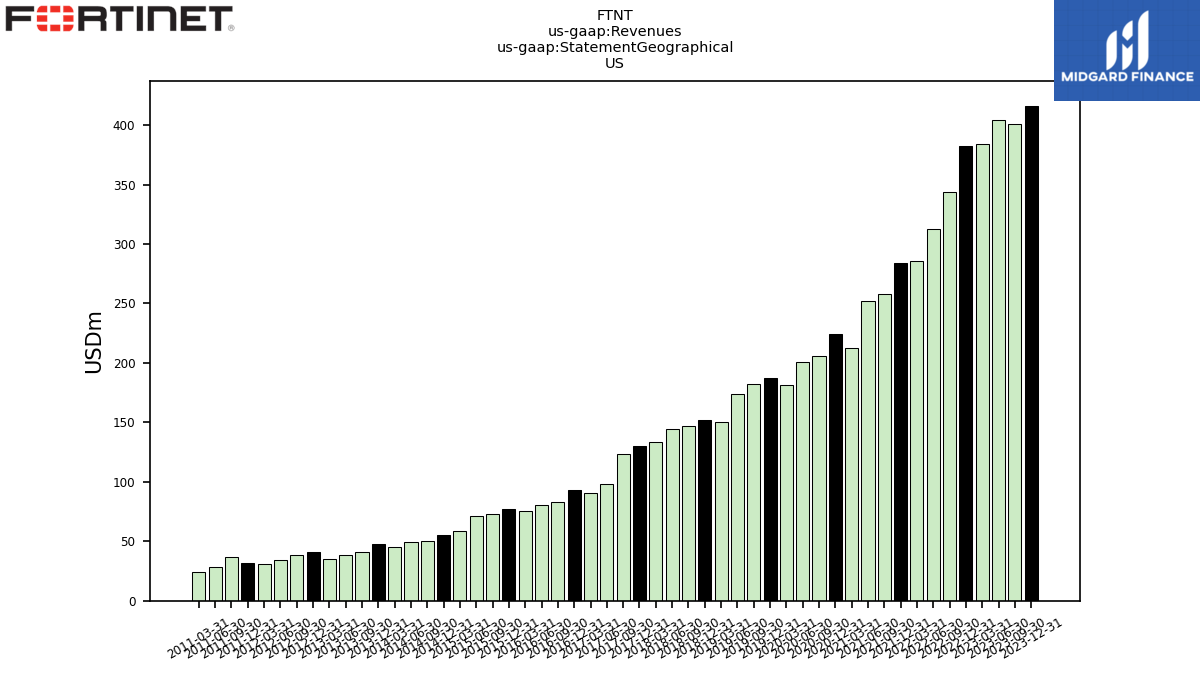
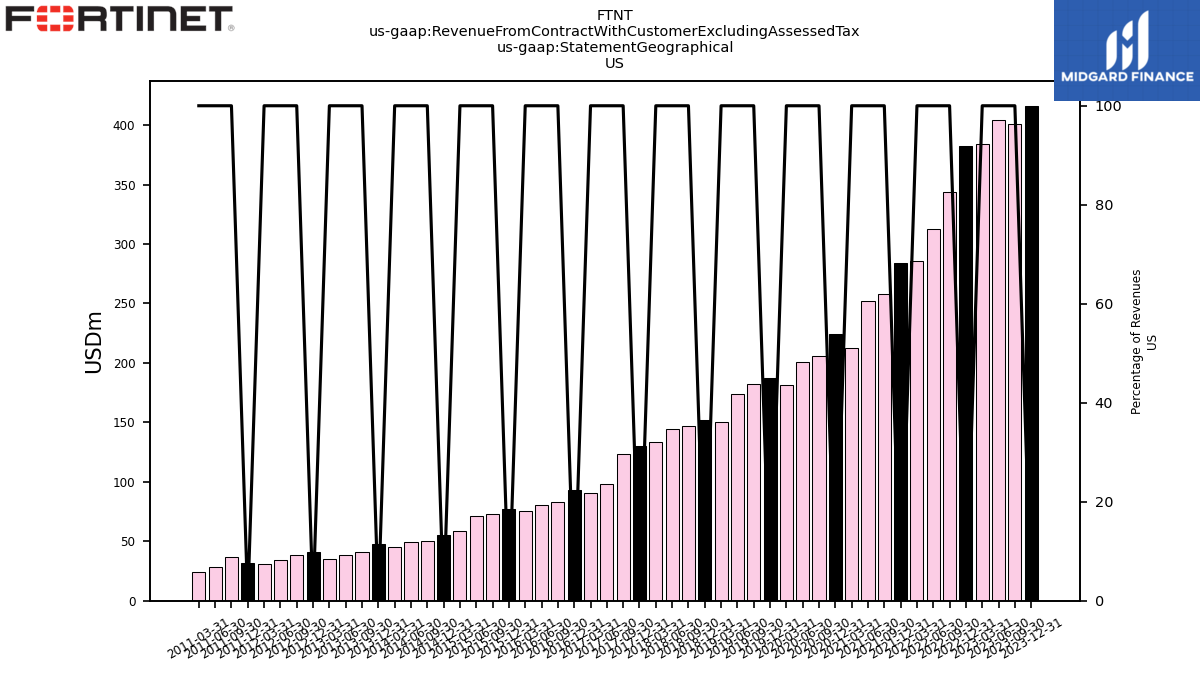
| US | 416.30 | 400.80 | 404.70 | 384.10 | 382.20 | 344.10 | 312.90 | 285.80 | 284.20 | 258.40 | 251.70 | 212.50 | 224.20 | 206.00 | 200.60 | 181.60 | 187.40 | 182.10 | 173.50 | 150.30 | 151.90 | 146.80 | 144.60 | 133.90 | 129.78 | 123.65 | 97.91 | 90.77 | 92.78 | 83.05 | 80.81 | 75.56 | 77.07 | 72.77 | 71.22 | 58.50 | 55.50 | 50.33 | 49.67 | 44.79 | 48.07 | 40.65 | 38.81 | 34.79 | 41.39 | 38.67 | 34.19 | 31.12 | 31.62 | 36.56 | 28.10 | 24.17 | NA | NA | NA | |
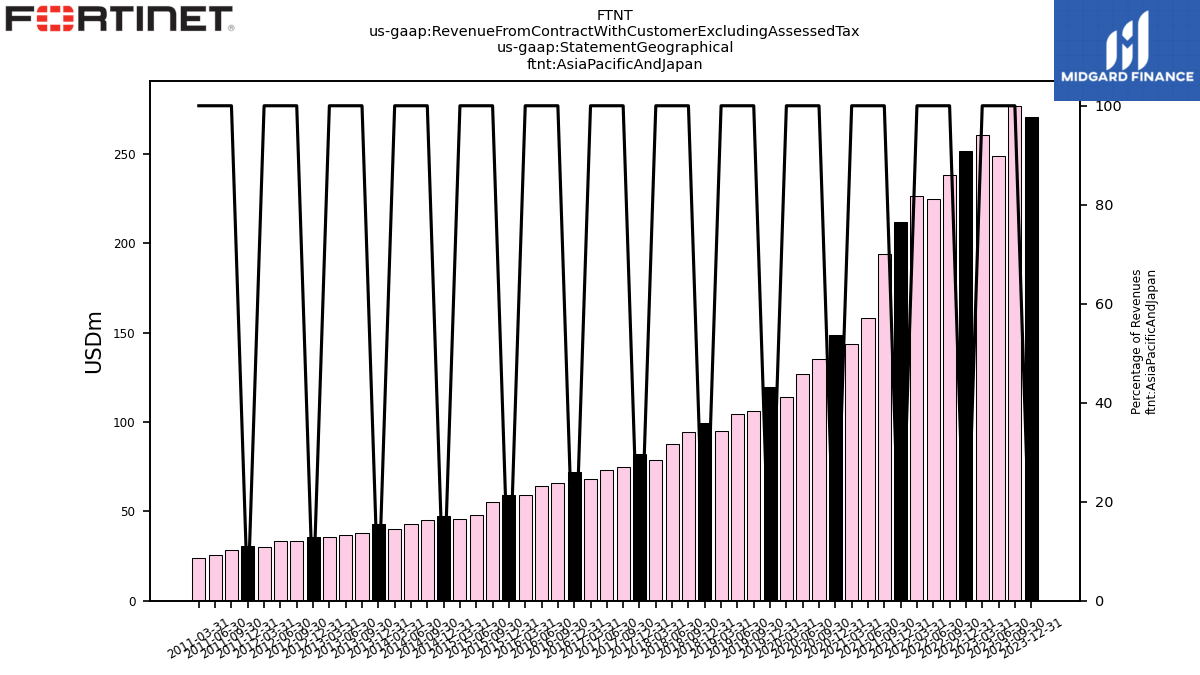
| Asia Pacific And Japan | 270.40 | 276.80 | 248.90 | 260.60 | 251.70 | 238.00 | 224.70 | 226.20 | 212.00 | 193.90 | 157.90 | 143.70 | 148.40 | 135.40 | 126.90 | 114.00 | 119.80 | 106.10 | 104.20 | 94.90 | 99.50 | 94.50 | 87.60 | 78.70 | 82.18 | 74.73 | 73.03 | 68.06 | 72.21 | 65.81 | 64.29 | 59.04 | 59.35 | 55.16 | 47.79 | 45.66 | 47.16 | 44.97 | 43.16 | 39.87 | 43.19 | 37.88 | 36.60 | 35.87 | 35.62 | 33.48 | 33.38 | 29.93 | 30.41 | 28.46 | 25.85 | 23.98 | NA | NA | NA | |
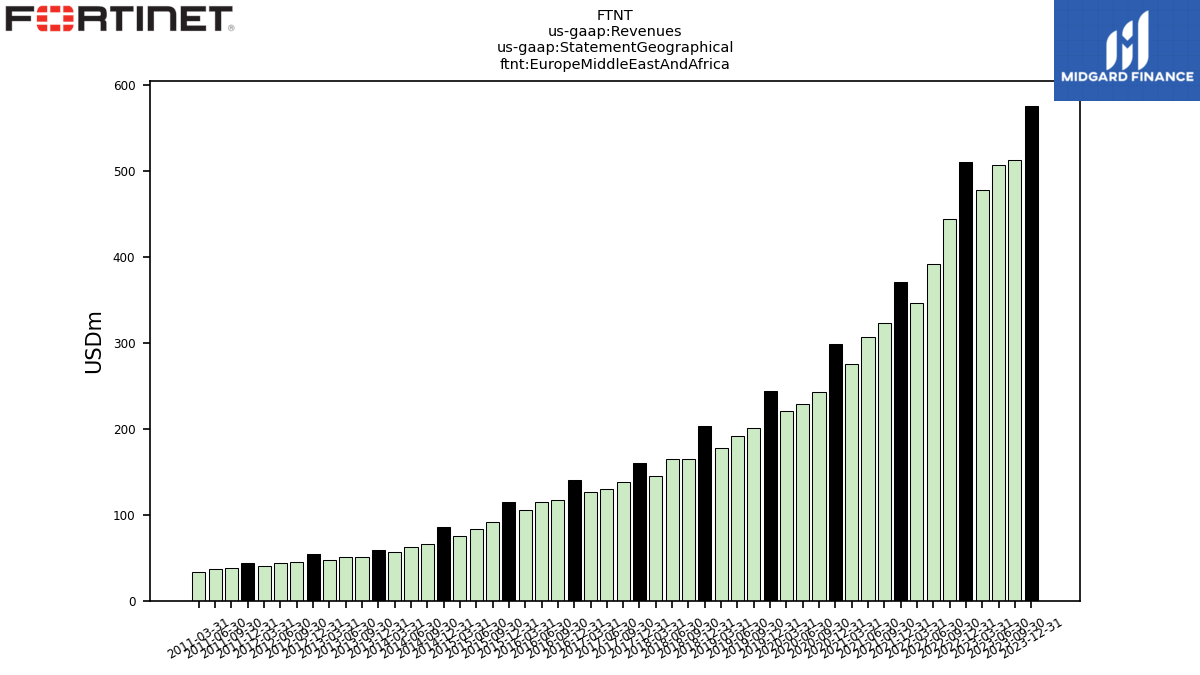
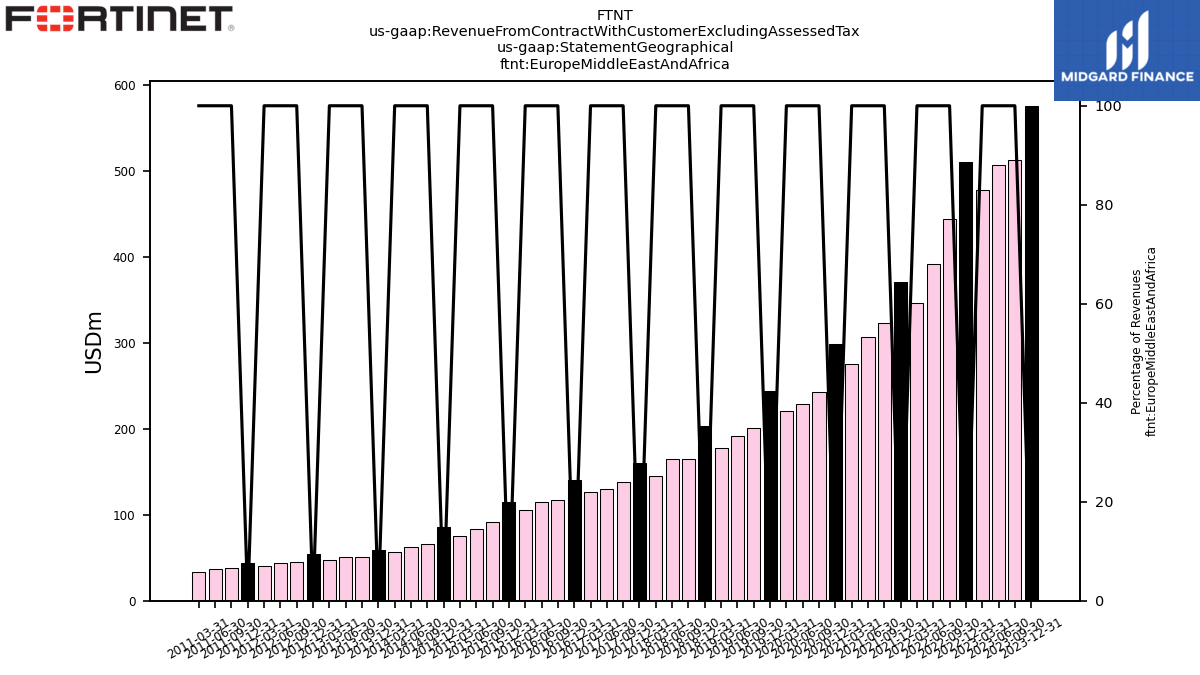
| Europe Middle East And Africa | 575.60 | 512.20 | 506.90 | 478.20 | 510.10 | 443.90 | 391.80 | 346.00 | 370.80 | 323.20 | 306.20 | 275.70 | 298.40 | 243.30 | 228.40 | 220.70 | 244.00 | 200.70 | 192.00 | 177.20 | 203.70 | 165.40 | 164.40 | 144.50 | 160.39 | 138.34 | 129.73 | 126.15 | 140.48 | 116.97 | 114.45 | 105.49 | 115.21 | 91.74 | 83.40 | 75.66 | 85.18 | 66.16 | 62.55 | 56.64 | 59.48 | 51.37 | 50.80 | 47.33 | 54.06 | 45.57 | 43.66 | 40.89 | 44.17 | 37.94 | 36.63 | 33.64 | NA | NA | NA | |
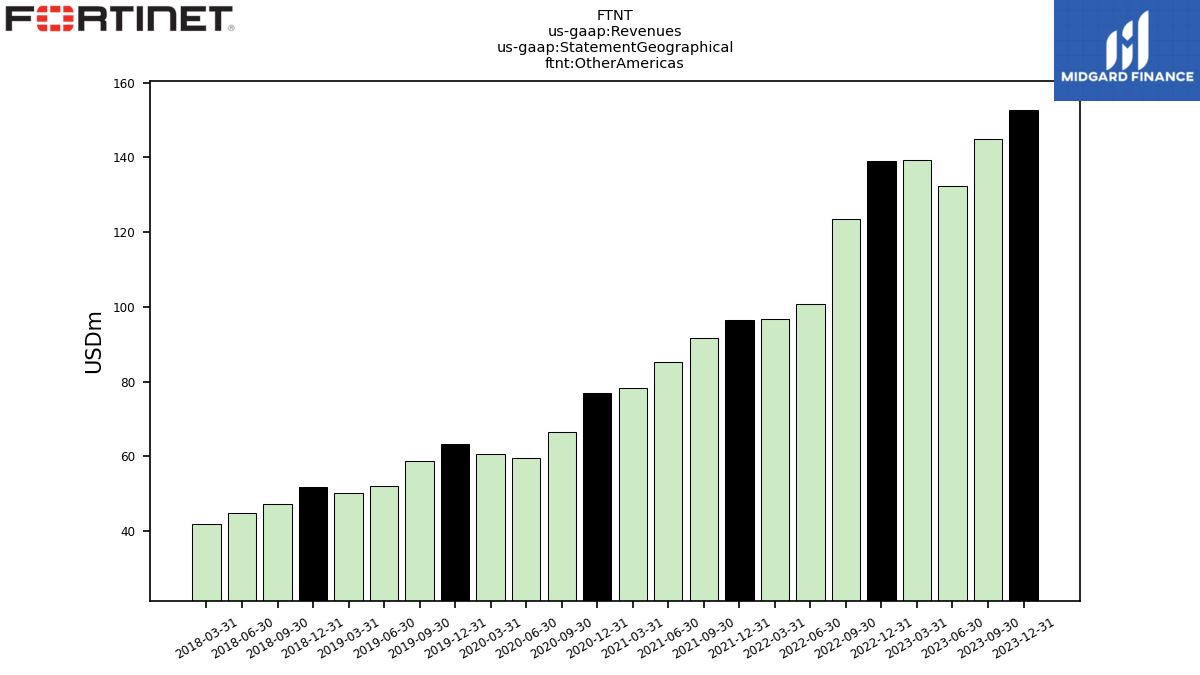
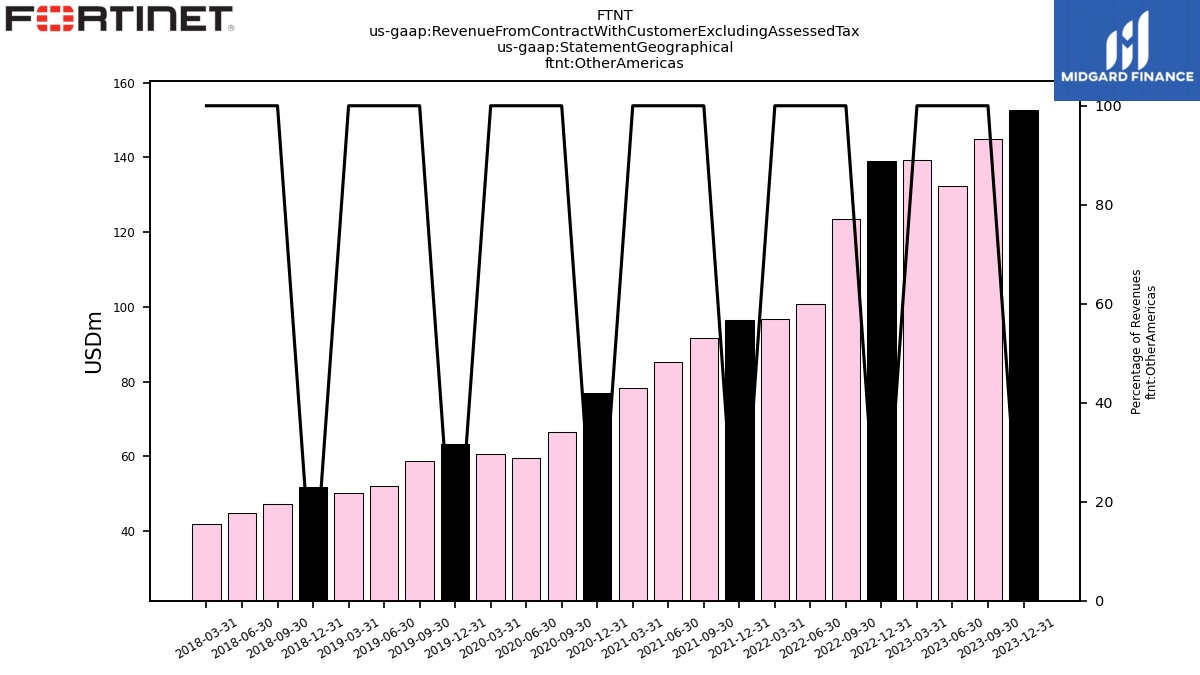
| Other Americas | 152.80 | 144.80 | 132.30 | 139.40 | 139.00 | 123.50 | 100.70 | 96.80 | 96.60 | 91.70 | 85.30 | 78.40 | 77.00 | 66.40 | 59.60 | 60.60 | 63.20 | 58.60 | 52.00 | 50.20 | 51.90 | 47.20 | 44.70 | 41.90 | NA | NA | NA | NA | NA | NA | NA | NA | NA | NA | NA | NA | NA | NA | NA | NA | NA | NA | NA | NA | NA | NA | NA | NA | NA | NA | NA | NA | NA | NA | NA | |
| Revenue From Contract With Customer Excluding Assessed Tax | 1415.10 | 1334.60 | 1292.80 | 1262.30 | 1283.00 | 1149.50 | 1030.10 | 954.80 | 963.60 | 867.20 | 801.10 | 710.30 | 748.00 | 651.10 | 615.50 | 576.90 | 614.40 | 547.50 | 521.70 | 472.60 | 507.00 | 453.90 | 441.30 | 399.00 | 416.64 | 374.22 | 363.47 | 340.58 | 362.83 | 316.65 | 311.39 | 284.58 | 296.53 | 260.07 | 239.78 | 212.89 | 223.97 | 193.35 | 184.10 | 168.95 | 177.35 | 154.70 | 147.43 | 135.82 | 151.16 | 136.27 | 128.96 | 117.25 | 120.86 | 116.43 | 103.02 | 93.27 | 93.60 | 84.97 | 76.33 | |
| Security Subscription | 524.50 | 494.60 | 457.30 | 421.70 | 403.90 | 369.80 | 340.40 | 312.90 | 309.40 | 287.40 | 272.90 | 255.30 | 249.30 | 235.40 | 222.60 | 211.40 | 205.40 | 192.80 | 183.10 | 169.60 | 165.40 | 157.00 | 147.10 | 136.60 | 138.50 | 130.80 | 122.00 | 113.50 | NA | NA | NA | NA | NA | NA | NA | NA | NA | NA | NA | NA | NA | NA | NA | NA | NA | NA | NA | NA | NA | NA | NA | NA | NA | NA | NA | |
| Product | 488.10 | 465.90 | 472.60 | 500.70 | 540.10 | 468.70 | 400.70 | 371.00 | 378.90 | 337.10 | 298.30 | 240.70 | 288.40 | 223.80 | 211.90 | 192.30 | 238.80 | 197.10 | 189.90 | 162.70 | 200.80 | 164.50 | 166.30 | 142.80 | NA | NA | NA | NA | NA | NA | NA | NA | NA | NA | NA | NA | NA | NA | NA | NA | NA | NA | NA | NA | NA | NA | NA | NA | NA | NA | NA | NA | NA | NA | NA | |
| Service | 927.00 | 868.70 | 820.20 | 761.60 | 742.90 | 680.80 | 629.40 | 583.80 | 584.70 | 530.10 | 502.80 | 469.60 | 459.60 | 427.30 | 403.60 | 384.60 | 375.60 | 350.40 | 331.80 | 309.90 | 306.20 | 289.40 | 275.00 | NA | NA | NA | NA | NA | NA | NA | NA | NA | NA | NA | NA | NA | NA | NA | NA | NA | NA | NA | NA | NA | NA | NA | NA | NA | NA | NA | NA | NA | NA | NA | NA | |
| 569.10 | 545.60 | 537.00 | 523.50 | 521.20 | 467.60 | 413.60 | 382.60 | 380.80 | 350.10 | 337.00 | 290.90 | 301.20 | 272.40 | 260.20 | 242.20 | 250.60 | 240.70 | 225.50 | 200.50 | 203.80 | 194.00 | 189.30 | NA | NA | NA | NA | NA | NA | NA | NA | NA | NA | NA | NA | NA | NA | NA | NA | NA | NA | NA | NA | NA | NA | NA | NA | NA | NA | NA | NA | NA | NA | NA | NA | ||
| US | 416.30 | 400.80 | 404.70 | 384.10 | 382.20 | 344.10 | 312.90 | 285.80 | 284.20 | 258.40 | 251.70 | 212.50 | 224.20 | 206.00 | 200.60 | 181.60 | 187.40 | 182.10 | 173.50 | 150.30 | 151.90 | 146.80 | 144.60 | 133.90 | 129.78 | 123.65 | 97.91 | 90.77 | 92.78 | 83.05 | 80.81 | 75.56 | 77.07 | 72.77 | 71.22 | 58.50 | 55.50 | 50.33 | 49.67 | 44.79 | 48.07 | 40.65 | 38.81 | 34.79 | 41.39 | 38.67 | 34.19 | 31.12 | 31.62 | 36.56 | 28.10 | 24.17 | NA | NA | NA | |
| Asia Pacific And Japan | 270.40 | 276.80 | 248.90 | 260.60 | 251.70 | 238.00 | 224.70 | 226.20 | 212.00 | 193.90 | 157.90 | 143.70 | 148.40 | 135.40 | 126.90 | 114.00 | 119.80 | 106.10 | 104.20 | 94.90 | 99.50 | 94.50 | 87.60 | 78.70 | 82.18 | 74.73 | 73.03 | 68.06 | 72.21 | 65.81 | 64.29 | 59.04 | 59.35 | 55.16 | 47.79 | 45.66 | 47.16 | 44.97 | 43.16 | 39.87 | 43.19 | 37.88 | 36.60 | 35.87 | 35.62 | 33.48 | 33.38 | 29.93 | 30.41 | 28.46 | 25.85 | 23.98 | NA | NA | NA | |
| Europe Middle East And Africa | 575.60 | 512.20 | 506.90 | 478.20 | 510.10 | 443.90 | 391.80 | 346.00 | 370.80 | 323.20 | 306.20 | 275.70 | 298.40 | 243.30 | 228.40 | 220.70 | 244.00 | 200.70 | 192.00 | 177.20 | 203.70 | 165.40 | 164.40 | 144.50 | 160.39 | 138.34 | 129.73 | 126.15 | 140.48 | 116.97 | 114.45 | 105.49 | 115.21 | 91.74 | 83.40 | 75.66 | 85.18 | 66.16 | 62.55 | 56.64 | 59.48 | 51.37 | 50.80 | 47.33 | 54.06 | 45.57 | 43.66 | 40.89 | 44.17 | 37.94 | 36.63 | 33.64 | NA | NA | NA | |
| Other Americas | 152.80 | 144.80 | 132.30 | 139.40 | 139.00 | 123.50 | 100.70 | 96.80 | 96.60 | 91.70 | 85.30 | 78.40 | 77.00 | 66.40 | 59.60 | 60.60 | 63.20 | 58.60 | 52.00 | 50.20 | 51.90 | 47.20 | 44.70 | 41.90 | NA | NA | NA | NA | NA | NA | NA | NA | NA | NA | NA | NA | NA | NA | NA | NA | NA | NA | NA | NA | NA | NA | NA | NA | NA | NA | NA | NA | NA | NA | NA |