
| 2023-12-31 | 2023-09-30 | 2023-06-30 | 2023-03-31 | 2022-12-31 | 2022-09-30 | 2022-06-30 | 2022-03-31 | 2021-12-31 | 2021-09-30 | 2021-06-30 | 2021-03-31 | 2020-12-31 | 2020-09-30 | 2020-06-30 | 2020-03-31 | 2019-12-31 | 2019-09-30 | 2019-06-30 | 2019-03-31 | 2018-12-31 | 2018-09-30 | 2018-06-30 | 2018-03-31 | 2017-12-31 | 2017-09-30 | 2017-06-30 | 2017-03-31 | 2016-12-31 | 2016-09-30 | 2016-06-30 | 2016-03-31 | 2015-12-31 | 2015-09-30 | 2015-06-30 | 2015-03-31 | 2014-12-31 | 2014-09-30 | 2014-06-30 | 2014-03-31 | 2013-12-31 | 2013-09-30 | 2013-06-30 | 2013-03-31 | 2012-12-31 | 2012-09-30 | 2012-06-30 | 2012-03-31 | 2011-12-31 | 2011-09-30 | 2011-06-30 | 2011-03-31 | 2010-12-31 | 2010-09-30 | 2010-06-30 | 2010-03-31 | ||
|---|---|---|---|---|---|---|---|---|---|---|---|---|---|---|---|---|---|---|---|---|---|---|---|---|---|---|---|---|---|---|---|---|---|---|---|---|---|---|---|---|---|---|---|---|---|---|---|---|---|---|---|---|---|---|---|---|---|
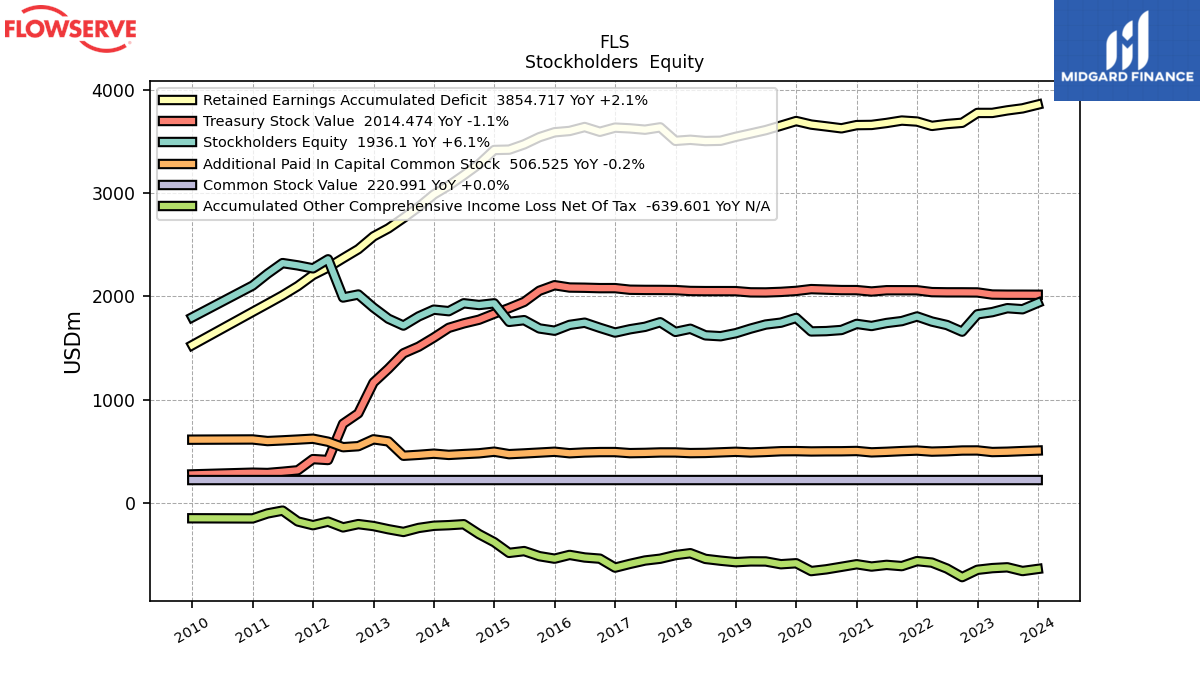
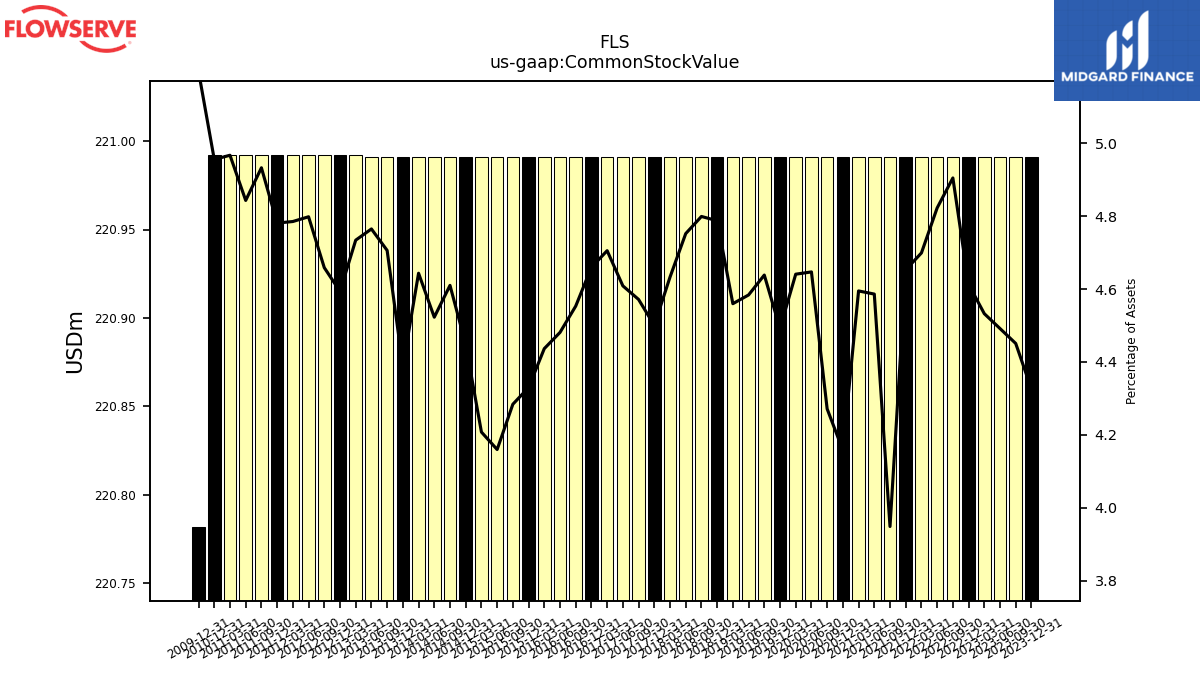
| Common Stock Value | 220.99 | 220.99 | 220.99 | 220.99 | 220.99 | 220.99 | 220.99 | 220.99 | 220.99 | 220.99 | 220.99 | 220.99 | 220.99 | 220.99 | 220.99 | 220.99 | 220.99 | 220.99 | 220.99 | 220.99 | 220.99 | 220.99 | 220.99 | 220.99 | 220.99 | 220.99 | 220.99 | 220.99 | 220.99 | 220.99 | 220.99 | 220.99 | 220.99 | 220.99 | 220.99 | 220.99 | 220.99 | 220.99 | 220.99 | 220.99 | 220.99 | 220.99 | 220.99 | 220.99 | 220.99 | 220.99 | 220.99 | 220.99 | 220.99 | 220.99 | 220.99 | 220.99 | 220.99 | NA | NA | NA | |
| dei: Entity Common Stock Shares Outstanding | NA | NA | NA | NA | NA | NA | NA | NA | NA | NA | NA | NA | NA | NA | NA | NA | NA | NA | NA | NA | NA | NA | NA | NA | NA | NA | NA | NA | NA | NA | NA | NA | NA | NA | NA | NA | NA | NA | NA | NA | NA | NA | NA | NA | NA | NA | NA | NA | NA | NA | NA | NA | NA | NA | NA | NA | |
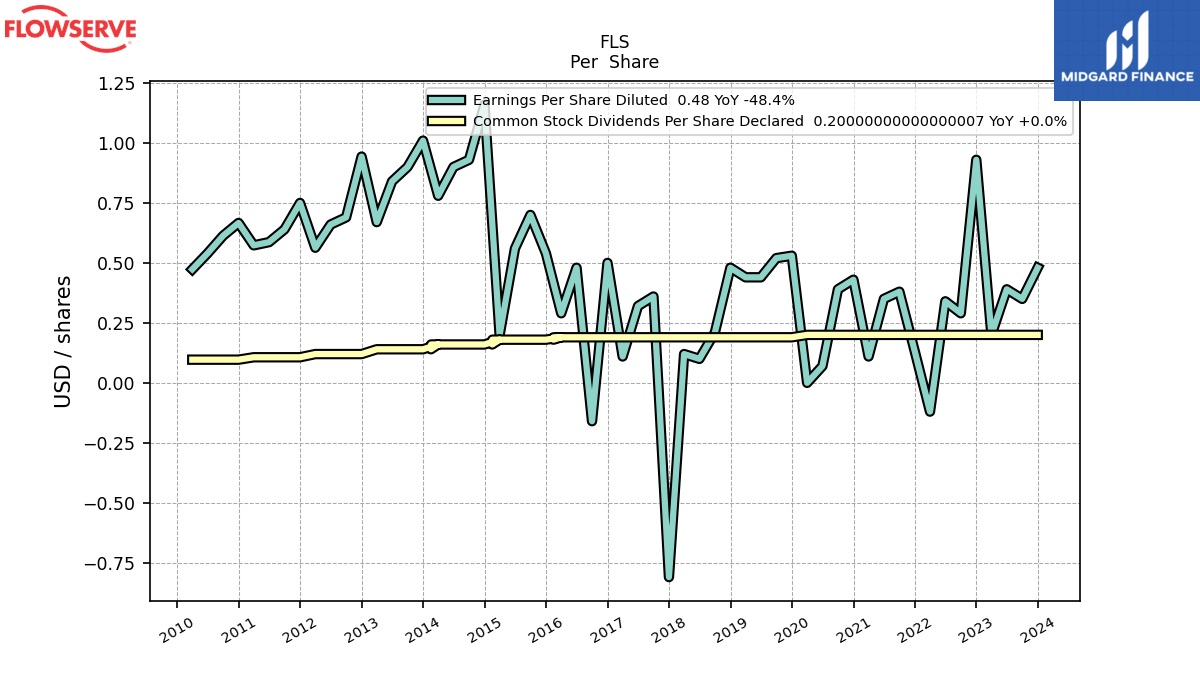
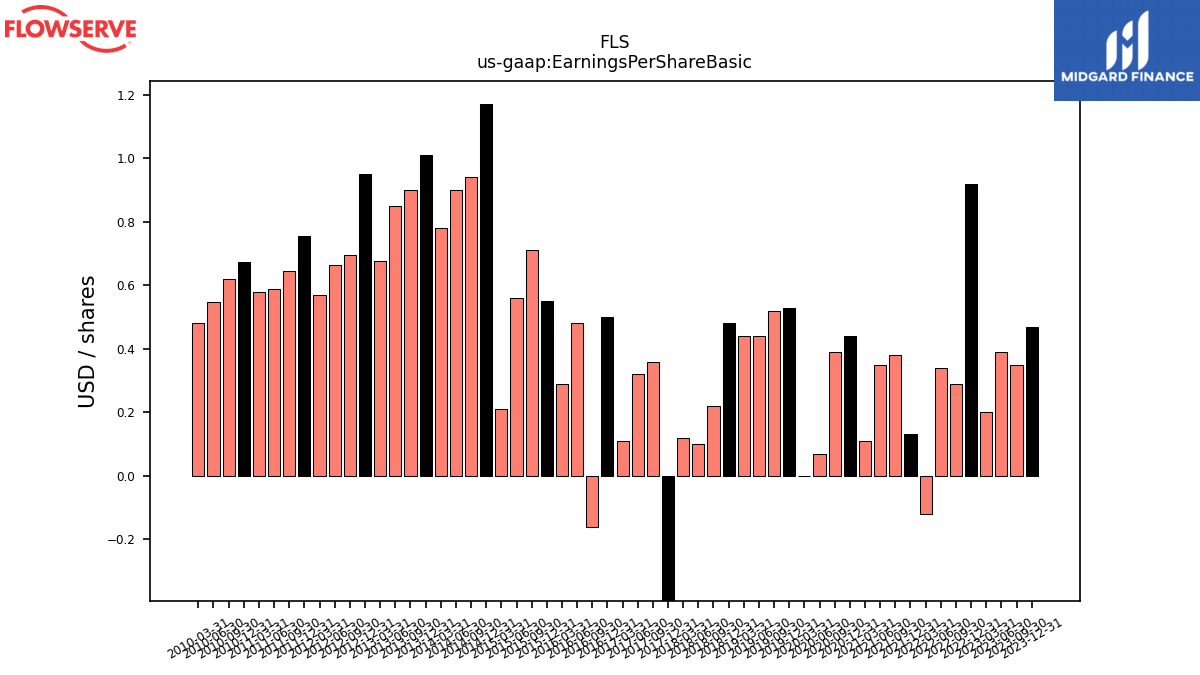
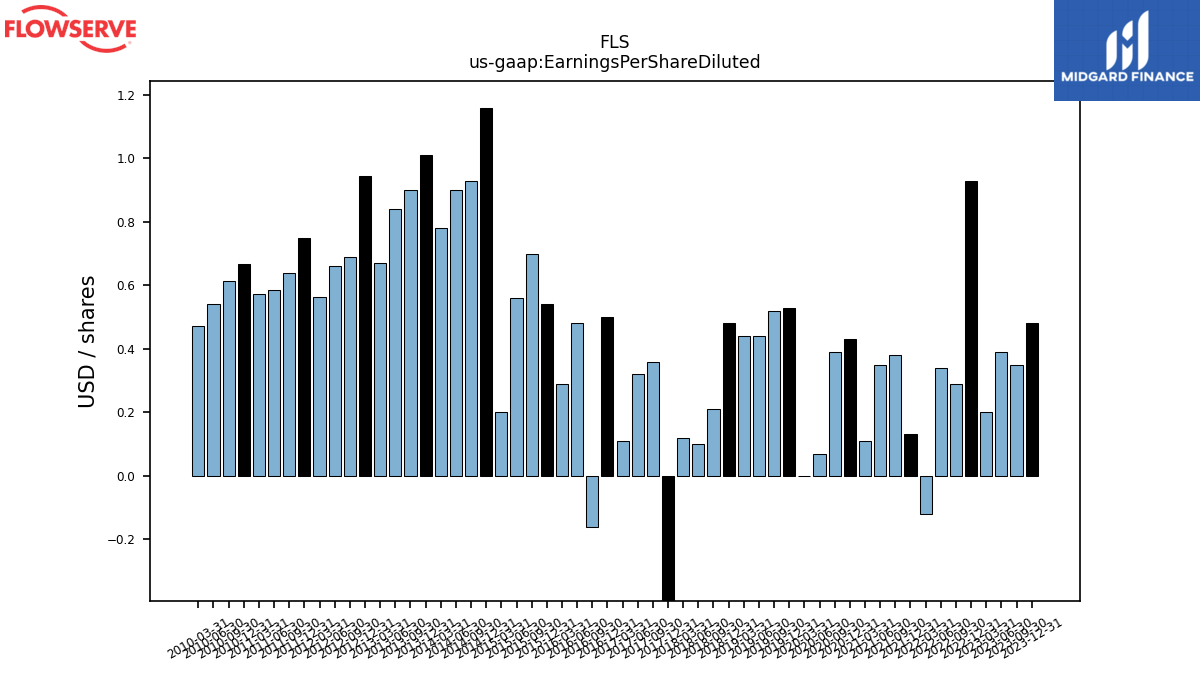
| Earnings Per Share Basic | 0.47 | 0.35 | 0.39 | 0.20 | 0.92 | 0.29 | 0.34 | -0.12 | 0.13 | 0.38 | 0.35 | 0.11 | 0.44 | 0.39 | 0.07 | 0.00 | 0.53 | 0.52 | 0.44 | 0.44 | 0.48 | 0.22 | 0.10 | 0.12 | -0.81 | 0.36 | 0.32 | 0.11 | 0.50 | -0.16 | 0.48 | 0.29 | 0.55 | 0.71 | 0.56 | 0.21 | 1.17 | 0.94 | 0.90 | 0.78 | 1.01 | 0.90 | 0.85 | 0.68 | 0.95 | 0.70 | 0.66 | 0.57 | 0.76 | 0.65 | 0.59 | 0.58 | 0.67 | 0.62 | 0.55 | 0.48 | |
| Earnings Per Share Diluted | 0.48 | 0.35 | 0.39 | 0.20 | 0.93 | 0.29 | 0.34 | -0.12 | 0.13 | 0.38 | 0.35 | 0.11 | 0.43 | 0.39 | 0.07 | 0.00 | 0.53 | 0.52 | 0.44 | 0.44 | 0.48 | 0.21 | 0.10 | 0.12 | -0.81 | 0.36 | 0.32 | 0.11 | 0.50 | -0.16 | 0.48 | 0.29 | 0.54 | 0.70 | 0.56 | 0.20 | 1.16 | 0.93 | 0.90 | 0.78 | 1.01 | 0.90 | 0.84 | 0.67 | 0.94 | 0.69 | 0.66 | 0.56 | 0.75 | 0.64 | 0.59 | 0.57 | 0.67 | 0.61 | 0.54 | 0.47 |
| 2023-12-31 | 2023-09-30 | 2023-06-30 | 2023-03-31 | 2022-12-31 | 2022-09-30 | 2022-06-30 | 2022-03-31 | 2021-12-31 | 2021-09-30 | 2021-06-30 | 2021-03-31 | 2020-12-31 | 2020-09-30 | 2020-06-30 | 2020-03-31 | 2019-12-31 | 2019-09-30 | 2019-06-30 | 2019-03-31 | 2018-12-31 | 2018-09-30 | 2018-06-30 | 2018-03-31 | 2017-12-31 | 2017-09-30 | 2017-06-30 | 2017-03-31 | 2016-12-31 | 2016-09-30 | 2016-06-30 | 2016-03-31 | 2015-12-31 | 2015-09-30 | 2015-06-30 | 2015-03-31 | 2014-12-31 | 2014-09-30 | 2014-06-30 | 2014-03-31 | 2013-12-31 | 2013-09-30 | 2013-06-30 | 2013-03-31 | 2012-12-31 | 2012-09-30 | 2012-06-30 | 2012-03-31 | 2011-12-31 | 2011-09-30 | 2011-06-30 | 2011-03-31 | 2010-12-31 | 2010-09-30 | 2010-06-30 | 2010-03-31 | ||
|---|---|---|---|---|---|---|---|---|---|---|---|---|---|---|---|---|---|---|---|---|---|---|---|---|---|---|---|---|---|---|---|---|---|---|---|---|---|---|---|---|---|---|---|---|---|---|---|---|---|---|---|---|---|---|---|---|---|
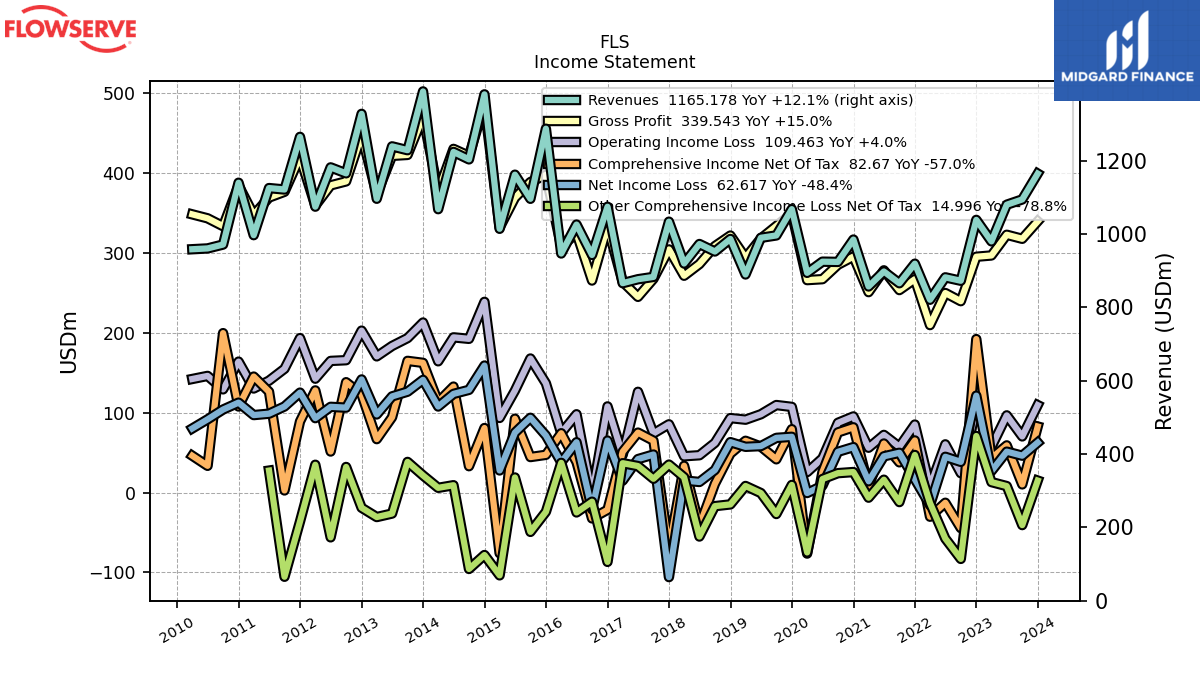
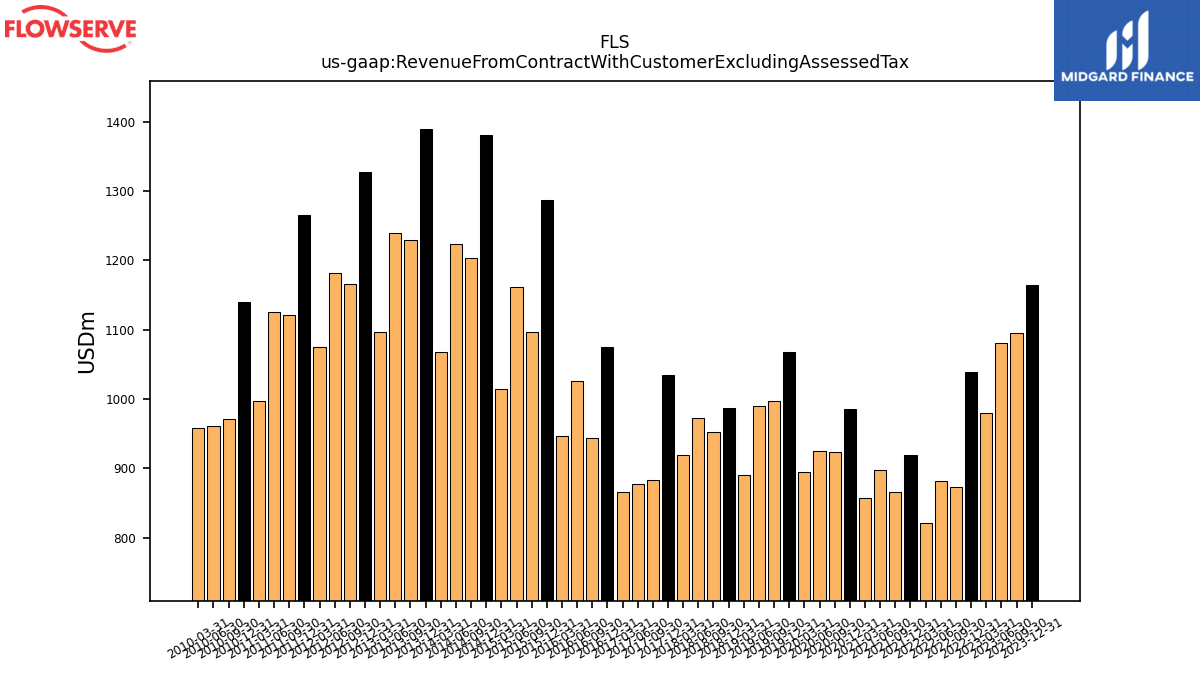
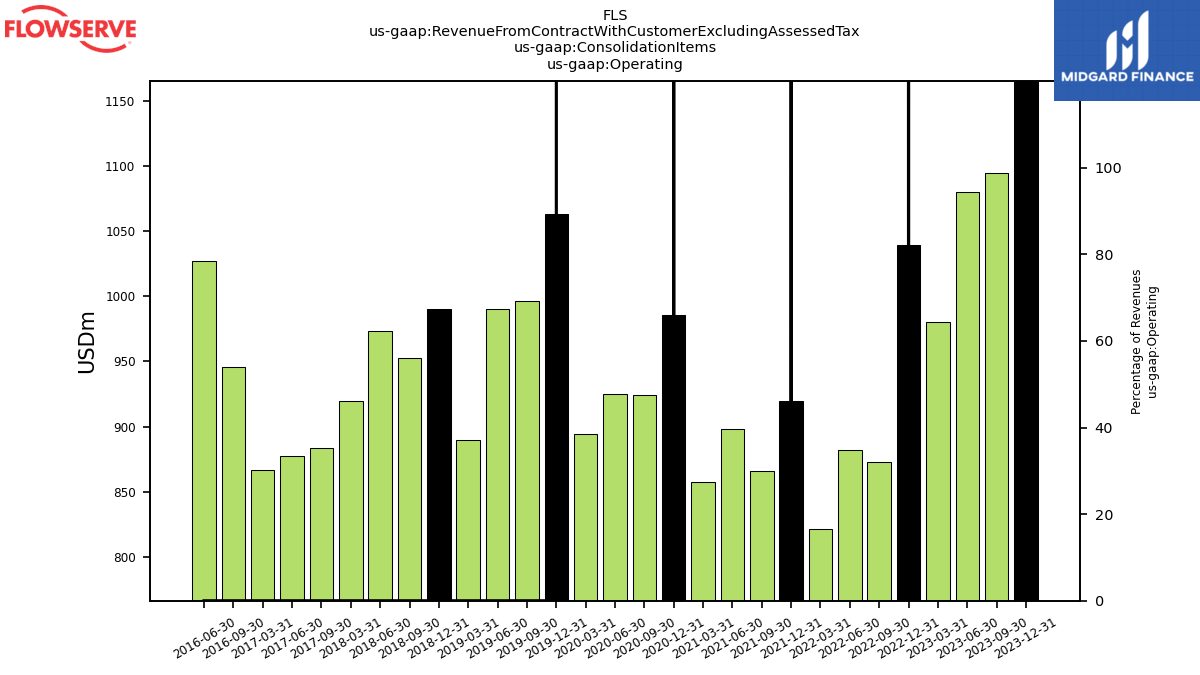
| Revenue From Contract With Customer Excluding Assessed Tax | 1165.18 | 1094.72 | 1080.38 | 980.30 | 1038.96 | 872.88 | 882.22 | 821.06 | 919.50 | 866.12 | 898.18 | 857.31 | 985.30 | 924.30 | 924.97 | 894.46 | 1068.20 | 996.54 | 990.08 | 890.05 | 986.90 | 952.72 | 973.13 | 919.95 | 1034.10 | 883.38 | 877.06 | 866.32 | 1074.80 | 943.33 | 1026.23 | 947.25 | 1287.70 | 1096.48 | 1162.25 | 1014.62 | 1381.40 | 1204.01 | 1224.38 | 1068.14 | 1389.40 | 1229.06 | 1239.53 | 1096.60 | 1328.20 | 1165.92 | 1182.22 | 1074.98 | 1265.40 | 1121.81 | 1125.75 | 997.21 | 1140.30 | 971.68 | 961.10 | 958.91 | |
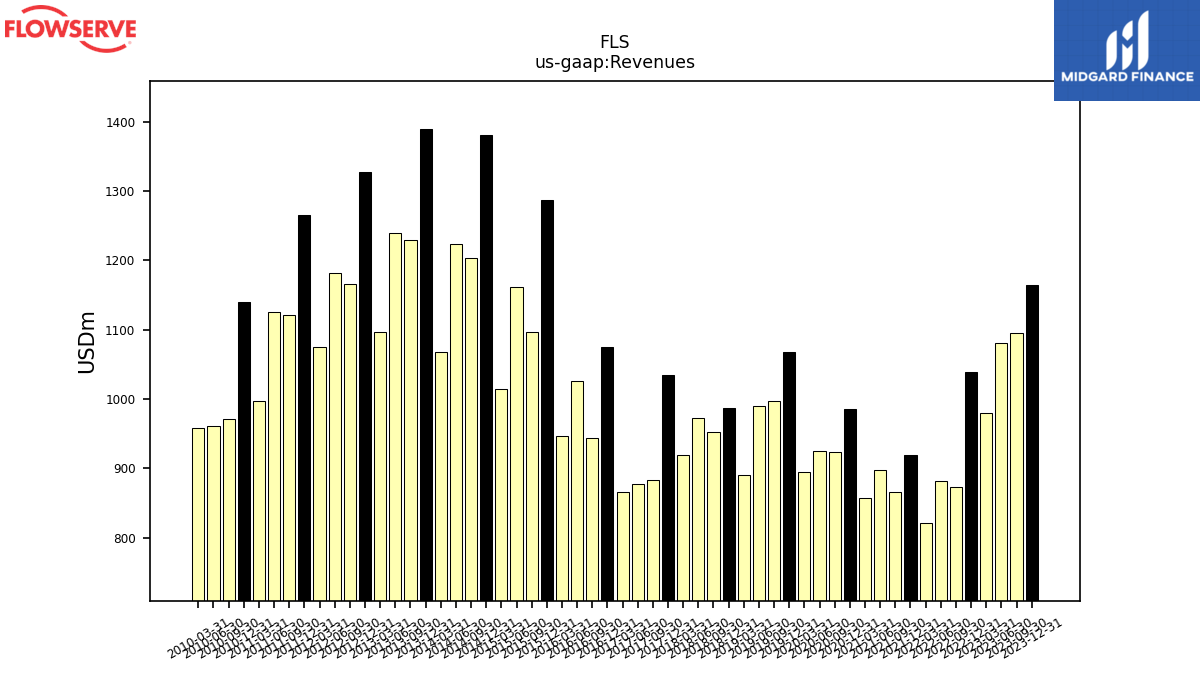
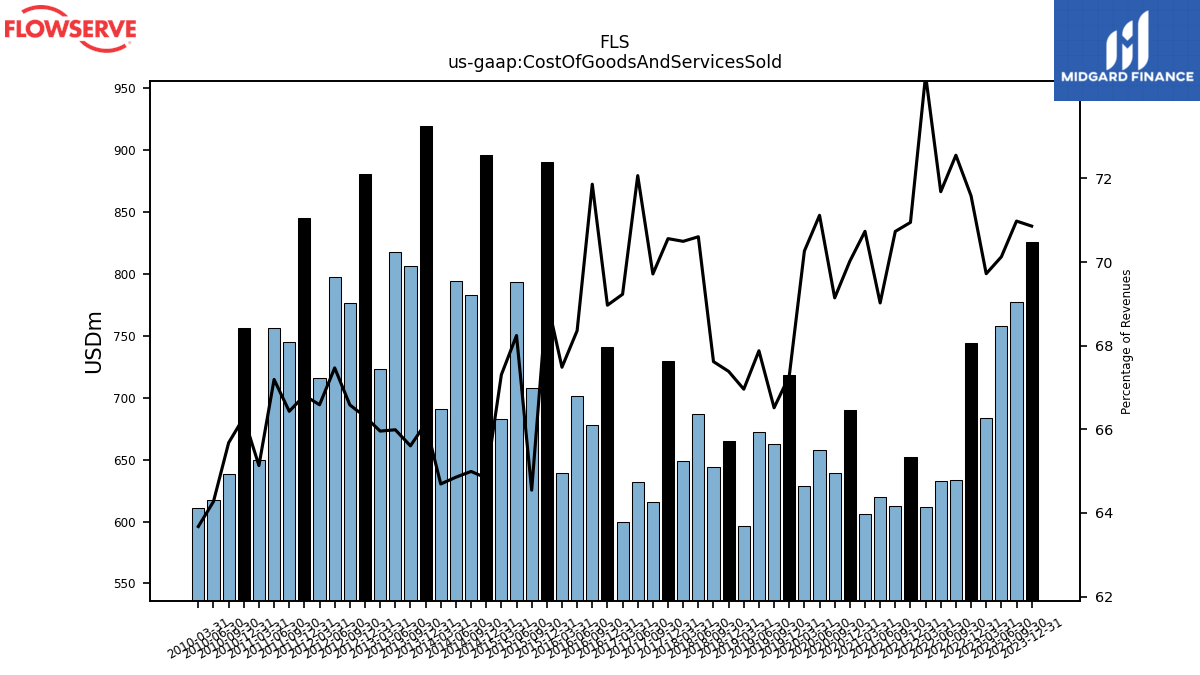
| Revenues | 1165.18 | 1094.72 | 1080.38 | 980.30 | 1038.96 | 872.88 | 882.22 | 821.06 | 919.50 | 866.12 | 898.18 | 857.31 | 985.30 | 924.30 | 924.97 | 894.46 | 1068.20 | 996.54 | 990.08 | 890.05 | 986.90 | 952.72 | 973.13 | 919.95 | 1034.10 | 883.38 | 877.06 | 866.32 | 1074.80 | 943.33 | 1026.23 | 947.25 | 1287.70 | 1096.48 | 1162.25 | 1014.62 | 1381.40 | 1204.01 | 1224.38 | 1068.14 | 1389.40 | 1229.06 | 1239.53 | 1096.60 | 1328.20 | 1165.92 | 1182.22 | 1074.98 | 1265.40 | 1121.81 | 1125.75 | 997.21 | 1140.30 | 971.68 | 961.10 | 958.91 | |
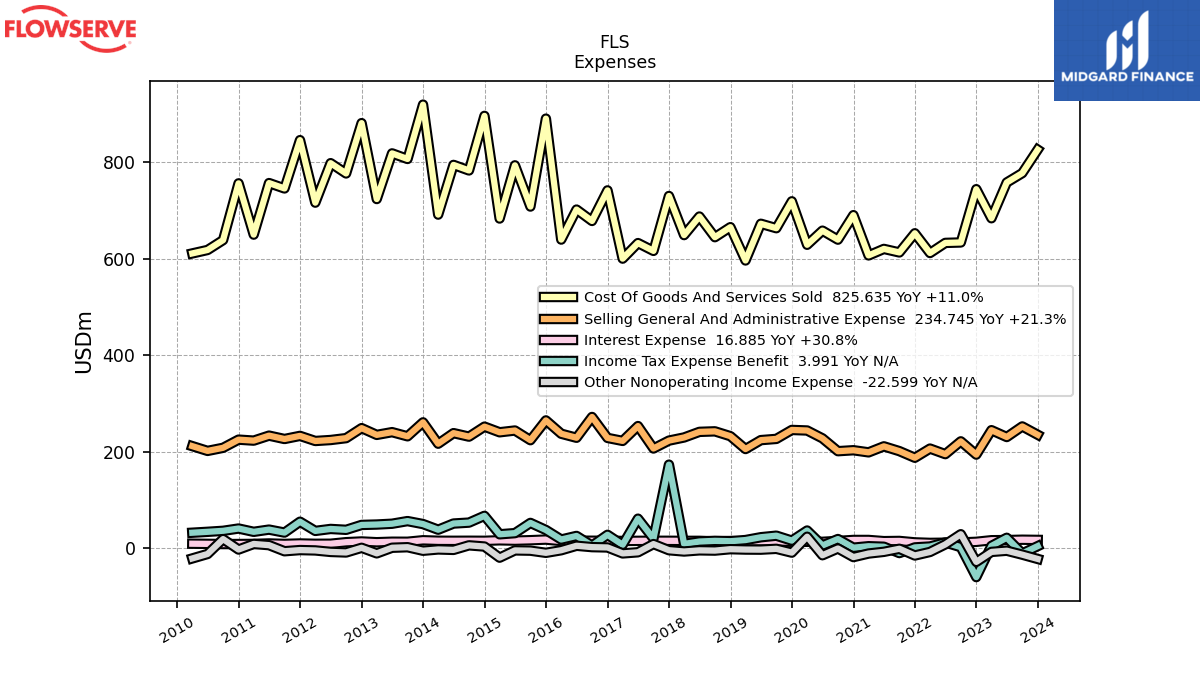
| Cost Of Goods And Services Sold | 825.63 | 777.02 | 757.62 | 683.48 | 743.72 | 633.30 | 632.39 | 611.41 | 652.36 | 612.63 | 619.94 | 606.41 | 689.91 | 639.09 | 657.80 | 628.48 | 718.60 | 662.86 | 672.05 | 595.98 | 665.02 | 644.22 | 687.07 | 648.52 | 729.66 | 615.85 | 632.07 | 599.75 | 741.26 | 677.89 | 701.51 | 639.25 | 889.94 | 707.73 | 793.15 | 682.89 | 895.66 | 782.52 | 794.07 | 691.01 | 918.97 | 806.32 | 817.95 | 723.29 | 880.65 | 776.32 | 797.62 | 715.80 | 845.40 | 745.23 | 756.41 | 649.51 | 755.83 | 638.18 | 617.73 | 610.60 | |
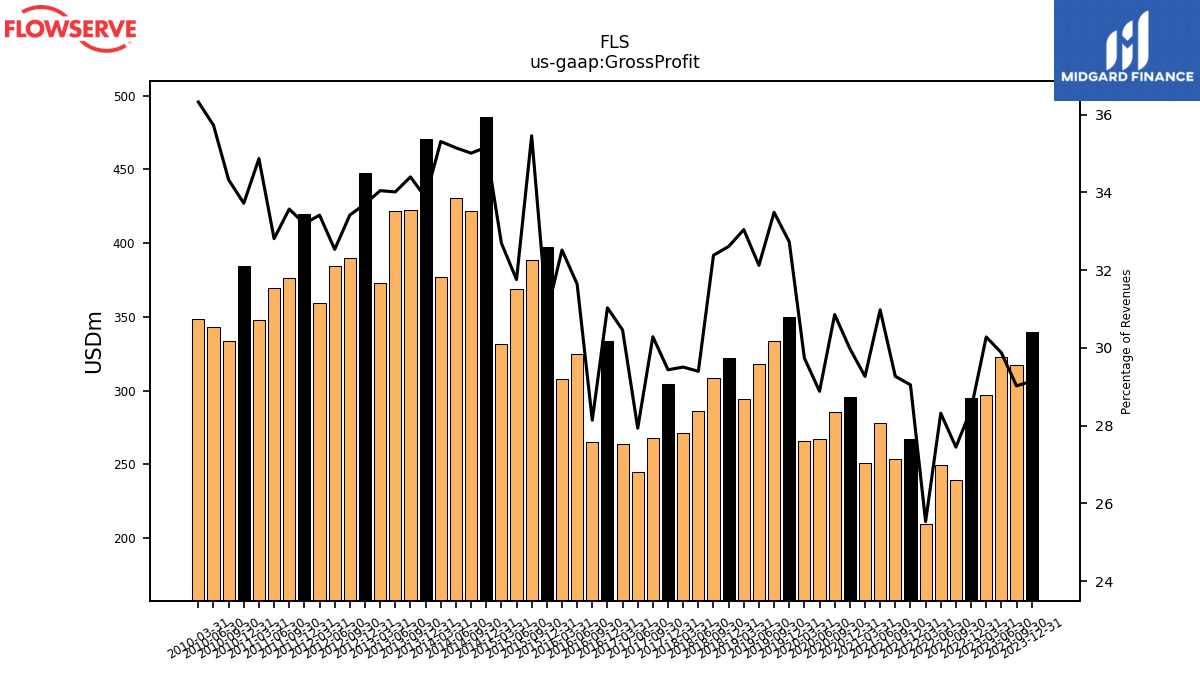
| Gross Profit | 339.54 | 317.69 | 322.76 | 296.83 | 295.24 | 239.58 | 249.83 | 209.65 | 267.10 | 253.49 | 278.24 | 250.90 | 295.40 | 285.21 | 267.16 | 265.98 | 349.60 | 333.69 | 318.03 | 294.08 | 321.80 | 308.50 | 286.06 | 271.43 | 304.40 | 267.53 | 245.00 | 263.88 | 333.50 | 265.44 | 324.72 | 308.00 | 397.70 | 388.75 | 369.09 | 331.73 | 485.70 | 421.49 | 430.31 | 377.12 | 470.50 | 422.74 | 421.58 | 373.31 | 447.60 | 389.60 | 384.60 | 359.18 | 420.00 | 376.59 | 369.34 | 347.69 | 384.50 | 333.50 | 343.37 | 348.31 | |
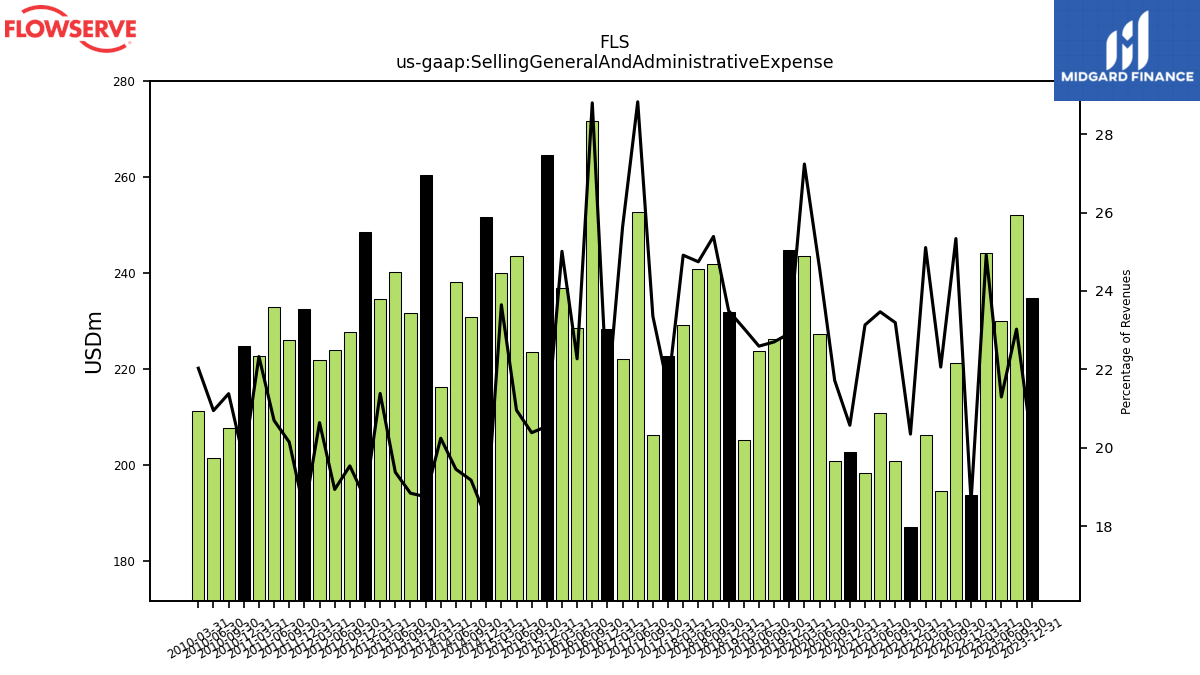
| Selling General And Administrative Expense | 234.75 | 252.06 | 230.08 | 244.27 | 193.59 | 221.14 | 194.61 | 206.14 | 187.11 | 200.86 | 210.79 | 198.31 | 202.72 | 200.73 | 227.36 | 243.62 | 244.77 | 226.22 | 223.68 | 205.15 | 231.87 | 241.88 | 240.79 | 229.18 | 222.68 | 206.29 | 252.80 | 222.03 | 228.24 | 271.64 | 228.53 | 236.91 | 264.57 | 223.52 | 243.59 | 239.93 | 251.62 | 230.87 | 238.18 | 216.23 | 260.55 | 231.57 | 240.20 | 234.51 | 248.55 | 227.80 | 223.89 | 221.89 | 232.46 | 226.00 | 232.98 | 222.64 | 224.68 | 207.74 | 201.33 | 211.24 | |
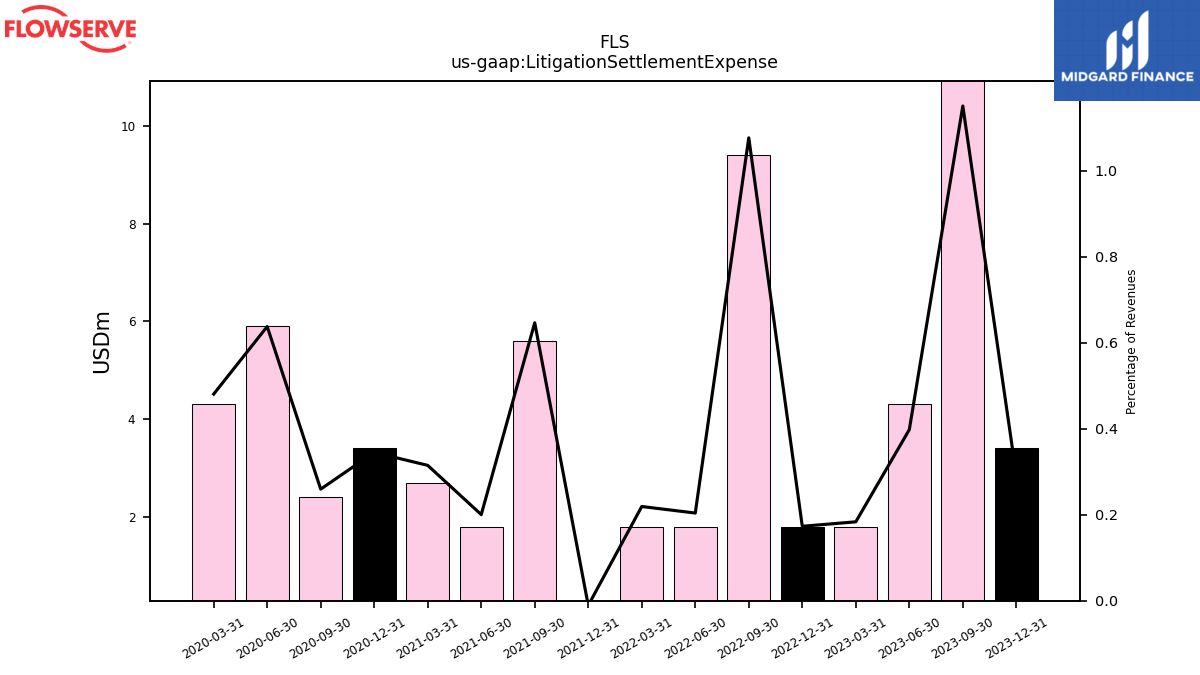
| Litigation Settlement Expense | 3.40 | 12.60 | 4.30 | 1.80 | 1.80 | 9.40 | 1.80 | 1.80 | -0.10 | 5.60 | 1.80 | 2.70 | 3.40 | 2.40 | 5.90 | 4.30 | NA | NA | NA | NA | NA | NA | NA | NA | NA | NA | NA | NA | NA | NA | NA | NA | NA | NA | NA | NA | NA | NA | NA | NA | NA | NA | NA | NA | NA | NA | NA | NA | NA | NA | NA | NA | NA | NA | NA | NA | |
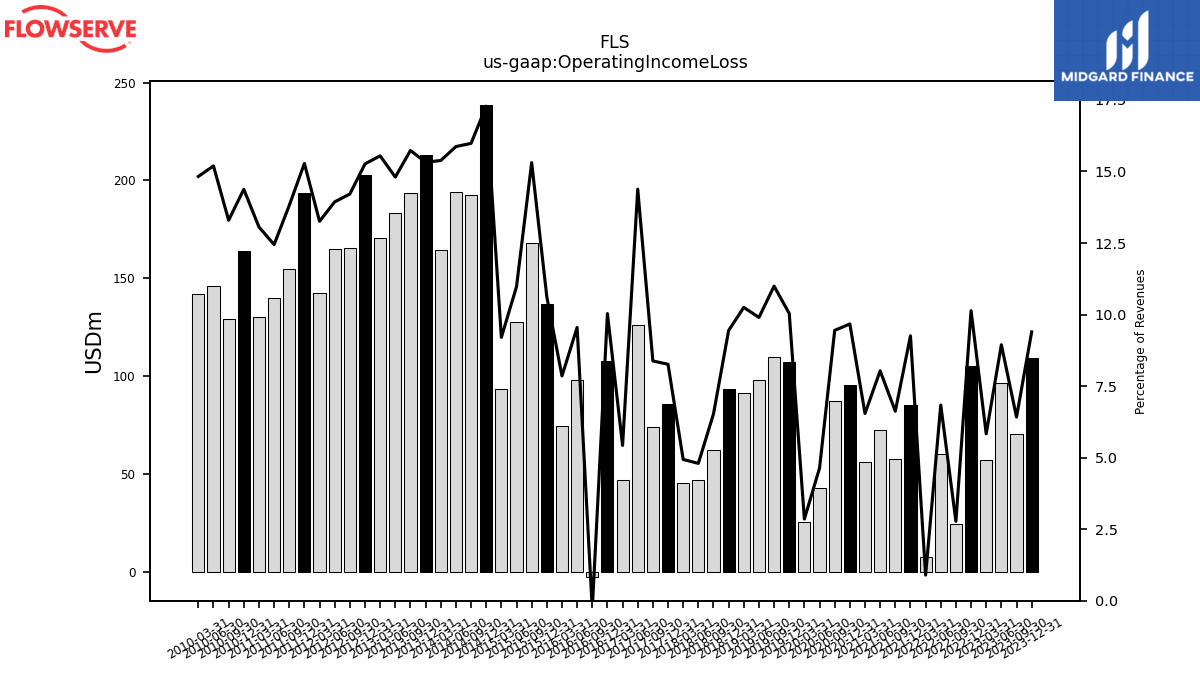
| Operating Income Loss | 109.46 | 70.26 | 96.65 | 57.19 | 105.30 | 24.22 | 60.33 | 7.37 | 85.13 | 57.36 | 72.16 | 56.10 | 95.30 | 87.32 | 42.89 | 25.55 | 107.23 | 109.56 | 98.02 | 91.23 | 93.21 | 62.19 | 46.71 | 45.42 | 85.45 | 74.02 | 126.14 | 47.02 | 107.85 | -2.81 | 98.00 | 74.41 | 136.76 | 167.85 | 127.58 | 93.38 | 238.75 | 192.44 | 194.31 | 164.33 | 212.89 | 193.39 | 183.52 | 170.48 | 202.75 | 165.71 | 164.80 | 142.52 | 193.36 | 154.96 | 140.11 | 130.25 | 163.95 | 129.20 | 146.03 | 142.17 | |
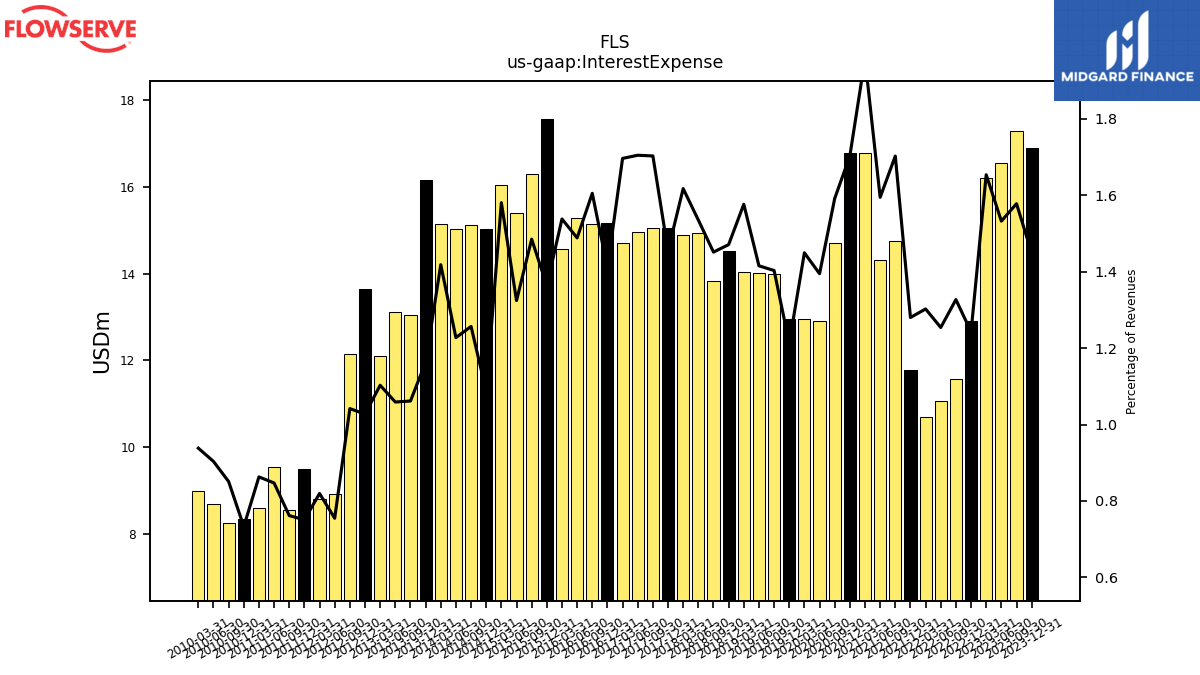
| Interest Expense | 16.89 | 17.27 | 16.55 | 16.21 | 12.91 | 11.58 | 11.06 | 10.69 | 11.77 | 14.75 | 14.32 | 16.78 | 16.78 | 14.71 | 12.90 | 12.96 | 12.96 | 13.98 | 14.01 | 14.03 | 14.52 | 13.83 | 14.94 | 14.88 | 15.04 | 15.04 | 14.95 | 14.70 | 15.15 | 15.14 | 15.27 | 14.57 | 17.56 | 16.28 | 15.39 | 16.04 | 15.02 | 15.13 | 15.03 | 15.15 | 16.15 | 13.05 | 13.12 | 12.09 | 13.64 | 12.14 | 8.92 | 8.81 | 9.50 | 8.54 | 9.53 | 8.61 | 8.36 | 8.27 | 8.68 | 8.99 | |
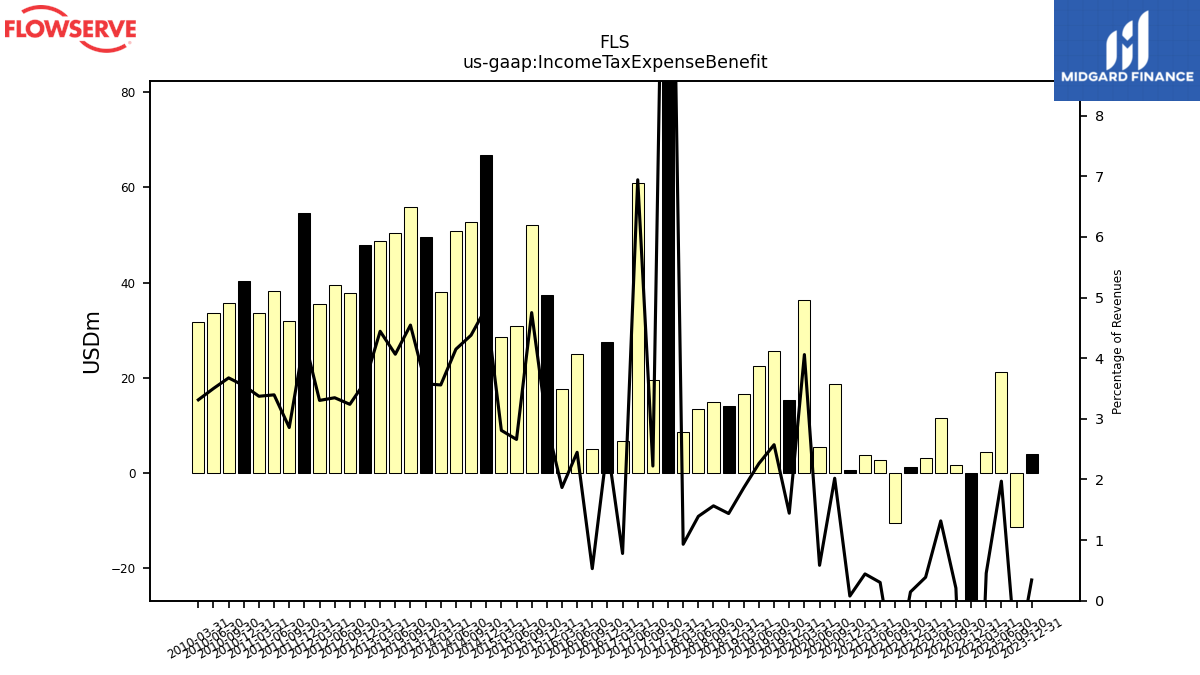
| Income Tax Expense Benefit | 3.99 | -11.19 | 21.30 | 4.45 | -60.26 | 1.82 | 11.62 | 3.18 | 1.33 | -10.43 | 2.71 | 3.79 | 0.77 | 18.67 | 5.41 | 36.31 | 15.42 | 25.65 | 22.41 | 16.59 | 14.20 | 14.91 | 13.54 | 8.57 | 172.84 | 19.63 | 60.89 | 6.75 | 27.48 | 5.00 | 25.12 | 17.69 | 37.40 | 52.10 | 30.92 | 28.51 | 66.77 | 52.73 | 50.79 | 38.02 | 49.70 | 55.87 | 50.40 | 48.73 | 47.90 | 37.77 | 39.58 | 35.52 | 54.62 | 32.05 | 38.23 | 33.63 | 40.46 | 35.71 | 33.65 | 31.77 | |
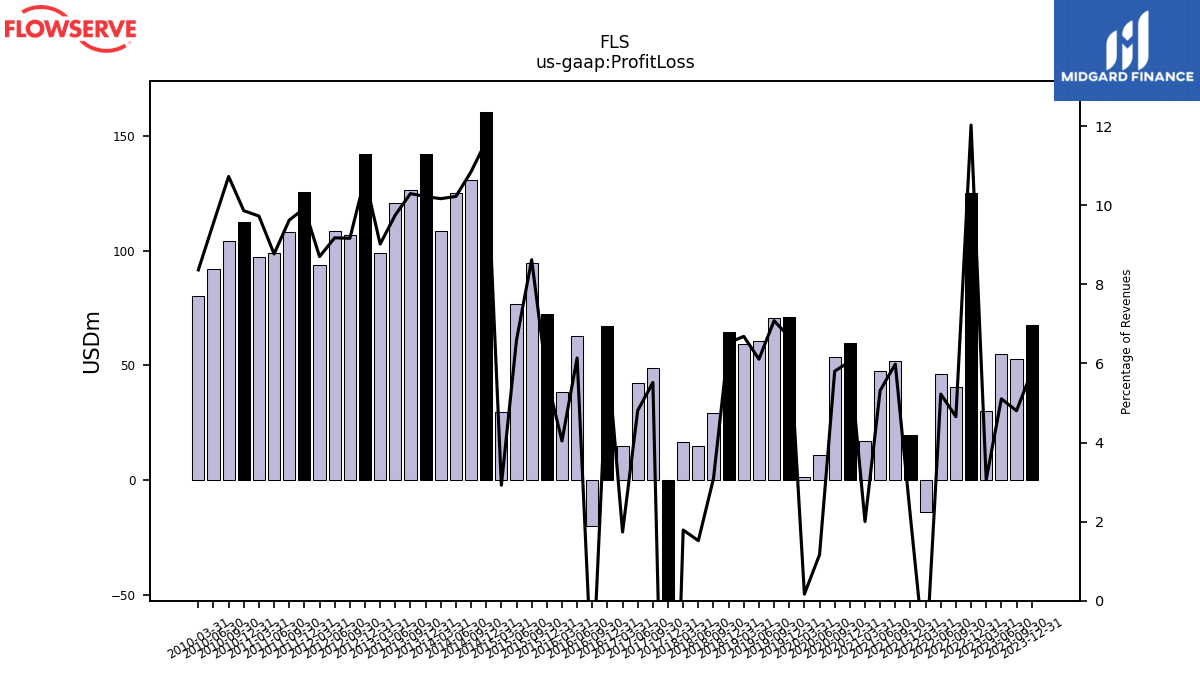
| Profit Loss | 67.44 | 52.59 | 55.15 | 30.00 | 124.96 | 40.63 | 46.09 | -13.68 | 19.47 | 51.81 | 47.74 | 17.16 | 59.62 | 53.65 | 10.79 | 1.49 | 71.25 | 70.56 | 60.47 | 59.50 | 64.36 | 29.44 | 14.79 | 16.46 | -105.89 | 48.74 | 42.19 | 15.06 | 66.99 | -20.12 | 62.99 | 38.28 | 72.46 | 94.54 | 76.63 | 29.64 | 160.53 | 130.60 | 125.17 | 108.59 | 141.99 | 126.53 | 120.89 | 98.90 | 141.94 | 106.83 | 108.48 | 93.54 | 125.56 | 107.96 | 98.72 | 97.00 | 112.45 | 104.22 | 91.80 | 80.20 | |
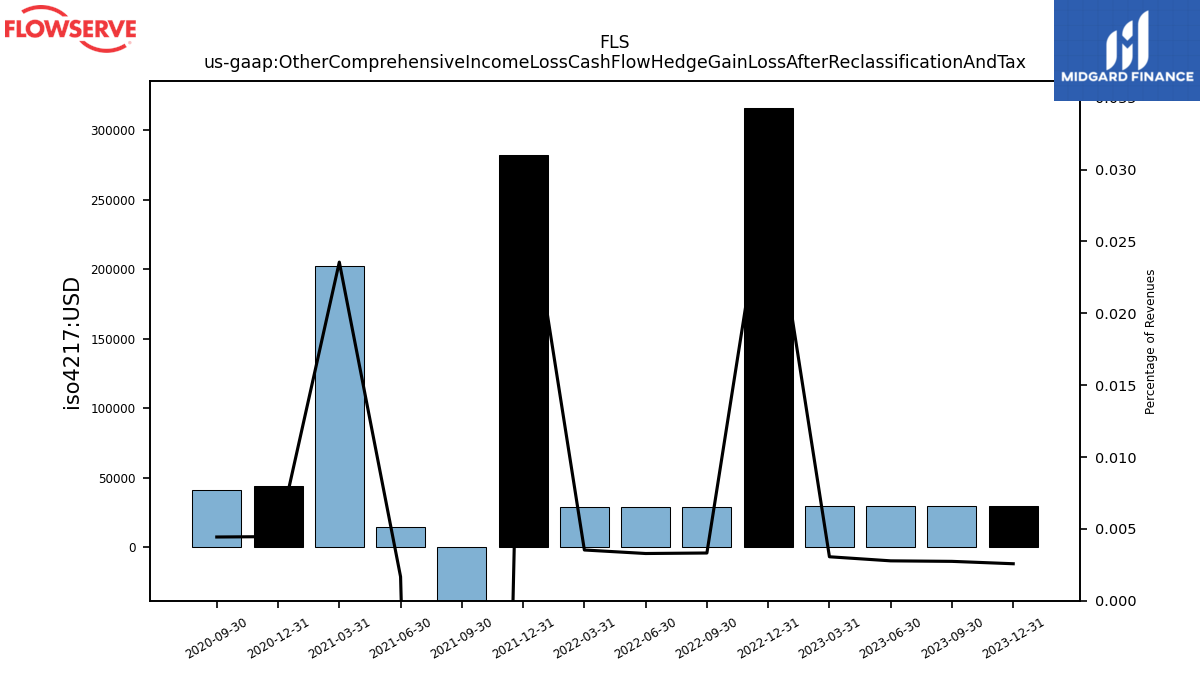
| Other Comprehensive Income Loss Cash Flow Hedge Gain Loss After Reclassification And Tax | 0.03 | 0.03 | 0.03 | 0.03 | 0.32 | 0.03 | 0.03 | 0.03 | 0.28 | -1.35 | 0.01 | 0.20 | 0.04 | 0.04 | NA | NA | NA | NA | NA | NA | NA | NA | NA | NA | NA | NA | NA | NA | NA | NA | NA | NA | NA | NA | NA | NA | NA | NA | NA | NA | NA | NA | NA | NA | NA | NA | NA | NA | NA | NA | NA | NA | NA | NA | NA | NA | |
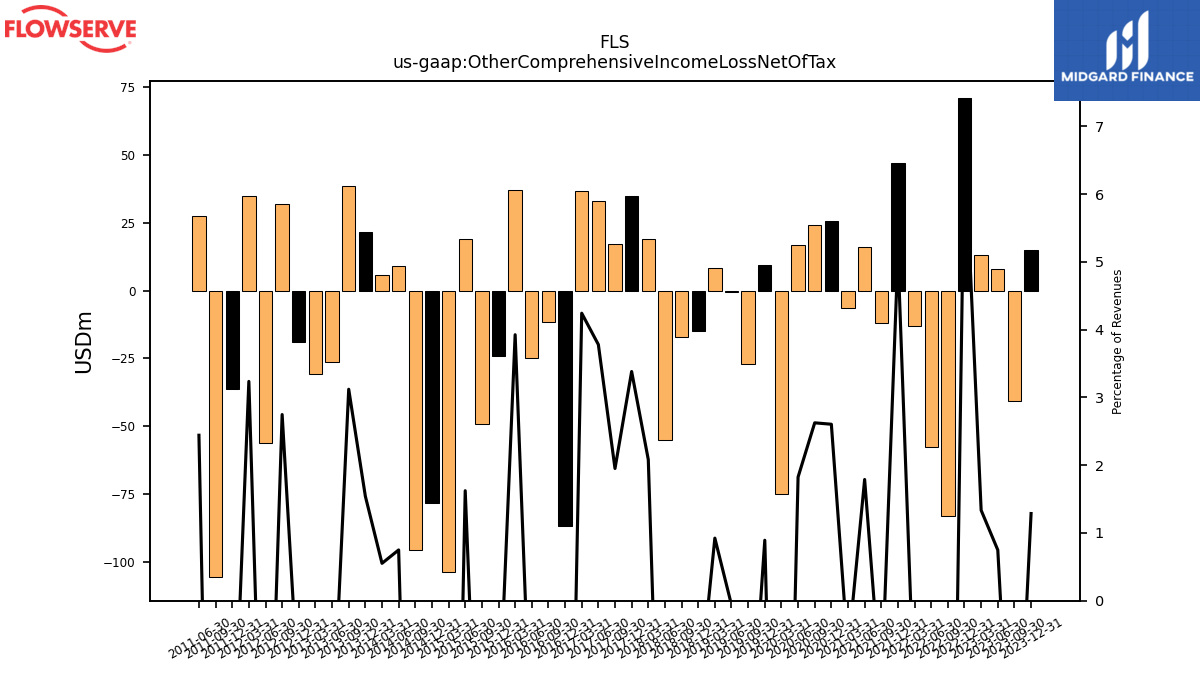
| Other Comprehensive Income Loss Net Of Tax | 15.00 | -40.78 | 8.09 | 13.09 | 70.84 | -83.09 | -57.56 | -13.13 | 47.04 | -11.95 | 16.07 | -6.43 | 25.66 | 24.27 | 16.89 | -74.99 | 9.54 | -26.91 | -0.62 | 8.22 | -14.87 | -17.02 | -55.08 | 19.17 | 34.98 | 17.24 | 33.16 | 36.76 | -86.81 | -11.46 | -24.91 | 37.19 | -24.12 | -49.27 | 18.87 | -103.69 | -78.21 | -95.71 | 9.18 | 5.90 | 21.42 | 38.36 | -26.30 | -30.69 | -19.04 | 32.04 | -56.11 | 34.79 | -36.33 | -105.46 | 27.50 | NA | NA | NA | NA | NA | |
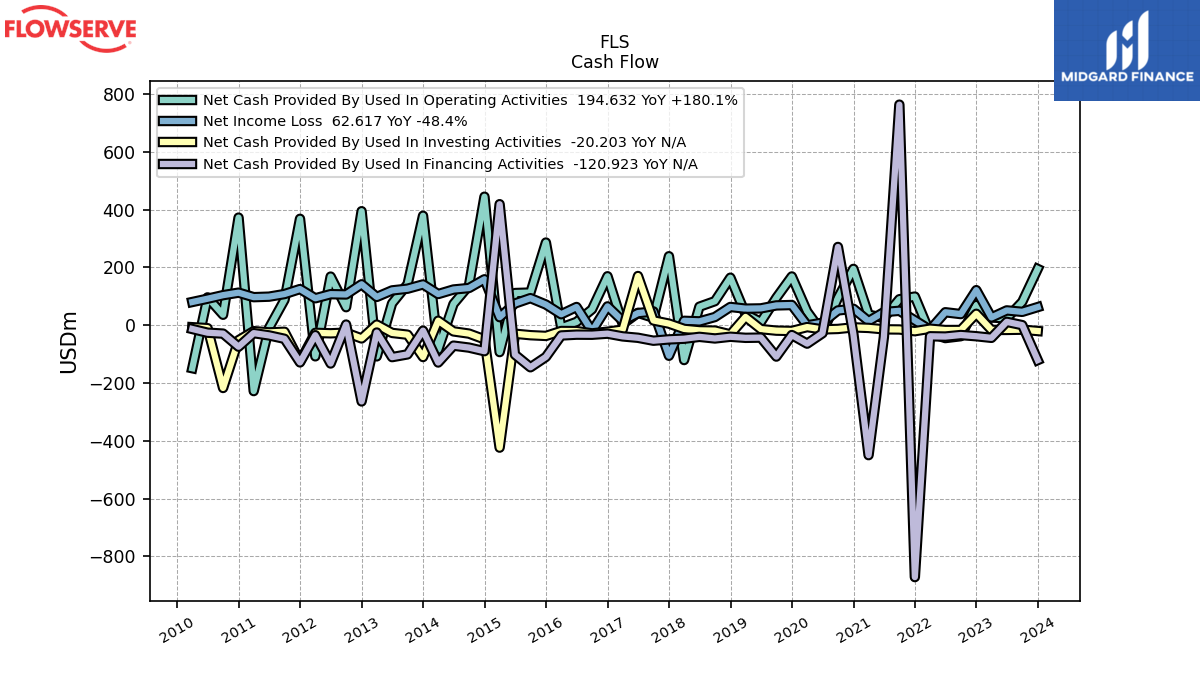
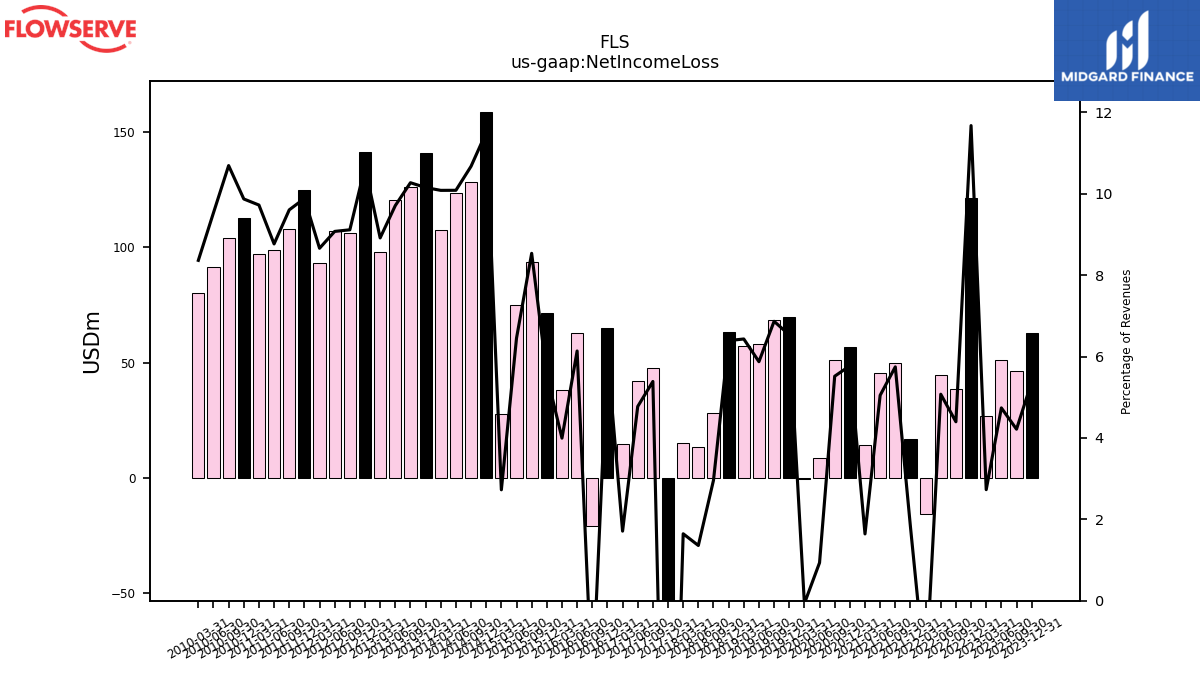
| Net Income Loss | 62.62 | 46.16 | 51.20 | 26.77 | 121.33 | 38.40 | 44.78 | -15.82 | 16.70 | 49.78 | 45.35 | 14.08 | 56.90 | 51.00 | 8.64 | -0.61 | 69.80 | 68.44 | 58.17 | 57.26 | 63.10 | 28.20 | 13.22 | 15.14 | -105.90 | 47.60 | 41.88 | 14.82 | 65.10 | -20.93 | 63.00 | 37.86 | 71.40 | 93.62 | 75.01 | 27.67 | 159.00 | 128.56 | 123.51 | 107.73 | 141.10 | 126.27 | 120.39 | 97.79 | 141.60 | 106.30 | 107.32 | 93.12 | 125.10 | 107.77 | 98.73 | 96.98 | 112.60 | 103.92 | 91.65 | 80.22 | |
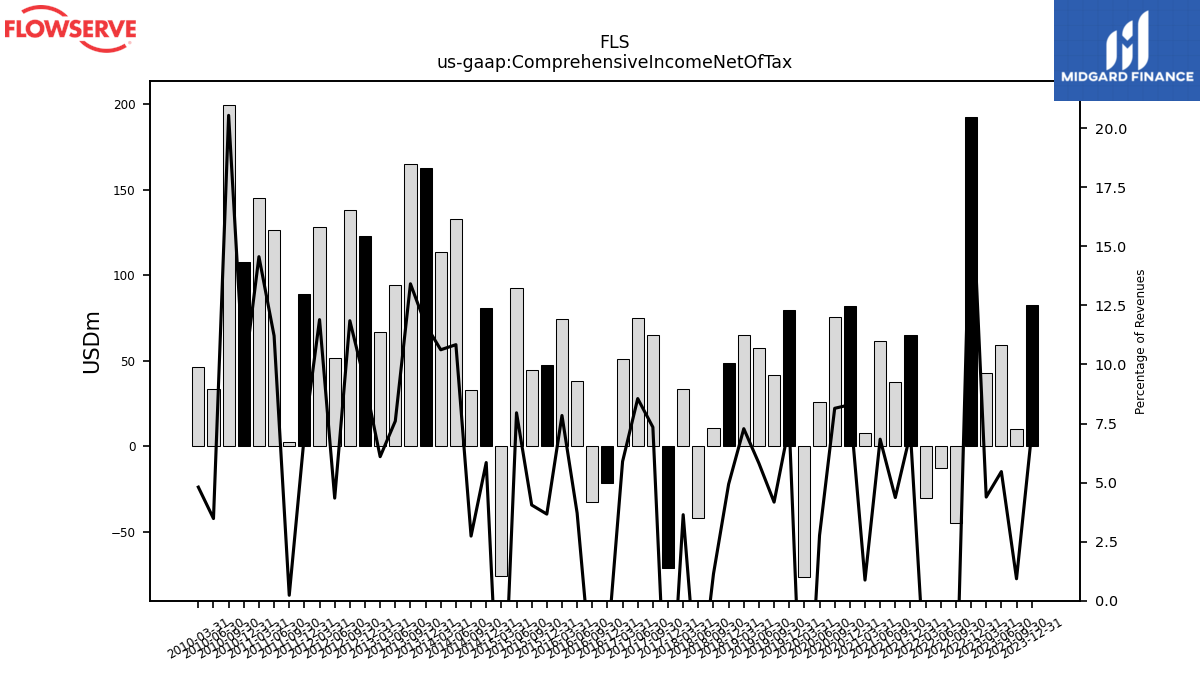
| Comprehensive Income Net Of Tax | 82.67 | 10.19 | 59.05 | 43.02 | 192.16 | -44.60 | -12.79 | -30.28 | 65.24 | 37.84 | 61.41 | 7.50 | 81.72 | 75.28 | 25.59 | -76.44 | 79.35 | 41.60 | 57.56 | 64.81 | 48.72 | 10.84 | -41.87 | 33.50 | -70.85 | 64.89 | 75.03 | 51.05 | -21.61 | -32.38 | 38.09 | 74.26 | 47.22 | 44.44 | 92.45 | -76.04 | 80.79 | 32.95 | 132.69 | 113.46 | 162.38 | 164.86 | 94.25 | 66.87 | 122.72 | 138.17 | 51.35 | 127.88 | 88.95 | 2.61 | 126.22 | 145.20 | 107.72 | 199.60 | 33.44 | 46.11 | |
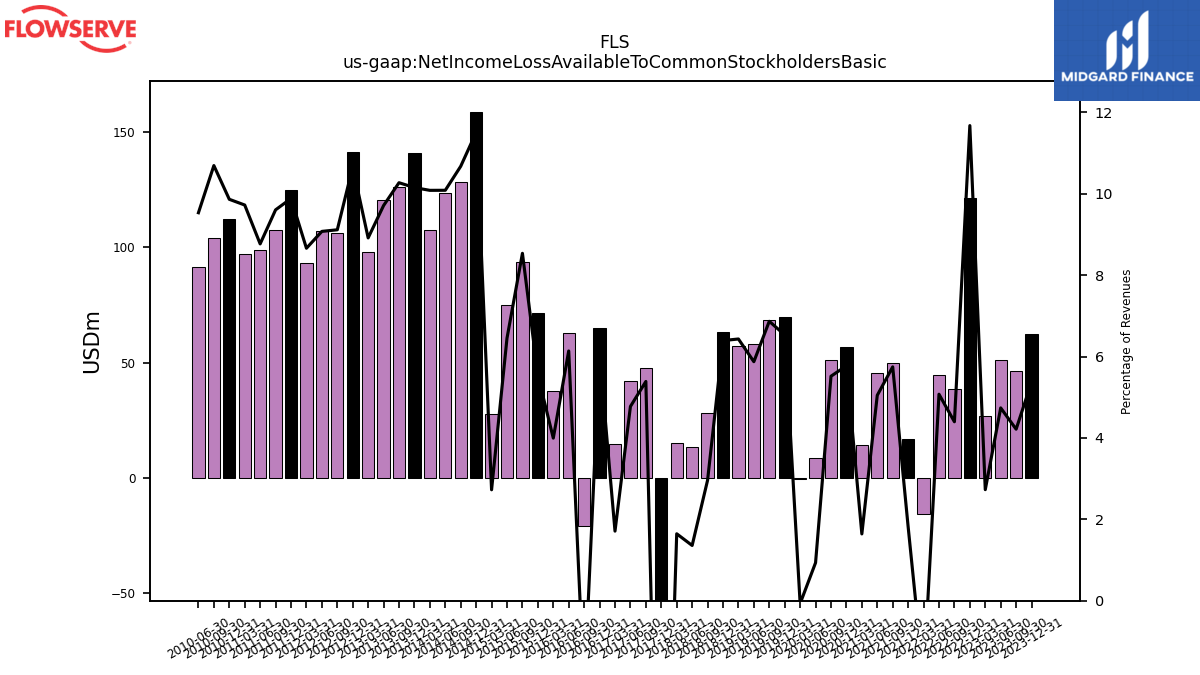
| Net Income Loss Available To Common Stockholders Basic | 62.62 | 46.16 | 51.20 | 26.77 | 121.33 | 38.40 | 44.78 | -15.82 | 16.73 | 49.78 | 45.35 | 14.08 | 56.89 | 51.00 | 8.64 | -0.61 | 69.79 | 68.44 | 58.17 | 57.26 | 63.10 | 28.20 | 13.22 | 15.14 | -105.88 | 47.60 | 41.88 | 14.82 | 65.13 | -20.93 | 63.00 | 37.86 | 71.38 | 93.63 | 75.01 | 27.67 | 159.02 | 128.56 | 123.52 | 107.74 | 141.08 | 126.27 | 120.39 | 97.79 | 141.61 | 106.30 | 107.32 | 93.13 | 125.10 | 107.78 | 98.74 | 96.99 | 112.51 | 103.92 | 91.65 | NA |
| 2023-12-31 | 2023-09-30 | 2023-06-30 | 2023-03-31 | 2022-12-31 | 2022-09-30 | 2022-06-30 | 2022-03-31 | 2021-12-31 | 2021-09-30 | 2021-06-30 | 2021-03-31 | 2020-12-31 | 2020-09-30 | 2020-06-30 | 2020-03-31 | 2019-12-31 | 2019-09-30 | 2019-06-30 | 2019-03-31 | 2018-12-31 | 2018-09-30 | 2018-06-30 | 2018-03-31 | 2017-12-31 | 2017-09-30 | 2017-06-30 | 2017-03-31 | 2016-12-31 | 2016-09-30 | 2016-06-30 | 2016-03-31 | 2015-12-31 | 2015-09-30 | 2015-06-30 | 2015-03-31 | 2014-12-31 | 2014-09-30 | 2014-06-30 | 2014-03-31 | 2013-12-31 | 2013-09-30 | 2013-06-30 | 2013-03-31 | 2012-12-31 | 2012-09-30 | 2012-06-30 | 2012-03-31 | 2011-12-31 | 2011-09-30 | 2011-06-30 | 2011-03-31 | 2010-12-31 | 2010-09-30 | 2010-06-30 | 2010-03-31 | ||
|---|---|---|---|---|---|---|---|---|---|---|---|---|---|---|---|---|---|---|---|---|---|---|---|---|---|---|---|---|---|---|---|---|---|---|---|---|---|---|---|---|---|---|---|---|---|---|---|---|---|---|---|---|---|---|---|---|---|
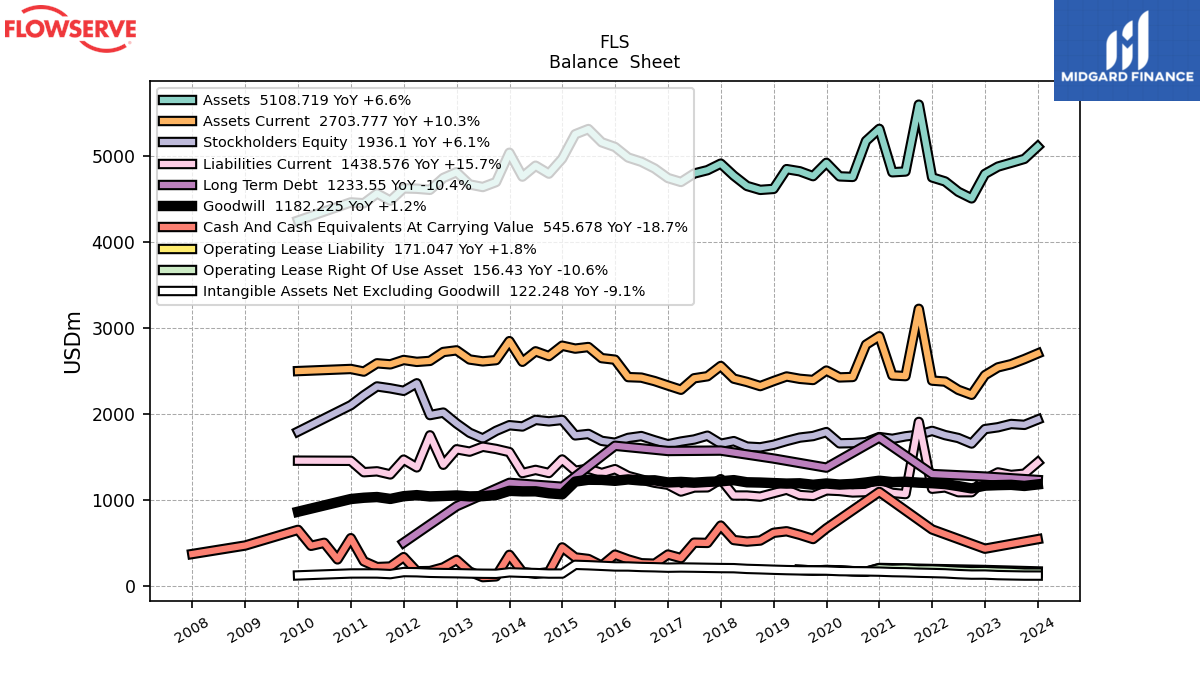
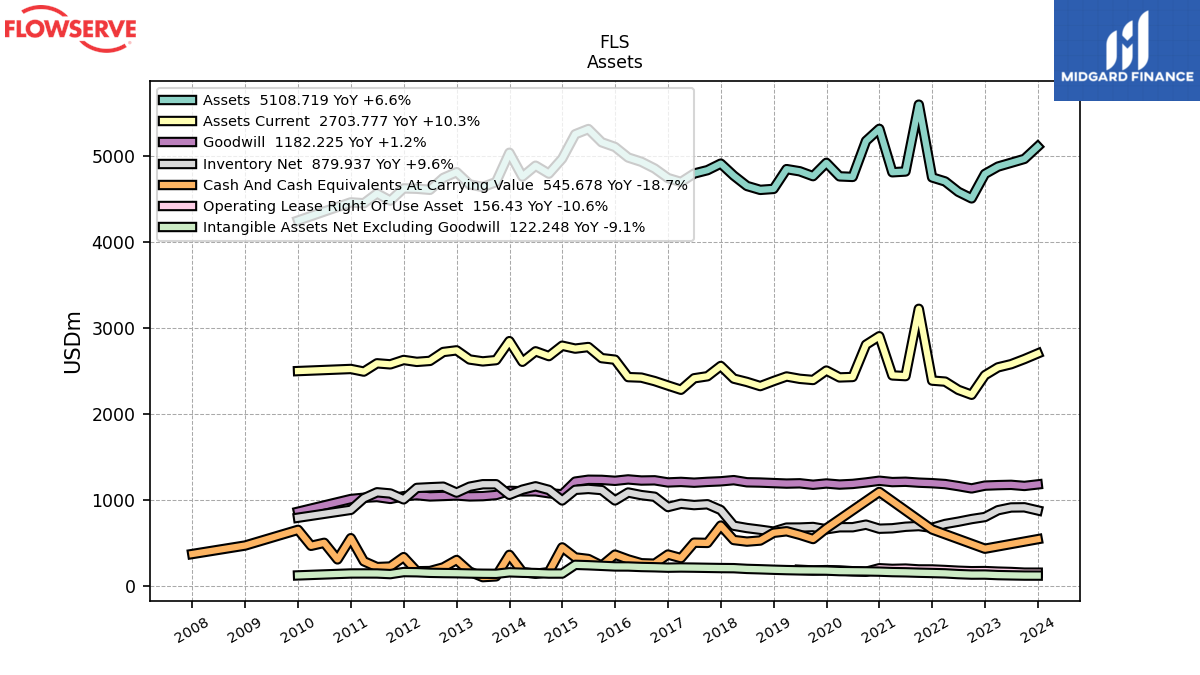
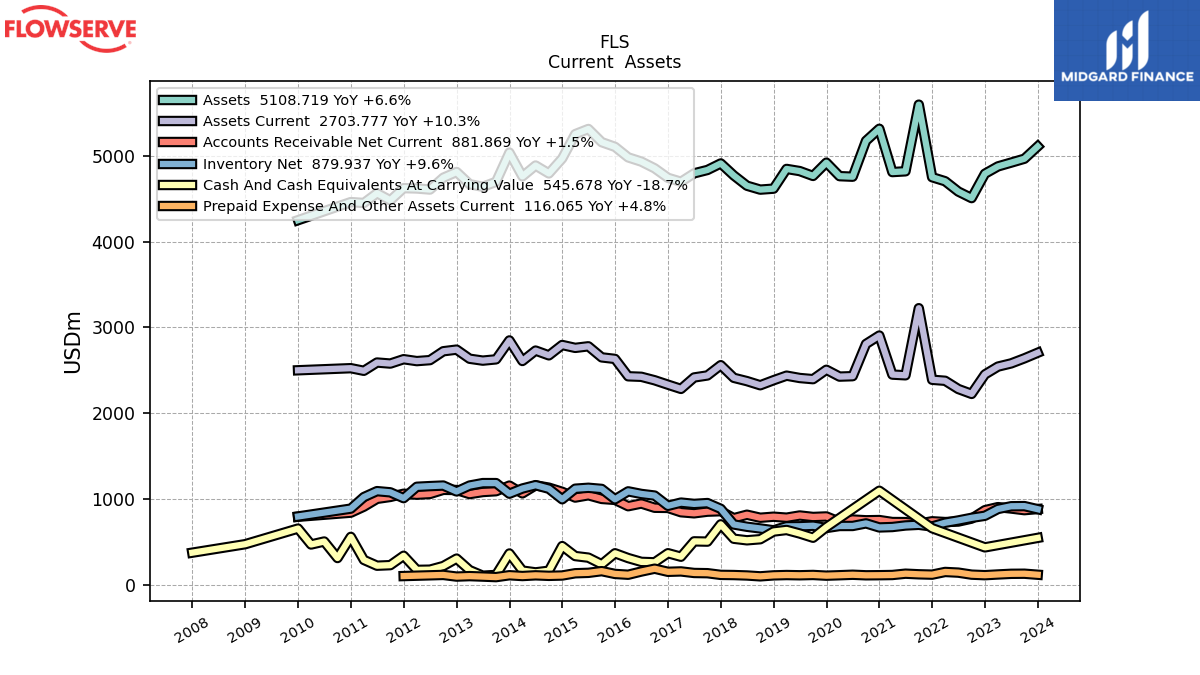
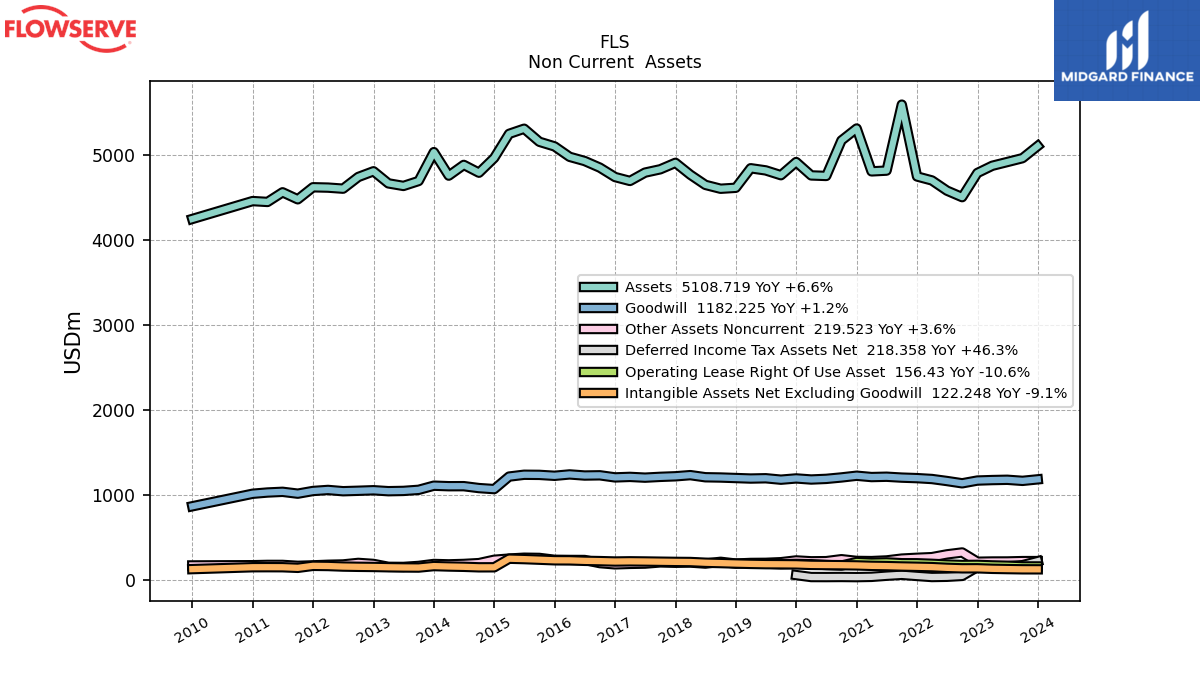
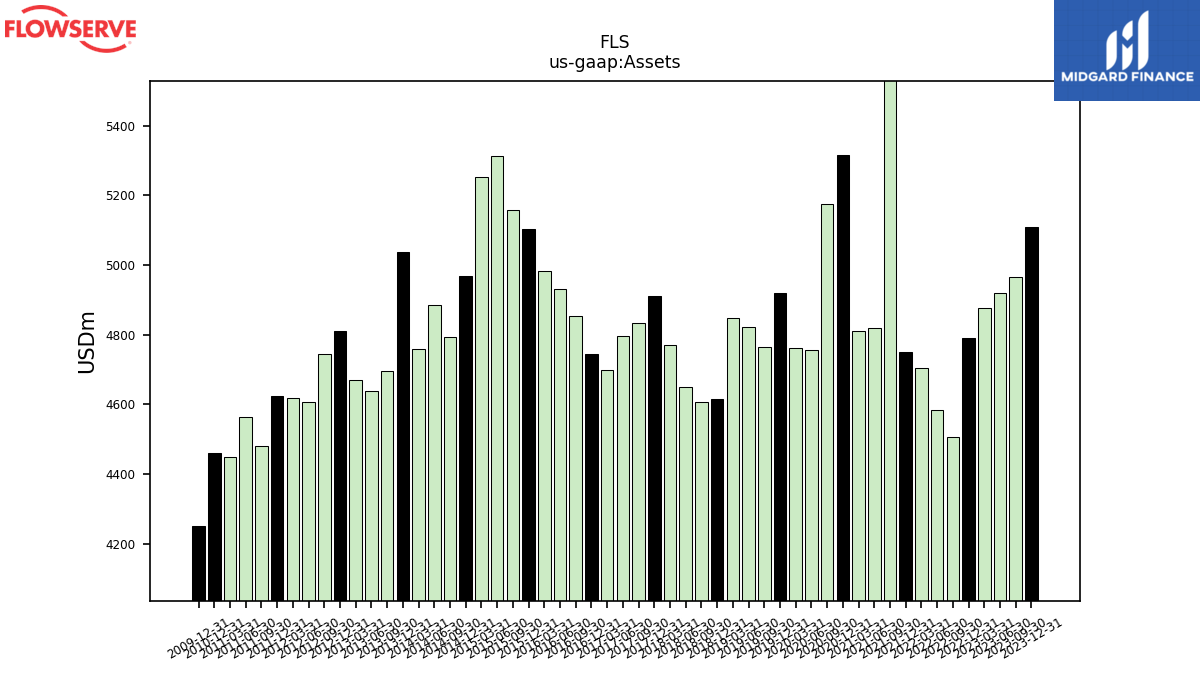
| Assets | 5108.72 | 4965.21 | 4920.02 | 4875.75 | 4790.63 | 4505.99 | 4582.73 | 4703.01 | 4749.77 | 5595.92 | 4818.67 | 4809.64 | 5314.68 | 5173.58 | 4755.70 | 4762.07 | 4919.64 | 4764.49 | 4821.21 | 4846.50 | 4616.28 | 4605.06 | 4650.62 | 4770.32 | 4910.47 | 4834.14 | 4795.11 | 4696.83 | 4742.76 | 4853.60 | 4931.67 | 4981.05 | 5103.85 | 5158.26 | 5312.12 | 5251.68 | 4968.02 | 4793.77 | 4886.11 | 4759.41 | 5036.73 | 4696.19 | 4638.14 | 4668.29 | 4810.96 | 4743.75 | 4605.88 | 4618.41 | 4622.61 | 4480.51 | 4563.28 | 4449.53 | 4459.91 | NA | NA | NA | |
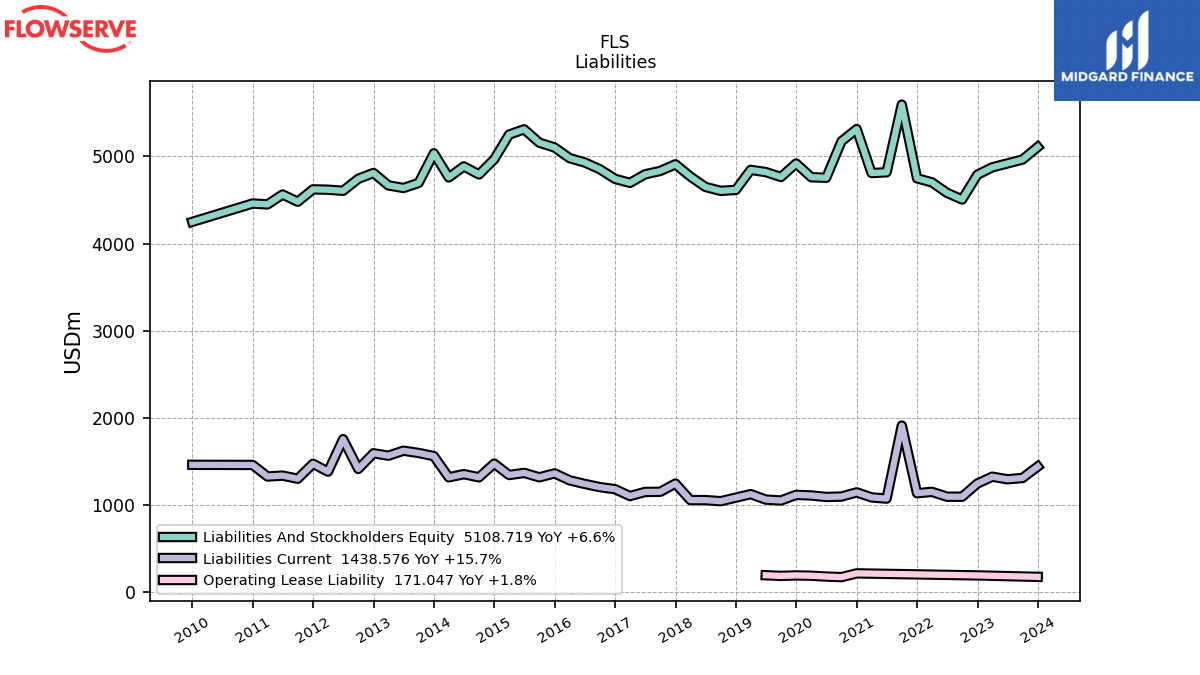
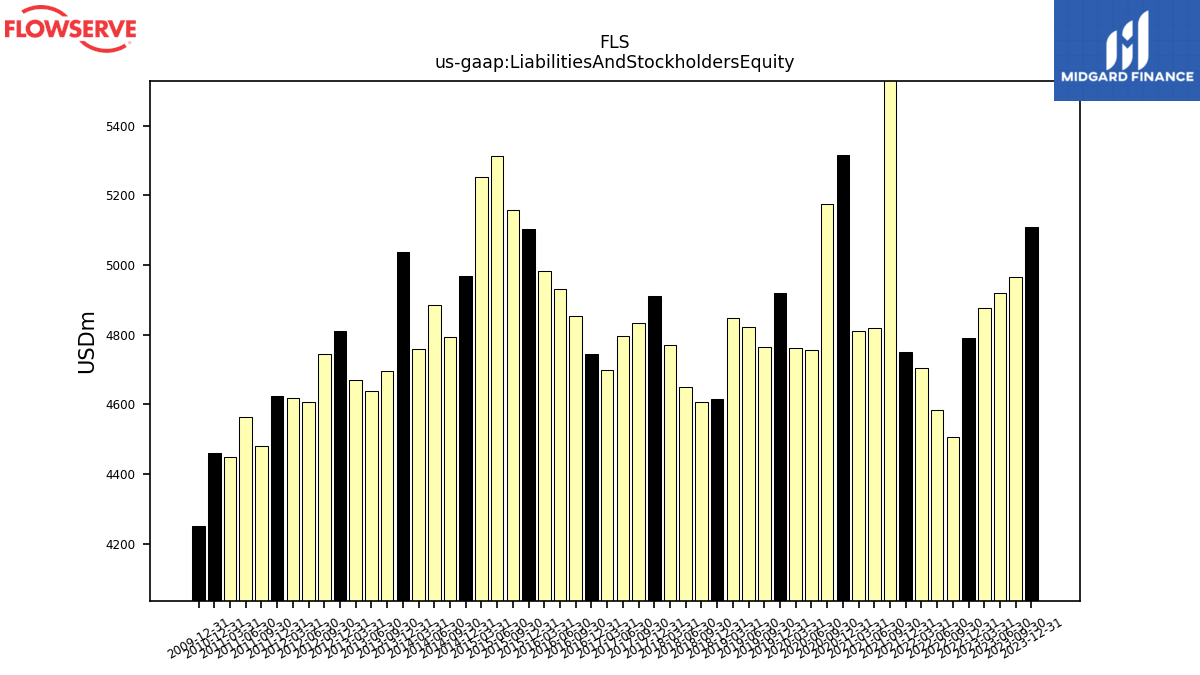
| Liabilities And Stockholders Equity | 5108.72 | 4965.21 | 4920.02 | 4875.75 | 4790.63 | 4505.99 | 4582.73 | 4703.01 | 4749.77 | 5595.92 | 4818.67 | 4809.64 | 5314.68 | 5173.58 | 4755.70 | 4762.07 | 4919.64 | 4764.49 | 4821.21 | 4846.50 | 4616.28 | 4605.06 | 4650.62 | 4770.32 | 4910.47 | 4834.14 | 4795.11 | 4696.83 | 4742.76 | 4853.60 | 4931.67 | 4981.05 | 5103.85 | 5158.26 | 5312.12 | 5251.68 | 4968.02 | 4793.77 | 4886.11 | 4759.41 | 5036.73 | 4696.19 | 4638.14 | 4668.29 | 4810.96 | 4743.75 | 4605.88 | 4618.41 | 4622.61 | 4480.51 | 4563.28 | 4449.53 | 4459.91 | NA | NA | NA | |
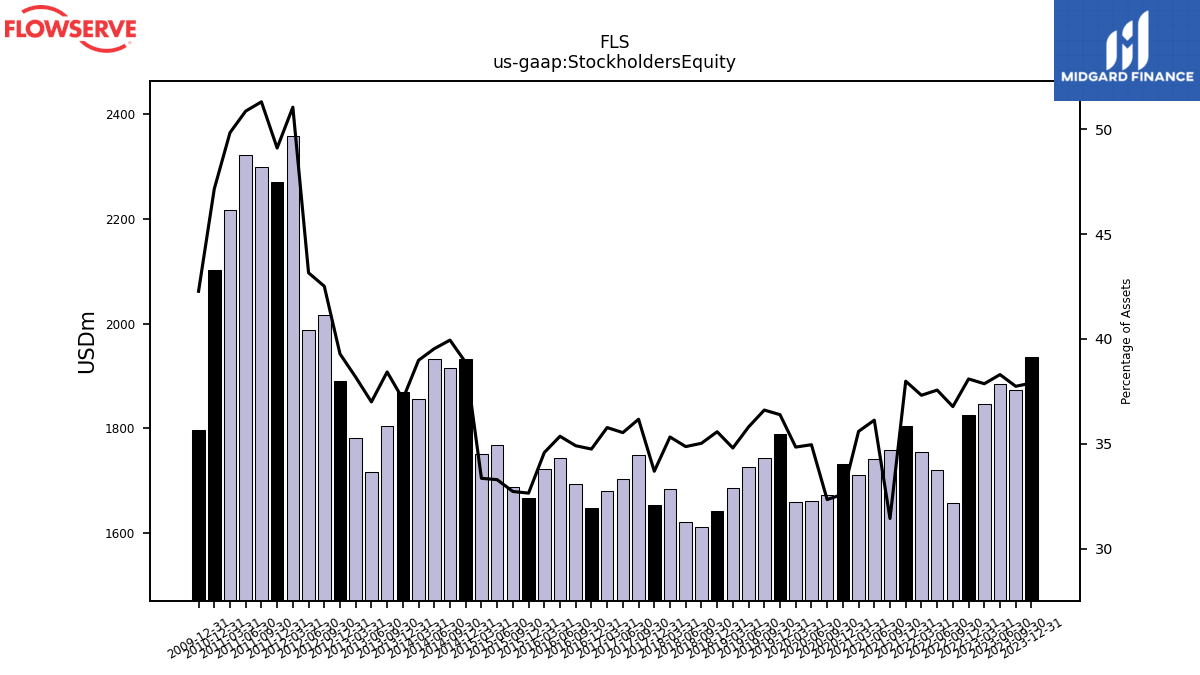
| Stockholders Equity | 1936.10 | 1874.11 | 1884.45 | 1846.32 | 1824.99 | 1657.12 | 1721.40 | 1754.99 | 1804.32 | 1759.50 | 1740.98 | 1712.03 | 1732.47 | 1673.42 | 1662.57 | 1659.43 | 1790.36 | 1744.34 | 1726.31 | 1686.80 | 1642.32 | 1613.04 | 1621.66 | 1685.23 | 1654.59 | 1748.69 | 1703.99 | 1680.37 | 1648.23 | 1694.42 | 1743.98 | 1722.66 | 1666.48 | 1688.32 | 1768.58 | 1751.86 | 1931.56 | 1914.91 | 1931.82 | 1855.49 | 1870.38 | 1804.66 | 1716.13 | 1782.33 | 1890.22 | 2016.81 | 1987.60 | 2357.67 | 2269.81 | 2298.70 | 2321.02 | 2217.41 | 2103.02 | NA | NA | NA |
| 2023-12-31 | 2023-09-30 | 2023-06-30 | 2023-03-31 | 2022-12-31 | 2022-09-30 | 2022-06-30 | 2022-03-31 | 2021-12-31 | 2021-09-30 | 2021-06-30 | 2021-03-31 | 2020-12-31 | 2020-09-30 | 2020-06-30 | 2020-03-31 | 2019-12-31 | 2019-09-30 | 2019-06-30 | 2019-03-31 | 2018-12-31 | 2018-09-30 | 2018-06-30 | 2018-03-31 | 2017-12-31 | 2017-09-30 | 2017-06-30 | 2017-03-31 | 2016-12-31 | 2016-09-30 | 2016-06-30 | 2016-03-31 | 2015-12-31 | 2015-09-30 | 2015-06-30 | 2015-03-31 | 2014-12-31 | 2014-09-30 | 2014-06-30 | 2014-03-31 | 2013-12-31 | 2013-09-30 | 2013-06-30 | 2013-03-31 | 2012-12-31 | 2012-09-30 | 2012-06-30 | 2012-03-31 | 2011-12-31 | 2011-09-30 | 2011-06-30 | 2011-03-31 | 2010-12-31 | 2010-09-30 | 2010-06-30 | 2010-03-31 | ||
|---|---|---|---|---|---|---|---|---|---|---|---|---|---|---|---|---|---|---|---|---|---|---|---|---|---|---|---|---|---|---|---|---|---|---|---|---|---|---|---|---|---|---|---|---|---|---|---|---|---|---|---|---|---|---|---|---|---|
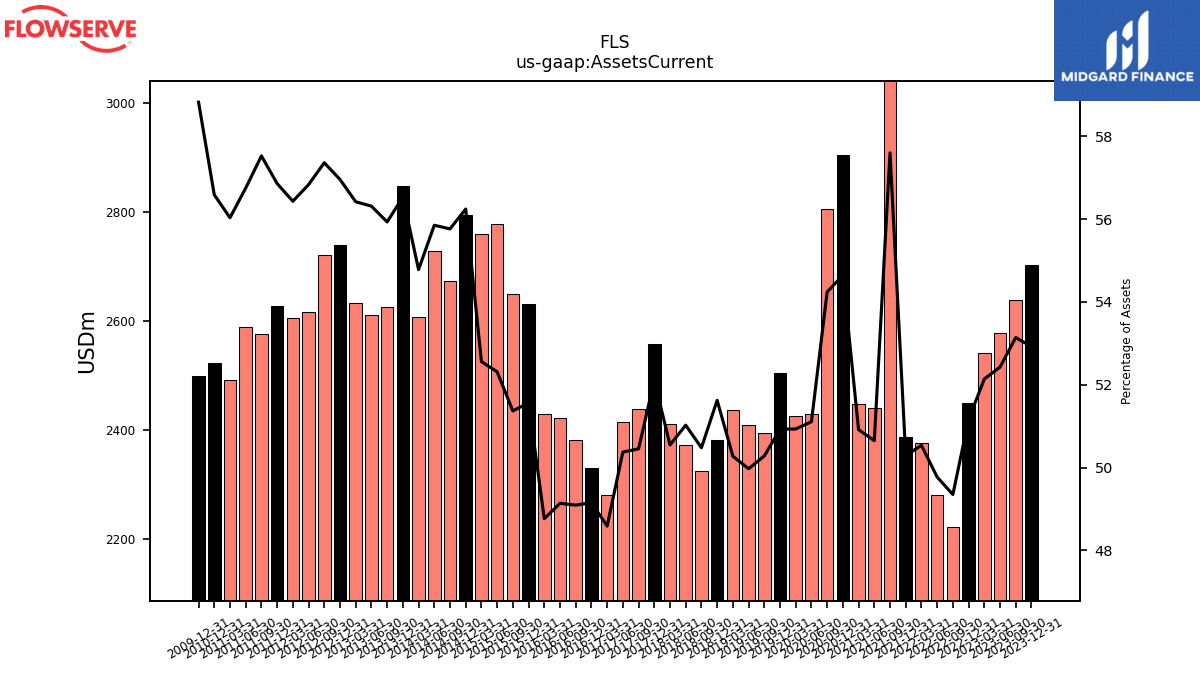
| Assets Current | 2703.78 | 2638.53 | 2579.38 | 2542.24 | 2450.97 | 2223.78 | 2280.93 | 2376.86 | 2388.68 | 3223.22 | 2440.69 | 2448.96 | 2904.33 | 2806.14 | 2430.55 | 2425.51 | 2505.37 | 2395.66 | 2409.32 | 2436.62 | 2383.14 | 2324.67 | 2372.99 | 2411.31 | 2558.74 | 2439.01 | 2415.55 | 2282.13 | 2331.36 | 2382.88 | 2423.36 | 2429.19 | 2631.79 | 2649.73 | 2778.94 | 2760.34 | 2794.16 | 2673.21 | 2728.99 | 2607.27 | 2847.38 | 2626.65 | 2611.87 | 2633.84 | 2740.22 | 2721.07 | 2617.65 | 2606.22 | 2628.35 | 2577.47 | 2589.62 | 2493.22 | 2523.74 | NA | NA | NA | |
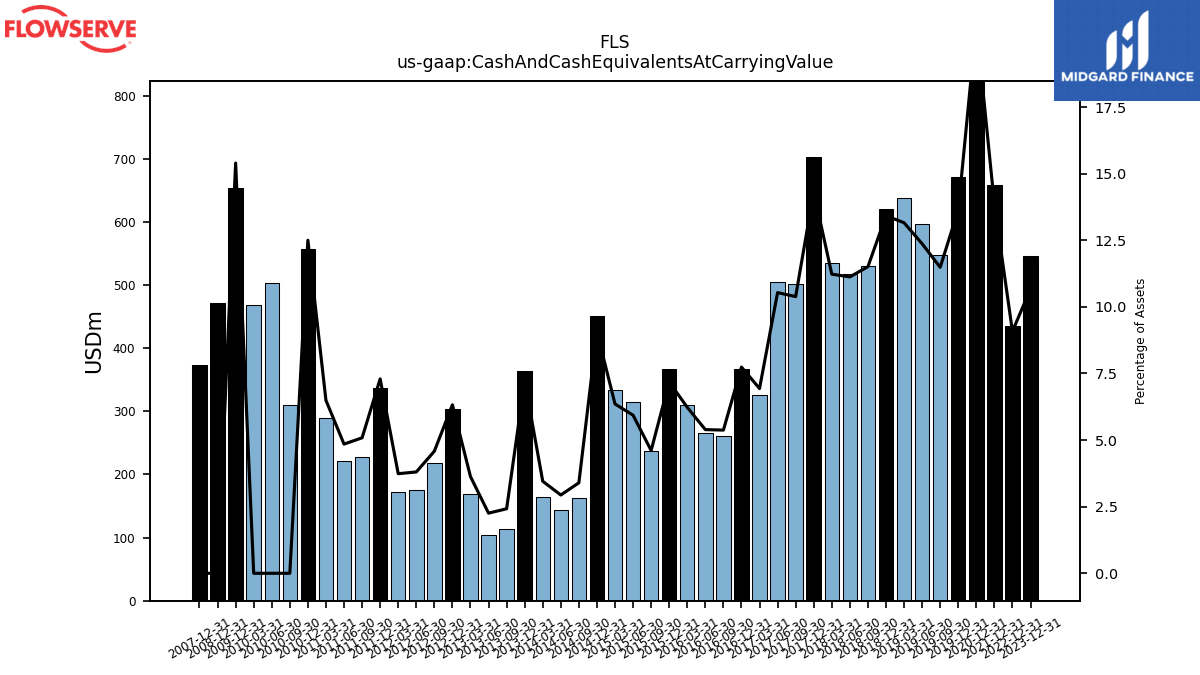
| Cash And Cash Equivalents At Carrying Value | 545.68 | NA | NA | NA | 434.97 | NA | NA | NA | 658.45 | NA | NA | NA | 1095.27 | NA | NA | NA | 670.98 | 547.27 | 596.47 | 637.71 | 619.68 | 529.94 | 517.44 | 535.66 | 703.45 | 502.14 | 505.16 | 325.78 | 367.16 | 260.87 | 266.01 | 310.32 | 366.44 | 237.84 | 315.30 | 333.78 | 450.35 | 162.87 | 143.57 | 164.42 | 363.80 | 113.75 | 104.71 | 169.44 | 304.25 | 217.42 | 175.21 | 172.69 | 337.36 | 227.88 | 221.31 | 288.86 | 557.58 | 310.61 | 503.50 | 468.36 | |
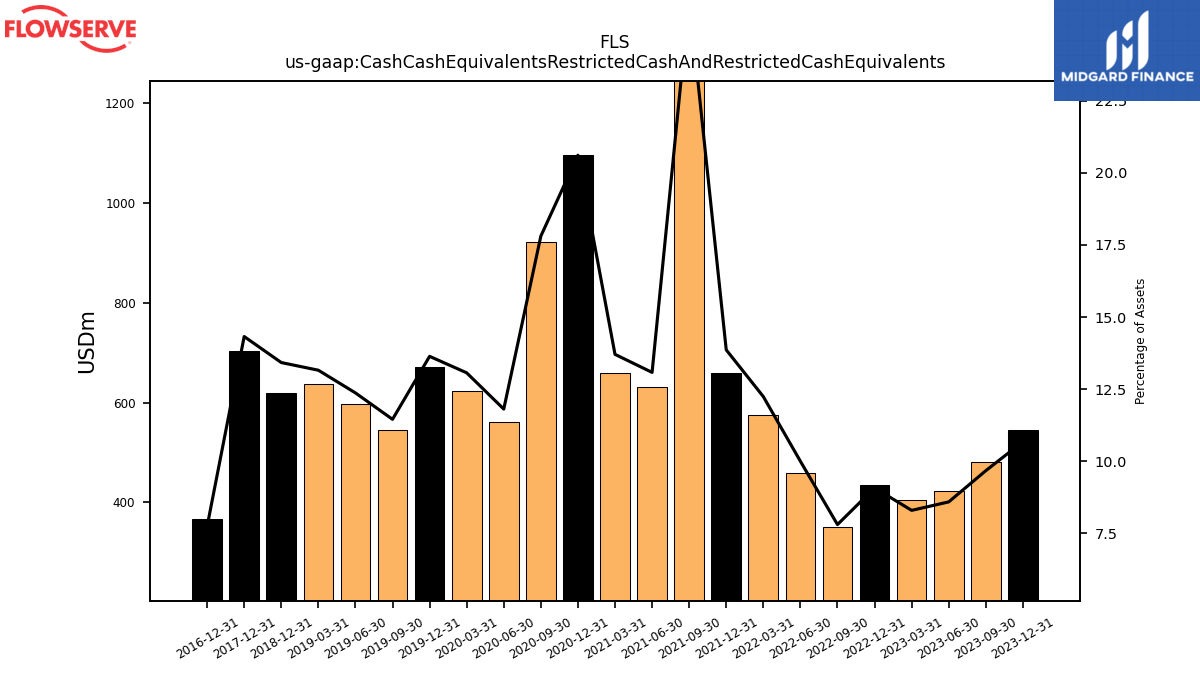
| Cash Cash Equivalents Restricted Cash And Restricted Cash Equivalents | 545.68 | 480.46 | 422.84 | 404.73 | 434.97 | 351.87 | 458.35 | 575.79 | 658.45 | 1457.27 | 630.40 | 659.30 | 1095.27 | 921.18 | 561.71 | 622.30 | 670.98 | 545.85 | 596.47 | 637.71 | 619.68 | NA | NA | NA | 703.45 | NA | NA | NA | 367.16 | NA | NA | NA | NA | NA | NA | NA | NA | NA | NA | NA | NA | NA | NA | NA | NA | NA | NA | NA | NA | NA | NA | NA | NA | NA | NA | NA | |
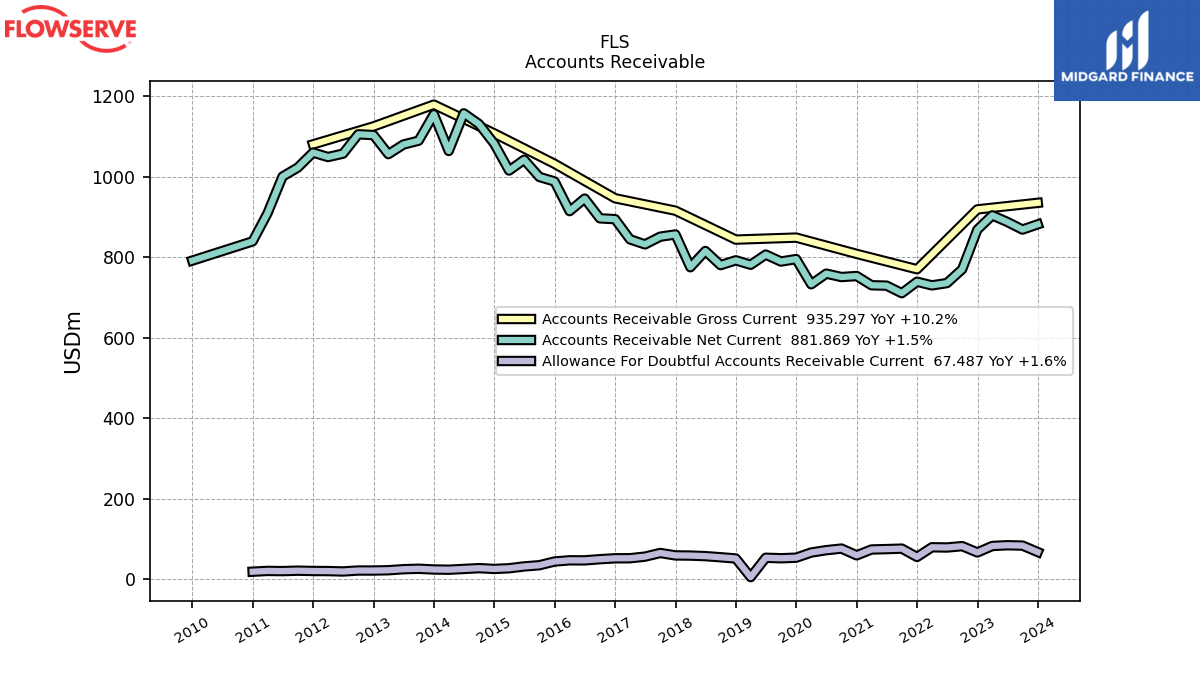
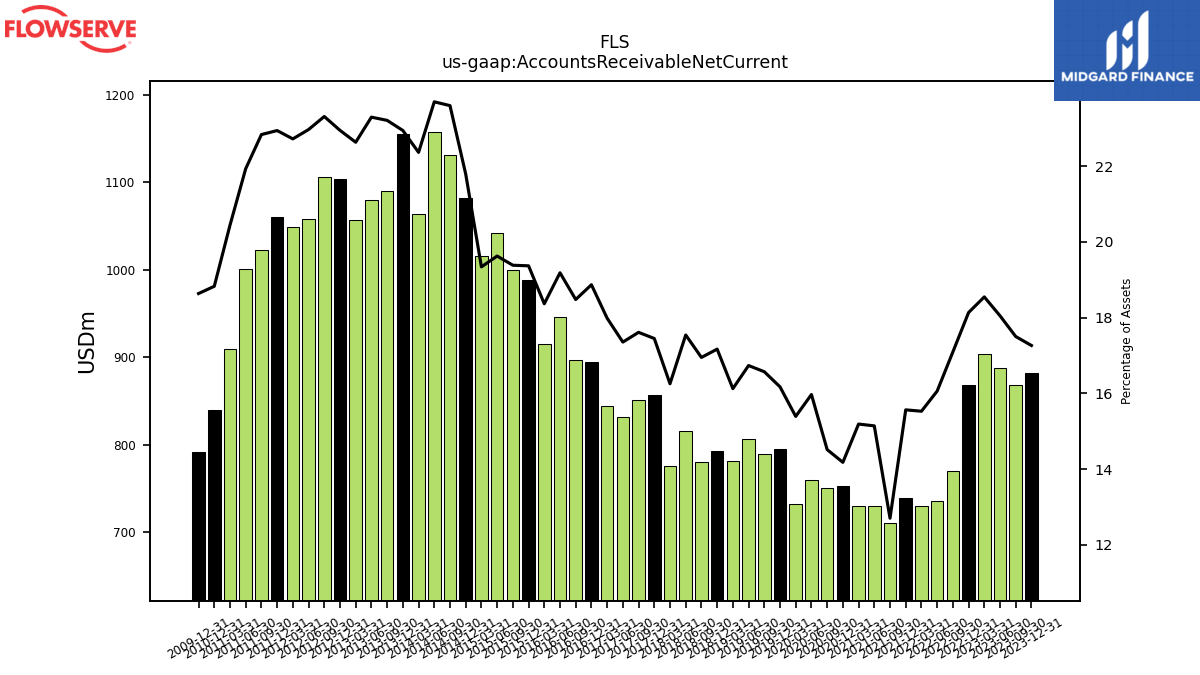
| Accounts Receivable Net Current | 881.87 | 868.86 | 887.87 | 904.18 | 868.63 | 770.15 | 735.89 | 730.20 | 739.21 | 710.78 | 729.55 | 730.48 | 753.46 | 750.90 | 759.38 | 732.88 | 795.54 | 789.45 | 806.72 | 781.38 | 792.43 | 780.41 | 815.71 | 775.24 | 856.71 | 851.25 | 832.04 | 844.60 | 894.75 | 896.75 | 945.97 | 914.68 | 988.39 | 999.70 | 1042.40 | 1015.54 | 1082.45 | 1131.08 | 1157.76 | 1064.22 | 1155.33 | 1089.75 | 1080.24 | 1056.32 | 1103.72 | 1105.64 | 1057.64 | 1049.12 | 1060.25 | 1022.90 | 1000.70 | 909.34 | 839.57 | NA | NA | NA | |
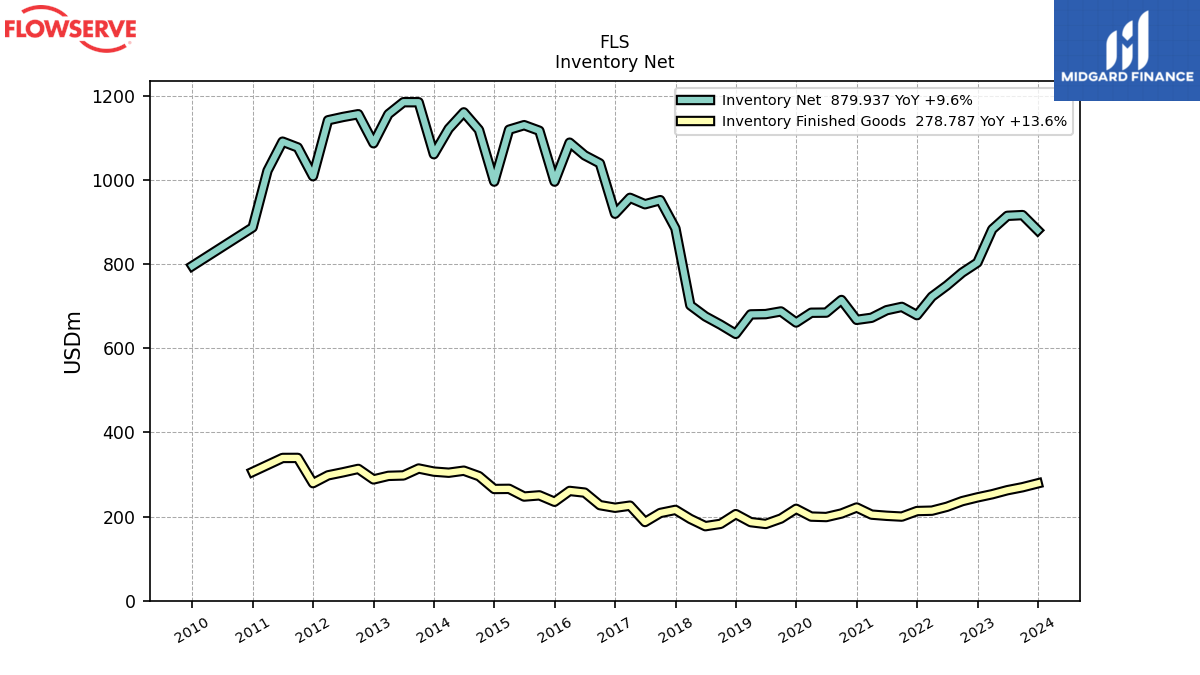
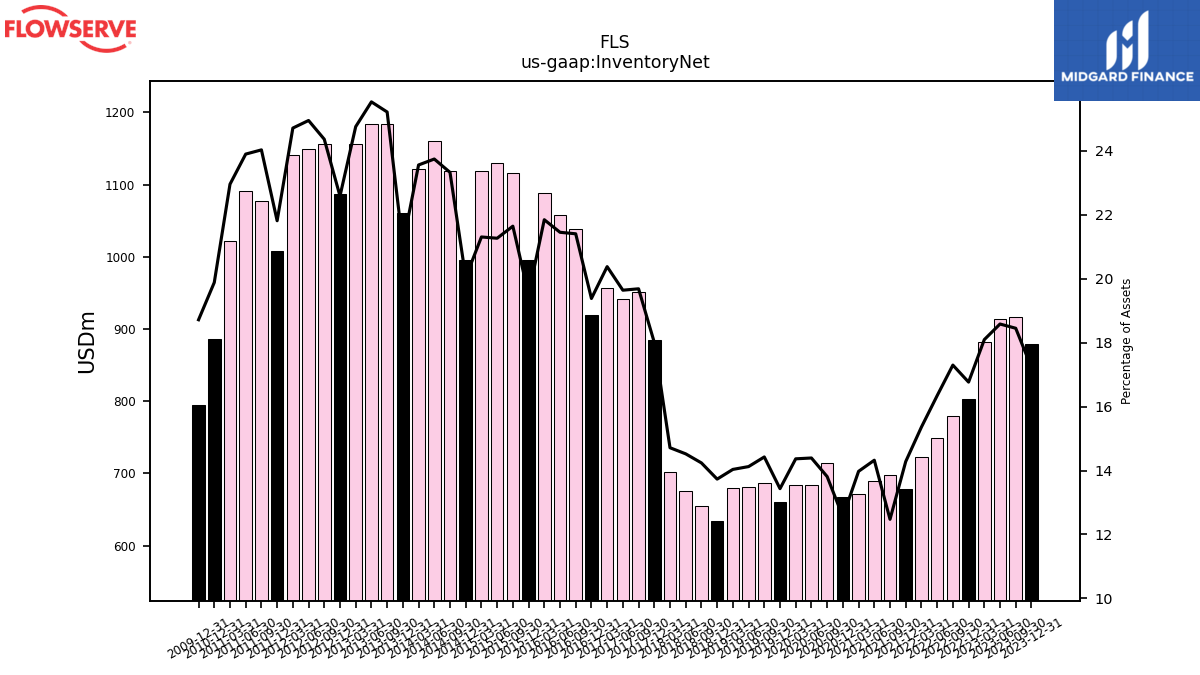
| Inventory Net | 879.94 | 916.11 | 914.29 | 882.25 | 803.20 | 779.45 | 748.92 | 722.38 | 678.29 | 698.05 | 690.14 | 672.12 | 667.23 | 714.49 | 684.43 | 684.11 | 660.84 | 687.24 | 680.90 | 680.19 | 633.87 | 655.65 | 675.33 | 701.85 | 884.27 | 951.60 | 941.82 | 957.12 | 919.25 | 1038.94 | 1057.97 | 1088.15 | 995.57 | 1116.44 | 1129.69 | 1118.94 | 995.56 | 1118.28 | 1160.18 | 1121.25 | 1060.67 | 1184.19 | 1184.24 | 1155.77 | 1086.66 | 1155.72 | 1149.18 | 1141.34 | 1008.38 | 1076.70 | 1090.58 | 1021.44 | 886.73 | NA | NA | NA | |
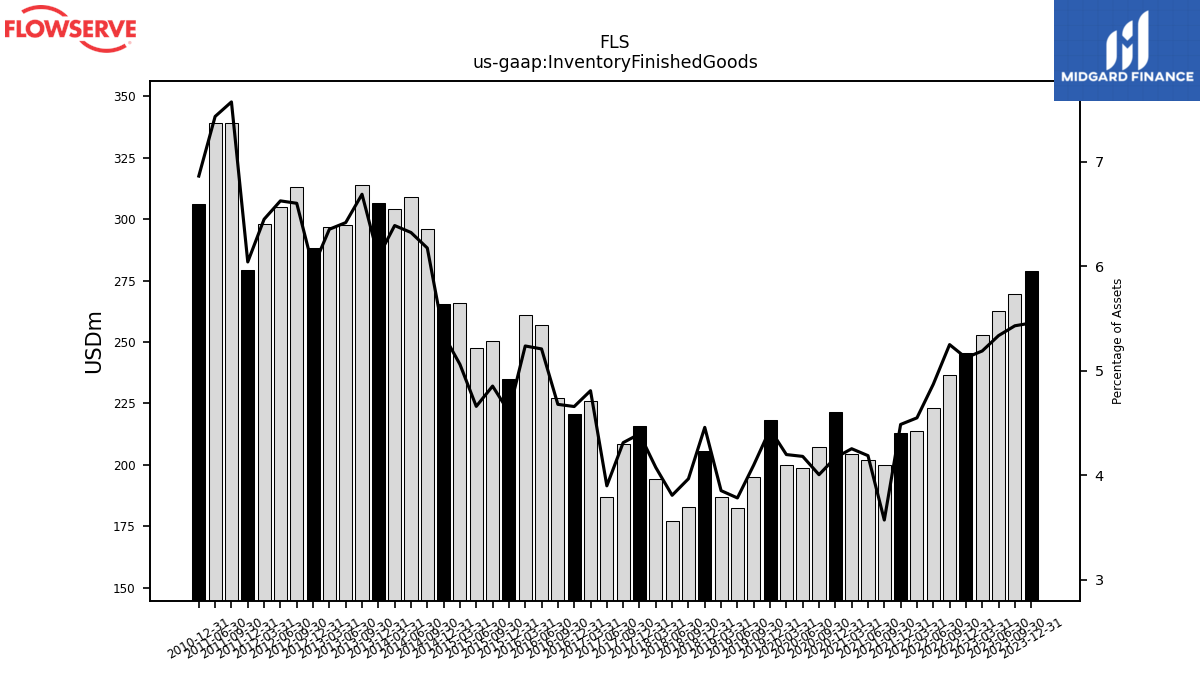
| Inventory Finished Goods | 278.79 | 269.63 | 262.56 | 253.03 | 245.49 | 236.58 | 223.21 | 213.96 | 213.10 | 199.88 | 201.80 | 204.60 | 221.53 | 207.24 | 198.83 | 199.92 | 218.41 | 195.26 | 182.39 | 186.74 | 205.81 | 182.67 | 177.12 | 194.37 | 215.85 | 208.47 | 186.97 | 225.88 | 220.91 | 227.08 | 256.90 | 260.88 | 235.08 | 250.36 | 247.51 | 265.81 | 265.44 | 296.00 | 308.95 | 304.11 | 306.76 | 314.12 | 297.67 | 296.63 | 288.16 | 313.21 | 305.17 | 297.88 | 279.27 | 339.29 | 339.20 | NA | 306.08 | NA | NA | NA | |
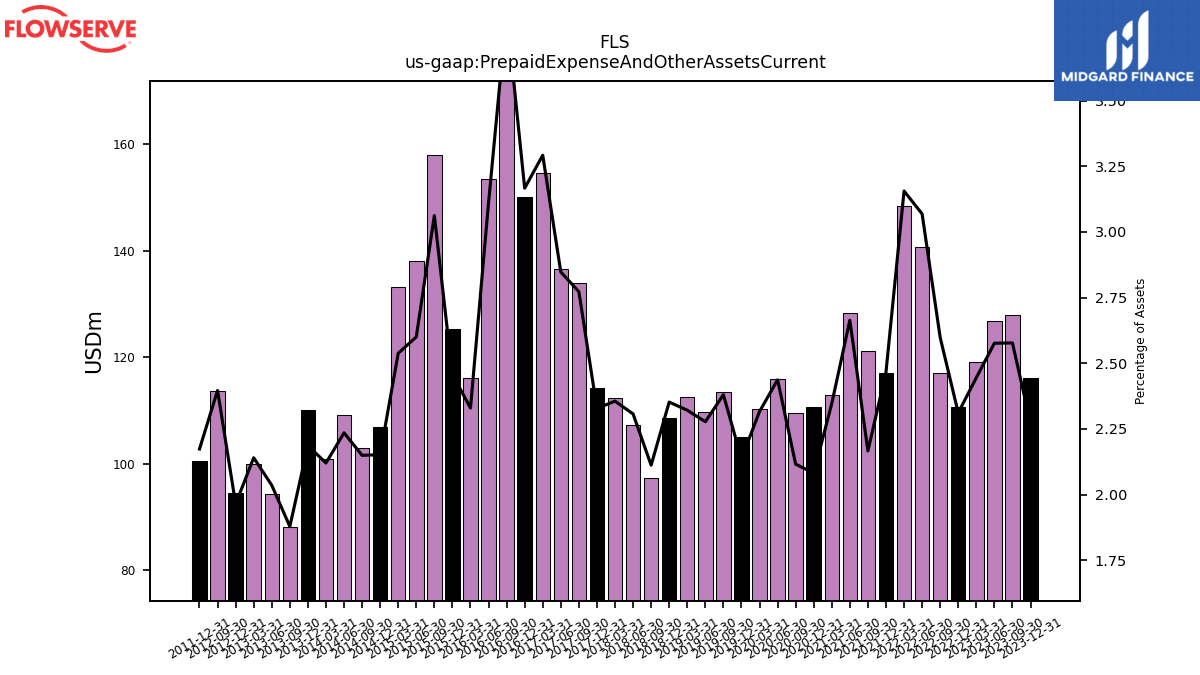
| Prepaid Expense And Other Assets Current | 116.06 | 127.97 | 126.76 | 119.21 | 110.71 | 117.08 | 140.64 | 148.43 | 117.13 | 121.21 | 128.36 | 112.87 | 110.64 | 109.45 | 115.89 | 110.30 | 105.10 | 113.40 | 109.79 | 112.49 | 108.58 | 97.25 | 107.29 | 112.38 | 114.32 | 134.02 | 136.54 | 154.63 | 150.20 | 186.31 | 153.42 | 116.03 | 125.41 | 157.97 | 138.14 | 133.28 | 106.89 | 103.04 | 109.21 | 100.90 | 110.13 | 88.20 | 94.40 | 99.91 | 94.48 | 113.67 | NA | NA | 100.47 | NA | NA | NA | NA | NA | NA | NA |
| 2023-12-31 | 2023-09-30 | 2023-06-30 | 2023-03-31 | 2022-12-31 | 2022-09-30 | 2022-06-30 | 2022-03-31 | 2021-12-31 | 2021-09-30 | 2021-06-30 | 2021-03-31 | 2020-12-31 | 2020-09-30 | 2020-06-30 | 2020-03-31 | 2019-12-31 | 2019-09-30 | 2019-06-30 | 2019-03-31 | 2018-12-31 | 2018-09-30 | 2018-06-30 | 2018-03-31 | 2017-12-31 | 2017-09-30 | 2017-06-30 | 2017-03-31 | 2016-12-31 | 2016-09-30 | 2016-06-30 | 2016-03-31 | 2015-12-31 | 2015-09-30 | 2015-06-30 | 2015-03-31 | 2014-12-31 | 2014-09-30 | 2014-06-30 | 2014-03-31 | 2013-12-31 | 2013-09-30 | 2013-06-30 | 2013-03-31 | 2012-12-31 | 2012-09-30 | 2012-06-30 | 2012-03-31 | 2011-12-31 | 2011-09-30 | 2011-06-30 | 2011-03-31 | 2010-12-31 | 2010-09-30 | 2010-06-30 | 2010-03-31 | ||
|---|---|---|---|---|---|---|---|---|---|---|---|---|---|---|---|---|---|---|---|---|---|---|---|---|---|---|---|---|---|---|---|---|---|---|---|---|---|---|---|---|---|---|---|---|---|---|---|---|---|---|---|---|---|---|---|---|---|
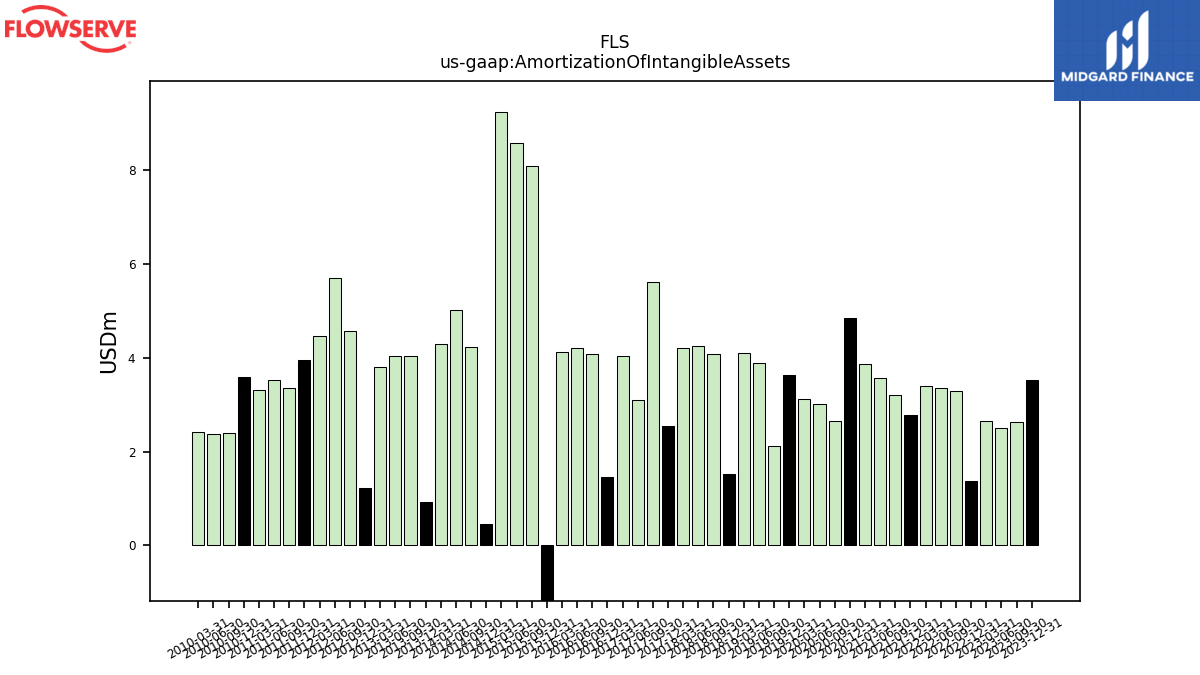
| Amortization Of Intangible Assets | 3.53 | 2.62 | 2.50 | 2.66 | 1.39 | 3.30 | 3.35 | 3.40 | 2.79 | 3.21 | 3.57 | 3.86 | 4.86 | 2.65 | 3.02 | 3.12 | 3.63 | 2.13 | 3.90 | 4.11 | 1.52 | 4.08 | 4.25 | 4.22 | 2.56 | 5.62 | 3.10 | 4.04 | 1.46 | 4.08 | 4.22 | 4.12 | -3.90 | 8.09 | 8.59 | 9.24 | 0.45 | 4.23 | 5.02 | 4.30 | 0.92 | 4.03 | 4.05 | 3.81 | 1.22 | 4.58 | 5.71 | 4.46 | 3.96 | 3.36 | 3.53 | 3.32 | 3.59 | 2.39 | 2.38 | 2.42 | |
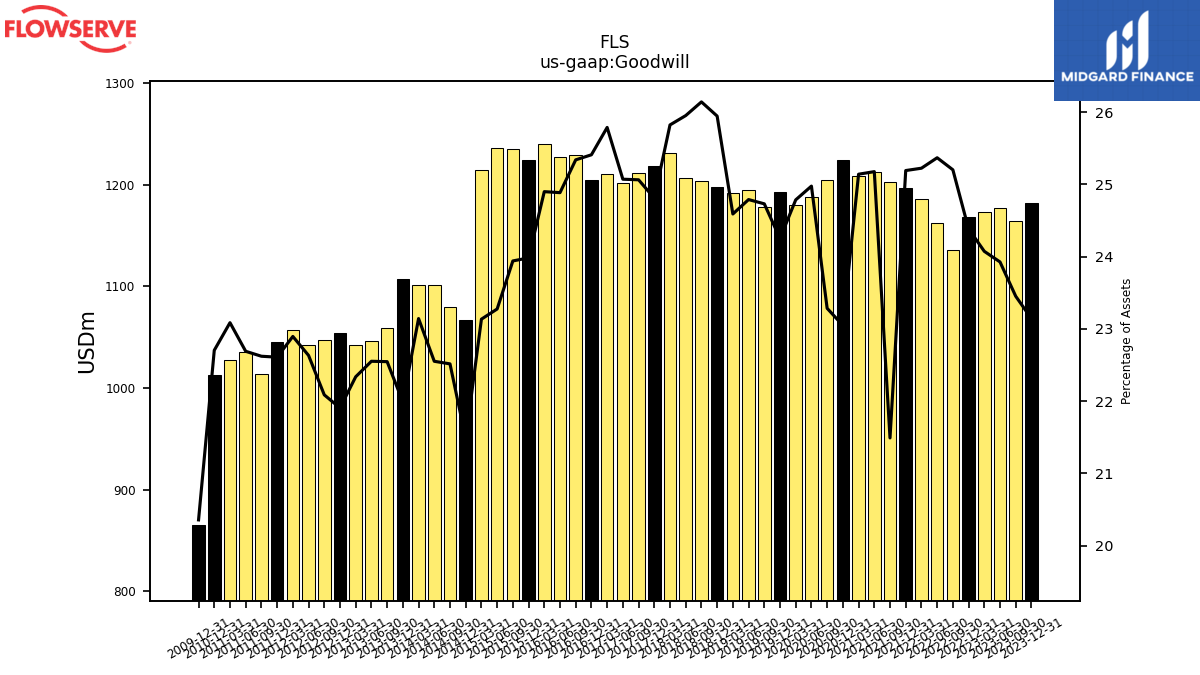
| Goodwill | 1182.22 | 1164.39 | 1177.13 | 1173.72 | 1168.12 | 1135.54 | 1162.51 | 1186.22 | 1196.48 | 1202.60 | 1213.10 | 1209.12 | 1224.89 | 1204.61 | 1187.73 | 1180.26 | 1193.01 | 1178.25 | 1195.12 | 1191.71 | 1197.64 | 1203.77 | 1206.88 | 1231.76 | 1218.19 | 1211.54 | 1202.16 | 1211.15 | 1205.05 | 1229.82 | 1227.22 | 1240.19 | 1223.99 | 1234.86 | 1236.37 | 1214.92 | 1067.26 | 1079.33 | 1101.87 | 1101.43 | 1107.55 | 1058.80 | 1045.96 | 1042.74 | 1053.85 | 1047.73 | 1042.41 | 1057.37 | 1045.08 | 1013.53 | 1035.37 | 1027.18 | 1012.53 | NA | NA | NA | |
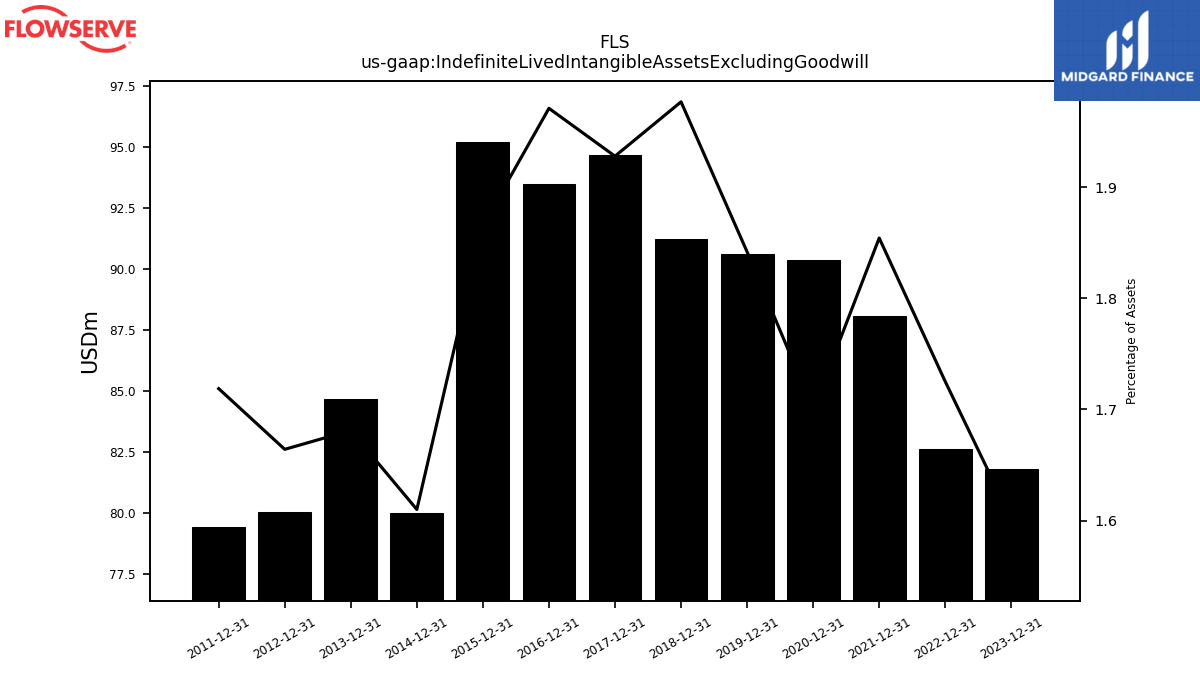
| Indefinite Lived Intangible Assets Excluding Goodwill | 81.82 | NA | NA | NA | 82.64 | NA | NA | NA | 88.07 | NA | NA | NA | 90.36 | NA | NA | NA | 90.61 | NA | NA | NA | 91.25 | NA | NA | NA | 94.67 | NA | NA | NA | 93.47 | NA | NA | NA | 95.22 | NA | NA | NA | 79.98 | NA | NA | NA | 84.67 | NA | NA | NA | 80.06 | NA | NA | NA | 79.45 | NA | NA | NA | NA | NA | NA | NA | |
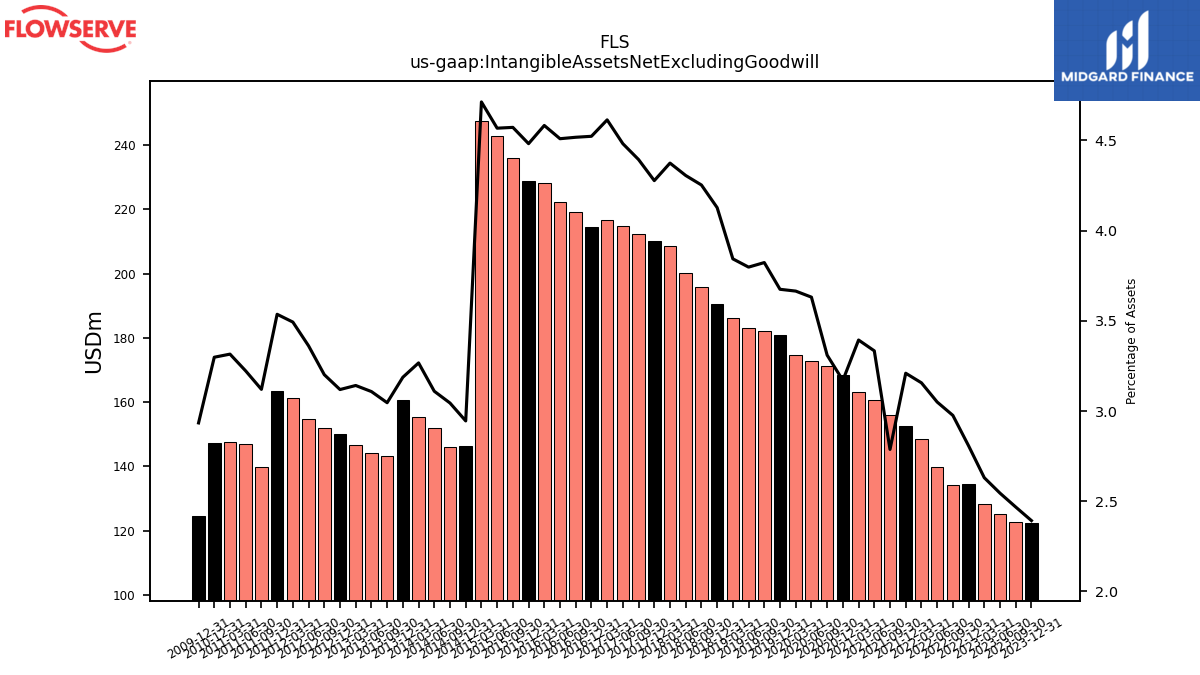
| Intangible Assets Net Excluding Goodwill | 122.25 | 122.55 | 125.22 | 128.26 | 134.50 | 134.10 | 139.79 | 148.46 | 152.46 | 155.99 | 160.65 | 163.24 | 168.50 | 171.25 | 172.71 | 174.54 | 180.81 | 182.16 | 183.11 | 186.29 | 190.55 | 195.86 | 200.25 | 208.69 | 210.05 | 212.43 | 214.93 | 216.72 | 214.53 | 219.28 | 222.41 | 228.29 | 228.78 | 235.87 | 242.67 | 247.55 | 146.34 | 145.96 | 151.96 | 155.50 | 160.55 | 143.07 | 144.16 | 146.68 | 150.07 | 151.89 | 154.84 | 161.34 | 163.48 | 139.81 | 147.06 | 147.53 | 147.11 | NA | NA | NA | |
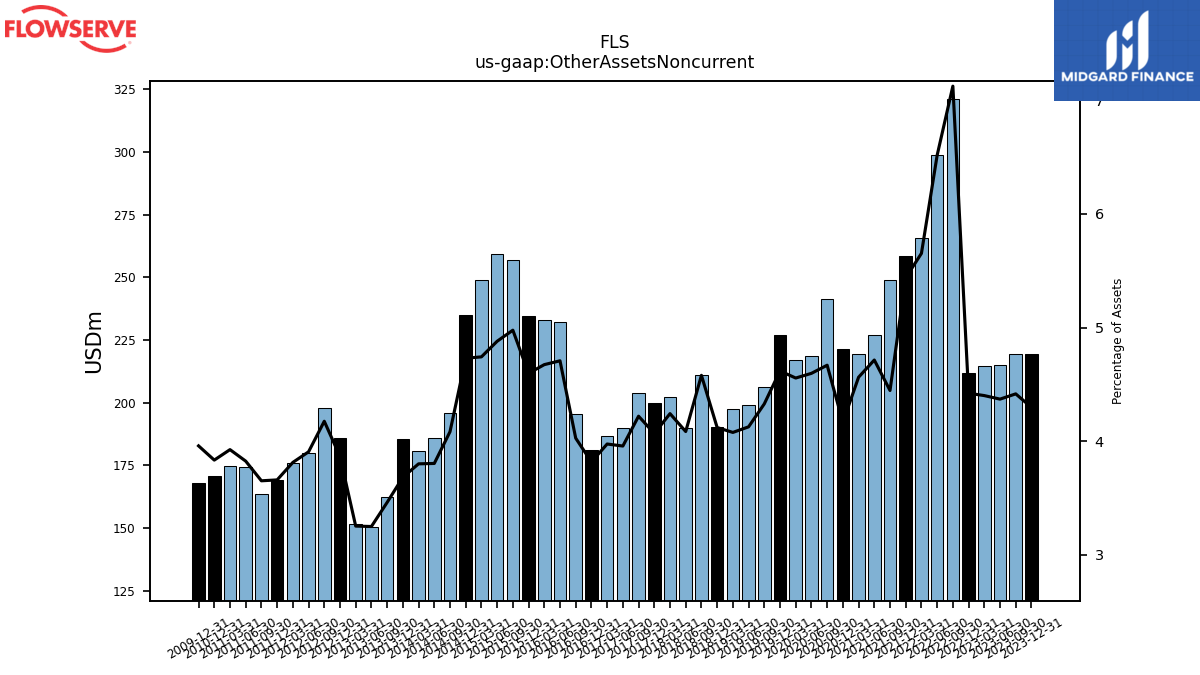
| Other Assets Noncurrent | 219.52 | 219.26 | 214.98 | 214.57 | 211.82 | 321.06 | 298.65 | 265.85 | 258.31 | 248.78 | 227.15 | 219.43 | 221.43 | 241.51 | 218.60 | 216.92 | 227.19 | 206.19 | 198.90 | 197.56 | 190.16 | 210.87 | 189.95 | 202.35 | 199.72 | 203.97 | 189.72 | 186.67 | 181.01 | 195.40 | 232.14 | 232.78 | 234.60 | 256.70 | 259.19 | 249.02 | 234.97 | 195.71 | 185.83 | 180.85 | 185.43 | 162.50 | 150.65 | 151.79 | 185.93 | 198.04 | 179.89 | 176.07 | 169.11 | 163.56 | 174.48 | 174.64 | 170.94 | NA | NA | NA |
| 2023-12-31 | 2023-09-30 | 2023-06-30 | 2023-03-31 | 2022-12-31 | 2022-09-30 | 2022-06-30 | 2022-03-31 | 2021-12-31 | 2021-09-30 | 2021-06-30 | 2021-03-31 | 2020-12-31 | 2020-09-30 | 2020-06-30 | 2020-03-31 | 2019-12-31 | 2019-09-30 | 2019-06-30 | 2019-03-31 | 2018-12-31 | 2018-09-30 | 2018-06-30 | 2018-03-31 | 2017-12-31 | 2017-09-30 | 2017-06-30 | 2017-03-31 | 2016-12-31 | 2016-09-30 | 2016-06-30 | 2016-03-31 | 2015-12-31 | 2015-09-30 | 2015-06-30 | 2015-03-31 | 2014-12-31 | 2014-09-30 | 2014-06-30 | 2014-03-31 | 2013-12-31 | 2013-09-30 | 2013-06-30 | 2013-03-31 | 2012-12-31 | 2012-09-30 | 2012-06-30 | 2012-03-31 | 2011-12-31 | 2011-09-30 | 2011-06-30 | 2011-03-31 | 2010-12-31 | 2010-09-30 | 2010-06-30 | 2010-03-31 | ||
|---|---|---|---|---|---|---|---|---|---|---|---|---|---|---|---|---|---|---|---|---|---|---|---|---|---|---|---|---|---|---|---|---|---|---|---|---|---|---|---|---|---|---|---|---|---|---|---|---|---|---|---|---|---|---|---|---|---|
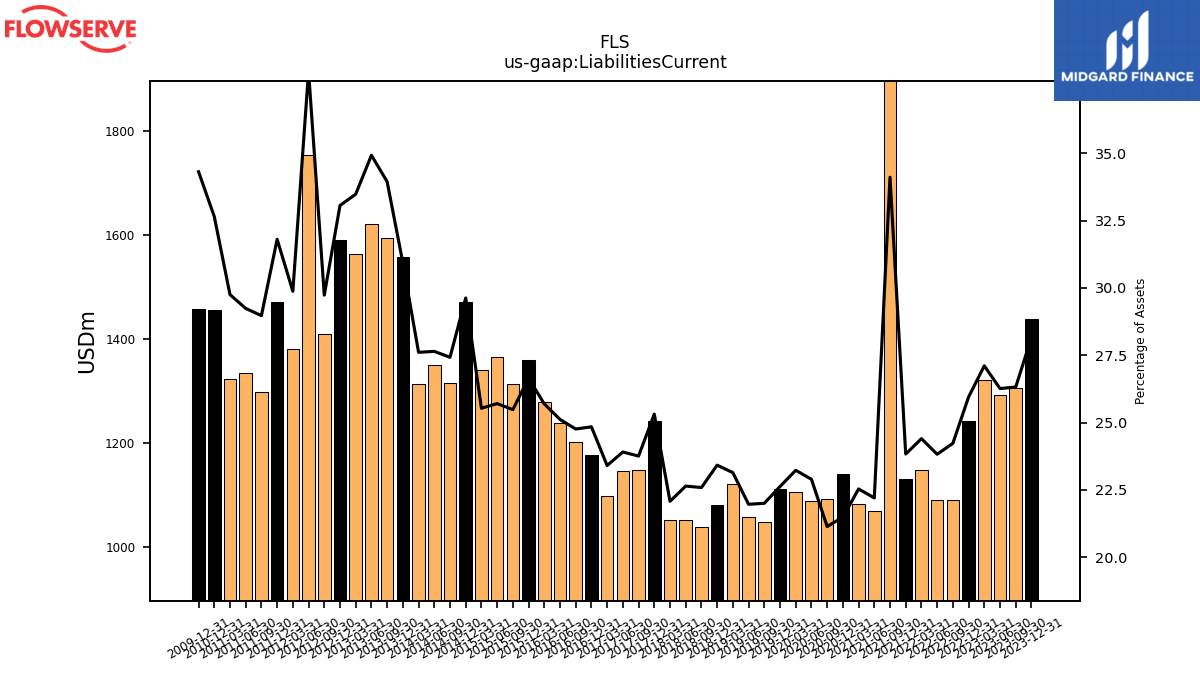
| Liabilities Current | 1438.58 | 1306.82 | 1292.09 | 1321.72 | 1243.15 | 1091.69 | 1091.72 | 1147.61 | 1131.81 | 1908.88 | 1069.72 | 1083.73 | 1141.63 | 1093.58 | 1088.74 | 1106.03 | 1112.89 | 1048.20 | 1058.87 | 1121.43 | 1080.97 | 1040.08 | 1052.86 | 1052.96 | 1242.91 | 1148.32 | 1146.32 | 1099.22 | 1178.14 | 1201.74 | 1238.60 | 1279.80 | 1359.96 | 1314.28 | 1365.42 | 1340.77 | 1471.88 | 1314.61 | 1350.72 | 1314.01 | 1558.10 | 1594.25 | 1620.09 | 1563.13 | 1590.62 | 1410.44 | 1752.59 | 1379.82 | 1470.32 | 1298.07 | 1334.29 | 1323.89 | 1456.38 | NA | NA | NA | |
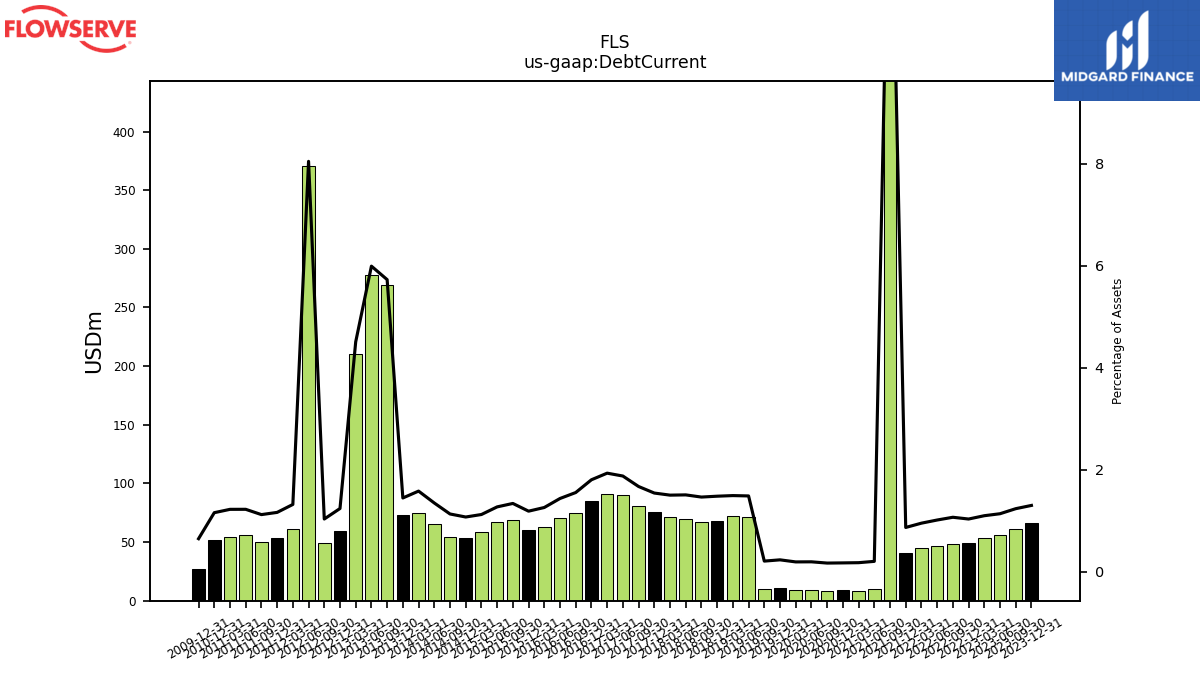
| Debt Current | 66.24 | 61.21 | 55.78 | 53.39 | 49.34 | 47.96 | 46.31 | 44.62 | 41.06 | 836.62 | 9.60 | 8.34 | 8.99 | 8.58 | 9.06 | 8.98 | 11.27 | 9.74 | 71.50 | 72.20 | 68.22 | 67.27 | 69.92 | 71.48 | 75.60 | 80.64 | 89.84 | 90.63 | 85.36 | 75.21 | 70.66 | 62.57 | 60.43 | 68.89 | 67.36 | 58.74 | 53.13 | 54.12 | 65.70 | 75.09 | 72.68 | 268.93 | 277.87 | 210.37 | 59.48 | 48.86 | 370.63 | 60.77 | 53.62 | 50.03 | 55.70 | 54.28 | 51.48 | NA | NA | NA | |
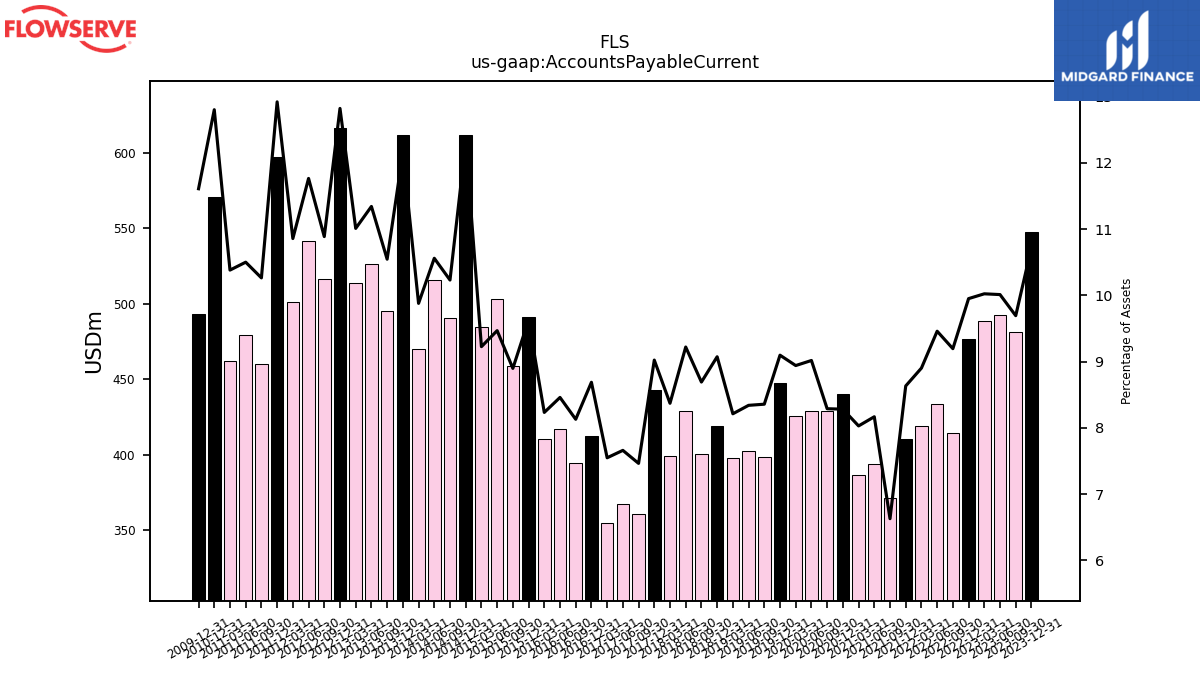
| Accounts Payable Current | 547.82 | 481.34 | 492.62 | 488.76 | 476.75 | 414.37 | 433.51 | 418.72 | 410.06 | 370.98 | 393.61 | 386.21 | 440.20 | 428.87 | 428.86 | 425.80 | 447.58 | 398.21 | 402.12 | 398.05 | 418.89 | 400.28 | 428.83 | 399.36 | 443.11 | 360.84 | 367.35 | 354.57 | 412.09 | 394.60 | 417.22 | 410.12 | 491.38 | 459.01 | 502.97 | 484.54 | 611.72 | 490.51 | 516.02 | 470.22 | 612.09 | 495.30 | 526.12 | 514.07 | 616.90 | 516.50 | 541.92 | 501.50 | 597.34 | 459.90 | 479.22 | 461.97 | 571.02 | NA | NA | NA | |
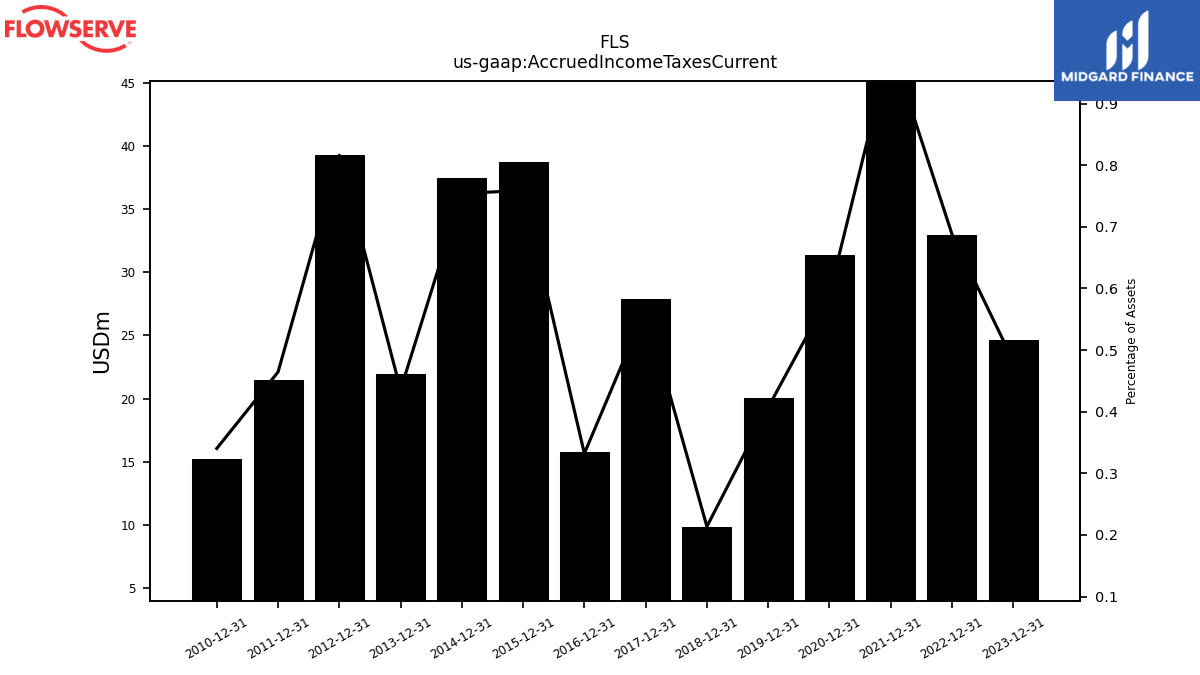
| Accrued Income Taxes Current | 24.64 | NA | NA | NA | 32.97 | NA | NA | NA | 47.19 | NA | NA | NA | 31.38 | NA | NA | NA | 20.02 | NA | NA | NA | 9.87 | NA | NA | NA | 27.86 | NA | NA | NA | 15.76 | NA | NA | NA | 38.75 | NA | NA | NA | 37.45 | NA | NA | NA | 21.94 | NA | NA | NA | 39.26 | NA | NA | NA | 21.47 | NA | NA | NA | 15.18 | NA | NA | NA | |
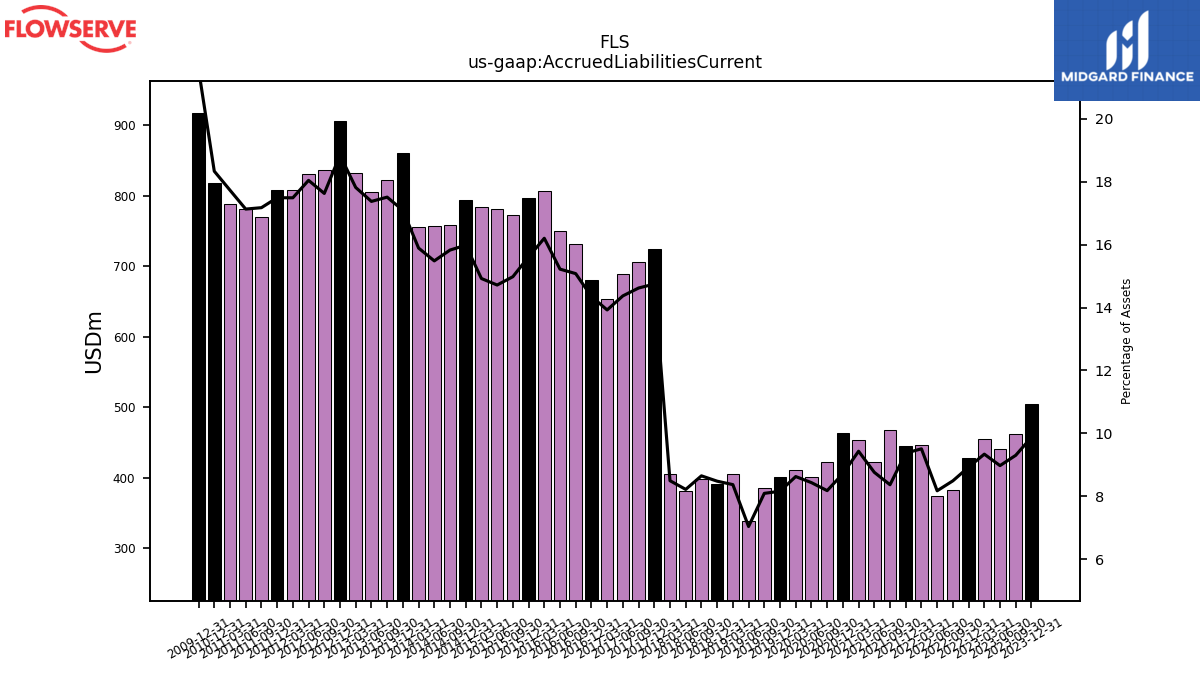
| Accrued Liabilities Current | 504.43 | 461.84 | 441.52 | 455.31 | 427.58 | 382.54 | 374.57 | 447.18 | 445.09 | 468.15 | 422.16 | 453.60 | 463.22 | 423.12 | 401.04 | 410.78 | 401.38 | 385.52 | 339.30 | 405.63 | 391.41 | 398.29 | 382.16 | 405.21 | 724.20 | 706.84 | 689.14 | 654.02 | 680.69 | 731.93 | 750.73 | 807.12 | 796.76 | 772.79 | 781.81 | 783.76 | 794.07 | 758.80 | 756.60 | 756.42 | 861.01 | 822.41 | 805.93 | 831.89 | 906.59 | 836.33 | 831.18 | 807.83 | 808.60 | 769.62 | 781.80 | 789.04 | 817.84 | NA | NA | NA | |
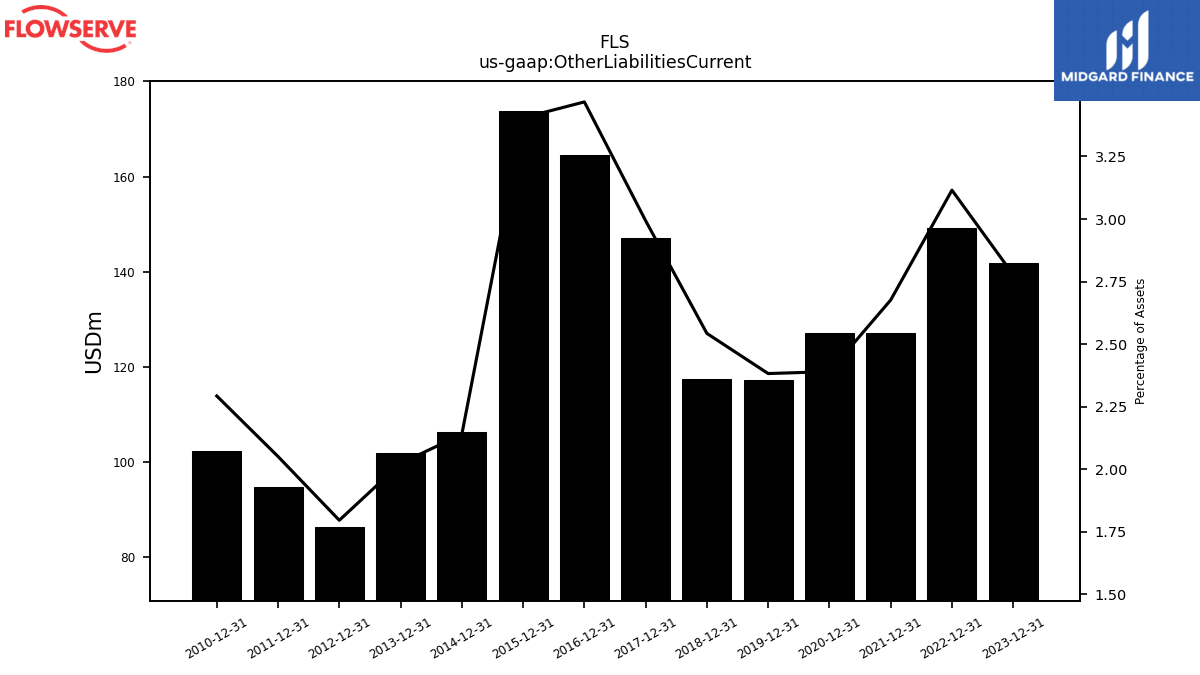
| Other Liabilities Current | 141.90 | NA | NA | NA | 149.24 | NA | NA | NA | 127.12 | NA | NA | NA | 127.04 | NA | NA | NA | 117.22 | NA | NA | NA | 117.39 | NA | NA | NA | 146.98 | NA | NA | NA | 164.48 | NA | NA | NA | 173.76 | NA | NA | NA | 106.30 | NA | NA | NA | 101.93 | NA | NA | NA | 86.42 | NA | NA | NA | 94.81 | NA | NA | NA | 102.26 | NA | NA | NA | |
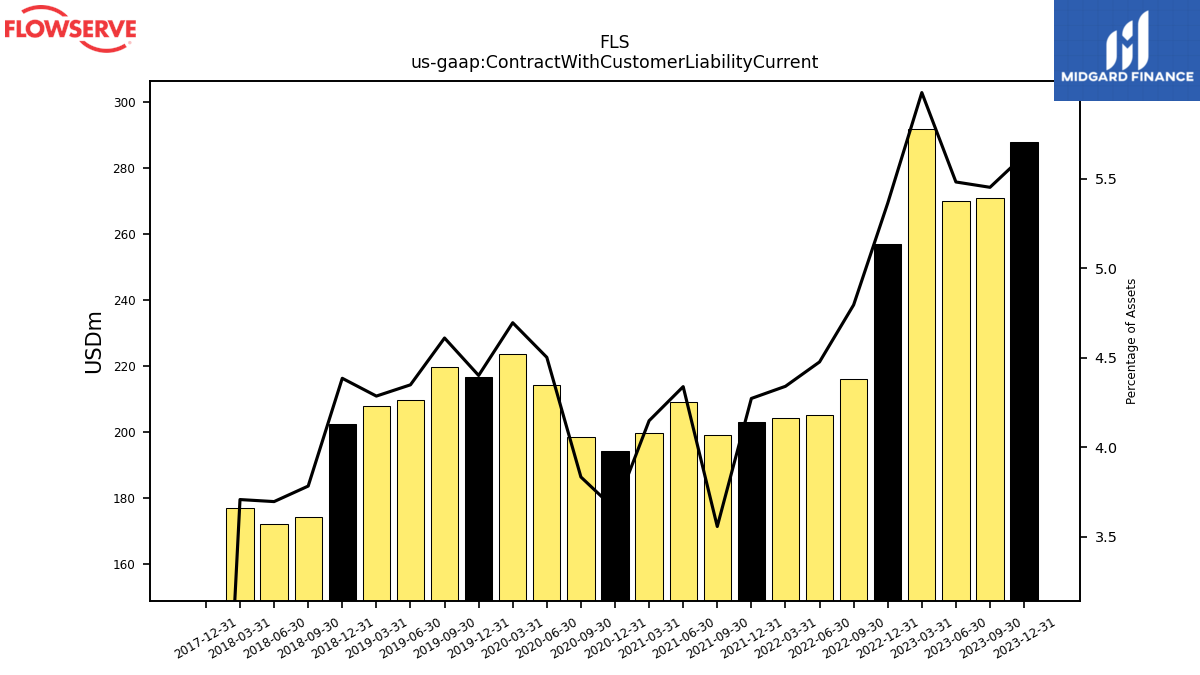
| Contract With Customer Liability Current | 287.70 | 270.73 | 269.73 | 291.64 | 256.96 | 216.09 | 205.18 | 204.16 | 202.97 | 199.10 | 209.09 | 199.54 | 194.23 | 198.38 | 214.13 | 223.63 | 216.54 | 219.68 | 209.69 | 207.74 | 202.46 | 174.25 | 171.94 | 176.91 | 0.00 | NA | NA | NA | NA | NA | NA | NA | NA | NA | NA | NA | NA | NA | NA | NA | NA | NA | NA | NA | NA | NA | NA | NA | NA | NA | NA | NA | NA | NA | NA | NA |
| 2023-12-31 | 2023-09-30 | 2023-06-30 | 2023-03-31 | 2022-12-31 | 2022-09-30 | 2022-06-30 | 2022-03-31 | 2021-12-31 | 2021-09-30 | 2021-06-30 | 2021-03-31 | 2020-12-31 | 2020-09-30 | 2020-06-30 | 2020-03-31 | 2019-12-31 | 2019-09-30 | 2019-06-30 | 2019-03-31 | 2018-12-31 | 2018-09-30 | 2018-06-30 | 2018-03-31 | 2017-12-31 | 2017-09-30 | 2017-06-30 | 2017-03-31 | 2016-12-31 | 2016-09-30 | 2016-06-30 | 2016-03-31 | 2015-12-31 | 2015-09-30 | 2015-06-30 | 2015-03-31 | 2014-12-31 | 2014-09-30 | 2014-06-30 | 2014-03-31 | 2013-12-31 | 2013-09-30 | 2013-06-30 | 2013-03-31 | 2012-12-31 | 2012-09-30 | 2012-06-30 | 2012-03-31 | 2011-12-31 | 2011-09-30 | 2011-06-30 | 2011-03-31 | 2010-12-31 | 2010-09-30 | 2010-06-30 | 2010-03-31 | ||
|---|---|---|---|---|---|---|---|---|---|---|---|---|---|---|---|---|---|---|---|---|---|---|---|---|---|---|---|---|---|---|---|---|---|---|---|---|---|---|---|---|---|---|---|---|---|---|---|---|---|---|---|---|---|---|---|---|---|
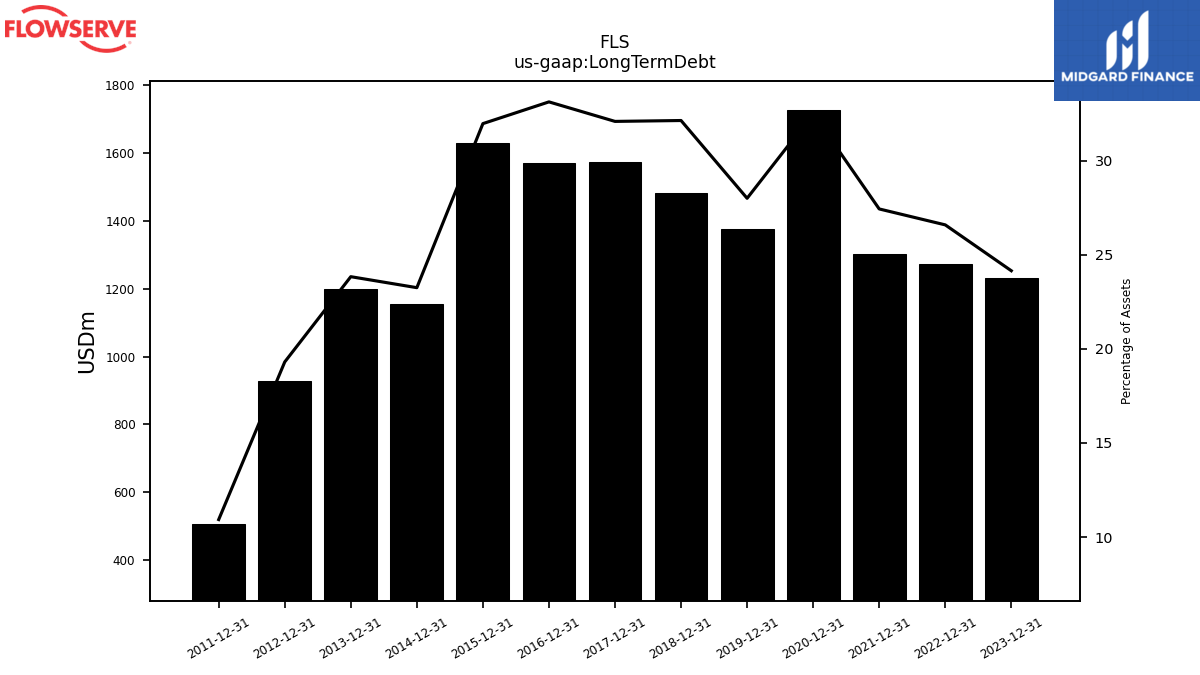
| Long Term Debt | 1233.55 | NA | NA | NA | 1273.49 | NA | NA | NA | 1302.83 | NA | NA | NA | 1726.91 | NA | NA | NA | 1377.25 | NA | NA | NA | 1483.05 | NA | NA | NA | 1575.26 | NA | NA | NA | 1570.62 | NA | NA | NA | 1631.27 | NA | NA | NA | 1154.92 | NA | NA | NA | 1200.30 | NA | NA | NA | 928.59 | NA | NA | NA | 505.22 | NA | NA | NA | NA | NA | NA | NA | |
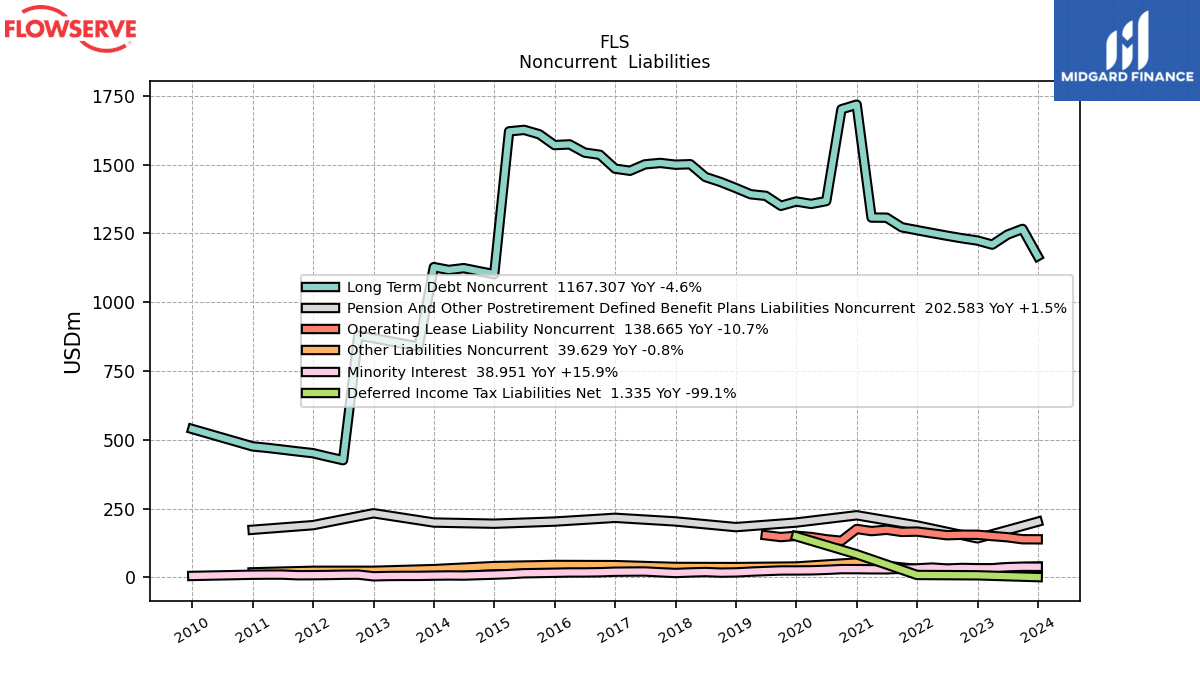
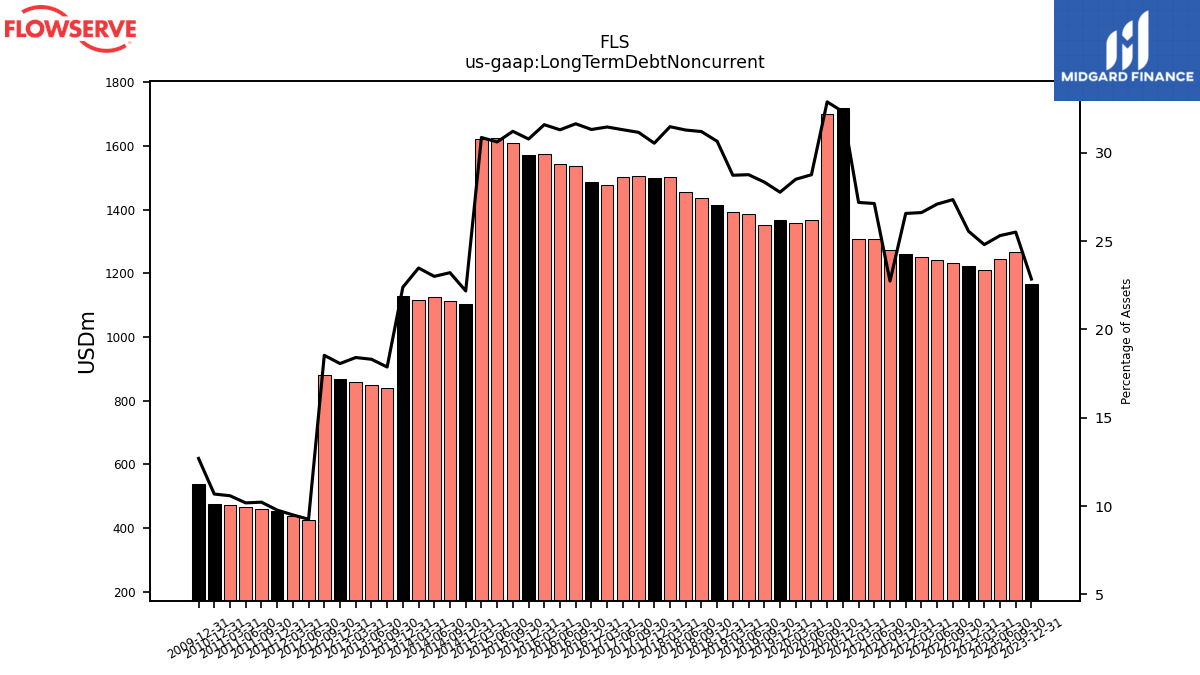
| Long Term Debt Noncurrent | 1167.31 | 1266.42 | 1245.25 | 1209.17 | 1224.15 | 1232.25 | 1241.64 | 1251.60 | 1261.77 | 1272.25 | 1307.15 | 1307.58 | 1717.91 | 1701.08 | 1367.48 | 1357.11 | 1365.98 | 1350.27 | 1386.47 | 1392.24 | 1414.83 | 1436.75 | 1454.95 | 1501.42 | 1499.66 | 1506.06 | 1500.99 | 1477.55 | 1485.26 | 1535.68 | 1543.56 | 1573.45 | 1570.84 | 1610.06 | 1626.15 | 1620.78 | 1101.79 | 1112.64 | 1123.86 | 1117.24 | 1127.62 | 839.22 | 849.21 | 859.29 | 869.12 | 879.13 | 426.14 | 438.65 | 451.59 | 457.86 | 464.46 | 470.86 | 476.23 | NA | NA | NA | |
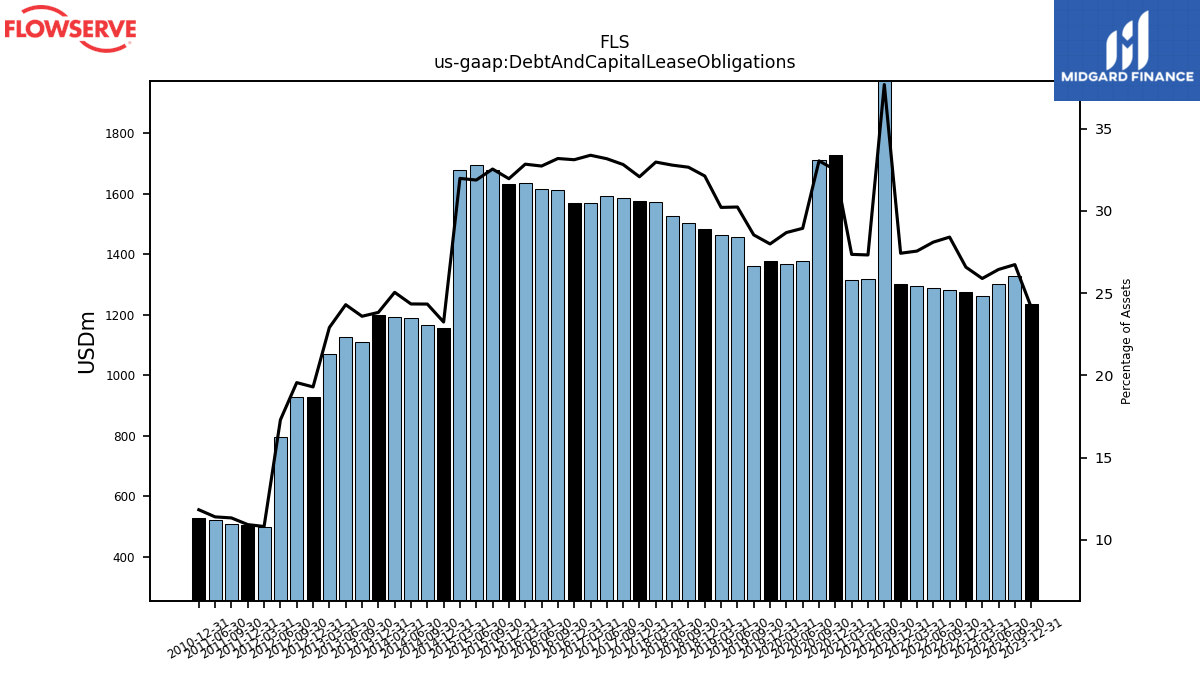
| Debt And Capital Lease Obligations | 1233.55 | 1327.64 | 1301.03 | 1262.56 | 1273.49 | 1280.21 | 1287.94 | 1296.21 | 1302.83 | 2108.86 | 1316.75 | 1315.92 | 1726.91 | 1709.66 | 1376.54 | 1366.09 | 1377.25 | 1360.00 | 1457.97 | 1464.43 | 1483.05 | 1504.02 | 1524.87 | 1572.91 | 1575.26 | 1586.69 | 1590.83 | 1568.18 | 1570.62 | 1610.89 | 1614.21 | 1636.02 | 1631.27 | 1678.95 | 1693.52 | 1679.52 | 1154.92 | 1166.76 | 1189.56 | 1192.33 | 1200.30 | 1108.16 | 1127.08 | 1069.65 | 928.59 | 928.00 | 796.77 | 499.42 | 505.22 | 507.89 | 520.16 | NA | 527.71 | NA | NA | NA | |
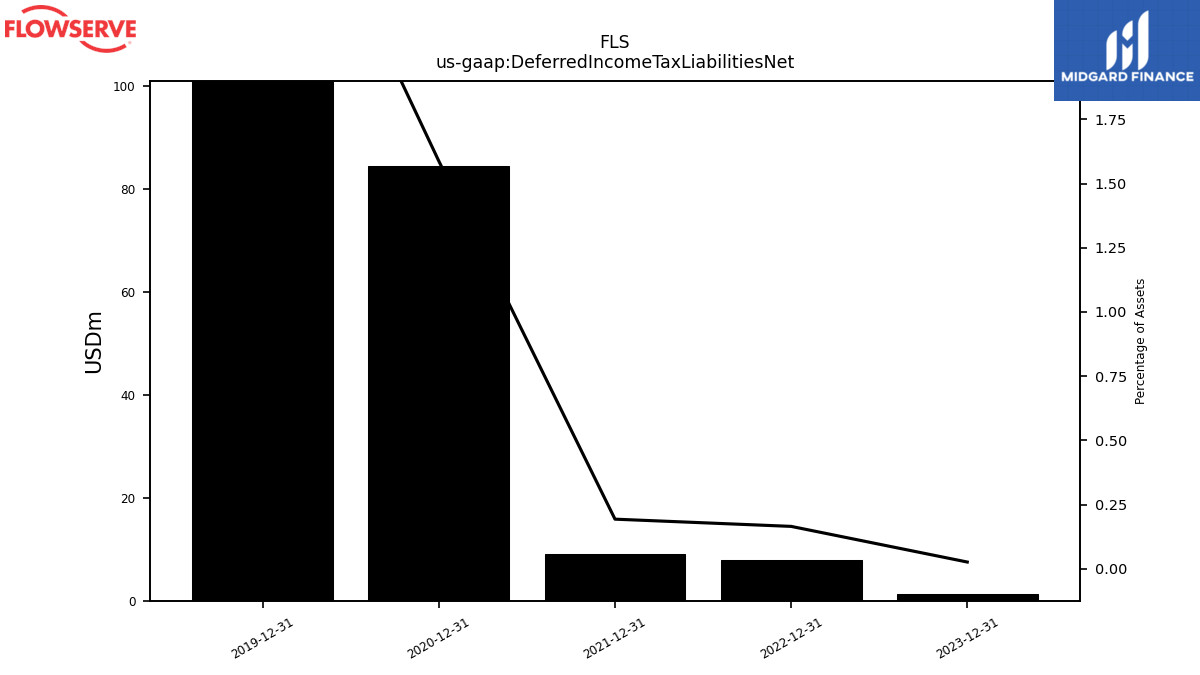
| Deferred Income Tax Liabilities Net | 1.33 | NA | NA | NA | 7.90 | NA | NA | NA | 9.17 | NA | NA | NA | 84.34 | NA | NA | NA | 149.63 | NA | NA | NA | NA | NA | NA | NA | NA | NA | NA | NA | NA | NA | NA | NA | NA | NA | NA | NA | NA | NA | NA | NA | NA | NA | NA | NA | NA | NA | NA | NA | NA | NA | NA | NA | NA | NA | NA | NA | |
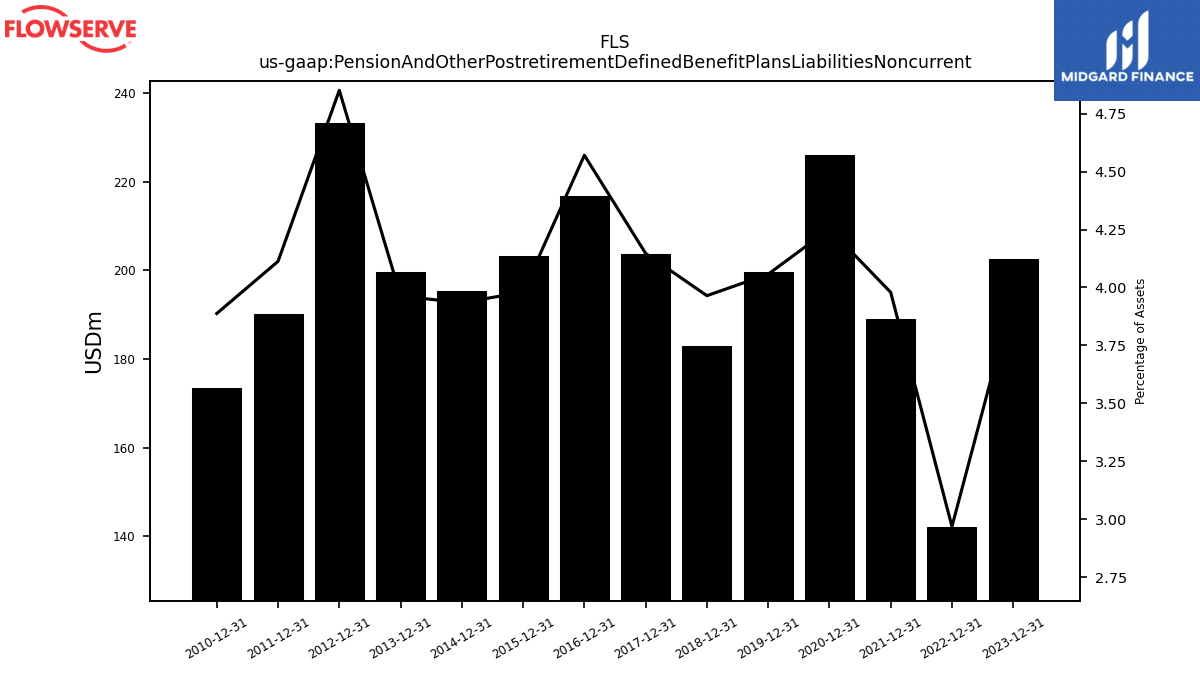
| Pension And Other Postretirement Defined Benefit Plans Liabilities Noncurrent | 202.58 | NA | NA | NA | 142.20 | NA | NA | NA | 189.00 | NA | NA | NA | 225.99 | NA | NA | NA | 199.60 | NA | NA | NA | 183.01 | NA | NA | NA | 203.64 | NA | NA | NA | 216.77 | NA | NA | NA | 203.15 | NA | NA | NA | 195.43 | NA | NA | NA | 199.63 | NA | NA | NA | 233.37 | NA | NA | NA | 190.11 | NA | NA | NA | 173.39 | NA | NA | NA | |
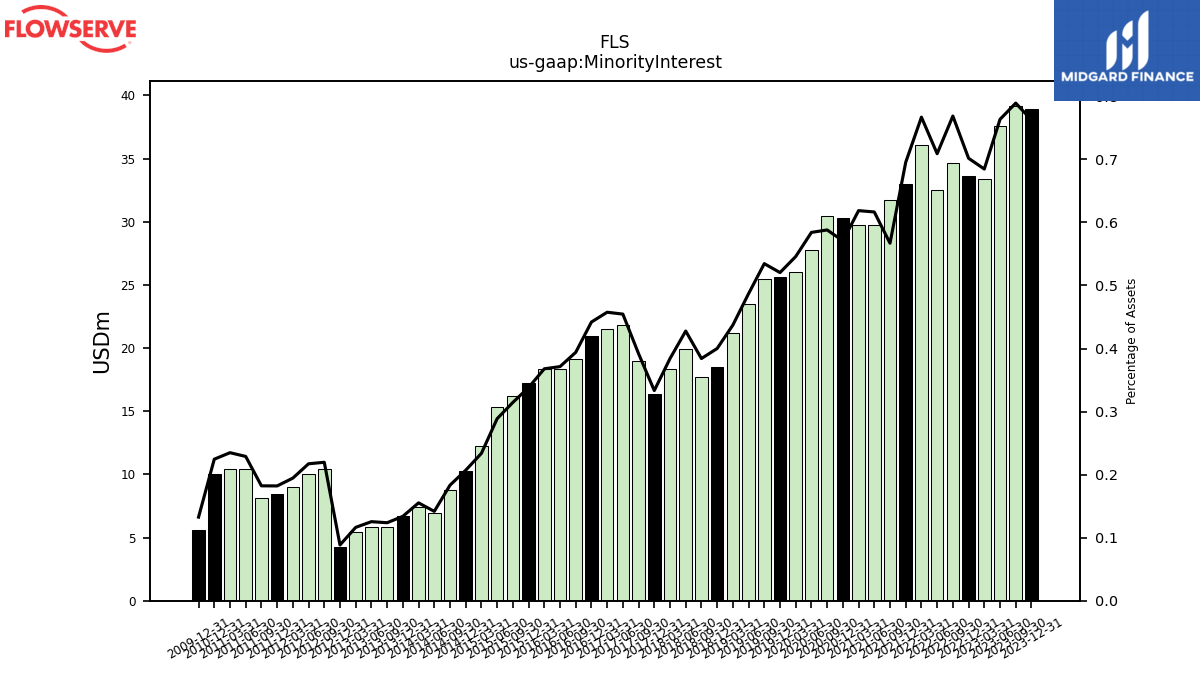
| Minority Interest | 38.95 | 39.18 | 37.56 | 33.38 | 33.61 | 34.63 | 32.49 | 36.07 | 33.03 | 31.73 | 29.71 | 29.75 | 30.33 | 30.42 | 27.78 | 26.00 | 25.60 | 25.47 | 23.48 | 21.19 | 18.46 | 17.69 | 19.89 | 18.32 | 16.37 | 18.94 | 21.80 | 21.49 | 20.96 | 19.12 | 18.31 | 18.32 | 17.26 | 16.22 | 15.34 | 12.28 | 10.28 | 8.79 | 6.92 | 7.39 | 6.74 | 5.81 | 5.82 | 5.43 | 4.26 | 10.42 | 10.00 | 8.98 | 8.42 | 8.16 | 10.44 | 10.45 | 10.01 | NA | NA | NA | |
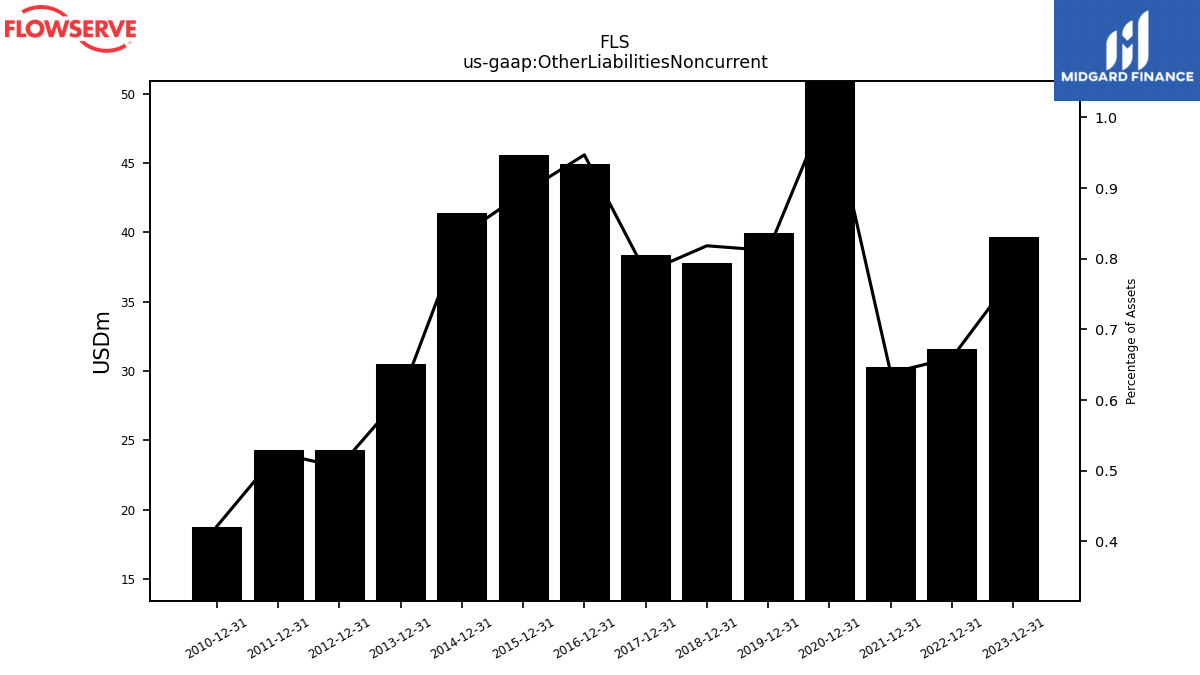
| Other Liabilities Noncurrent | 39.63 | NA | NA | NA | 31.61 | NA | NA | NA | 30.32 | NA | NA | NA | 54.29 | NA | NA | NA | 39.93 | NA | NA | NA | 37.77 | NA | NA | NA | 38.33 | NA | NA | NA | 44.91 | NA | NA | NA | 45.56 | NA | NA | NA | 41.41 | NA | NA | NA | 30.47 | NA | NA | NA | 24.30 | NA | NA | NA | 24.27 | NA | NA | NA | 18.78 | NA | NA | NA | |
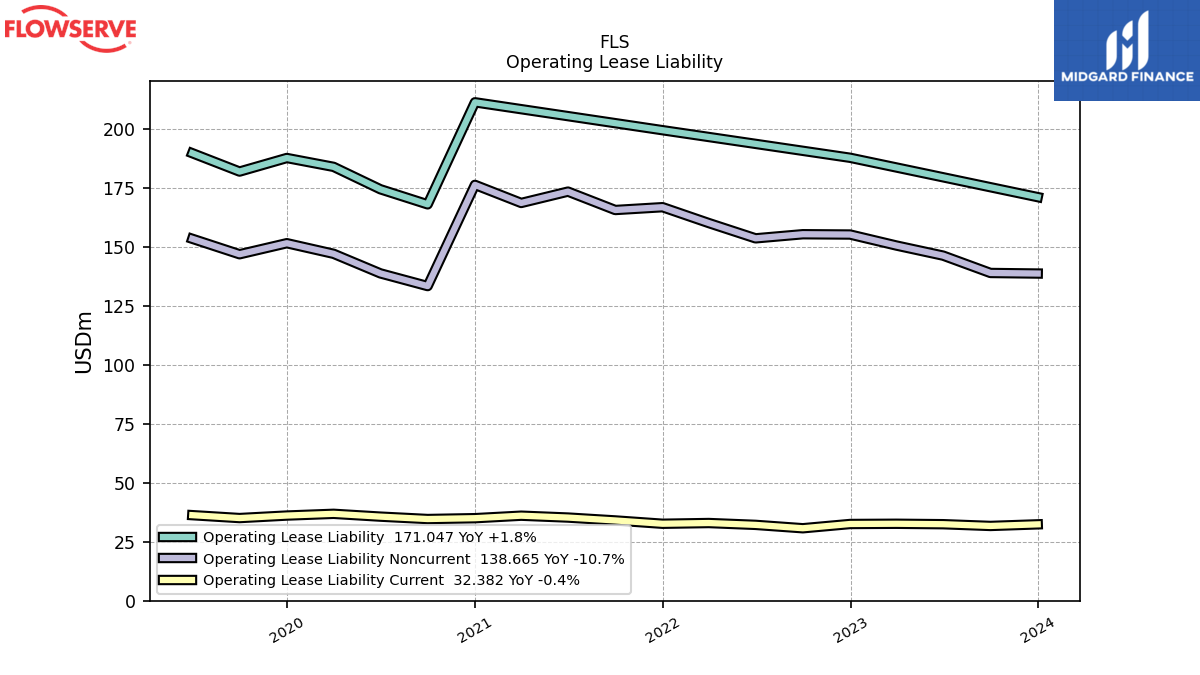
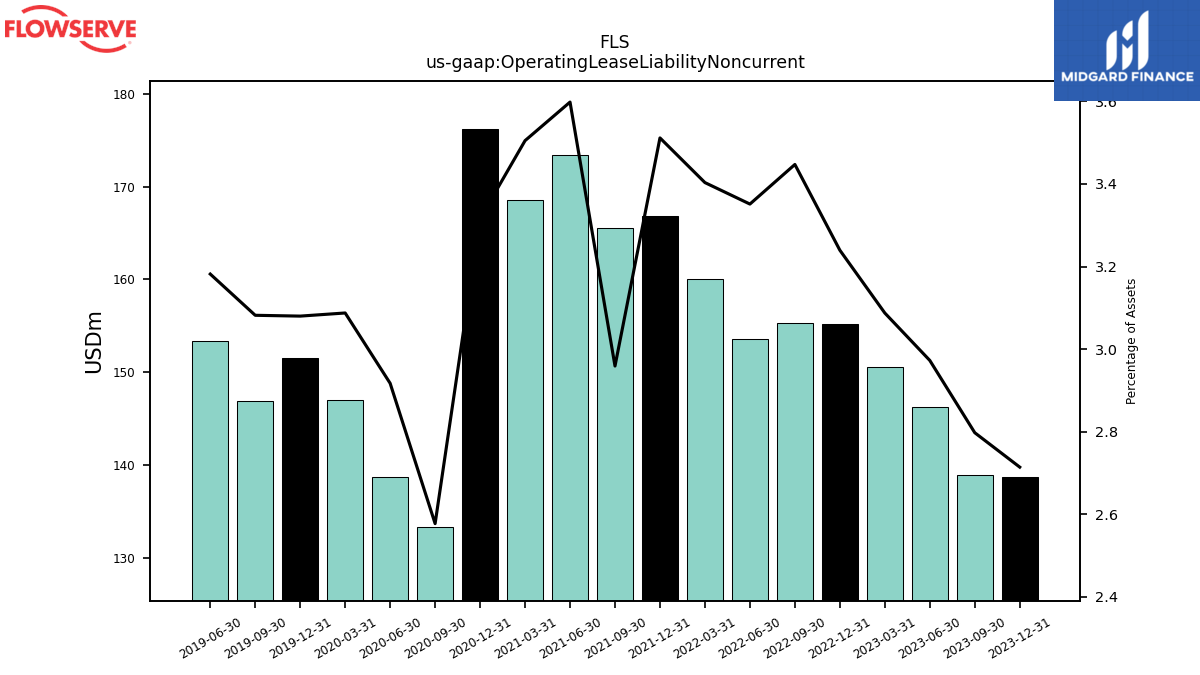
| Operating Lease Liability Noncurrent | 138.66 | 138.91 | 146.25 | 150.54 | 155.20 | 155.33 | 153.58 | 160.06 | 166.79 | 165.59 | 173.39 | 168.57 | 176.25 | 133.35 | 138.74 | 147.03 | 151.52 | 146.84 | 153.40 | NA | NA | NA | NA | NA | NA | NA | NA | NA | NA | NA | NA | NA | NA | NA | NA | NA | NA | NA | NA | NA | NA | NA | NA | NA | NA | NA | NA | NA | NA | NA | NA | NA | NA | NA | NA | NA |
| 2023-12-31 | 2023-09-30 | 2023-06-30 | 2023-03-31 | 2022-12-31 | 2022-09-30 | 2022-06-30 | 2022-03-31 | 2021-12-31 | 2021-09-30 | 2021-06-30 | 2021-03-31 | 2020-12-31 | 2020-09-30 | 2020-06-30 | 2020-03-31 | 2019-12-31 | 2019-09-30 | 2019-06-30 | 2019-03-31 | 2018-12-31 | 2018-09-30 | 2018-06-30 | 2018-03-31 | 2017-12-31 | 2017-09-30 | 2017-06-30 | 2017-03-31 | 2016-12-31 | 2016-09-30 | 2016-06-30 | 2016-03-31 | 2015-12-31 | 2015-09-30 | 2015-06-30 | 2015-03-31 | 2014-12-31 | 2014-09-30 | 2014-06-30 | 2014-03-31 | 2013-12-31 | 2013-09-30 | 2013-06-30 | 2013-03-31 | 2012-12-31 | 2012-09-30 | 2012-06-30 | 2012-03-31 | 2011-12-31 | 2011-09-30 | 2011-06-30 | 2011-03-31 | 2010-12-31 | 2010-09-30 | 2010-06-30 | 2010-03-31 | ||
|---|---|---|---|---|---|---|---|---|---|---|---|---|---|---|---|---|---|---|---|---|---|---|---|---|---|---|---|---|---|---|---|---|---|---|---|---|---|---|---|---|---|---|---|---|---|---|---|---|---|---|---|---|---|---|---|---|---|
| Stockholders Equity | 1936.10 | 1874.11 | 1884.45 | 1846.32 | 1824.99 | 1657.12 | 1721.40 | 1754.99 | 1804.32 | 1759.50 | 1740.98 | 1712.03 | 1732.47 | 1673.42 | 1662.57 | 1659.43 | 1790.36 | 1744.34 | 1726.31 | 1686.80 | 1642.32 | 1613.04 | 1621.66 | 1685.23 | 1654.59 | 1748.69 | 1703.99 | 1680.37 | 1648.23 | 1694.42 | 1743.98 | 1722.66 | 1666.48 | 1688.32 | 1768.58 | 1751.86 | 1931.56 | 1914.91 | 1931.82 | 1855.49 | 1870.38 | 1804.66 | 1716.13 | 1782.33 | 1890.22 | 2016.81 | 1987.60 | 2357.67 | 2269.81 | 2298.70 | 2321.02 | 2217.41 | 2103.02 | NA | NA | NA | |
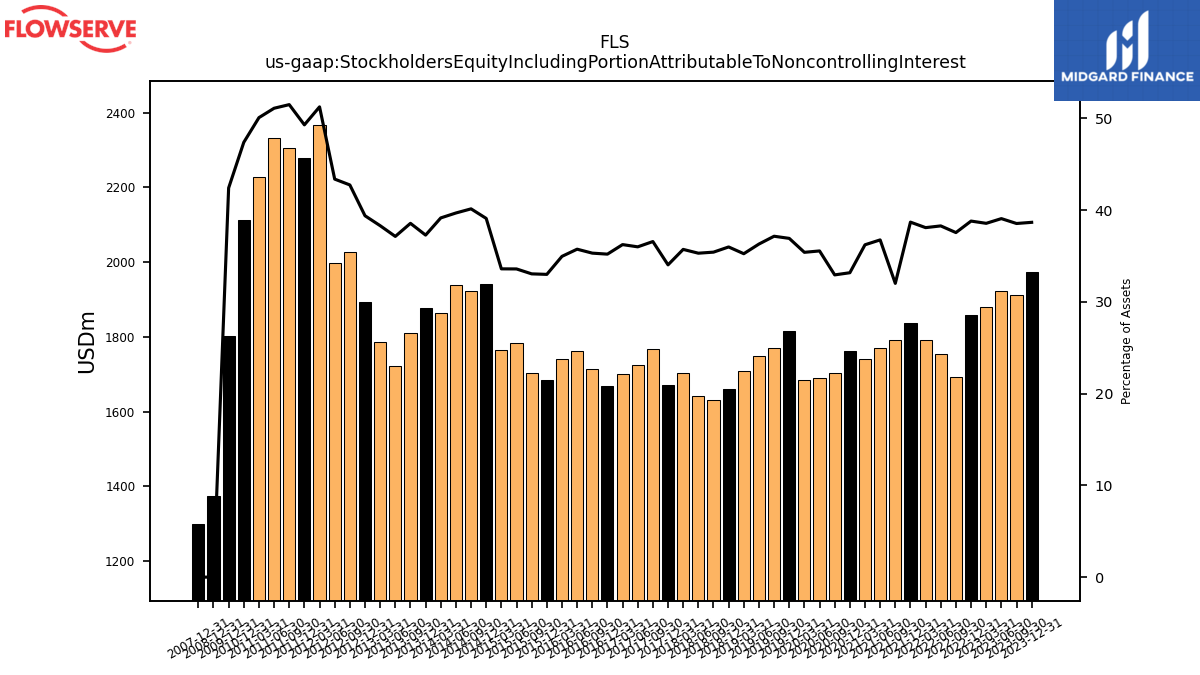
| Stockholders Equity Including Portion Attributable To Noncontrolling Interest | 1975.05 | 1913.29 | 1922.01 | 1879.70 | 1858.61 | 1691.76 | 1753.89 | 1791.06 | 1837.35 | 1791.23 | 1770.69 | 1741.79 | 1762.80 | 1703.84 | 1690.35 | 1685.42 | 1815.96 | 1769.80 | 1749.79 | 1707.99 | 1660.78 | 1630.73 | 1641.55 | 1703.55 | 1670.95 | 1767.63 | 1725.79 | 1701.86 | 1669.19 | 1713.54 | 1762.29 | 1740.99 | 1683.73 | 1704.55 | 1783.91 | 1764.14 | 1941.84 | 1923.70 | 1938.74 | 1862.87 | 1877.12 | 1810.47 | 1721.95 | 1787.76 | 1894.47 | 2027.22 | 1997.60 | 2366.65 | 2278.23 | 2306.87 | 2331.46 | 2227.85 | 2113.03 | NA | NA | NA | |
| Common Stock Value | 220.99 | 220.99 | 220.99 | 220.99 | 220.99 | 220.99 | 220.99 | 220.99 | 220.99 | 220.99 | 220.99 | 220.99 | 220.99 | 220.99 | 220.99 | 220.99 | 220.99 | 220.99 | 220.99 | 220.99 | 220.99 | 220.99 | 220.99 | 220.99 | 220.99 | 220.99 | 220.99 | 220.99 | 220.99 | 220.99 | 220.99 | 220.99 | 220.99 | 220.99 | 220.99 | 220.99 | 220.99 | 220.99 | 220.99 | 220.99 | 220.99 | 220.99 | 220.99 | 220.99 | 220.99 | 220.99 | 220.99 | 220.99 | 220.99 | 220.99 | 220.99 | 220.99 | 220.99 | NA | NA | NA | |
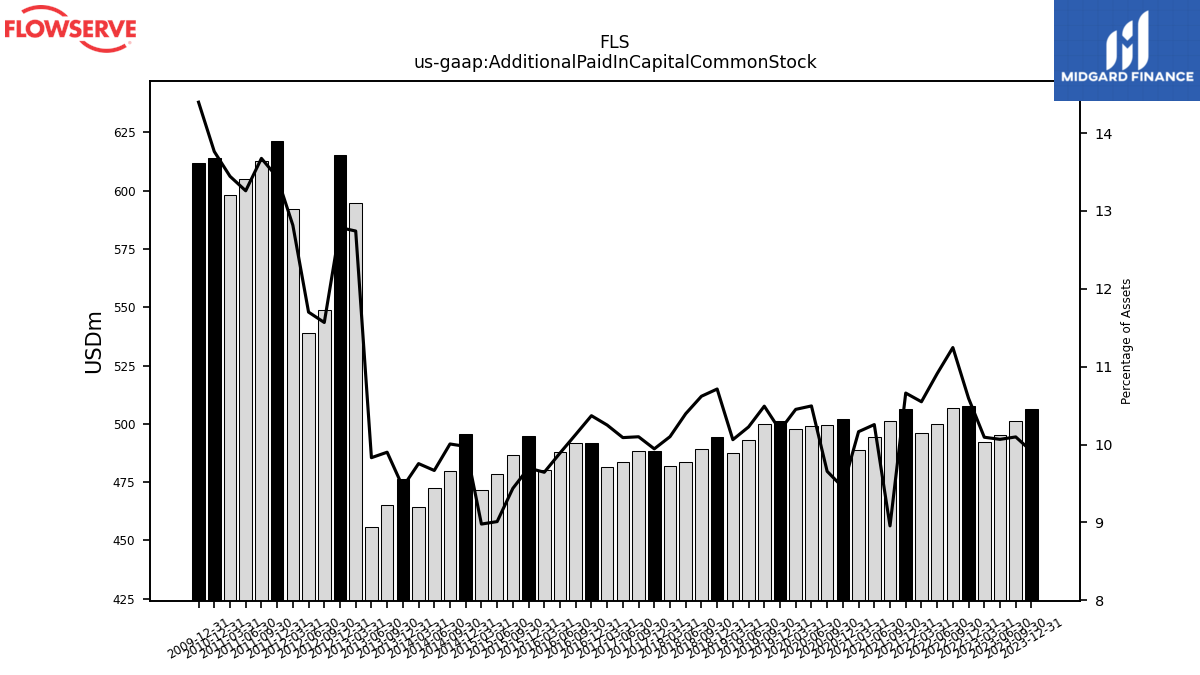
| Additional Paid In Capital Common Stock | 506.52 | 501.38 | 495.28 | 492.15 | 507.48 | 506.74 | 500.01 | 496.15 | 506.39 | 501.12 | 494.22 | 488.91 | 502.23 | 499.56 | 499.15 | 497.72 | 501.05 | 499.93 | 493.04 | 487.67 | 494.55 | 489.07 | 483.48 | 481.86 | 488.33 | 488.25 | 483.78 | 481.44 | 491.85 | 491.64 | 487.77 | 480.37 | 494.96 | 486.79 | 478.63 | 471.52 | 495.60 | 479.72 | 472.33 | 464.28 | 476.22 | 464.99 | 455.98 | 594.86 | 615.18 | 548.75 | 538.94 | 591.96 | 621.08 | 612.74 | 605.08 | 598.27 | 613.86 | NA | NA | NA | |
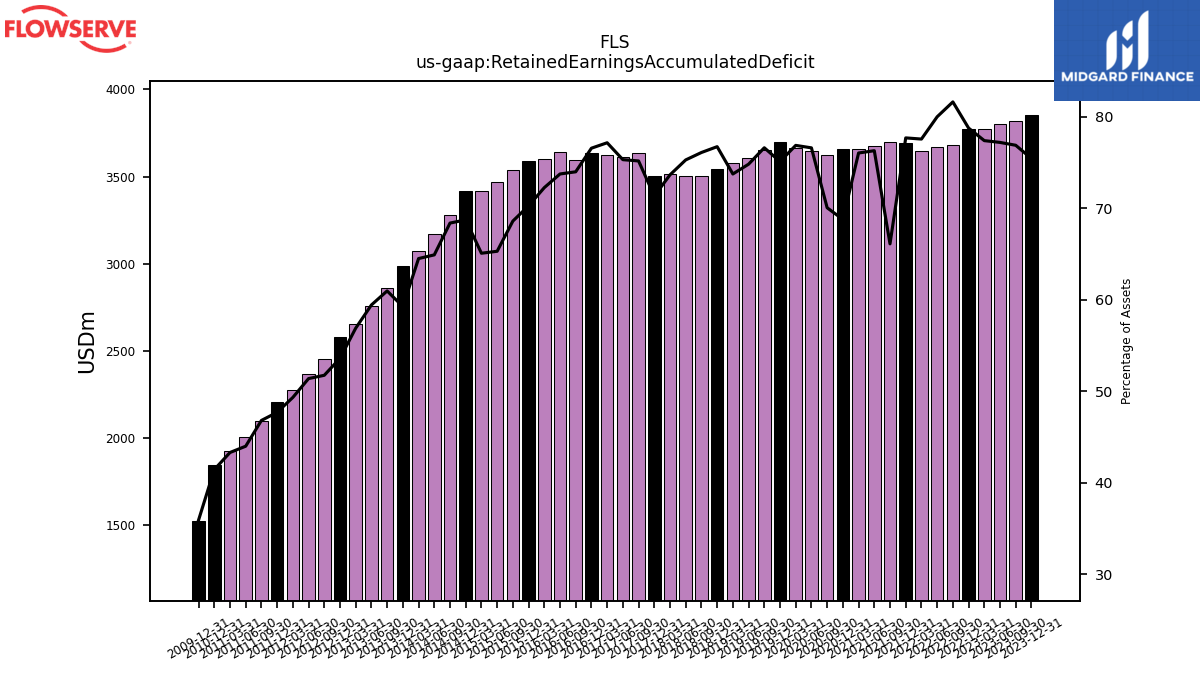
| Retained Earnings Accumulated Deficit | 3854.72 | 3818.39 | 3798.98 | 3774.38 | 3774.21 | 3678.82 | 3666.93 | 3648.68 | 3691.02 | 3700.51 | 3677.12 | 3658.16 | 3656.45 | 3625.29 | 3643.87 | 3661.58 | 3695.86 | 3651.13 | 3607.93 | 3575.01 | 3543.01 | 3505.05 | 3502.01 | 3514.30 | 3503.95 | 3634.75 | 3612.17 | 3624.91 | 3632.16 | 3591.87 | 3637.84 | 3599.87 | 3587.12 | 3539.47 | 3469.69 | 3418.92 | 3415.74 | 3278.77 | 3172.21 | 3070.78 | 2985.39 | 2863.86 | 2757.26 | 2656.81 | 2579.31 | 2455.40 | 2367.47 | 2278.81 | 2205.52 | 2098.05 | 2008.27 | 1927.58 | 1848.68 | NA | NA | NA | |
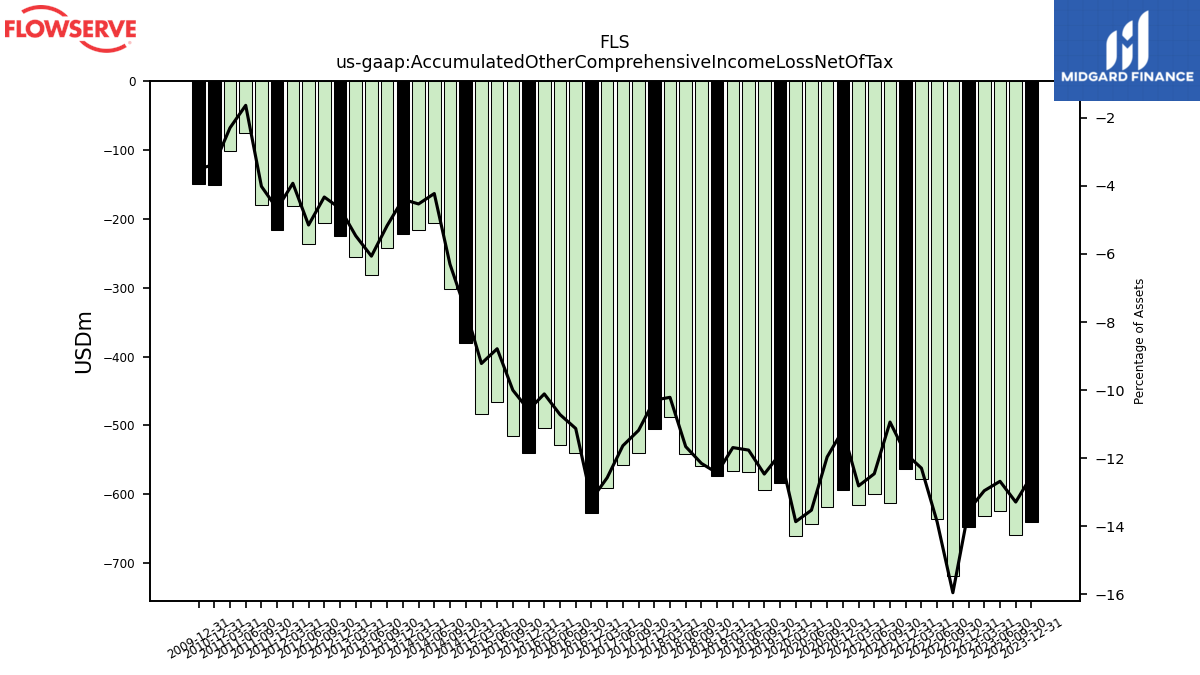
| Accumulated Other Comprehensive Income Loss Net Of Tax | -639.60 | -659.65 | -623.69 | -631.53 | -647.79 | -718.62 | -635.62 | -578.05 | -563.59 | -612.09 | -600.14 | -616.20 | -594.05 | -618.86 | -643.17 | -660.12 | -584.29 | -593.85 | -567.01 | -566.40 | -573.95 | -559.56 | -542.20 | -487.11 | -505.47 | -540.50 | -557.79 | -590.52 | -626.75 | -540.01 | -528.55 | -503.64 | -540.04 | -515.89 | -466.68 | -484.11 | -380.41 | -302.18 | -206.57 | -215.75 | -221.48 | -242.78 | -281.37 | -255.23 | -224.31 | -205.43 | -237.30 | -181.34 | -216.10 | -179.95 | -74.79 | -102.29 | -150.51 | NA | NA | NA | |
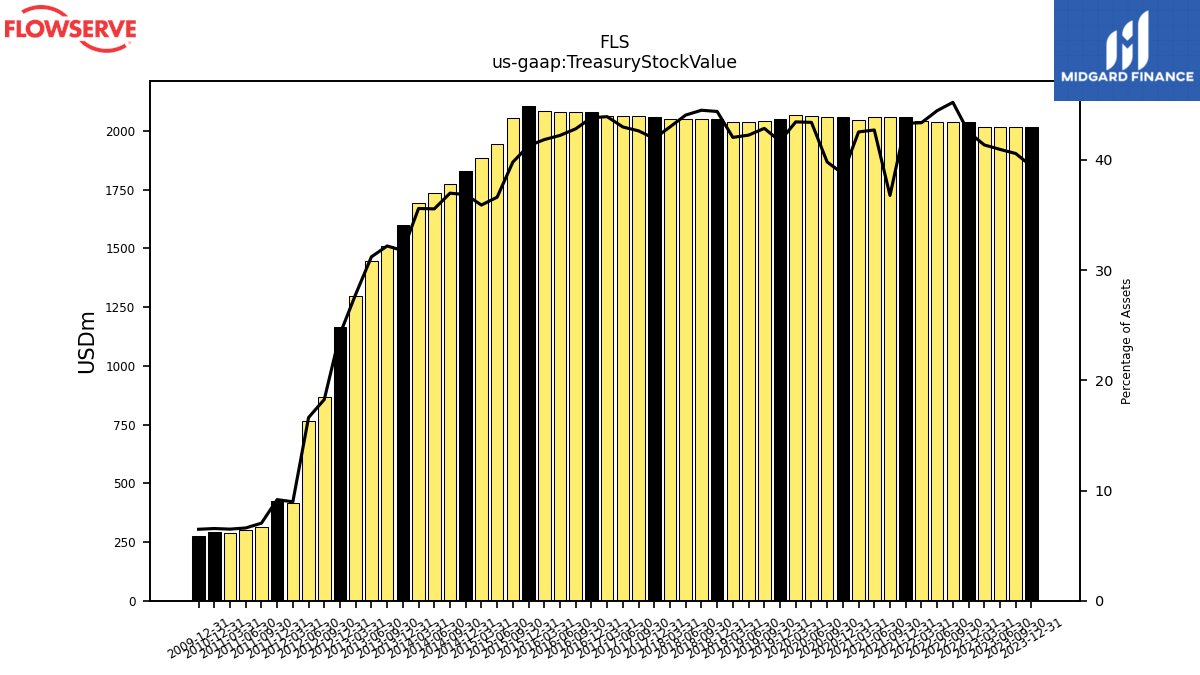
| Treasury Stock Value | 2014.47 | 2014.88 | 2014.93 | 2016.52 | 2036.88 | 2037.76 | 2037.84 | 2039.90 | 2057.71 | 2058.17 | 2058.28 | 2045.94 | 2059.31 | 2059.67 | 2064.30 | 2069.06 | 2051.58 | 2042.14 | 2036.86 | 2037.59 | 2049.40 | 2049.53 | 2049.55 | 2051.02 | 2059.56 | 2061.05 | 2061.34 | 2063.09 | 2078.53 | 2078.44 | 2082.31 | 2084.24 | 2106.78 | 2053.13 | 1945.23 | 1885.59 | 1830.92 | 1772.81 | 1737.42 | 1693.99 | 1600.27 | 1511.77 | 1447.40 | 1298.39 | 1164.50 | 866.29 | 765.73 | 414.72 | 424.05 | 315.39 | 301.35 | 289.16 | 292.21 | NA | NA | NA | |
| Minority Interest | 38.95 | 39.18 | 37.56 | 33.38 | 33.61 | 34.63 | 32.49 | 36.07 | 33.03 | 31.73 | 29.71 | 29.75 | 30.33 | 30.42 | 27.78 | 26.00 | 25.60 | 25.47 | 23.48 | 21.19 | 18.46 | 17.69 | 19.89 | 18.32 | 16.37 | 18.94 | 21.80 | 21.49 | 20.96 | 19.12 | 18.31 | 18.32 | 17.26 | 16.22 | 15.34 | 12.28 | 10.28 | 8.79 | 6.92 | 7.39 | 6.74 | 5.81 | 5.82 | 5.43 | 4.26 | 10.42 | 10.00 | 8.98 | 8.42 | 8.16 | 10.44 | 10.45 | 10.01 | NA | NA | NA | |
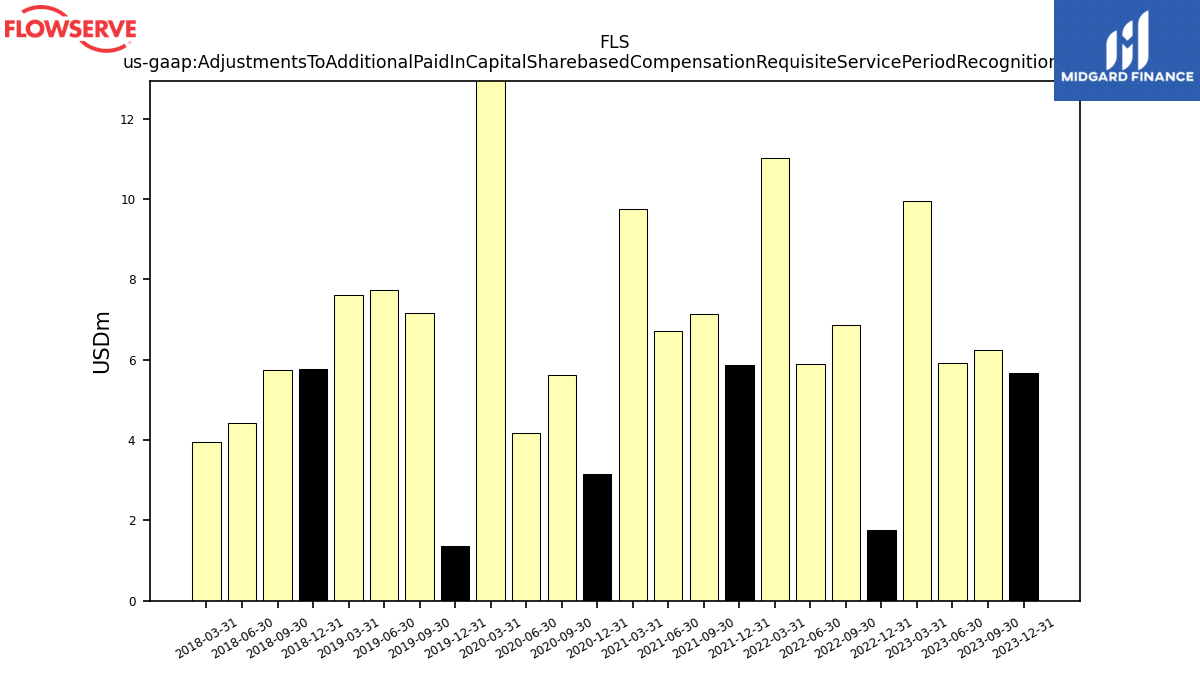
| Adjustments To Additional Paid In Capital Sharebased Compensation Requisite Service Period Recognition Value | 5.68 | 6.25 | 5.92 | 9.95 | 1.77 | 6.86 | 5.89 | 11.01 | 5.87 | 7.14 | 6.71 | 9.76 | 3.15 | 5.63 | 4.16 | 14.31 | 1.37 | 7.15 | 7.75 | 7.61 | 5.78 | 5.74 | 4.43 | 3.96 | NA | NA | NA | NA | NA | NA | NA | NA | NA | NA | NA | NA | NA | NA | NA | NA | NA | NA | NA | NA | NA | NA | NA | NA | NA | NA | NA | NA | NA | NA | NA | NA |
| 2023-12-31 | 2023-09-30 | 2023-06-30 | 2023-03-31 | 2022-12-31 | 2022-09-30 | 2022-06-30 | 2022-03-31 | 2021-12-31 | 2021-09-30 | 2021-06-30 | 2021-03-31 | 2020-12-31 | 2020-09-30 | 2020-06-30 | 2020-03-31 | 2019-12-31 | 2019-09-30 | 2019-06-30 | 2019-03-31 | 2018-12-31 | 2018-09-30 | 2018-06-30 | 2018-03-31 | 2017-12-31 | 2017-09-30 | 2017-06-30 | 2017-03-31 | 2016-12-31 | 2016-09-30 | 2016-06-30 | 2016-03-31 | 2015-12-31 | 2015-09-30 | 2015-06-30 | 2015-03-31 | 2014-12-31 | 2014-09-30 | 2014-06-30 | 2014-03-31 | 2013-12-31 | 2013-09-30 | 2013-06-30 | 2013-03-31 | 2012-12-31 | 2012-09-30 | 2012-06-30 | 2012-03-31 | 2011-12-31 | 2011-09-30 | 2011-06-30 | 2011-03-31 | 2010-12-31 | 2010-09-30 | 2010-06-30 | 2010-03-31 | ||
|---|---|---|---|---|---|---|---|---|---|---|---|---|---|---|---|---|---|---|---|---|---|---|---|---|---|---|---|---|---|---|---|---|---|---|---|---|---|---|---|---|---|---|---|---|---|---|---|---|---|---|---|---|---|---|---|---|---|
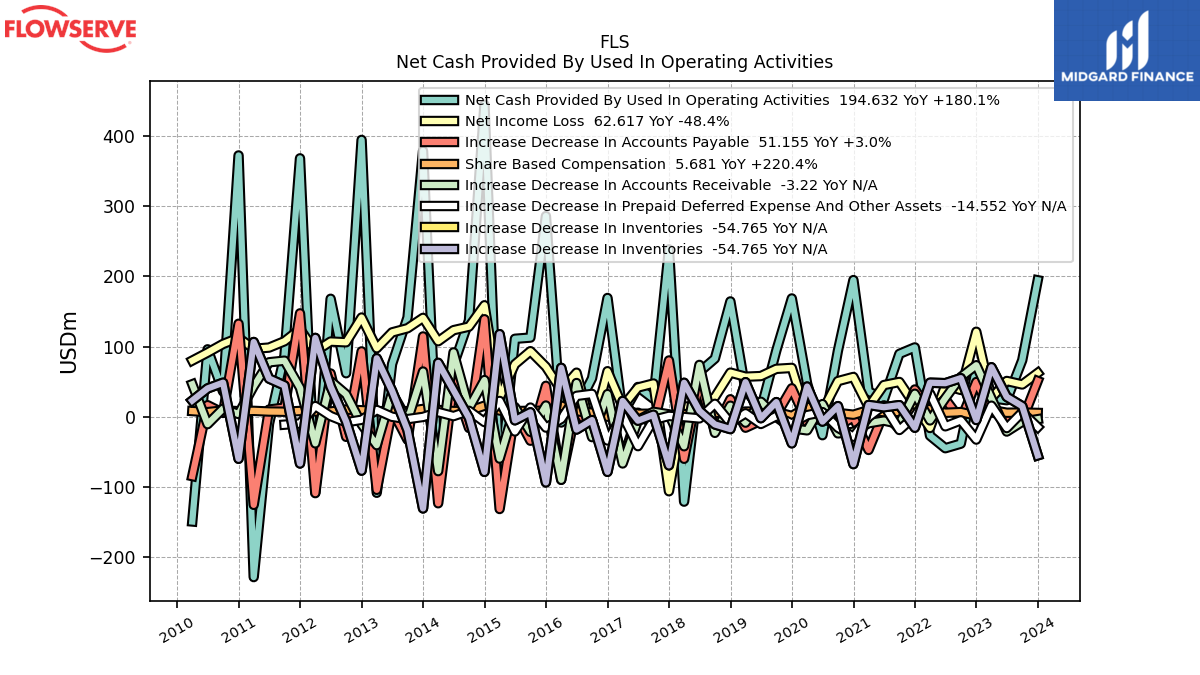
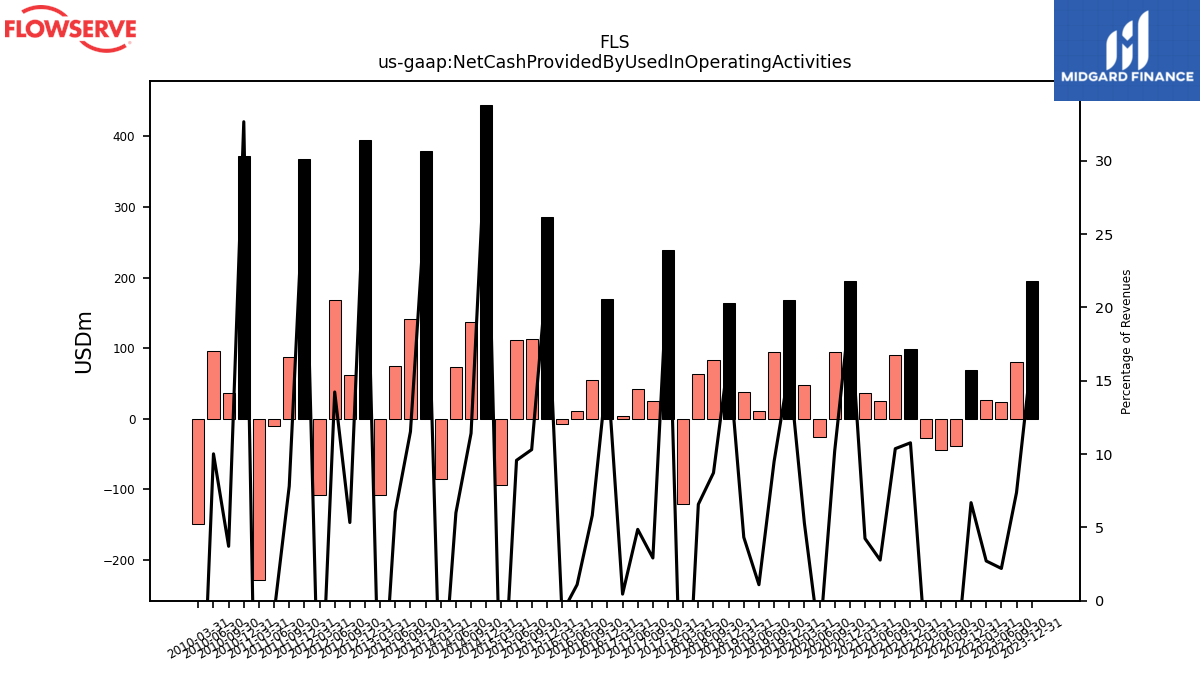
| Net Cash Provided By Used In Operating Activities | 194.63 | 80.76 | 23.80 | 26.59 | 69.47 | -38.12 | -44.59 | -26.77 | 99.01 | 89.80 | 24.93 | 36.38 | 194.91 | 94.40 | -26.07 | 47.30 | 168.75 | 94.64 | 10.83 | 38.52 | 164.49 | 83.08 | 63.99 | -120.73 | 238.71 | 25.76 | 42.67 | 3.93 | 169.40 | 54.91 | 11.28 | -8.00 | 286.05 | 112.98 | 111.27 | -93.20 | 444.76 | 137.47 | 73.40 | -84.67 | 378.87 | 141.71 | 75.24 | -108.07 | 394.57 | 62.19 | 168.27 | -107.89 | 368.30 | 87.71 | -9.61 | -228.19 | 372.39 | 36.08 | 96.26 | -148.96 | |
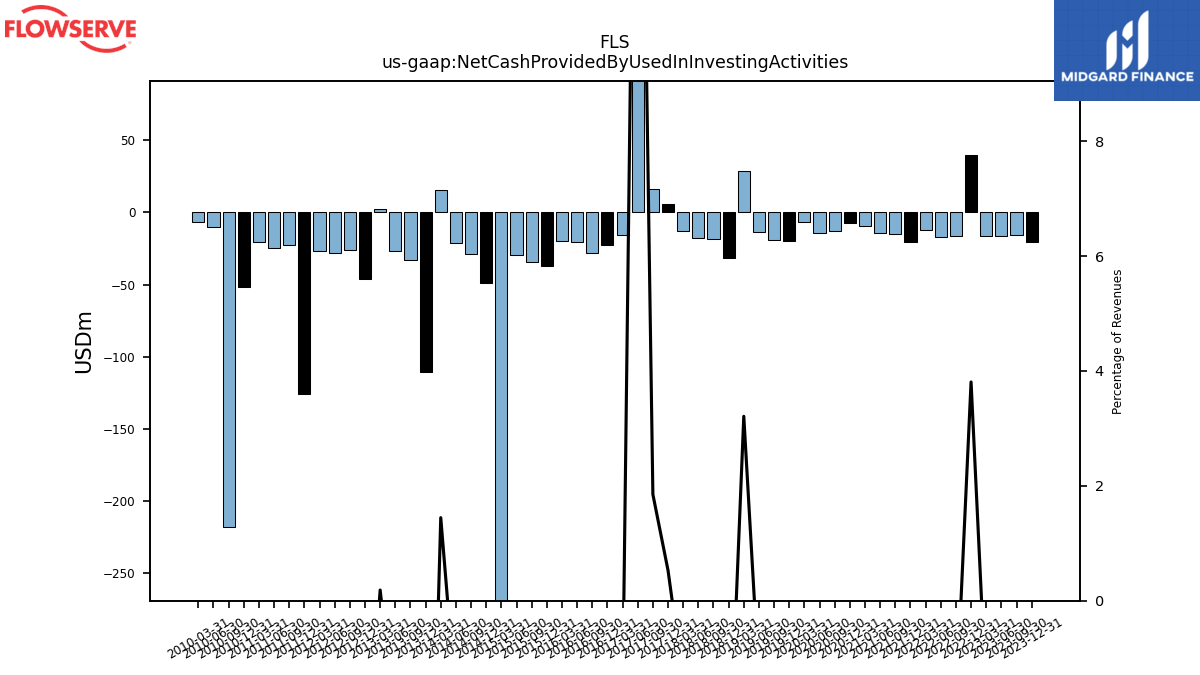
| Net Cash Provided By Used In Investing Activities | -20.20 | -15.54 | -16.38 | -16.46 | 39.56 | -16.65 | -16.78 | -12.22 | -20.76 | -14.87 | -14.35 | -9.49 | -7.54 | -13.00 | -14.59 | -6.57 | -19.99 | -18.89 | -13.54 | 28.57 | -31.89 | -18.74 | -17.95 | -12.89 | 5.47 | 16.36 | 170.27 | -15.49 | -22.56 | -28.36 | -20.44 | -20.11 | -37.21 | -34.62 | -29.60 | -423.86 | -48.90 | -29.11 | -21.52 | 15.44 | -110.36 | -32.91 | -26.78 | 2.05 | -45.90 | -25.93 | -28.09 | -26.51 | -125.68 | -22.87 | -24.93 | -20.73 | -51.97 | -217.48 | -10.30 | -6.97 | |
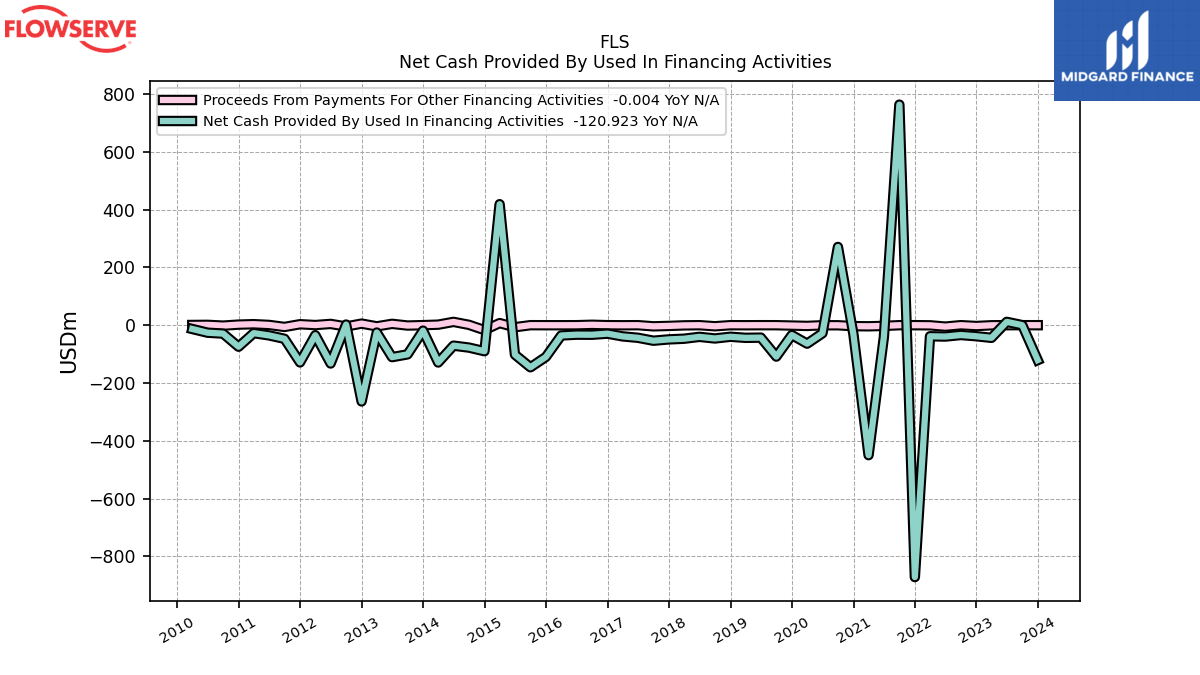
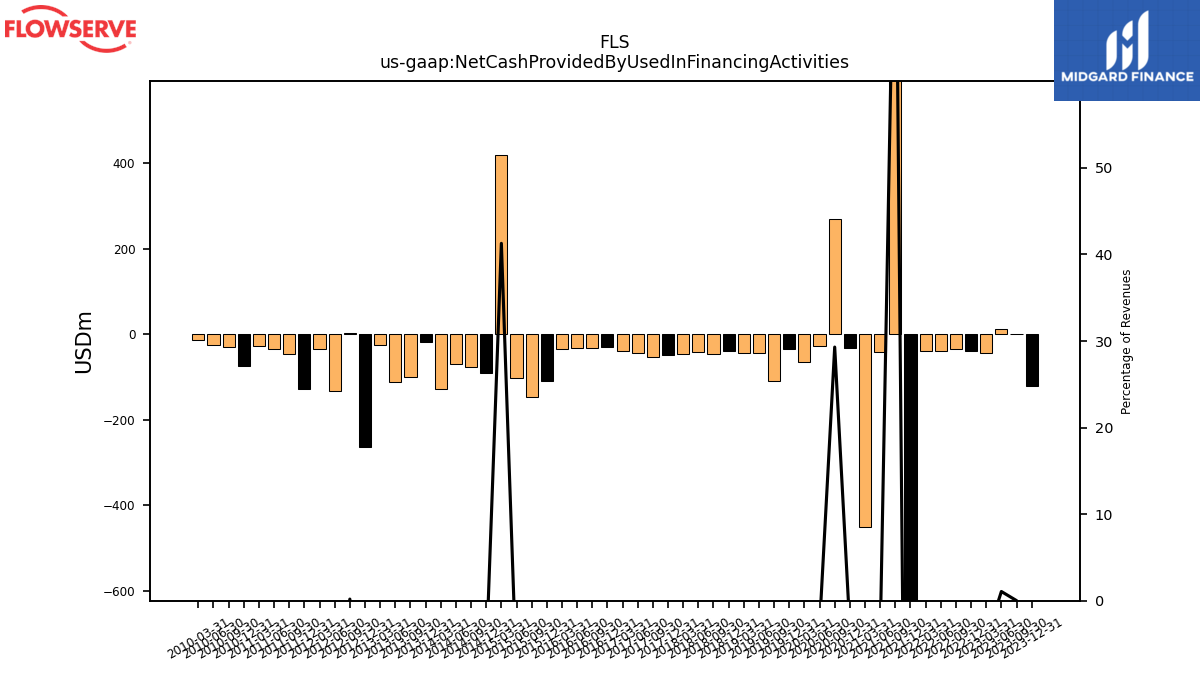
| Net Cash Provided By Used In Financing Activities | -120.92 | 0.20 | 11.53 | -43.82 | -38.23 | -34.07 | -39.32 | -38.39 | -872.05 | 763.44 | -41.17 | -449.92 | -31.39 | 270.85 | -27.96 | -63.92 | -34.11 | -108.72 | -43.04 | -43.79 | -40.06 | -45.98 | -40.39 | -46.85 | -49.14 | -53.75 | -43.64 | -38.83 | -29.32 | -33.09 | -32.82 | -35.61 | -109.87 | -145.75 | -101.93 | 418.88 | -90.05 | -77.59 | -70.80 | -129.22 | -18.82 | -101.03 | -110.60 | -25.38 | -264.01 | 2.25 | -132.60 | -34.57 | -128.92 | -47.13 | -35.38 | -27.53 | -74.54 | -29.18 | -26.02 | -13.18 |
| 2023-12-31 | 2023-09-30 | 2023-06-30 | 2023-03-31 | 2022-12-31 | 2022-09-30 | 2022-06-30 | 2022-03-31 | 2021-12-31 | 2021-09-30 | 2021-06-30 | 2021-03-31 | 2020-12-31 | 2020-09-30 | 2020-06-30 | 2020-03-31 | 2019-12-31 | 2019-09-30 | 2019-06-30 | 2019-03-31 | 2018-12-31 | 2018-09-30 | 2018-06-30 | 2018-03-31 | 2017-12-31 | 2017-09-30 | 2017-06-30 | 2017-03-31 | 2016-12-31 | 2016-09-30 | 2016-06-30 | 2016-03-31 | 2015-12-31 | 2015-09-30 | 2015-06-30 | 2015-03-31 | 2014-12-31 | 2014-09-30 | 2014-06-30 | 2014-03-31 | 2013-12-31 | 2013-09-30 | 2013-06-30 | 2013-03-31 | 2012-12-31 | 2012-09-30 | 2012-06-30 | 2012-03-31 | 2011-12-31 | 2011-09-30 | 2011-06-30 | 2011-03-31 | 2010-12-31 | 2010-09-30 | 2010-06-30 | 2010-03-31 | ||
|---|---|---|---|---|---|---|---|---|---|---|---|---|---|---|---|---|---|---|---|---|---|---|---|---|---|---|---|---|---|---|---|---|---|---|---|---|---|---|---|---|---|---|---|---|---|---|---|---|---|---|---|---|---|---|---|---|---|
| Net Cash Provided By Used In Operating Activities | 194.63 | 80.76 | 23.80 | 26.59 | 69.47 | -38.12 | -44.59 | -26.77 | 99.01 | 89.80 | 24.93 | 36.38 | 194.91 | 94.40 | -26.07 | 47.30 | 168.75 | 94.64 | 10.83 | 38.52 | 164.49 | 83.08 | 63.99 | -120.73 | 238.71 | 25.76 | 42.67 | 3.93 | 169.40 | 54.91 | 11.28 | -8.00 | 286.05 | 112.98 | 111.27 | -93.20 | 444.76 | 137.47 | 73.40 | -84.67 | 378.87 | 141.71 | 75.24 | -108.07 | 394.57 | 62.19 | 168.27 | -107.89 | 368.30 | 87.71 | -9.61 | -228.19 | 372.39 | 36.08 | 96.26 | -148.96 | |
| Net Income Loss | 62.62 | 46.16 | 51.20 | 26.77 | 121.33 | 38.40 | 44.78 | -15.82 | 16.70 | 49.78 | 45.35 | 14.08 | 56.90 | 51.00 | 8.64 | -0.61 | 69.80 | 68.44 | 58.17 | 57.26 | 63.10 | 28.20 | 13.22 | 15.14 | -105.90 | 47.60 | 41.88 | 14.82 | 65.10 | -20.93 | 63.00 | 37.86 | 71.40 | 93.62 | 75.01 | 27.67 | 159.00 | 128.56 | 123.51 | 107.73 | 141.10 | 126.27 | 120.39 | 97.79 | 141.60 | 106.30 | 107.32 | 93.12 | 125.10 | 107.77 | 98.73 | 96.98 | 112.60 | 103.92 | 91.65 | 80.22 | |
| Profit Loss | 67.44 | 52.59 | 55.15 | 30.00 | 124.96 | 40.63 | 46.09 | -13.68 | 19.47 | 51.81 | 47.74 | 17.16 | 59.62 | 53.65 | 10.79 | 1.49 | 71.25 | 70.56 | 60.47 | 59.50 | 64.36 | 29.44 | 14.79 | 16.46 | -105.89 | 48.74 | 42.19 | 15.06 | 66.99 | -20.12 | 62.99 | 38.28 | 72.46 | 94.54 | 76.63 | 29.64 | 160.53 | 130.60 | 125.17 | 108.59 | 141.99 | 126.53 | 120.89 | 98.90 | 141.94 | 106.83 | 108.48 | 93.54 | 125.56 | 107.96 | 98.72 | 97.00 | 112.45 | 104.22 | 91.80 | 80.20 | |
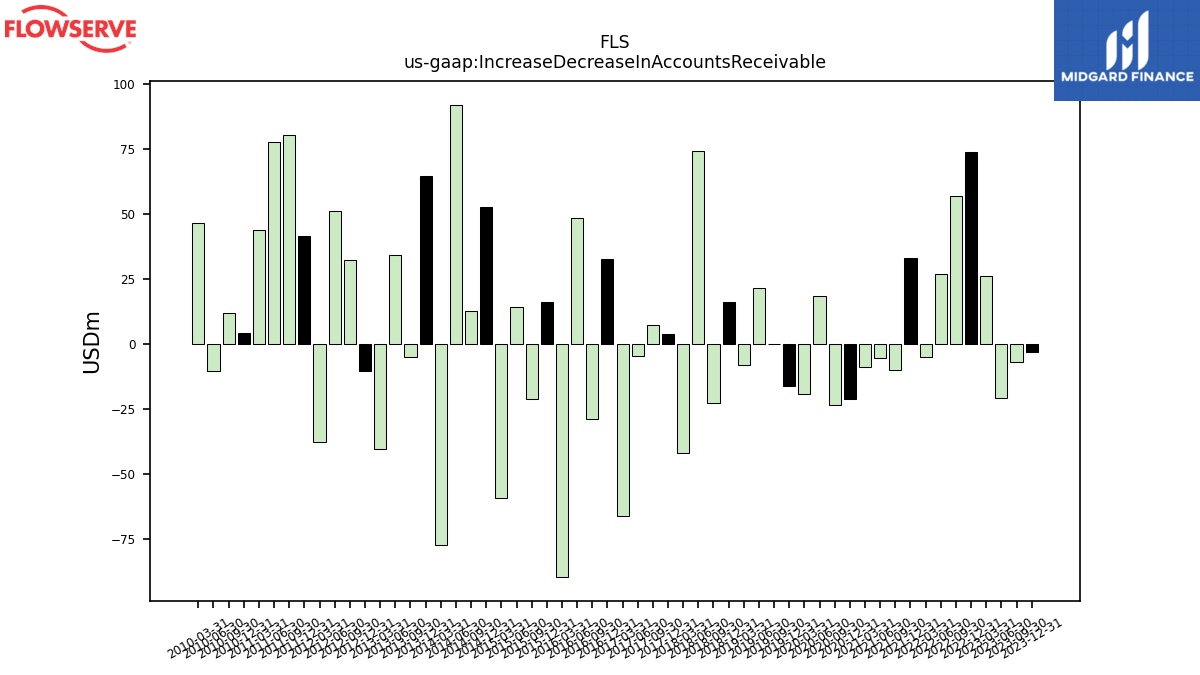
| Increase Decrease In Accounts Receivable | -3.22 | -6.87 | -20.90 | 26.25 | 73.64 | 56.74 | 26.68 | -5.04 | 33.04 | -10.08 | -5.28 | -9.01 | -21.32 | -23.47 | 18.28 | -19.14 | -16.23 | -0.09 | 21.62 | -8.17 | 15.97 | -22.75 | 74.08 | -41.85 | 3.62 | 7.24 | -4.74 | -66.34 | 32.49 | -28.84 | 48.30 | -89.65 | 16.22 | -21.28 | 14.02 | -59.40 | 52.51 | 12.45 | 91.96 | -77.26 | 64.65 | -4.94 | 34.33 | -40.22 | -10.49 | 32.25 | 51.01 | -37.69 | 41.48 | 80.10 | 77.78 | 43.75 | 4.09 | 11.71 | -10.37 | 46.54 | |
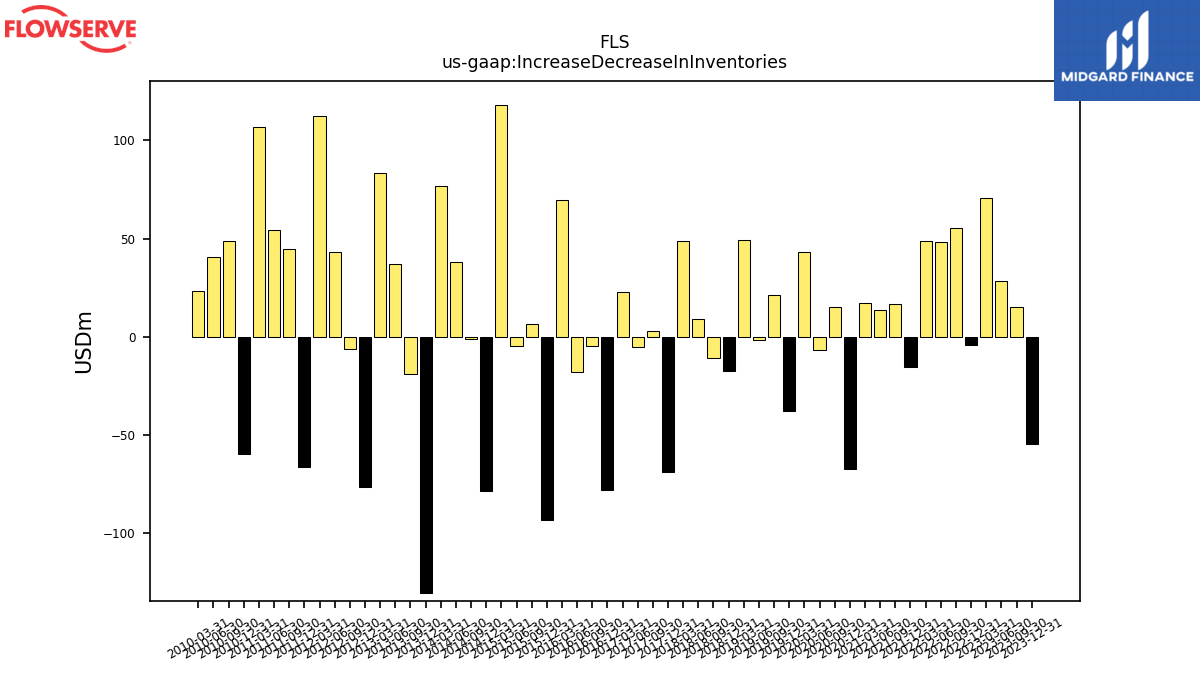
| Increase Decrease In Inventories | -54.77 | 15.36 | 28.52 | 70.72 | -4.45 | 55.20 | 48.02 | 48.72 | -15.41 | 16.75 | 13.80 | 16.99 | -67.28 | 15.40 | -6.65 | 43.23 | -37.64 | 21.09 | -1.87 | 49.48 | -17.39 | -10.71 | 8.81 | 48.60 | -69.00 | 3.08 | -5.39 | 22.67 | -78.25 | -4.49 | -18.00 | 69.86 | -93.30 | 6.53 | -4.84 | 117.85 | -78.33 | -1.26 | 38.12 | 76.99 | -130.36 | -18.93 | 37.17 | 83.50 | -76.55 | -6.49 | 43.23 | 112.51 | -66.33 | 44.78 | 54.61 | 106.69 | -59.62 | 48.73 | 40.55 | 23.25 | |
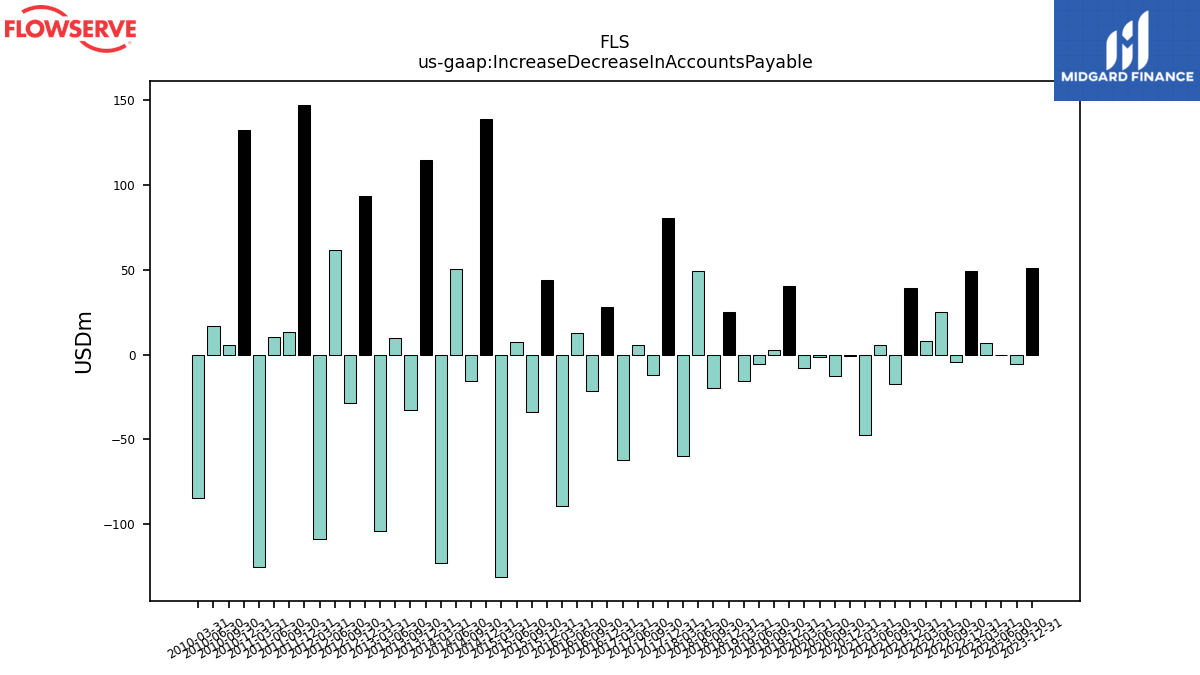
| Increase Decrease In Accounts Payable | 51.16 | -5.21 | 0.11 | 7.01 | 49.66 | -4.24 | 25.35 | 8.20 | 39.09 | -17.45 | 5.95 | -47.09 | -0.81 | -12.62 | -1.27 | -7.87 | 40.76 | 2.77 | -5.26 | -15.40 | 25.14 | -19.41 | 49.09 | -59.65 | 80.42 | -12.08 | 5.99 | -61.92 | 28.01 | -21.42 | 13.07 | -89.49 | 44.29 | -33.93 | 7.21 | -131.21 | 139.13 | -15.73 | 50.40 | -123.05 | 114.64 | -32.65 | 9.55 | -103.88 | 93.35 | -28.41 | 61.84 | -108.60 | 147.52 | 13.14 | 10.47 | -125.28 | 132.70 | 5.64 | 16.70 | -84.31 | |
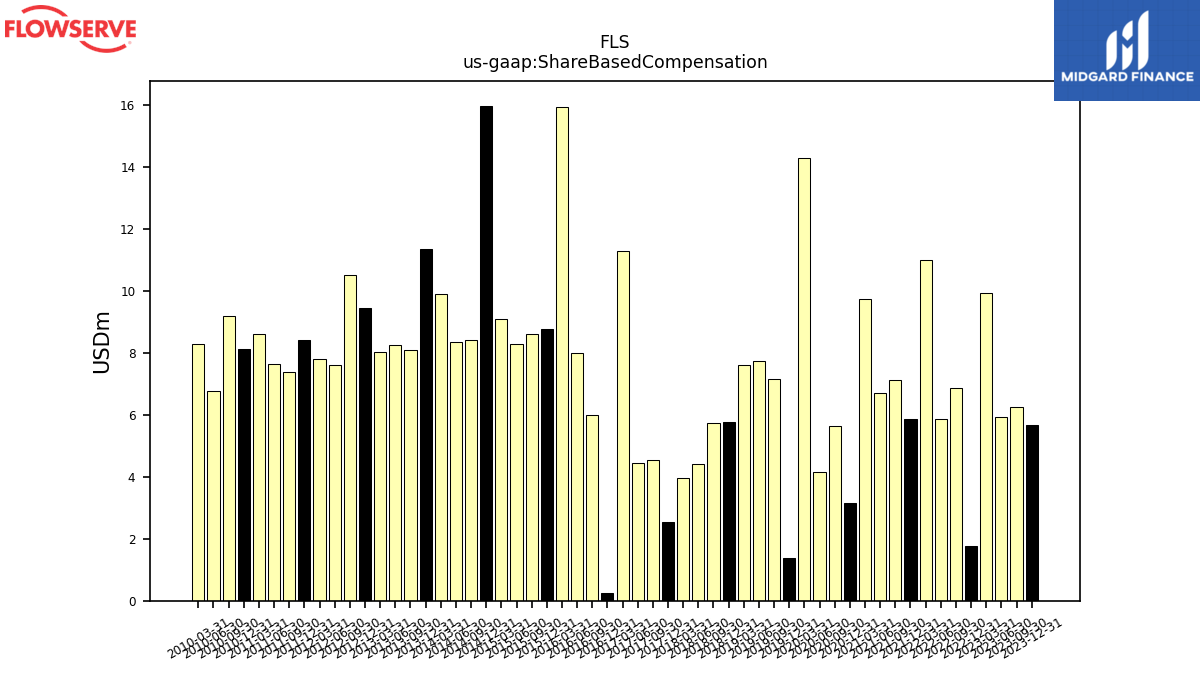
| Share Based Compensation | 5.68 | 6.25 | 5.92 | 9.95 | 1.77 | 6.86 | 5.88 | 11.01 | 5.87 | 7.14 | 6.71 | 9.76 | 3.15 | 5.63 | 4.16 | 14.31 | 1.38 | 7.15 | 7.75 | 7.61 | 5.78 | 5.74 | 4.43 | 3.96 | 2.53 | 4.55 | 4.44 | 11.31 | 0.25 | 6.00 | 8.01 | 15.96 | 8.79 | 8.63 | 8.30 | 9.10 | 15.99 | 8.41 | 8.36 | 9.92 | 11.36 | 8.11 | 8.25 | 8.04 | 9.46 | 10.52 | 7.63 | 7.80 | 8.44 | 7.38 | 7.66 | 8.61 | 8.13 | 9.21 | 6.79 | 8.30 |
| 2023-12-31 | 2023-09-30 | 2023-06-30 | 2023-03-31 | 2022-12-31 | 2022-09-30 | 2022-06-30 | 2022-03-31 | 2021-12-31 | 2021-09-30 | 2021-06-30 | 2021-03-31 | 2020-12-31 | 2020-09-30 | 2020-06-30 | 2020-03-31 | 2019-12-31 | 2019-09-30 | 2019-06-30 | 2019-03-31 | 2018-12-31 | 2018-09-30 | 2018-06-30 | 2018-03-31 | 2017-12-31 | 2017-09-30 | 2017-06-30 | 2017-03-31 | 2016-12-31 | 2016-09-30 | 2016-06-30 | 2016-03-31 | 2015-12-31 | 2015-09-30 | 2015-06-30 | 2015-03-31 | 2014-12-31 | 2014-09-30 | 2014-06-30 | 2014-03-31 | 2013-12-31 | 2013-09-30 | 2013-06-30 | 2013-03-31 | 2012-12-31 | 2012-09-30 | 2012-06-30 | 2012-03-31 | 2011-12-31 | 2011-09-30 | 2011-06-30 | 2011-03-31 | 2010-12-31 | 2010-09-30 | 2010-06-30 | 2010-03-31 | ||
|---|---|---|---|---|---|---|---|---|---|---|---|---|---|---|---|---|---|---|---|---|---|---|---|---|---|---|---|---|---|---|---|---|---|---|---|---|---|---|---|---|---|---|---|---|---|---|---|---|---|---|---|---|---|---|---|---|---|
| Net Cash Provided By Used In Investing Activities | -20.20 | -15.54 | -16.38 | -16.46 | 39.56 | -16.65 | -16.78 | -12.22 | -20.76 | -14.87 | -14.35 | -9.49 | -7.54 | -13.00 | -14.59 | -6.57 | -19.99 | -18.89 | -13.54 | 28.57 | -31.89 | -18.74 | -17.95 | -12.89 | 5.47 | 16.36 | 170.27 | -15.49 | -22.56 | -28.36 | -20.44 | -20.11 | -37.21 | -34.62 | -29.60 | -423.86 | -48.90 | -29.11 | -21.52 | 15.44 | -110.36 | -32.91 | -26.78 | 2.05 | -45.90 | -25.93 | -28.09 | -26.51 | -125.68 | -22.87 | -24.93 | -20.73 | -51.97 | -217.48 | -10.30 | -6.97 | |
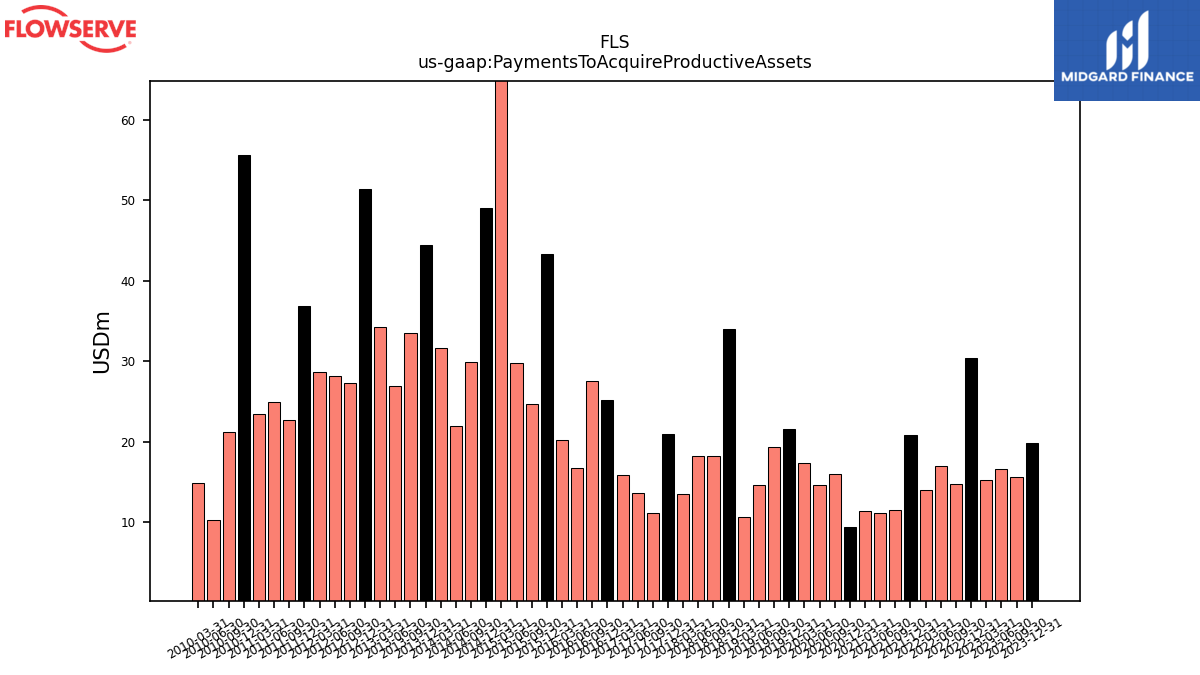
| Payments To Acquire Productive Assets | 19.82 | 15.65 | 16.57 | 15.32 | 30.46 | 14.82 | 16.96 | 14.05 | 20.90 | 11.49 | 11.12 | 11.42 | 9.49 | 15.95 | 14.66 | 17.31 | 21.55 | 19.36 | 14.63 | 10.64 | 34.02 | 18.23 | 18.26 | 13.49 | 20.98 | 11.17 | 13.59 | 15.86 | 25.22 | 27.56 | 16.70 | 20.21 | 43.33 | 24.74 | 29.83 | 83.97 | 49.02 | 29.94 | 22.00 | 31.66 | 44.39 | 33.54 | 26.90 | 34.26 | 51.36 | 27.30 | 28.20 | 28.69 | 36.80 | 22.67 | 25.00 | 23.50 | 55.57 | 21.20 | 10.30 | 14.93 |
| 2023-12-31 | 2023-09-30 | 2023-06-30 | 2023-03-31 | 2022-12-31 | 2022-09-30 | 2022-06-30 | 2022-03-31 | 2021-12-31 | 2021-09-30 | 2021-06-30 | 2021-03-31 | 2020-12-31 | 2020-09-30 | 2020-06-30 | 2020-03-31 | 2019-12-31 | 2019-09-30 | 2019-06-30 | 2019-03-31 | 2018-12-31 | 2018-09-30 | 2018-06-30 | 2018-03-31 | 2017-12-31 | 2017-09-30 | 2017-06-30 | 2017-03-31 | 2016-12-31 | 2016-09-30 | 2016-06-30 | 2016-03-31 | 2015-12-31 | 2015-09-30 | 2015-06-30 | 2015-03-31 | 2014-12-31 | 2014-09-30 | 2014-06-30 | 2014-03-31 | 2013-12-31 | 2013-09-30 | 2013-06-30 | 2013-03-31 | 2012-12-31 | 2012-09-30 | 2012-06-30 | 2012-03-31 | 2011-12-31 | 2011-09-30 | 2011-06-30 | 2011-03-31 | 2010-12-31 | 2010-09-30 | 2010-06-30 | 2010-03-31 | ||
|---|---|---|---|---|---|---|---|---|---|---|---|---|---|---|---|---|---|---|---|---|---|---|---|---|---|---|---|---|---|---|---|---|---|---|---|---|---|---|---|---|---|---|---|---|---|---|---|---|---|---|---|---|---|---|---|---|---|
| Net Cash Provided By Used In Financing Activities | -120.92 | 0.20 | 11.53 | -43.82 | -38.23 | -34.07 | -39.32 | -38.39 | -872.05 | 763.44 | -41.17 | -449.92 | -31.39 | 270.85 | -27.96 | -63.92 | -34.11 | -108.72 | -43.04 | -43.79 | -40.06 | -45.98 | -40.39 | -46.85 | -49.14 | -53.75 | -43.64 | -38.83 | -29.32 | -33.09 | -32.82 | -35.61 | -109.87 | -145.75 | -101.93 | 418.88 | -90.05 | -77.59 | -70.80 | -129.22 | -18.82 | -101.03 | -110.60 | -25.38 | -264.01 | 2.25 | -132.60 | -34.57 | -128.92 | -47.13 | -35.38 | -27.53 | -74.54 | -29.18 | -26.02 | -13.18 | |
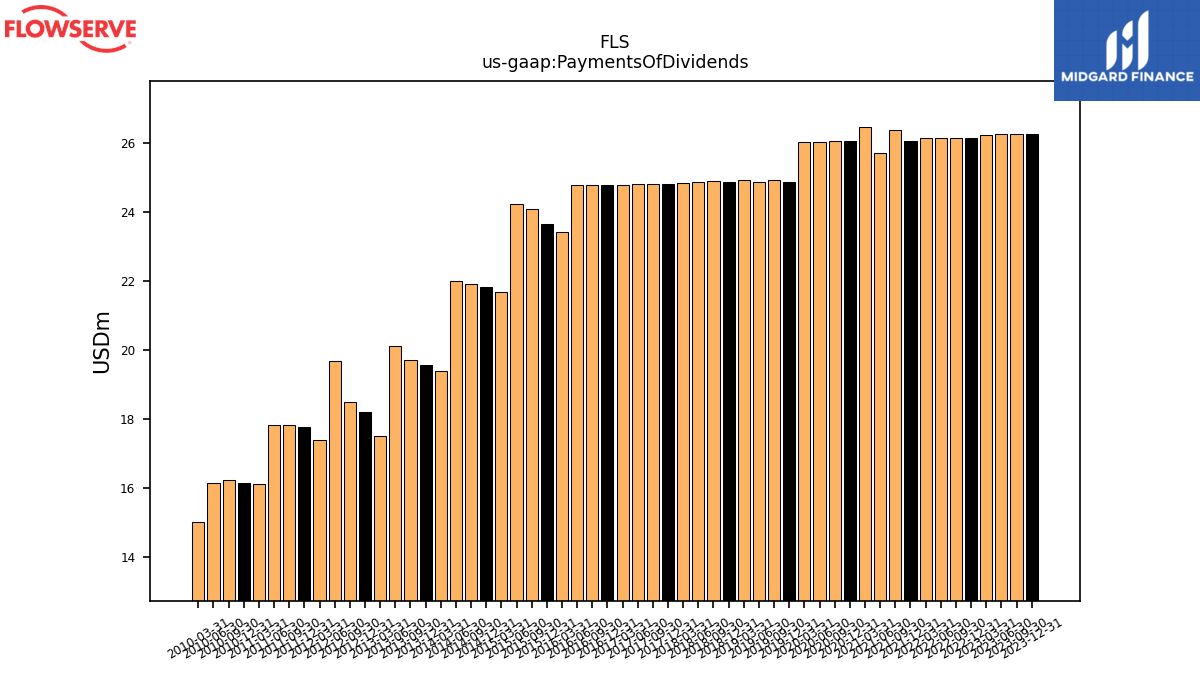
| Payments Of Dividends | 26.24 | 26.24 | 26.24 | 26.23 | 26.14 | 26.14 | 26.14 | 26.13 | 26.05 | 26.38 | 25.70 | 26.46 | 26.05 | 26.05 | 26.03 | 26.02 | 24.86 | 24.92 | 24.86 | 24.91 | 24.87 | 24.90 | 24.86 | 24.83 | 24.82 | 24.80 | 24.79 | 24.79 | 24.79 | 24.78 | 24.77 | 23.41 | 23.65 | 24.07 | 24.24 | 21.69 | 21.83 | 21.91 | 22.00 | 19.39 | 19.56 | 19.72 | 20.11 | 17.51 | 18.20 | 18.49 | 19.67 | 17.41 | 17.76 | 17.82 | 17.84 | 16.13 | 16.16 | 16.25 | 16.16 | 15.02 |
| 2023-12-31 | 2023-09-30 | 2023-06-30 | 2023-03-31 | 2022-12-31 | 2022-09-30 | 2022-06-30 | 2022-03-31 | 2021-12-31 | 2021-09-30 | 2021-06-30 | 2021-03-31 | 2020-12-31 | 2020-09-30 | 2020-06-30 | 2020-03-31 | 2019-12-31 | 2019-09-30 | 2019-06-30 | 2019-03-31 | 2018-12-31 | 2018-09-30 | 2018-06-30 | 2018-03-31 | 2017-12-31 | 2017-09-30 | 2017-06-30 | 2017-03-31 | 2016-12-31 | 2016-09-30 | 2016-06-30 | 2016-03-31 | 2015-12-31 | 2015-09-30 | 2015-06-30 | 2015-03-31 | 2014-12-31 | 2014-09-30 | 2014-06-30 | 2014-03-31 | 2013-12-31 | 2013-09-30 | 2013-06-30 | 2013-03-31 | 2012-12-31 | 2012-09-30 | 2012-06-30 | 2012-03-31 | 2011-12-31 | 2011-09-30 | 2011-06-30 | 2011-03-31 | 2010-12-31 | 2010-09-30 | 2010-06-30 | 2010-03-31 | ||
|---|---|---|---|---|---|---|---|---|---|---|---|---|---|---|---|---|---|---|---|---|---|---|---|---|---|---|---|---|---|---|---|---|---|---|---|---|---|---|---|---|---|---|---|---|---|---|---|---|---|---|---|---|---|---|---|---|---|
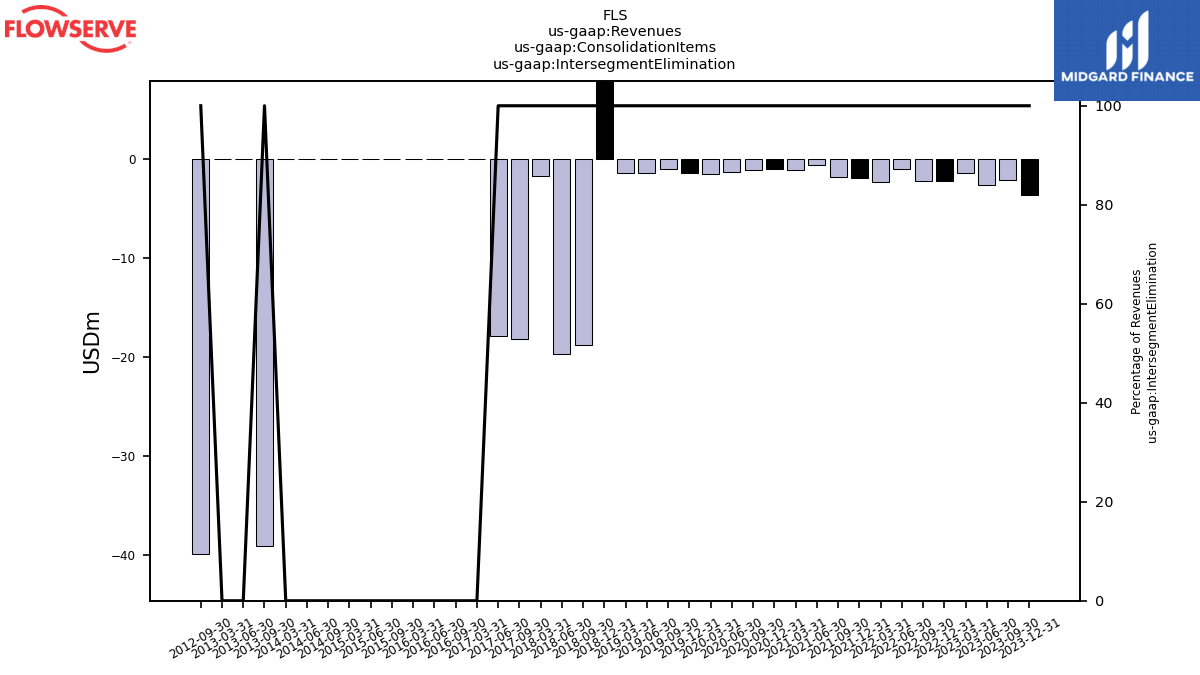
| Revenues | 1165.18 | 1094.72 | 1080.38 | 980.30 | 1038.96 | 872.88 | 882.22 | 821.06 | 919.50 | 866.12 | 898.18 | 857.31 | 985.30 | 924.30 | 924.97 | 894.46 | 1068.20 | 996.54 | 990.08 | 890.05 | 986.90 | 952.72 | 973.13 | 919.95 | 1034.10 | 883.38 | 877.06 | 866.32 | 1074.80 | 943.33 | 1026.23 | 947.25 | 1287.70 | 1096.48 | 1162.25 | 1014.62 | 1381.40 | 1204.01 | 1224.38 | 1068.14 | 1389.40 | 1229.06 | 1239.53 | 1096.60 | 1328.20 | 1165.92 | 1182.22 | 1074.98 | 1265.40 | 1121.81 | 1125.75 | 997.21 | 1140.30 | 971.68 | 961.10 | 958.91 | |
| Intersegment Elimination | -3.67 | -2.12 | -2.71 | -1.43 | -2.26 | -2.30 | -1.05 | -2.38 | -2.00 | -1.84 | -0.67 | -1.16 | -1.09 | -1.13 | -1.34 | -1.52 | -1.50 | -1.01 | -1.47 | -1.48 | 55.19 | -18.81 | -19.74 | -1.73 | NA | -18.23 | -17.88 | 0.00 | NA | 0.00 | 0.00 | 0.00 | NA | 0.00 | 0.00 | 0.00 | NA | 0.00 | 0.00 | 0.00 | NA | -39.08 | 0.00 | 0.00 | NA | -39.83 | NA | NA | NA | NA | NA | NA | NA | NA | NA | NA | |
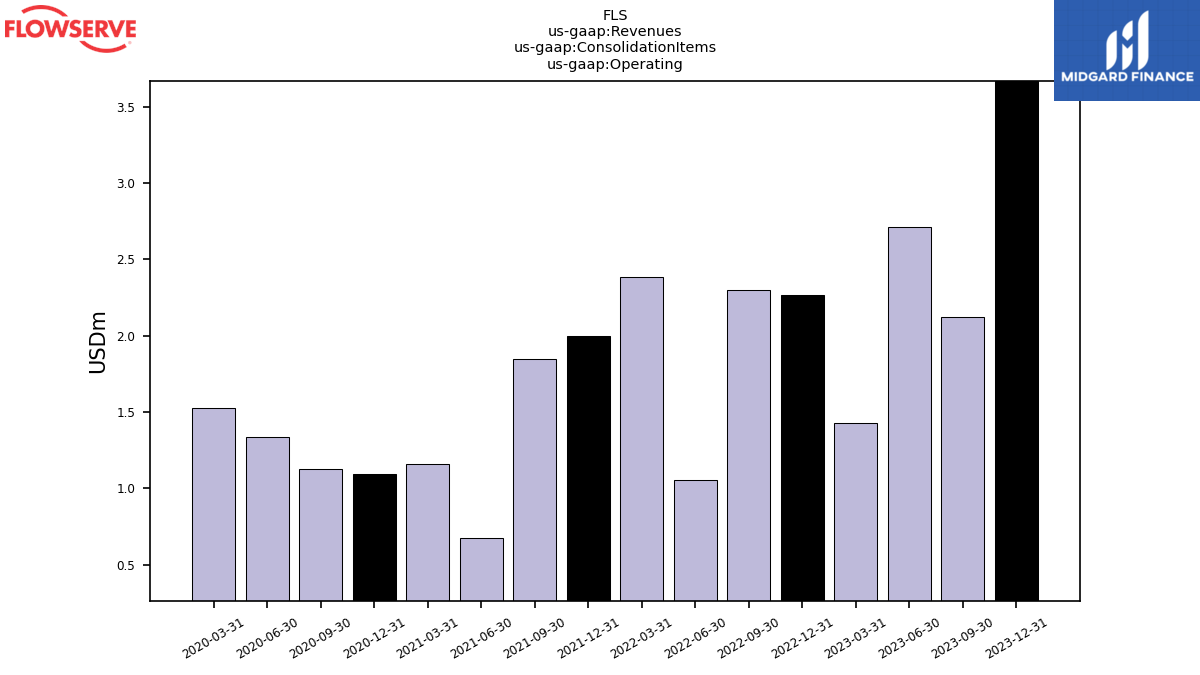
| Operating | 3.67 | 2.12 | 2.71 | 1.43 | 2.26 | 2.30 | 1.05 | 2.38 | 2.00 | 1.84 | 0.67 | 1.16 | 1.09 | 1.13 | 1.34 | 1.52 | NA | NA | NA | NA | NA | NA | NA | NA | NA | NA | NA | NA | NA | NA | NA | NA | NA | NA | NA | NA | NA | NA | NA | NA | NA | NA | NA | NA | NA | NA | NA | NA | NA | NA | NA | NA | NA | NA | NA | NA | |
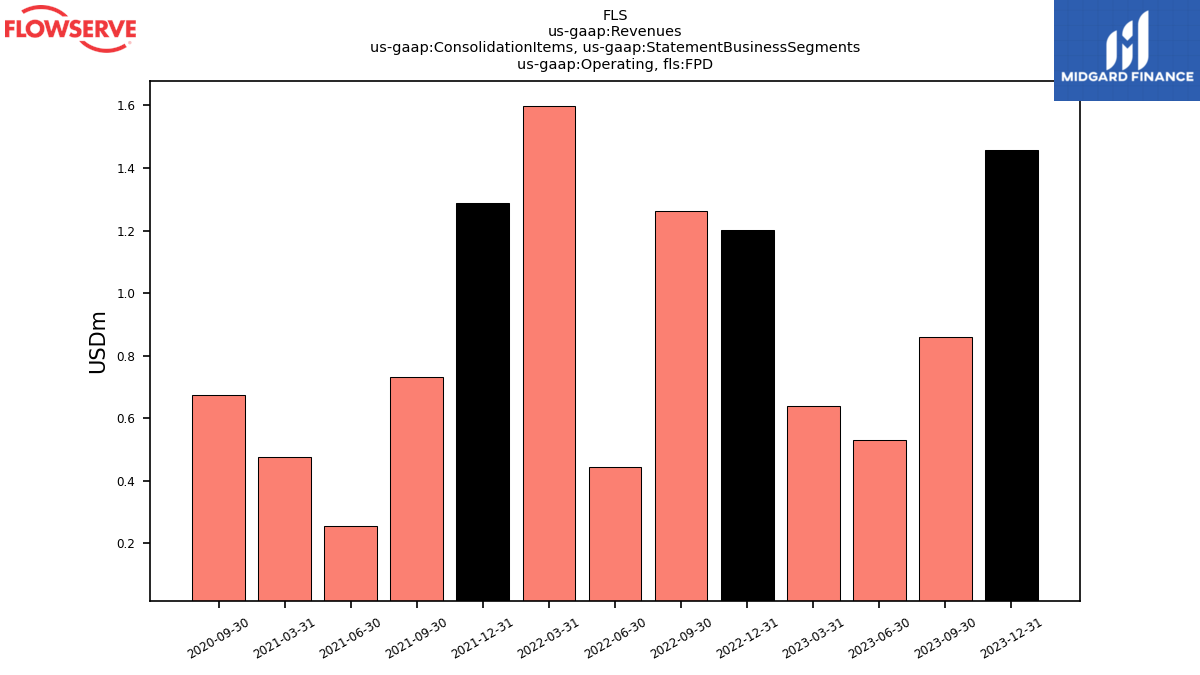
| Operating,FPD | 1.46 | 0.86 | 0.53 | 0.64 | 1.20 | 1.26 | 0.45 | 1.60 | 1.29 | 0.73 | 0.26 | 0.48 | NA | 0.67 | NA | NA | NA | NA | NA | NA | NA | NA | NA | NA | NA | NA | NA | NA | NA | NA | NA | NA | NA | NA | NA | NA | NA | NA | NA | NA | NA | NA | NA | NA | NA | NA | NA | NA | NA | NA | NA | NA | NA | NA | NA | NA | |
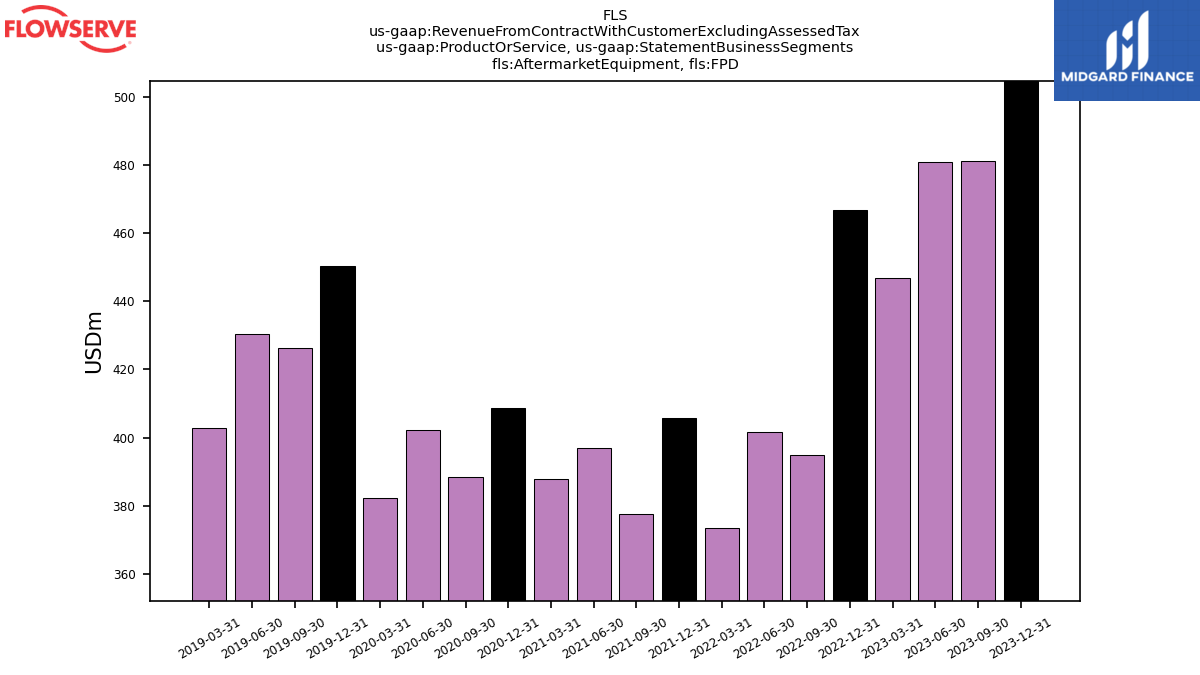
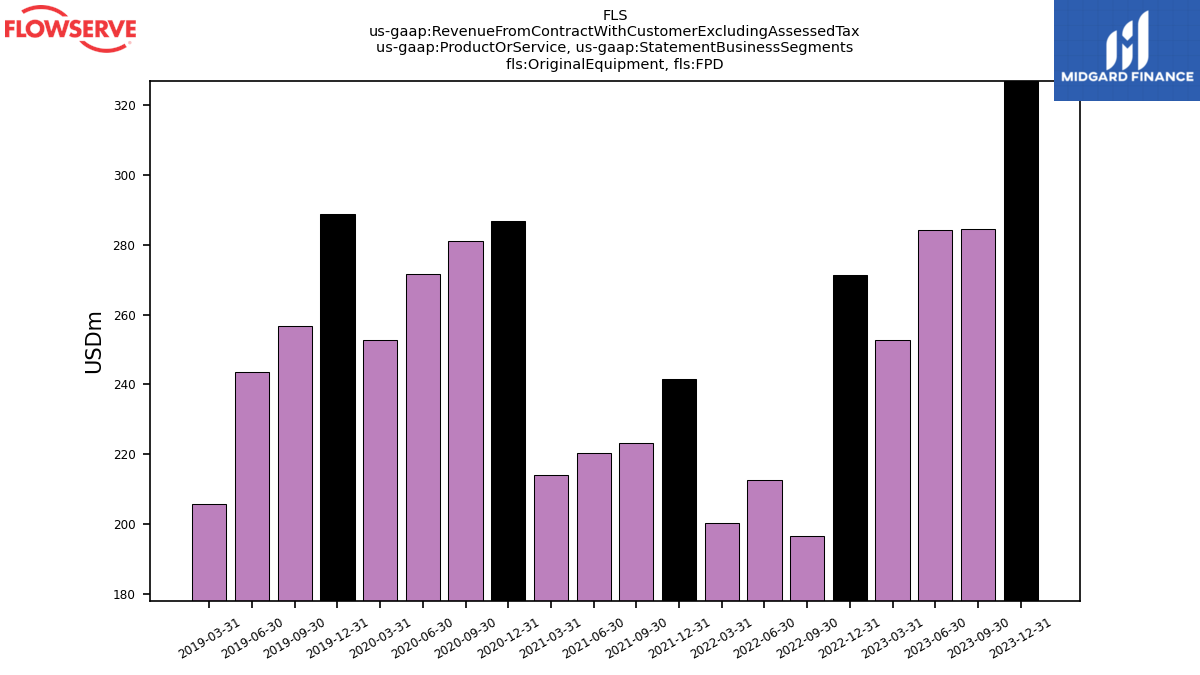
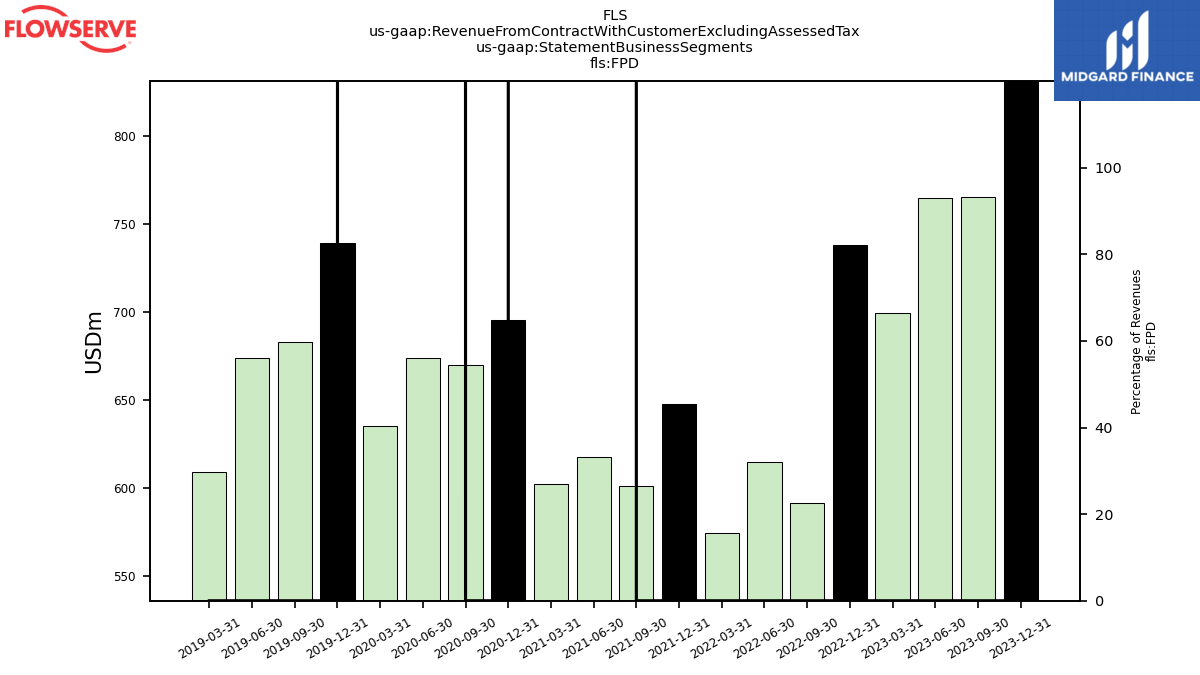
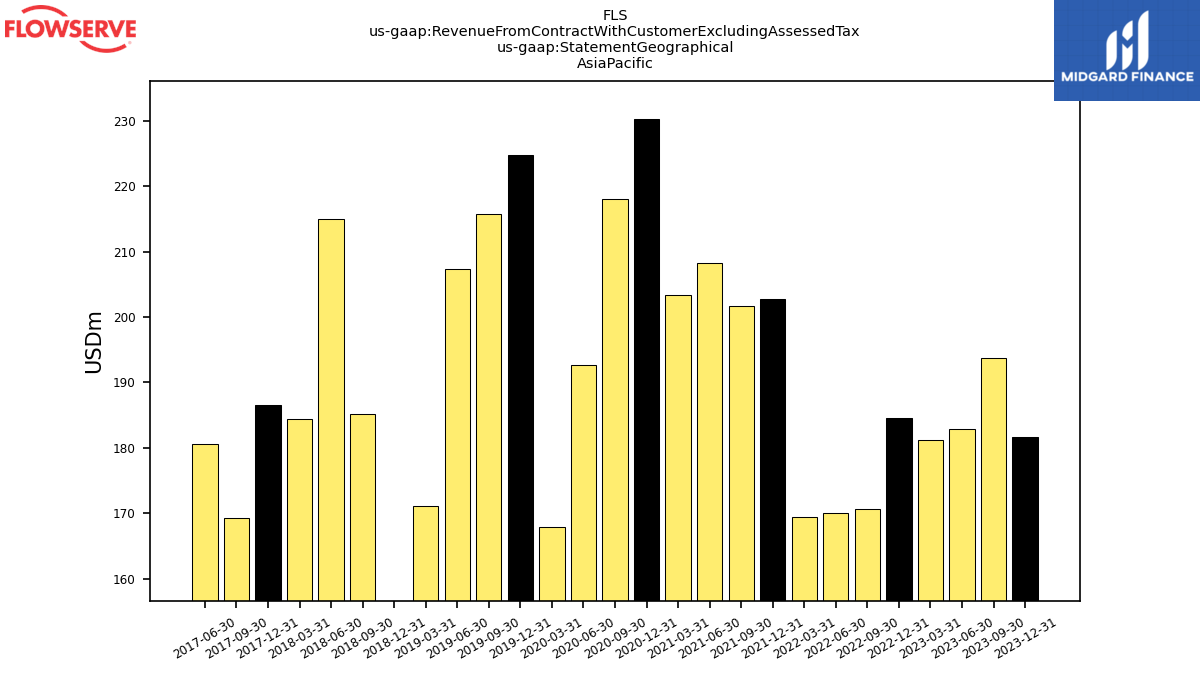
| Revenue From Contract With Customer Excluding Assessed Tax | 1165.18 | 1094.72 | 1080.38 | 980.30 | 1038.96 | 872.88 | 882.22 | 821.06 | 919.50 | 866.12 | 898.18 | 857.31 | 985.30 | 924.30 | 924.97 | 894.46 | 1068.20 | 996.54 | 990.08 | 890.05 | 986.90 | 952.72 | 973.13 | 919.95 | 1034.10 | 883.38 | 877.06 | 866.32 | 1074.80 | 943.33 | 1026.23 | 947.25 | 1287.70 | 1096.48 | 1162.25 | 1014.62 | 1381.40 | 1204.01 | 1224.38 | 1068.14 | 1389.40 | 1229.06 | 1239.53 | 1096.60 | 1328.20 | 1165.92 | 1182.22 | 1074.98 | 1265.40 | 1121.81 | 1125.75 | 997.21 | 1140.30 | 971.68 | 961.10 | 958.91 | |
| Operating | 1165.18 | 1094.72 | 1080.38 | 980.30 | 1038.96 | 872.88 | 882.22 | 821.06 | 919.46 | 866.12 | 898.18 | 857.31 | 985.31 | 924.30 | 924.97 | 894.46 | 1063.02 | 996.54 | 990.08 | 890.05 | 989.90 | 952.72 | 973.13 | 919.95 | NA | 883.38 | 877.06 | 866.32 | NA | 945.94 | 1027.39 | NA | NA | NA | NA | NA | NA | NA | NA | NA | NA | NA | NA | NA | NA | NA | NA | NA | NA | NA | NA | NA | NA | NA | NA | NA | |
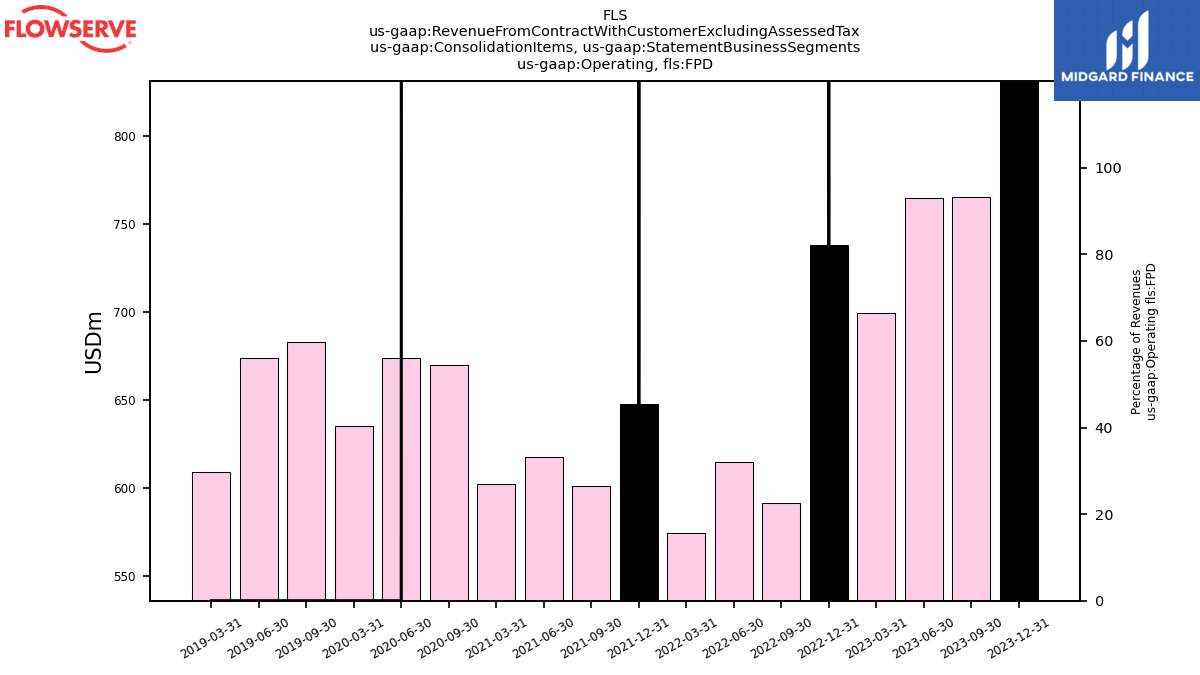
| Operating,FPD | 831.35 | 765.31 | 764.85 | 699.48 | 738.24 | 591.35 | 614.42 | 573.99 | 647.39 | 601.11 | 617.43 | 602.17 | NA | 669.53 | 673.55 | 635.13 | NA | 682.80 | 673.97 | 608.76 | NA | NA | NA | NA | NA | NA | NA | NA | NA | NA | NA | NA | NA | NA | NA | NA | NA | NA | NA | NA | NA | NA | NA | NA | NA | NA | NA | NA | NA | NA | NA | NA | NA | NA | NA | NA | |
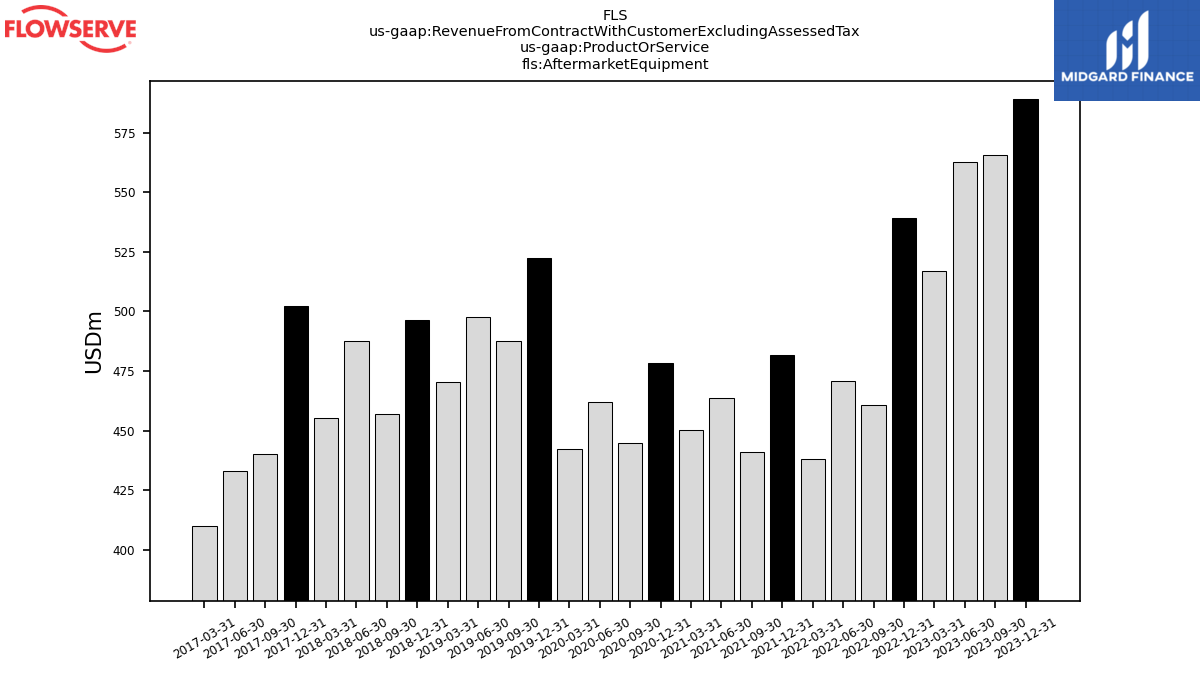
| Aftermarket Equipment | 588.97 | 565.53 | 562.55 | 516.82 | 539.02 | 460.79 | 470.87 | 437.88 | 481.81 | 440.87 | 463.69 | 450.42 | 478.42 | 444.88 | 462.19 | 442.16 | 522.43 | 487.60 | 497.53 | 470.20 | 496.39 | 457.15 | 487.68 | 455.40 | 502.14 | 439.97 | 433.00 | 409.75 | NA | NA | NA | NA | NA | NA | NA | NA | NA | NA | NA | NA | NA | NA | NA | NA | NA | NA | NA | NA | NA | NA | NA | NA | NA | NA | NA | NA | |
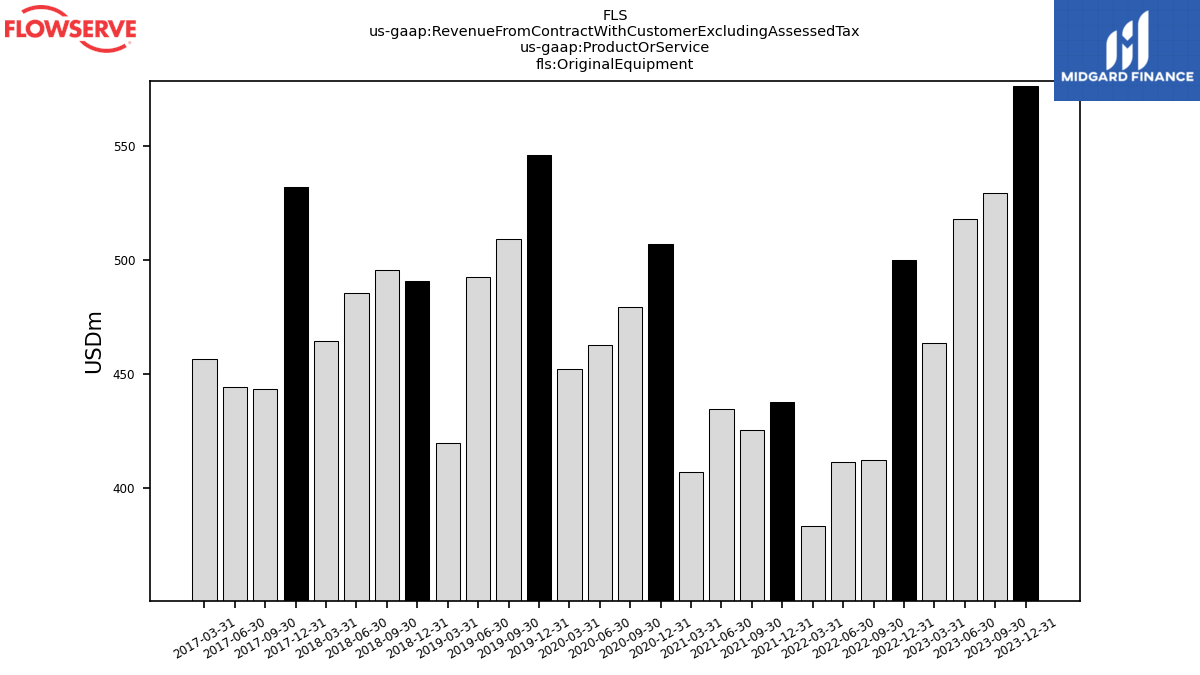
| Original Equipment | 576.21 | 529.18 | 517.82 | 463.49 | 499.94 | 412.09 | 411.36 | 383.18 | 437.65 | 425.25 | 434.48 | 406.88 | 506.89 | 479.42 | 462.78 | 452.30 | 545.75 | 508.95 | 492.55 | 419.85 | 490.48 | 495.56 | 485.45 | 464.56 | 531.93 | 443.41 | 444.06 | 456.57 | NA | NA | NA | NA | NA | NA | NA | NA | NA | NA | NA | NA | NA | NA | NA | NA | NA | NA | NA | NA | NA | NA | NA | NA | NA | NA | NA | NA | |
| Aftermarket Equipment,FPD | 504.55 | 480.99 | 480.80 | 446.75 | 466.82 | 394.81 | 401.67 | 373.65 | 405.78 | 377.75 | 397.05 | 388.00 | 408.73 | 388.58 | 402.09 | 382.39 | 450.30 | 426.13 | 430.34 | 402.96 | NA | NA | NA | NA | NA | NA | NA | NA | NA | NA | NA | NA | NA | NA | NA | NA | NA | NA | NA | NA | NA | NA | NA | NA | NA | NA | NA | NA | NA | NA | NA | NA | NA | NA | NA | NA | |
| Original Equipment,FPD | 326.80 | 284.32 | 284.05 | 252.73 | 271.42 | 196.54 | 212.76 | 200.34 | 241.61 | 223.36 | 220.39 | 214.16 | 286.76 | 280.95 | 271.46 | 252.73 | 288.63 | 256.66 | 243.62 | 205.80 | NA | NA | NA | NA | NA | NA | NA | NA | NA | NA | NA | NA | NA | NA | NA | NA | NA | NA | NA | NA | NA | NA | NA | NA | NA | NA | NA | NA | NA | NA | NA | NA | NA | NA | NA | NA | |
| FPD | 831.35 | 765.31 | 764.85 | 699.48 | 738.24 | 591.35 | 614.42 | 573.99 | 647.39 | 601.11 | 617.43 | 602.17 | 695.49 | 669.53 | 673.55 | 635.13 | 738.92 | 682.80 | 673.97 | 608.76 | NA | NA | NA | NA | NA | NA | NA | NA | NA | NA | NA | NA | NA | NA | NA | NA | NA | NA | NA | NA | NA | NA | NA | NA | NA | NA | NA | NA | NA | NA | NA | NA | NA | NA | NA | NA | |
| 181.66 | 193.72 | 182.90 | 181.20 | 184.61 | 170.56 | 169.97 | 169.39 | 202.79 | 201.69 | 208.32 | 203.31 | 230.29 | 218.06 | 192.60 | 167.96 | 224.76 | 215.83 | 207.40 | 171.14 | -44.52 | 185.15 | 214.97 | 184.34 | 186.57 | 169.33 | 180.65 | NA | NA | NA | NA | NA | NA | NA | NA | NA | NA | NA | NA | NA | NA | NA | NA | NA | NA | NA | NA | NA | NA | NA | NA | NA | NA | NA | NA | NA | ||
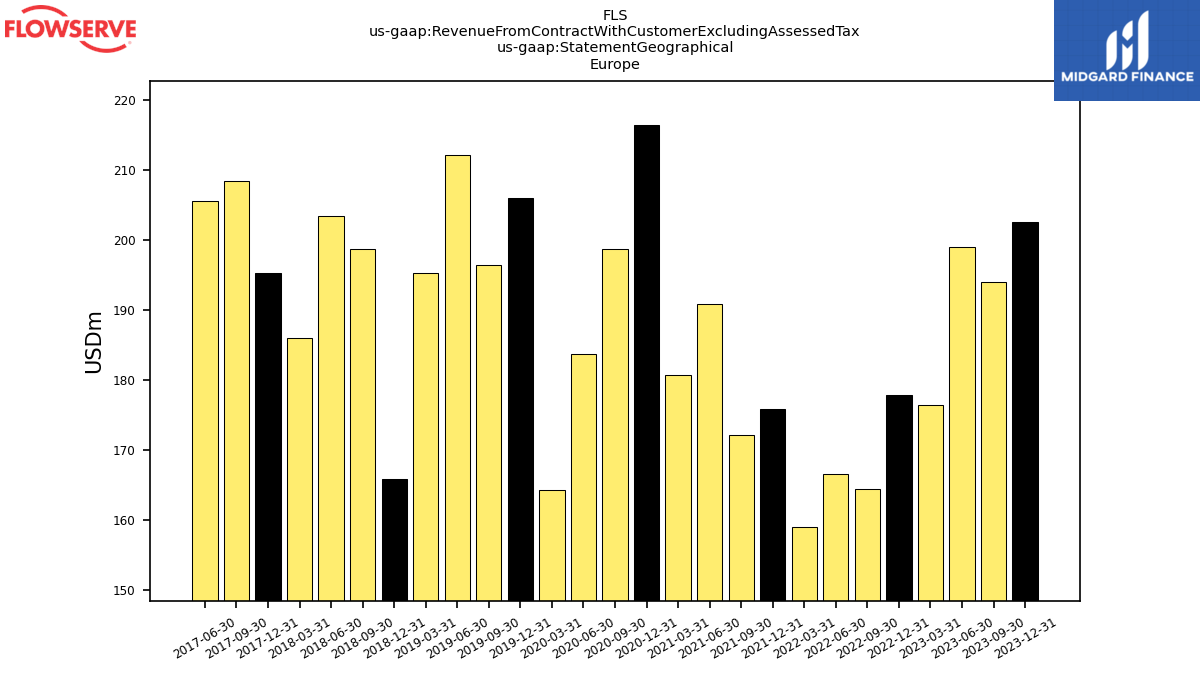
| 202.67 | 194.10 | 199.04 | 176.53 | 177.93 | 164.47 | 166.57 | 159.10 | 175.87 | 172.11 | 190.84 | 180.69 | 216.54 | 198.74 | 183.78 | 164.32 | 206.06 | 196.52 | 212.15 | 195.31 | 165.94 | 198.75 | 203.50 | 186.10 | 195.30 | 208.52 | 205.66 | NA | NA | NA | NA | NA | NA | NA | NA | NA | NA | NA | NA | NA | NA | NA | NA | NA | NA | NA | NA | NA | NA | NA | NA | NA | NA | NA | NA | NA | ||
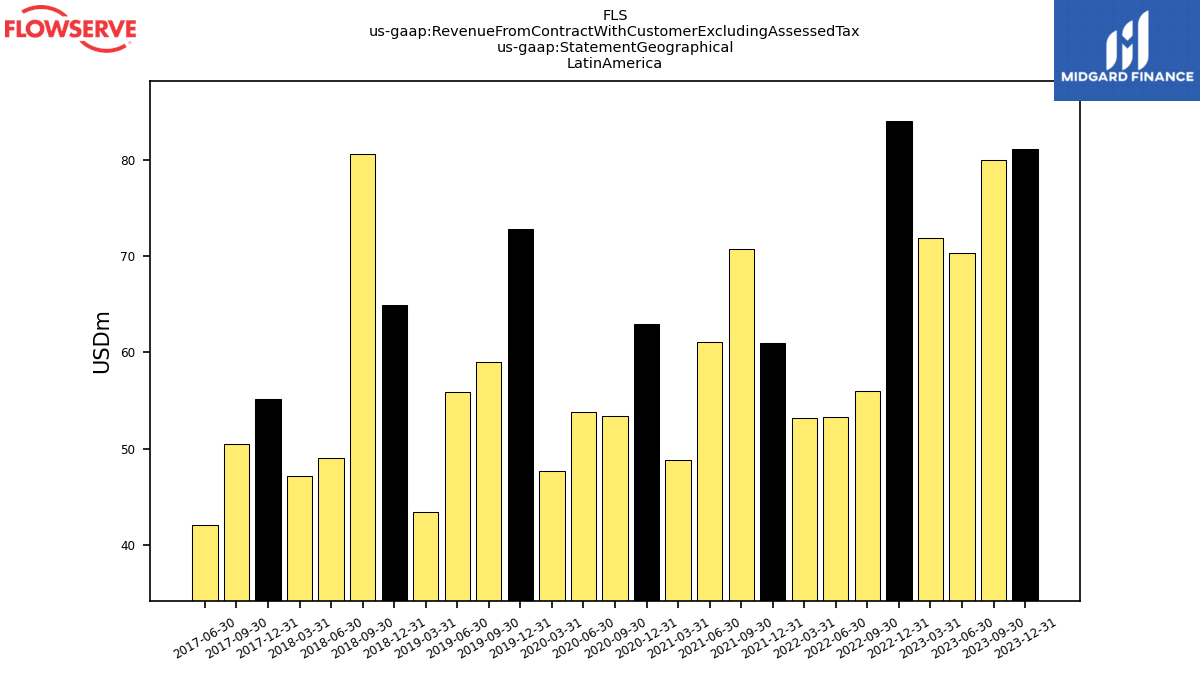
| 81.14 | 79.97 | 70.30 | 71.85 | 84.02 | 56.02 | 53.25 | 53.17 | 60.99 | 70.76 | 61.10 | 48.86 | 62.99 | 53.41 | 53.81 | 47.70 | 72.86 | 59.02 | 55.86 | 43.40 | 64.97 | 80.67 | 48.99 | 47.14 | 55.19 | 50.52 | 42.01 | NA | NA | NA | NA | NA | NA | NA | NA | NA | NA | NA | NA | NA | NA | NA | NA | NA | NA | NA | NA | NA | NA | NA | NA | NA | NA | NA | NA | NA | ||
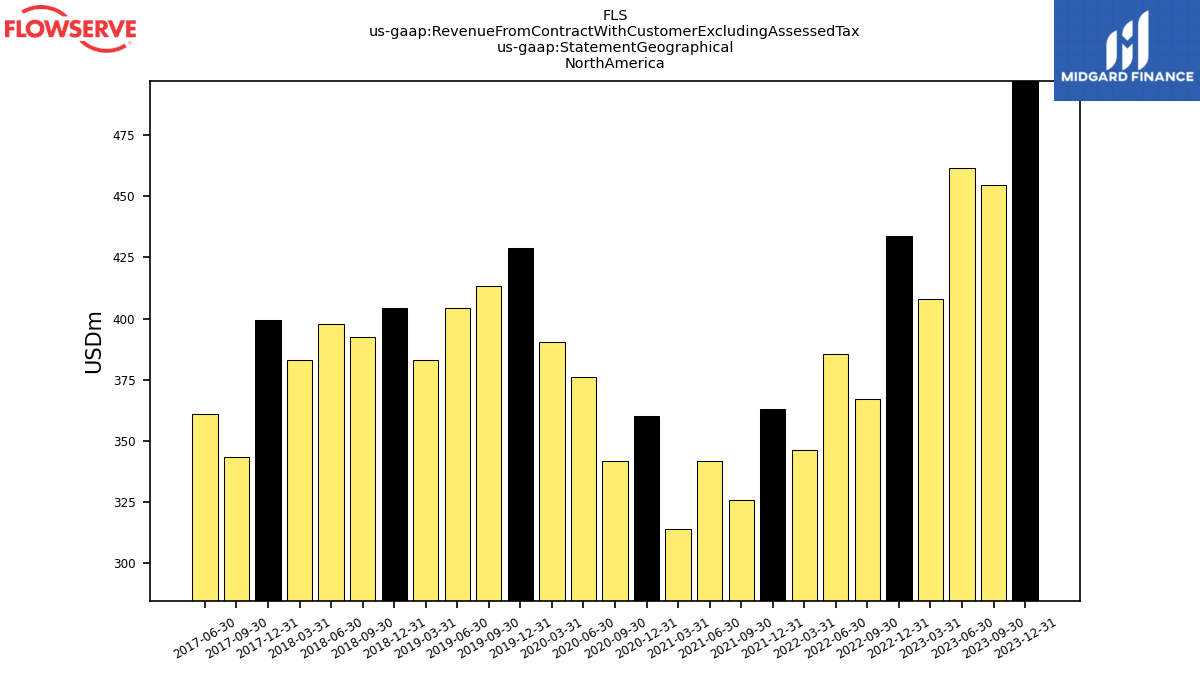
| 497.08 | 454.43 | 461.44 | 407.95 | 433.83 | 367.23 | 385.45 | 346.34 | 363.12 | 325.98 | 341.73 | 314.22 | 360.18 | 341.72 | 376.35 | 390.64 | 428.77 | 413.46 | 404.45 | 382.95 | 404.49 | 392.38 | 397.81 | 383.28 | 399.53 | 343.40 | 361.19 | NA | NA | NA | NA | NA | NA | NA | NA | NA | NA | NA | NA | NA | NA | NA | NA | NA | NA | NA | NA | NA | NA | NA | NA | NA | NA | NA | NA | NA | ||
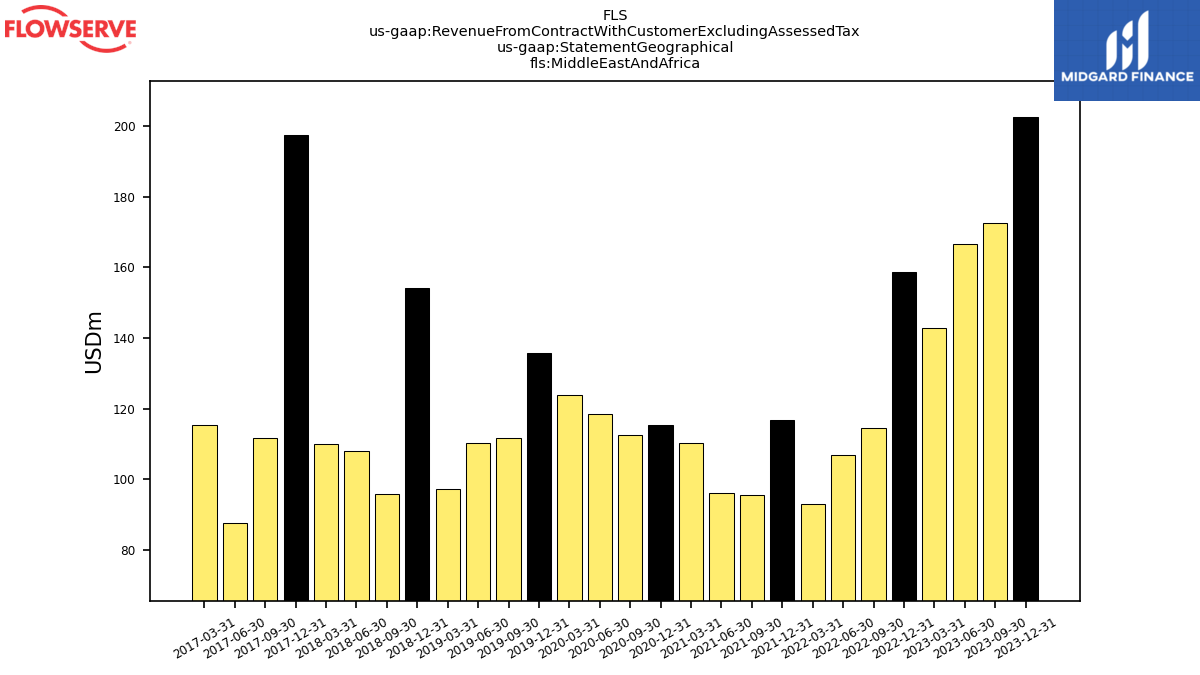
| Middle East And Africa | 202.63 | 172.50 | 166.69 | 142.77 | 158.57 | 114.59 | 106.98 | 93.05 | 116.69 | 95.57 | 96.19 | 110.23 | 115.31 | 112.38 | 118.43 | 123.83 | 135.72 | 111.70 | 110.22 | 97.26 | 154.23 | 95.77 | 107.86 | 109.88 | 197.47 | 111.61 | 87.56 | 115.41 | NA | NA | NA | NA | NA | NA | NA | NA | NA | NA | NA | NA | NA | NA | NA | NA | NA | NA | NA | NA | NA | NA | NA | NA | NA | NA | NA | NA | |
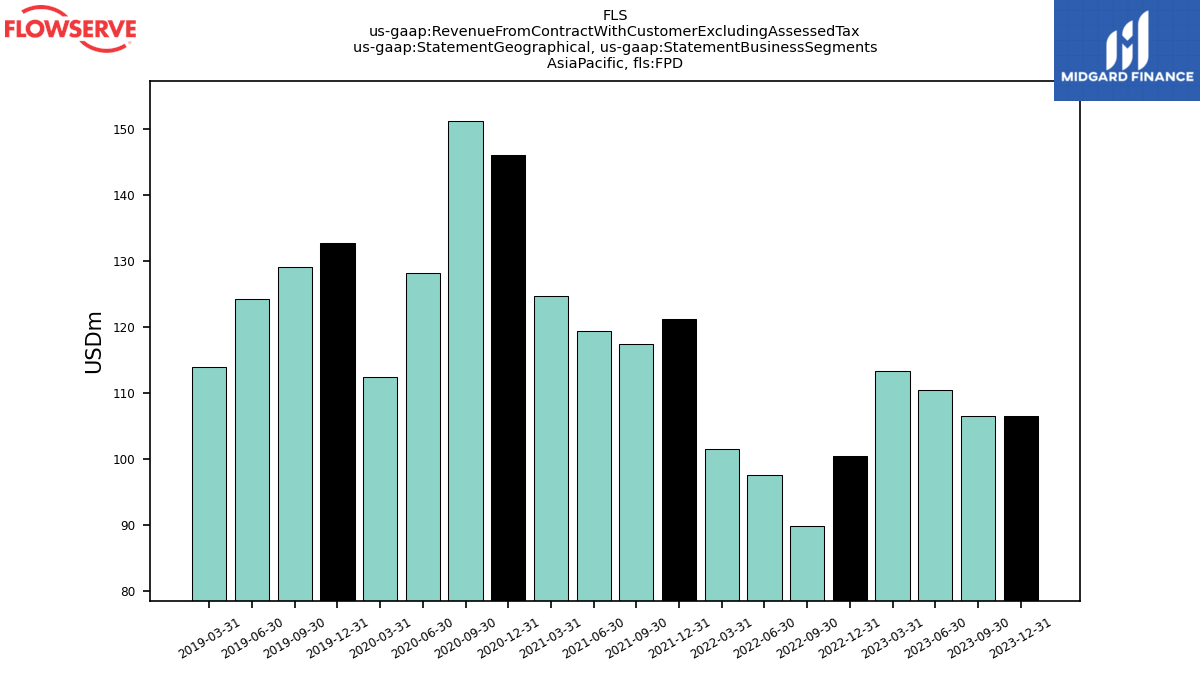
| ,FPD | 106.57 | 106.45 | 110.39 | 113.37 | 100.39 | 89.79 | 97.56 | 101.60 | 121.15 | 117.42 | 119.38 | 124.65 | 146.00 | 151.23 | 128.10 | 112.45 | 132.73 | 129.05 | 124.21 | 113.95 | NA | NA | NA | NA | NA | NA | NA | NA | NA | NA | NA | NA | NA | NA | NA | NA | NA | NA | NA | NA | NA | NA | NA | NA | NA | NA | NA | NA | NA | NA | NA | NA | NA | NA | NA | NA | |
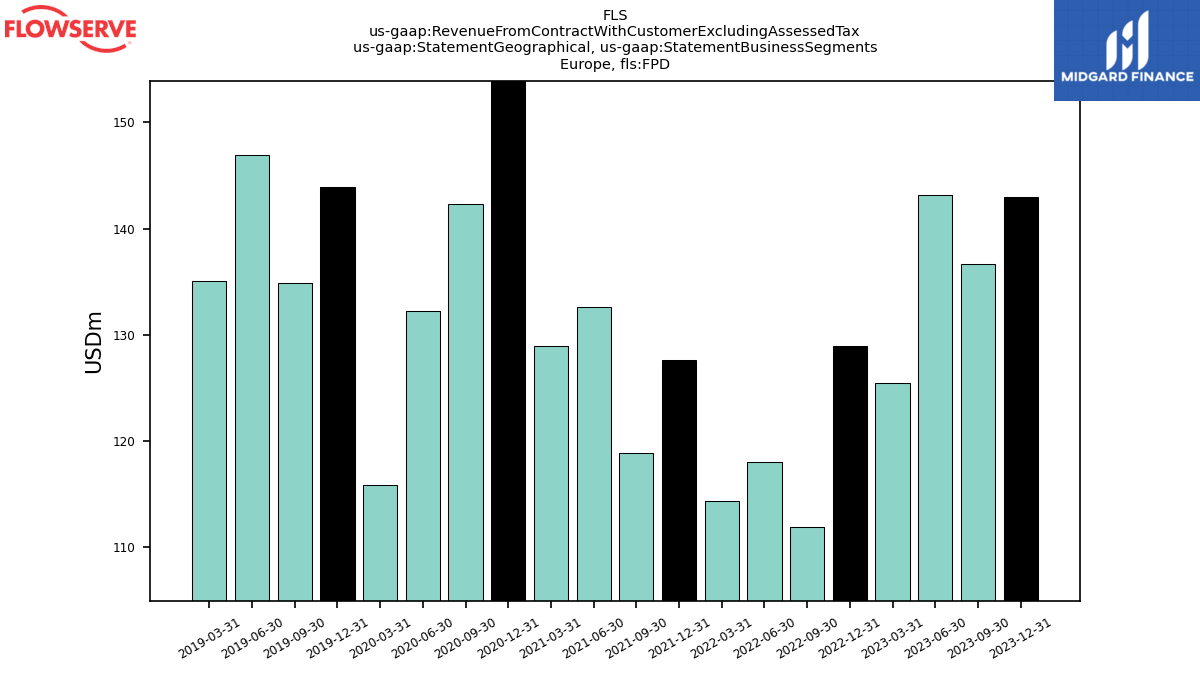
| ,FPD | 143.00 | 136.67 | 143.20 | 125.48 | 128.94 | 111.92 | 117.98 | 114.36 | 127.57 | 118.81 | 132.57 | 128.96 | 155.37 | 142.35 | 132.19 | 115.79 | 143.88 | 134.85 | 146.91 | 135.07 | NA | NA | NA | NA | NA | NA | NA | NA | NA | NA | NA | NA | NA | NA | NA | NA | NA | NA | NA | NA | NA | NA | NA | NA | NA | NA | NA | NA | NA | NA | NA | NA | NA | NA | NA | NA | |
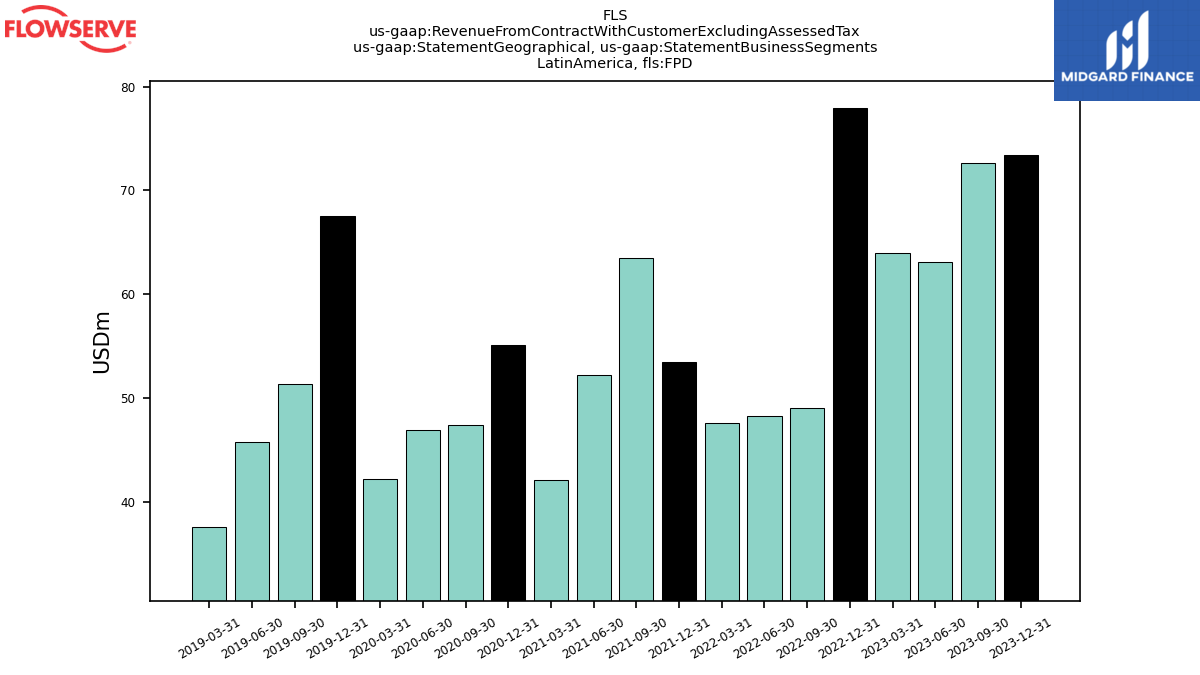
| ,FPD | 73.40 | 72.64 | 63.11 | 63.99 | 77.90 | 49.06 | 48.29 | 47.62 | 53.45 | 63.44 | 52.22 | 42.04 | 55.07 | 47.35 | 46.91 | 42.19 | 67.53 | 51.34 | 45.77 | 37.60 | NA | NA | NA | NA | NA | NA | NA | NA | NA | NA | NA | NA | NA | NA | NA | NA | NA | NA | NA | NA | NA | NA | NA | NA | NA | NA | NA | NA | NA | NA | NA | NA | NA | NA | NA | NA | |
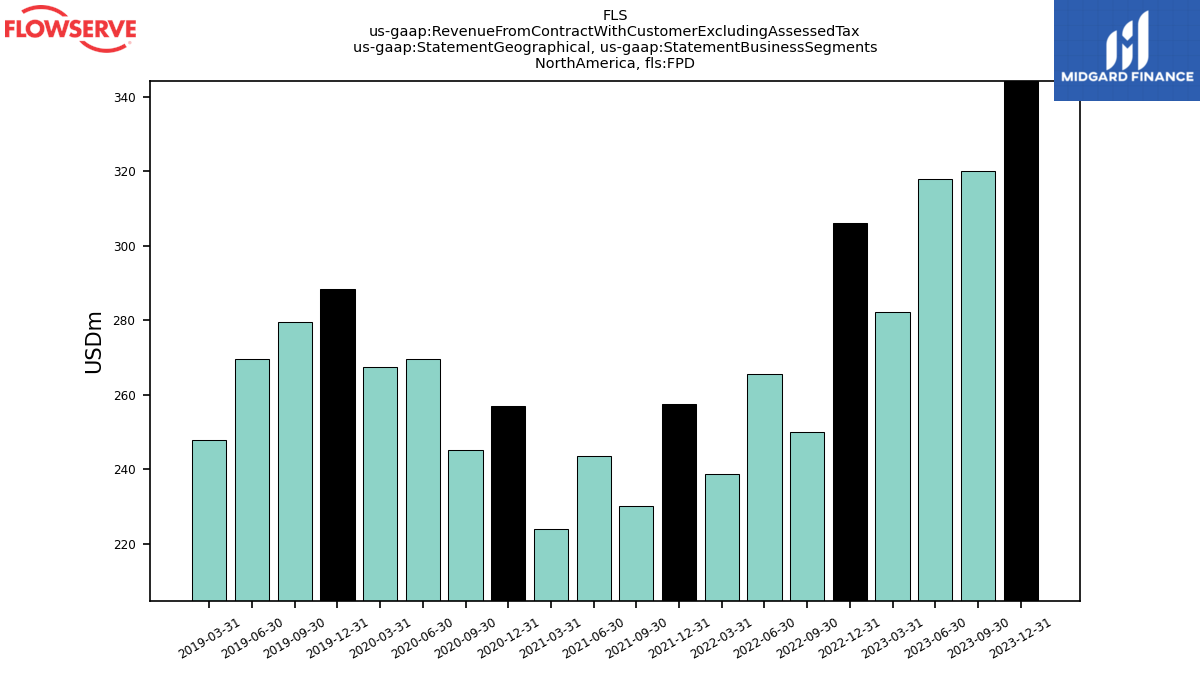
| ,FPD | 344.24 | 320.18 | 317.99 | 282.27 | 306.06 | 249.97 | 265.66 | 238.71 | 257.57 | 230.13 | 243.61 | 223.97 | 256.88 | 245.28 | 269.61 | 267.52 | 288.54 | 279.58 | 269.74 | 247.77 | NA | NA | NA | NA | NA | NA | NA | NA | NA | NA | NA | NA | NA | NA | NA | NA | NA | NA | NA | NA | NA | NA | NA | NA | NA | NA | NA | NA | NA | NA | NA | NA | NA | NA | NA | NA | |
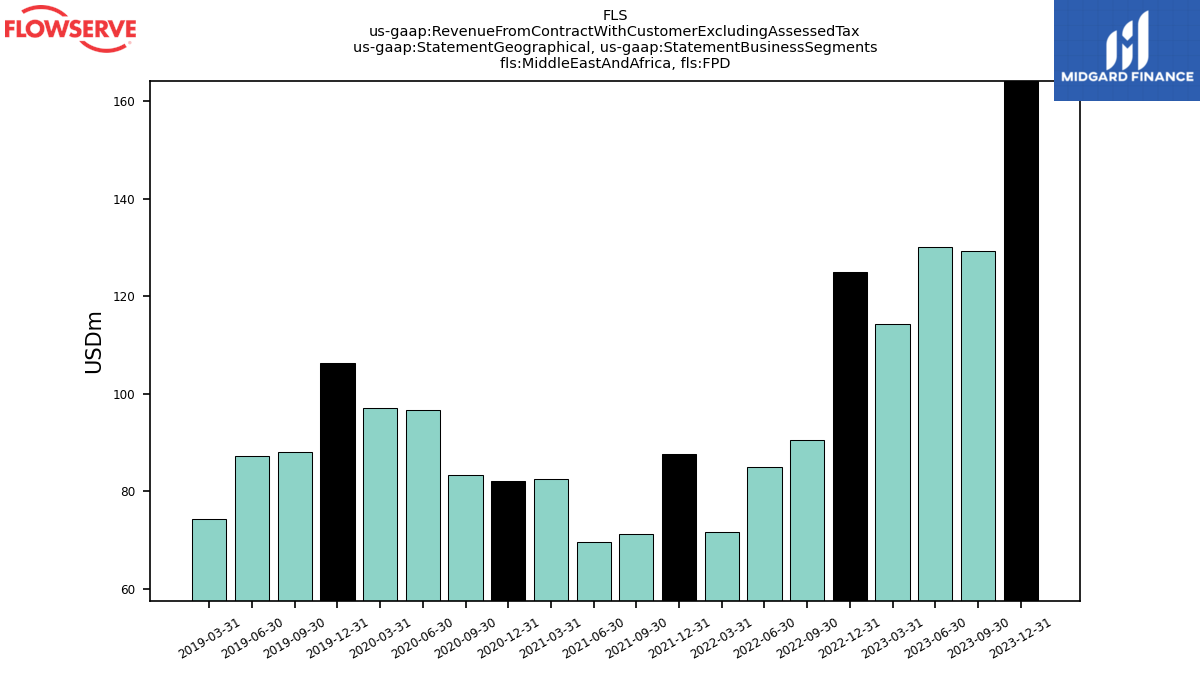
| Middle East And Africa,FPD | 164.15 | 129.37 | 130.16 | 114.37 | 124.94 | 90.60 | 84.94 | 71.70 | 87.66 | 71.30 | 69.66 | 82.54 | 82.17 | 83.33 | 96.74 | 97.17 | 106.24 | 87.98 | 87.34 | 74.37 | NA | NA | NA | NA | NA | NA | NA | NA | NA | NA | NA | NA | NA | NA | NA | NA | NA | NA | NA | NA | NA | NA | NA | NA | NA | NA | NA | NA | NA | NA | NA | NA | NA | NA | NA | NA |
