

| 2023-12-31 | 2023-09-30 | 2023-06-30 | 2023-03-31 | 2022-12-31 | 2022-09-30 | 2022-06-30 | 2022-03-31 | 2021-12-31 | 2021-09-30 | 2021-06-30 | 2021-03-31 | 2020-12-31 | 2020-09-30 | 2020-06-30 | 2020-03-31 | 2019-12-31 | 2019-09-30 | 2019-06-30 | 2019-03-31 | 2018-12-31 | 2018-09-30 | 2018-06-30 | 2018-03-31 | 2017-12-31 | 2017-09-30 | 2017-06-30 | 2017-03-31 | ||
|---|---|---|---|---|---|---|---|---|---|---|---|---|---|---|---|---|---|---|---|---|---|---|---|---|---|---|---|---|---|
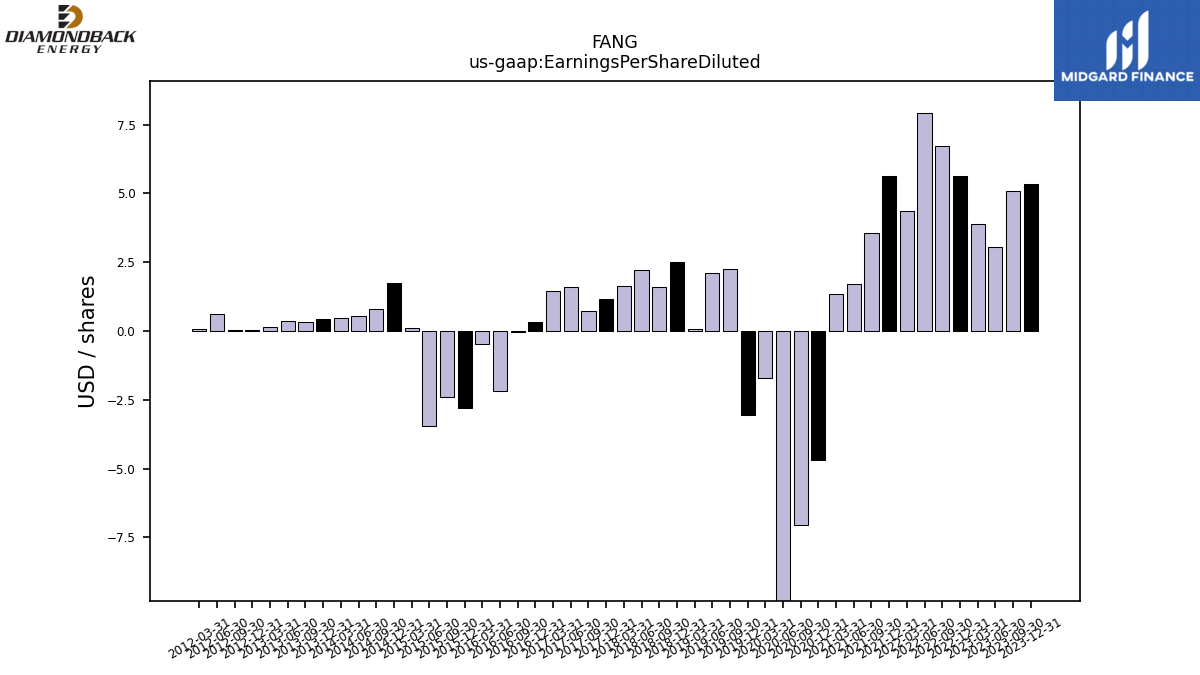
| Earnings Per Share Basic | 5.33 | 5.07 | 3.05 | 3.88 | 5.62 | 6.72 | 7.95 | 4.39 | 5.62 | 3.59 | 1.72 | 1.34 | -4.68 | -7.05 | -15.16 | -1.72 | -3.04 | 2.27 | 2.12 | 0.06 | 2.50 | 1.59 | 2.22 | 1.65 | 1.17 | 0.74 | 1.61 | 1.46 | |
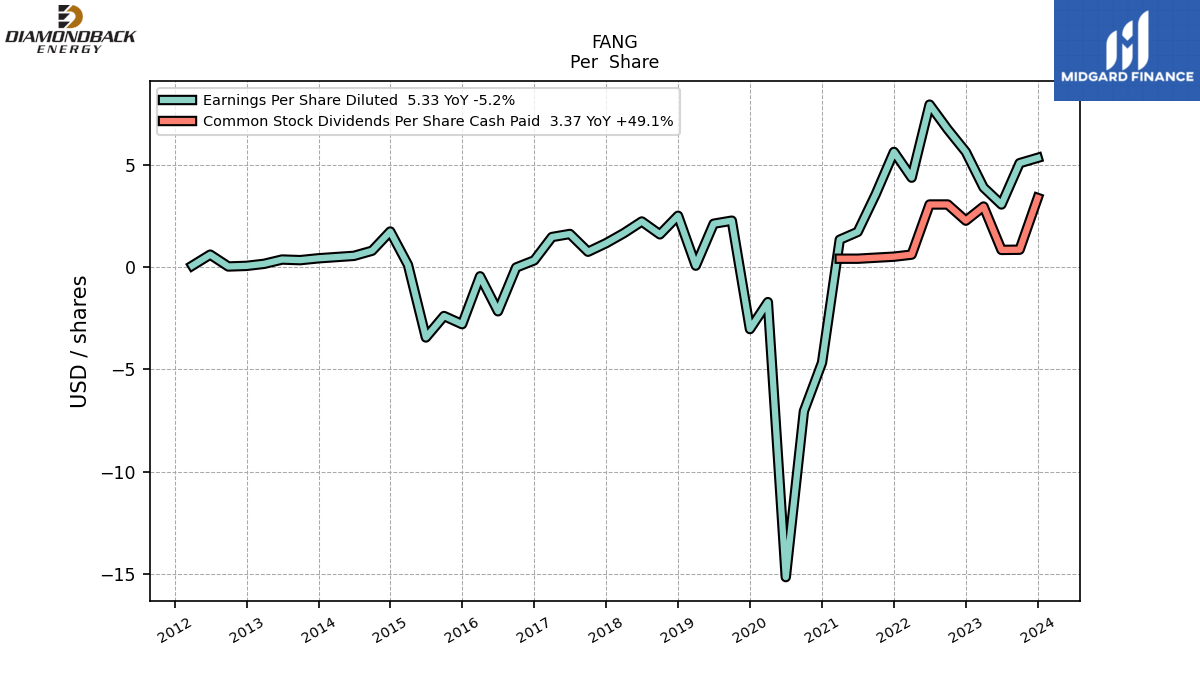
| Earnings Per Share Diluted | 5.33 | 5.07 | 3.05 | 3.88 | 5.62 | 6.72 | 7.93 | 4.36 | 5.62 | 3.56 | 1.71 | 1.33 | -4.68 | -7.05 | -15.16 | -1.72 | -3.04 | 2.26 | 2.11 | 0.06 | 2.50 | 1.59 | 2.22 | 1.65 | 1.16 | 0.74 | 1.61 | 1.46 |
| 2023-12-31 | 2023-09-30 | 2023-06-30 | 2023-03-31 | 2022-12-31 | 2022-09-30 | 2022-06-30 | 2022-03-31 | 2021-12-31 | 2021-09-30 | 2021-06-30 | 2021-03-31 | 2020-12-31 | 2020-09-30 | 2020-06-30 | 2020-03-31 | 2019-12-31 | 2019-09-30 | 2019-06-30 | 2019-03-31 | 2018-12-31 | 2018-09-30 | 2018-06-30 | 2018-03-31 | 2017-12-31 | 2017-09-30 | 2017-06-30 | 2017-03-31 | ||
|---|---|---|---|---|---|---|---|---|---|---|---|---|---|---|---|---|---|---|---|---|---|---|---|---|---|---|---|---|---|
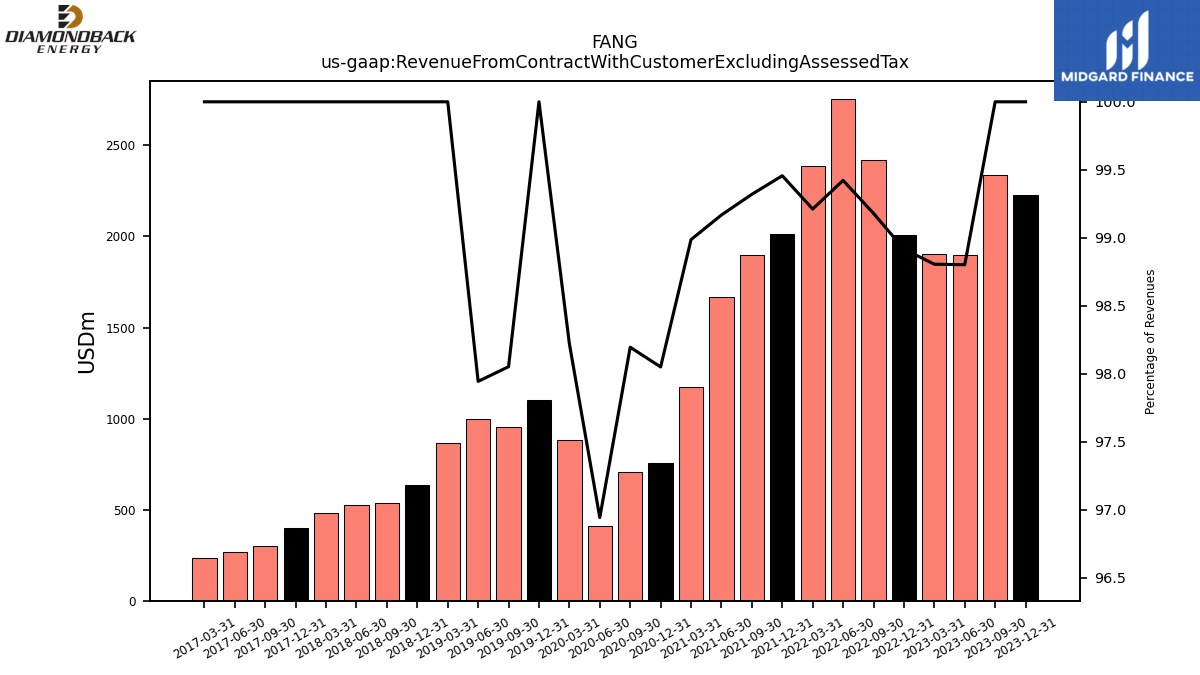
| Revenue From Contract With Customer Excluding Assessed Tax | 2228.00 | 2340.00 | 1896.00 | 1902.00 | 2008.00 | 2417.00 | 2752.00 | 2389.00 | 2011.00 | 1897.00 | 1667.00 | 1172.00 | 754.00 | 707.00 | 412.00 | 883.00 | 1104.00 | 956.00 | 1000.00 | 864.00 | 633.00 | 537.00 | 527.00 | 479.00 | 399.19 | 301.25 | 269.43 | 235.23 | |
| Revenue From Contract With Customer Including Assessed Tax | 2228.00 | 2340.00 | 1919.00 | 1925.00 | 2030.00 | 2437.00 | 2768.00 | 2408.00 | 2022.00 | 1910.00 | 1681.00 | 1184.00 | 769.00 | 720.00 | 425.00 | 899.00 | 1104.00 | 975.00 | 1021.00 | 864.00 | 631.76 | 538.03 | 526.27 | 480.19 | 399.19 | 301.25 | 269.43 | 235.23 | |
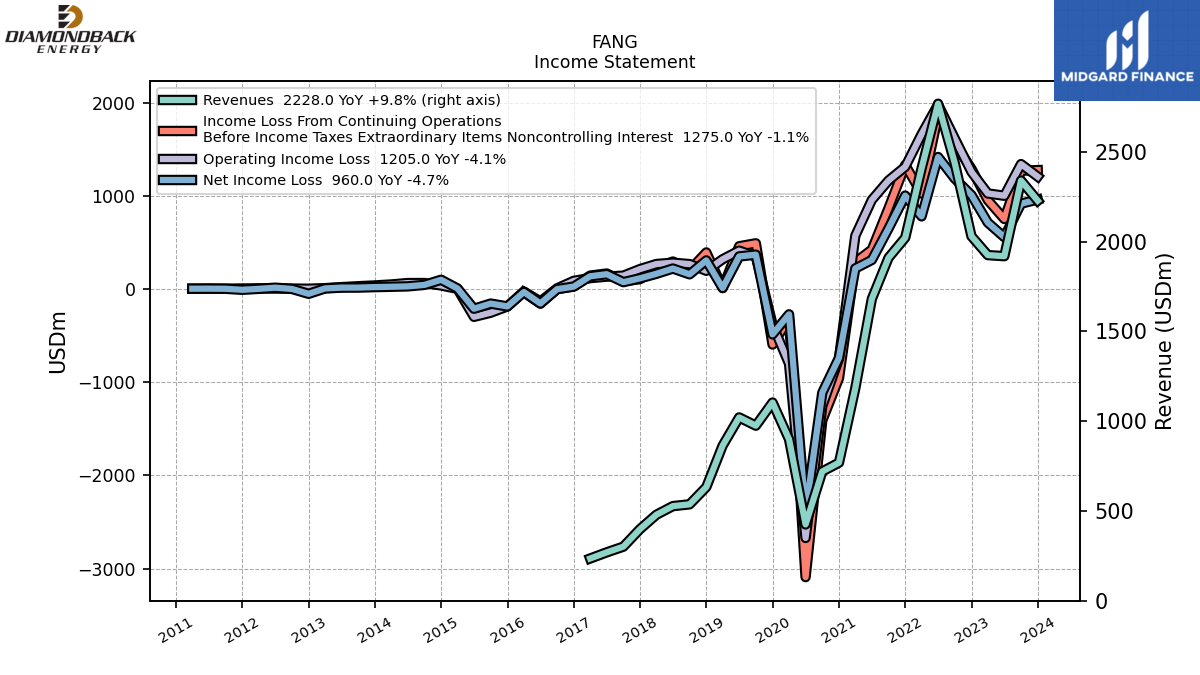
| Revenues | 2228.00 | 2340.00 | 1919.00 | 1925.00 | 2030.00 | 2437.00 | 2768.00 | 2408.00 | 2022.00 | 1910.00 | 1681.00 | 1184.00 | 769.00 | 720.00 | 425.00 | 899.00 | 1104.00 | 975.00 | 1021.00 | 864.00 | 633.00 | 537.00 | 527.00 | 479.00 | 399.19 | 301.25 | 269.43 | 235.23 | |
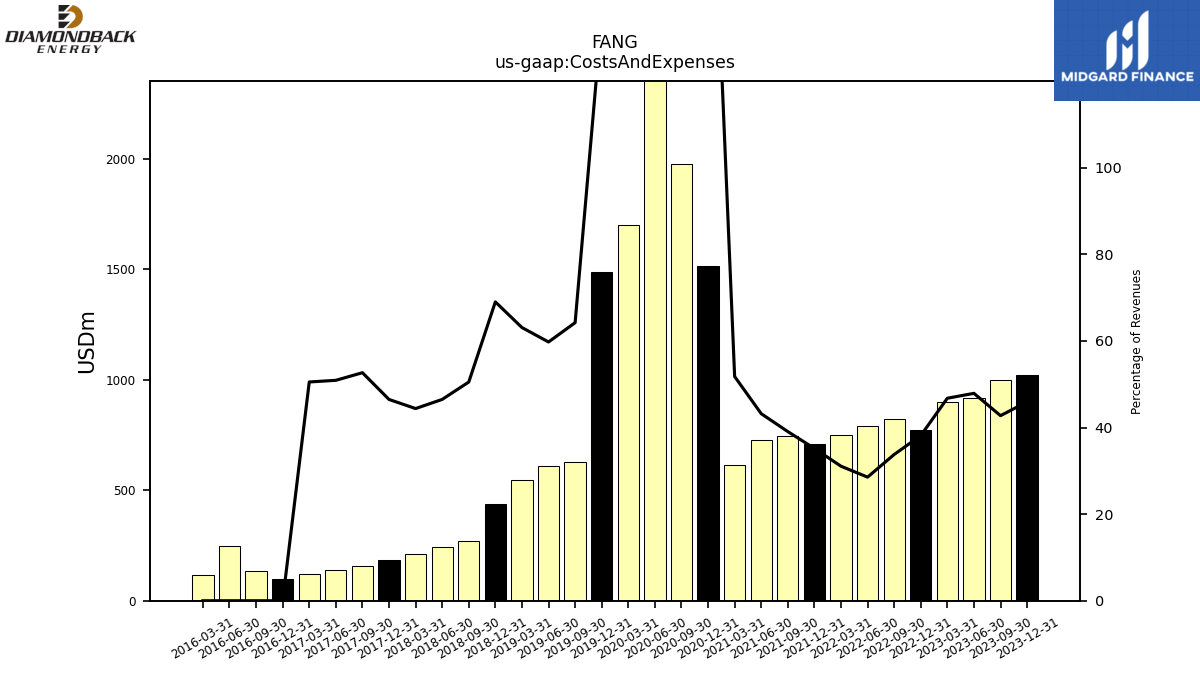
| Costs And Expenses | 1023.00 | 1000.00 | 919.00 | 900.00 | 774.00 | 823.00 | 790.00 | 748.00 | 711.00 | 746.00 | 726.00 | 613.00 | 1515.00 | 1976.00 | 3097.00 | 1701.00 | 1488.00 | 626.00 | 610.00 | 545.00 | 436.77 | 271.18 | 244.97 | 212.55 | 185.53 | 158.61 | 137.13 | 118.82 | |
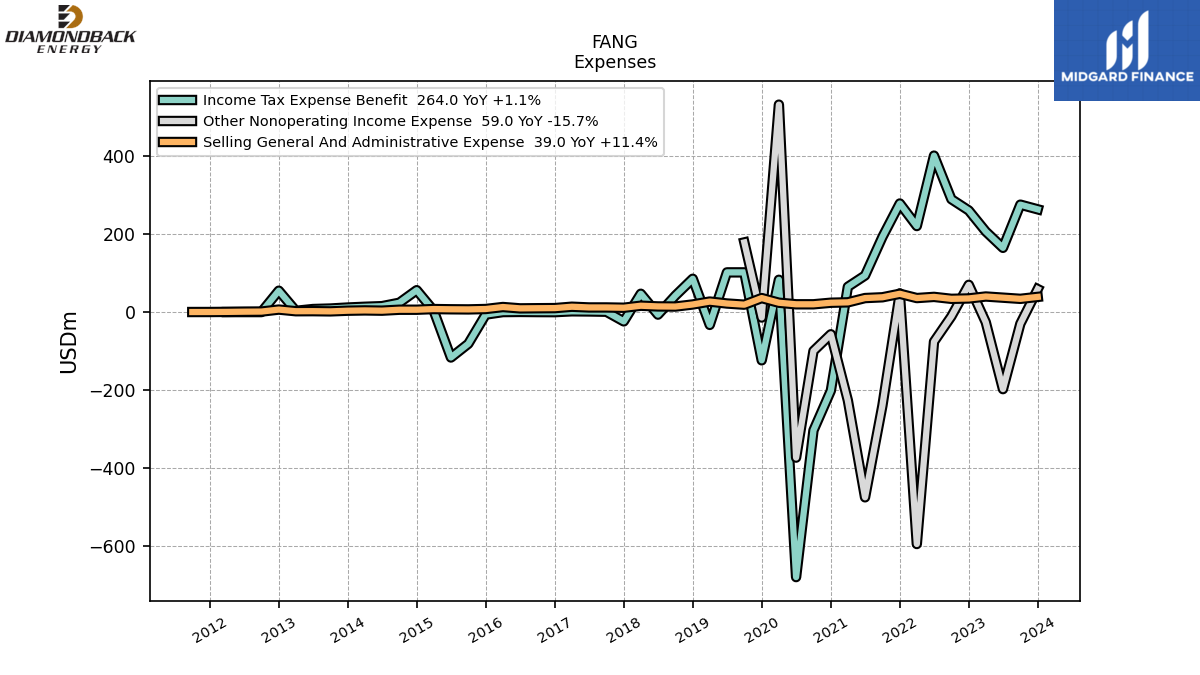
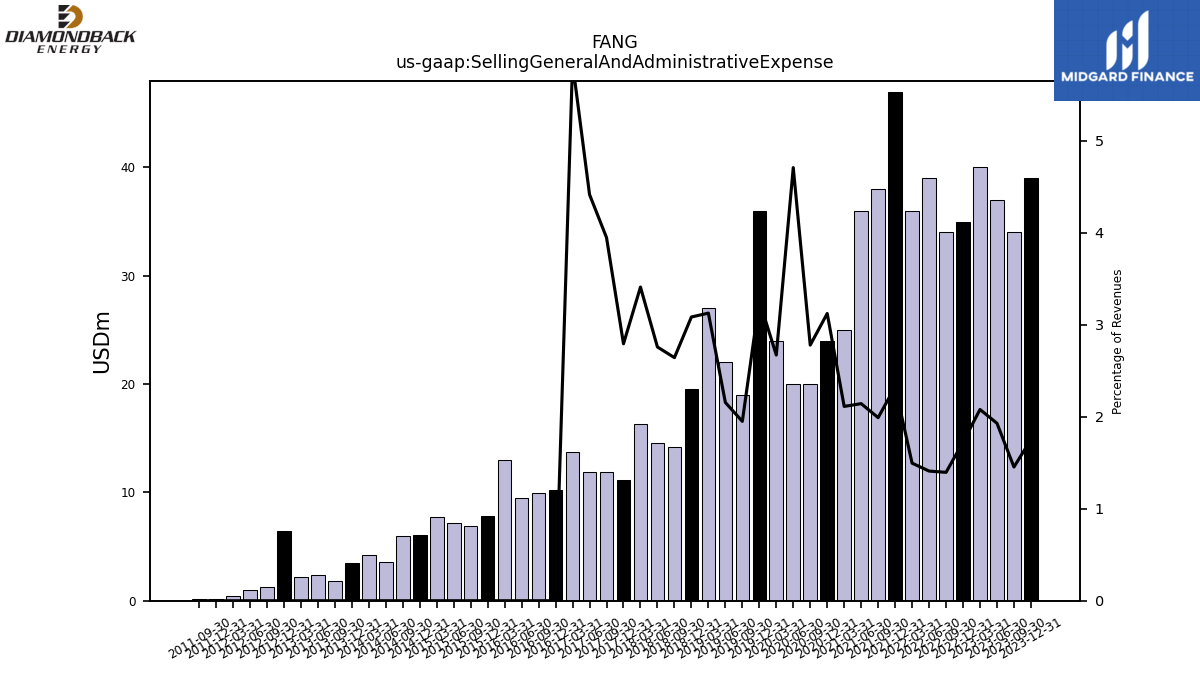
| Selling General And Administrative Expense | 39.00 | 34.00 | 37.00 | 40.00 | 35.00 | 34.00 | 39.00 | 36.00 | 47.00 | 38.00 | 36.00 | 25.00 | 24.00 | 20.00 | 20.00 | 24.00 | 36.00 | 19.00 | 22.00 | 27.00 | 19.52 | 14.19 | 14.53 | 16.32 | 11.14 | 11.89 | 11.89 | 13.74 | |
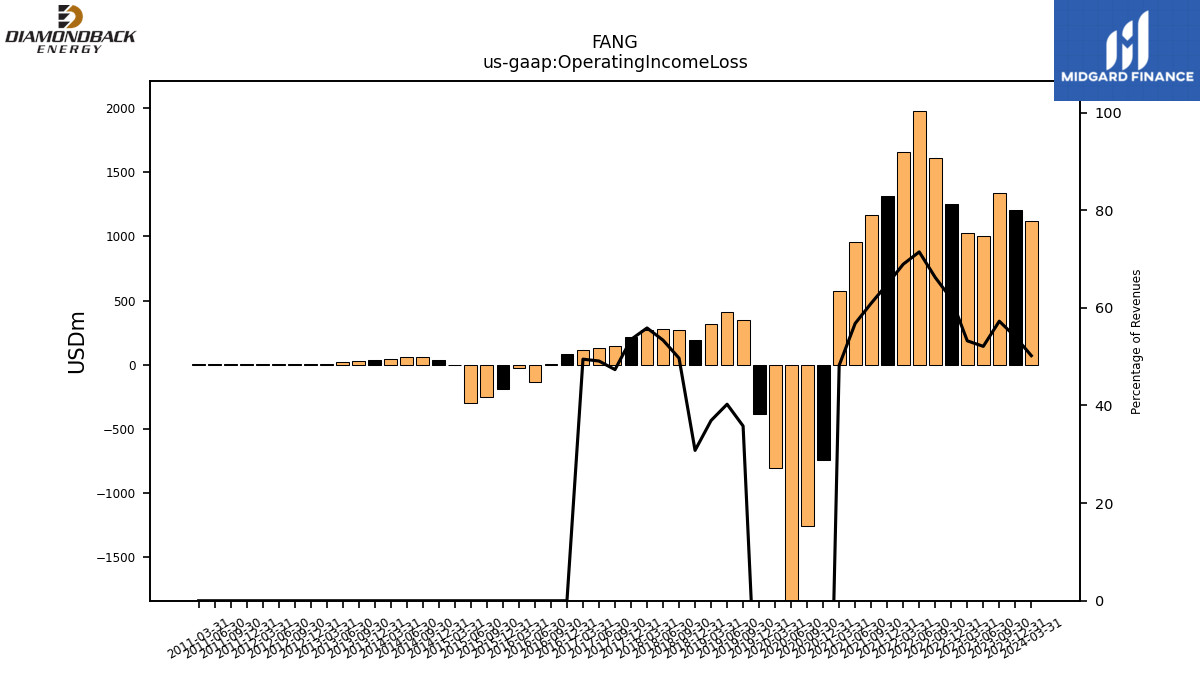
| Operating Income Loss | 1205.00 | 1340.00 | 1000.00 | 1025.00 | 1256.00 | 1614.00 | 1978.00 | 1660.00 | 1311.00 | 1164.00 | 955.00 | 571.00 | -746.00 | -1256.00 | -2672.00 | -802.00 | -384.00 | 349.00 | 411.00 | 319.00 | 194.99 | 266.85 | 281.30 | 267.65 | 213.66 | 142.64 | 132.31 | 116.41 | |
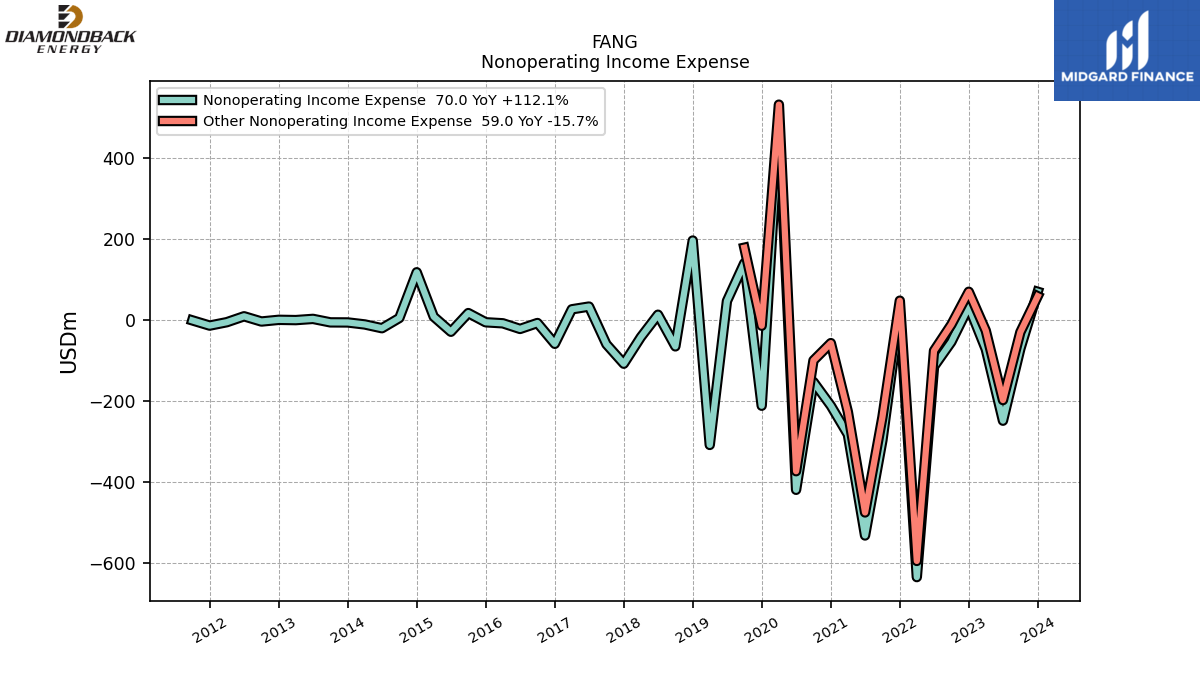
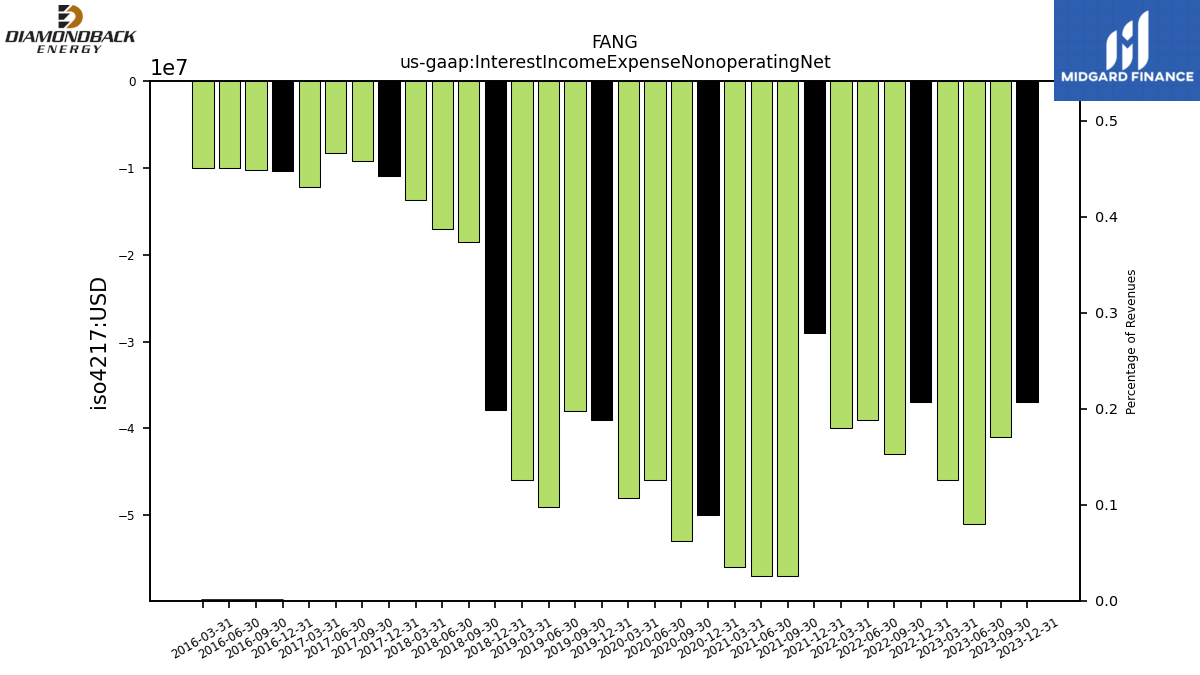
| Interest Income Expense Nonoperating Net | -37.00 | -41.00 | -51.00 | -46.00 | -37.00 | -43.00 | -39.00 | -40.00 | -29.00 | -57.00 | -57.00 | -56.00 | -50.00 | -53.00 | -46.00 | -48.00 | -39.00 | -38.00 | -49.00 | -46.00 | -37.93 | -18.55 | -17.10 | -13.70 | -10.89 | -9.19 | -8.24 | -12.22 | |
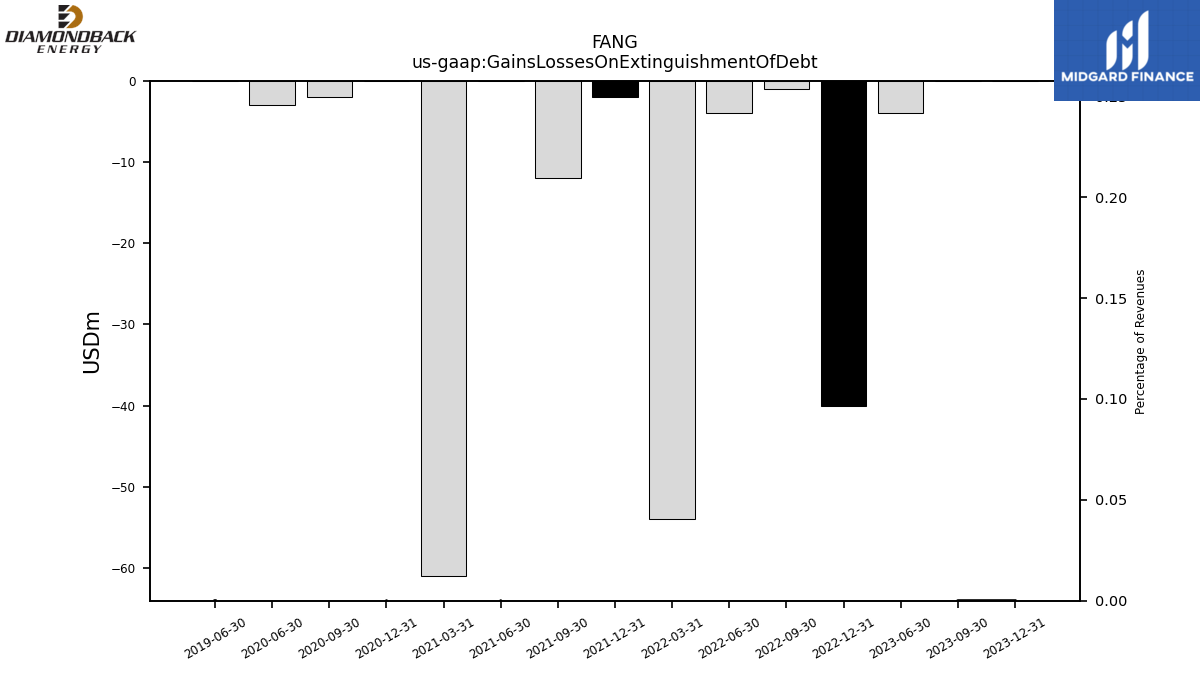
| Gains Losses On Extinguishment Of Debt | 0.00 | 0.00 | -4.00 | NA | -40.00 | -1.00 | -4.00 | -54.00 | -2.00 | -12.00 | 0.00 | -61.00 | 0.00 | -2.00 | -3.00 | NA | NA | NA | 0.00 | NA | NA | NA | NA | NA | NA | NA | NA | NA | |
| Income Tax Expense Benefit | 264.00 | 276.00 | 165.00 | 207.00 | 261.00 | 290.00 | 402.00 | 221.00 | 279.00 | 193.00 | 94.00 | 65.00 | -202.00 | -304.00 | -681.00 | 83.00 | -124.00 | 102.00 | 102.00 | -33.00 | 85.61 | 42.28 | -6.61 | 47.08 | -23.96 | 0.86 | 1.58 | 1.96 | |
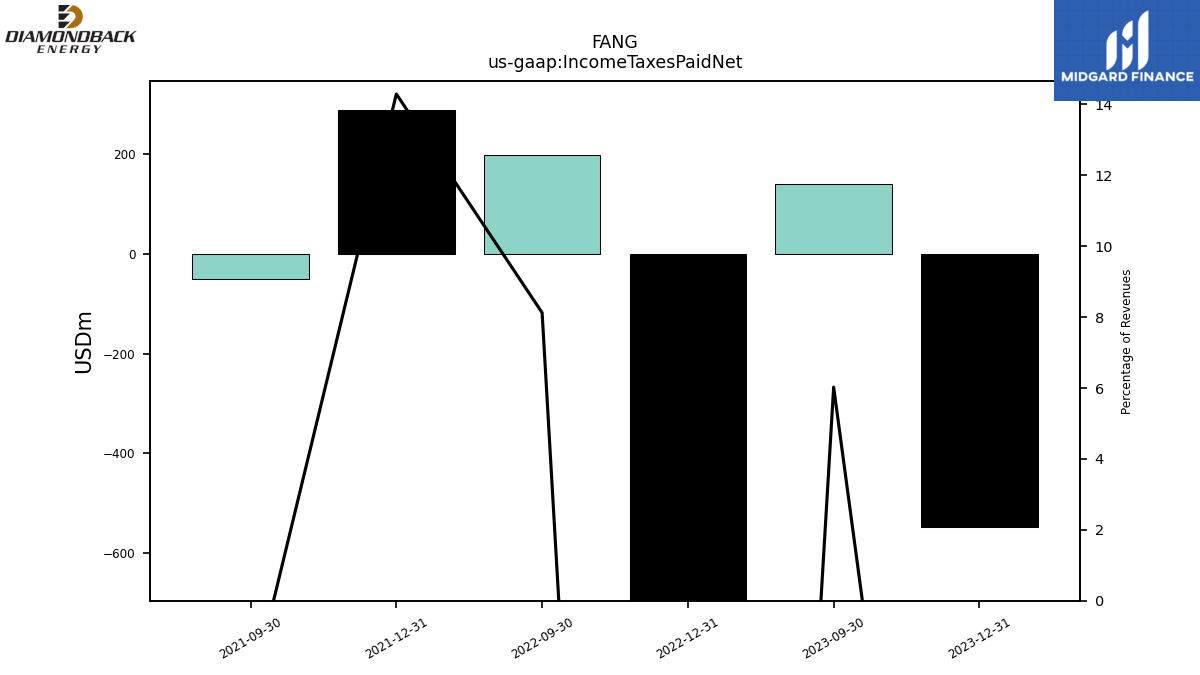
| Income Taxes Paid Net | -547.00 | 141.00 | NA | NA | -1278.00 | 198.00 | NA | NA | 289.00 | -51.00 | NA | NA | NA | NA | NA | NA | NA | NA | NA | NA | NA | NA | NA | NA | NA | NA | NA | NA | |
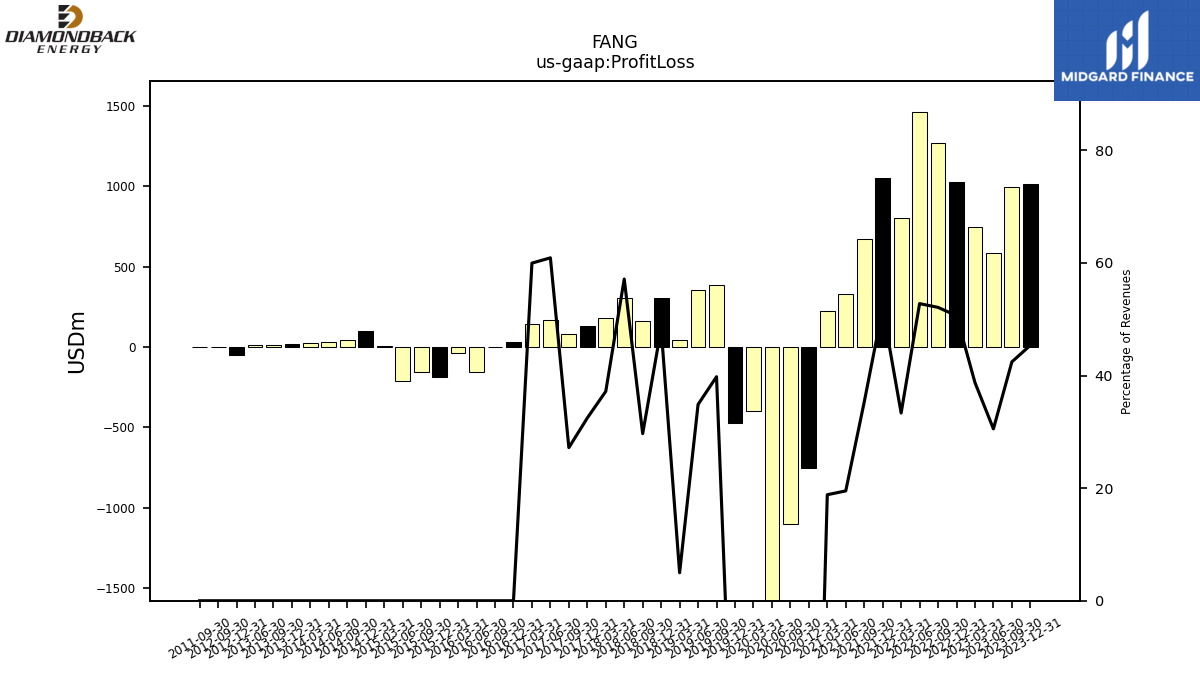
| Profit Loss | 1011.00 | 993.00 | 586.00 | 746.00 | 1028.00 | 1270.00 | 1461.00 | 803.00 | 1051.00 | 674.00 | 328.00 | 223.00 | -756.00 | -1105.00 | -2411.00 | -400.00 | -472.00 | 388.00 | 356.00 | 43.00 | 306.16 | 159.42 | 301.16 | 178.15 | 129.61 | 81.95 | 164.13 | 141.07 | |
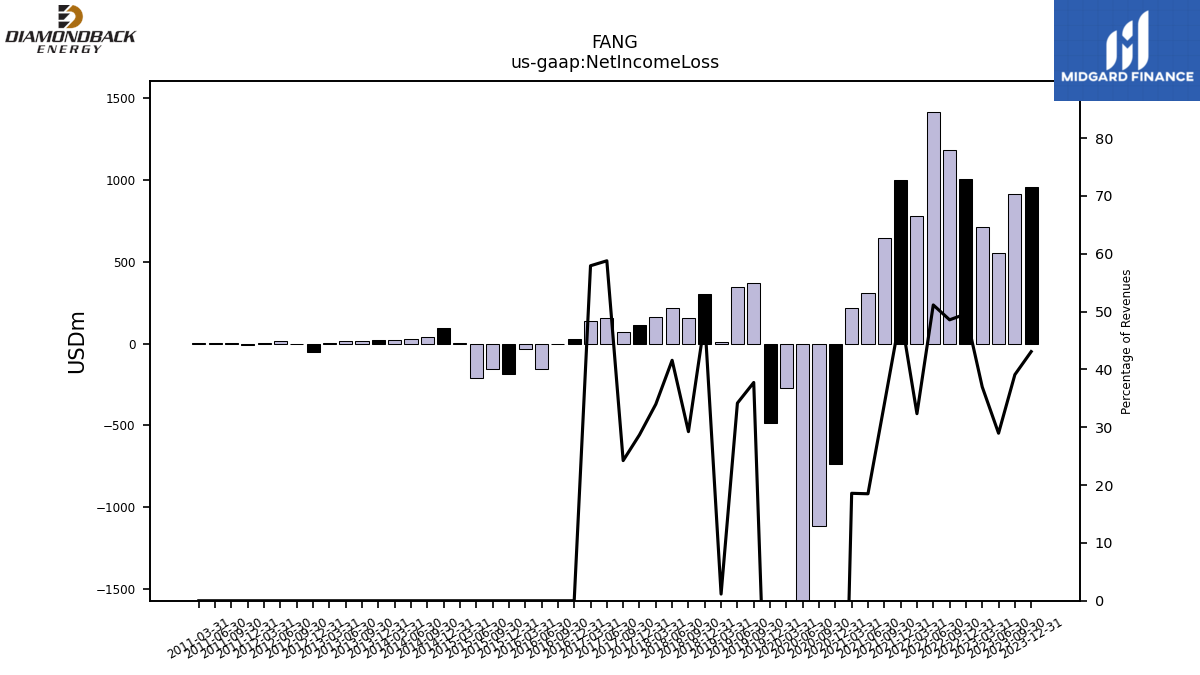
| Net Income Loss | 960.00 | 915.00 | 556.00 | 712.00 | 1007.00 | 1184.00 | 1416.00 | 779.00 | 1002.00 | 649.00 | 311.00 | 220.00 | -739.00 | -1113.00 | -2393.00 | -272.00 | -487.00 | 368.00 | 349.00 | 10.00 | 306.66 | 157.05 | 219.15 | 162.81 | 114.56 | 73.02 | 158.41 | 136.27 | |
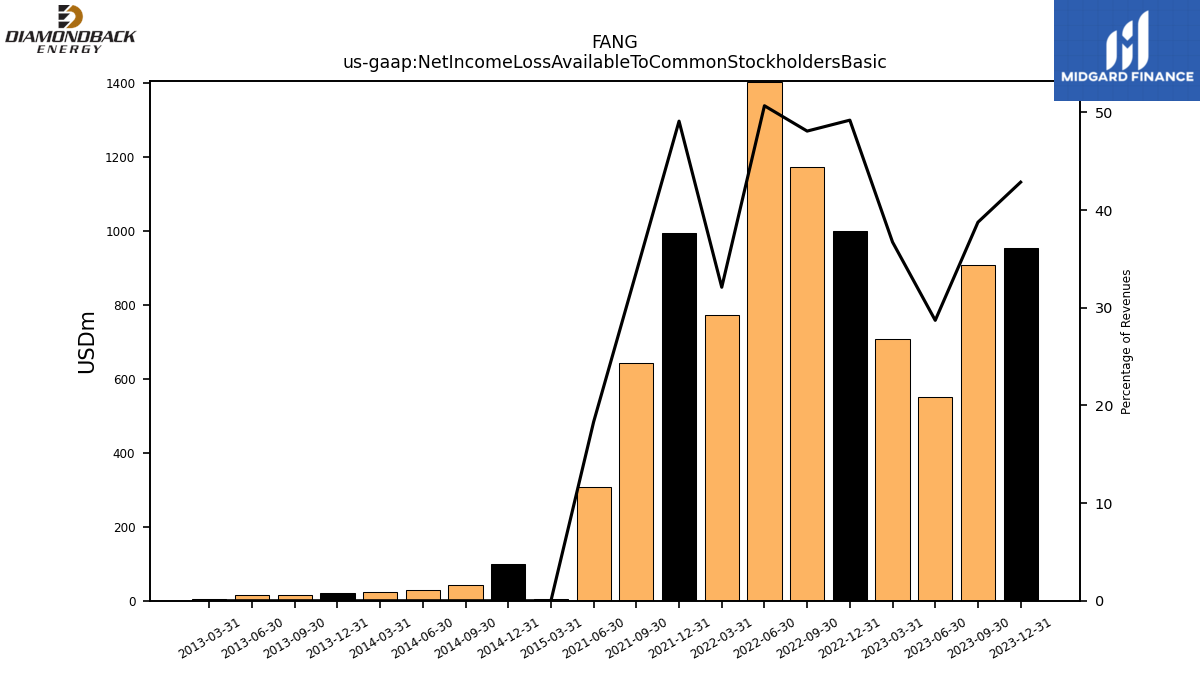
| Net Income Loss Available To Common Stockholders Basic | 955.00 | 907.00 | 551.00 | 707.00 | 999.00 | 1172.00 | 1403.00 | 773.00 | 993.00 | 643.00 | 308.00 | NA | NA | NA | NA | NA | NA | NA | NA | NA | NA | NA | NA | NA | NA | NA | NA | NA |
| 2023-12-31 | 2023-09-30 | 2023-06-30 | 2023-03-31 | 2022-12-31 | 2022-09-30 | 2022-06-30 | 2022-03-31 | 2021-12-31 | 2021-09-30 | 2021-06-30 | 2021-03-31 | 2020-12-31 | 2020-09-30 | 2020-06-30 | 2020-03-31 | 2019-12-31 | 2019-09-30 | 2019-06-30 | 2019-03-31 | 2018-12-31 | 2018-09-30 | 2018-06-30 | 2018-03-31 | 2017-12-31 | 2017-09-30 | 2017-06-30 | 2017-03-31 | ||
|---|---|---|---|---|---|---|---|---|---|---|---|---|---|---|---|---|---|---|---|---|---|---|---|---|---|---|---|---|---|
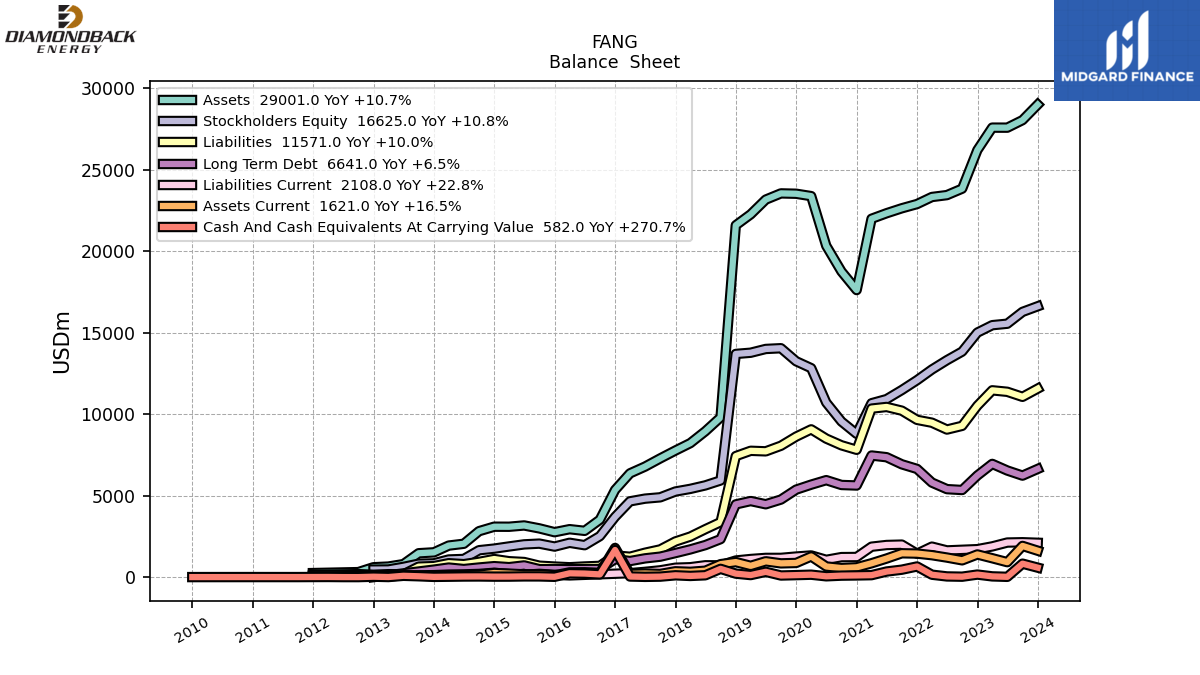
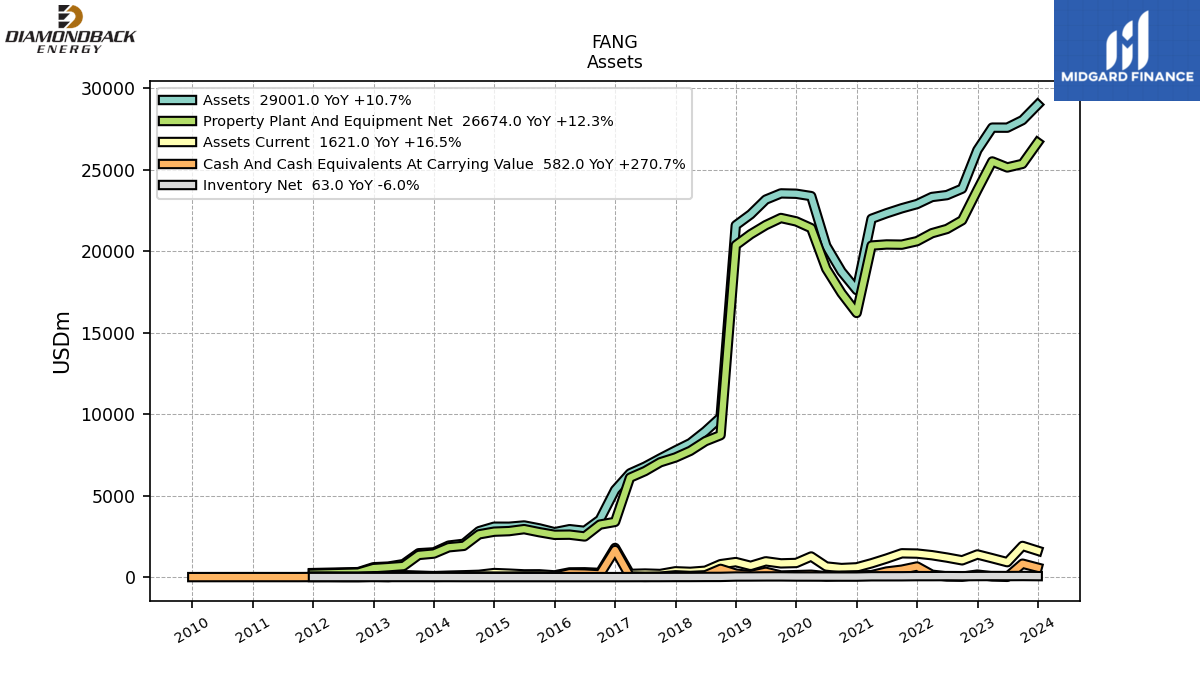
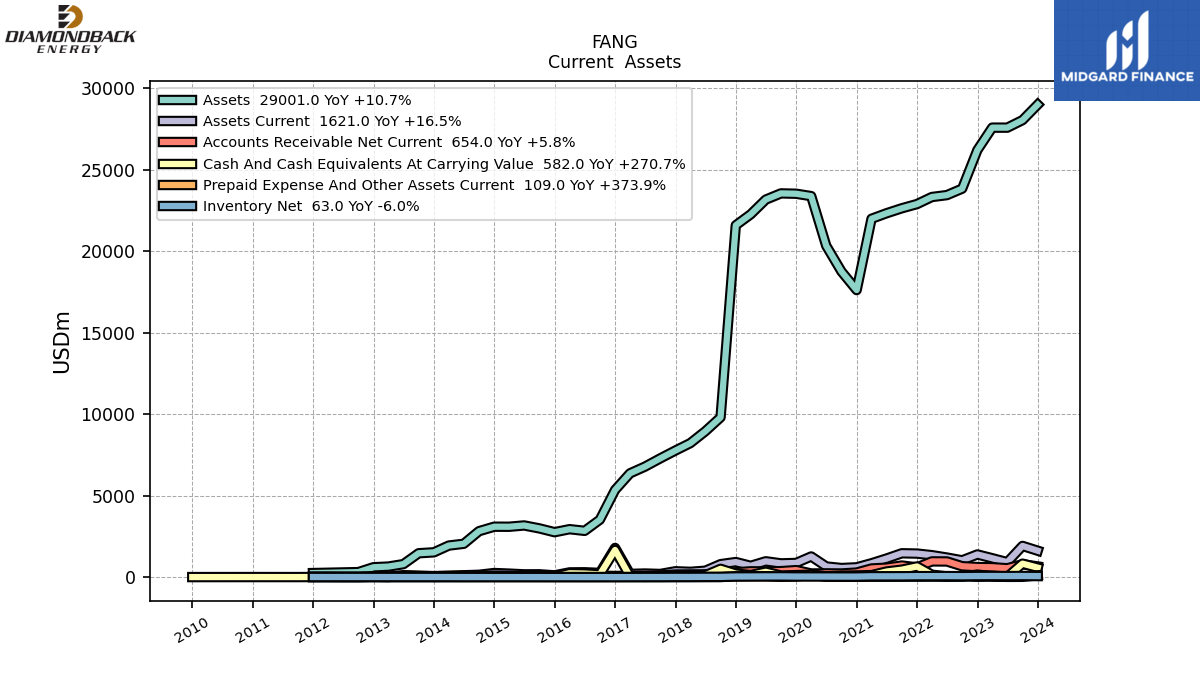
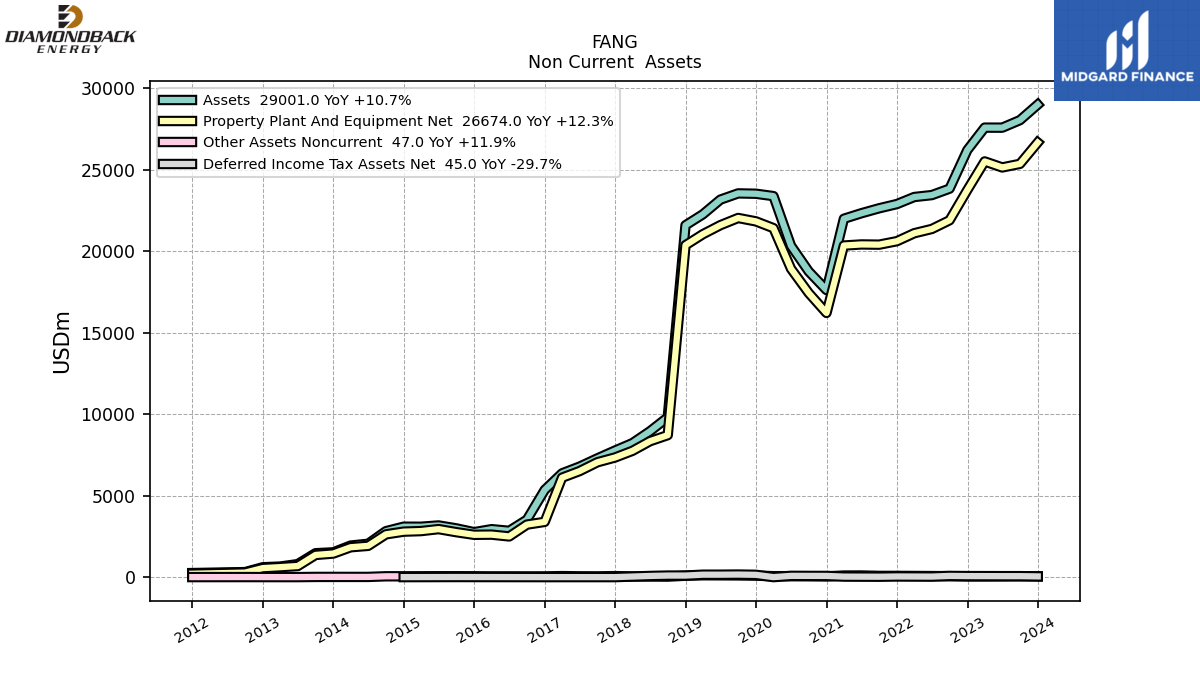
| Assets | 29001.00 | 28049.00 | 27587.00 | 27589.00 | 26209.00 | 23843.00 | 23448.00 | 23331.00 | 22898.00 | 22639.00 | 22335.00 | 21996.00 | 17619.00 | 18760.00 | 20337.00 | 23386.00 | 23531.00 | 23553.00 | 23171.00 | 22268.00 | 21595.69 | 9806.57 | 8954.40 | 8224.89 | 7770.98 | 7287.57 | 6783.81 | 6369.70 | |
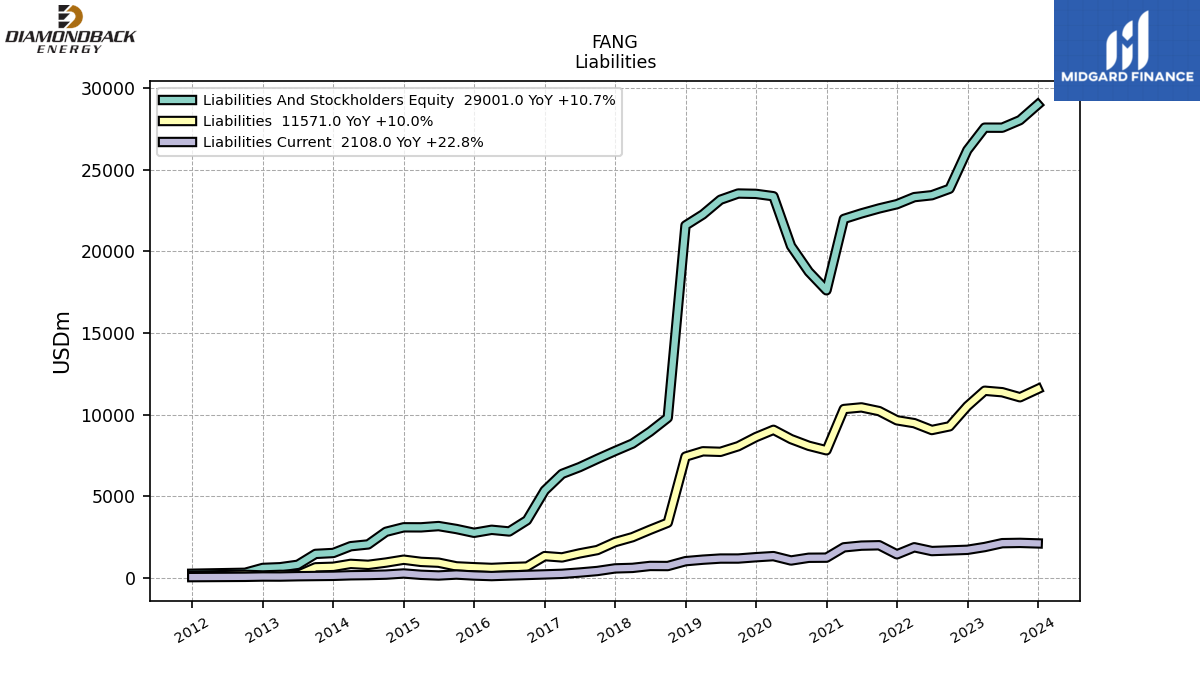
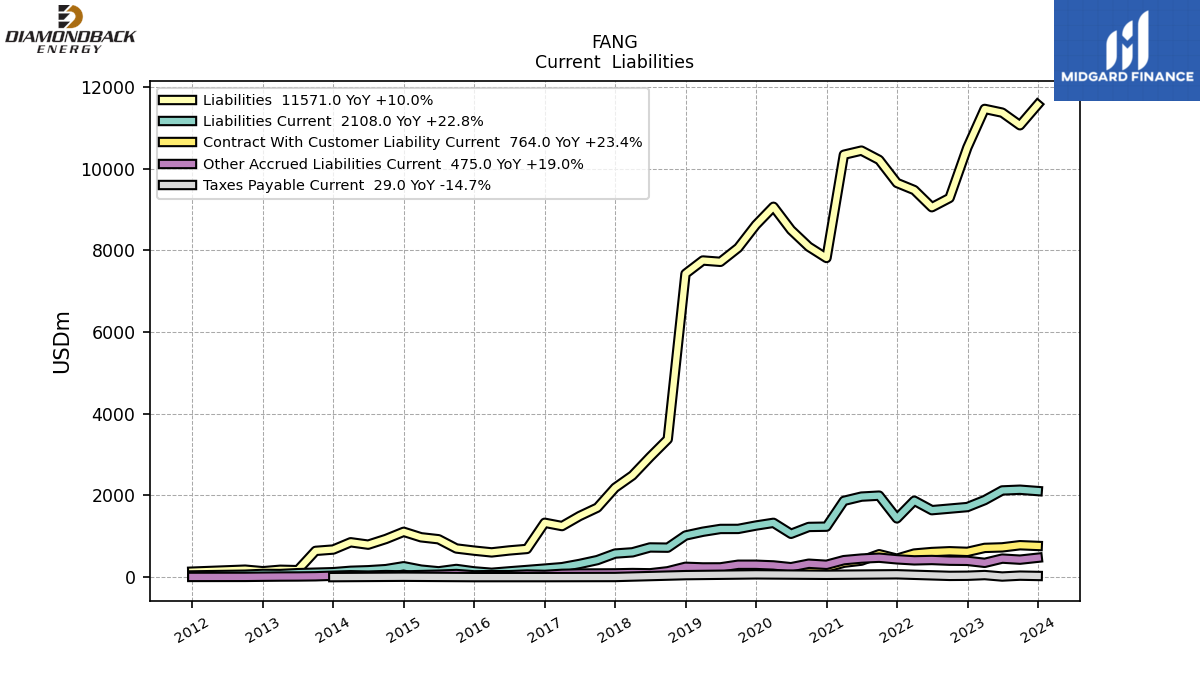
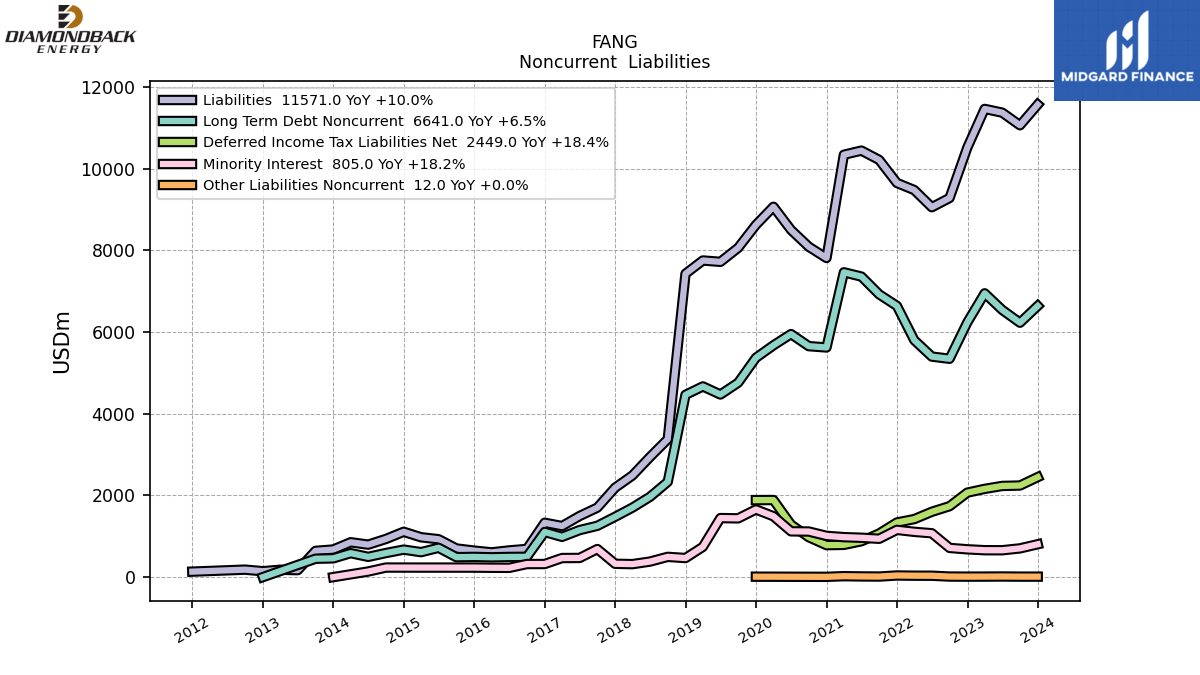
| Liabilities | 11571.00 | 11065.00 | 11375.00 | 11466.00 | 10519.00 | 9285.00 | 9058.00 | 9479.00 | 9653.00 | 10217.00 | 10445.00 | 10344.00 | 7815.00 | 8091.00 | 8502.00 | 9070.00 | 8625.00 | 8064.00 | 7721.00 | 7754.00 | 7429.43 | 3376.78 | 2941.93 | 2489.71 | 2189.25 | 1701.44 | 1496.88 | 1250.34 | |
| Liabilities And Stockholders Equity | 29001.00 | 28049.00 | 27587.00 | 27589.00 | 26209.00 | 23843.00 | 23448.00 | 23331.00 | 22898.00 | 22639.00 | 22335.00 | 21996.00 | 17619.00 | 18760.00 | 20337.00 | 23386.00 | 23531.00 | 23553.00 | 23171.00 | 22268.00 | 21595.69 | 9806.57 | 8954.40 | 8224.89 | 7770.98 | 7287.57 | 6783.81 | 6369.70 | |
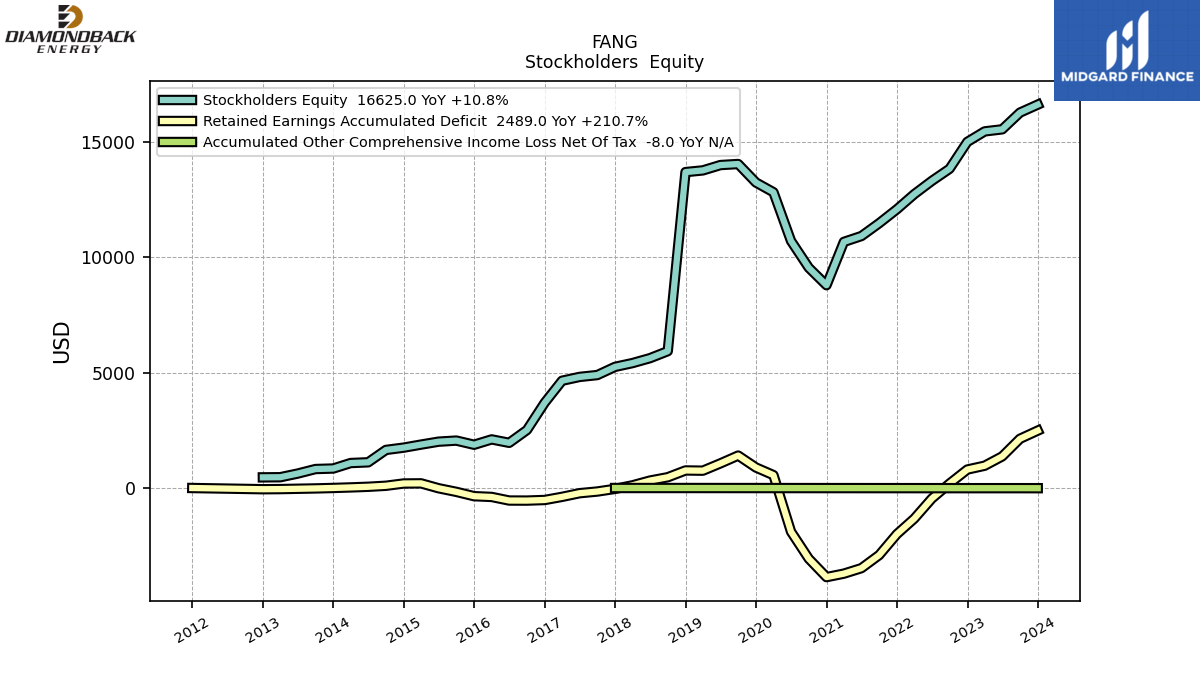
| Stockholders Equity | 16625.00 | 16280.00 | 15554.00 | 15464.00 | 15009.00 | 13843.00 | 13316.00 | 12743.00 | 12088.00 | 11483.00 | 10926.00 | 10673.00 | 8794.00 | 9552.00 | 10714.00 | 12826.00 | 13249.00 | 14050.00 | 14004.00 | 13773.00 | 13699.29 | 5933.36 | 5631.45 | 5417.08 | 5254.86 | 4898.50 | 4817.62 | 4651.87 |
| 2023-12-31 | 2023-09-30 | 2023-06-30 | 2023-03-31 | 2022-12-31 | 2022-09-30 | 2022-06-30 | 2022-03-31 | 2021-12-31 | 2021-09-30 | 2021-06-30 | 2021-03-31 | 2020-12-31 | 2020-09-30 | 2020-06-30 | 2020-03-31 | 2019-12-31 | 2019-09-30 | 2019-06-30 | 2019-03-31 | 2018-12-31 | 2018-09-30 | 2018-06-30 | 2018-03-31 | 2017-12-31 | 2017-09-30 | 2017-06-30 | 2017-03-31 | ||
|---|---|---|---|---|---|---|---|---|---|---|---|---|---|---|---|---|---|---|---|---|---|---|---|---|---|---|---|---|---|
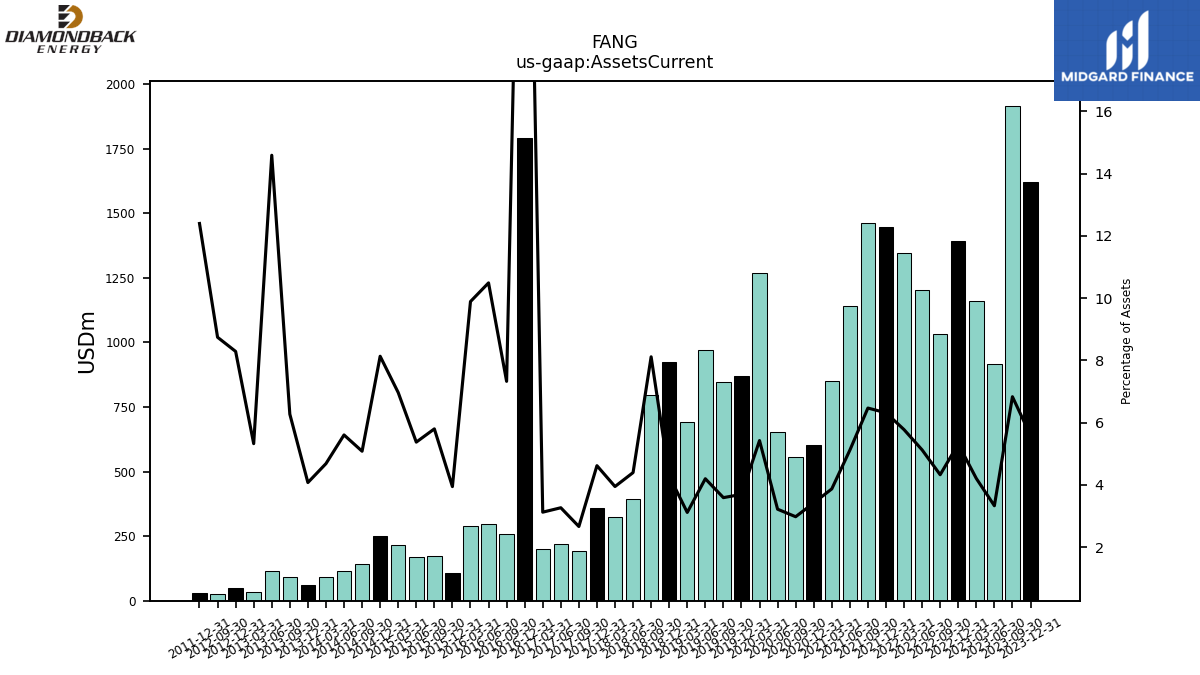
| Assets Current | 1621.00 | 1916.00 | 918.00 | 1160.00 | 1392.00 | 1031.00 | 1201.00 | 1347.00 | 1446.00 | 1464.00 | 1142.00 | 851.00 | 602.00 | 558.00 | 654.00 | 1268.00 | 869.00 | 845.00 | 972.00 | 693.00 | 925.02 | 795.69 | 393.35 | 324.47 | 358.60 | 193.85 | 221.34 | 198.77 | |
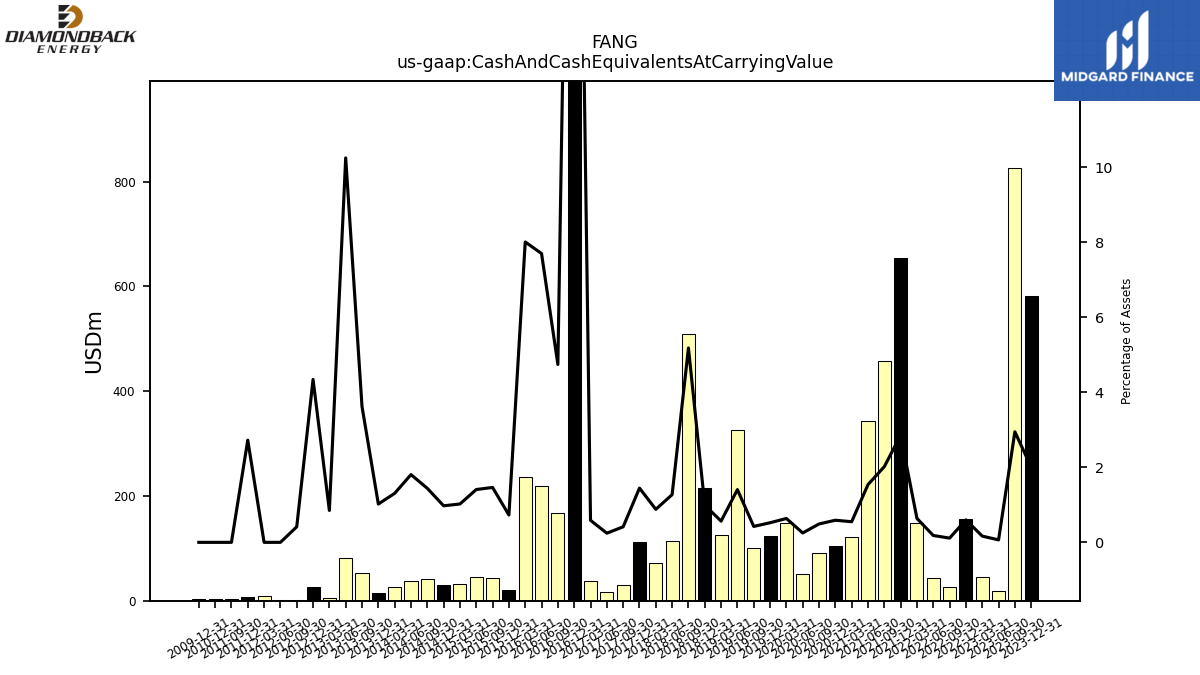
| Cash And Cash Equivalents At Carrying Value | 582.00 | 827.00 | 18.00 | 46.00 | 157.00 | 27.00 | 43.00 | 149.00 | 654.00 | 457.00 | 344.00 | 121.00 | 104.00 | 92.00 | 51.00 | 149.00 | 123.00 | 100.00 | 326.00 | 126.00 | 214.52 | 508.45 | 113.93 | 72.49 | 112.45 | 30.20 | 16.59 | 37.44 | |
| Cash Cash Equivalents Restricted Cash And Restricted Cash Equivalents | 585.00 | 830.00 | 21.00 | 53.00 | 164.00 | 34.00 | 59.00 | 167.00 | 672.00 | 541.00 | 396.00 | 174.00 | 108.00 | 99.00 | 59.00 | 155.00 | 123.00 | 100.00 | 326.00 | 126.00 | 215.00 | 509.00 | NA | NA | 112.00 | NA | NA | NA | |
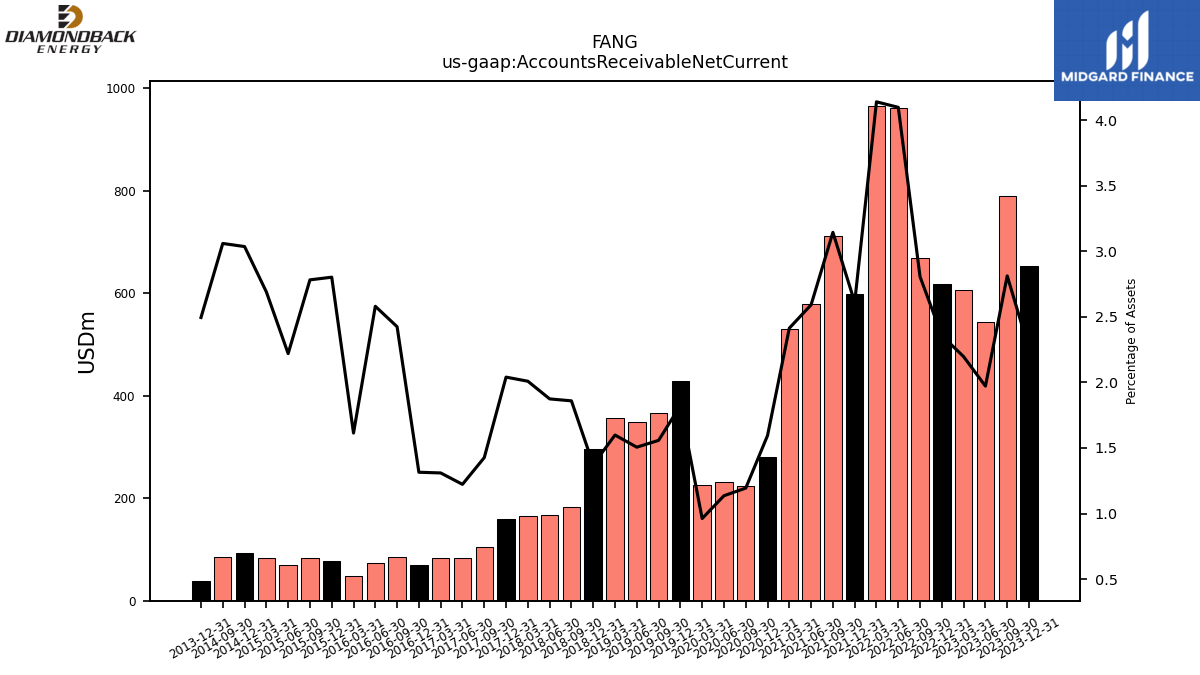
| Accounts Receivable Net Current | 654.00 | 789.00 | 544.00 | 606.00 | 618.00 | 669.00 | 961.00 | 966.00 | 598.00 | 712.00 | 579.00 | 531.00 | 281.00 | 224.00 | 231.00 | 225.00 | 429.00 | 367.00 | 349.00 | 356.00 | 296.52 | 182.36 | 167.85 | 165.26 | 158.57 | 103.96 | 82.95 | 83.42 | |
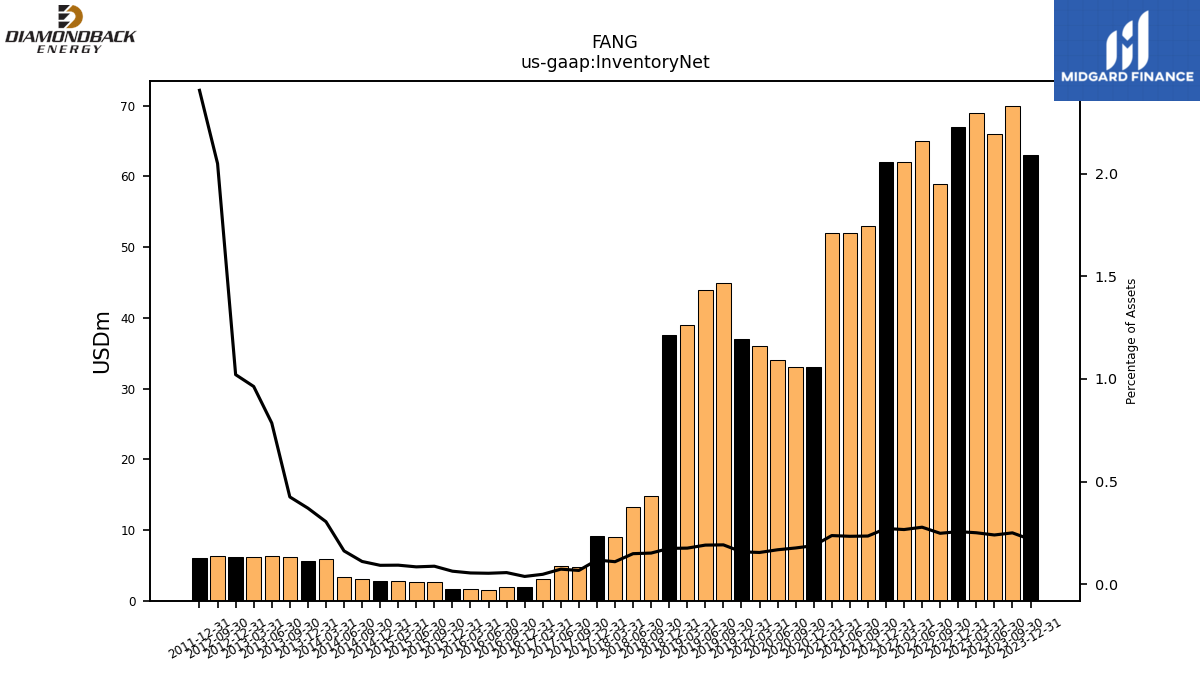
| Inventory Net | 63.00 | 70.00 | 66.00 | 69.00 | 67.00 | 59.00 | 65.00 | 62.00 | 62.00 | 53.00 | 52.00 | 52.00 | 33.00 | 33.00 | 34.00 | 36.00 | 37.00 | 45.00 | 44.00 | 39.00 | 37.57 | 14.81 | 13.26 | 8.96 | 9.11 | 4.83 | 4.92 | 3.03 | |
| Prepaid Expense And Other Assets Current | 109.00 | 19.00 | 17.00 | 36.00 | 23.00 | 54.00 | 23.00 | 33.00 | 28.00 | 28.00 | 25.00 | 27.00 | 23.00 | 20.00 | 33.00 | 140.00 | 43.00 | 22.00 | 56.00 | 60.00 | 50.35 | 8.11 | 7.27 | 6.74 | 4.90 | 3.51 | 3.46 | 4.46 | |
| Land | 1.00 | NA | NA | NA | 1.00 | NA | NA | NA | 1.00 | NA | NA | 2.00 | 2.00 | 2.00 | 2.00 | 2.00 | 2.00 | 2.00 | 2.00 | 1.00 | 1.00 | NA | NA | NA | NA | NA | NA | NA |
| 2023-12-31 | 2023-09-30 | 2023-06-30 | 2023-03-31 | 2022-12-31 | 2022-09-30 | 2022-06-30 | 2022-03-31 | 2021-12-31 | 2021-09-30 | 2021-06-30 | 2021-03-31 | 2020-12-31 | 2020-09-30 | 2020-06-30 | 2020-03-31 | 2019-12-31 | 2019-09-30 | 2019-06-30 | 2019-03-31 | 2018-12-31 | 2018-09-30 | 2018-06-30 | 2018-03-31 | 2017-12-31 | 2017-09-30 | 2017-06-30 | 2017-03-31 | ||
|---|---|---|---|---|---|---|---|---|---|---|---|---|---|---|---|---|---|---|---|---|---|---|---|---|---|---|---|---|---|
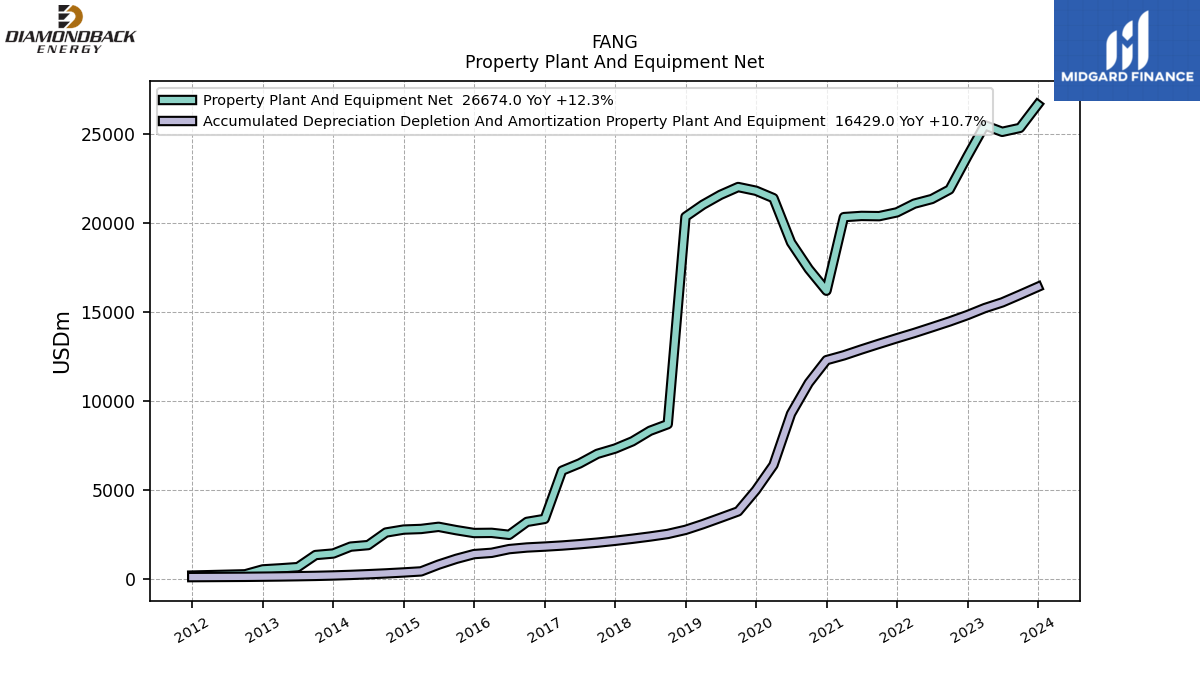
| Accumulated Depreciation Depletion And Amortization Property Plant And Equipment | 16429.00 | 15988.00 | 15558.00 | 15238.00 | 14844.00 | 14487.00 | 14160.00 | 13840.00 | 13545.00 | 13234.00 | 12914.00 | 12583.00 | 12314.00 | 11031.00 | 9297.00 | 6416.00 | 5003.00 | 3815.00 | 3451.00 | 3095.00 | 2774.47 | 2545.41 | 2401.24 | 2274.91 | 2161.37 | 2056.80 | 1969.82 | 1894.90 | |
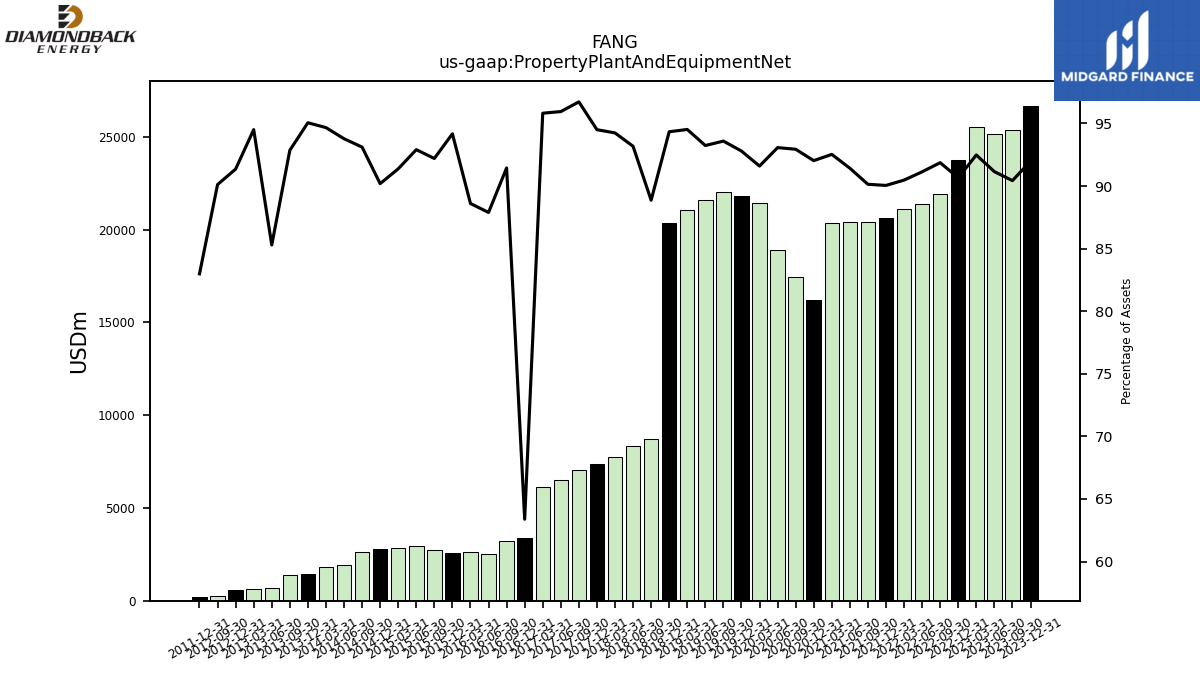
| Property Plant And Equipment Net | 26674.00 | 25365.00 | 25145.00 | 25514.00 | 23759.00 | 21903.00 | 21369.00 | 21108.00 | 20619.00 | 20406.00 | 20419.00 | 20352.00 | 16214.00 | 17435.00 | 18927.00 | 21420.00 | 21835.00 | 22043.00 | 21603.00 | 21047.00 | 20371.97 | 8714.61 | 8343.04 | 7751.17 | 7343.62 | 7048.61 | 6508.75 | 6103.10 | |
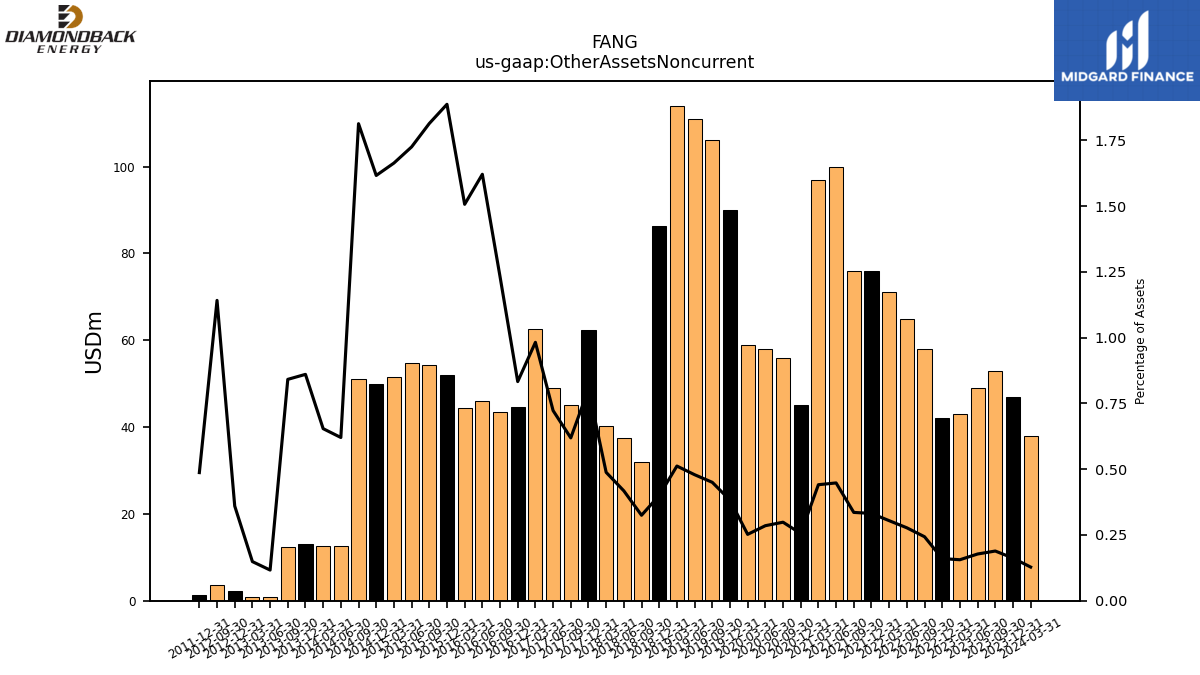
| Other Assets Noncurrent | 47.00 | 53.00 | 49.00 | 43.00 | 42.00 | 58.00 | 65.00 | 71.00 | 76.00 | 76.00 | 100.00 | 97.00 | 45.00 | 56.00 | 58.00 | 59.00 | 90.00 | 106.00 | 111.00 | 114.00 | 86.40 | 31.86 | 37.39 | 40.14 | 62.46 | 45.11 | 49.02 | 62.55 |
| 2023-12-31 | 2023-09-30 | 2023-06-30 | 2023-03-31 | 2022-12-31 | 2022-09-30 | 2022-06-30 | 2022-03-31 | 2021-12-31 | 2021-09-30 | 2021-06-30 | 2021-03-31 | 2020-12-31 | 2020-09-30 | 2020-06-30 | 2020-03-31 | 2019-12-31 | 2019-09-30 | 2019-06-30 | 2019-03-31 | 2018-12-31 | 2018-09-30 | 2018-06-30 | 2018-03-31 | 2017-12-31 | 2017-09-30 | 2017-06-30 | 2017-03-31 | ||
|---|---|---|---|---|---|---|---|---|---|---|---|---|---|---|---|---|---|---|---|---|---|---|---|---|---|---|---|---|---|
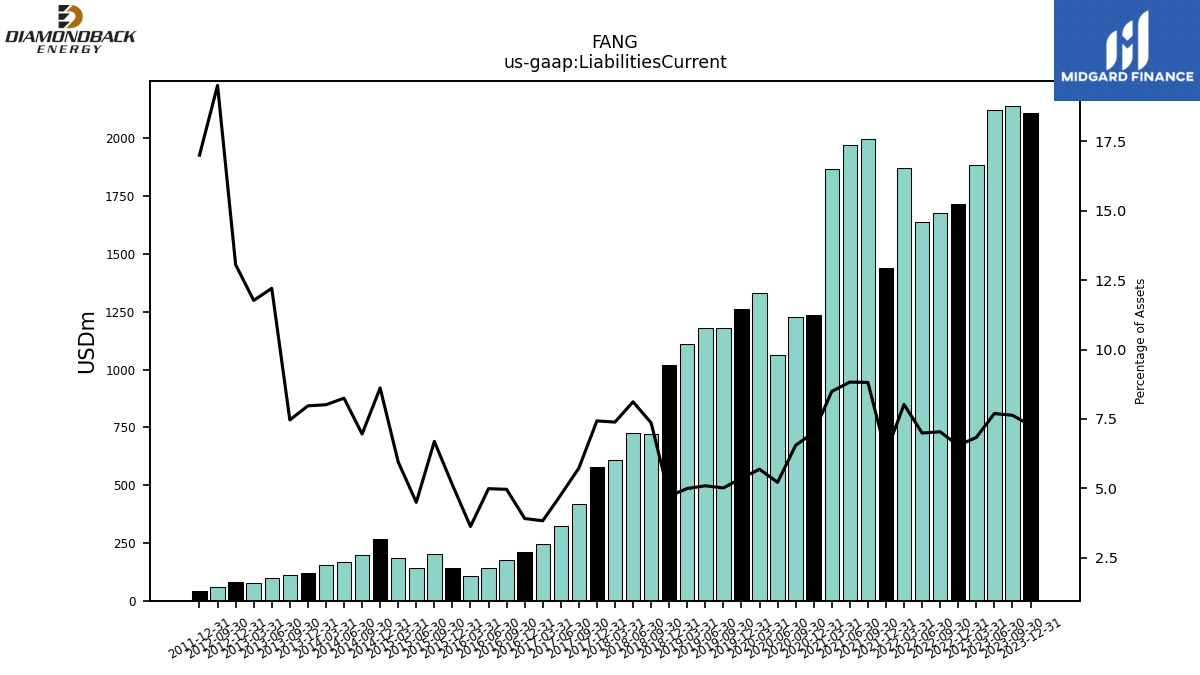
| Liabilities Current | 2108.00 | 2141.00 | 2123.00 | 1886.00 | 1716.00 | 1678.00 | 1640.00 | 1872.00 | 1438.00 | 1996.00 | 1972.00 | 1868.00 | 1236.00 | 1229.00 | 1061.00 | 1330.00 | 1263.00 | 1181.00 | 1180.00 | 1112.00 | 1019.61 | 721.79 | 727.08 | 607.67 | 577.43 | 417.62 | 323.17 | 244.07 | |
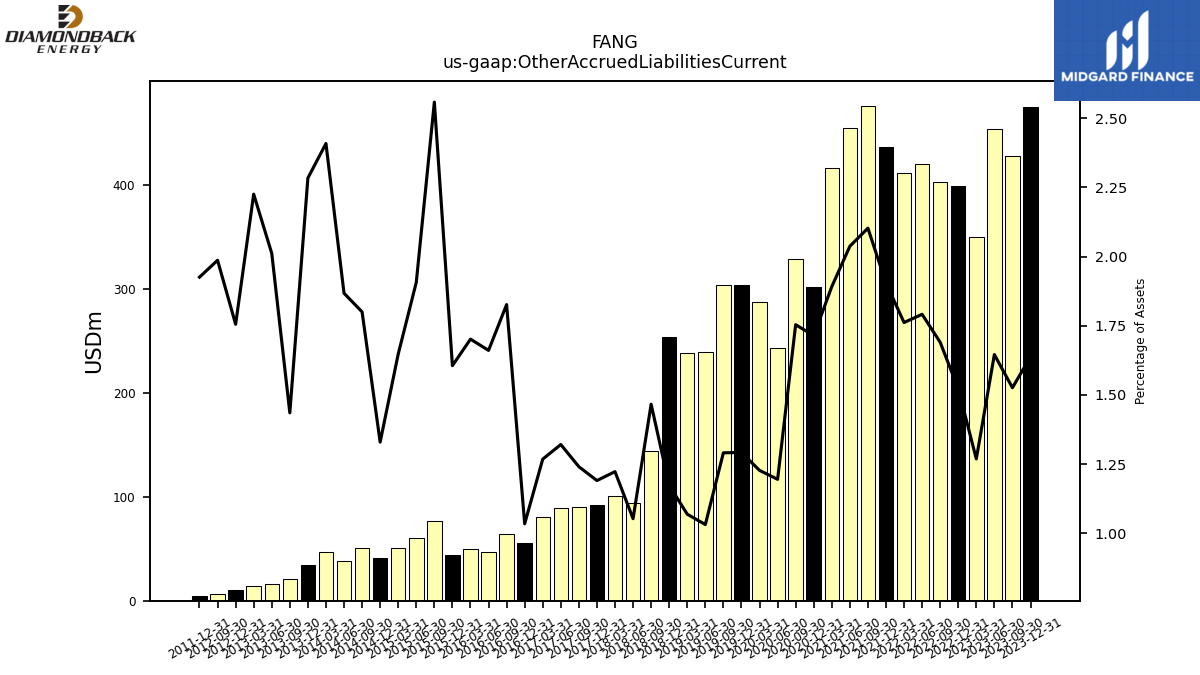
| Other Accrued Liabilities Current | 475.00 | 428.00 | 454.00 | 350.00 | 399.00 | 403.00 | 420.00 | 411.00 | 436.00 | 476.00 | 455.00 | 416.00 | 302.00 | 329.00 | 243.00 | 287.00 | 304.00 | 304.00 | 239.00 | 238.00 | 253.27 | 143.79 | 94.27 | 100.56 | 92.51 | 90.40 | 89.59 | 80.76 | |
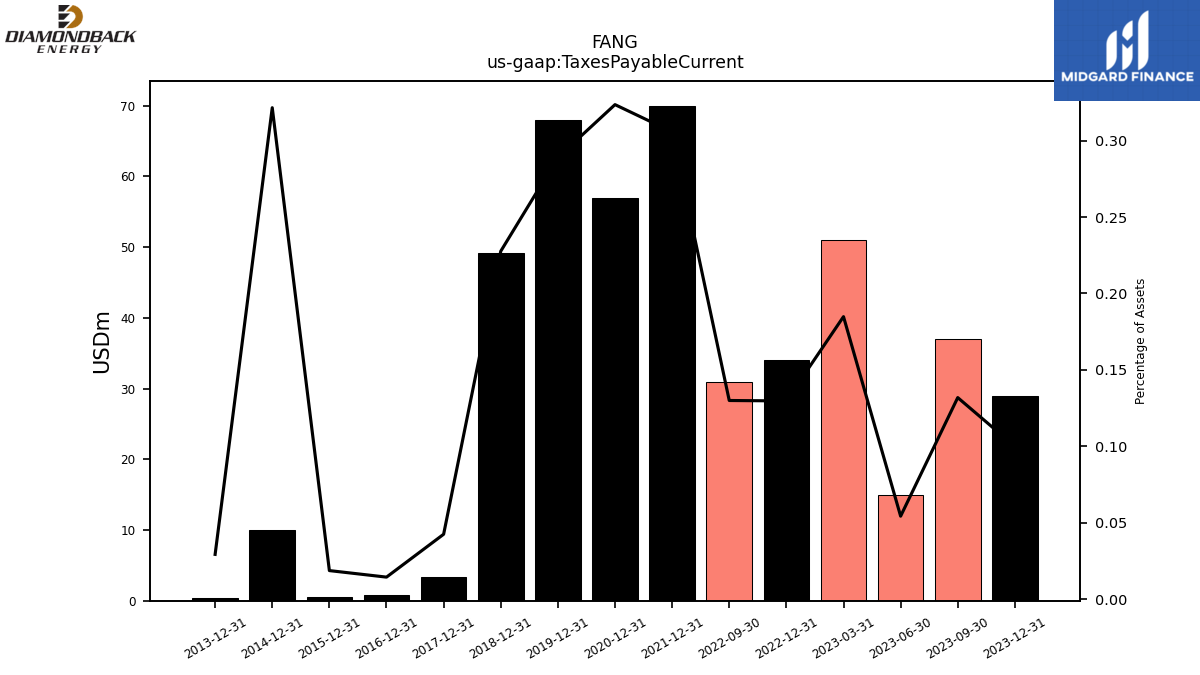
| Taxes Payable Current | 29.00 | 37.00 | 15.00 | 51.00 | 34.00 | 31.00 | NA | NA | 70.00 | NA | NA | NA | 57.00 | NA | NA | NA | 68.00 | NA | NA | NA | 49.16 | NA | NA | NA | 3.31 | NA | NA | NA | |
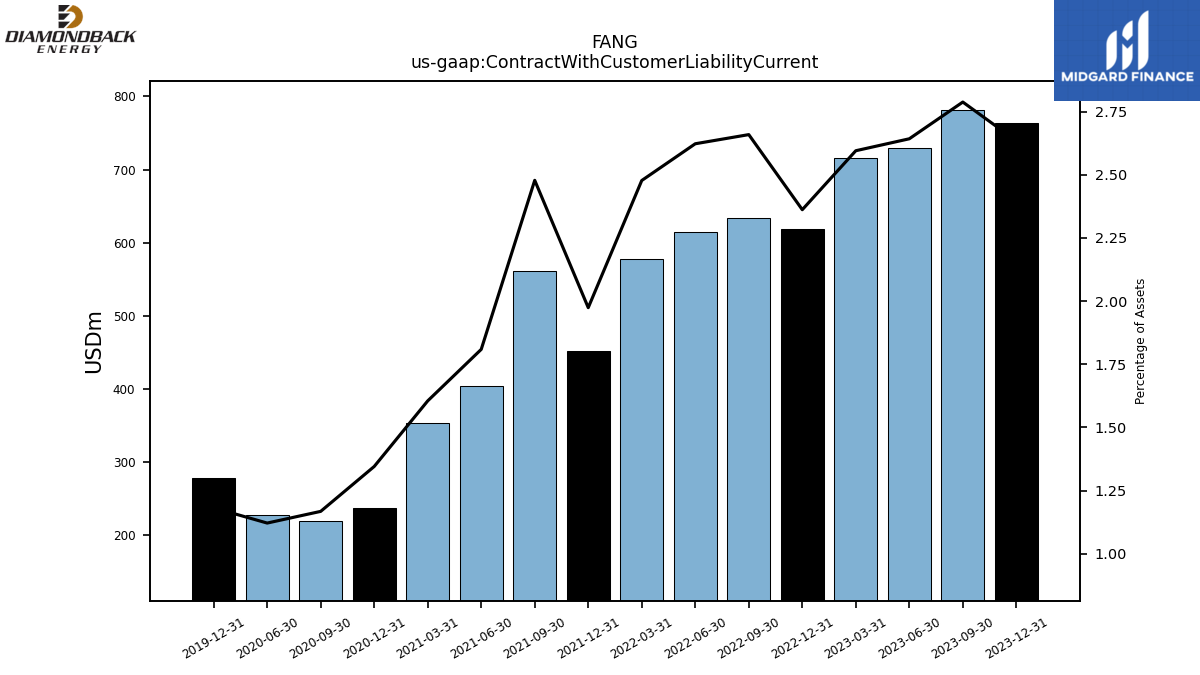
| Contract With Customer Liability Current | 764.00 | 782.00 | 729.00 | 716.00 | 619.00 | 634.00 | 615.00 | 578.00 | 452.00 | 561.00 | 404.00 | 353.00 | 237.00 | 219.00 | 228.00 | NA | 278.00 | NA | NA | NA | NA | NA | NA | NA | NA | NA | NA | NA |
| 2023-12-31 | 2023-09-30 | 2023-06-30 | 2023-03-31 | 2022-12-31 | 2022-09-30 | 2022-06-30 | 2022-03-31 | 2021-12-31 | 2021-09-30 | 2021-06-30 | 2021-03-31 | 2020-12-31 | 2020-09-30 | 2020-06-30 | 2020-03-31 | 2019-12-31 | 2019-09-30 | 2019-06-30 | 2019-03-31 | 2018-12-31 | 2018-09-30 | 2018-06-30 | 2018-03-31 | 2017-12-31 | 2017-09-30 | 2017-06-30 | 2017-03-31 | ||
|---|---|---|---|---|---|---|---|---|---|---|---|---|---|---|---|---|---|---|---|---|---|---|---|---|---|---|---|---|---|
| Long Term Debt | 6641.00 | 6230.00 | 6543.00 | 6950.00 | 6238.00 | 5347.00 | 5401.00 | 5803.00 | 6642.00 | 6925.00 | 7360.00 | 7465.00 | 5624.00 | 5656.00 | 5952.00 | 5677.00 | 5371.00 | 4761.00 | 4472.00 | 4670.00 | 4464.34 | 2332.36 | 1967.07 | 1701.91 | 1477.35 | 1256.39 | 1151.52 | 985.79 | |
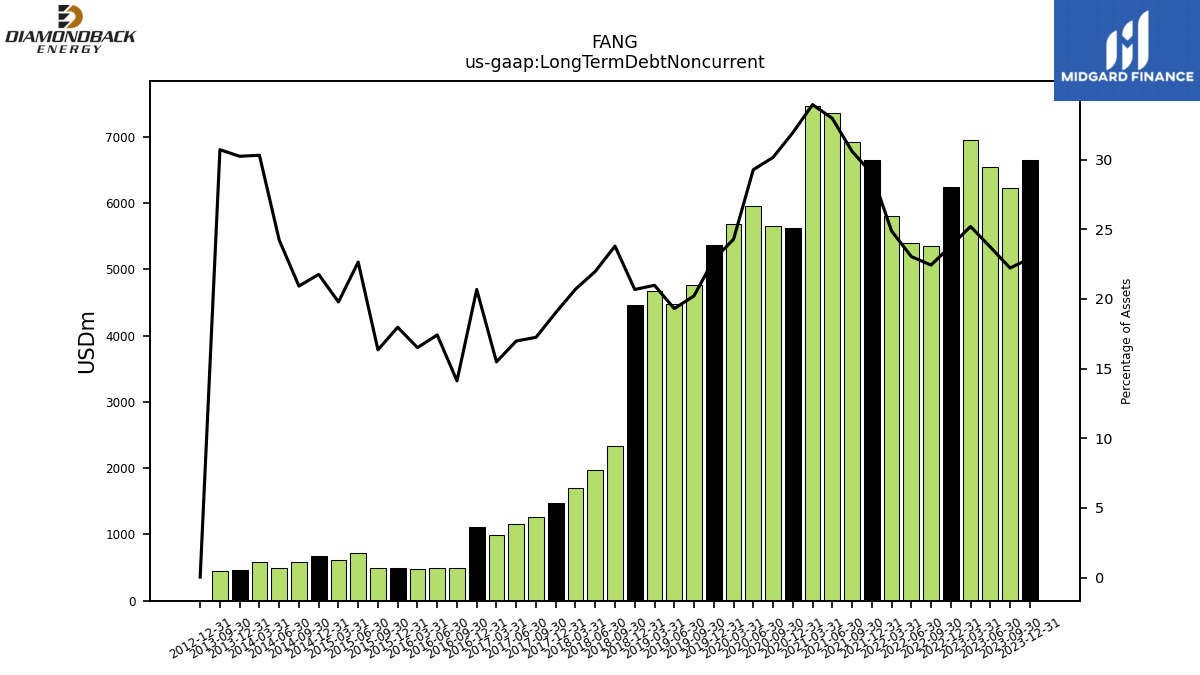
| Long Term Debt Noncurrent | 6641.00 | 6230.00 | 6543.00 | 6950.00 | 6238.00 | 5347.00 | 5401.00 | 5803.00 | 6642.00 | 6925.00 | 7360.00 | 7465.00 | 5624.00 | 5656.00 | 5952.00 | 5677.00 | 5371.00 | 4761.00 | 4472.00 | 4670.00 | 4464.34 | 2332.36 | 1967.07 | 1701.91 | 1477.35 | 1256.39 | 1151.52 | 985.79 | |
| Deferred Income Tax Liabilities Net | 2449.00 | 2243.00 | 2233.00 | 2161.00 | 2069.00 | 1737.00 | 1600.00 | 1421.00 | 1338.00 | 1068.00 | 879.00 | 790.00 | 783.00 | 978.00 | 1286.00 | 1888.00 | 1886.00 | NA | NA | NA | NA | NA | NA | NA | NA | NA | NA | NA | |
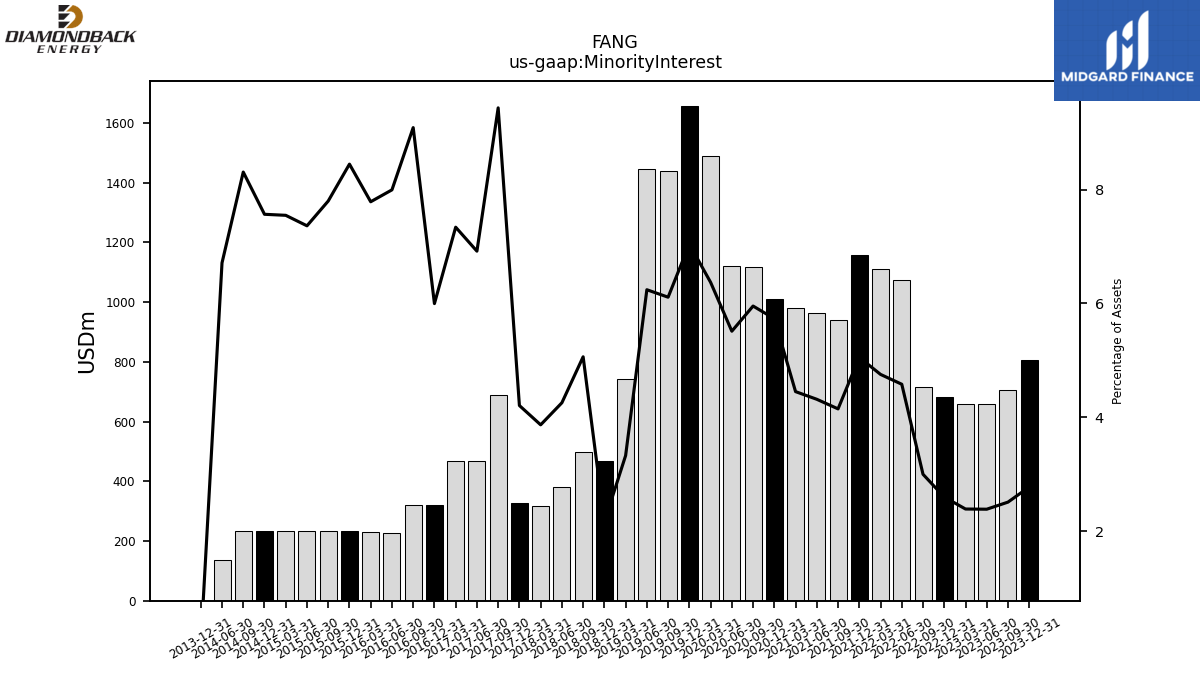
| Minority Interest | 805.00 | 704.00 | 658.00 | 659.00 | 681.00 | 715.00 | 1074.00 | 1109.00 | 1157.00 | 939.00 | 964.00 | 979.00 | 1010.00 | 1117.00 | 1121.00 | 1490.00 | 1657.00 | 1439.00 | 1446.00 | 741.00 | 466.98 | 496.44 | 381.02 | 318.10 | 326.88 | 687.62 | 469.31 | 467.49 | |
| Other Liabilities Noncurrent | 12.00 | 12.00 | 15.00 | 13.00 | 12.00 | 14.00 | 34.00 | 35.00 | 40.00 | 14.00 | 17.00 | 23.00 | 7.00 | 8.00 | 9.00 | 10.00 | 11.00 | NA | NA | NA | NA | NA | NA | NA | NA | NA | NA | NA |
| 2023-12-31 | 2023-09-30 | 2023-06-30 | 2023-03-31 | 2022-12-31 | 2022-09-30 | 2022-06-30 | 2022-03-31 | 2021-12-31 | 2021-09-30 | 2021-06-30 | 2021-03-31 | 2020-12-31 | 2020-09-30 | 2020-06-30 | 2020-03-31 | 2019-12-31 | 2019-09-30 | 2019-06-30 | 2019-03-31 | 2018-12-31 | 2018-09-30 | 2018-06-30 | 2018-03-31 | 2017-12-31 | 2017-09-30 | 2017-06-30 | 2017-03-31 | ||
|---|---|---|---|---|---|---|---|---|---|---|---|---|---|---|---|---|---|---|---|---|---|---|---|---|---|---|---|---|---|
| Stockholders Equity | 16625.00 | 16280.00 | 15554.00 | 15464.00 | 15009.00 | 13843.00 | 13316.00 | 12743.00 | 12088.00 | 11483.00 | 10926.00 | 10673.00 | 8794.00 | 9552.00 | 10714.00 | 12826.00 | 13249.00 | 14050.00 | 14004.00 | 13773.00 | 13699.29 | 5933.36 | 5631.45 | 5417.08 | 5254.86 | 4898.50 | 4817.62 | 4651.87 | |
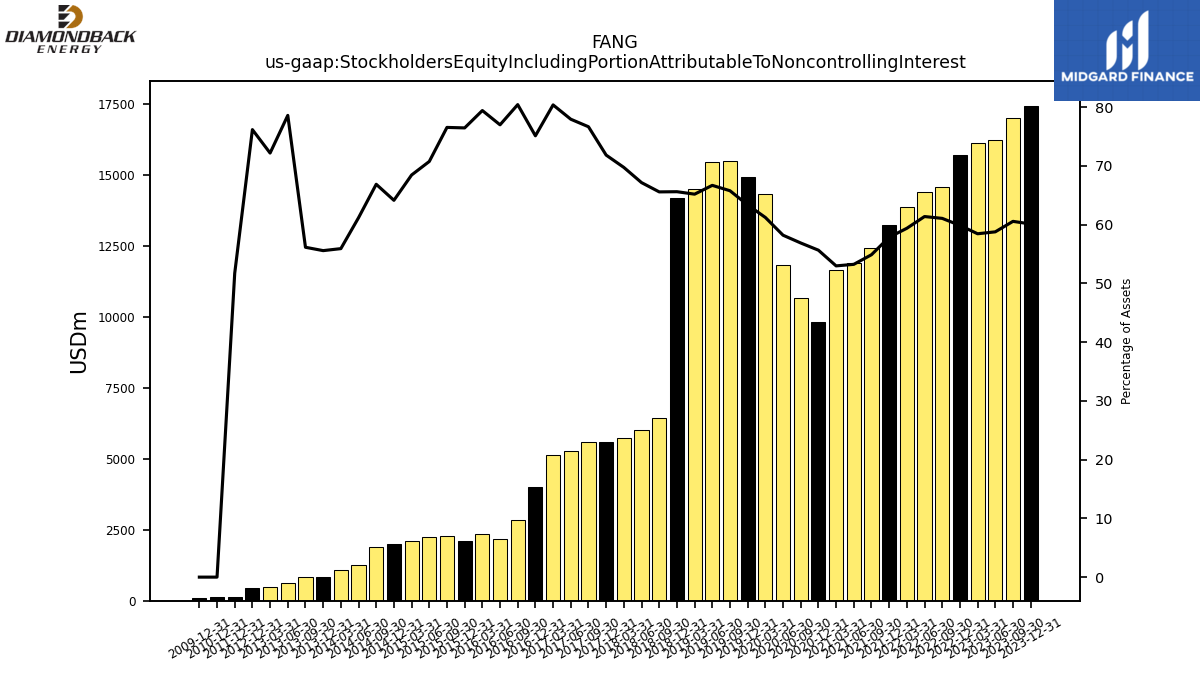
| Stockholders Equity Including Portion Attributable To Noncontrolling Interest | 17430.00 | 16984.00 | 16212.00 | 16123.00 | 15690.00 | 14558.00 | 14390.00 | 13852.00 | 13245.00 | 12422.00 | 11890.00 | 11652.00 | 9804.00 | 10669.00 | 11835.00 | 14316.00 | 14906.00 | 15489.00 | 15450.00 | 14514.00 | 14166.26 | 6429.80 | 6012.47 | 5735.18 | 5581.74 | 5586.12 | 5286.93 | 5119.36 | |
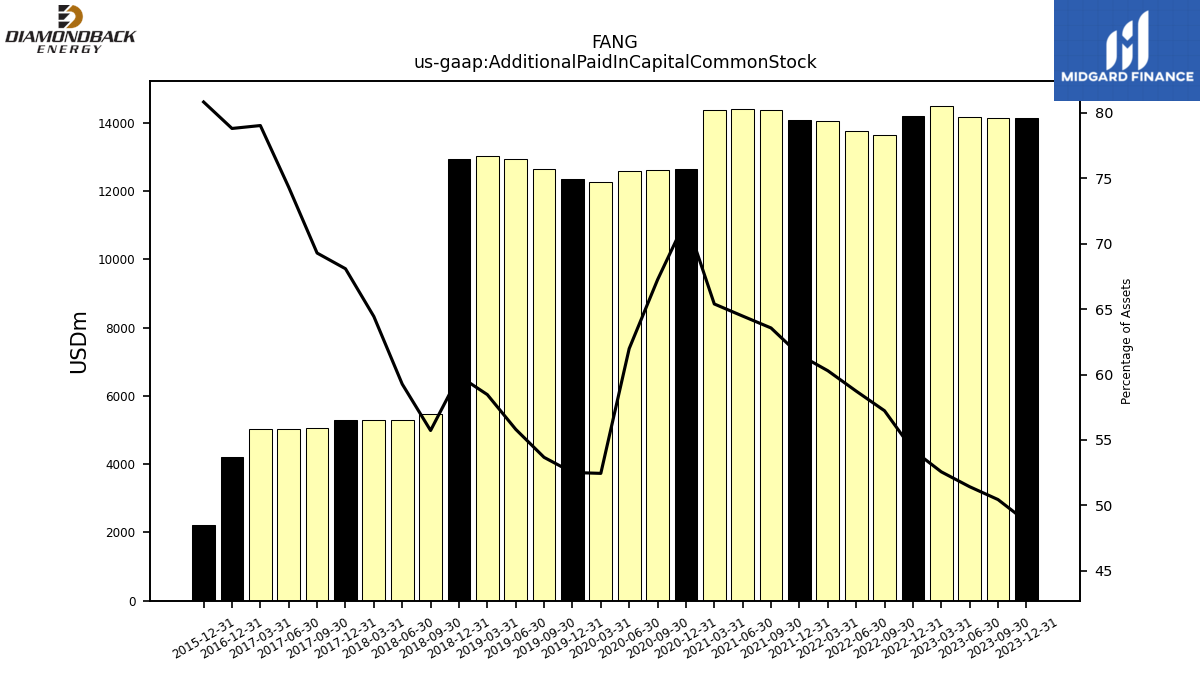
| Additional Paid In Capital Common Stock | 14142.00 | 14149.00 | 14187.00 | 14502.00 | 14213.00 | 13646.00 | 13772.00 | 14067.00 | 14084.00 | 14389.00 | 14399.00 | 14384.00 | 12656.00 | 12615.00 | 12605.00 | 12265.00 | 12357.00 | 12641.00 | 12933.00 | 13019.00 | 12935.89 | 5464.54 | 5307.36 | 5299.81 | 5291.01 | 5049.21 | 5041.36 | 5034.01 | |
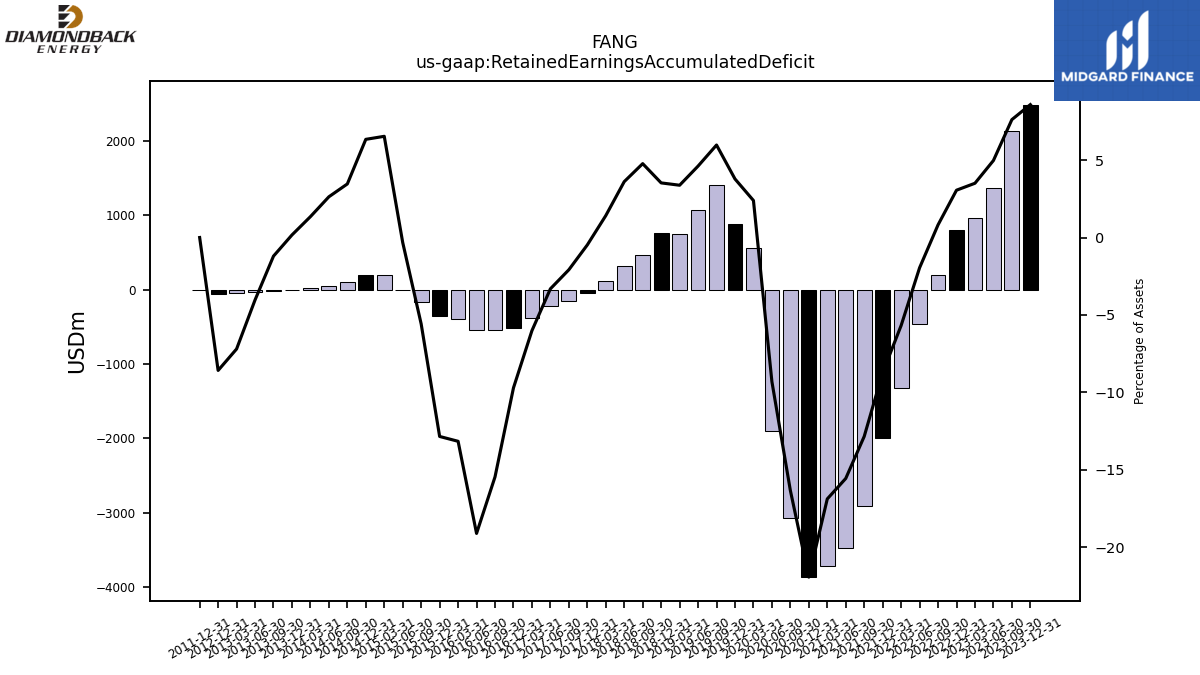
| Retained Earnings Accumulated Deficit | 2489.00 | 2136.00 | 1372.00 | 967.00 | 801.00 | 195.00 | -458.00 | -1326.00 | -1998.00 | -2908.00 | -3475.00 | -3713.00 | -3864.00 | -3065.00 | -1893.00 | 559.00 | 890.00 | 1407.00 | 1069.00 | 752.00 | 761.83 | 467.83 | 323.11 | 116.29 | -37.13 | -151.69 | -224.72 | -383.12 | |
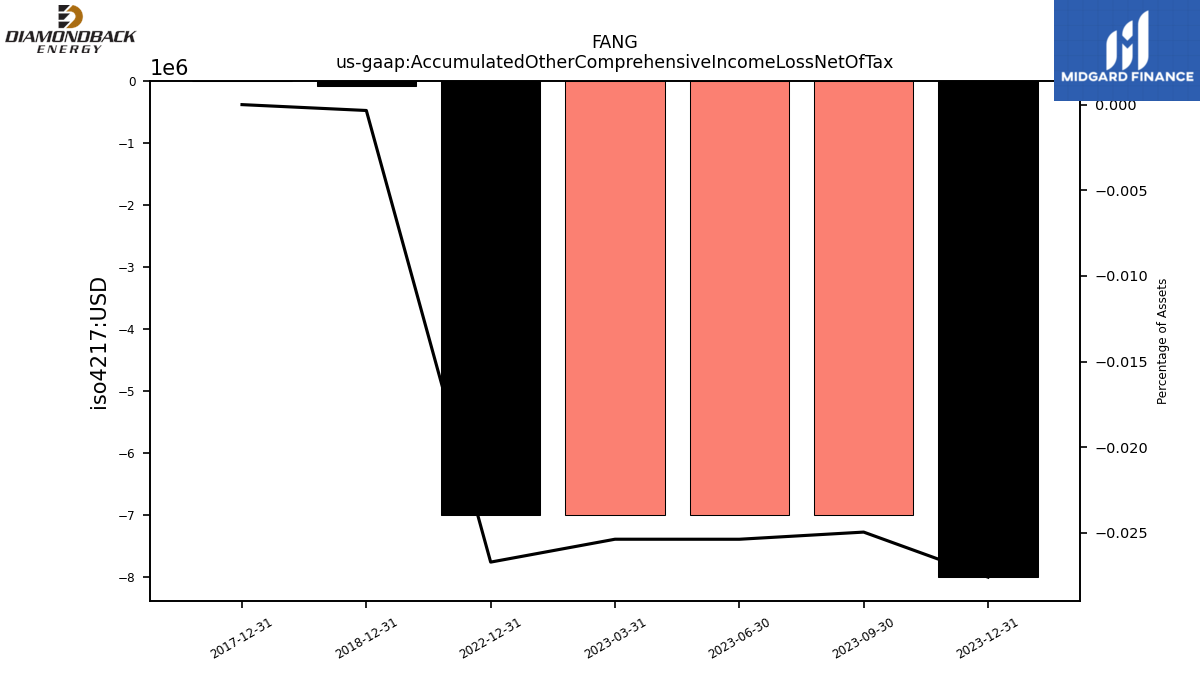
| Accumulated Other Comprehensive Income Loss Net Of Tax | -8.00 | -7.00 | -7.00 | -7.00 | -7.00 | NA | NA | NA | NA | NA | NA | NA | NA | NA | NA | NA | NA | NA | NA | NA | -0.07 | NA | NA | NA | 0.00 | NA | NA | NA | |
| Minority Interest | 805.00 | 704.00 | 658.00 | 659.00 | 681.00 | 715.00 | 1074.00 | 1109.00 | 1157.00 | 939.00 | 964.00 | 979.00 | 1010.00 | 1117.00 | 1121.00 | 1490.00 | 1657.00 | 1439.00 | 1446.00 | 741.00 | 466.98 | 496.44 | 381.02 | 318.10 | 326.88 | 687.62 | 469.31 | 467.49 |
| 2023-12-31 | 2023-09-30 | 2023-06-30 | 2023-03-31 | 2022-12-31 | 2022-09-30 | 2022-06-30 | 2022-03-31 | 2021-12-31 | 2021-09-30 | 2021-06-30 | 2021-03-31 | 2020-12-31 | 2020-09-30 | 2020-06-30 | 2020-03-31 | 2019-12-31 | 2019-09-30 | 2019-06-30 | 2019-03-31 | 2018-12-31 | 2018-09-30 | 2018-06-30 | 2018-03-31 | 2017-12-31 | 2017-09-30 | 2017-06-30 | 2017-03-31 | ||
|---|---|---|---|---|---|---|---|---|---|---|---|---|---|---|---|---|---|---|---|---|---|---|---|---|---|---|---|---|---|
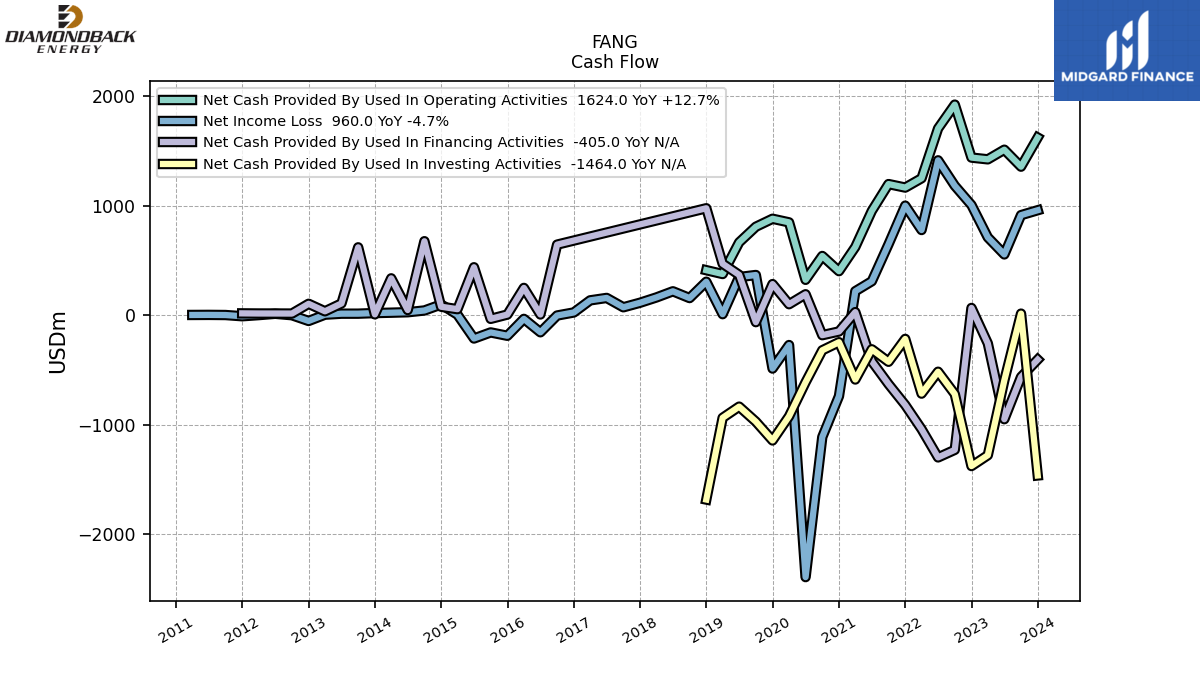
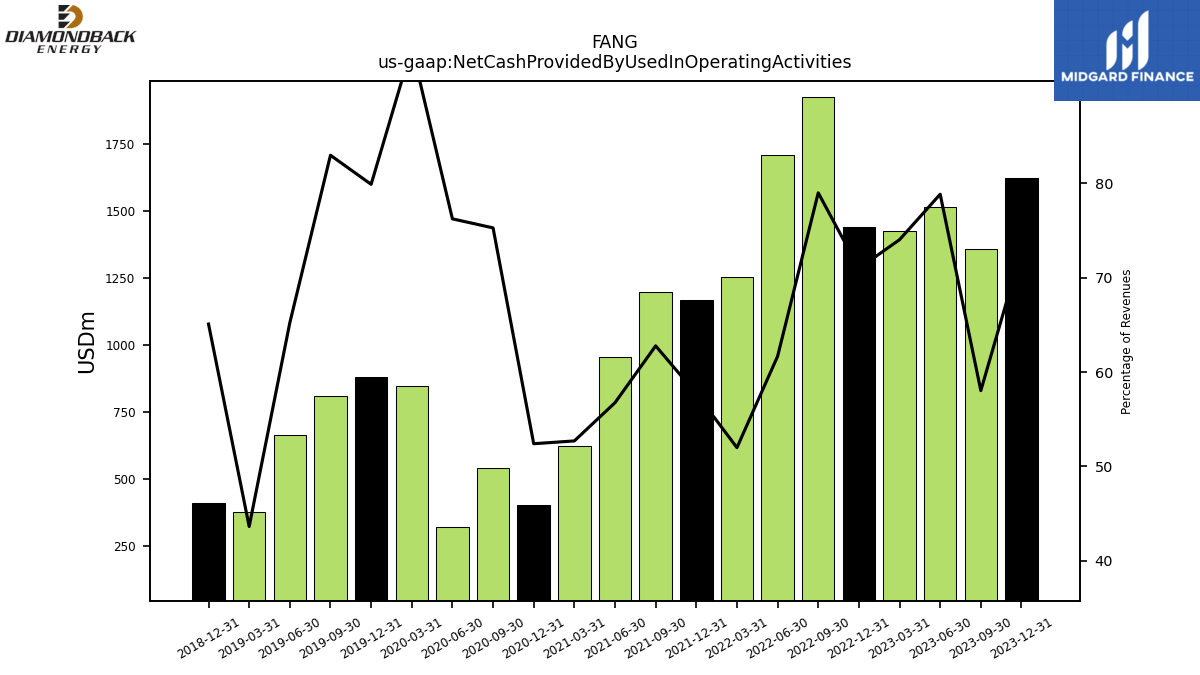
| Net Cash Provided By Used In Operating Activities | 1624.00 | 1358.00 | 1513.00 | 1425.00 | 1441.00 | 1925.00 | 1707.00 | 1252.00 | 1167.00 | 1199.00 | 954.00 | 624.00 | 403.00 | 542.00 | 324.00 | 849.00 | 882.00 | 809.00 | 666.00 | 377.00 | 412.00 | NA | NA | NA | NA | NA | NA | NA | |
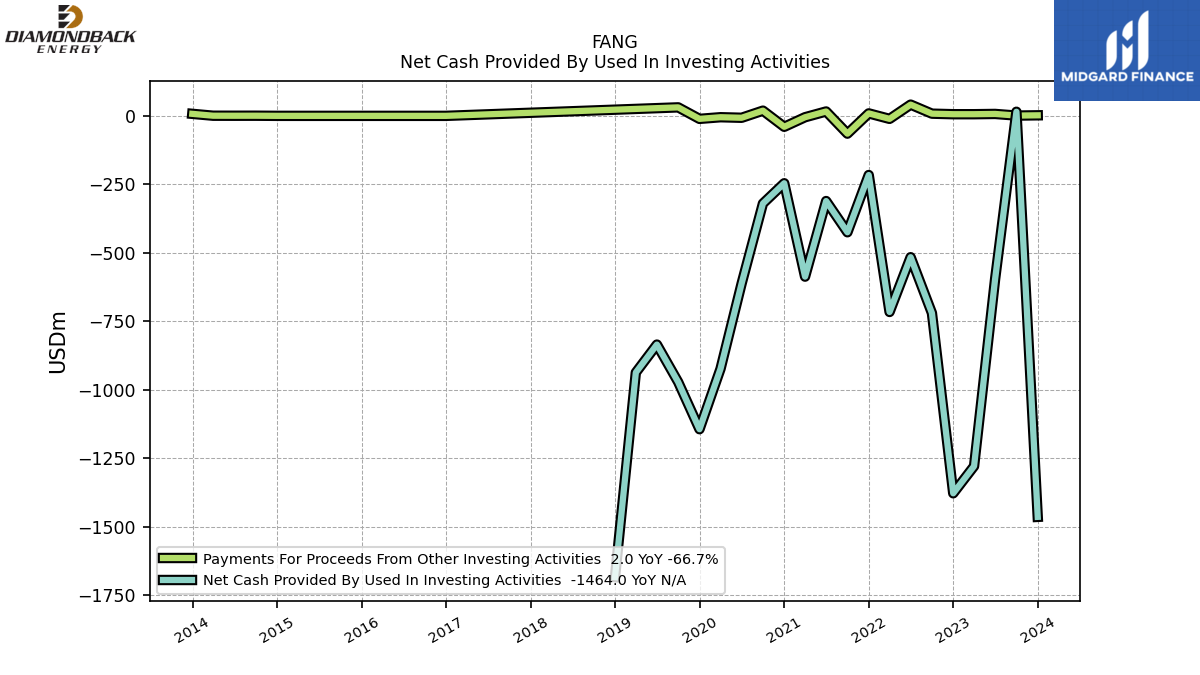
| Net Cash Provided By Used In Investing Activities | -1464.00 | 15.00 | -595.00 | -1279.00 | -1378.00 | -720.00 | -516.00 | -716.00 | -216.00 | -425.00 | -311.00 | -587.00 | -246.00 | -320.00 | -612.00 | -923.00 | -1144.00 | -972.00 | -835.00 | -937.00 | -1684.00 | NA | NA | NA | NA | NA | NA | NA | |
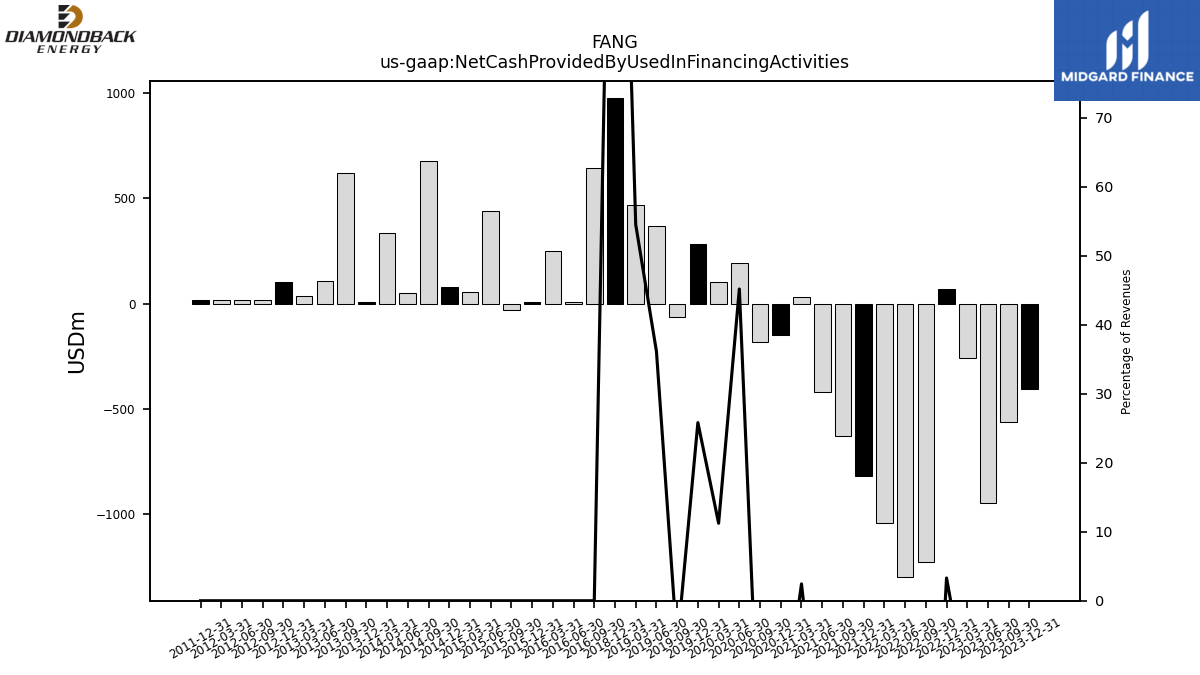
| Net Cash Provided By Used In Financing Activities | -405.00 | -564.00 | -950.00 | -257.00 | 67.00 | -1230.00 | -1299.00 | -1041.00 | -820.00 | -629.00 | -421.00 | 29.00 | -148.00 | -182.00 | 192.00 | 101.00 | 285.00 | -63.00 | 369.00 | 471.00 | 978.00 | NA | NA | NA | NA | NA | NA | NA |
| 2023-12-31 | 2023-09-30 | 2023-06-30 | 2023-03-31 | 2022-12-31 | 2022-09-30 | 2022-06-30 | 2022-03-31 | 2021-12-31 | 2021-09-30 | 2021-06-30 | 2021-03-31 | 2020-12-31 | 2020-09-30 | 2020-06-30 | 2020-03-31 | 2019-12-31 | 2019-09-30 | 2019-06-30 | 2019-03-31 | 2018-12-31 | 2018-09-30 | 2018-06-30 | 2018-03-31 | 2017-12-31 | 2017-09-30 | 2017-06-30 | 2017-03-31 | ||
|---|---|---|---|---|---|---|---|---|---|---|---|---|---|---|---|---|---|---|---|---|---|---|---|---|---|---|---|---|---|
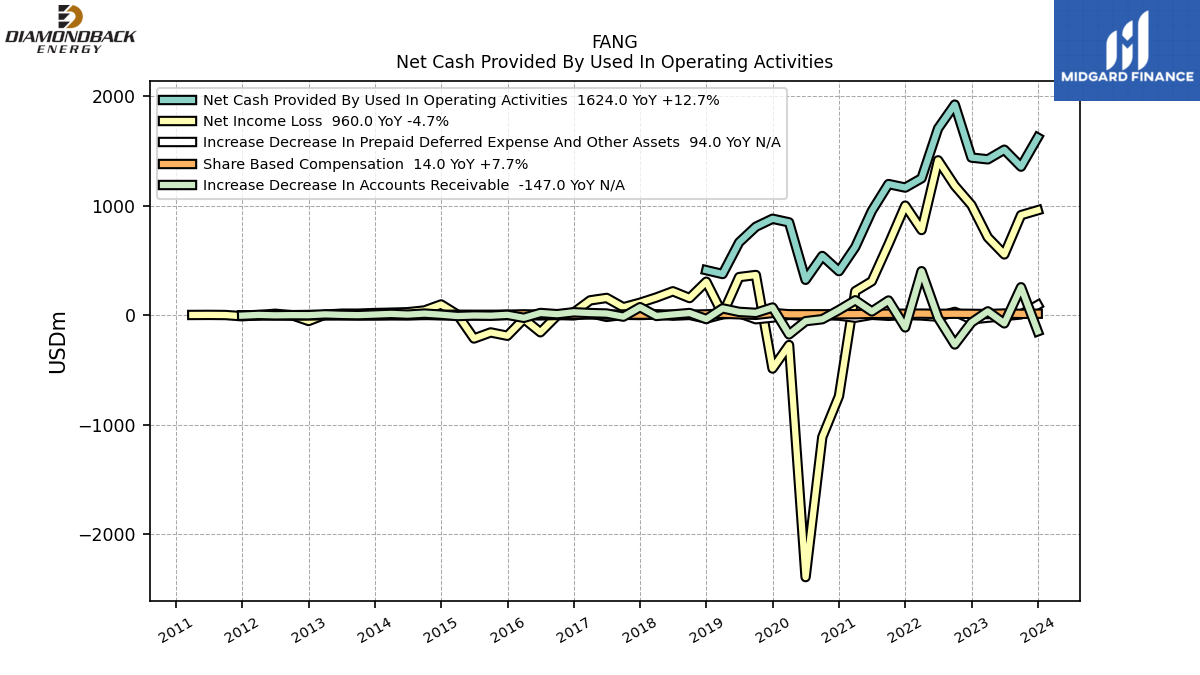
| Net Cash Provided By Used In Operating Activities | 1624.00 | 1358.00 | 1513.00 | 1425.00 | 1441.00 | 1925.00 | 1707.00 | 1252.00 | 1167.00 | 1199.00 | 954.00 | 624.00 | 403.00 | 542.00 | 324.00 | 849.00 | 882.00 | 809.00 | 666.00 | 377.00 | 412.00 | NA | NA | NA | NA | NA | NA | NA | |
| Net Income Loss | 960.00 | 915.00 | 556.00 | 712.00 | 1007.00 | 1184.00 | 1416.00 | 779.00 | 1002.00 | 649.00 | 311.00 | 220.00 | -739.00 | -1113.00 | -2393.00 | -272.00 | -487.00 | 368.00 | 349.00 | 10.00 | 306.66 | 157.05 | 219.15 | 162.81 | 114.56 | 73.02 | 158.41 | 136.27 | |
| Profit Loss | 1011.00 | 993.00 | 586.00 | 746.00 | 1028.00 | 1270.00 | 1461.00 | 803.00 | 1051.00 | 674.00 | 328.00 | 223.00 | -756.00 | -1105.00 | -2411.00 | -400.00 | -472.00 | 388.00 | 356.00 | 43.00 | 306.16 | 159.42 | 301.16 | 178.15 | 129.61 | 81.95 | 164.13 | 141.07 | |
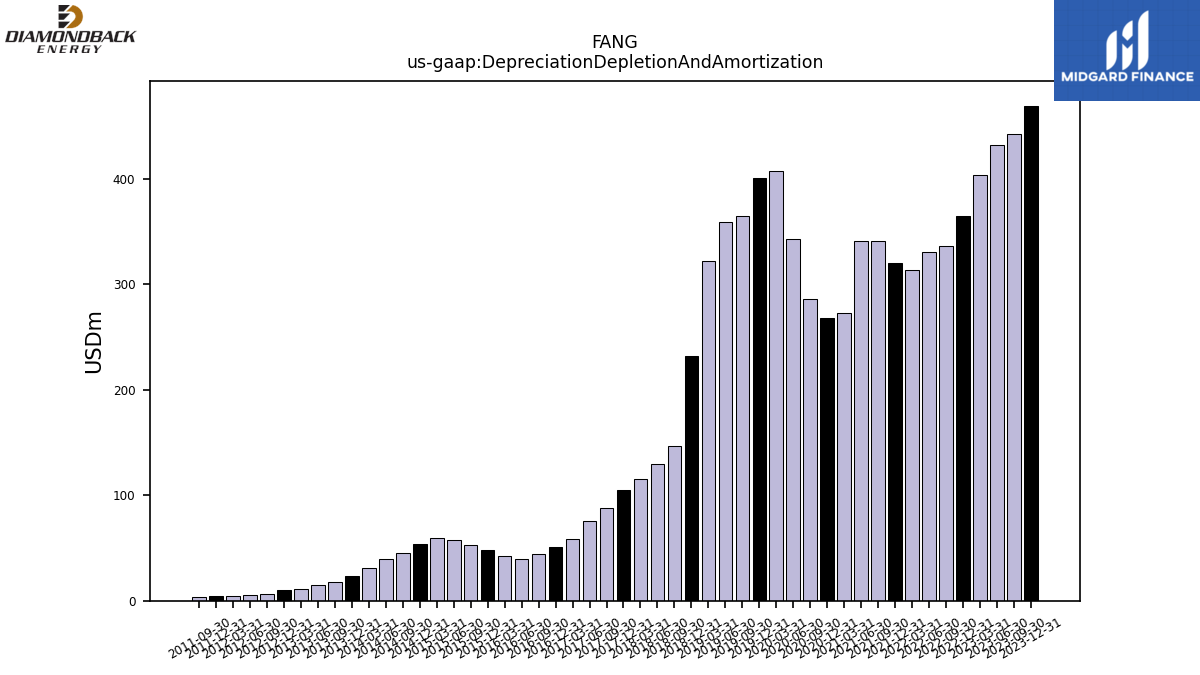
| Depreciation Depletion And Amortization | 469.00 | 442.00 | 432.00 | 403.00 | 365.00 | 336.00 | 330.00 | 313.00 | 320.00 | 341.00 | 341.00 | 273.00 | 268.00 | 286.00 | 343.00 | 407.00 | 401.00 | 365.00 | 359.00 | 322.00 | 231.64 | 146.32 | 129.87 | 115.22 | 105.08 | 87.58 | 75.17 | 58.93 | |
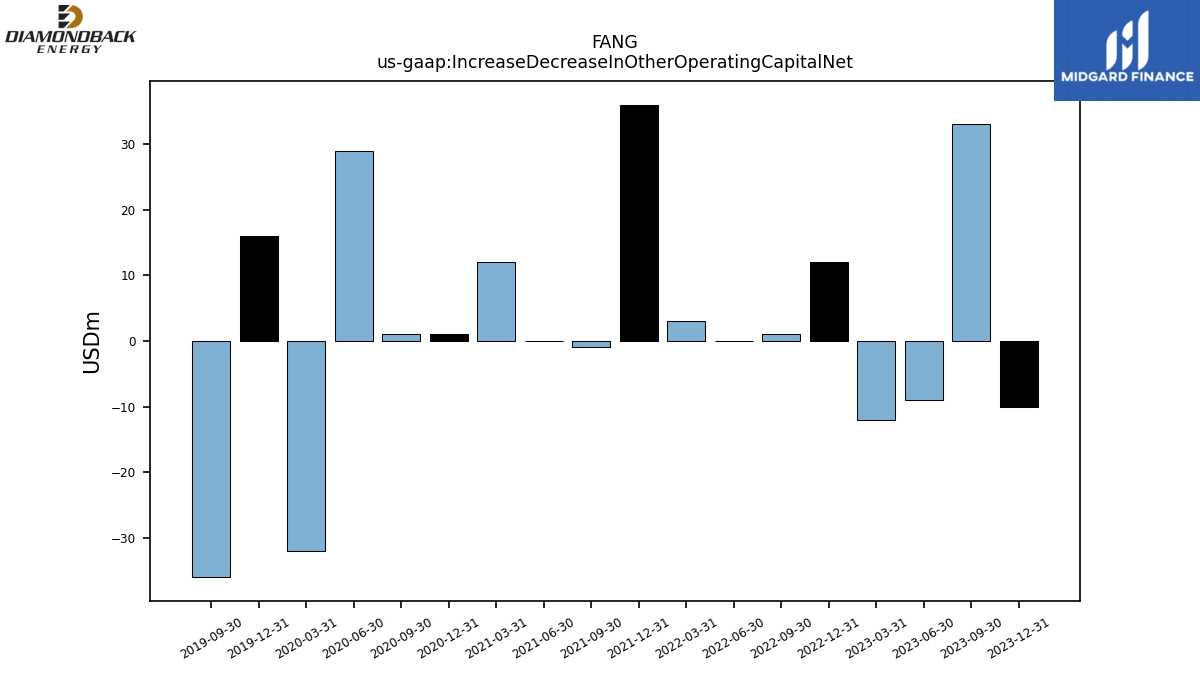
| Increase Decrease In Other Operating Capital Net | -10.00 | 33.00 | -9.00 | -12.00 | 12.00 | 1.00 | 0.00 | 3.00 | 36.00 | -1.00 | 0.00 | 12.00 | 1.00 | 1.00 | 29.00 | -32.00 | 16.00 | -36.00 | NA | NA | NA | NA | NA | NA | NA | NA | NA | NA | |
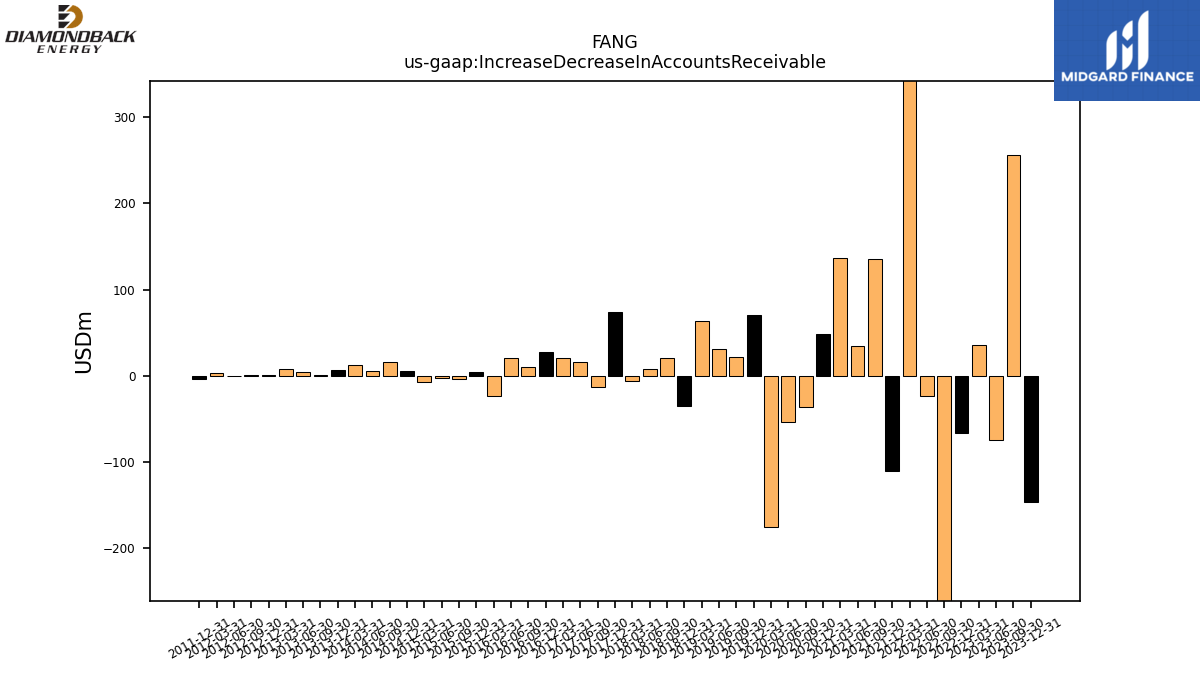
| Increase Decrease In Accounts Receivable | -147.00 | 256.00 | -74.00 | 36.00 | -66.00 | -267.00 | -23.00 | 403.00 | -111.00 | 135.00 | 35.00 | 137.00 | 48.00 | -36.00 | -54.00 | -175.00 | 71.00 | 22.00 | 31.00 | 63.00 | -34.77 | 20.54 | 7.39 | -6.32 | 74.19 | -12.71 | 16.03 | 20.10 | |
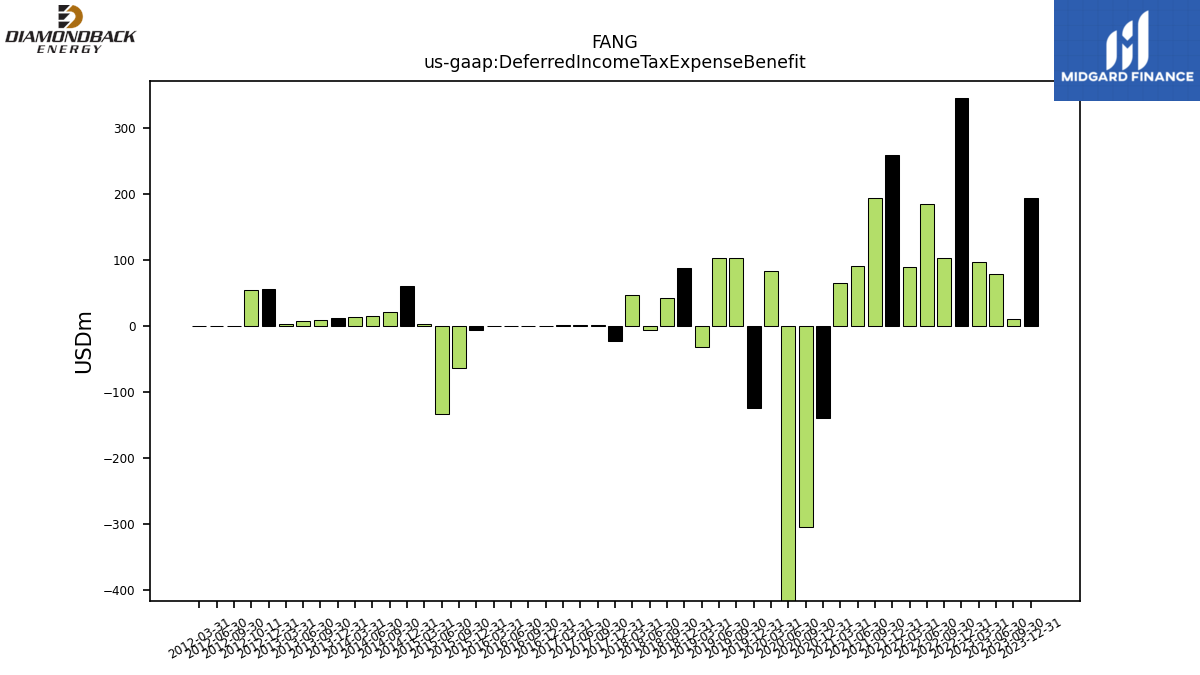
| Deferred Income Tax Expense Benefit | 193.00 | 10.00 | 78.00 | 97.00 | 345.00 | 102.00 | 184.00 | 89.00 | 258.00 | 193.00 | 91.00 | 64.00 | -140.00 | -304.00 | -681.00 | 83.00 | -124.00 | 102.00 | 102.00 | -33.00 | 87.78 | 41.61 | -6.94 | 46.91 | -23.88 | 0.98 | 0.91 | 1.43 | |
| Share Based Compensation | 14.00 | 13.00 | 16.00 | 11.00 | 13.00 | 14.00 | 13.00 | 15.00 | 14.00 | 14.00 | 13.00 | 10.00 | 10.00 | 9.00 | 9.00 | 9.00 | 21.00 | 4.00 | 9.00 | 14.00 | 8.31 | 5.35 | 5.65 | 7.45 | 6.12 | 6.19 | 6.17 | 7.06 |
| 2023-12-31 | 2023-09-30 | 2023-06-30 | 2023-03-31 | 2022-12-31 | 2022-09-30 | 2022-06-30 | 2022-03-31 | 2021-12-31 | 2021-09-30 | 2021-06-30 | 2021-03-31 | 2020-12-31 | 2020-09-30 | 2020-06-30 | 2020-03-31 | 2019-12-31 | 2019-09-30 | 2019-06-30 | 2019-03-31 | 2018-12-31 | 2018-09-30 | 2018-06-30 | 2018-03-31 | 2017-12-31 | 2017-09-30 | 2017-06-30 | 2017-03-31 | ||
|---|---|---|---|---|---|---|---|---|---|---|---|---|---|---|---|---|---|---|---|---|---|---|---|---|---|---|---|---|---|
| Net Cash Provided By Used In Investing Activities | -1464.00 | 15.00 | -595.00 | -1279.00 | -1378.00 | -720.00 | -516.00 | -716.00 | -216.00 | -425.00 | -311.00 | -587.00 | -246.00 | -320.00 | -612.00 | -923.00 | -1144.00 | -972.00 | -835.00 | -937.00 | -1684.00 | NA | NA | NA | NA | NA | NA | NA |
| 2023-12-31 | 2023-09-30 | 2023-06-30 | 2023-03-31 | 2022-12-31 | 2022-09-30 | 2022-06-30 | 2022-03-31 | 2021-12-31 | 2021-09-30 | 2021-06-30 | 2021-03-31 | 2020-12-31 | 2020-09-30 | 2020-06-30 | 2020-03-31 | 2019-12-31 | 2019-09-30 | 2019-06-30 | 2019-03-31 | 2018-12-31 | 2018-09-30 | 2018-06-30 | 2018-03-31 | 2017-12-31 | 2017-09-30 | 2017-06-30 | 2017-03-31 | ||
|---|---|---|---|---|---|---|---|---|---|---|---|---|---|---|---|---|---|---|---|---|---|---|---|---|---|---|---|---|---|
| Net Cash Provided By Used In Financing Activities | -405.00 | -564.00 | -950.00 | -257.00 | 67.00 | -1230.00 | -1299.00 | -1041.00 | -820.00 | -629.00 | -421.00 | 29.00 | -148.00 | -182.00 | 192.00 | 101.00 | 285.00 | -63.00 | 369.00 | 471.00 | 978.00 | NA | NA | NA | NA | NA | NA | NA | |
| Payments Of Dividends Common Stock | 603.00 | 149.00 | 150.00 | 542.00 | 398.00 | 526.00 | 541.00 | 107.00 | 91.00 | 81.00 | 72.00 | 68.00 | 59.00 | 59.00 | 59.00 | 59.00 | 30.00 | 31.00 | 30.00 | 21.00 | 12.66 | 12.33 | 12.33 | 0.00 | 0.00 | 0.00 | NA | NA | |
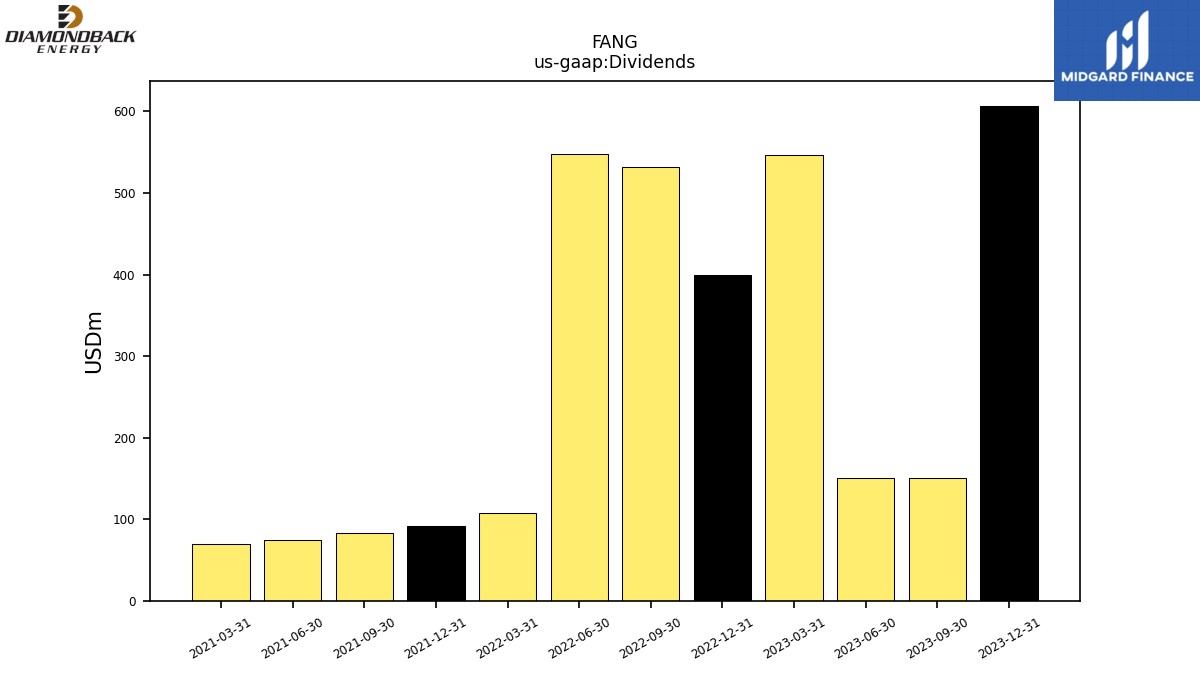
| Dividends | 607.00 | 151.00 | 151.00 | 546.00 | 400.00 | 532.00 | 548.00 | 108.00 | 92.00 | 83.00 | 74.00 | 69.00 | NA | NA | NA | NA | NA | NA | NA | NA | NA | NA | NA | NA | NA | NA | NA | NA | |
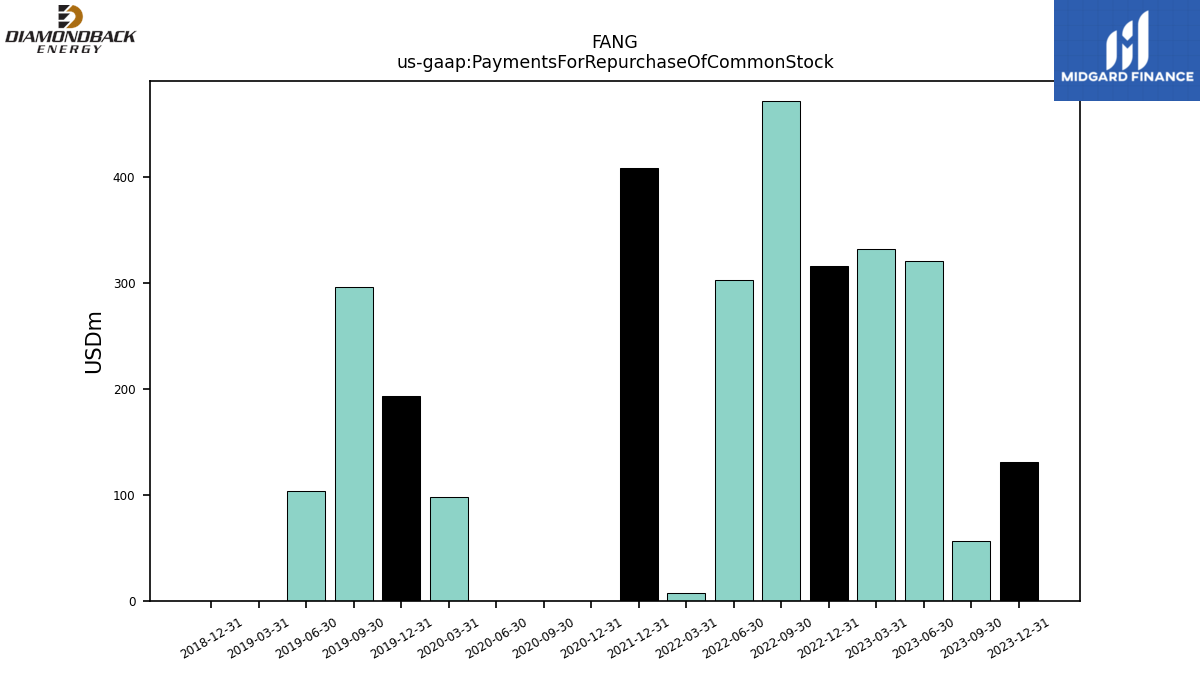
| Payments For Repurchase Of Common Stock | 131.00 | 56.00 | 321.00 | 332.00 | 316.00 | 472.00 | 303.00 | 7.00 | 409.00 | NA | NA | NA | 0.00 | 0.00 | 0.00 | 98.00 | 193.00 | 296.00 | 104.00 | 0.00 | 0.00 | NA | NA | NA | NA | NA | NA | NA |
| 2023-12-31 | 2023-09-30 | 2023-06-30 | 2023-03-31 | 2022-12-31 | 2022-09-30 | 2022-06-30 | 2022-03-31 | 2021-12-31 | 2021-09-30 | 2021-06-30 | 2021-03-31 | 2020-12-31 | 2020-09-30 | 2020-06-30 | 2020-03-31 | 2019-12-31 | 2019-09-30 | 2019-06-30 | 2019-03-31 | 2018-12-31 | 2018-09-30 | 2018-06-30 | 2018-03-31 | 2017-12-31 | 2017-09-30 | 2017-06-30 | 2017-03-31 | ||
|---|---|---|---|---|---|---|---|---|---|---|---|---|---|---|---|---|---|---|---|---|---|---|---|---|---|---|---|---|---|
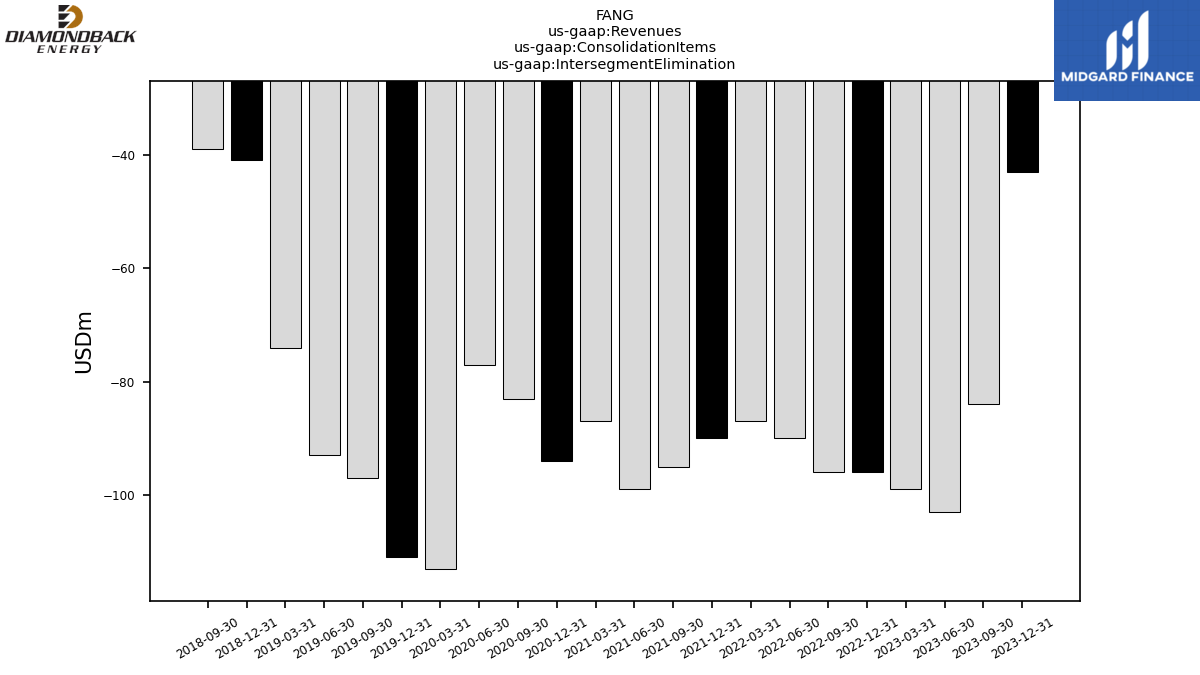
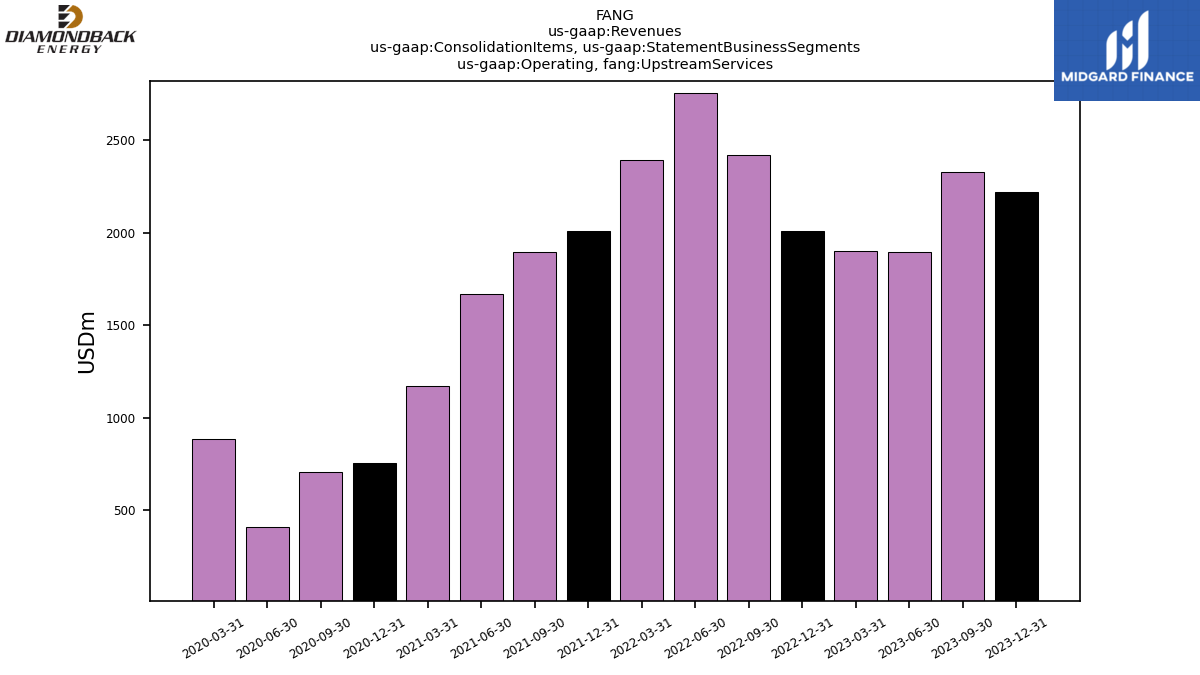
| Revenues | 2228.00 | 2340.00 | 1919.00 | 1925.00 | 2030.00 | 2437.00 | 2768.00 | 2408.00 | 2022.00 | 1910.00 | 1681.00 | 1184.00 | 769.00 | 720.00 | 425.00 | 899.00 | 1104.00 | 975.00 | 1021.00 | 864.00 | 633.00 | 537.00 | 527.00 | 479.00 | 399.19 | 301.25 | 269.43 | 235.23 | |
| Intersegment Elimination | -43.00 | -84.00 | -103.00 | -99.00 | -96.00 | -96.00 | -90.00 | -87.00 | -90.00 | -95.00 | -99.00 | -87.00 | -94.00 | -83.00 | -77.00 | -113.00 | -111.00 | -97.00 | -93.00 | -74.00 | -41.00 | -39.00 | NA | NA | NA | NA | NA | NA | |
| Operating, Upstream Services | 2218.00 | 2327.00 | 1895.00 | 1904.00 | 2009.00 | 2419.00 | 2753.00 | 2391.00 | 2010.00 | 1896.00 | 1669.00 | 1172.00 | 754.00 | 706.00 | 412.00 | 883.00 | NA | NA | NA | NA | NA | NA | NA | NA | NA | NA | NA | NA | |
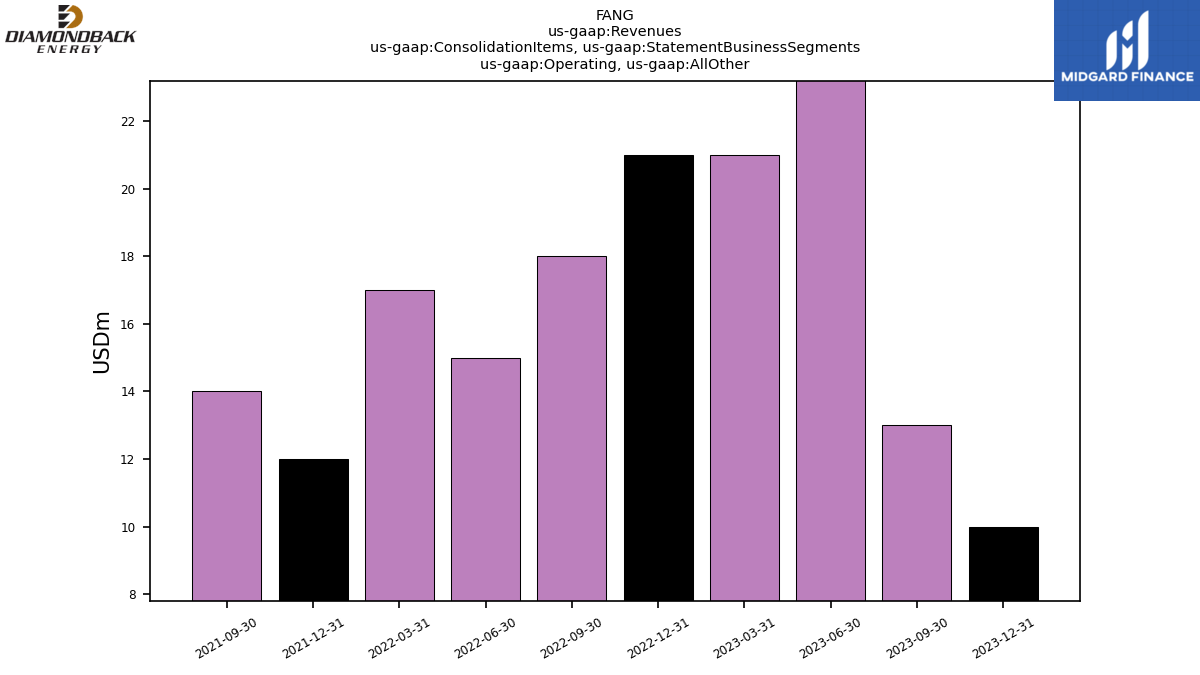
| Operating, All Other | 10.00 | 13.00 | 24.00 | 21.00 | 21.00 | 18.00 | 15.00 | 17.00 | 12.00 | 14.00 | NA | NA | NA | NA | NA | NA | NA | NA | NA | NA | NA | NA | NA | NA | NA | NA | NA | NA | |
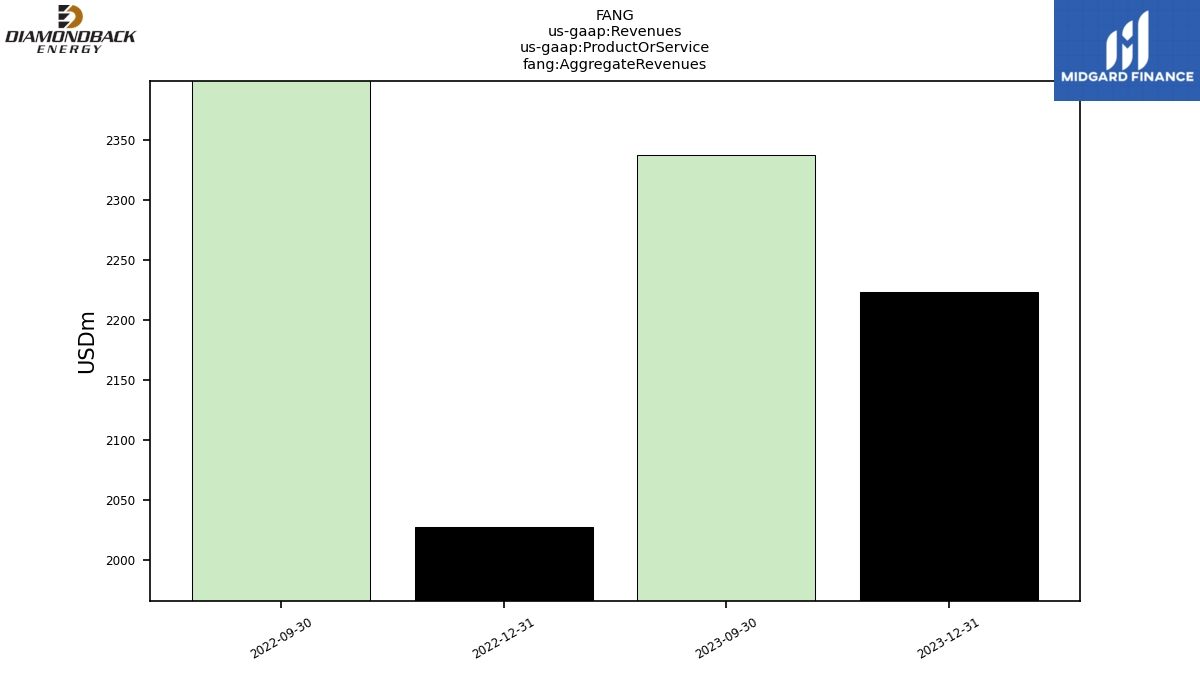
| Aggregate Revenues | 2223.00 | 2337.00 | NA | NA | 2028.00 | 2435.00 | NA | NA | NA | NA | NA | NA | NA | NA | NA | NA | NA | NA | NA | NA | NA | NA | NA | NA | NA | NA | NA | NA | |
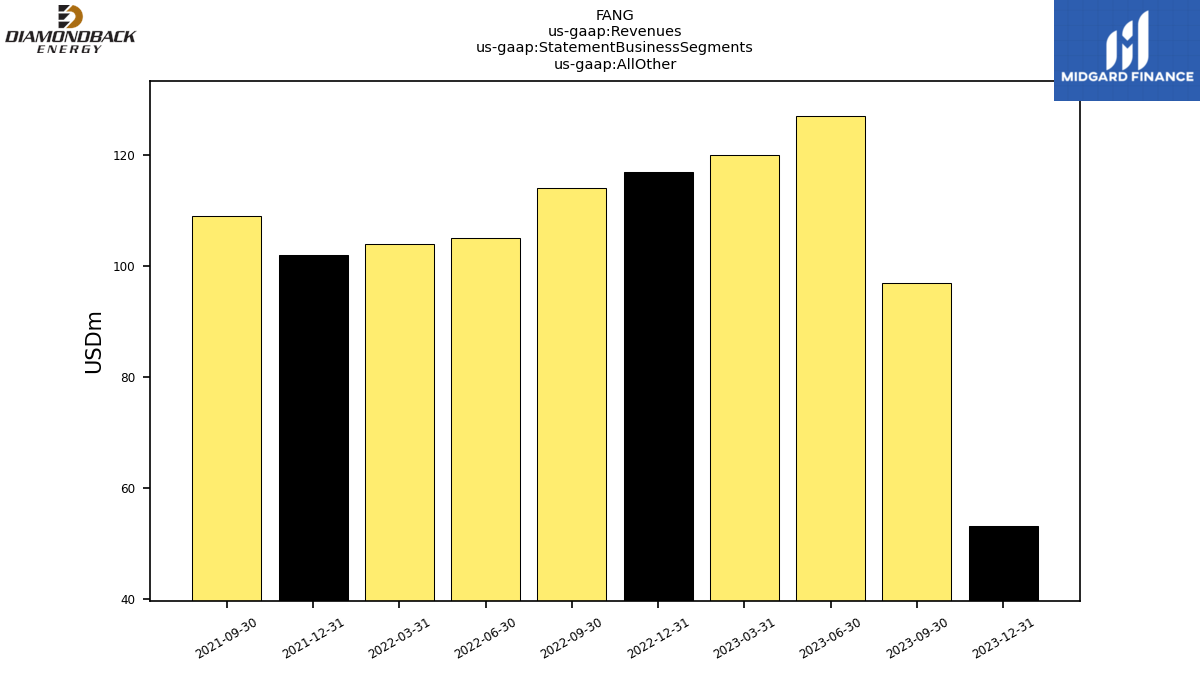
| All Other | 53.00 | 97.00 | 127.00 | 120.00 | 117.00 | 114.00 | 105.00 | 104.00 | 102.00 | 109.00 | NA | NA | NA | NA | NA | NA | NA | NA | NA | NA | NA | NA | NA | NA | NA | NA | NA | NA | |
| Revenue From Contract With Customer Excluding Assessed Tax | 2228.00 | 2340.00 | 1896.00 | 1902.00 | 2008.00 | 2417.00 | 2752.00 | 2389.00 | 2011.00 | 1897.00 | 1667.00 | 1172.00 | 754.00 | 707.00 | 412.00 | 883.00 | 1104.00 | 956.00 | 1000.00 | 864.00 | 633.00 | 537.00 | 527.00 | 479.00 | 399.19 | 301.25 | 269.43 | 235.23 | |
| Delaware Basin, Natural Gas Liquids Production | 43.00 | 50.00 | NA | NA | 59.00 | 80.00 | NA | NA | NA | NA | NA | NA | NA | NA | NA | NA | NA | NA | NA | NA | NA | NA | NA | NA | NA | NA | NA | NA | |
| Delaware Basin, Oil Explorationand Production | 378.00 | 407.00 | NA | NA | 446.00 | 539.00 | NA | NA | NA | NA | NA | NA | NA | NA | NA | NA | NA | NA | NA | NA | NA | NA | NA | NA | NA | NA | NA | NA | |
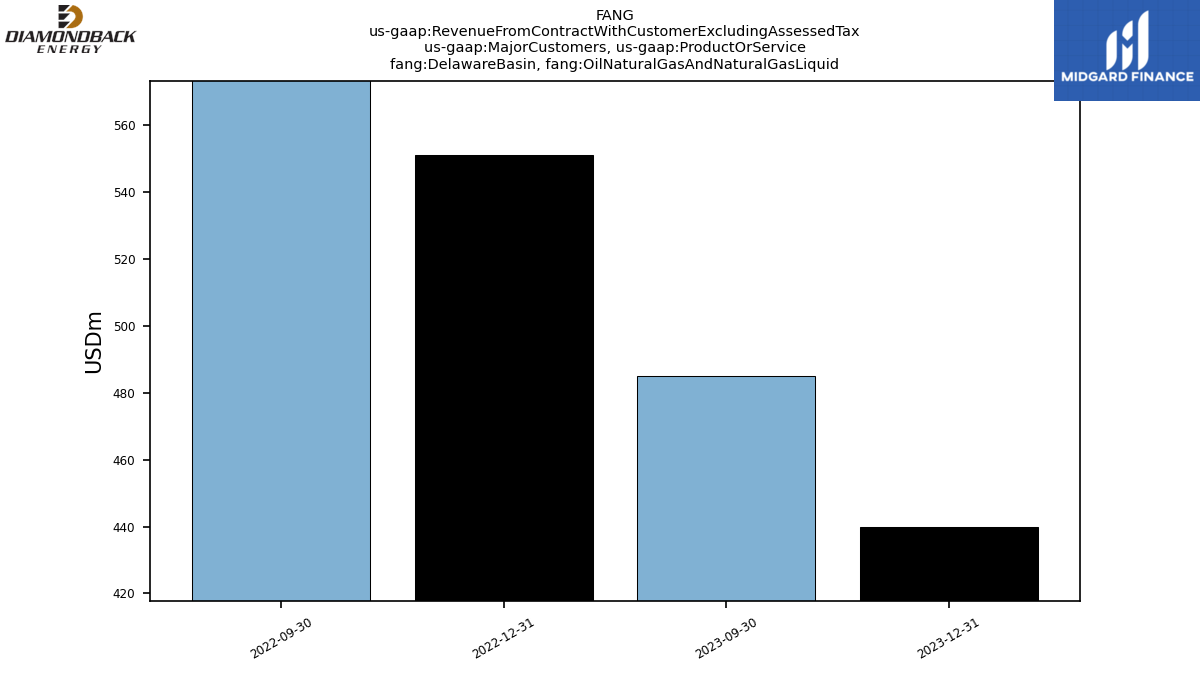
| Delaware Basin, Oil Natural Gas And Natural Gas Liquid | 440.00 | 485.00 | NA | NA | 551.00 | 714.00 | NA | NA | NA | NA | NA | NA | NA | NA | NA | NA | NA | NA | NA | NA | NA | NA | NA | NA | NA | NA | NA | NA | |
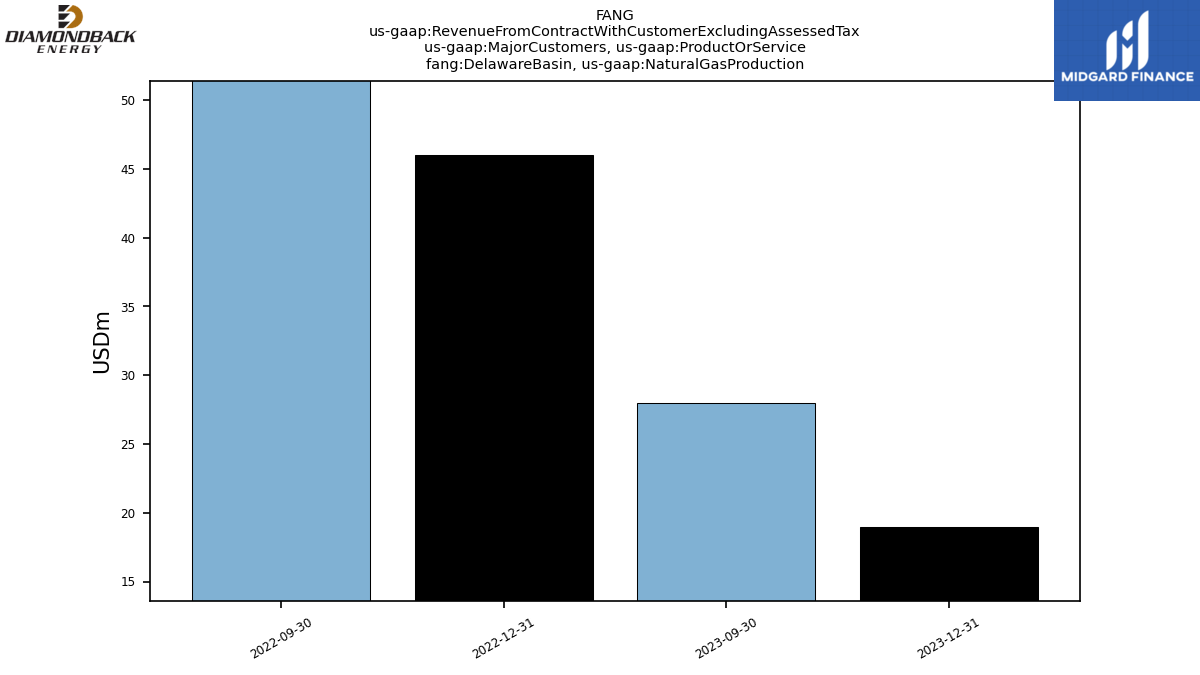
| Delaware Basin, Natural Gas Production | 19.00 | 28.00 | NA | NA | 46.00 | 95.00 | NA | NA | NA | NA | NA | NA | NA | NA | NA | NA | NA | NA | NA | NA | NA | NA | NA | NA | NA | NA | NA | NA | |
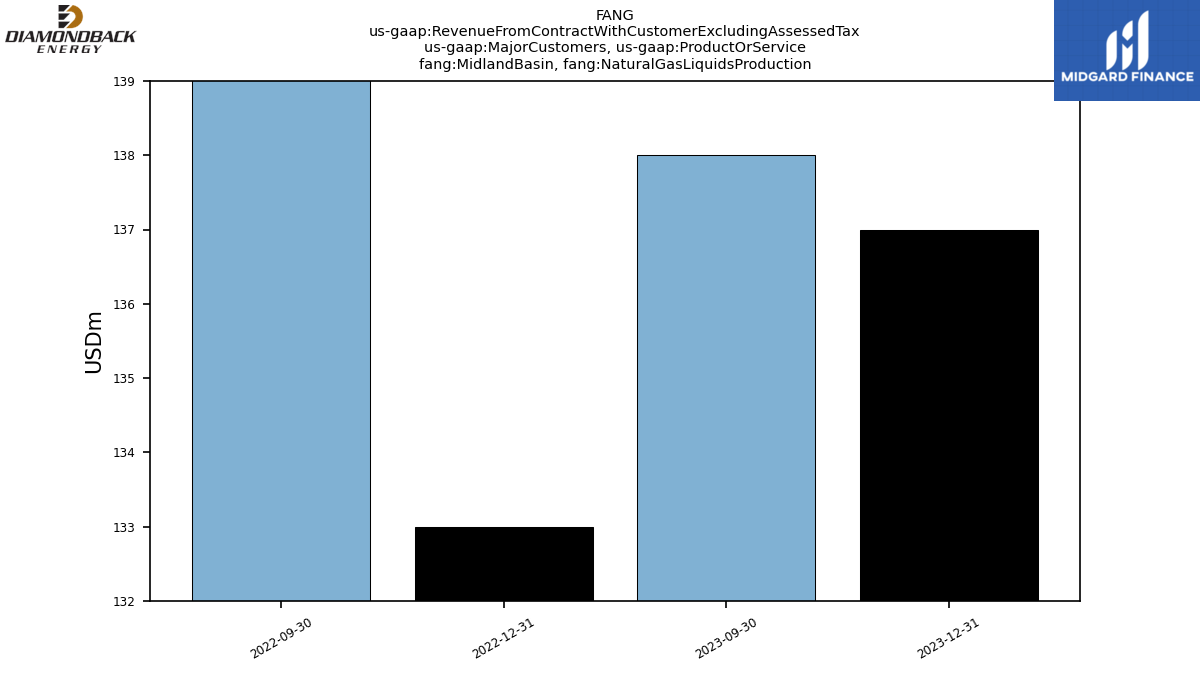
| Midland Basin, Natural Gas Liquids Production | 137.00 | 138.00 | NA | NA | 133.00 | 188.00 | NA | NA | NA | NA | NA | NA | NA | NA | NA | NA | NA | NA | NA | NA | NA | NA | NA | NA | NA | NA | NA | NA | |
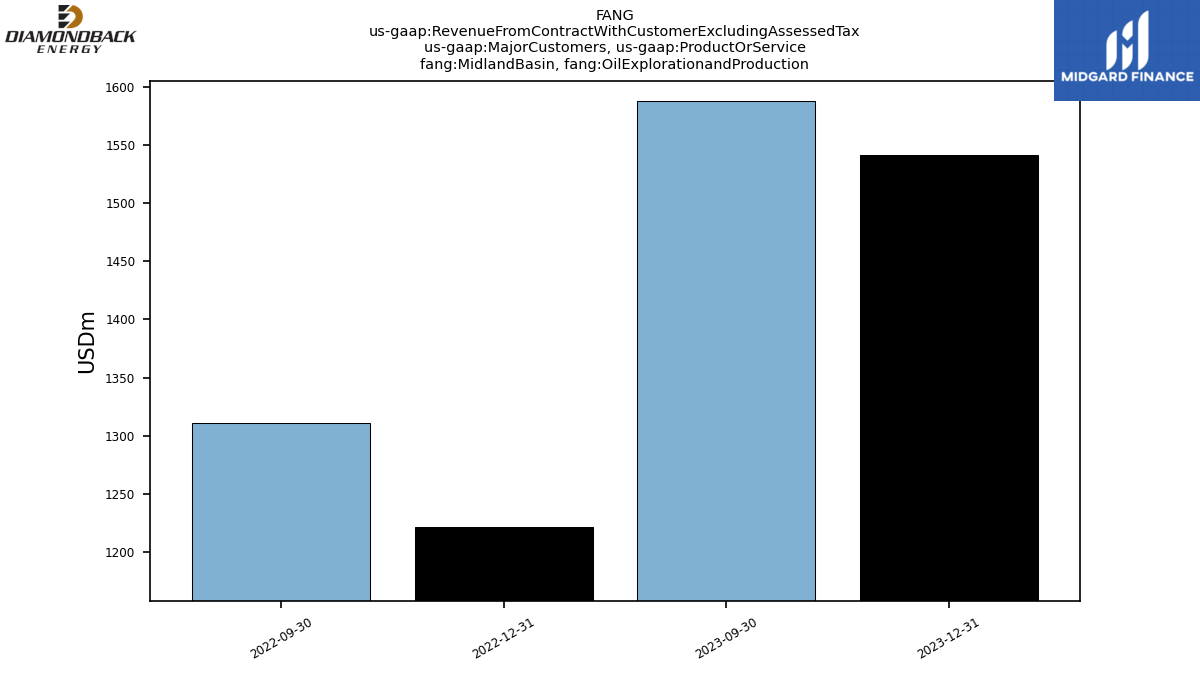
| Midland Basin, Oil Explorationand Production | 1541.00 | 1588.00 | NA | NA | 1222.00 | 1311.00 | NA | NA | NA | NA | NA | NA | NA | NA | NA | NA | NA | NA | NA | NA | NA | NA | NA | NA | NA | NA | NA | NA | |
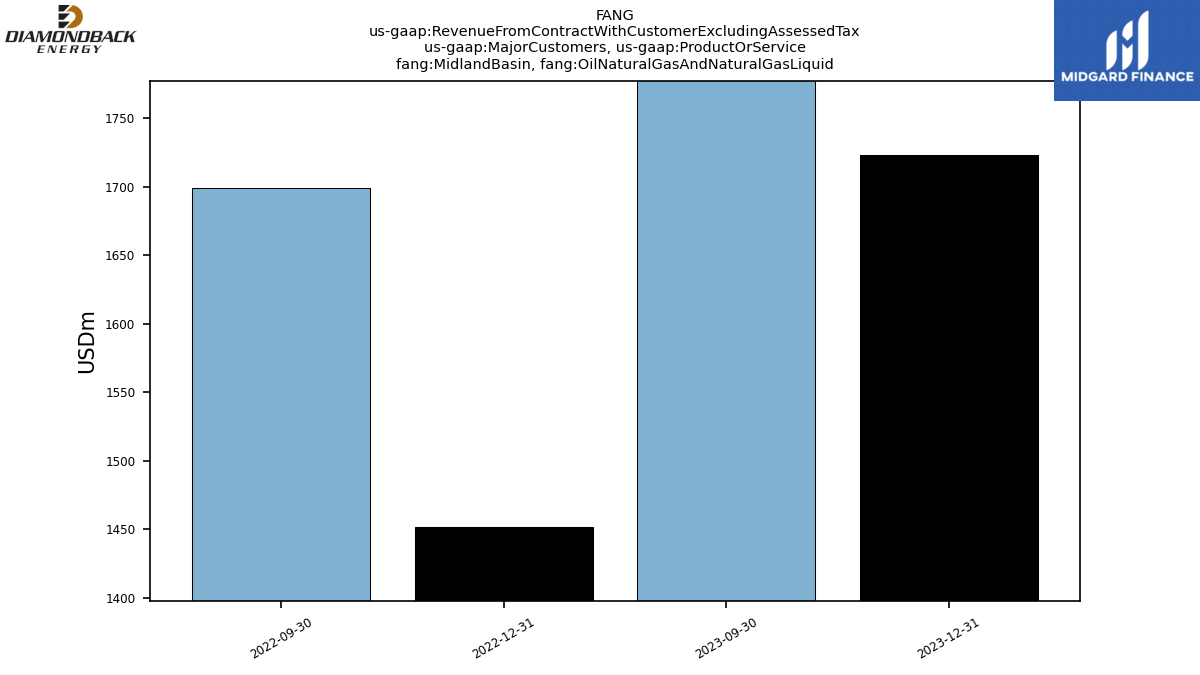
| Midland Basin, Oil Natural Gas And Natural Gas Liquid | 1723.00 | 1778.00 | NA | NA | 1452.00 | 1699.00 | NA | NA | NA | NA | NA | NA | NA | NA | NA | NA | NA | NA | NA | NA | NA | NA | NA | NA | NA | NA | NA | NA | |
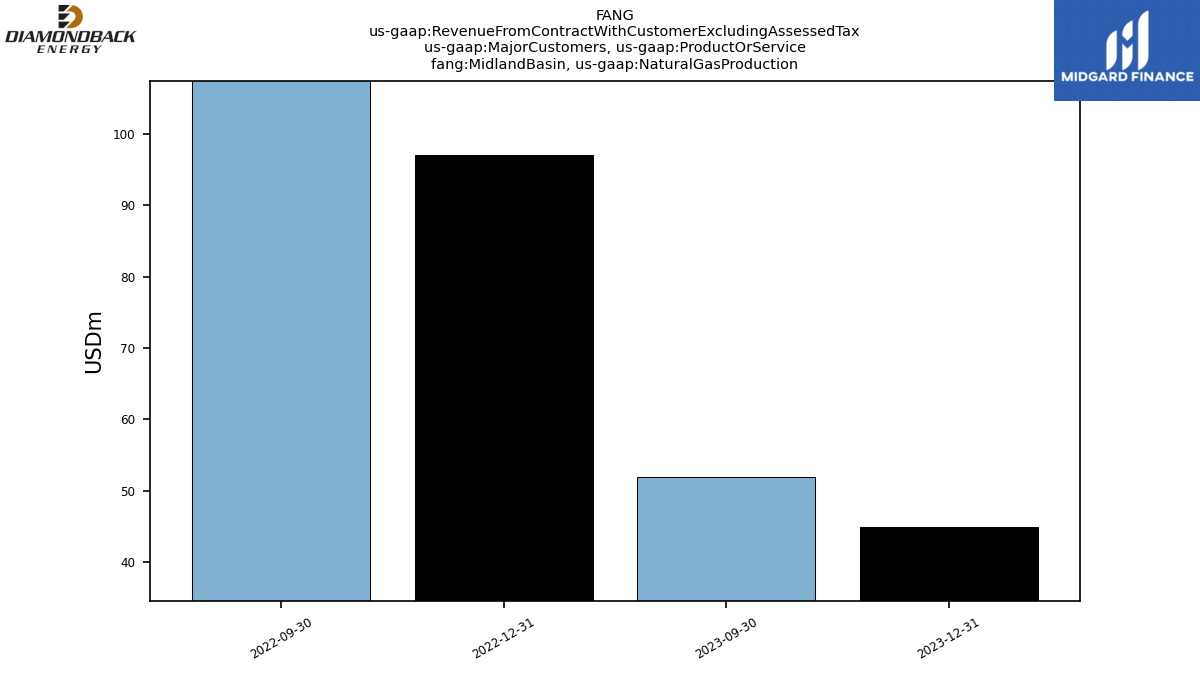
| Midland Basin, Natural Gas Production | 45.00 | 52.00 | NA | NA | 97.00 | 200.00 | NA | NA | NA | NA | NA | NA | NA | NA | NA | NA | NA | NA | NA | NA | NA | NA | NA | NA | NA | NA | NA | NA | |
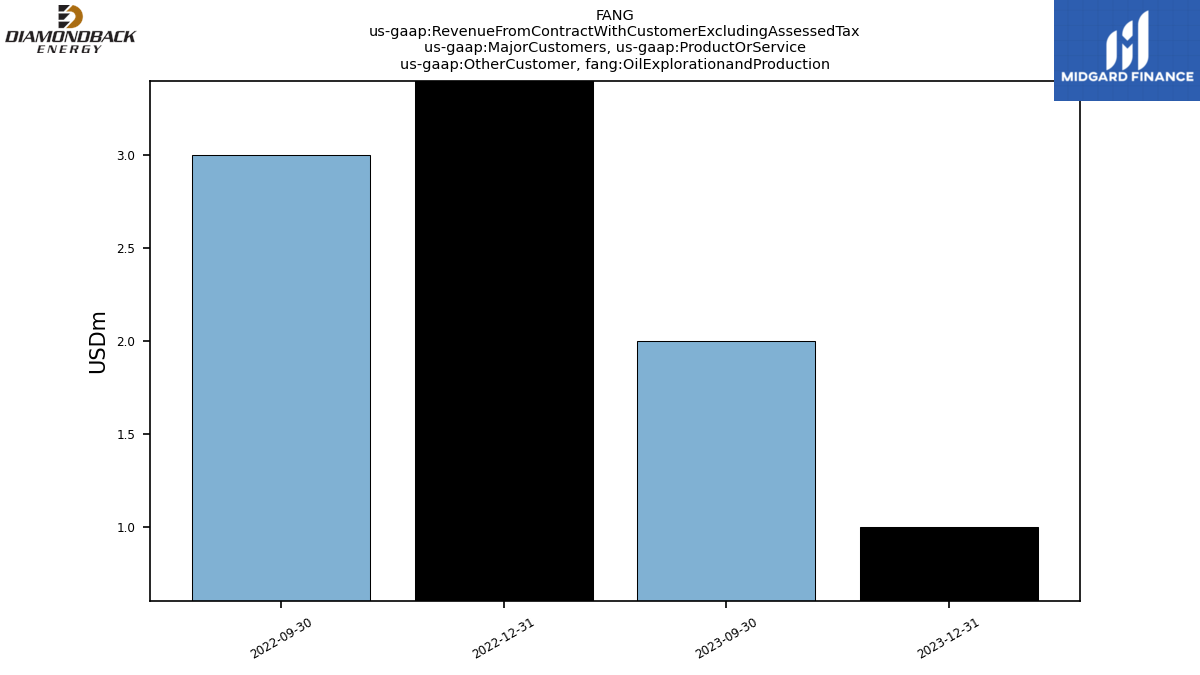
| Other Customer, Oil Explorationand Production | 1.00 | 2.00 | NA | NA | 4.00 | 3.00 | NA | NA | NA | NA | NA | NA | NA | NA | NA | NA | NA | NA | NA | NA | NA | NA | NA | NA | NA | NA | NA | NA | |
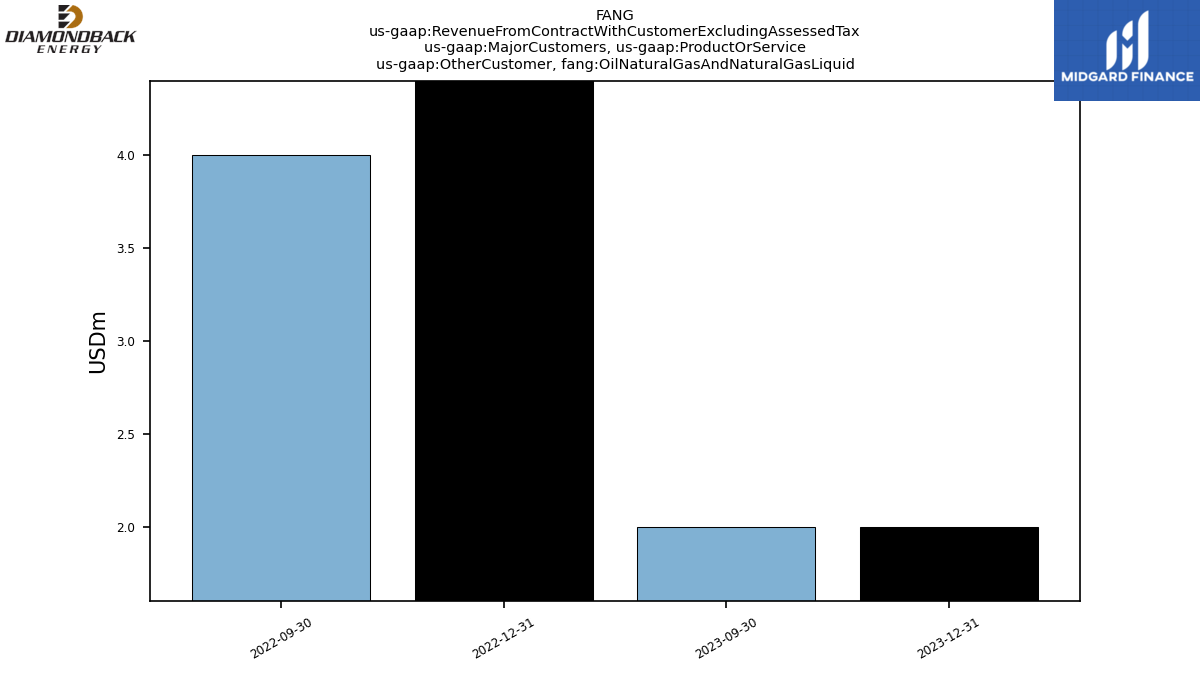
| Other Customer, Oil Natural Gas And Natural Gas Liquid | 2.00 | 2.00 | NA | NA | 5.00 | 4.00 | NA | NA | NA | NA | NA | NA | NA | NA | NA | NA | NA | NA | NA | NA | NA | NA | NA | NA | NA | NA | NA | NA | |
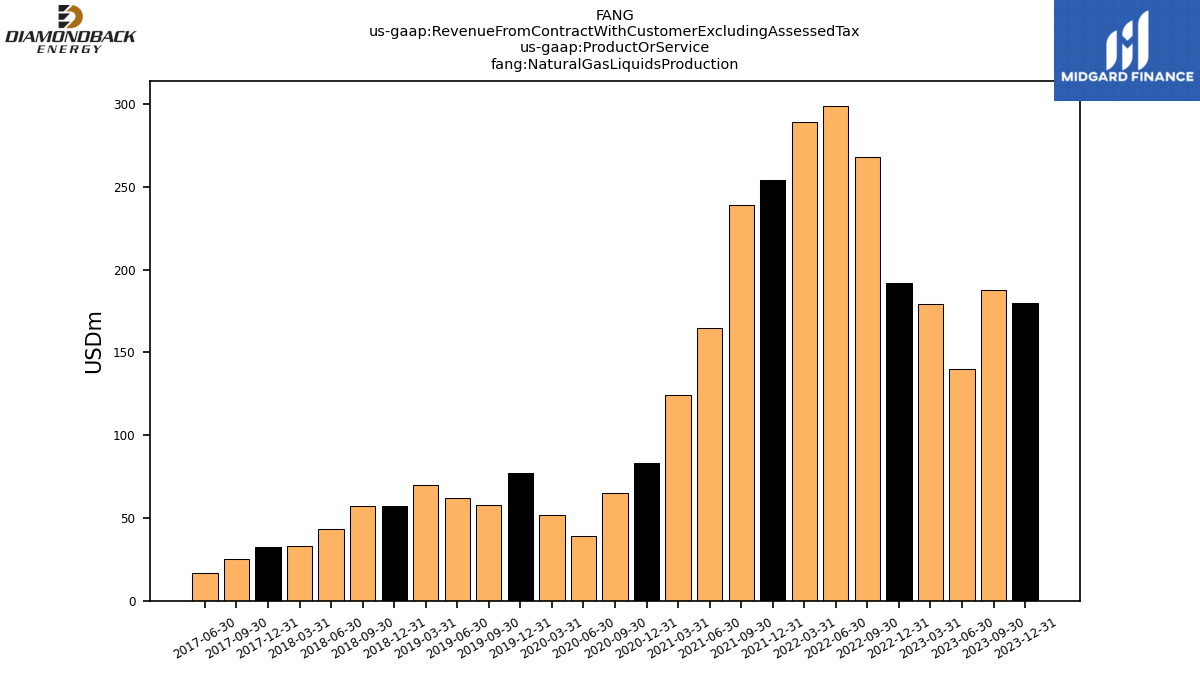
| Natural Gas Liquids Production | 180.00 | 188.00 | 140.00 | 179.00 | 192.00 | 268.00 | 299.00 | 289.00 | 254.00 | 239.00 | 165.00 | 124.00 | 83.00 | 65.00 | 39.00 | 52.00 | 77.00 | 58.00 | 62.00 | 70.00 | 57.00 | 57.00 | 43.13 | 33.00 | 32.38 | 25.27 | 16.86 | NA | |
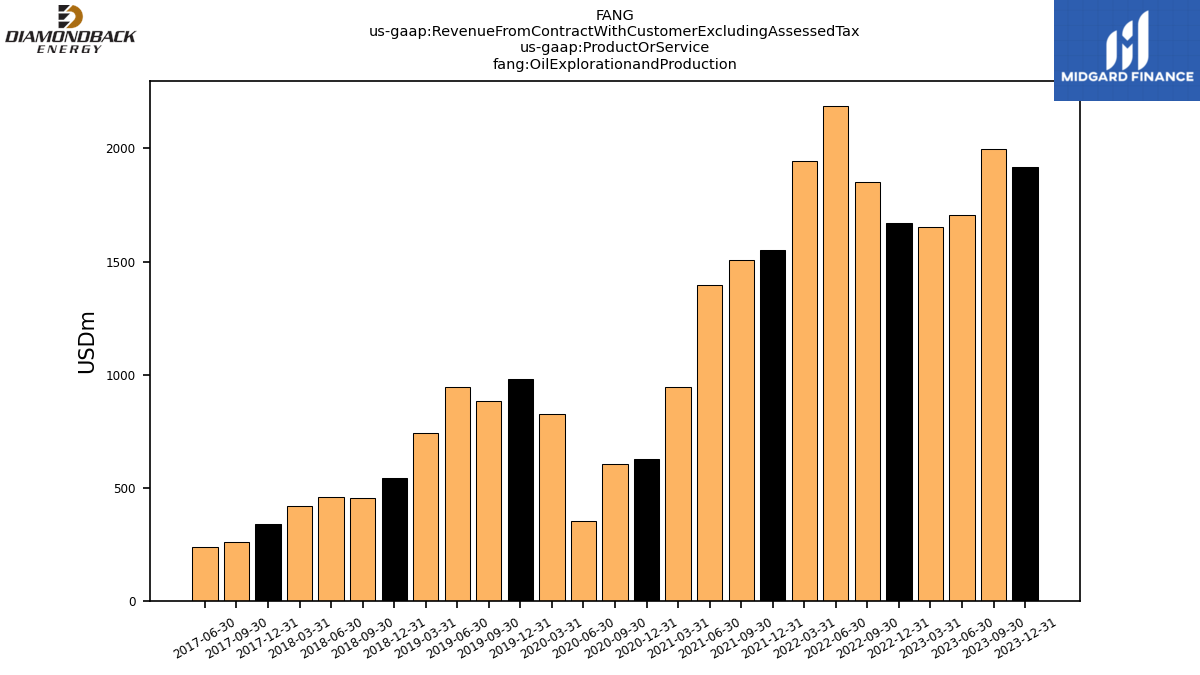
| Oil Explorationand Production | 1920.00 | 1997.00 | 1708.00 | 1654.00 | 1672.00 | 1853.00 | 2189.00 | 1946.00 | 1551.00 | 1506.00 | 1395.00 | 944.00 | 625.00 | 606.00 | 352.00 | 827.00 | 982.00 | 882.00 | 947.00 | 743.00 | 545.00 | 454.00 | 460.44 | 419.00 | 339.99 | 259.05 | 237.88 | NA | |
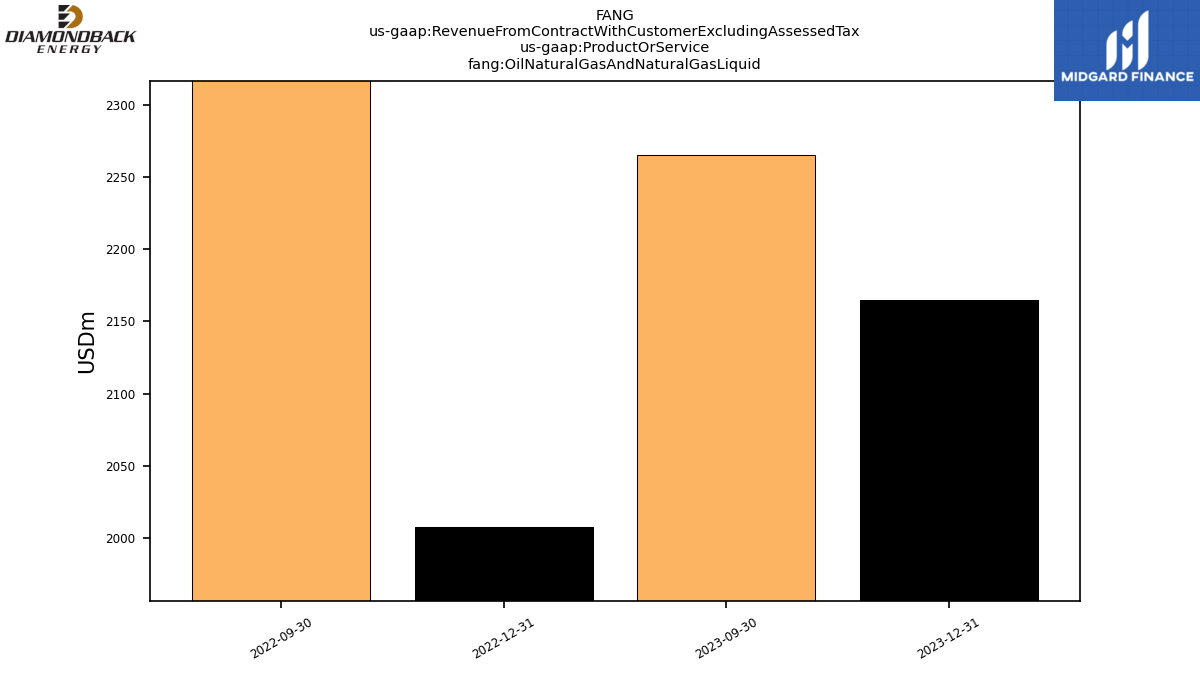
| Oil Natural Gas And Natural Gas Liquid | 2165.00 | 2265.00 | NA | NA | 2008.00 | 2417.00 | NA | NA | NA | NA | NA | NA | NA | NA | NA | NA | NA | NA | NA | NA | NA | NA | NA | NA | NA | NA | NA | NA | |
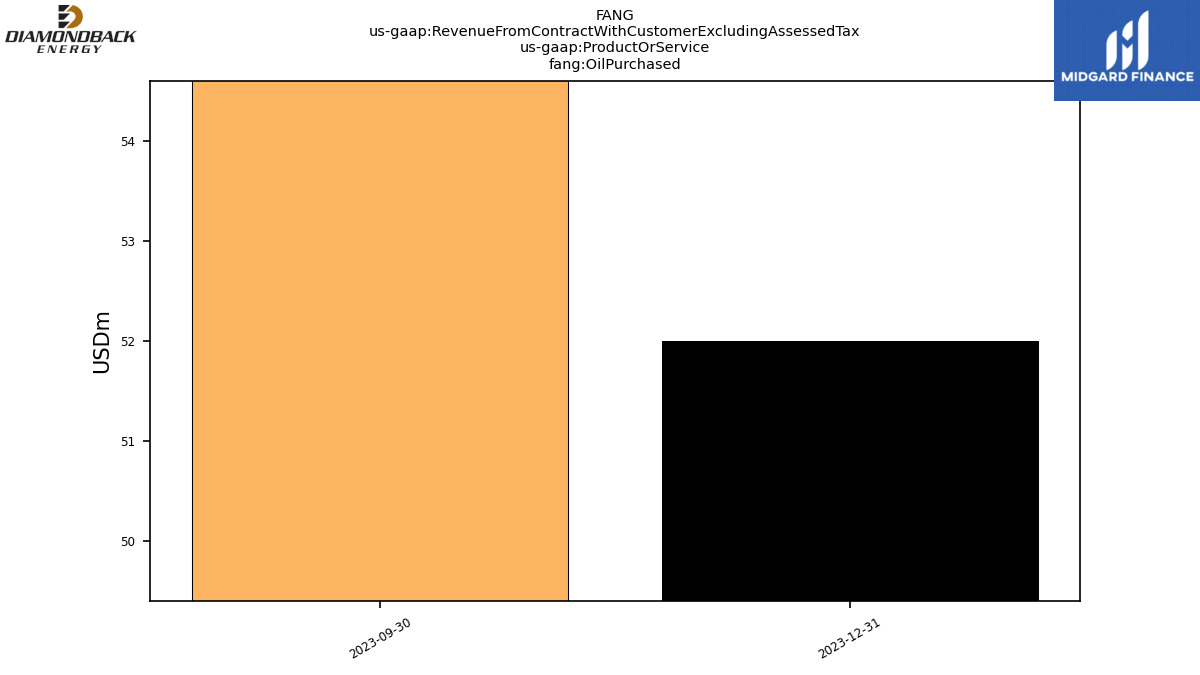
| Oil Purchased | 52.00 | 59.00 | NA | NA | NA | NA | NA | NA | NA | NA | NA | NA | NA | NA | NA | NA | NA | NA | NA | NA | NA | NA | NA | NA | NA | NA | NA | NA | |
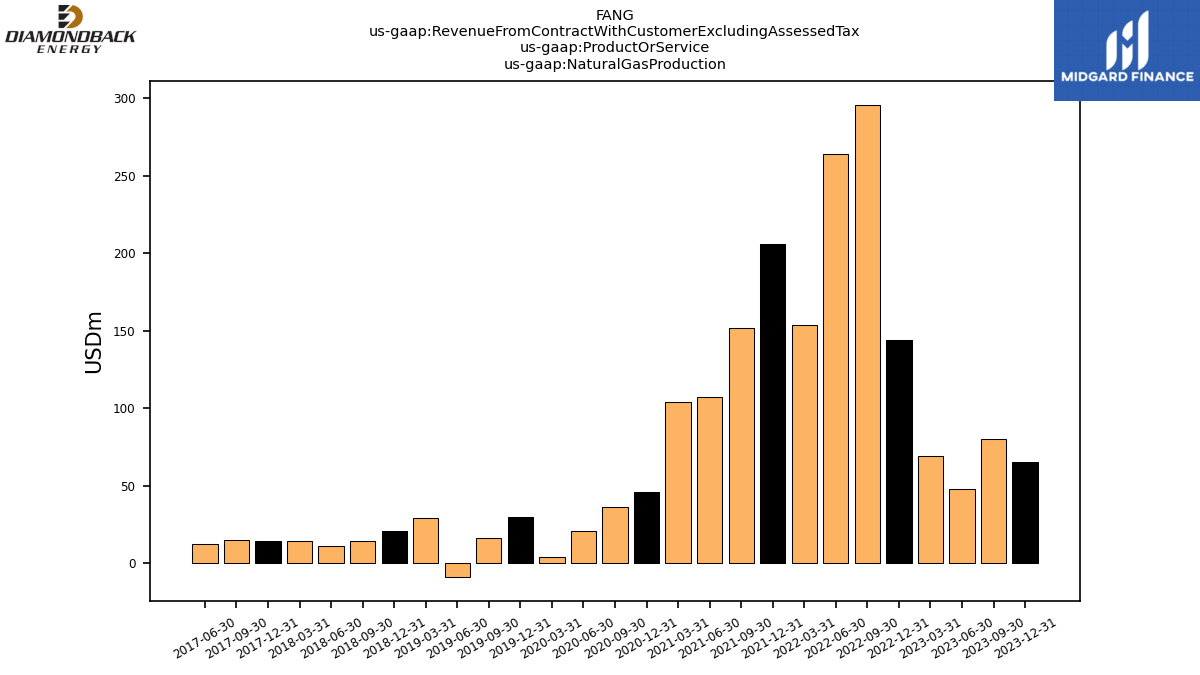
| Natural Gas Production | 65.00 | 80.00 | 48.00 | 69.00 | 144.00 | 296.00 | 264.00 | 154.00 | 206.00 | 152.00 | 107.00 | 104.00 | 46.00 | 36.00 | 21.00 | 4.00 | 30.00 | 16.00 | -9.00 | 29.00 | 21.00 | 14.00 | 11.37 | 14.00 | 14.46 | 14.92 | 12.69 | NA | |
| Revenue From Contract With Customer Including Assessed Tax | 2228.00 | 2340.00 | 1919.00 | 1925.00 | 2030.00 | 2437.00 | 2768.00 | 2408.00 | 2022.00 | 1910.00 | 1681.00 | 1184.00 | 769.00 | 720.00 | 425.00 | 899.00 | 1104.00 | 975.00 | 1021.00 | 864.00 | 631.76 | 538.03 | 526.27 | 480.19 | 399.19 | 301.25 | 269.43 | 235.23 |
