
| 2023-12-31 | 2023-09-30 | 2023-06-30 | 2023-03-31 | 2022-12-31 | 2022-09-30 | 2022-06-30 | 2022-03-31 | 2021-12-31 | 2021-09-30 | 2021-06-30 | 2021-03-31 | 2020-12-31 | 2020-09-30 | 2020-06-30 | 2020-03-31 | 2019-12-31 | 2019-09-30 | 2019-06-30 | 2019-03-31 | 2018-12-31 | 2018-09-30 | 2018-06-30 | 2018-03-31 | 2017-12-31 | 2017-09-30 | 2017-06-30 | 2017-03-31 | ||
|---|---|---|---|---|---|---|---|---|---|---|---|---|---|---|---|---|---|---|---|---|---|---|---|---|---|---|---|---|---|
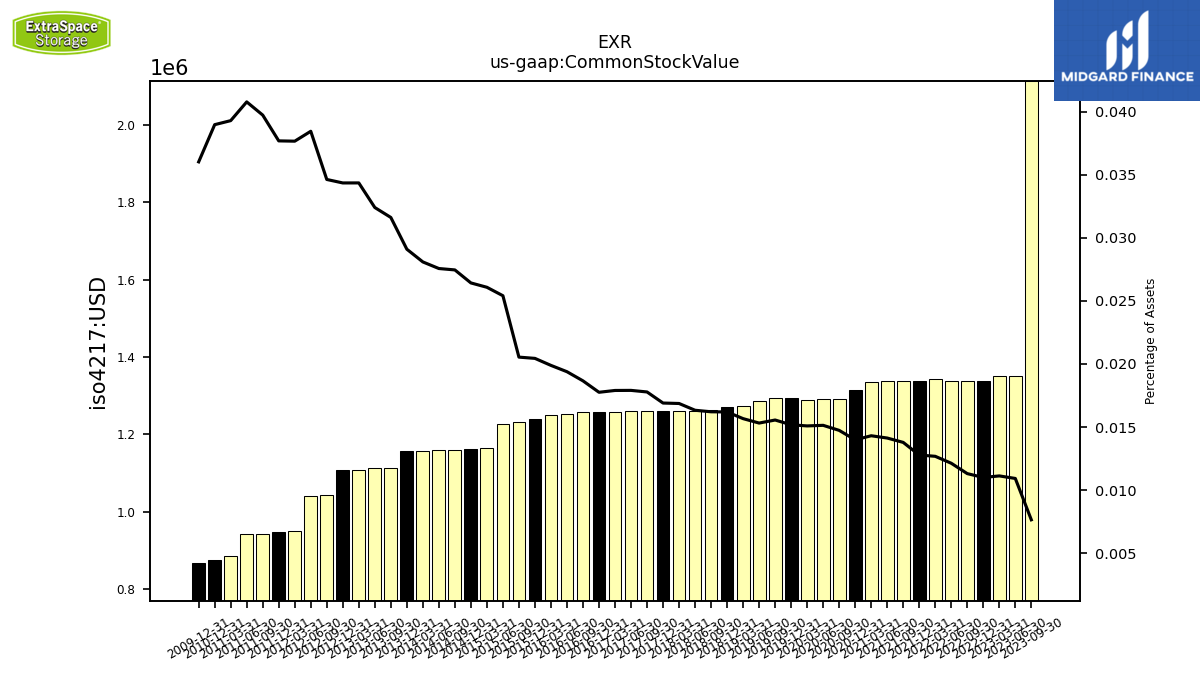
| Common Stock Value | 2.11 | 2.11 | 1.35 | 1.35 | 1.34 | 1.34 | 1.34 | 1.34 | 1.34 | 1.34 | 1.34 | 1.34 | 1.31 | 1.29 | 1.29 | 1.29 | 1.29 | 1.29 | 1.28 | 1.27 | 1.27 | 1.26 | 1.26 | 1.26 | 1.26 | 1.26 | 1.26 | 1.26 | |
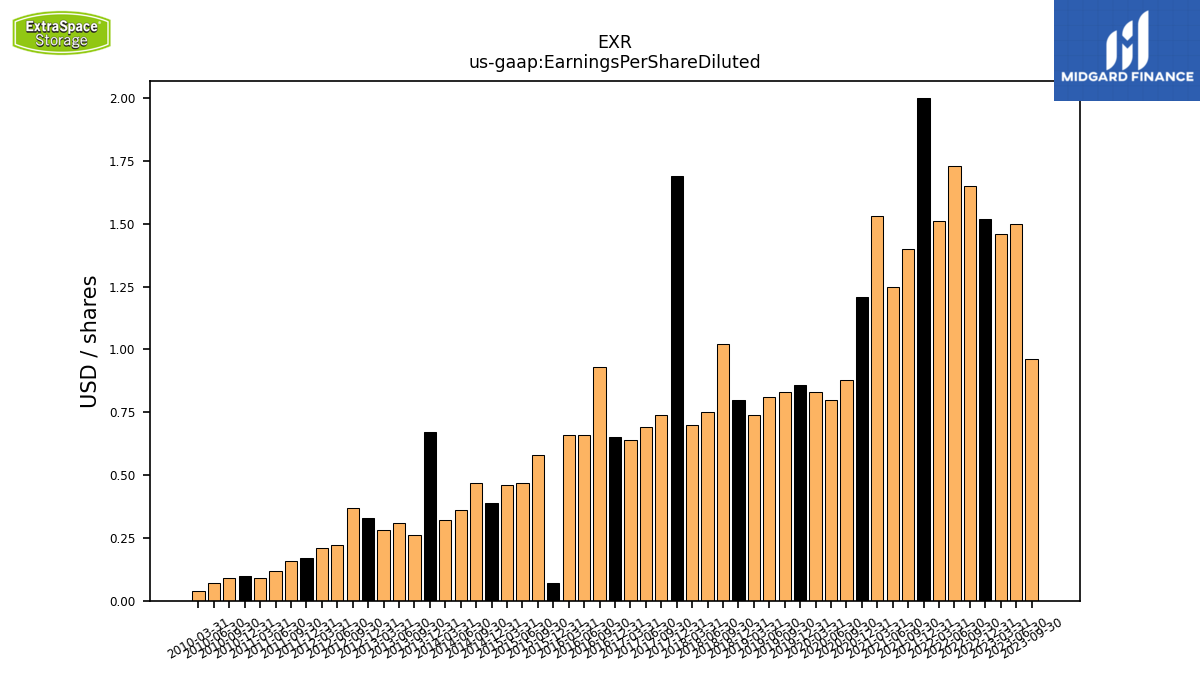
| Earnings Per Share Basic | 0.96 | 0.96 | 1.50 | 1.46 | 1.52 | 1.65 | 1.73 | 1.52 | 2.01 | 1.41 | 1.25 | 1.54 | 1.19 | 0.89 | 0.80 | 0.84 | 0.87 | 0.84 | 0.82 | 0.74 | 0.80 | 1.03 | 0.75 | 0.70 | 1.71 | 0.74 | 0.69 | 0.65 | |
| Earnings Per Share Diluted | 0.96 | 0.96 | 1.50 | 1.46 | 1.52 | 1.65 | 1.73 | 1.51 | 2.00 | 1.40 | 1.25 | 1.53 | 1.21 | 0.88 | 0.80 | 0.83 | 0.86 | 0.83 | 0.81 | 0.74 | 0.80 | 1.02 | 0.75 | 0.70 | 1.69 | 0.74 | 0.69 | 0.64 |
| 2023-12-31 | 2023-09-30 | 2023-06-30 | 2023-03-31 | 2022-12-31 | 2022-09-30 | 2022-06-30 | 2022-03-31 | 2021-12-31 | 2021-09-30 | 2021-06-30 | 2021-03-31 | 2020-12-31 | 2020-09-30 | 2020-06-30 | 2020-03-31 | 2019-12-31 | 2019-09-30 | 2019-06-30 | 2019-03-31 | 2018-12-31 | 2018-09-30 | 2018-06-30 | 2018-03-31 | 2017-12-31 | 2017-09-30 | 2017-06-30 | 2017-03-31 | ||
|---|---|---|---|---|---|---|---|---|---|---|---|---|---|---|---|---|---|---|---|---|---|---|---|---|---|---|---|---|---|
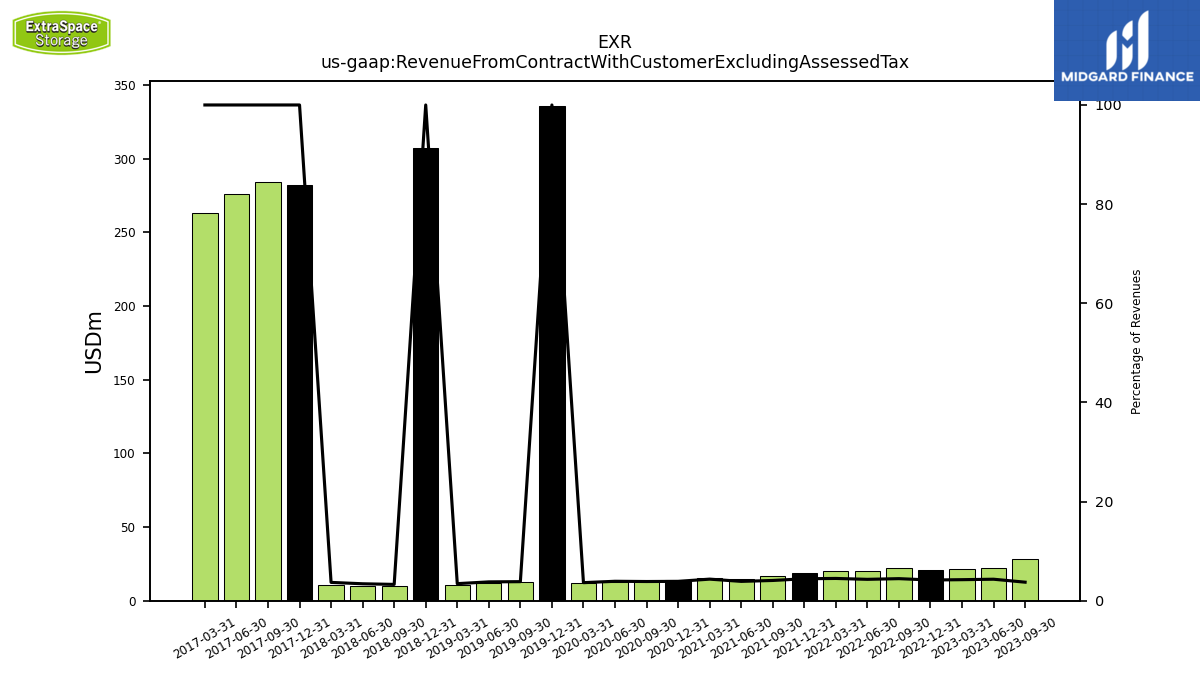
| Revenue From Contract With Customer Excluding Assessed Tax | 30.38 | 28.02 | 22.21 | 21.38 | 21.18 | 22.25 | 20.52 | 19.96 | 18.94 | 16.88 | 14.80 | 15.64 | 13.83 | 13.31 | 12.86 | 12.14 | 335.80 | 13.00 | 12.32 | 10.75 | 307.35 | 10.12 | 10.16 | 10.56 | 281.84 | 284.16 | 276.00 | 263.01 | |
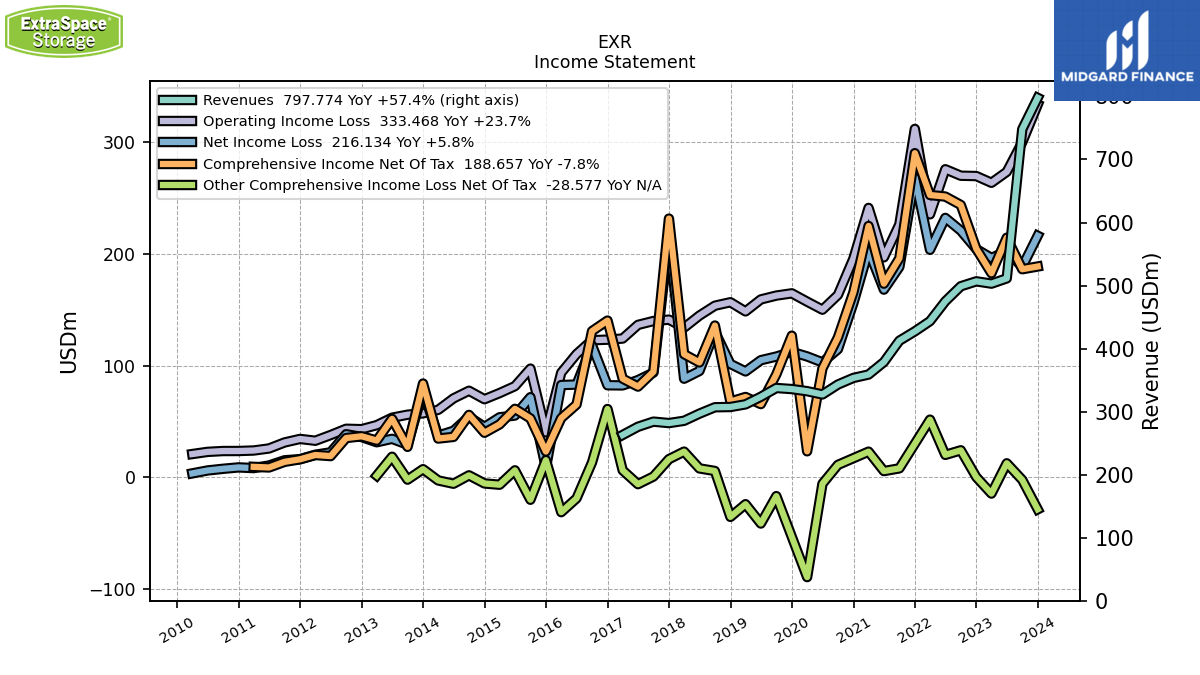
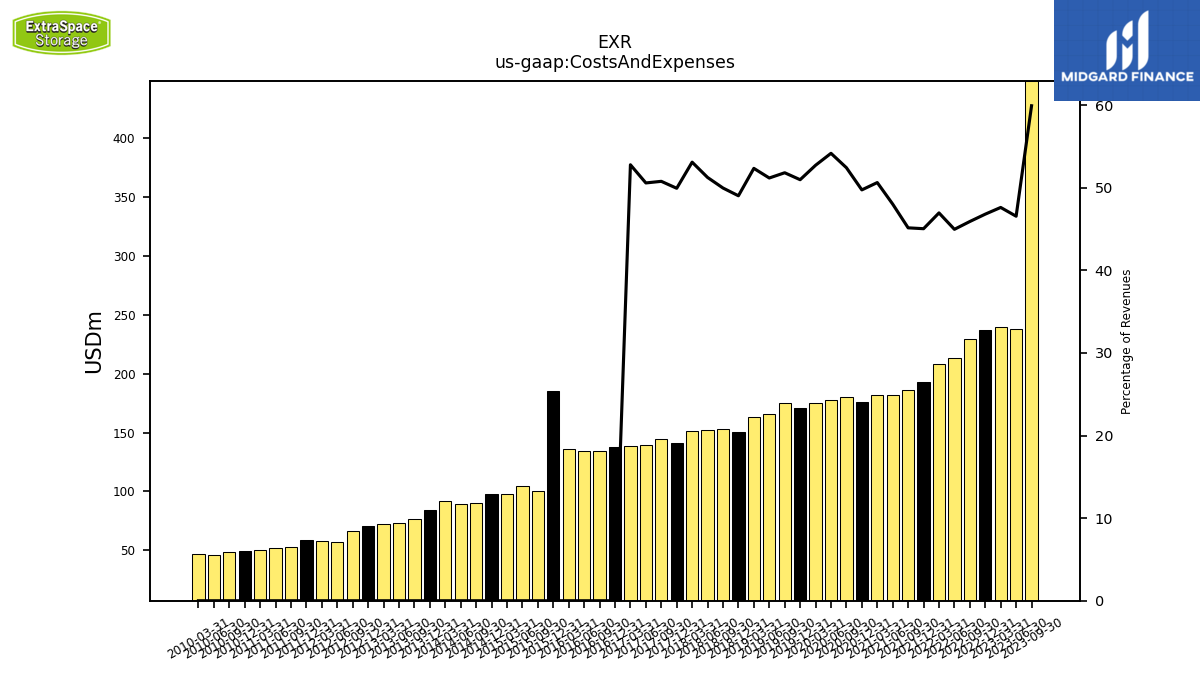
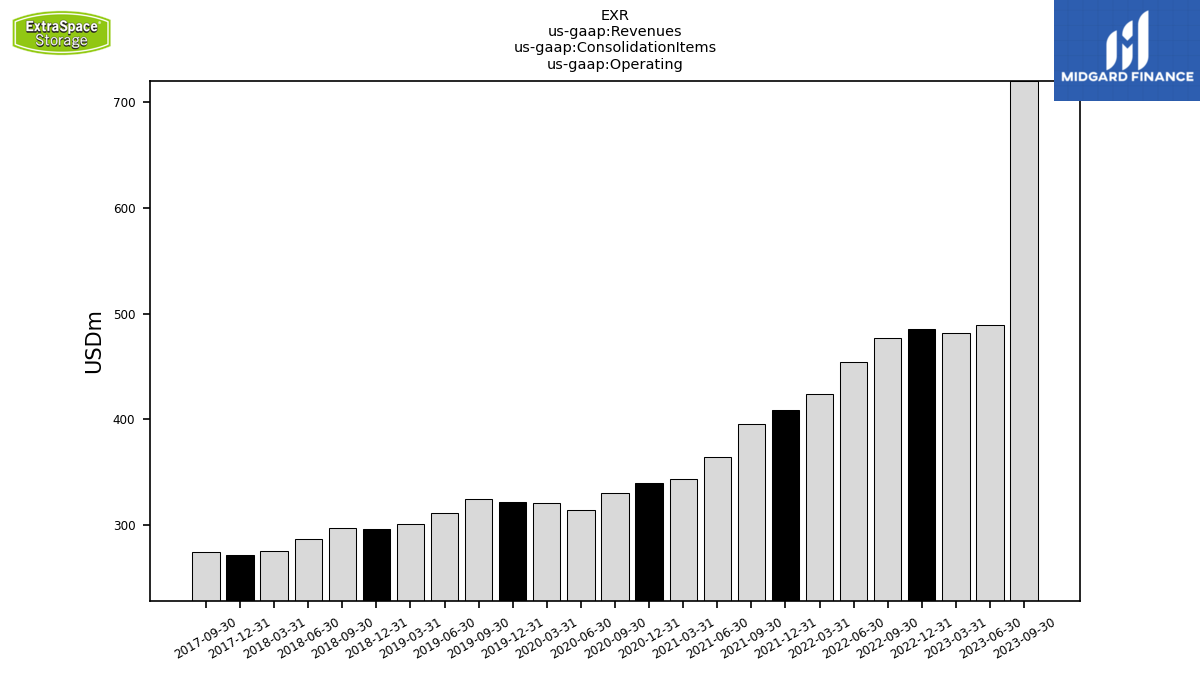
| Revenues | 797.77 | 748.03 | 511.39 | 503.05 | 506.72 | 498.90 | 474.99 | 443.56 | 427.38 | 412.49 | 378.63 | 358.86 | 353.49 | 343.02 | 327.25 | 332.45 | 335.80 | 337.50 | 323.60 | 311.55 | 307.35 | 306.95 | 296.81 | 285.49 | 281.84 | 284.16 | 276.00 | 263.01 | |
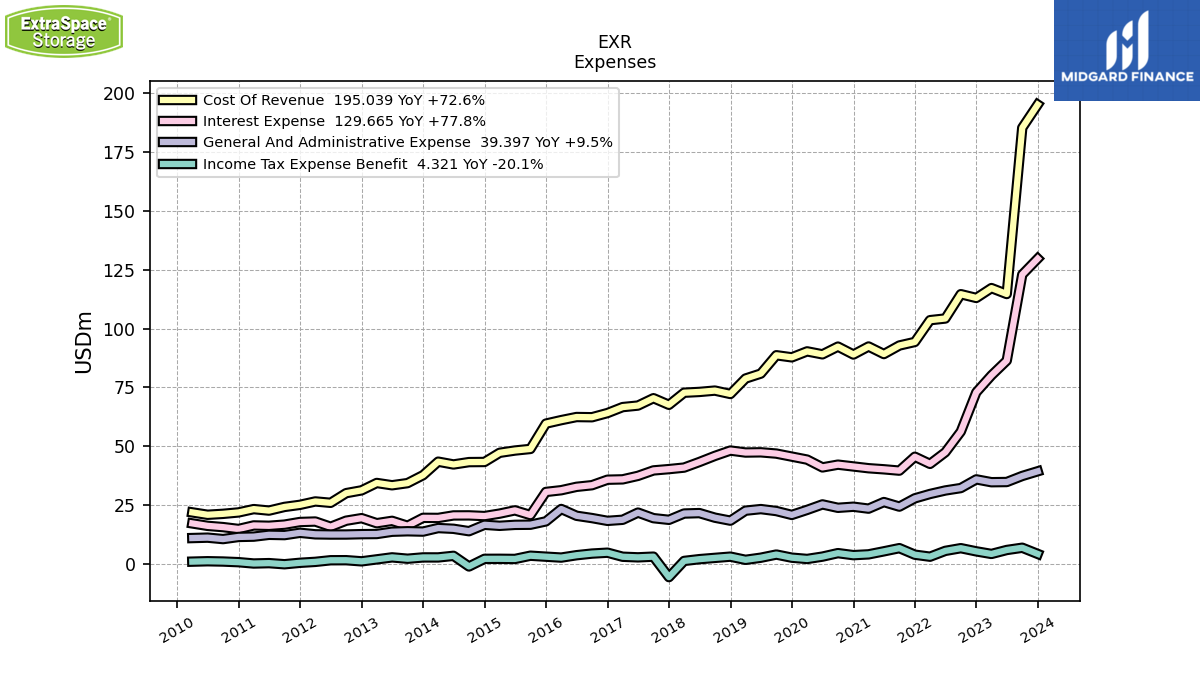
| Cost Of Revenue | 195.04 | 185.19 | 114.64 | 117.17 | 112.97 | 114.58 | 104.25 | 103.54 | 94.29 | 92.79 | 89.16 | 92.37 | 88.96 | 92.32 | 89.04 | 90.30 | 87.76 | 88.65 | 80.87 | 78.77 | 72.21 | 73.65 | 73.08 | 72.75 | 67.60 | 70.43 | 67.30 | 66.64 | |
| Costs And Expenses | 464.31 | 448.24 | 238.05 | 239.51 | 237.15 | 229.04 | 213.57 | 208.25 | 192.49 | 186.21 | 181.80 | 181.67 | 175.82 | 179.82 | 177.25 | 175.26 | 171.16 | 174.87 | 165.61 | 163.07 | 150.68 | 153.36 | 152.10 | 151.57 | 140.73 | 144.28 | 139.60 | 138.81 | |
| General And Administrative Expense | 39.40 | 37.41 | 34.84 | 34.76 | 35.96 | 32.27 | 31.25 | 29.76 | 27.92 | 24.39 | 26.34 | 23.54 | 24.35 | 23.89 | 25.34 | 23.01 | 20.87 | 22.52 | 23.35 | 22.68 | 18.43 | 19.71 | 21.65 | 21.46 | 18.79 | 19.50 | 21.86 | 18.81 | |
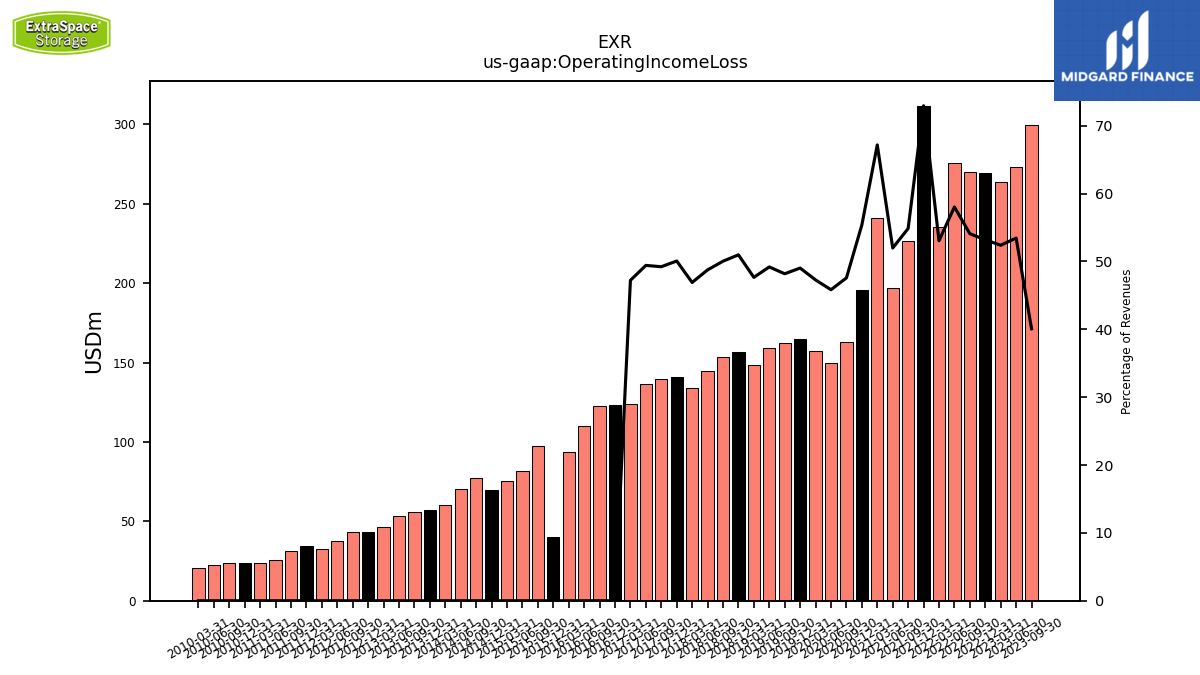
| Operating Income Loss | 333.47 | 299.79 | 273.34 | 263.54 | 269.57 | 269.86 | 275.67 | 235.31 | 311.77 | 226.28 | 196.83 | 241.07 | 195.75 | 163.21 | 149.99 | 157.19 | 164.65 | 162.64 | 159.20 | 148.48 | 156.68 | 153.59 | 144.72 | 133.91 | 141.11 | 139.88 | 136.41 | 124.20 | |
| Interest Expense | 129.66 | 122.90 | 86.37 | 80.10 | 72.92 | 56.24 | 47.47 | 42.54 | 45.58 | 39.67 | 40.24 | 40.70 | NA | 42.21 | 41.04 | 44.36 | NA | 46.91 | 47.45 | 47.36 | 48.20 | 45.93 | 43.35 | 40.97 | 40.32 | 39.77 | 37.46 | 35.97 | |
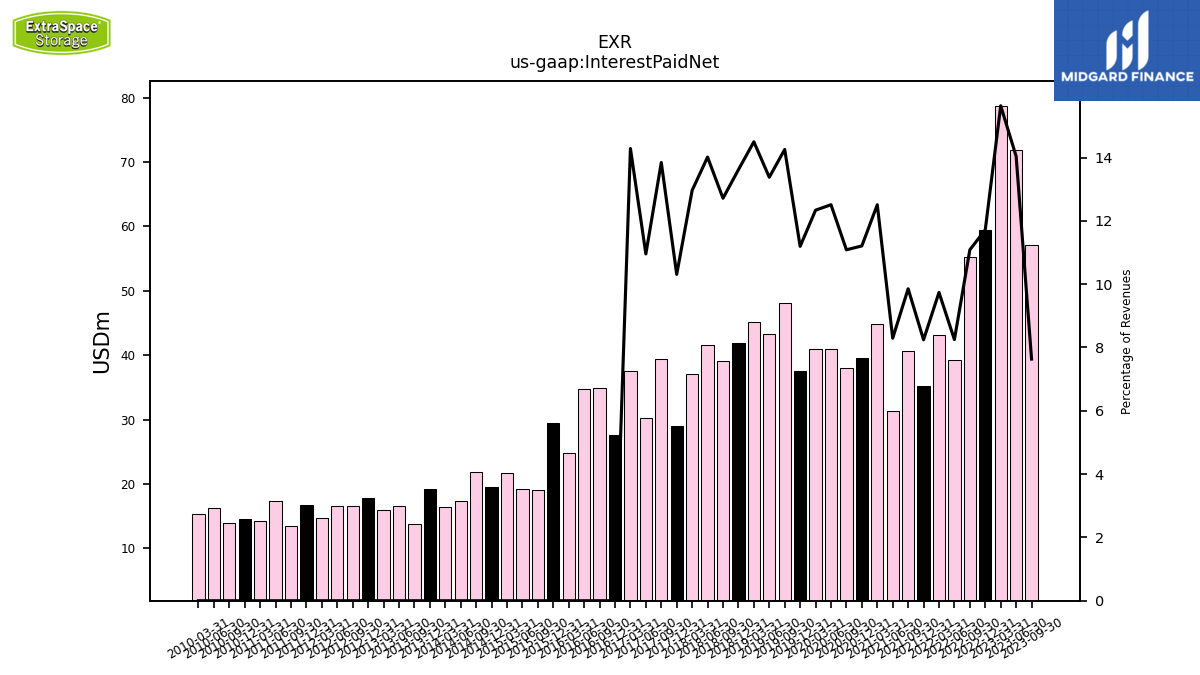
| Interest Paid Net | 130.98 | 57.11 | 71.80 | 78.66 | 59.39 | 55.30 | 39.18 | 43.20 | 35.23 | 40.65 | 31.40 | 44.89 | 39.62 | 38.03 | 40.94 | 41.01 | 37.59 | 48.11 | 43.29 | 45.16 | 41.85 | 39.02 | 41.59 | 37.01 | 29.06 | 39.34 | 30.24 | 37.57 | |
| Income Loss From Continuing Operations Before Income Taxes Minority Interest And Income Loss From Equity Method Investments | 215.50 | 190.76 | 208.04 | 202.88 | 213.90 | 231.74 | 243.26 | 211.76 | 279.03 | 198.34 | 169.43 | 212.68 | 163.44 | 122.91 | 109.39 | 113.30 | 120.19 | 117.34 | 112.28 | 101.34 | 108.61 | 138.70 | 101.38 | 93.17 | 219.86 | 100.25 | 93.13 | 89.28 | |
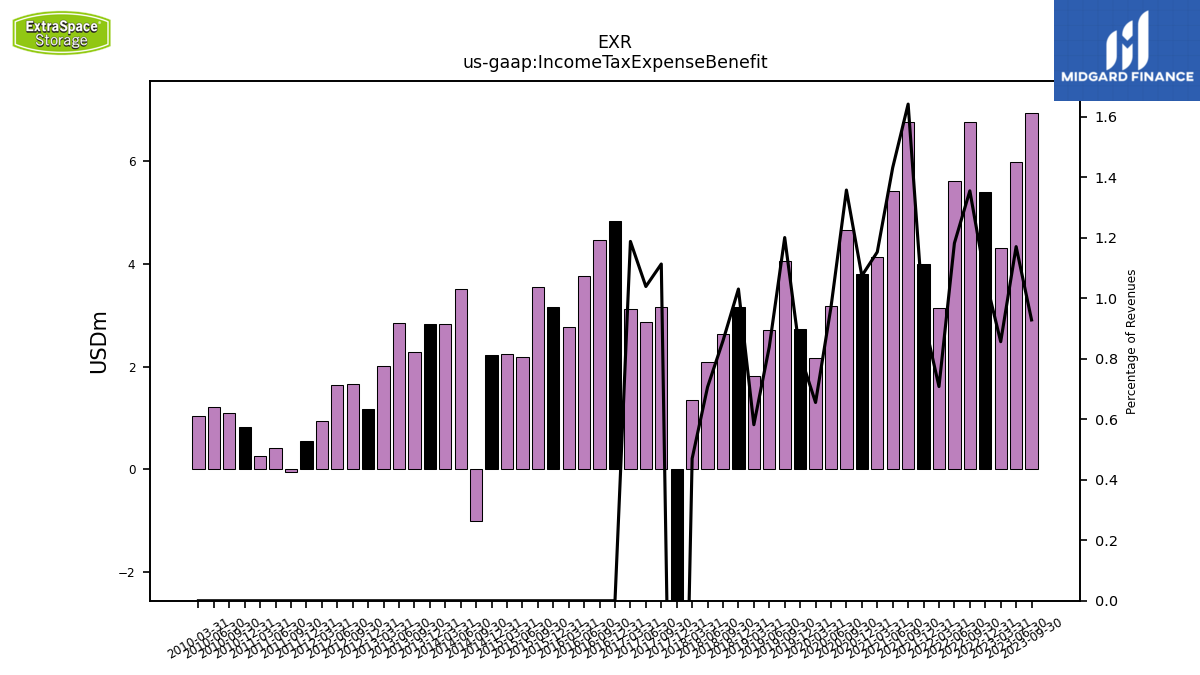
| Income Tax Expense Benefit | 4.32 | 6.94 | 5.99 | 4.31 | 5.41 | 6.76 | 5.62 | 3.14 | 3.99 | 6.77 | 5.42 | 4.14 | 3.80 | 4.66 | 3.18 | 2.18 | 2.73 | 4.05 | 2.71 | 1.81 | 3.17 | 2.64 | 2.10 | 1.34 | -5.53 | 3.16 | 2.87 | 3.12 | |
| Income Taxes Paid Net | 2.53 | 18.31 | 0.00 | 1.91 | 4.47 | 5.37 | 8.41 | 0.70 | 4.89 | 4.62 | 15.70 | 1.05 | 0.00 | 3.39 | 0.82 | 0.98 | 4.16 | 2.10 | 4.27 | -0.18 | -0.07 | -1.03 | 1.34 | 0.49 | NA | NA | NA | NA | |
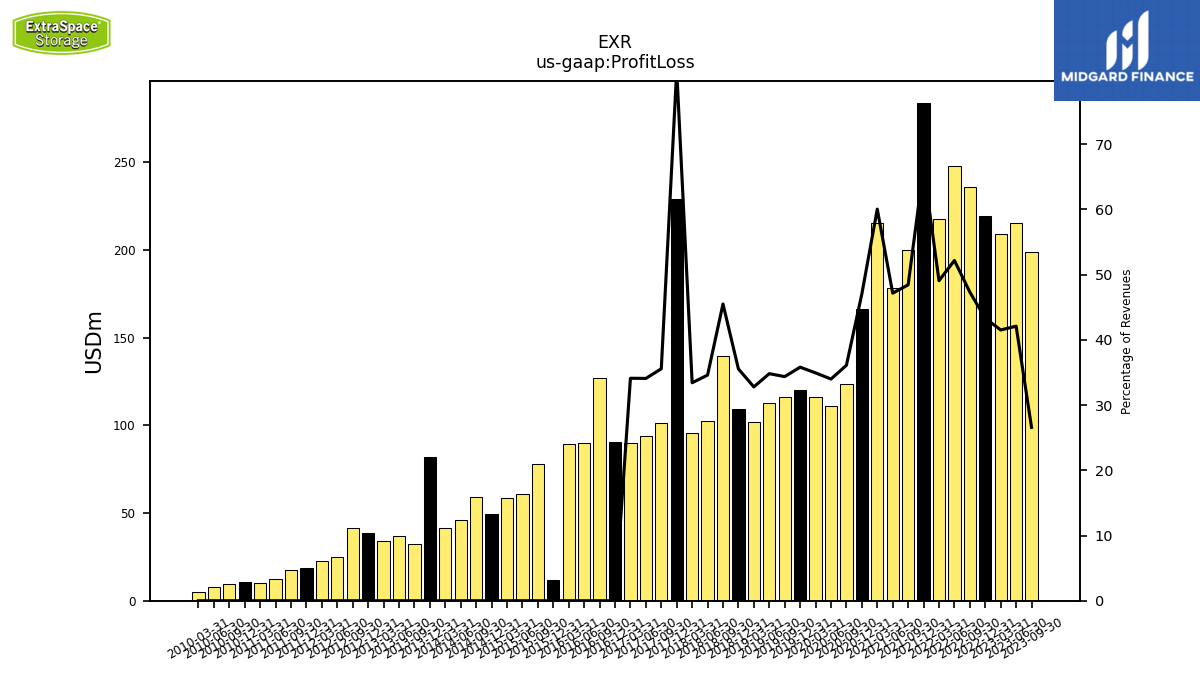
| Profit Loss | 227.41 | 198.86 | 215.31 | 208.88 | 219.48 | 236.13 | 247.83 | 217.72 | 283.86 | 199.82 | 178.58 | 215.50 | 166.31 | 123.85 | 111.26 | 116.16 | 120.28 | 116.00 | 112.69 | 102.16 | 109.25 | 139.69 | 102.71 | 95.43 | 229.31 | 101.08 | 94.10 | 89.73 | |
| Other Comprehensive Income Loss Cash Flow Hedge Gain Loss After Reclassification And Tax | -28.58 | -2.26 | 12.60 | -14.51 | 0.27 | 24.22 | 20.11 | 51.65 | 22.64 | 8.05 | 5.62 | 23.01 | 10.11 | 11.18 | -5.73 | -89.24 | 15.21 | -16.76 | -41.30 | -23.99 | -35.38 | 5.72 | 8.03 | 23.06 | NA | NA | NA | NA | |
| Other Comprehensive Income Loss Net Of Tax | -28.58 | -2.26 | 12.60 | -14.51 | 0.27 | 24.22 | 20.11 | 51.65 | NA | 8.05 | 5.62 | 23.01 | NA | 11.18 | -5.73 | -89.24 | NA | -16.76 | -41.30 | -23.99 | -35.38 | 5.72 | 8.03 | 23.06 | 16.32 | 0.76 | -6.10 | 6.33 | |
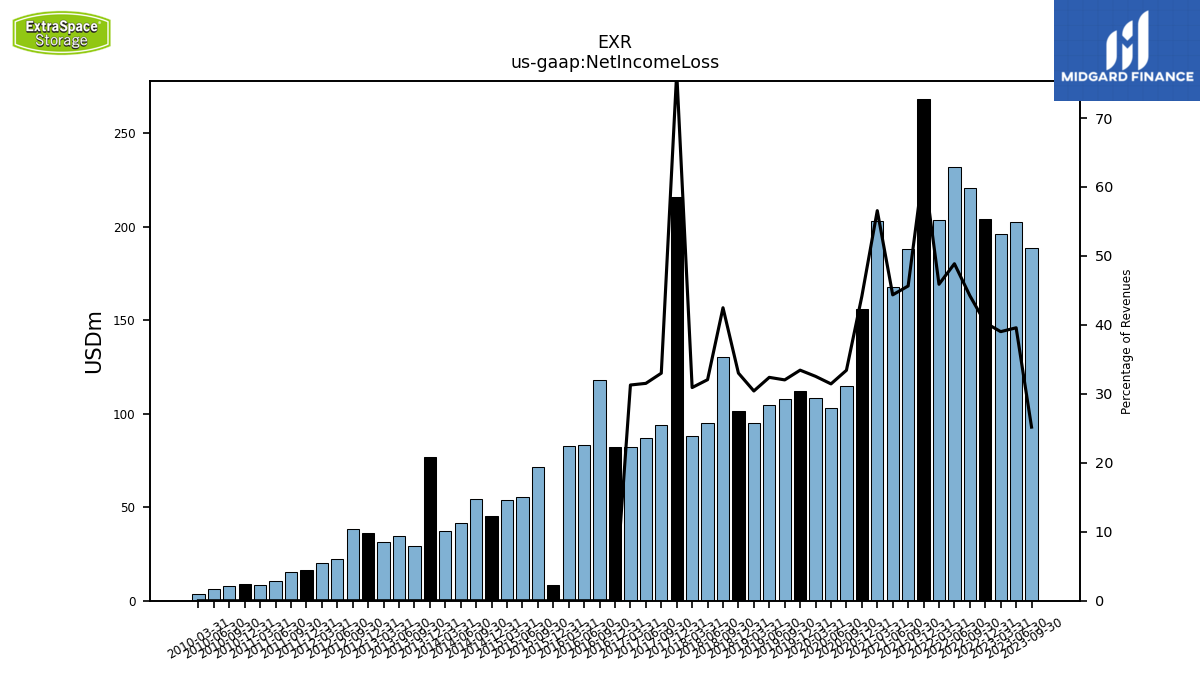
| Net Income Loss | 216.13 | 188.35 | 202.41 | 196.30 | 204.26 | 220.72 | 232.13 | 203.58 | 268.43 | 188.28 | 167.95 | 203.00 | 156.06 | 114.63 | 102.91 | 108.18 | 112.28 | 108.09 | 104.83 | 94.77 | 101.46 | 130.42 | 95.15 | 88.26 | 215.98 | 93.76 | 87.01 | 82.28 | |
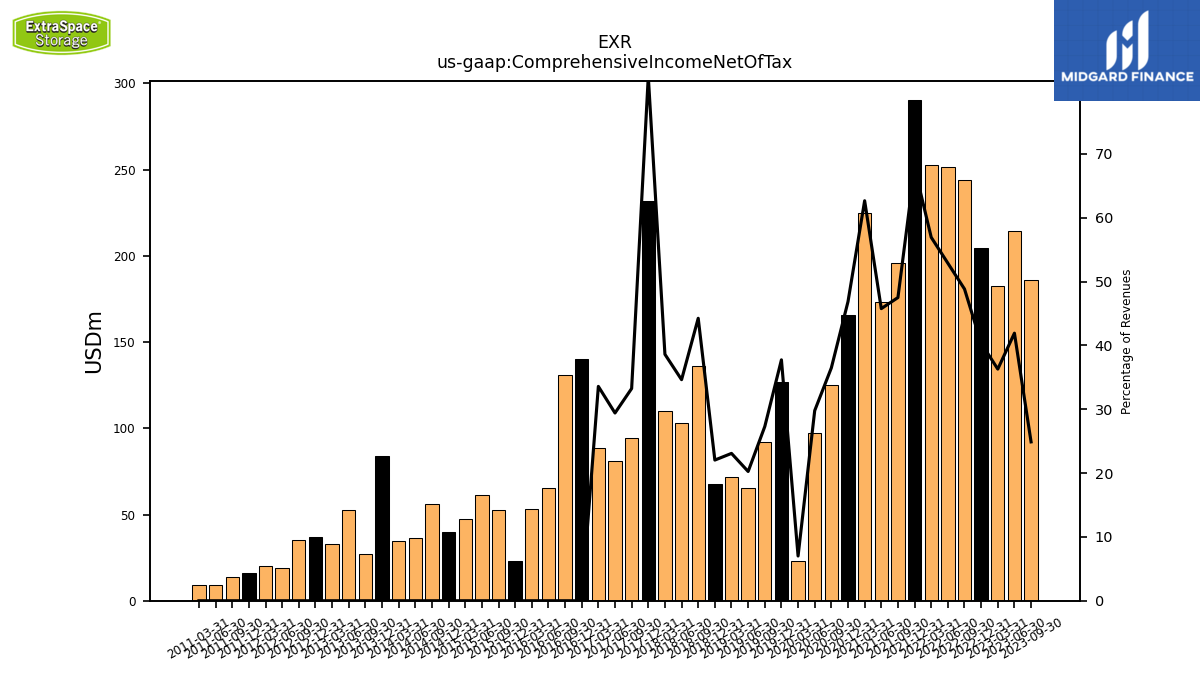
| Comprehensive Income Net Of Tax | 188.66 | 186.20 | 214.39 | 182.59 | 204.54 | 243.69 | 251.23 | 252.58 | 290.04 | 195.95 | 173.30 | 224.91 | 165.67 | 125.18 | 97.50 | 23.30 | 126.75 | 92.12 | 65.55 | 71.93 | 67.75 | 135.85 | 102.81 | 110.24 | 231.52 | 94.49 | 81.19 | 88.33 | |
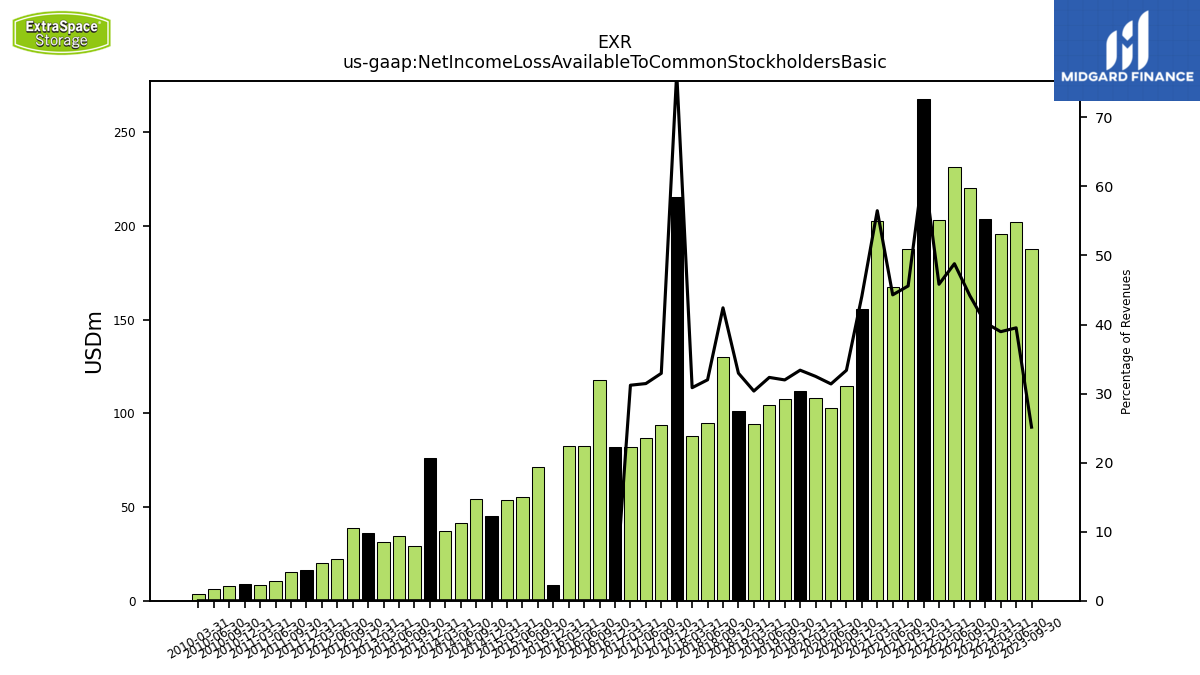
| Net Income Loss Available To Common Stockholders Basic | 215.84 | 188.05 | 202.09 | 196.00 | 203.97 | 220.41 | 231.82 | 203.29 | 268.04 | 188.02 | 167.72 | 202.69 | 155.86 | 114.46 | 102.74 | 108.02 | 112.11 | 107.92 | 104.65 | 94.60 | 101.29 | 130.20 | 94.96 | 88.08 | 215.58 | 93.57 | 86.80 | 82.08 | |
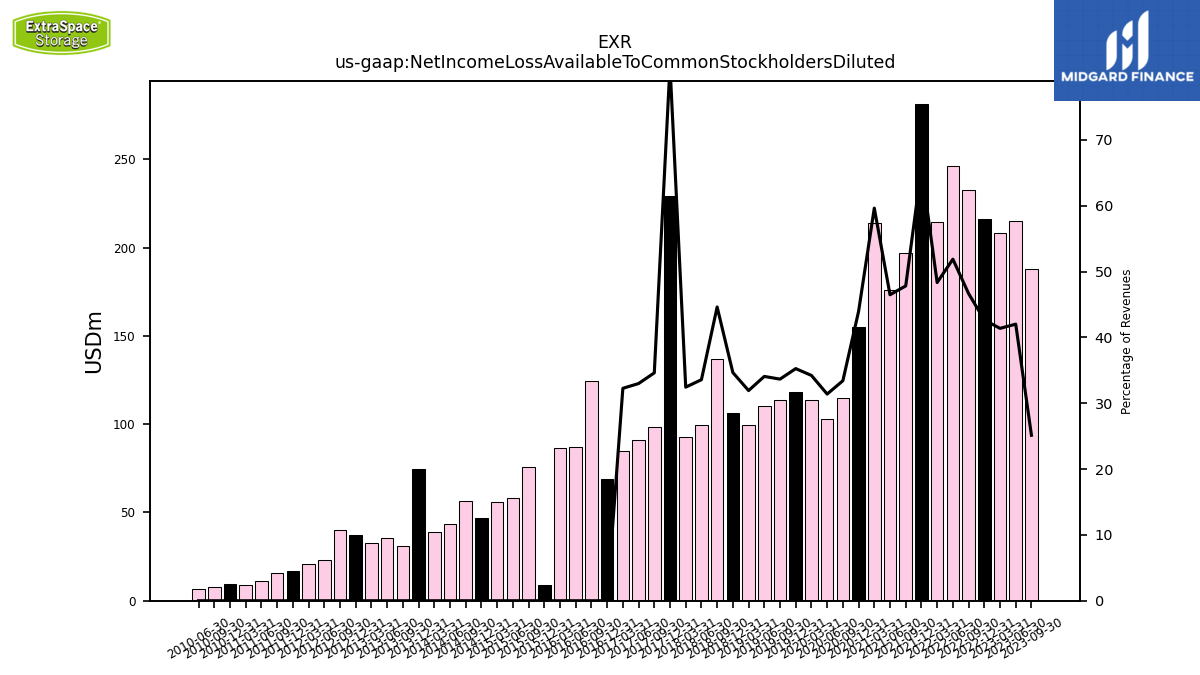
| Net Income Loss Available To Common Stockholders Diluted | 215.84 | 188.05 | 214.85 | 208.13 | 216.18 | 232.79 | 246.45 | 214.41 | 281.17 | 197.25 | 175.98 | 214.01 | 155.35 | 114.63 | 102.74 | 113.78 | 118.41 | 113.61 | 110.27 | 99.46 | 106.53 | 136.96 | 99.66 | 92.62 | 229.05 | 98.36 | 91.06 | 84.86 |
| 2023-12-31 | 2023-09-30 | 2023-06-30 | 2023-03-31 | 2022-12-31 | 2022-09-30 | 2022-06-30 | 2022-03-31 | 2021-12-31 | 2021-09-30 | 2021-06-30 | 2021-03-31 | 2020-12-31 | 2020-09-30 | 2020-06-30 | 2020-03-31 | 2019-12-31 | 2019-09-30 | 2019-06-30 | 2019-03-31 | 2018-12-31 | 2018-09-30 | 2018-06-30 | 2018-03-31 | 2017-12-31 | 2017-09-30 | 2017-06-30 | 2017-03-31 | ||
|---|---|---|---|---|---|---|---|---|---|---|---|---|---|---|---|---|---|---|---|---|---|---|---|---|---|---|---|---|---|
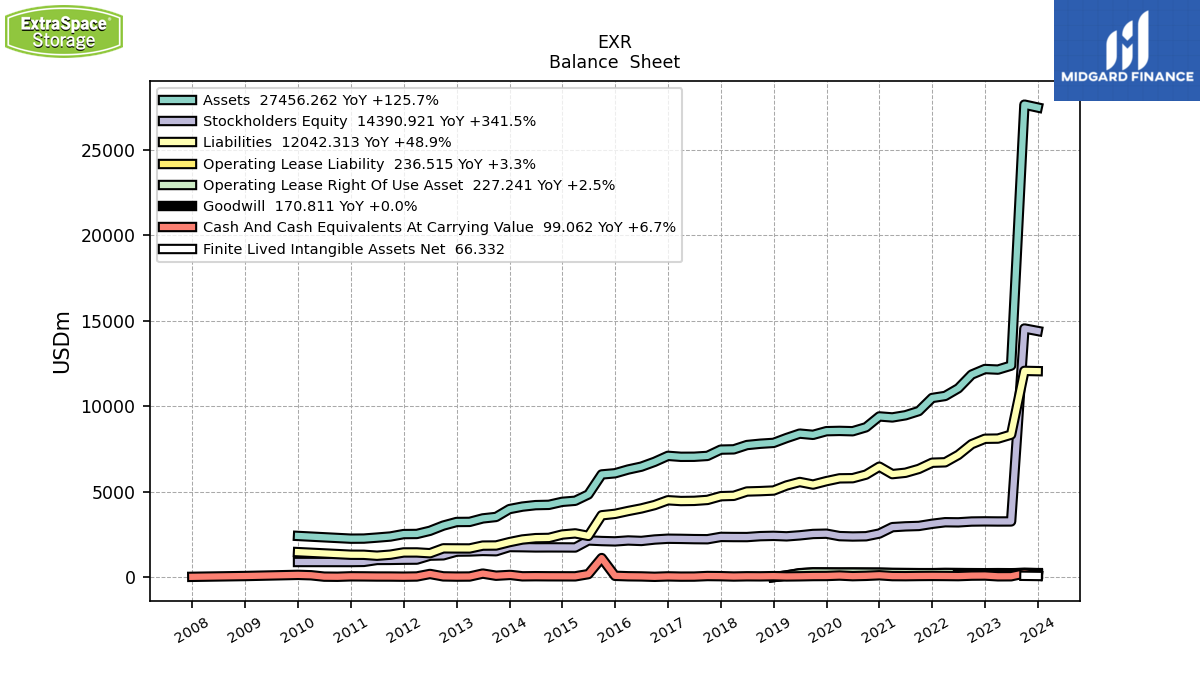
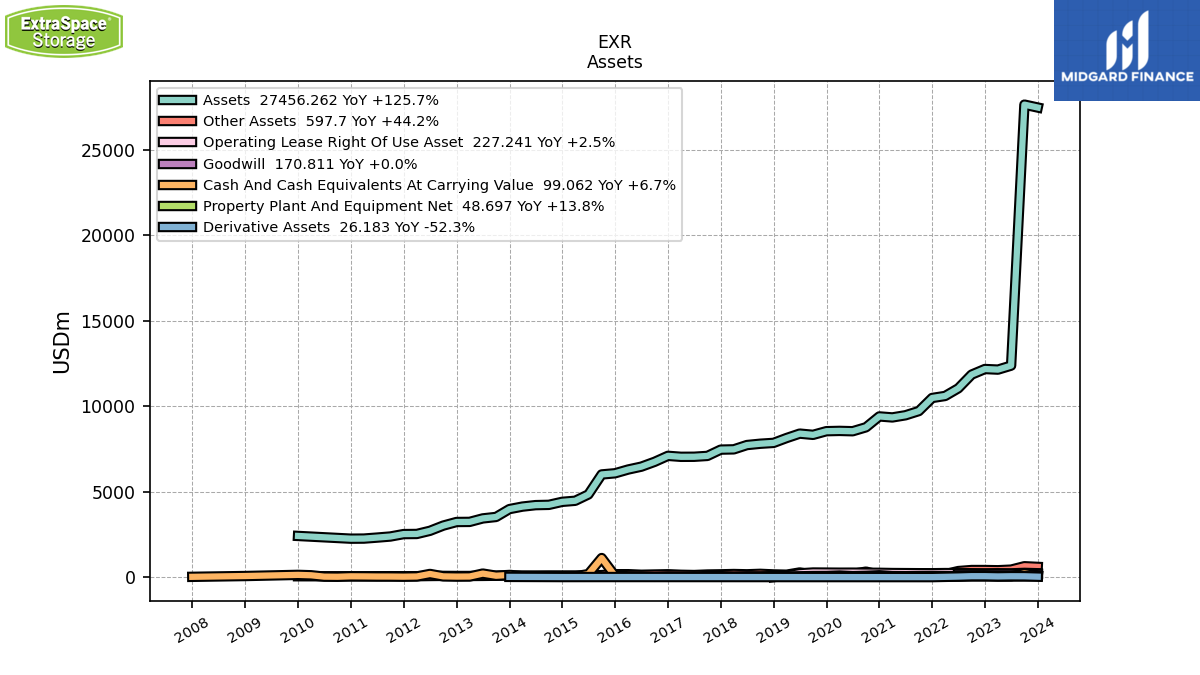
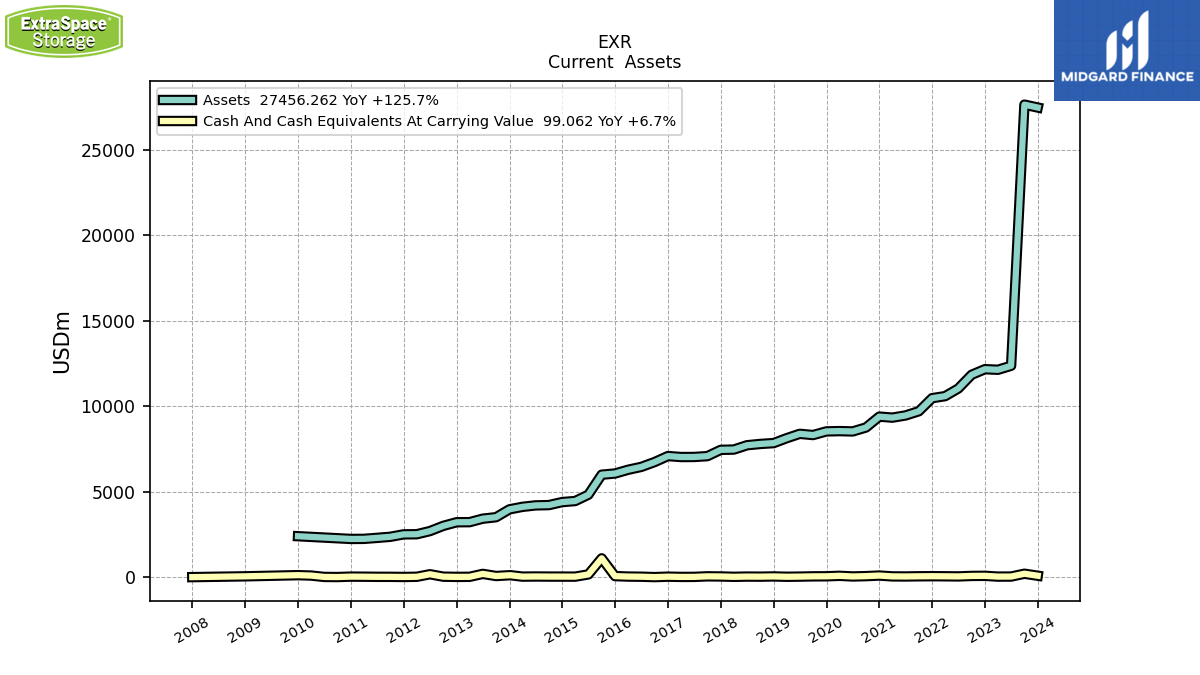
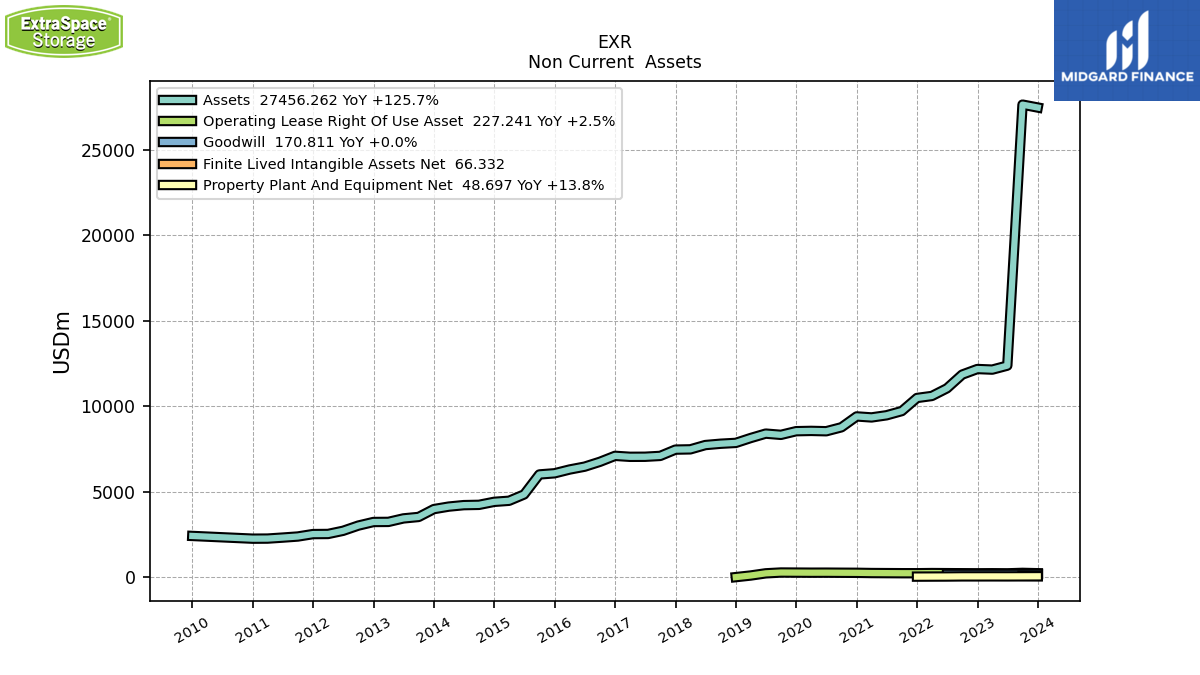
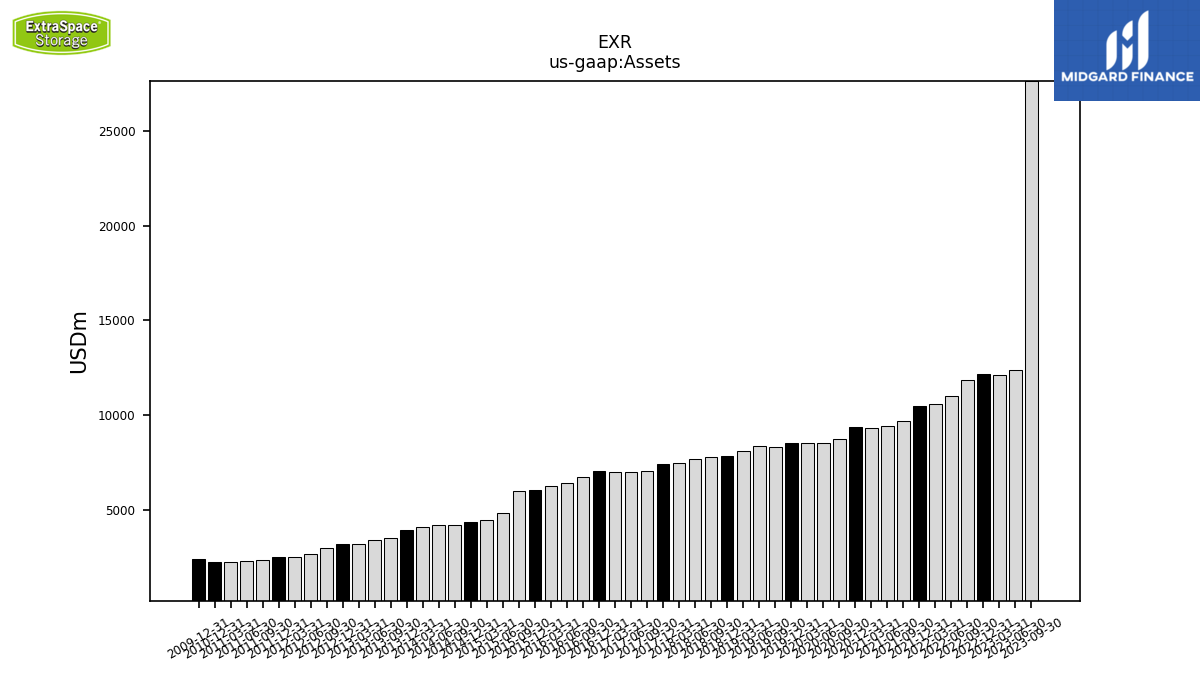
| Assets | 27456.26 | 27625.82 | 12365.45 | 12132.67 | 12167.46 | 11840.65 | 11038.77 | 10591.75 | 10474.48 | 9708.36 | 9463.09 | 9336.61 | 9395.85 | 8761.10 | 8529.89 | 8549.49 | 8532.38 | 8318.43 | 8390.72 | 8132.51 | 7847.98 | 7798.69 | 7721.95 | 7470.62 | 7455.14 | 7086.95 | 7037.46 | 7034.36 | |
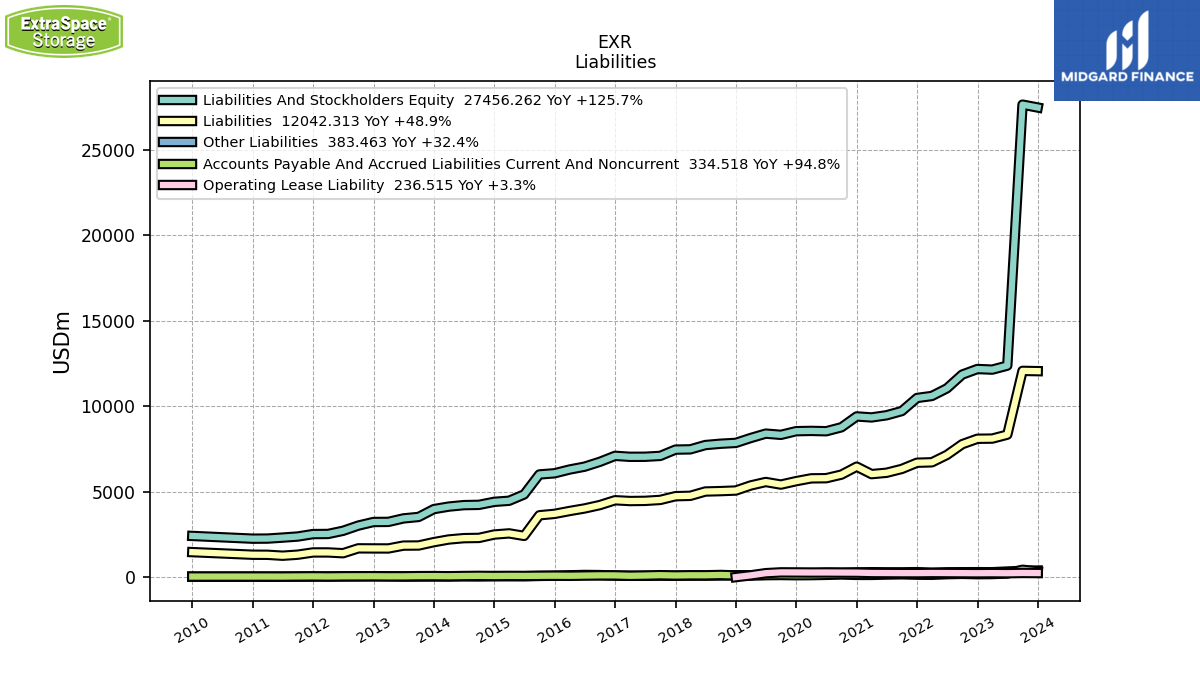
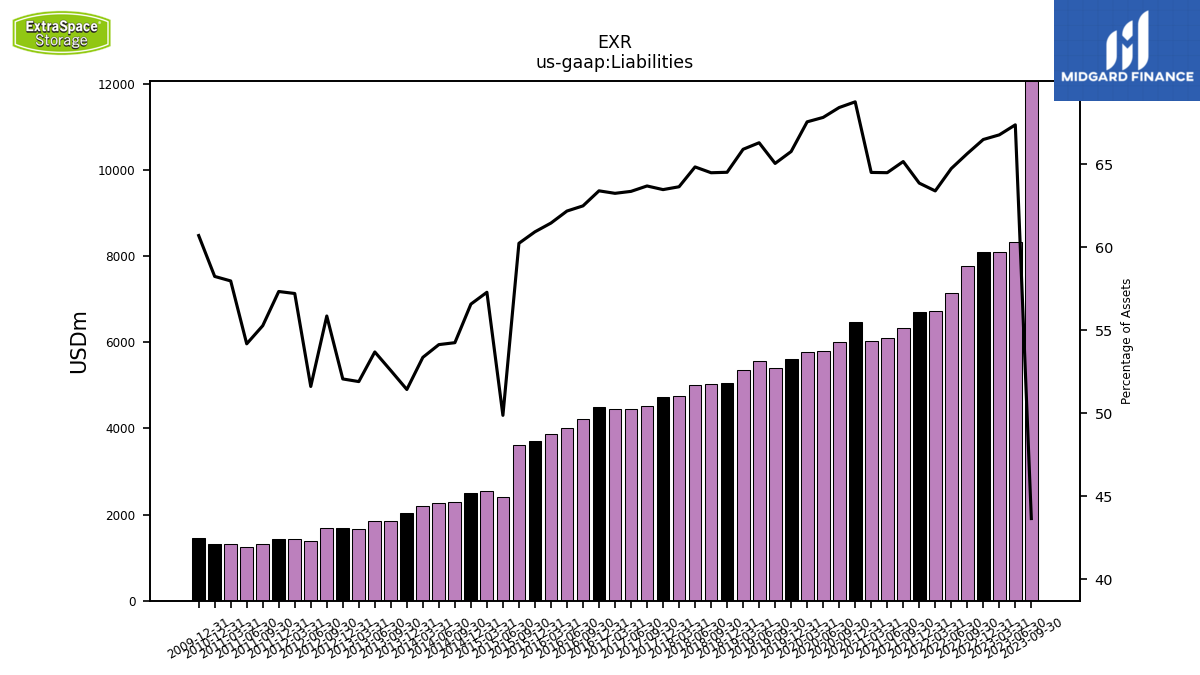
| Liabilities | 12042.31 | 12059.12 | 8330.05 | 8099.97 | 8089.18 | 7771.35 | 7145.53 | 6713.59 | 6688.50 | 6325.48 | 6102.14 | 6021.96 | 6459.72 | 5993.28 | 5784.38 | 5774.86 | 5610.68 | 5410.44 | 5561.91 | 5358.70 | 5062.56 | 5028.60 | 5006.15 | 4753.98 | 4731.33 | 4513.23 | 4458.78 | 4448.54 | |
| Liabilities And Stockholders Equity | 27456.26 | 27625.82 | 12365.45 | 12132.67 | 12167.46 | 11840.65 | 11038.77 | 10591.75 | 10474.48 | 9708.36 | 9463.09 | 9336.61 | 9395.85 | 8761.10 | 8529.89 | 8549.49 | 8532.38 | 8318.43 | 8390.72 | 8132.51 | 7847.98 | 7798.69 | 7721.95 | 7470.62 | 7455.14 | 7086.95 | 7037.46 | 7034.36 | |
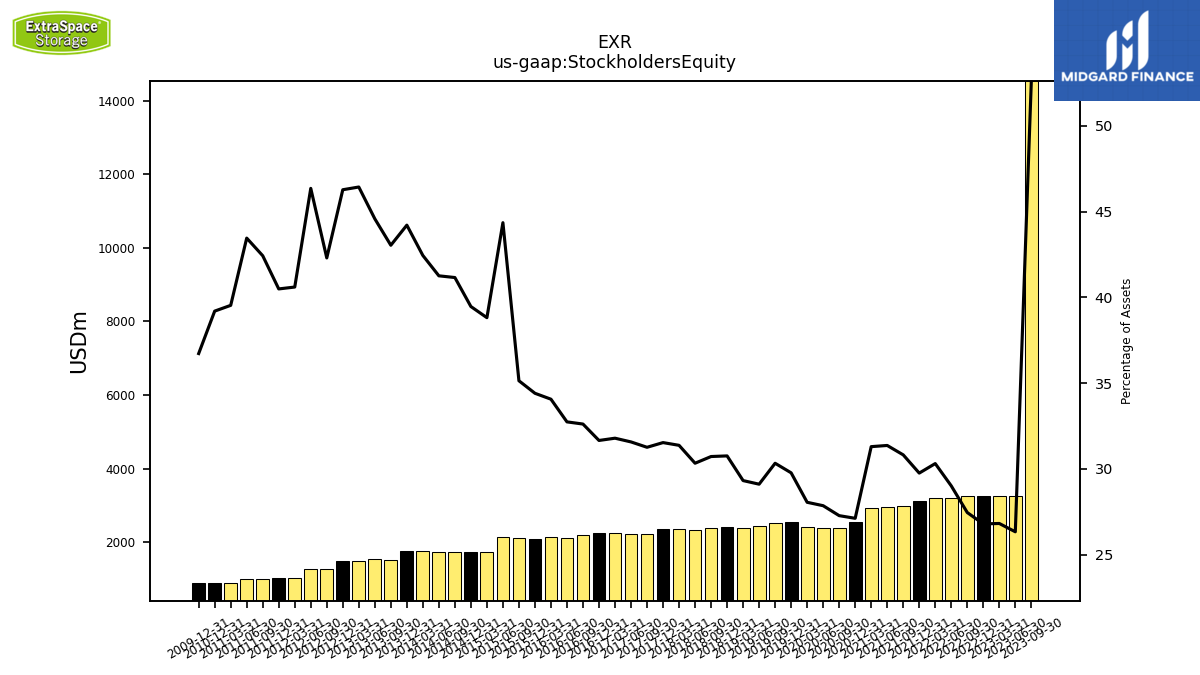
| Stockholders Equity | 14390.92 | 14537.12 | 3255.78 | 3253.33 | 3259.60 | 3250.57 | 3202.12 | 3210.22 | 3116.50 | 2991.76 | 2968.09 | 2921.97 | 2547.78 | 2389.28 | 2375.69 | 2398.12 | 2539.96 | 2522.71 | 2442.21 | 2384.15 | 2413.72 | 2395.72 | 2341.95 | 2343.75 | 2350.75 | 2215.27 | 2221.79 | 2236.12 |
| 2023-12-31 | 2023-09-30 | 2023-06-30 | 2023-03-31 | 2022-12-31 | 2022-09-30 | 2022-06-30 | 2022-03-31 | 2021-12-31 | 2021-09-30 | 2021-06-30 | 2021-03-31 | 2020-12-31 | 2020-09-30 | 2020-06-30 | 2020-03-31 | 2019-12-31 | 2019-09-30 | 2019-06-30 | 2019-03-31 | 2018-12-31 | 2018-09-30 | 2018-06-30 | 2018-03-31 | 2017-12-31 | 2017-09-30 | 2017-06-30 | 2017-03-31 | ||
|---|---|---|---|---|---|---|---|---|---|---|---|---|---|---|---|---|---|---|---|---|---|---|---|---|---|---|---|---|---|
| Cash And Cash Equivalents At Carrying Value | 99.06 | 216.12 | 50.64 | 47.95 | 92.87 | 86.99 | 58.73 | 65.98 | 71.13 | 65.56 | 56.01 | 60.33 | 109.12 | 74.80 | 56.40 | 93.30 | 65.75 | 62.28 | 47.67 | 38.99 | 57.50 | 45.38 | 49.19 | 35.53 | 55.68 | 63.73 | 31.65 | 29.31 | |
| Cash Cash Equivalents Restricted Cash And Restricted Cash Equivalents | 105.08 | 223.12 | 52.91 | 50.44 | 97.73 | 94.35 | 70.17 | 72.67 | 76.19 | 81.28 | 59.75 | 62.80 | 128.01 | 80.57 | 61.75 | 97.93 | 70.73 | 66.72 | 55.64 | 46.83 | 72.69 | 66.58 | 69.11 | 54.06 | 86.04 | 81.01 | 48.41 | 41.54 | |
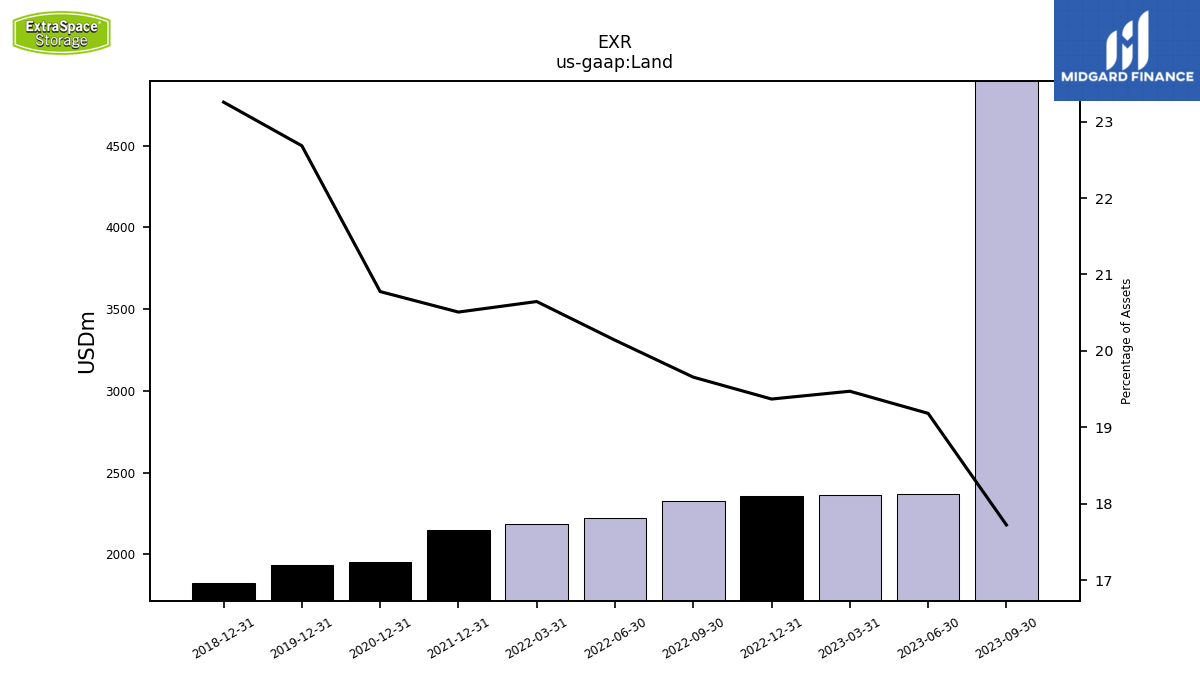
| Land | 4904.70 | 4895.65 | 2371.92 | 2362.40 | 2356.75 | 2327.37 | 2223.17 | 2186.75 | 2148.09 | NA | NA | NA | 1952.10 | NA | NA | NA | 1935.55 | NA | NA | NA | 1825.13 | NA | NA | NA | NA | NA | NA | NA |
| 2023-12-31 | 2023-09-30 | 2023-06-30 | 2023-03-31 | 2022-12-31 | 2022-09-30 | 2022-06-30 | 2022-03-31 | 2021-12-31 | 2021-09-30 | 2021-06-30 | 2021-03-31 | 2020-12-31 | 2020-09-30 | 2020-06-30 | 2020-03-31 | 2019-12-31 | 2019-09-30 | 2019-06-30 | 2019-03-31 | 2018-12-31 | 2018-09-30 | 2018-06-30 | 2018-03-31 | 2017-12-31 | 2017-09-30 | 2017-06-30 | 2017-03-31 | ||
|---|---|---|---|---|---|---|---|---|---|---|---|---|---|---|---|---|---|---|---|---|---|---|---|---|---|---|---|---|---|
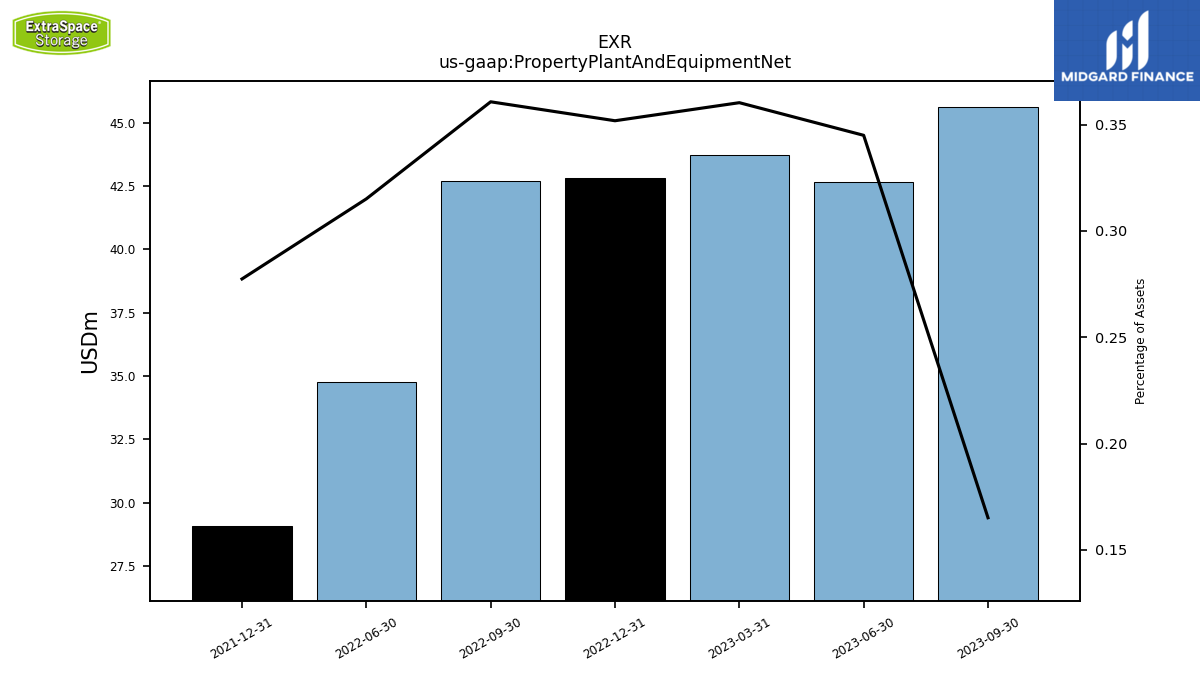
| Property Plant And Equipment Net | 48.70 | 45.63 | 42.66 | 43.72 | 42.81 | 42.71 | 34.78 | NA | 29.06 | NA | NA | NA | NA | NA | NA | NA | NA | NA | NA | NA | NA | NA | NA | NA | NA | NA | NA | NA | |
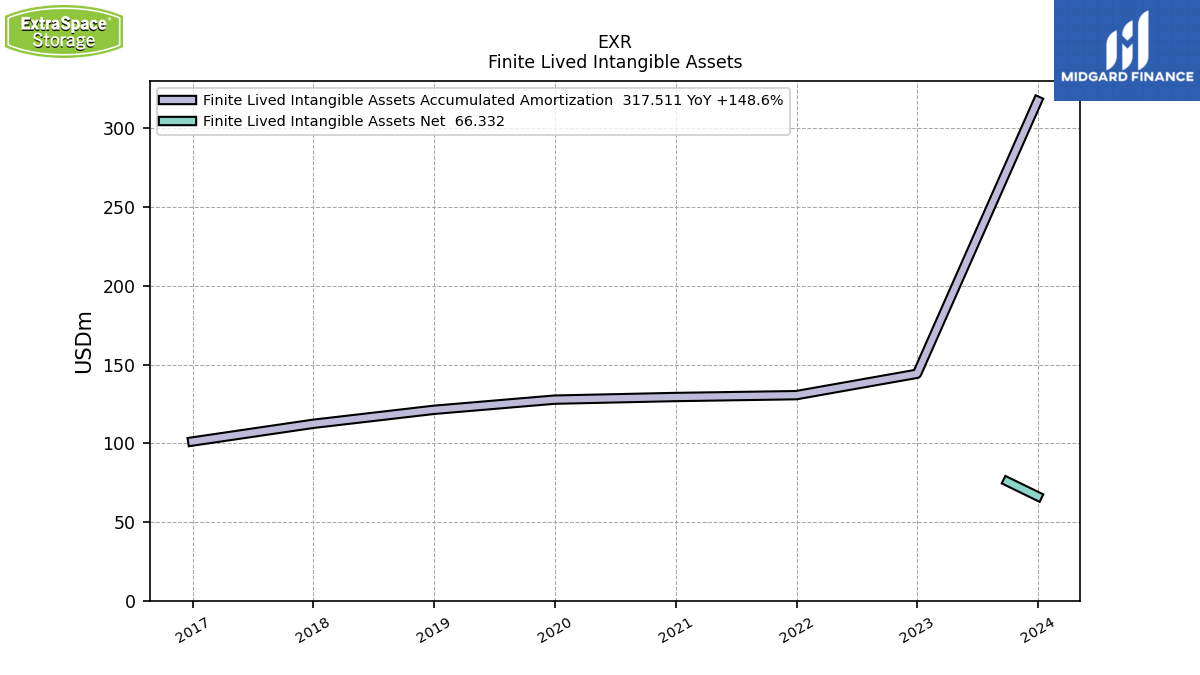
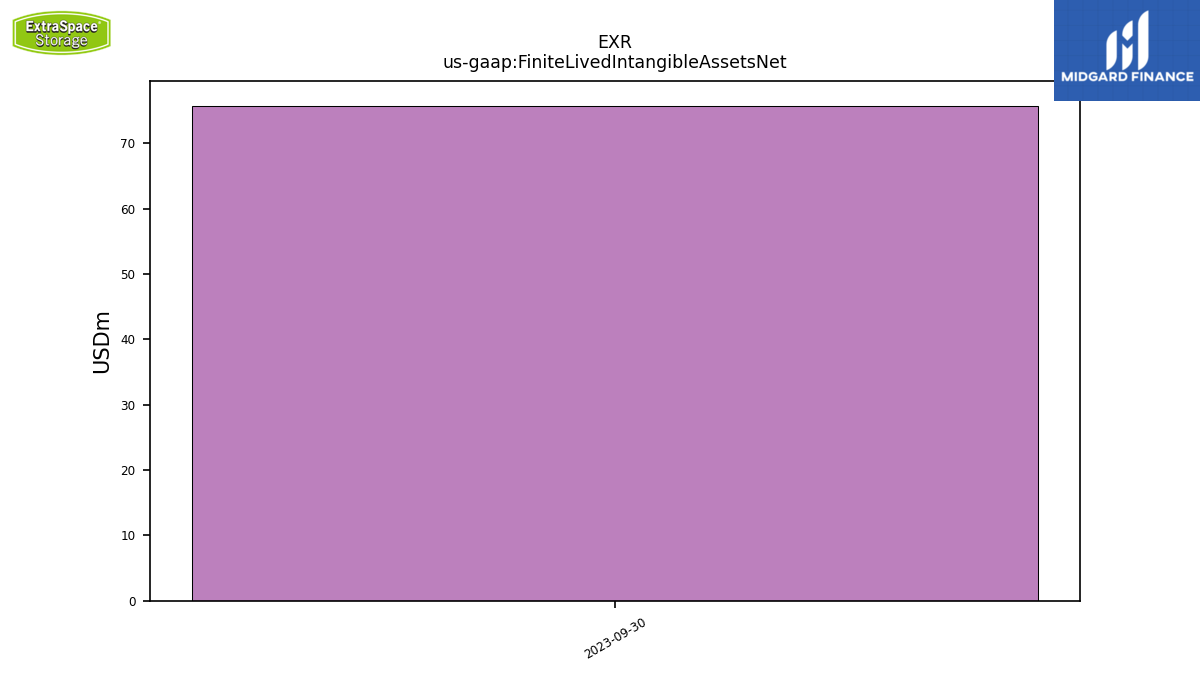
| Finite Lived Intangible Assets Net | 66.33 | 75.75 | NA | NA | NA | NA | NA | NA | NA | NA | NA | NA | NA | NA | NA | NA | NA | NA | NA | NA | NA | NA | NA | NA | NA | NA | NA | NA |
| 2023-12-31 | 2023-09-30 | 2023-06-30 | 2023-03-31 | 2022-12-31 | 2022-09-30 | 2022-06-30 | 2022-03-31 | 2021-12-31 | 2021-09-30 | 2021-06-30 | 2021-03-31 | 2020-12-31 | 2020-09-30 | 2020-06-30 | 2020-03-31 | 2019-12-31 | 2019-09-30 | 2019-06-30 | 2019-03-31 | 2018-12-31 | 2018-09-30 | 2018-06-30 | 2018-03-31 | 2017-12-31 | 2017-09-30 | 2017-06-30 | 2017-03-31 | ||
|---|---|---|---|---|---|---|---|---|---|---|---|---|---|---|---|---|---|---|---|---|---|---|---|---|---|---|---|---|---|
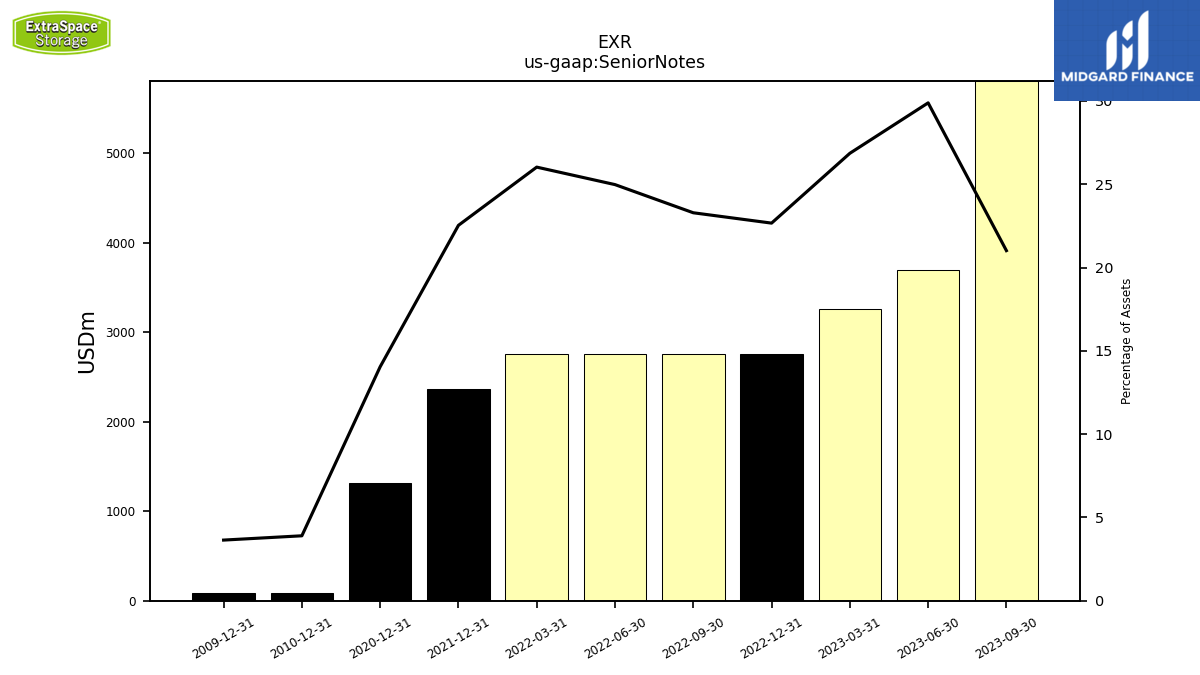
| Senior Notes | 6410.62 | 5805.45 | 3695.20 | 3258.33 | 2757.79 | 2757.28 | 2757.16 | 2756.64 | 2360.07 | NA | NA | NA | 1319.47 | NA | NA | NA | NA | NA | NA | NA | NA | NA | NA | NA | NA | NA | NA | NA |
| 2023-12-31 | 2023-09-30 | 2023-06-30 | 2023-03-31 | 2022-12-31 | 2022-09-30 | 2022-06-30 | 2022-03-31 | 2021-12-31 | 2021-09-30 | 2021-06-30 | 2021-03-31 | 2020-12-31 | 2020-09-30 | 2020-06-30 | 2020-03-31 | 2019-12-31 | 2019-09-30 | 2019-06-30 | 2019-03-31 | 2018-12-31 | 2018-09-30 | 2018-06-30 | 2018-03-31 | 2017-12-31 | 2017-09-30 | 2017-06-30 | 2017-03-31 | ||
|---|---|---|---|---|---|---|---|---|---|---|---|---|---|---|---|---|---|---|---|---|---|---|---|---|---|---|---|---|---|
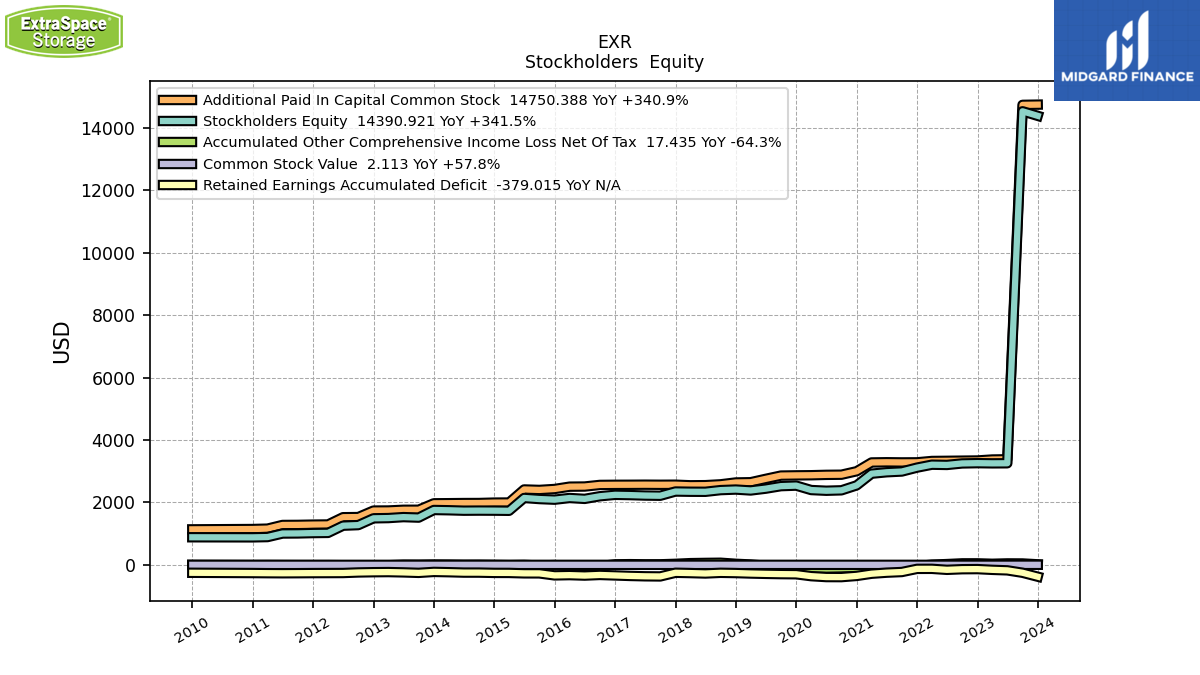
| Stockholders Equity | 14390.92 | 14537.12 | 3255.78 | 3253.33 | 3259.60 | 3250.57 | 3202.12 | 3210.22 | 3116.50 | 2991.76 | 2968.09 | 2921.97 | 2547.78 | 2389.28 | 2375.69 | 2398.12 | 2539.96 | 2522.71 | 2442.21 | 2384.15 | 2413.72 | 2395.72 | 2341.95 | 2343.75 | 2350.75 | 2215.27 | 2221.79 | 2236.12 | |
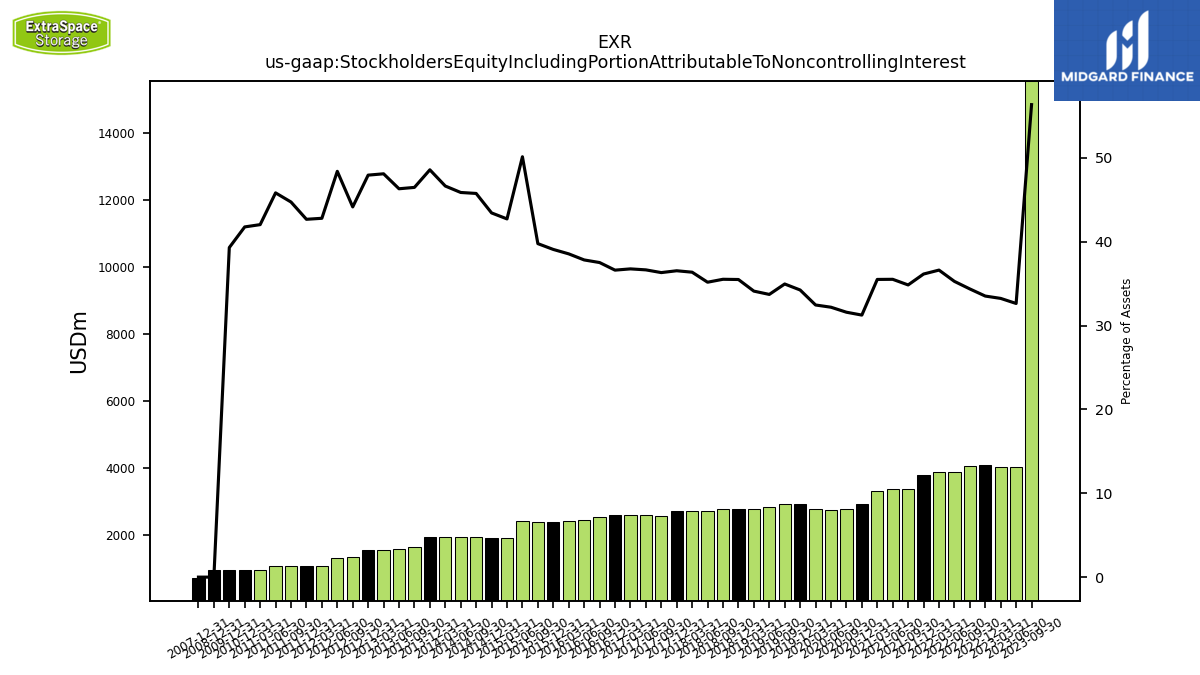
| Stockholders Equity Including Portion Attributable To Noncontrolling Interest | 15413.95 | 15566.70 | 4035.41 | 4032.70 | 4078.27 | 4069.30 | 3893.24 | 3878.16 | 3785.98 | 3382.88 | 3360.95 | 3314.65 | 2936.12 | 2767.82 | 2745.52 | 2774.63 | 2921.69 | 2907.99 | 2828.81 | 2773.81 | 2785.42 | 2770.09 | 2715.80 | 2716.65 | 2723.81 | 2573.72 | 2578.68 | 2585.82 | |
| Common Stock Value | 2.11 | 2.11 | 1.35 | 1.35 | 1.34 | 1.34 | 1.34 | 1.34 | 1.34 | 1.34 | 1.34 | 1.34 | 1.31 | 1.29 | 1.29 | 1.29 | 1.29 | 1.29 | 1.28 | 1.27 | 1.27 | 1.26 | 1.26 | 1.26 | 1.26 | 1.26 | 1.26 | 1.26 | |
| Additional Paid In Capital Common Stock | 14750.39 | 14742.97 | 3383.30 | 3376.46 | 3345.33 | 3339.96 | 3334.32 | 3329.61 | 3285.95 | 3283.85 | 3288.85 | 3282.26 | 3000.46 | 2889.59 | 2884.94 | 2872.93 | 2868.68 | 2861.61 | 2756.80 | 2648.72 | 2640.70 | 2581.16 | 2554.45 | 2550.58 | 2569.49 | 2567.23 | 2569.97 | 2567.23 | |
| Retained Earnings Accumulated Deficit | -379.01 | -252.88 | -175.94 | -159.56 | -135.87 | -139.25 | -159.09 | -127.19 | -128.25 | -229.27 | -250.27 | -284.44 | -354.90 | -392.89 | -391.29 | -362.26 | -301.05 | -296.75 | -288.40 | -277.65 | -262.90 | -255.06 | -276.69 | -263.36 | -253.28 | -370.96 | -366.44 | -355.19 | |
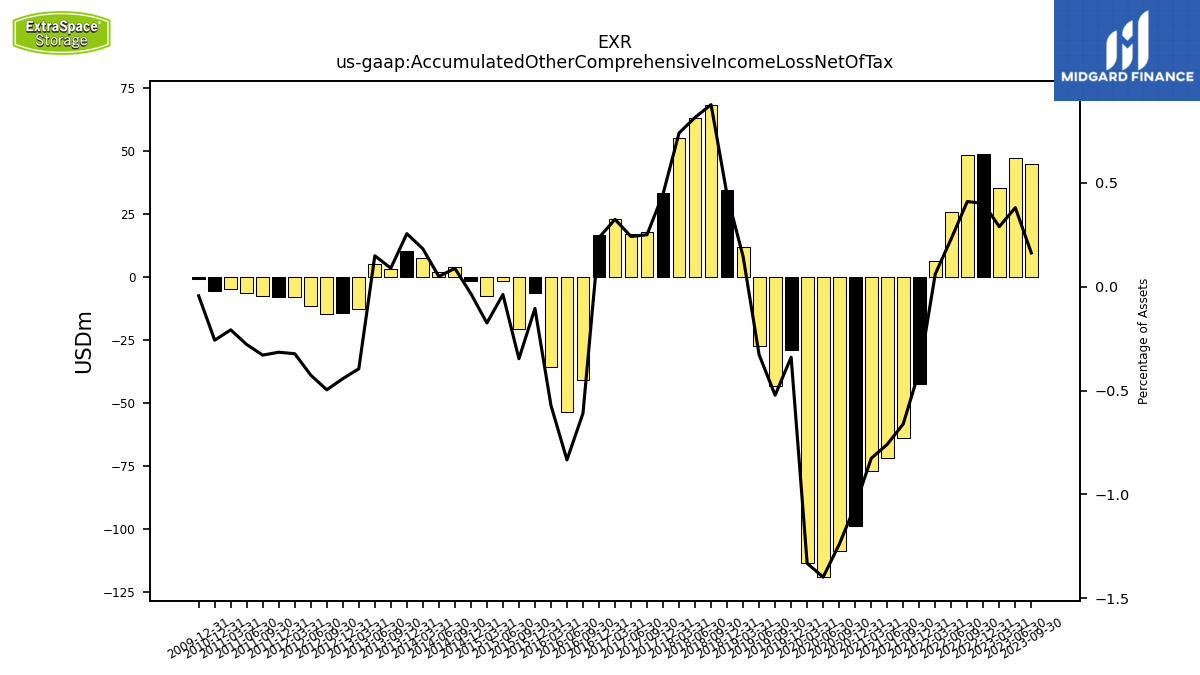
| Accumulated Other Comprehensive Income Loss Net Of Tax | 17.43 | 44.91 | 47.06 | 35.08 | 48.80 | 48.52 | 25.55 | 6.46 | -42.55 | -64.16 | -71.83 | -77.18 | -99.09 | -108.71 | -119.26 | -113.84 | -28.97 | -43.44 | -27.48 | 11.81 | 34.65 | 68.36 | 62.93 | 55.27 | 33.29 | 17.73 | 17.00 | 22.82 | |
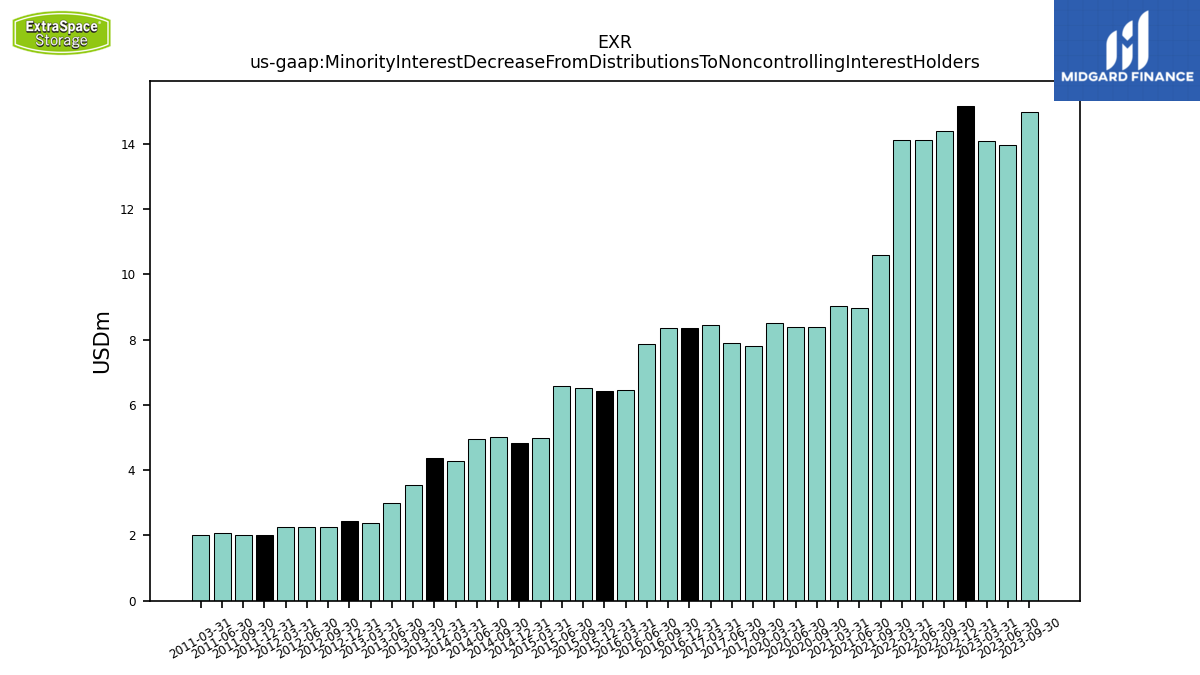
| Minority Interest Decrease From Distributions To Noncontrolling Interest Holders | 16.65 | 14.96 | 13.96 | 14.08 | 15.16 | 14.39 | 14.13 | 14.11 | NA | 10.59 | 8.97 | 9.03 | NA | 8.37 | 8.39 | 8.51 | NA | NA | NA | NA | NA | NA | NA | NA | NA | 7.82 | 7.88 | 8.44 |
| 2023-12-31 | 2023-09-30 | 2023-06-30 | 2023-03-31 | 2022-12-31 | 2022-09-30 | 2022-06-30 | 2022-03-31 | 2021-12-31 | 2021-09-30 | 2021-06-30 | 2021-03-31 | 2020-12-31 | 2020-09-30 | 2020-06-30 | 2020-03-31 | 2019-12-31 | 2019-09-30 | 2019-06-30 | 2019-03-31 | 2018-12-31 | 2018-09-30 | 2018-06-30 | 2018-03-31 | 2017-12-31 | 2017-09-30 | 2017-06-30 | 2017-03-31 | ||
|---|---|---|---|---|---|---|---|---|---|---|---|---|---|---|---|---|---|---|---|---|---|---|---|---|---|---|---|---|---|
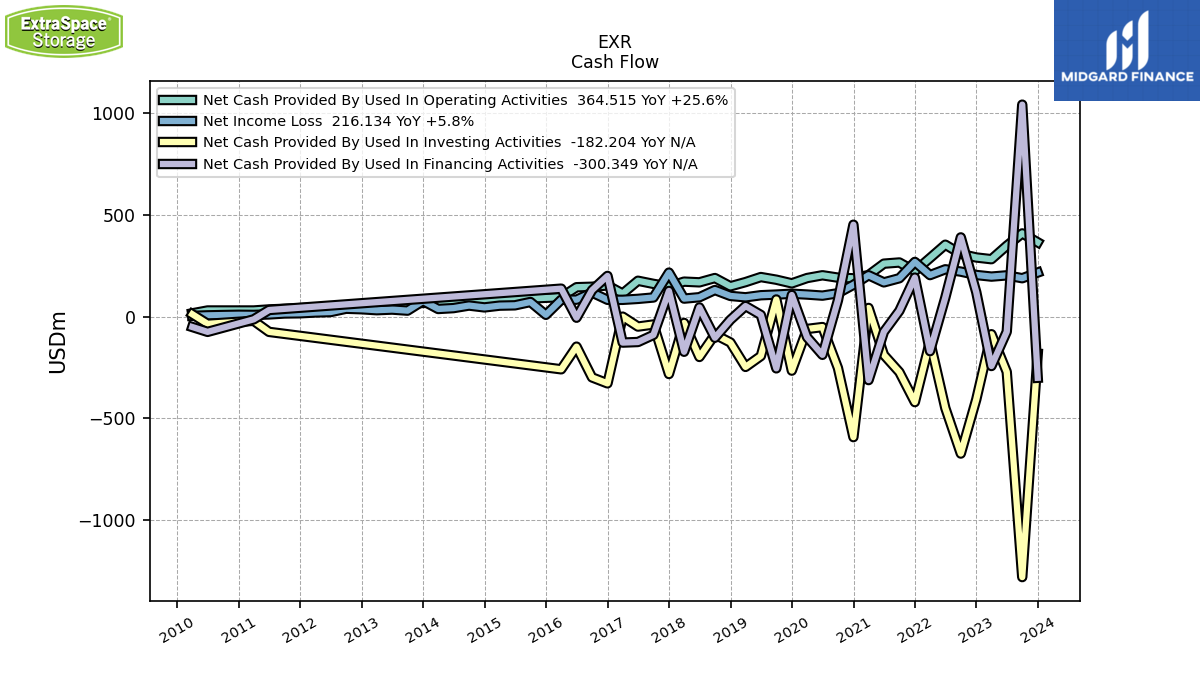
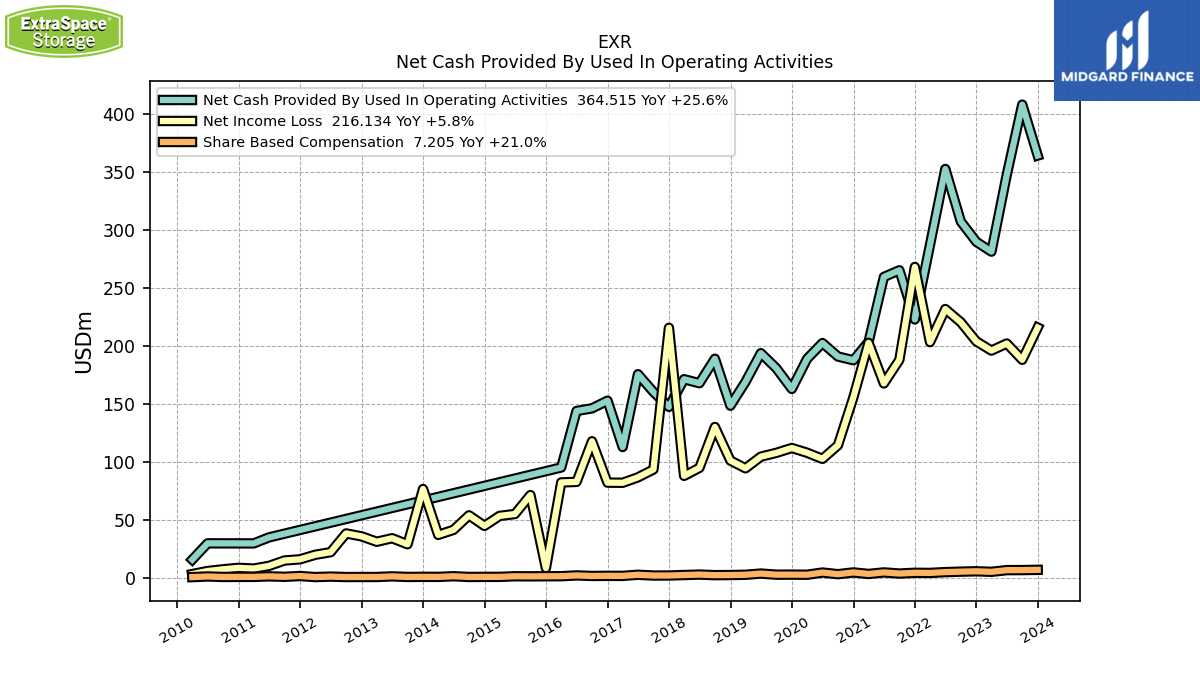
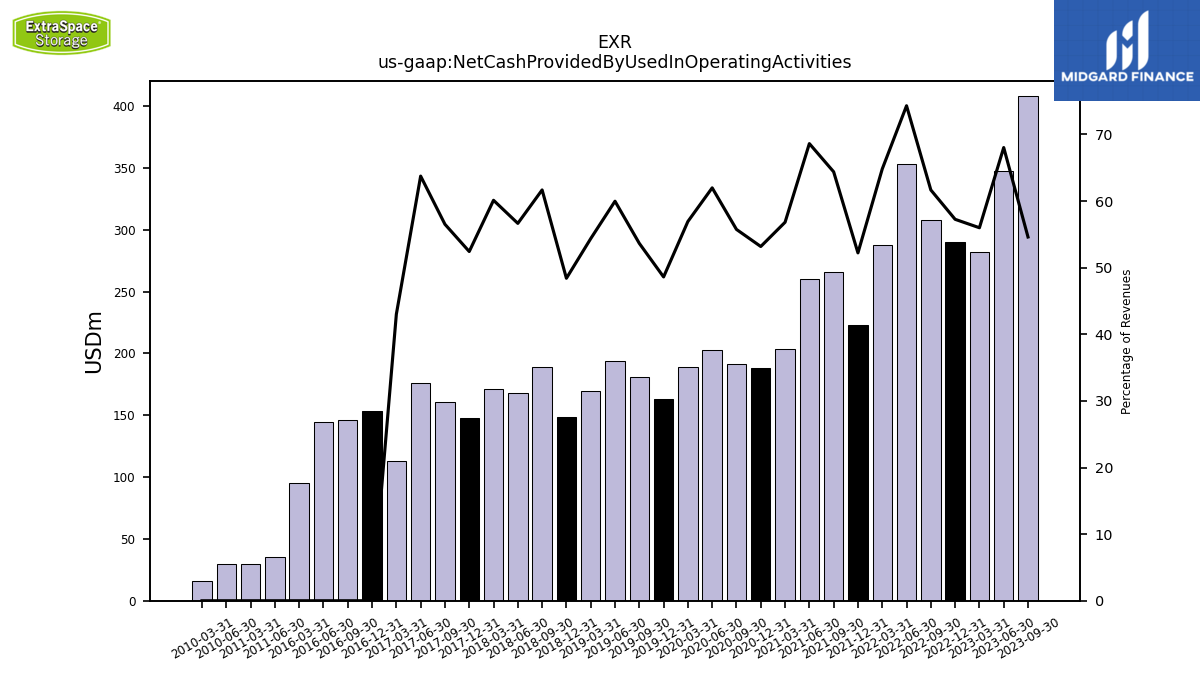
| Net Cash Provided By Used In Operating Activities | 364.51 | 408.43 | 347.88 | 281.65 | 290.12 | 307.63 | 352.92 | 287.46 | 223.17 | 265.58 | 259.81 | 203.88 | 187.97 | 191.19 | 202.82 | 189.26 | 163.22 | 181.06 | 194.07 | 169.34 | 148.77 | 189.28 | 168.13 | 171.61 | 147.75 | 160.58 | 175.93 | 113.12 | |
| Net Cash Provided By Used In Investing Activities | -182.20 | -1278.47 | -271.25 | -86.34 | -406.20 | -672.23 | -448.66 | -121.37 | -419.75 | -272.49 | -187.90 | 42.59 | -591.58 | -251.98 | -51.30 | -60.57 | -265.25 | 84.05 | -193.45 | -246.97 | -126.87 | -87.93 | -198.17 | -30.93 | -281.81 | -38.71 | -48.94 | -0.09 | |
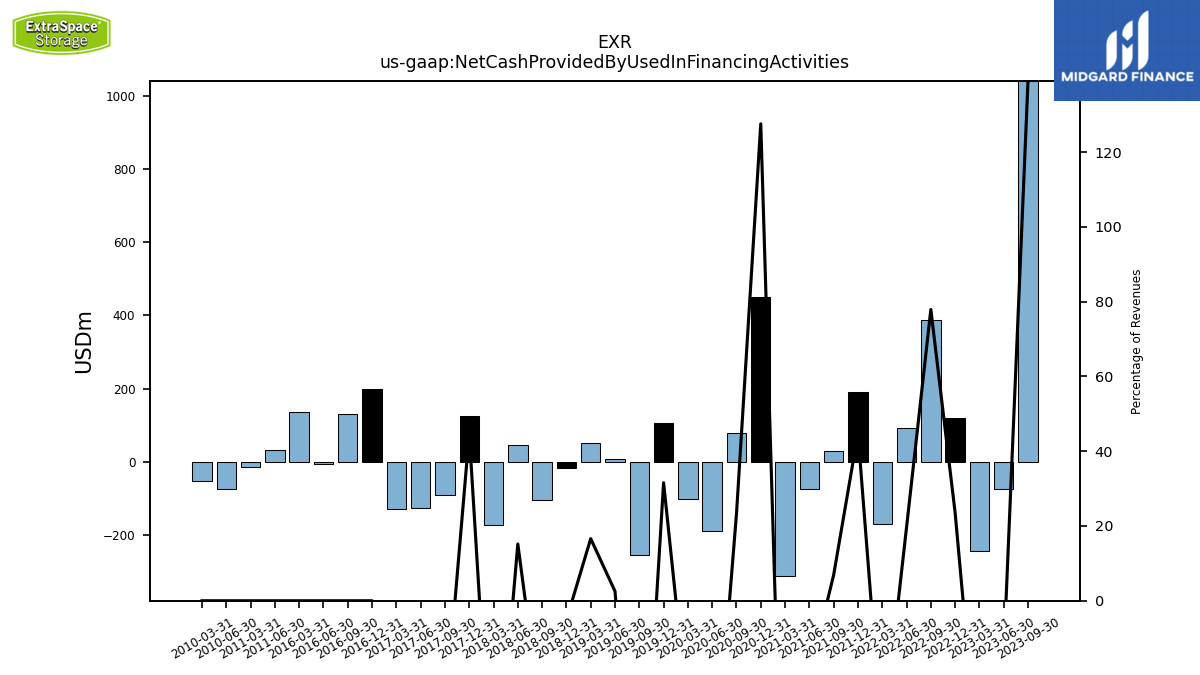
| Net Cash Provided By Used In Financing Activities | -300.35 | 1040.24 | -74.16 | -242.60 | 119.47 | 388.78 | 93.23 | -169.62 | 191.49 | 28.44 | -74.96 | -311.69 | 451.05 | 79.61 | -187.70 | -101.49 | 106.05 | -254.04 | 8.20 | 51.77 | -15.79 | -103.87 | 45.08 | -172.66 | 126.02 | -89.79 | -124.65 | -127.58 |
| 2023-12-31 | 2023-09-30 | 2023-06-30 | 2023-03-31 | 2022-12-31 | 2022-09-30 | 2022-06-30 | 2022-03-31 | 2021-12-31 | 2021-09-30 | 2021-06-30 | 2021-03-31 | 2020-12-31 | 2020-09-30 | 2020-06-30 | 2020-03-31 | 2019-12-31 | 2019-09-30 | 2019-06-30 | 2019-03-31 | 2018-12-31 | 2018-09-30 | 2018-06-30 | 2018-03-31 | 2017-12-31 | 2017-09-30 | 2017-06-30 | 2017-03-31 | ||
|---|---|---|---|---|---|---|---|---|---|---|---|---|---|---|---|---|---|---|---|---|---|---|---|---|---|---|---|---|---|
| Net Cash Provided By Used In Operating Activities | 364.51 | 408.43 | 347.88 | 281.65 | 290.12 | 307.63 | 352.92 | 287.46 | 223.17 | 265.58 | 259.81 | 203.88 | 187.97 | 191.19 | 202.82 | 189.26 | 163.22 | 181.06 | 194.07 | 169.34 | 148.77 | 189.28 | 168.13 | 171.61 | 147.75 | 160.58 | 175.93 | 113.12 | |
| Net Income Loss | 216.13 | 188.35 | 202.41 | 196.30 | 204.26 | 220.72 | 232.13 | 203.58 | 268.43 | 188.28 | 167.95 | 203.00 | 156.06 | 114.63 | 102.91 | 108.18 | 112.28 | 108.09 | 104.83 | 94.77 | 101.46 | 130.42 | 95.15 | 88.26 | 215.98 | 93.76 | 87.01 | 82.28 | |
| Profit Loss | 227.41 | 198.86 | 215.31 | 208.88 | 219.48 | 236.13 | 247.83 | 217.72 | 283.86 | 199.82 | 178.58 | 215.50 | 166.31 | 123.85 | 111.26 | 116.16 | 120.28 | 116.00 | 112.69 | 102.16 | 109.25 | 139.69 | 102.71 | 95.43 | 229.31 | 101.08 | 94.10 | 89.73 | |
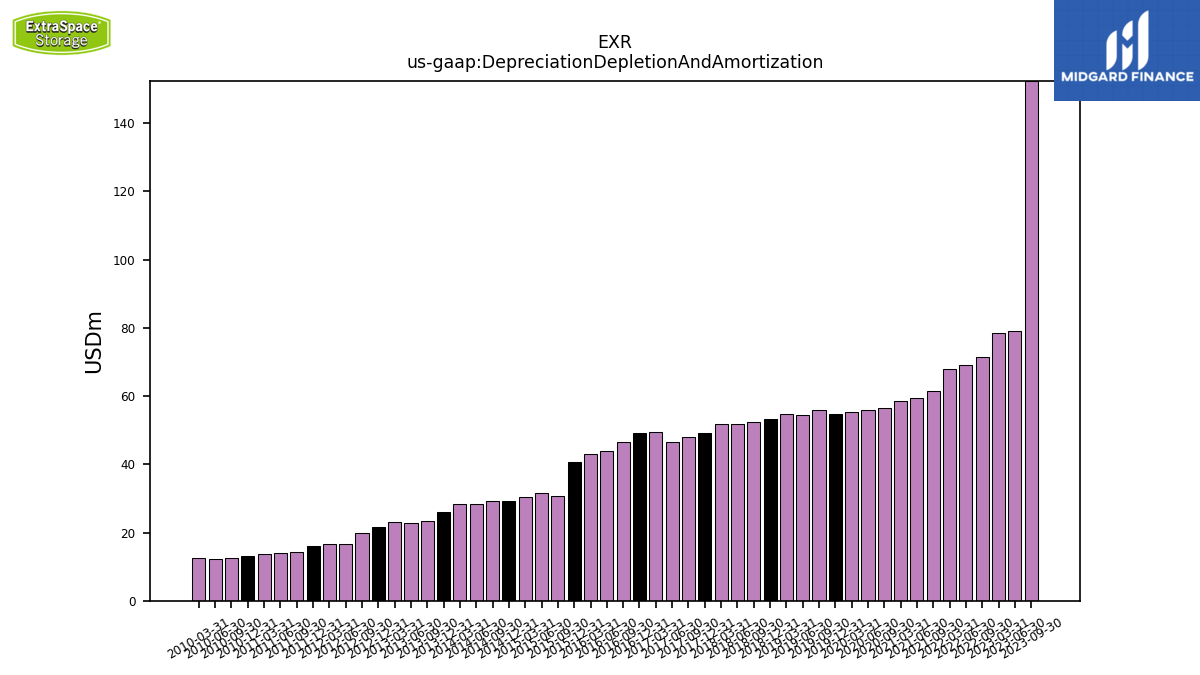
| Depreciation Depletion And Amortization | 196.14 | 152.34 | 79.09 | 78.49 | 79.92 | 71.42 | 69.07 | 67.91 | 62.19 | 61.52 | 59.57 | 58.60 | NA | 56.41 | 56.02 | 55.27 | 54.74 | 56.05 | 54.41 | 54.66 | 53.13 | 52.28 | 51.89 | 51.75 | 49.16 | 48.08 | 46.63 | 49.43 | |
| Share Based Compensation | 7.21 | 6.99 | 6.94 | 5.50 | 5.96 | 5.64 | 5.25 | 4.54 | 4.66 | 4.01 | 4.98 | 3.65 | 4.96 | 3.45 | 4.88 | 2.98 | 3.06 | 3.04 | 4.00 | 2.95 | 2.72 | 2.61 | 3.12 | 2.73 | 2.32 | 2.29 | 2.96 | 1.99 | |
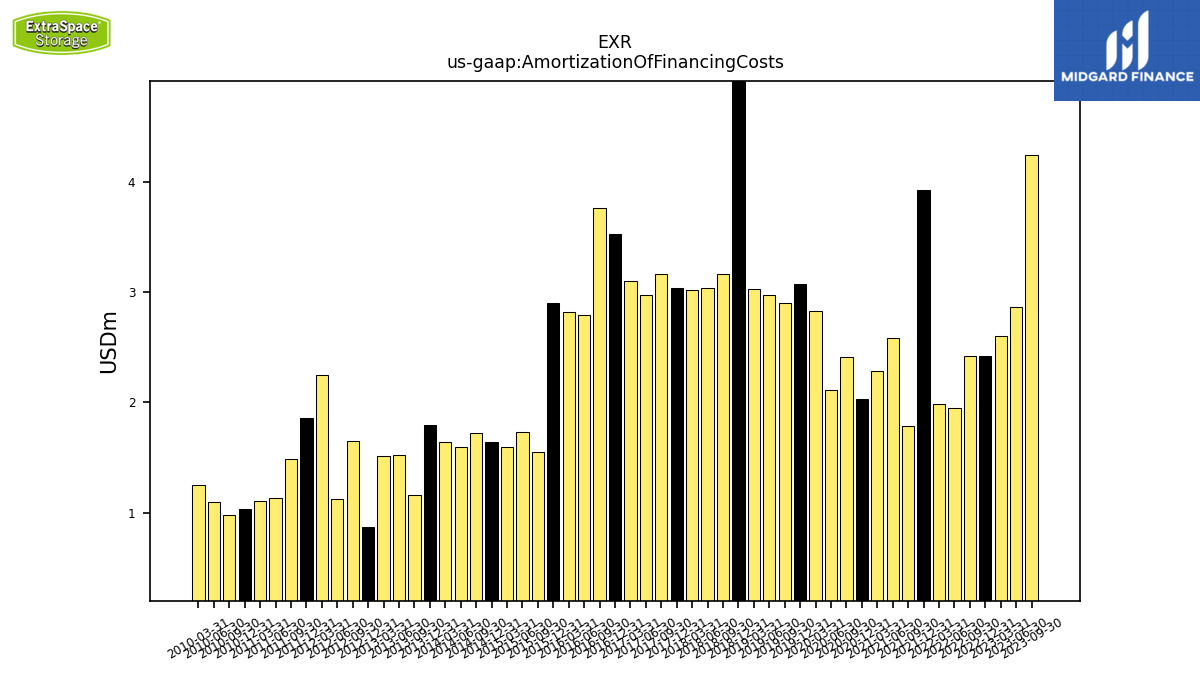
| Amortization Of Financing Costs | 9.23 | 4.25 | 2.87 | 2.60 | 2.42 | 2.42 | 1.95 | 1.98 | 3.93 | 1.79 | 2.58 | 2.29 | 2.03 | 2.41 | 2.12 | 2.83 | 3.08 | 2.91 | 2.97 | 3.03 | 5.06 | 3.17 | 3.04 | 3.02 | 3.04 | 3.16 | 2.98 | 3.10 |
| 2023-12-31 | 2023-09-30 | 2023-06-30 | 2023-03-31 | 2022-12-31 | 2022-09-30 | 2022-06-30 | 2022-03-31 | 2021-12-31 | 2021-09-30 | 2021-06-30 | 2021-03-31 | 2020-12-31 | 2020-09-30 | 2020-06-30 | 2020-03-31 | 2019-12-31 | 2019-09-30 | 2019-06-30 | 2019-03-31 | 2018-12-31 | 2018-09-30 | 2018-06-30 | 2018-03-31 | 2017-12-31 | 2017-09-30 | 2017-06-30 | 2017-03-31 | ||
|---|---|---|---|---|---|---|---|---|---|---|---|---|---|---|---|---|---|---|---|---|---|---|---|---|---|---|---|---|---|
| Net Cash Provided By Used In Investing Activities | -182.20 | -1278.47 | -271.25 | -86.34 | -406.20 | -672.23 | -448.66 | -121.37 | -419.75 | -272.49 | -187.90 | 42.59 | -591.58 | -251.98 | -51.30 | -60.57 | -265.25 | 84.05 | -193.45 | -246.97 | -126.87 | -87.93 | -198.17 | -30.93 | -281.81 | -38.71 | -48.94 | -0.09 | |
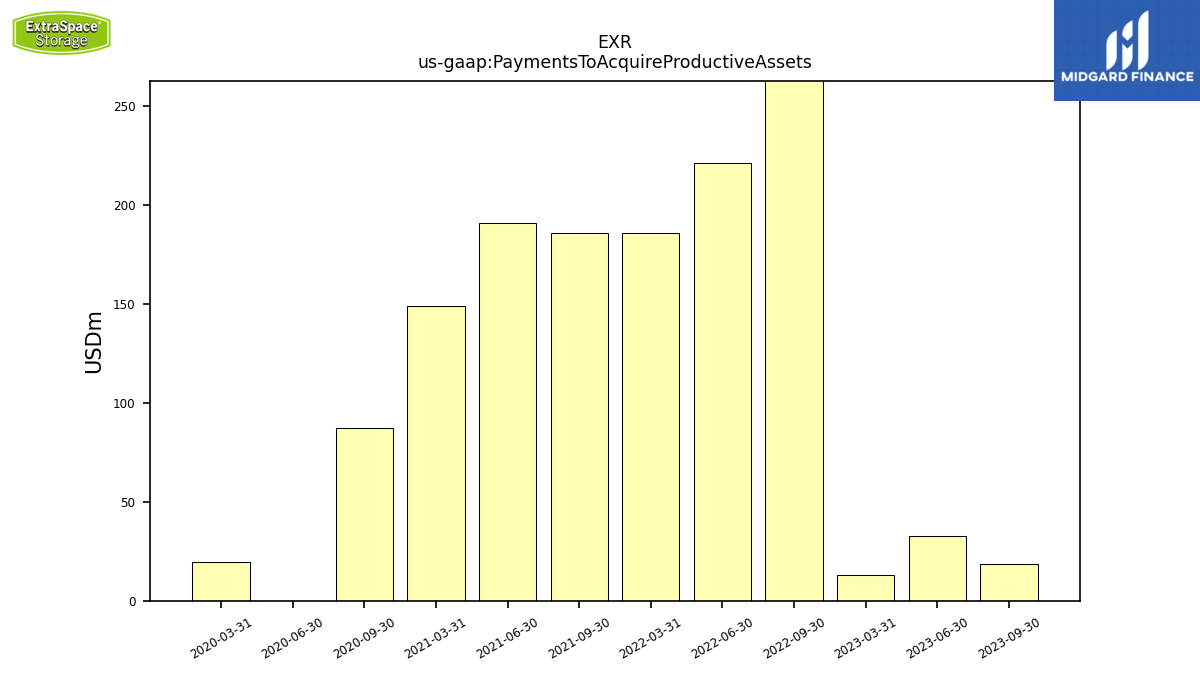
| Payments To Acquire Productive Assets | 71.00 | 18.58 | 32.89 | 13.11 | 147.35 | 639.07 | 220.93 | 185.91 | NA | 185.50 | 190.73 | 148.94 | NA | 87.00 | 0.00 | 19.35 | NA | NA | NA | NA | NA | NA | NA | NA | NA | NA | NA | NA |
| 2023-12-31 | 2023-09-30 | 2023-06-30 | 2023-03-31 | 2022-12-31 | 2022-09-30 | 2022-06-30 | 2022-03-31 | 2021-12-31 | 2021-09-30 | 2021-06-30 | 2021-03-31 | 2020-12-31 | 2020-09-30 | 2020-06-30 | 2020-03-31 | 2019-12-31 | 2019-09-30 | 2019-06-30 | 2019-03-31 | 2018-12-31 | 2018-09-30 | 2018-06-30 | 2018-03-31 | 2017-12-31 | 2017-09-30 | 2017-06-30 | 2017-03-31 | ||
|---|---|---|---|---|---|---|---|---|---|---|---|---|---|---|---|---|---|---|---|---|---|---|---|---|---|---|---|---|---|
| Net Cash Provided By Used In Financing Activities | -300.35 | 1040.24 | -74.16 | -242.60 | 119.47 | 388.78 | 93.23 | -169.62 | 191.49 | 28.44 | -74.96 | -311.69 | 451.05 | 79.61 | -187.70 | -101.49 | 106.05 | -254.04 | 8.20 | 51.77 | -15.79 | -103.87 | 45.08 | -172.66 | 126.02 | -89.79 | -124.65 | -127.58 | |
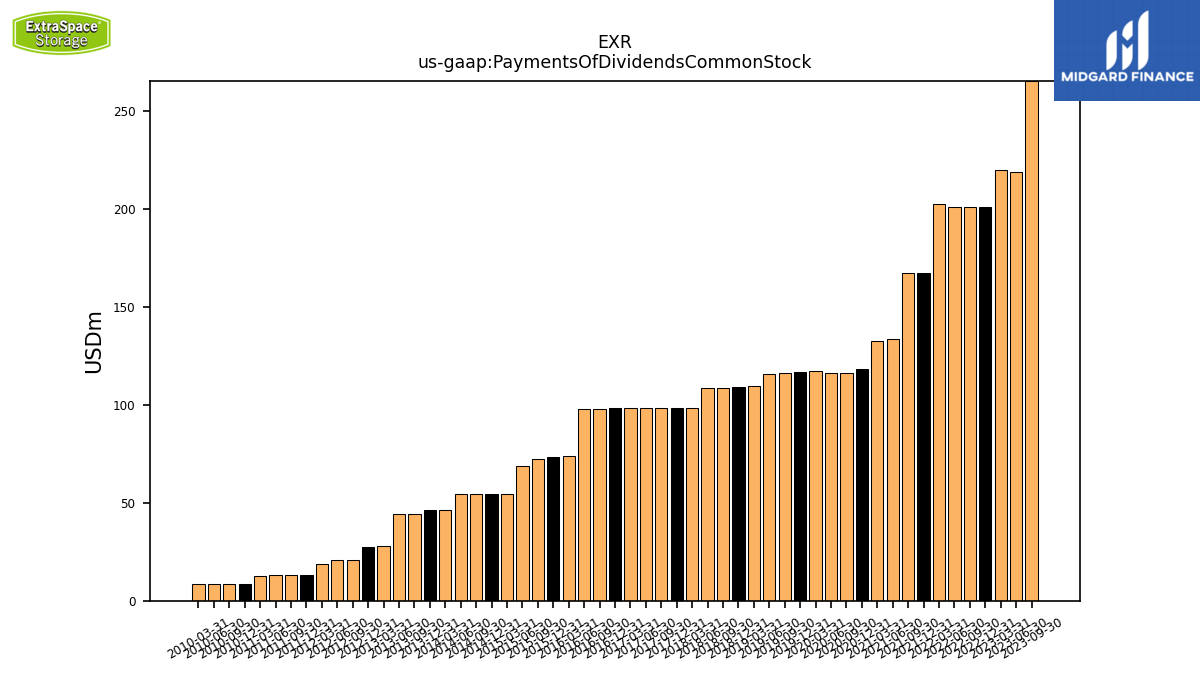
| Payments Of Dividends Common Stock | 342.27 | 265.29 | 218.79 | 219.99 | 200.88 | 200.88 | 201.02 | 202.53 | 167.40 | 167.27 | 133.78 | 132.54 | 118.06 | 116.19 | 116.32 | 117.20 | 116.58 | 116.44 | 115.57 | 109.52 | 109.30 | 108.80 | 108.49 | 98.33 | 98.29 | 98.29 | 98.26 | 98.21 |
| 2023-12-31 | 2023-09-30 | 2023-06-30 | 2023-03-31 | 2022-12-31 | 2022-09-30 | 2022-06-30 | 2022-03-31 | 2021-12-31 | 2021-09-30 | 2021-06-30 | 2021-03-31 | 2020-12-31 | 2020-09-30 | 2020-06-30 | 2020-03-31 | 2019-12-31 | 2019-09-30 | 2019-06-30 | 2019-03-31 | 2018-12-31 | 2018-09-30 | 2018-06-30 | 2018-03-31 | 2017-12-31 | 2017-09-30 | 2017-06-30 | 2017-03-31 | ||
|---|---|---|---|---|---|---|---|---|---|---|---|---|---|---|---|---|---|---|---|---|---|---|---|---|---|---|---|---|---|
| Revenues | 797.77 | 748.03 | 511.39 | 503.05 | 506.72 | 498.90 | 474.99 | 443.56 | 427.38 | 412.49 | 378.63 | 358.86 | 353.49 | 343.02 | 327.25 | 332.45 | 335.80 | 337.50 | 323.60 | 311.55 | 307.35 | 306.95 | 296.81 | 285.49 | 281.84 | 284.16 | 276.00 | 263.01 | |
| Operating | 767.40 | 720.01 | 489.18 | 481.67 | 485.53 | 476.66 | 454.47 | 423.61 | 408.44 | 395.61 | 363.83 | 343.21 | 339.66 | 329.72 | 314.39 | 320.32 | 321.97 | 324.50 | 311.29 | 300.80 | 296.44 | 296.83 | 286.65 | 274.92 | 271.70 | 274.47 | NA | NA | |
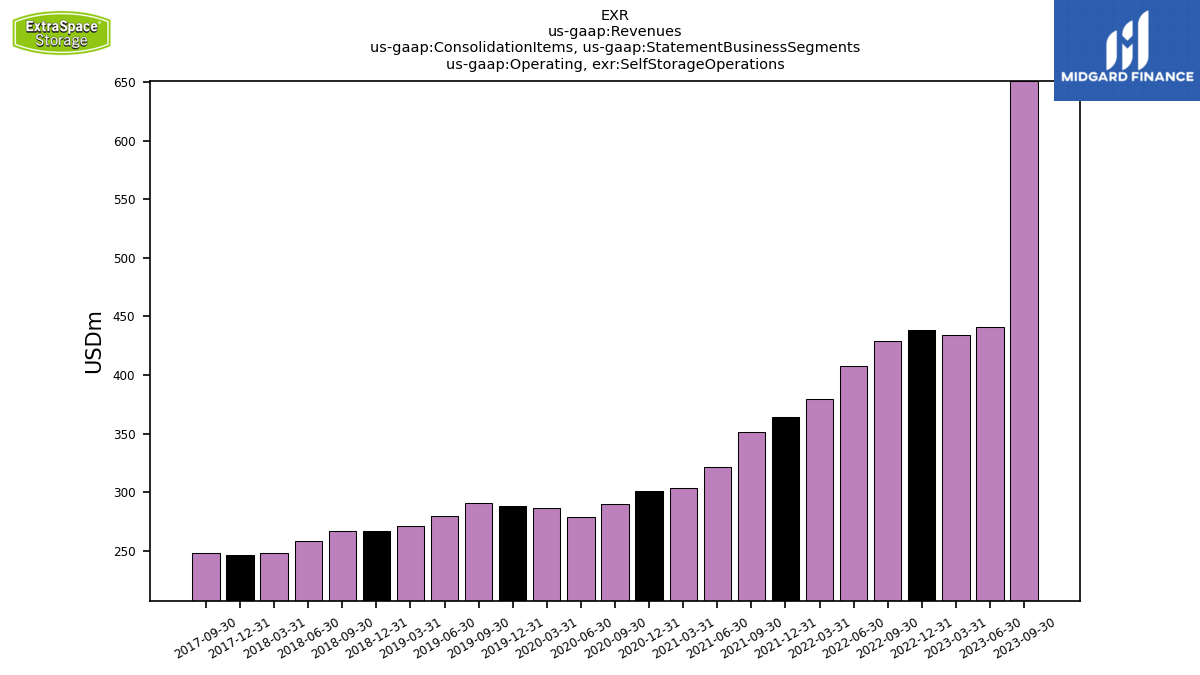
| Operating, Self Storage Operations | 696.98 | 650.89 | 440.75 | 433.96 | 438.10 | 428.79 | 408.04 | 379.81 | 364.54 | 351.36 | 321.50 | 303.59 | 301.08 | 290.42 | 279.31 | 286.70 | 288.67 | 290.92 | 279.58 | 271.00 | 266.60 | 266.73 | 258.13 | 247.89 | 246.35 | 248.59 | NA | NA | |
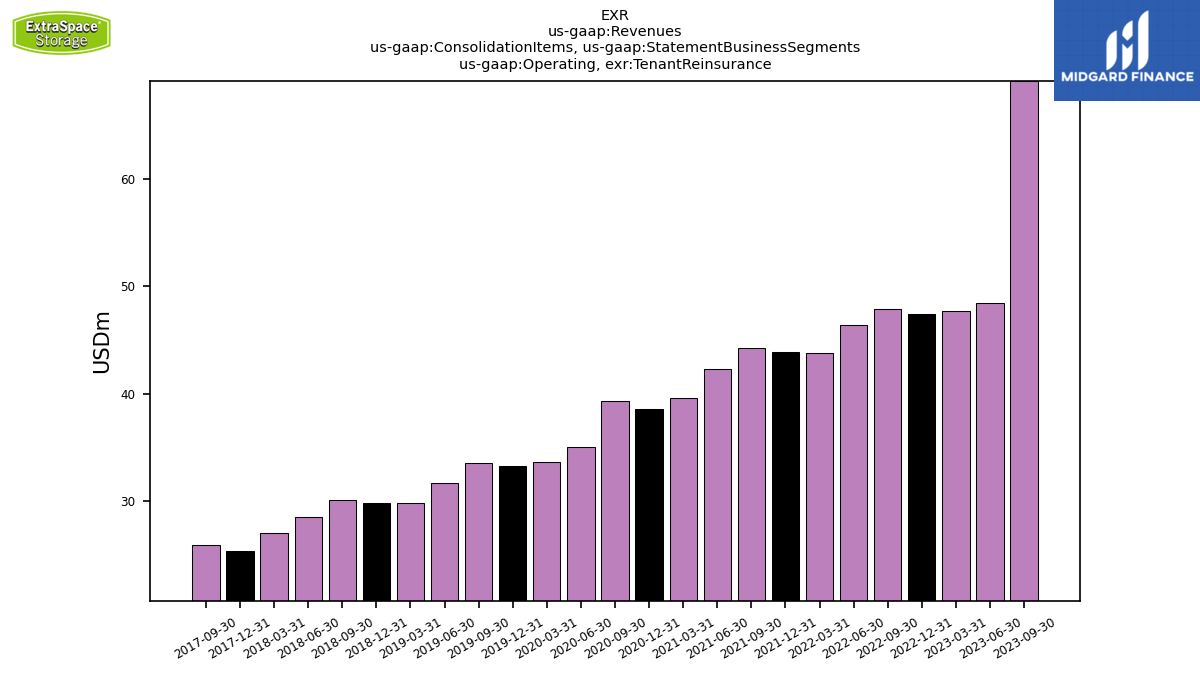
| Operating, Tenant Reinsurance | 70.42 | 69.13 | 48.43 | 47.70 | 47.44 | 47.87 | 46.43 | 43.80 | 43.90 | 44.26 | 42.33 | 39.62 | 38.58 | 39.29 | 35.08 | 33.61 | 33.30 | 33.59 | 31.70 | 29.80 | 29.85 | 30.11 | 28.52 | 27.03 | 25.35 | 25.88 | NA | NA | |
| Revenue From Contract With Customer Excluding Assessed Tax | 30.38 | 28.02 | 22.21 | 21.38 | 21.18 | 22.25 | 20.52 | 19.96 | 18.94 | 16.88 | 14.80 | 15.64 | 13.83 | 13.31 | 12.86 | 12.14 | 335.80 | 13.00 | 12.32 | 10.75 | 307.35 | 10.12 | 10.16 | 10.56 | 281.84 | 284.16 | 276.00 | 263.01 |