
| 2023-07-31 | 2023-04-30 | 2023-01-31 | 2022-10-31 | 2022-07-31 | 2022-04-30 | 2022-01-31 | 2021-10-31 | 2021-07-31 | 2021-04-30 | 2021-01-31 | 2020-10-31 | 2020-07-31 | 2020-04-30 | 2020-01-31 | 2019-10-31 | 2019-07-31 | 2019-04-30 | 2019-01-31 | 2018-10-31 | 2018-07-31 | 2018-04-30 | 2018-01-31 | 2017-10-31 | 2017-07-31 | ||
|---|---|---|---|---|---|---|---|---|---|---|---|---|---|---|---|---|---|---|---|---|---|---|---|---|---|---|
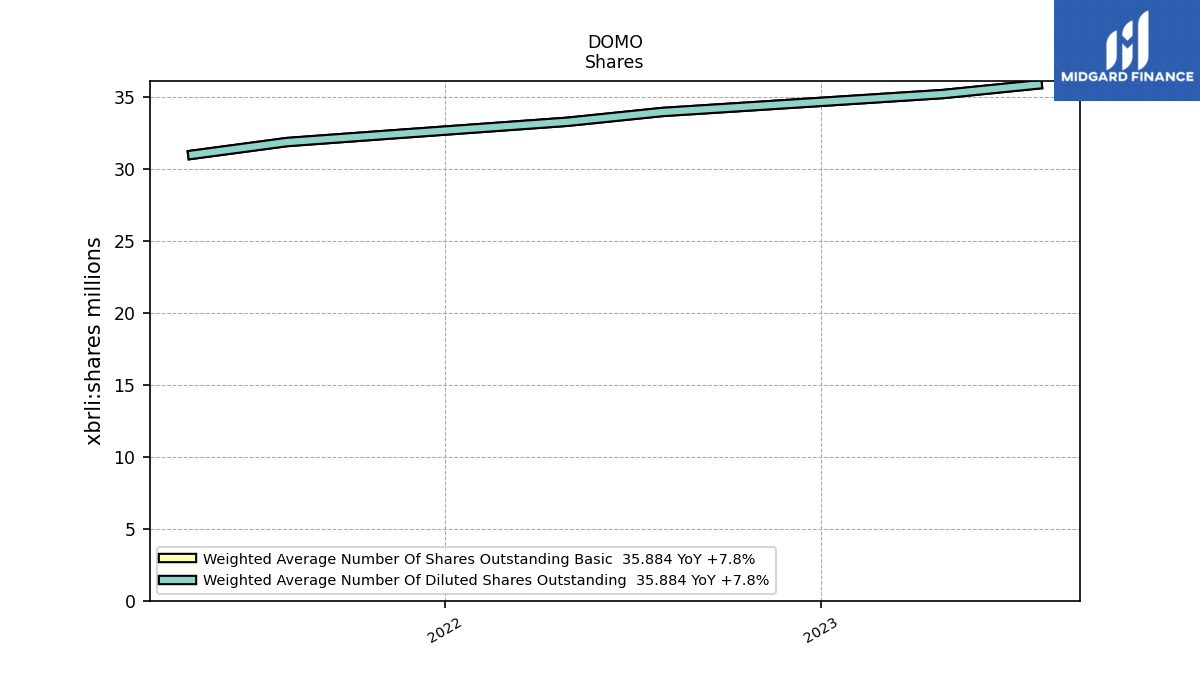
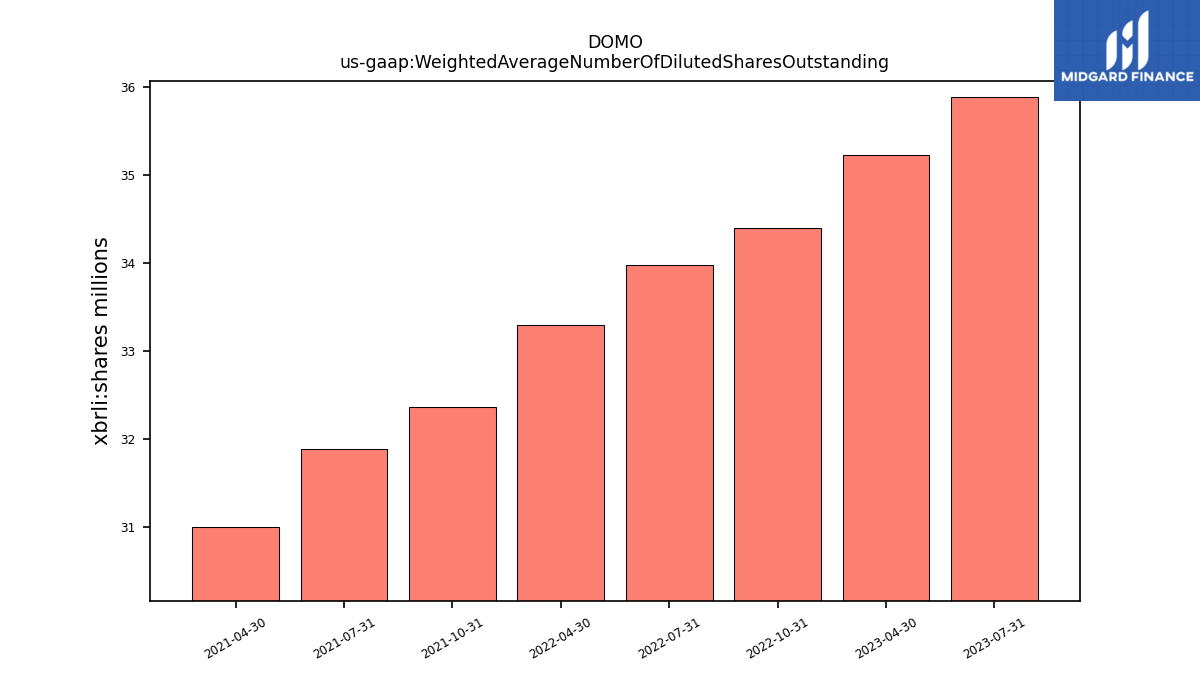
| Weighted Average Number Of Diluted Shares Outstanding | 35.88 | 35.22 | NA | 34.39 | 33.97 | 33.30 | NA | 32.36 | 31.88 | 31.00 | NA | NA | NA | NA | NA | NA | NA | NA | NA | NA | NA | NA | NA | NA | NA | |
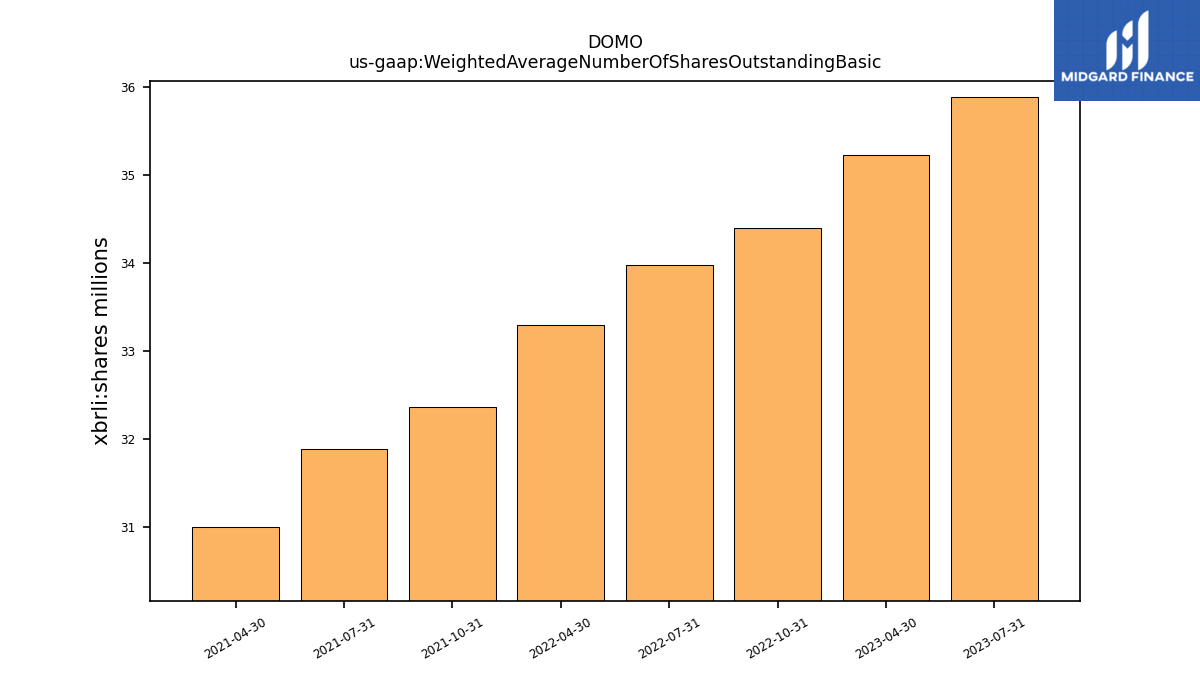
| Weighted Average Number Of Shares Outstanding Basic | 35.88 | 35.22 | NA | 34.39 | 33.97 | 33.30 | NA | 32.36 | 31.88 | 31.00 | NA | NA | NA | NA | NA | NA | NA | NA | NA | NA | NA | NA | NA | NA | NA | |
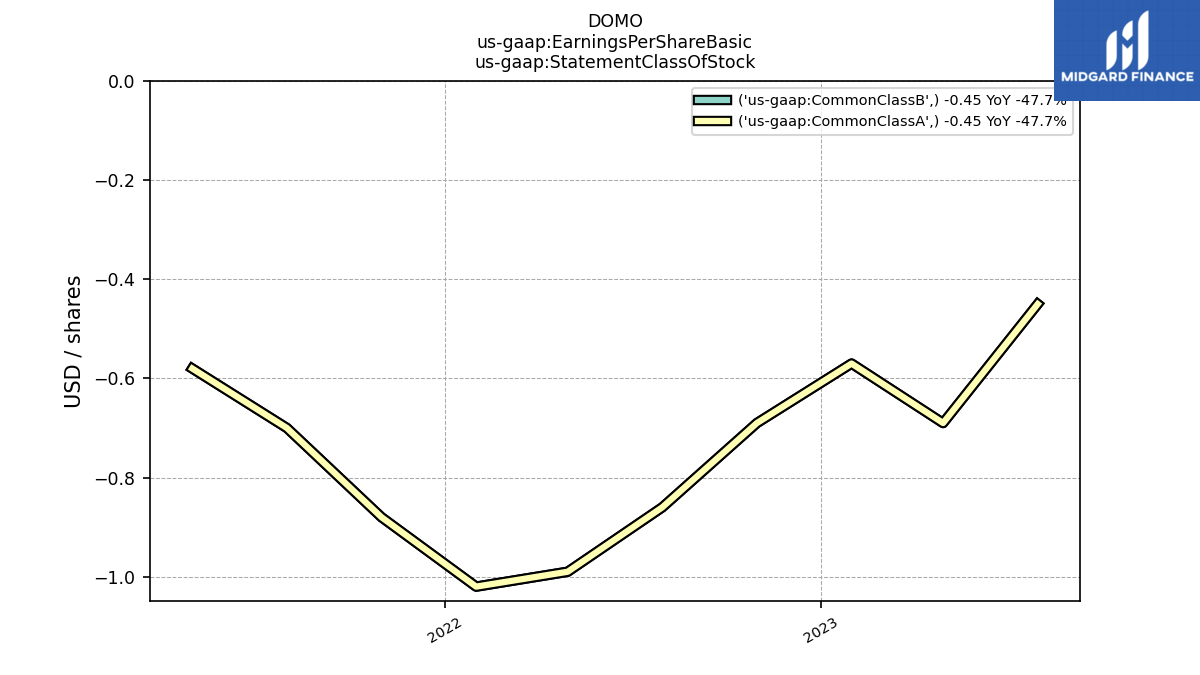
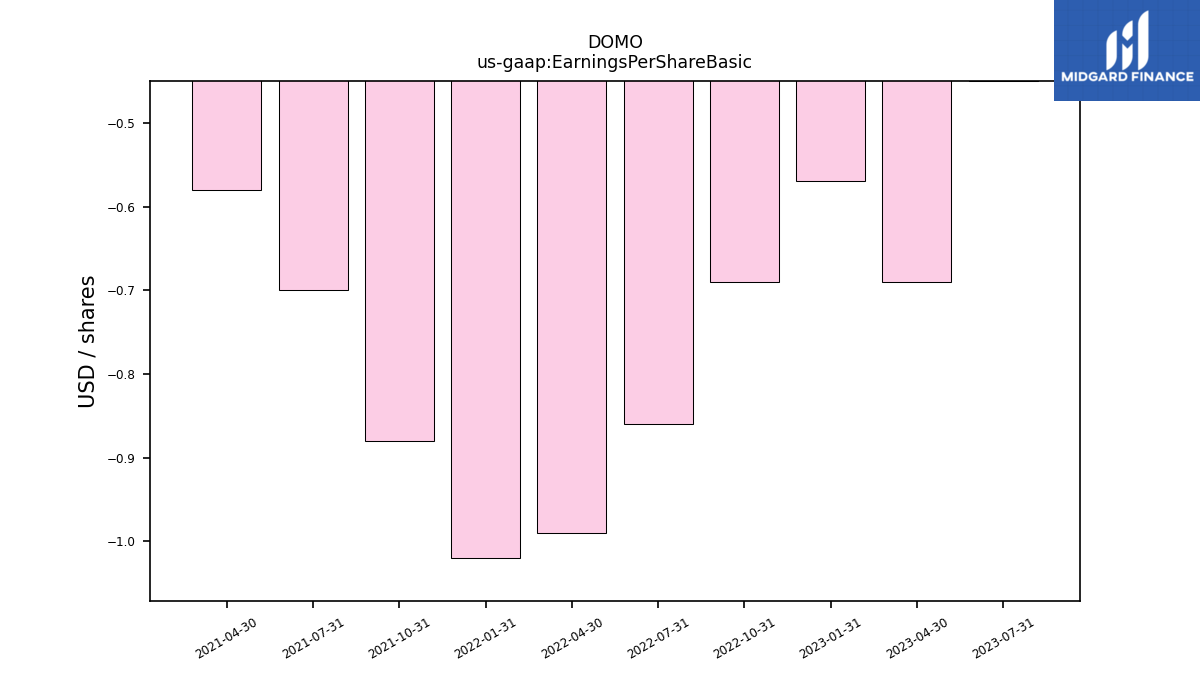
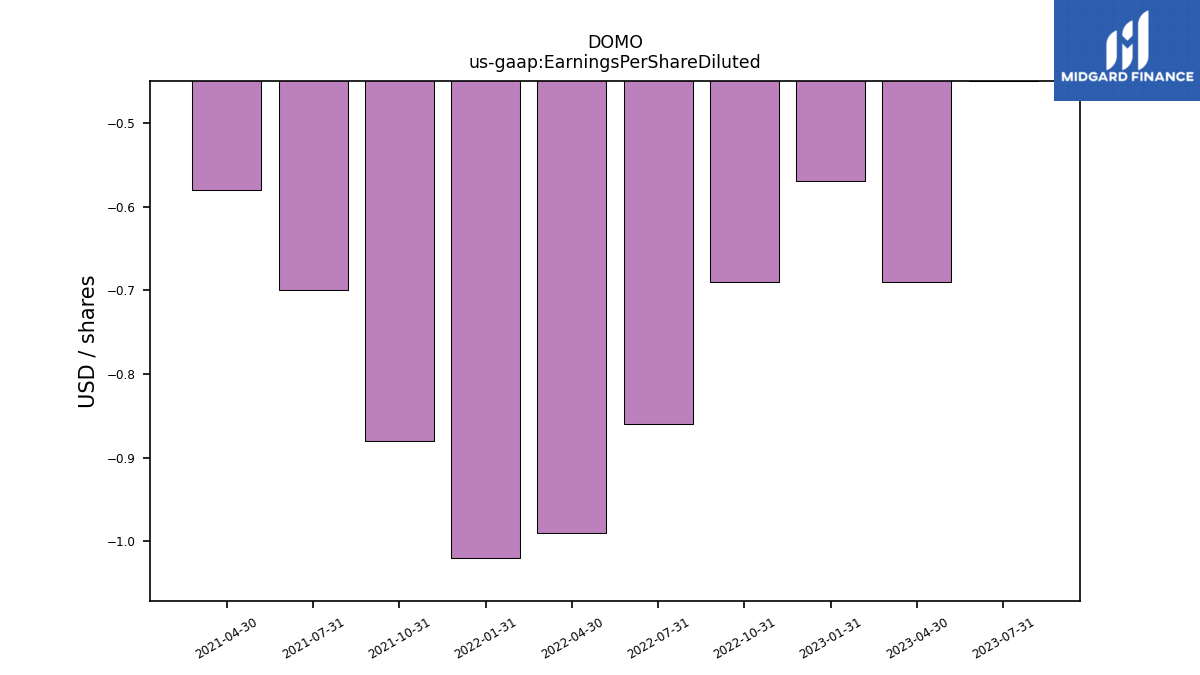
| Earnings Per Share Basic | -0.45 | -0.69 | -0.57 | -0.69 | -0.86 | -0.99 | -1.02 | -0.88 | -0.70 | -0.58 | NA | NA | NA | NA | NA | NA | NA | NA | NA | NA | NA | NA | NA | NA | NA | |
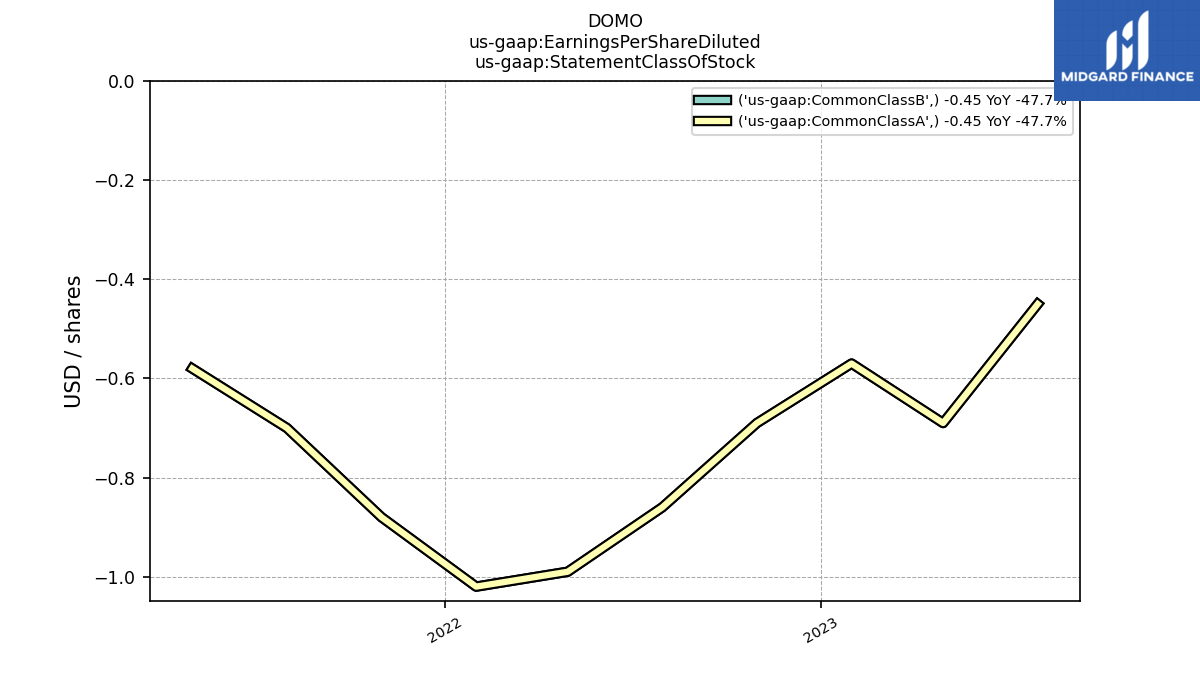
| Earnings Per Share Diluted | -0.45 | -0.69 | -0.57 | -0.69 | -0.86 | -0.99 | -1.02 | -0.88 | -0.70 | -0.58 | NA | NA | NA | NA | NA | NA | NA | NA | NA | NA | NA | NA | NA | NA | NA |
| 2023-07-31 | 2023-04-30 | 2023-01-31 | 2022-10-31 | 2022-07-31 | 2022-04-30 | 2022-01-31 | 2021-10-31 | 2021-07-31 | 2021-04-30 | 2021-01-31 | 2020-10-31 | 2020-07-31 | 2020-04-30 | 2020-01-31 | 2019-10-31 | 2019-07-31 | 2019-04-30 | 2019-01-31 | 2018-10-31 | 2018-07-31 | 2018-04-30 | 2018-01-31 | 2017-10-31 | 2017-07-31 | ||
|---|---|---|---|---|---|---|---|---|---|---|---|---|---|---|---|---|---|---|---|---|---|---|---|---|---|---|
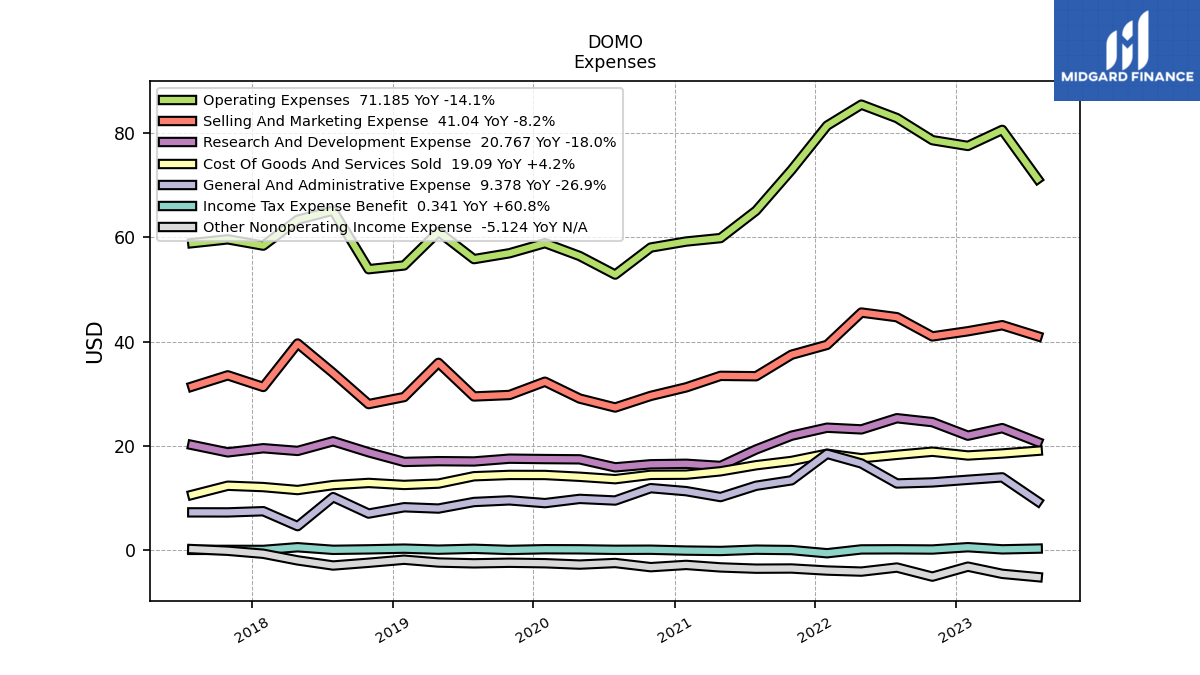
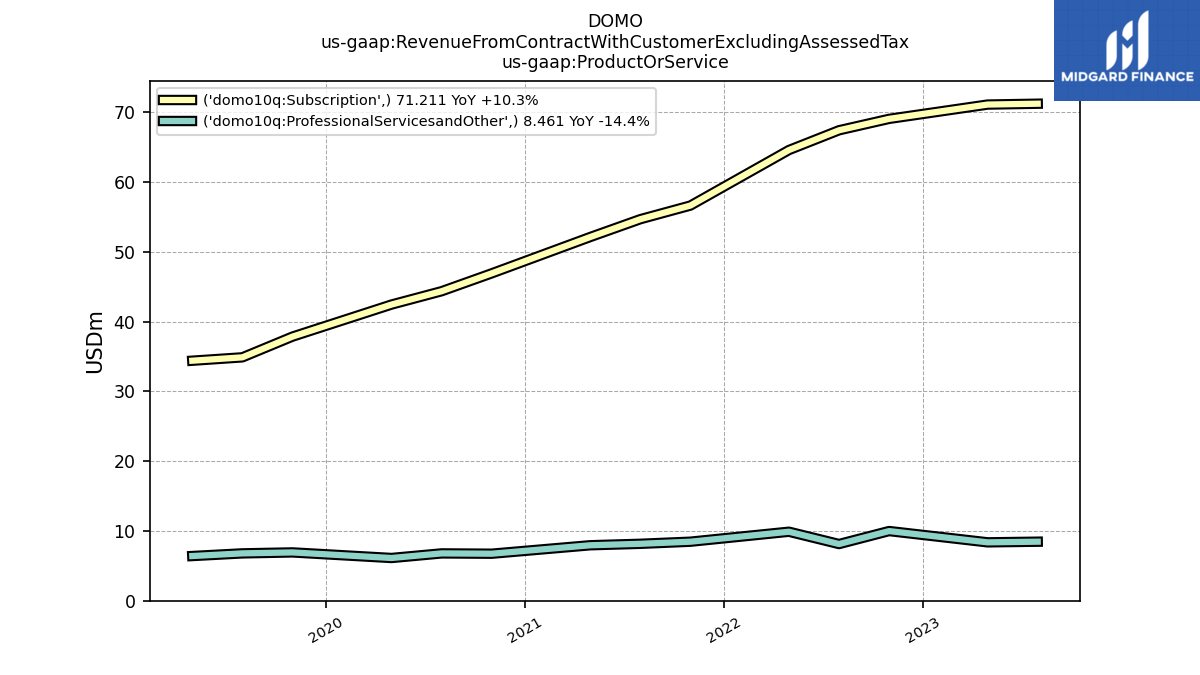
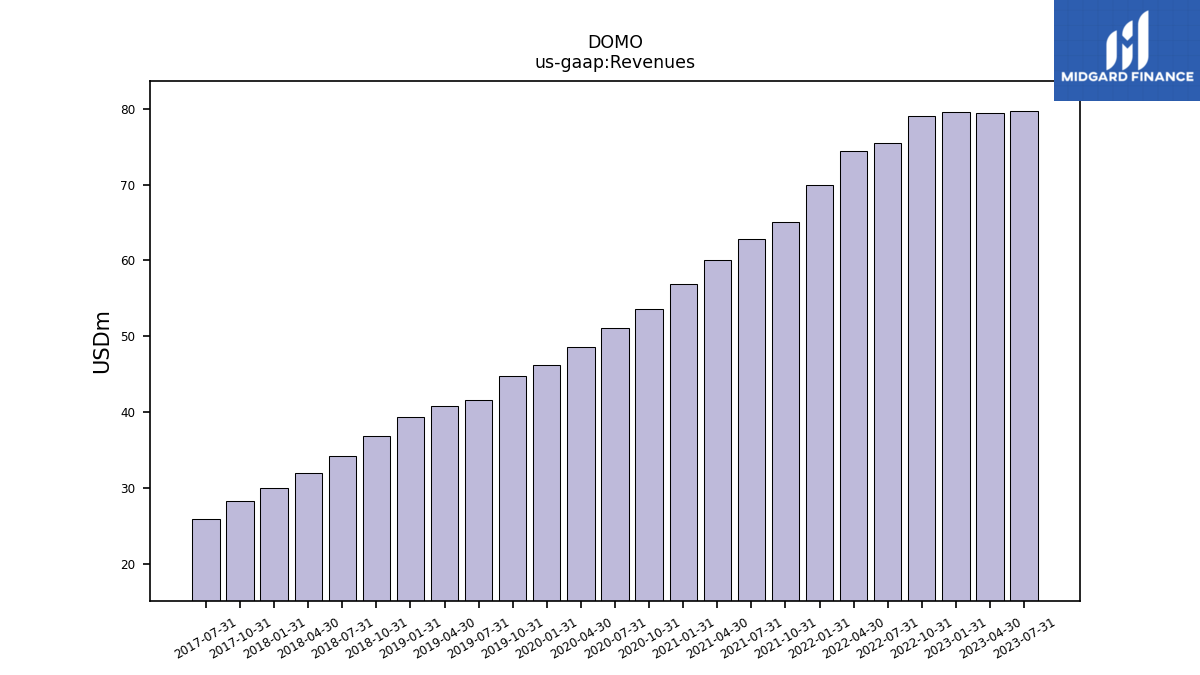
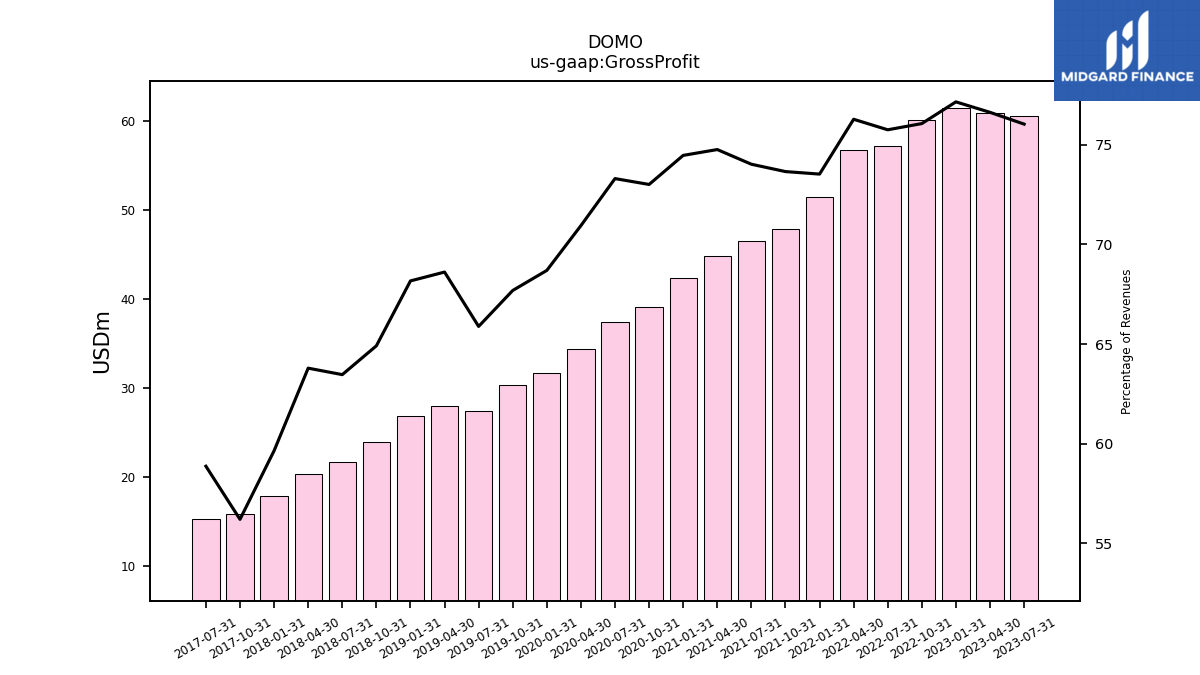
| Revenue From Contract With Customer Excluding Assessed Tax | 79.67 | 79.46 | 79.62 | 79.03 | 75.53 | 74.46 | 69.99 | 65.08 | 62.83 | 60.06 | 56.84 | 53.65 | 51.13 | 48.56 | 46.17 | 44.77 | 41.66 | 40.80 | 39.41 | 36.84 | 34.27 | 31.95 | 30.07 | 28.30 | 25.90 | |
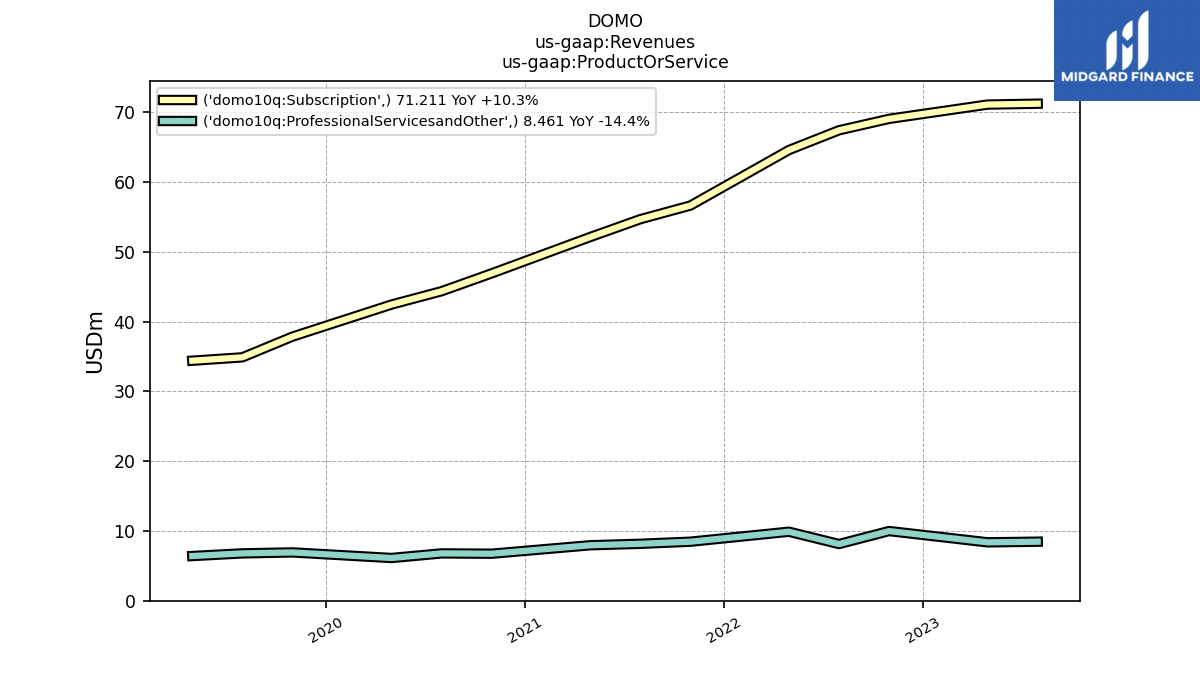
| Revenues | 79.67 | 79.46 | 79.62 | 79.03 | 75.53 | 74.46 | 69.99 | 65.08 | 62.83 | 60.06 | 56.84 | 53.65 | 51.13 | 48.56 | 46.17 | 44.77 | 41.66 | 40.80 | 39.41 | 36.84 | 34.27 | 31.95 | 30.07 | 28.30 | 25.90 | |
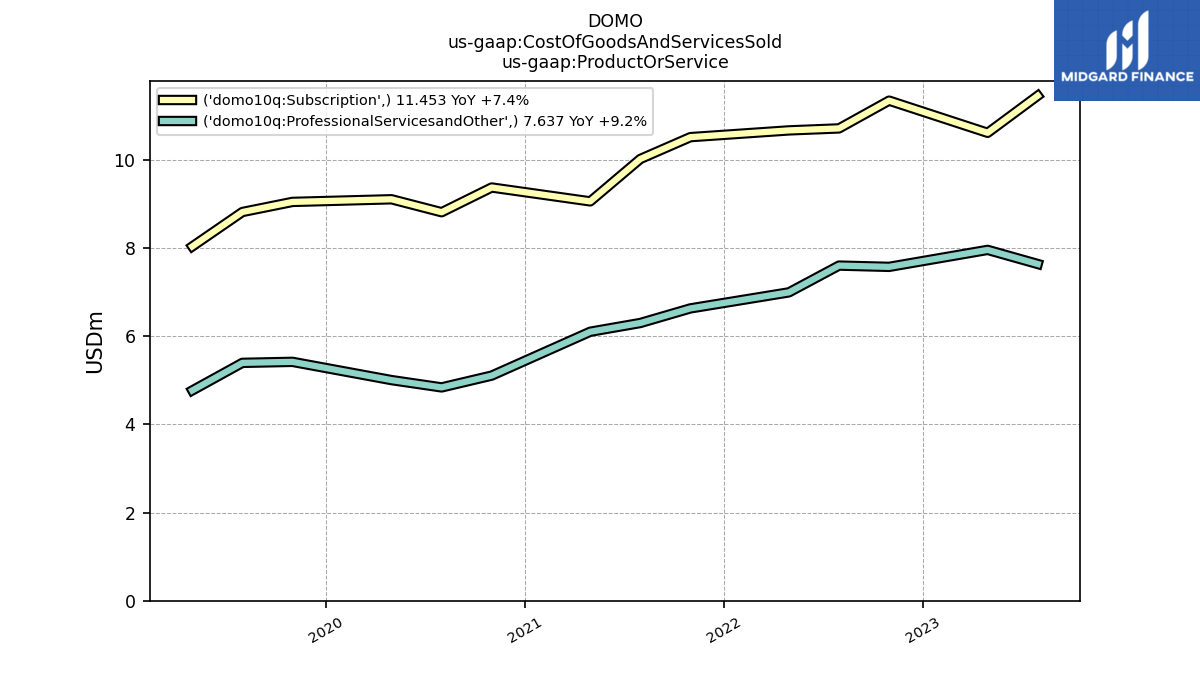
| Cost Of Goods And Services Sold | 19.09 | 18.57 | 18.19 | 18.91 | 18.31 | 17.66 | 18.53 | 17.14 | 16.32 | 15.16 | 14.51 | 14.48 | 13.65 | 14.11 | 14.45 | 14.46 | 14.21 | 12.80 | 12.54 | 12.93 | 12.52 | 11.57 | 12.13 | 12.39 | 10.65 | |
| Gross Profit | 60.58 | 60.89 | 61.43 | 60.11 | 57.22 | 56.80 | 51.47 | 47.94 | 46.51 | 44.90 | 42.33 | 39.17 | 37.48 | 34.45 | 31.72 | 30.30 | 27.45 | 27.99 | 26.86 | 23.92 | 21.75 | 20.38 | 17.94 | 15.91 | 15.25 | |
| Operating Expenses | 71.19 | 80.60 | 77.52 | 78.62 | 82.86 | 85.44 | 81.41 | 72.92 | 65.10 | 59.86 | 59.20 | 58.04 | 52.86 | 56.42 | 58.89 | 56.95 | 55.82 | 61.06 | 54.61 | 53.89 | 65.13 | 63.36 | 58.41 | 59.62 | 58.89 | |
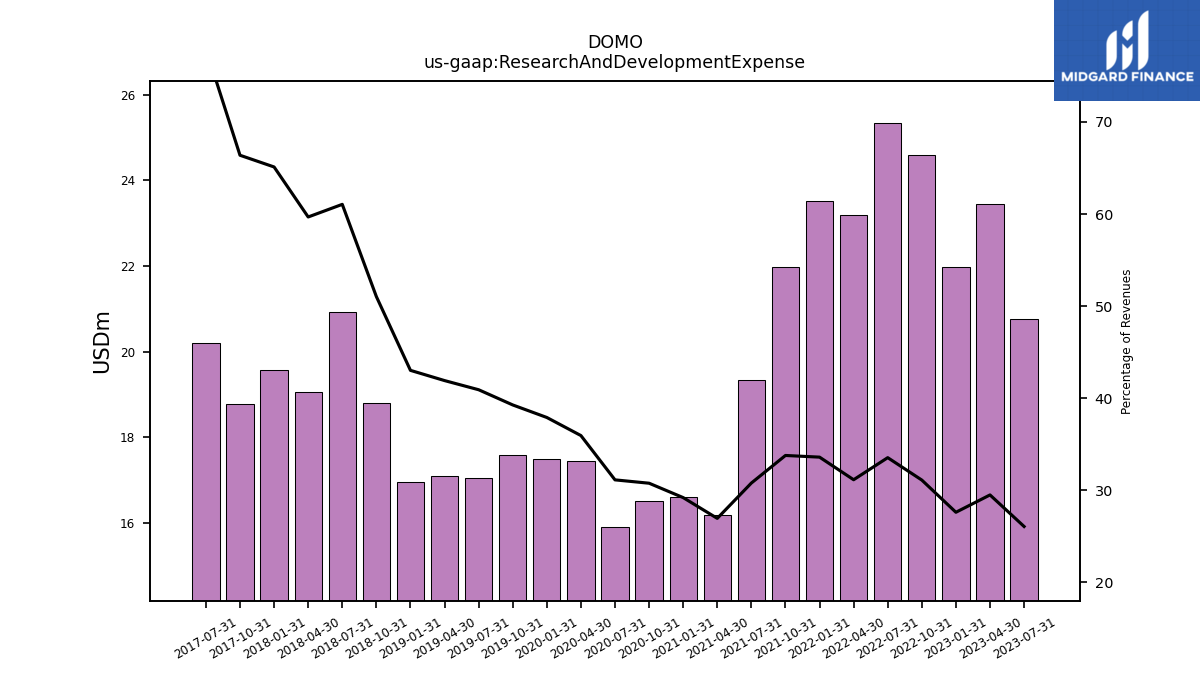
| Research And Development Expense | 20.77 | 23.43 | 21.98 | 24.58 | 25.33 | 23.19 | 23.52 | 21.98 | 19.34 | 16.19 | 16.60 | 16.50 | 15.92 | 17.45 | 17.50 | 17.58 | 17.05 | 17.10 | 16.95 | 18.80 | 20.92 | 19.06 | 19.58 | 18.79 | 20.19 | |
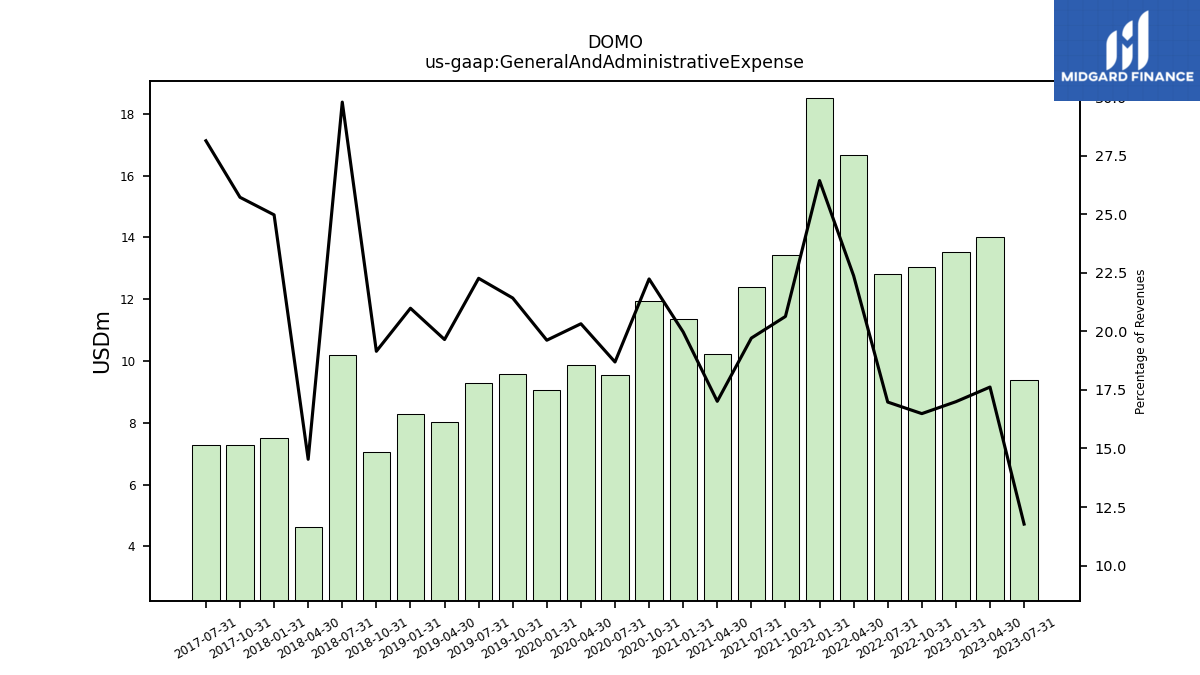
| General And Administrative Expense | 9.38 | 14.00 | 13.53 | 13.03 | 12.82 | 16.66 | 18.50 | 13.43 | 12.38 | 10.22 | 11.35 | 11.93 | 9.56 | 9.87 | 9.06 | 9.59 | 9.28 | 8.02 | 8.27 | 7.05 | 10.21 | 4.64 | 7.51 | 7.28 | 7.29 | |
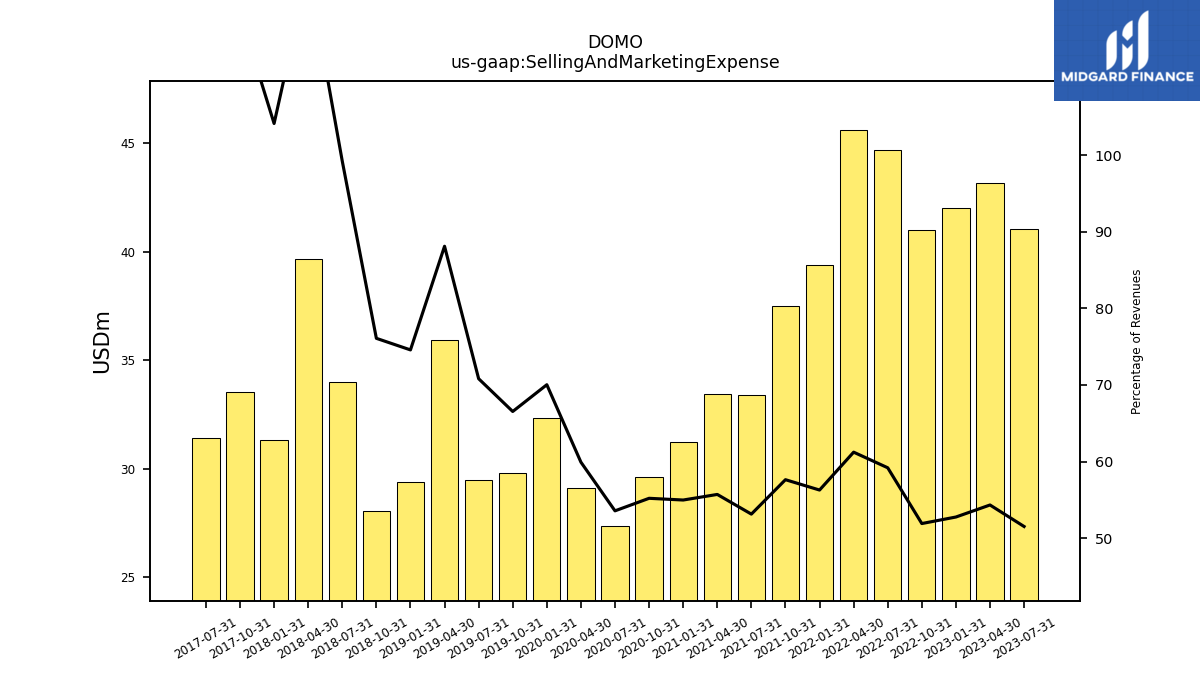
| Selling And Marketing Expense | 41.04 | 43.16 | 42.00 | 41.01 | 44.70 | 45.59 | 39.39 | 37.50 | 33.38 | 33.45 | 31.25 | 29.61 | 27.38 | 29.10 | 32.33 | 29.78 | 29.50 | 35.95 | 29.39 | 28.03 | 34.00 | 39.66 | 31.32 | 33.55 | 31.41 | |
| Operating Income Loss | -10.60 | -19.71 | -16.09 | -18.51 | -25.64 | -28.64 | -29.94 | -24.98 | -18.60 | -14.95 | -16.87 | -18.88 | -15.38 | -21.97 | -27.17 | -26.65 | -28.37 | -33.07 | -27.75 | -29.98 | -43.38 | -42.98 | -40.47 | -43.71 | -43.64 | |
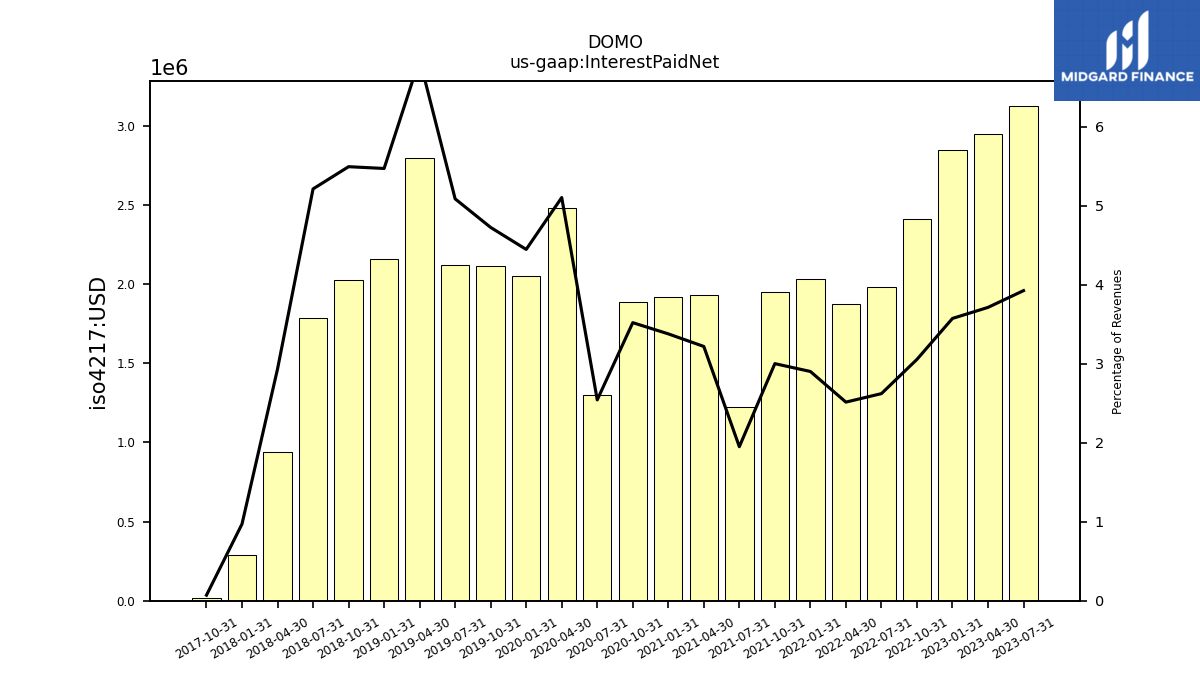
| Interest Paid Net | 3.13 | 2.95 | 2.85 | 2.41 | 1.98 | 1.87 | 2.03 | 1.95 | 1.23 | 1.93 | 1.92 | 1.89 | 1.30 | 2.48 | 2.05 | 2.12 | 2.12 | 2.80 | 2.16 | 2.02 | 1.79 | 0.94 | 0.29 | 0.02 | NA | |
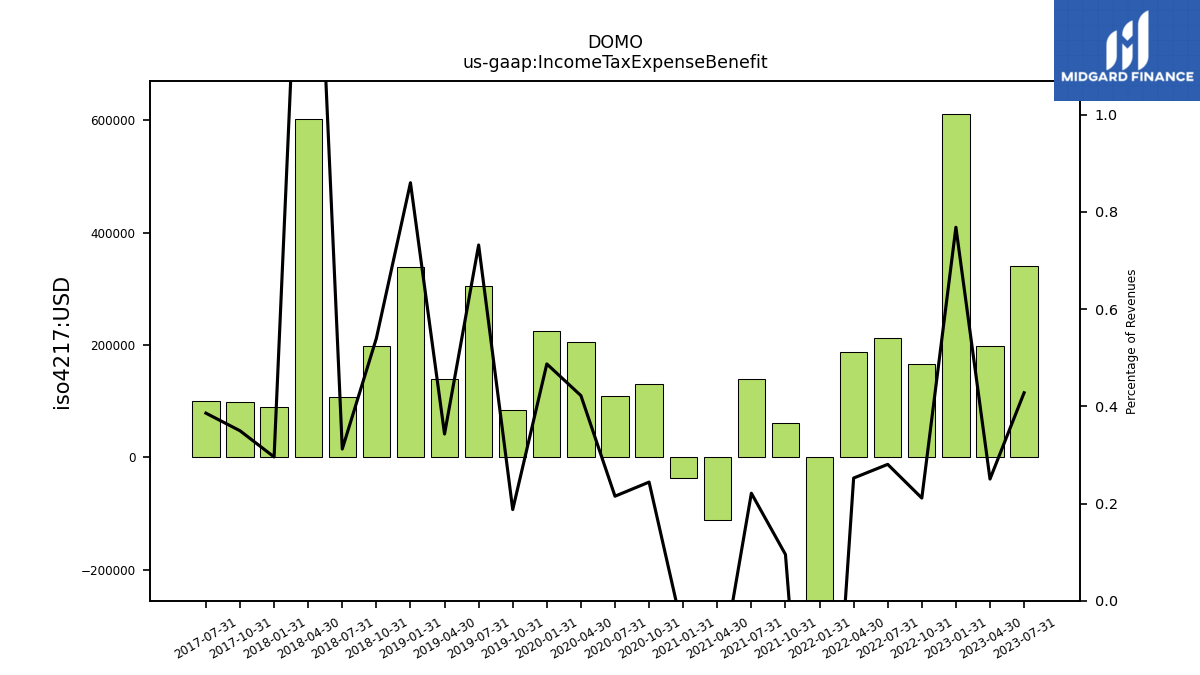
| Income Tax Expense Benefit | 0.34 | 0.20 | 0.61 | 0.17 | 0.21 | 0.19 | -0.55 | 0.06 | 0.14 | -0.11 | -0.04 | 0.13 | 0.11 | 0.20 | 0.23 | 0.08 | 0.30 | 0.14 | 0.34 | 0.20 | 0.11 | 0.60 | 0.09 | 0.10 | 0.10 | |
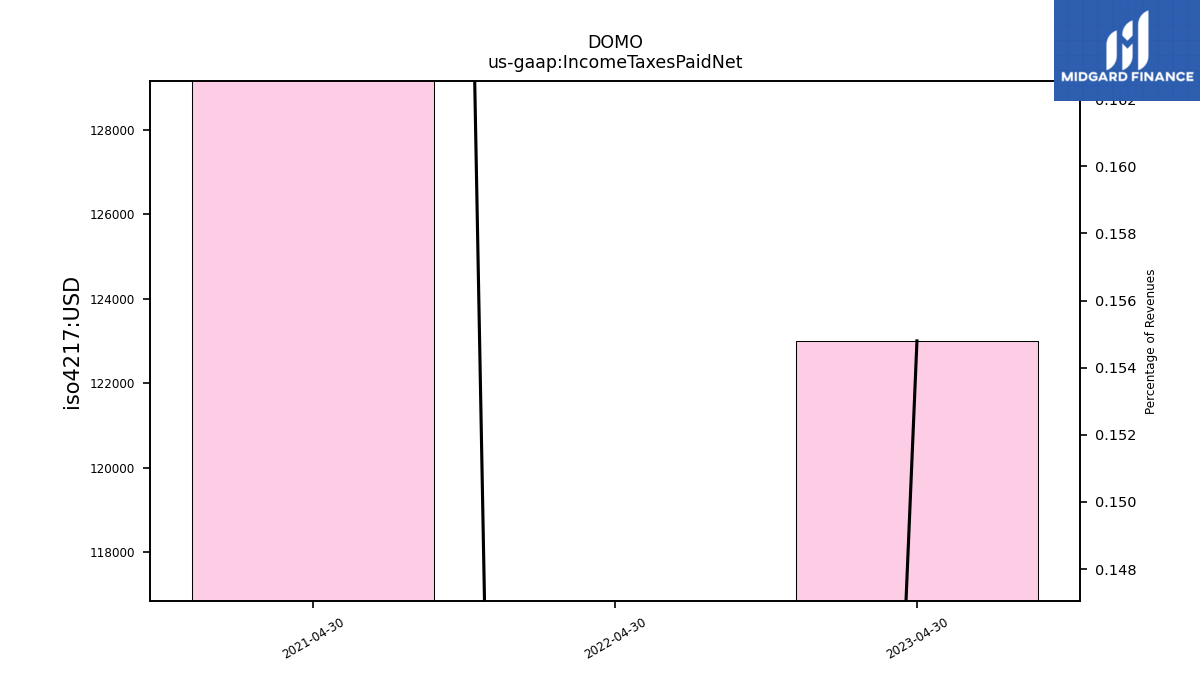
| Income Taxes Paid Net | NA | 0.12 | NA | NA | NA | -0.04 | NA | NA | NA | 0.25 | NA | NA | NA | NA | NA | NA | NA | NA | NA | NA | NA | NA | NA | NA | NA | |
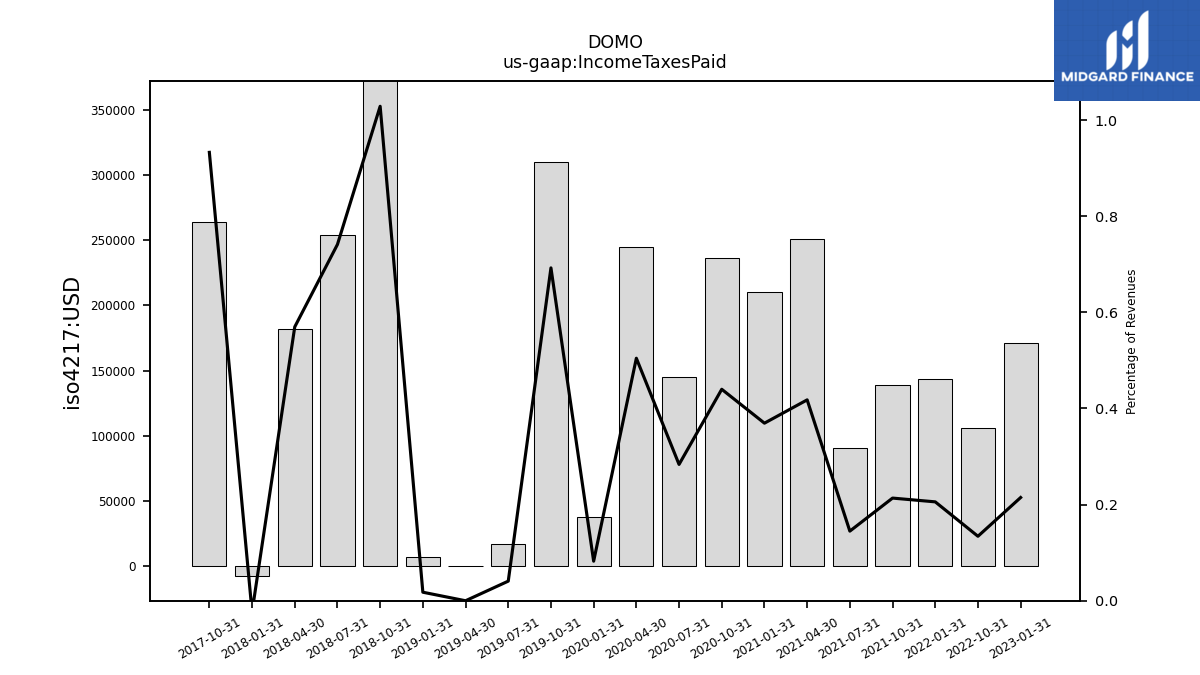
| Income Taxes Paid | NA | NA | 0.17 | 0.11 | NA | NA | 0.14 | 0.14 | 0.09 | 0.25 | 0.21 | 0.24 | 0.14 | 0.24 | 0.04 | 0.31 | 0.02 | 0.00 | 0.01 | 0.38 | 0.25 | 0.18 | -0.01 | 0.26 | NA | |
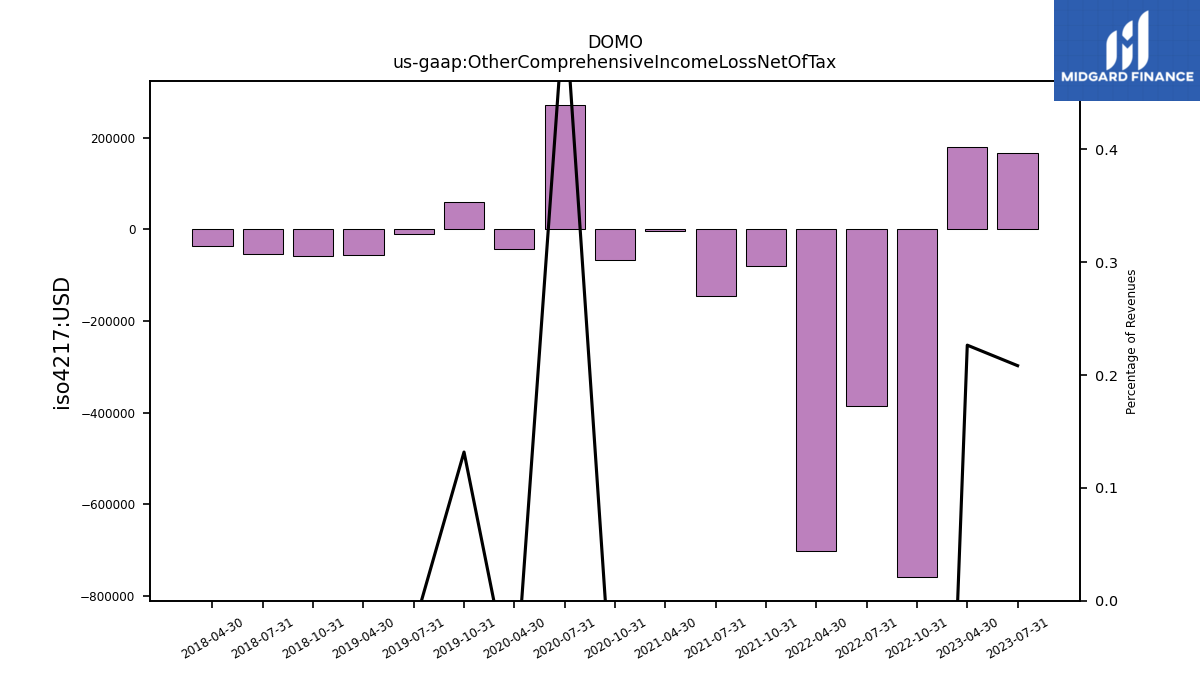
| Other Comprehensive Income Loss Net Of Tax | 0.17 | 0.18 | NA | -0.76 | -0.39 | -0.70 | NA | -0.08 | -0.15 | -0.00 | NA | -0.07 | 0.27 | -0.04 | NA | 0.06 | -0.01 | -0.06 | NA | -0.06 | -0.06 | -0.04 | NA | NA | NA | |
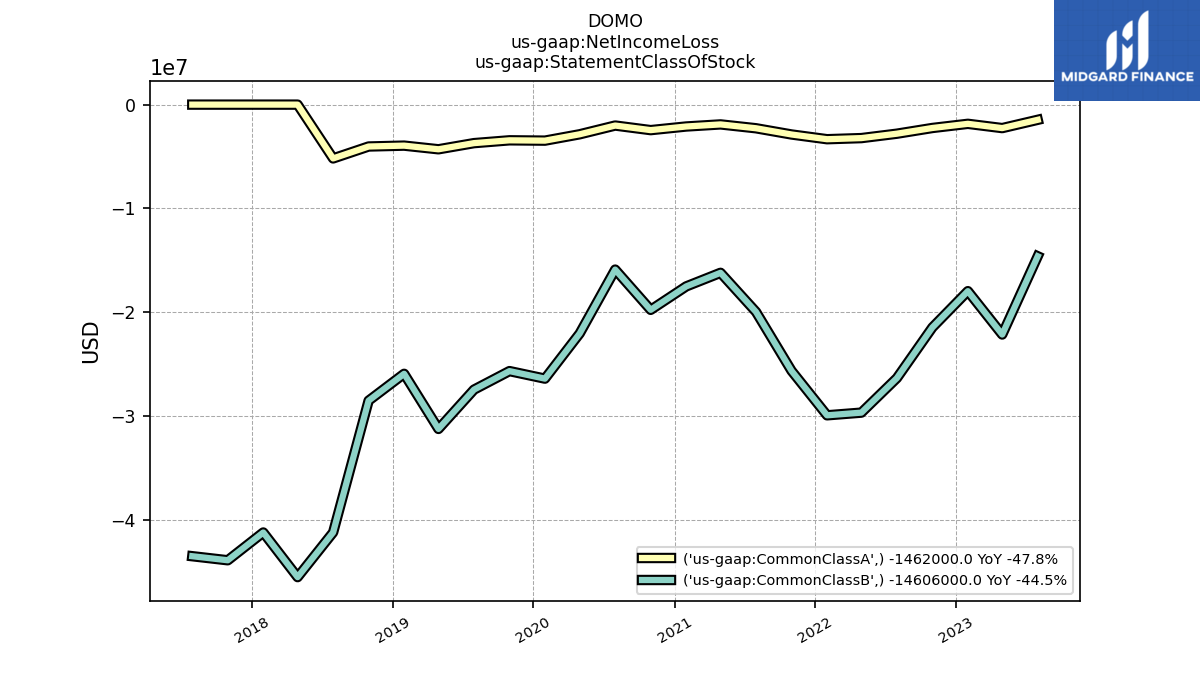
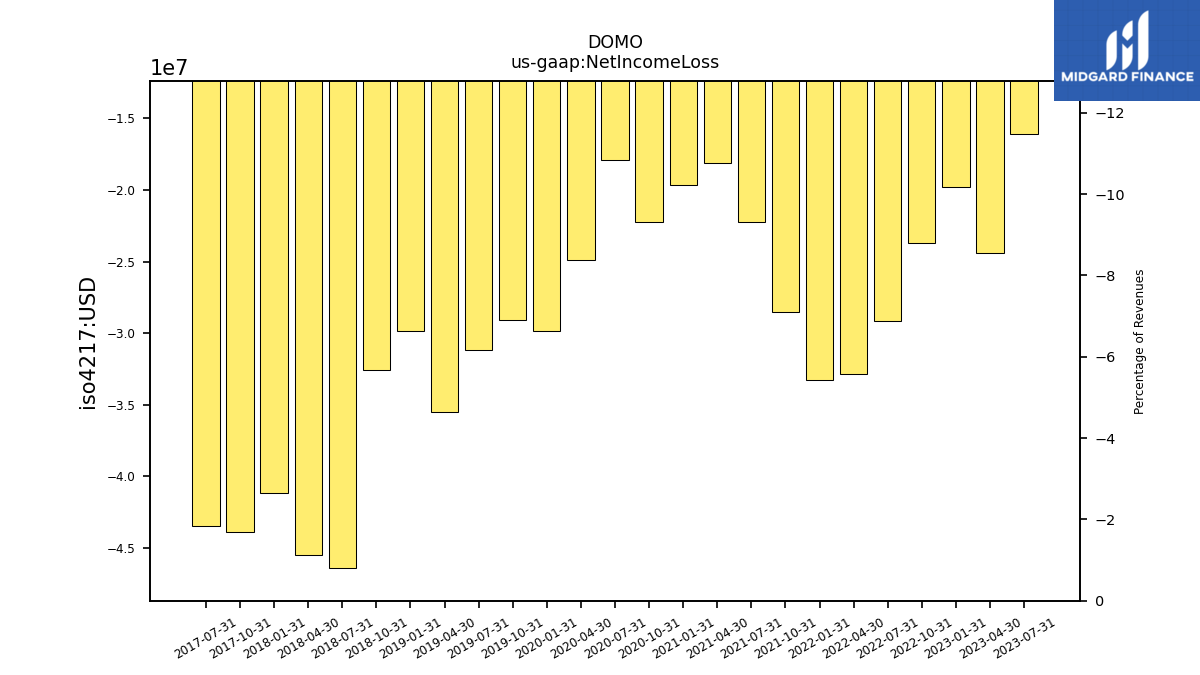
| Net Income Loss | -16.07 | -24.40 | -19.81 | -23.71 | -29.14 | -32.89 | -33.25 | -28.51 | -22.24 | -18.10 | -19.61 | -22.22 | -17.90 | -24.89 | -29.86 | -29.10 | -31.16 | -35.54 | -29.87 | -32.55 | -46.38 | -45.51 | -41.21 | -43.88 | -43.49 | |
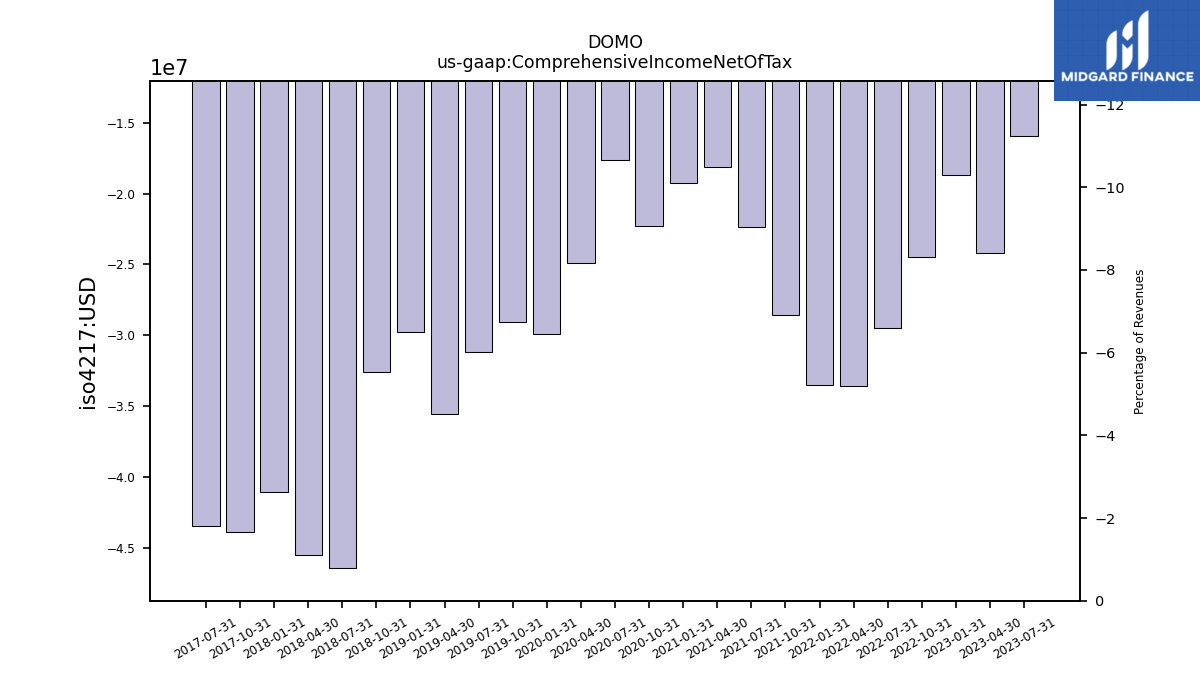
| Comprehensive Income Net Of Tax | -15.90 | -24.22 | -18.68 | -24.47 | -29.52 | -33.59 | -33.51 | -28.59 | -22.39 | -18.11 | -19.29 | -22.29 | -17.63 | -24.94 | -29.90 | -29.04 | -31.17 | -35.59 | -29.79 | -32.60 | -46.44 | -45.54 | -41.10 | -43.90 | -43.45 |
| 2023-07-31 | 2023-04-30 | 2023-01-31 | 2022-10-31 | 2022-07-31 | 2022-04-30 | 2022-01-31 | 2021-10-31 | 2021-07-31 | 2021-04-30 | 2021-01-31 | 2020-10-31 | 2020-07-31 | 2020-04-30 | 2020-01-31 | 2019-10-31 | 2019-07-31 | 2019-04-30 | 2019-01-31 | 2018-10-31 | 2018-07-31 | 2018-04-30 | 2018-01-31 | 2017-10-31 | 2017-07-31 | ||
|---|---|---|---|---|---|---|---|---|---|---|---|---|---|---|---|---|---|---|---|---|---|---|---|---|---|---|
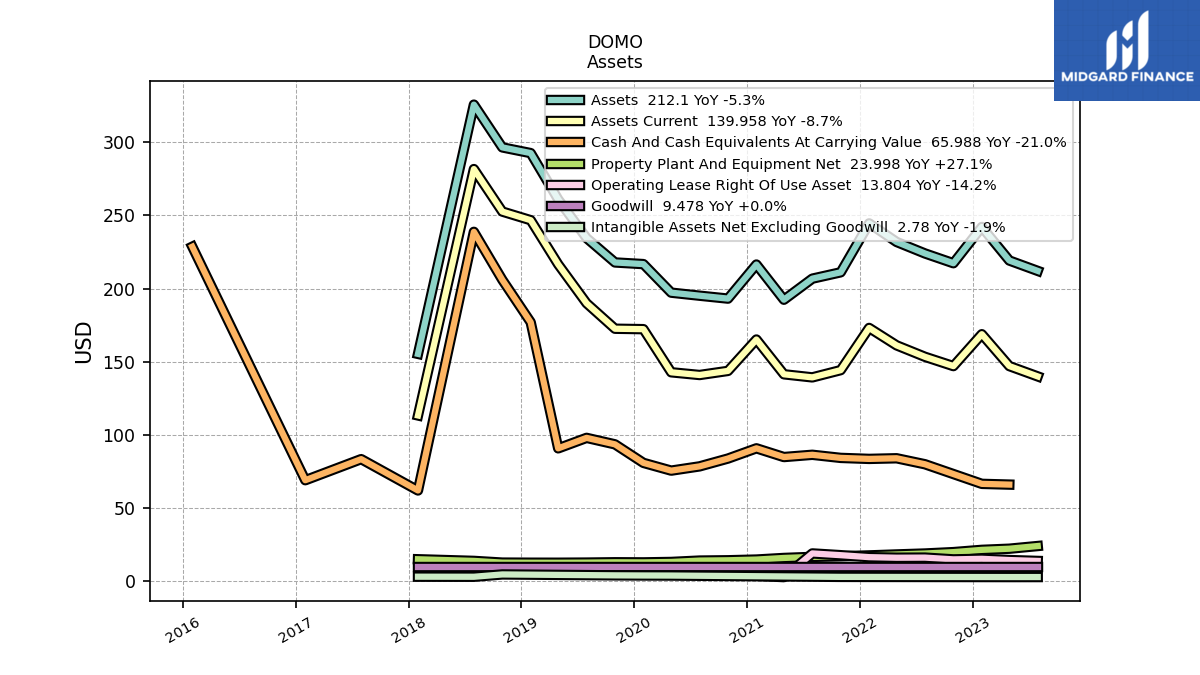
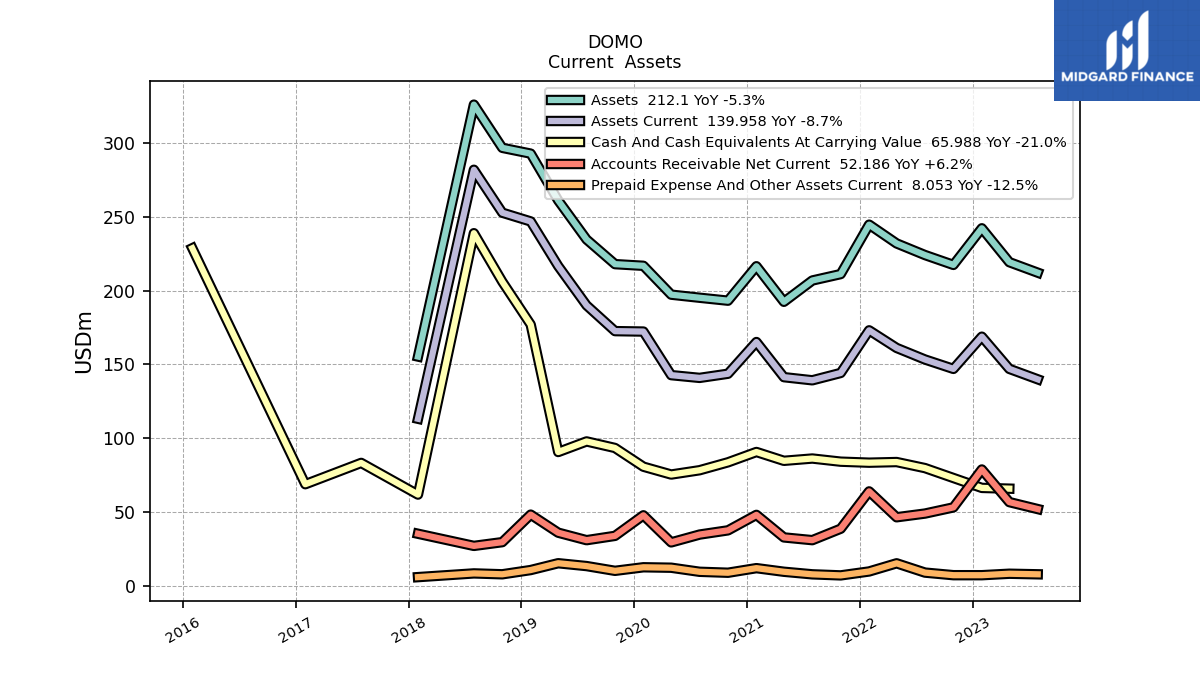
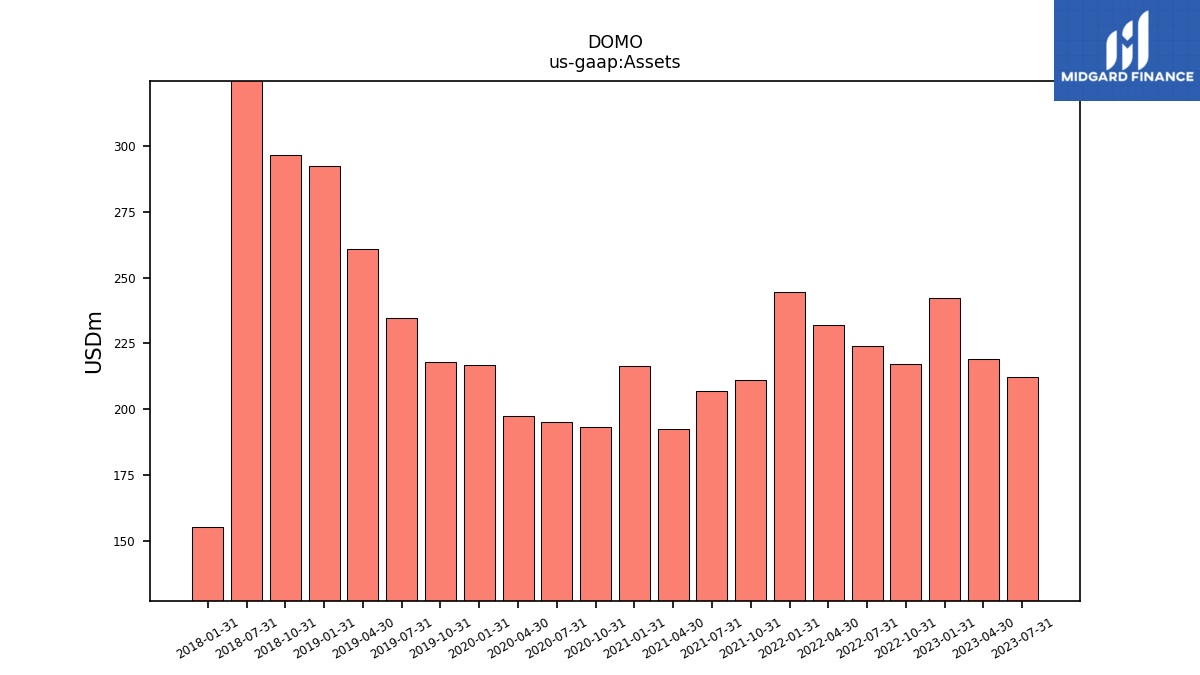
| Assets | 212.10 | 219.19 | 242.12 | 217.33 | 224.01 | 231.87 | 244.59 | 211.13 | 206.80 | 192.38 | 216.44 | 193.14 | 195.13 | 197.22 | 216.74 | 217.86 | 234.53 | 260.98 | 292.63 | 296.53 | 325.77 | NA | 155.35 | NA | NA | |
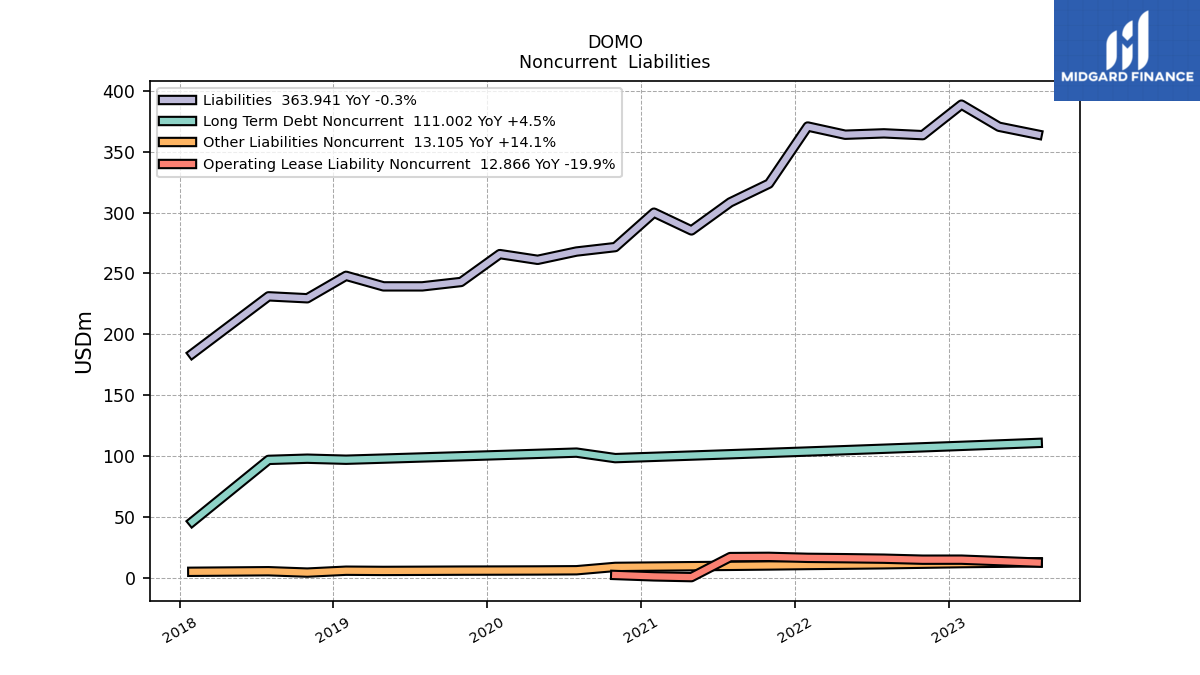
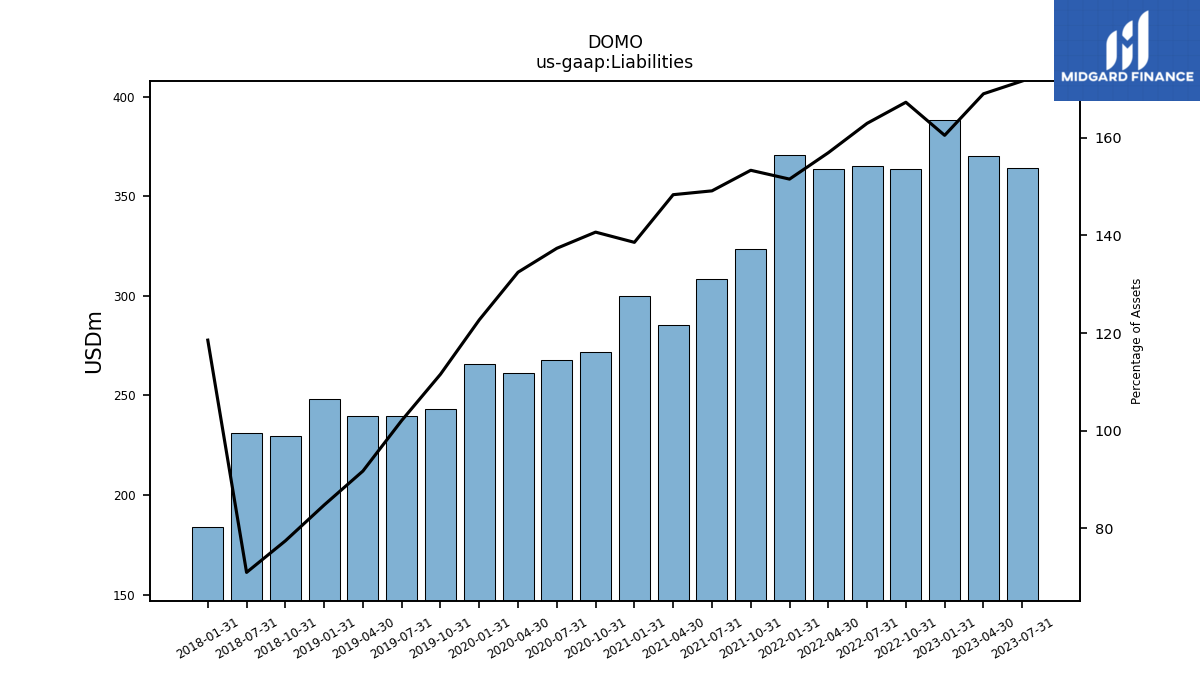
| Liabilities | 363.94 | 370.36 | 388.52 | 363.46 | 364.95 | 363.83 | 370.57 | 323.69 | 308.33 | 285.32 | 299.90 | 271.66 | 268.00 | 261.21 | 265.92 | 243.04 | 239.44 | 239.43 | 248.10 | 229.67 | 231.27 | NA | 184.16 | NA | NA | |
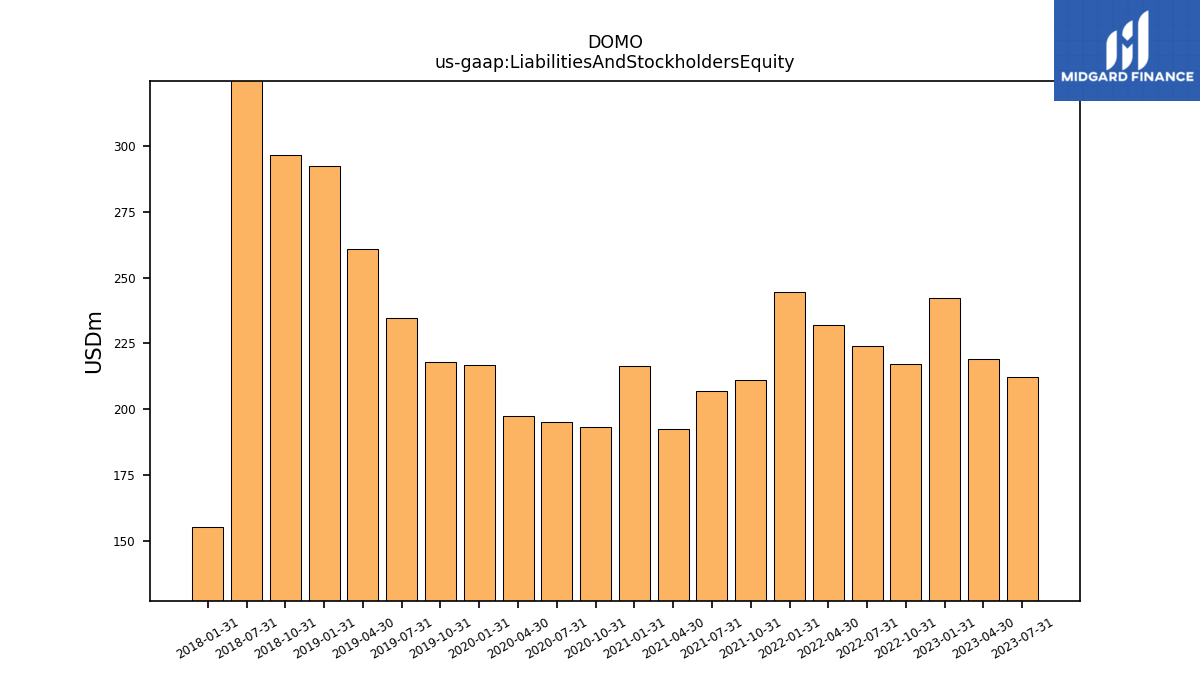
| Liabilities And Stockholders Equity | 212.10 | 219.19 | 242.12 | 217.33 | 224.01 | 231.87 | 244.59 | 211.13 | 206.80 | 192.38 | 216.44 | 193.14 | 195.13 | 197.22 | 216.74 | 217.86 | 234.53 | 260.98 | 292.63 | 296.53 | 325.77 | NA | 155.35 | NA | NA | |
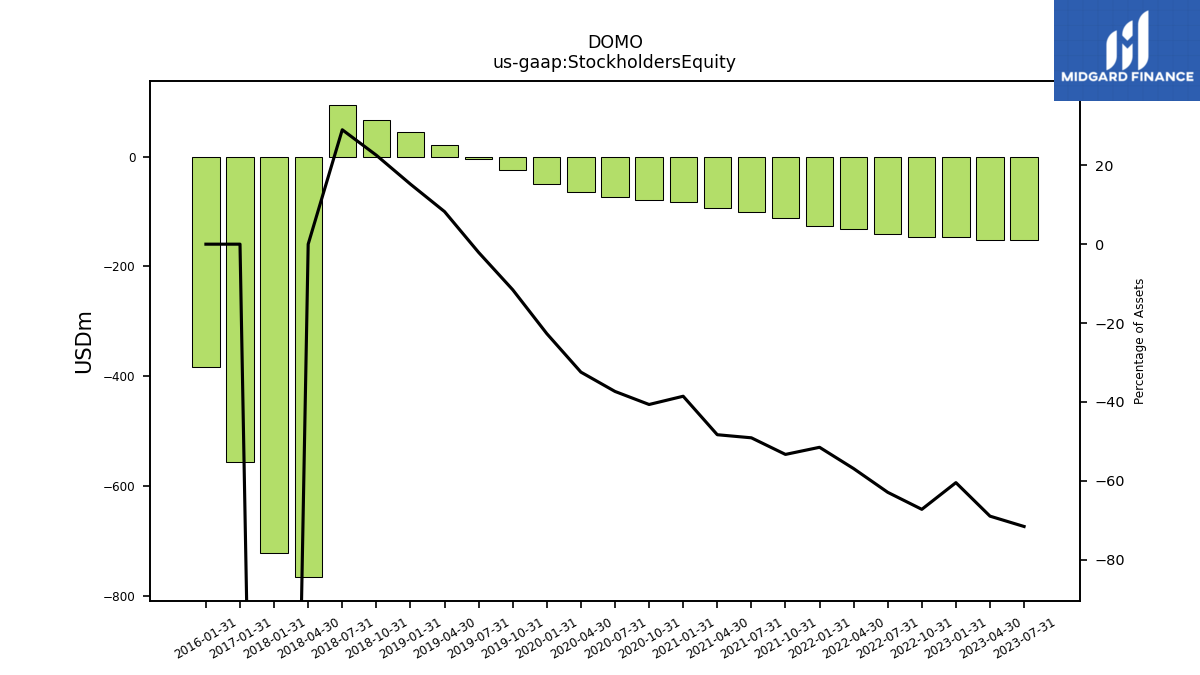
| Stockholders Equity | -151.84 | -151.17 | -146.40 | -146.12 | -140.95 | -131.95 | -125.98 | -112.56 | -101.54 | -92.95 | -83.46 | -78.52 | -72.87 | -63.99 | -49.18 | -25.18 | -4.91 | 21.55 | 44.53 | 66.86 | 94.50 | -765.22 | -721.96 | NA | NA |
| 2023-07-31 | 2023-04-30 | 2023-01-31 | 2022-10-31 | 2022-07-31 | 2022-04-30 | 2022-01-31 | 2021-10-31 | 2021-07-31 | 2021-04-30 | 2021-01-31 | 2020-10-31 | 2020-07-31 | 2020-04-30 | 2020-01-31 | 2019-10-31 | 2019-07-31 | 2019-04-30 | 2019-01-31 | 2018-10-31 | 2018-07-31 | 2018-04-30 | 2018-01-31 | 2017-10-31 | 2017-07-31 | ||
|---|---|---|---|---|---|---|---|---|---|---|---|---|---|---|---|---|---|---|---|---|---|---|---|---|---|---|
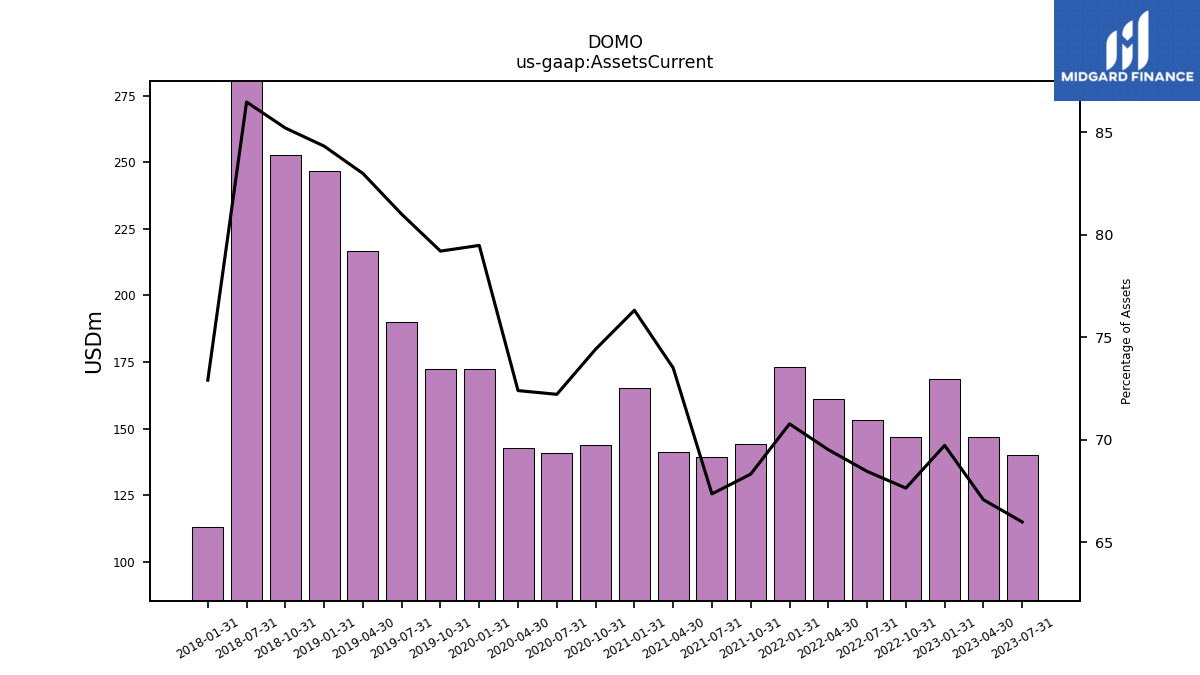
| Assets Current | 139.96 | 147.01 | 168.81 | 147.00 | 153.35 | 161.18 | 173.10 | 144.25 | 139.29 | 141.40 | 165.18 | 143.73 | 140.91 | 142.78 | 172.26 | 172.55 | 189.97 | 216.58 | 246.75 | 252.66 | 281.71 | NA | 113.26 | NA | NA | |
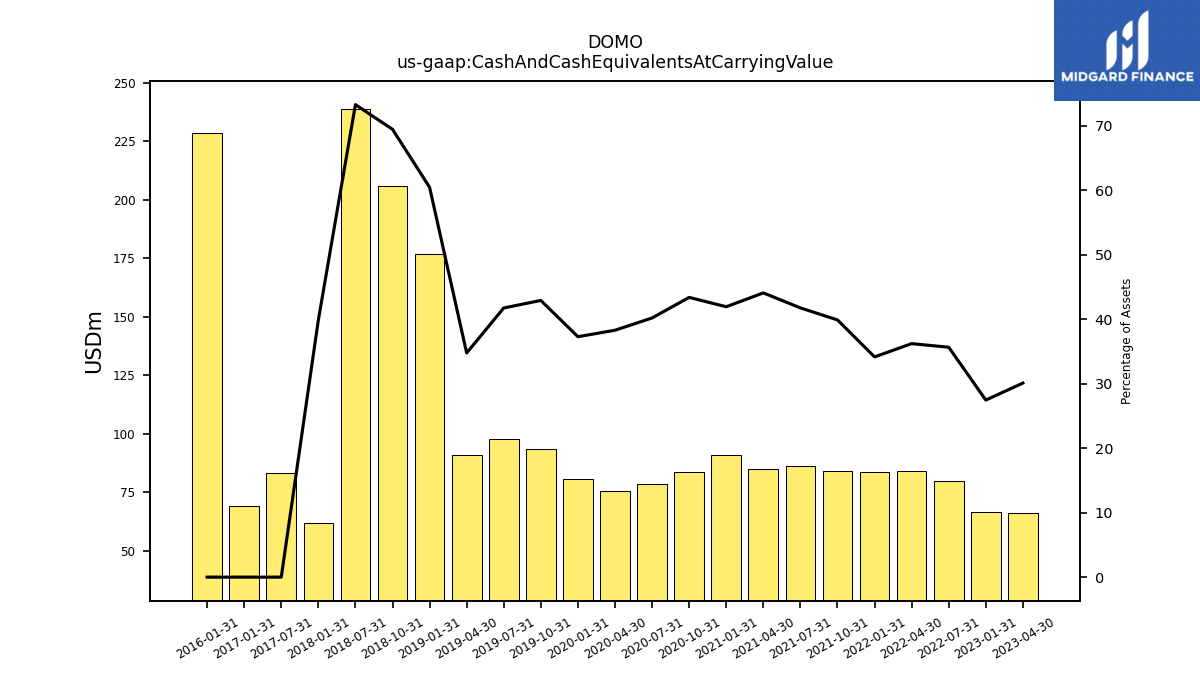
| Cash And Cash Equivalents At Carrying Value | NA | 65.99 | 66.50 | NA | 79.89 | 84.00 | 83.56 | 84.25 | 86.37 | 84.83 | 90.79 | 83.81 | 78.45 | 75.54 | 80.84 | 93.51 | 97.94 | 90.76 | 176.97 | 206.00 | 238.80 | NA | 61.97 | NA | 83.41 | |
| Cash Cash Equivalents Restricted Cash And Restricted Cash Equivalents | 63.85 | 65.99 | 66.50 | 71.08 | 79.89 | 84.00 | 83.56 | 84.25 | 86.37 | 84.83 | 90.79 | 83.81 | 78.45 | 75.54 | 80.84 | 93.51 | 97.94 | 90.76 | 176.97 | 206.00 | 238.80 | 71.94 | 61.97 | NA | NA | |
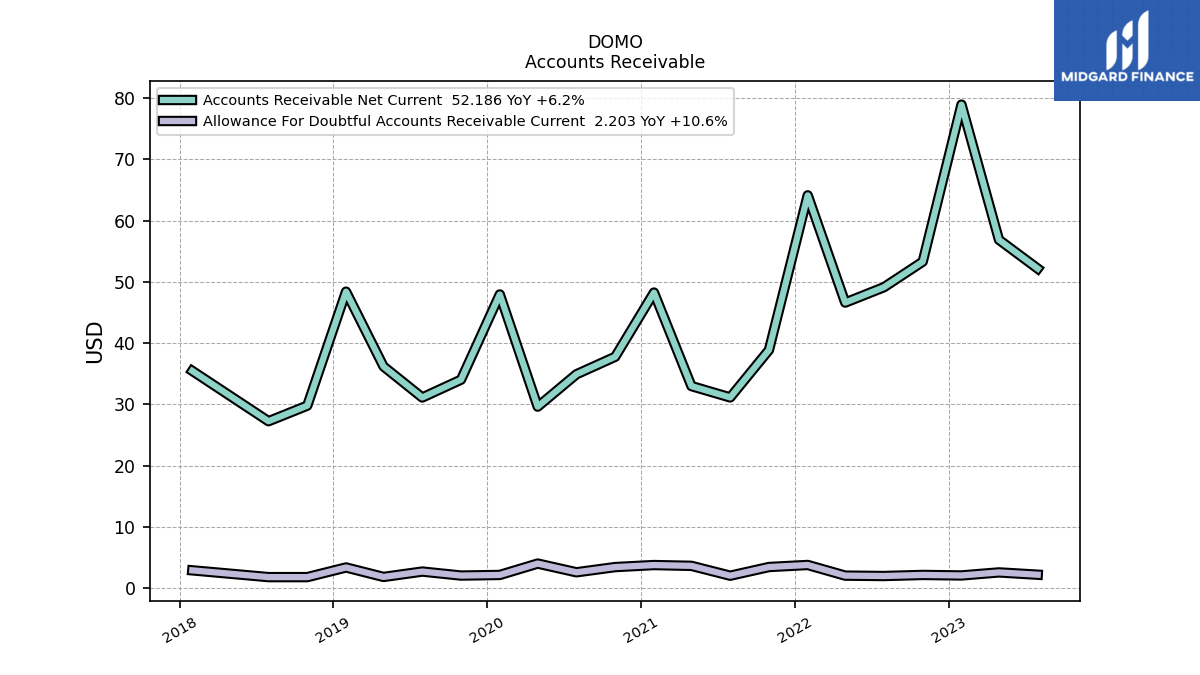
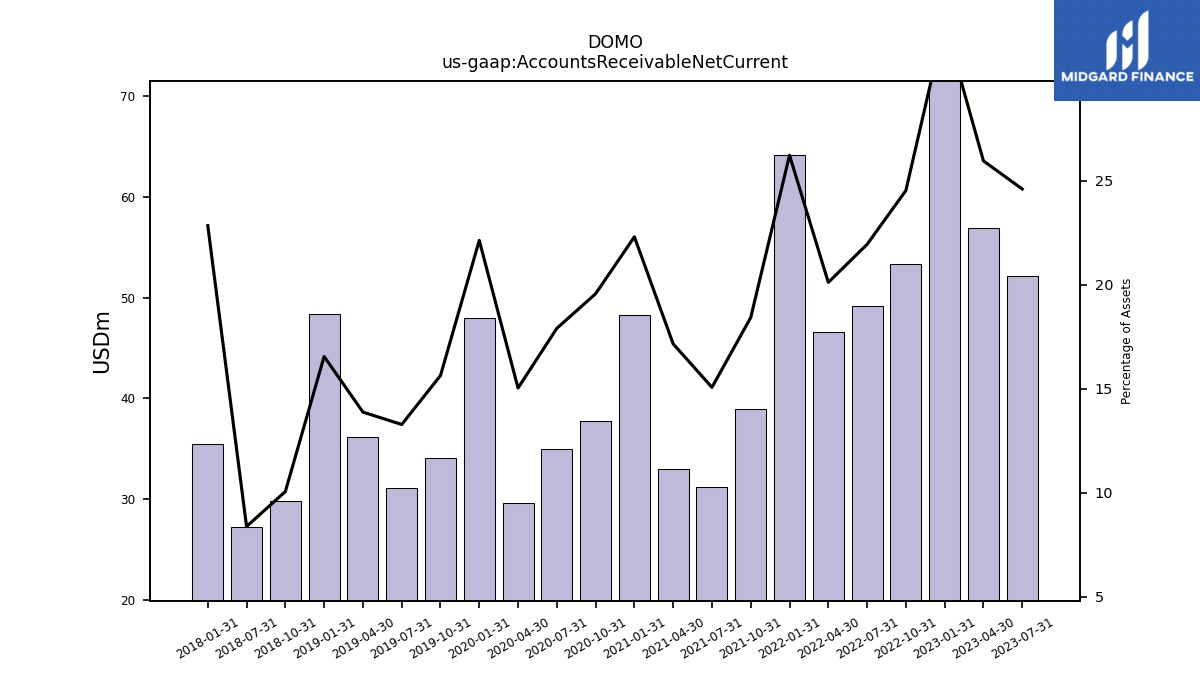
| Accounts Receivable Net Current | 52.19 | 56.89 | 78.96 | 53.31 | 49.15 | 46.63 | 64.15 | 38.90 | 31.15 | 33.00 | 48.27 | 37.79 | 34.93 | 29.64 | 47.97 | 34.05 | 31.14 | 36.21 | 48.42 | 29.80 | 27.27 | NA | 35.48 | NA | NA | |
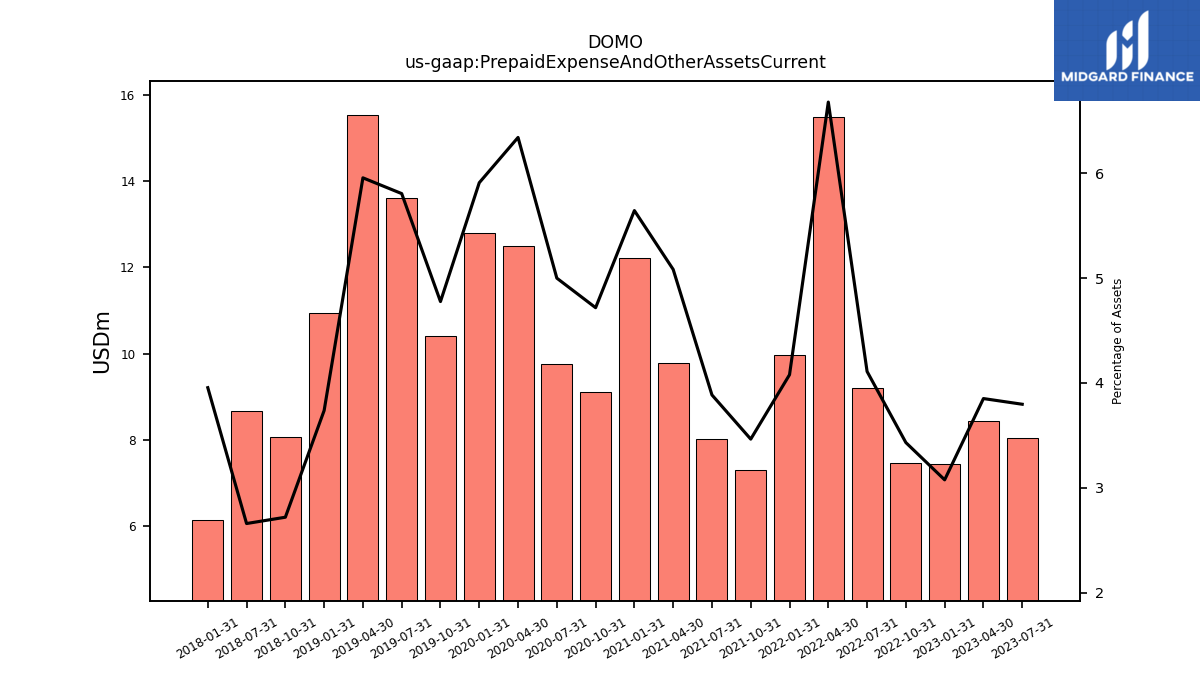
| Prepaid Expense And Other Assets Current | 8.05 | 8.44 | 7.45 | 7.46 | 9.21 | 15.49 | 9.97 | 7.31 | 8.04 | 9.78 | 12.22 | 9.11 | 9.76 | 12.51 | 12.81 | 10.41 | 13.62 | 15.54 | 10.94 | 8.06 | 8.66 | NA | 6.14 | NA | NA |
| 2023-07-31 | 2023-04-30 | 2023-01-31 | 2022-10-31 | 2022-07-31 | 2022-04-30 | 2022-01-31 | 2021-10-31 | 2021-07-31 | 2021-04-30 | 2021-01-31 | 2020-10-31 | 2020-07-31 | 2020-04-30 | 2020-01-31 | 2019-10-31 | 2019-07-31 | 2019-04-30 | 2019-01-31 | 2018-10-31 | 2018-07-31 | 2018-04-30 | 2018-01-31 | 2017-10-31 | 2017-07-31 | ||
|---|---|---|---|---|---|---|---|---|---|---|---|---|---|---|---|---|---|---|---|---|---|---|---|---|---|---|
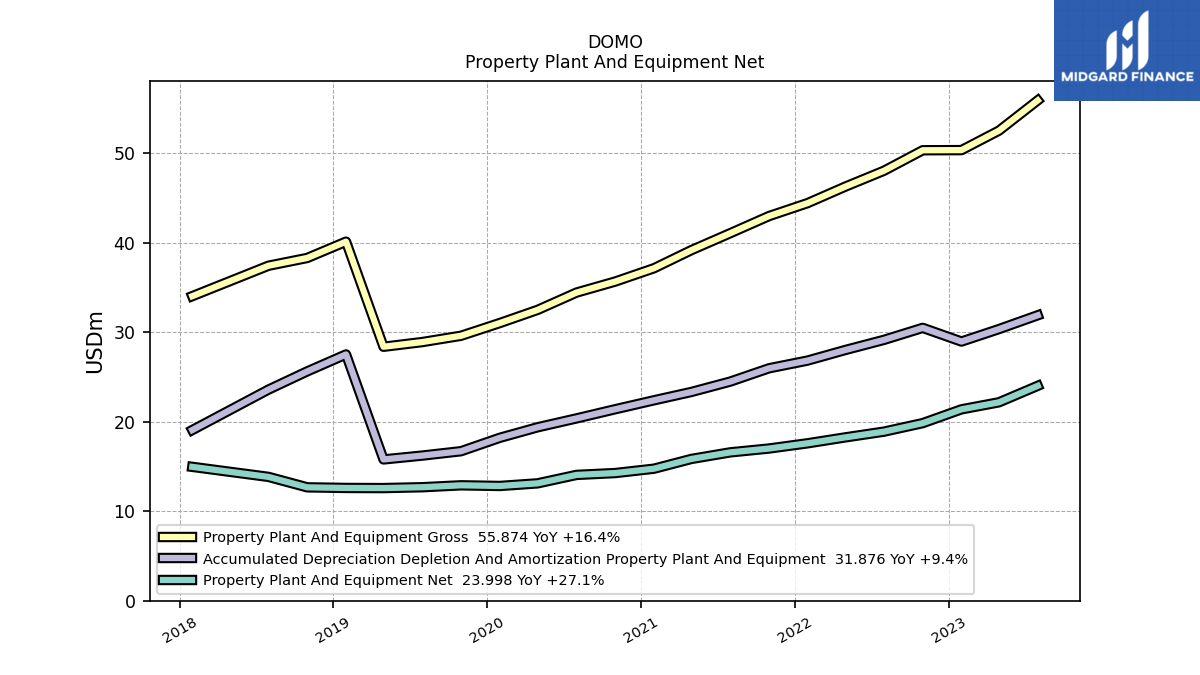
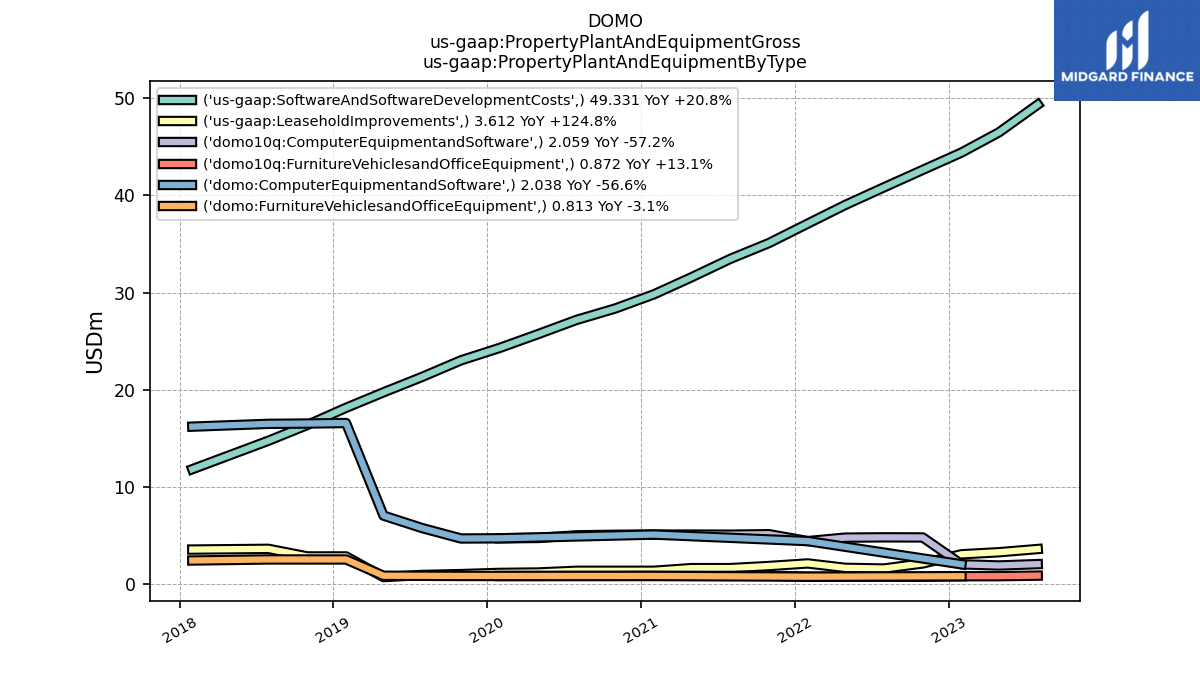
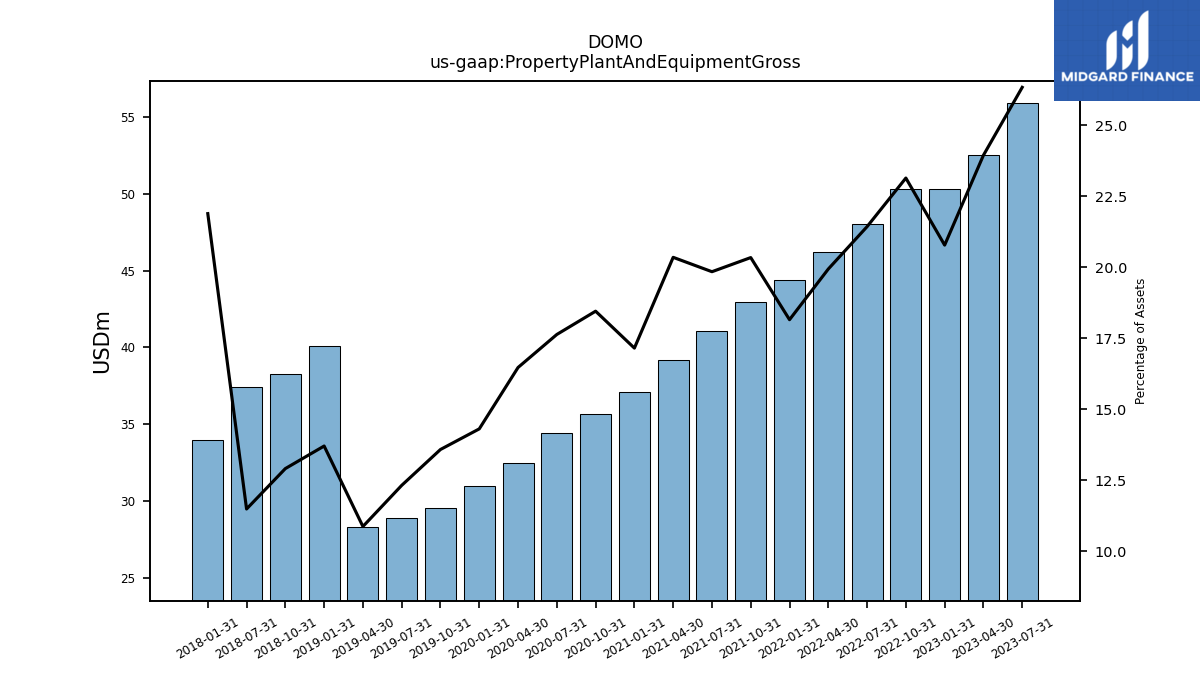
| Property Plant And Equipment Gross | 55.87 | 52.50 | 50.32 | 50.30 | 48.02 | 46.24 | 44.41 | 42.95 | 41.04 | 39.15 | 37.13 | 35.64 | 34.41 | 32.48 | 31.01 | 29.59 | 28.89 | 28.36 | 40.10 | 38.28 | 37.41 | NA | 34.01 | NA | NA | |
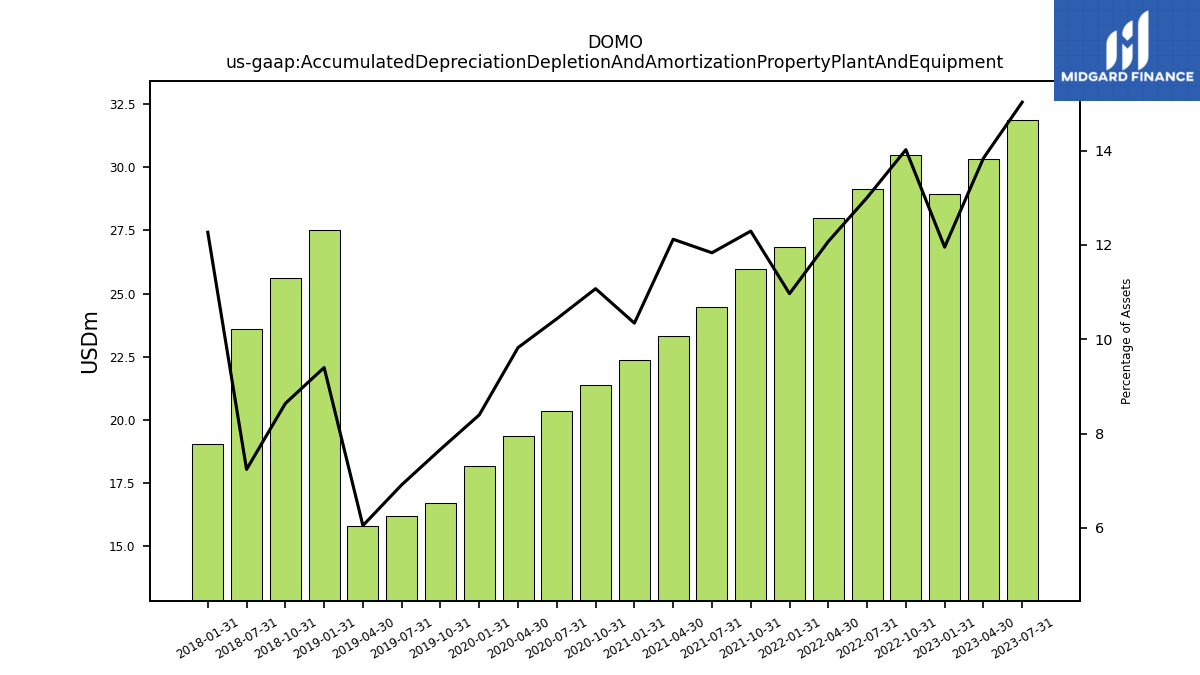
| Accumulated Depreciation Depletion And Amortization Property Plant And Equipment | 31.88 | 30.34 | 28.95 | 30.47 | 29.13 | 28.00 | 26.82 | 25.95 | 24.47 | 23.32 | 22.38 | 21.39 | 20.36 | 19.37 | 18.19 | 16.70 | 16.21 | 15.78 | 27.51 | 25.61 | 23.58 | NA | 19.06 | NA | NA | |
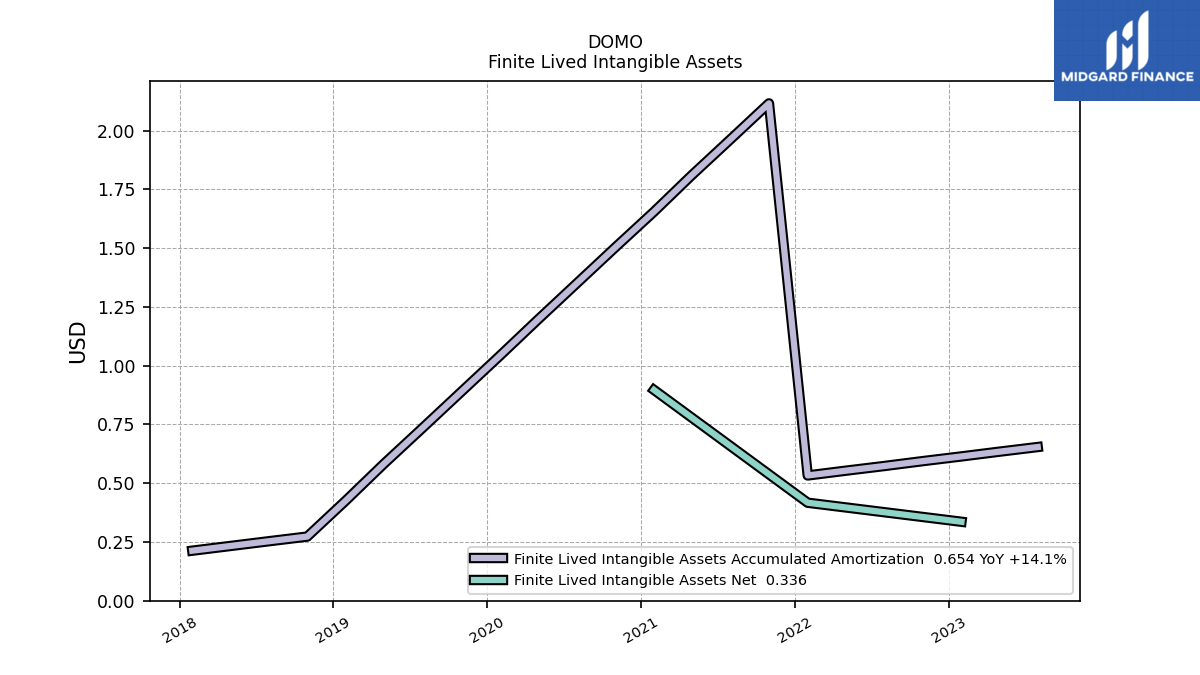
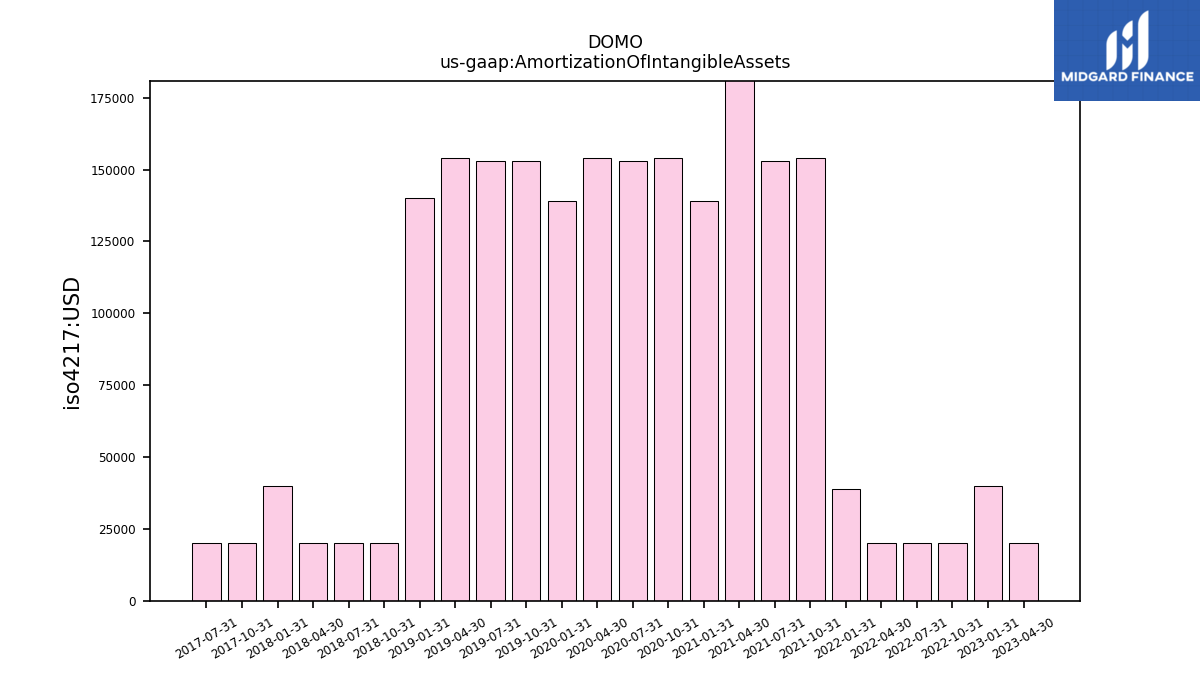
| Amortization Of Intangible Assets | NA | 0.02 | 0.04 | 0.02 | 0.02 | 0.02 | 0.04 | 0.15 | 0.15 | 0.20 | 0.14 | 0.15 | 0.15 | 0.15 | 0.14 | 0.15 | 0.15 | 0.15 | 0.14 | 0.02 | 0.02 | 0.02 | 0.04 | 0.02 | 0.02 | |
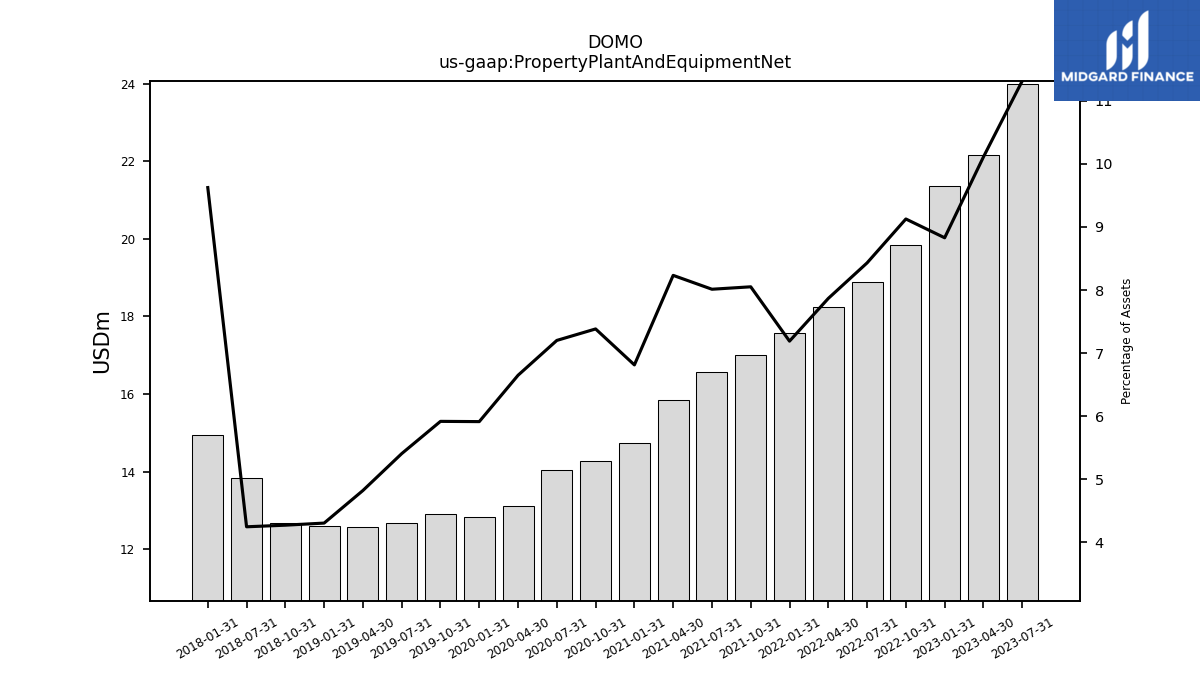
| Property Plant And Equipment Net | 24.00 | 22.16 | 21.38 | 19.83 | 18.88 | 18.24 | 17.58 | 17.00 | 16.57 | 15.84 | 14.74 | 14.26 | 14.05 | 13.11 | 12.82 | 12.89 | 12.68 | 12.58 | 12.60 | 12.66 | 13.83 | NA | 14.95 | NA | NA | |
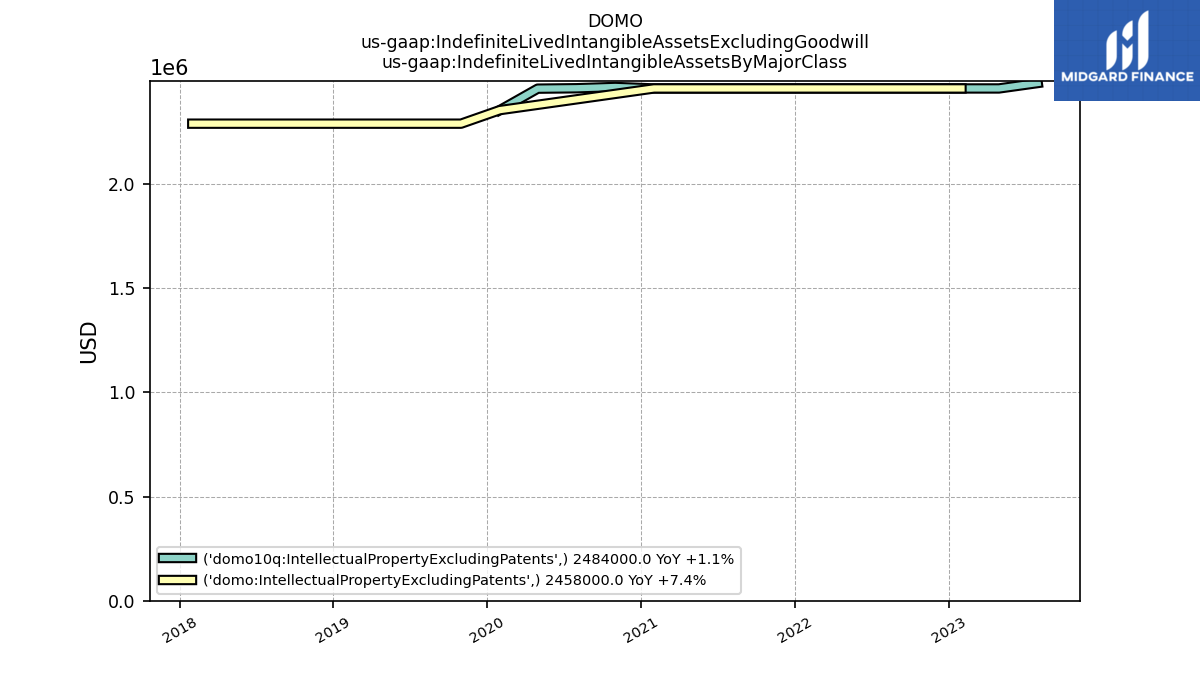
| Intangible Assets Net Excluding Goodwill | 2.78 | 2.77 | 2.79 | 2.81 | 2.83 | 2.85 | 2.88 | 2.90 | 3.05 | 3.20 | 3.36 | 3.52 | 3.66 | 3.81 | 3.87 | 3.95 | 4.11 | 4.26 | 4.42 | 4.57 | 2.99 | NA | 3.03 | NA | NA | |
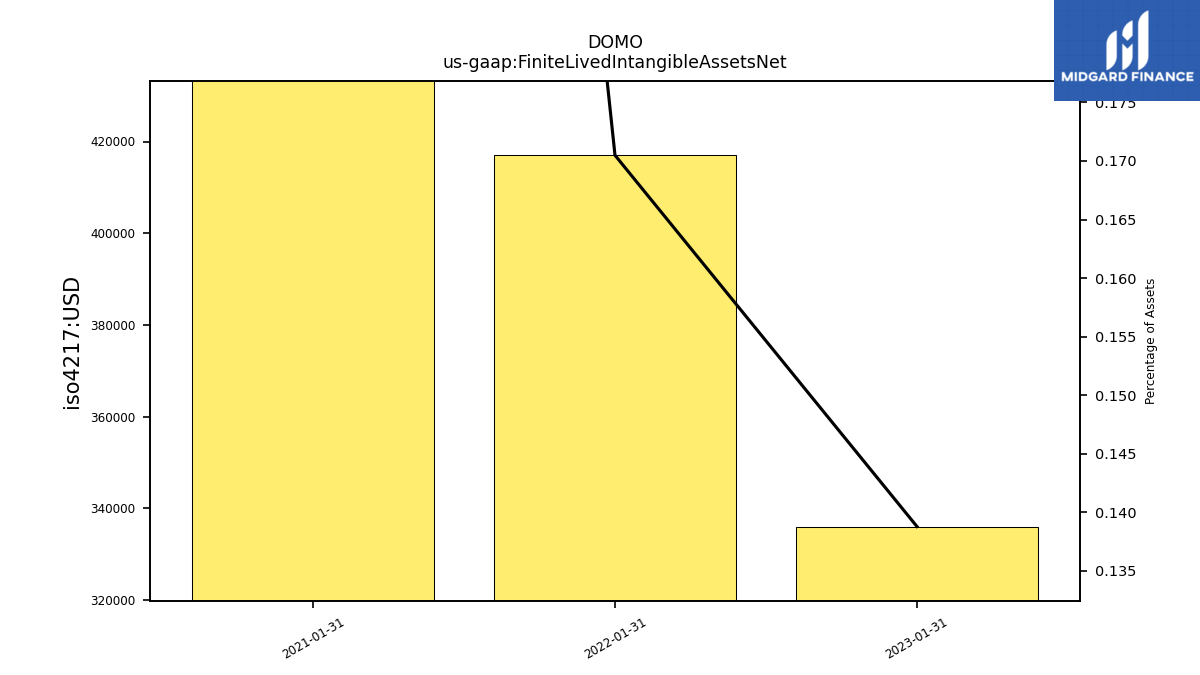
| Finite Lived Intangible Assets Net | NA | NA | 0.34 | NA | NA | NA | 0.42 | NA | NA | NA | 0.90 | NA | NA | NA | NA | NA | NA | NA | NA | NA | NA | NA | NA | NA | NA | |
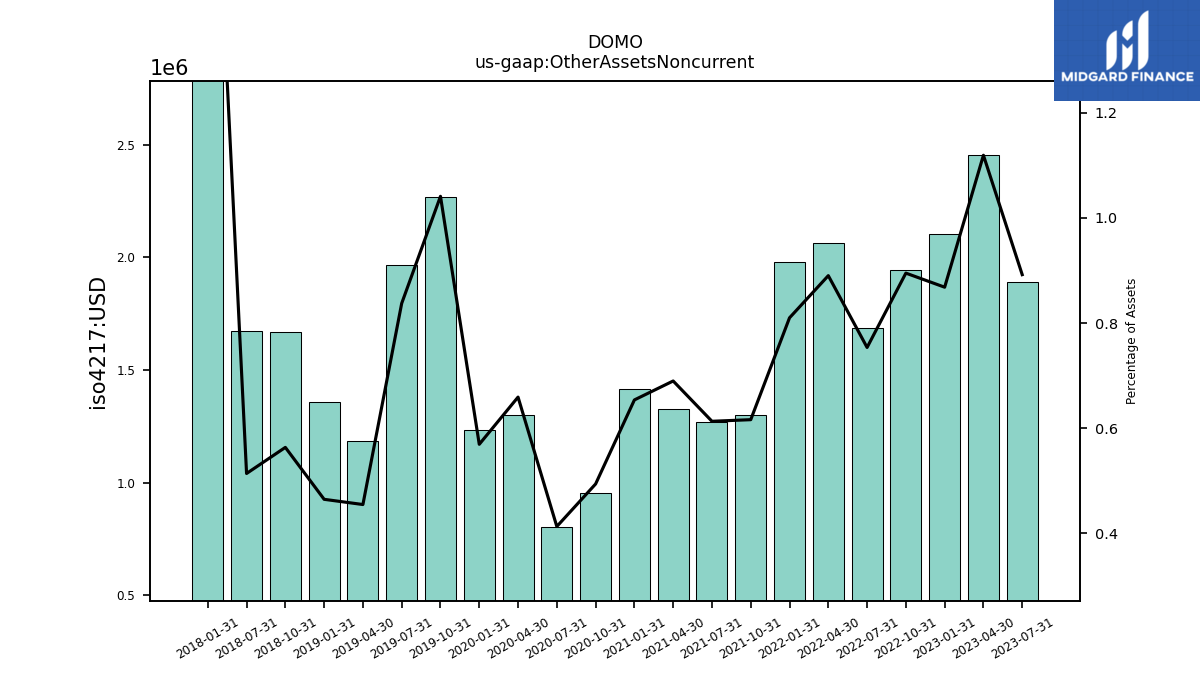
| Other Assets Noncurrent | 1.89 | 2.45 | 2.10 | 1.95 | 1.69 | 2.06 | 1.98 | 1.30 | 1.27 | 1.33 | 1.42 | 0.95 | 0.81 | 1.30 | 1.23 | 2.27 | 1.96 | 1.19 | 1.36 | 1.67 | 1.67 | NA | 3.12 | NA | NA |
| 2023-07-31 | 2023-04-30 | 2023-01-31 | 2022-10-31 | 2022-07-31 | 2022-04-30 | 2022-01-31 | 2021-10-31 | 2021-07-31 | 2021-04-30 | 2021-01-31 | 2020-10-31 | 2020-07-31 | 2020-04-30 | 2020-01-31 | 2019-10-31 | 2019-07-31 | 2019-04-30 | 2019-01-31 | 2018-10-31 | 2018-07-31 | 2018-04-30 | 2018-01-31 | 2017-10-31 | 2017-07-31 | ||
|---|---|---|---|---|---|---|---|---|---|---|---|---|---|---|---|---|---|---|---|---|---|---|---|---|---|---|
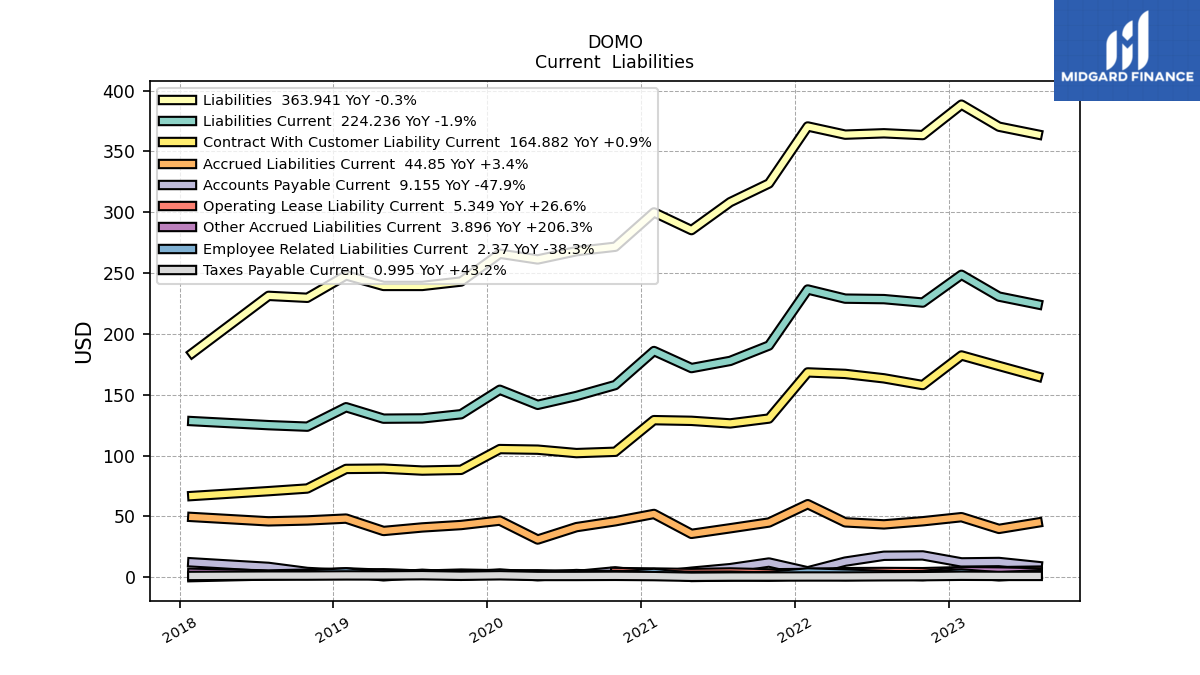
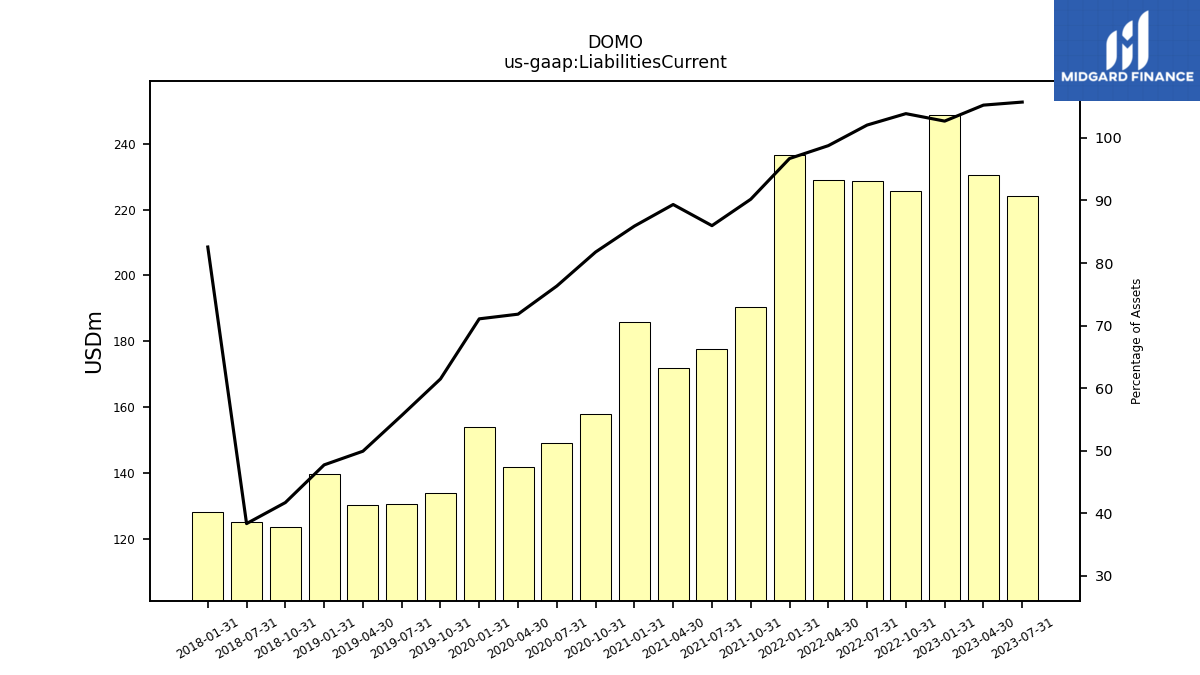
| Liabilities Current | 224.24 | 230.67 | 248.60 | 225.75 | 228.59 | 228.99 | 236.52 | 190.43 | 177.79 | 171.89 | 185.92 | 157.91 | 148.94 | 141.65 | 154.06 | 133.94 | 130.50 | 130.30 | 139.71 | 123.71 | 124.95 | NA | 128.26 | NA | NA | |
| Accounts Payable Current | 9.15 | 12.45 | 12.12 | 17.84 | 17.56 | 12.76 | 4.77 | 12.02 | 7.38 | 4.46 | 1.08 | 4.76 | 1.77 | 2.35 | 2.30 | 2.90 | 2.02 | 3.14 | 2.61 | 4.25 | 8.41 | NA | 12.12 | NA | NA | |
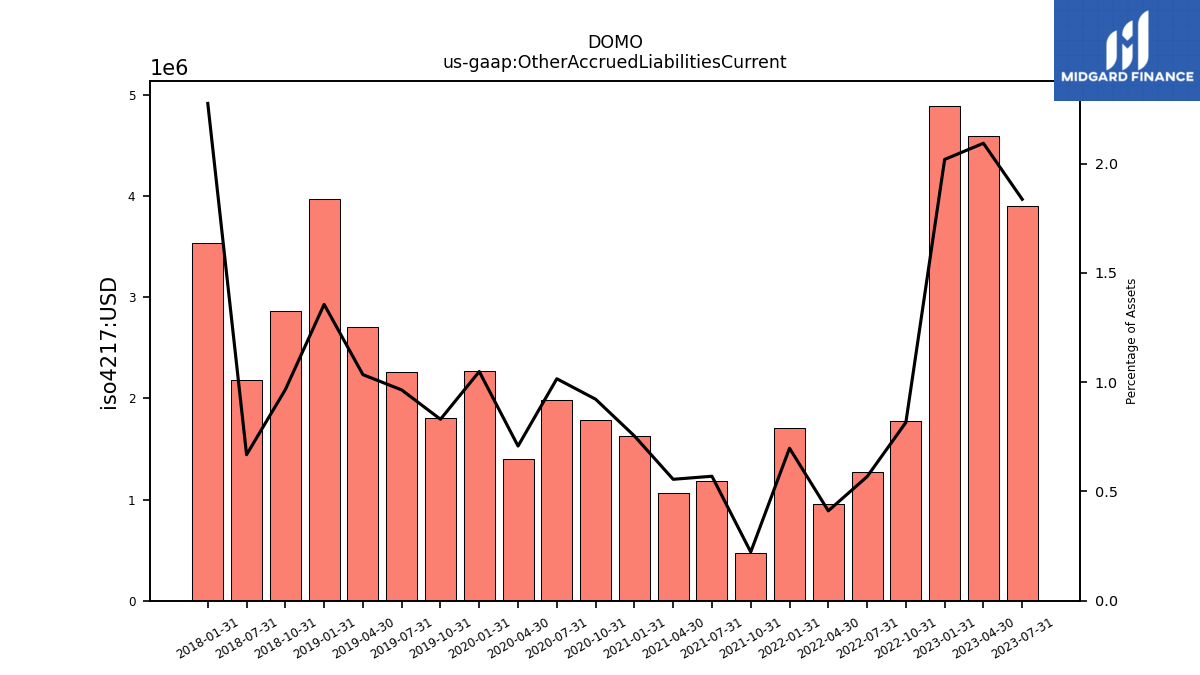
| Other Accrued Liabilities Current | 3.90 | 4.59 | 4.89 | 1.77 | 1.27 | 0.95 | 1.71 | 0.47 | 1.18 | 1.07 | 1.63 | 1.78 | 1.98 | 1.40 | 2.27 | 1.81 | 2.26 | 2.70 | 3.97 | 2.87 | 2.18 | NA | 3.54 | NA | NA | |
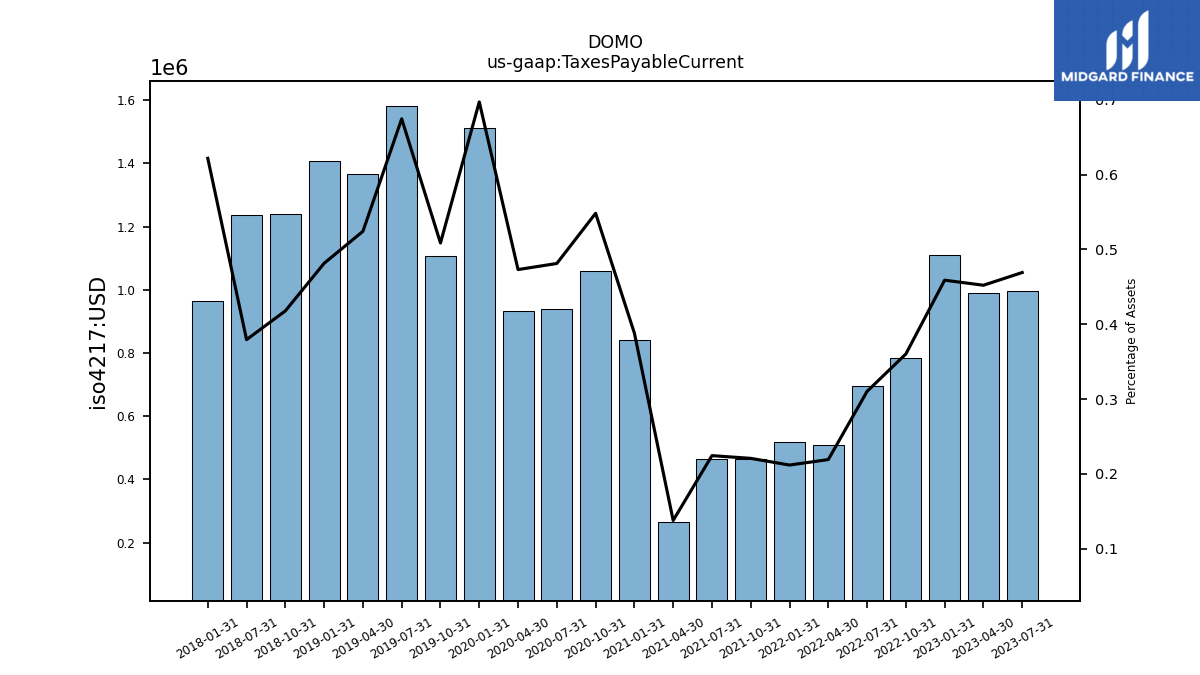
| Taxes Payable Current | 0.99 | 0.99 | 1.11 | 0.78 | 0.69 | 0.51 | 0.52 | 0.47 | 0.46 | 0.27 | 0.84 | 1.06 | 0.94 | 0.93 | 1.51 | 1.11 | 1.58 | 1.37 | 1.41 | 1.24 | 1.24 | NA | 0.97 | NA | NA | |
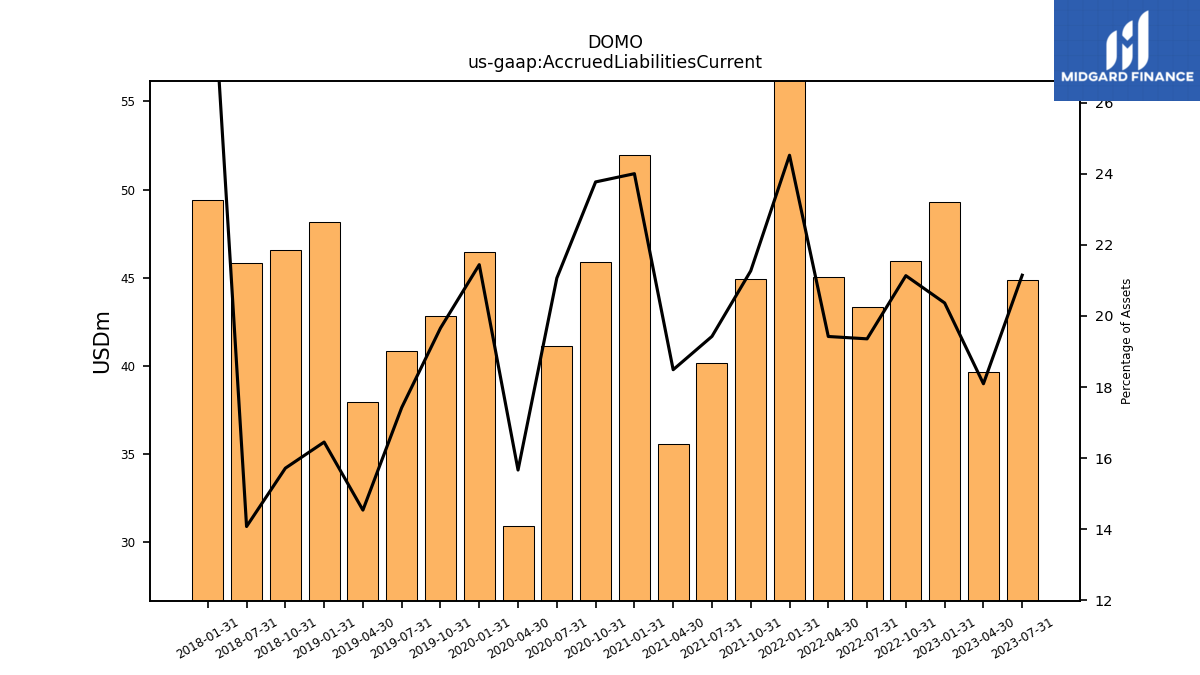
| Accrued Liabilities Current | 44.85 | 39.66 | 49.31 | 45.93 | 43.36 | 45.03 | 59.98 | 44.90 | 40.17 | 35.56 | 51.95 | 45.91 | 41.10 | 30.89 | 46.47 | 42.83 | 40.86 | 37.94 | 48.14 | 46.60 | 45.85 | NA | 49.43 | NA | NA | |
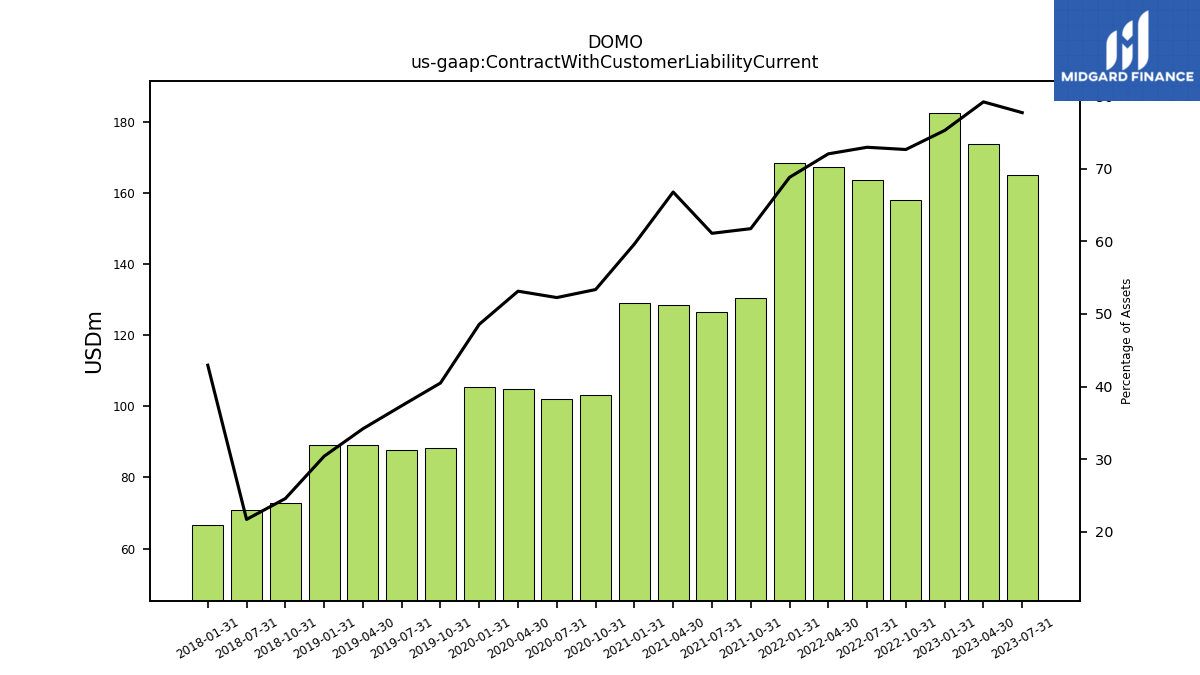
| Contract With Customer Liability Current | 164.88 | 173.65 | 182.27 | 157.91 | 163.45 | 167.09 | 168.34 | 130.38 | 126.38 | 128.51 | 129.08 | 103.08 | 101.98 | 104.80 | 105.29 | 88.21 | 87.62 | 89.22 | 88.96 | 72.86 | 70.69 | NA | 66.71 | NA | NA |
| 2023-07-31 | 2023-04-30 | 2023-01-31 | 2022-10-31 | 2022-07-31 | 2022-04-30 | 2022-01-31 | 2021-10-31 | 2021-07-31 | 2021-04-30 | 2021-01-31 | 2020-10-31 | 2020-07-31 | 2020-04-30 | 2020-01-31 | 2019-10-31 | 2019-07-31 | 2019-04-30 | 2019-01-31 | 2018-10-31 | 2018-07-31 | 2018-04-30 | 2018-01-31 | 2017-10-31 | 2017-07-31 | ||
|---|---|---|---|---|---|---|---|---|---|---|---|---|---|---|---|---|---|---|---|---|---|---|---|---|---|---|
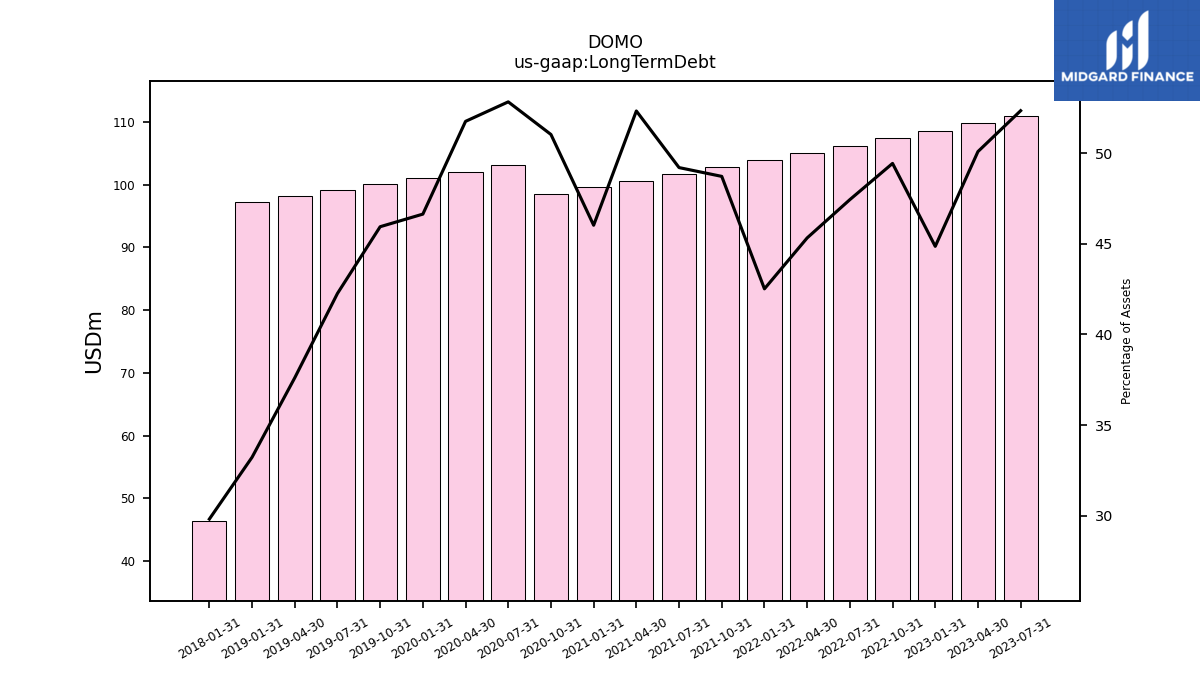
| Long Term Debt | 111.00 | 109.77 | 108.61 | 107.42 | 106.25 | 105.09 | 103.99 | 102.85 | 101.74 | 100.65 | 99.61 | 98.55 | 103.08 | 102.06 | 101.07 | 100.09 | 99.11 | 98.16 | 97.25 | NA | NA | NA | 46.33 | NA | NA | |
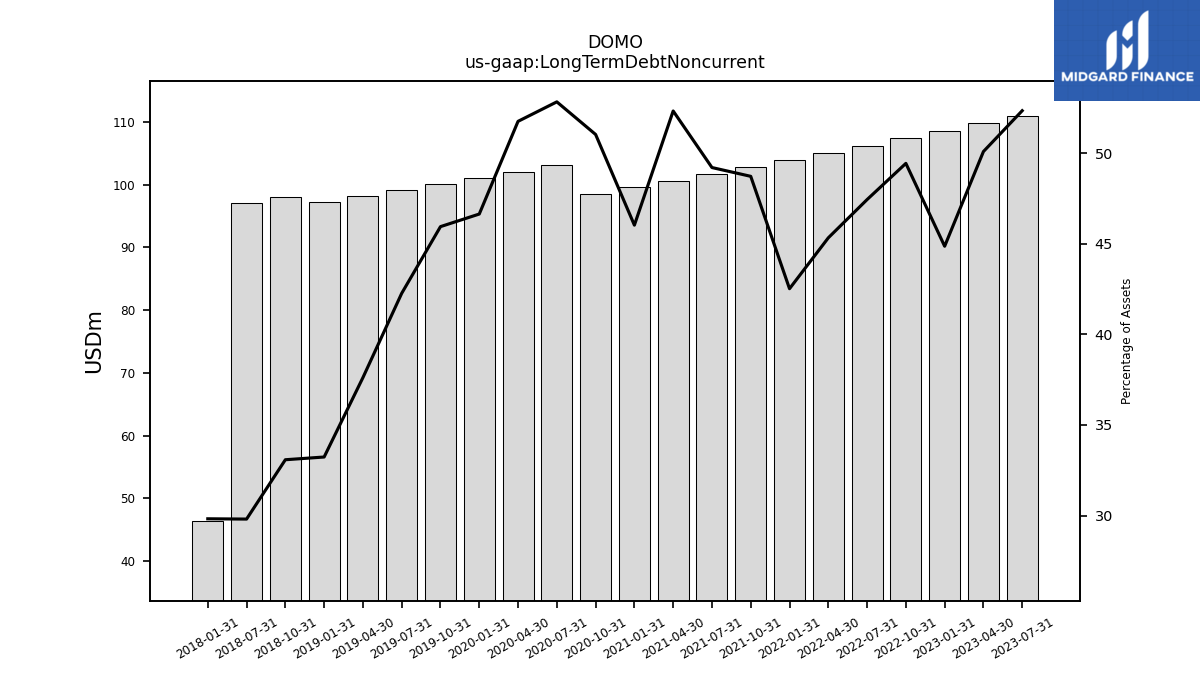
| Long Term Debt Noncurrent | 111.00 | 109.77 | 108.61 | 107.42 | 106.25 | 105.09 | 103.99 | 102.85 | 101.74 | 100.65 | 99.61 | 98.55 | 103.08 | 102.06 | 101.07 | 100.09 | 99.11 | 98.16 | 97.25 | 98.09 | 97.10 | NA | 46.33 | NA | NA | |
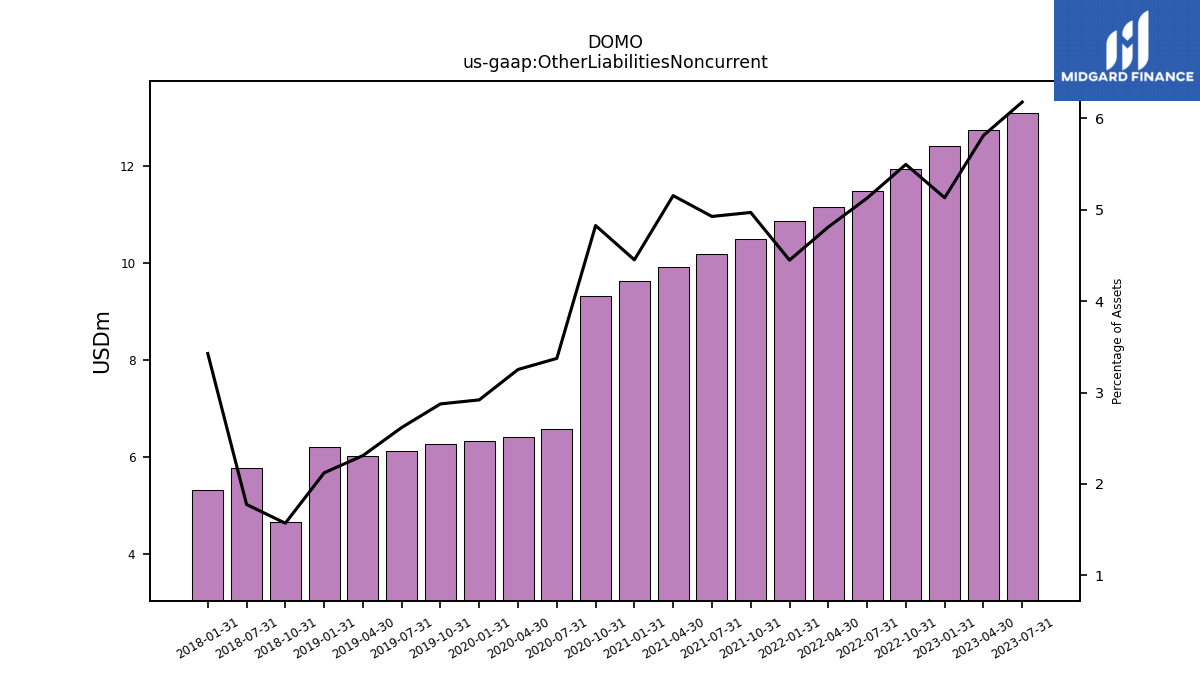
| Other Liabilities Noncurrent | 13.11 | 12.74 | 12.43 | 11.95 | 11.49 | 11.16 | 10.88 | 10.49 | 10.19 | 9.92 | 9.64 | 9.32 | 6.58 | 6.42 | 6.33 | 6.27 | 6.14 | 6.03 | 6.21 | 4.66 | 5.79 | NA | 5.32 | NA | NA | |
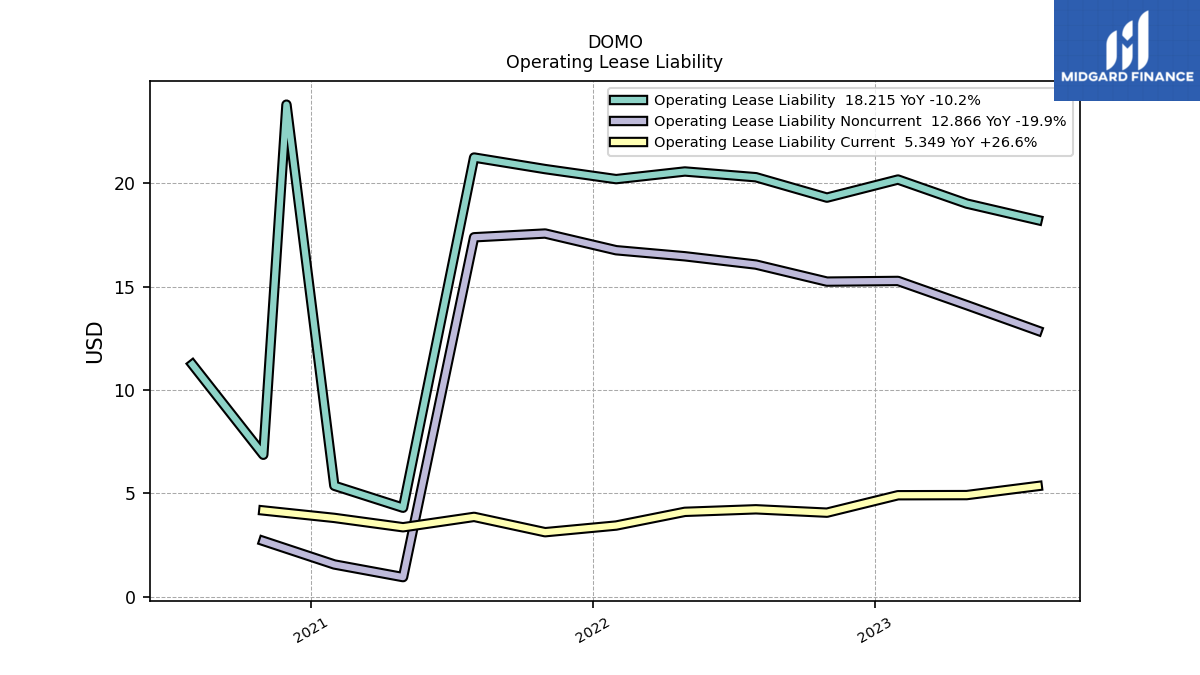
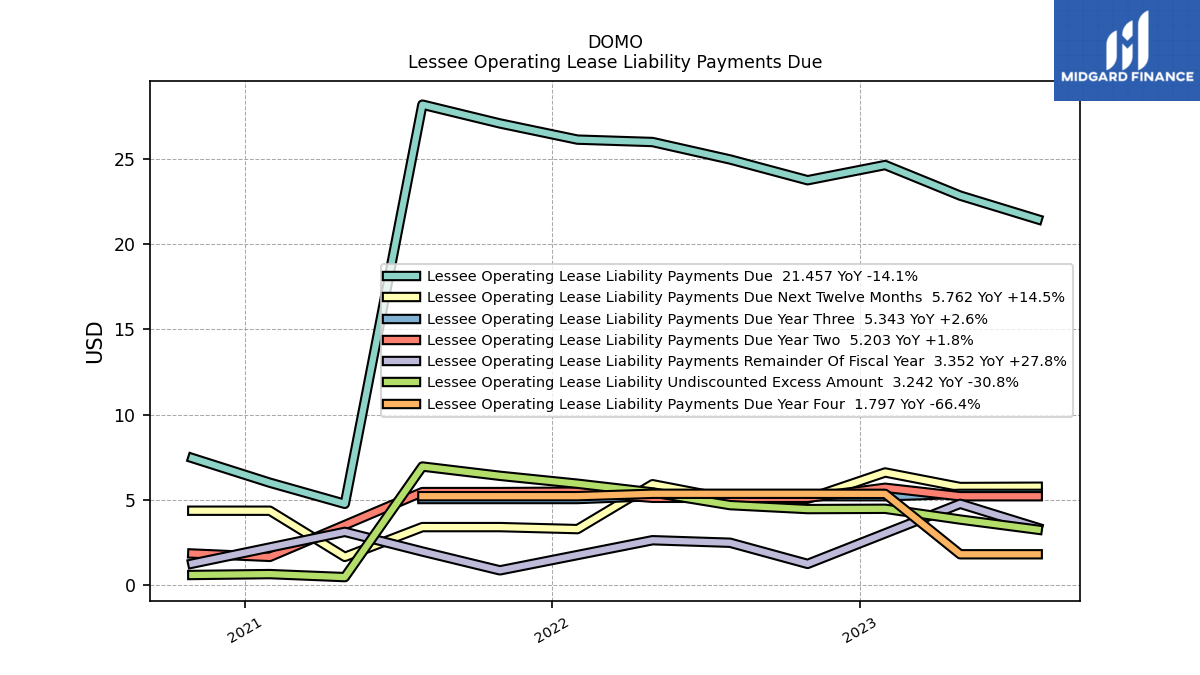
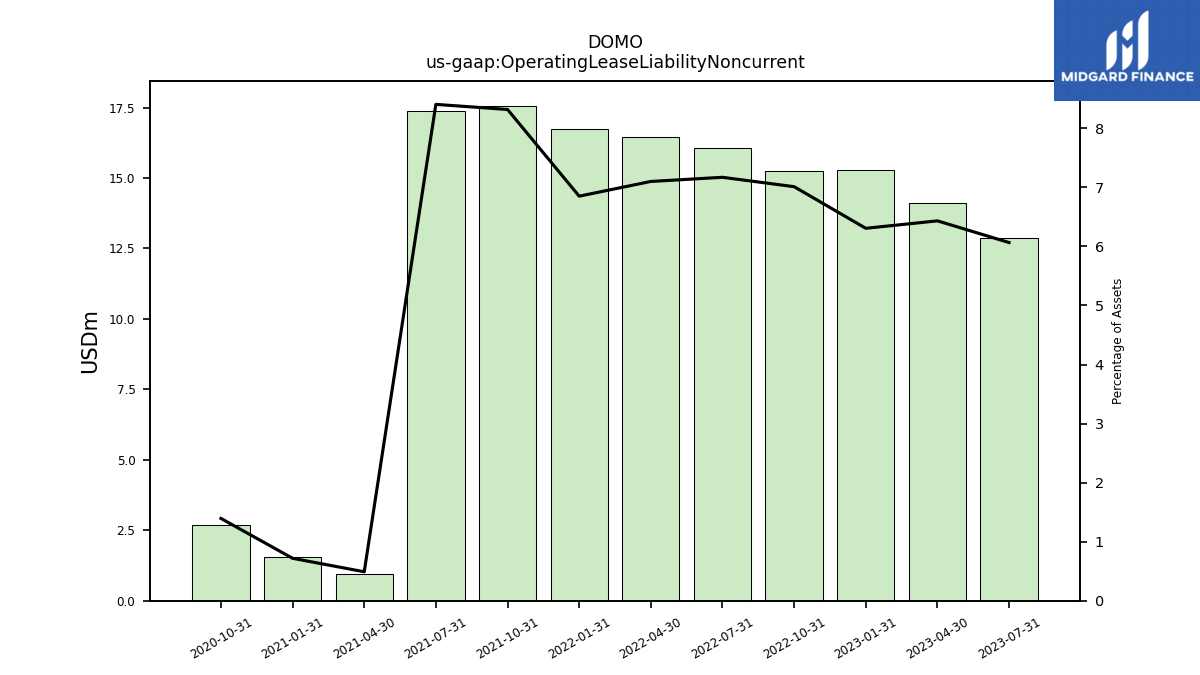
| Operating Lease Liability Noncurrent | 12.87 | 14.10 | 15.27 | 15.24 | 16.06 | 16.46 | 16.76 | 17.57 | 17.38 | 0.94 | 1.56 | 2.69 | NA | NA | NA | NA | NA | NA | NA | NA | NA | NA | NA | NA | NA |
| 2023-07-31 | 2023-04-30 | 2023-01-31 | 2022-10-31 | 2022-07-31 | 2022-04-30 | 2022-01-31 | 2021-10-31 | 2021-07-31 | 2021-04-30 | 2021-01-31 | 2020-10-31 | 2020-07-31 | 2020-04-30 | 2020-01-31 | 2019-10-31 | 2019-07-31 | 2019-04-30 | 2019-01-31 | 2018-10-31 | 2018-07-31 | 2018-04-30 | 2018-01-31 | 2017-10-31 | 2017-07-31 | ||
|---|---|---|---|---|---|---|---|---|---|---|---|---|---|---|---|---|---|---|---|---|---|---|---|---|---|---|
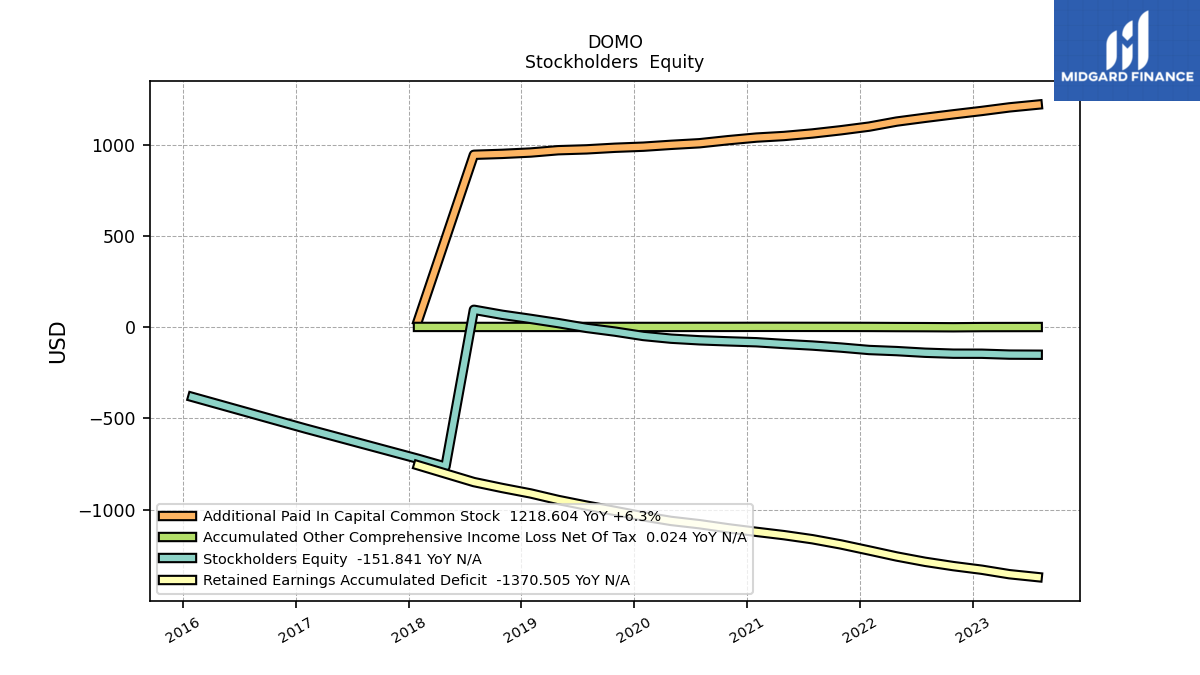
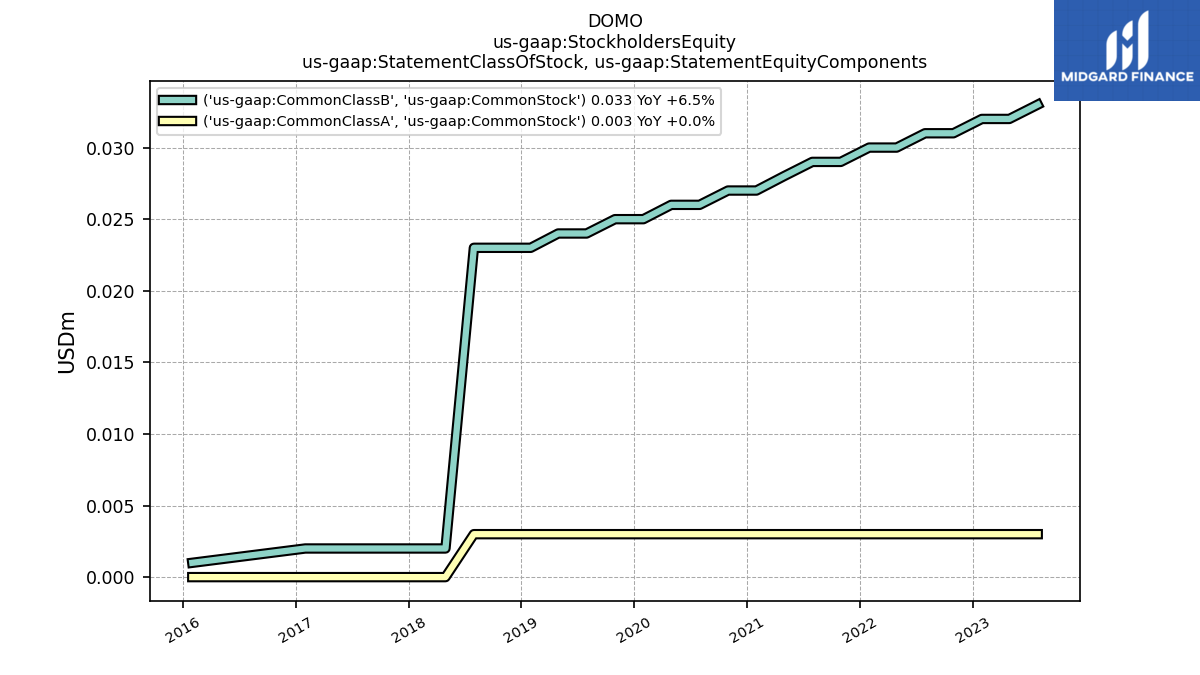
| Stockholders Equity | -151.84 | -151.17 | -146.40 | -146.12 | -140.95 | -131.95 | -125.98 | -112.56 | -101.54 | -92.95 | -83.46 | -78.52 | -72.87 | -63.99 | -49.18 | -25.18 | -4.91 | 21.55 | 44.53 | 66.86 | 94.50 | -765.22 | -721.96 | NA | NA | |
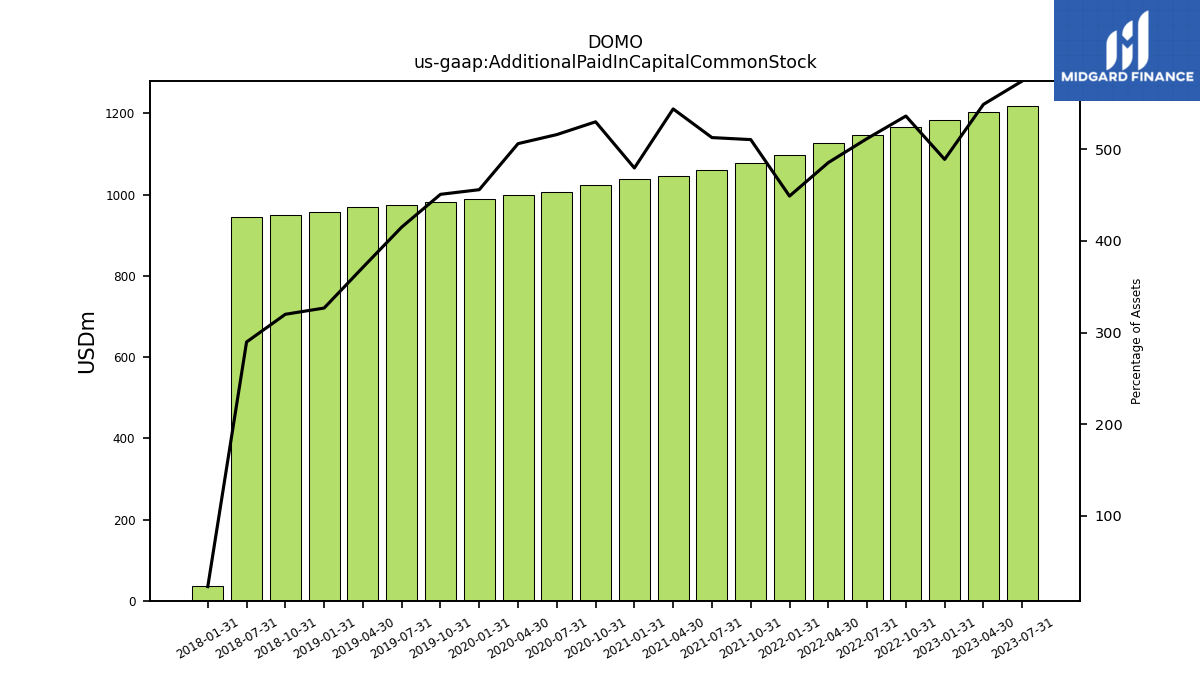
| Additional Paid In Capital Common Stock | 1218.60 | 1203.38 | 1183.92 | 1165.52 | 1146.23 | 1125.70 | 1098.08 | 1077.99 | 1060.42 | 1046.62 | 1038.01 | 1023.66 | 1007.02 | 998.27 | 988.14 | 982.24 | 973.47 | 968.75 | 956.14 | 948.69 | 943.72 | NA | 35.30 | NA | NA | |
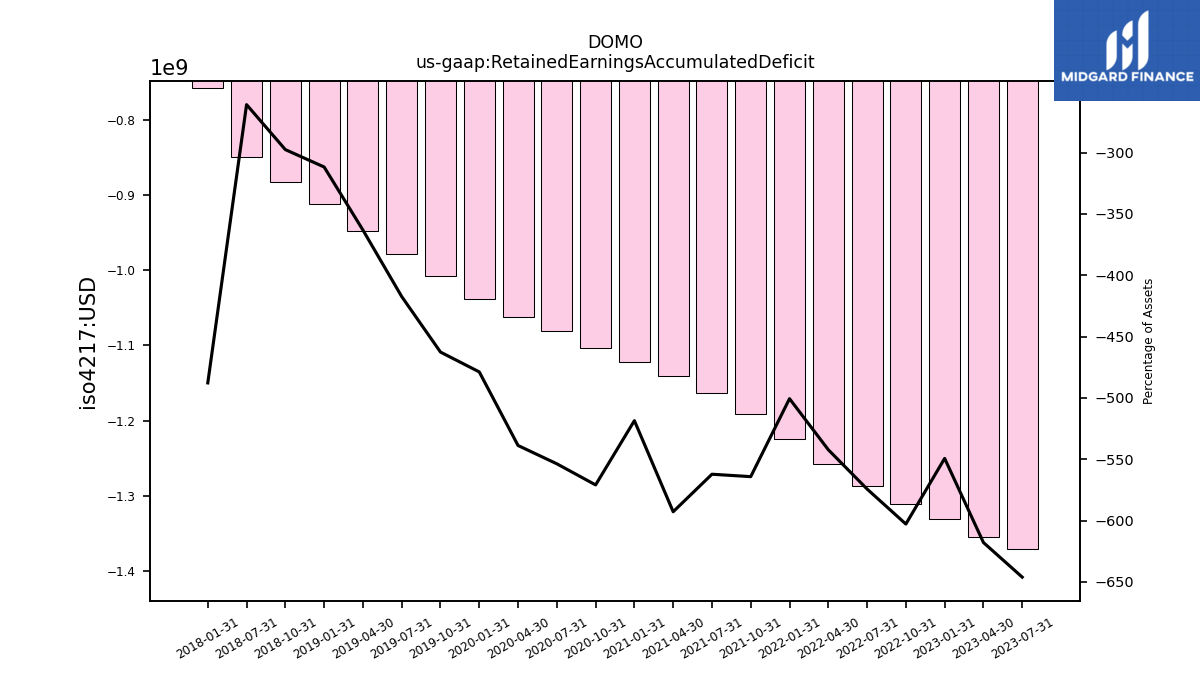
| Retained Earnings Accumulated Deficit | -1370.51 | -1354.44 | -1330.03 | -1310.22 | -1286.51 | -1257.37 | -1224.48 | -1191.23 | -1162.72 | -1140.48 | -1122.37 | -1102.76 | -1080.54 | -1062.63 | -1037.74 | -1007.88 | -978.78 | -947.62 | -912.08 | -882.21 | -849.66 | NA | -757.77 | NA | NA | |
| Accumulated Other Comprehensive Income Loss Net Of Tax | 0.02 | -0.14 | -0.32 | -1.46 | -0.70 | -0.32 | 0.39 | 0.65 | 0.73 | 0.87 | 0.88 | 0.55 | 0.62 | 0.34 | 0.39 | 0.43 | 0.37 | 0.38 | 0.44 | 0.36 | 0.41 | NA | 0.51 | NA | NA | |
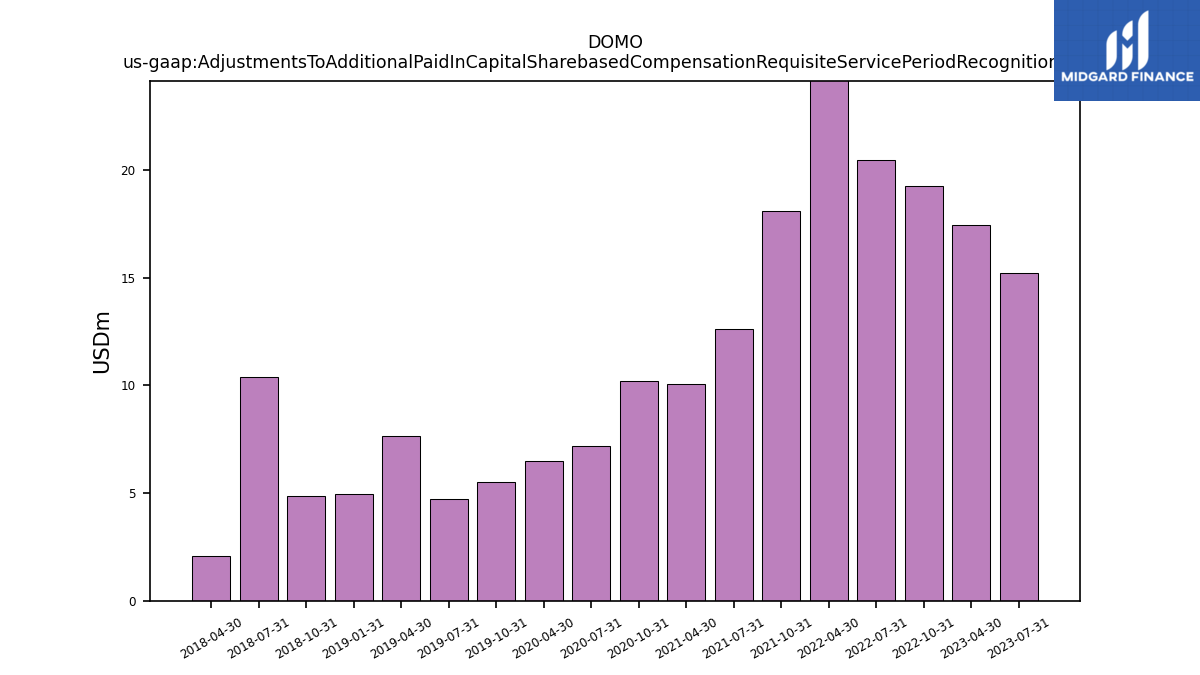
| Adjustments To Additional Paid In Capital Sharebased Compensation Requisite Service Period Recognition Value | 15.23 | 17.42 | NA | 19.23 | 20.45 | 25.33 | NA | 18.11 | 12.62 | 10.07 | NA | 10.19 | 7.20 | 6.50 | NA | 5.50 | 4.74 | 7.65 | 4.98 | 4.85 | 10.39 | 2.08 | NA | NA | NA |
| 2023-07-31 | 2023-04-30 | 2023-01-31 | 2022-10-31 | 2022-07-31 | 2022-04-30 | 2022-01-31 | 2021-10-31 | 2021-07-31 | 2021-04-30 | 2021-01-31 | 2020-10-31 | 2020-07-31 | 2020-04-30 | 2020-01-31 | 2019-10-31 | 2019-07-31 | 2019-04-30 | 2019-01-31 | 2018-10-31 | 2018-07-31 | 2018-04-30 | 2018-01-31 | 2017-10-31 | 2017-07-31 | ||
|---|---|---|---|---|---|---|---|---|---|---|---|---|---|---|---|---|---|---|---|---|---|---|---|---|---|---|
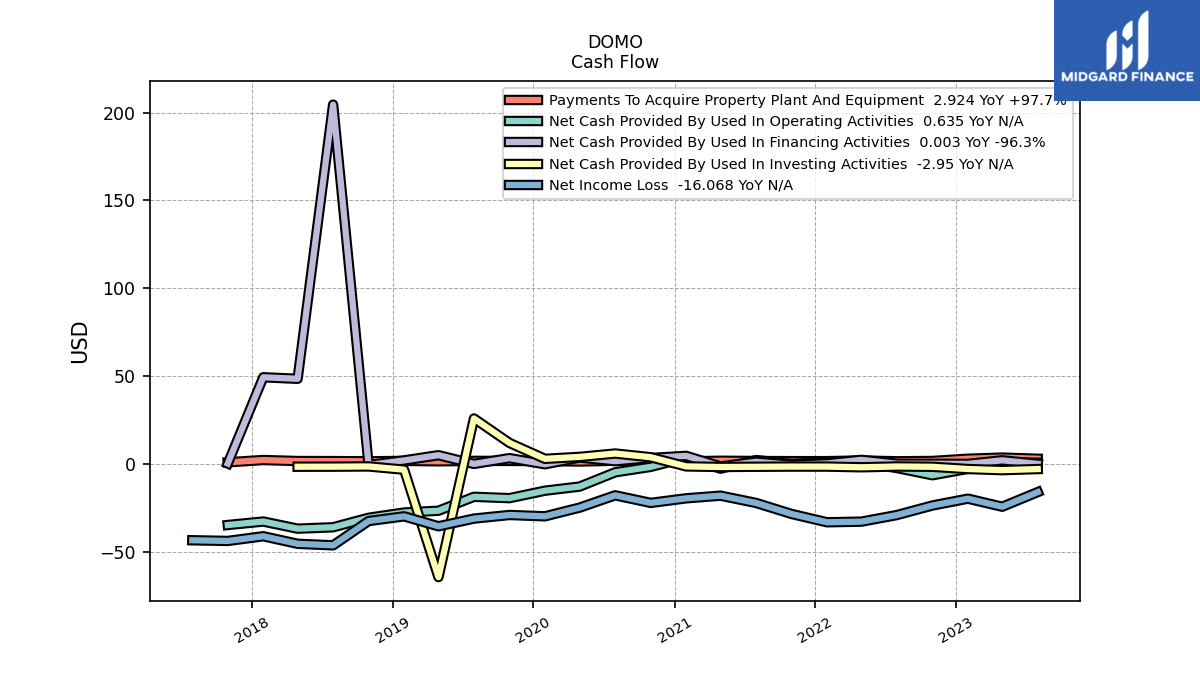
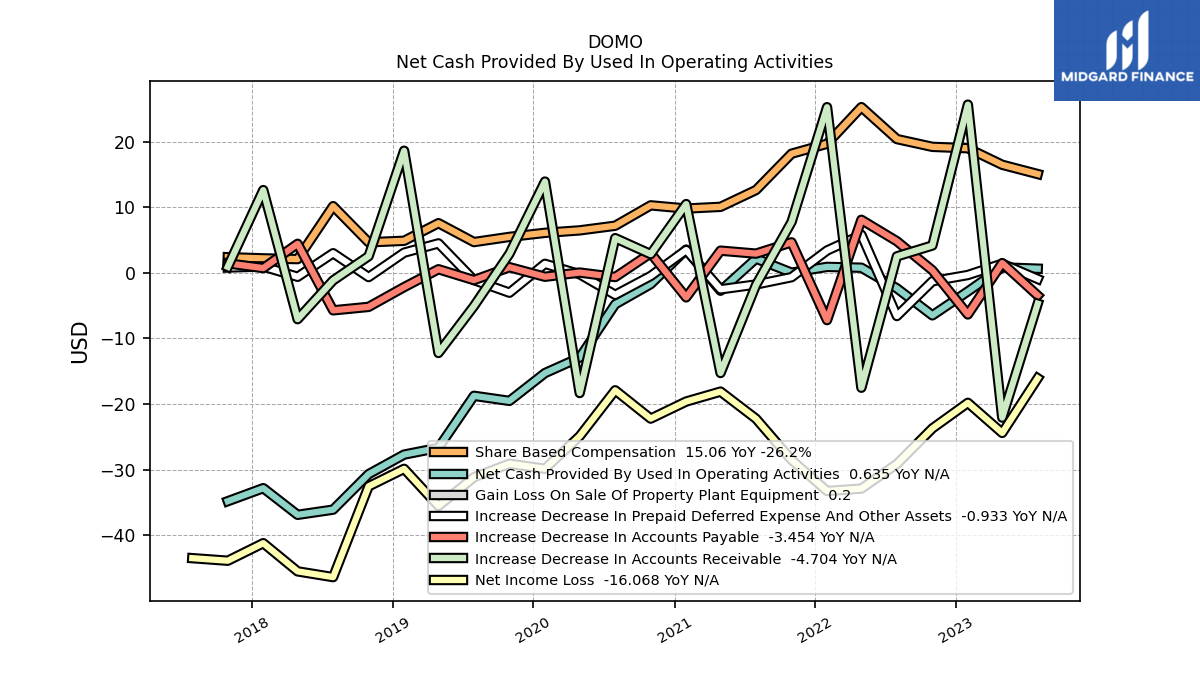
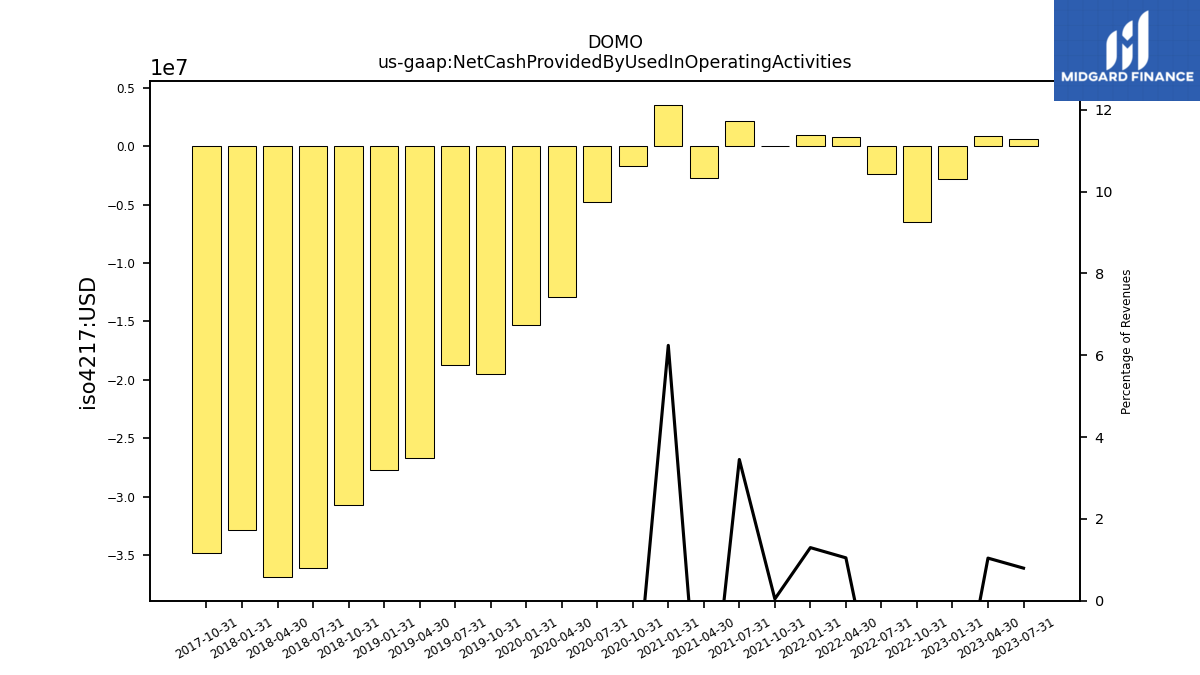
| Net Cash Provided By Used In Operating Activities | 0.64 | 0.83 | -2.83 | -6.48 | -2.36 | 0.78 | 0.91 | 0.03 | 2.17 | -2.73 | 3.55 | -1.72 | -4.79 | -12.91 | -15.28 | -19.52 | -18.74 | -26.68 | -27.70 | -30.68 | -36.10 | -36.89 | -32.82 | -34.81 | NA | |
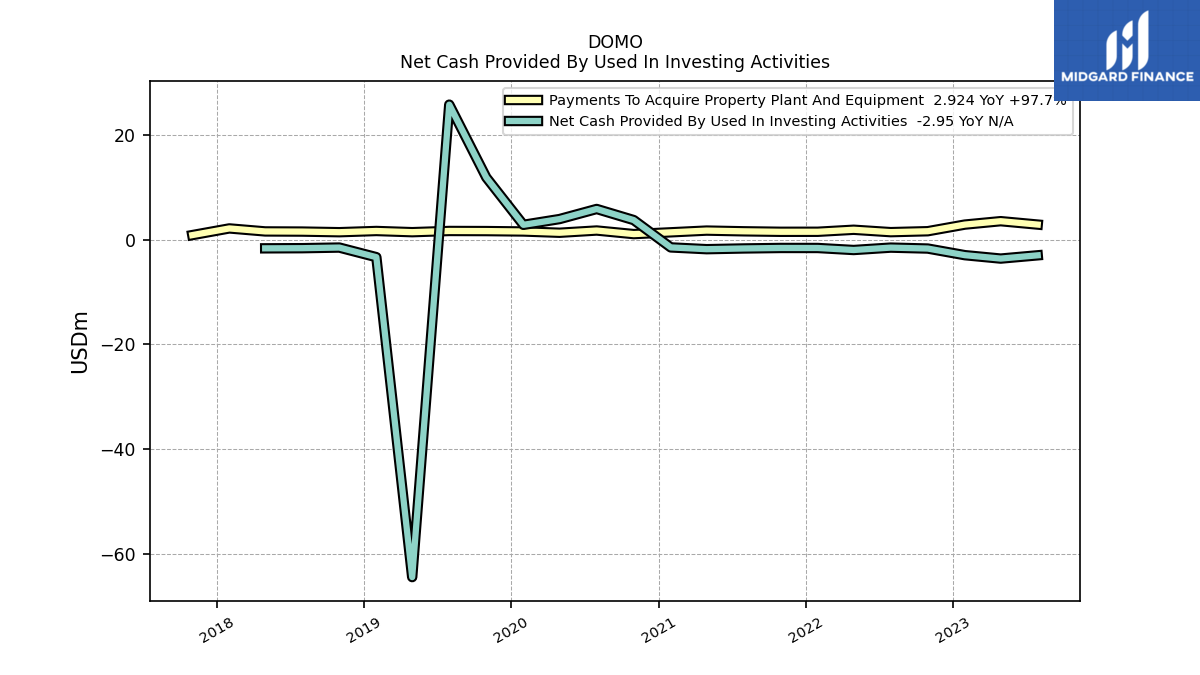
| Net Cash Provided By Used In Investing Activities | -2.95 | -3.58 | -2.92 | -1.66 | -1.48 | -1.94 | -1.55 | -1.55 | -1.64 | -1.78 | -1.44 | 3.79 | 5.91 | 3.98 | 2.88 | 11.93 | 25.86 | -64.48 | -3.30 | -1.47 | -1.59 | -1.62 | NA | NA | NA | |
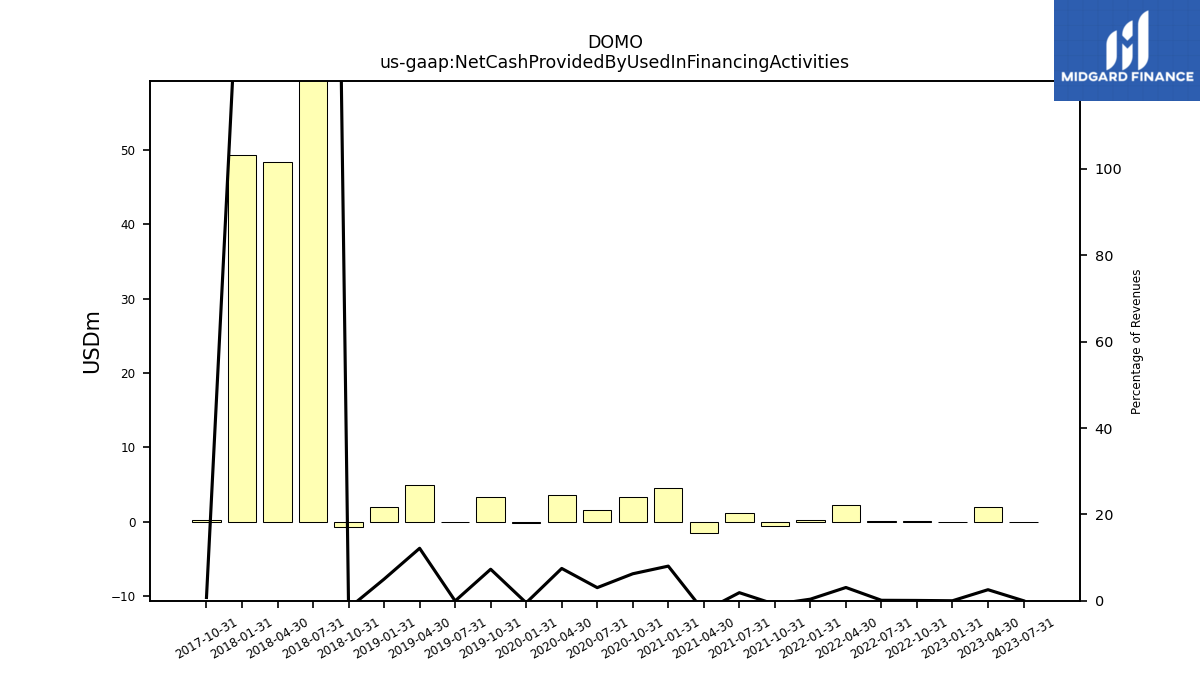
| Net Cash Provided By Used In Financing Activities | 0.00 | 2.03 | 0.00 | 0.06 | 0.08 | 2.29 | 0.26 | -0.54 | 1.18 | -1.46 | 4.56 | 3.35 | 1.55 | 3.63 | -0.22 | 3.27 | -0.02 | 4.96 | 1.98 | -0.65 | 204.56 | 48.44 | 49.32 | 0.21 | NA |
| 2023-07-31 | 2023-04-30 | 2023-01-31 | 2022-10-31 | 2022-07-31 | 2022-04-30 | 2022-01-31 | 2021-10-31 | 2021-07-31 | 2021-04-30 | 2021-01-31 | 2020-10-31 | 2020-07-31 | 2020-04-30 | 2020-01-31 | 2019-10-31 | 2019-07-31 | 2019-04-30 | 2019-01-31 | 2018-10-31 | 2018-07-31 | 2018-04-30 | 2018-01-31 | 2017-10-31 | 2017-07-31 | ||
|---|---|---|---|---|---|---|---|---|---|---|---|---|---|---|---|---|---|---|---|---|---|---|---|---|---|---|
| Net Cash Provided By Used In Operating Activities | 0.64 | 0.83 | -2.83 | -6.48 | -2.36 | 0.78 | 0.91 | 0.03 | 2.17 | -2.73 | 3.55 | -1.72 | -4.79 | -12.91 | -15.28 | -19.52 | -18.74 | -26.68 | -27.70 | -30.68 | -36.10 | -36.89 | -32.82 | -34.81 | NA | |
| Net Income Loss | -16.07 | -24.40 | -19.81 | -23.71 | -29.14 | -32.89 | -33.25 | -28.51 | -22.24 | -18.10 | -19.61 | -22.22 | -17.90 | -24.89 | -29.86 | -29.10 | -31.16 | -35.54 | -29.87 | -32.55 | -46.38 | -45.51 | -41.21 | -43.88 | -43.49 | |
| Increase Decrease In Accounts Receivable | -4.70 | -22.07 | 25.64 | 4.17 | 2.51 | -17.52 | 25.25 | 7.75 | -1.85 | -15.27 | 10.48 | 2.85 | 5.29 | -18.32 | 13.92 | 2.92 | -5.07 | -12.21 | 18.62 | 2.54 | -1.15 | -7.07 | 12.62 | 0.92 | NA | |
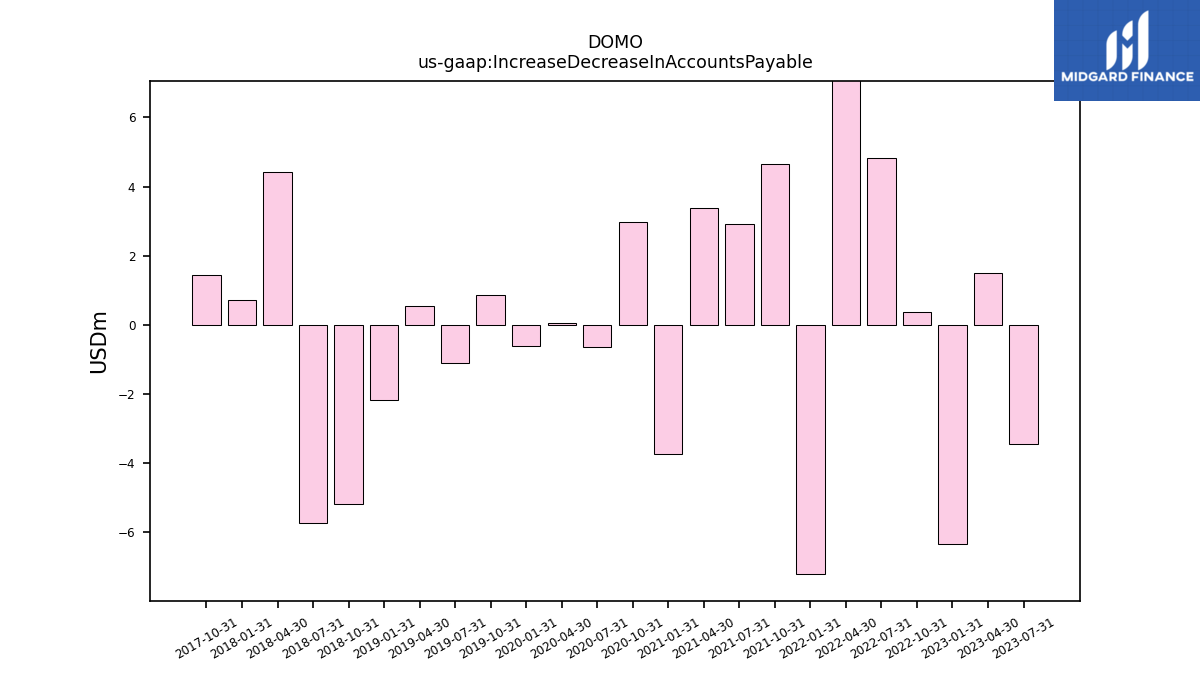
| Increase Decrease In Accounts Payable | -3.45 | 1.49 | -6.34 | 0.38 | 4.82 | 8.09 | -7.21 | 4.65 | 2.93 | 3.38 | -3.74 | 2.99 | -0.64 | 0.04 | -0.60 | 0.86 | -1.11 | 0.55 | -2.17 | -5.19 | -5.72 | 4.43 | 0.72 | 1.45 | NA | |
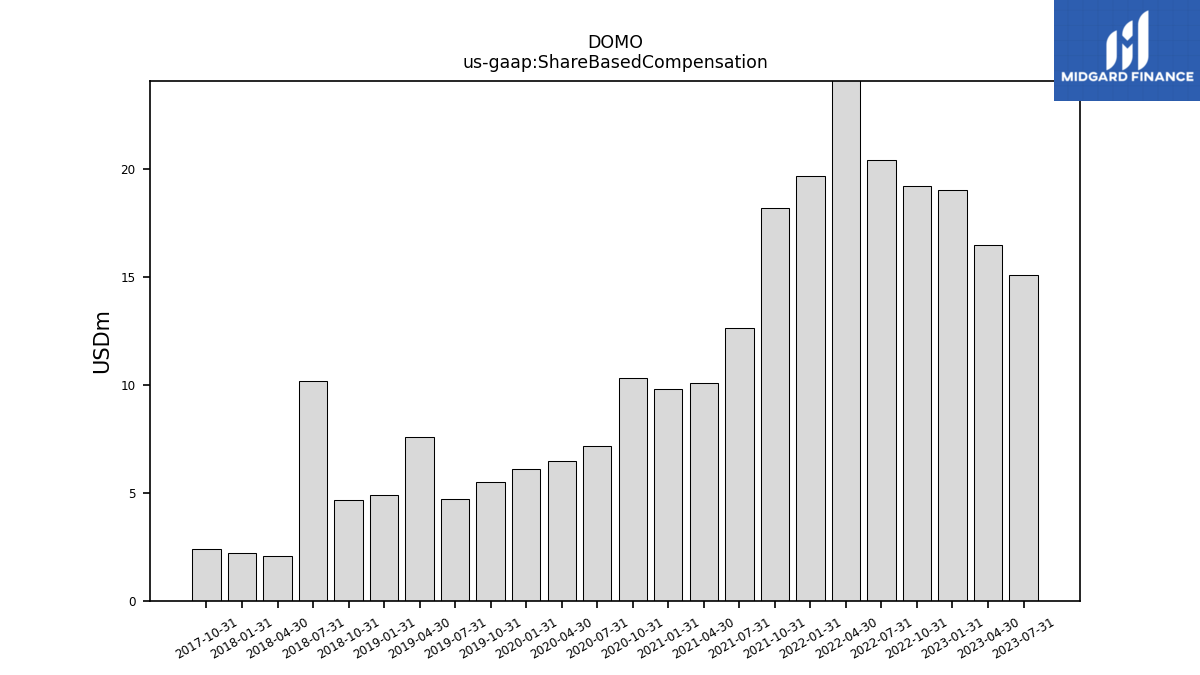
| Share Based Compensation | 15.06 | 16.47 | 19.00 | 19.21 | 20.39 | 25.26 | 19.68 | 18.16 | 12.63 | 10.06 | 9.80 | 10.29 | 7.18 | 6.48 | 6.10 | 5.48 | 4.69 | 7.58 | 4.89 | 4.65 | 10.17 | 2.09 | 2.21 | 2.38 | NA |
| 2023-07-31 | 2023-04-30 | 2023-01-31 | 2022-10-31 | 2022-07-31 | 2022-04-30 | 2022-01-31 | 2021-10-31 | 2021-07-31 | 2021-04-30 | 2021-01-31 | 2020-10-31 | 2020-07-31 | 2020-04-30 | 2020-01-31 | 2019-10-31 | 2019-07-31 | 2019-04-30 | 2019-01-31 | 2018-10-31 | 2018-07-31 | 2018-04-30 | 2018-01-31 | 2017-10-31 | 2017-07-31 | ||
|---|---|---|---|---|---|---|---|---|---|---|---|---|---|---|---|---|---|---|---|---|---|---|---|---|---|---|
| Net Cash Provided By Used In Investing Activities | -2.95 | -3.58 | -2.92 | -1.66 | -1.48 | -1.94 | -1.55 | -1.55 | -1.64 | -1.78 | -1.44 | 3.79 | 5.91 | 3.98 | 2.88 | 11.93 | 25.86 | -64.48 | -3.30 | -1.47 | -1.59 | -1.62 | NA | NA | NA | |
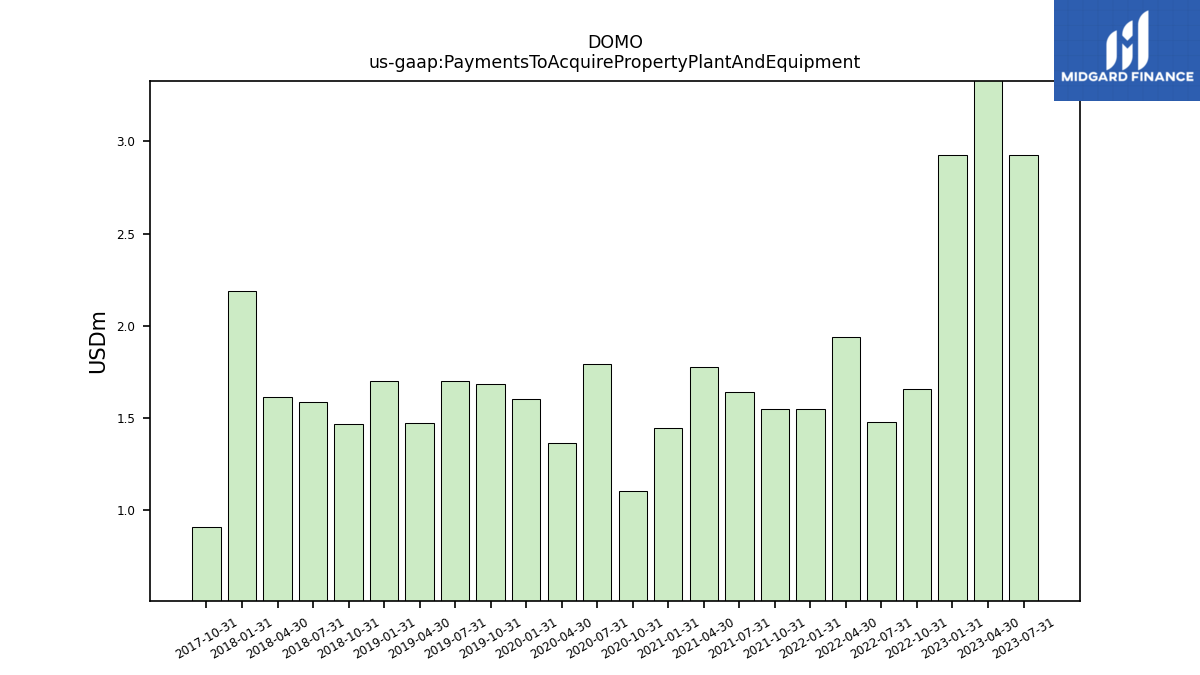
| Payments To Acquire Property Plant And Equipment | 2.92 | 3.58 | 2.92 | 1.66 | 1.48 | 1.94 | 1.55 | 1.55 | 1.64 | 1.78 | 1.45 | 1.10 | 1.79 | 1.36 | 1.61 | 1.68 | 1.70 | 1.47 | 1.70 | 1.47 | 1.59 | 1.62 | 2.19 | 0.91 | NA |
| 2023-07-31 | 2023-04-30 | 2023-01-31 | 2022-10-31 | 2022-07-31 | 2022-04-30 | 2022-01-31 | 2021-10-31 | 2021-07-31 | 2021-04-30 | 2021-01-31 | 2020-10-31 | 2020-07-31 | 2020-04-30 | 2020-01-31 | 2019-10-31 | 2019-07-31 | 2019-04-30 | 2019-01-31 | 2018-10-31 | 2018-07-31 | 2018-04-30 | 2018-01-31 | 2017-10-31 | 2017-07-31 | ||
|---|---|---|---|---|---|---|---|---|---|---|---|---|---|---|---|---|---|---|---|---|---|---|---|---|---|---|
| Net Cash Provided By Used In Financing Activities | 0.00 | 2.03 | 0.00 | 0.06 | 0.08 | 2.29 | 0.26 | -0.54 | 1.18 | -1.46 | 4.56 | 3.35 | 1.55 | 3.63 | -0.22 | 3.27 | -0.02 | 4.96 | 1.98 | -0.65 | 204.56 | 48.44 | 49.32 | 0.21 | NA |
| 2023-07-31 | 2023-04-30 | 2023-01-31 | 2022-10-31 | 2022-07-31 | 2022-04-30 | 2022-01-31 | 2021-10-31 | 2021-07-31 | 2021-04-30 | 2021-01-31 | 2020-10-31 | 2020-07-31 | 2020-04-30 | 2020-01-31 | 2019-10-31 | 2019-07-31 | 2019-04-30 | 2019-01-31 | 2018-10-31 | 2018-07-31 | 2018-04-30 | 2018-01-31 | 2017-10-31 | 2017-07-31 | ||
|---|---|---|---|---|---|---|---|---|---|---|---|---|---|---|---|---|---|---|---|---|---|---|---|---|---|---|
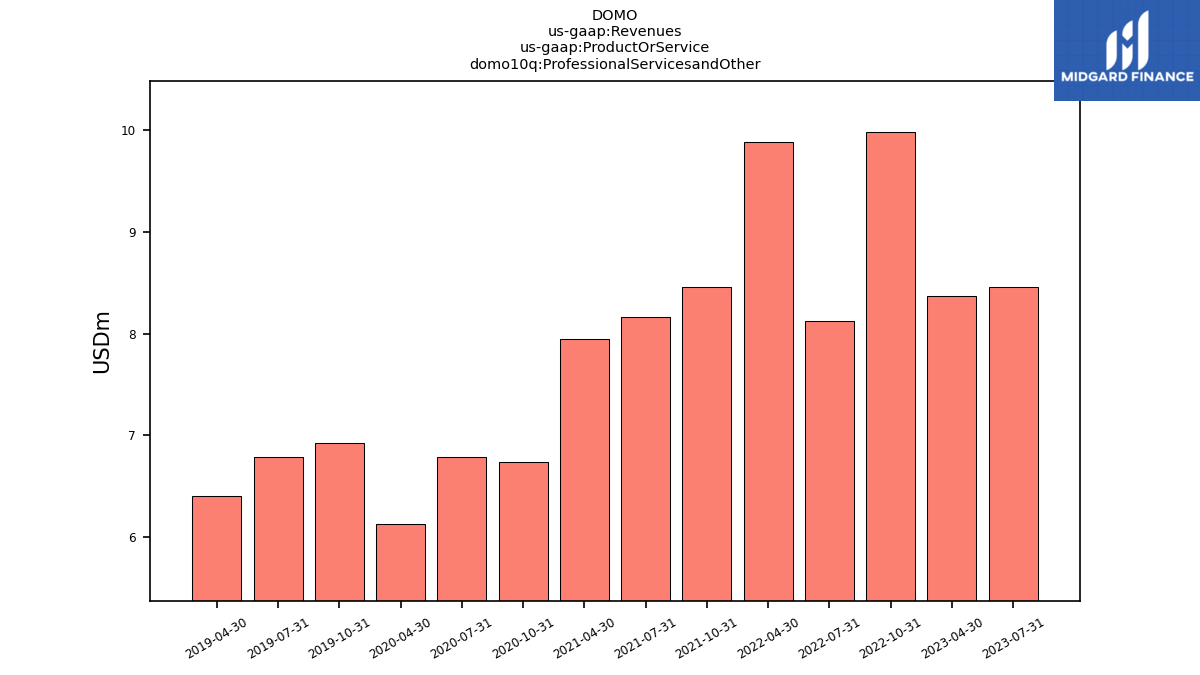
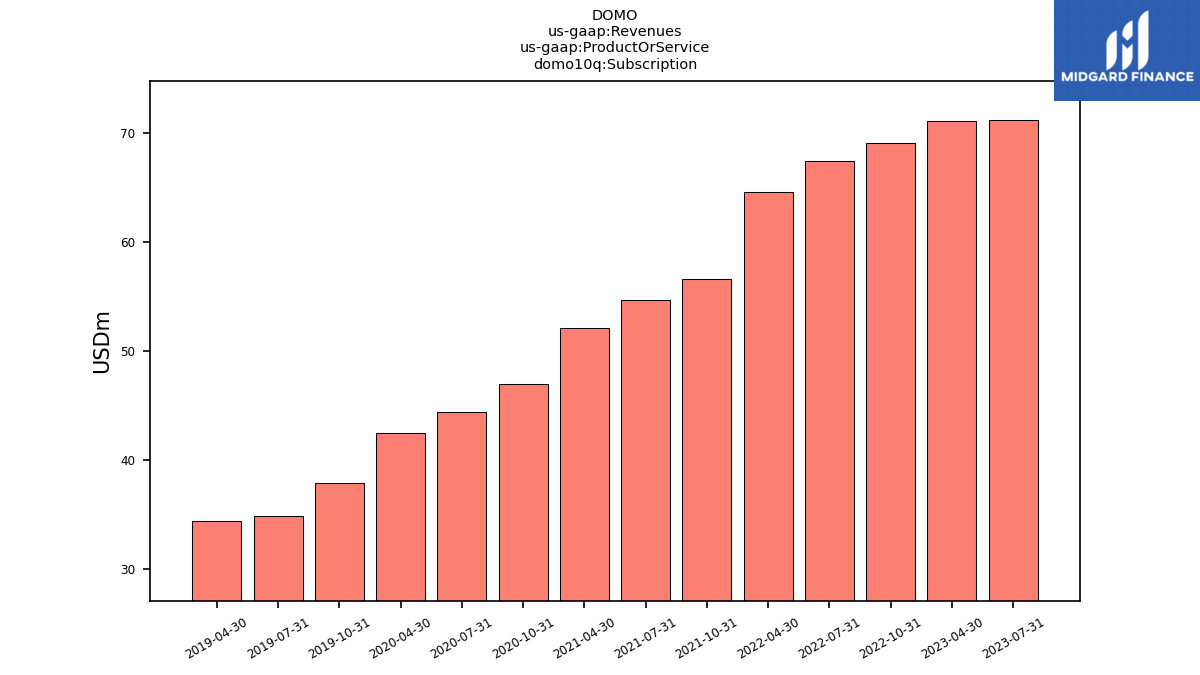
| Revenues | 79.67 | 79.46 | 79.62 | 79.03 | 75.53 | 74.46 | 69.99 | 65.08 | 62.83 | 60.06 | 56.84 | 53.65 | 51.13 | 48.56 | 46.17 | 44.77 | 41.66 | 40.80 | 39.41 | 36.84 | 34.27 | 31.95 | 30.07 | 28.30 | 25.90 | |
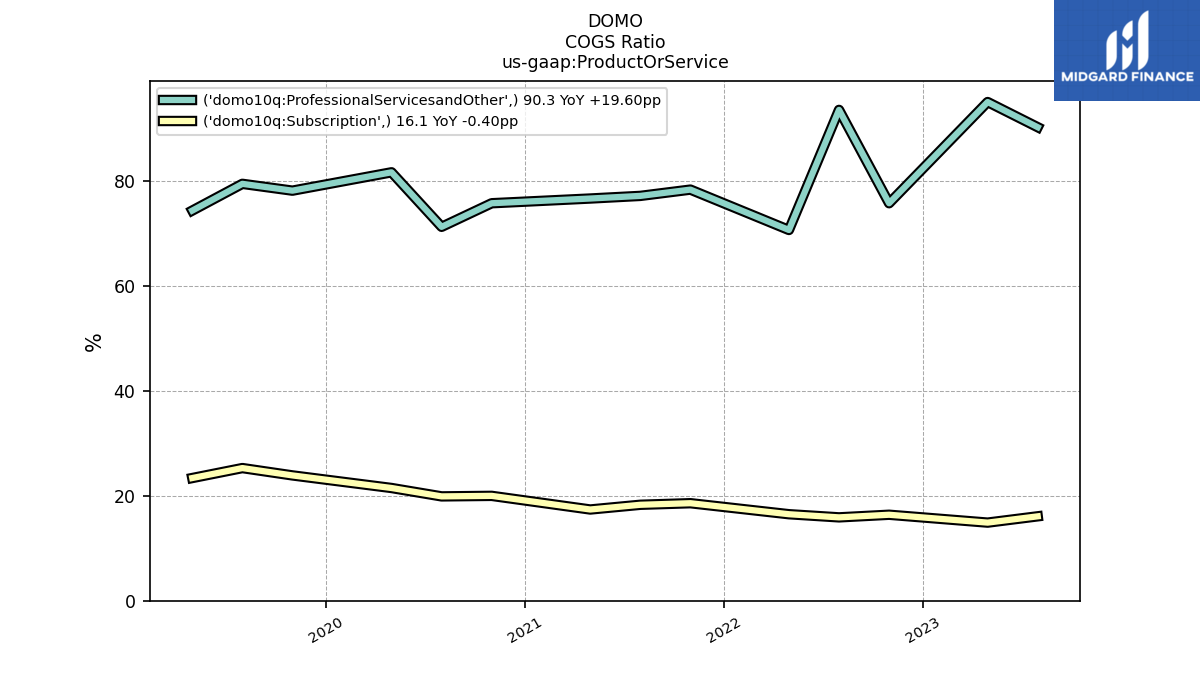
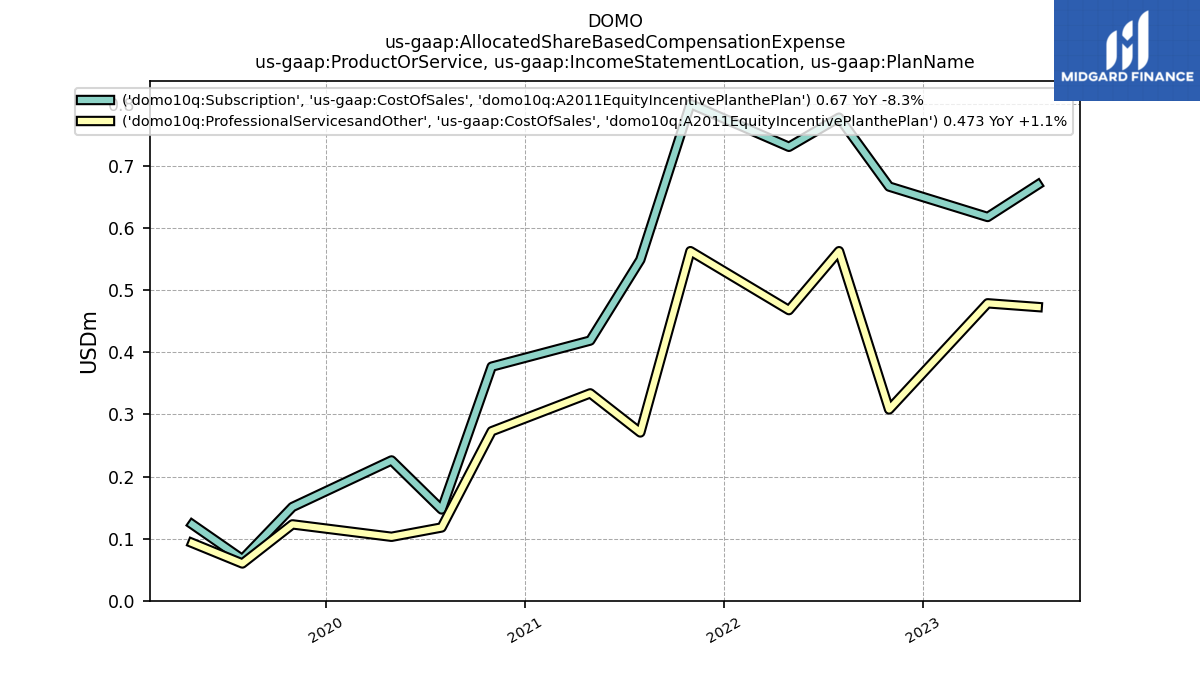
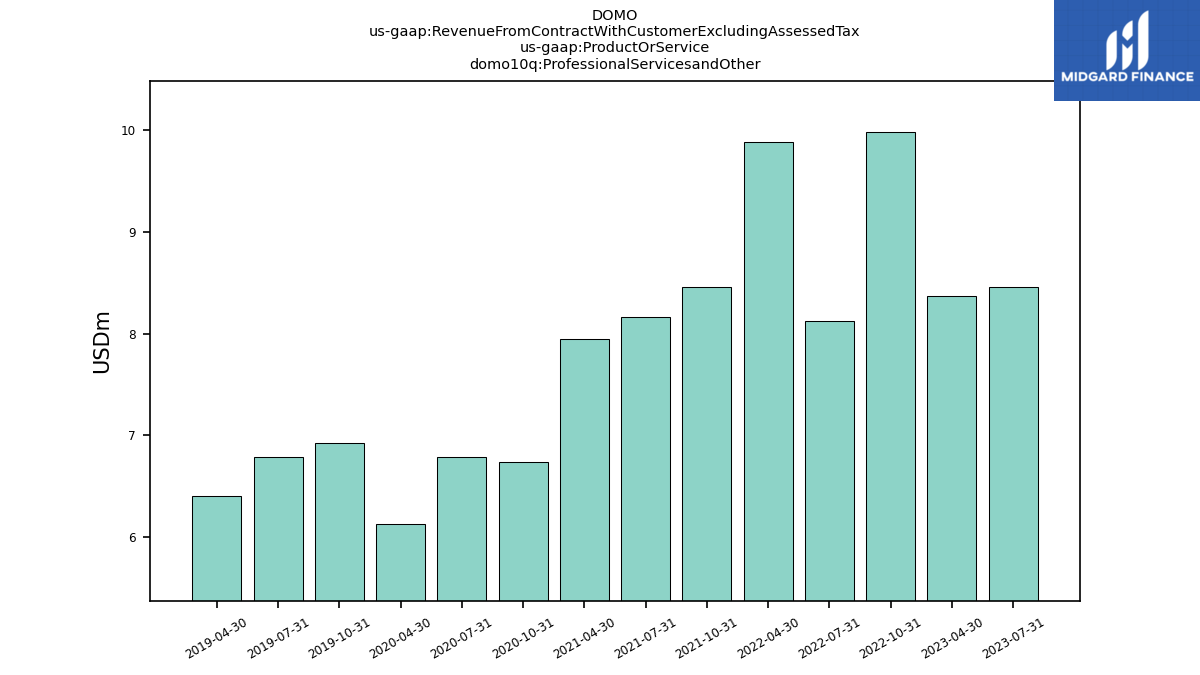
| Professional Servicesand Other | 8.46 | 8.37 | NA | 9.98 | 8.12 | 9.89 | NA | 8.46 | 8.16 | 7.95 | NA | 6.74 | 6.78 | 6.12 | NA | 6.92 | 6.79 | 6.41 | NA | NA | NA | NA | NA | NA | NA | |
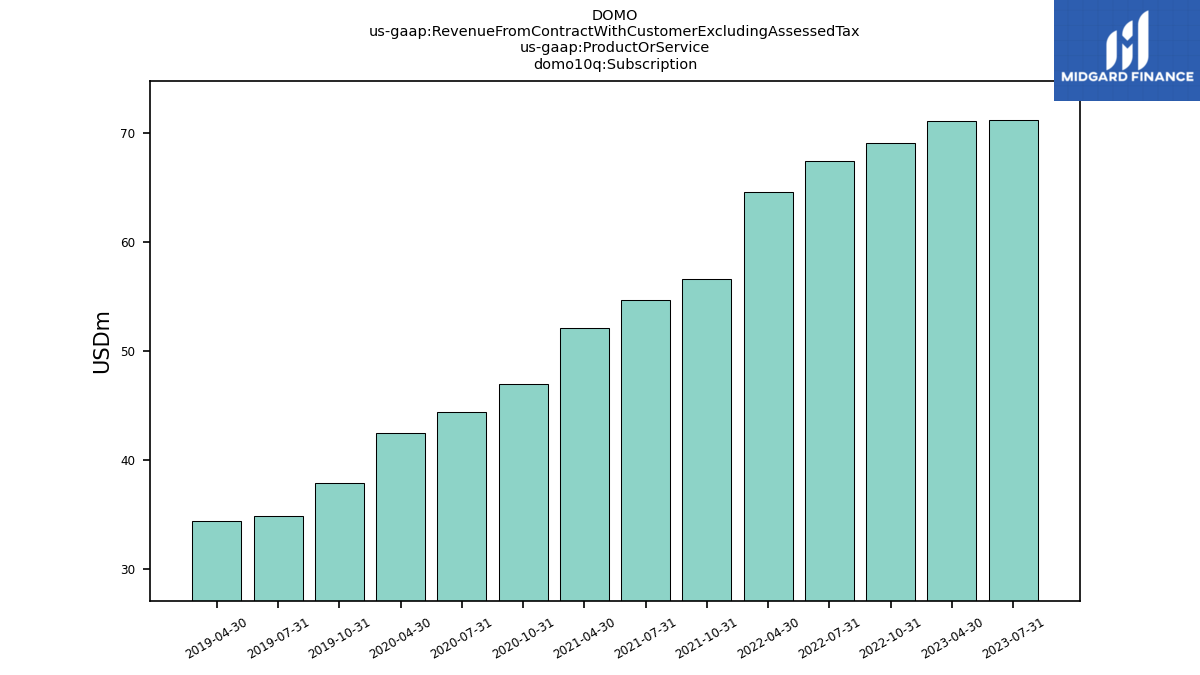
| Subscription | 71.21 | 71.09 | NA | 69.04 | 67.41 | 64.58 | NA | 56.62 | 54.67 | 52.11 | NA | 46.91 | 44.35 | 42.44 | NA | 37.84 | 34.87 | 34.39 | NA | NA | NA | NA | NA | NA | NA | |
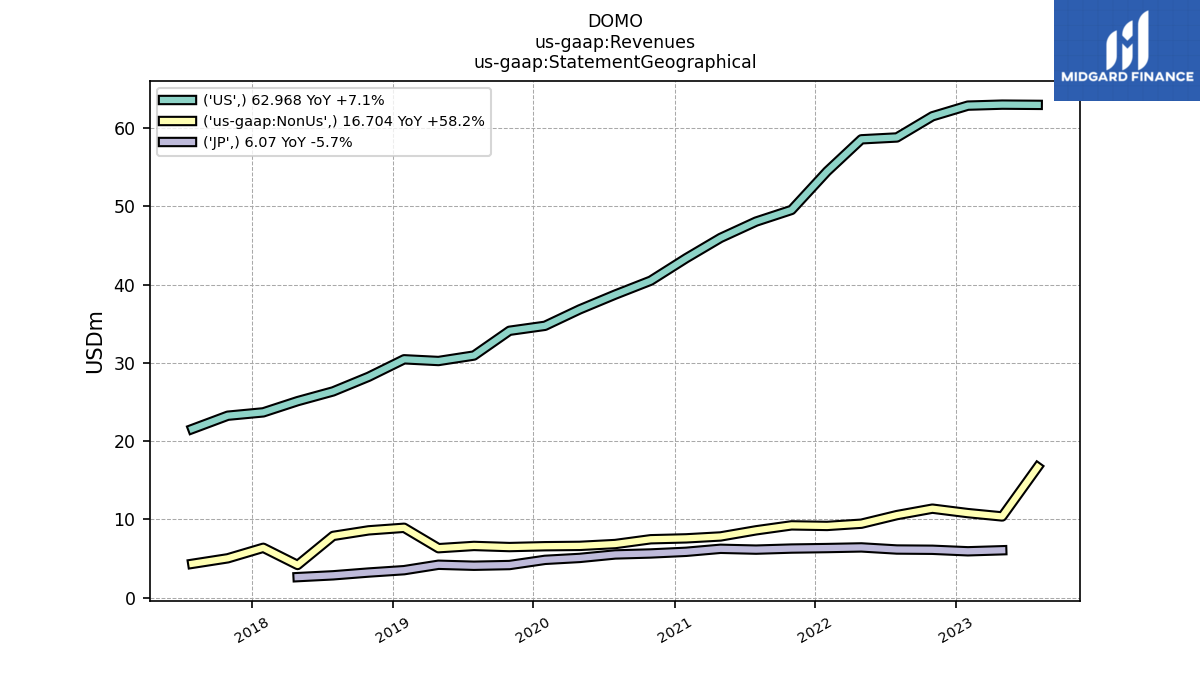
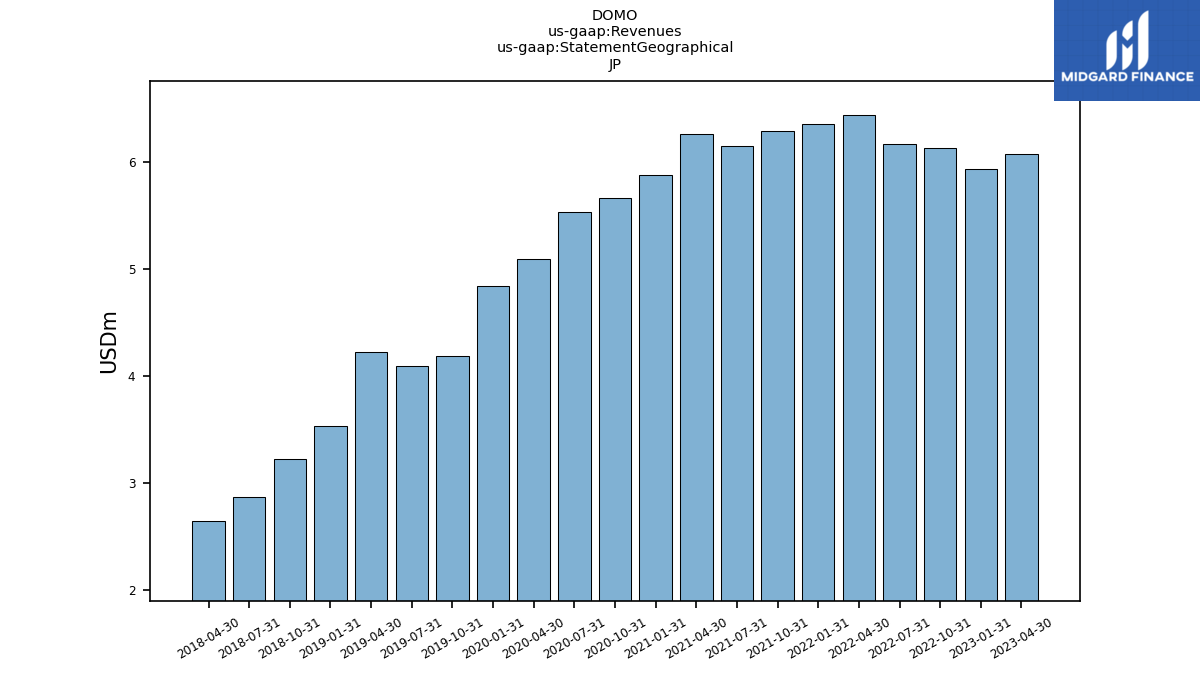
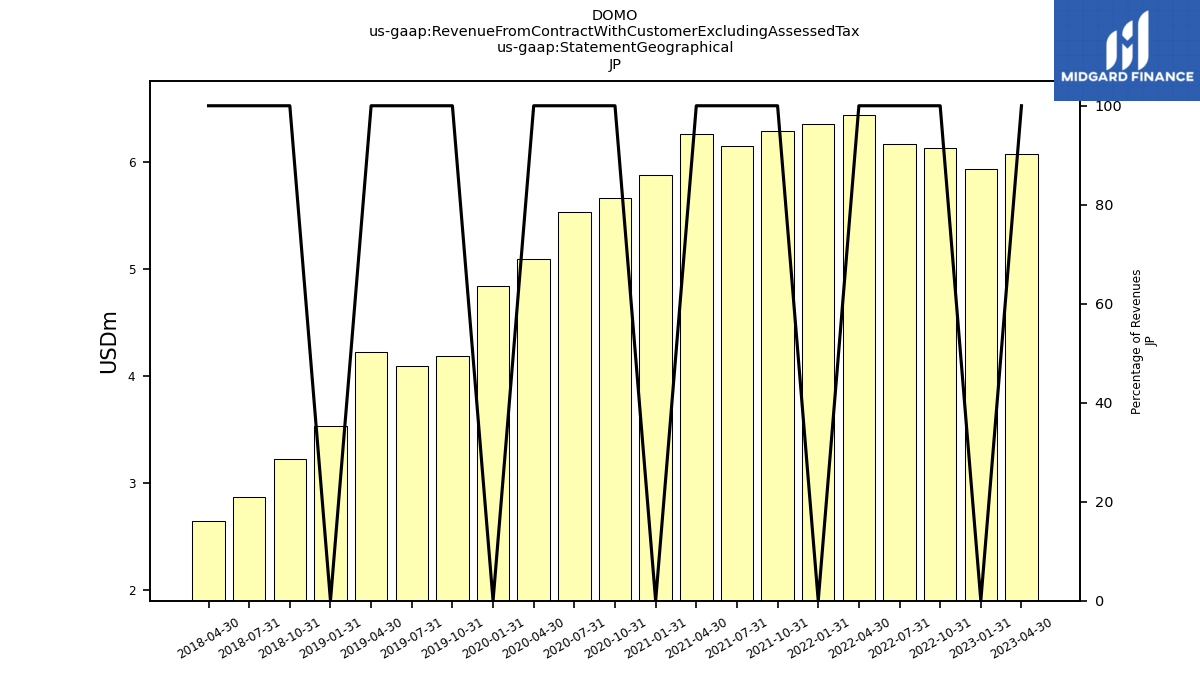
| NA | 6.07 | 5.94 | 6.13 | 6.17 | 6.43 | 6.35 | 6.29 | 6.15 | 6.26 | 5.87 | 5.66 | 5.53 | 5.09 | 4.84 | 4.18 | 4.09 | 4.22 | 3.53 | 3.23 | 2.87 | 2.64 | NA | NA | NA | ||
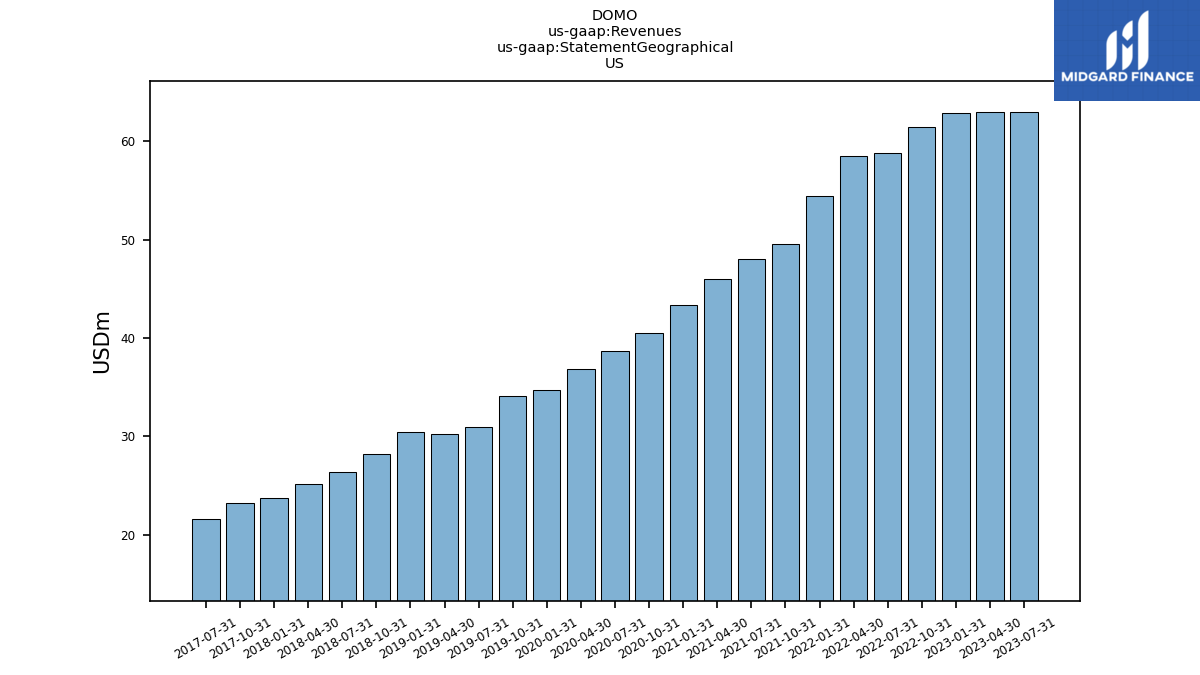
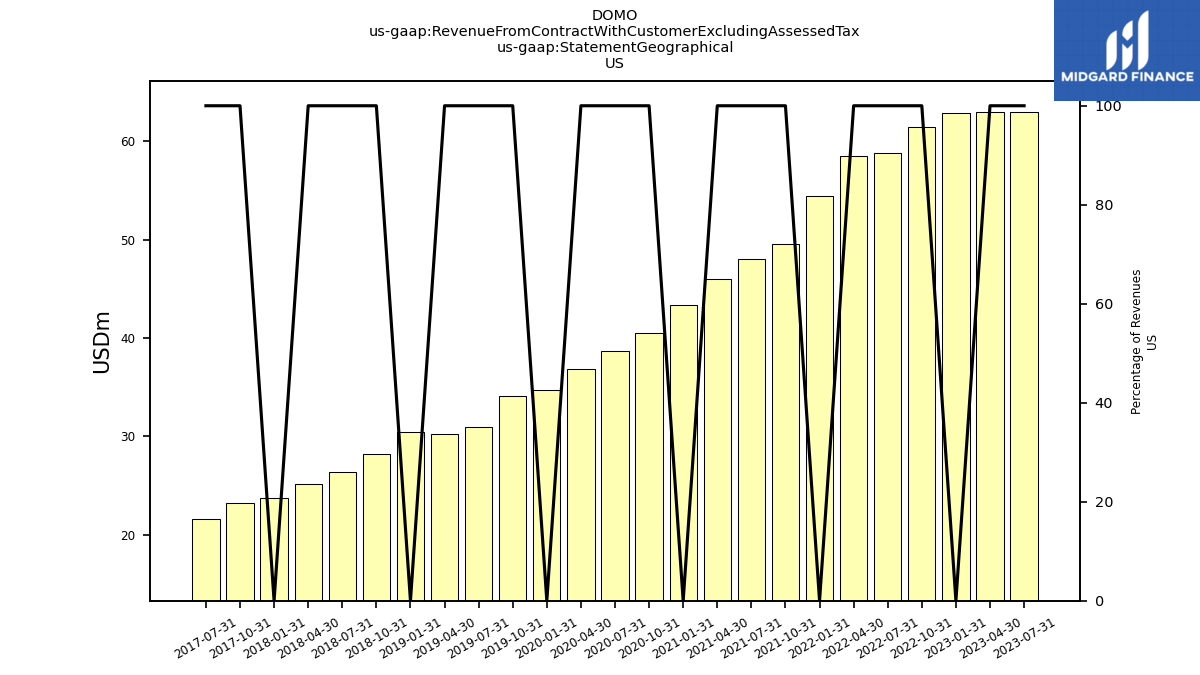
| US | 62.97 | 63.00 | 62.87 | 61.51 | 58.80 | 58.57 | 54.47 | 49.55 | 48.06 | 45.97 | 43.38 | 40.51 | 38.73 | 36.84 | 34.74 | 34.11 | 30.95 | 30.25 | 30.47 | 28.23 | 26.36 | 25.12 | 23.69 | 23.26 | 21.56 | |
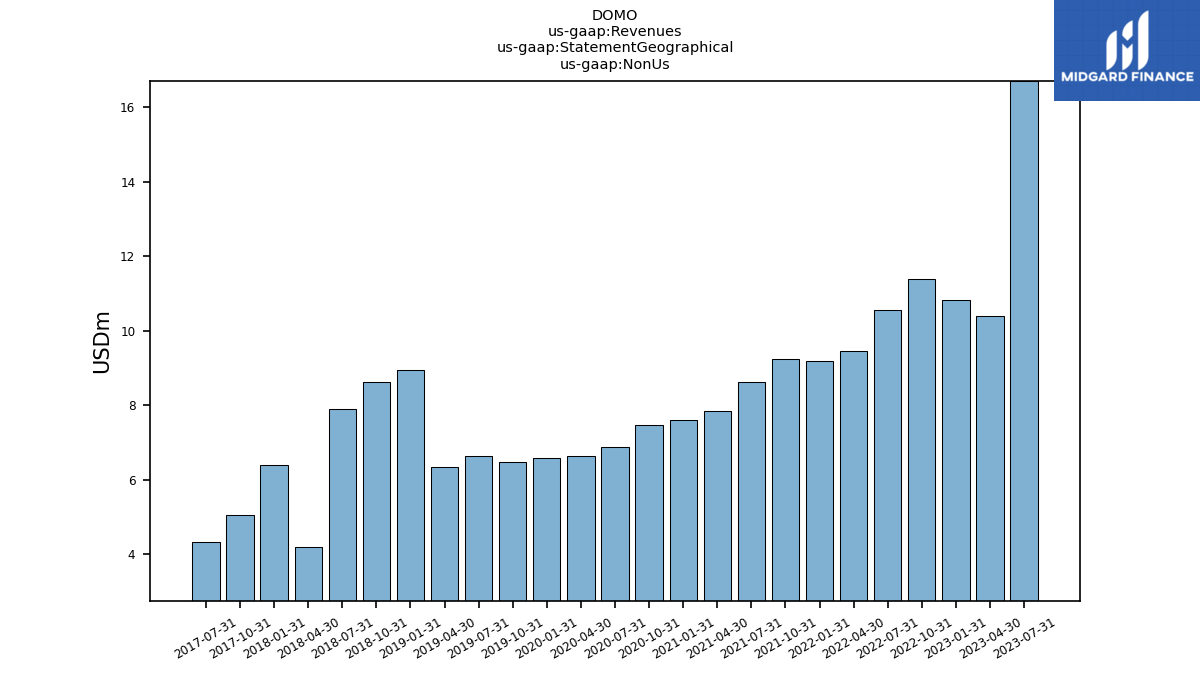
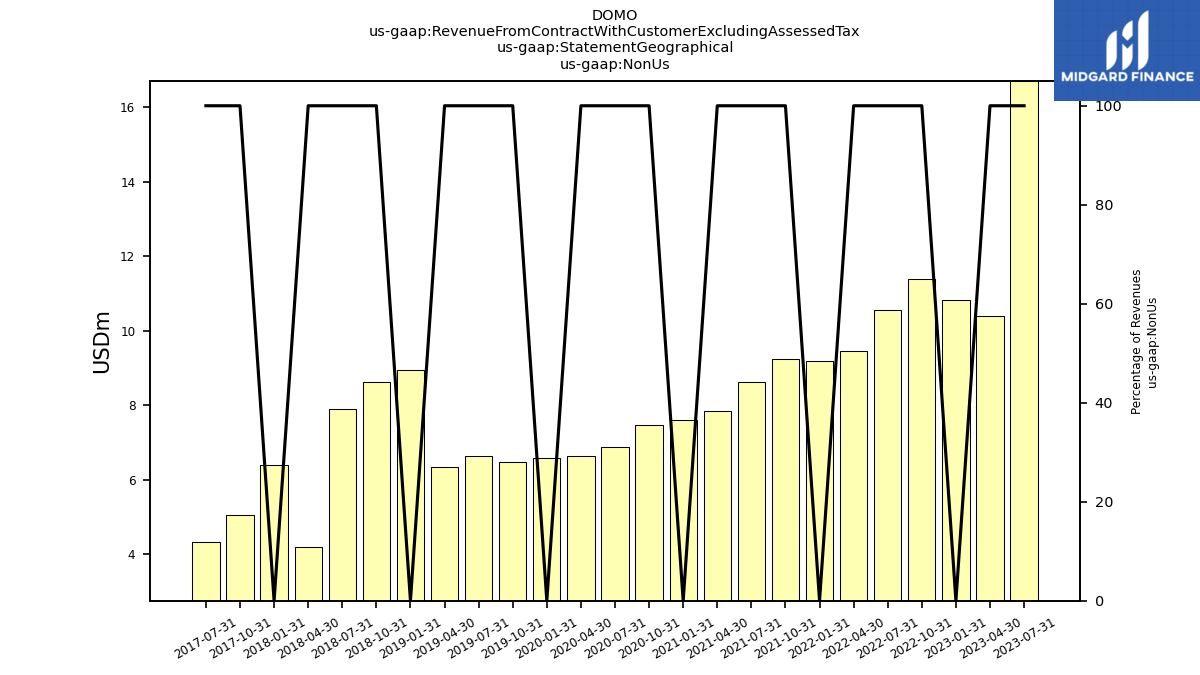
| Non Us | 16.70 | 10.39 | 10.82 | 11.38 | 10.56 | 9.46 | 9.18 | 9.25 | 8.62 | 7.83 | 7.59 | 7.48 | 6.87 | 6.63 | 6.58 | 6.48 | 6.62 | 6.33 | 8.94 | 8.61 | 7.90 | 4.19 | 6.39 | 5.04 | 4.34 | |
| Revenue From Contract With Customer Excluding Assessed Tax | 79.67 | 79.46 | 79.62 | 79.03 | 75.53 | 74.46 | 69.99 | 65.08 | 62.83 | 60.06 | 56.84 | 53.65 | 51.13 | 48.56 | 46.17 | 44.77 | 41.66 | 40.80 | 39.41 | 36.84 | 34.27 | 31.95 | 30.07 | 28.30 | 25.90 | |
| Professional Servicesand Other | 8.46 | 8.37 | NA | 9.98 | 8.12 | 9.89 | NA | 8.46 | 8.16 | 7.95 | NA | 6.74 | 6.78 | 6.12 | NA | 6.92 | 6.79 | 6.41 | NA | NA | NA | NA | NA | NA | NA | |
| Subscription | 71.21 | 71.09 | NA | 69.04 | 67.41 | 64.58 | NA | 56.62 | 54.67 | 52.11 | NA | 46.91 | 44.35 | 42.44 | NA | 37.84 | 34.87 | 34.39 | NA | NA | NA | NA | NA | NA | NA | |
| NA | 6.07 | 5.94 | 6.13 | 6.17 | 6.43 | 6.35 | 6.29 | 6.15 | 6.26 | 5.87 | 5.66 | 5.53 | 5.09 | 4.84 | 4.18 | 4.09 | 4.22 | 3.53 | 3.23 | 2.87 | 2.64 | NA | NA | NA | ||
| US | 62.97 | 63.00 | 62.87 | 61.51 | 58.80 | 58.57 | 54.47 | 49.55 | 48.06 | 45.97 | 43.38 | 40.51 | 38.73 | 36.84 | 34.74 | 34.11 | 30.95 | 30.25 | 30.47 | 28.23 | 26.36 | 25.12 | 23.69 | 23.26 | 21.56 | |
| Non Us | 16.70 | 10.39 | 10.82 | 11.38 | 10.56 | 9.46 | 9.18 | 9.25 | 8.62 | 7.83 | 7.59 | 7.48 | 6.87 | 6.63 | 6.58 | 6.48 | 6.62 | 6.33 | 8.94 | 8.61 | 7.90 | 4.19 | 6.39 | 5.04 | 4.34 |


