
| 2024-02-03 | 2023-10-28 | 2023-07-29 | 2023-04-29 | 2023-01-28 | 2022-10-29 | 2022-07-30 | 2022-04-30 | 2022-01-29 | 2021-10-30 | 2021-07-31 | 2021-05-01 | 2021-01-30 | 2020-10-31 | 2020-08-01 | 2020-05-02 | 2020-02-01 | 2019-11-02 | 2019-08-03 | 2019-05-04 | 2019-02-02 | 2018-11-03 | 2018-08-04 | 2018-05-05 | 2018-02-03 | 2017-10-28 | 2017-07-29 | 2017-04-29 | 2017-01-28 | 2016-10-29 | 2016-07-30 | 2016-04-30 | 2016-01-30 | 2015-10-31 | 2015-08-01 | 2015-05-02 | 2015-01-31 | 2014-11-01 | 2014-08-02 | 2014-05-03 | 2014-02-01 | 2013-11-02 | 2013-08-03 | 2013-05-04 | 2013-02-02 | 2012-10-27 | 2012-07-28 | 2012-04-28 | 2012-01-28 | 2011-10-29 | 2011-07-30 | 2011-01-29 | ||
|---|---|---|---|---|---|---|---|---|---|---|---|---|---|---|---|---|---|---|---|---|---|---|---|---|---|---|---|---|---|---|---|---|---|---|---|---|---|---|---|---|---|---|---|---|---|---|---|---|---|---|---|---|---|
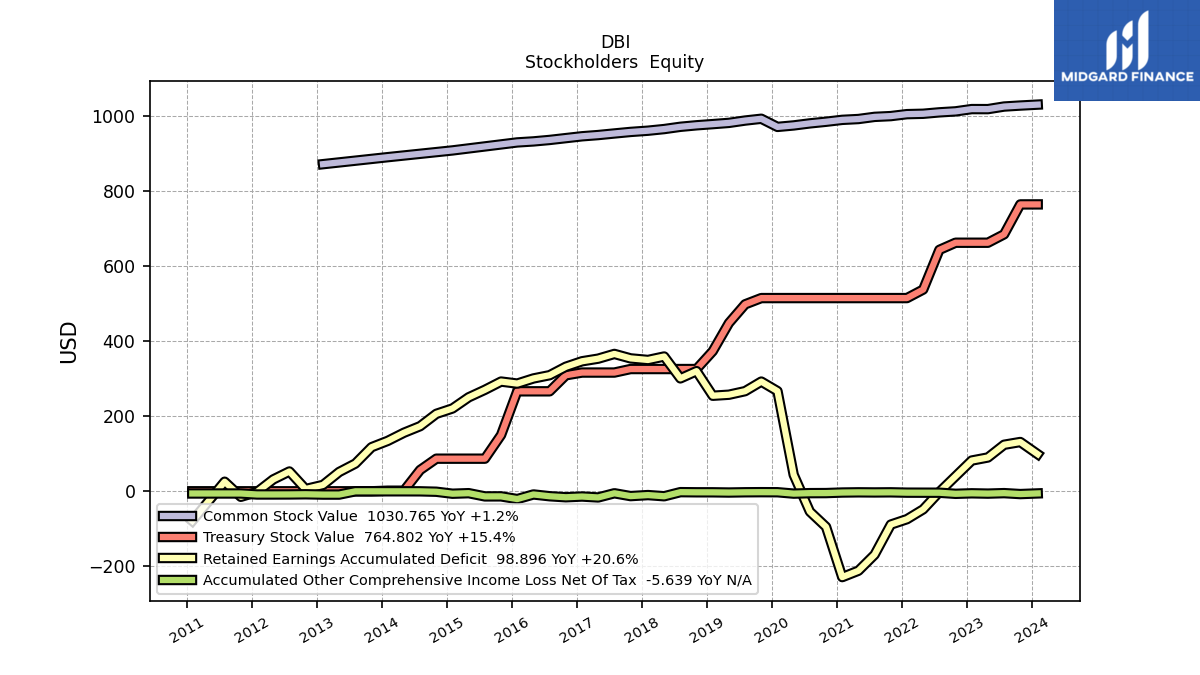
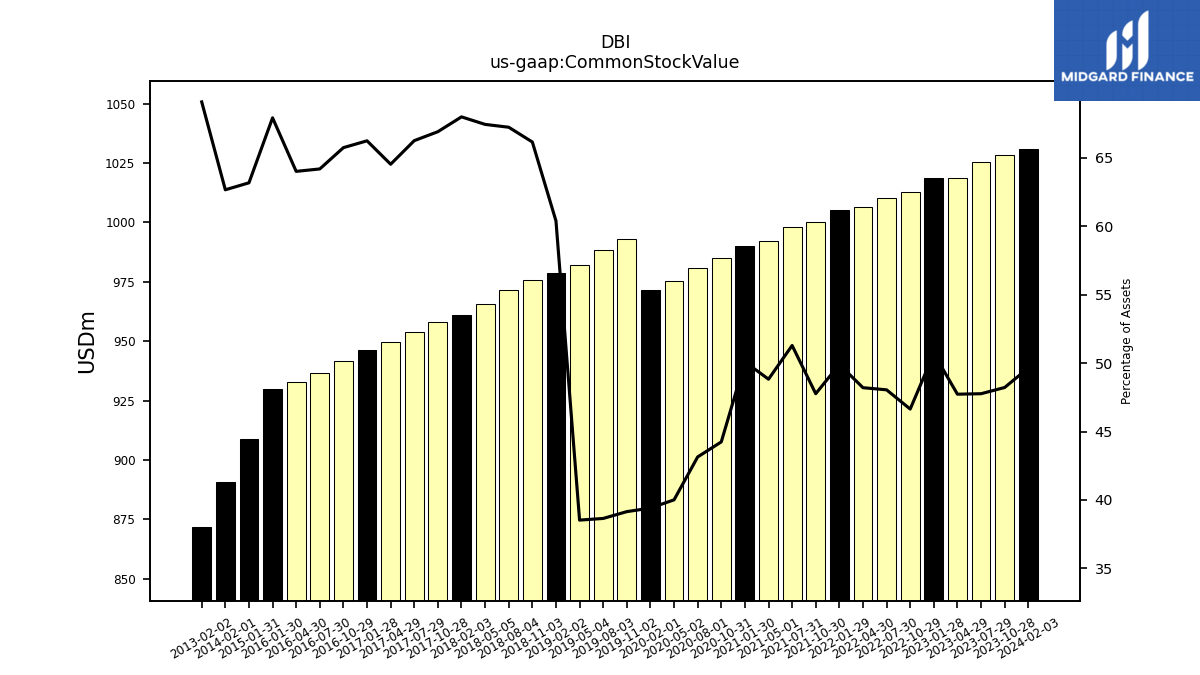
| Common Stock Value | 1030.77 | 1028.31 | 1025.66 | 1018.77 | 1018.87 | 1012.79 | 1010.18 | 1006.38 | 1005.38 | 1000.18 | 998.12 | 992.38 | 990.15 | 985.12 | 980.75 | 975.30 | 971.38 | 993.09 | 988.30 | 982.09 | 978.79 | 975.66 | 971.65 | 965.62 | 961.25 | 957.96 | 953.87 | 949.64 | 946.35 | 941.49 | 936.57 | 932.70 | 930.01 | NA | NA | NA | 908.68 | NA | NA | NA | 890.70 | NA | NA | NA | 872.03 | NA | NA | NA | NA | NA | NA | NA |
| 2024-02-03 | 2023-10-28 | 2023-07-29 | 2023-04-29 | 2023-01-28 | 2022-10-29 | 2022-07-30 | 2022-04-30 | 2022-01-29 | 2021-10-30 | 2021-07-31 | 2021-05-01 | 2021-01-30 | 2020-10-31 | 2020-08-01 | 2020-05-02 | 2020-02-01 | 2019-11-02 | 2019-08-03 | 2019-05-04 | 2019-02-02 | 2018-11-03 | 2018-08-04 | 2018-05-05 | 2018-02-03 | 2017-10-28 | 2017-07-29 | 2017-04-29 | 2017-01-28 | 2016-10-29 | 2016-07-30 | 2016-04-30 | 2016-01-30 | 2015-10-31 | 2015-08-01 | 2015-05-02 | 2015-01-31 | 2014-11-01 | 2014-08-02 | 2014-05-03 | 2014-02-01 | 2013-11-02 | 2013-08-03 | 2013-05-04 | 2013-02-02 | 2012-10-27 | 2012-07-28 | 2012-04-28 | 2012-01-28 | 2011-10-29 | 2011-07-30 | 2011-01-29 | ||
|---|---|---|---|---|---|---|---|---|---|---|---|---|---|---|---|---|---|---|---|---|---|---|---|---|---|---|---|---|---|---|---|---|---|---|---|---|---|---|---|---|---|---|---|---|---|---|---|---|---|---|---|---|---|
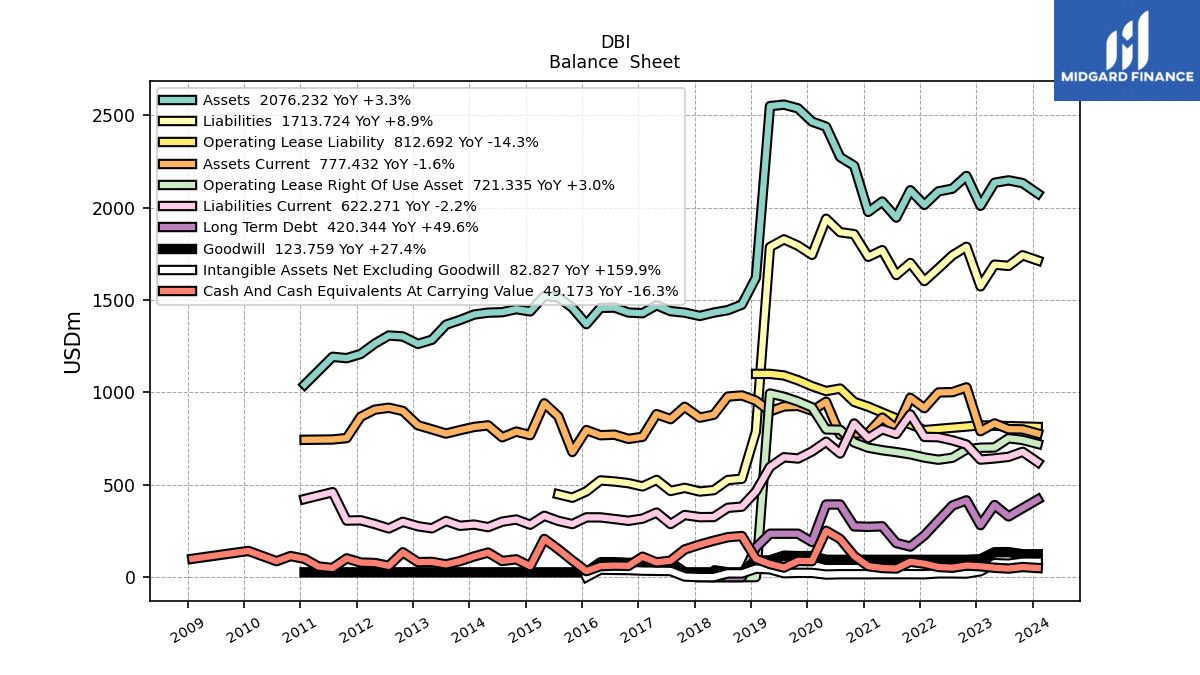
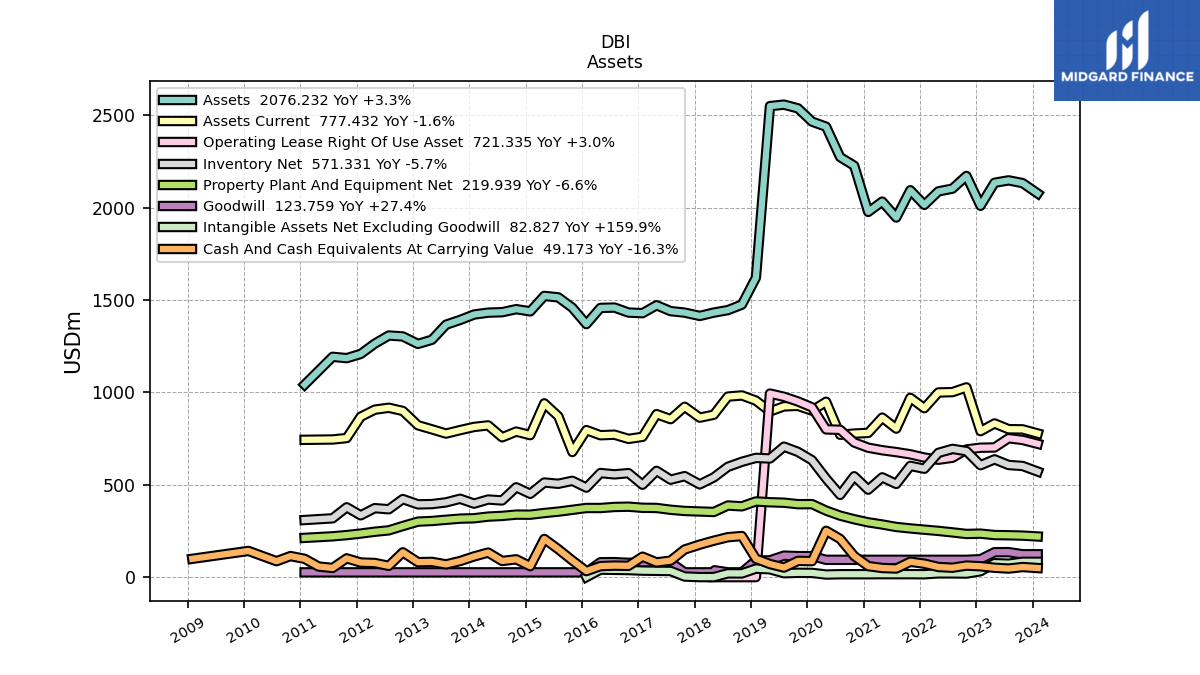
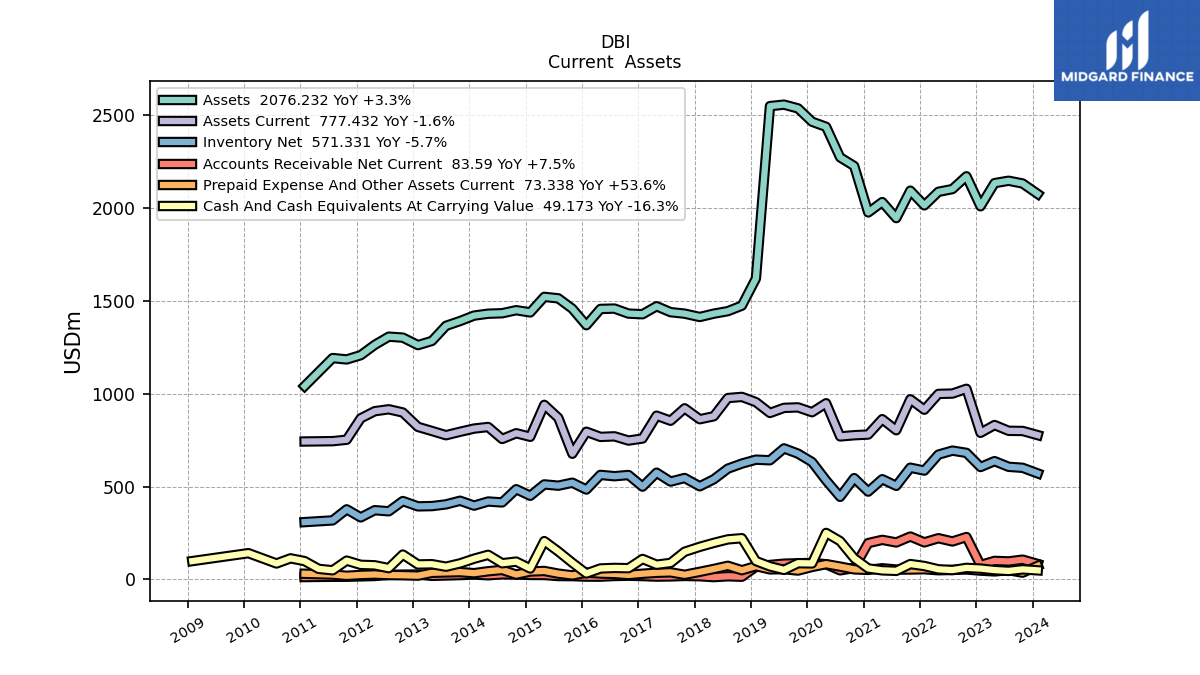
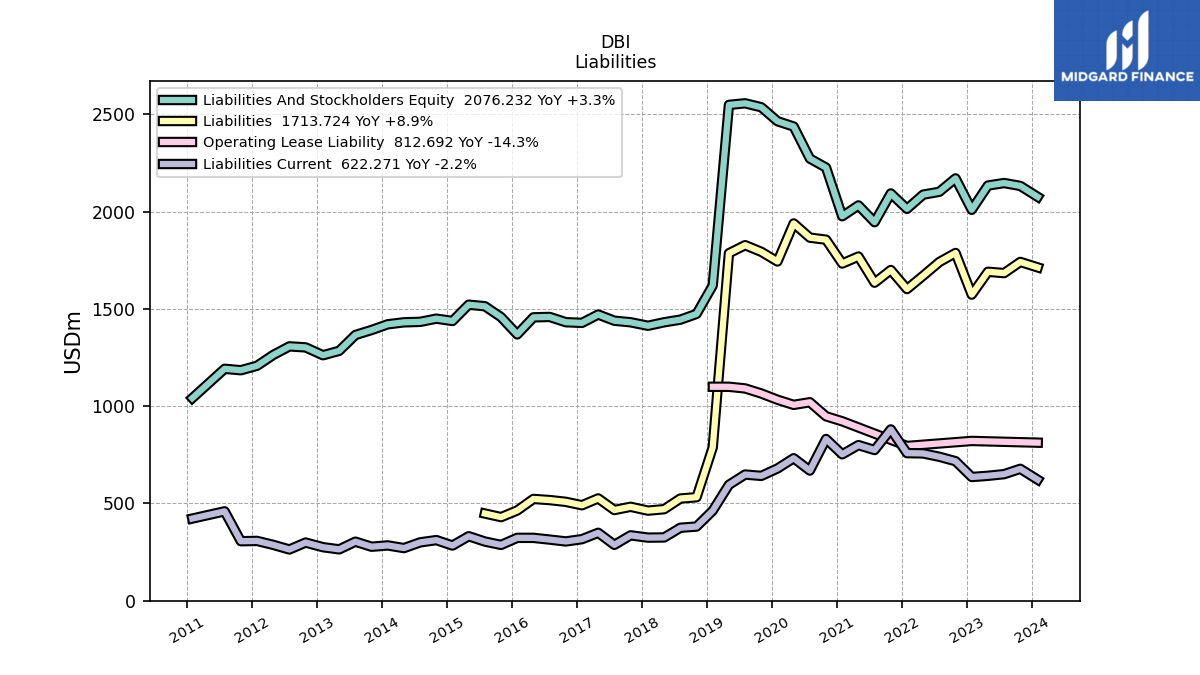
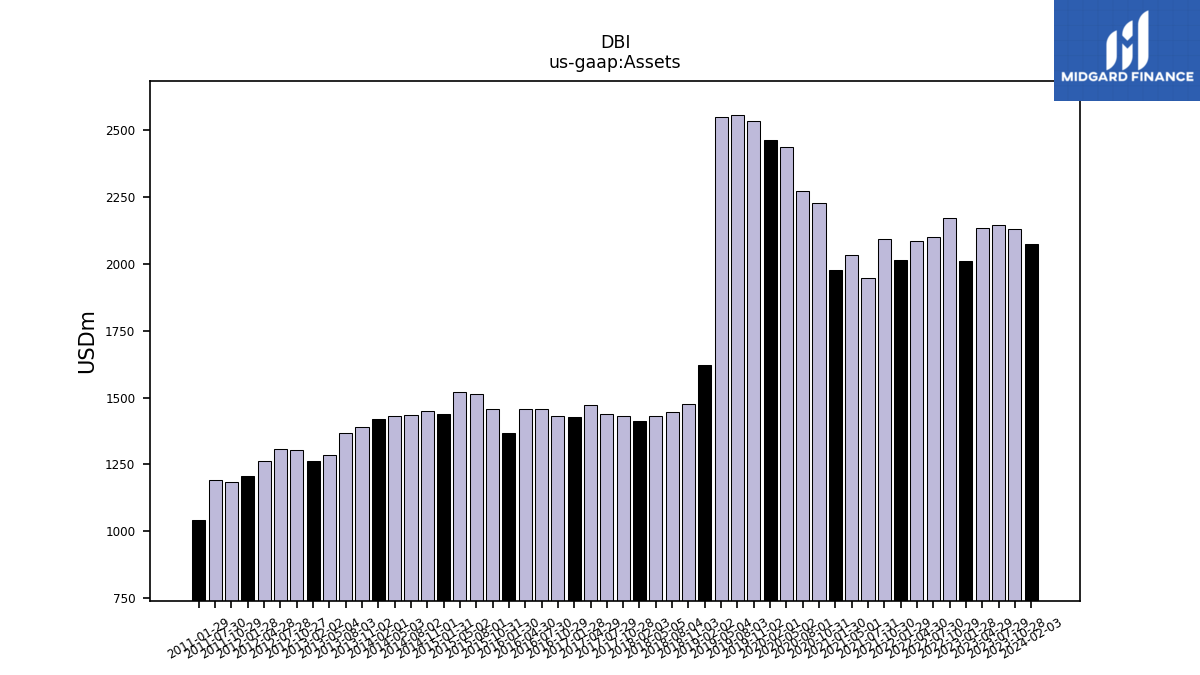
| Assets | 2076.23 | 2132.58 | 2147.34 | 2134.49 | 2009.62 | 2171.38 | 2102.44 | 2087.74 | 2014.63 | 2093.94 | 1946.05 | 2032.46 | 1976.60 | 2226.72 | 2273.26 | 2437.84 | 2465.07 | 2536.98 | 2557.25 | 2549.17 | 1620.58 | 1474.63 | 1445.02 | 1431.62 | 1413.61 | 1431.58 | 1439.55 | 1471.46 | 1428.48 | 1431.91 | 1458.97 | 1456.99 | 1369.11 | 1458.03 | 1514.06 | 1521.96 | 1438.24 | 1450.23 | 1433.77 | 1431.35 | 1421.24 | 1391.77 | 1366.17 | 1284.77 | 1262.10 | 1302.56 | 1307.67 | 1263.61 | 1207.90 | 1185.03 | 1192.45 | 1041.48 | |
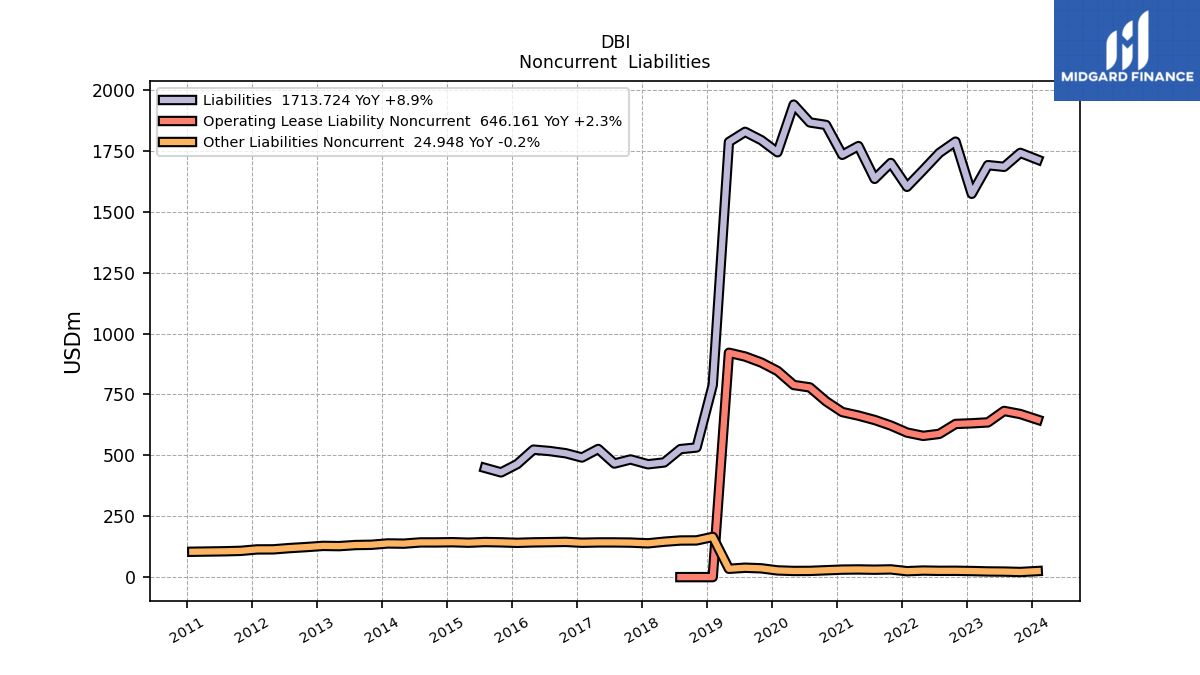
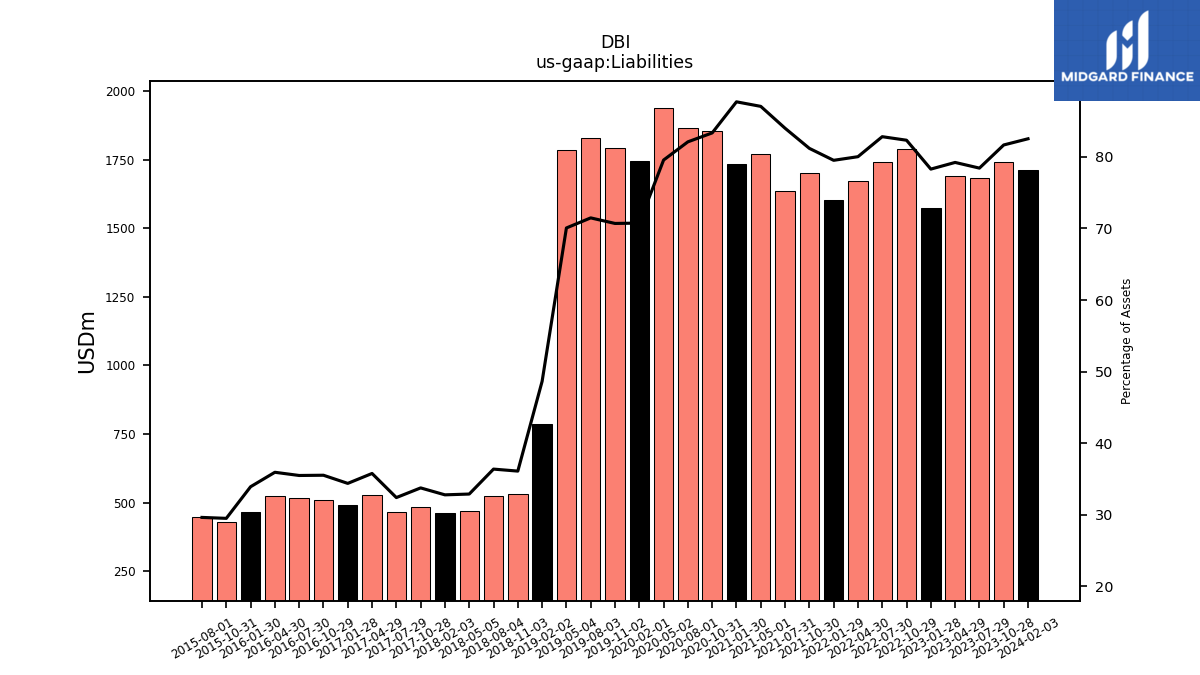
| Liabilities | 1713.72 | 1741.79 | 1684.38 | 1691.25 | 1573.56 | 1787.87 | 1741.49 | 1670.95 | 1602.24 | 1700.28 | 1634.94 | 1769.65 | 1733.58 | 1856.20 | 1866.63 | 1939.73 | 1744.16 | 1793.80 | 1828.00 | 1786.32 | 788.21 | 532.19 | 525.53 | 470.75 | 463.26 | 483.02 | 466.27 | 526.18 | 490.99 | 508.49 | 517.61 | 523.42 | 464.19 | 429.89 | 448.41 | NA | NA | NA | NA | NA | NA | NA | NA | NA | NA | NA | NA | NA | NA | NA | NA | NA | |
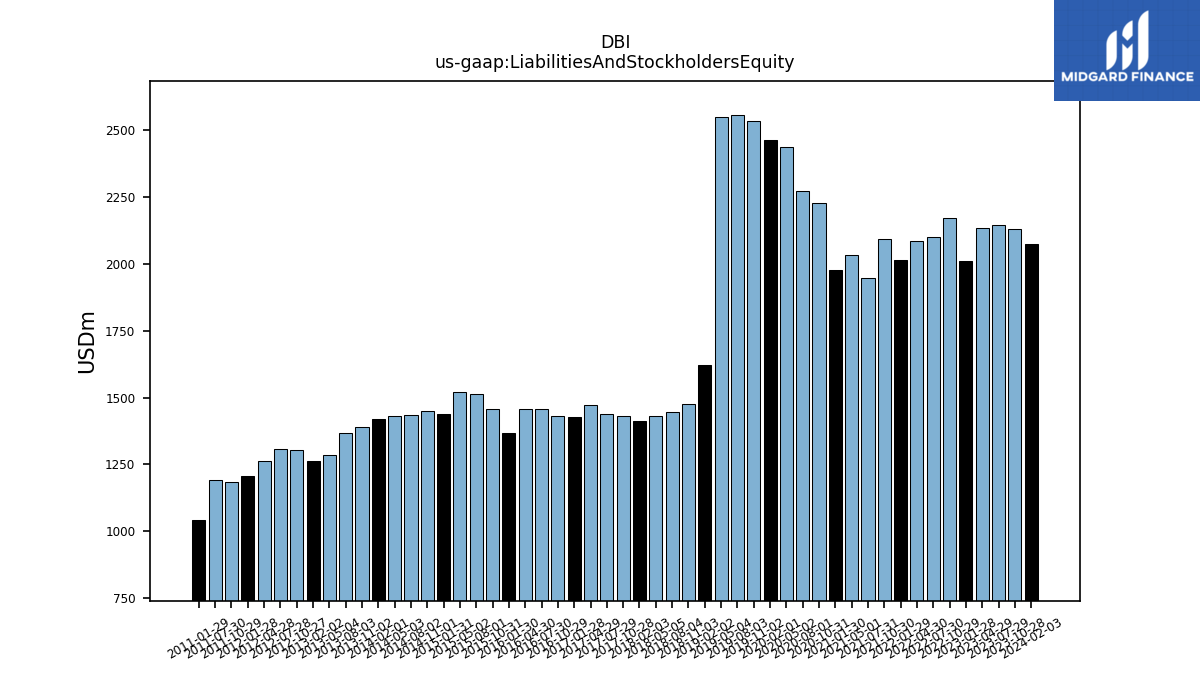
| Liabilities And Stockholders Equity | 2076.23 | 2132.58 | 2147.34 | 2134.49 | 2009.62 | 2171.38 | 2102.44 | 2087.74 | 2014.63 | 2093.94 | 1946.05 | 2032.46 | 1976.60 | 2226.72 | 2273.26 | 2437.84 | 2465.07 | 2536.98 | 2557.25 | 2549.17 | 1620.58 | 1474.63 | 1445.02 | 1431.62 | 1413.61 | 1431.58 | 1439.55 | 1471.46 | 1428.48 | 1431.91 | 1458.97 | 1456.99 | 1369.11 | 1458.03 | 1514.06 | 1521.96 | 1438.24 | 1450.23 | 1433.77 | 1431.35 | 1421.24 | 1391.77 | 1366.17 | 1284.77 | 1262.10 | 1302.56 | 1307.67 | 1263.61 | 1207.90 | 1185.03 | 1192.45 | 1041.48 |
| 2024-02-03 | 2023-10-28 | 2023-07-29 | 2023-04-29 | 2023-01-28 | 2022-10-29 | 2022-07-30 | 2022-04-30 | 2022-01-29 | 2021-10-30 | 2021-07-31 | 2021-05-01 | 2021-01-30 | 2020-10-31 | 2020-08-01 | 2020-05-02 | 2020-02-01 | 2019-11-02 | 2019-08-03 | 2019-05-04 | 2019-02-02 | 2018-11-03 | 2018-08-04 | 2018-05-05 | 2018-02-03 | 2017-10-28 | 2017-07-29 | 2017-04-29 | 2017-01-28 | 2016-10-29 | 2016-07-30 | 2016-04-30 | 2016-01-30 | 2015-10-31 | 2015-08-01 | 2015-05-02 | 2015-01-31 | 2014-11-01 | 2014-08-02 | 2014-05-03 | 2014-02-01 | 2013-11-02 | 2013-08-03 | 2013-05-04 | 2013-02-02 | 2012-10-27 | 2012-07-28 | 2012-04-28 | 2012-01-28 | 2011-10-29 | 2011-07-30 | 2011-01-29 | ||
|---|---|---|---|---|---|---|---|---|---|---|---|---|---|---|---|---|---|---|---|---|---|---|---|---|---|---|---|---|---|---|---|---|---|---|---|---|---|---|---|---|---|---|---|---|---|---|---|---|---|---|---|---|---|
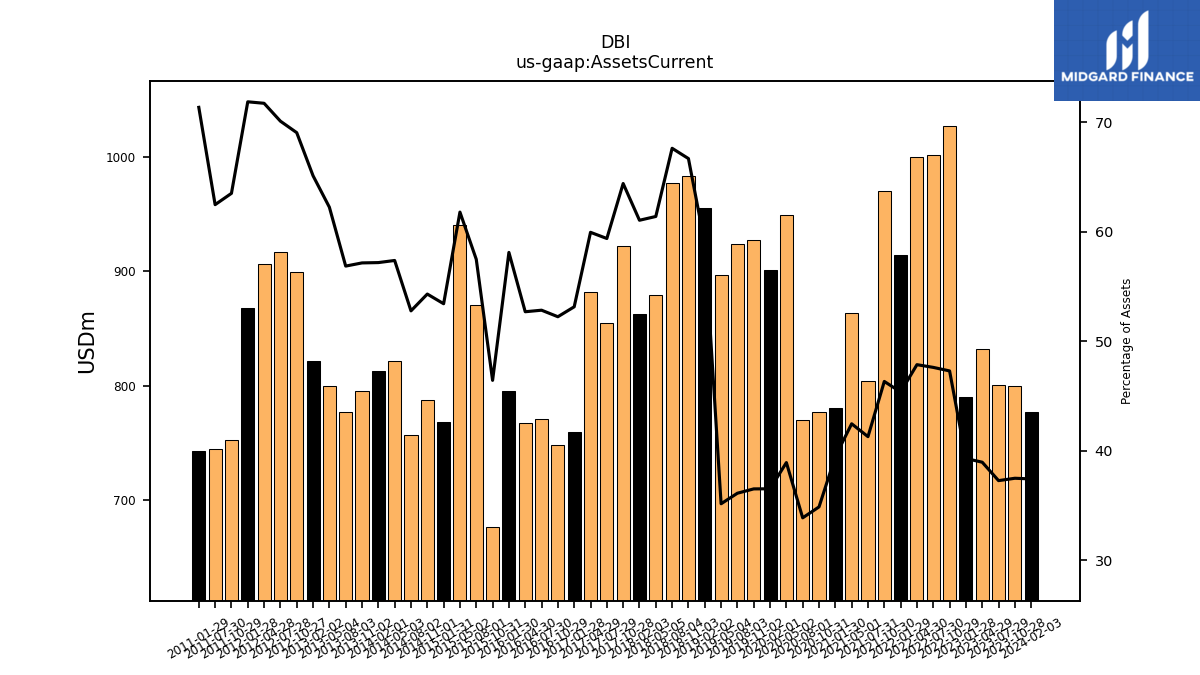
| Assets Current | 777.43 | 799.81 | 800.70 | 831.80 | 789.93 | 1027.05 | 1001.25 | 999.42 | 914.22 | 970.32 | 803.76 | 863.30 | 780.59 | 776.90 | 770.46 | 949.21 | 900.81 | 926.86 | 924.16 | 896.73 | 955.22 | 983.26 | 977.09 | 878.96 | 863.01 | 921.97 | 854.89 | 882.13 | 759.27 | 748.12 | 770.96 | 767.85 | 795.67 | 677.10 | 870.36 | 940.50 | 768.47 | 787.70 | 756.75 | 821.31 | 812.76 | 795.50 | 776.90 | 799.67 | 821.79 | 899.35 | 916.60 | 906.33 | 868.01 | 752.57 | 744.97 | 743.14 | |
| Cash And Cash Equivalents At Carrying Value | 49.17 | 54.64 | 46.19 | 50.57 | 58.77 | 62.51 | 50.80 | 54.80 | 72.69 | 83.07 | 46.46 | 49.30 | 59.58 | 114.53 | 206.72 | 250.87 | 86.56 | 87.84 | 51.76 | 70.67 | 99.37 | 222.42 | 216.00 | 197.16 | 175.93 | 149.49 | 89.31 | 79.67 | 110.66 | 60.96 | 62.32 | 59.46 | 32.49 | 90.02 | 151.01 | 206.87 | 59.17 | 96.39 | 87.41 | 132.90 | 112.02 | 86.91 | 68.93 | 82.41 | 81.10 | 134.32 | 61.06 | 76.55 | 79.00 | 101.67 | 49.62 | 99.13 | |
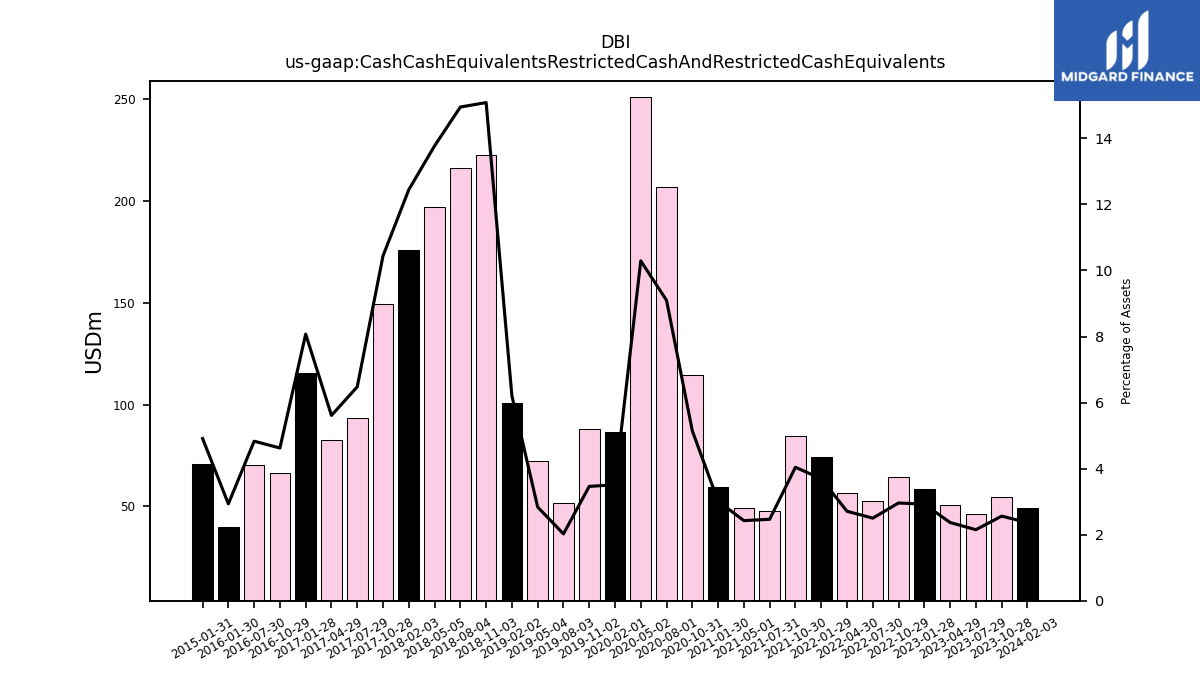
| Cash Cash Equivalents Restricted Cash And Restricted Cash Equivalents | 49.17 | 54.64 | 46.19 | 50.57 | 58.77 | 64.28 | 52.57 | 56.57 | 74.46 | 84.61 | 48.00 | 49.30 | 59.58 | 114.53 | 206.72 | 250.87 | 86.56 | 87.84 | 51.76 | 72.30 | 100.57 | 222.42 | 216.00 | 197.16 | 175.93 | 149.49 | 93.23 | 82.57 | 115.31 | 66.23 | 70.47 | NA | 40.17 | NA | NA | NA | 70.64 | NA | NA | NA | NA | NA | NA | NA | NA | NA | NA | NA | NA | NA | NA | NA | |
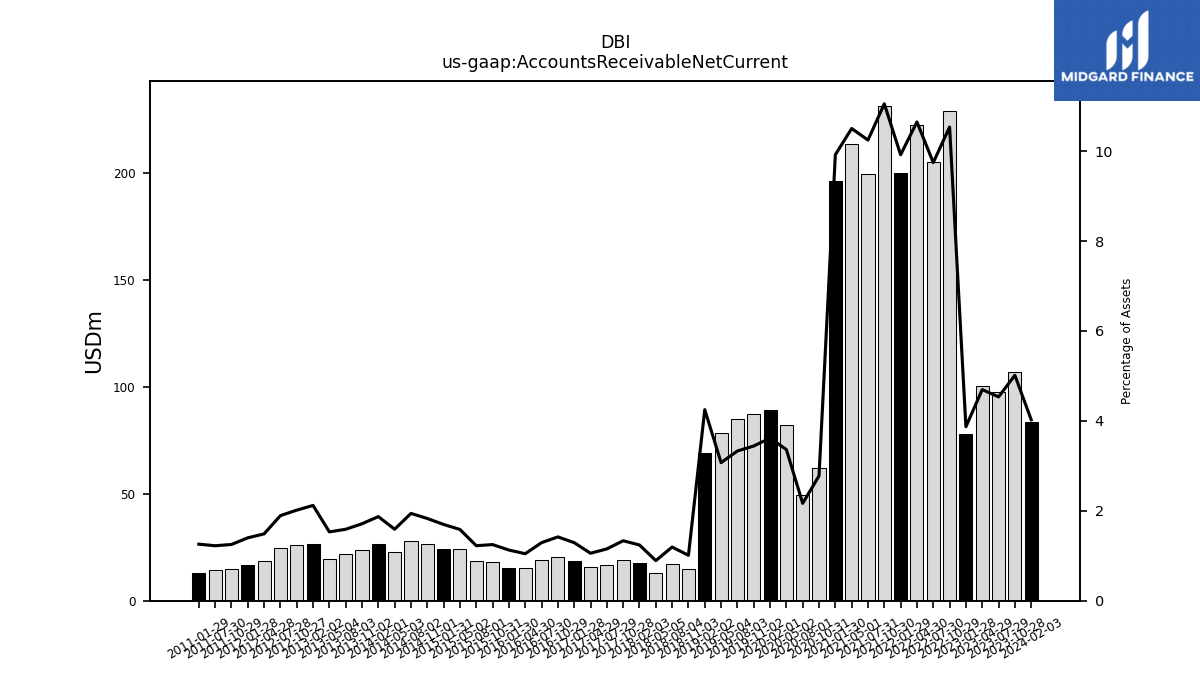
| Accounts Receivable Net Current | 83.59 | 106.92 | 97.36 | 100.24 | 77.76 | 228.75 | 204.88 | 222.30 | 199.83 | 231.39 | 199.37 | 213.45 | 196.05 | 61.84 | 49.24 | 81.95 | 89.15 | 87.31 | 85.16 | 78.29 | 68.87 | 14.90 | 17.26 | 12.78 | 17.53 | 19.10 | 16.60 | 15.54 | 18.46 | 20.33 | 18.85 | 15.24 | 15.44 | 18.21 | 18.53 | 24.12 | 24.40 | 26.53 | 27.86 | 22.76 | 26.59 | 23.83 | 21.72 | 19.68 | 26.76 | 26.25 | 24.75 | 18.79 | 16.90 | 14.83 | 14.59 | 13.11 | |
| Inventory Net | 571.33 | 601.47 | 606.84 | 637.40 | 605.65 | 681.84 | 694.01 | 672.49 | 586.43 | 602.10 | 504.32 | 540.09 | 473.18 | 545.95 | 445.04 | 533.64 | 632.59 | 677.70 | 706.17 | 642.04 | 645.32 | 624.17 | 596.96 | 539.70 | 501.90 | 546.55 | 527.30 | 575.17 | 500.00 | 562.70 | 556.18 | 563.32 | 484.24 | 521.24 | 505.17 | 512.10 | 450.84 | 486.26 | 414.99 | 419.98 | 397.77 | 424.07 | 404.51 | 395.31 | 393.79 | 422.47 | 367.23 | 373.25 | 334.39 | 377.94 | 318.26 | 309.01 | |
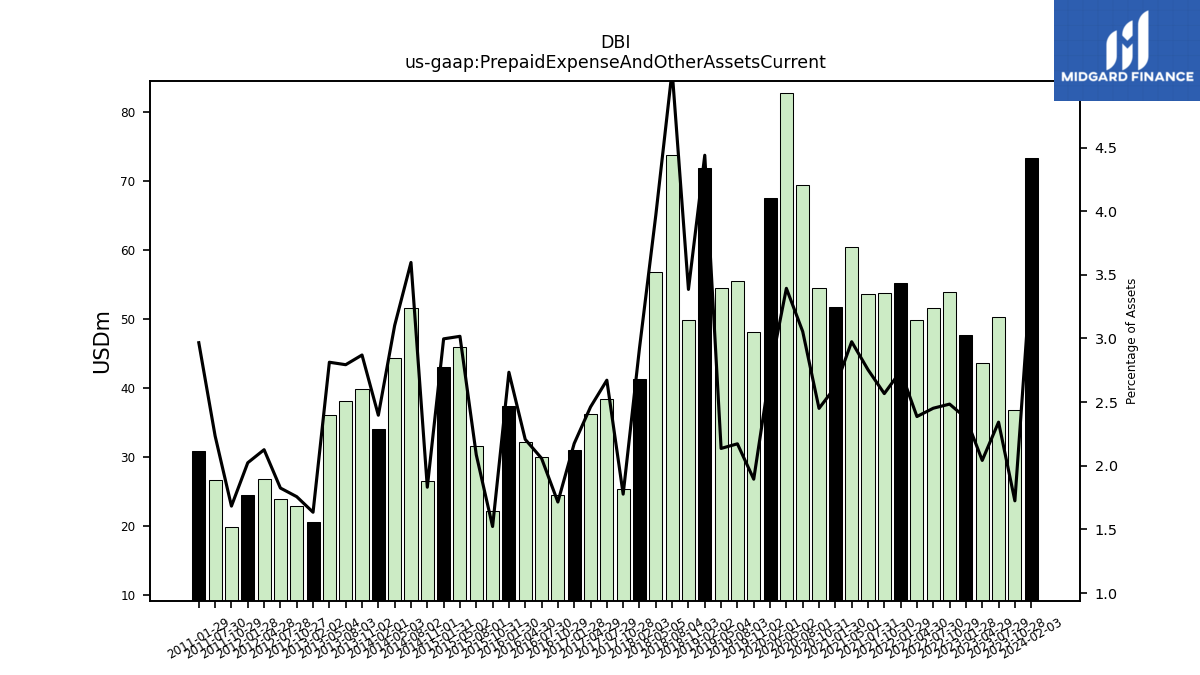
| Prepaid Expense And Other Assets Current | 73.34 | 36.78 | 50.31 | 43.60 | 47.75 | 53.95 | 51.56 | 49.84 | 55.27 | 53.76 | 53.62 | 60.46 | 51.77 | 54.58 | 69.46 | 82.74 | 67.53 | 48.08 | 55.56 | 54.46 | 71.94 | 49.92 | 73.76 | 56.81 | 41.33 | 25.45 | 38.47 | 36.23 | 31.07 | 24.57 | 30.04 | 32.16 | 37.44 | 22.21 | 31.60 | 45.92 | 43.11 | 26.57 | 51.58 | 44.40 | 34.07 | 39.95 | 38.17 | 36.15 | 20.64 | 22.89 | 23.87 | 26.87 | 24.45 | 19.95 | 26.65 | 30.90 | |
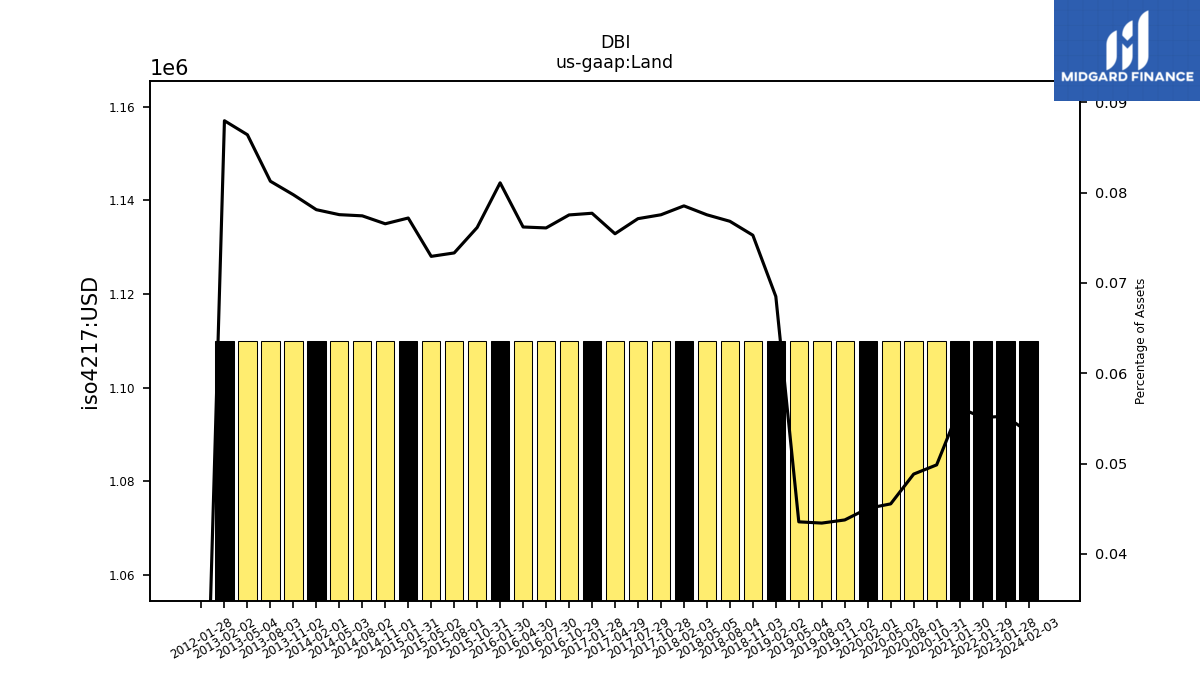
| Land | 1.11 | NA | NA | NA | 1.11 | NA | NA | NA | 1.11 | NA | NA | NA | 1.11 | 1.11 | 1.11 | 1.11 | 1.11 | 1.11 | 1.11 | 1.11 | 1.11 | 1.11 | 1.11 | 1.11 | 1.11 | 1.11 | 1.11 | 1.11 | 1.11 | 1.11 | 1.11 | 1.11 | 1.11 | 1.11 | 1.11 | 1.11 | 1.11 | 1.11 | 1.11 | 1.11 | 1.11 | 1.11 | 1.11 | 1.11 | 1.11 | NA | NA | NA | 0.00 | NA | NA | NA |
| 2024-02-03 | 2023-10-28 | 2023-07-29 | 2023-04-29 | 2023-01-28 | 2022-10-29 | 2022-07-30 | 2022-04-30 | 2022-01-29 | 2021-10-30 | 2021-07-31 | 2021-05-01 | 2021-01-30 | 2020-10-31 | 2020-08-01 | 2020-05-02 | 2020-02-01 | 2019-11-02 | 2019-08-03 | 2019-05-04 | 2019-02-02 | 2018-11-03 | 2018-08-04 | 2018-05-05 | 2018-02-03 | 2017-10-28 | 2017-07-29 | 2017-04-29 | 2017-01-28 | 2016-10-29 | 2016-07-30 | 2016-04-30 | 2016-01-30 | 2015-10-31 | 2015-08-01 | 2015-05-02 | 2015-01-31 | 2014-11-01 | 2014-08-02 | 2014-05-03 | 2014-02-01 | 2013-11-02 | 2013-08-03 | 2013-05-04 | 2013-02-02 | 2012-10-27 | 2012-07-28 | 2012-04-28 | 2012-01-28 | 2011-10-29 | 2011-07-30 | 2011-01-29 | ||
|---|---|---|---|---|---|---|---|---|---|---|---|---|---|---|---|---|---|---|---|---|---|---|---|---|---|---|---|---|---|---|---|---|---|---|---|---|---|---|---|---|---|---|---|---|---|---|---|---|---|---|---|---|---|
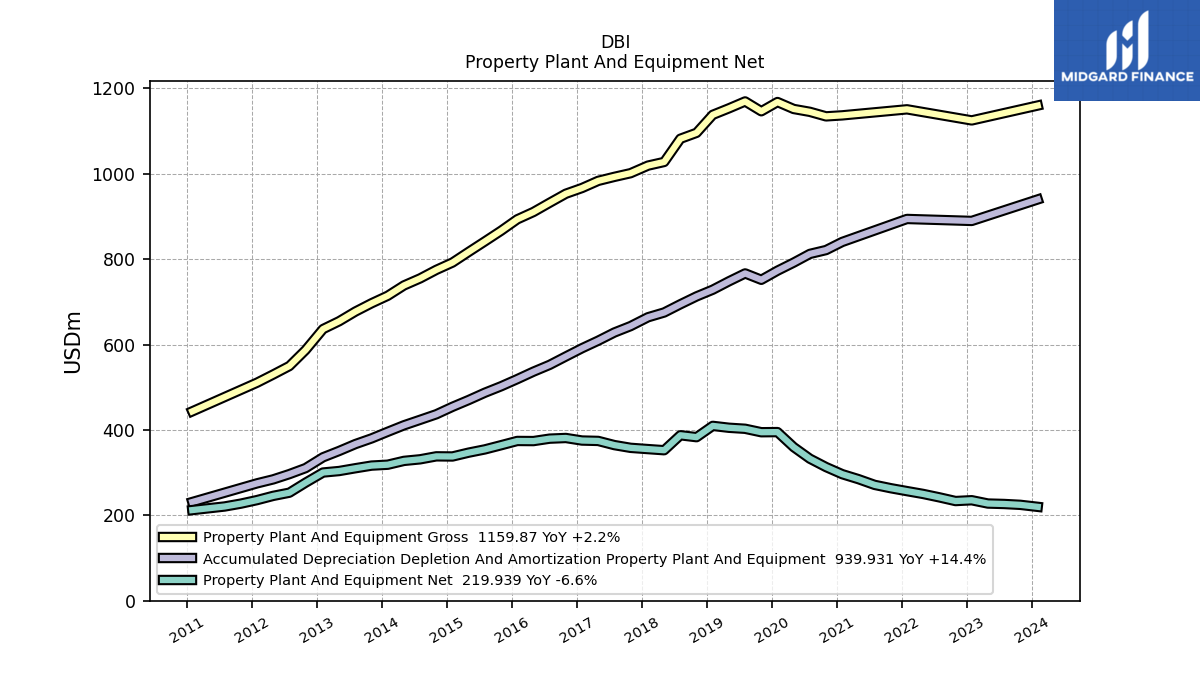
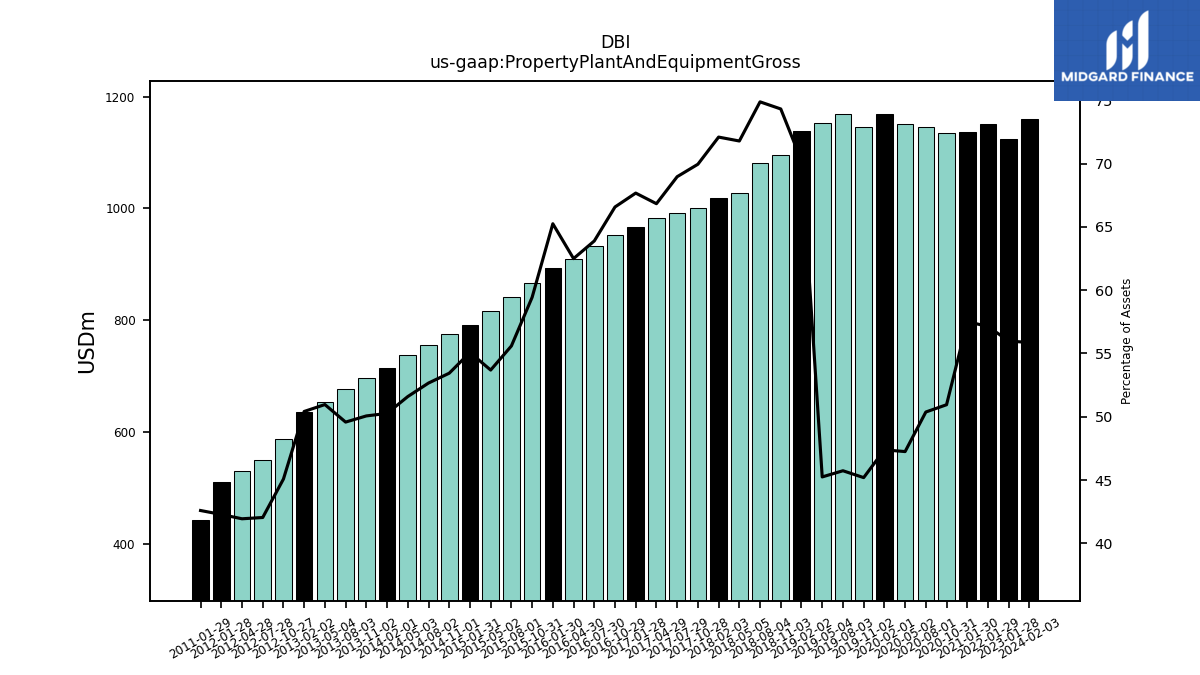
| Property Plant And Equipment Gross | 1159.87 | NA | NA | NA | 1125.01 | NA | NA | NA | 1150.98 | NA | NA | NA | 1136.84 | 1134.47 | 1145.10 | 1151.79 | 1168.06 | 1146.44 | 1169.46 | 1153.32 | 1138.08 | 1095.93 | 1082.04 | 1027.71 | 1019.16 | 1001.40 | 992.80 | 983.43 | 966.67 | 953.28 | 932.11 | 910.54 | 893.32 | 866.57 | 841.69 | 817.11 | 792.14 | 774.99 | 755.05 | 738.47 | 714.36 | 696.77 | 677.31 | 654.74 | 636.30 | 587.18 | 549.73 | 529.90 | 510.68 | NA | NA | 443.56 | |
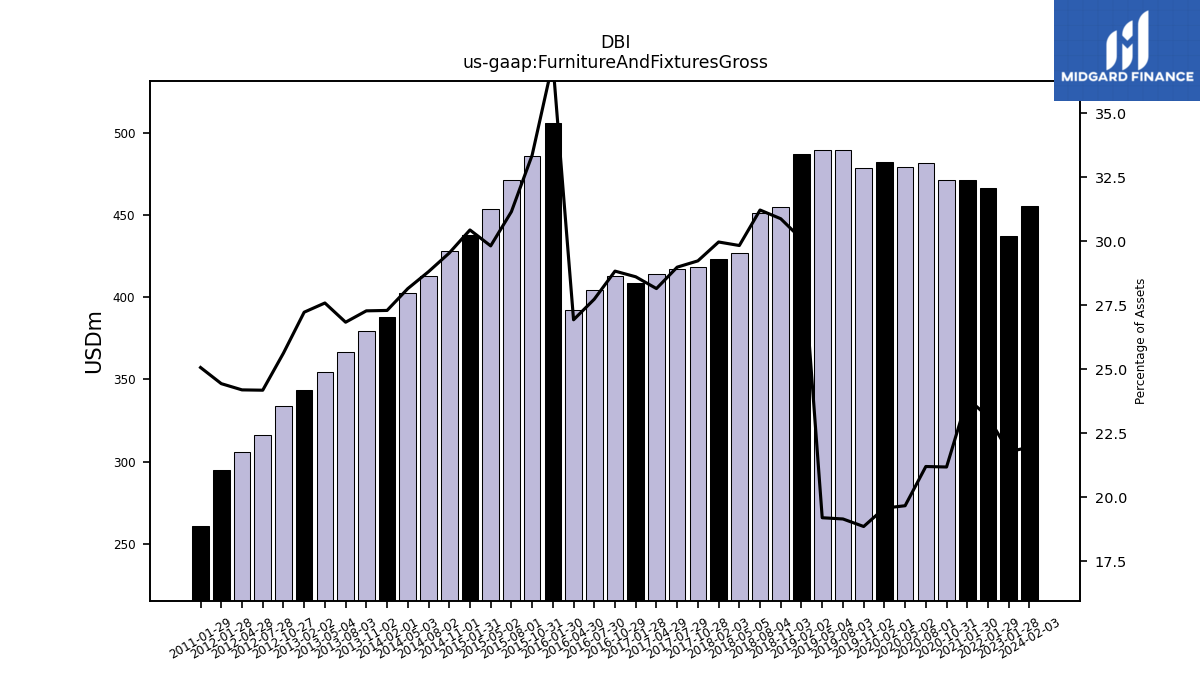
| Furniture And Fixtures Gross | 455.87 | NA | NA | NA | 437.61 | NA | NA | NA | 466.40 | NA | NA | NA | 471.59 | 471.67 | 481.96 | 479.53 | 482.57 | 478.46 | 489.81 | 489.48 | 487.49 | 455.26 | 451.04 | 427.03 | 423.60 | 418.43 | 417.23 | 414.18 | 408.65 | 412.80 | 404.63 | 392.35 | 506.35 | 486.28 | 471.61 | 453.75 | 437.75 | 428.32 | 413.01 | 402.86 | 387.91 | 379.65 | 366.61 | 354.40 | 343.61 | 333.82 | 316.20 | 305.70 | 295.16 | NA | NA | 261.06 | |
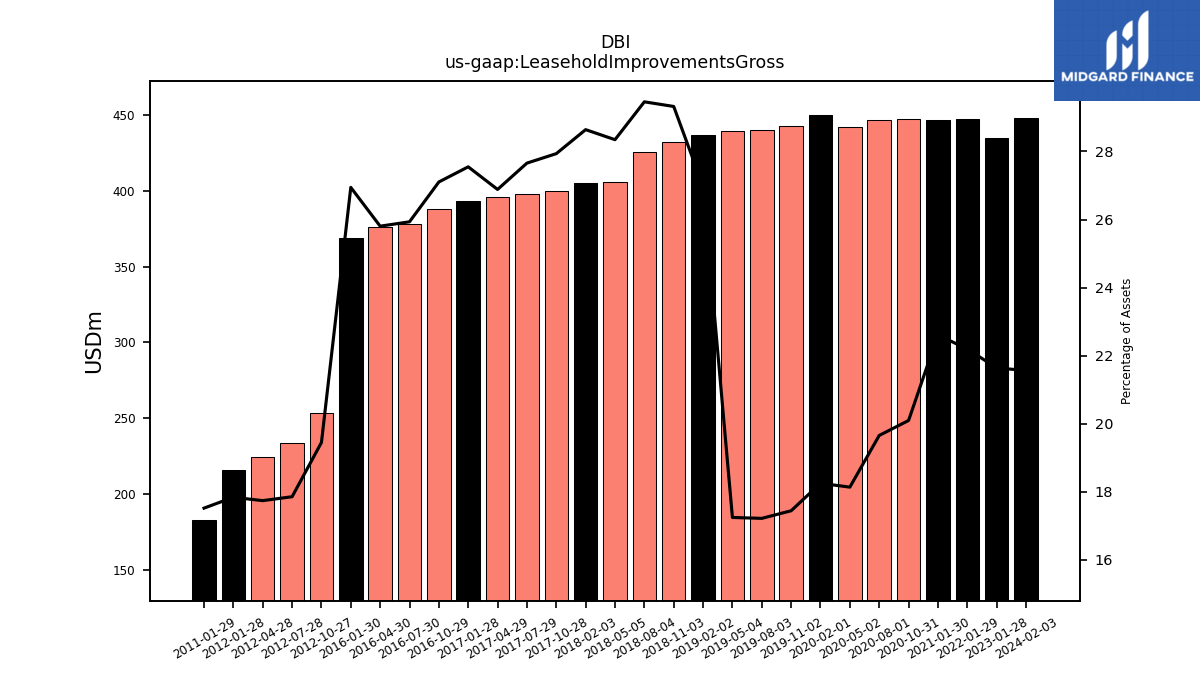
| Leasehold Improvements Gross | 447.71 | NA | NA | NA | 434.96 | NA | NA | NA | 447.16 | NA | NA | NA | 446.94 | 447.51 | 446.87 | 442.22 | 449.96 | 442.61 | 440.43 | 439.71 | 437.12 | 432.37 | 425.65 | 405.79 | 404.85 | 399.90 | 398.13 | 395.58 | 393.50 | 388.08 | 378.36 | 375.97 | 368.88 | NA | NA | NA | NA | NA | NA | NA | NA | NA | NA | NA | NA | 253.36 | 233.53 | 224.21 | 215.52 | NA | NA | 182.50 | |
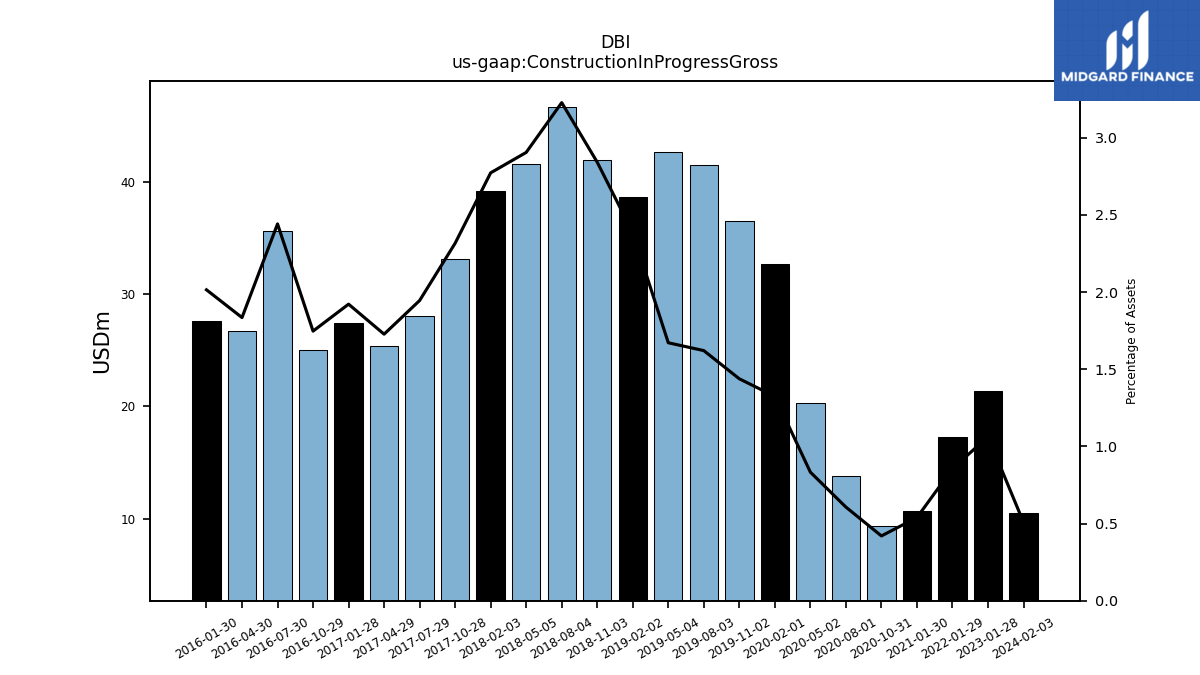
| Construction In Progress Gross | 10.54 | NA | NA | NA | 21.37 | NA | NA | NA | 17.24 | NA | NA | NA | 10.66 | 9.35 | 13.80 | 20.32 | 32.65 | 36.49 | 41.45 | 42.62 | 38.65 | 41.91 | 46.64 | 41.59 | 39.20 | 33.17 | 28.01 | 25.42 | 27.46 | 25.02 | 35.63 | 26.74 | 27.59 | NA | NA | NA | NA | NA | NA | NA | NA | NA | NA | NA | NA | NA | NA | NA | NA | NA | NA | NA | |
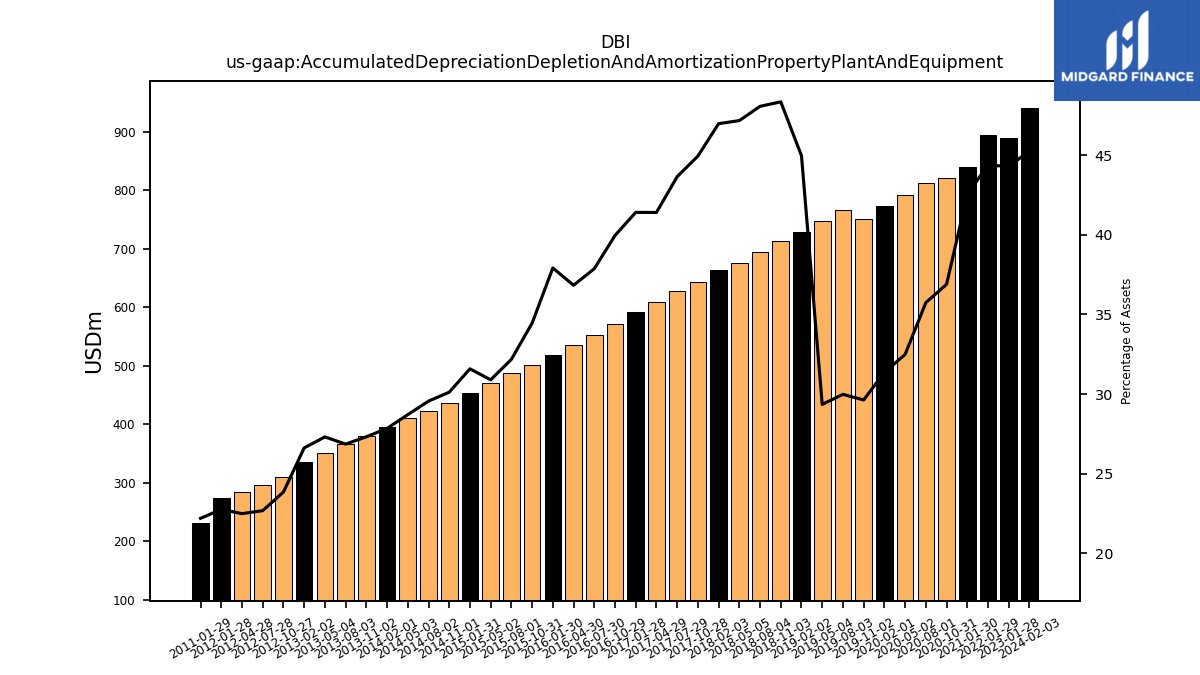
| Accumulated Depreciation Depletion And Amortization Property Plant And Equipment | 939.93 | NA | NA | NA | 889.58 | NA | NA | NA | 894.19 | NA | NA | NA | 840.37 | 821.37 | 812.37 | 791.95 | 773.05 | 751.75 | 766.69 | 748.17 | 728.50 | 712.82 | 694.42 | 675.16 | 663.96 | 643.24 | 628.25 | 609.11 | 591.42 | 572.06 | 552.47 | 536.56 | 519.08 | 502.31 | 487.21 | 470.19 | 454.24 | 436.76 | 423.78 | 410.91 | 395.74 | 380.23 | 366.94 | 350.89 | 335.98 | 310.68 | 296.63 | 284.26 | 274.95 | NA | NA | 231.22 | |
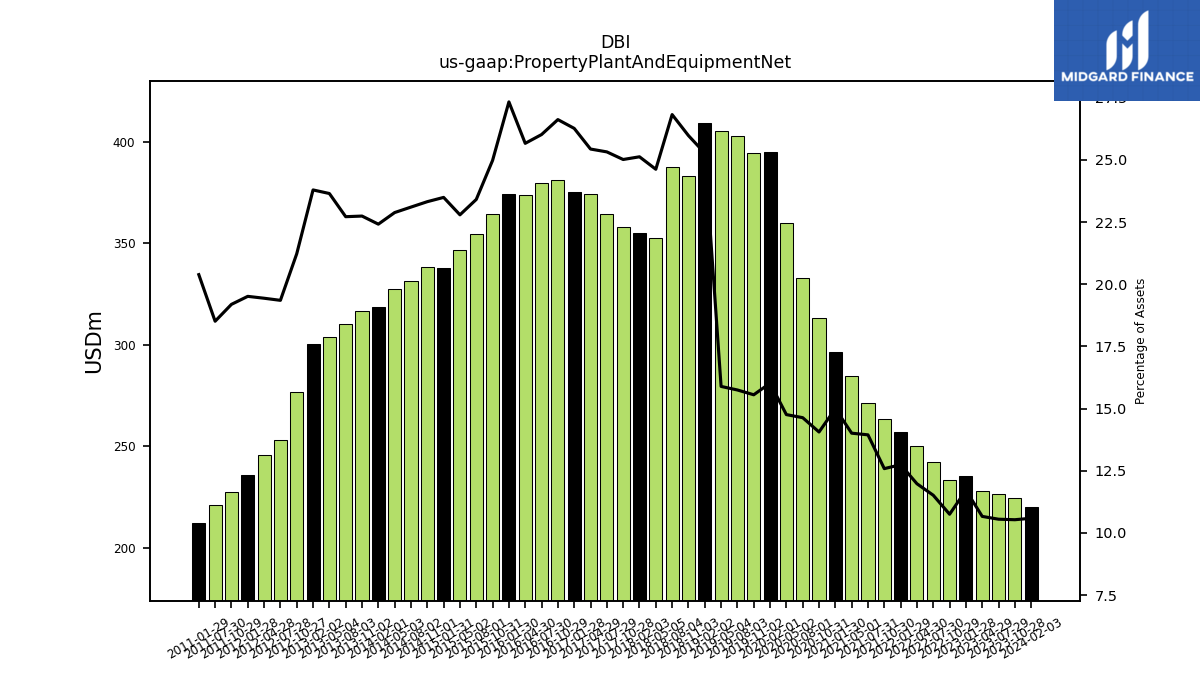
| Property Plant And Equipment Net | 219.94 | 224.64 | 226.63 | 227.69 | 235.43 | 233.51 | 242.15 | 250.12 | 256.79 | 263.58 | 271.40 | 284.82 | 296.47 | 313.10 | 332.73 | 359.84 | 395.01 | 394.69 | 402.78 | 405.16 | 409.58 | 383.11 | 387.62 | 352.55 | 355.20 | 358.15 | 364.55 | 374.32 | 375.25 | 381.22 | 379.64 | 373.98 | 374.24 | 364.25 | 354.48 | 346.91 | 337.90 | 338.23 | 331.27 | 327.56 | 318.62 | 316.54 | 310.37 | 303.85 | 300.31 | 276.50 | 253.10 | 245.64 | 235.73 | 227.45 | 220.78 | 212.34 | |
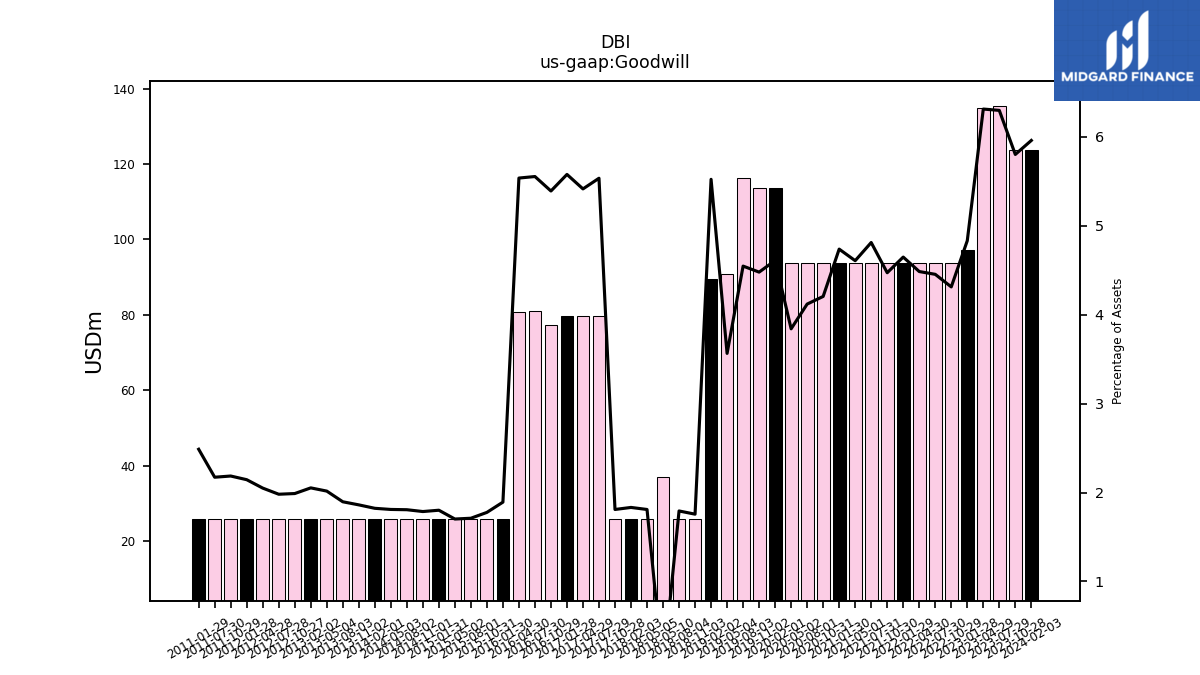
| Goodwill | 123.76 | 123.76 | 135.26 | 134.77 | 97.11 | 93.66 | 93.66 | 93.66 | 93.66 | 93.66 | 93.66 | 93.66 | 93.66 | 93.66 | 93.66 | 93.66 | 113.64 | 113.64 | 116.28 | 90.88 | 89.51 | 25.90 | 25.90 | 25.90 | 25.90 | 25.90 | 79.69 | 79.69 | 79.69 | 77.21 | 81.04 | 80.68 | 25.90 | 25.90 | 25.90 | 25.90 | 25.90 | 25.90 | 25.90 | 25.90 | 25.90 | 25.90 | 25.90 | 25.90 | 25.90 | 25.90 | 25.90 | 25.90 | 25.90 | 25.90 | 25.90 | 25.90 | |
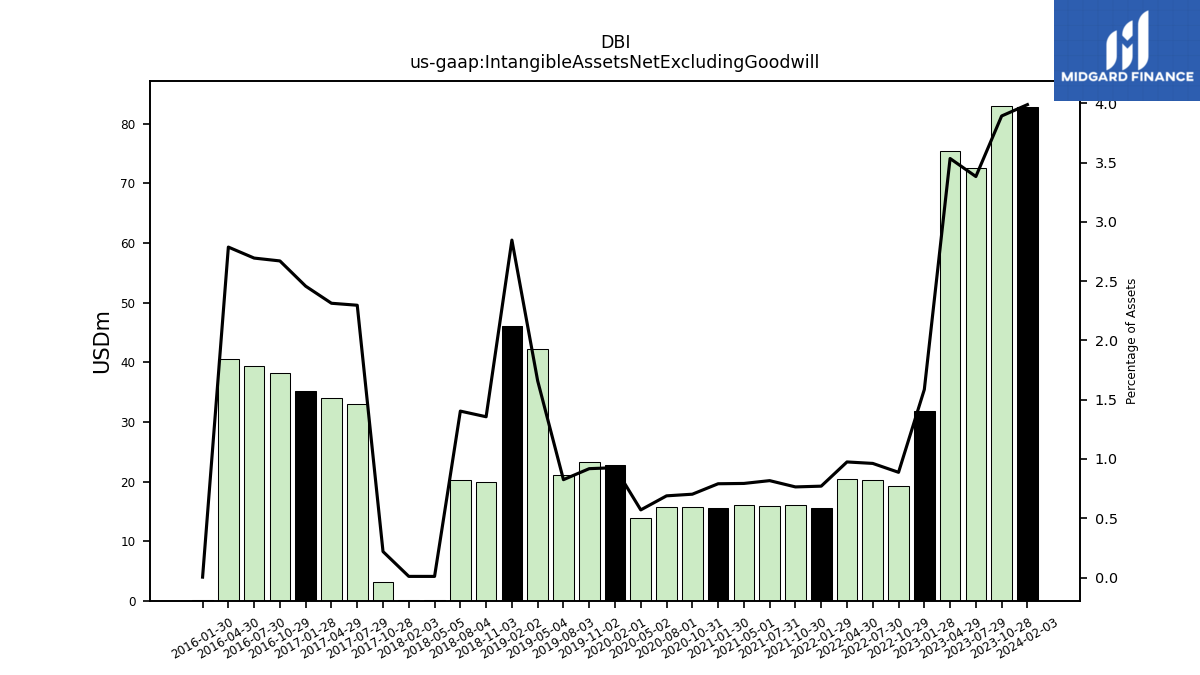
| Intangible Assets Net Excluding Goodwill | 82.83 | 83.03 | 72.64 | 75.45 | 31.87 | 19.27 | 20.24 | 20.36 | 15.53 | 16.00 | 15.90 | 16.13 | 15.63 | 15.65 | 15.66 | 13.91 | 22.85 | 23.30 | 21.11 | 42.30 | 46.13 | 20.00 | 20.29 | 0.14 | 0.14 | 3.13 | 33.06 | 34.04 | 35.11 | 38.24 | 39.32 | 40.61 | 0.05 | NA | NA | NA | NA | NA | NA | NA | NA | NA | NA | NA | NA | NA | NA | NA | NA | NA | NA | NA | |
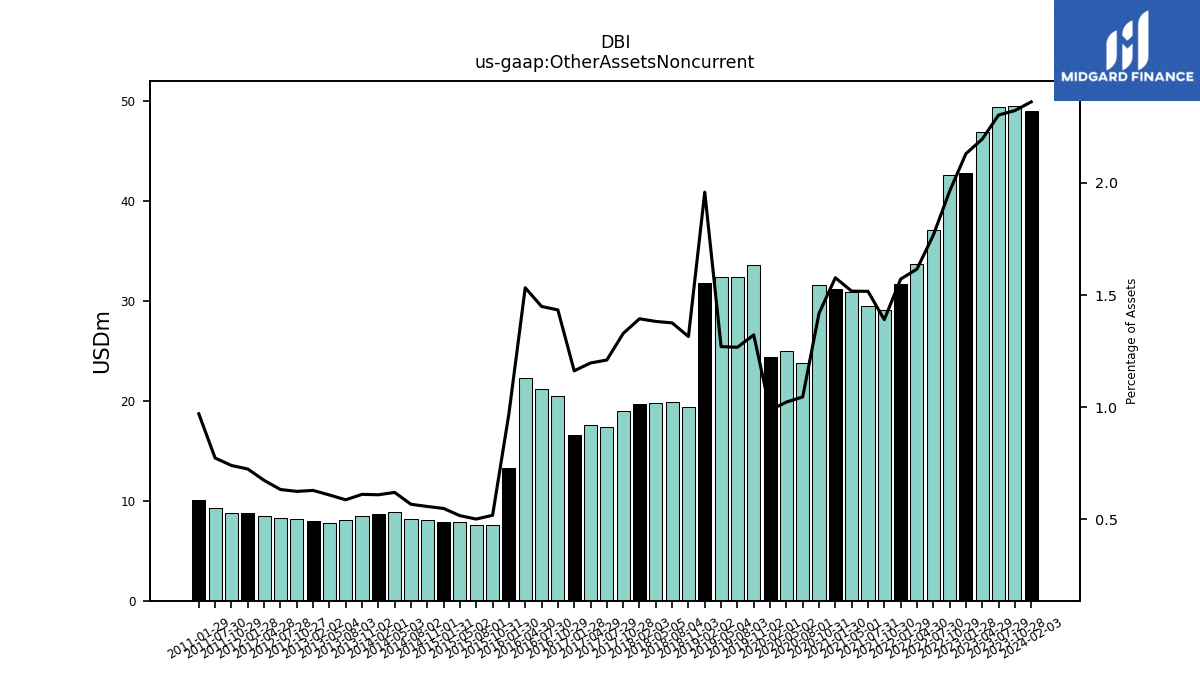
| Other Assets Noncurrent | 49.02 | 49.52 | 49.43 | 46.85 | 42.80 | 42.61 | 37.13 | 33.73 | 31.65 | 29.12 | 29.51 | 30.84 | 31.17 | 31.59 | 23.78 | 24.94 | 24.34 | 33.55 | 32.41 | 32.38 | 31.74 | 19.39 | 19.88 | 19.79 | 19.71 | 19.02 | 17.43 | 17.62 | 16.61 | 20.53 | 21.14 | 22.33 | 13.30 | 7.57 | 7.60 | 7.87 | 7.90 | 8.09 | 8.14 | 8.88 | 8.67 | 8.52 | 8.03 | 7.83 | 7.95 | 8.14 | 8.29 | 8.52 | 8.76 | 8.78 | 9.23 | 10.11 |
| 2024-02-03 | 2023-10-28 | 2023-07-29 | 2023-04-29 | 2023-01-28 | 2022-10-29 | 2022-07-30 | 2022-04-30 | 2022-01-29 | 2021-10-30 | 2021-07-31 | 2021-05-01 | 2021-01-30 | 2020-10-31 | 2020-08-01 | 2020-05-02 | 2020-02-01 | 2019-11-02 | 2019-08-03 | 2019-05-04 | 2019-02-02 | 2018-11-03 | 2018-08-04 | 2018-05-05 | 2018-02-03 | 2017-10-28 | 2017-07-29 | 2017-04-29 | 2017-01-28 | 2016-10-29 | 2016-07-30 | 2016-04-30 | 2016-01-30 | 2015-10-31 | 2015-08-01 | 2015-05-02 | 2015-01-31 | 2014-11-01 | 2014-08-02 | 2014-05-03 | 2014-02-01 | 2013-11-02 | 2013-08-03 | 2013-05-04 | 2013-02-02 | 2012-10-27 | 2012-07-28 | 2012-04-28 | 2012-01-28 | 2011-10-29 | 2011-07-30 | 2011-01-29 | ||
|---|---|---|---|---|---|---|---|---|---|---|---|---|---|---|---|---|---|---|---|---|---|---|---|---|---|---|---|---|---|---|---|---|---|---|---|---|---|---|---|---|---|---|---|---|---|---|---|---|---|---|---|---|---|
| Liabilities Current | 622.27 | 678.25 | 650.84 | 642.36 | 636.13 | 717.52 | 740.14 | 757.30 | 758.92 | 880.86 | 774.73 | 800.22 | 752.68 | 831.57 | 669.22 | 732.73 | 680.03 | 641.83 | 648.86 | 596.02 | 463.16 | 381.46 | 375.22 | 325.38 | 324.53 | 336.30 | 287.31 | 349.37 | 316.61 | 304.92 | 314.43 | 323.29 | 323.43 | 287.06 | 304.38 | 331.78 | 283.79 | 311.82 | 300.12 | 270.64 | 284.40 | 277.71 | 303.78 | 264.16 | 275.31 | 299.21 | 263.50 | 287.36 | 307.55 | 306.02 | 459.74 | 422.51 | |
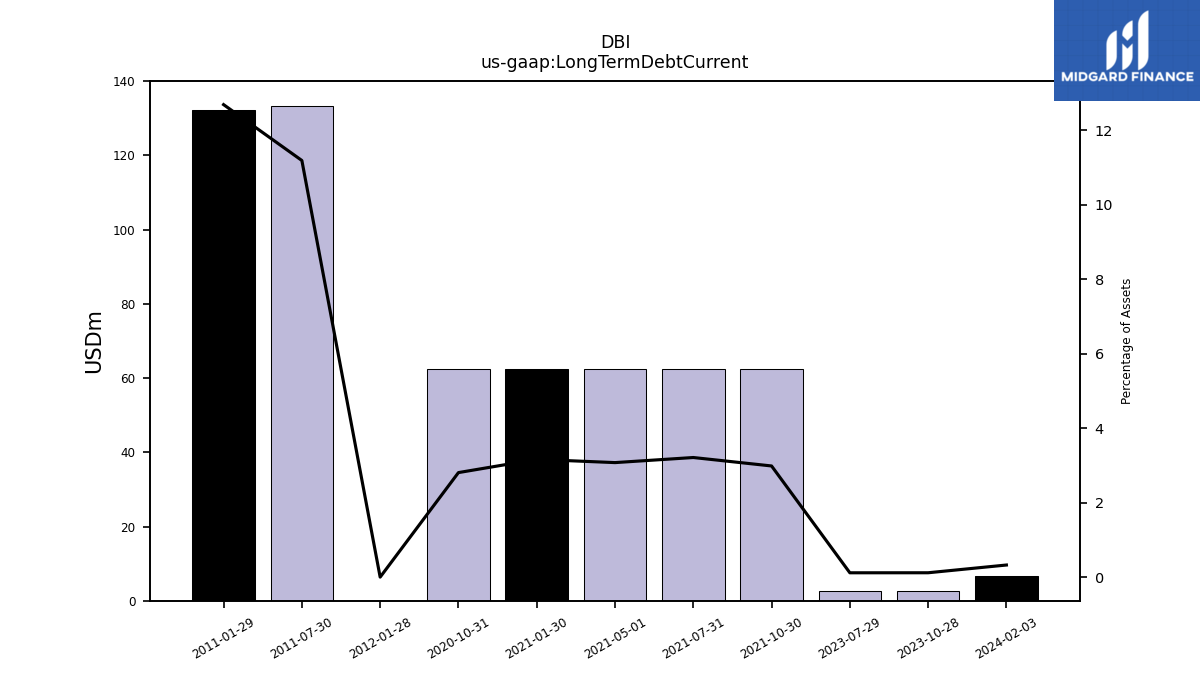
| Long Term Debt Current | 6.75 | 2.50 | 2.50 | NA | NA | NA | NA | NA | NA | 62.50 | 62.50 | 62.50 | 62.50 | 62.50 | NA | NA | NA | NA | NA | NA | NA | NA | NA | NA | NA | NA | NA | NA | NA | NA | NA | NA | NA | NA | NA | NA | NA | NA | NA | NA | NA | NA | NA | NA | NA | NA | NA | NA | 0.00 | NA | 133.40 | 132.13 | |
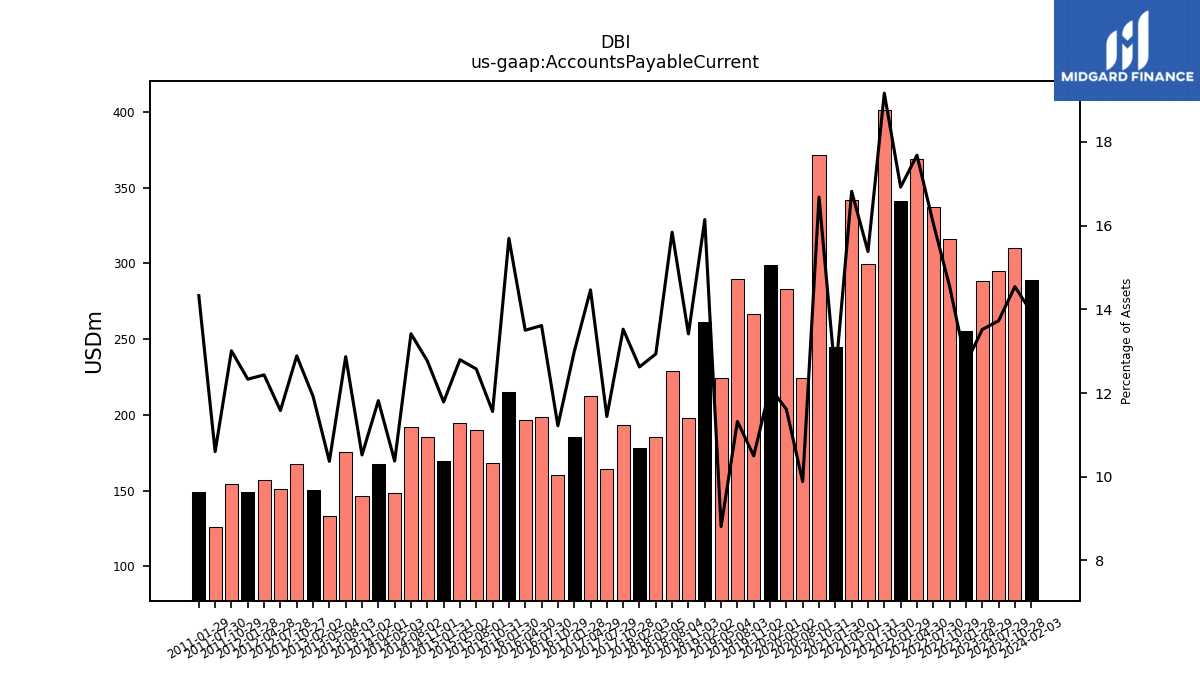
| Accounts Payable Current | 289.37 | 310.11 | 294.72 | 288.53 | 255.36 | 316.00 | 337.54 | 369.15 | 340.88 | 401.28 | 299.32 | 341.82 | 245.07 | 371.38 | 224.69 | 283.05 | 299.07 | 266.33 | 289.46 | 224.58 | 261.62 | 197.79 | 228.92 | 185.15 | 178.45 | 193.61 | 164.66 | 212.82 | 185.50 | 160.62 | 198.58 | 196.70 | 214.89 | 168.54 | 190.38 | 194.75 | 169.52 | 185.18 | 192.34 | 148.49 | 167.95 | 146.42 | 175.81 | 133.20 | 150.46 | 167.86 | 151.45 | 157.10 | 148.94 | 154.15 | 126.39 | 149.21 | |
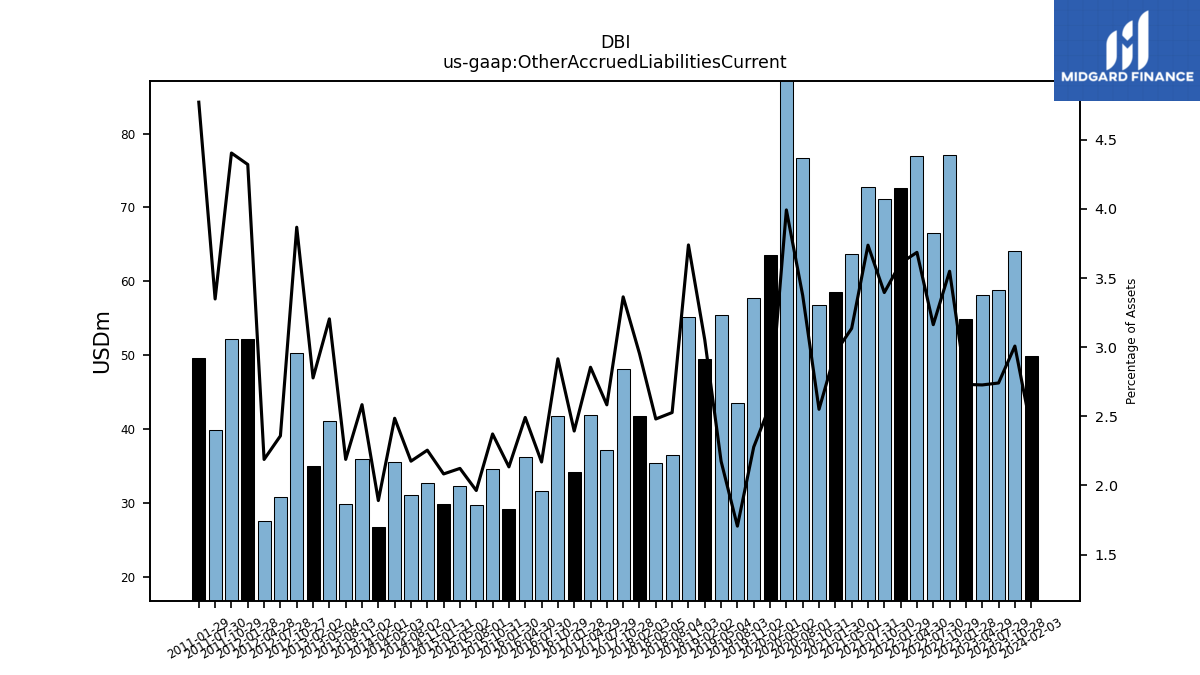
| Other Accrued Liabilities Current | 49.94 | 64.14 | 58.86 | 58.21 | 54.88 | 77.06 | 66.50 | 76.95 | 72.69 | 71.09 | 72.73 | 63.74 | 58.52 | 56.80 | 76.71 | 97.33 | 63.56 | 57.80 | 43.63 | 55.45 | 49.48 | 55.14 | 36.52 | 35.52 | 41.75 | 48.16 | 37.19 | 42.01 | 34.19 | 41.75 | 31.66 | 36.30 | 29.22 | 34.59 | 29.73 | 32.32 | 29.96 | 32.70 | 31.19 | 35.58 | 26.88 | 35.97 | 29.90 | 41.17 | 35.06 | 50.38 | 30.84 | 27.65 | 52.20 | 52.19 | 39.93 | 49.69 | |
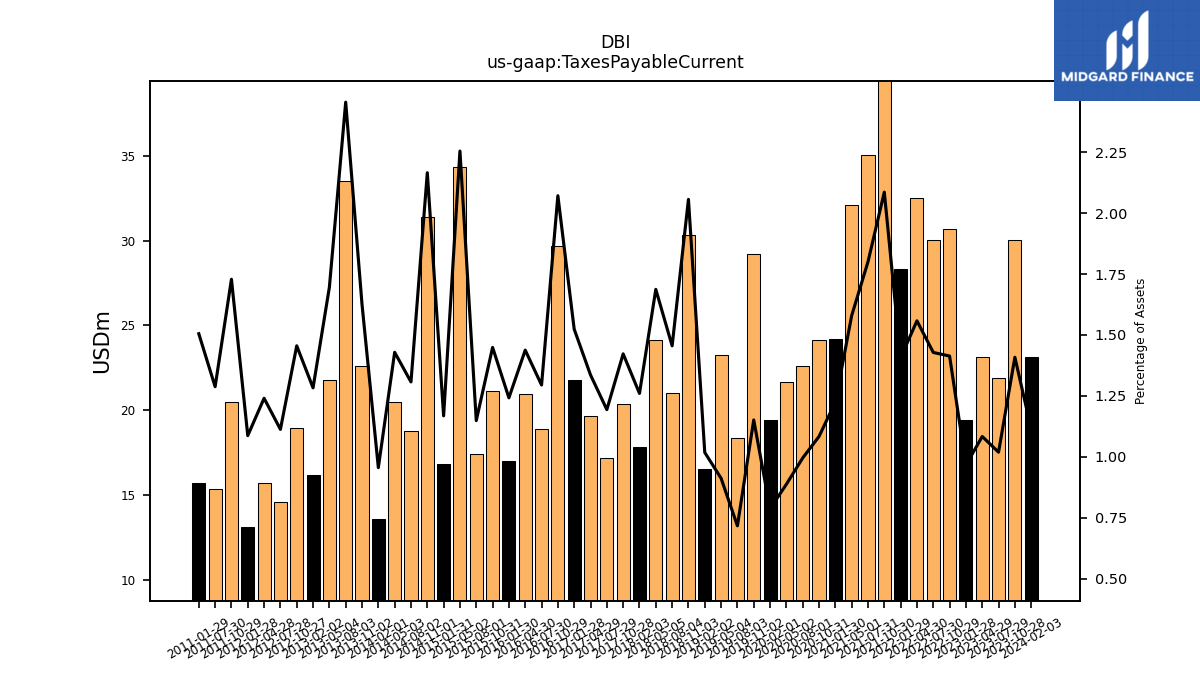
| Taxes Payable Current | 23.13 | 30.04 | 21.88 | 23.12 | 19.42 | 30.69 | 30.03 | 32.53 | 28.33 | 43.68 | 35.03 | 32.09 | 24.21 | 24.12 | 22.62 | 21.63 | 19.40 | 29.20 | 18.33 | 23.24 | 16.49 | 30.32 | 21.03 | 24.15 | 17.81 | 20.36 | 17.18 | 19.66 | 21.76 | 29.66 | 18.89 | 20.94 | 17.00 | 21.12 | 17.39 | 34.31 | 16.80 | 31.41 | 18.74 | 20.45 | 13.58 | 22.62 | 33.54 | 21.78 | 16.19 | 18.96 | 14.55 | 15.67 | 13.13 | 20.48 | 15.35 | 15.67 | |
| Accrued Liabilities Current | 159.62 | 183.38 | 172.13 | 170.76 | 190.68 | 213.91 | 210.47 | 208.28 | 215.81 | 211.02 | 222.06 | 195.24 | 200.33 | 171.26 | 202.83 | 231.36 | 194.26 | 190.90 | 173.44 | 186.99 | 201.53 | 182.96 | 145.78 | 139.35 | 145.22 | 141.99 | 121.93 | 135.76 | 130.33 | 143.65 | 115.19 | 125.77 | 107.80 | 117.89 | 113.47 | 136.37 | 113.18 | 125.89 | 107.12 | 120.48 | 115.70 | 130.61 | 127.15 | 129.42 | 123.20 | 130.26 | 111.13 | 112.41 | 127.00 | NA | NA | NA |
| 2024-02-03 | 2023-10-28 | 2023-07-29 | 2023-04-29 | 2023-01-28 | 2022-10-29 | 2022-07-30 | 2022-04-30 | 2022-01-29 | 2021-10-30 | 2021-07-31 | 2021-05-01 | 2021-01-30 | 2020-10-31 | 2020-08-01 | 2020-05-02 | 2020-02-01 | 2019-11-02 | 2019-08-03 | 2019-05-04 | 2019-02-02 | 2018-11-03 | 2018-08-04 | 2018-05-05 | 2018-02-03 | 2017-10-28 | 2017-07-29 | 2017-04-29 | 2017-01-28 | 2016-10-29 | 2016-07-30 | 2016-04-30 | 2016-01-30 | 2015-10-31 | 2015-08-01 | 2015-05-02 | 2015-01-31 | 2014-11-01 | 2014-08-02 | 2014-05-03 | 2014-02-01 | 2013-11-02 | 2013-08-03 | 2013-05-04 | 2013-02-02 | 2012-10-27 | 2012-07-28 | 2012-04-28 | 2012-01-28 | 2011-10-29 | 2011-07-30 | 2011-01-29 | ||
|---|---|---|---|---|---|---|---|---|---|---|---|---|---|---|---|---|---|---|---|---|---|---|---|---|---|---|---|---|---|---|---|---|---|---|---|---|---|---|---|---|---|---|---|---|---|---|---|---|---|---|---|---|---|
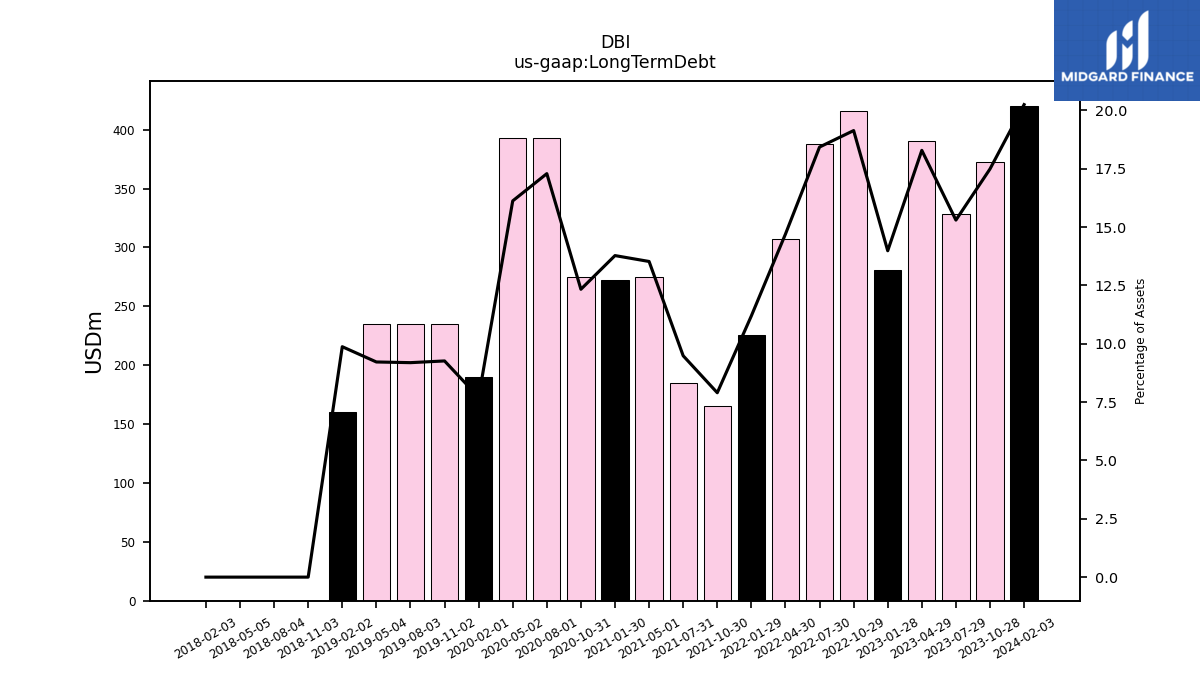
| Long Term Debt | 420.34 | 372.96 | 328.51 | 390.30 | 281.04 | 415.47 | 387.44 | 306.86 | 225.54 | 165.42 | 184.57 | 274.89 | 272.32 | 274.63 | 393.00 | 393.00 | 190.00 | 235.00 | 235.00 | 235.00 | 160.00 | 0.00 | 0.00 | 0.00 | 0.00 | NA | NA | NA | NA | NA | NA | NA | NA | NA | NA | NA | NA | NA | NA | NA | NA | NA | NA | NA | NA | NA | NA | NA | NA | NA | NA | NA | |
| Other Liabilities Noncurrent | 24.95 | 21.07 | 22.78 | 23.34 | 24.99 | 26.06 | 25.84 | 26.95 | 24.36 | 31.73 | 30.50 | 31.53 | 30.84 | 28.23 | 25.59 | 25.30 | 27.54 | 36.08 | 38.59 | 34.15 | 165.05 | 150.73 | 150.32 | 145.37 | 138.73 | 141.75 | 142.50 | 142.52 | 141.18 | 144.65 | 143.56 | 142.69 | 140.76 | 142.83 | 144.03 | 141.39 | 143.33 | 142.54 | 142.48 | 137.41 | 138.30 | 132.84 | 131.66 | 127.23 | 128.21 | 123.16 | 119.18 | 113.98 | 113.76 | 107.87 | 106.12 | 104.18 | |
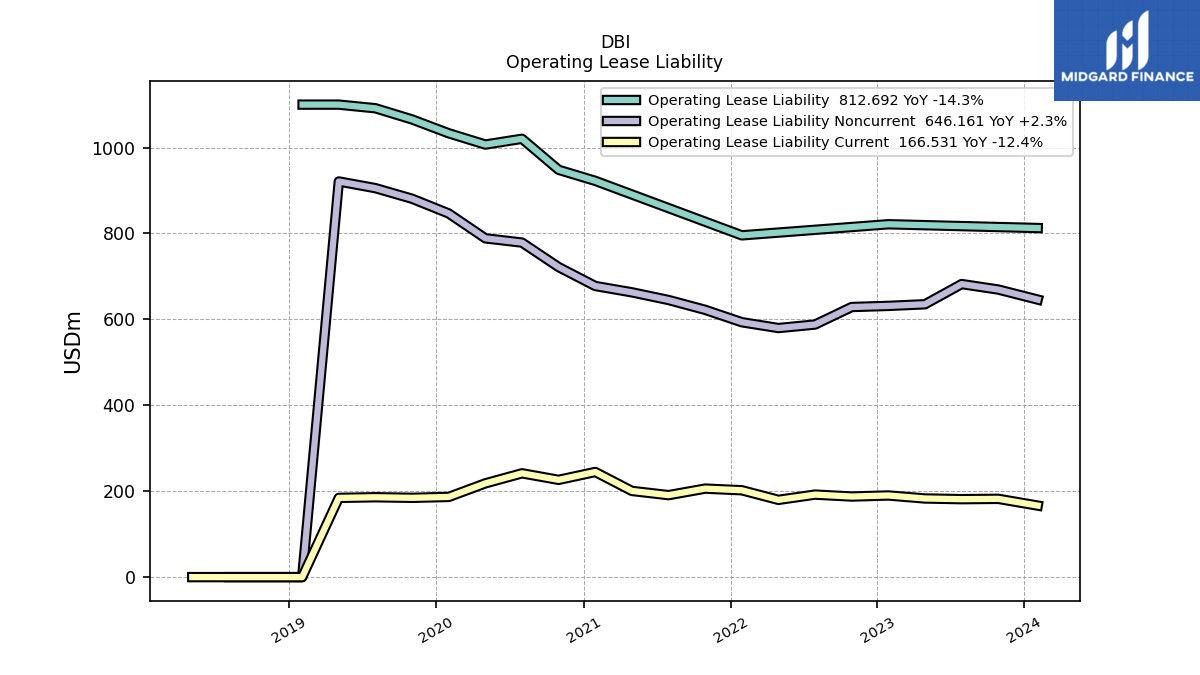
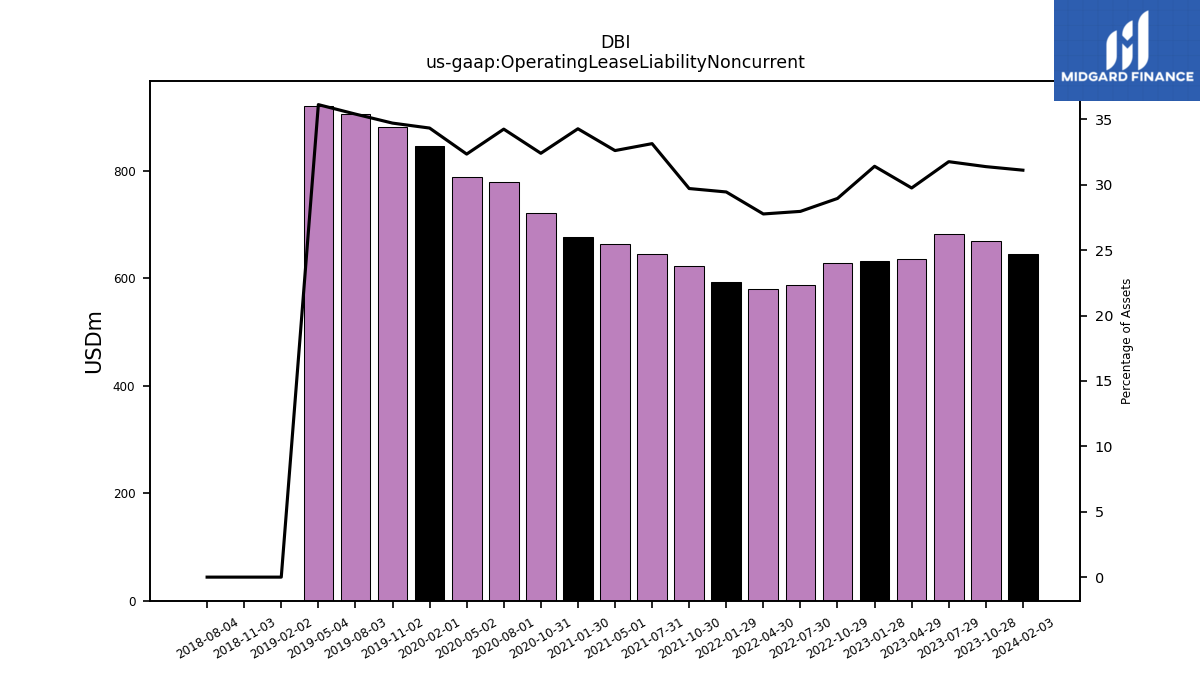
| Operating Lease Liability Noncurrent | 646.16 | 669.49 | 682.25 | 635.25 | 631.41 | 628.82 | 588.06 | 579.84 | 593.43 | 622.27 | 645.14 | 663.02 | 677.74 | 721.77 | 778.83 | 788.70 | 846.58 | 880.88 | 905.55 | 921.14 | 0.00 | 0.00 | 0.00 | NA | NA | NA | NA | NA | NA | NA | NA | NA | NA | NA | NA | NA | NA | NA | NA | NA | NA | NA | NA | NA | NA | NA | NA | NA | NA | NA | NA | NA |
| 2024-02-03 | 2023-10-28 | 2023-07-29 | 2023-04-29 | 2023-01-28 | 2022-10-29 | 2022-07-30 | 2022-04-30 | 2022-01-29 | 2021-10-30 | 2021-07-31 | 2021-05-01 | 2021-01-30 | 2020-10-31 | 2020-08-01 | 2020-05-02 | 2020-02-01 | 2019-11-02 | 2019-08-03 | 2019-05-04 | 2019-02-02 | 2018-11-03 | 2018-08-04 | 2018-05-05 | 2018-02-03 | 2017-10-28 | 2017-07-29 | 2017-04-29 | 2017-01-28 | 2016-10-29 | 2016-07-30 | 2016-04-30 | 2016-01-30 | 2015-10-31 | 2015-08-01 | 2015-05-02 | 2015-01-31 | 2014-11-01 | 2014-08-02 | 2014-05-03 | 2014-02-01 | 2013-11-02 | 2013-08-03 | 2013-05-04 | 2013-02-02 | 2012-10-27 | 2012-07-28 | 2012-04-28 | 2012-01-28 | 2011-10-29 | 2011-07-30 | 2011-01-29 | ||
|---|---|---|---|---|---|---|---|---|---|---|---|---|---|---|---|---|---|---|---|---|---|---|---|---|---|---|---|---|---|---|---|---|---|---|---|---|---|---|---|---|---|---|---|---|---|---|---|---|---|---|---|---|---|
| Stockholders Equity Including Portion Attributable To Noncontrolling Interest | 359.22 | 387.58 | 459.82 | 440.15 | 432.90 | 383.51 | 360.95 | 416.79 | 412.40 | 393.66 | 311.11 | 262.81 | 243.02 | 370.52 | 406.63 | 498.11 | 720.91 | 743.18 | 729.25 | 762.85 | 832.38 | 942.44 | 919.48 | 960.87 | 950.36 | 948.56 | 973.28 | 945.29 | 937.49 | 923.42 | 941.37 | 933.57 | 904.92 | 1028.13 | 1065.66 | 1048.79 | 1011.12 | 995.88 | 991.17 | 1023.29 | 998.54 | 981.22 | 930.74 | 893.38 | 858.58 | 858.48 | 901.30 | 854.71 | 786.59 | 771.14 | 626.59 | 488.87 | |
| Common Stock Value | 1030.77 | 1028.31 | 1025.66 | 1018.77 | 1018.87 | 1012.79 | 1010.18 | 1006.38 | 1005.38 | 1000.18 | 998.12 | 992.38 | 990.15 | 985.12 | 980.75 | 975.30 | 971.38 | 993.09 | 988.30 | 982.09 | 978.79 | 975.66 | 971.65 | 965.62 | 961.25 | 957.96 | 953.87 | 949.64 | 946.35 | 941.49 | 936.57 | 932.70 | 930.01 | NA | NA | NA | 908.68 | NA | NA | NA | 890.70 | NA | NA | NA | 872.03 | NA | NA | NA | NA | NA | NA | NA | |
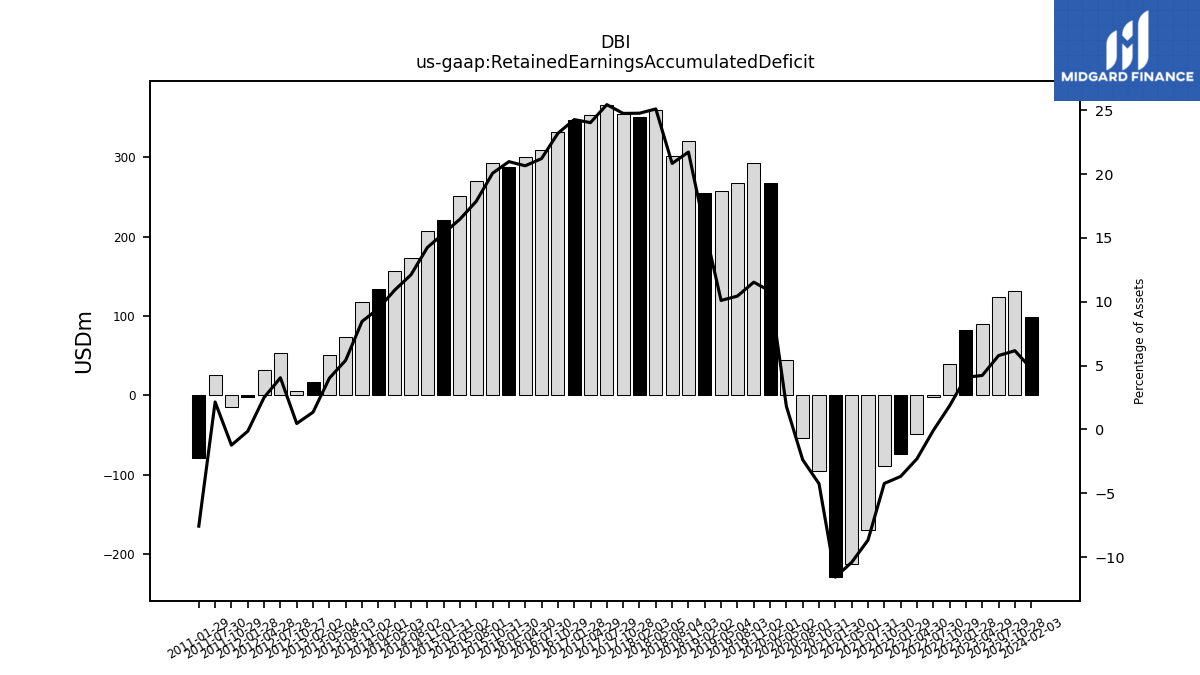
| Retained Earnings Accumulated Deficit | 98.90 | 131.42 | 124.09 | 90.16 | 81.99 | 40.05 | -1.91 | -48.12 | -74.30 | -88.72 | -168.90 | -211.76 | -228.78 | -94.78 | -54.14 | 44.08 | 267.09 | 292.49 | 266.96 | 257.45 | 254.72 | 320.34 | 301.01 | 359.34 | 350.08 | 354.31 | 366.20 | 353.59 | 346.60 | 332.05 | 309.50 | 300.82 | 287.14 | 292.54 | 270.51 | 250.59 | 220.83 | 206.53 | 173.62 | 156.10 | 134.44 | 117.64 | 73.97 | 51.51 | 16.99 | 5.98 | 52.89 | 31.57 | -1.74 | -14.65 | 25.59 | -78.94 | |
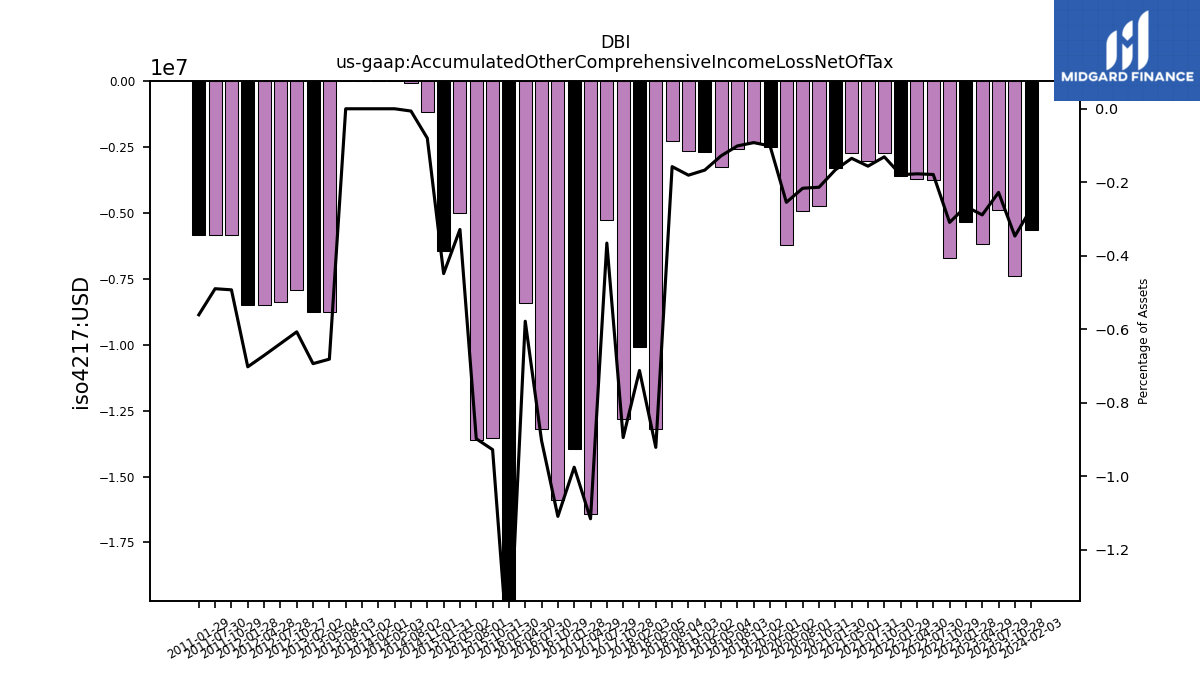
| Accumulated Other Comprehensive Income Loss Net Of Tax | -5.64 | -7.39 | -4.89 | -6.17 | -5.35 | -6.72 | -3.76 | -3.70 | -3.62 | -2.74 | -3.04 | -2.74 | -3.29 | -4.76 | -4.92 | -6.21 | -2.50 | -2.34 | -2.59 | -3.27 | -2.71 | -2.67 | -2.28 | -13.20 | -10.07 | -12.81 | -5.26 | -16.43 | -13.94 | -15.89 | -13.18 | -8.43 | -20.70 | -13.53 | -13.60 | -5.00 | -6.45 | -1.16 | -0.09 | 0.00 | 0.00 | 0.00 | 0.00 | -8.76 | -8.76 | -7.91 | -8.36 | -8.49 | -8.49 | -5.84 | -5.84 | -5.84 | |
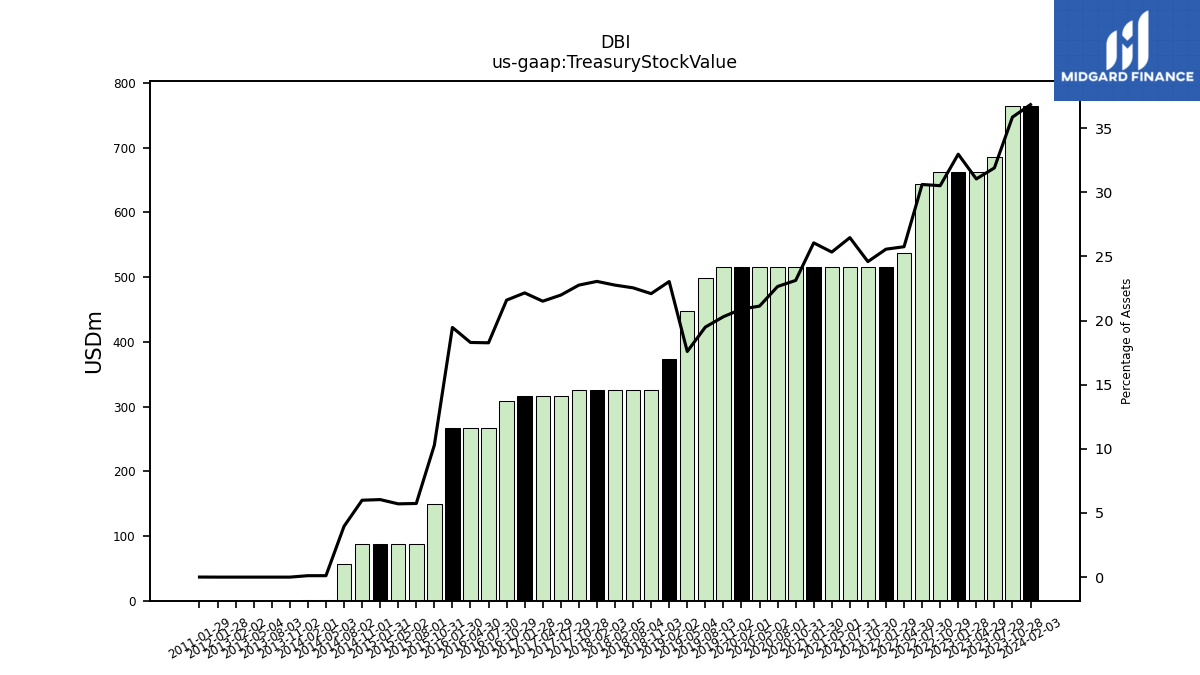
| Treasury Stock Value | 764.80 | 764.75 | 685.05 | 662.61 | 662.61 | 662.61 | 643.56 | 537.77 | 515.07 | 515.07 | 515.07 | 515.07 | 515.07 | 515.07 | 515.07 | 515.07 | 515.07 | 515.07 | 498.44 | 448.44 | 373.44 | 325.91 | 325.91 | 325.91 | 325.91 | 325.91 | 316.53 | 316.53 | 316.53 | 309.23 | 266.53 | 266.53 | 266.50 | 150.00 | 86.94 | 86.94 | 86.94 | 86.94 | 56.78 | 1.60 | 1.60 | 0.00 | 0.00 | 0.00 | 0.00 | NA | NA | NA | 0.00 | NA | NA | 0.06 |


