
| 2023-07-31 | 2023-04-30 | 2023-01-31 | 2022-10-31 | 2022-07-31 | 2022-04-30 | 2022-01-31 | 2021-10-31 | 2021-07-31 | 2021-04-30 | 2021-01-31 | 2020-10-31 | 2020-07-31 | 2020-04-30 | 2020-01-31 | 2019-10-31 | 2019-07-31 | 2019-04-30 | 2019-01-31 | 2018-10-31 | 2018-07-31 | 2018-04-30 | 2018-01-31 | 2017-10-31 | 2017-07-31 | 2017-04-30 | 2017-01-31 | 2016-10-31 | 2016-07-31 | 2016-04-30 | 2016-01-31 | 2015-10-31 | 2015-07-31 | 2015-04-30 | 2015-01-31 | 2014-10-31 | 2014-07-31 | 2014-04-30 | 2014-01-31 | 2013-10-31 | 2013-07-31 | 2013-04-30 | 2013-01-31 | 2012-10-31 | 2012-07-31 | 2012-04-30 | 2012-01-31 | 2011-10-31 | 2011-07-31 | 2011-04-30 | 2011-01-31 | 2010-10-31 | 2010-07-31 | ||
|---|---|---|---|---|---|---|---|---|---|---|---|---|---|---|---|---|---|---|---|---|---|---|---|---|---|---|---|---|---|---|---|---|---|---|---|---|---|---|---|---|---|---|---|---|---|---|---|---|---|---|---|---|---|---|
| Common Stock Value | 0.34 | 0.34 | 0.33 | 0.33 | 0.33 | 0.33 | 0.33 | 0.33 | 0.33 | 0.33 | 0.33 | 0.33 | 0.33 | 0.33 | 0.32 | 0.32 | 0.32 | 0.32 | 0.32 | 0.32 | 0.32 | 0.32 | 0.31 | 0.31 | 0.31 | 0.31 | 0.31 | 0.31 | 0.31 | 0.31 | 0.31 | 0.35 | 0.36 | 0.36 | 0.36 | 0.36 | 0.36 | 0.36 | 0.36 | 0.36 | 0.36 | 0.36 | 0.35 | 0.33 | 0.33 | 0.32 | 0.32 | 0.32 | 0.32 | NA | 0.34 | NA | NA | |
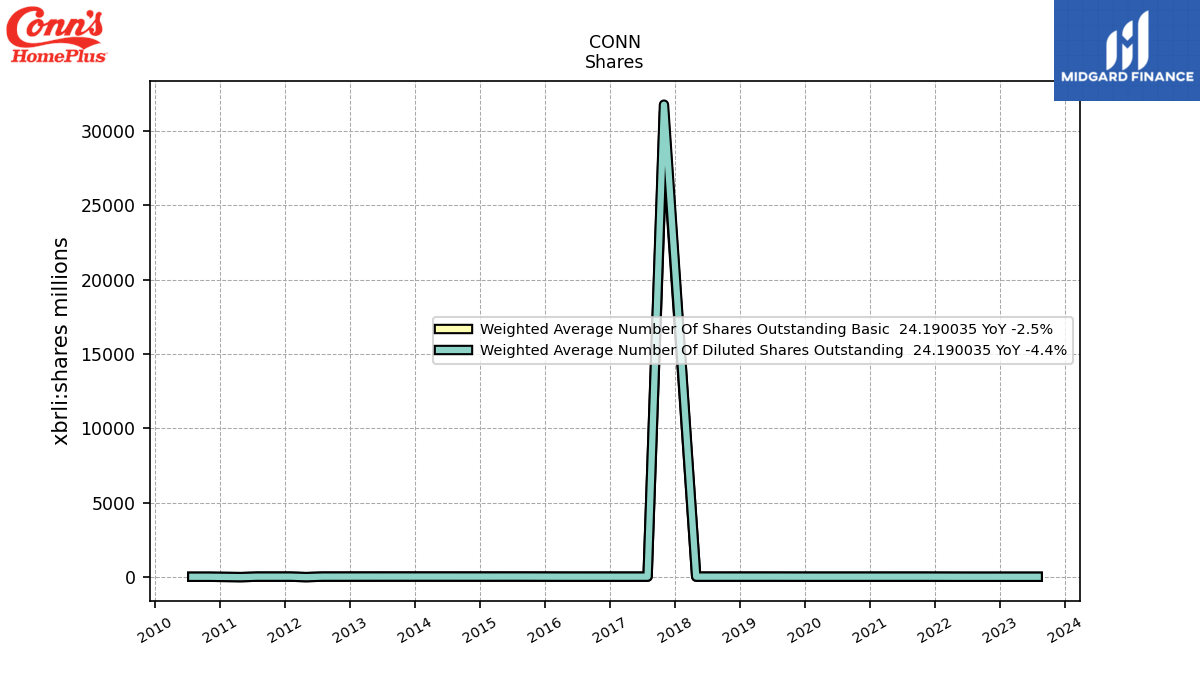
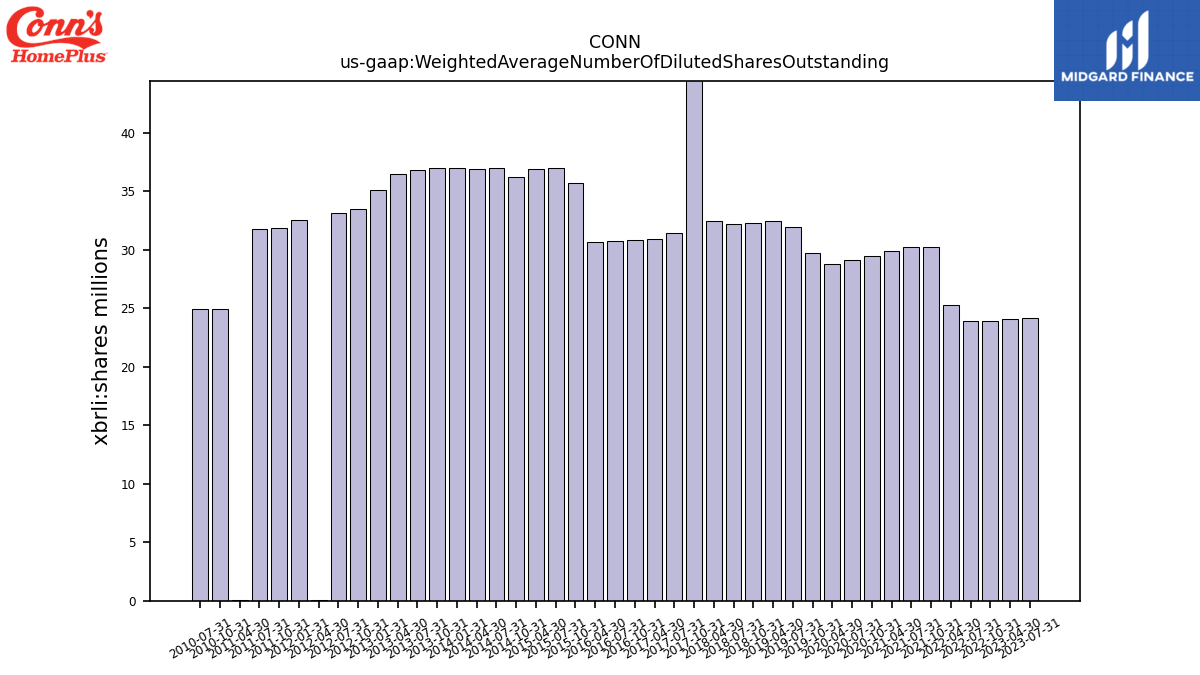
| Weighted Average Number Of Diluted Shares Outstanding | 24.19 | 24.13 | NA | 23.91 | 23.92 | 25.31 | NA | 30.26 | 30.21 | 29.88 | NA | 29.48 | 29.14 | 28.82 | NA | 29.71 | 31.96 | 32.44 | NA | 32.32 | 32.24 | 32.45 | NA | 31764.59 | 31.43 | 30.97 | NA | 30.82 | 30.73 | 30.66 | NA | 35.70 | 37.04 | 36.88 | NA | 36.27 | 36.97 | 36.92 | 37.02 | 36.97 | 36.85 | 36.45 | 35.16 | 33.54 | 33.12 | 0.03 | 32.57 | 31.88 | 31.81 | 0.03 | NA | 24.95 | 24.95 | |
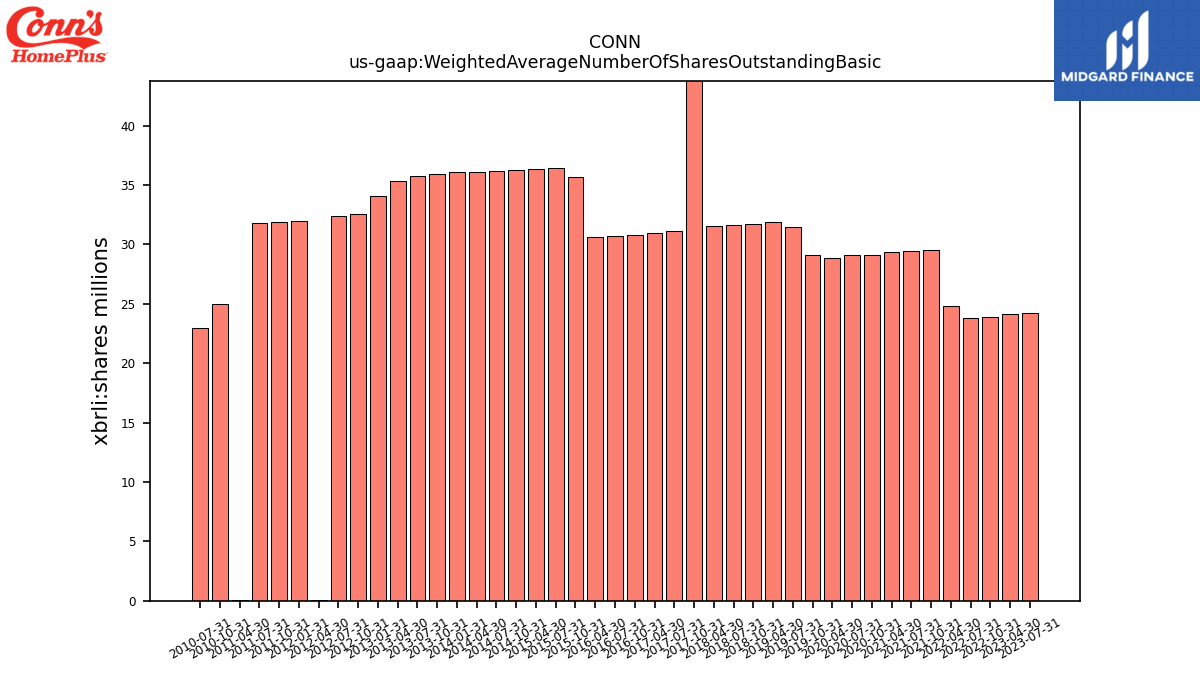
| Weighted Average Number Of Shares Outstanding Basic | 24.19 | 24.13 | NA | 23.91 | 23.83 | 24.80 | NA | 29.49 | 29.44 | 29.32 | NA | 29.14 | 29.07 | 28.82 | NA | 29.09 | 31.44 | 31.88 | NA | 31.71 | 31.65 | 31.54 | NA | 31292.91 | 31.09 | 30.97 | NA | 30.82 | 30.73 | 30.66 | NA | 35.70 | 36.47 | 36.37 | NA | 36.27 | 36.21 | 36.13 | 36.05 | 35.95 | 35.78 | 35.31 | 34.07 | 32.55 | 32.40 | 0.03 | 32.00 | 31.88 | 31.81 | 0.03 | NA | 24.95 | 22.94 | |
| Earnings Per Share Basic | -1.39 | -1.47 | -1.78 | -1.04 | 0.09 | 0.25 | 0.28 | 0.62 | 1.26 | 1.55 | 0.86 | 0.25 | 0.71 | -1.95 | 0.18 | 0.52 | 0.64 | 0.61 | 0.93 | 0.46 | 0.54 | 0.40 | 0.10 | 0.05 | 0.14 | -0.08 | 0.00 | -0.12 | -0.39 | -0.32 | 0.03 | -0.07 | 0.45 | 0.43 | 0.43 | -0.08 | 0.49 | 0.79 | 0.00 | 0.68 | 0.54 | 0.63 | 0.52 | 0.36 | 0.36 | 0.36 | 0.24 | -0.40 | -0.11 | 0.14 | -0.14 | -0.19 | 0.06 | |
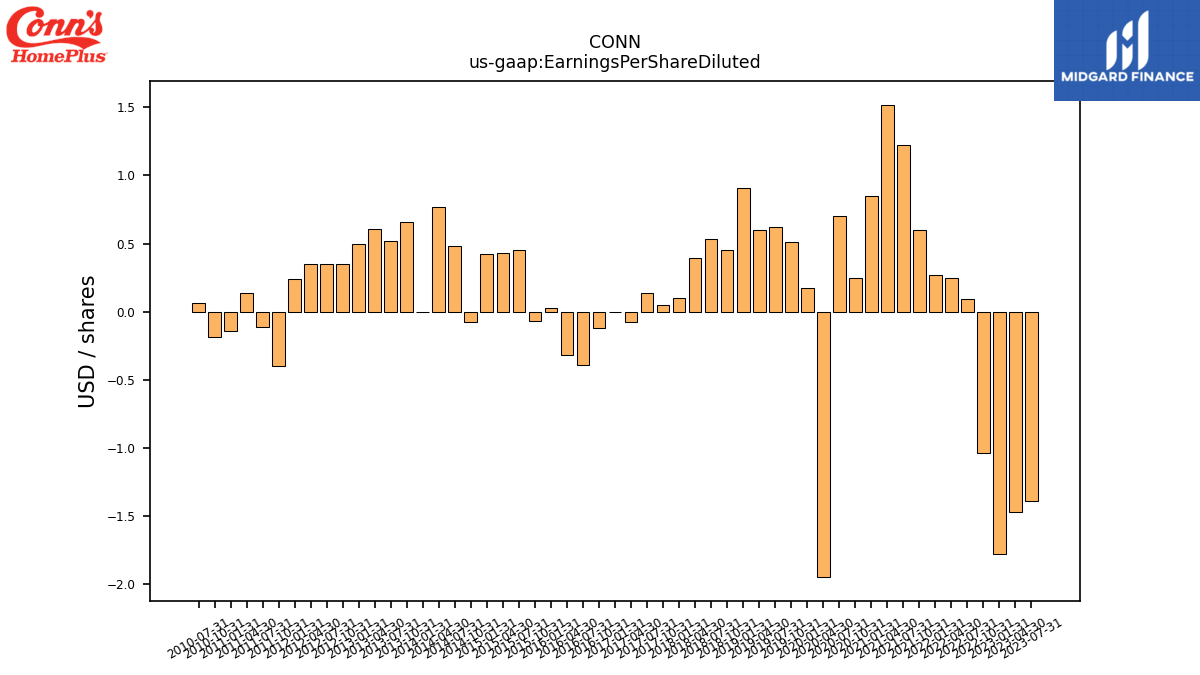
| Earnings Per Share Diluted | -1.39 | -1.47 | -1.78 | -1.04 | 0.09 | 0.25 | 0.27 | 0.60 | 1.22 | 1.52 | 0.85 | 0.25 | 0.70 | -1.95 | 0.17 | 0.51 | 0.62 | 0.60 | 0.91 | 0.45 | 0.53 | 0.39 | 0.10 | 0.05 | 0.14 | -0.08 | 0.00 | -0.12 | -0.39 | -0.32 | 0.03 | -0.07 | 0.45 | 0.43 | 0.42 | -0.08 | 0.48 | 0.77 | 0.00 | 0.66 | 0.52 | 0.61 | 0.50 | 0.35 | 0.35 | 0.35 | 0.24 | -0.40 | -0.11 | 0.14 | -0.14 | -0.19 | 0.06 |
| 2023-07-31 | 2023-04-30 | 2023-01-31 | 2022-10-31 | 2022-07-31 | 2022-04-30 | 2022-01-31 | 2021-10-31 | 2021-07-31 | 2021-04-30 | 2021-01-31 | 2020-10-31 | 2020-07-31 | 2020-04-30 | 2020-01-31 | 2019-10-31 | 2019-07-31 | 2019-04-30 | 2019-01-31 | 2018-10-31 | 2018-07-31 | 2018-04-30 | 2018-01-31 | 2017-10-31 | 2017-07-31 | 2017-04-30 | 2017-01-31 | 2016-10-31 | 2016-07-31 | 2016-04-30 | 2016-01-31 | 2015-10-31 | 2015-07-31 | 2015-04-30 | 2015-01-31 | 2014-10-31 | 2014-07-31 | 2014-04-30 | 2014-01-31 | 2013-10-31 | 2013-07-31 | 2013-04-30 | 2013-01-31 | 2012-10-31 | 2012-07-31 | 2012-04-30 | 2012-01-31 | 2011-10-31 | 2011-07-31 | 2011-04-30 | 2011-01-31 | 2010-10-31 | 2010-07-31 | ||
|---|---|---|---|---|---|---|---|---|---|---|---|---|---|---|---|---|---|---|---|---|---|---|---|---|---|---|---|---|---|---|---|---|---|---|---|---|---|---|---|---|---|---|---|---|---|---|---|---|---|---|---|---|---|---|
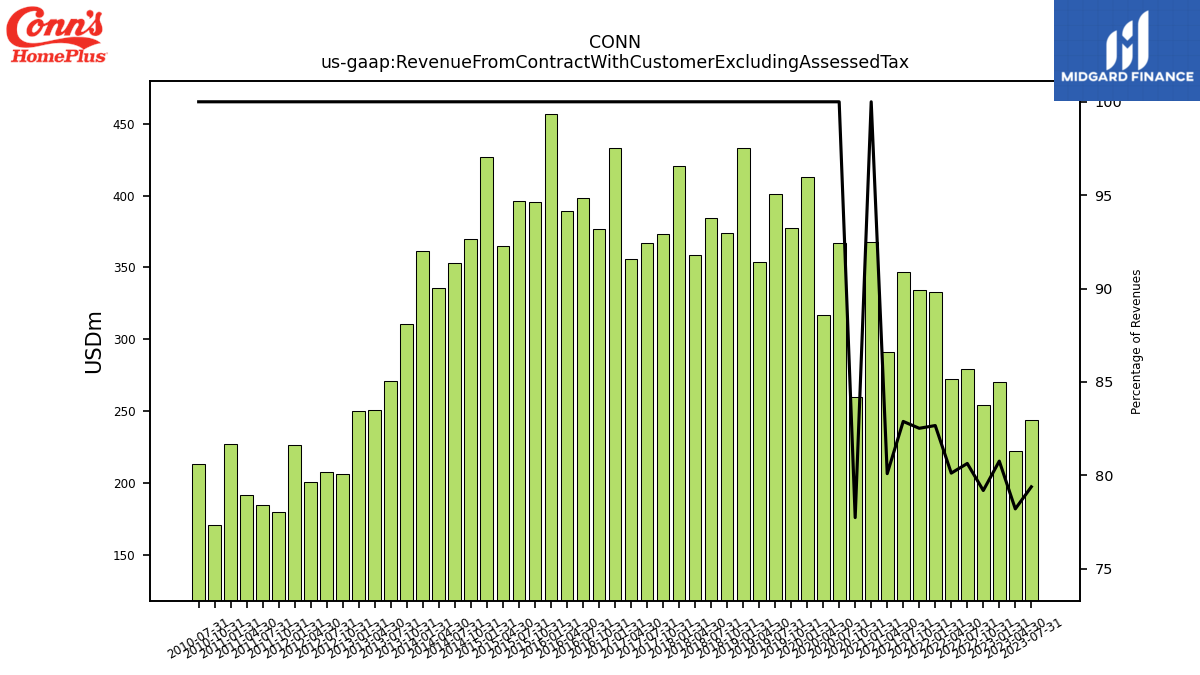
| Revenue From Contract With Customer Excluding Assessed Tax | 243.65 | 222.55 | 270.46 | 254.36 | 279.51 | 272.26 | 332.73 | 334.58 | 346.79 | 291.30 | 367.79 | 259.77 | 366.92 | 317.16 | 412.99 | 377.71 | 401.06 | 353.51 | 432.98 | 373.82 | 384.62 | 358.39 | 420.39 | 373.17 | 366.65 | 355.83 | 432.81 | 376.77 | 398.16 | 389.11 | 456.82 | 395.23 | 396.05 | 365.08 | 426.75 | 370.06 | 352.96 | 335.45 | 361.14 | 310.88 | 270.69 | 251.06 | 250.34 | 206.40 | 207.44 | 200.85 | 226.67 | 179.54 | 184.38 | 191.98 | 227.36 | 170.56 | 213.12 | |
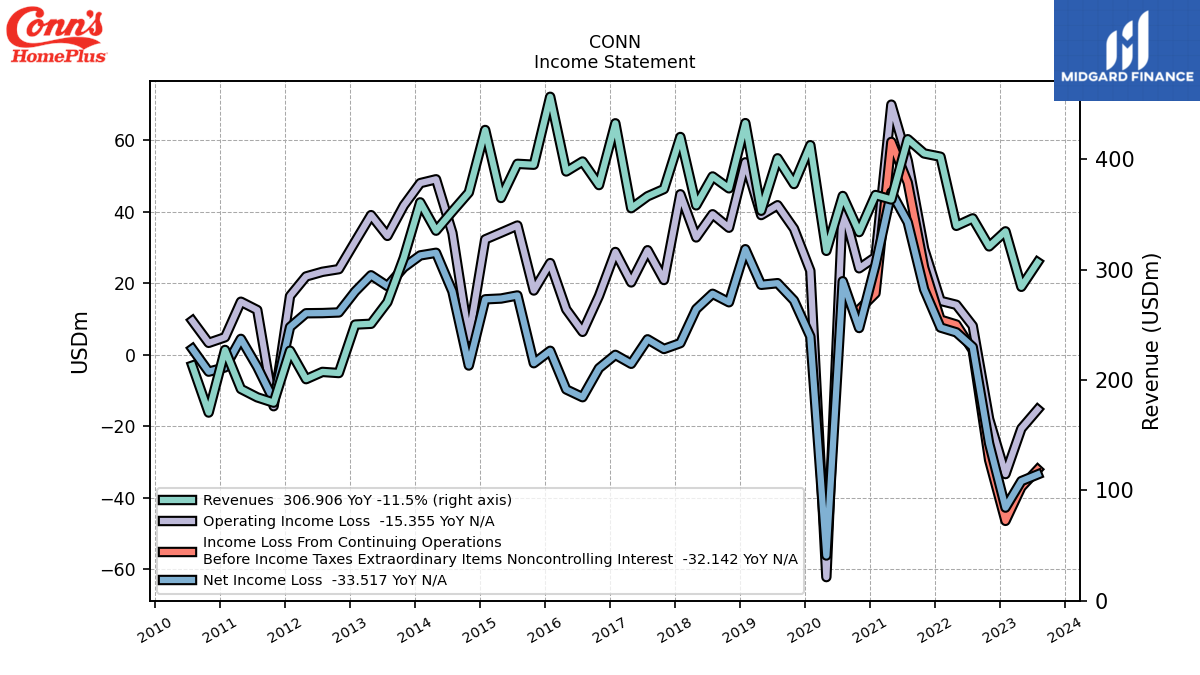
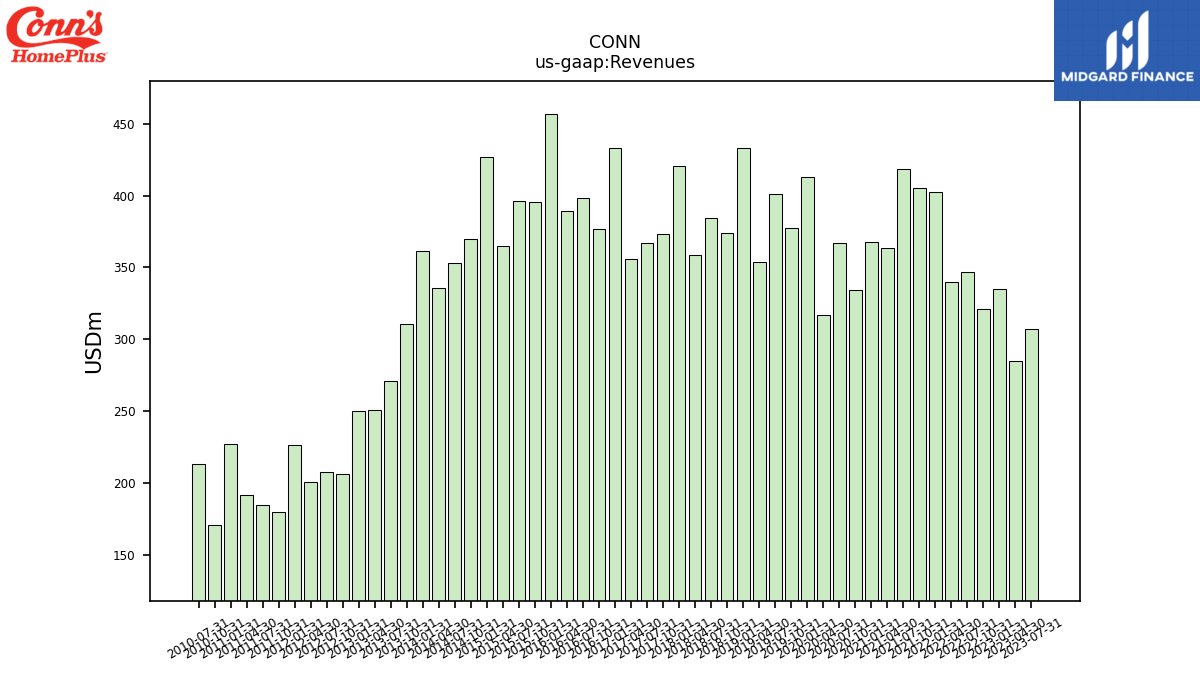
| Revenues | 306.91 | 284.57 | 334.88 | 321.20 | 346.63 | 339.82 | 402.49 | 405.46 | 418.38 | 363.70 | 367.79 | 334.16 | 366.92 | 317.16 | 412.99 | 377.71 | 401.06 | 353.51 | 432.98 | 373.82 | 384.62 | 358.39 | 420.39 | 373.17 | 366.65 | 355.83 | 432.81 | 376.77 | 398.16 | 389.11 | 456.82 | 395.23 | 396.05 | 365.08 | 426.75 | 370.06 | 352.96 | 335.45 | 361.14 | 310.88 | 270.69 | 251.06 | 250.34 | 206.40 | 207.44 | 200.85 | 226.67 | 179.54 | 184.38 | 191.98 | 227.36 | 170.56 | 213.12 | |
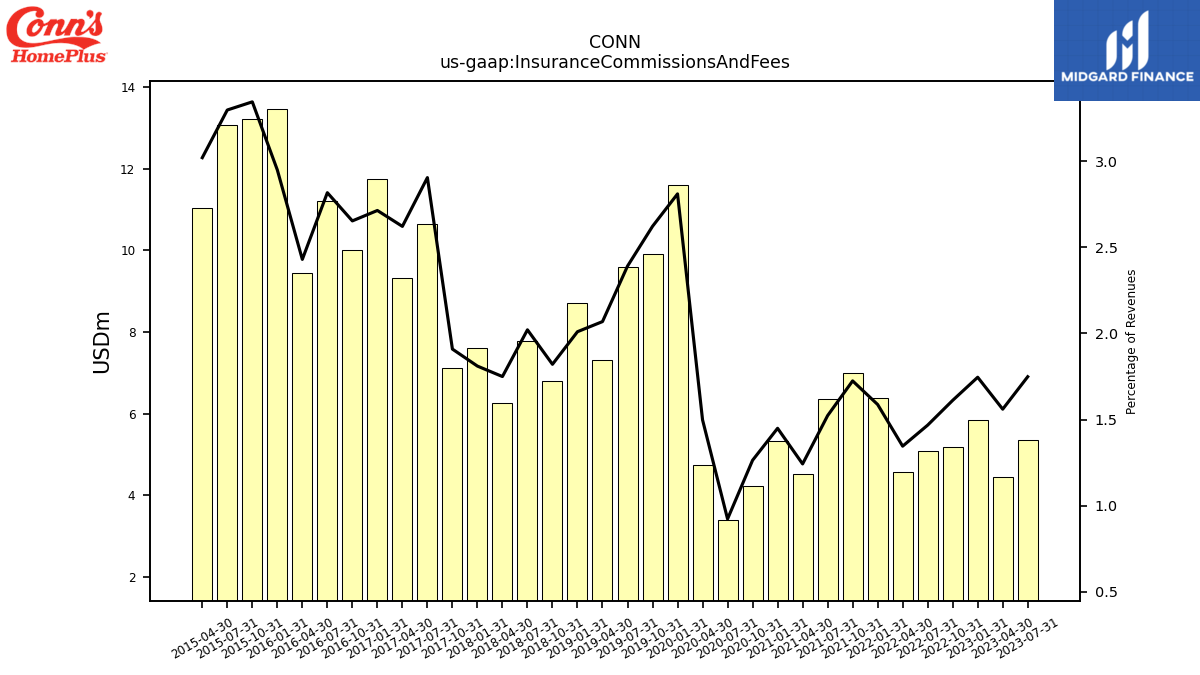
| Insurance Commissions And Fees | 5.37 | 4.44 | 5.85 | 5.18 | 5.09 | 4.57 | 6.39 | 6.99 | 6.37 | 4.52 | 5.33 | 4.22 | 3.38 | 4.75 | 11.61 | 9.90 | 9.59 | 7.31 | 8.70 | 6.81 | 7.77 | 6.27 | 7.61 | 7.12 | 10.65 | 9.33 | 11.75 | 10.00 | 11.22 | 9.46 | 13.48 | 13.22 | 13.06 | 11.03 | NA | NA | NA | NA | NA | NA | NA | NA | NA | NA | NA | NA | NA | NA | NA | NA | NA | NA | NA | |
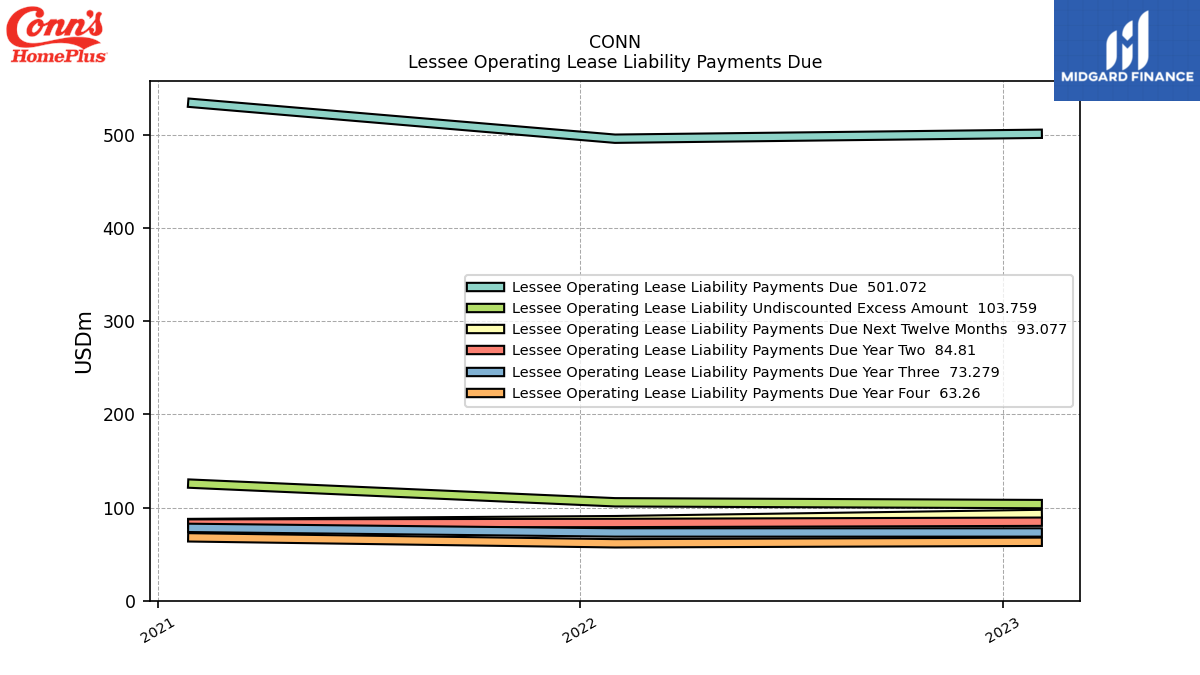
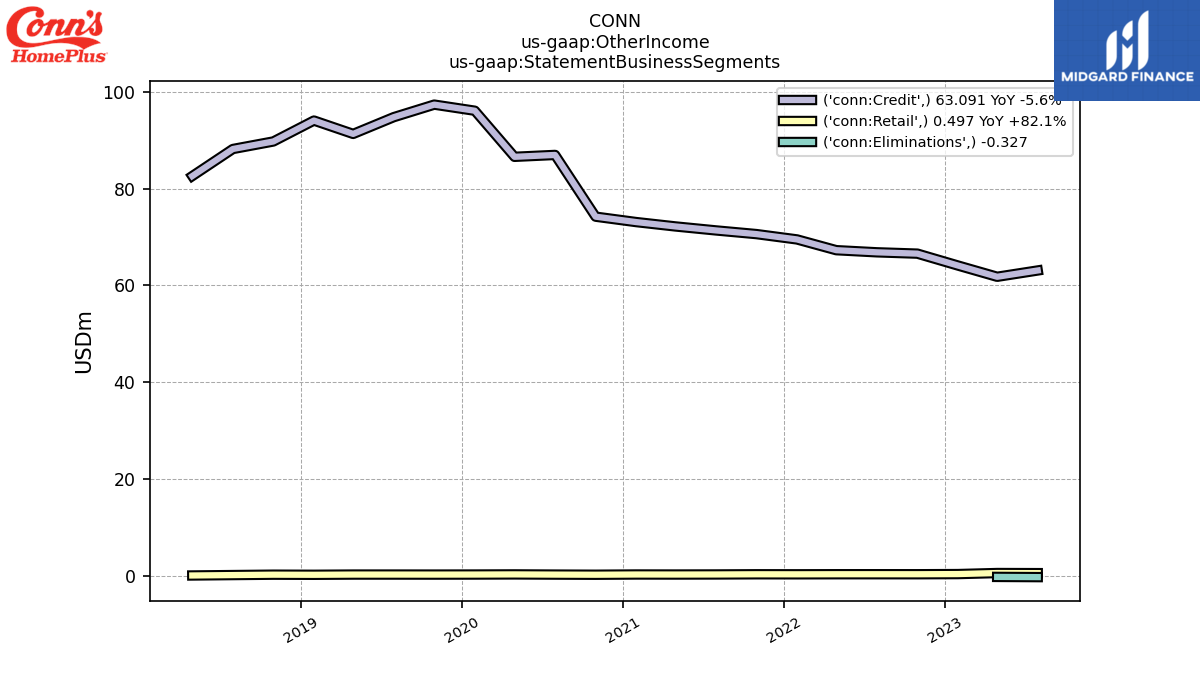
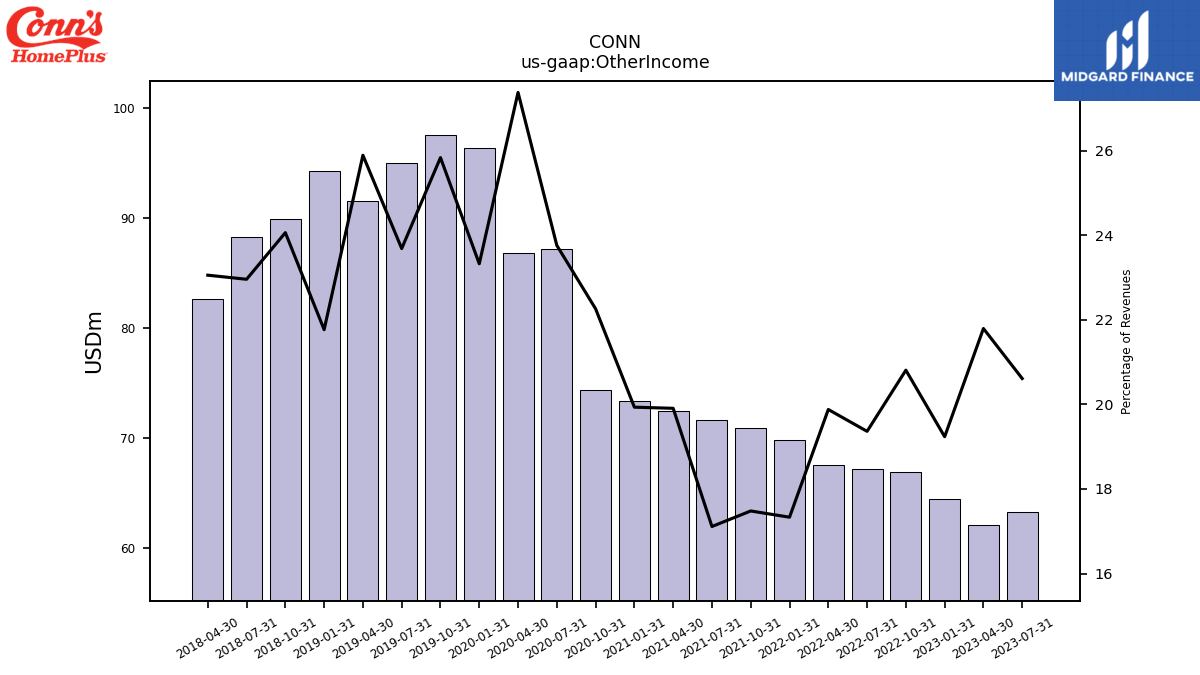
| Other Income | 63.26 | 62.02 | 64.42 | 66.84 | 67.12 | 67.56 | 69.76 | 70.88 | 71.60 | 72.41 | 73.32 | 74.39 | 87.18 | 86.83 | 96.33 | 97.59 | 95.00 | 91.53 | 94.25 | 89.95 | 88.31 | 82.63 | NA | NA | NA | NA | NA | NA | NA | NA | NA | NA | NA | NA | NA | NA | NA | NA | NA | NA | NA | NA | NA | NA | NA | NA | NA | NA | NA | NA | NA | NA | NA | |
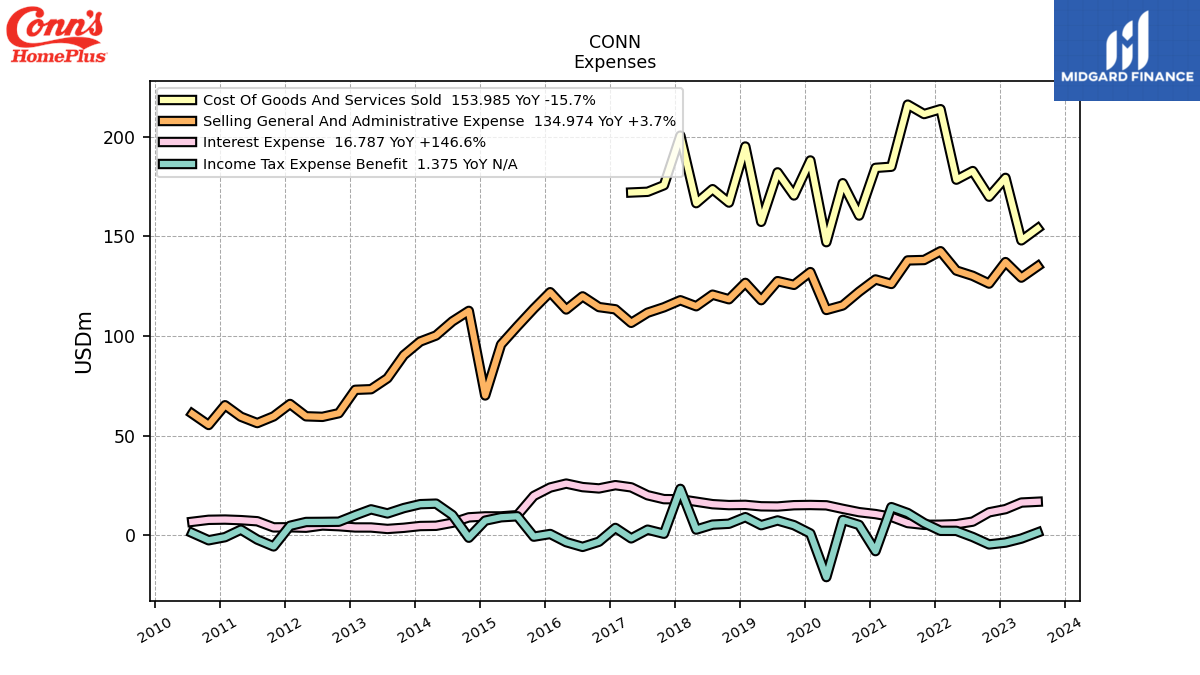
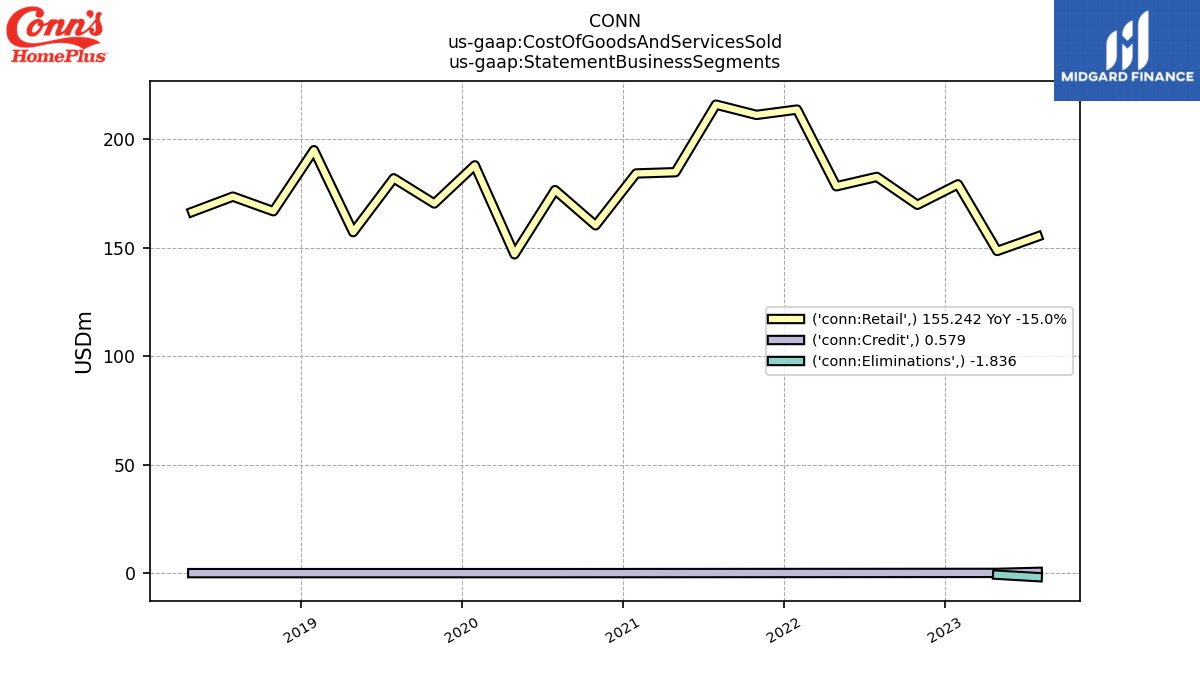
| Cost Of Goods And Services Sold | 153.99 | 147.93 | 179.29 | 169.84 | 182.72 | 178.38 | 213.77 | 211.30 | 216.04 | 184.88 | 184.30 | 160.38 | 176.62 | 147.01 | 188.04 | 170.45 | 182.06 | 157.23 | 195.03 | 166.89 | 173.63 | 166.59 | 200.50 | 175.59 | 172.31 | 171.95 | NA | NA | NA | NA | NA | NA | NA | NA | NA | NA | NA | NA | NA | NA | NA | NA | NA | NA | NA | NA | NA | NA | NA | NA | NA | NA | NA | |
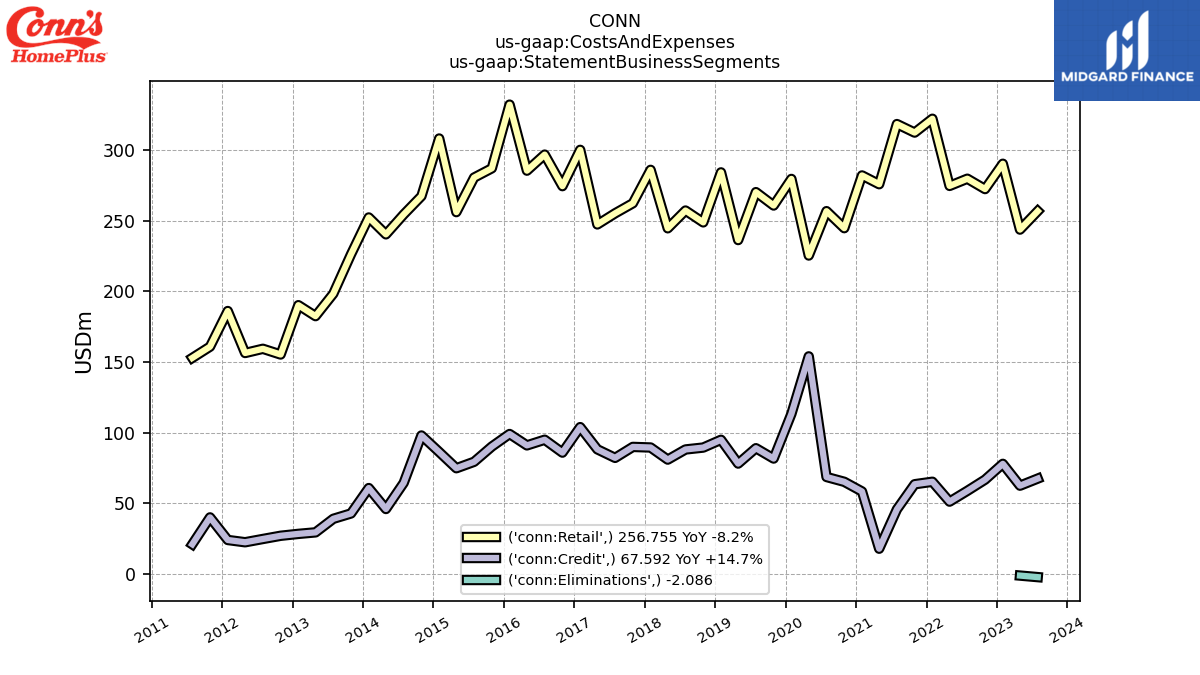
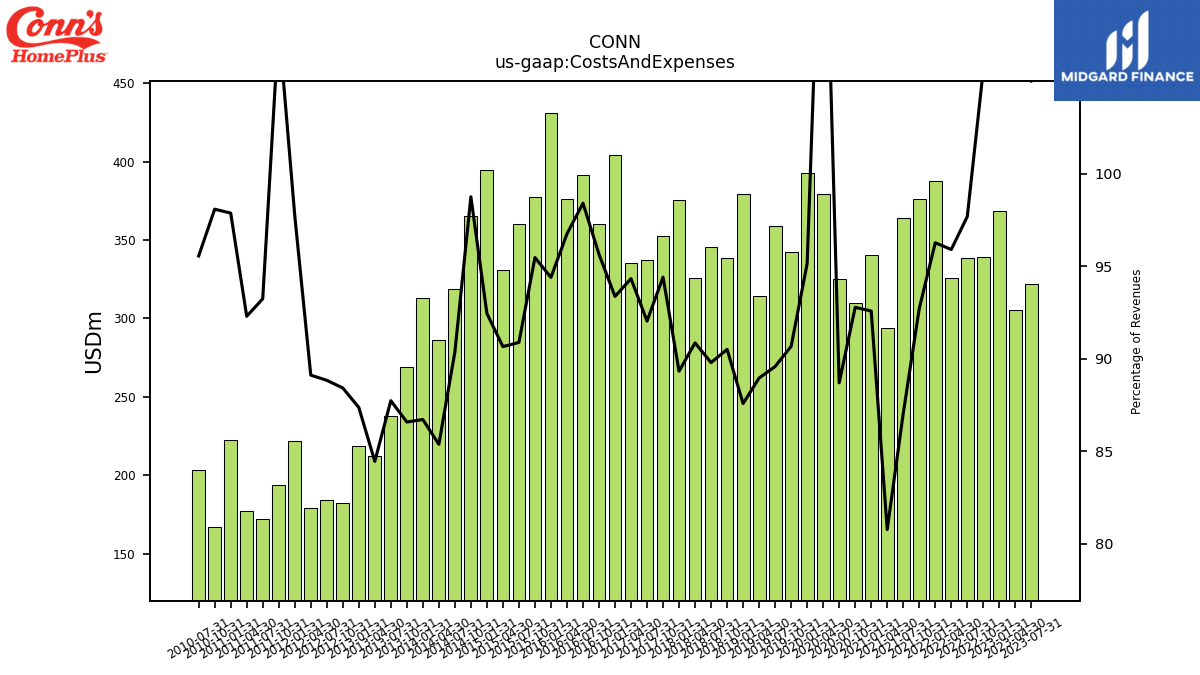
| Costs And Expenses | 322.26 | 305.27 | 368.31 | 339.19 | 338.60 | 325.90 | 387.46 | 375.91 | 364.17 | 293.79 | 340.50 | 310.03 | 325.48 | 379.40 | 392.90 | 342.48 | 359.29 | 314.49 | 379.22 | 338.35 | 345.37 | 325.62 | 375.55 | 352.32 | 337.45 | 335.64 | 404.11 | 360.38 | 391.81 | 376.46 | 431.22 | 377.32 | 359.95 | 330.97 | 394.53 | 365.44 | 318.97 | 286.42 | 313.19 | 269.18 | 237.50 | 212.06 | 218.73 | 182.51 | 184.28 | 179.00 | 221.55 | 193.99 | 171.91 | 177.19 | 222.52 | 167.29 | 203.64 | |
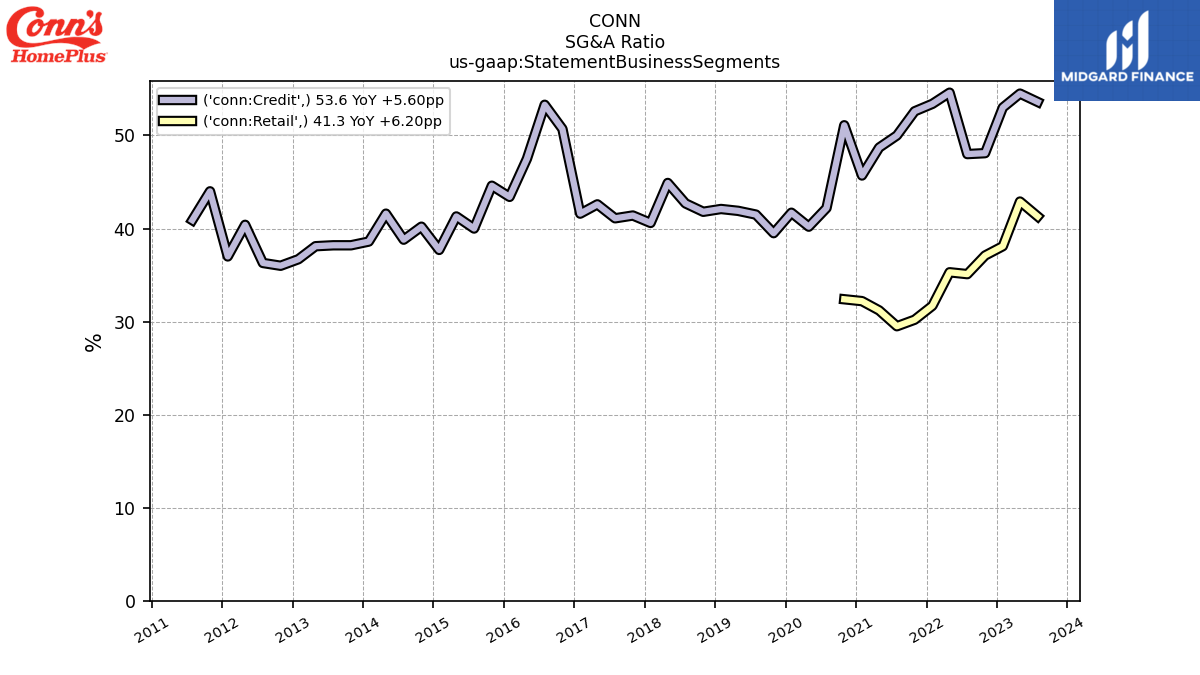
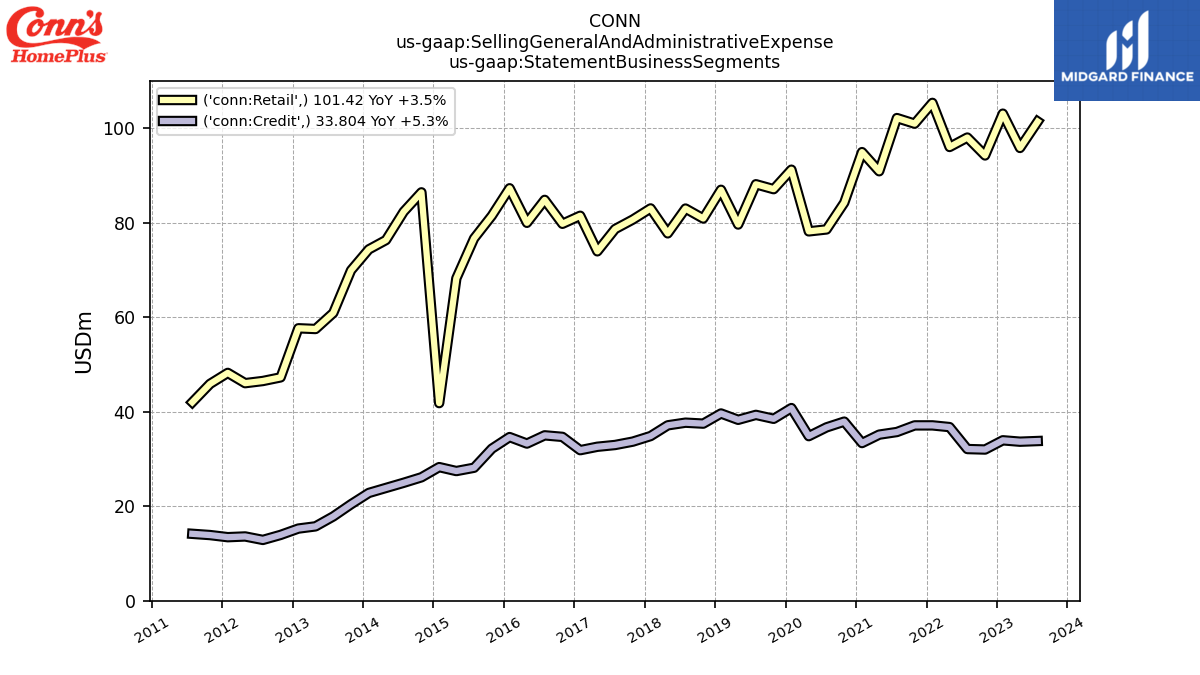
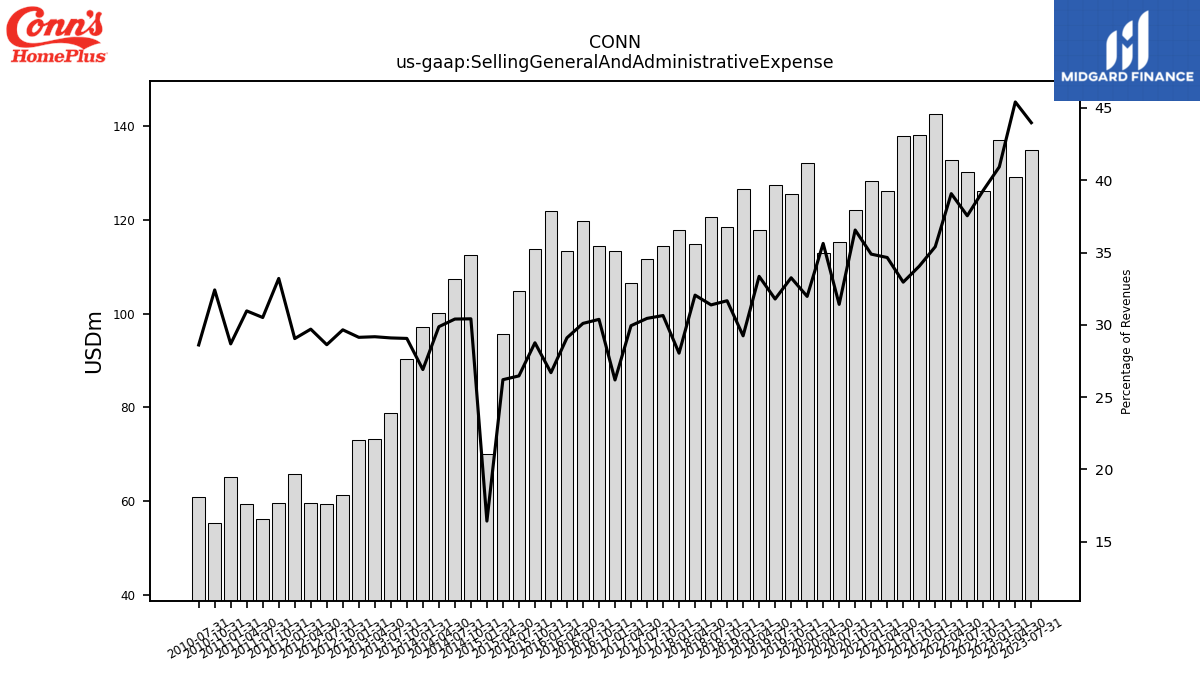
| Selling General And Administrative Expense | 134.97 | 129.24 | 137.04 | 126.24 | 130.14 | 132.78 | 142.49 | 138.08 | 137.87 | 126.05 | 128.32 | 122.16 | 115.28 | 113.01 | 132.02 | 125.61 | 127.48 | 117.91 | 126.61 | 118.38 | 120.69 | 114.88 | 117.89 | 114.36 | 111.63 | 106.54 | 113.35 | 114.46 | 119.85 | 113.25 | 121.94 | 113.67 | 104.83 | 95.67 | 70.11 | 112.56 | 107.30 | 100.20 | 97.17 | 90.34 | 78.76 | 73.25 | 72.94 | 61.21 | 59.38 | 59.66 | 65.85 | 59.62 | 56.25 | 59.45 | 65.22 | 55.29 | 60.97 | |
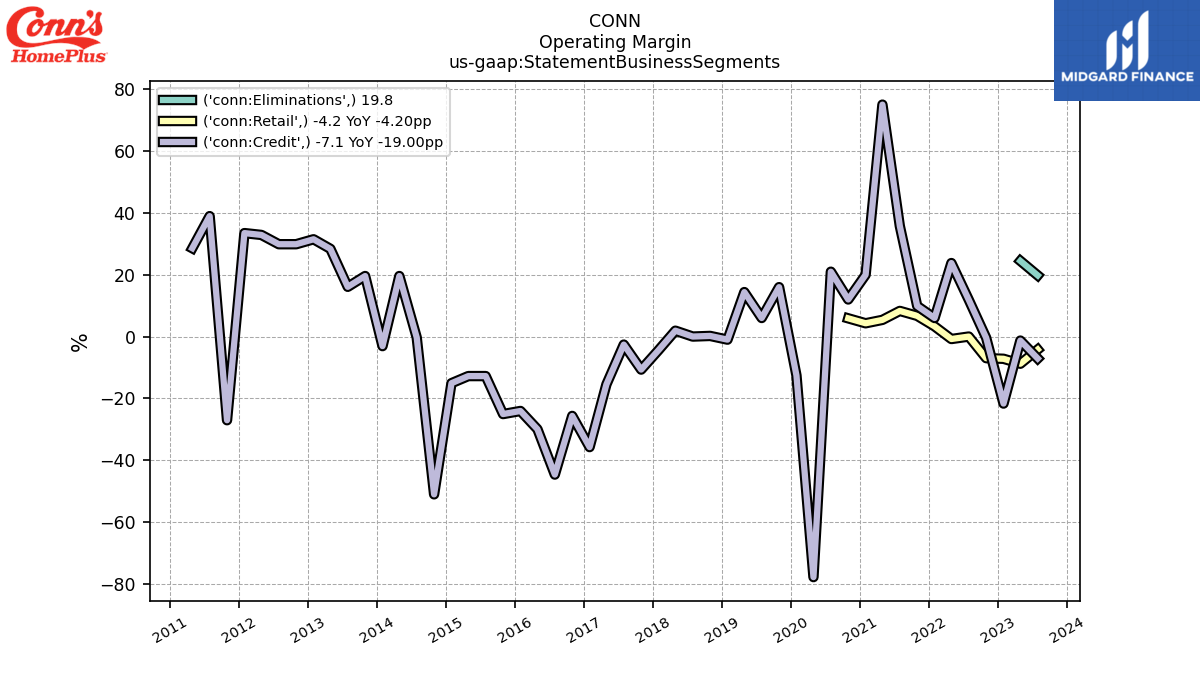
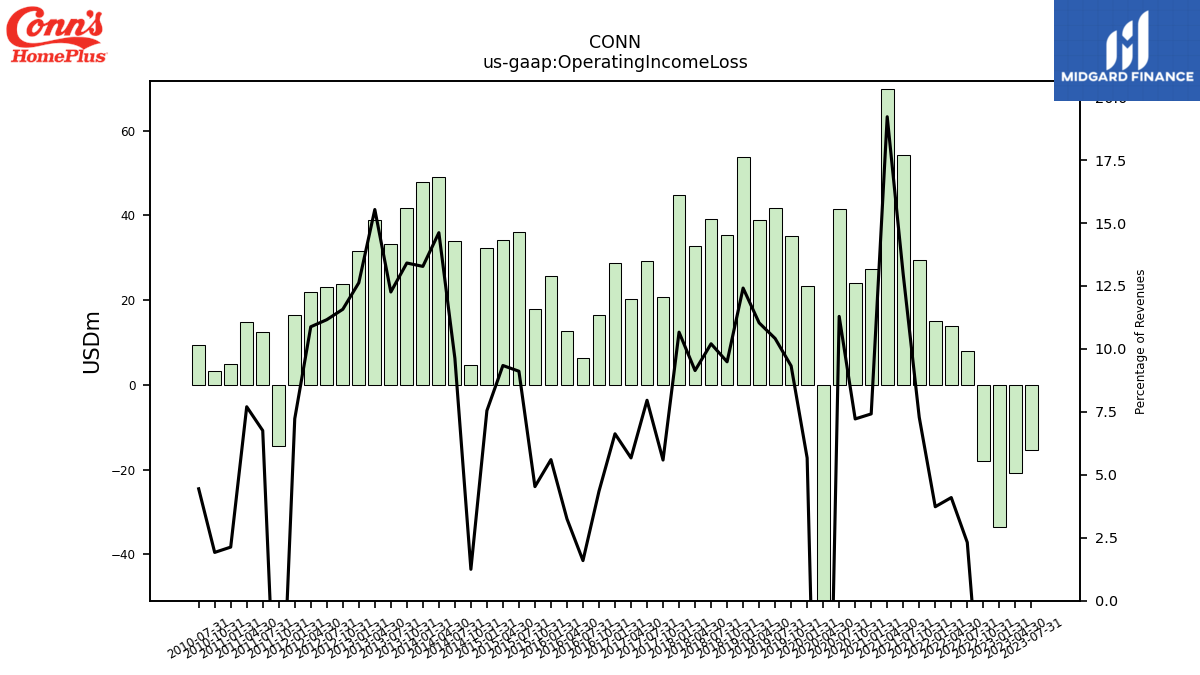
| Operating Income Loss | -15.36 | -20.70 | -33.43 | -18.00 | 8.03 | 13.93 | 15.03 | 29.55 | 54.21 | 69.91 | 27.29 | 24.13 | 41.44 | -62.24 | 23.42 | 35.22 | 41.77 | 39.02 | 53.77 | 35.47 | 39.25 | 32.76 | 44.84 | 20.85 | 29.19 | 20.18 | 28.70 | 16.39 | 6.35 | 12.66 | 25.60 | 17.92 | 36.10 | 34.11 | 32.22 | 4.62 | 34.00 | 49.03 | 47.95 | 41.70 | 33.19 | 39.01 | 31.61 | 23.89 | 23.15 | 21.85 | 16.39 | -14.44 | 12.46 | 14.79 | 4.84 | 3.27 | 9.47 | |
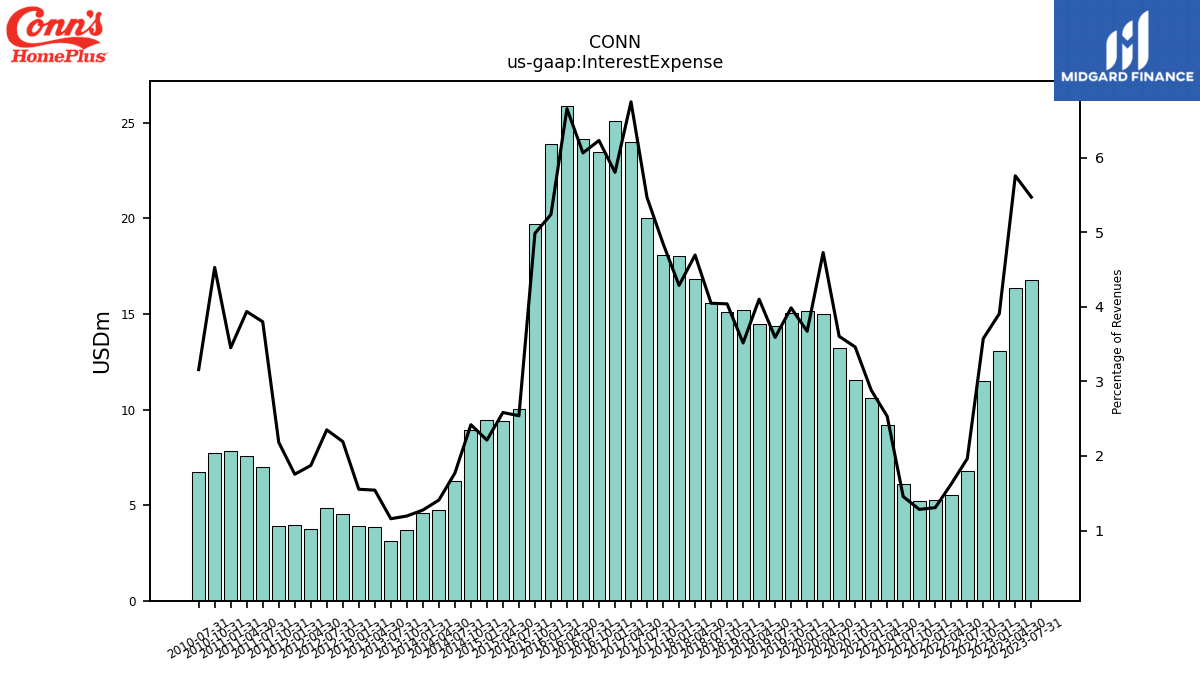
| Interest Expense | 16.79 | 16.38 | 13.08 | 11.48 | 6.81 | 5.52 | 5.26 | 5.21 | 6.09 | 9.20 | 10.60 | 11.56 | 13.22 | 14.99 | 15.16 | 15.05 | 14.40 | 14.50 | 15.22 | 15.10 | 15.57 | 16.82 | 18.02 | 18.09 | 20.04 | 24.01 | 25.11 | 23.47 | 24.14 | 25.90 | 23.92 | 19.70 | 10.05 | 9.43 | 9.44 | 8.95 | 6.25 | 4.72 | 4.60 | 3.71 | 3.13 | 3.87 | 3.89 | 4.53 | 4.87 | 3.76 | 3.98 | 3.92 | 7.00 | 7.56 | 7.85 | 7.72 | 6.73 | |
| Interest Paid Net | 1.51 | 10.23 | 9.49 | 8.17 | 4.73 | 3.61 | 3.50 | 3.83 | 4.20 | 6.73 | 12.26 | 4.83 | 15.37 | 8.61 | 17.00 | 11.94 | 12.95 | 8.61 | 16.71 | 8.35 | NA | NA | NA | NA | NA | NA | NA | NA | NA | NA | NA | NA | NA | NA | NA | NA | NA | NA | NA | NA | NA | NA | NA | NA | NA | NA | NA | NA | NA | NA | NA | NA | NA | |
| Income Tax Expense Benefit | 1.38 | -1.70 | -3.71 | -4.63 | -0.91 | 2.18 | 2.20 | 6.10 | 11.12 | 14.09 | -8.00 | 5.15 | 7.69 | -21.03 | 0.87 | 5.03 | 7.40 | 5.01 | 9.07 | 5.75 | 5.31 | 2.81 | 23.25 | 0.73 | 2.78 | -1.59 | 3.66 | -3.26 | -5.86 | -3.49 | 0.61 | -0.73 | 9.51 | 9.00 | 7.32 | -1.26 | 10.10 | 15.84 | 15.57 | 13.61 | 10.93 | 12.97 | 10.03 | 6.76 | 6.68 | 6.63 | 4.72 | -5.63 | -2.20 | 2.78 | -0.98 | -2.55 | 1.13 | |
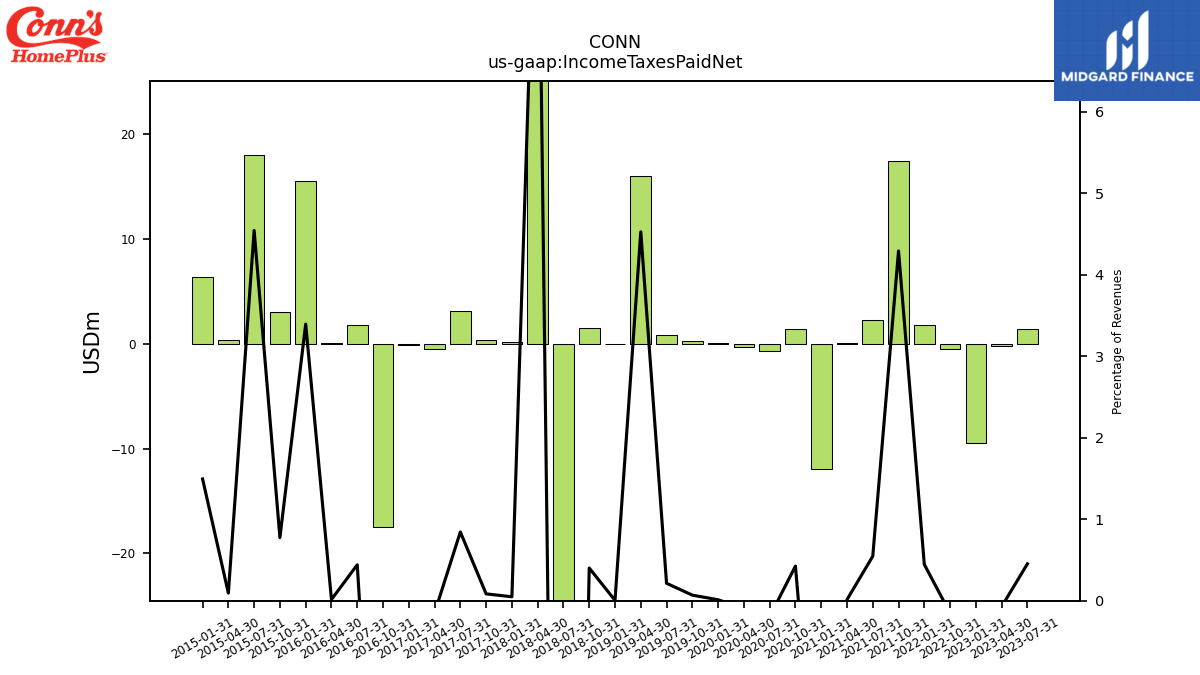
| Income Taxes Paid Net | 1.39 | -0.20 | -9.44 | -0.49 | NA | NA | 1.79 | 17.40 | 2.28 | 0.05 | -11.98 | 1.42 | -0.72 | -0.31 | 0.05 | 0.26 | 0.86 | 16.00 | 0.02 | 1.50 | -56.98 | 35.01 | 0.20 | 0.32 | 3.09 | -0.53 | -0.13 | -17.44 | 1.75 | 0.06 | 15.50 | 3.06 | 17.99 | 0.34 | 6.38 | NA | NA | NA | NA | NA | NA | NA | NA | NA | NA | NA | NA | NA | NA | NA | NA | NA | NA | |
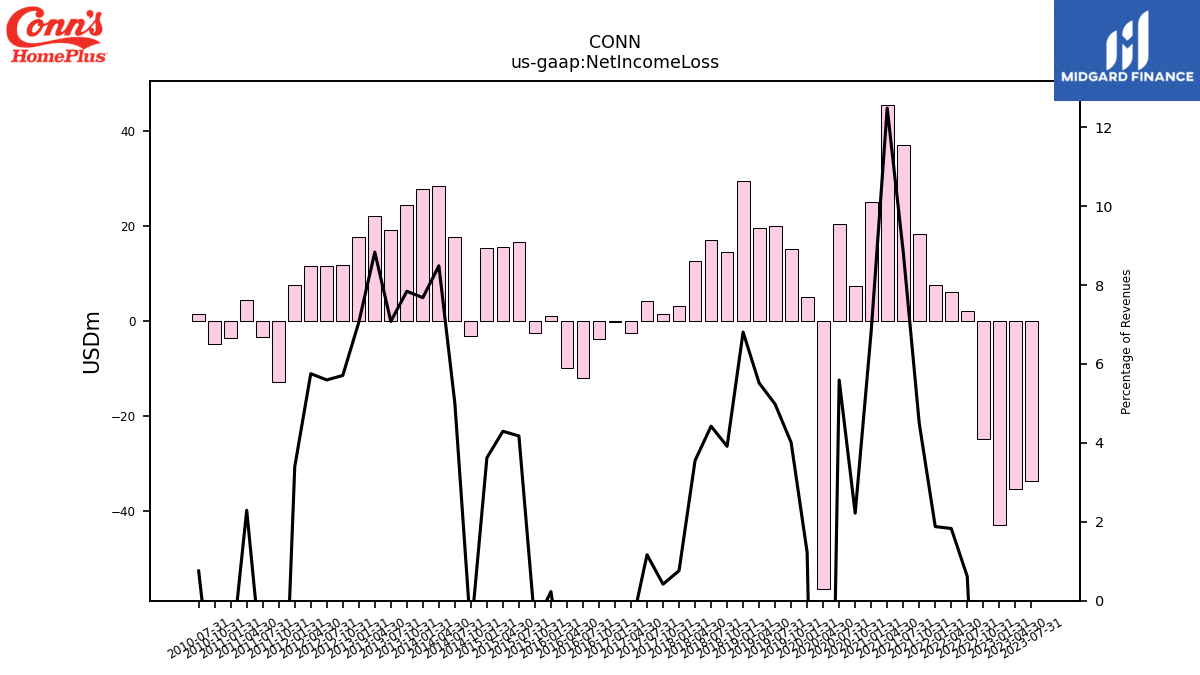
| Net Income Loss | -33.52 | -35.38 | -42.80 | -24.84 | 2.13 | 6.22 | 7.56 | 18.24 | 37.00 | 45.40 | 25.13 | 7.42 | 20.52 | -56.20 | 5.05 | 15.14 | 19.97 | 19.51 | 29.48 | 14.63 | 17.01 | 12.73 | 3.20 | 1.57 | 4.27 | -2.58 | -0.07 | -3.81 | -11.92 | -9.75 | 1.06 | -2.42 | 16.54 | 15.68 | 15.46 | -3.06 | 17.65 | 28.47 | 27.73 | 24.38 | 19.16 | 22.18 | 17.66 | 11.79 | 11.61 | 11.56 | 7.70 | -12.72 | -3.43 | 4.40 | -3.58 | -4.78 | 1.61 |
| 2023-07-31 | 2023-04-30 | 2023-01-31 | 2022-10-31 | 2022-07-31 | 2022-04-30 | 2022-01-31 | 2021-10-31 | 2021-07-31 | 2021-04-30 | 2021-01-31 | 2020-10-31 | 2020-07-31 | 2020-04-30 | 2020-01-31 | 2019-10-31 | 2019-07-31 | 2019-04-30 | 2019-01-31 | 2018-10-31 | 2018-07-31 | 2018-04-30 | 2018-01-31 | 2017-10-31 | 2017-07-31 | 2017-04-30 | 2017-01-31 | 2016-10-31 | 2016-07-31 | 2016-04-30 | 2016-01-31 | 2015-10-31 | 2015-07-31 | 2015-04-30 | 2015-01-31 | 2014-10-31 | 2014-07-31 | 2014-04-30 | 2014-01-31 | 2013-10-31 | 2013-07-31 | 2013-04-30 | 2013-01-31 | 2012-10-31 | 2012-07-31 | 2012-04-30 | 2012-01-31 | 2011-10-31 | 2011-07-31 | 2011-04-30 | 2011-01-31 | 2010-10-31 | 2010-07-31 | ||
|---|---|---|---|---|---|---|---|---|---|---|---|---|---|---|---|---|---|---|---|---|---|---|---|---|---|---|---|---|---|---|---|---|---|---|---|---|---|---|---|---|---|---|---|---|---|---|---|---|---|---|---|---|---|---|
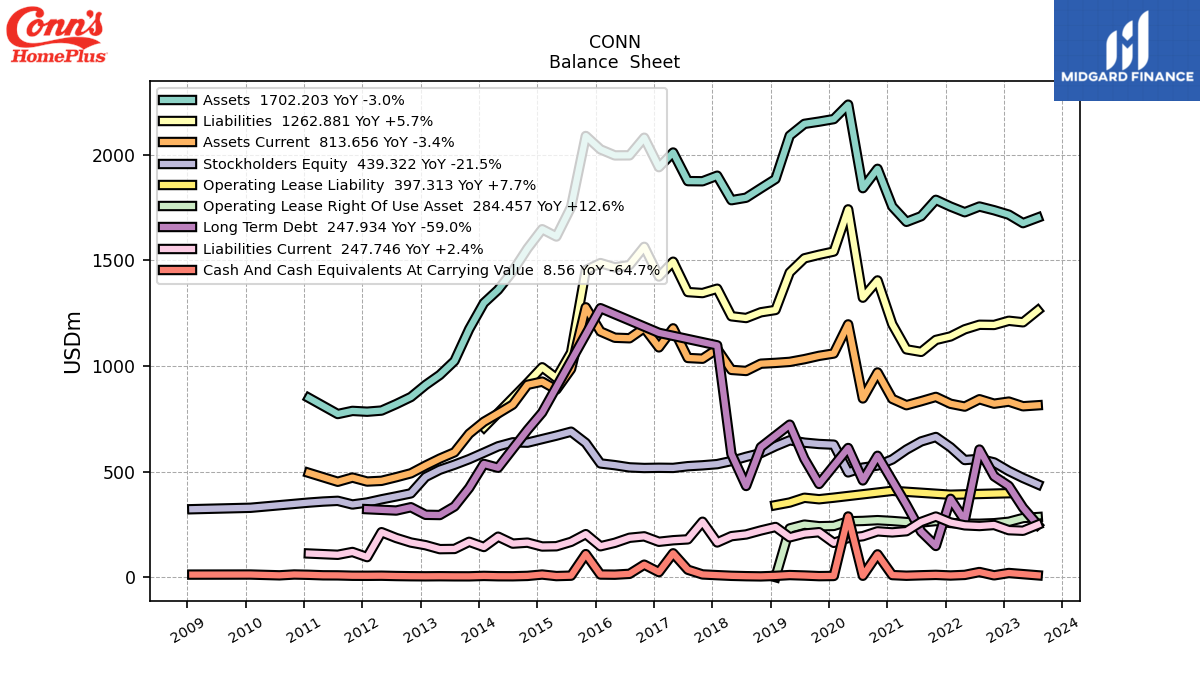
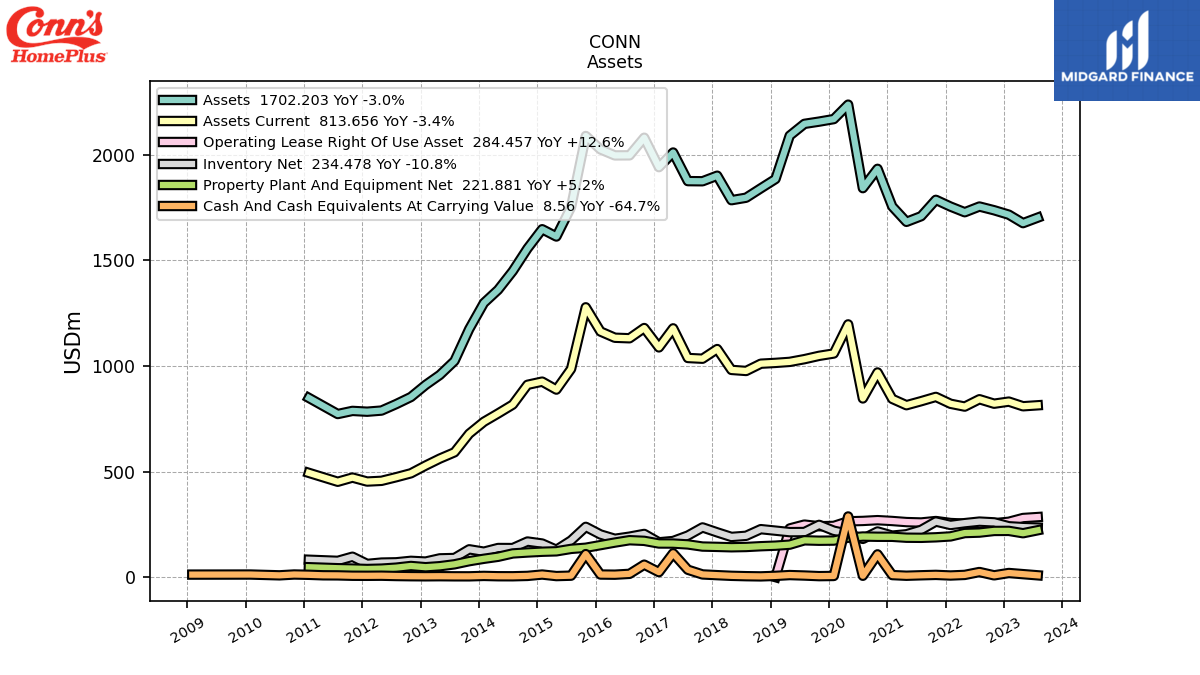
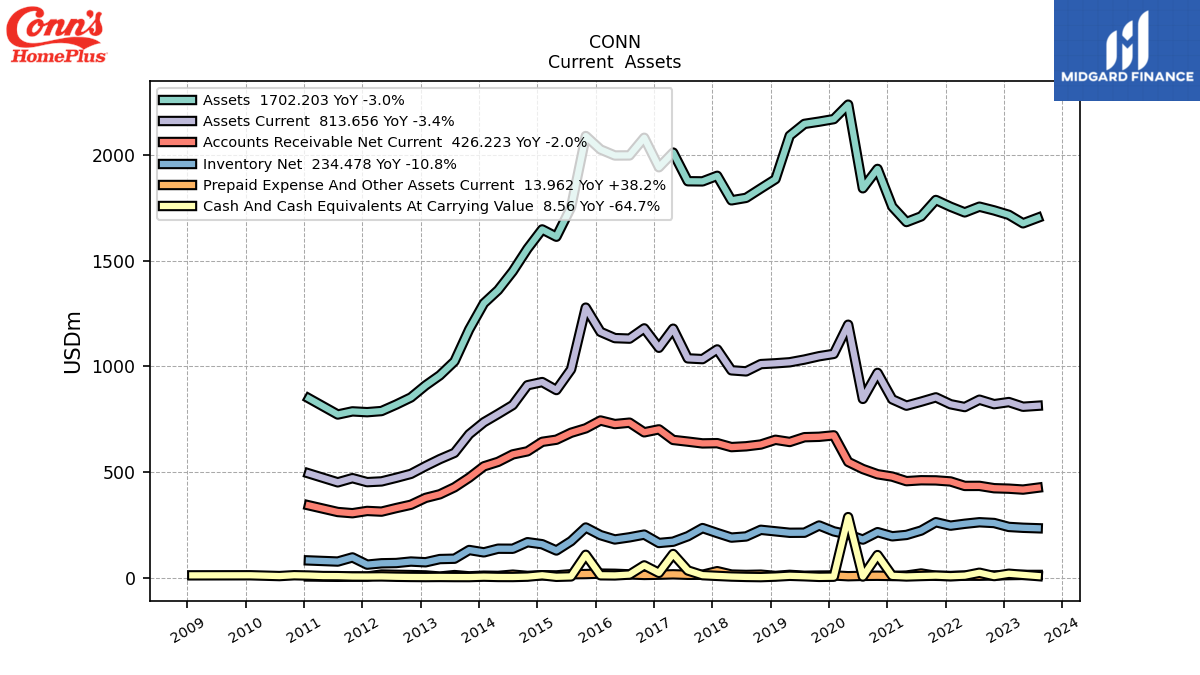
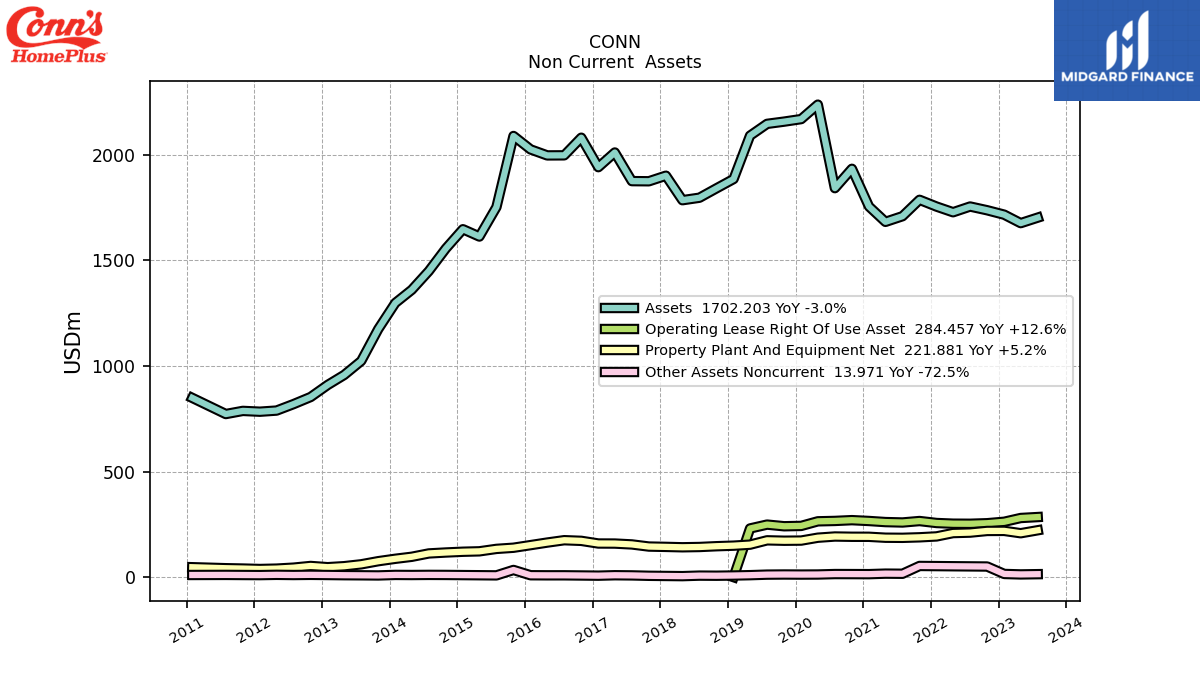
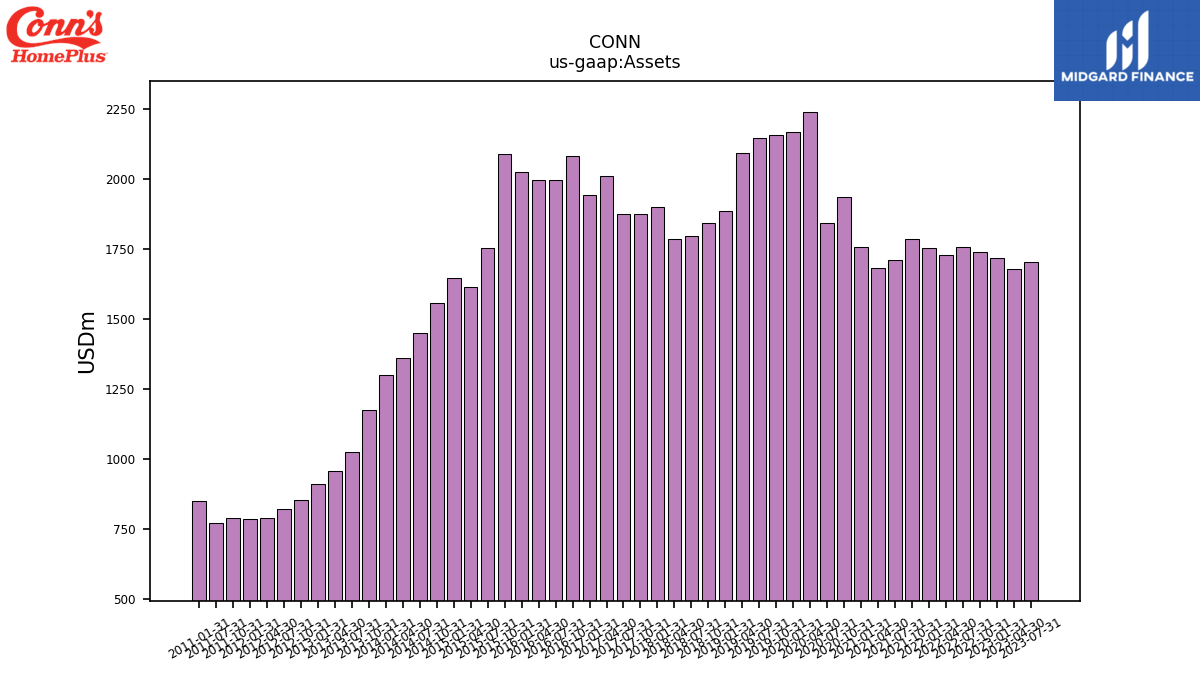
| Assets | 1702.20 | 1676.11 | 1716.21 | 1737.13 | 1754.81 | 1727.73 | 1754.47 | 1786.58 | 1708.95 | 1682.16 | 1755.08 | 1933.46 | 1841.70 | 2237.29 | 2168.77 | 2156.82 | 2146.22 | 2090.28 | 1884.91 | 1841.01 | 1796.50 | 1784.75 | 1900.80 | 1874.39 | 1875.06 | 2010.61 | 1941.13 | 2080.63 | 1997.18 | 1996.83 | 2025.30 | 2088.84 | 1752.07 | 1612.67 | 1647.32 | 1556.01 | 1449.19 | 1360.38 | 1297.99 | 1174.36 | 1023.46 | 957.27 | 909.86 | 852.86 | 819.33 | 788.63 | 783.30 | 787.05 | 772.19 | NA | 848.64 | NA | NA | |
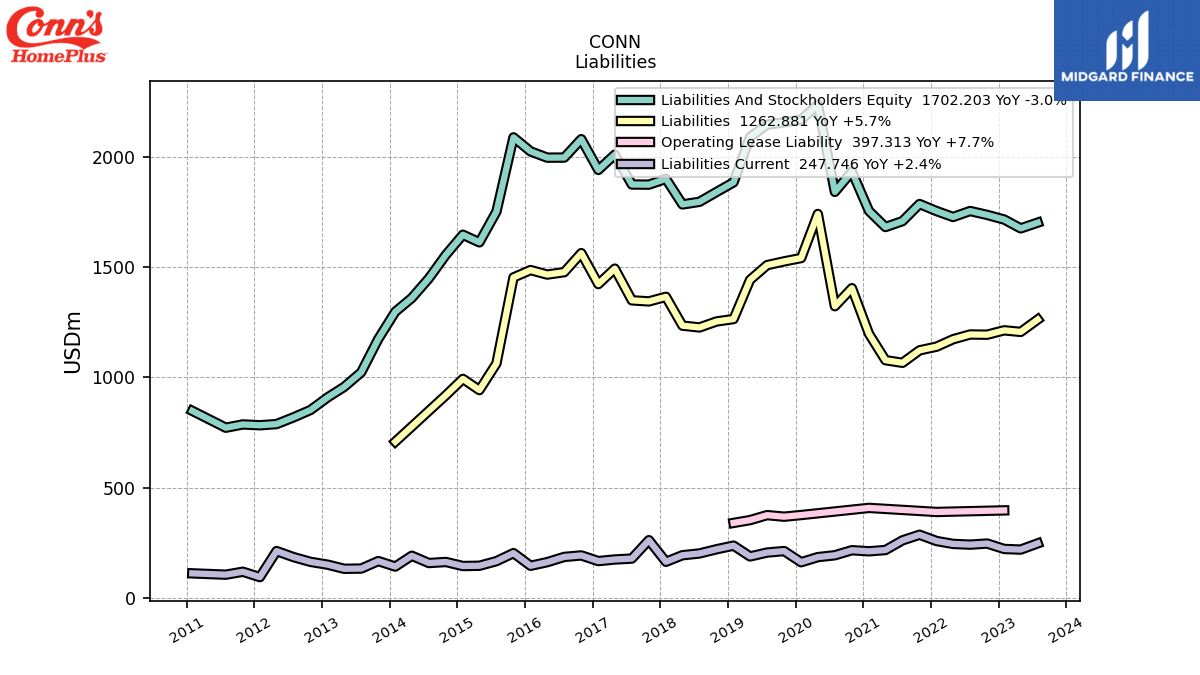
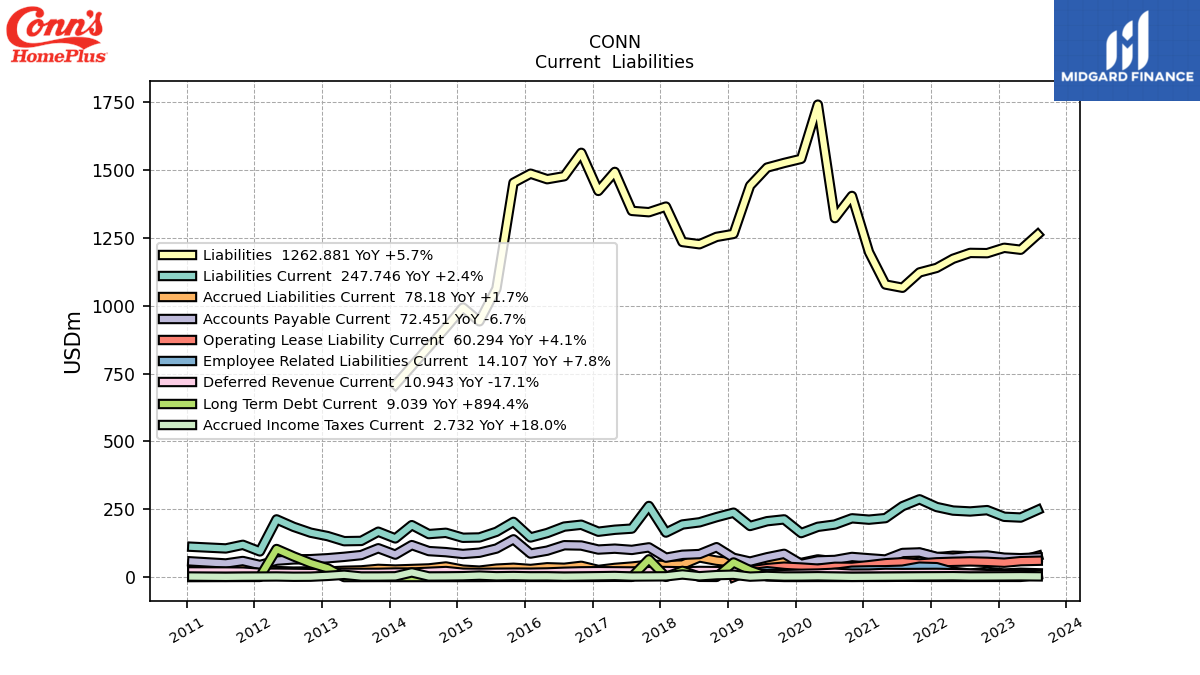
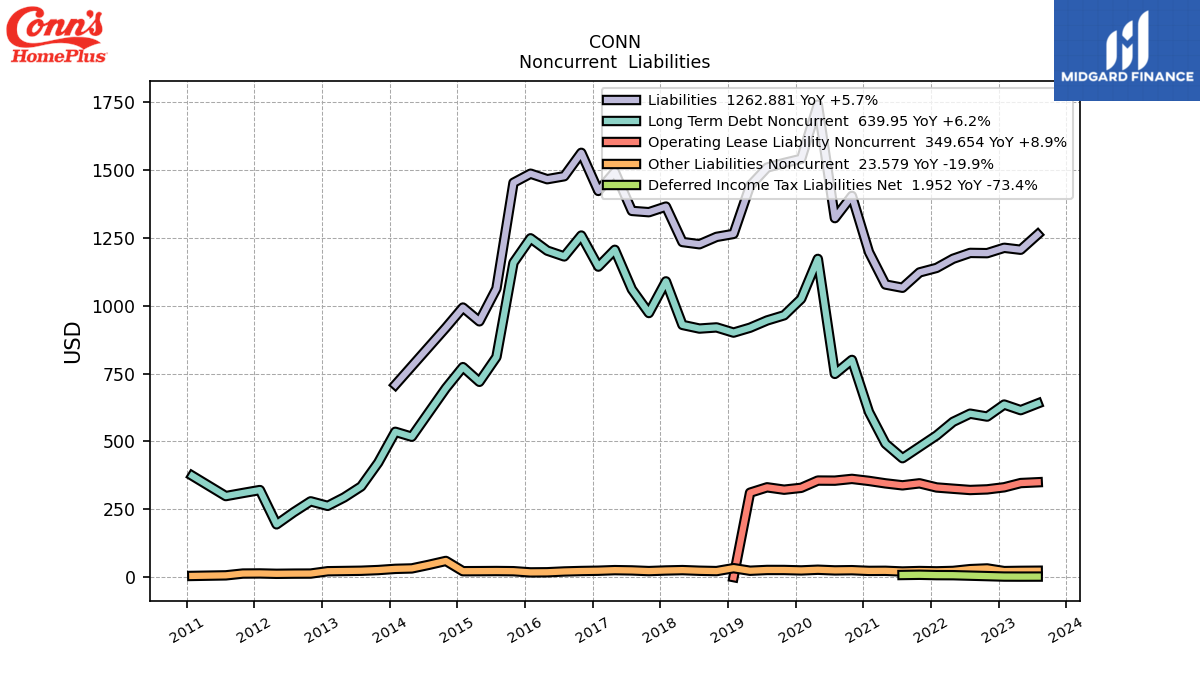
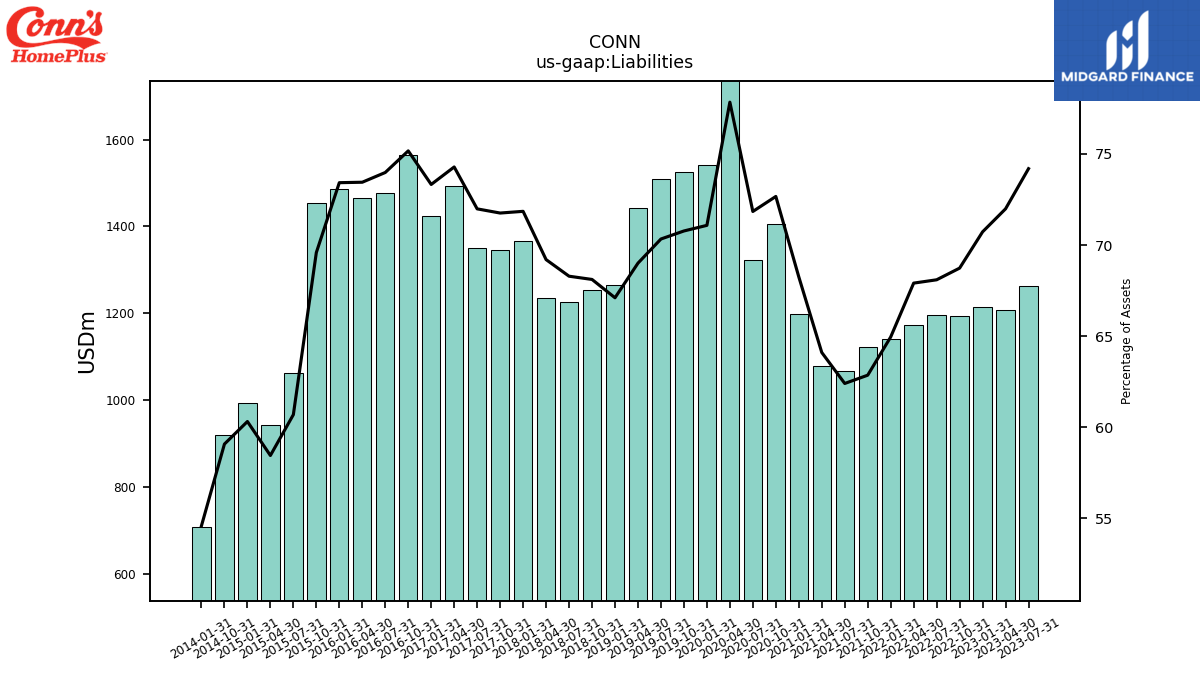
| Liabilities | 1262.88 | 1206.60 | 1213.81 | 1194.03 | 1194.93 | 1173.34 | 1139.65 | 1123.06 | 1066.50 | 1078.39 | 1197.93 | 1404.98 | 1323.11 | 1741.48 | 1541.59 | 1526.45 | 1509.49 | 1442.46 | 1264.93 | 1253.98 | 1226.85 | 1235.09 | 1365.73 | 1345.00 | 1349.79 | 1493.56 | 1423.34 | 1563.94 | 1477.54 | 1466.61 | 1487.02 | 1453.63 | 1063.45 | 942.70 | 993.65 | 919.33 | NA | NA | 708.70 | NA | NA | NA | NA | NA | NA | NA | NA | NA | NA | NA | NA | NA | NA | |
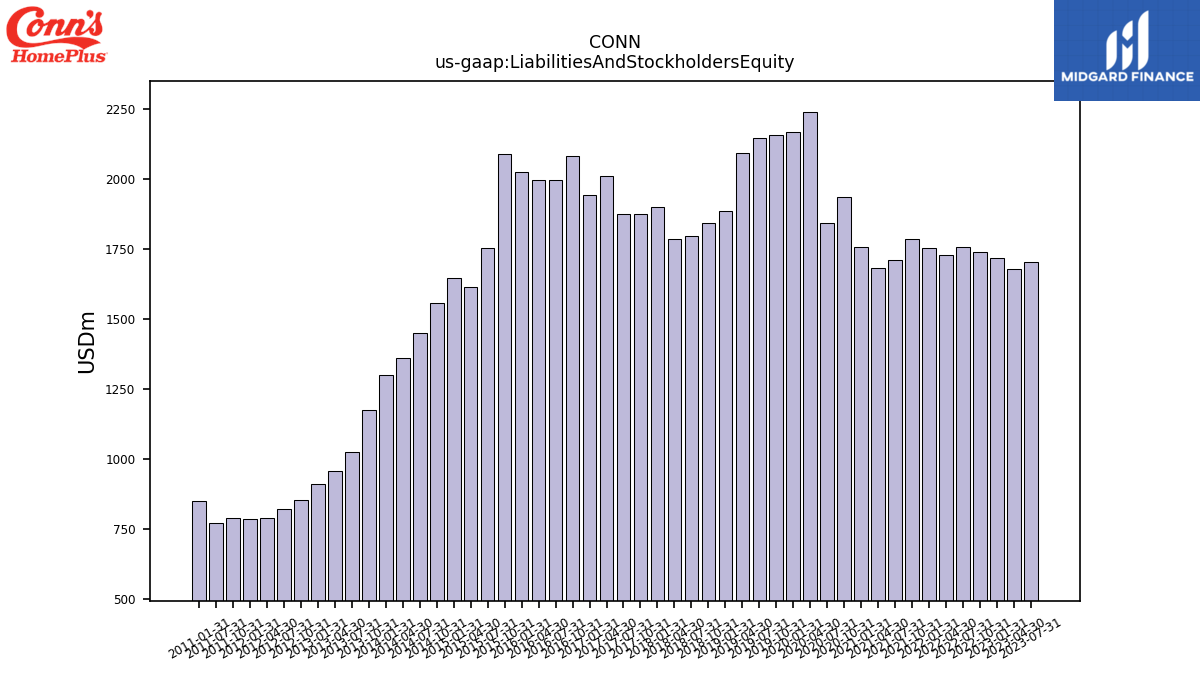
| Liabilities And Stockholders Equity | 1702.20 | 1676.11 | 1716.21 | 1737.13 | 1754.81 | 1727.73 | 1754.47 | 1786.58 | 1708.95 | 1682.16 | 1755.08 | 1933.46 | 1841.70 | 2237.29 | 2168.77 | 2156.82 | 2146.22 | 2090.28 | 1884.91 | 1841.01 | 1796.50 | 1784.75 | 1900.80 | 1874.39 | 1875.06 | 2010.61 | 1941.13 | 2080.63 | 1997.18 | 1996.83 | 2025.30 | 2088.84 | 1752.07 | 1612.67 | 1647.32 | 1556.01 | 1449.19 | 1360.38 | 1297.99 | 1174.36 | 1023.46 | 957.27 | 909.86 | 852.86 | 819.33 | 788.63 | 783.30 | 787.05 | 772.19 | NA | 848.64 | NA | NA | |
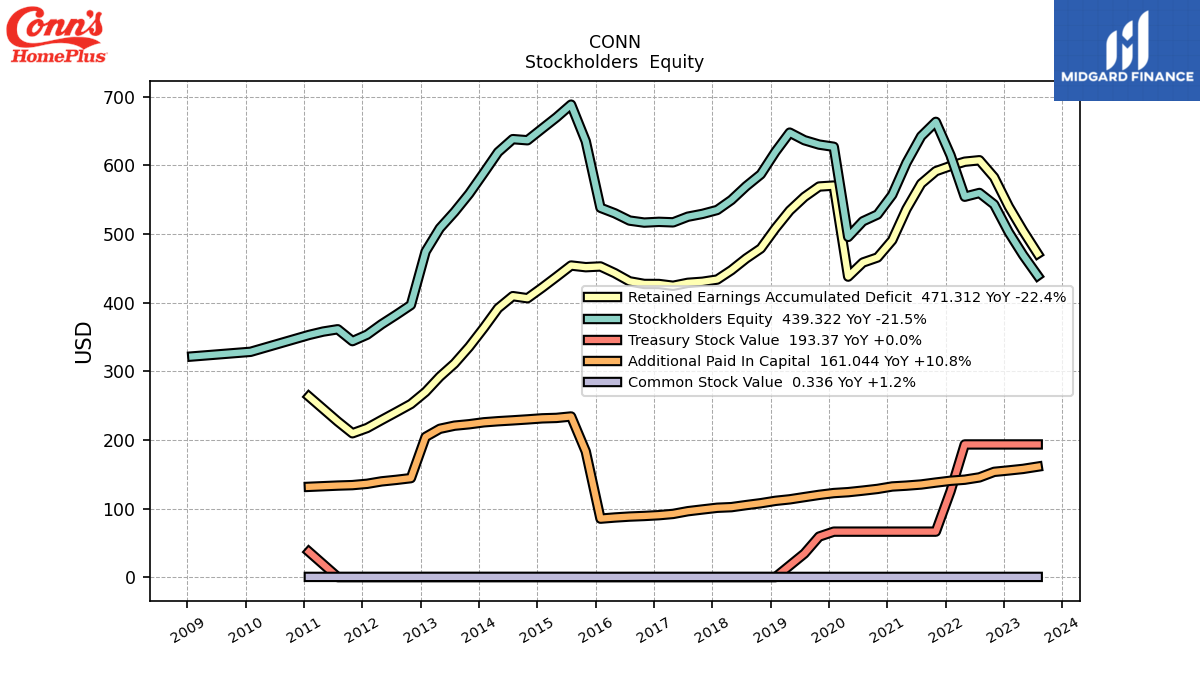
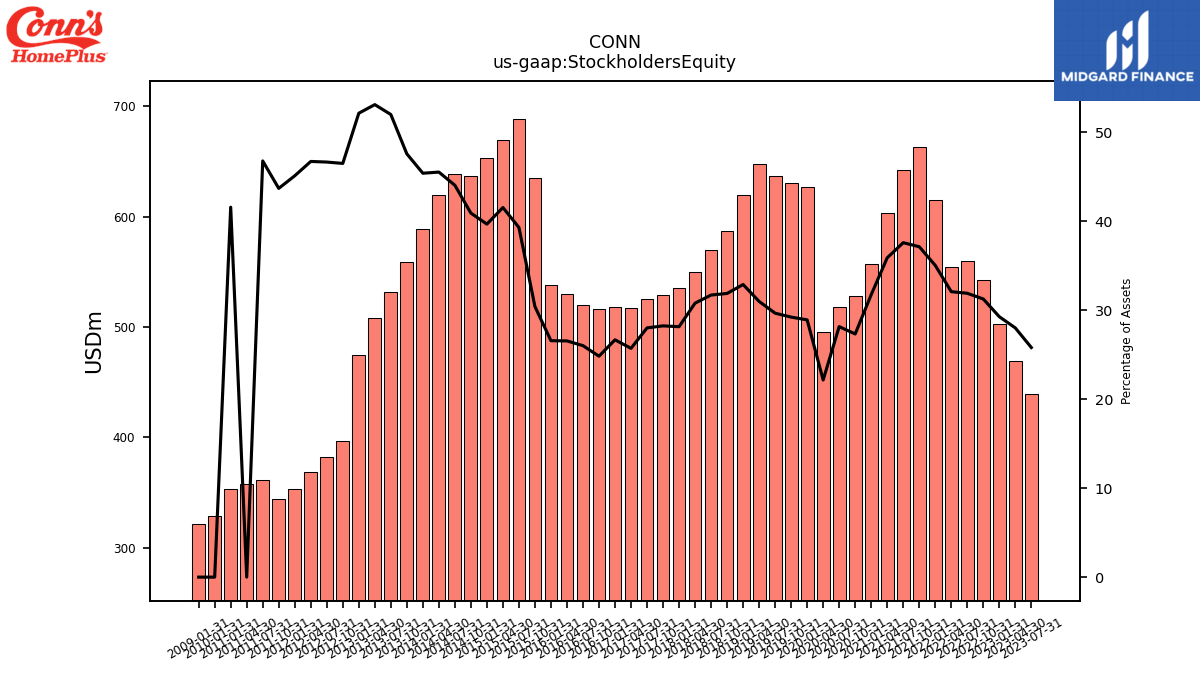
| Stockholders Equity | 439.32 | 469.51 | 502.41 | 543.11 | 559.88 | 554.39 | 614.82 | 663.51 | 642.45 | 603.77 | 557.15 | 528.47 | 518.59 | 495.81 | 627.18 | 630.38 | 636.74 | 647.82 | 619.98 | 587.03 | 569.65 | 549.65 | 535.07 | 529.39 | 525.28 | 517.05 | 517.79 | 516.69 | 519.64 | 530.22 | 538.28 | 635.21 | 688.62 | 669.98 | 653.67 | 636.68 | 638.33 | 619.37 | 589.29 | 558.74 | 532.22 | 508.43 | 474.45 | 396.61 | 382.27 | 368.49 | 353.37 | 343.93 | 361.25 | 357.85 | 352.90 | NA | NA |
| 2023-07-31 | 2023-04-30 | 2023-01-31 | 2022-10-31 | 2022-07-31 | 2022-04-30 | 2022-01-31 | 2021-10-31 | 2021-07-31 | 2021-04-30 | 2021-01-31 | 2020-10-31 | 2020-07-31 | 2020-04-30 | 2020-01-31 | 2019-10-31 | 2019-07-31 | 2019-04-30 | 2019-01-31 | 2018-10-31 | 2018-07-31 | 2018-04-30 | 2018-01-31 | 2017-10-31 | 2017-07-31 | 2017-04-30 | 2017-01-31 | 2016-10-31 | 2016-07-31 | 2016-04-30 | 2016-01-31 | 2015-10-31 | 2015-07-31 | 2015-04-30 | 2015-01-31 | 2014-10-31 | 2014-07-31 | 2014-04-30 | 2014-01-31 | 2013-10-31 | 2013-07-31 | 2013-04-30 | 2013-01-31 | 2012-10-31 | 2012-07-31 | 2012-04-30 | 2012-01-31 | 2011-10-31 | 2011-07-31 | 2011-04-30 | 2011-01-31 | 2010-10-31 | 2010-07-31 | ||
|---|---|---|---|---|---|---|---|---|---|---|---|---|---|---|---|---|---|---|---|---|---|---|---|---|---|---|---|---|---|---|---|---|---|---|---|---|---|---|---|---|---|---|---|---|---|---|---|---|---|---|---|---|---|---|
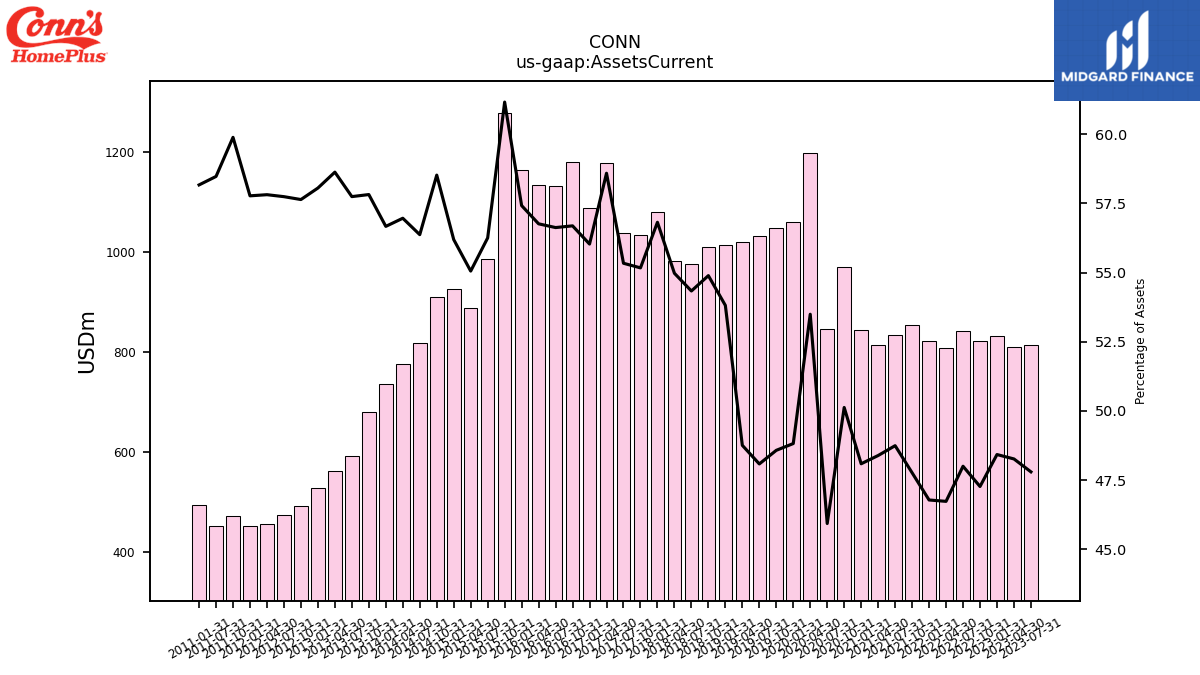
| Assets Current | 813.66 | 809.01 | 831.10 | 821.17 | 842.37 | 807.44 | 820.81 | 853.41 | 833.06 | 814.01 | 844.06 | 969.19 | 845.96 | 1196.87 | 1058.87 | 1047.75 | 1032.04 | 1019.20 | 1014.39 | 1010.57 | 976.16 | 981.21 | 1080.02 | 1034.14 | 1037.65 | 1178.06 | 1087.67 | 1179.54 | 1130.98 | 1133.49 | 1163.00 | 1277.63 | 985.63 | 887.88 | 925.72 | 910.65 | 816.95 | 774.96 | 735.60 | 679.04 | 591.03 | 561.27 | 528.24 | 491.61 | 473.13 | 455.96 | 452.56 | 471.36 | 451.55 | NA | 493.66 | NA | NA | |
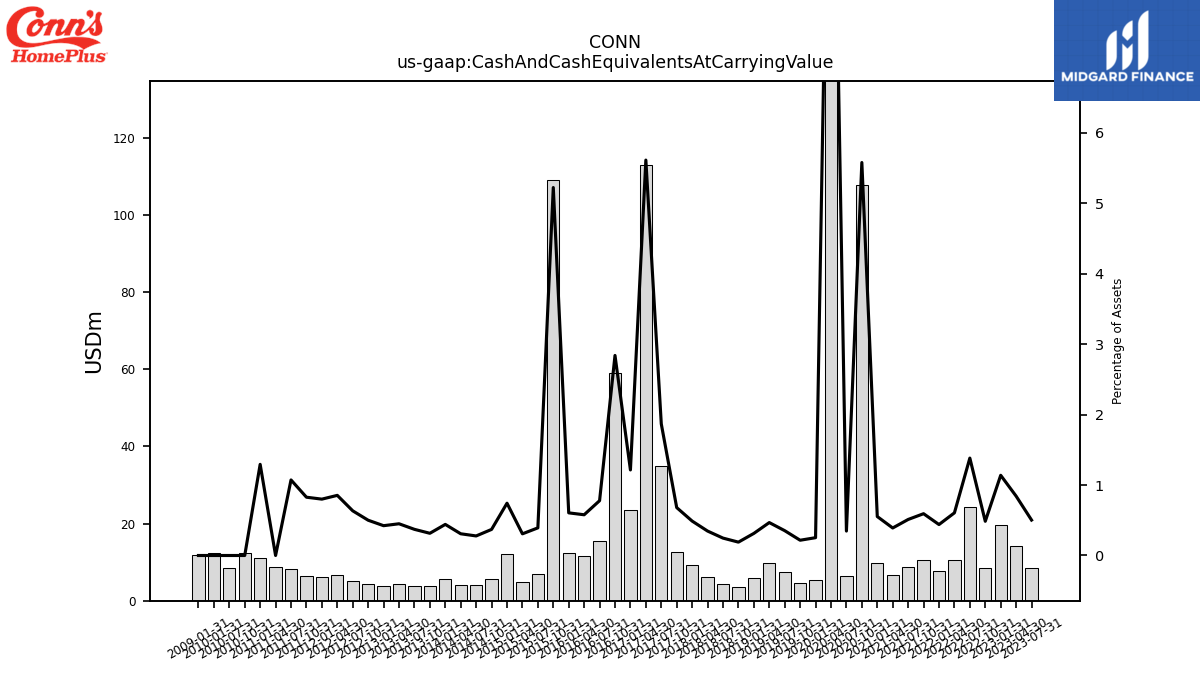
| Cash And Cash Equivalents At Carrying Value | 8.56 | 14.12 | 19.53 | 8.43 | 24.26 | 10.46 | 7.71 | 10.60 | 8.74 | 6.57 | 9.70 | 107.82 | 6.38 | 287.34 | 5.49 | 4.67 | 7.56 | 9.77 | 5.91 | 3.49 | 4.43 | 6.19 | 9.29 | 12.74 | 35.02 | 112.82 | 23.57 | 59.06 | 15.54 | 11.54 | 12.25 | 109.07 | 6.87 | 4.96 | 12.22 | 5.76 | 4.02 | 4.19 | 5.73 | 3.70 | 3.80 | 4.31 | 3.85 | 4.27 | 5.20 | 6.73 | 6.26 | 6.51 | 8.28 | 8.62 | 10.98 | 12.42 | 8.47 | |
| Cash Cash Equivalents Restricted Cash And Restricted Cash Equivalents | 37.58 | 46.12 | 60.37 | 53.94 | 72.11 | 43.38 | 39.64 | 36.12 | 39.70 | 58.22 | 60.26 | 186.20 | 70.22 | 360.79 | 80.86 | 53.92 | 75.78 | 87.81 | 64.94 | 73.53 | 56.09 | 82.91 | 96.16 | 83.84 | 121.45 | 272.86 | 134.26 | NA | NA | NA | 90.83 | NA | NA | NA | NA | NA | NA | NA | NA | NA | NA | NA | NA | NA | NA | NA | NA | NA | NA | NA | NA | NA | NA | |
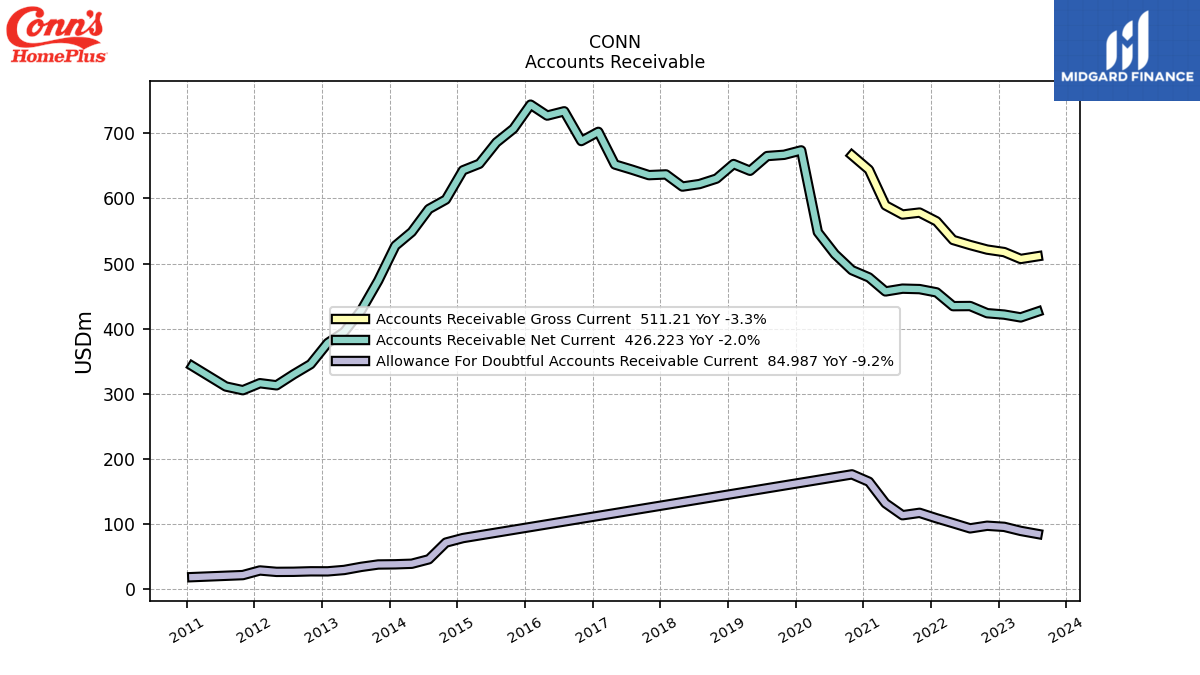
| Accounts Receivable Net Current | 426.22 | 417.36 | 421.68 | 423.83 | 434.82 | 434.64 | 455.79 | 460.81 | 461.49 | 457.21 | 478.73 | 489.84 | 514.53 | 548.17 | 673.74 | 666.92 | 664.98 | 642.38 | 652.77 | 630.40 | 622.01 | 618.16 | 636.83 | 635.70 | 644.15 | 652.05 | 702.16 | 688.01 | 733.72 | 727.08 | 743.93 | 706.93 | 685.93 | 653.14 | 643.09 | 598.24 | 583.69 | 548.48 | 527.27 | 473.80 | 428.08 | 395.08 | 378.05 | 345.55 | 329.99 | 313.14 | 316.38 | 305.62 | 311.32 | NA | 342.75 | NA | NA | |
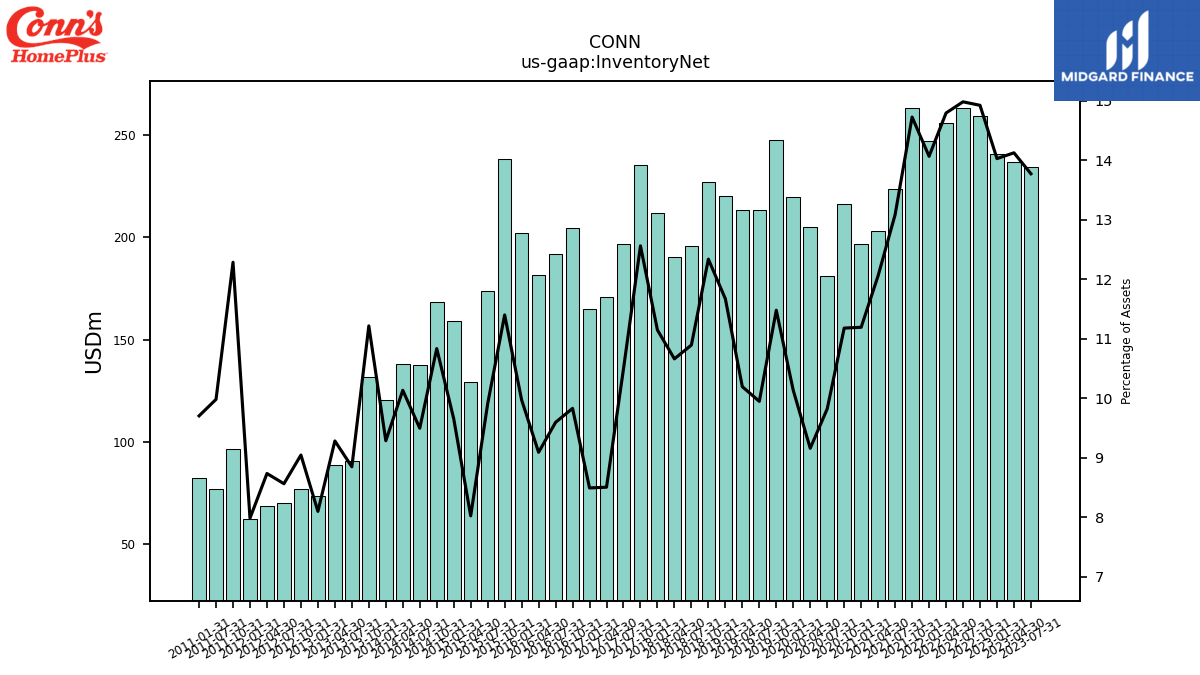
| Inventory Net | 234.48 | 236.79 | 240.78 | 259.29 | 262.95 | 255.65 | 246.83 | 263.13 | 223.66 | 202.90 | 196.46 | 216.16 | 180.89 | 204.92 | 219.76 | 247.61 | 213.51 | 213.10 | 220.03 | 227.16 | 195.73 | 190.31 | 211.89 | 235.48 | 196.77 | 171.00 | 164.86 | 204.54 | 191.64 | 181.54 | 201.97 | 238.15 | 173.58 | 129.39 | 159.07 | 168.60 | 137.62 | 137.86 | 120.53 | 131.73 | 90.56 | 88.86 | 73.69 | 77.15 | 70.17 | 68.89 | 62.54 | 96.70 | 77.08 | NA | 82.35 | NA | NA | |
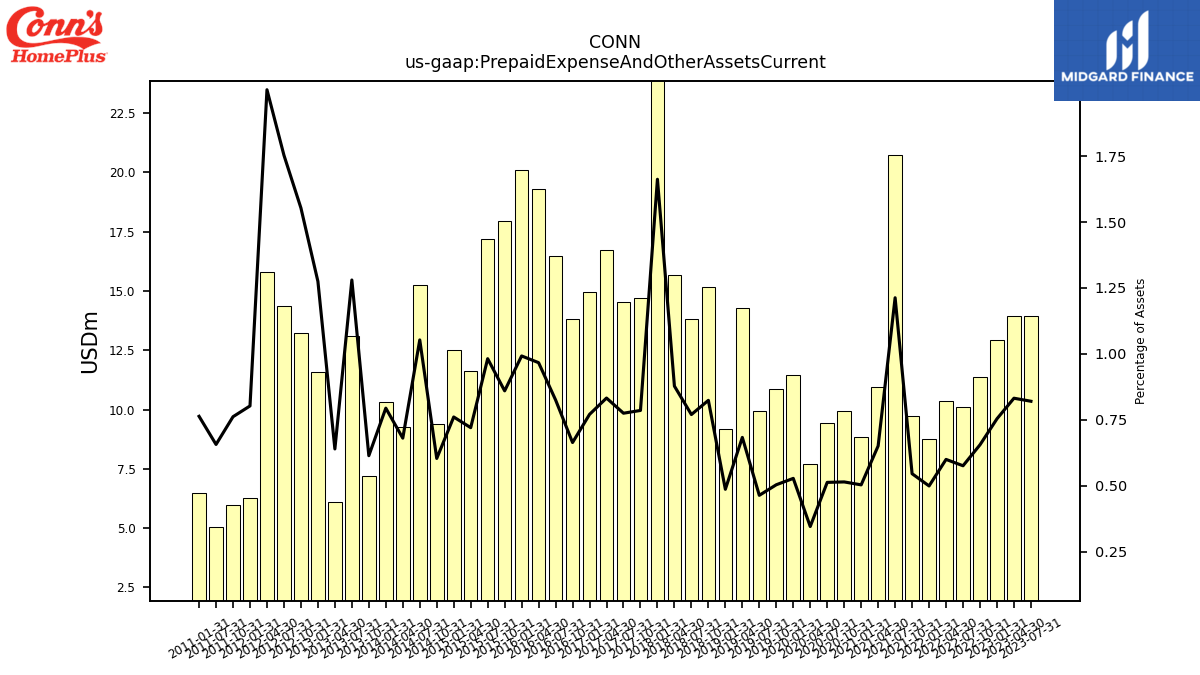
| Prepaid Expense And Other Assets Current | 13.96 | 13.94 | 12.94 | 11.38 | 10.10 | 10.36 | 8.76 | 9.74 | 20.73 | 10.95 | 8.83 | 9.94 | 9.44 | 7.72 | 11.45 | 10.86 | 9.95 | 14.28 | 9.17 | 15.16 | 13.83 | 15.66 | 31.59 | 14.72 | 14.53 | 16.74 | 14.96 | 13.81 | 16.48 | 19.30 | 20.09 | 17.96 | 17.20 | 11.61 | 12.53 | 9.39 | 15.26 | 9.26 | 10.31 | 7.21 | 13.10 | 6.12 | 11.60 | 13.25 | 14.36 | 15.79 | 6.29 | 5.99 | 5.07 | NA | 6.48 | NA | NA |
| 2023-07-31 | 2023-04-30 | 2023-01-31 | 2022-10-31 | 2022-07-31 | 2022-04-30 | 2022-01-31 | 2021-10-31 | 2021-07-31 | 2021-04-30 | 2021-01-31 | 2020-10-31 | 2020-07-31 | 2020-04-30 | 2020-01-31 | 2019-10-31 | 2019-07-31 | 2019-04-30 | 2019-01-31 | 2018-10-31 | 2018-07-31 | 2018-04-30 | 2018-01-31 | 2017-10-31 | 2017-07-31 | 2017-04-30 | 2017-01-31 | 2016-10-31 | 2016-07-31 | 2016-04-30 | 2016-01-31 | 2015-10-31 | 2015-07-31 | 2015-04-30 | 2015-01-31 | 2014-10-31 | 2014-07-31 | 2014-04-30 | 2014-01-31 | 2013-10-31 | 2013-07-31 | 2013-04-30 | 2013-01-31 | 2012-10-31 | 2012-07-31 | 2012-04-30 | 2012-01-31 | 2011-10-31 | 2011-07-31 | 2011-04-30 | 2011-01-31 | 2010-10-31 | 2010-07-31 | ||
|---|---|---|---|---|---|---|---|---|---|---|---|---|---|---|---|---|---|---|---|---|---|---|---|---|---|---|---|---|---|---|---|---|---|---|---|---|---|---|---|---|---|---|---|---|---|---|---|---|---|---|---|---|---|---|
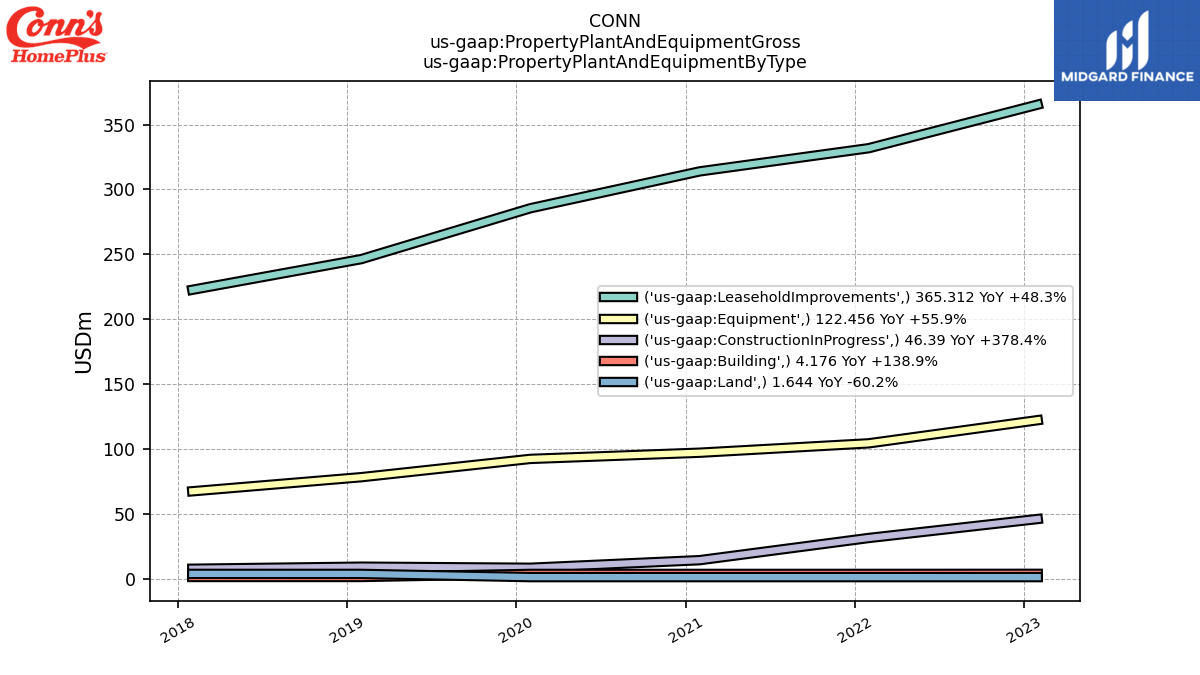
| Property Plant And Equipment Net | 221.88 | 207.87 | 218.96 | 218.64 | 210.81 | 208.62 | 192.76 | 188.50 | 186.07 | 186.61 | 190.96 | 191.08 | 192.30 | 186.66 | 173.03 | 172.34 | 174.22 | 153.70 | 148.98 | 146.33 | 142.63 | 141.31 | 143.15 | 144.75 | 154.79 | 158.93 | 159.20 | 171.75 | 174.81 | 163.63 | 151.48 | 139.16 | 133.67 | 122.19 | 120.22 | 116.58 | 112.15 | 96.33 | 86.84 | 75.44 | 60.69 | 51.73 | 46.99 | 52.79 | 44.86 | 40.26 | 38.48 | 40.62 | 42.21 | NA | 46.89 | NA | NA | |
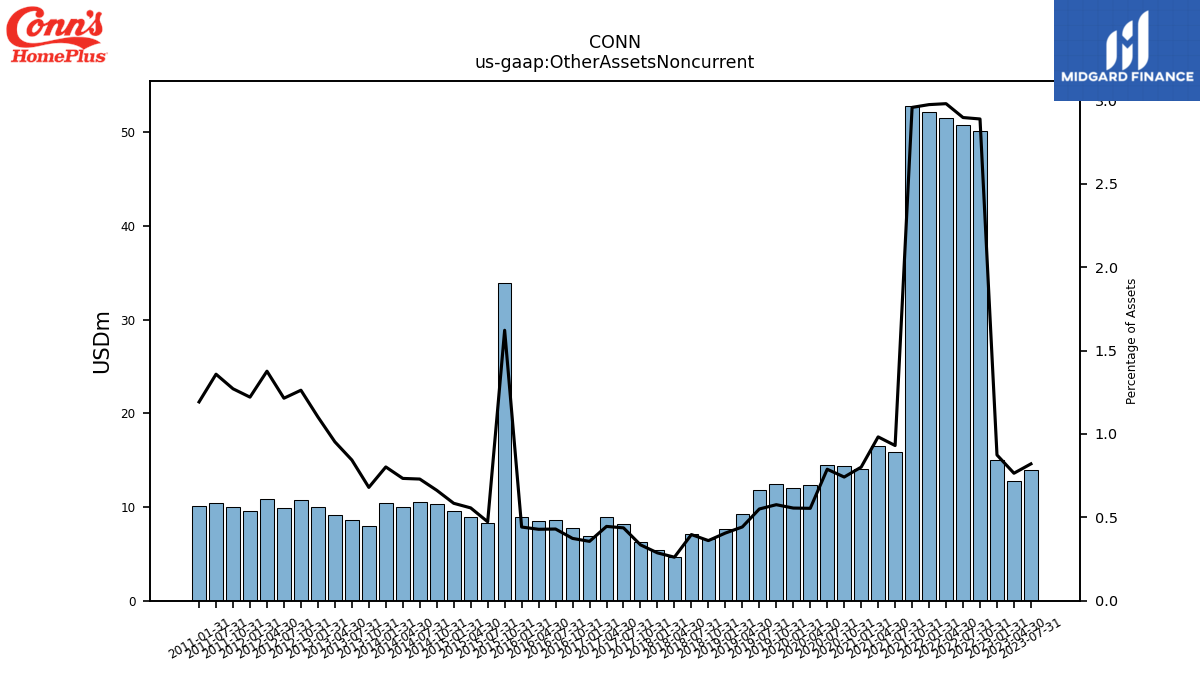
| Other Assets Noncurrent | 13.97 | 12.82 | 15.00 | 50.19 | 50.85 | 51.50 | 52.20 | 52.85 | 15.91 | 16.53 | 14.06 | 14.34 | 14.52 | 12.40 | 12.05 | 12.42 | 11.81 | 9.25 | 7.65 | 6.64 | 7.13 | 4.66 | 5.46 | 6.29 | 8.20 | 8.96 | 6.91 | 7.78 | 8.59 | 8.56 | 8.95 | 33.88 | 8.30 | 8.98 | 9.63 | 10.31 | 10.58 | 9.98 | 10.41 | 7.98 | 8.64 | 9.12 | 10.03 | 10.77 | 9.95 | 10.86 | 9.56 | 10.00 | 10.49 | NA | 10.12 | NA | NA |
| 2023-07-31 | 2023-04-30 | 2023-01-31 | 2022-10-31 | 2022-07-31 | 2022-04-30 | 2022-01-31 | 2021-10-31 | 2021-07-31 | 2021-04-30 | 2021-01-31 | 2020-10-31 | 2020-07-31 | 2020-04-30 | 2020-01-31 | 2019-10-31 | 2019-07-31 | 2019-04-30 | 2019-01-31 | 2018-10-31 | 2018-07-31 | 2018-04-30 | 2018-01-31 | 2017-10-31 | 2017-07-31 | 2017-04-30 | 2017-01-31 | 2016-10-31 | 2016-07-31 | 2016-04-30 | 2016-01-31 | 2015-10-31 | 2015-07-31 | 2015-04-30 | 2015-01-31 | 2014-10-31 | 2014-07-31 | 2014-04-30 | 2014-01-31 | 2013-10-31 | 2013-07-31 | 2013-04-30 | 2013-01-31 | 2012-10-31 | 2012-07-31 | 2012-04-30 | 2012-01-31 | 2011-10-31 | 2011-07-31 | 2011-04-30 | 2011-01-31 | 2010-10-31 | 2010-07-31 | ||
|---|---|---|---|---|---|---|---|---|---|---|---|---|---|---|---|---|---|---|---|---|---|---|---|---|---|---|---|---|---|---|---|---|---|---|---|---|---|---|---|---|---|---|---|---|---|---|---|---|---|---|---|---|---|---|
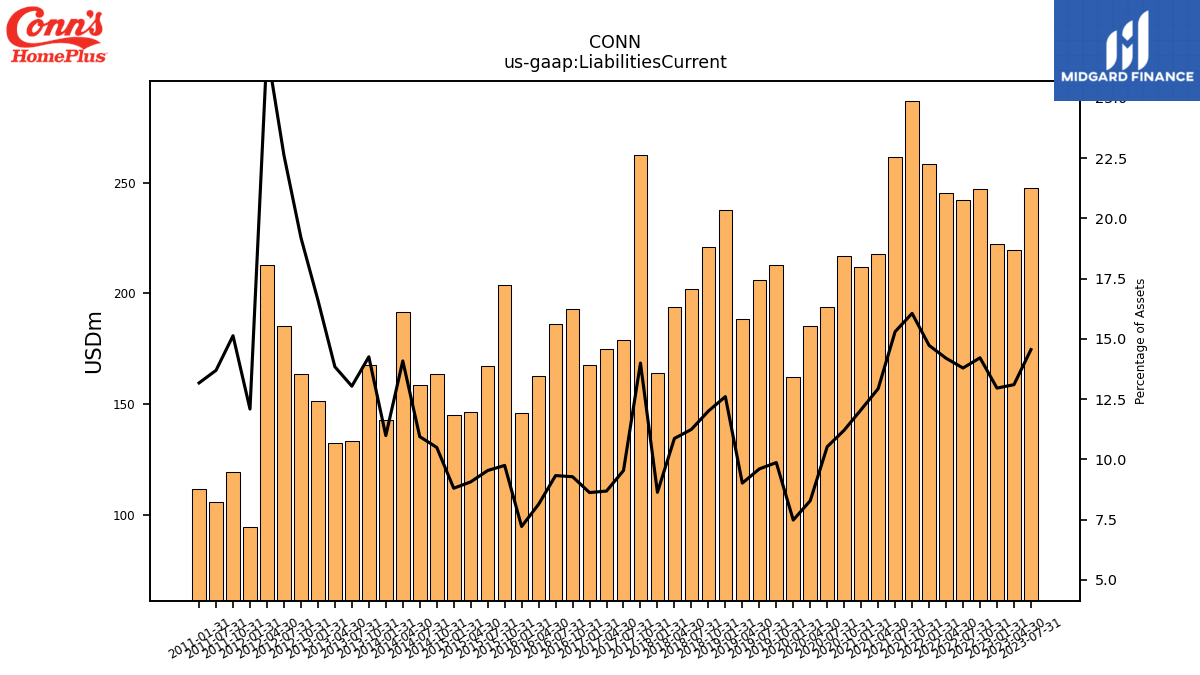
| Liabilities Current | 247.75 | 219.57 | 222.36 | 246.92 | 241.99 | 245.26 | 258.42 | 286.87 | 261.42 | 217.52 | 211.76 | 216.76 | 193.83 | 185.38 | 162.27 | 212.83 | 206.10 | 188.45 | 237.57 | 220.98 | 201.98 | 193.97 | 164.11 | 262.32 | 178.81 | 174.63 | 167.38 | 193.08 | 186.28 | 162.48 | 146.12 | 203.64 | 167.08 | 146.20 | 145.01 | 163.34 | 158.58 | 191.59 | 142.61 | 167.38 | 133.43 | 132.50 | 151.16 | 163.76 | 185.31 | 212.86 | 94.67 | 119.07 | 105.75 | NA | 111.78 | NA | NA | |
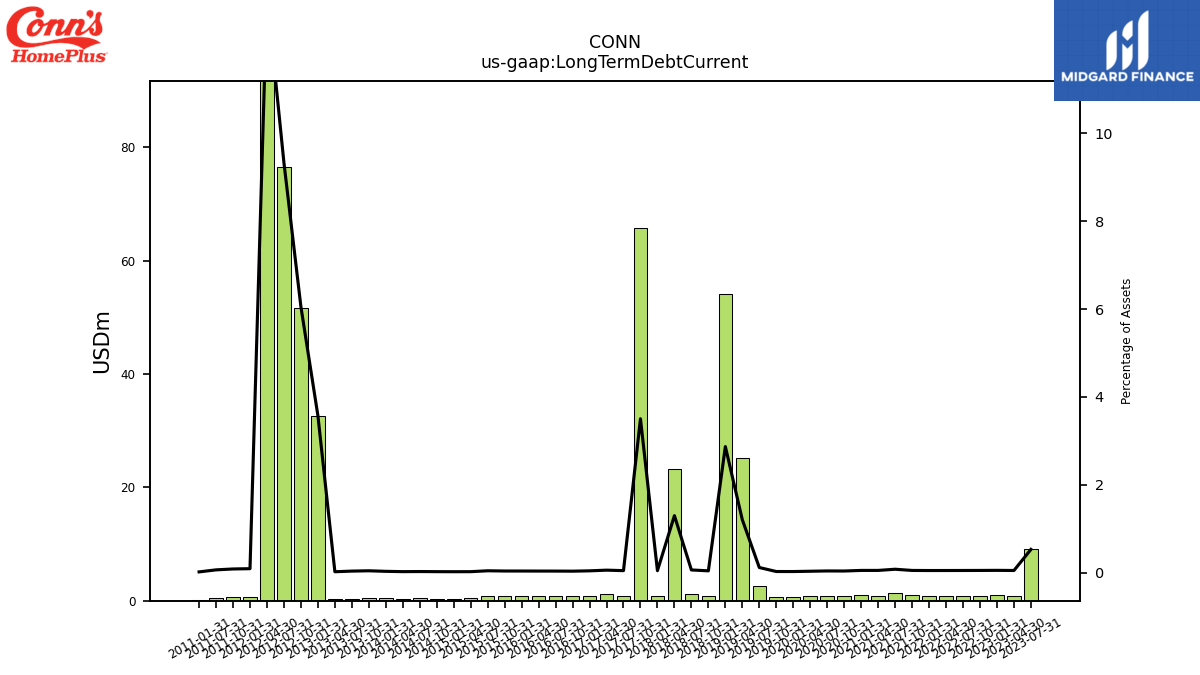
| Long Term Debt Current | 9.04 | 0.87 | 0.94 | 0.92 | 0.91 | 0.88 | 0.89 | 0.94 | 1.37 | 0.90 | 0.93 | 0.77 | 0.76 | 0.77 | 0.60 | 0.61 | 2.56 | 25.19 | 54.11 | 0.80 | 1.15 | 23.18 | 0.91 | 65.65 | 0.91 | 1.19 | 0.85 | 0.75 | 0.76 | 0.77 | 0.80 | 0.83 | 0.79 | 0.40 | 0.40 | 0.39 | 0.40 | 0.35 | 0.42 | 0.53 | 0.39 | 0.22 | 32.53 | 51.59 | 76.41 | 103.69 | 0.73 | 0.68 | 0.51 | NA | 0.17 | NA | NA | |
| Accounts Payable Current | 72.45 | 69.77 | 71.69 | 79.86 | 77.69 | 71.66 | 74.70 | 91.08 | 89.00 | 64.95 | 69.37 | 74.34 | 63.27 | 61.44 | 48.55 | 85.91 | 73.20 | 57.27 | 71.12 | 110.36 | 85.00 | 82.36 | 71.62 | 109.74 | 100.27 | 104.92 | 101.61 | 116.47 | 117.63 | 97.52 | 86.80 | 139.43 | 105.31 | 89.98 | 85.36 | 92.10 | 95.96 | 118.08 | 82.86 | 106.42 | 81.25 | 74.75 | 69.61 | 66.17 | 65.31 | 60.81 | 44.71 | 59.48 | 50.38 | NA | 57.74 | NA | NA | |
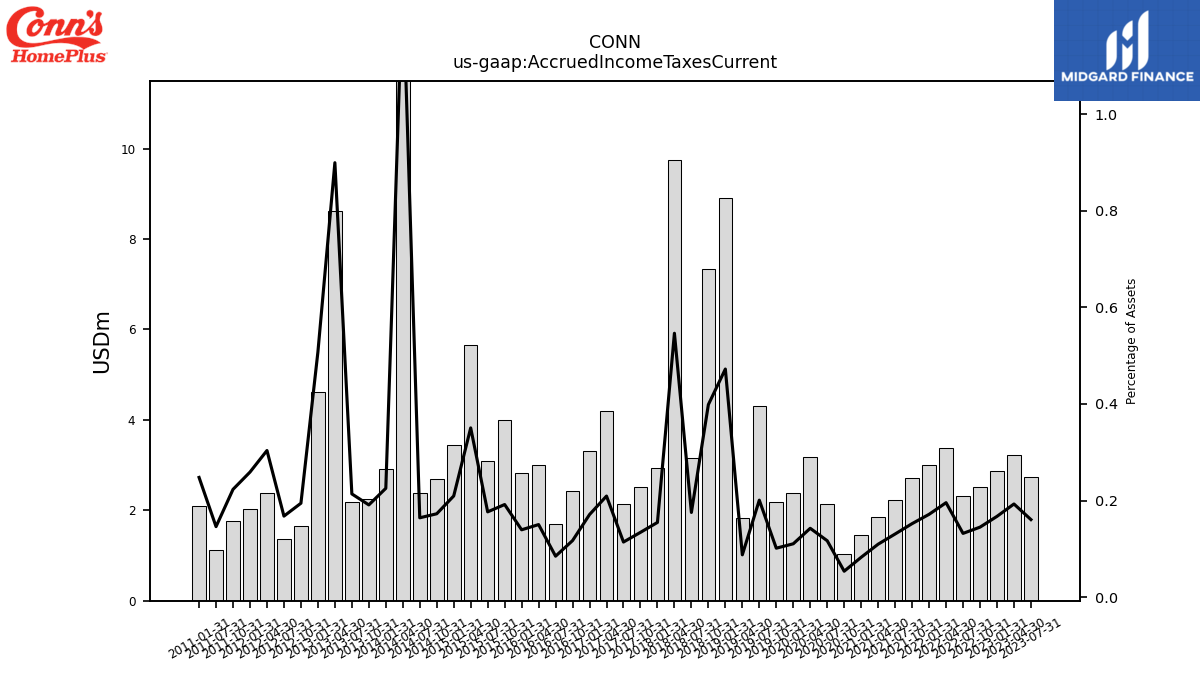
| Accrued Income Taxes Current | 2.73 | 3.23 | 2.87 | 2.52 | 2.31 | 3.38 | 3.01 | 2.72 | 2.23 | 1.84 | 1.45 | 1.04 | 2.15 | 3.19 | 2.39 | 2.18 | 4.31 | 1.83 | 8.90 | 7.34 | 3.15 | 9.75 | 2.94 | 2.51 | 2.14 | 4.21 | 3.32 | 2.44 | 1.69 | 3.00 | 2.82 | 4.00 | 3.09 | 5.65 | 3.45 | 2.69 | 2.38 | 17.37 | 2.92 | 2.24 | 2.19 | 8.61 | 4.62 | 1.66 | 1.37 | 2.39 | 2.03 | 1.76 | 1.13 | NA | 2.10 | NA | NA | |
| Accrued Liabilities Current | 78.18 | 60.52 | 69.33 | 76.94 | 76.85 | 78.81 | 73.03 | 89.51 | 71.71 | 57.89 | 58.05 | 66.52 | 58.15 | 65.33 | 52.30 | 59.41 | 59.66 | 55.42 | 54.38 | 60.65 | 72.56 | 46.10 | 44.81 | 45.49 | 38.95 | 33.97 | 26.46 | 41.66 | 34.36 | 36.33 | 30.04 | 34.47 | 31.31 | 23.97 | 27.48 | 39.30 | 32.12 | 29.97 | 27.94 | 30.37 | 24.89 | 23.39 | 20.72 | 21.16 | 20.32 | 22.31 | 24.03 | 29.58 | 27.23 | NA | 25.42 | NA | NA |
| 2023-07-31 | 2023-04-30 | 2023-01-31 | 2022-10-31 | 2022-07-31 | 2022-04-30 | 2022-01-31 | 2021-10-31 | 2021-07-31 | 2021-04-30 | 2021-01-31 | 2020-10-31 | 2020-07-31 | 2020-04-30 | 2020-01-31 | 2019-10-31 | 2019-07-31 | 2019-04-30 | 2019-01-31 | 2018-10-31 | 2018-07-31 | 2018-04-30 | 2018-01-31 | 2017-10-31 | 2017-07-31 | 2017-04-30 | 2017-01-31 | 2016-10-31 | 2016-07-31 | 2016-04-30 | 2016-01-31 | 2015-10-31 | 2015-07-31 | 2015-04-30 | 2015-01-31 | 2014-10-31 | 2014-07-31 | 2014-04-30 | 2014-01-31 | 2013-10-31 | 2013-07-31 | 2013-04-30 | 2013-01-31 | 2012-10-31 | 2012-07-31 | 2012-04-30 | 2012-01-31 | 2011-10-31 | 2011-07-31 | 2011-04-30 | 2011-01-31 | 2010-10-31 | 2010-07-31 | ||
|---|---|---|---|---|---|---|---|---|---|---|---|---|---|---|---|---|---|---|---|---|---|---|---|---|---|---|---|---|---|---|---|---|---|---|---|---|---|---|---|---|---|---|---|---|---|---|---|---|---|---|---|---|---|---|
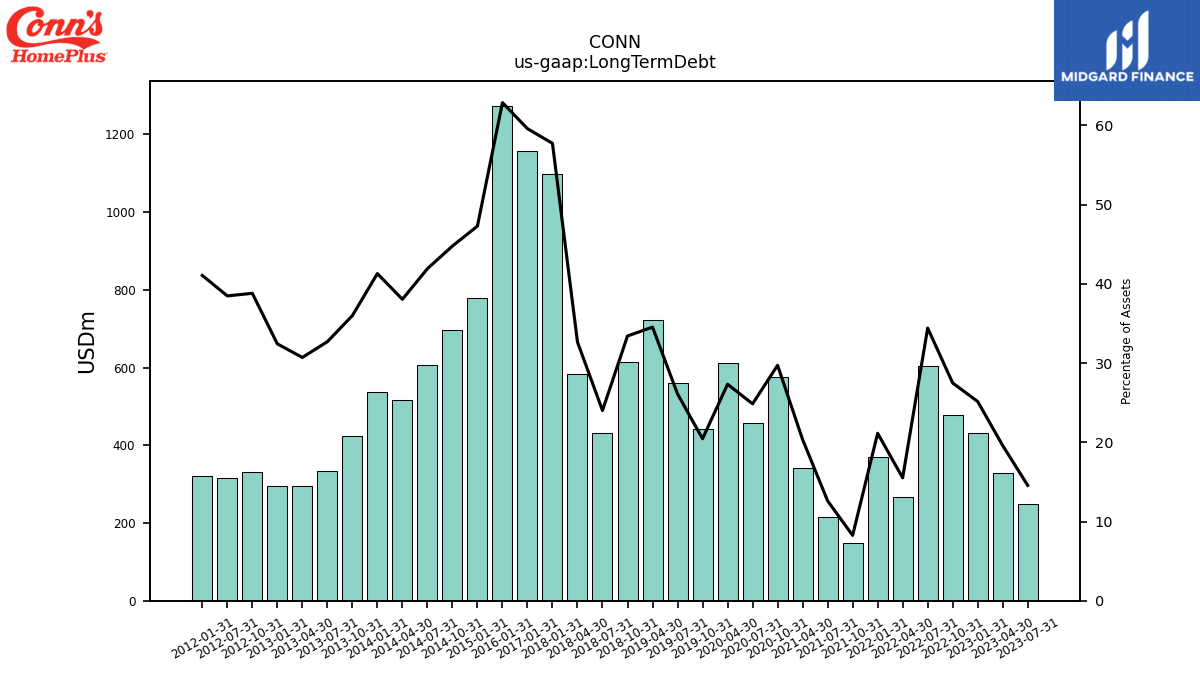
| Long Term Debt | 247.93 | 328.33 | 431.60 | 477.53 | 604.05 | 268.15 | 370.80 | 147.43 | 215.53 | 342.38 | NA | 574.61 | 457.81 | 611.50 | NA | 441.09 | 560.42 | 721.98 | NA | 615.33 | 431.48 | 582.92 | 1097.48 | NA | NA | NA | 1156.79 | NA | NA | NA | 1273.49 | NA | NA | NA | 779.04 | 696.70 | 607.38 | 517.71 | 536.05 | 422.69 | 334.68 | 294.00 | 295.06 | 330.99 | 315.30 | NA | 321.70 | NA | NA | NA | NA | NA | NA | |
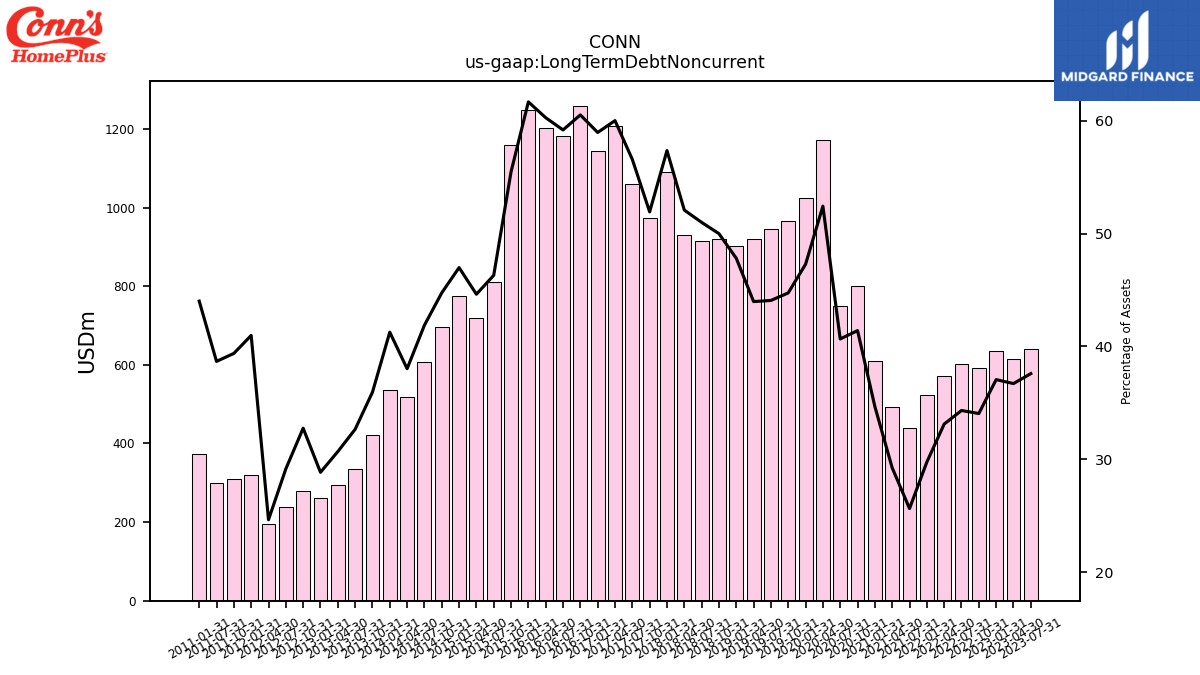
| Long Term Debt Noncurrent | 639.95 | 615.38 | 636.08 | 591.67 | 602.41 | 572.35 | 522.15 | NA | 438.24 | 492.06 | 608.63 | 800.59 | 748.90 | 1172.99 | 1025.54 | 965.06 | 945.98 | 919.25 | 901.22 | 920.37 | 916.08 | 929.53 | 1090.11 | 973.28 | 1060.72 | 1206.45 | 1144.39 | 1259.01 | 1181.95 | 1203.36 | 1248.88 | 1158.75 | 811.24 | 719.71 | 774.01 | 696.31 | 606.98 | 517.36 | 535.63 | 422.16 | 334.30 | 293.77 | 262.53 | 279.40 | 238.90 | 194.40 | 320.98 | 310.00 | 298.67 | NA | 373.57 | NA | NA | |
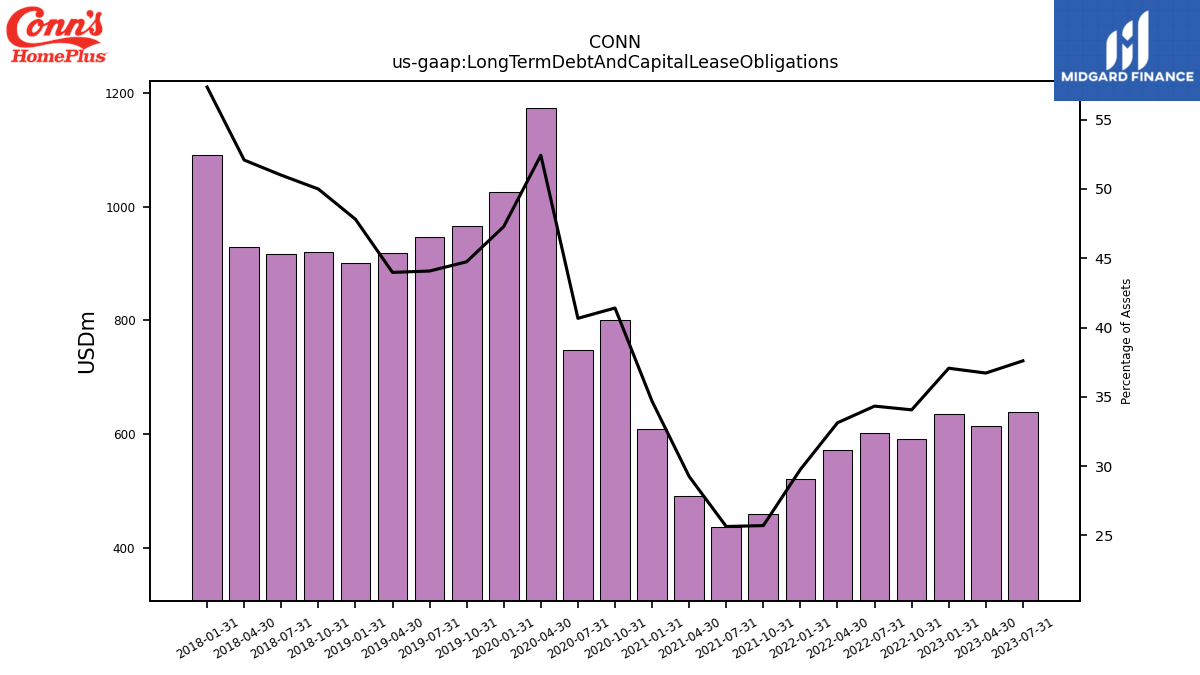
| Long Term Debt And Capital Lease Obligations | 639.95 | 615.38 | 636.08 | 591.67 | 602.41 | 572.35 | 522.15 | 459.32 | 438.24 | 492.06 | 608.63 | 800.59 | 748.90 | 1172.99 | 1025.54 | 965.06 | 945.98 | 919.25 | 901.22 | 920.37 | 916.08 | 929.53 | 1090.11 | NA | NA | NA | NA | NA | NA | NA | NA | NA | NA | NA | NA | NA | NA | NA | NA | NA | NA | NA | NA | NA | NA | NA | NA | NA | NA | NA | NA | NA | NA | |
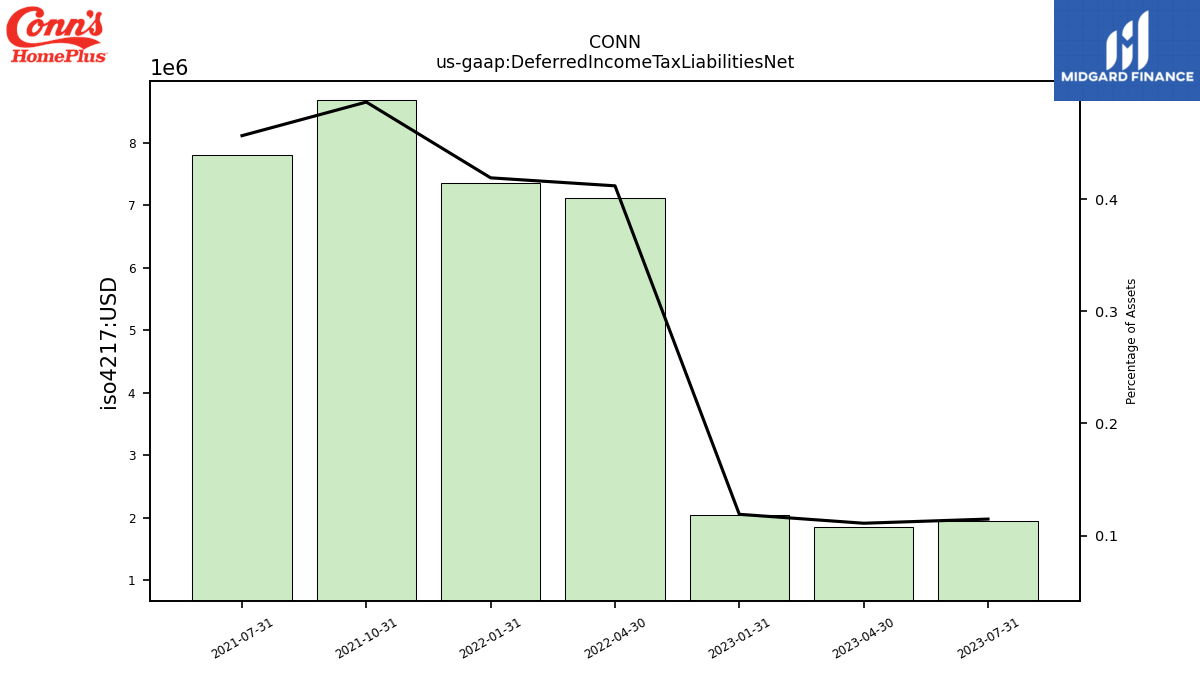
| Deferred Income Tax Liabilities Net | 1.95 | 1.86 | 2.04 | NA | NA | 7.12 | 7.35 | 8.69 | 7.80 | NA | NA | NA | NA | NA | NA | NA | NA | NA | NA | NA | NA | NA | NA | NA | NA | NA | NA | NA | NA | NA | NA | NA | NA | NA | NA | NA | NA | NA | NA | NA | NA | NA | NA | NA | NA | NA | NA | NA | NA | NA | NA | NA | NA | |
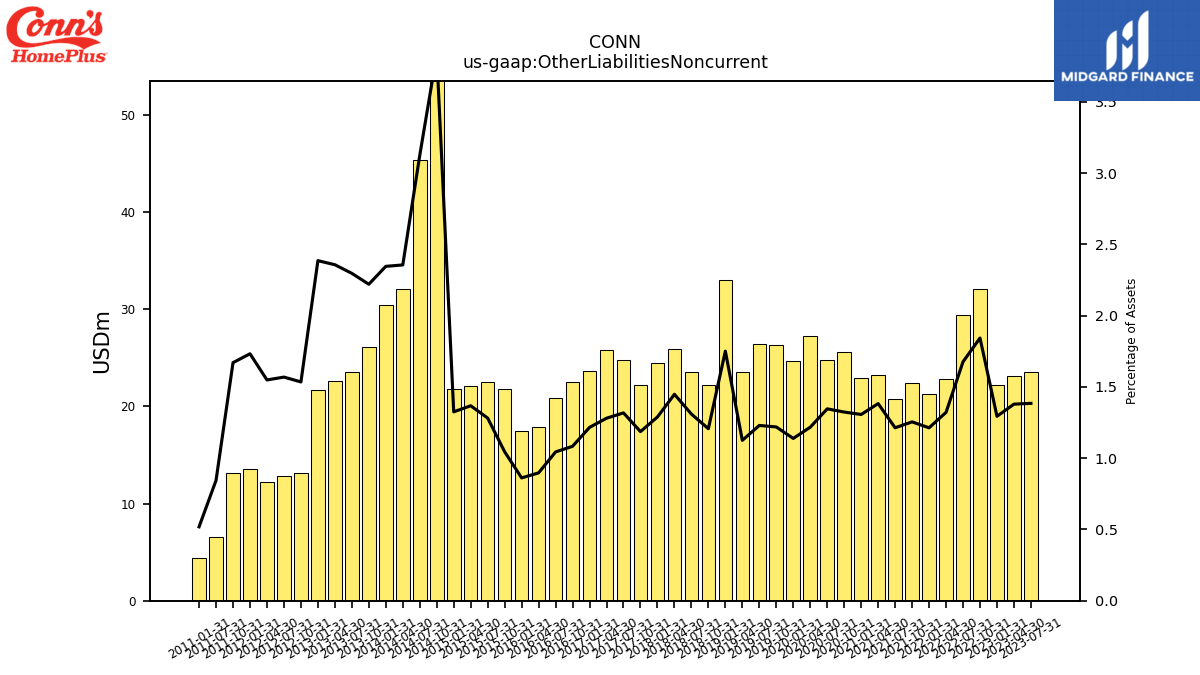
| Other Liabilities Noncurrent | 23.58 | 23.12 | 22.21 | 32.03 | 29.43 | 22.84 | 21.29 | 22.42 | 20.74 | 23.27 | 22.94 | 25.60 | 24.80 | 27.24 | 24.70 | 26.31 | 26.40 | 23.53 | 33.02 | 22.23 | 23.54 | 25.86 | 24.51 | 22.25 | 24.72 | 25.75 | 23.61 | 22.55 | 20.85 | 17.92 | 17.46 | 21.84 | 22.46 | 22.07 | 21.84 | 59.68 | 45.30 | 32.06 | 30.46 | 26.08 | 23.51 | 22.57 | 21.71 | 13.10 | 12.86 | 12.22 | 13.58 | 13.15 | 6.52 | NA | 4.40 | NA | NA | |
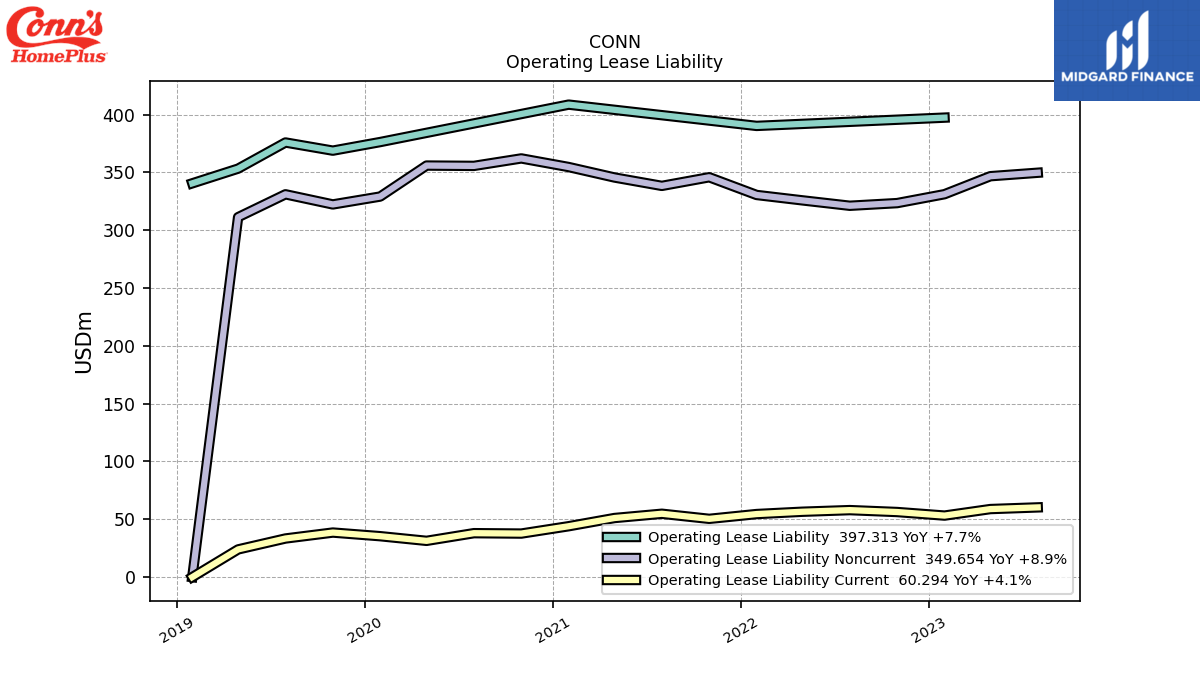
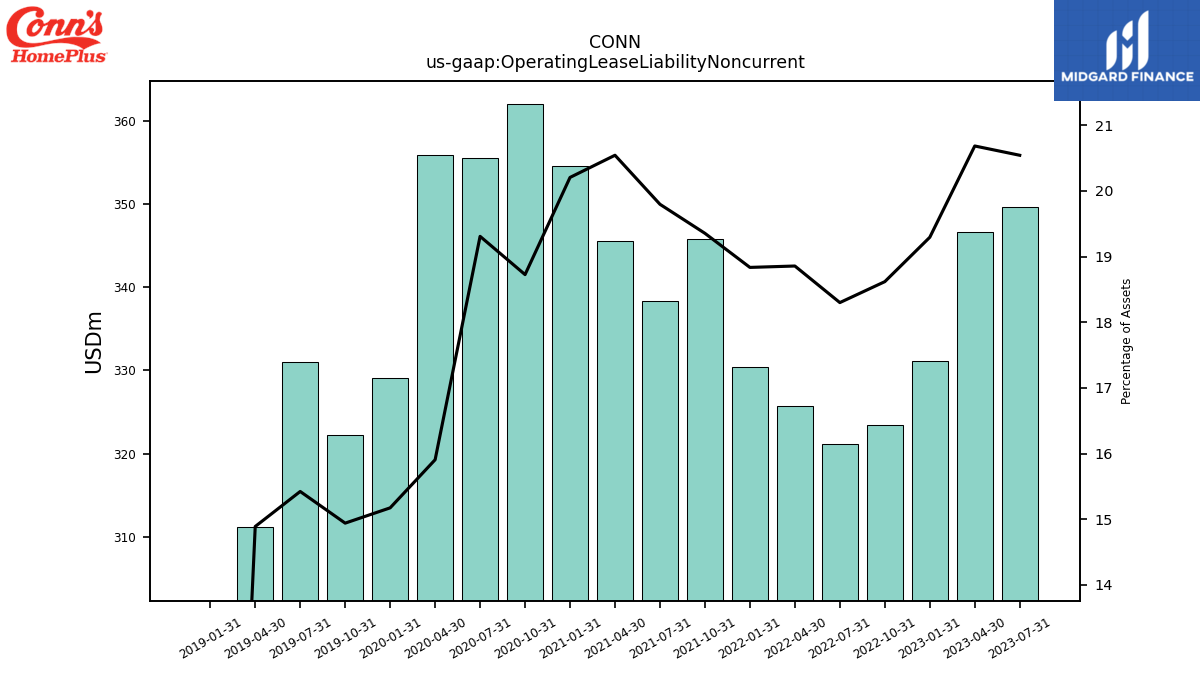
| Operating Lease Liability Noncurrent | 349.65 | 346.67 | 331.11 | 323.41 | 321.10 | 325.77 | 330.44 | 345.76 | 338.29 | 345.54 | 354.60 | 362.04 | 355.58 | 355.87 | 329.08 | 322.25 | 331.01 | 311.24 | 0.00 | NA | NA | NA | NA | NA | NA | NA | NA | NA | NA | NA | NA | NA | NA | NA | NA | NA | NA | NA | NA | NA | NA | NA | NA | NA | NA | NA | NA | NA | NA | NA | NA | NA | NA |
| 2023-07-31 | 2023-04-30 | 2023-01-31 | 2022-10-31 | 2022-07-31 | 2022-04-30 | 2022-01-31 | 2021-10-31 | 2021-07-31 | 2021-04-30 | 2021-01-31 | 2020-10-31 | 2020-07-31 | 2020-04-30 | 2020-01-31 | 2019-10-31 | 2019-07-31 | 2019-04-30 | 2019-01-31 | 2018-10-31 | 2018-07-31 | 2018-04-30 | 2018-01-31 | 2017-10-31 | 2017-07-31 | 2017-04-30 | 2017-01-31 | 2016-10-31 | 2016-07-31 | 2016-04-30 | 2016-01-31 | 2015-10-31 | 2015-07-31 | 2015-04-30 | 2015-01-31 | 2014-10-31 | 2014-07-31 | 2014-04-30 | 2014-01-31 | 2013-10-31 | 2013-07-31 | 2013-04-30 | 2013-01-31 | 2012-10-31 | 2012-07-31 | 2012-04-30 | 2012-01-31 | 2011-10-31 | 2011-07-31 | 2011-04-30 | 2011-01-31 | 2010-10-31 | 2010-07-31 | ||
|---|---|---|---|---|---|---|---|---|---|---|---|---|---|---|---|---|---|---|---|---|---|---|---|---|---|---|---|---|---|---|---|---|---|---|---|---|---|---|---|---|---|---|---|---|---|---|---|---|---|---|---|---|---|---|
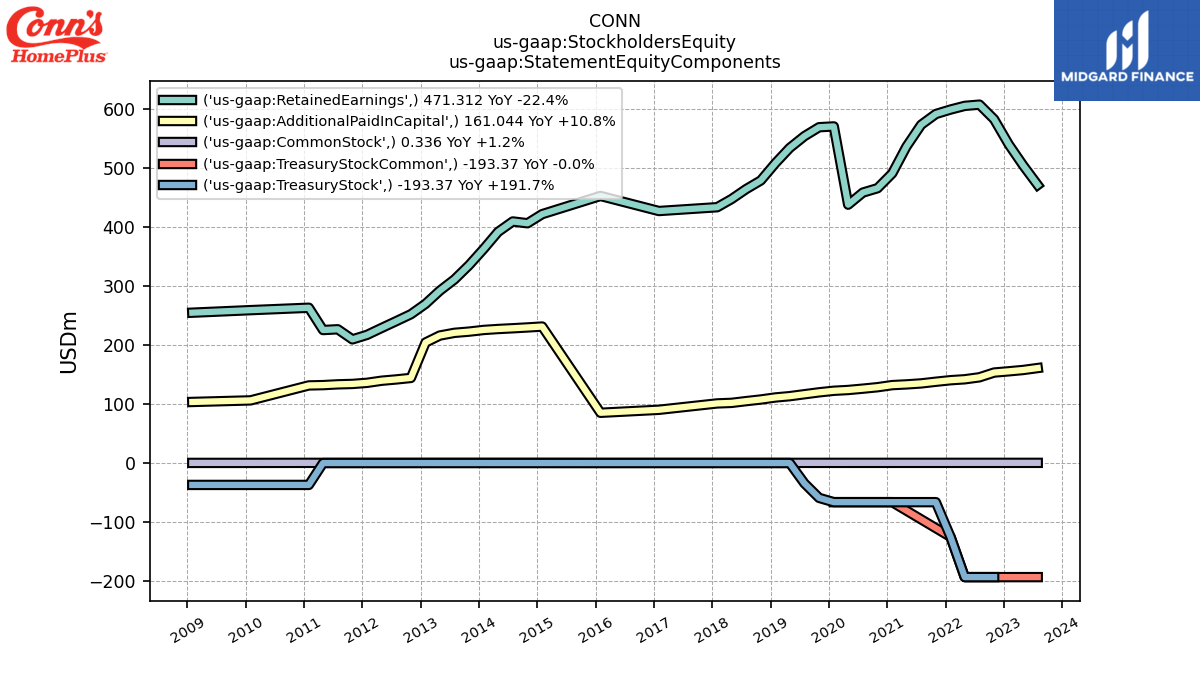
| Stockholders Equity | 439.32 | 469.51 | 502.41 | 543.11 | 559.88 | 554.39 | 614.82 | 663.51 | 642.45 | 603.77 | 557.15 | 528.47 | 518.59 | 495.81 | 627.18 | 630.38 | 636.74 | 647.82 | 619.98 | 587.03 | 569.65 | 549.65 | 535.07 | 529.39 | 525.28 | 517.05 | 517.79 | 516.69 | 519.64 | 530.22 | 538.28 | 635.21 | 688.62 | 669.98 | 653.67 | 636.68 | 638.33 | 619.37 | 589.29 | 558.74 | 532.22 | 508.43 | 474.45 | 396.61 | 382.27 | 368.49 | 353.37 | 343.93 | 361.25 | 357.85 | 352.90 | NA | NA | |
| Common Stock Value | 0.34 | 0.34 | 0.33 | 0.33 | 0.33 | 0.33 | 0.33 | 0.33 | 0.33 | 0.33 | 0.33 | 0.33 | 0.33 | 0.33 | 0.32 | 0.32 | 0.32 | 0.32 | 0.32 | 0.32 | 0.32 | 0.32 | 0.31 | 0.31 | 0.31 | 0.31 | 0.31 | 0.31 | 0.31 | 0.31 | 0.31 | 0.35 | 0.36 | 0.36 | 0.36 | 0.36 | 0.36 | 0.36 | 0.36 | 0.36 | 0.36 | 0.36 | 0.35 | 0.33 | 0.33 | 0.32 | 0.32 | 0.32 | 0.32 | NA | 0.34 | NA | NA | |
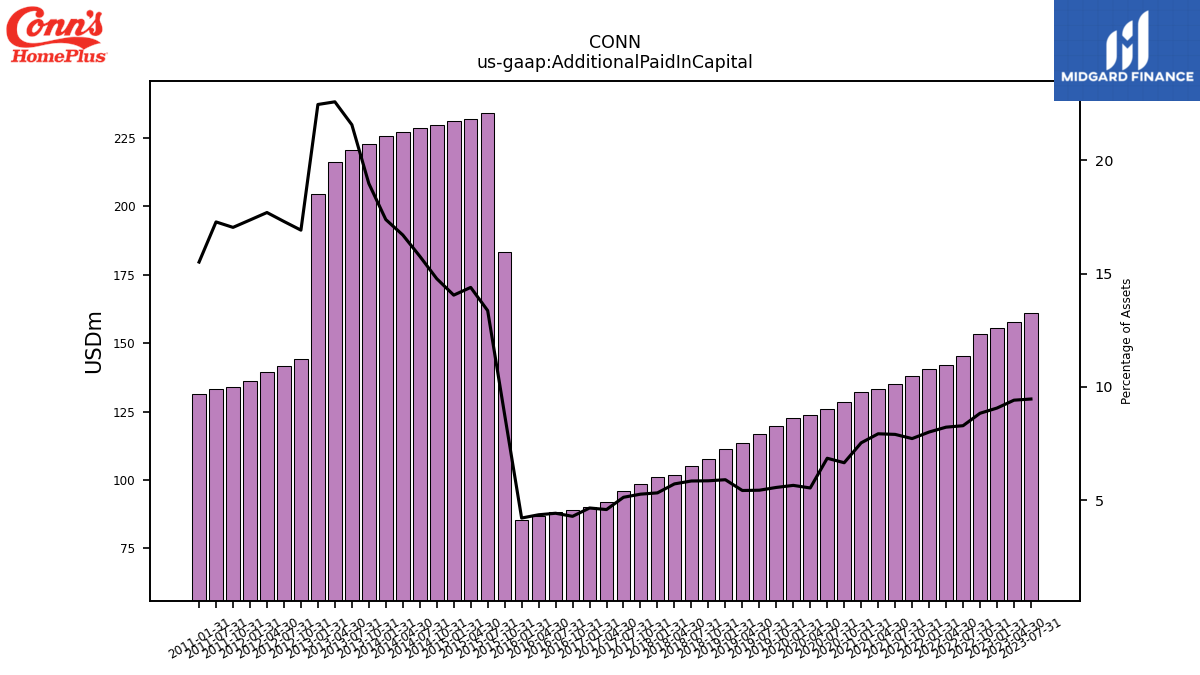
| Additional Paid In Capital | 161.04 | 157.71 | 155.52 | 153.42 | 145.35 | 141.99 | 140.42 | 137.82 | 135.00 | 133.33 | 132.11 | 128.55 | 126.09 | 123.83 | 122.51 | 119.87 | 116.64 | 113.36 | 111.19 | 107.72 | 104.96 | 101.98 | 101.09 | 98.61 | 96.07 | 92.11 | 90.28 | 89.11 | 88.24 | 86.89 | 85.21 | 183.16 | 234.13 | 232.03 | 231.40 | 229.86 | 228.48 | 227.21 | 225.63 | 222.81 | 220.74 | 216.15 | 204.37 | 144.26 | 141.73 | 139.53 | 136.01 | 134.09 | 133.42 | NA | 131.59 | NA | NA | |
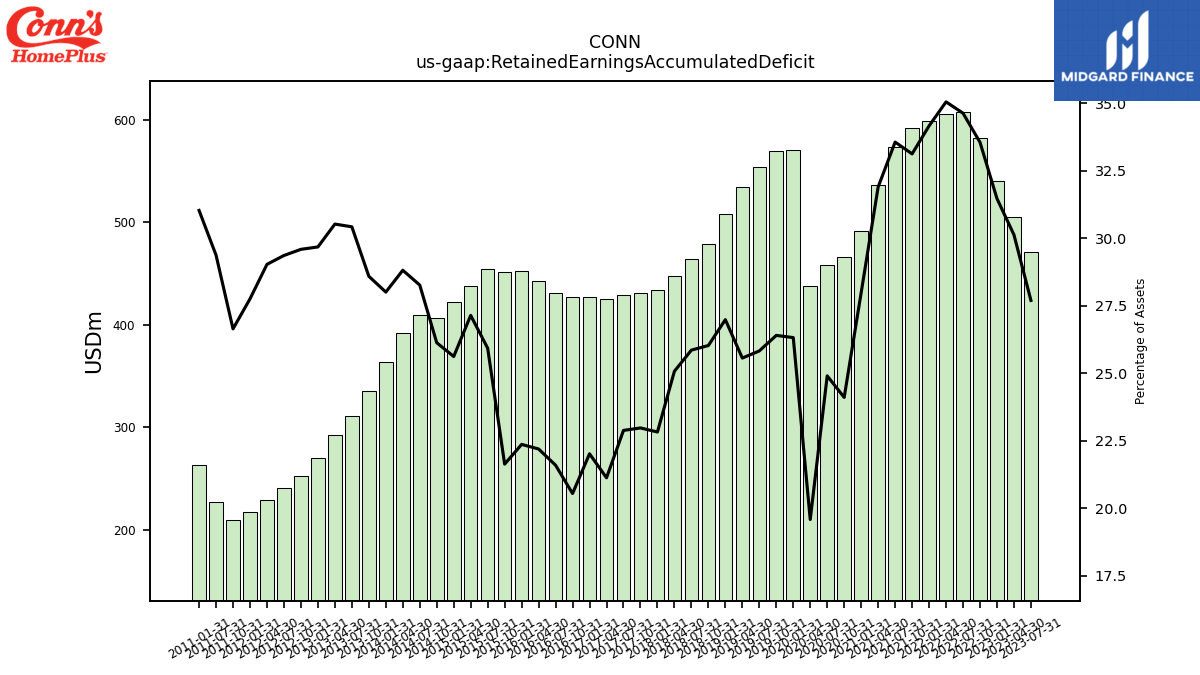
| Retained Earnings Accumulated Deficit | 471.31 | 504.83 | 539.92 | 582.73 | 607.57 | 605.44 | 599.22 | 591.65 | 573.41 | 536.41 | 491.01 | 465.88 | 458.46 | 437.94 | 570.64 | 569.26 | 554.11 | 534.14 | 508.47 | 479.00 | 464.37 | 447.36 | 433.67 | 430.47 | 428.90 | 424.62 | 427.20 | 427.28 | 431.09 | 443.02 | 452.77 | 451.70 | 454.13 | 437.59 | 421.91 | 406.45 | 409.52 | 391.87 | 363.40 | 335.66 | 311.29 | 292.12 | 269.95 | 252.28 | 240.50 | 228.89 | 217.34 | 209.64 | 226.77 | NA | 263.26 | NA | NA | |
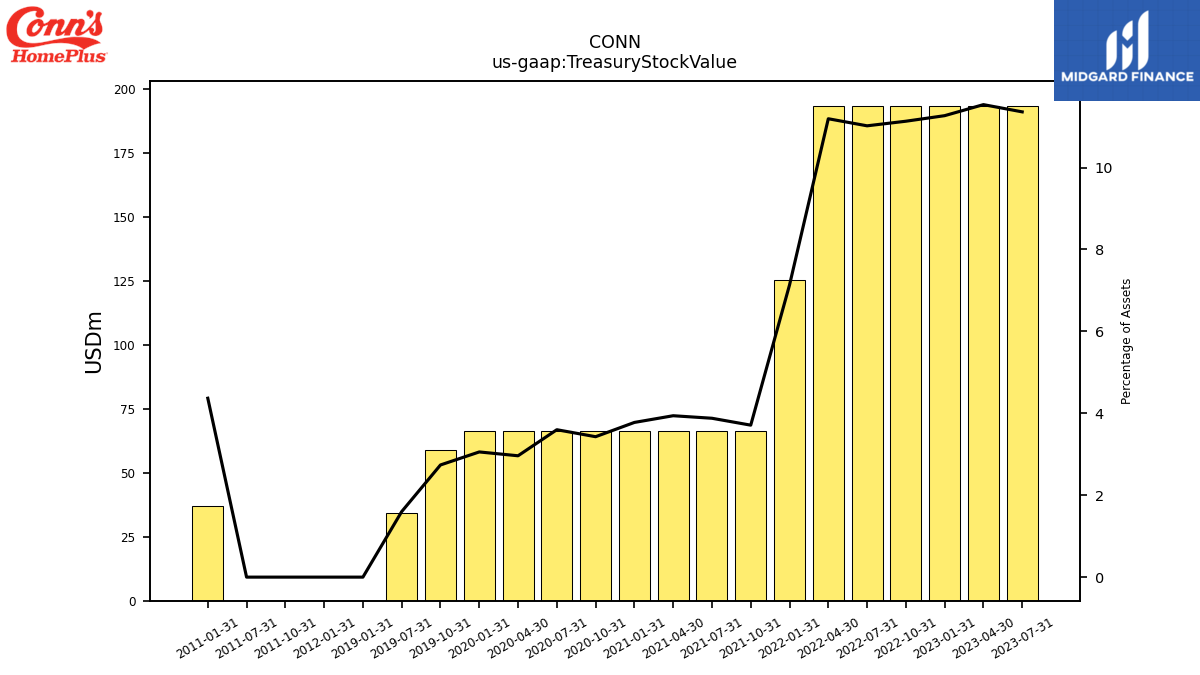
| Treasury Stock Value | 193.37 | 193.37 | 193.37 | 193.37 | 193.37 | 193.37 | 125.14 | 66.29 | 66.29 | 66.29 | 66.29 | 66.29 | 66.29 | 66.29 | 66.29 | 59.07 | 34.34 | NA | 0.00 | NA | NA | NA | NA | NA | NA | NA | NA | NA | NA | NA | NA | NA | NA | NA | NA | NA | NA | NA | NA | NA | NA | NA | NA | NA | NA | NA | 0.00 | 0.00 | 0.00 | NA | 37.07 | NA | NA | |
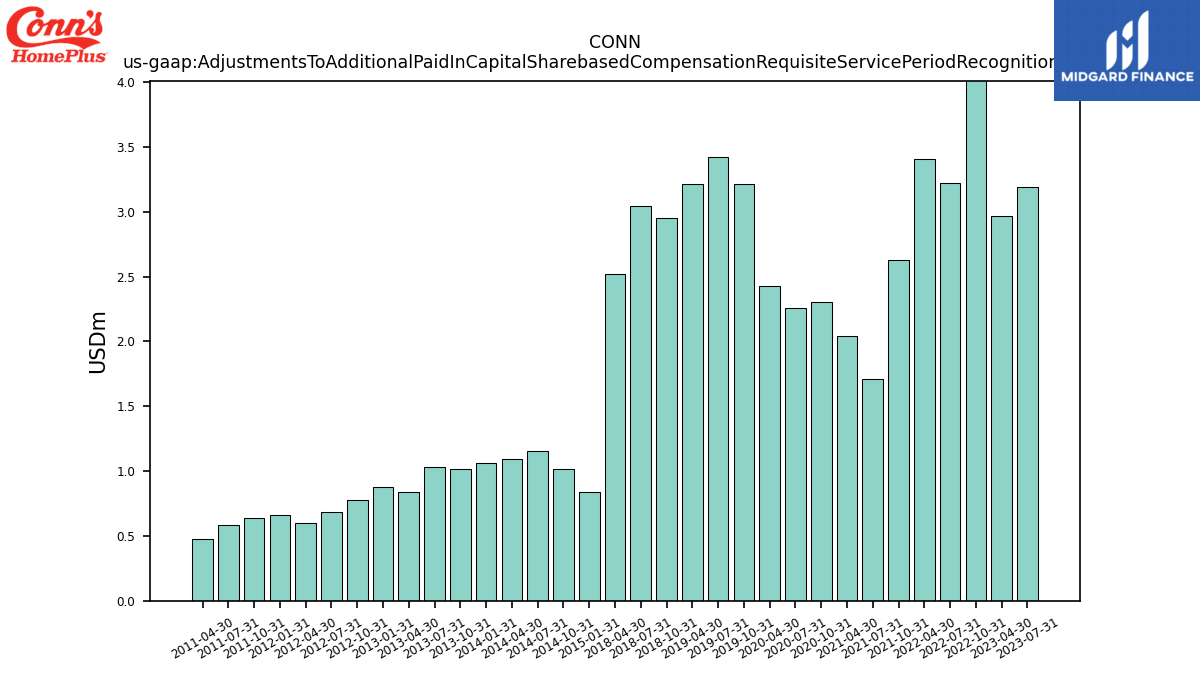
| Adjustments To Additional Paid In Capital Sharebased Compensation Requisite Service Period Recognition Value | 3.19 | 2.96 | NA | 8.11 | 3.22 | 3.41 | NA | 2.63 | 1.71 | 2.04 | NA | 2.30 | 2.25 | 2.43 | NA | 3.22 | 3.42 | 3.22 | NA | 2.95 | 3.04 | 2.52 | NA | NA | NA | NA | NA | NA | NA | NA | NA | NA | NA | NA | 0.84 | 1.02 | 1.15 | 1.09 | 1.06 | 1.02 | 1.03 | 0.84 | 0.88 | 0.78 | 0.69 | 0.60 | 0.66 | 0.64 | 0.58 | 0.47 | NA | NA | NA |
| 2023-07-31 | 2023-04-30 | 2023-01-31 | 2022-10-31 | 2022-07-31 | 2022-04-30 | 2022-01-31 | 2021-10-31 | 2021-07-31 | 2021-04-30 | 2021-01-31 | 2020-10-31 | 2020-07-31 | 2020-04-30 | 2020-01-31 | 2019-10-31 | 2019-07-31 | 2019-04-30 | 2019-01-31 | 2018-10-31 | 2018-07-31 | 2018-04-30 | 2018-01-31 | 2017-10-31 | 2017-07-31 | 2017-04-30 | 2017-01-31 | 2016-10-31 | 2016-07-31 | 2016-04-30 | 2016-01-31 | 2015-10-31 | 2015-07-31 | 2015-04-30 | 2015-01-31 | 2014-10-31 | 2014-07-31 | 2014-04-30 | 2014-01-31 | 2013-10-31 | 2013-07-31 | 2013-04-30 | 2013-01-31 | 2012-10-31 | 2012-07-31 | 2012-04-30 | 2012-01-31 | 2011-10-31 | 2011-07-31 | 2011-04-30 | 2011-01-31 | 2010-10-31 | 2010-07-31 | ||
|---|---|---|---|---|---|---|---|---|---|---|---|---|---|---|---|---|---|---|---|---|---|---|---|---|---|---|---|---|---|---|---|---|---|---|---|---|---|---|---|---|---|---|---|---|---|---|---|---|---|---|---|---|---|---|
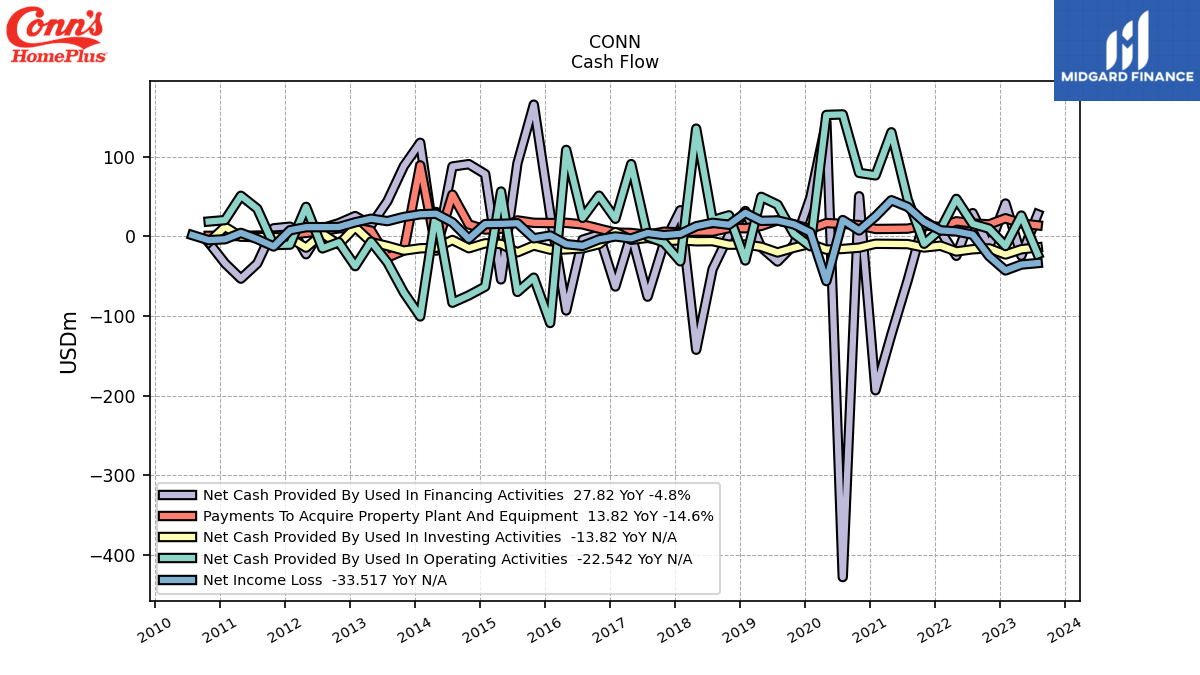
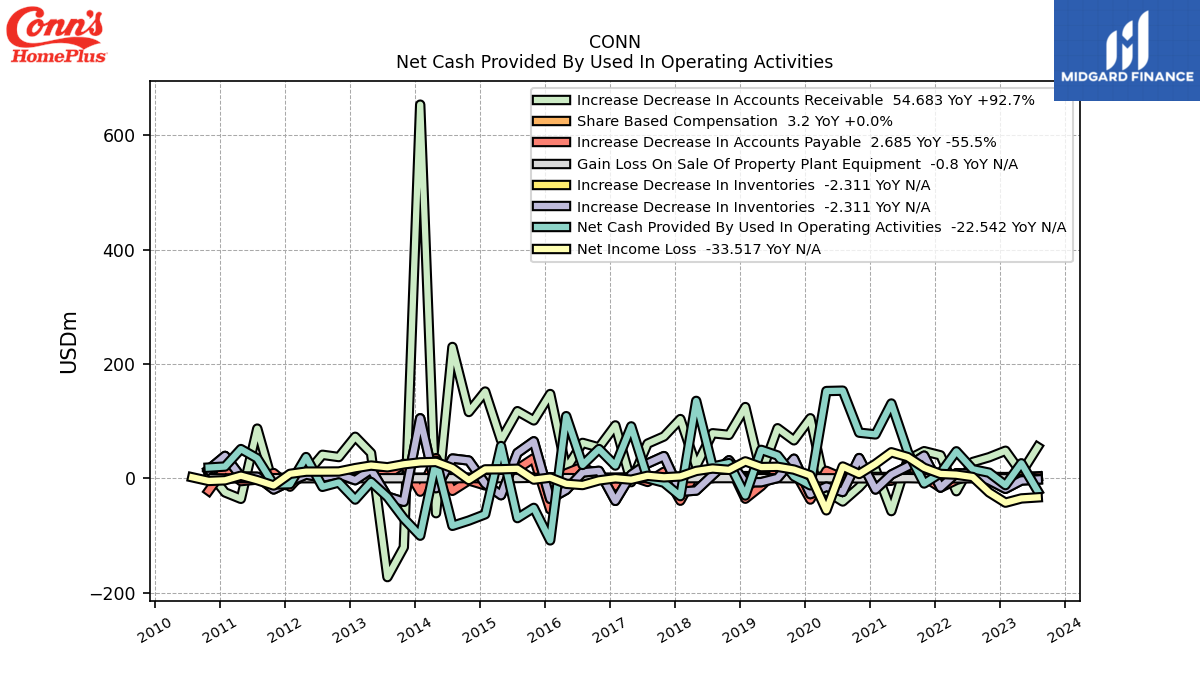
| Net Cash Provided By Used In Operating Activities | -22.54 | 26.15 | -12.08 | 9.71 | 15.71 | 47.12 | 8.73 | -9.26 | 46.17 | 130.77 | 76.65 | 79.74 | 153.20 | 152.52 | -12.46 | 3.08 | 39.78 | 49.66 | -30.29 | 26.44 | 20.31 | 135.34 | -31.38 | -7.80 | -0.22 | 90.76 | 22.12 | 51.11 | 23.25 | 108.65 | -108.83 | -51.85 | -69.80 | 56.35 | -63.11 | -74.12 | -83.35 | 30.68 | -100.56 | -70.51 | -32.67 | -6.51 | -37.41 | -7.38 | -15.07 | 37.07 | -10.35 | -10.91 | 34.75 | 51.03 | 20.46 | 18.66 | NA | |
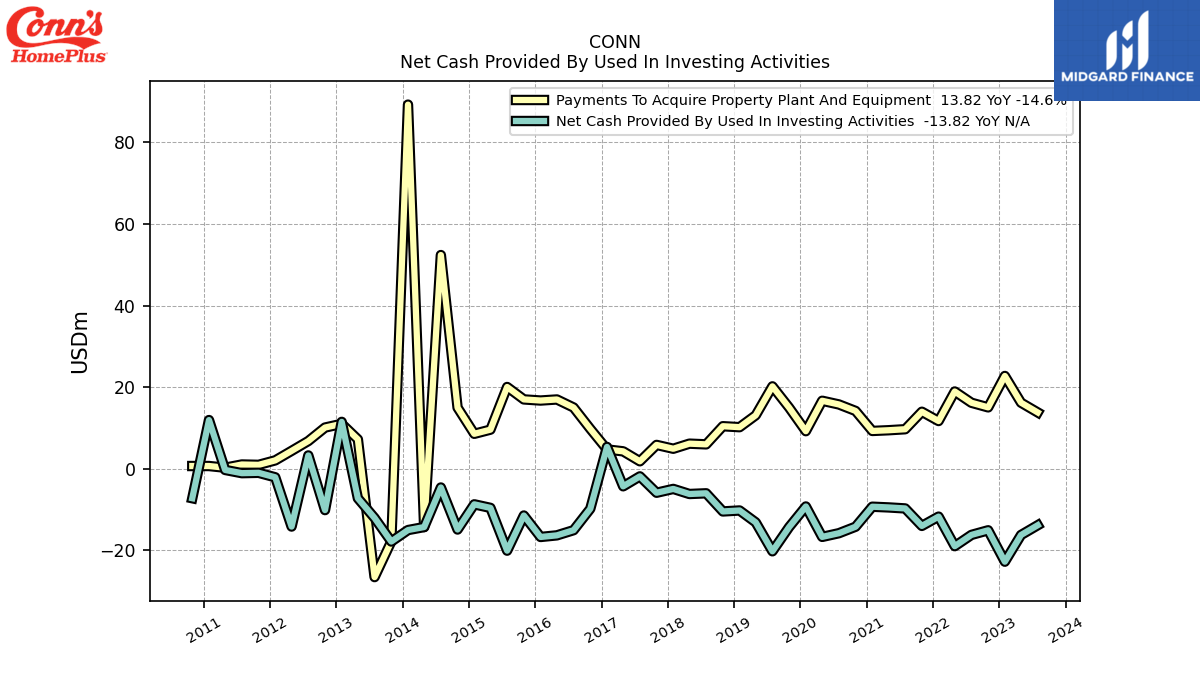
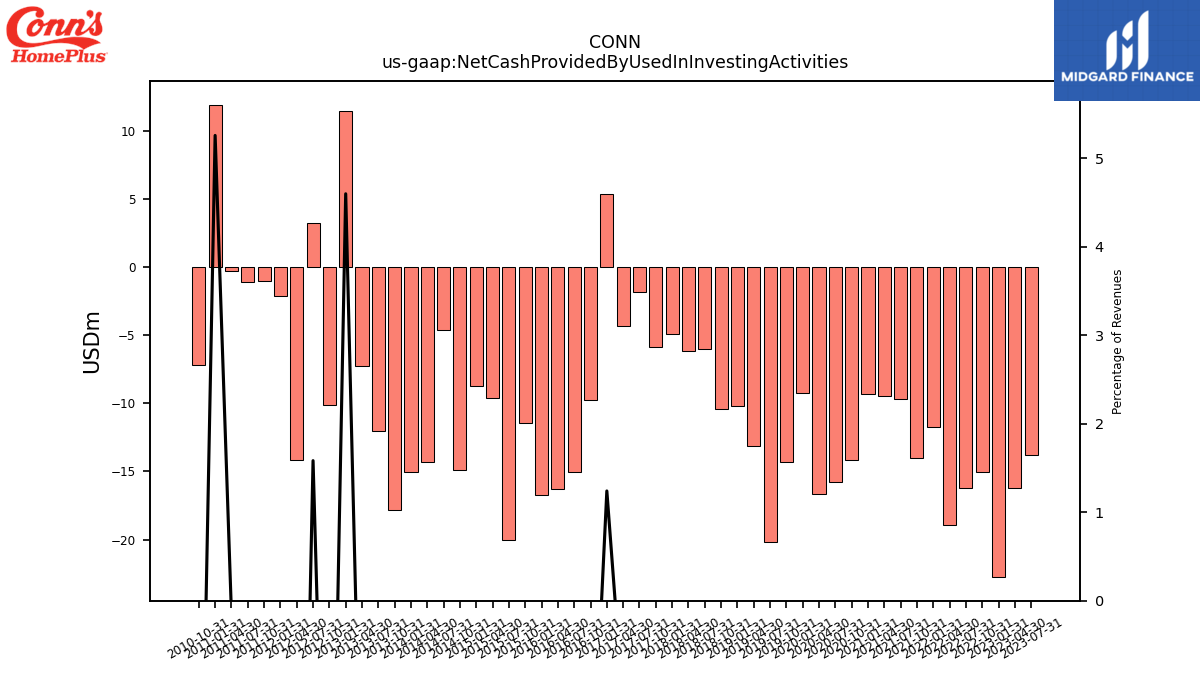
| Net Cash Provided By Used In Investing Activities | -13.82 | -16.21 | -22.76 | -15.06 | -16.19 | -18.96 | -11.71 | -13.99 | -9.71 | -9.46 | -9.28 | -14.19 | -15.78 | -16.68 | -9.22 | -14.27 | -20.21 | -13.12 | -10.21 | -10.44 | -6.00 | -6.17 | -4.92 | -5.86 | -1.85 | -4.29 | 5.37 | -9.78 | -15.03 | -16.30 | -16.70 | -11.44 | -20.05 | -9.57 | -8.70 | -14.87 | -4.57 | -14.27 | -15.01 | -17.82 | -12.04 | -7.22 | 11.51 | -10.11 | 3.28 | -14.15 | -2.07 | -0.97 | -1.06 | -0.28 | 11.95 | -7.21 | NA | |
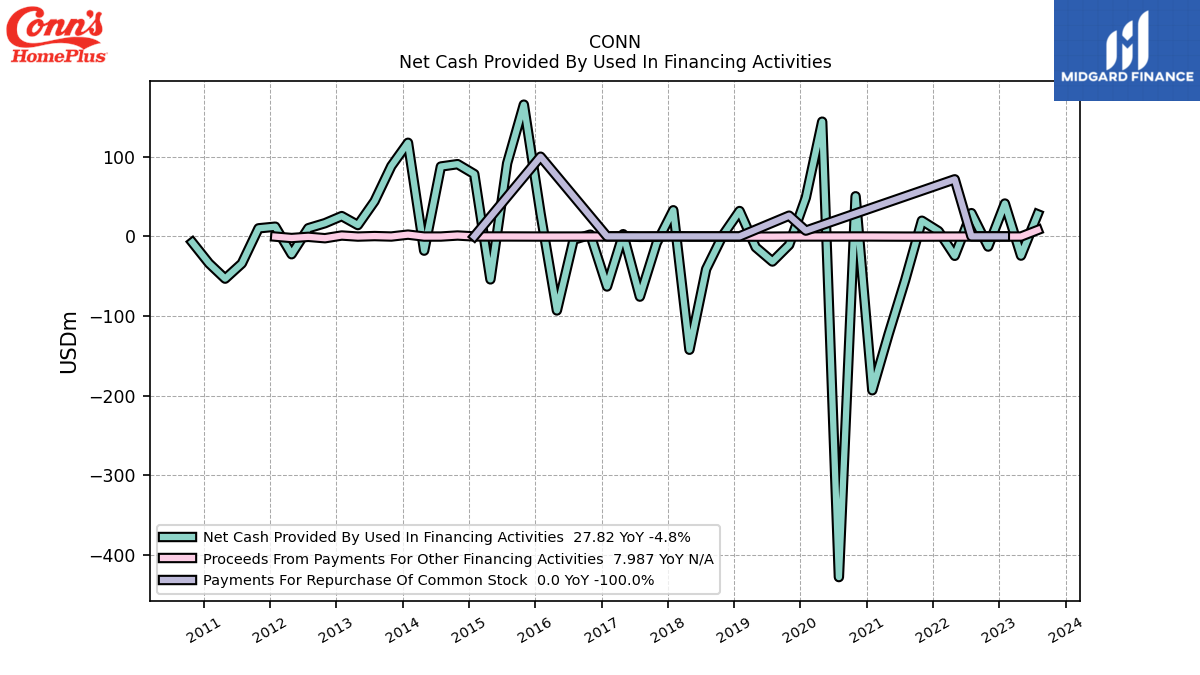
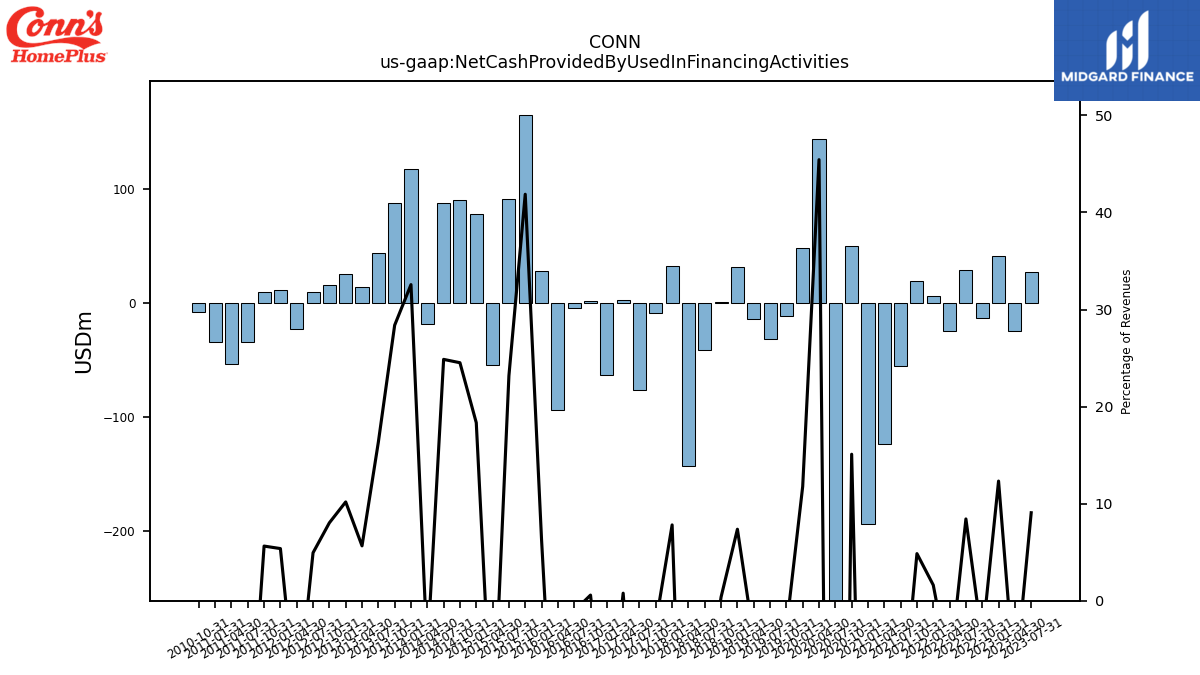
| Net Cash Provided By Used In Financing Activities | 27.82 | -24.19 | 41.28 | -12.82 | 29.21 | -24.41 | 6.50 | 19.68 | -54.98 | -123.36 | -193.31 | 50.42 | -428.00 | 144.09 | 48.62 | -10.68 | -31.60 | -13.67 | 31.90 | 1.44 | -41.14 | -142.41 | 32.84 | -8.61 | -75.73 | 2.77 | -62.99 | 2.20 | -4.22 | -93.06 | 28.71 | 165.49 | 91.76 | -54.05 | 78.27 | 90.73 | 87.75 | -17.94 | 117.59 | 88.23 | 44.20 | 14.20 | 25.48 | 16.57 | 10.26 | -22.45 | 12.18 | 10.11 | -34.02 | -53.11 | -33.85 | -7.50 | NA |
| 2023-07-31 | 2023-04-30 | 2023-01-31 | 2022-10-31 | 2022-07-31 | 2022-04-30 | 2022-01-31 | 2021-10-31 | 2021-07-31 | 2021-04-30 | 2021-01-31 | 2020-10-31 | 2020-07-31 | 2020-04-30 | 2020-01-31 | 2019-10-31 | 2019-07-31 | 2019-04-30 | 2019-01-31 | 2018-10-31 | 2018-07-31 | 2018-04-30 | 2018-01-31 | 2017-10-31 | 2017-07-31 | 2017-04-30 | 2017-01-31 | 2016-10-31 | 2016-07-31 | 2016-04-30 | 2016-01-31 | 2015-10-31 | 2015-07-31 | 2015-04-30 | 2015-01-31 | 2014-10-31 | 2014-07-31 | 2014-04-30 | 2014-01-31 | 2013-10-31 | 2013-07-31 | 2013-04-30 | 2013-01-31 | 2012-10-31 | 2012-07-31 | 2012-04-30 | 2012-01-31 | 2011-10-31 | 2011-07-31 | 2011-04-30 | 2011-01-31 | 2010-10-31 | 2010-07-31 | ||
|---|---|---|---|---|---|---|---|---|---|---|---|---|---|---|---|---|---|---|---|---|---|---|---|---|---|---|---|---|---|---|---|---|---|---|---|---|---|---|---|---|---|---|---|---|---|---|---|---|---|---|---|---|---|---|
| Net Cash Provided By Used In Operating Activities | -22.54 | 26.15 | -12.08 | 9.71 | 15.71 | 47.12 | 8.73 | -9.26 | 46.17 | 130.77 | 76.65 | 79.74 | 153.20 | 152.52 | -12.46 | 3.08 | 39.78 | 49.66 | -30.29 | 26.44 | 20.31 | 135.34 | -31.38 | -7.80 | -0.22 | 90.76 | 22.12 | 51.11 | 23.25 | 108.65 | -108.83 | -51.85 | -69.80 | 56.35 | -63.11 | -74.12 | -83.35 | 30.68 | -100.56 | -70.51 | -32.67 | -6.51 | -37.41 | -7.38 | -15.07 | 37.07 | -10.35 | -10.91 | 34.75 | 51.03 | 20.46 | 18.66 | NA | |
| Net Income Loss | -33.52 | -35.38 | -42.80 | -24.84 | 2.13 | 6.22 | 7.56 | 18.24 | 37.00 | 45.40 | 25.13 | 7.42 | 20.52 | -56.20 | 5.05 | 15.14 | 19.97 | 19.51 | 29.48 | 14.63 | 17.01 | 12.73 | 3.20 | 1.57 | 4.27 | -2.58 | -0.07 | -3.81 | -11.92 | -9.75 | 1.06 | -2.42 | 16.54 | 15.68 | 15.46 | -3.06 | 17.65 | 28.47 | 27.73 | 24.38 | 19.16 | 22.18 | 17.66 | 11.79 | 11.61 | 11.56 | 7.70 | -12.72 | -3.43 | 4.40 | -3.58 | -4.78 | 1.61 | |
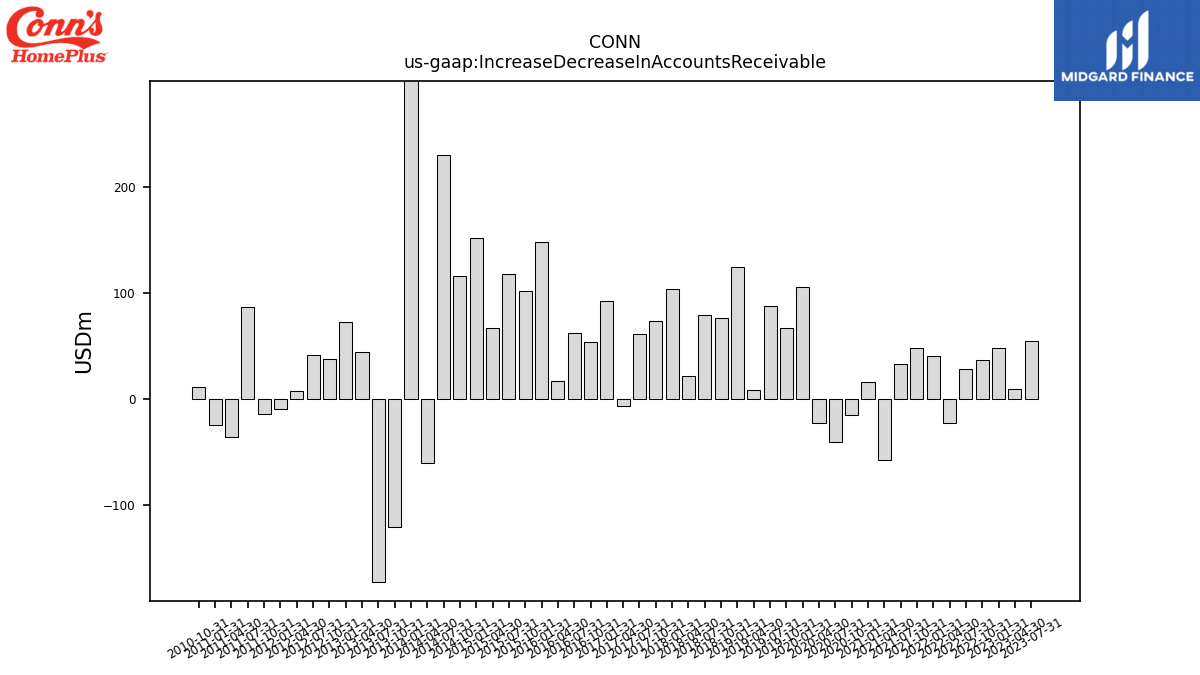
| Increase Decrease In Accounts Receivable | 54.68 | 9.15 | 48.08 | 36.72 | 28.37 | -22.71 | 40.08 | 47.34 | 32.69 | -57.56 | 15.49 | -15.61 | -40.75 | -23.00 | 104.92 | 66.25 | 87.48 | 8.35 | 124.55 | 75.86 | 78.70 | 21.64 | 103.55 | 73.09 | 60.51 | -6.94 | 92.42 | 53.85 | 61.84 | 16.25 | 147.38 | 101.13 | 117.37 | 66.51 | 151.73 | 115.83 | 229.69 | -61.22 | 653.66 | -120.73 | -173.04 | 44.02 | 72.54 | 37.02 | 41.01 | 6.77 | -9.69 | -14.30 | 86.83 | -36.09 | -24.86 | 11.34 | NA | |
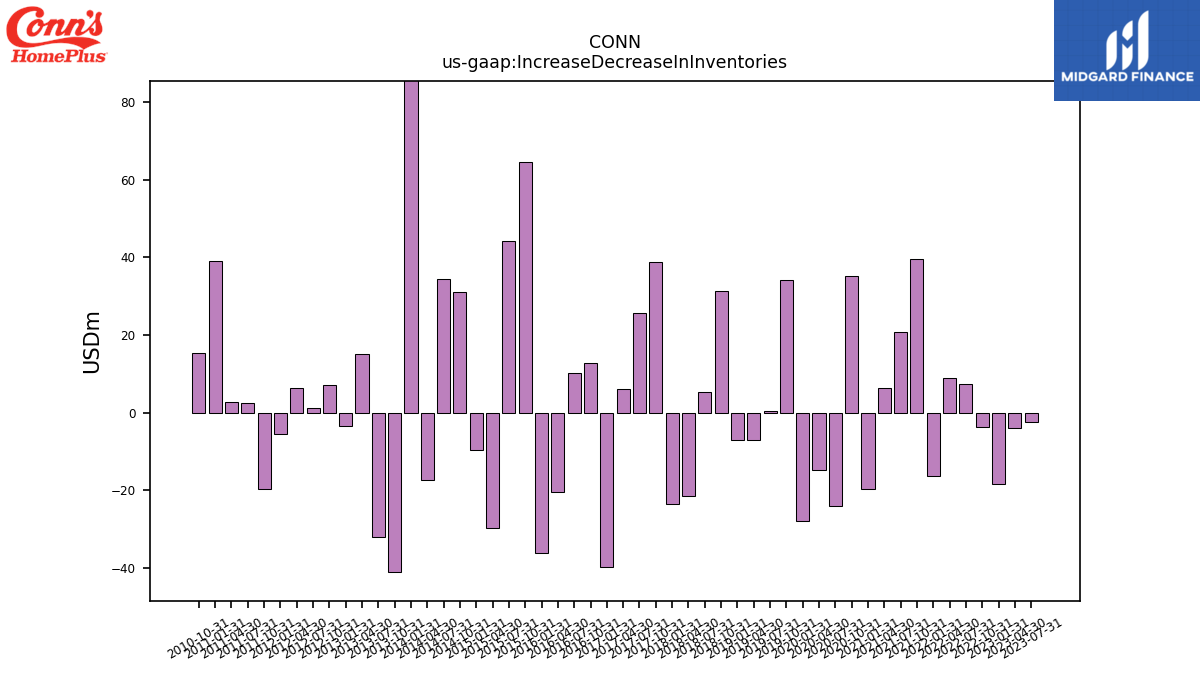
| Increase Decrease In Inventories | -2.31 | -3.99 | -18.50 | -3.67 | 7.30 | 8.82 | -16.31 | 39.47 | 20.76 | 6.44 | -19.70 | 35.27 | -24.03 | -14.83 | -27.86 | 34.10 | 0.41 | -6.93 | -7.13 | 31.44 | 5.42 | -21.58 | -23.59 | 38.71 | 25.77 | 6.14 | -39.68 | 12.89 | 10.10 | -20.43 | -36.18 | 64.58 | 44.19 | -29.68 | -9.54 | 30.98 | 34.43 | -17.33 | 104.89 | -41.17 | -32.05 | 15.18 | -3.46 | 6.99 | 1.27 | 6.35 | -5.46 | -19.62 | 2.51 | 2.77 | 39.09 | 15.38 | NA | |
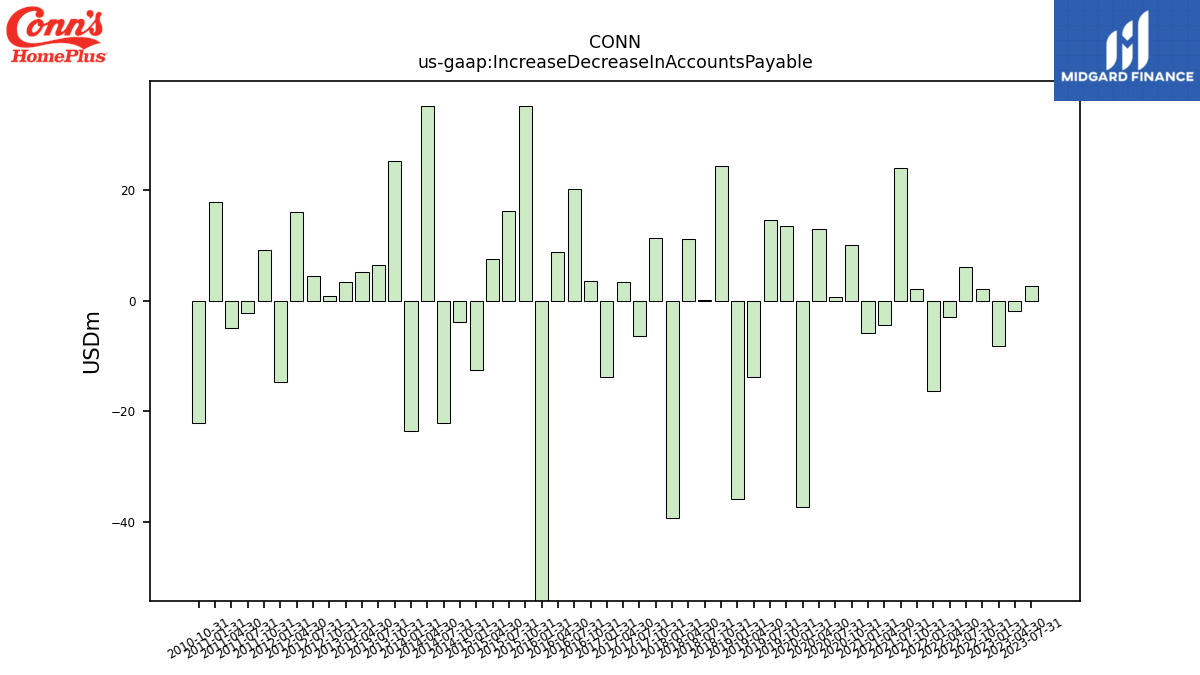
| Increase Decrease In Accounts Payable | 2.69 | -1.92 | -8.18 | 2.17 | 6.03 | -3.05 | -16.38 | 2.08 | 24.05 | -4.42 | -5.92 | 9.98 | 0.56 | 12.88 | -37.35 | 13.55 | 14.62 | -13.85 | -35.86 | 24.27 | 0.04 | 11.05 | -39.41 | 11.25 | -6.49 | 3.43 | -13.91 | 3.51 | 20.11 | 8.72 | -54.72 | 35.13 | 16.21 | 7.45 | -12.61 | -3.86 | -22.12 | 35.22 | -23.56 | 25.17 | 6.50 | 5.14 | 3.43 | 0.87 | 4.50 | 16.10 | -14.77 | 9.10 | -2.30 | -5.06 | 17.74 | -22.12 | NA | |
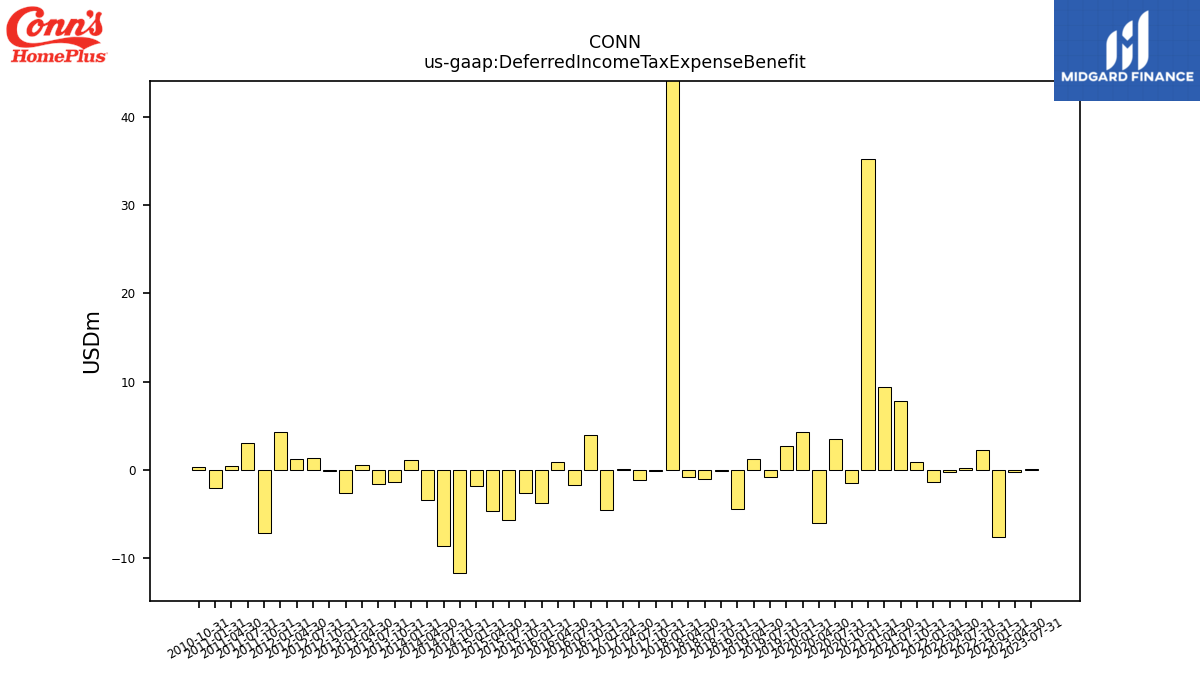
| Deferred Income Tax Expense Benefit | 0.09 | -0.27 | -7.61 | 2.27 | 0.26 | -0.23 | -1.34 | 0.89 | 7.80 | 9.45 | 35.28 | -1.48 | 3.50 | -5.97 | 4.31 | 2.71 | -0.75 | 1.22 | -4.38 | -0.07 | -1.03 | -0.74 | 50.99 | -0.12 | -1.11 | 0.11 | -4.53 | 4.01 | -1.66 | 0.95 | -3.73 | -2.60 | -5.70 | -4.65 | -1.86 | -11.66 | -8.60 | -3.42 | 1.19 | -1.37 | -1.62 | 0.62 | -2.59 | -0.12 | 1.42 | 1.27 | 4.37 | -7.09 | 3.04 | 0.43 | -2.00 | 0.40 | NA | |
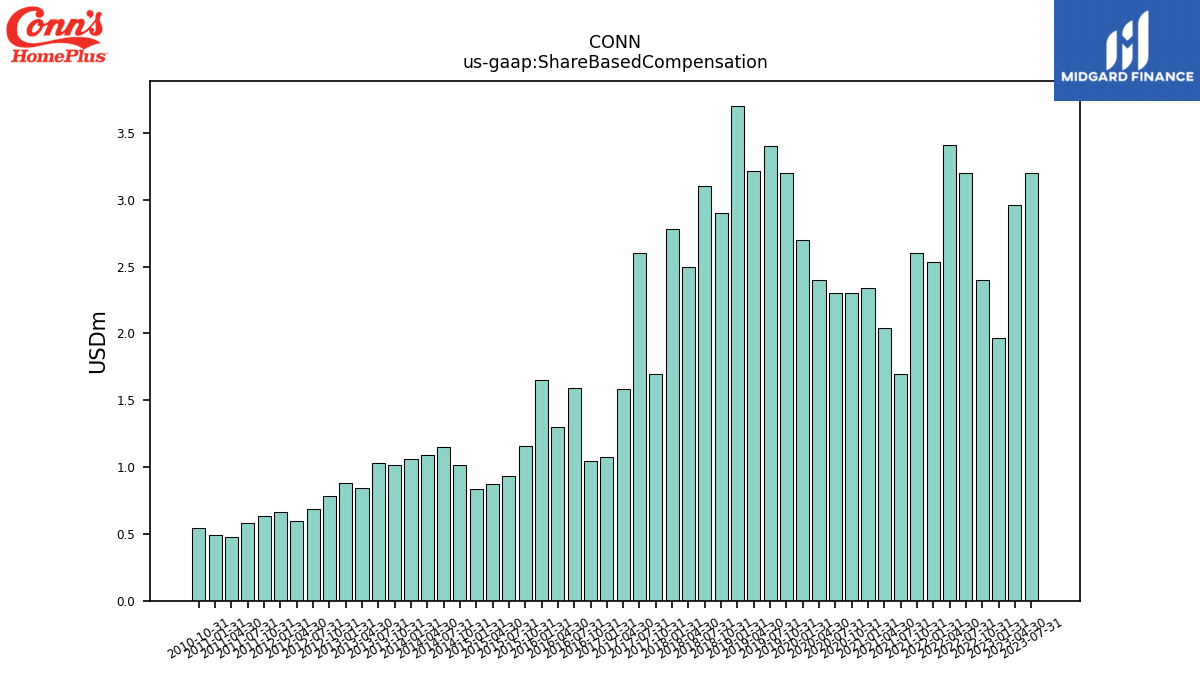
| Share Based Compensation | 3.20 | 2.96 | 1.97 | 2.40 | 3.20 | 3.41 | 2.53 | 2.60 | 1.70 | 2.04 | 2.34 | 2.30 | 2.30 | 2.40 | 2.70 | 3.20 | 3.40 | 3.22 | 3.70 | 2.90 | 3.10 | 2.50 | 2.78 | 1.70 | 2.60 | 1.58 | 1.07 | 1.04 | 1.59 | 1.30 | 1.65 | 1.16 | 0.93 | 0.87 | 0.84 | 1.02 | 1.15 | 1.09 | 1.06 | 1.02 | 1.03 | 0.84 | 0.88 | 0.78 | 0.69 | 0.60 | 0.66 | 0.64 | 0.58 | 0.47 | 0.49 | 0.54 | NA | |
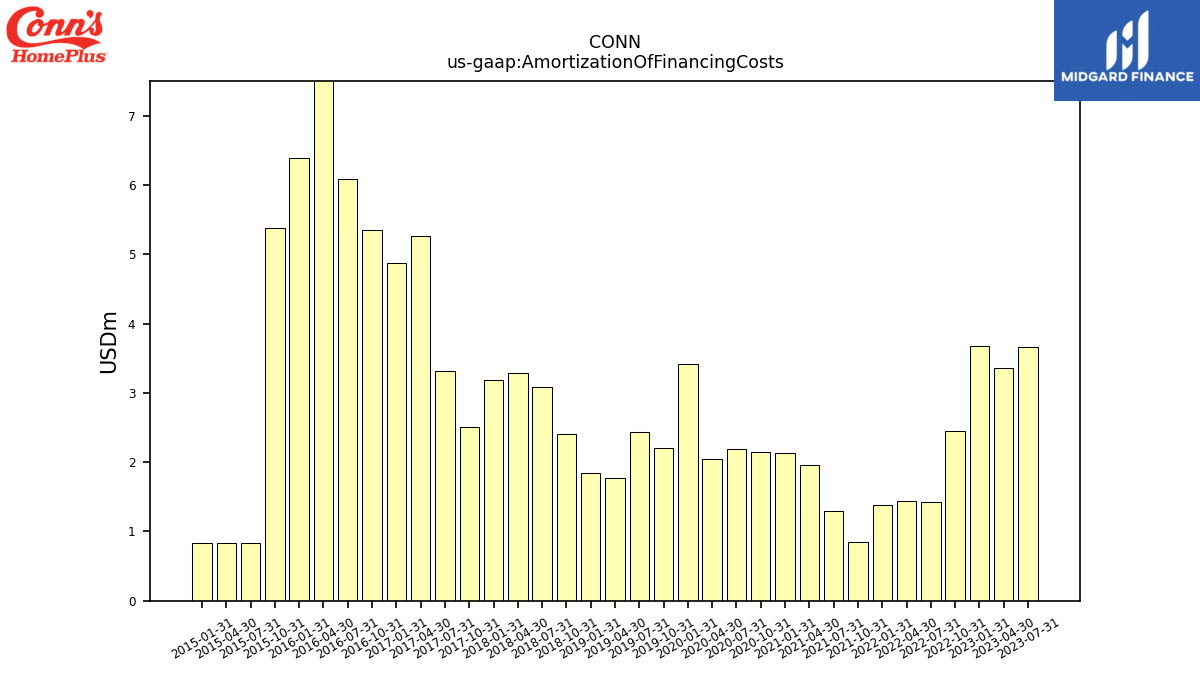
| Amortization Of Financing Costs | 3.67 | 3.37 | 3.67 | 2.44 | 1.42 | 1.44 | 1.39 | 0.84 | 1.29 | 1.96 | 2.14 | 2.15 | 2.19 | 2.05 | 3.42 | 2.20 | 2.44 | 1.77 | 1.84 | 2.41 | 3.09 | 3.29 | 3.19 | 2.51 | 3.31 | 5.26 | 4.88 | 5.35 | 6.08 | 7.73 | 6.39 | 5.38 | 0.83 | 0.83 | 0.83 | NA | NA | NA | NA | NA | NA | NA | NA | NA | NA | NA | NA | NA | NA | NA | NA | NA | NA |
| 2023-07-31 | 2023-04-30 | 2023-01-31 | 2022-10-31 | 2022-07-31 | 2022-04-30 | 2022-01-31 | 2021-10-31 | 2021-07-31 | 2021-04-30 | 2021-01-31 | 2020-10-31 | 2020-07-31 | 2020-04-30 | 2020-01-31 | 2019-10-31 | 2019-07-31 | 2019-04-30 | 2019-01-31 | 2018-10-31 | 2018-07-31 | 2018-04-30 | 2018-01-31 | 2017-10-31 | 2017-07-31 | 2017-04-30 | 2017-01-31 | 2016-10-31 | 2016-07-31 | 2016-04-30 | 2016-01-31 | 2015-10-31 | 2015-07-31 | 2015-04-30 | 2015-01-31 | 2014-10-31 | 2014-07-31 | 2014-04-30 | 2014-01-31 | 2013-10-31 | 2013-07-31 | 2013-04-30 | 2013-01-31 | 2012-10-31 | 2012-07-31 | 2012-04-30 | 2012-01-31 | 2011-10-31 | 2011-07-31 | 2011-04-30 | 2011-01-31 | 2010-10-31 | 2010-07-31 | ||
|---|---|---|---|---|---|---|---|---|---|---|---|---|---|---|---|---|---|---|---|---|---|---|---|---|---|---|---|---|---|---|---|---|---|---|---|---|---|---|---|---|---|---|---|---|---|---|---|---|---|---|---|---|---|---|
| Net Cash Provided By Used In Investing Activities | -13.82 | -16.21 | -22.76 | -15.06 | -16.19 | -18.96 | -11.71 | -13.99 | -9.71 | -9.46 | -9.28 | -14.19 | -15.78 | -16.68 | -9.22 | -14.27 | -20.21 | -13.12 | -10.21 | -10.44 | -6.00 | -6.17 | -4.92 | -5.86 | -1.85 | -4.29 | 5.37 | -9.78 | -15.03 | -16.30 | -16.70 | -11.44 | -20.05 | -9.57 | -8.70 | -14.87 | -4.57 | -14.27 | -15.01 | -17.82 | -12.04 | -7.22 | 11.51 | -10.11 | 3.28 | -14.15 | -2.07 | -0.97 | -1.06 | -0.28 | 11.95 | -7.21 | NA | |
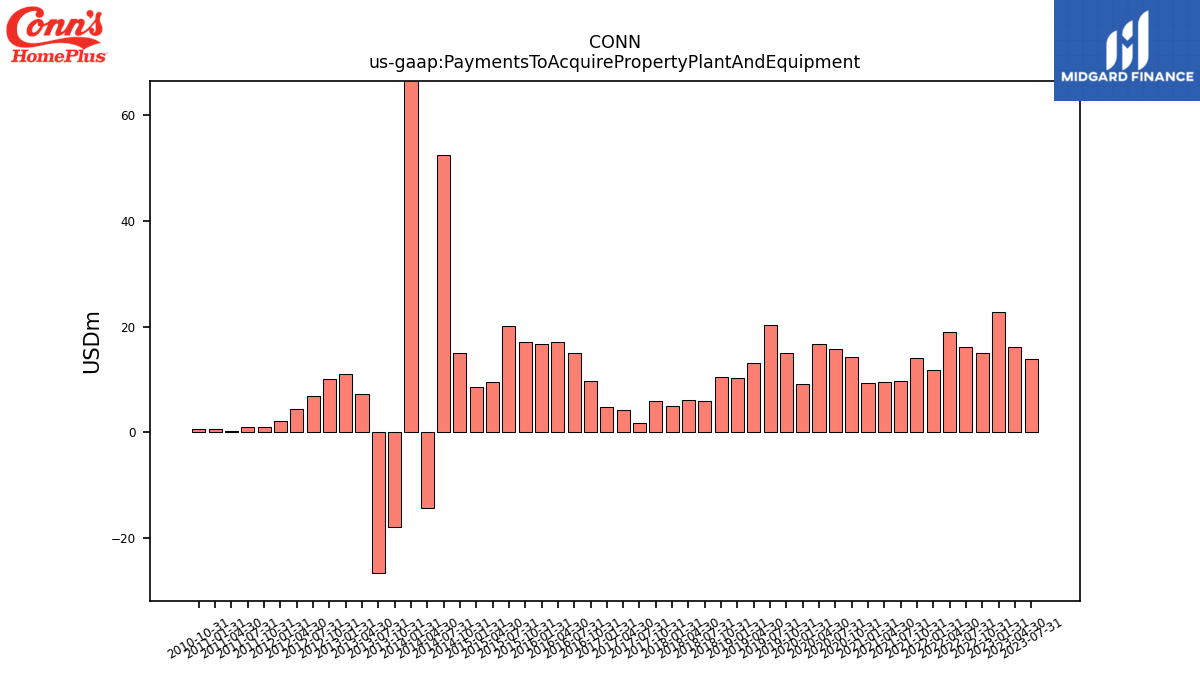
| Payments To Acquire Property Plant And Equipment | 13.82 | 16.21 | 22.76 | 15.06 | 16.19 | 18.96 | 11.71 | 13.99 | 9.71 | 9.46 | 9.28 | 14.19 | 15.78 | 16.68 | 9.22 | 14.99 | 20.21 | 13.12 | 10.21 | 10.44 | 6.00 | 6.17 | 4.92 | 5.86 | 1.85 | 4.29 | 4.75 | 9.78 | 15.02 | 17.00 | 16.74 | 17.01 | 20.05 | 9.60 | 8.58 | 15.00 | 52.39 | -14.27 | 89.25 | -17.81 | -26.54 | 7.23 | 11.02 | 10.11 | 6.81 | 4.40 | 2.07 | 0.97 | 1.06 | 0.28 | 0.69 | 0.69 | NA |
| 2023-07-31 | 2023-04-30 | 2023-01-31 | 2022-10-31 | 2022-07-31 | 2022-04-30 | 2022-01-31 | 2021-10-31 | 2021-07-31 | 2021-04-30 | 2021-01-31 | 2020-10-31 | 2020-07-31 | 2020-04-30 | 2020-01-31 | 2019-10-31 | 2019-07-31 | 2019-04-30 | 2019-01-31 | 2018-10-31 | 2018-07-31 | 2018-04-30 | 2018-01-31 | 2017-10-31 | 2017-07-31 | 2017-04-30 | 2017-01-31 | 2016-10-31 | 2016-07-31 | 2016-04-30 | 2016-01-31 | 2015-10-31 | 2015-07-31 | 2015-04-30 | 2015-01-31 | 2014-10-31 | 2014-07-31 | 2014-04-30 | 2014-01-31 | 2013-10-31 | 2013-07-31 | 2013-04-30 | 2013-01-31 | 2012-10-31 | 2012-07-31 | 2012-04-30 | 2012-01-31 | 2011-10-31 | 2011-07-31 | 2011-04-30 | 2011-01-31 | 2010-10-31 | 2010-07-31 | ||
|---|---|---|---|---|---|---|---|---|---|---|---|---|---|---|---|---|---|---|---|---|---|---|---|---|---|---|---|---|---|---|---|---|---|---|---|---|---|---|---|---|---|---|---|---|---|---|---|---|---|---|---|---|---|---|
| Net Cash Provided By Used In Financing Activities | 27.82 | -24.19 | 41.28 | -12.82 | 29.21 | -24.41 | 6.50 | 19.68 | -54.98 | -123.36 | -193.31 | 50.42 | -428.00 | 144.09 | 48.62 | -10.68 | -31.60 | -13.67 | 31.90 | 1.44 | -41.14 | -142.41 | 32.84 | -8.61 | -75.73 | 2.77 | -62.99 | 2.20 | -4.22 | -93.06 | 28.71 | 165.49 | 91.76 | -54.05 | 78.27 | 90.73 | 87.75 | -17.94 | 117.59 | 88.23 | 44.20 | 14.20 | 25.48 | 16.57 | 10.26 | -22.45 | 12.18 | 10.11 | -34.02 | -53.11 | -33.85 | -7.50 | NA | |
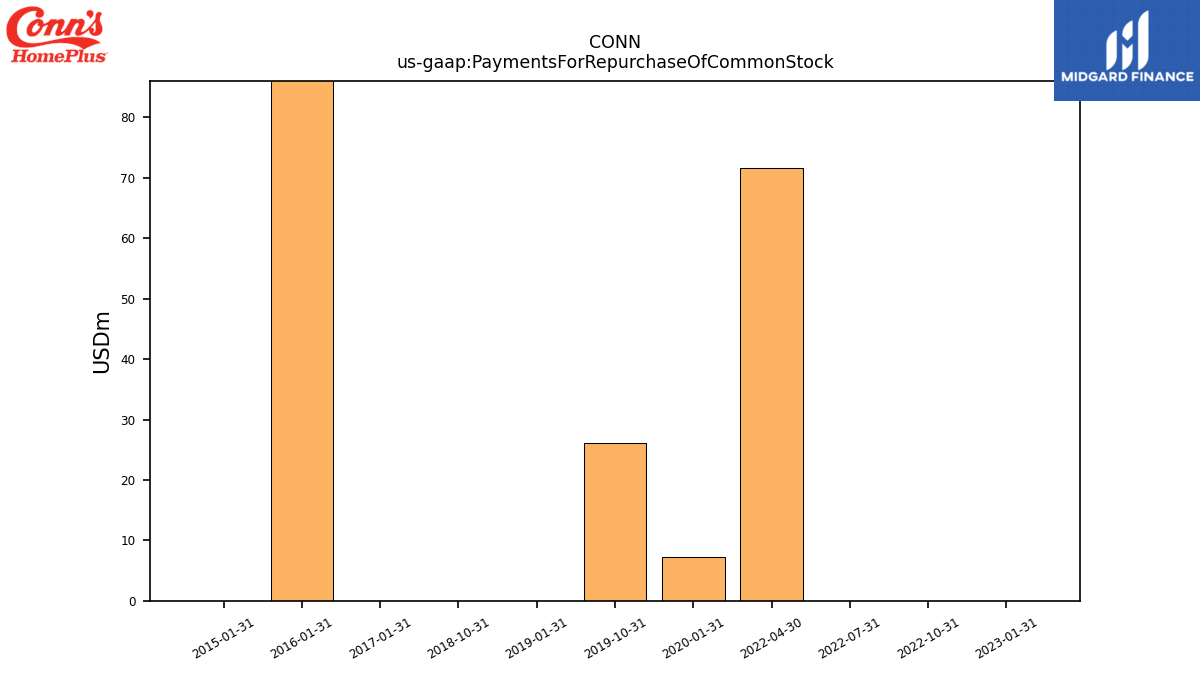
| Payments For Repurchase Of Common Stock | NA | NA | 0.00 | 0.00 | 0.00 | 71.70 | NA | NA | NA | NA | NA | NA | NA | NA | 7.22 | 26.05 | NA | NA | 0.00 | 0.00 | NA | NA | NA | NA | NA | NA | 0.00 | NA | NA | NA | 100.10 | NA | NA | NA | 0.00 | NA | NA | NA | NA | NA | NA | NA | NA | NA | NA | NA | NA | NA | NA | NA | NA | NA | NA |
| 2023-07-31 | 2023-04-30 | 2023-01-31 | 2022-10-31 | 2022-07-31 | 2022-04-30 | 2022-01-31 | 2021-10-31 | 2021-07-31 | 2021-04-30 | 2021-01-31 | 2020-10-31 | 2020-07-31 | 2020-04-30 | 2020-01-31 | 2019-10-31 | 2019-07-31 | 2019-04-30 | 2019-01-31 | 2018-10-31 | 2018-07-31 | 2018-04-30 | 2018-01-31 | 2017-10-31 | 2017-07-31 | 2017-04-30 | 2017-01-31 | 2016-10-31 | 2016-07-31 | 2016-04-30 | 2016-01-31 | 2015-10-31 | 2015-07-31 | 2015-04-30 | 2015-01-31 | 2014-10-31 | 2014-07-31 | 2014-04-30 | 2014-01-31 | 2013-10-31 | 2013-07-31 | 2013-04-30 | 2013-01-31 | 2012-10-31 | 2012-07-31 | 2012-04-30 | 2012-01-31 | 2011-10-31 | 2011-07-31 | 2011-04-30 | 2011-01-31 | 2010-10-31 | 2010-07-31 | ||
|---|---|---|---|---|---|---|---|---|---|---|---|---|---|---|---|---|---|---|---|---|---|---|---|---|---|---|---|---|---|---|---|---|---|---|---|---|---|---|---|---|---|---|---|---|---|---|---|---|---|---|---|---|---|---|
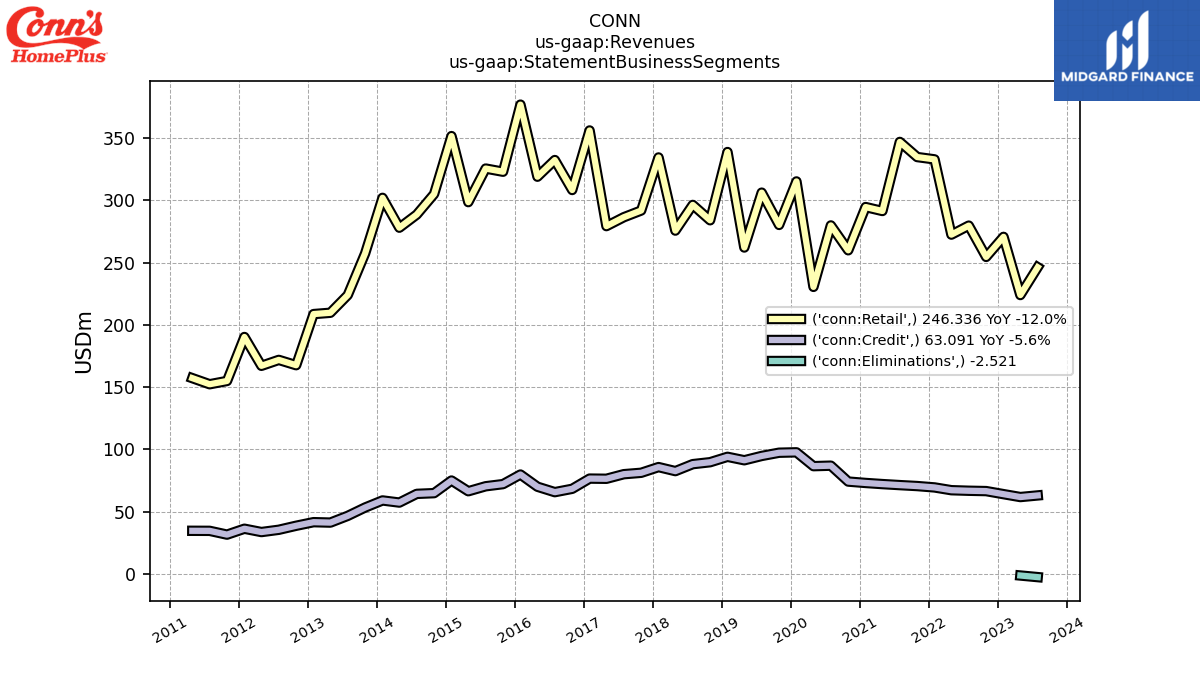
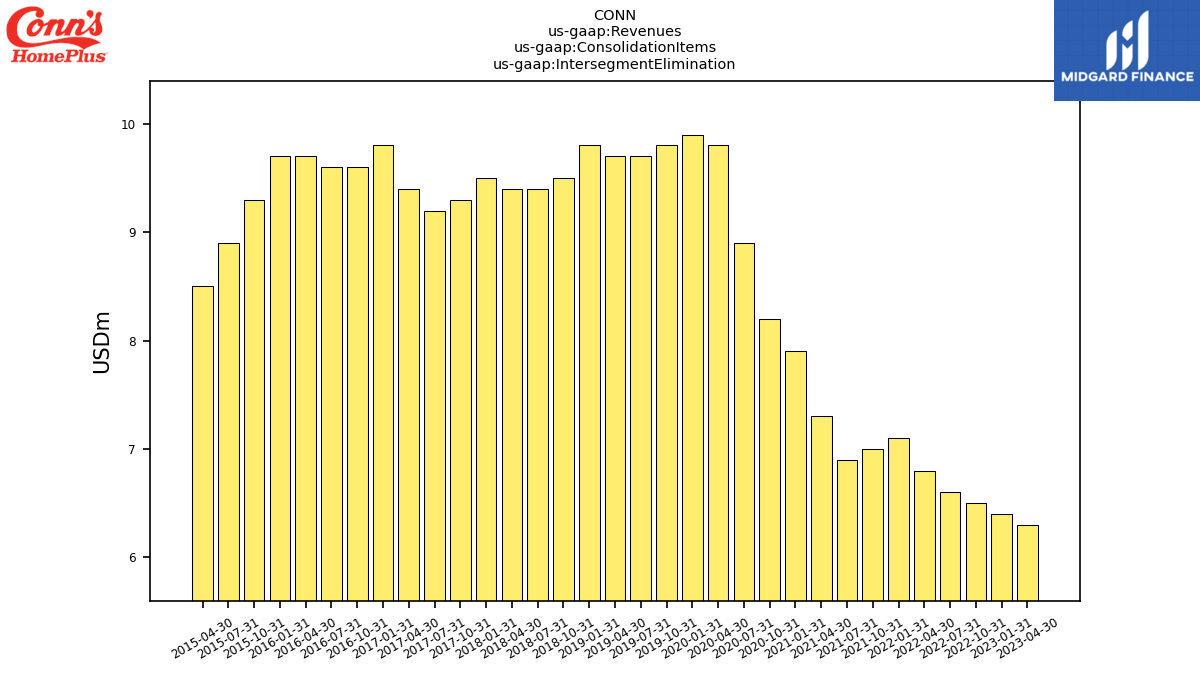
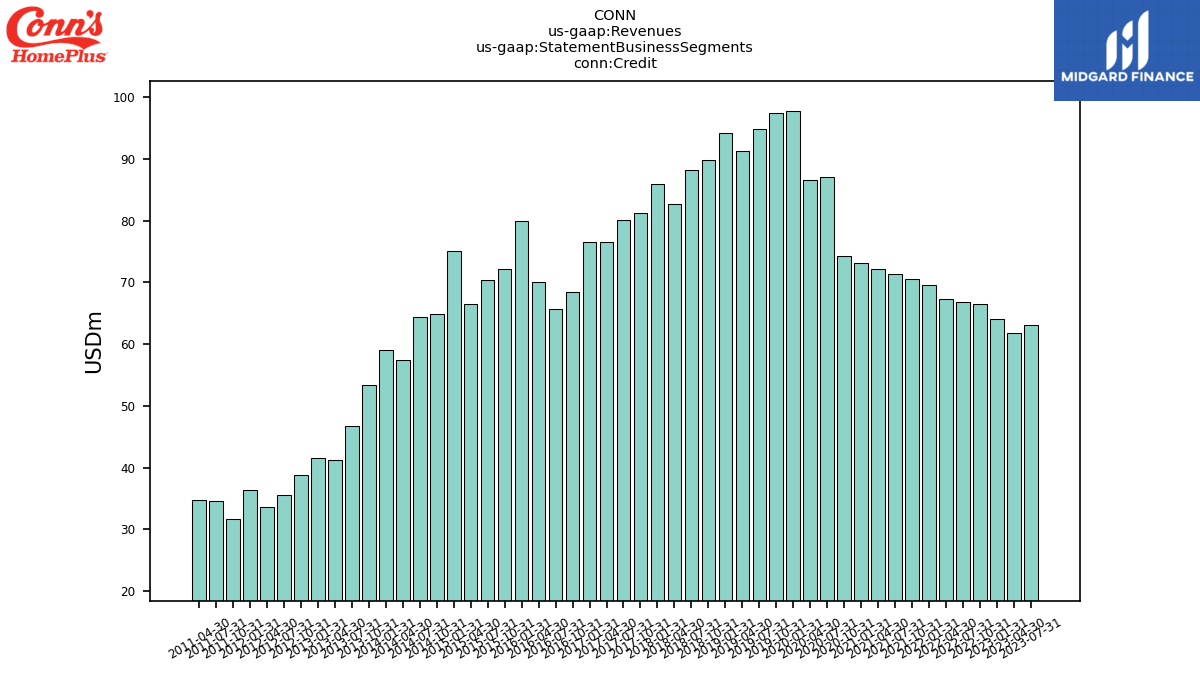
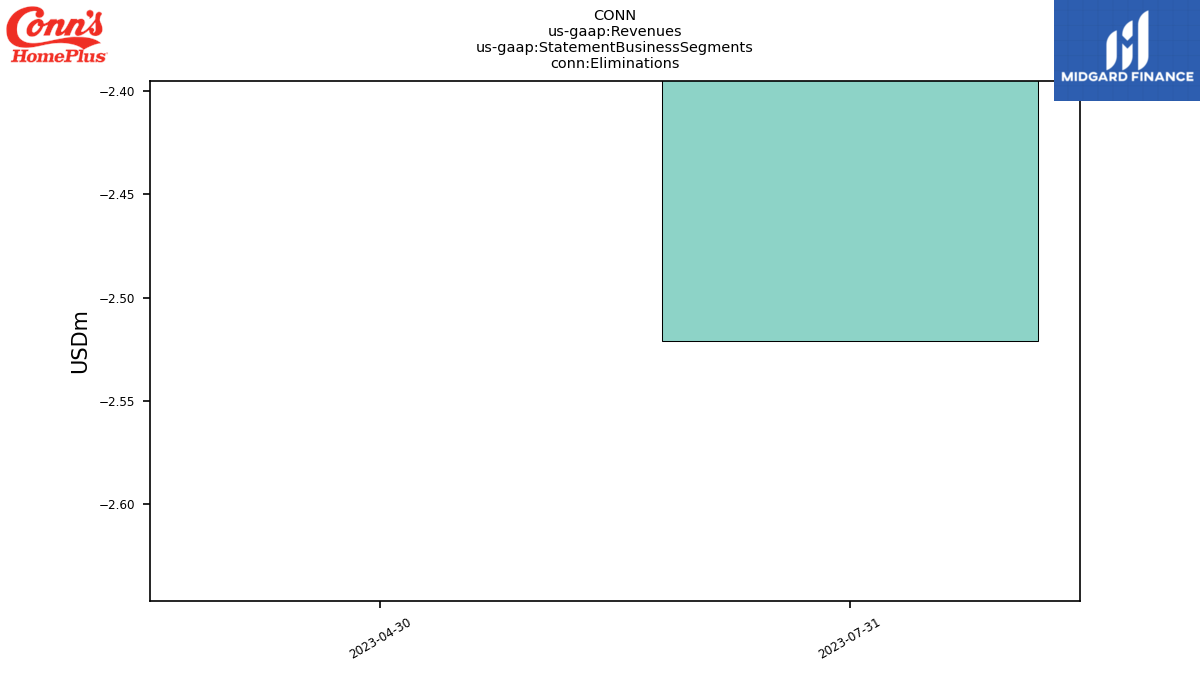
| Revenues | 306.91 | 284.57 | 334.88 | 321.20 | 346.63 | 339.82 | 402.49 | 405.46 | 418.38 | 363.70 | 367.79 | 334.16 | 366.92 | 317.16 | 412.99 | 377.71 | 401.06 | 353.51 | 432.98 | 373.82 | 384.62 | 358.39 | 420.39 | 373.17 | 366.65 | 355.83 | 432.81 | 376.77 | 398.16 | 389.11 | 456.82 | 395.23 | 396.05 | 365.08 | 426.75 | 370.06 | 352.96 | 335.45 | 361.14 | 310.88 | 270.69 | 251.06 | 250.34 | 206.40 | 207.44 | 200.85 | 226.67 | 179.54 | 184.38 | 191.98 | 227.36 | 170.56 | 213.12 | |
| Intersegment Elimination | NA | 6.30 | 6.40 | 6.50 | 6.60 | 6.80 | 7.10 | 7.00 | 6.90 | 7.30 | 7.90 | 8.20 | 8.90 | 9.80 | 9.90 | 9.80 | 9.70 | 9.70 | 9.80 | 9.50 | 9.40 | 9.40 | 9.50 | 9.30 | 9.20 | 9.40 | 9.80 | 9.60 | 9.60 | 9.70 | 9.70 | 9.30 | 8.90 | 8.50 | NA | NA | NA | NA | NA | NA | NA | NA | NA | NA | NA | NA | NA | NA | NA | NA | NA | NA | NA | |
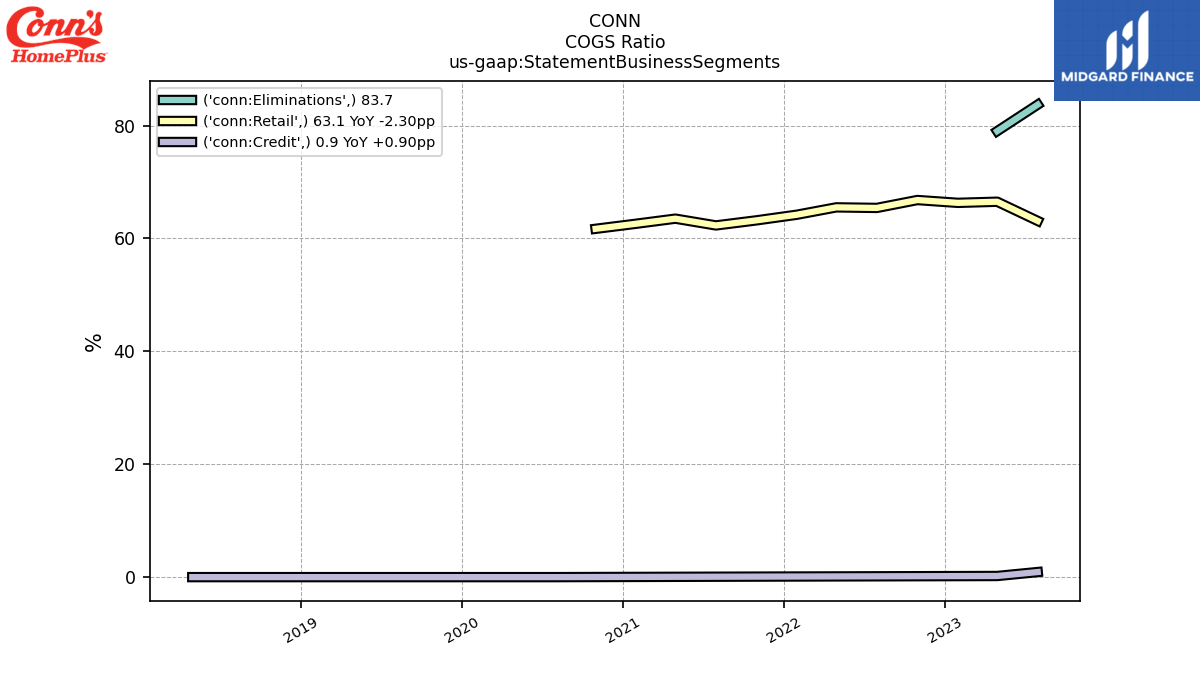
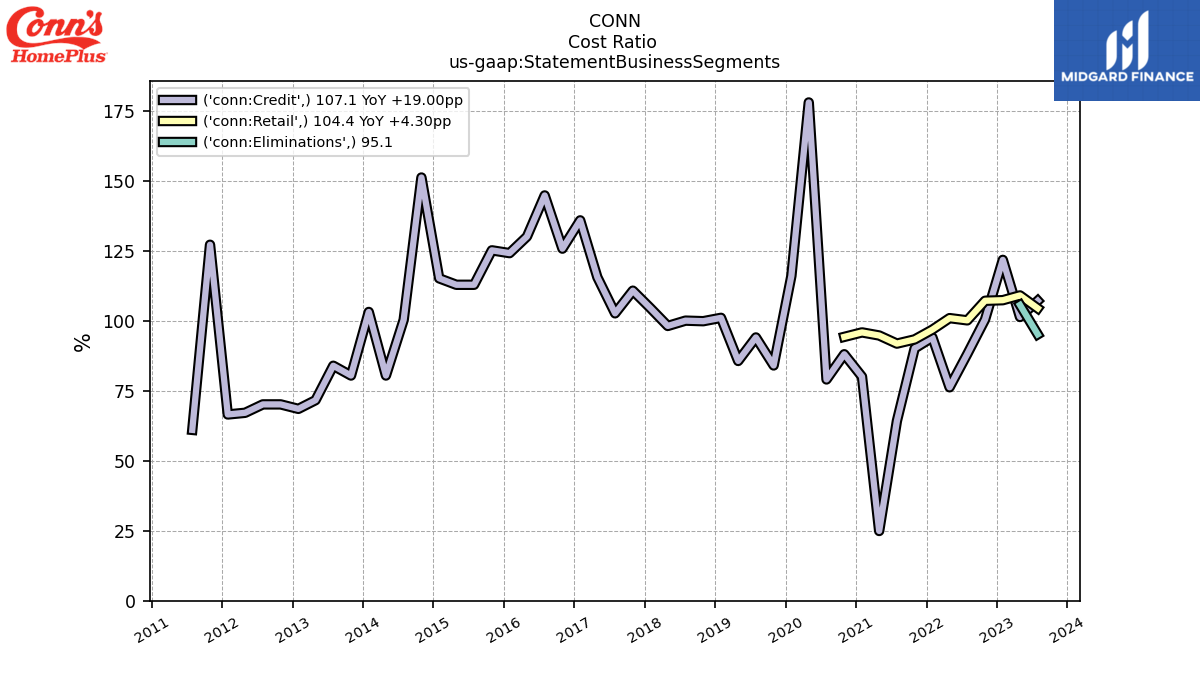
| Credit | 63.09 | 61.79 | 64.11 | 66.57 | 66.85 | 67.29 | 69.51 | 70.61 | 71.37 | 72.20 | 73.10 | 74.22 | 86.98 | 86.59 | 97.71 | 97.39 | 94.79 | 91.33 | 94.09 | 89.77 | 88.21 | 82.62 | 85.85 | 81.27 | 80.14 | 76.46 | 76.61 | 68.40 | 65.72 | 70.08 | 79.87 | 72.18 | 70.44 | 66.45 | 75.06 | 64.92 | 64.34 | 57.35 | 59.05 | 53.39 | 46.69 | 41.28 | 41.61 | 38.74 | 35.51 | 33.67 | 36.34 | 31.61 | 34.65 | 34.69 | NA | NA | NA | |
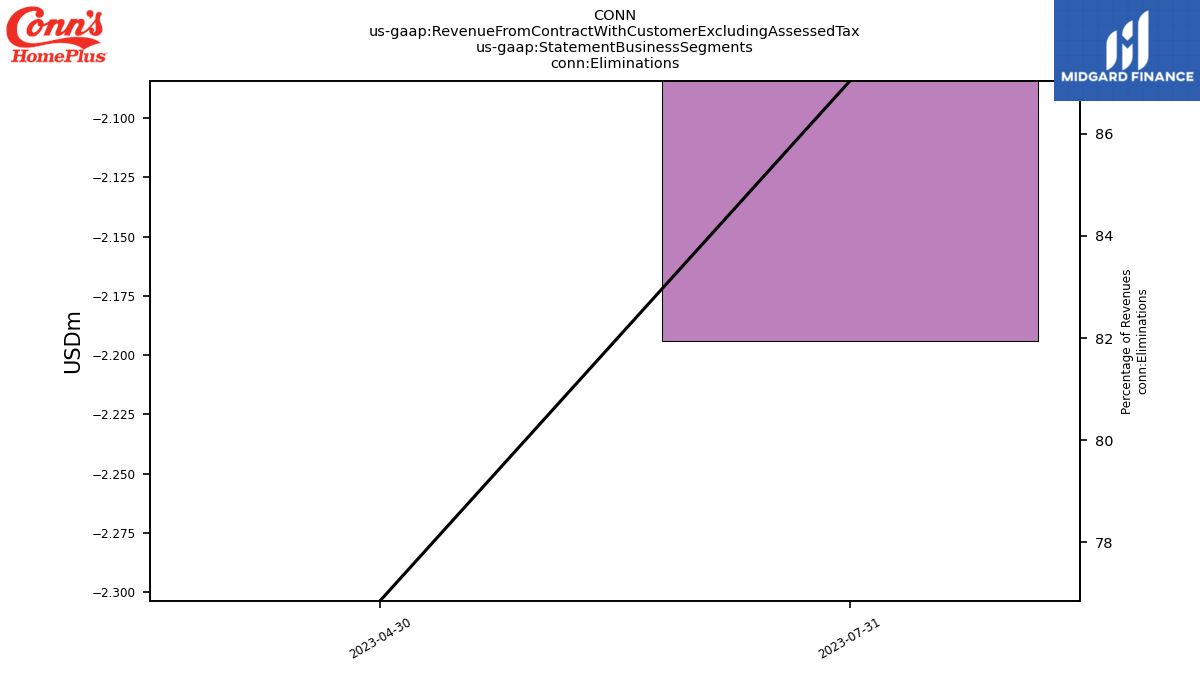
| Eliminations | -2.52 | -1.22 | NA | NA | NA | NA | NA | NA | NA | NA | NA | NA | NA | NA | NA | NA | NA | NA | NA | NA | NA | NA | NA | NA | NA | NA | NA | NA | NA | NA | NA | NA | NA | NA | NA | NA | NA | NA | NA | NA | NA | NA | NA | NA | NA | NA | NA | NA | NA | NA | NA | NA | NA | |
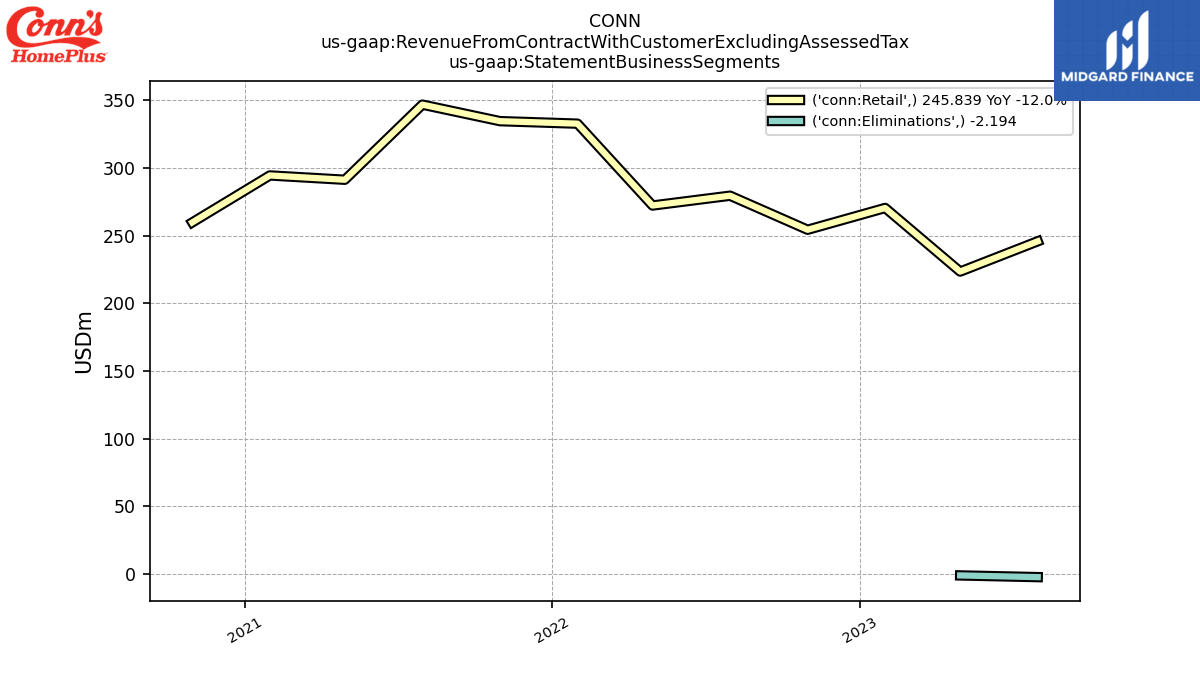
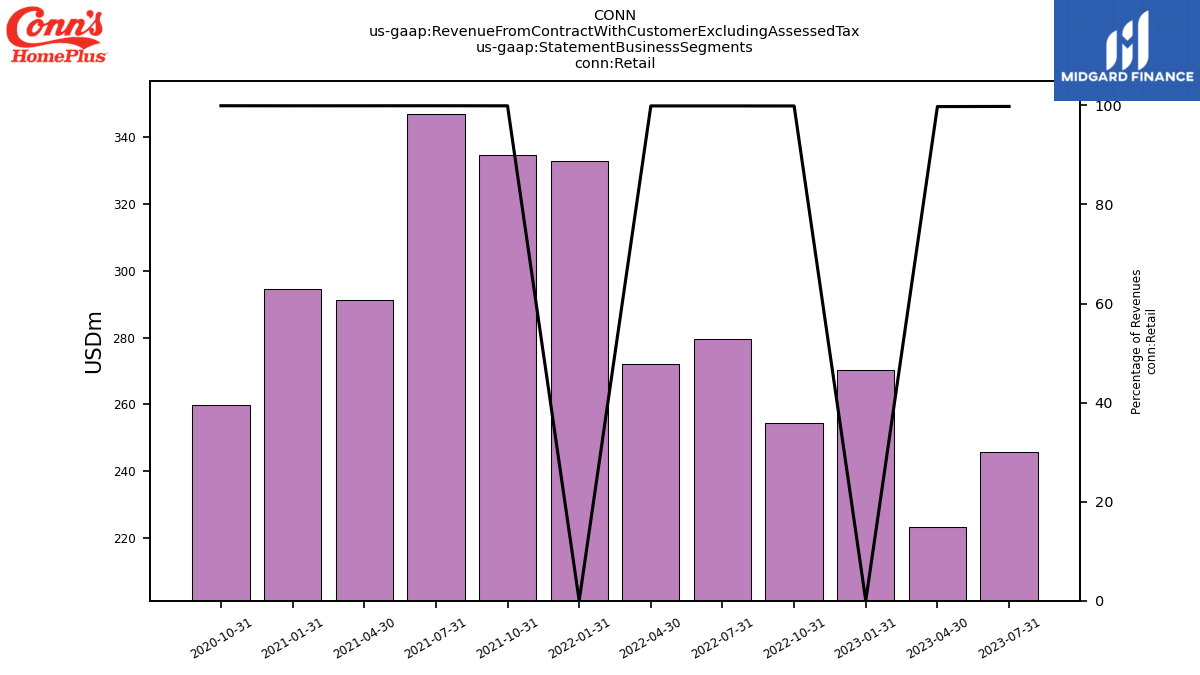
| Retail | 246.34 | 224.01 | 270.76 | 254.63 | 279.79 | 272.54 | 332.98 | 334.85 | 347.01 | 291.50 | 294.69 | 259.94 | 279.93 | 230.56 | 315.28 | 280.32 | 306.26 | 262.18 | 338.89 | 284.05 | 296.41 | 275.77 | 334.54 | 291.90 | 286.50 | 279.37 | 356.20 | 308.37 | 332.44 | 319.04 | 376.94 | 323.05 | 325.61 | 298.63 | 351.68 | 305.14 | 288.62 | 278.10 | 302.09 | 257.48 | 224.00 | 209.79 | 208.73 | 167.66 | 171.93 | 167.18 | 190.33 | 155.02 | 152.38 | 157.29 | NA | NA | NA | |
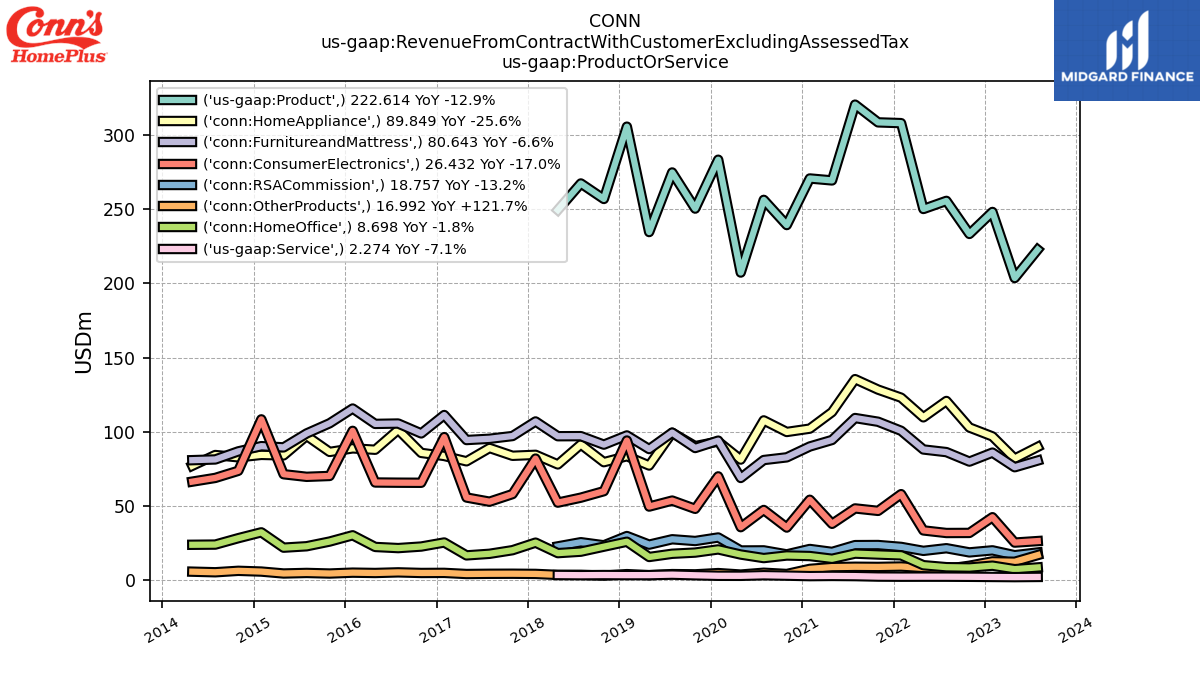
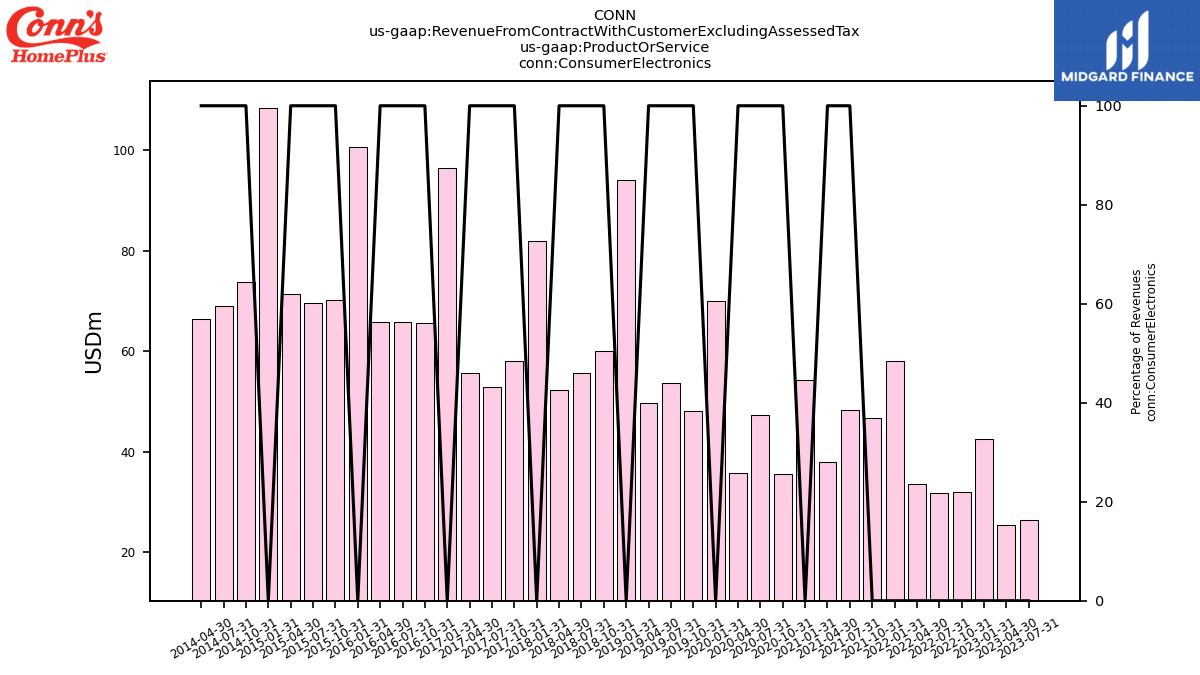
| Revenue From Contract With Customer Excluding Assessed Tax | 243.65 | 222.55 | 270.46 | 254.36 | 279.51 | 272.26 | 332.73 | 334.58 | 346.79 | 291.30 | 367.79 | 259.77 | 366.92 | 317.16 | 412.99 | 377.71 | 401.06 | 353.51 | 432.98 | 373.82 | 384.62 | 358.39 | 420.39 | 373.17 | 366.65 | 355.83 | 432.81 | 376.77 | 398.16 | 389.11 | 456.82 | 395.23 | 396.05 | 365.08 | 426.75 | 370.06 | 352.96 | 335.45 | 361.14 | 310.88 | 270.69 | 251.06 | 250.34 | 206.40 | 207.44 | 200.85 | 226.67 | 179.54 | 184.38 | 191.98 | 227.36 | 170.56 | 213.12 | |
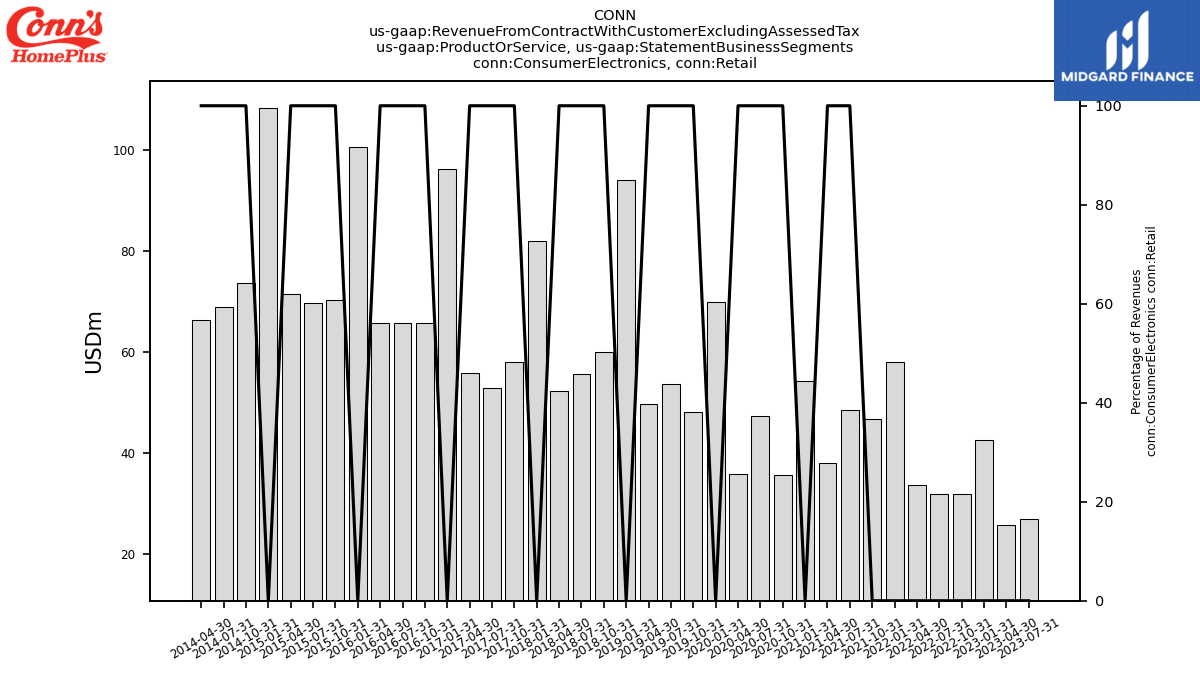
| Consumer Electronics | 26.43 | 25.40 | 42.49 | 31.91 | 31.86 | 33.60 | 58.03 | 46.75 | 48.41 | 38.04 | 54.26 | 35.52 | 47.38 | 35.78 | 70.00 | 48.11 | 53.69 | 49.65 | 94.12 | 60.01 | 55.65 | 52.30 | 81.97 | 58.06 | 52.95 | 55.75 | 96.42 | 65.67 | 65.73 | 65.86 | 100.63 | 70.26 | 69.68 | 71.43 | 108.37 | 73.72 | 68.94 | 66.44 | NA | NA | NA | NA | NA | NA | NA | NA | NA | NA | NA | NA | NA | NA | NA | |
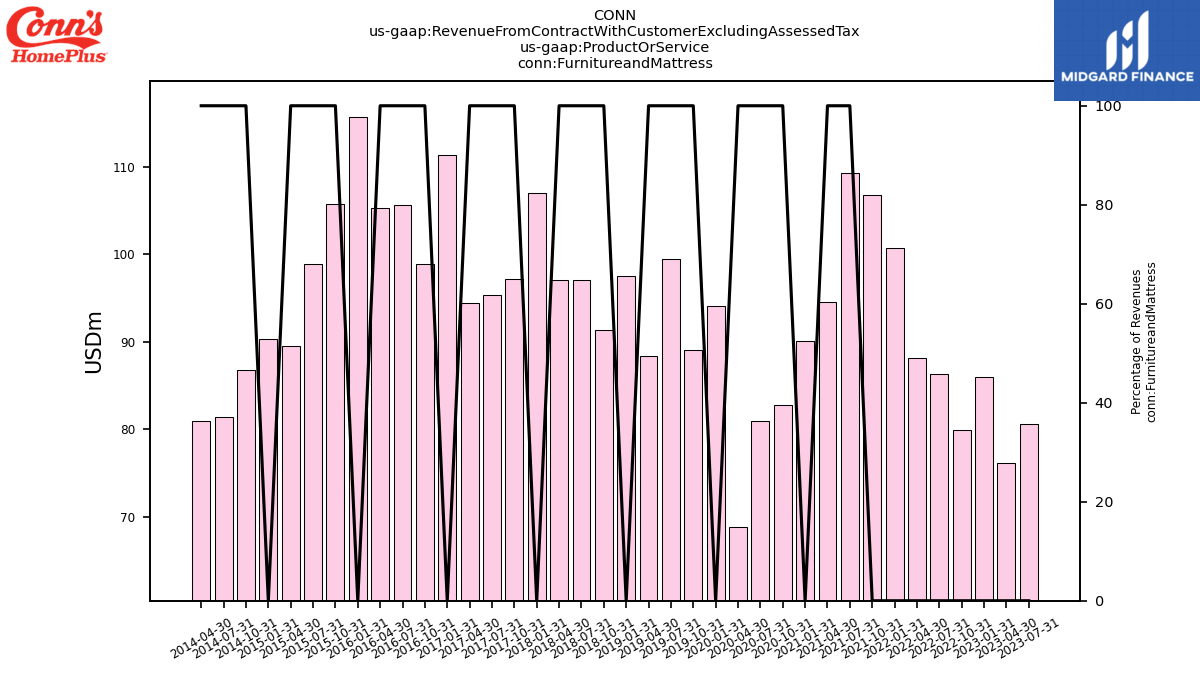
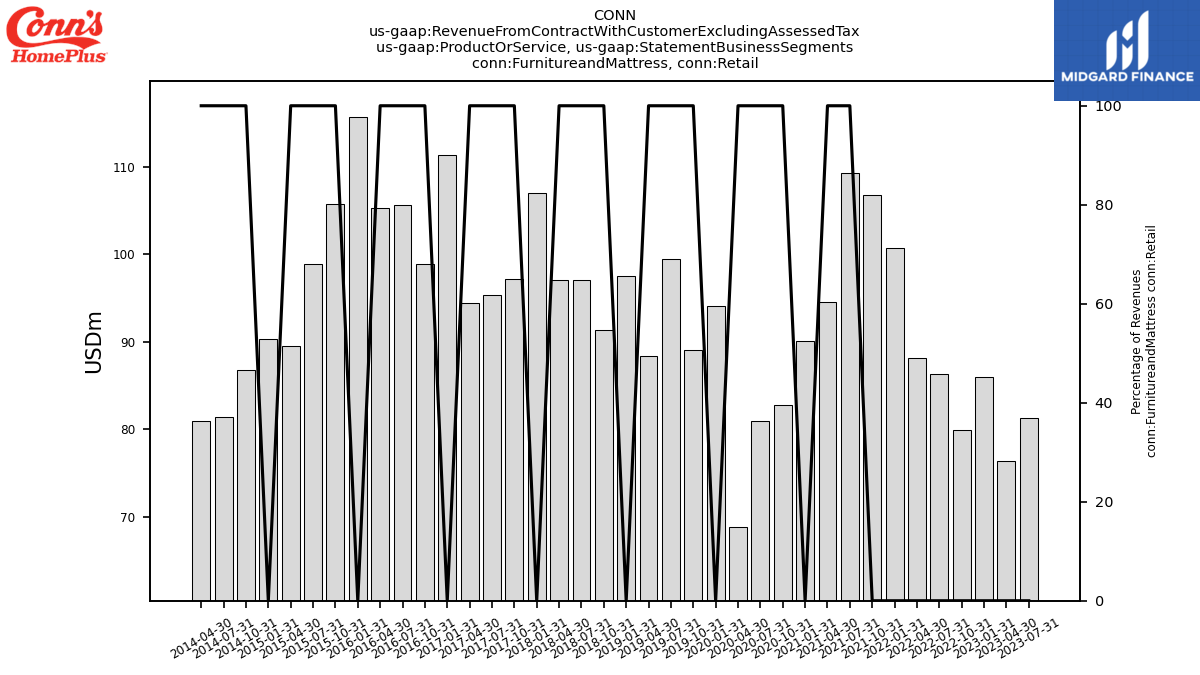
| Furnitureand Mattress | 80.64 | 76.13 | 85.98 | 79.93 | 86.32 | 88.09 | 100.66 | 106.76 | 109.26 | 94.49 | 90.10 | 82.79 | 80.98 | 68.89 | 94.04 | 89.07 | 99.45 | 88.36 | 97.55 | 91.34 | 97.07 | 97.02 | 106.97 | 97.15 | 95.30 | 94.44 | 111.29 | 98.90 | 105.56 | 105.31 | 115.67 | 105.73 | 98.88 | 89.50 | 90.33 | 86.82 | 81.37 | 80.89 | NA | NA | NA | NA | NA | NA | NA | NA | NA | NA | NA | NA | NA | NA | NA | |
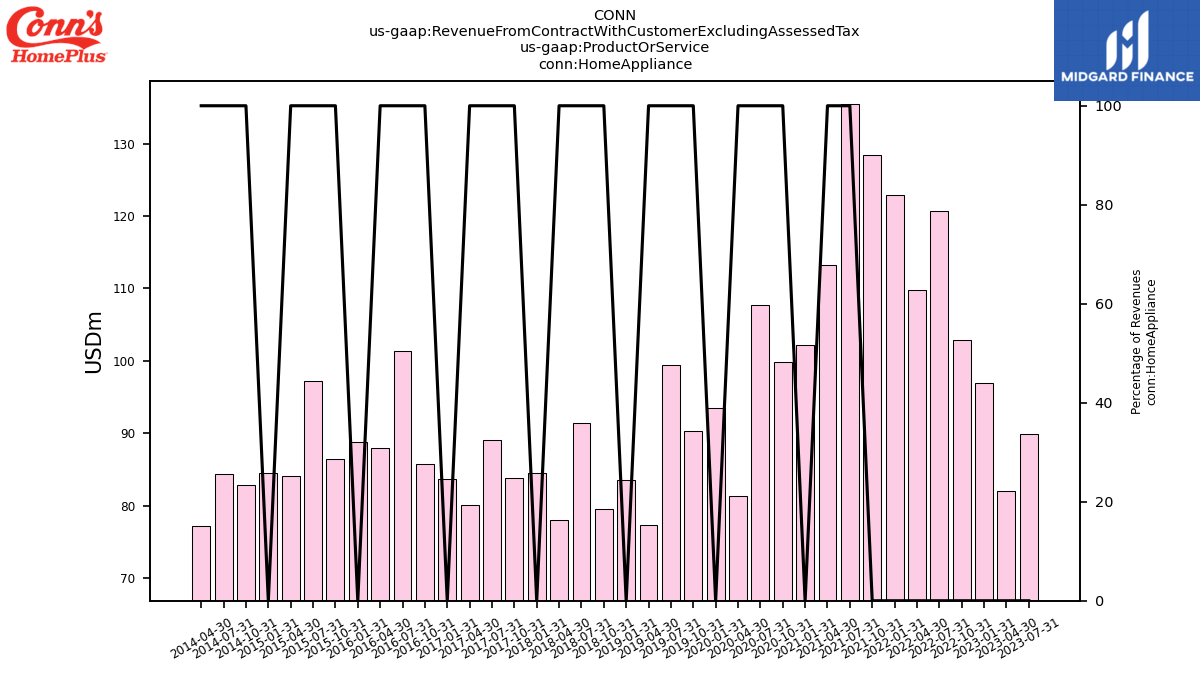
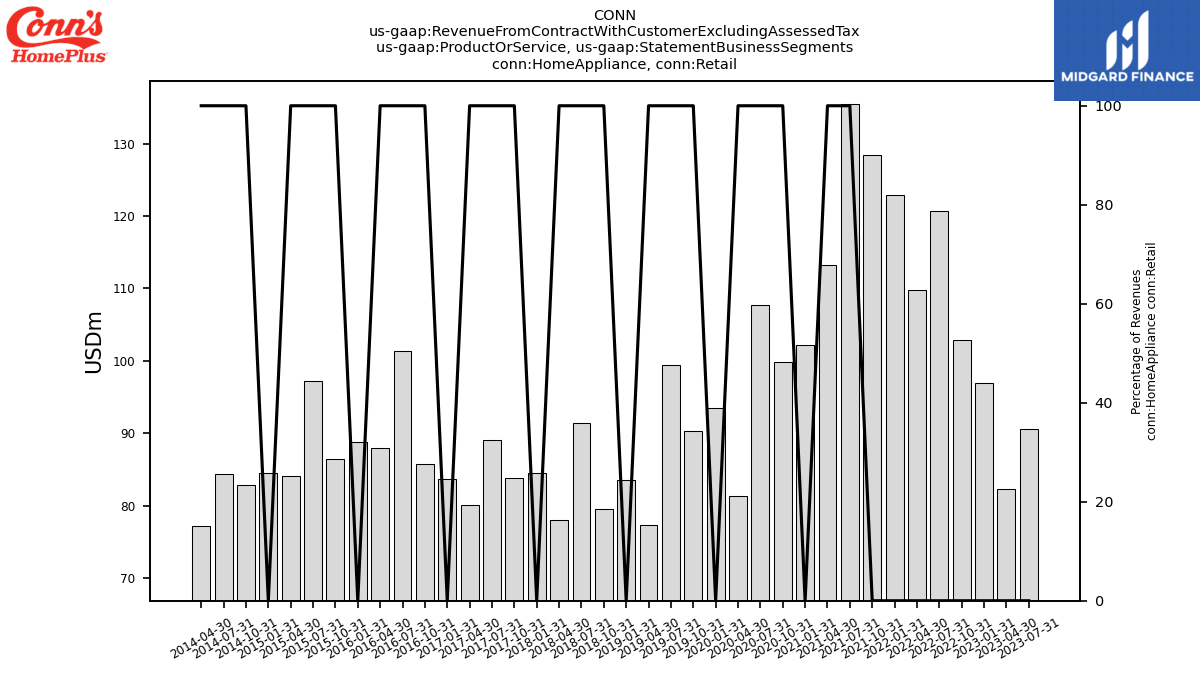
| Home Appliance | 89.85 | 81.95 | 96.89 | 102.88 | 120.75 | 109.73 | 122.96 | 128.38 | 135.44 | 113.26 | 102.12 | 99.87 | 107.68 | 81.28 | 93.45 | 90.34 | 99.36 | 77.29 | 83.57 | 79.54 | 91.47 | 78.02 | 84.49 | 83.84 | 89.08 | 80.12 | 83.72 | 85.78 | 101.36 | 87.90 | 88.84 | 86.43 | 97.26 | 84.10 | 84.46 | 82.81 | 84.36 | 77.11 | NA | NA | NA | NA | NA | NA | NA | NA | NA | NA | NA | NA | NA | NA | NA | |
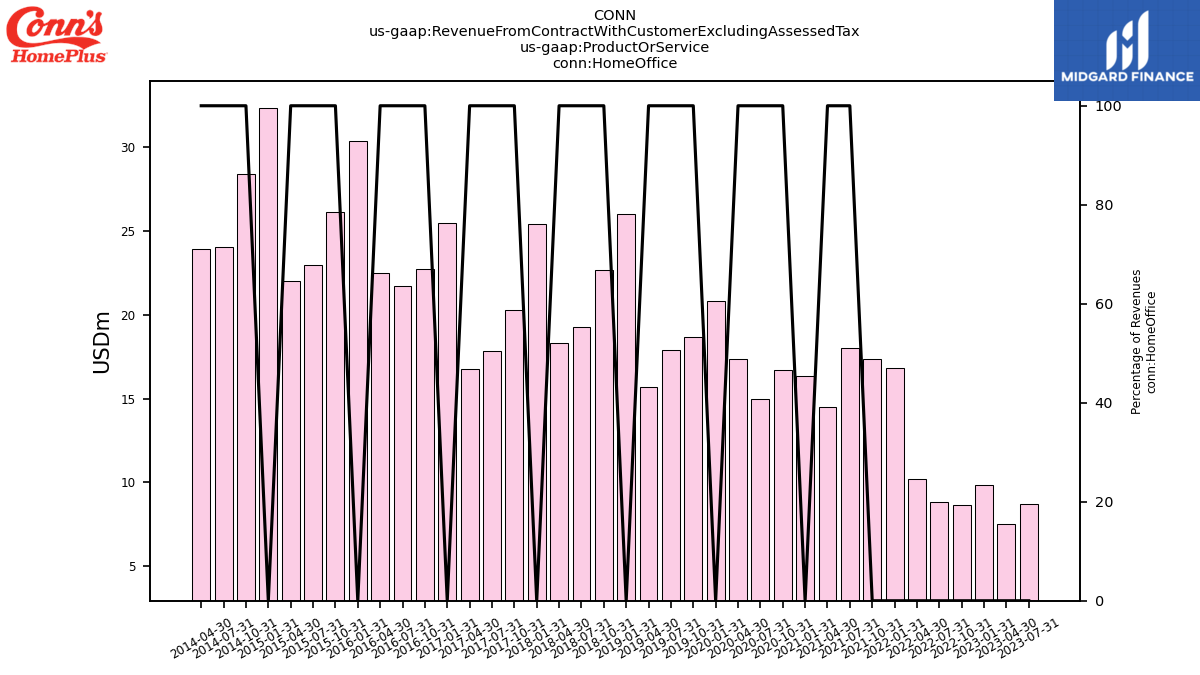
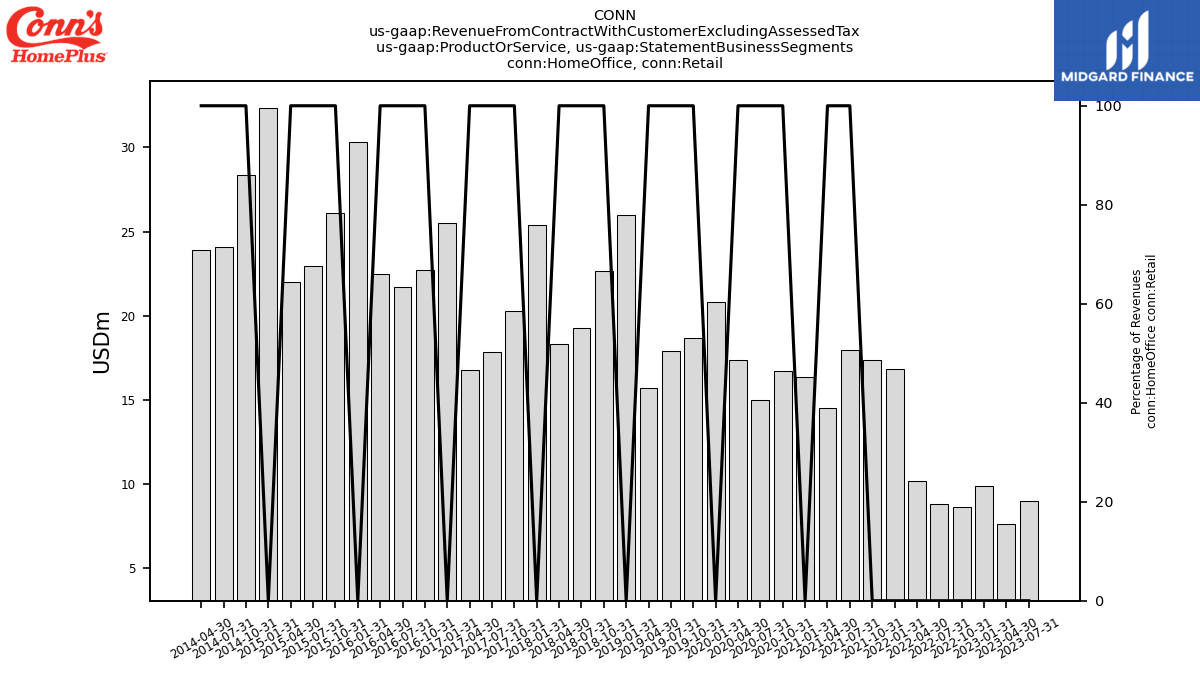
| Home Office | 8.70 | 7.50 | 9.87 | 8.63 | 8.86 | 10.19 | 16.83 | 17.37 | 17.99 | 14.52 | 16.35 | 16.71 | 14.98 | 17.37 | 20.80 | 18.68 | 17.88 | 15.71 | 26.00 | 22.66 | 19.29 | 18.31 | 25.39 | 20.30 | 17.86 | 16.79 | 25.48 | 22.75 | 21.70 | 22.47 | 30.33 | 26.11 | 22.94 | 21.98 | 32.32 | 28.38 | 24.06 | 23.94 | NA | NA | NA | NA | NA | NA | NA | NA | NA | NA | NA | NA | NA | NA | NA | |
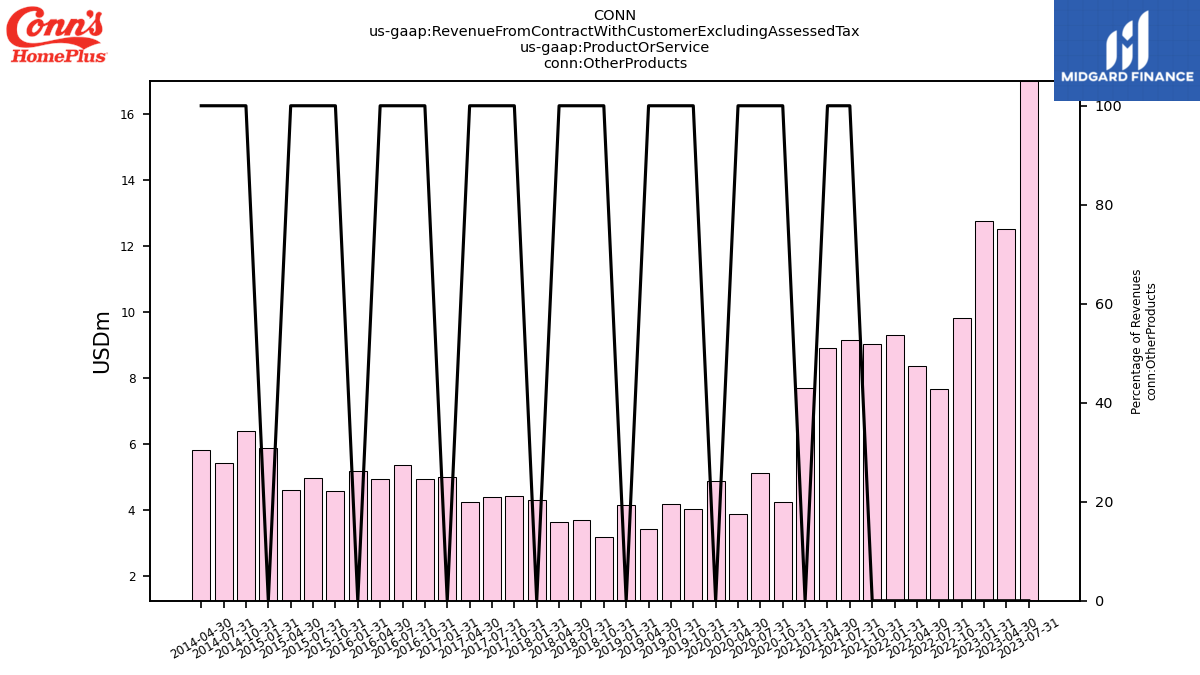
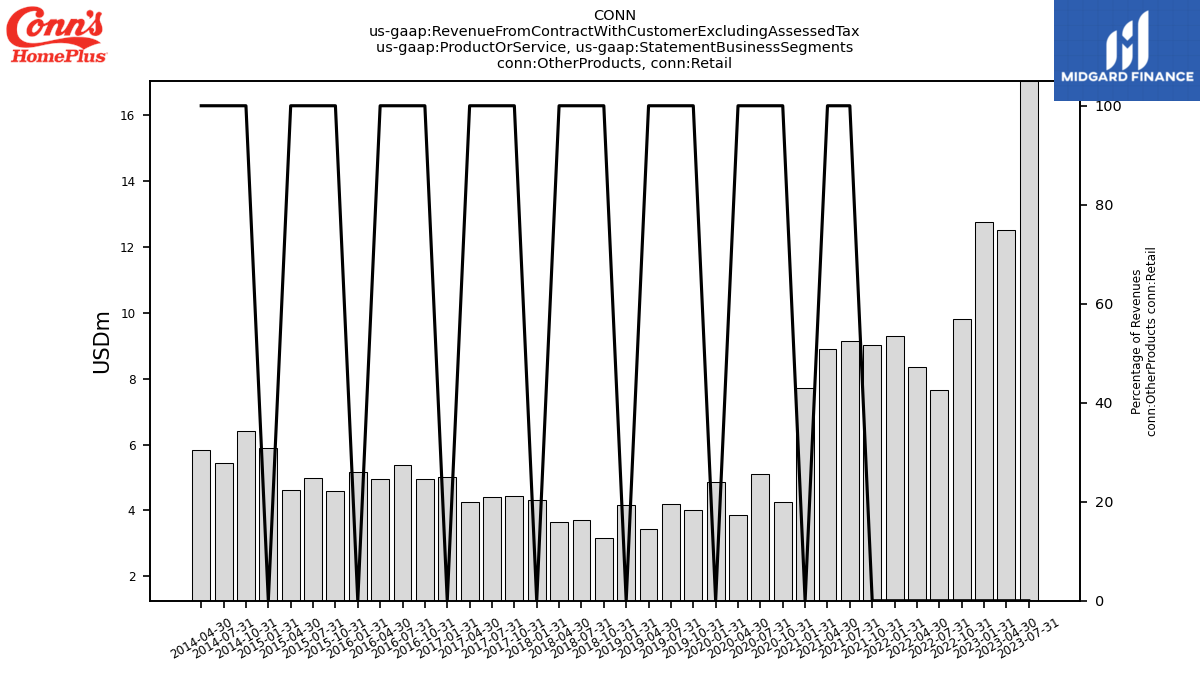
| Other Products | 16.99 | 12.50 | 12.76 | 9.82 | 7.66 | 8.36 | 9.31 | 9.04 | 9.14 | 8.90 | 7.71 | 4.26 | 5.11 | 3.88 | 4.88 | 4.03 | 4.19 | 3.44 | 4.17 | 3.18 | 3.70 | 3.66 | 4.32 | 4.45 | 4.40 | 4.26 | 5.02 | 4.96 | 5.37 | 4.94 | 5.17 | 4.58 | 4.97 | 4.61 | 5.90 | 6.41 | 5.43 | 5.83 | NA | NA | NA | NA | NA | NA | NA | NA | NA | NA | NA | NA | NA | NA | NA | |
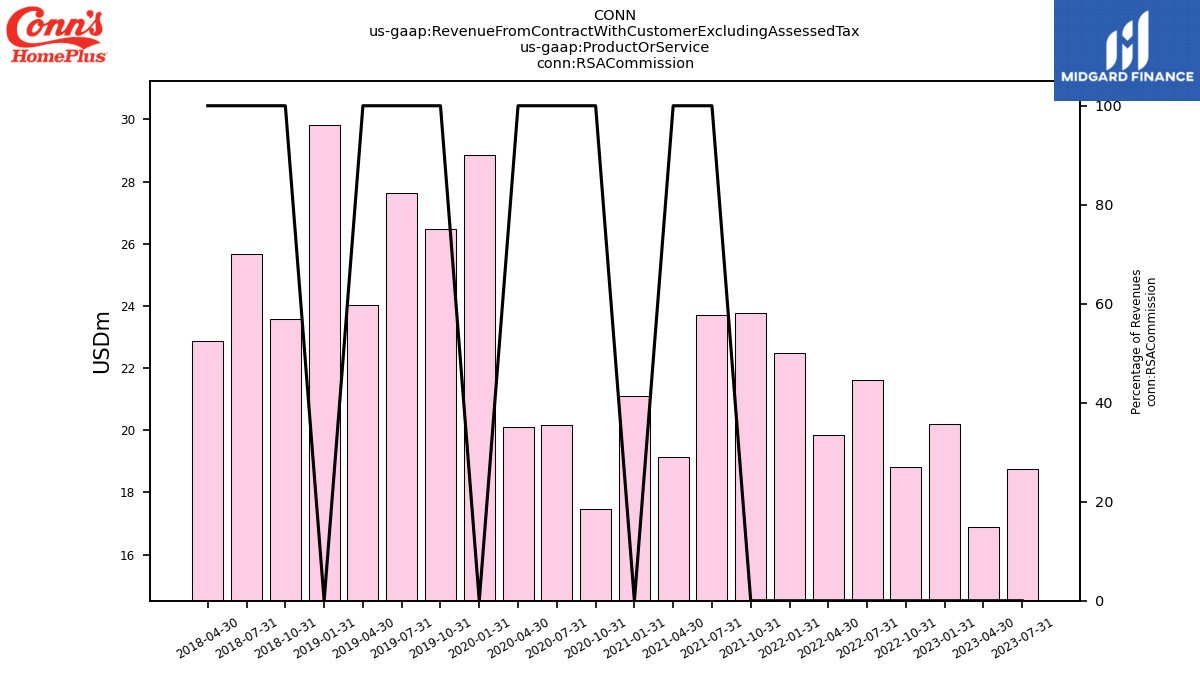
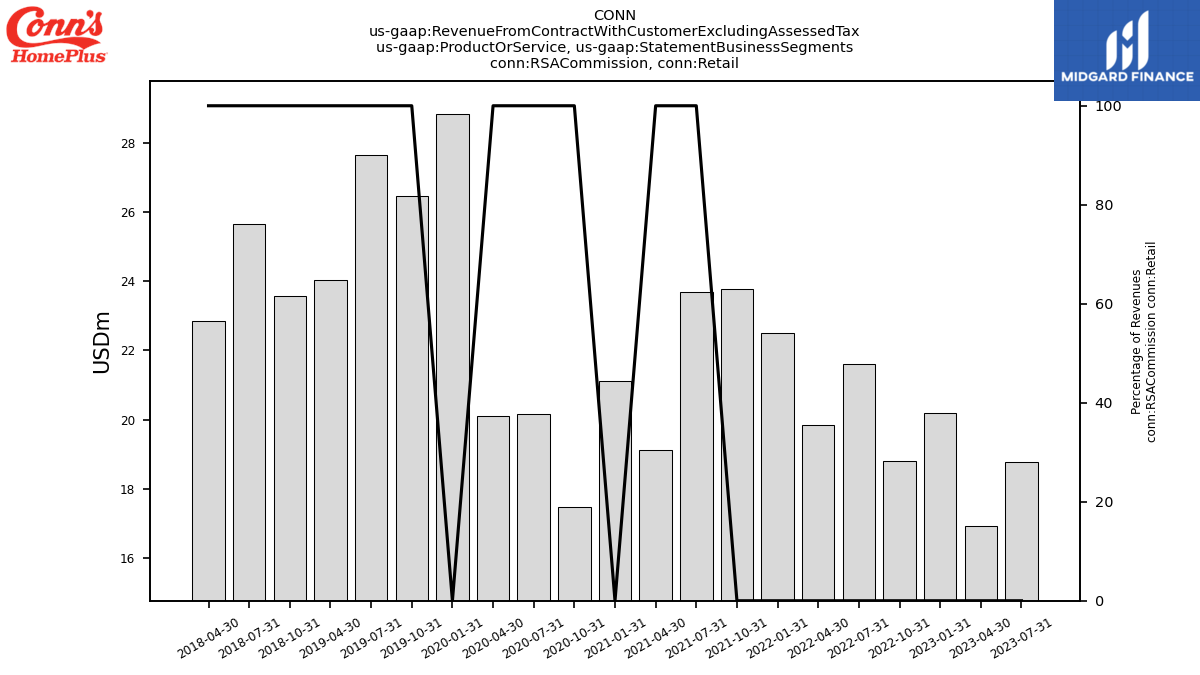
| R S A Commission | 18.76 | 16.91 | 20.19 | 18.80 | 21.61 | 19.84 | 22.50 | 23.77 | 23.70 | 19.13 | 21.11 | 17.46 | 20.16 | 20.10 | 28.85 | 26.48 | 27.65 | 24.02 | 29.82 | 23.58 | 25.66 | 22.86 | NA | NA | NA | NA | NA | NA | NA | NA | NA | NA | NA | NA | NA | NA | NA | NA | NA | NA | NA | NA | NA | NA | NA | NA | NA | NA | NA | NA | NA | NA | NA | |
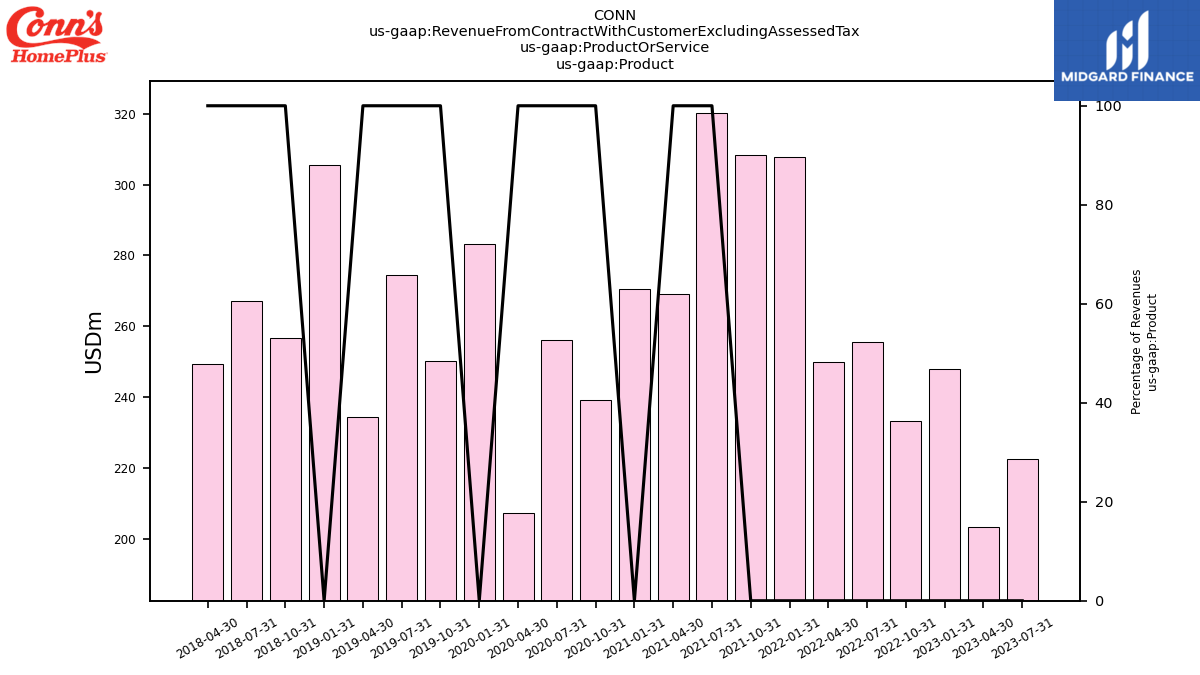
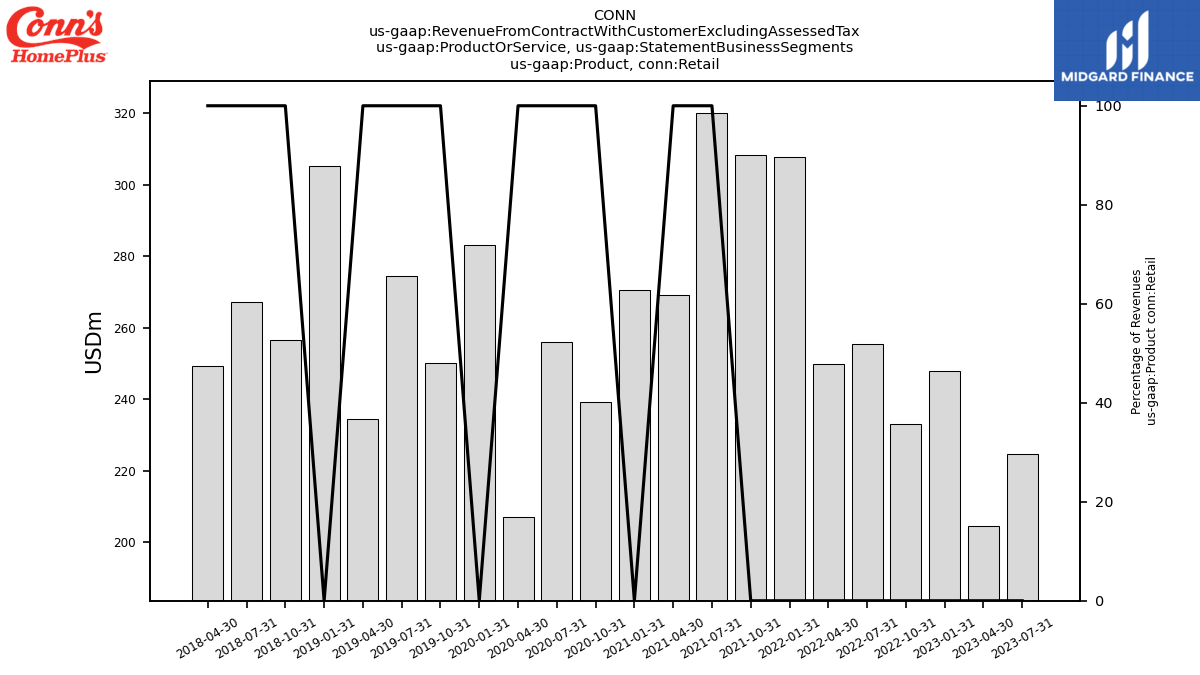
| Product | 222.61 | 203.48 | 248.00 | 233.18 | 255.45 | 249.97 | 307.79 | 308.30 | 320.25 | 269.21 | 270.53 | 239.16 | 256.14 | 207.20 | 283.17 | 250.23 | 274.58 | 234.44 | 305.41 | 256.73 | 267.18 | 249.31 | NA | NA | NA | NA | NA | NA | NA | NA | NA | NA | NA | NA | NA | NA | NA | NA | NA | NA | NA | NA | NA | NA | NA | NA | NA | NA | NA | NA | NA | NA | NA | |
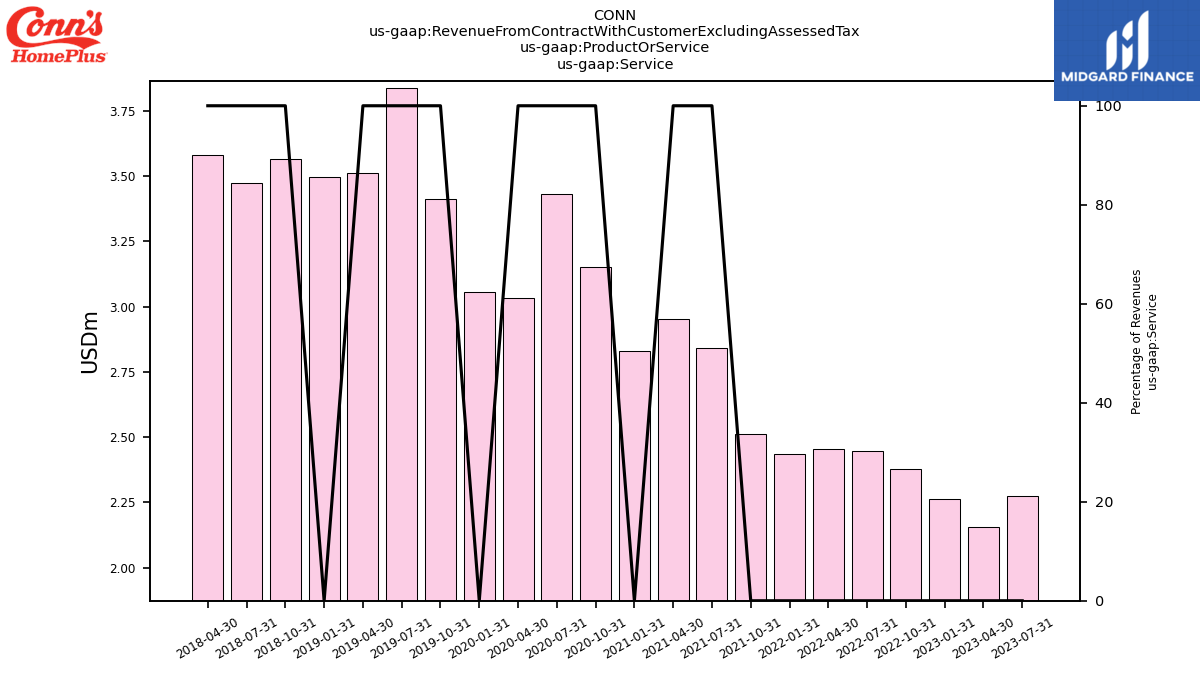
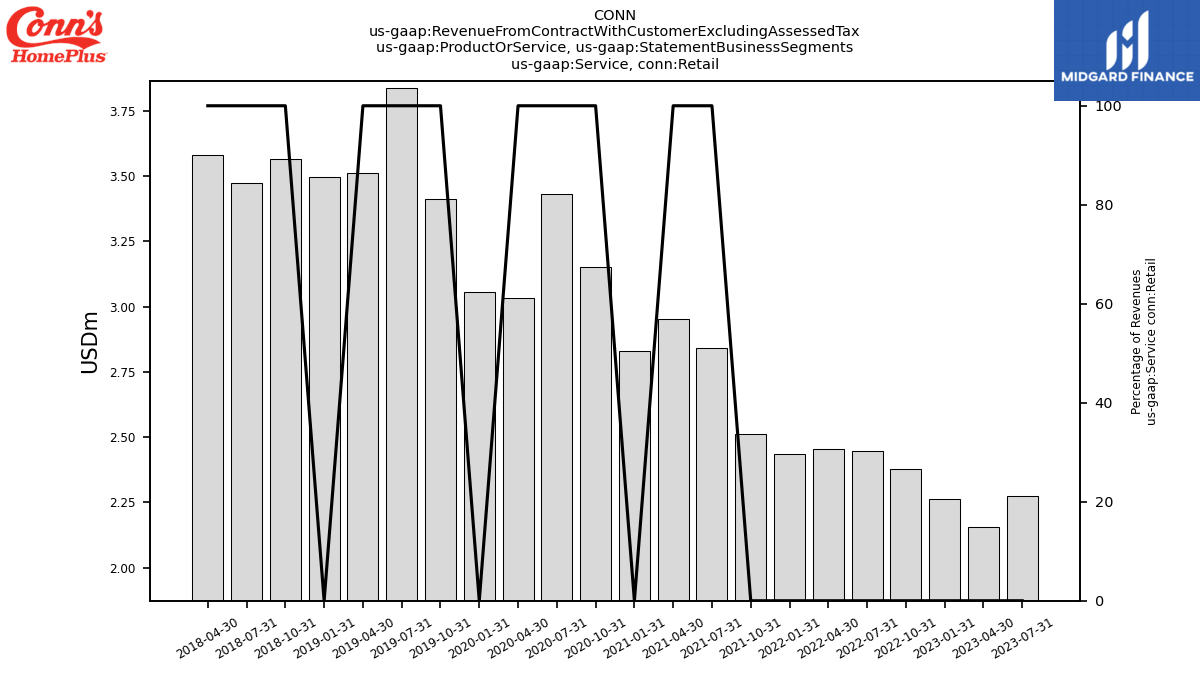
| Service | 2.27 | 2.16 | 2.27 | 2.38 | 2.45 | 2.46 | 2.44 | 2.51 | 2.84 | 2.95 | 2.83 | 3.15 | 3.43 | 3.03 | 3.06 | 3.41 | 3.84 | 3.51 | 3.50 | 3.56 | 3.47 | 3.58 | NA | NA | NA | NA | NA | NA | NA | NA | NA | NA | NA | NA | NA | NA | NA | NA | NA | NA | NA | NA | NA | NA | NA | NA | NA | NA | NA | NA | NA | NA | NA | |
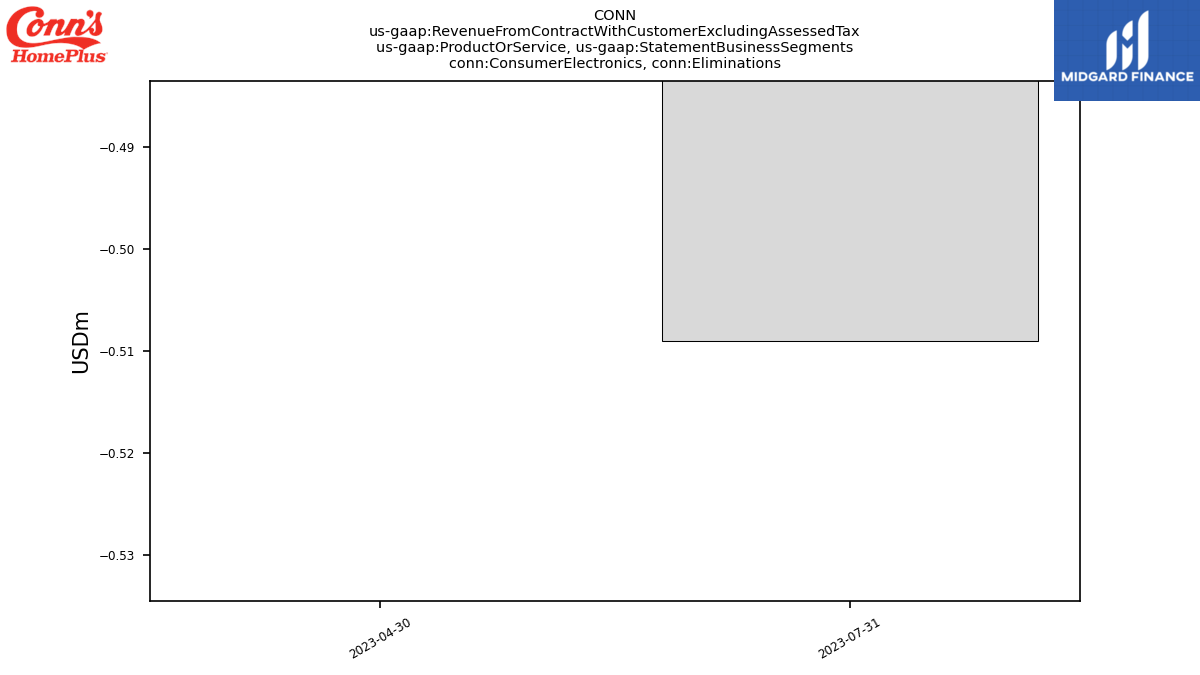
| Consumer Electronics, Eliminations | -0.51 | -0.25 | NA | NA | NA | NA | NA | NA | NA | NA | NA | NA | NA | NA | NA | NA | NA | NA | NA | NA | NA | NA | NA | NA | NA | NA | NA | NA | NA | NA | NA | NA | NA | NA | NA | NA | NA | NA | NA | NA | NA | NA | NA | NA | NA | NA | NA | NA | NA | NA | NA | NA | NA | |
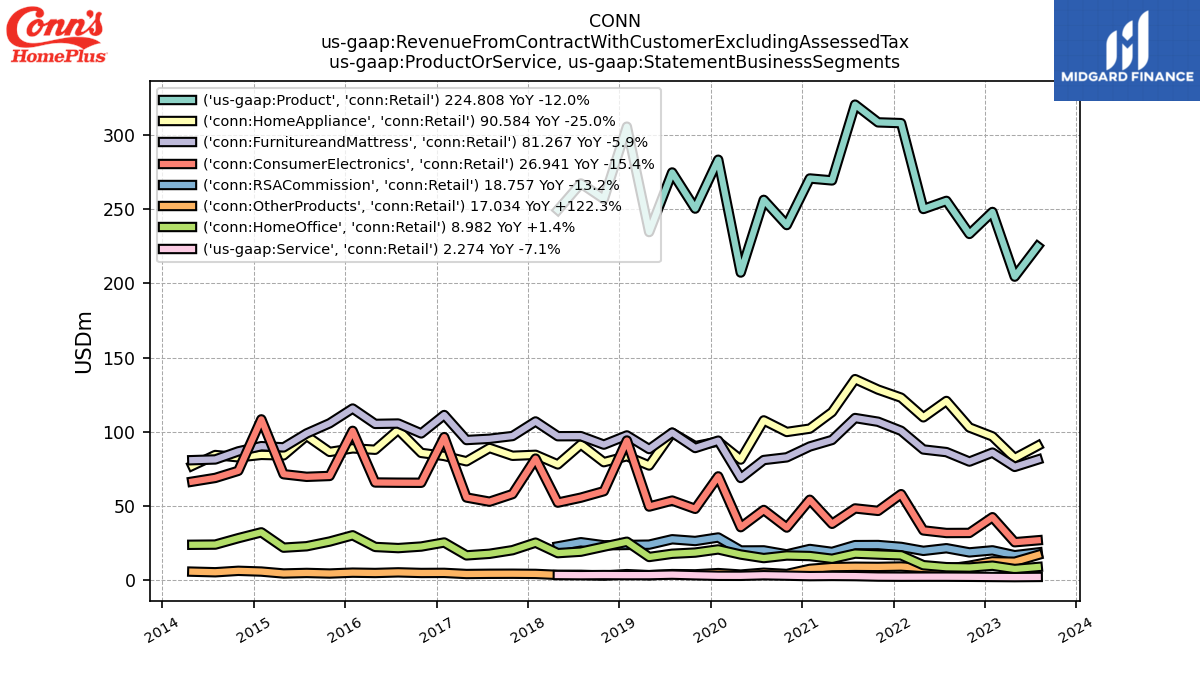
| Consumer Electronics, Retail | 26.94 | 25.65 | 42.49 | 31.91 | 31.86 | 33.60 | 58.03 | 46.75 | 48.41 | 38.04 | 54.26 | 35.52 | 47.38 | 35.78 | 70.00 | 48.11 | 53.69 | 49.65 | 94.12 | 60.01 | 55.65 | 52.30 | 81.97 | 58.06 | 52.95 | 55.75 | 96.42 | 65.67 | 65.73 | 65.86 | 100.63 | 70.26 | 69.68 | 71.43 | 108.37 | 73.72 | 68.94 | 66.44 | NA | NA | NA | NA | NA | NA | NA | NA | NA | NA | NA | NA | NA | NA | NA | |
| Furnitureand Mattress, Eliminations | -0.62 | -0.24 | NA | NA | NA | NA | NA | NA | NA | NA | NA | NA | NA | NA | NA | NA | NA | NA | NA | NA | NA | NA | NA | NA | NA | NA | NA | NA | NA | NA | NA | NA | NA | NA | NA | NA | NA | NA | NA | NA | NA | NA | NA | NA | NA | NA | NA | NA | NA | NA | NA | NA | NA | |
| Furnitureand Mattress, Retail | 81.27 | 76.37 | 85.98 | 79.93 | 86.32 | 88.09 | 100.66 | 106.76 | 109.26 | 94.49 | 90.10 | 82.79 | 80.98 | 68.89 | 94.04 | 89.07 | 99.45 | 88.36 | 97.55 | 91.34 | 97.07 | 97.02 | 106.97 | 97.15 | 95.30 | 94.44 | 111.29 | 98.90 | 105.56 | 105.31 | 115.67 | 105.73 | 98.88 | 89.50 | 90.33 | 86.82 | 81.37 | 80.89 | NA | NA | NA | NA | NA | NA | NA | NA | NA | NA | NA | NA | NA | NA | NA | |
| Home Appliance, Eliminations | -0.73 | -0.31 | NA | NA | NA | NA | NA | NA | NA | NA | NA | NA | NA | NA | NA | NA | NA | NA | NA | NA | NA | NA | NA | NA | NA | NA | NA | NA | NA | NA | NA | NA | NA | NA | NA | NA | NA | NA | NA | NA | NA | NA | NA | NA | NA | NA | NA | NA | NA | NA | NA | NA | NA | |
| Home Appliance, Retail | 90.58 | 82.27 | 96.89 | 102.88 | 120.75 | 109.73 | 122.96 | 128.38 | 135.44 | 113.26 | 102.12 | 99.87 | 107.68 | 81.28 | 93.45 | 90.34 | 99.36 | 77.29 | 83.57 | 79.54 | 91.47 | 78.02 | 84.49 | 83.84 | 89.08 | 80.12 | 83.72 | 85.78 | 101.36 | 87.90 | 88.84 | 86.43 | 97.26 | 84.10 | 84.46 | 82.81 | 84.36 | 77.11 | NA | NA | NA | NA | NA | NA | NA | NA | NA | NA | NA | NA | NA | NA | NA | |
| Home Office, Eliminations | -0.28 | -0.12 | NA | NA | NA | NA | NA | NA | NA | NA | NA | NA | NA | NA | NA | NA | NA | NA | NA | NA | NA | NA | NA | NA | NA | NA | NA | NA | NA | NA | NA | NA | NA | NA | NA | NA | NA | NA | NA | NA | NA | NA | NA | NA | NA | NA | NA | NA | NA | NA | NA | NA | NA | |
| Home Office, Retail | 8.98 | 7.63 | 9.87 | 8.63 | 8.86 | 10.19 | 16.83 | 17.37 | 17.99 | 14.52 | 16.35 | 16.71 | 14.98 | 17.37 | 20.80 | 18.68 | 17.88 | 15.71 | 26.00 | 22.66 | 19.29 | 18.31 | 25.39 | 20.30 | 17.86 | 16.79 | 25.48 | 22.75 | 21.70 | 22.47 | 30.33 | 26.11 | 22.94 | 21.98 | 32.32 | 28.38 | 24.06 | 23.94 | NA | NA | NA | NA | NA | NA | NA | NA | NA | NA | NA | NA | NA | NA | NA | |
| Other Products, Eliminations | -0.04 | -0.02 | NA | NA | NA | NA | NA | NA | NA | NA | NA | NA | NA | NA | NA | NA | NA | NA | NA | NA | NA | NA | NA | NA | NA | NA | NA | NA | NA | NA | NA | NA | NA | NA | NA | NA | NA | NA | NA | NA | NA | NA | NA | NA | NA | NA | NA | NA | NA | NA | NA | NA | NA | |
| Other Products, Retail | 17.03 | 12.52 | 12.76 | 9.82 | 7.66 | 8.36 | 9.31 | 9.04 | 9.14 | 8.90 | 7.71 | 4.26 | 5.11 | 3.88 | 4.88 | 4.03 | 4.19 | 3.44 | 4.17 | 3.18 | 3.70 | 3.66 | 4.32 | 4.45 | 4.40 | 4.26 | 5.02 | 4.96 | 5.37 | 4.94 | 5.17 | 4.58 | 4.97 | 4.61 | 5.90 | 6.41 | 5.43 | 5.83 | NA | NA | NA | NA | NA | NA | NA | NA | NA | NA | NA | NA | NA | NA | NA | |
| R S A Commission, Retail | 18.76 | 16.91 | 20.19 | 18.80 | 21.61 | 19.84 | 22.50 | 23.77 | 23.70 | 19.13 | 21.11 | 17.46 | 20.16 | 20.10 | 28.85 | 26.48 | 27.65 | 24.02 | NA | 23.58 | 25.66 | 22.86 | NA | NA | NA | NA | NA | NA | NA | NA | NA | NA | NA | NA | NA | NA | NA | NA | NA | NA | NA | NA | NA | NA | NA | NA | NA | NA | NA | NA | NA | NA | NA | |
| Product, Eliminations | -2.19 | -0.94 | NA | NA | NA | NA | NA | NA | NA | NA | NA | NA | NA | NA | NA | NA | NA | NA | NA | NA | NA | NA | NA | NA | NA | NA | NA | NA | NA | NA | NA | NA | NA | NA | NA | NA | NA | NA | NA | NA | NA | NA | NA | NA | NA | NA | NA | NA | NA | NA | NA | NA | NA | |
| Product, Retail | 224.81 | 204.42 | 248.00 | 233.18 | 255.45 | 249.97 | 307.79 | 308.30 | 320.25 | 269.21 | 270.53 | 239.16 | 256.14 | 207.20 | 283.17 | 250.23 | 274.58 | 234.44 | 305.41 | 256.73 | 267.18 | 249.31 | NA | NA | NA | NA | NA | NA | NA | NA | NA | NA | NA | NA | NA | NA | NA | NA | NA | NA | NA | NA | NA | NA | NA | NA | NA | NA | NA | NA | NA | NA | NA | |
| Service, Retail | 2.27 | 2.16 | 2.27 | 2.38 | 2.45 | 2.46 | 2.44 | 2.51 | 2.84 | 2.95 | 2.83 | 3.15 | 3.43 | 3.03 | 3.06 | 3.41 | 3.84 | 3.51 | 3.50 | 3.56 | 3.47 | 3.58 | NA | NA | NA | NA | NA | NA | NA | NA | NA | NA | NA | NA | NA | NA | NA | NA | NA | NA | NA | NA | NA | NA | NA | NA | NA | NA | NA | NA | NA | NA | NA | |
| Eliminations | -2.19 | -0.94 | NA | NA | NA | NA | NA | NA | NA | NA | NA | NA | NA | NA | NA | NA | NA | NA | NA | NA | NA | NA | NA | NA | NA | NA | NA | NA | NA | NA | NA | NA | NA | NA | NA | NA | NA | NA | NA | NA | NA | NA | NA | NA | NA | NA | NA | NA | NA | NA | NA | NA | NA | |
| Retail | 245.84 | 223.49 | 270.46 | 254.36 | 279.51 | 272.26 | 332.73 | 334.58 | 346.79 | 291.30 | 294.47 | 259.77 | NA | NA | NA | NA | NA | NA | NA | NA | NA | NA | NA | NA | NA | NA | NA | NA | NA | NA | NA | NA | NA | NA | NA | NA | NA | NA | NA | NA | NA | NA | NA | NA | NA | NA | NA | NA | NA | NA | NA | NA | NA |


