
| 2023-12-31 | 2023-09-29 | 2023-06-30 | 2023-03-31 | 2022-12-31 | 2022-09-30 | 2022-07-01 | 2022-04-01 | 2021-12-31 | 2021-10-01 | 2021-07-02 | 2021-04-02 | 2020-12-31 | 2020-09-27 | 2020-06-28 | 2020-03-29 | 2019-12-29 | 2019-09-29 | 2019-06-30 | 2019-03-31 | 2018-12-30 | 2018-09-30 | 2018-07-01 | 2018-04-01 | 2017-12-31 | 2017-10-01 | 2017-07-02 | 2017-04-02 | 2017-01-01 | 2016-10-02 | 2016-07-03 | 2016-04-03 | 2016-01-03 | 2015-09-27 | 2015-06-28 | 2015-03-29 | 2014-12-28 | 2014-09-28 | 2014-06-29 | 2014-03-30 | 2013-12-29 | 2013-09-29 | 2013-06-30 | 2013-03-31 | 2012-12-30 | 2012-09-30 | 2012-07-01 | 2012-04-01 | 2012-01-01 | 2011-10-02 | 2011-07-03 | 2011-04-03 | 2011-01-02 | 2010-10-03 | 2010-07-04 | ||
|---|---|---|---|---|---|---|---|---|---|---|---|---|---|---|---|---|---|---|---|---|---|---|---|---|---|---|---|---|---|---|---|---|---|---|---|---|---|---|---|---|---|---|---|---|---|---|---|---|---|---|---|---|---|---|---|---|
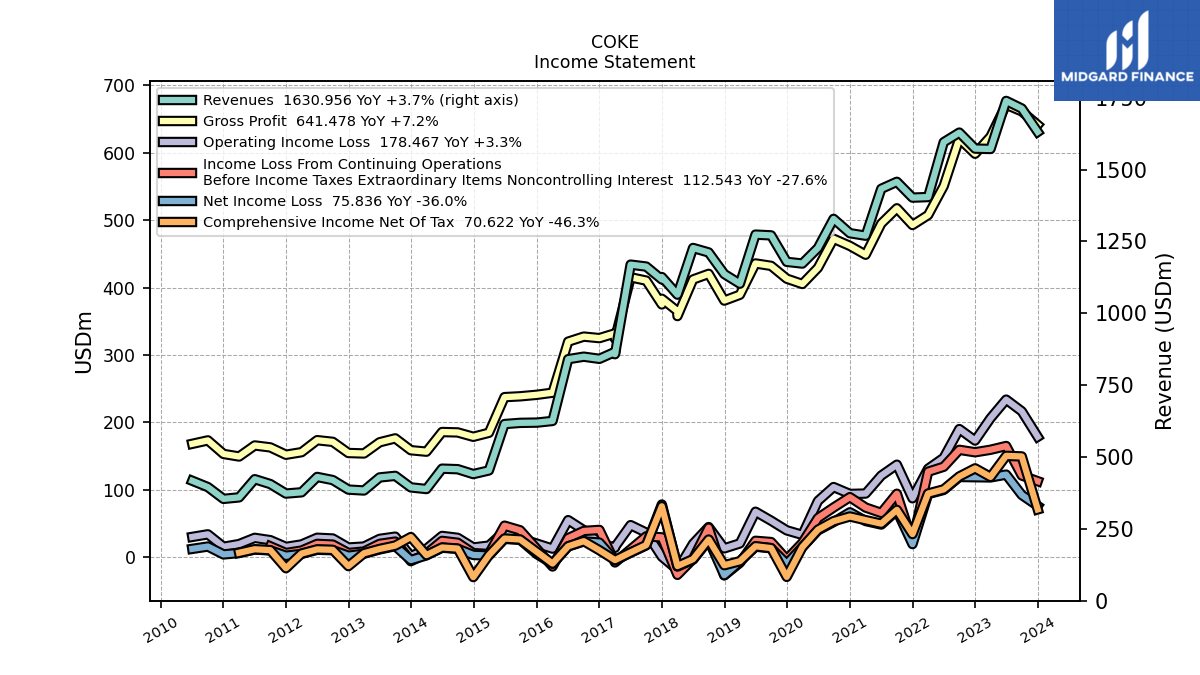
| Revenue From Contract With Customer Excluding Assessed Tax | 1630.96 | 1712.43 | 1738.83 | 1571.64 | 1572.80 | 1628.59 | 1595.21 | 1404.36 | 1402.34 | 1457.43 | 1433.09 | 1269.86 | 1278.64 | 1328.48 | 1227.21 | 1173.02 | 1178.95 | 1271.03 | 1273.66 | 1102.91 | 1136.57 | 1211.66 | 1227.27 | 1064.76 | 1117.63 | 1162.53 | 1169.29 | 865.70 | 841.56 | 849.03 | 840.38 | 625.46 | 619.72 | 618.81 | 614.68 | 453.25 | 440.64 | 457.68 | 459.47 | 388.58 | 394.34 | 434.46 | 428.98 | 383.55 | 386.70 | 419.86 | 430.69 | 377.19 | 372.86 | 405.86 | 422.89 | 359.63 | 354.38 | 395.36 | 417.36 | |
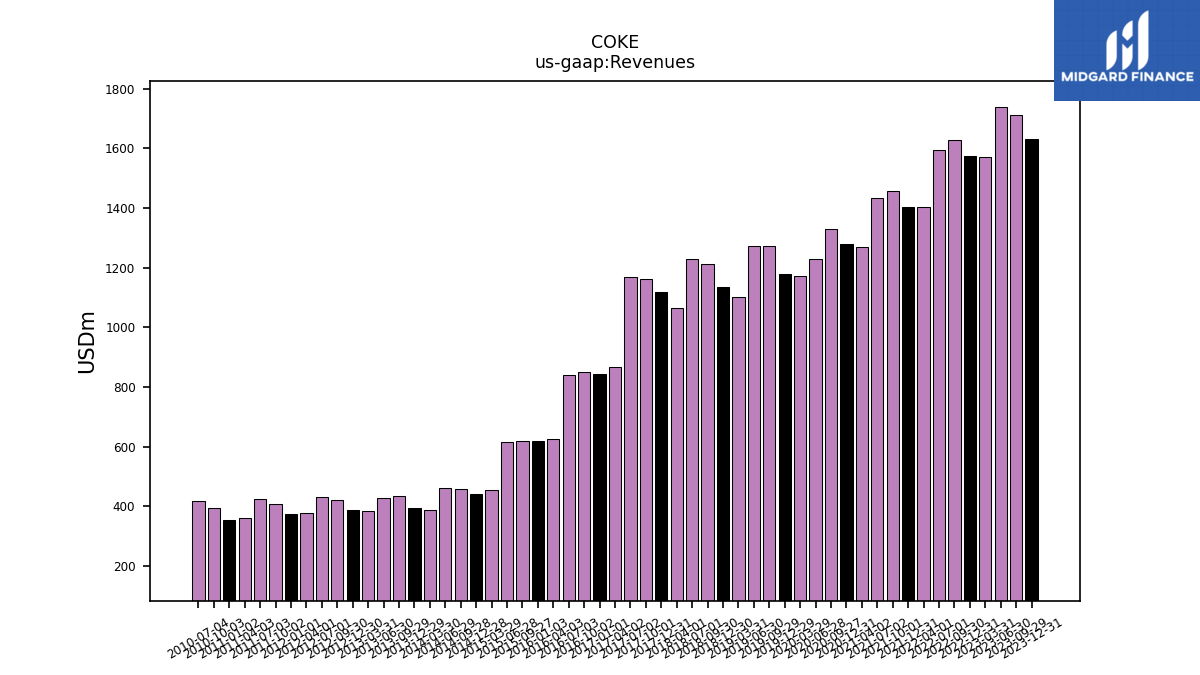
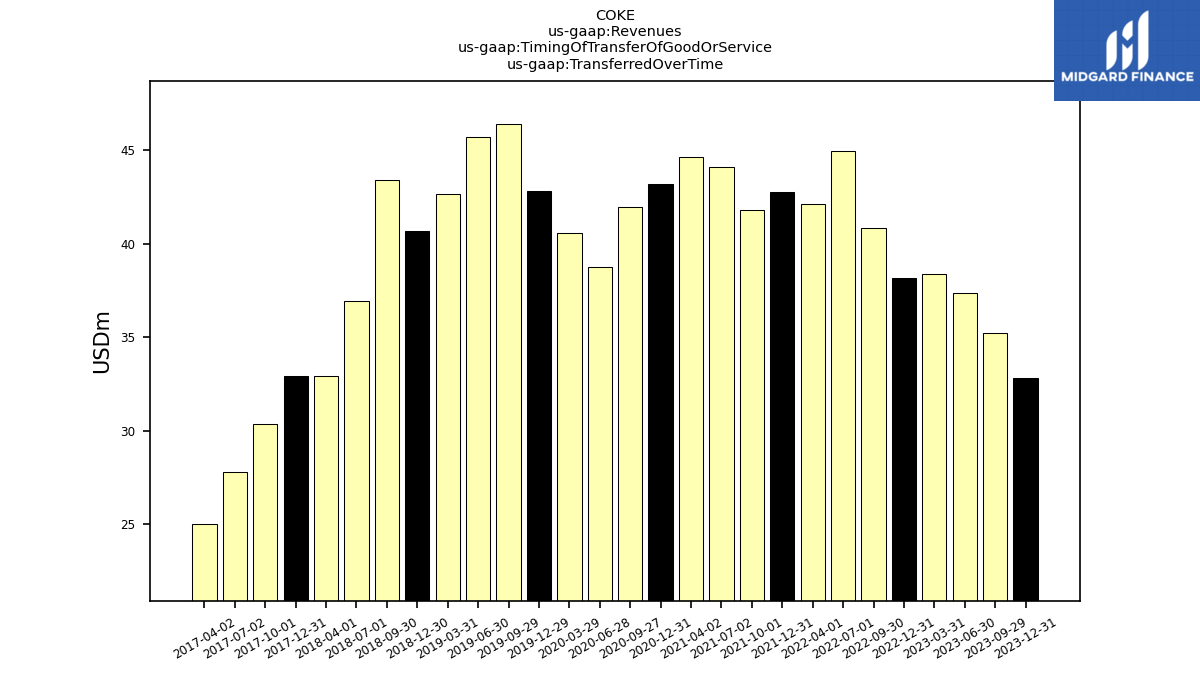
| Revenues | 1630.96 | 1712.43 | 1738.83 | 1571.64 | 1572.80 | 1628.59 | 1595.21 | 1404.36 | 1402.34 | 1457.43 | 1433.09 | 1269.86 | 1278.64 | 1328.48 | 1227.21 | 1173.02 | 1178.95 | 1271.03 | 1273.66 | 1102.91 | 1136.57 | 1211.66 | 1227.27 | 1064.76 | 1117.63 | 1162.53 | 1169.29 | 865.70 | 841.56 | 849.03 | 840.38 | 625.46 | 619.72 | 618.81 | 614.68 | 453.25 | 440.64 | 457.68 | 459.47 | 388.58 | 394.34 | 434.46 | 428.98 | 383.55 | 386.70 | 419.86 | 430.69 | 377.19 | 372.86 | 405.86 | 422.89 | 359.63 | 354.38 | 395.36 | 417.36 | |
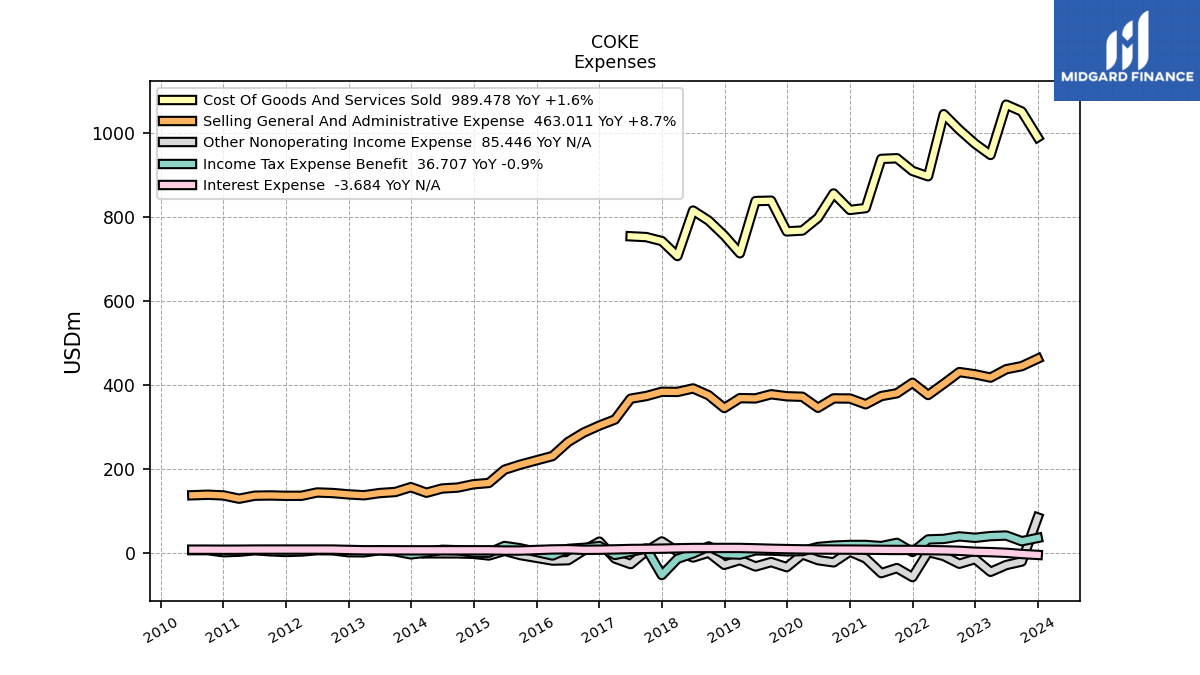
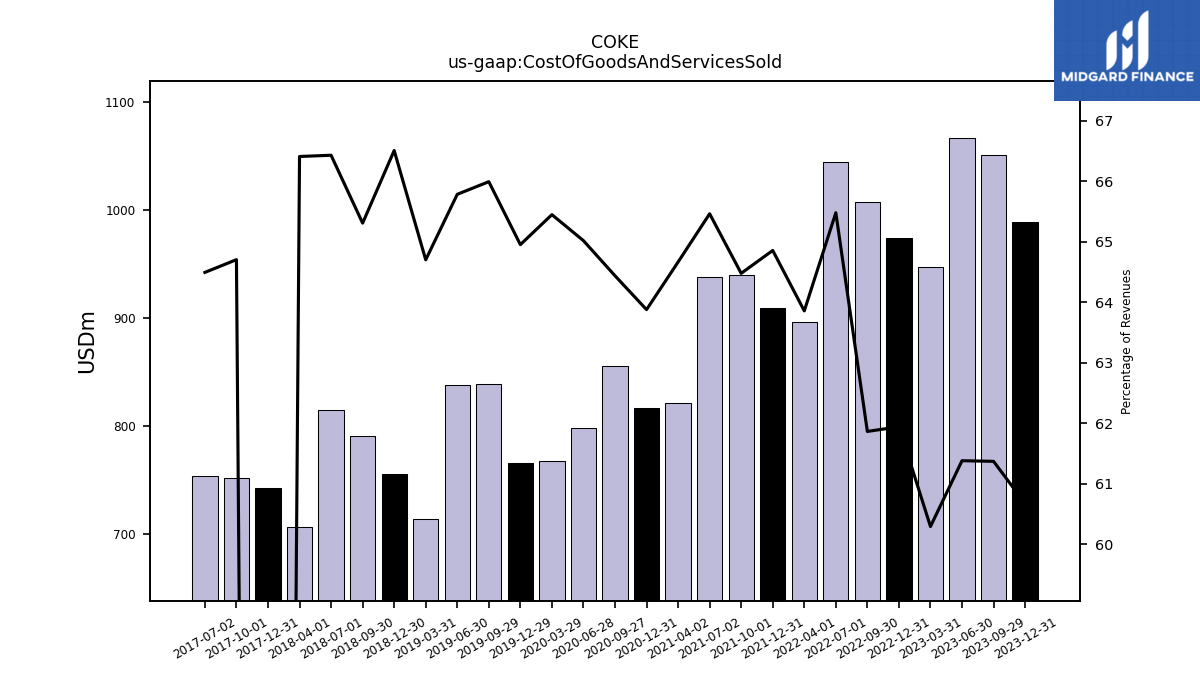
| Cost Of Goods And Services Sold | 989.48 | 1050.88 | 1067.26 | 947.54 | 974.18 | 1007.48 | 1044.56 | 896.78 | 909.51 | 939.72 | 938.15 | 821.15 | 816.76 | 856.05 | 797.91 | 767.73 | 765.76 | 838.80 | 837.88 | 713.60 | 755.92 | 791.32 | 815.29 | 707.12 | 742.73 | 752.20 | 754.11 | NA | NA | NA | NA | NA | NA | NA | NA | NA | NA | NA | NA | NA | NA | NA | NA | NA | NA | NA | NA | NA | NA | NA | NA | NA | NA | NA | NA | |
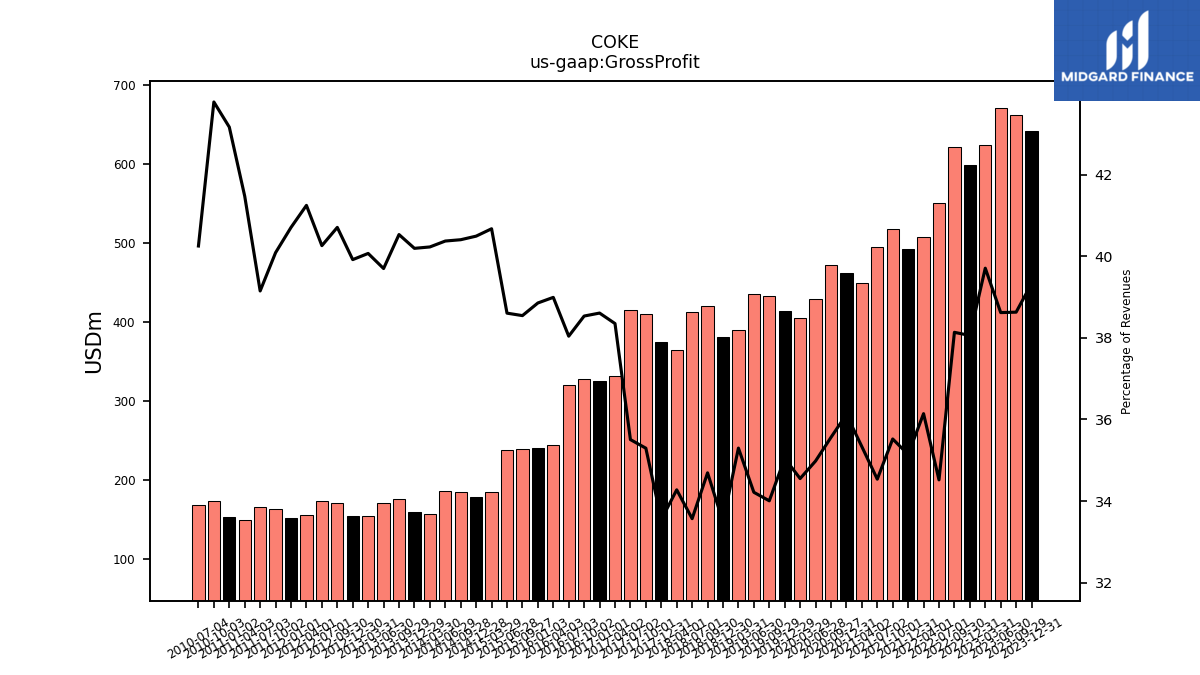
| Gross Profit | 641.48 | 661.55 | 671.58 | 624.11 | 598.61 | 621.11 | 550.66 | 507.58 | 492.83 | 517.71 | 494.94 | 448.70 | 461.88 | 472.44 | 429.30 | 405.30 | 413.19 | 432.22 | 435.78 | 389.31 | 380.65 | 420.34 | 411.98 | 364.95 | 374.90 | 410.32 | 415.18 | 332.02 | 324.93 | 327.19 | 319.71 | 243.90 | 240.81 | 238.54 | 237.32 | 184.37 | 178.44 | 184.94 | 185.52 | 156.33 | 158.51 | 176.11 | 170.31 | 153.70 | 154.37 | 170.93 | 173.41 | 155.59 | 151.79 | 162.72 | 165.57 | 149.16 | 152.99 | 173.12 | 168.01 | |
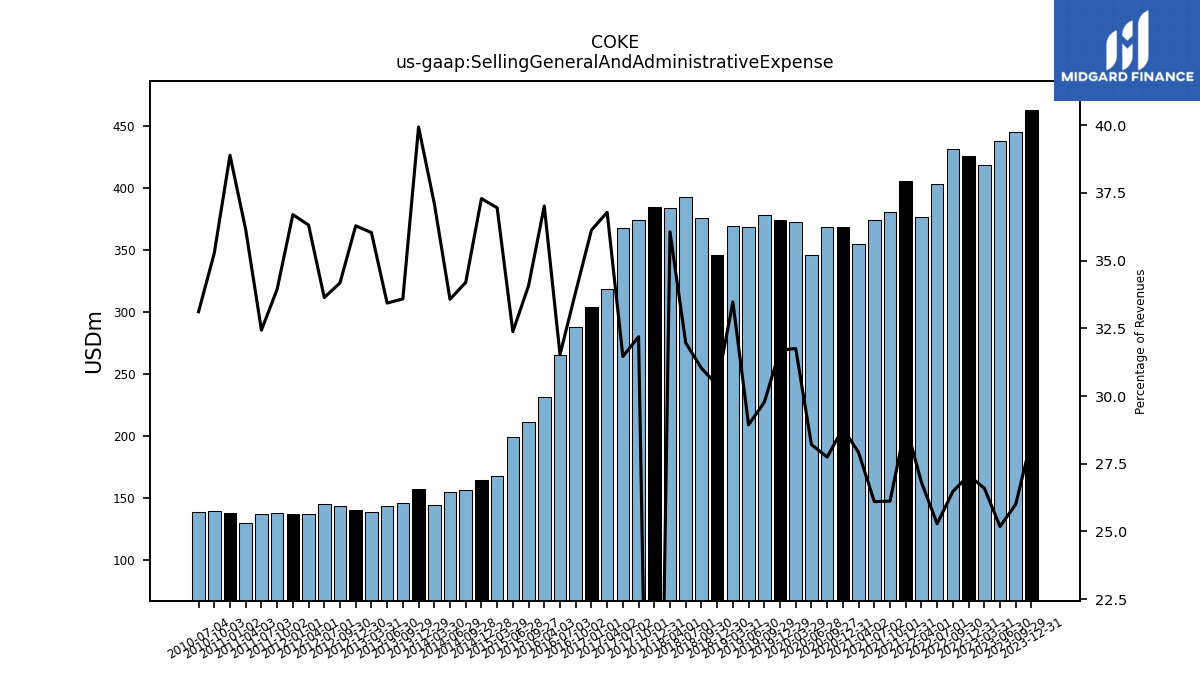
| Selling General And Administrative Expense | 463.01 | 445.29 | 437.91 | 418.05 | 425.77 | 431.18 | 403.37 | 376.59 | 405.74 | 380.68 | 374.08 | 354.52 | 368.28 | 368.59 | 346.18 | 372.47 | 373.65 | 378.38 | 368.56 | 369.15 | 345.63 | 375.94 | 392.30 | 383.94 | 384.30 | 374.19 | 367.87 | 318.41 | 304.01 | 287.39 | 264.97 | 231.50 | NA | 210.85 | 199.00 | 167.47 | 164.30 | 156.50 | 154.26 | 144.22 | 157.45 | 145.91 | 143.42 | 138.21 | 140.31 | 143.49 | 144.86 | 136.96 | 136.83 | 137.75 | 137.15 | 129.98 | 137.81 | 139.46 | 138.19 | |
| Operating Income Loss | 178.47 | 216.26 | 233.67 | 206.05 | 172.84 | 189.93 | 147.29 | 130.99 | 87.09 | 137.03 | 120.86 | 94.18 | 93.59 | 103.84 | 83.12 | 32.82 | 39.54 | 53.85 | 67.21 | 20.15 | 12.82 | 44.40 | 19.68 | -19.00 | 0.47 | 36.13 | 47.31 | 13.61 | 20.92 | 39.80 | 54.74 | 12.40 | NA | 27.68 | 38.32 | 16.90 | 14.14 | 28.45 | 31.26 | 12.12 | 1.06 | 30.20 | 26.90 | 15.49 | 14.07 | 27.44 | 28.55 | 18.63 | 14.97 | 24.96 | 28.42 | 19.18 | 15.18 | 33.66 | 29.82 | |
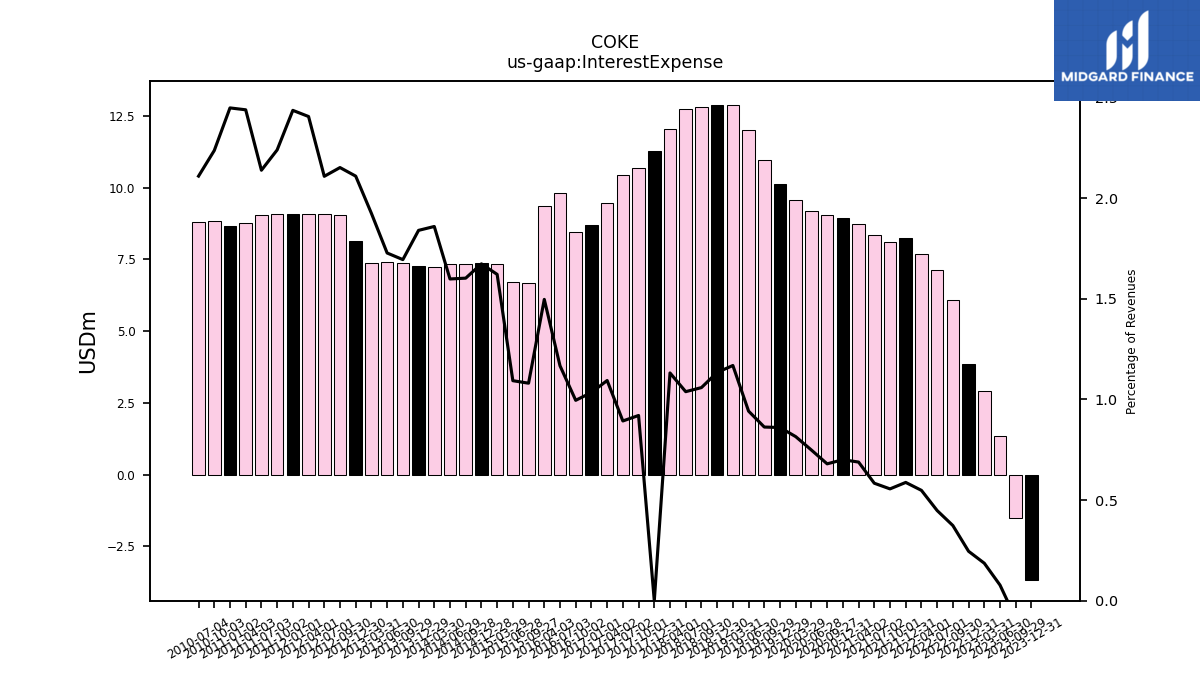
| Interest Expense | -3.68 | -1.52 | 1.35 | 2.93 | 3.86 | 6.08 | 7.15 | 7.70 | 8.24 | 8.10 | 8.37 | 8.75 | 8.96 | 9.03 | 9.18 | 9.56 | 10.14 | 10.96 | 11.99 | 12.89 | 12.89 | 12.83 | 12.74 | 12.05 | 11.26 | 10.70 | 10.44 | 9.47 | 8.70 | 8.45 | 9.81 | 9.36 | NA | 6.69 | 6.72 | 7.35 | 7.37 | 7.33 | 7.34 | 7.22 | 7.25 | 7.36 | 7.41 | 7.38 | 8.15 | 9.03 | 9.08 | 9.07 | 9.08 | 9.09 | 9.04 | 8.77 | 8.67 | 8.84 | 8.80 | |
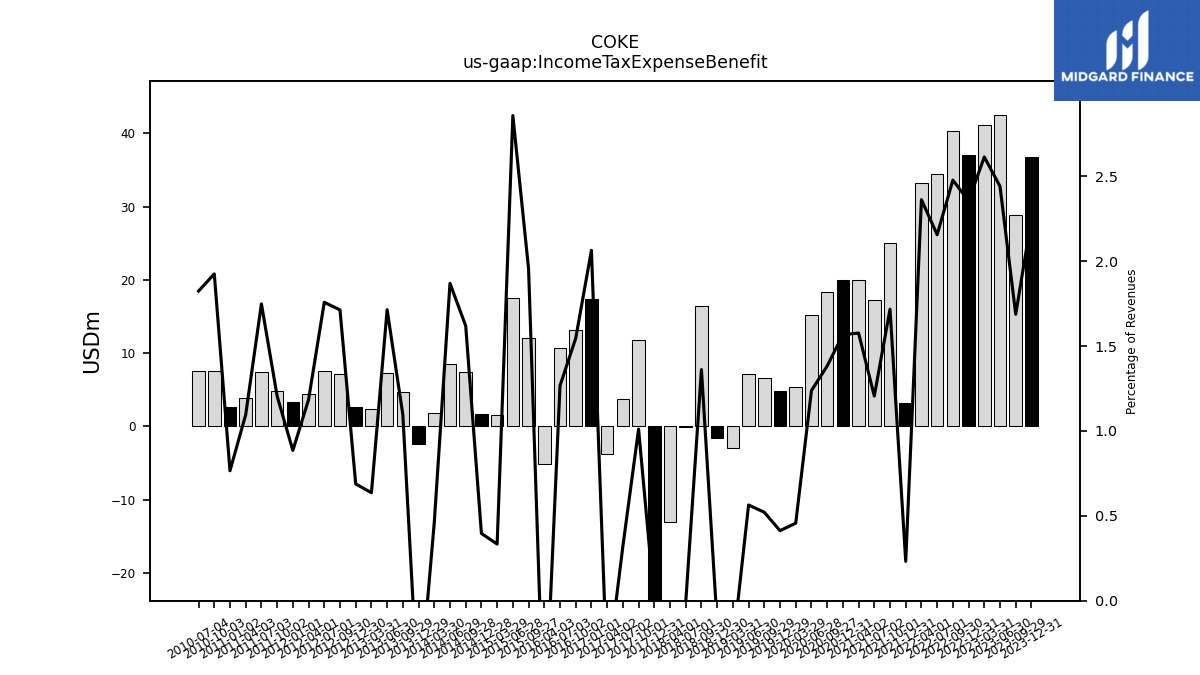
| Income Tax Expense Benefit | 36.71 | 28.89 | 42.43 | 41.08 | 37.03 | 40.34 | 34.39 | 33.17 | 3.25 | 25.02 | 17.27 | 20.02 | 20.03 | 18.36 | 15.19 | 5.36 | 4.86 | 6.62 | 7.18 | -3.00 | -1.52 | 16.49 | -0.14 | -12.97 | -51.64 | 11.75 | 3.74 | -3.69 | 17.37 | 13.12 | 10.64 | -5.08 | NA | 12.10 | 17.56 | 1.51 | 1.75 | 7.41 | 8.59 | 1.79 | -2.41 | 4.76 | 7.35 | 2.44 | 2.66 | 7.19 | 7.57 | 4.47 | 3.30 | 4.89 | 7.39 | 3.94 | 2.71 | 7.61 | 7.61 | |
| Net Income Loss | 75.84 | 92.09 | 122.32 | 118.13 | 118.44 | 118.76 | 99.56 | 93.39 | 19.11 | 68.93 | 48.18 | 53.36 | 66.38 | 51.88 | 39.57 | 14.66 | -10.17 | 13.01 | 15.37 | -6.83 | -26.98 | 25.16 | -3.93 | -14.19 | 77.92 | 17.32 | 6.35 | -5.05 | 21.39 | 23.14 | 15.65 | -10.04 | 4.29 | 25.55 | 26.93 | 2.22 | 2.99 | 12.13 | 13.78 | 2.45 | -4.58 | 16.17 | 11.23 | 4.86 | 1.83 | 10.08 | 10.75 | 4.57 | 1.83 | 9.77 | 11.10 | 5.91 | 3.82 | 15.53 | 12.04 | |
| Comprehensive Income Net Of Tax | 70.62 | 149.31 | 150.14 | 118.86 | 131.63 | 119.58 | 100.38 | 94.20 | 33.99 | 69.98 | 49.50 | 54.70 | 60.13 | 53.16 | 40.54 | 14.61 | -29.55 | 13.20 | 15.96 | -6.25 | -12.24 | 25.90 | -3.21 | -13.45 | 75.27 | 17.76 | 6.80 | -4.61 | 9.98 | 23.45 | 15.95 | -9.73 | NA | 25.98 | 27.35 | 2.64 | -29.89 | 12.52 | 14.16 | 2.83 | 29.64 | 16.88 | 11.94 | 5.57 | -13.58 | 10.64 | 11.31 | 5.13 | -16.68 | 10.15 | 11.47 | 6.28 | NA | NA | NA |
| 2023-12-31 | 2023-09-29 | 2023-06-30 | 2023-03-31 | 2022-12-31 | 2022-09-30 | 2022-07-01 | 2022-04-01 | 2021-12-31 | 2021-10-01 | 2021-07-02 | 2021-04-02 | 2020-12-31 | 2020-09-27 | 2020-06-28 | 2020-03-29 | 2019-12-29 | 2019-09-29 | 2019-06-30 | 2019-03-31 | 2018-12-30 | 2018-09-30 | 2018-07-01 | 2018-04-01 | 2017-12-31 | 2017-10-01 | 2017-07-02 | 2017-04-02 | 2017-01-01 | 2016-10-02 | 2016-07-03 | 2016-04-03 | 2016-01-03 | 2015-09-27 | 2015-06-28 | 2015-03-29 | 2014-12-28 | 2014-09-28 | 2014-06-29 | 2014-03-30 | 2013-12-29 | 2013-09-29 | 2013-06-30 | 2013-03-31 | 2012-12-30 | 2012-09-30 | 2012-07-01 | 2012-04-01 | 2012-01-01 | 2011-10-02 | 2011-07-03 | 2011-04-03 | 2011-01-02 | 2010-10-03 | 2010-07-04 | ||
|---|---|---|---|---|---|---|---|---|---|---|---|---|---|---|---|---|---|---|---|---|---|---|---|---|---|---|---|---|---|---|---|---|---|---|---|---|---|---|---|---|---|---|---|---|---|---|---|---|---|---|---|---|---|---|---|---|
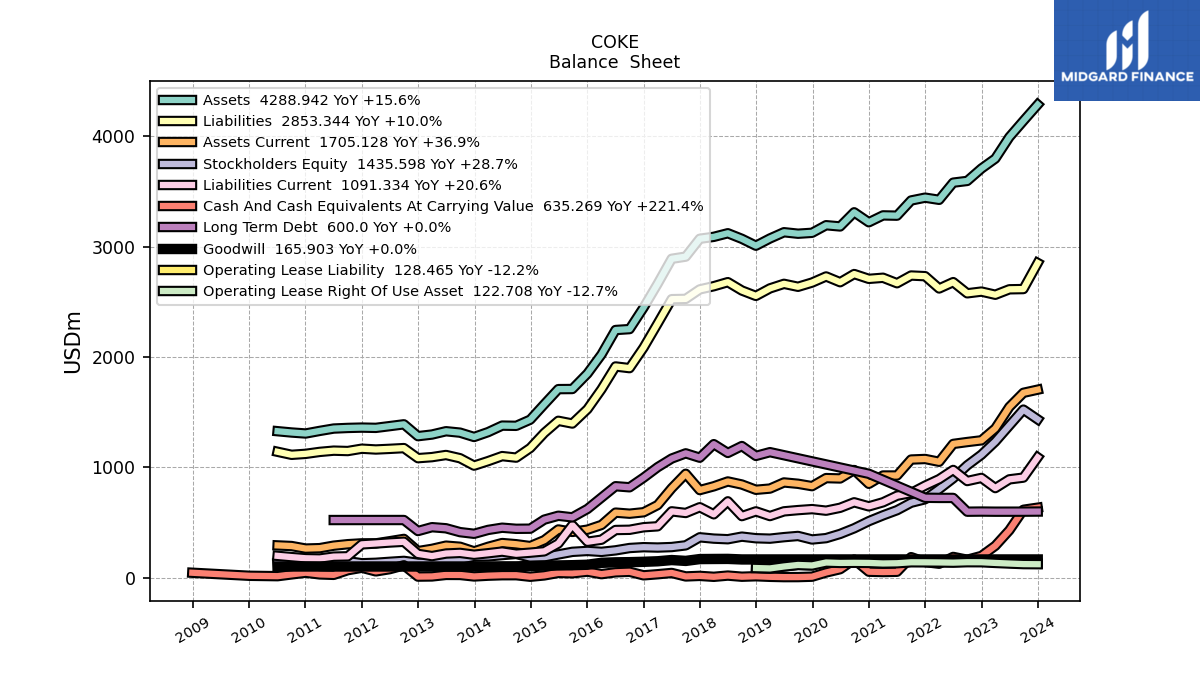
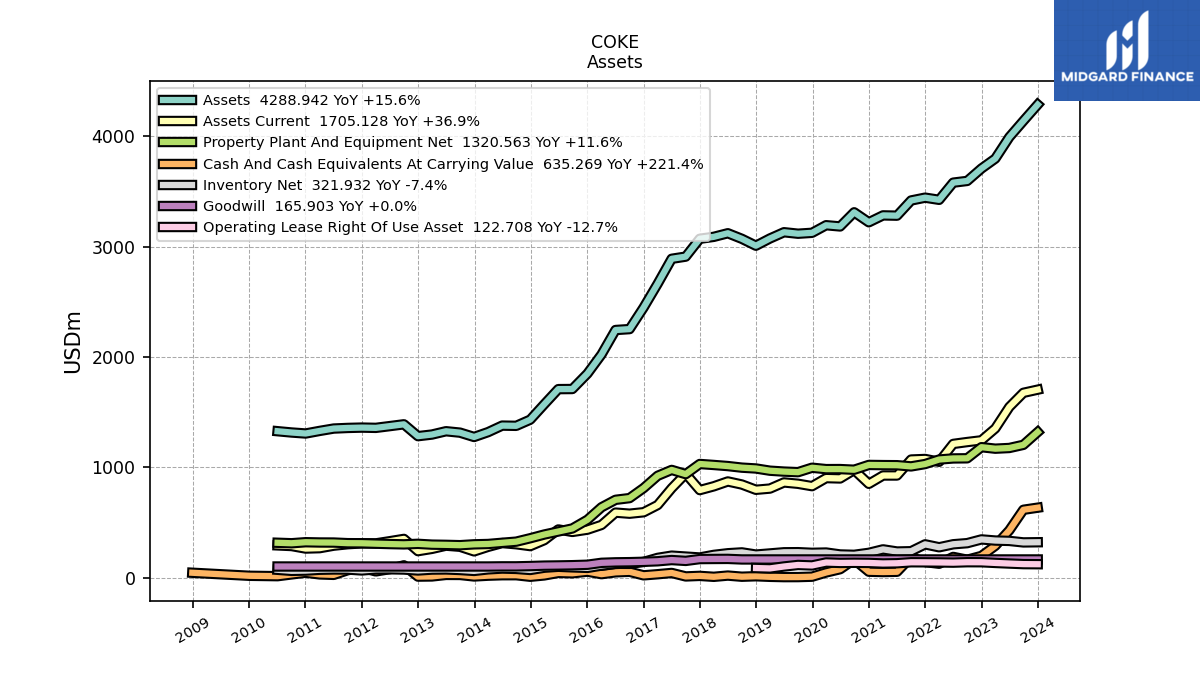
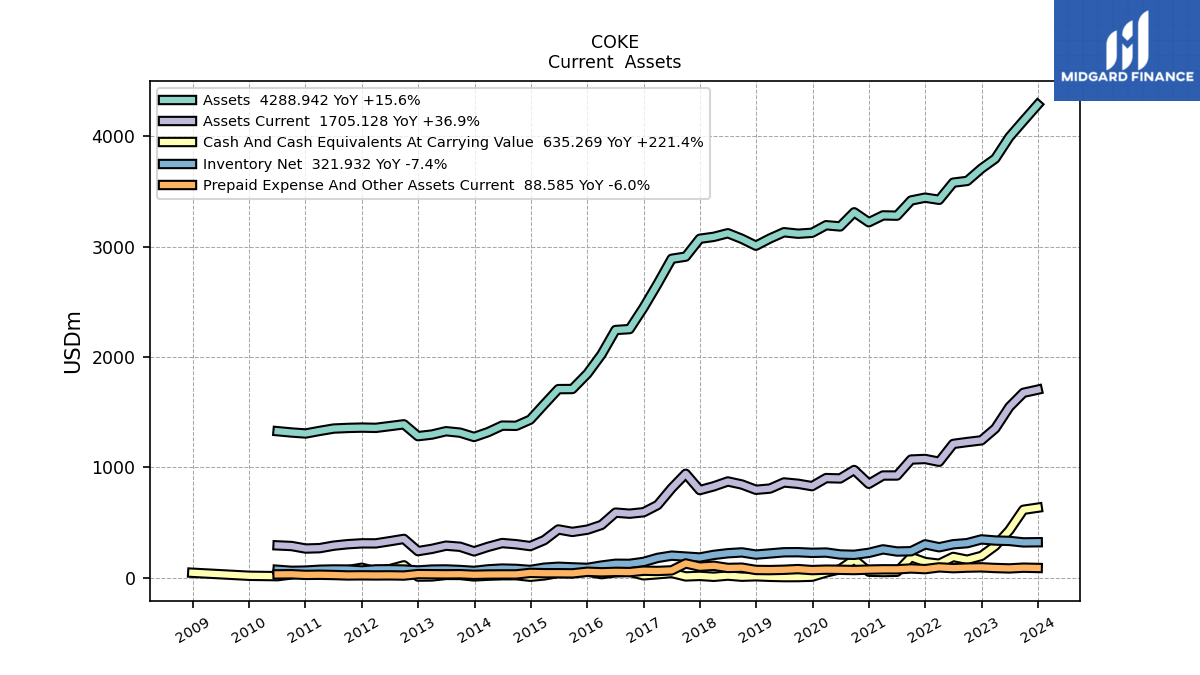
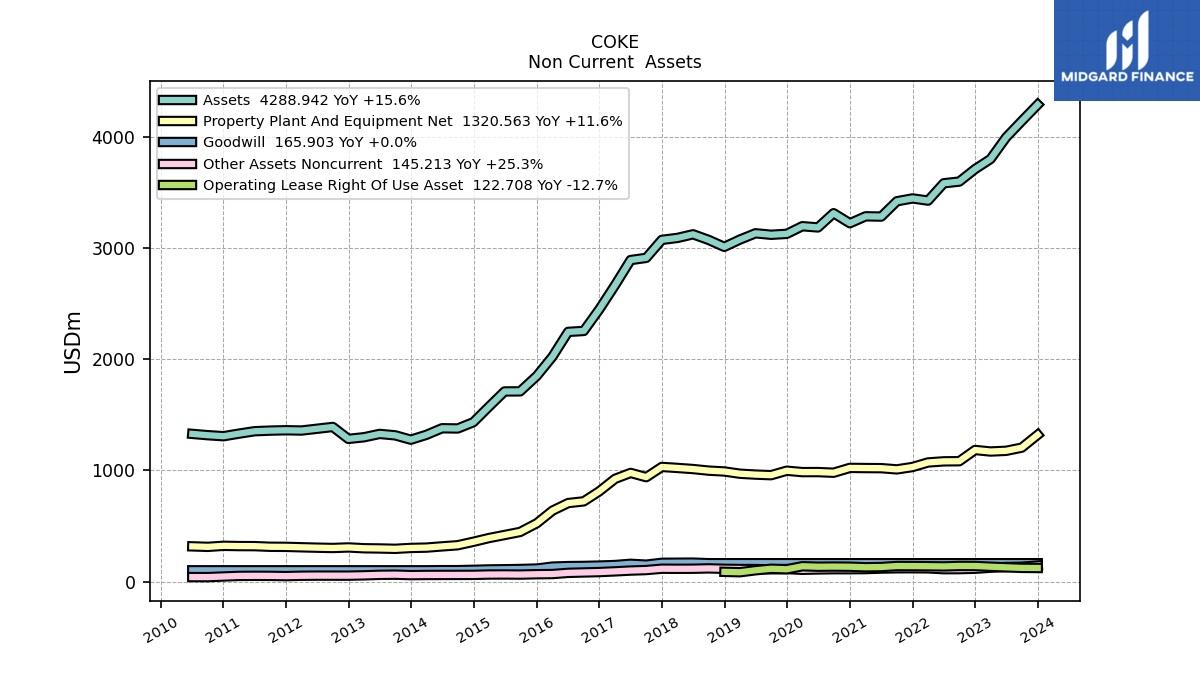
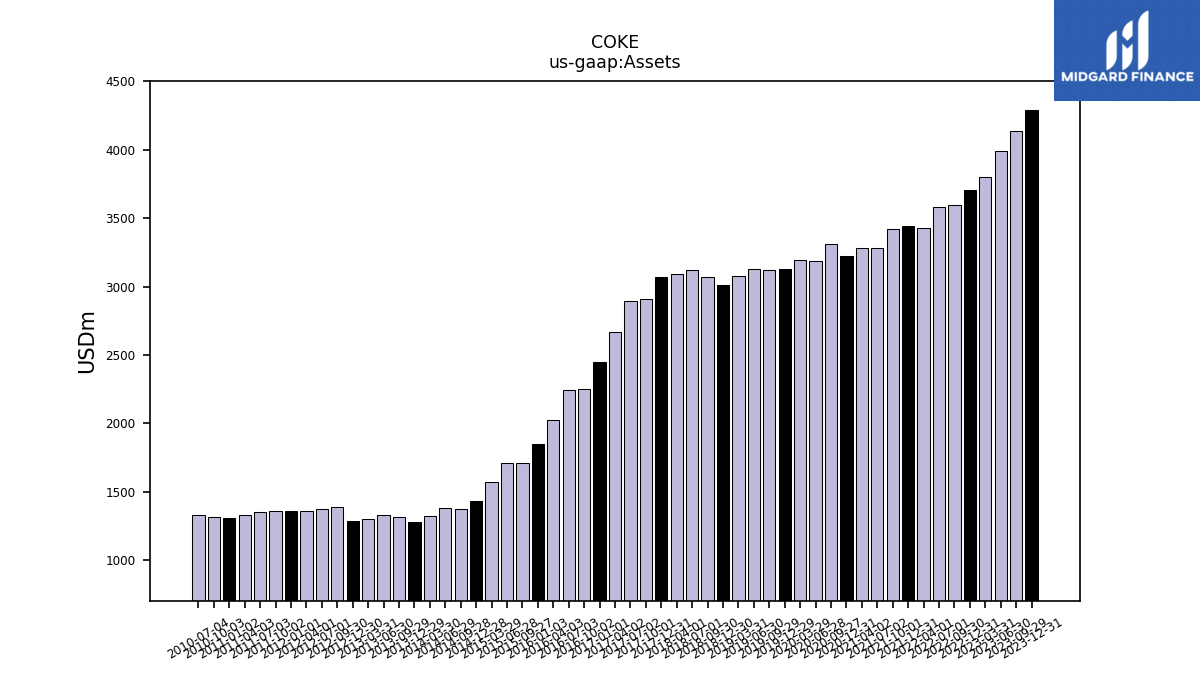
| Assets | 4288.94 | 4141.28 | 3994.54 | 3799.70 | 3709.55 | 3597.28 | 3581.67 | 3425.93 | 3445.57 | 3419.94 | 3282.30 | 3284.83 | 3222.45 | 3312.89 | 3184.58 | 3195.74 | 3126.93 | 3118.72 | 3132.15 | 3075.69 | 3009.93 | 3072.42 | 3122.99 | 3090.44 | 3072.96 | 2911.10 | 2891.44 | 2664.82 | 2449.48 | 2254.03 | 2245.75 | 2023.86 | 1850.82 | 1710.85 | 1709.99 | 1572.74 | 1433.08 | 1377.12 | 1379.18 | 1320.26 | 1276.16 | 1315.36 | 1328.21 | 1298.24 | 1283.47 | 1391.02 | 1374.74 | 1358.71 | 1361.17 | 1358.07 | 1352.52 | 1331.11 | 1307.62 | 1316.66 | 1328.48 | |
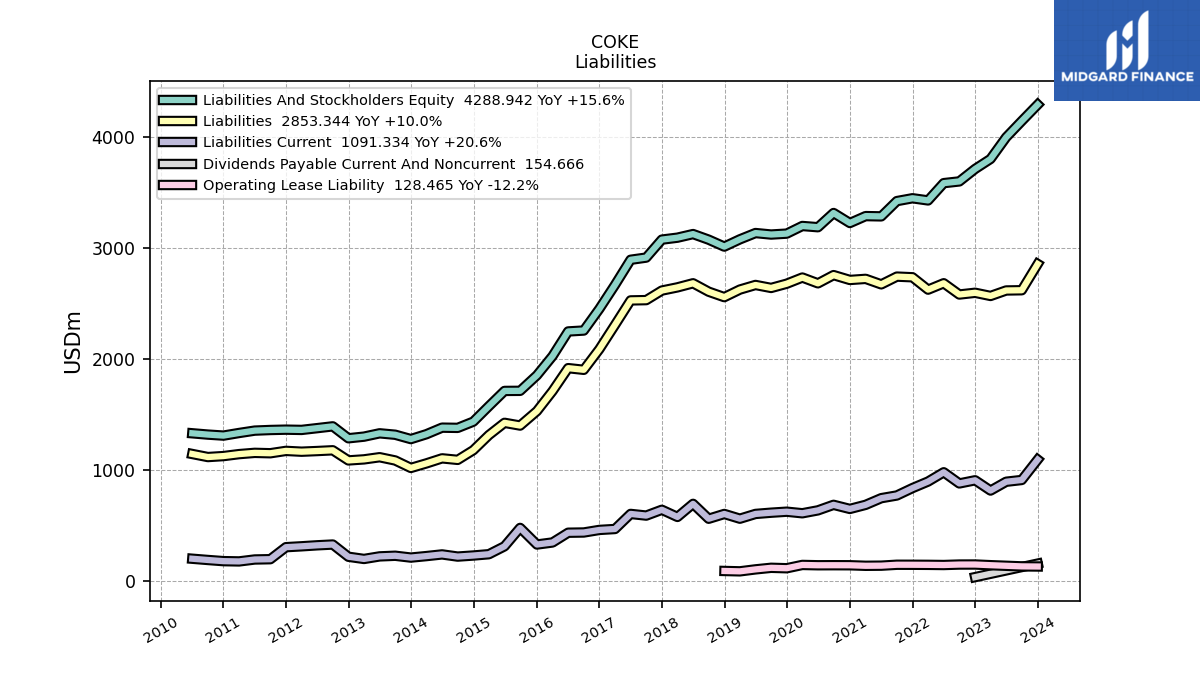
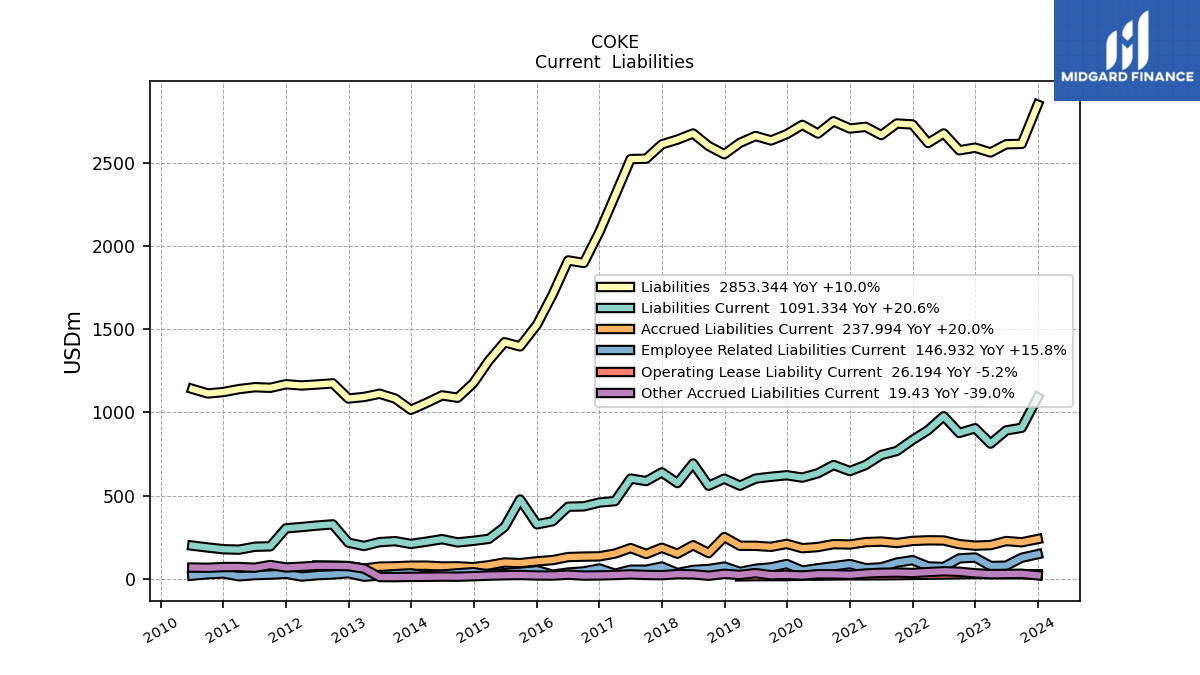
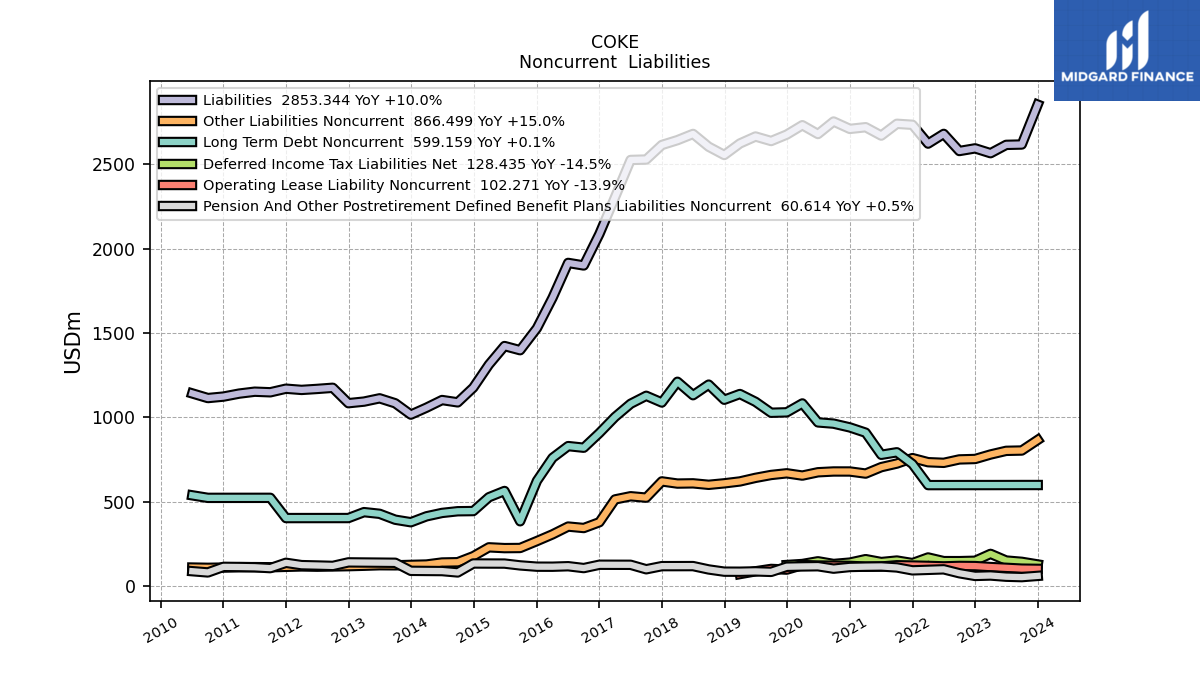
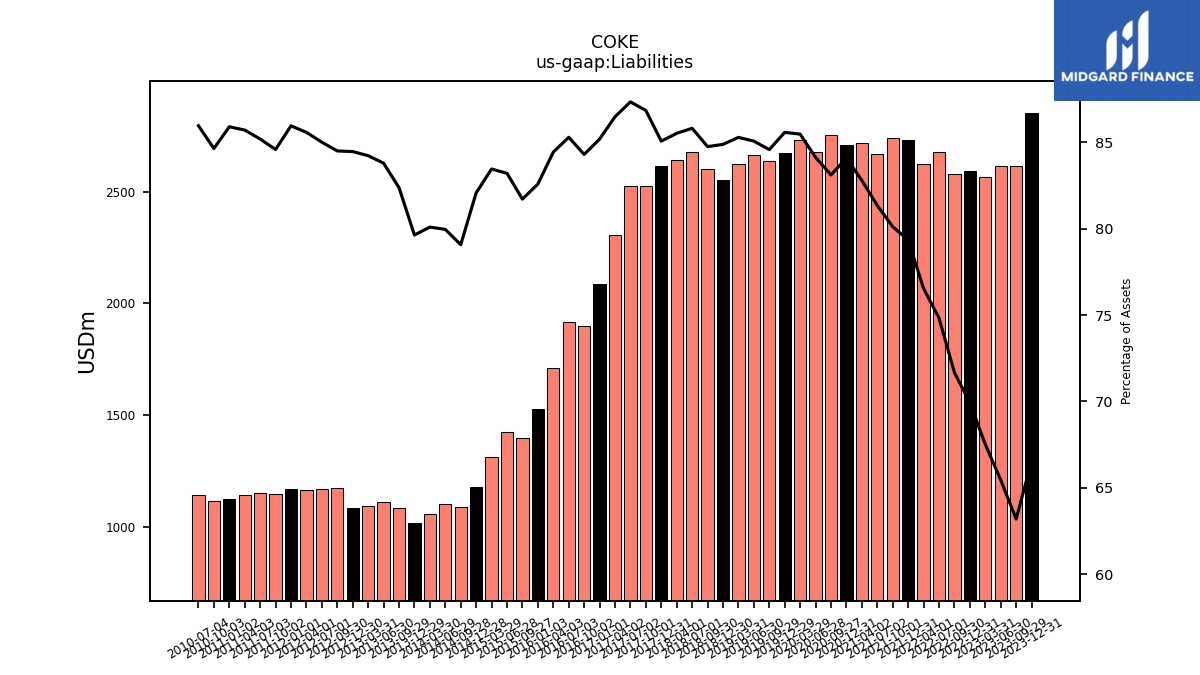
| Liabilities | 2853.34 | 2616.95 | 2614.83 | 2565.44 | 2594.16 | 2578.36 | 2679.99 | 2622.28 | 2733.78 | 2739.80 | 2669.80 | 2719.49 | 2709.46 | 2753.34 | 2679.01 | 2731.42 | 2675.81 | 2637.61 | 2664.44 | 2623.09 | 2554.76 | 2603.86 | 2679.77 | 2642.86 | 2614.05 | 2527.98 | 2525.35 | 2304.43 | 2086.46 | 1900.08 | 1915.34 | 1708.75 | 1528.38 | 1397.95 | 1422.76 | 1312.52 | 1176.13 | 1088.92 | 1102.76 | 1057.41 | 1016.23 | 1083.53 | 1112.87 | 1093.44 | 1084.04 | 1175.37 | 1168.56 | 1162.69 | 1169.93 | 1148.66 | 1152.18 | 1140.82 | 1123.20 | 1114.40 | 1141.94 | |
| Liabilities And Stockholders Equity | 4288.94 | 4141.28 | 3994.54 | 3799.70 | 3709.55 | 3597.28 | 3581.67 | 3425.93 | 3445.57 | 3419.94 | 3282.30 | 3284.83 | 3222.45 | 3312.89 | 3184.58 | 3195.74 | 3126.93 | 3118.72 | 3132.15 | 3075.69 | 3009.93 | 3072.42 | 3122.99 | 3090.44 | 3072.96 | 2911.10 | 2891.44 | 2664.82 | 2449.48 | 2254.03 | 2245.75 | 2023.86 | 1850.82 | 1710.85 | 1709.99 | 1572.74 | 1433.08 | 1377.12 | 1379.18 | 1320.26 | 1276.16 | 1315.36 | 1328.21 | 1298.24 | 1283.47 | 1391.02 | 1374.74 | 1358.71 | 1361.17 | 1358.07 | 1352.52 | 1331.11 | 1307.62 | 1316.66 | 1328.48 | |
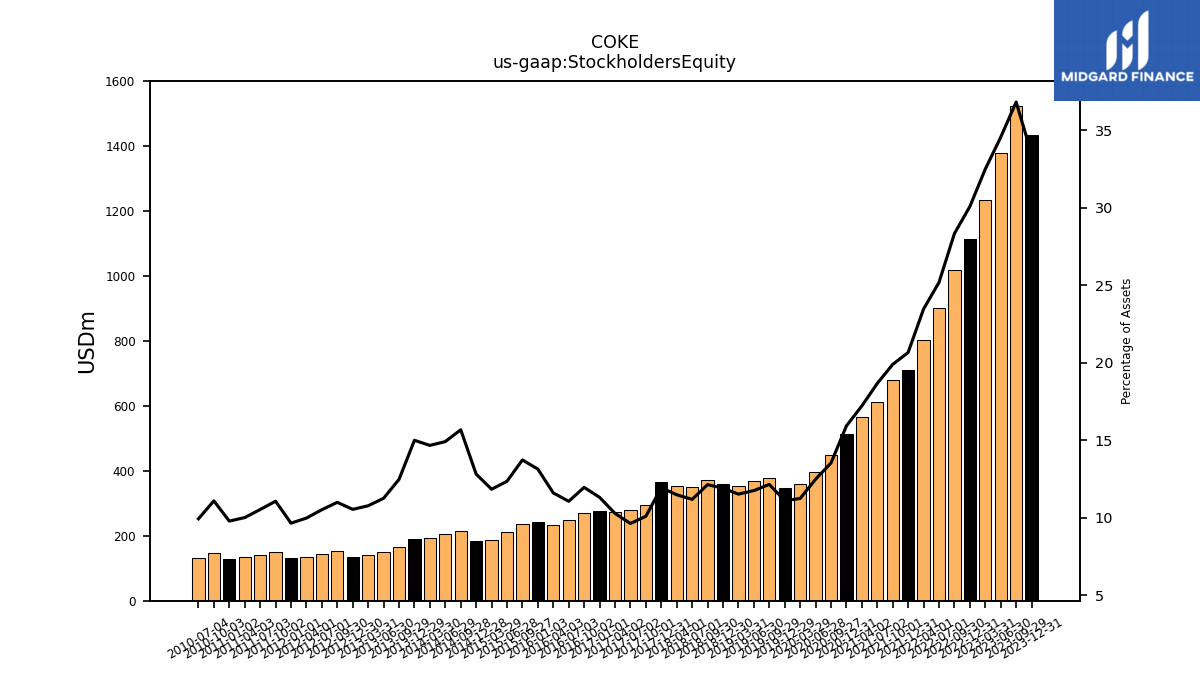
| Stockholders Equity | 1435.60 | 1524.33 | 1379.71 | 1234.25 | 1115.39 | 1018.91 | 901.68 | 803.65 | 711.79 | 680.14 | 612.50 | 565.34 | 512.99 | 448.24 | 397.42 | 359.22 | 346.95 | 378.85 | 367.99 | 354.37 | 358.19 | 372.76 | 349.21 | 354.75 | 366.70 | 293.76 | 278.33 | 273.86 | 277.13 | 269.47 | 248.35 | 234.73 | 243.06 | 234.84 | 211.18 | 186.16 | 183.61 | 215.82 | 205.62 | 193.60 | 191.32 | 164.01 | 149.44 | 139.82 | 135.26 | 152.89 | 144.56 | 135.55 | 131.30 | 150.23 | 142.38 | 133.21 | 127.89 | 145.95 | 131.90 |
| 2023-12-31 | 2023-09-29 | 2023-06-30 | 2023-03-31 | 2022-12-31 | 2022-09-30 | 2022-07-01 | 2022-04-01 | 2021-12-31 | 2021-10-01 | 2021-07-02 | 2021-04-02 | 2020-12-31 | 2020-09-27 | 2020-06-28 | 2020-03-29 | 2019-12-29 | 2019-09-29 | 2019-06-30 | 2019-03-31 | 2018-12-30 | 2018-09-30 | 2018-07-01 | 2018-04-01 | 2017-12-31 | 2017-10-01 | 2017-07-02 | 2017-04-02 | 2017-01-01 | 2016-10-02 | 2016-07-03 | 2016-04-03 | 2016-01-03 | 2015-09-27 | 2015-06-28 | 2015-03-29 | 2014-12-28 | 2014-09-28 | 2014-06-29 | 2014-03-30 | 2013-12-29 | 2013-09-29 | 2013-06-30 | 2013-03-31 | 2012-12-30 | 2012-09-30 | 2012-07-01 | 2012-04-01 | 2012-01-01 | 2011-10-02 | 2011-07-03 | 2011-04-03 | 2011-01-02 | 2010-10-03 | 2010-07-04 | ||
|---|---|---|---|---|---|---|---|---|---|---|---|---|---|---|---|---|---|---|---|---|---|---|---|---|---|---|---|---|---|---|---|---|---|---|---|---|---|---|---|---|---|---|---|---|---|---|---|---|---|---|---|---|---|---|---|---|
| Assets Current | 1705.13 | 1676.47 | 1548.01 | 1353.63 | 1245.80 | 1230.27 | 1213.20 | 1051.22 | 1076.66 | 1071.62 | 926.87 | 926.85 | 851.24 | 976.90 | 900.11 | 903.49 | 830.28 | 851.89 | 863.92 | 808.43 | 797.42 | 845.23 | 872.89 | 828.90 | 794.54 | 942.72 | 811.38 | 659.16 | 593.81 | 580.67 | 590.46 | 478.69 | 436.02 | 415.41 | 437.92 | 340.74 | 287.00 | 303.85 | 314.64 | 280.44 | 239.22 | 280.89 | 290.97 | 261.92 | 241.31 | 352.15 | 331.37 | 311.54 | 311.81 | 304.19 | 290.92 | 268.31 | 264.70 | 287.53 | 293.27 | |
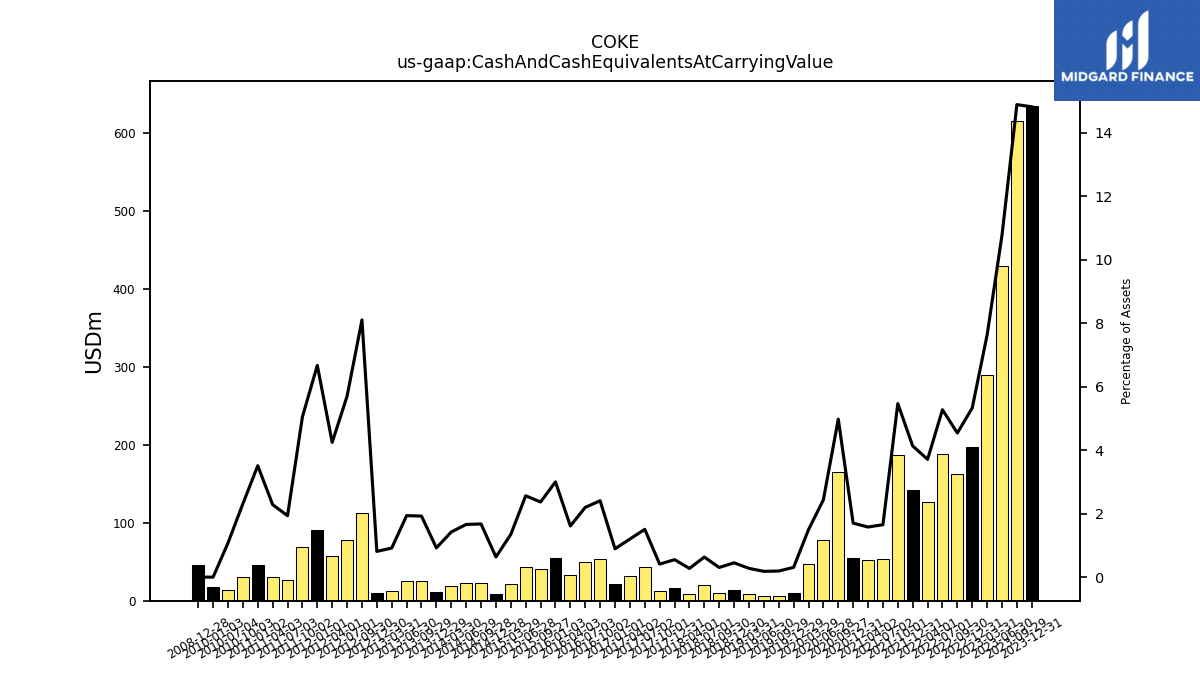
| Cash And Cash Equivalents At Carrying Value | 635.27 | 616.22 | 430.17 | 289.78 | 197.65 | 163.24 | 188.80 | 127.08 | 142.31 | 186.88 | 54.20 | 51.83 | 54.79 | 164.82 | 77.55 | 47.75 | 9.61 | 5.99 | 5.69 | 8.50 | 13.55 | 9.34 | 19.72 | 8.48 | 16.90 | 11.92 | 43.51 | 31.94 | 21.85 | 54.22 | 49.32 | 32.60 | 55.50 | 40.49 | 43.80 | 21.16 | 9.10 | 23.07 | 22.87 | 18.77 | 11.76 | 25.28 | 25.73 | 11.89 | 10.40 | 112.66 | 78.33 | 57.65 | 90.76 | 68.55 | 26.17 | 30.38 | 45.87 | 30.42 | 14.30 | |
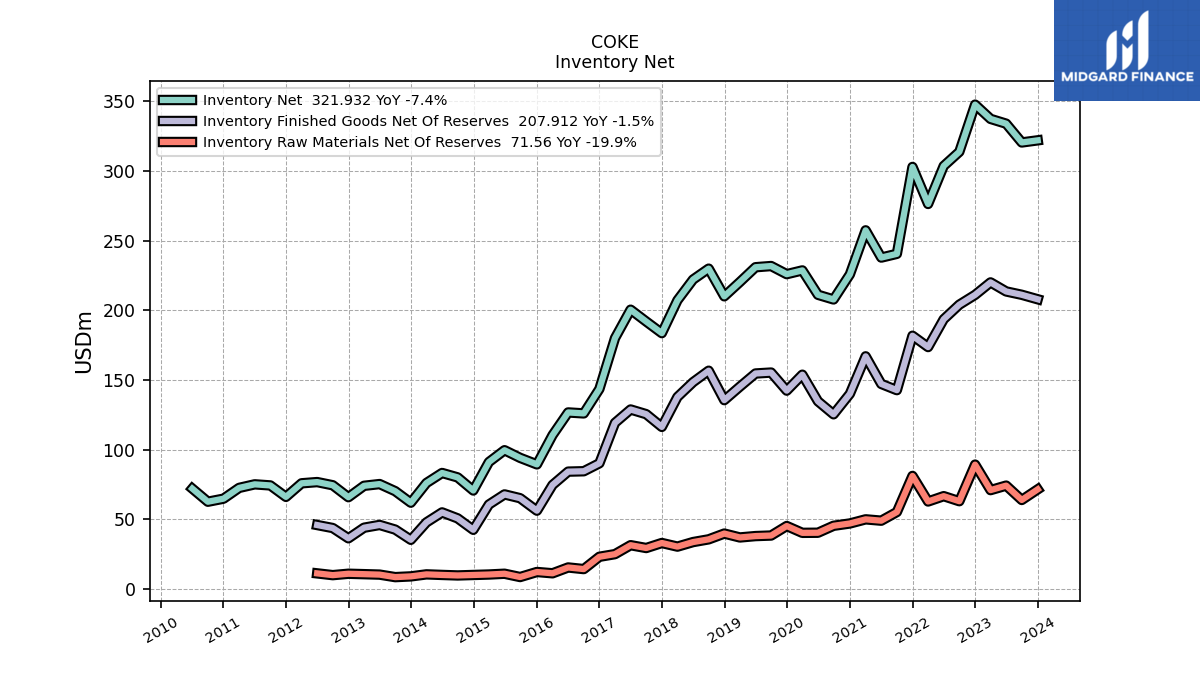
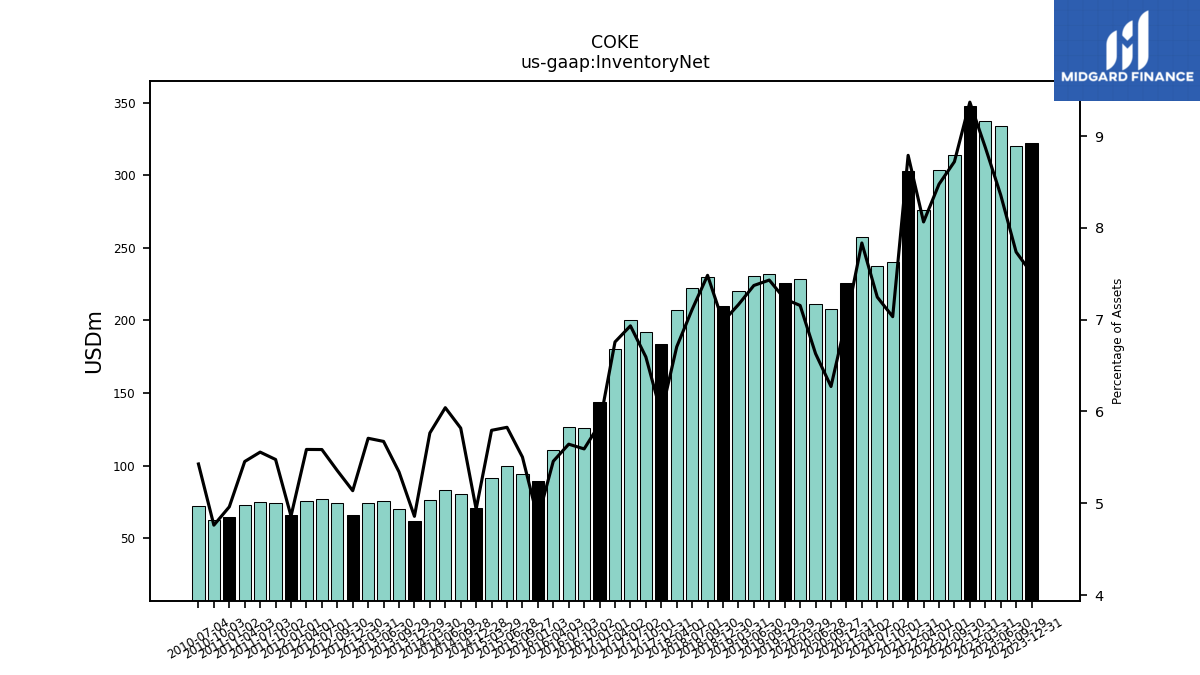
| Inventory Net | 321.93 | 320.40 | 333.87 | 337.31 | 347.55 | 313.70 | 303.54 | 276.28 | 302.85 | 240.50 | 237.82 | 257.36 | 225.76 | 207.77 | 211.13 | 228.62 | 225.93 | 231.75 | 230.90 | 220.32 | 210.03 | 229.89 | 222.07 | 207.16 | 183.62 | 191.94 | 200.44 | 180.05 | 143.55 | 126.04 | 126.73 | 110.45 | 89.46 | 94.15 | 99.64 | 91.13 | 70.74 | 80.12 | 83.31 | 76.11 | 61.99 | 70.25 | 75.35 | 74.10 | 65.92 | 74.49 | 76.78 | 75.89 | 66.16 | 74.37 | 75.16 | 72.61 | 64.87 | 62.69 | 72.11 | |
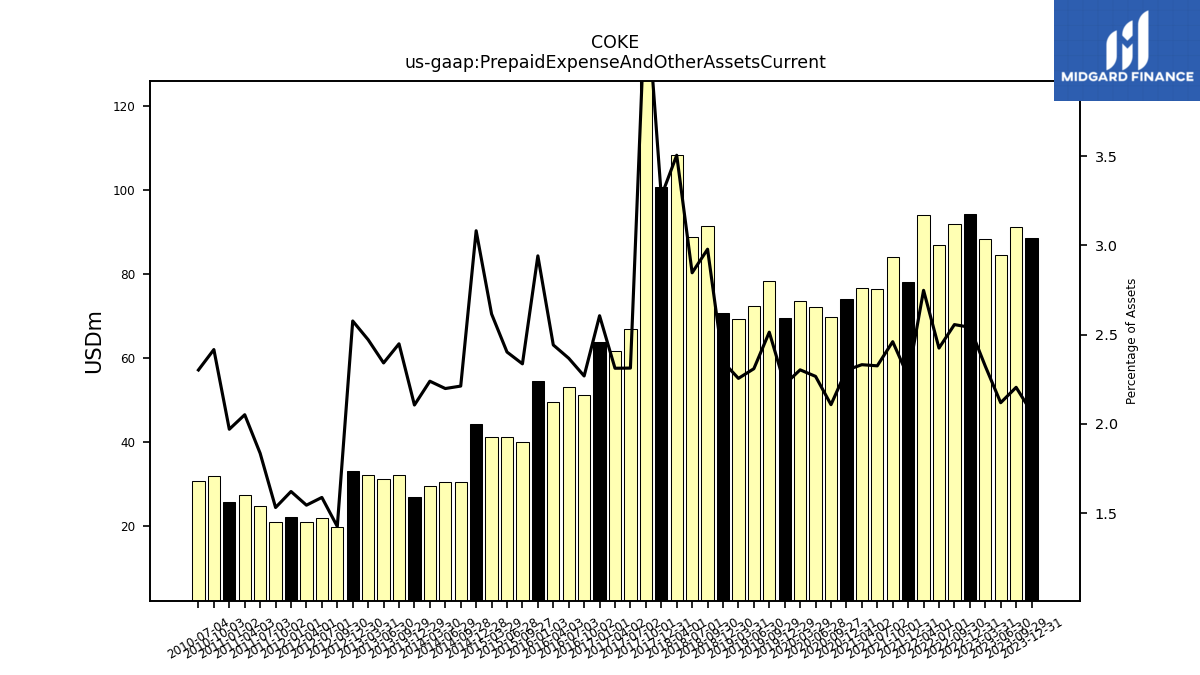
| Prepaid Expense And Other Assets Current | 88.58 | 91.31 | 84.63 | 88.29 | 94.26 | 91.96 | 86.84 | 94.15 | 78.07 | 84.15 | 76.32 | 76.59 | 74.15 | 69.83 | 72.17 | 73.59 | 69.46 | 78.40 | 72.33 | 69.36 | 70.68 | 91.51 | 88.90 | 108.32 | 100.65 | 129.67 | 66.87 | 61.60 | 63.83 | 51.13 | 53.17 | 49.43 | 54.44 | 39.97 | 41.08 | 41.14 | 44.17 | 30.46 | 30.32 | 29.56 | 26.87 | 32.21 | 31.10 | 32.09 | 33.07 | 19.82 | 21.83 | 20.99 | 22.07 | 20.80 | 24.82 | 27.31 | 25.76 | 31.82 | 30.58 |
| 2023-12-31 | 2023-09-29 | 2023-06-30 | 2023-03-31 | 2022-12-31 | 2022-09-30 | 2022-07-01 | 2022-04-01 | 2021-12-31 | 2021-10-01 | 2021-07-02 | 2021-04-02 | 2020-12-31 | 2020-09-27 | 2020-06-28 | 2020-03-29 | 2019-12-29 | 2019-09-29 | 2019-06-30 | 2019-03-31 | 2018-12-30 | 2018-09-30 | 2018-07-01 | 2018-04-01 | 2017-12-31 | 2017-10-01 | 2017-07-02 | 2017-04-02 | 2017-01-01 | 2016-10-02 | 2016-07-03 | 2016-04-03 | 2016-01-03 | 2015-09-27 | 2015-06-28 | 2015-03-29 | 2014-12-28 | 2014-09-28 | 2014-06-29 | 2014-03-30 | 2013-12-29 | 2013-09-29 | 2013-06-30 | 2013-03-31 | 2012-12-30 | 2012-09-30 | 2012-07-01 | 2012-04-01 | 2012-01-01 | 2011-10-02 | 2011-07-03 | 2011-04-03 | 2011-01-02 | 2010-10-03 | 2010-07-04 | ||
|---|---|---|---|---|---|---|---|---|---|---|---|---|---|---|---|---|---|---|---|---|---|---|---|---|---|---|---|---|---|---|---|---|---|---|---|---|---|---|---|---|---|---|---|---|---|---|---|---|---|---|---|---|---|---|---|---|
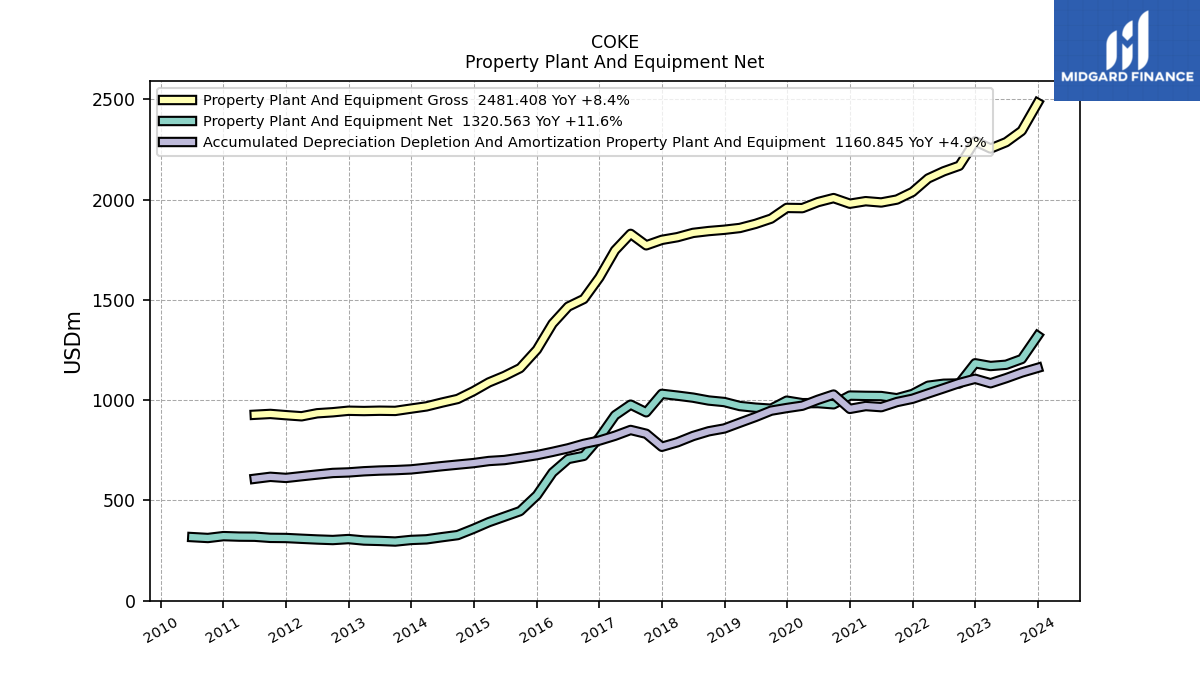
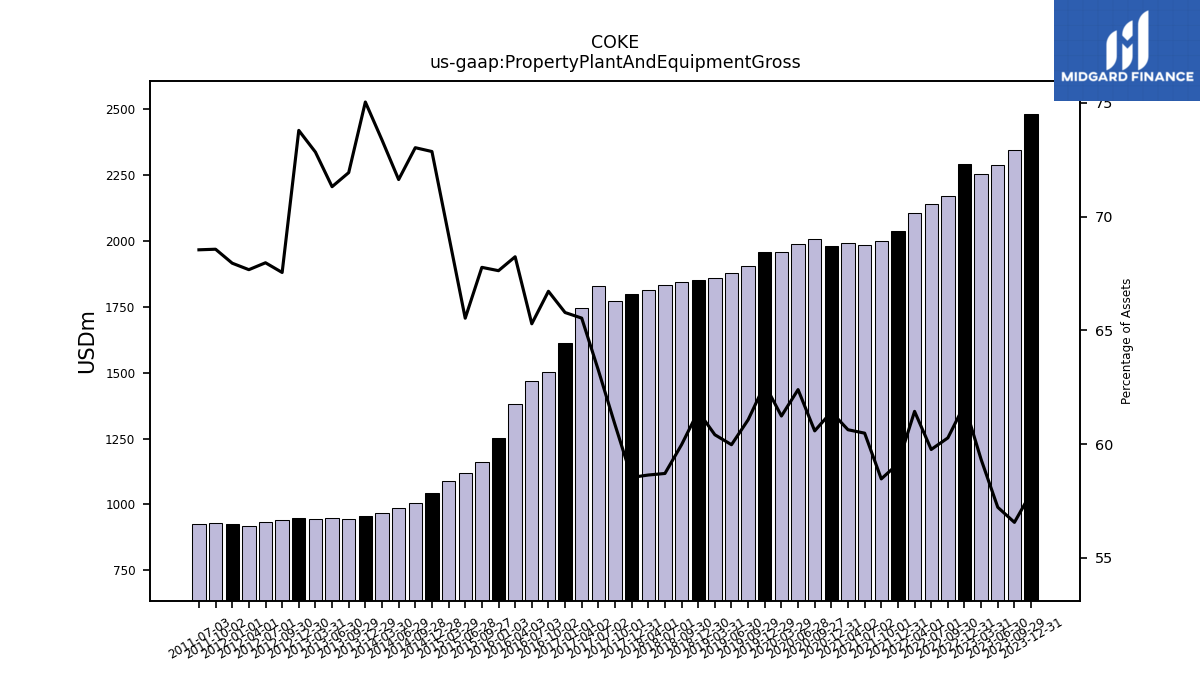
| Property Plant And Equipment Gross | 2481.41 | 2342.37 | 2285.85 | 2254.12 | 2289.99 | 2168.26 | 2140.61 | 2104.90 | 2037.46 | 1999.72 | 1985.23 | 1991.69 | 1979.01 | 2007.07 | 1987.12 | 1956.97 | 1958.08 | 1904.66 | 1878.51 | 1858.12 | 1849.20 | 1842.73 | 1833.53 | 1812.32 | 1798.82 | 1771.57 | 1828.86 | 1746.55 | 1611.44 | 1503.90 | 1466.30 | 1381.06 | 1251.64 | 1159.49 | 1120.68 | 1088.39 | 1044.21 | 1005.76 | 987.94 | 968.70 | 957.65 | 946.25 | 947.26 | 945.64 | 947.12 | 939.59 | 934.47 | 919.45 | 925.00 | 931.22 | 927.07 | NA | NA | NA | NA | |
| Accumulated Depreciation Depletion And Amortization Property Plant And Equipment | 1160.85 | 1137.53 | 1109.51 | 1084.11 | 1106.26 | 1085.32 | 1059.01 | 1033.17 | 1006.78 | 990.40 | 964.94 | 970.49 | 956.29 | 1027.86 | 1001.94 | 972.20 | 960.67 | 947.47 | 916.11 | 887.62 | 858.67 | 844.61 | 821.11 | 790.00 | 767.44 | 832.30 | 851.30 | 822.38 | 798.45 | 781.88 | 759.82 | 742.16 | 725.82 | 712.71 | 701.41 | 696.55 | 685.98 | 678.52 | 670.96 | 662.63 | 654.65 | 651.10 | 649.00 | 645.41 | 639.65 | 636.95 | 629.13 | 620.88 | 612.21 | 617.71 | 607.95 | NA | NA | NA | NA | |
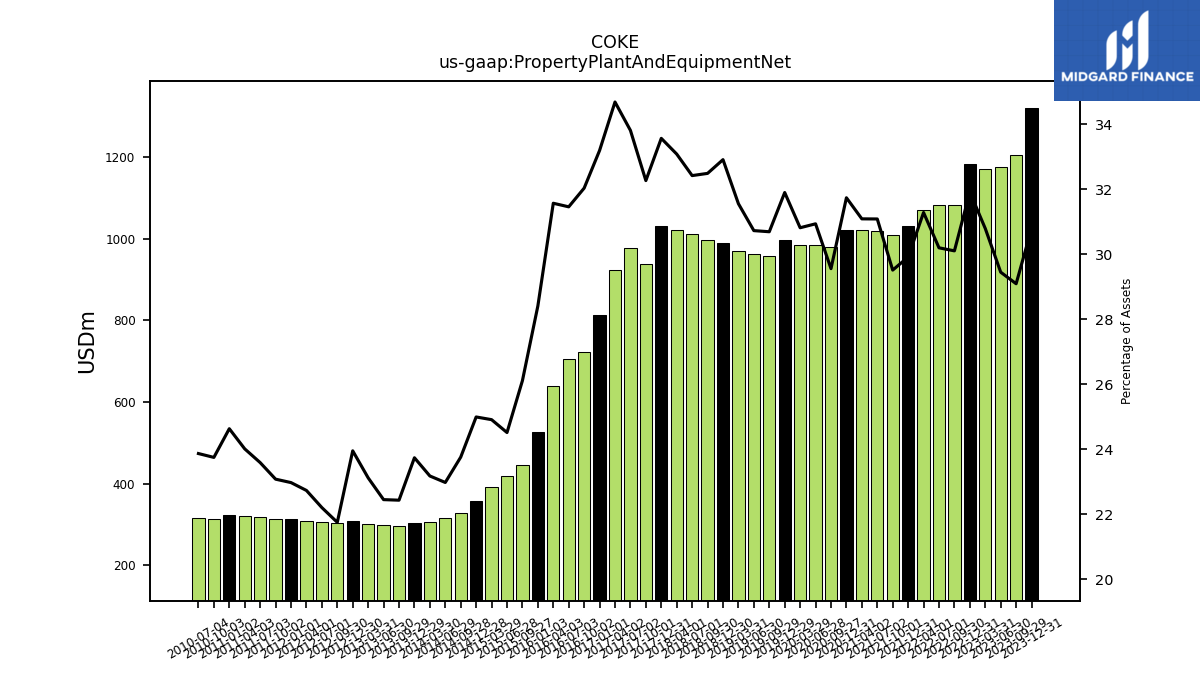
| Property Plant And Equipment Net | 1320.56 | 1204.84 | 1176.34 | 1170.00 | 1183.73 | 1082.94 | 1081.60 | 1071.73 | 1030.69 | 1009.33 | 1020.29 | 1021.20 | 1022.72 | 979.21 | 985.18 | 984.77 | 997.40 | 957.20 | 962.40 | 970.50 | 990.53 | 998.12 | 1012.42 | 1022.33 | 1031.39 | 939.27 | 977.55 | 924.18 | 812.99 | 722.02 | 706.47 | 638.90 | 525.82 | 446.78 | 419.26 | 391.84 | 358.23 | 327.24 | 316.98 | 306.07 | 303.00 | 295.15 | 298.26 | 300.23 | 307.47 | 302.64 | 305.34 | 308.94 | 312.79 | 313.51 | 319.12 | 319.68 | 322.14 | 312.76 | 317.14 | |
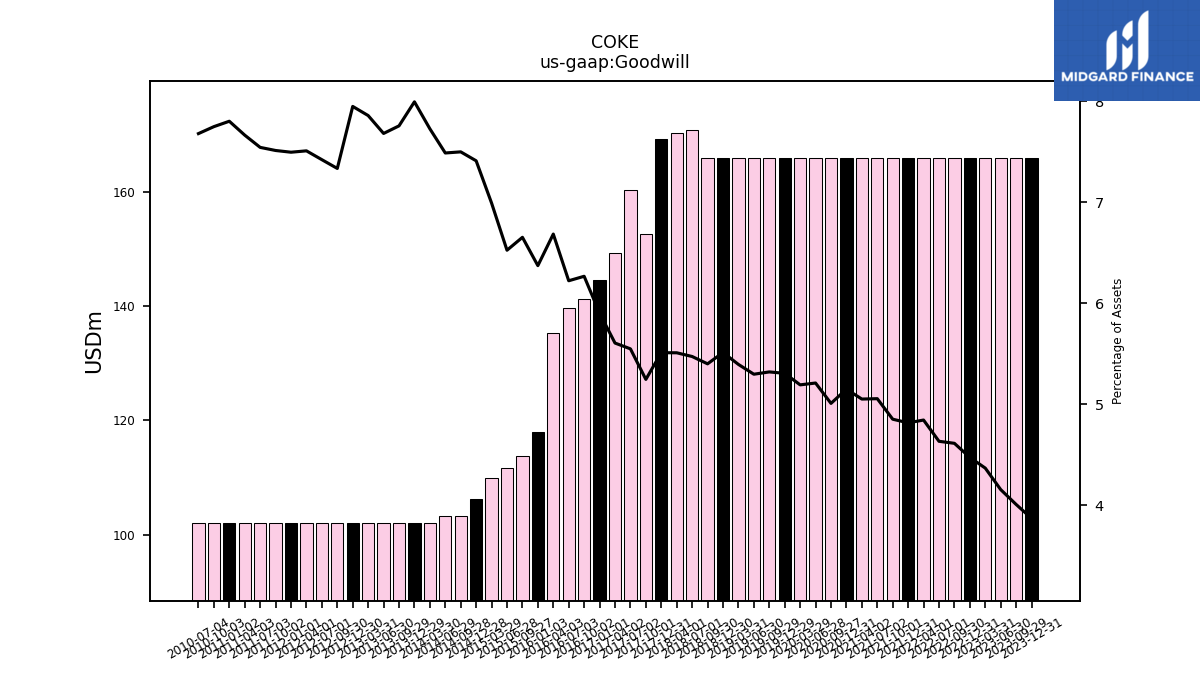
| Goodwill | 165.90 | 165.90 | 165.90 | 165.90 | 165.90 | 165.90 | 165.90 | 165.90 | 165.90 | 165.90 | 165.90 | 165.90 | 165.90 | 165.90 | 165.90 | 165.90 | 165.90 | 165.90 | 165.90 | 165.90 | 165.90 | 165.90 | 170.90 | 170.26 | 169.32 | 152.70 | 160.43 | 149.38 | 144.59 | 141.27 | 139.76 | 135.31 | 117.95 | 113.83 | 111.59 | 109.98 | 106.22 | 103.29 | 103.29 | 102.05 | 102.05 | 102.05 | 102.05 | 102.05 | 102.05 | 102.05 | 102.05 | 102.05 | 102.05 | 102.05 | 102.05 | 102.05 | 102.05 | 102.05 | 102.05 | |
| Other Assets Noncurrent | 145.21 | 133.96 | 132.02 | 125.31 | 115.89 | 112.47 | 112.13 | 119.34 | 120.49 | 120.23 | 117.25 | 113.00 | 111.78 | 111.78 | 109.82 | 106.43 | 113.27 | 111.02 | 113.03 | 113.54 | 115.49 | 119.19 | 116.09 | 115.52 | 116.21 | 104.11 | 99.59 | 92.42 | 86.09 | 82.61 | 79.06 | 68.30 | 66.89 | 63.51 | 64.61 | 64.01 | 60.83 | 60.50 | 60.34 | 59.96 | 58.56 | 62.62 | 61.17 | 56.74 | 53.80 | 53.77 | 54.02 | 52.86 | 49.60 | 51.81 | 52.32 | 51.46 | 46.33 | 40.65 | 41.03 |
| 2023-12-31 | 2023-09-29 | 2023-06-30 | 2023-03-31 | 2022-12-31 | 2022-09-30 | 2022-07-01 | 2022-04-01 | 2021-12-31 | 2021-10-01 | 2021-07-02 | 2021-04-02 | 2020-12-31 | 2020-09-27 | 2020-06-28 | 2020-03-29 | 2019-12-29 | 2019-09-29 | 2019-06-30 | 2019-03-31 | 2018-12-30 | 2018-09-30 | 2018-07-01 | 2018-04-01 | 2017-12-31 | 2017-10-01 | 2017-07-02 | 2017-04-02 | 2017-01-01 | 2016-10-02 | 2016-07-03 | 2016-04-03 | 2016-01-03 | 2015-09-27 | 2015-06-28 | 2015-03-29 | 2014-12-28 | 2014-09-28 | 2014-06-29 | 2014-03-30 | 2013-12-29 | 2013-09-29 | 2013-06-30 | 2013-03-31 | 2012-12-30 | 2012-09-30 | 2012-07-01 | 2012-04-01 | 2012-01-01 | 2011-10-02 | 2011-07-03 | 2011-04-03 | 2011-01-02 | 2010-10-03 | 2010-07-04 | ||
|---|---|---|---|---|---|---|---|---|---|---|---|---|---|---|---|---|---|---|---|---|---|---|---|---|---|---|---|---|---|---|---|---|---|---|---|---|---|---|---|---|---|---|---|---|---|---|---|---|---|---|---|---|---|---|---|---|
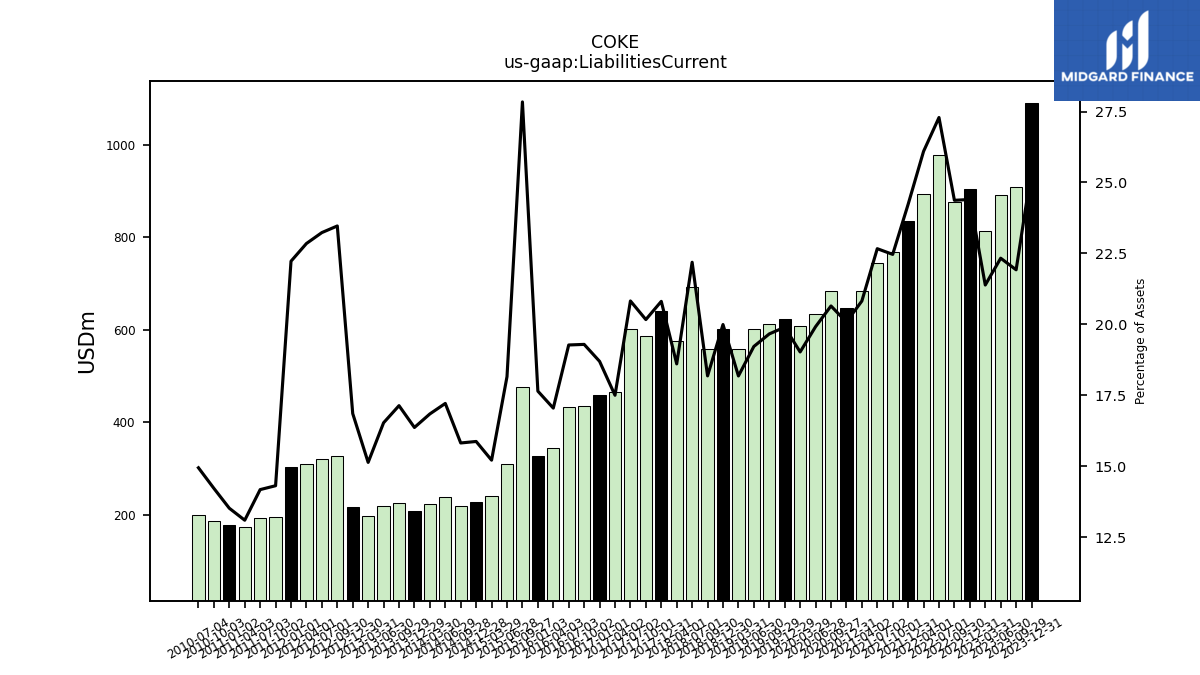
| Liabilities Current | 1091.33 | 907.83 | 891.98 | 812.58 | 905.16 | 876.70 | 977.43 | 894.07 | 834.86 | 768.30 | 743.95 | 683.91 | 647.06 | 683.99 | 634.23 | 607.99 | 622.20 | 613.17 | 601.95 | 559.14 | 601.74 | 558.62 | 692.92 | 574.96 | 639.45 | 587.08 | 602.09 | 466.31 | 457.91 | 434.84 | 432.78 | 344.97 | 326.55 | 476.30 | 310.45 | 239.21 | 227.42 | 217.81 | 237.36 | 222.34 | 208.82 | 225.34 | 219.53 | 196.45 | 216.31 | 326.43 | 319.40 | 310.44 | 302.51 | 194.33 | 191.68 | 174.29 | 176.74 | 187.19 | 198.50 | |
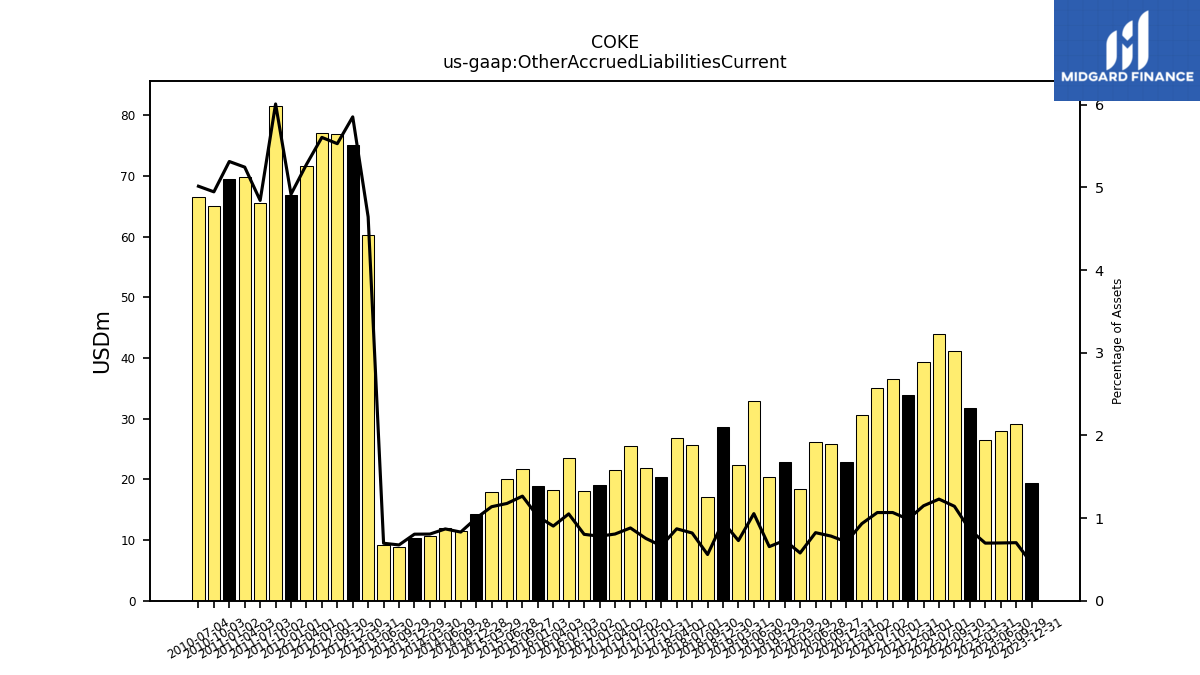
| Other Accrued Liabilities Current | 19.43 | 29.08 | 27.92 | 26.48 | 31.85 | 41.10 | 44.03 | 39.35 | 33.97 | 36.50 | 35.01 | 30.63 | 22.93 | 25.91 | 26.23 | 18.47 | 22.84 | 20.41 | 33.01 | 22.39 | 28.69 | 17.18 | 25.59 | 26.89 | 20.42 | 21.95 | 25.46 | 21.51 | 19.12 | 18.11 | 23.59 | 18.28 | 18.85 | 21.65 | 20.12 | 17.89 | 14.31 | 11.44 | 11.98 | 10.65 | 10.28 | 8.88 | 9.24 | 60.27 | 75.11 | 76.90 | 77.04 | 71.70 | 66.92 | 81.60 | 65.49 | 69.81 | 69.47 | 65.12 | 66.61 | |
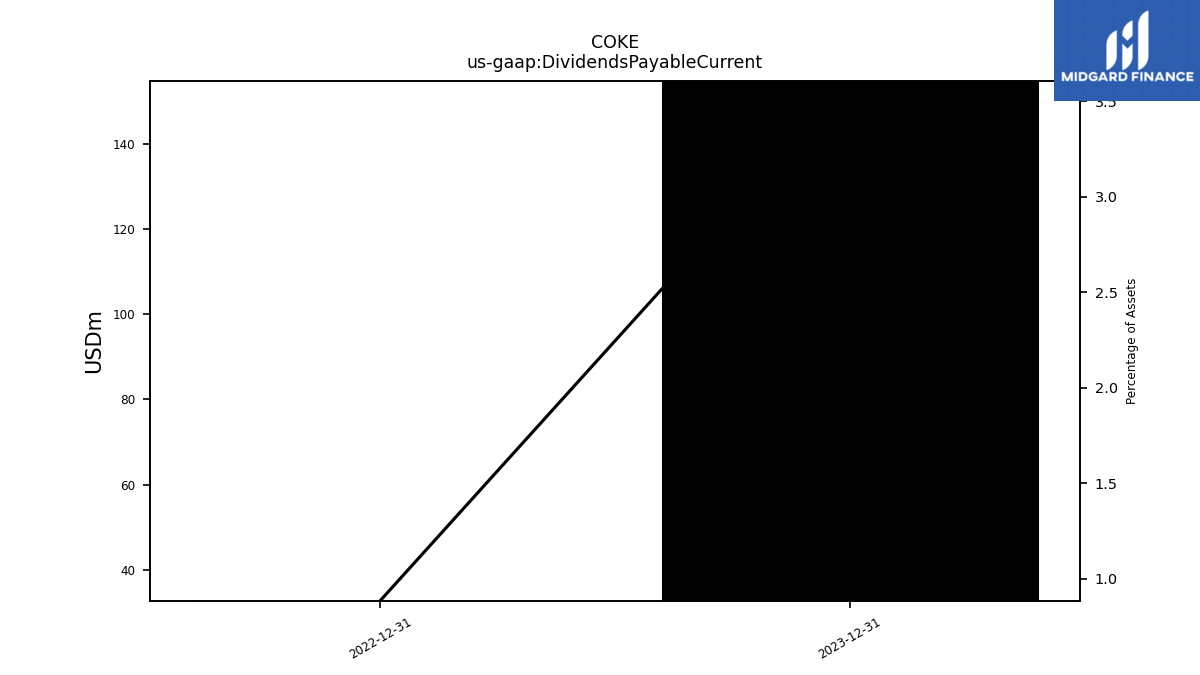
| Dividends Payable Current | 154.67 | NA | NA | NA | 32.81 | NA | NA | NA | NA | NA | NA | NA | NA | NA | NA | NA | NA | NA | NA | NA | NA | NA | NA | NA | NA | NA | NA | NA | NA | NA | NA | NA | NA | NA | NA | NA | NA | NA | NA | NA | NA | NA | NA | NA | NA | NA | NA | NA | NA | NA | NA | NA | NA | NA | NA | |
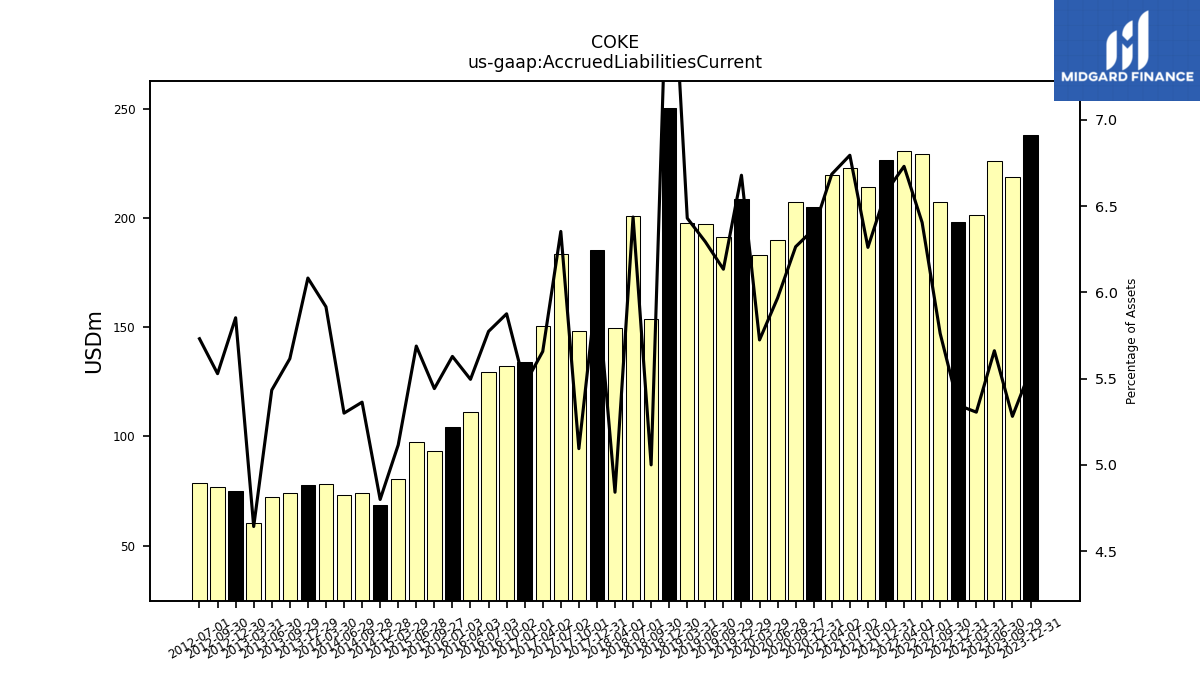
| Accrued Liabilities Current | 237.99 | 218.70 | 226.13 | 201.58 | 198.30 | 207.25 | 229.40 | 230.57 | 226.77 | 214.10 | 223.01 | 219.58 | 205.14 | 207.52 | 190.02 | 182.92 | 208.83 | 191.30 | 197.10 | 197.75 | 250.25 | 153.61 | 201.00 | 149.61 | 185.53 | 148.28 | 183.68 | 150.75 | 133.88 | 132.43 | 129.65 | 111.22 | 104.17 | 93.10 | 97.27 | 80.45 | 68.78 | 73.86 | 73.09 | 78.11 | 77.62 | 73.86 | 72.16 | 60.27 | 75.11 | 76.90 | 78.78 | NA | NA | NA | NA | NA | NA | NA | NA |
| 2023-12-31 | 2023-09-29 | 2023-06-30 | 2023-03-31 | 2022-12-31 | 2022-09-30 | 2022-07-01 | 2022-04-01 | 2021-12-31 | 2021-10-01 | 2021-07-02 | 2021-04-02 | 2020-12-31 | 2020-09-27 | 2020-06-28 | 2020-03-29 | 2019-12-29 | 2019-09-29 | 2019-06-30 | 2019-03-31 | 2018-12-30 | 2018-09-30 | 2018-07-01 | 2018-04-01 | 2017-12-31 | 2017-10-01 | 2017-07-02 | 2017-04-02 | 2017-01-01 | 2016-10-02 | 2016-07-03 | 2016-04-03 | 2016-01-03 | 2015-09-27 | 2015-06-28 | 2015-03-29 | 2014-12-28 | 2014-09-28 | 2014-06-29 | 2014-03-30 | 2013-12-29 | 2013-09-29 | 2013-06-30 | 2013-03-31 | 2012-12-30 | 2012-09-30 | 2012-07-01 | 2012-04-01 | 2012-01-01 | 2011-10-02 | 2011-07-03 | 2011-04-03 | 2011-01-02 | 2010-10-03 | 2010-07-04 | ||
|---|---|---|---|---|---|---|---|---|---|---|---|---|---|---|---|---|---|---|---|---|---|---|---|---|---|---|---|---|---|---|---|---|---|---|---|---|---|---|---|---|---|---|---|---|---|---|---|---|---|---|---|---|---|---|---|---|
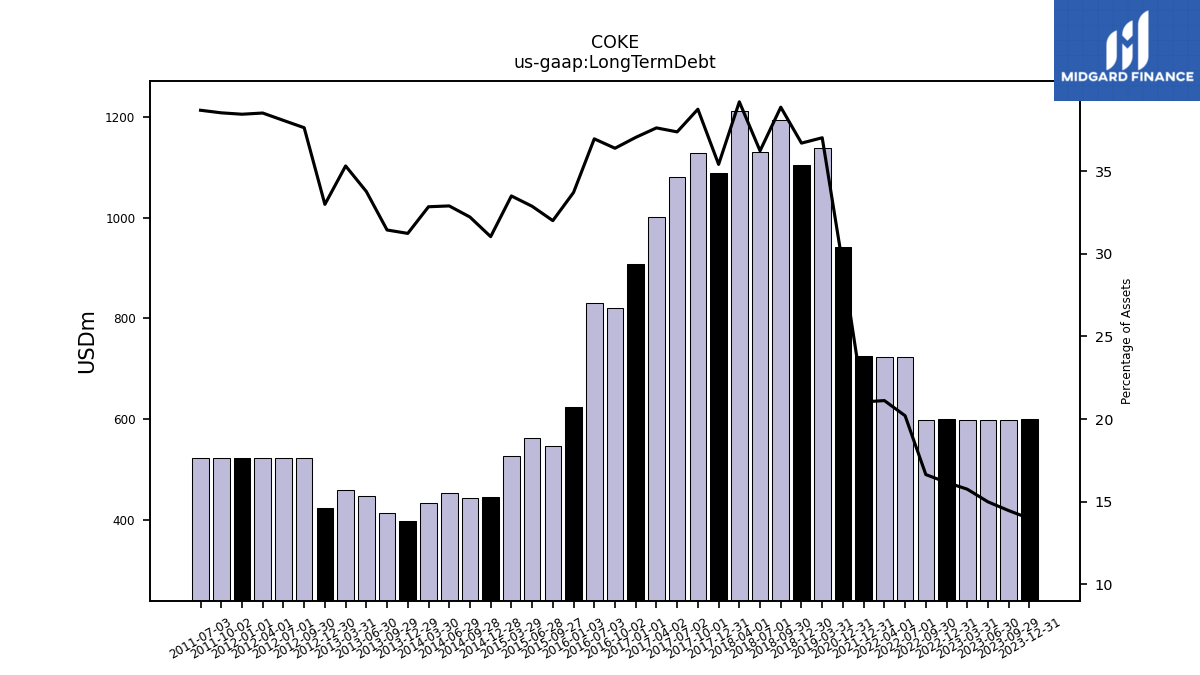
| Long Term Debt | 600.00 | 599.12 | 598.99 | 598.86 | 600.00 | 598.78 | 723.63 | 723.57 | 725.00 | NA | NA | NA | 942.50 | NA | NA | NA | NA | NA | NA | 1138.50 | 1104.40 | 1194.11 | 1131.31 | 1211.11 | 1088.02 | 1127.85 | 1080.58 | 1002.31 | 907.25 | 820.06 | 829.82 | NA | 623.88 | 547.52 | 562.11 | 526.81 | 444.76 | 443.71 | 453.66 | 433.61 | 398.57 | 413.52 | 448.48 | 458.43 | 423.39 | 523.34 | 523.30 | 523.26 | 523.22 | 523.18 | 523.14 | NA | NA | NA | NA | |
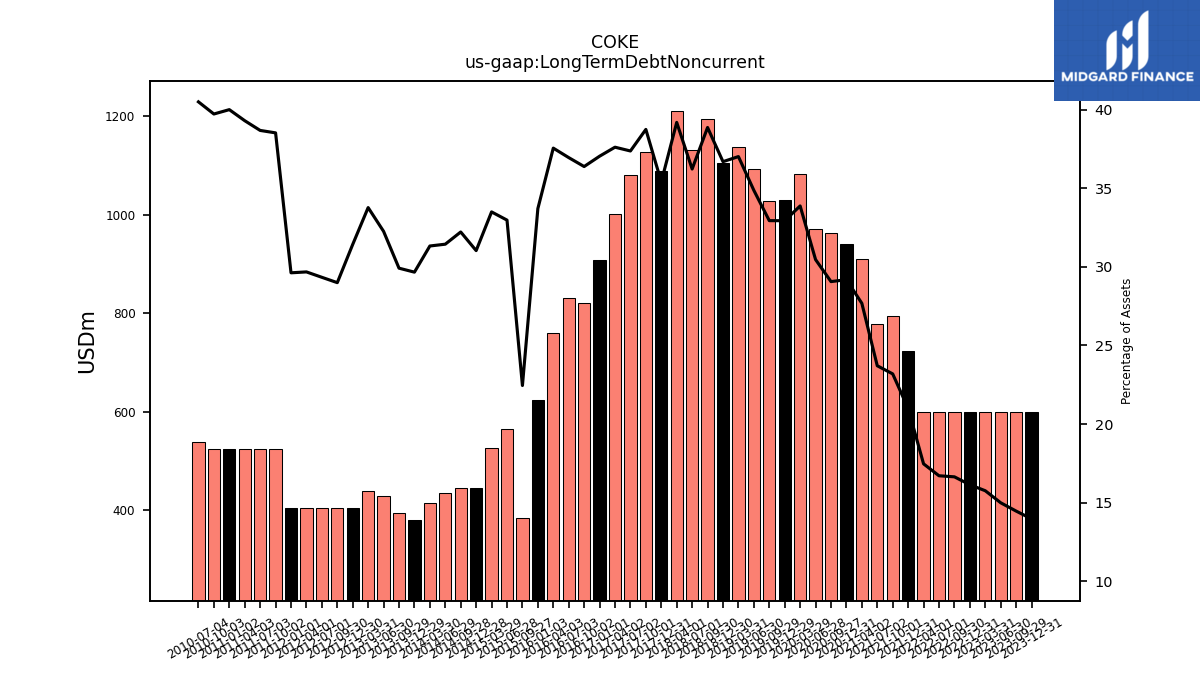
| Long Term Debt Noncurrent | 599.16 | 599.12 | 598.99 | 598.86 | 598.82 | 598.78 | 598.63 | 598.57 | 723.44 | 793.18 | 778.24 | 909.30 | 940.47 | 962.87 | 970.17 | 1082.59 | 1029.92 | 1027.34 | 1092.15 | 1138.50 | 1104.40 | 1194.11 | 1131.31 | 1211.11 | 1088.02 | 1127.85 | 1080.58 | 1002.31 | 907.25 | 820.06 | 829.82 | 760.04 | 623.88 | 384.15 | 563.86 | 526.81 | 444.76 | 443.71 | 433.66 | 413.61 | 378.57 | 393.52 | 428.48 | 438.43 | 403.39 | 403.34 | 403.30 | 403.26 | 403.22 | 523.18 | 523.14 | 523.10 | 523.06 | 523.02 | 537.99 | |
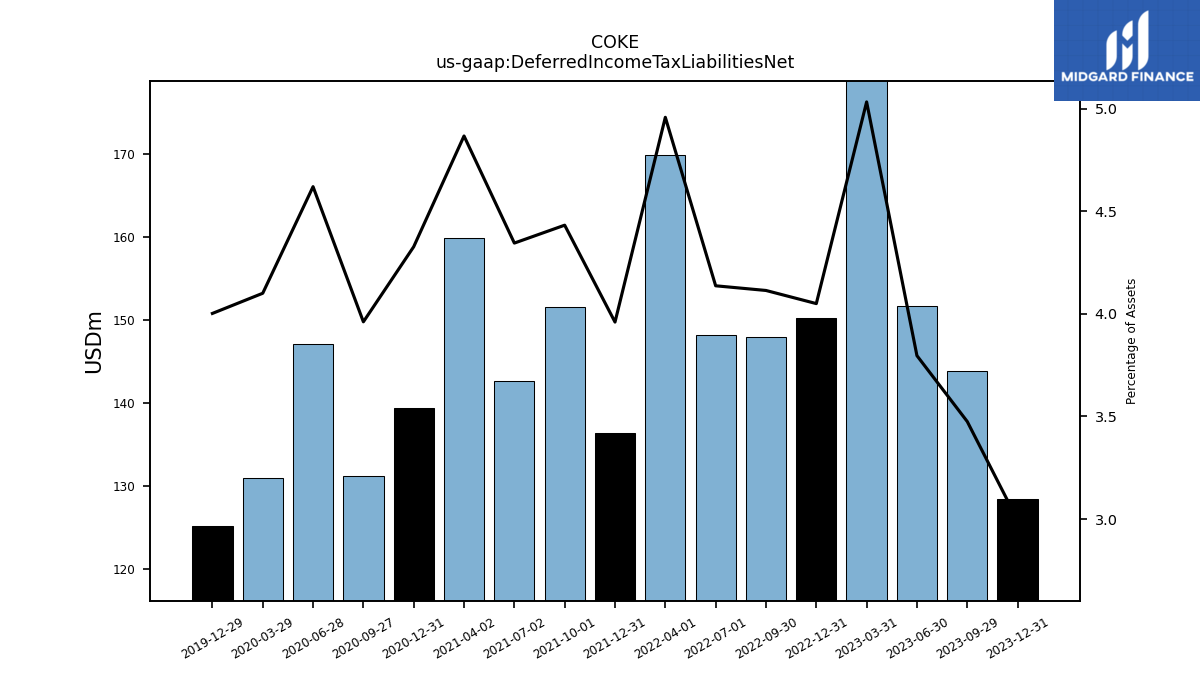
| Deferred Income Tax Liabilities Net | 128.44 | 143.91 | 151.63 | 191.20 | 150.22 | 147.98 | 148.15 | 169.83 | 136.43 | 151.56 | 142.60 | 159.84 | 139.42 | 131.22 | 147.10 | 131.02 | 125.13 | NA | NA | NA | NA | NA | NA | NA | NA | NA | NA | NA | NA | NA | NA | NA | NA | NA | NA | NA | NA | NA | NA | NA | NA | NA | NA | NA | NA | NA | NA | NA | NA | NA | NA | NA | NA | NA | NA | |
| Pension And Other Postretirement Defined Benefit Plans Liabilities Noncurrent | 60.61 | 53.29 | 55.78 | 62.85 | 60.32 | 76.38 | 99.49 | 96.40 | 93.39 | 110.58 | 116.45 | 115.31 | 113.33 | 103.43 | 117.84 | 116.64 | 114.83 | 84.36 | 87.30 | 85.37 | 85.68 | 98.74 | 118.66 | 118.49 | 118.39 | 99.83 | 126.31 | 126.47 | 126.68 | 106.87 | 117.92 | 115.00 | 115.20 | 122.78 | 133.55 | 133.81 | 134.10 | 80.99 | 89.16 | 89.83 | 90.60 | 138.29 | 139.16 | 139.93 | 140.72 | 119.77 | 122.25 | 124.43 | 138.16 | 106.55 | 111.74 | 113.29 | 114.16 | 81.02 | 88.47 | |
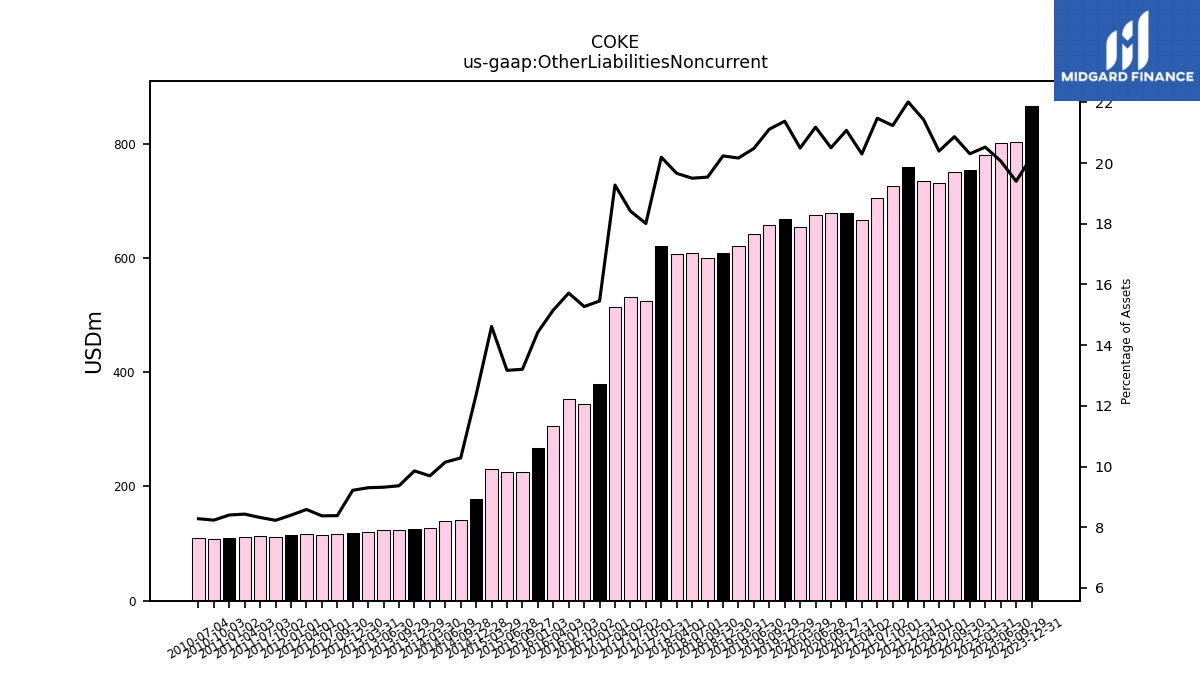
| Other Liabilities Noncurrent | 866.50 | 803.55 | 801.64 | 779.99 | 753.36 | 750.81 | 730.53 | 734.34 | 758.61 | 726.29 | 705.01 | 666.88 | 679.28 | 679.36 | 674.67 | 655.05 | 668.57 | 658.61 | 641.56 | 620.29 | 609.13 | 600.31 | 609.07 | 607.68 | 620.58 | 524.29 | 532.57 | 513.68 | 378.57 | 344.26 | 352.96 | 306.75 | 267.09 | 225.93 | 225.20 | 229.89 | 177.25 | 141.62 | 139.93 | 127.97 | 125.79 | 123.21 | 123.77 | 120.77 | 118.30 | 116.59 | 115.14 | 116.66 | 114.30 | 111.74 | 112.54 | 112.24 | 109.88 | 108.42 | 110.00 | |
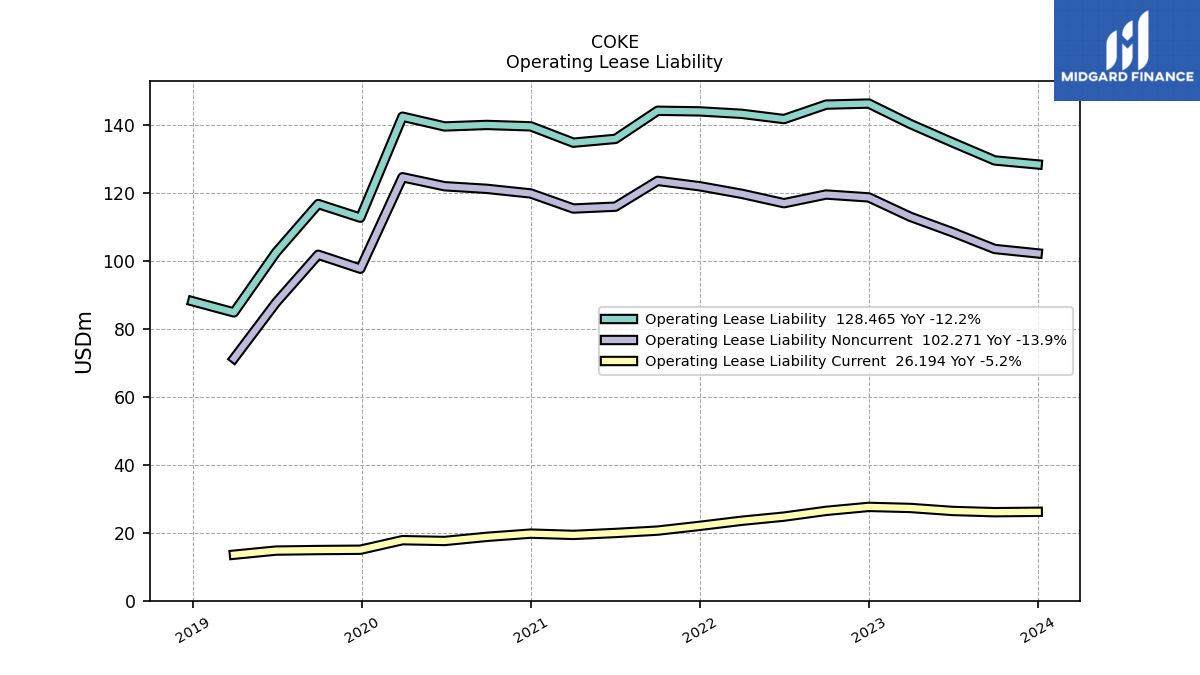
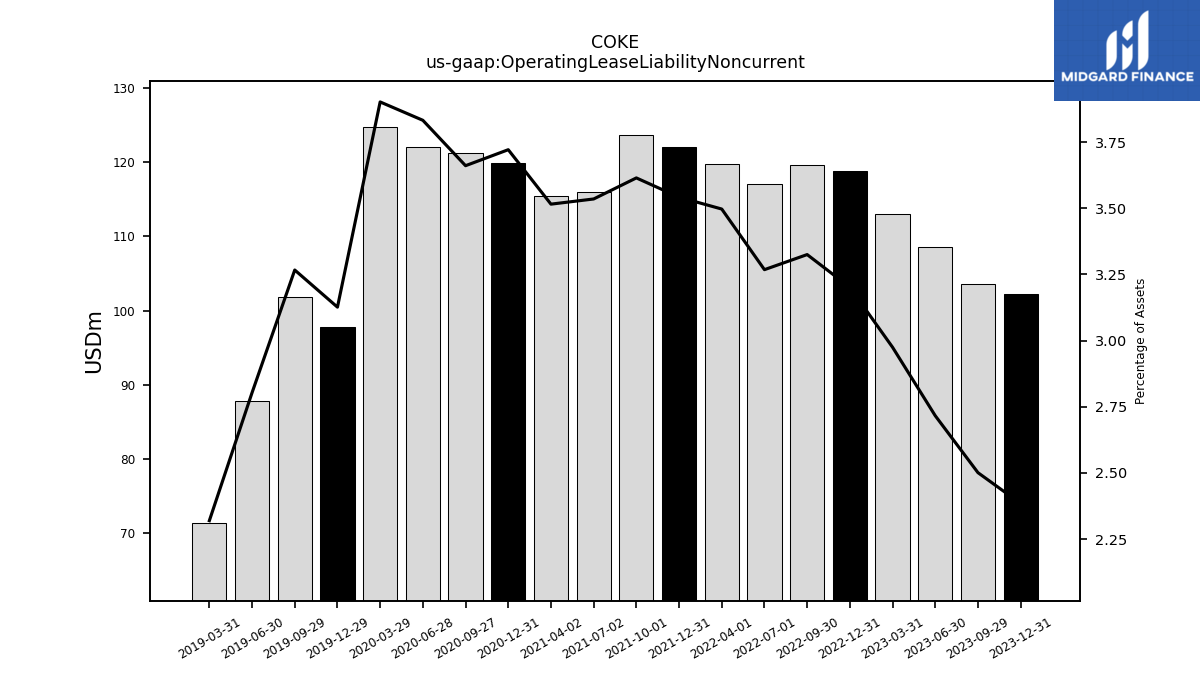
| Operating Lease Liability Noncurrent | 102.27 | 103.58 | 108.50 | 113.04 | 118.76 | 119.62 | 117.06 | 119.81 | 122.05 | 123.63 | 116.04 | 115.49 | 119.92 | 121.29 | 122.05 | 124.70 | 97.77 | 101.88 | 87.80 | 71.34 | NA | NA | NA | NA | NA | NA | NA | NA | NA | NA | NA | NA | NA | NA | NA | NA | NA | NA | NA | NA | NA | NA | NA | NA | NA | NA | NA | NA | NA | NA | NA | NA | NA | NA | NA |
| 2023-12-31 | 2023-09-29 | 2023-06-30 | 2023-03-31 | 2022-12-31 | 2022-09-30 | 2022-07-01 | 2022-04-01 | 2021-12-31 | 2021-10-01 | 2021-07-02 | 2021-04-02 | 2020-12-31 | 2020-09-27 | 2020-06-28 | 2020-03-29 | 2019-12-29 | 2019-09-29 | 2019-06-30 | 2019-03-31 | 2018-12-30 | 2018-09-30 | 2018-07-01 | 2018-04-01 | 2017-12-31 | 2017-10-01 | 2017-07-02 | 2017-04-02 | 2017-01-01 | 2016-10-02 | 2016-07-03 | 2016-04-03 | 2016-01-03 | 2015-09-27 | 2015-06-28 | 2015-03-29 | 2014-12-28 | 2014-09-28 | 2014-06-29 | 2014-03-30 | 2013-12-29 | 2013-09-29 | 2013-06-30 | 2013-03-31 | 2012-12-30 | 2012-09-30 | 2012-07-01 | 2012-04-01 | 2012-01-01 | 2011-10-02 | 2011-07-03 | 2011-04-03 | 2011-01-02 | 2010-10-03 | 2010-07-04 | ||
|---|---|---|---|---|---|---|---|---|---|---|---|---|---|---|---|---|---|---|---|---|---|---|---|---|---|---|---|---|---|---|---|---|---|---|---|---|---|---|---|---|---|---|---|---|---|---|---|---|---|---|---|---|---|---|---|---|
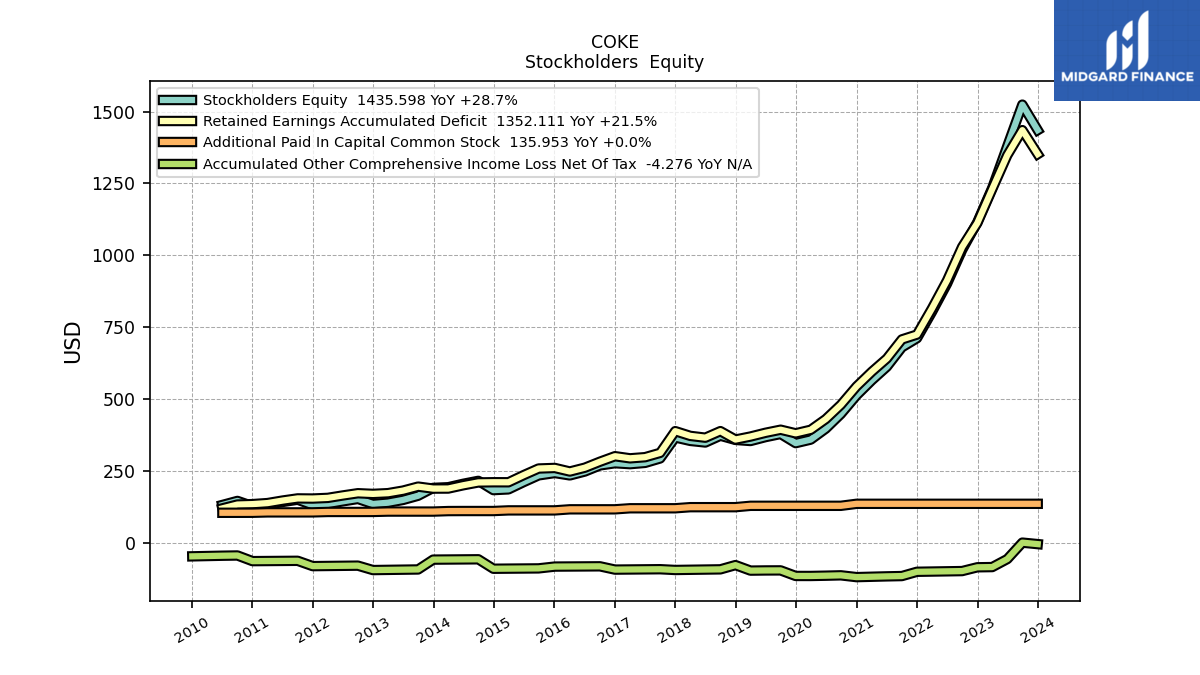
| Stockholders Equity | 1435.60 | 1524.33 | 1379.71 | 1234.25 | 1115.39 | 1018.91 | 901.68 | 803.65 | 711.79 | 680.14 | 612.50 | 565.34 | 512.99 | 448.24 | 397.42 | 359.22 | 346.95 | 378.85 | 367.99 | 354.37 | 358.19 | 372.76 | 349.21 | 354.75 | 366.70 | 293.76 | 278.33 | 273.86 | 277.13 | 269.47 | 248.35 | 234.73 | 243.06 | 234.84 | 211.18 | 186.16 | 183.61 | 215.82 | 205.62 | 193.60 | 191.32 | 164.01 | 149.44 | 139.82 | 135.26 | 152.89 | 144.56 | 135.55 | 131.30 | 150.23 | 142.38 | 133.21 | 127.89 | 145.95 | 131.90 | |
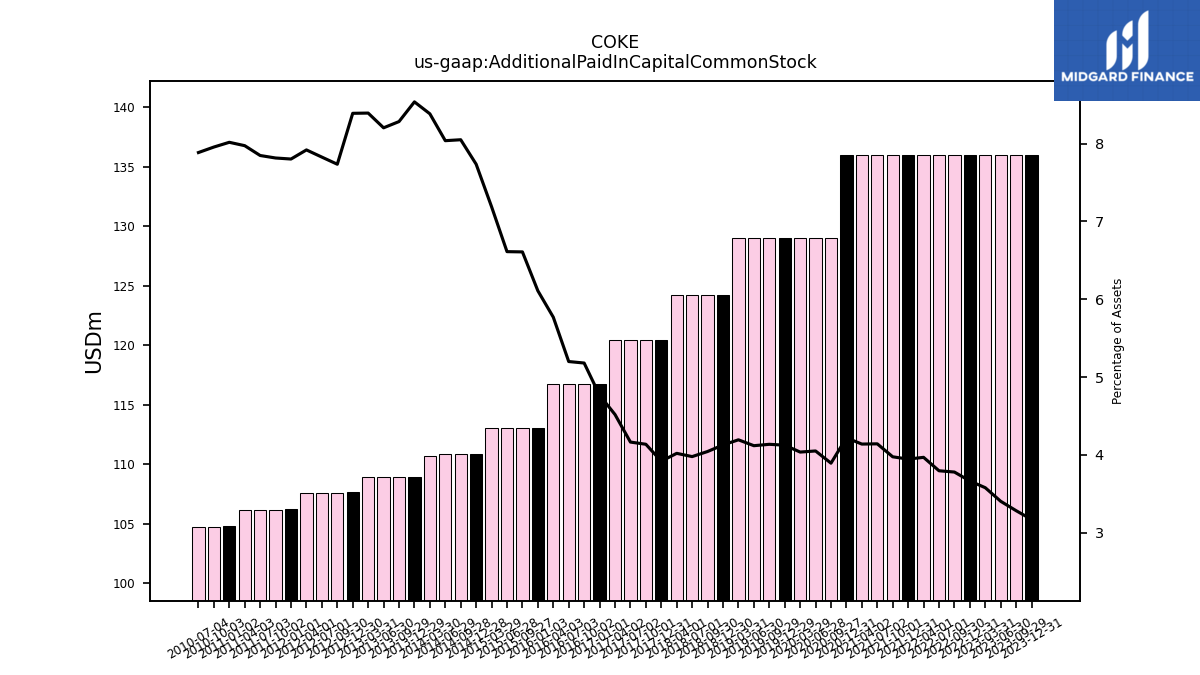
| Additional Paid In Capital Common Stock | 135.95 | 135.95 | 135.95 | 135.95 | 135.95 | 135.95 | 135.95 | 135.95 | 135.95 | 135.95 | 135.95 | 135.95 | 135.95 | 128.98 | 128.98 | 128.98 | 128.98 | 128.98 | 128.98 | 128.98 | 124.23 | 124.23 | 124.23 | 124.23 | 120.42 | 120.42 | 120.42 | 120.42 | 116.77 | 116.77 | 116.77 | 116.77 | 113.06 | 113.06 | 113.06 | 113.06 | 110.86 | 110.86 | 110.86 | 110.68 | 108.94 | 108.96 | 108.96 | 108.96 | 107.68 | 107.60 | 107.60 | 107.60 | 106.20 | 106.14 | 106.14 | 106.14 | 104.83 | 104.76 | 104.76 | |
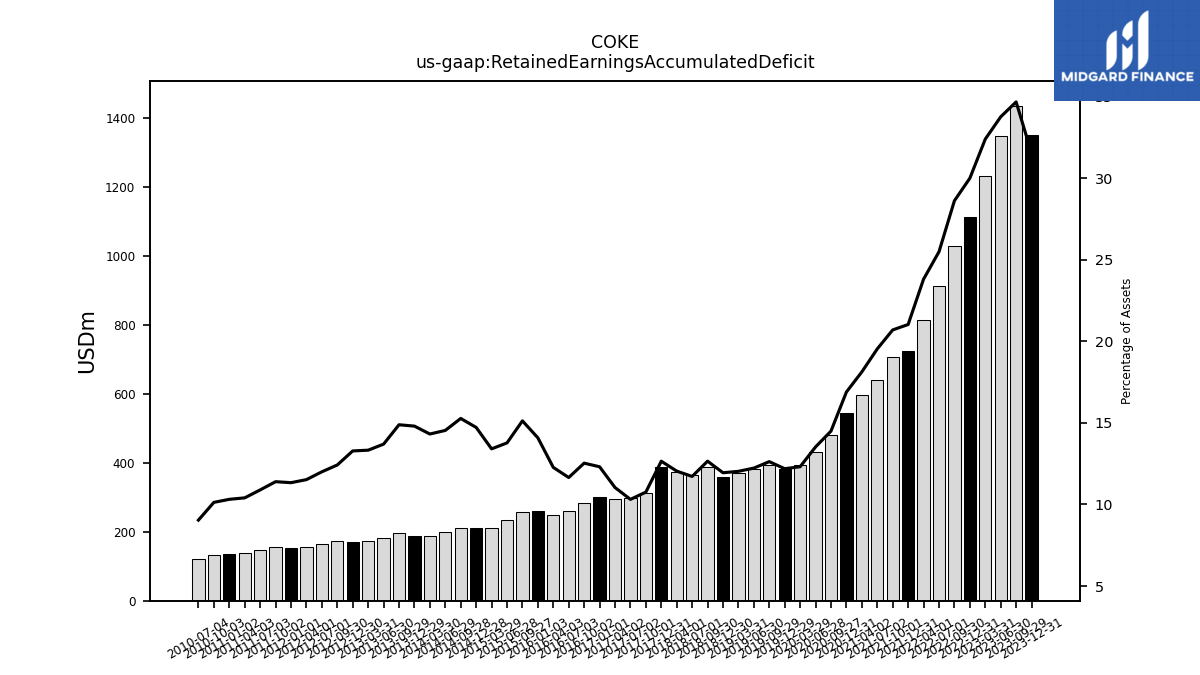
| Retained Earnings Accumulated Deficit | 1352.11 | 1435.63 | 1348.22 | 1230.59 | 1112.46 | 1029.17 | 912.75 | 815.53 | 724.49 | 707.72 | 641.14 | 595.30 | 544.28 | 480.25 | 430.71 | 393.48 | 381.16 | 393.67 | 383.01 | 369.99 | 359.44 | 388.75 | 365.93 | 372.20 | 388.72 | 313.13 | 298.15 | 294.13 | 301.51 | 282.44 | 261.63 | 248.31 | 260.67 | 258.70 | 235.47 | 210.86 | 210.96 | 210.28 | 200.47 | 189.01 | 188.87 | 195.77 | 181.91 | 172.99 | 170.44 | 172.75 | 164.98 | 156.54 | 154.28 | 154.75 | 147.29 | 138.49 | 134.87 | 133.35 | 120.11 | |
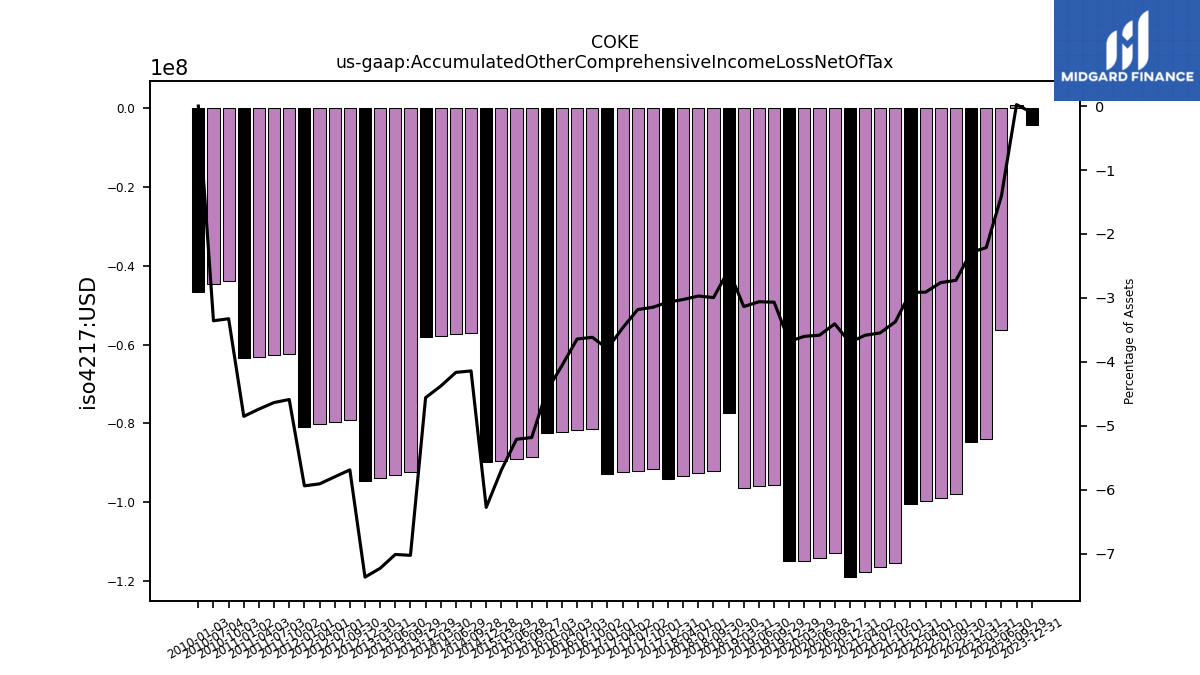
| Accumulated Other Comprehensive Income Loss Net Of Tax | -4.28 | 0.94 | -56.28 | -84.10 | -84.84 | -98.02 | -98.83 | -99.65 | -100.46 | -115.35 | -116.40 | -117.72 | -119.05 | -112.80 | -114.08 | -115.05 | -115.00 | -95.62 | -95.81 | -96.41 | -77.27 | -92.00 | -92.74 | -93.46 | -94.20 | -91.55 | -92.00 | -92.45 | -92.90 | -81.49 | -81.80 | -82.09 | -82.41 | -88.66 | -89.08 | -89.50 | -89.91 | -57.03 | -57.42 | -57.80 | -58.18 | -92.40 | -93.11 | -93.82 | -94.53 | -79.12 | -79.69 | -80.26 | -80.82 | -62.31 | -62.69 | -63.06 | -63.43 | -43.78 | -44.59 |
| 2023-12-31 | 2023-09-29 | 2023-06-30 | 2023-03-31 | 2022-12-31 | 2022-09-30 | 2022-07-01 | 2022-04-01 | 2021-12-31 | 2021-10-01 | 2021-07-02 | 2021-04-02 | 2020-12-31 | 2020-09-27 | 2020-06-28 | 2020-03-29 | 2019-12-29 | 2019-09-29 | 2019-06-30 | 2019-03-31 | 2018-12-30 | 2018-09-30 | 2018-07-01 | 2018-04-01 | 2017-12-31 | 2017-10-01 | 2017-07-02 | 2017-04-02 | 2017-01-01 | 2016-10-02 | 2016-07-03 | 2016-04-03 | 2016-01-03 | 2015-09-27 | 2015-06-28 | 2015-03-29 | 2014-12-28 | 2014-09-28 | 2014-06-29 | 2014-03-30 | 2013-12-29 | 2013-09-29 | 2013-06-30 | 2013-03-31 | 2012-12-30 | 2012-09-30 | 2012-07-01 | 2012-04-01 | 2012-01-01 | 2011-10-02 | 2011-07-03 | 2011-04-03 | 2011-01-02 | 2010-10-03 | 2010-07-04 | ||
|---|---|---|---|---|---|---|---|---|---|---|---|---|---|---|---|---|---|---|---|---|---|---|---|---|---|---|---|---|---|---|---|---|---|---|---|---|---|---|---|---|---|---|---|---|---|---|---|---|---|---|---|---|---|---|---|---|
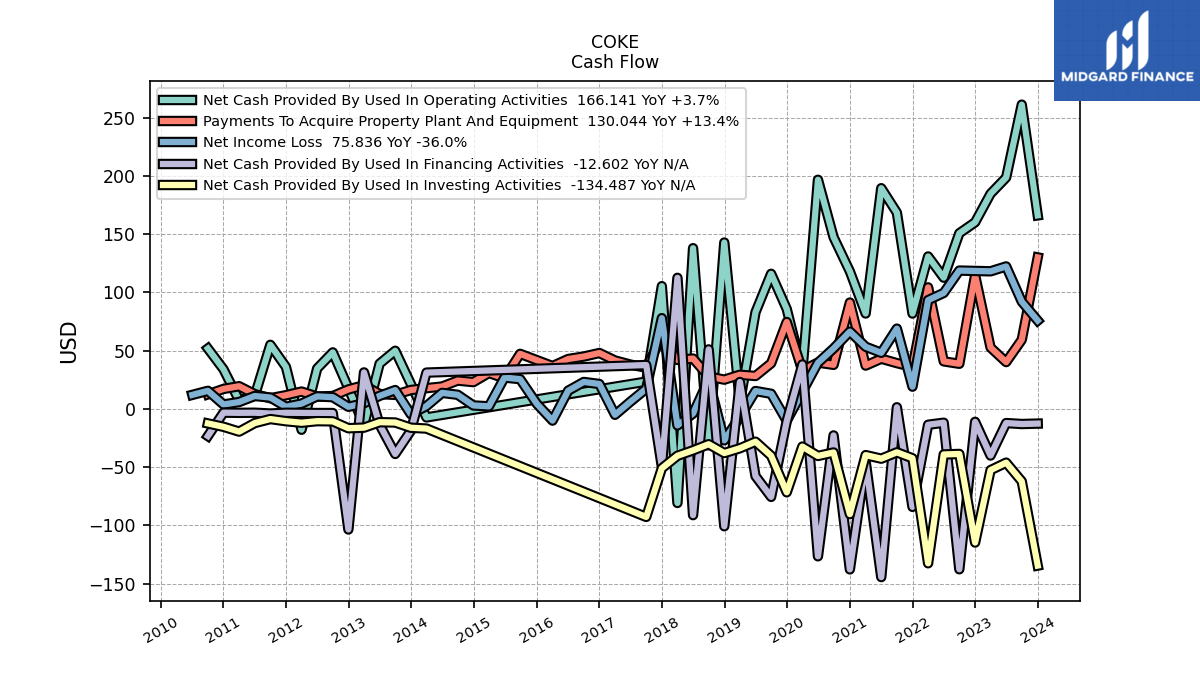
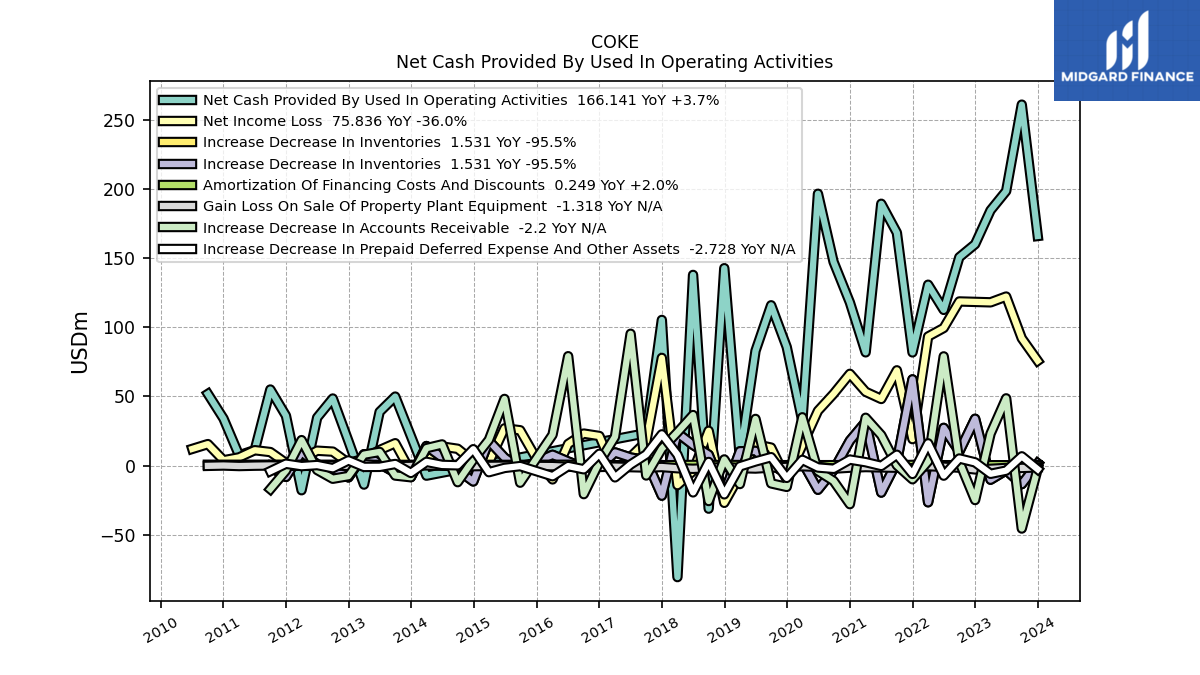
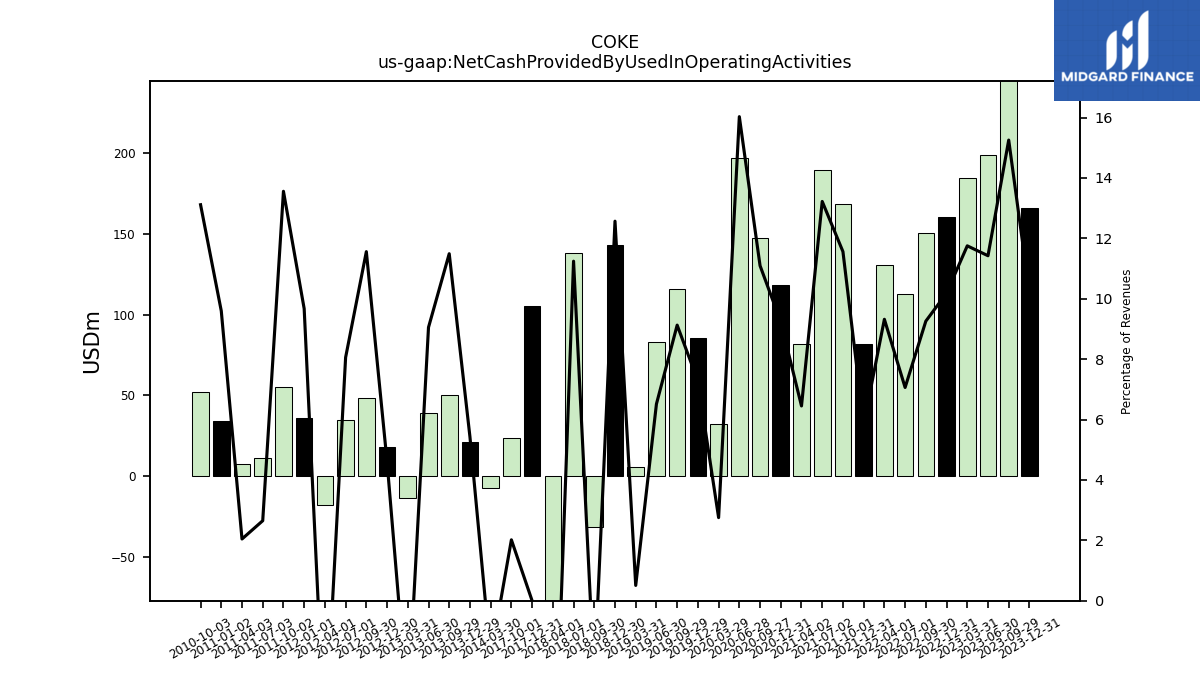
| Net Cash Provided By Used In Operating Activities | 166.14 | 261.21 | 198.64 | 184.69 | 160.20 | 150.77 | 112.65 | 130.88 | 81.88 | 168.49 | 189.47 | 81.91 | 118.06 | 147.40 | 196.71 | 32.29 | 85.79 | 116.00 | 82.99 | 5.60 | 142.85 | -31.21 | 137.99 | -80.75 | 105.39 | 23.45 | NA | NA | NA | NA | NA | NA | NA | NA | NA | NA | NA | NA | NA | -7.31 | 21.40 | 49.92 | 38.84 | -13.79 | 17.81 | 48.53 | 34.70 | -17.87 | 36.06 | 55.03 | 11.21 | 7.35 | 34.00 | 51.84 | NA | |
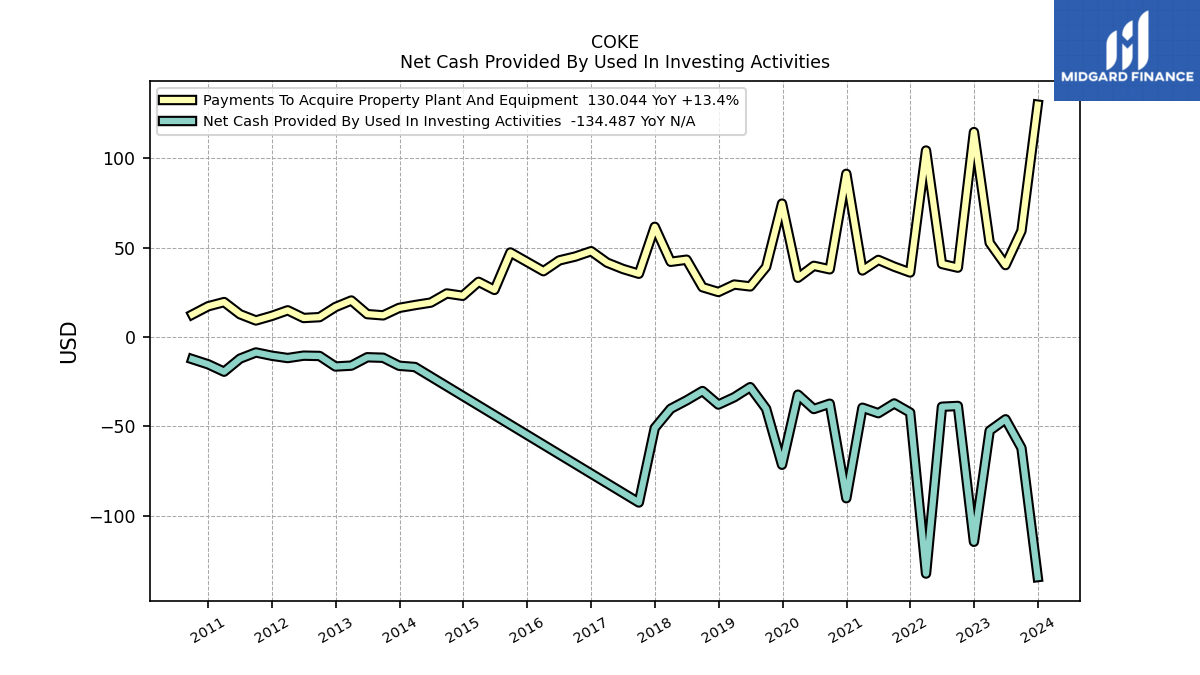
| Net Cash Provided By Used In Investing Activities | -134.49 | -62.20 | -46.12 | -52.54 | -114.72 | -38.65 | -39.09 | -132.52 | -42.35 | -37.24 | -42.71 | -39.64 | -90.33 | -37.39 | -40.38 | -32.33 | -71.59 | -40.19 | -28.12 | -33.77 | -37.90 | -30.29 | -35.53 | -40.22 | -50.99 | -92.72 | NA | NA | NA | NA | NA | NA | NA | NA | NA | NA | NA | NA | NA | -16.86 | -16.16 | -11.67 | -11.39 | -16.08 | -16.57 | -10.67 | -10.50 | -11.83 | -10.54 | -8.71 | -12.15 | -19.48 | -15.35 | -12.45 | NA | |
| Net Cash Provided By Used In Financing Activities | -12.60 | -12.96 | -12.14 | -40.02 | -11.08 | -137.68 | -11.84 | -13.59 | -84.10 | 1.43 | -144.39 | -45.23 | -137.76 | -22.74 | -126.54 | 38.17 | -10.57 | -75.51 | -57.67 | 23.13 | -100.74 | 51.12 | -91.21 | 112.55 | -49.42 | 37.67 | NA | NA | NA | NA | NA | NA | NA | NA | NA | NA | NA | NA | NA | 31.18 | -18.77 | -38.70 | -13.61 | 31.36 | -103.50 | -3.53 | -3.53 | -3.40 | -3.31 | -3.94 | -3.27 | -3.36 | -3.21 | -23.27 | NA |
| 2023-12-31 | 2023-09-29 | 2023-06-30 | 2023-03-31 | 2022-12-31 | 2022-09-30 | 2022-07-01 | 2022-04-01 | 2021-12-31 | 2021-10-01 | 2021-07-02 | 2021-04-02 | 2020-12-31 | 2020-09-27 | 2020-06-28 | 2020-03-29 | 2019-12-29 | 2019-09-29 | 2019-06-30 | 2019-03-31 | 2018-12-30 | 2018-09-30 | 2018-07-01 | 2018-04-01 | 2017-12-31 | 2017-10-01 | 2017-07-02 | 2017-04-02 | 2017-01-01 | 2016-10-02 | 2016-07-03 | 2016-04-03 | 2016-01-03 | 2015-09-27 | 2015-06-28 | 2015-03-29 | 2014-12-28 | 2014-09-28 | 2014-06-29 | 2014-03-30 | 2013-12-29 | 2013-09-29 | 2013-06-30 | 2013-03-31 | 2012-12-30 | 2012-09-30 | 2012-07-01 | 2012-04-01 | 2012-01-01 | 2011-10-02 | 2011-07-03 | 2011-04-03 | 2011-01-02 | 2010-10-03 | 2010-07-04 | ||
|---|---|---|---|---|---|---|---|---|---|---|---|---|---|---|---|---|---|---|---|---|---|---|---|---|---|---|---|---|---|---|---|---|---|---|---|---|---|---|---|---|---|---|---|---|---|---|---|---|---|---|---|---|---|---|---|---|
| Net Cash Provided By Used In Operating Activities | 166.14 | 261.21 | 198.64 | 184.69 | 160.20 | 150.77 | 112.65 | 130.88 | 81.88 | 168.49 | 189.47 | 81.91 | 118.06 | 147.40 | 196.71 | 32.29 | 85.79 | 116.00 | 82.99 | 5.60 | 142.85 | -31.21 | 137.99 | -80.75 | 105.39 | 23.45 | NA | NA | NA | NA | NA | NA | NA | NA | NA | NA | NA | NA | NA | -7.31 | 21.40 | 49.92 | 38.84 | -13.79 | 17.81 | 48.53 | 34.70 | -17.87 | 36.06 | 55.03 | 11.21 | 7.35 | 34.00 | 51.84 | NA | |
| Net Income Loss | 75.84 | 92.09 | 122.32 | 118.13 | 118.44 | 118.76 | 99.56 | 93.39 | 19.11 | 68.93 | 48.18 | 53.36 | 66.38 | 51.88 | 39.57 | 14.66 | -10.17 | 13.01 | 15.37 | -6.83 | -26.98 | 25.16 | -3.93 | -14.19 | 77.92 | 17.32 | 6.35 | -5.05 | 21.39 | 23.14 | 15.65 | -10.04 | 4.29 | 25.55 | 26.93 | 2.22 | 2.99 | 12.13 | 13.78 | 2.45 | -4.58 | 16.17 | 11.23 | 4.86 | 1.83 | 10.08 | 10.75 | 4.57 | 1.83 | 9.77 | 11.10 | 5.91 | 3.82 | 15.53 | 12.04 | |
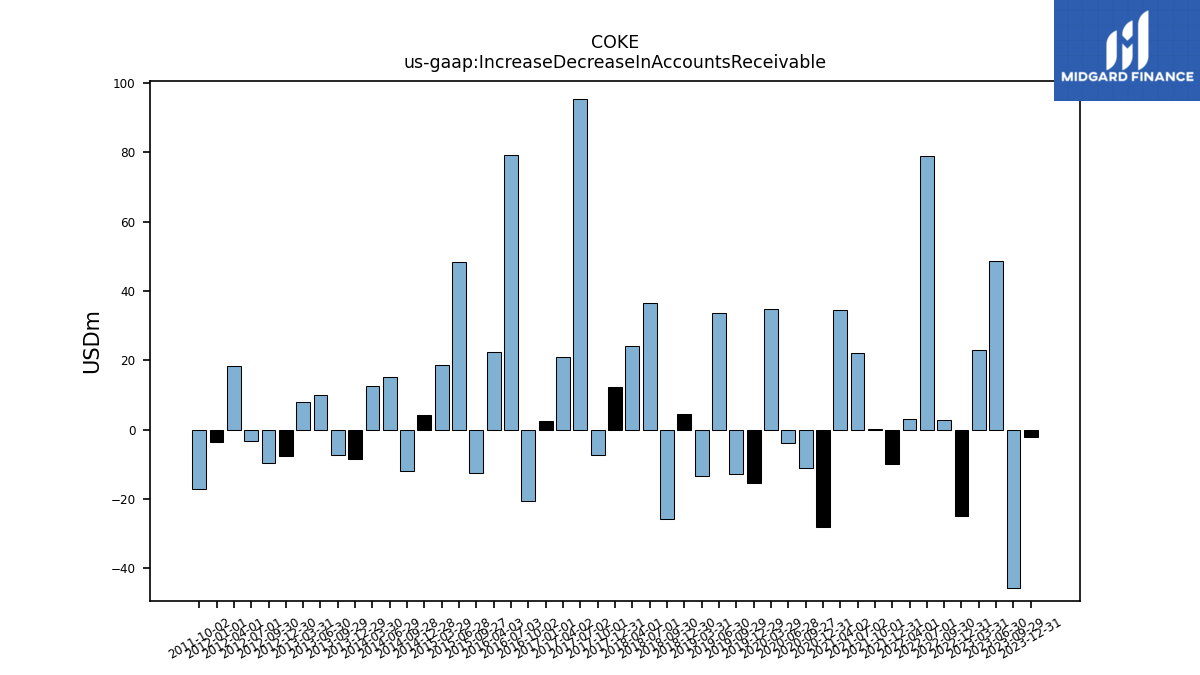
| Increase Decrease In Accounts Receivable | -2.20 | -45.59 | 48.64 | 23.04 | -24.98 | 2.70 | 79.03 | 3.03 | -9.94 | 0.21 | 21.98 | 34.58 | -27.96 | -11.10 | -3.99 | 34.94 | -15.45 | -12.90 | 33.76 | -13.39 | 4.43 | -25.69 | 36.55 | 24.04 | 12.18 | -7.20 | 95.39 | 20.83 | 2.48 | -20.70 | 79.15 | 22.28 | NA | -12.41 | 48.24 | 18.63 | 4.26 | -12.04 | 15.30 | 12.60 | -8.46 | -7.23 | 9.87 | 7.90 | -7.63 | -9.55 | -3.22 | 18.41 | -3.66 | -17.05 | NA | NA | NA | NA | NA | |
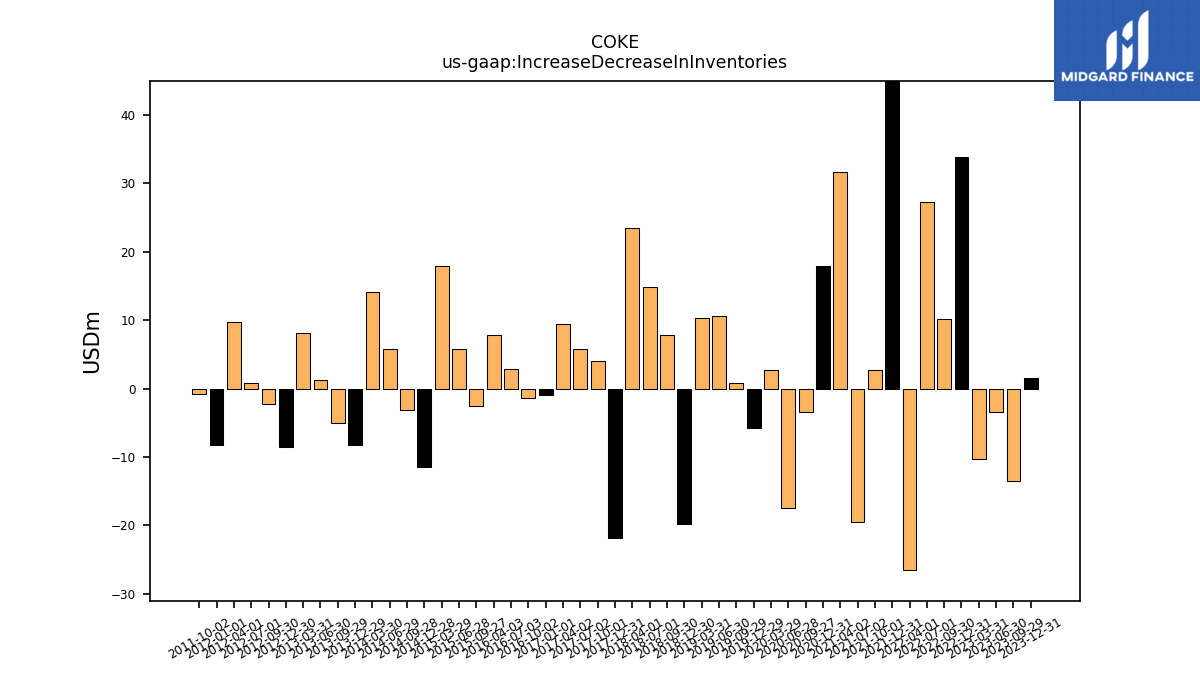
| Increase Decrease In Inventories | 1.53 | -13.47 | -3.44 | -10.23 | 33.85 | 10.16 | 27.26 | -26.57 | 62.36 | 2.67 | -19.54 | 31.61 | 17.98 | -3.35 | -17.50 | 2.70 | -5.83 | 0.85 | 10.58 | 10.28 | -19.86 | 7.82 | 14.91 | 23.55 | -21.78 | 3.98 | 5.78 | 9.50 | -1.00 | -1.38 | 2.90 | 7.78 | NA | -2.58 | 5.80 | 17.88 | -11.49 | -3.19 | 5.84 | 14.13 | -8.27 | -5.10 | 1.25 | 8.17 | -8.57 | -2.28 | 0.88 | 9.74 | -8.21 | -0.78 | NA | NA | NA | NA | NA | |
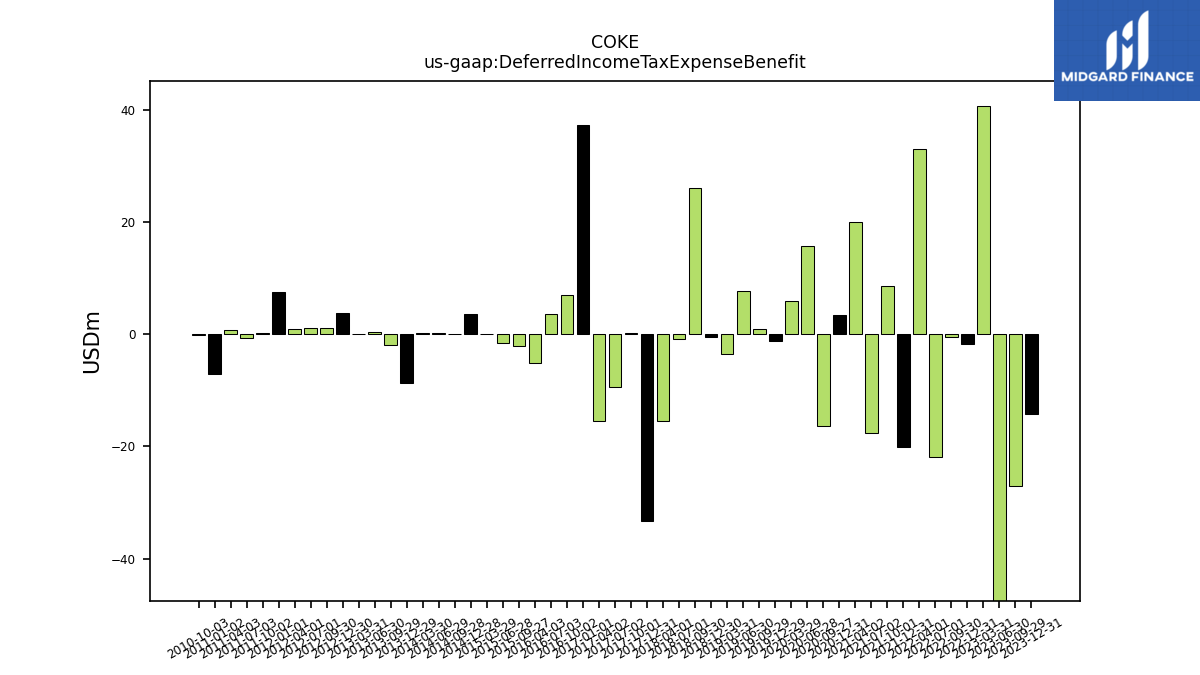
| Deferred Income Tax Expense Benefit | -14.14 | -27.03 | -48.59 | 40.74 | -1.77 | -0.44 | -21.94 | 33.13 | -20.09 | 8.61 | -17.69 | 19.98 | 3.44 | -16.37 | 15.76 | 5.91 | -1.27 | 0.93 | 7.77 | -3.44 | -0.54 | 26.19 | -0.89 | -15.39 | -33.37 | 0.18 | -9.42 | -15.49 | 37.43 | 6.99 | 3.60 | -5.08 | NA | -2.04 | -1.50 | 0.04 | 3.56 | 0.15 | 0.28 | 0.22 | -8.64 | -1.95 | 0.43 | 0.15 | 3.73 | 1.21 | 1.23 | 0.97 | 7.54 | 0.19 | -0.68 | 0.84 | -7.09 | -0.12 | NA |
| 2023-12-31 | 2023-09-29 | 2023-06-30 | 2023-03-31 | 2022-12-31 | 2022-09-30 | 2022-07-01 | 2022-04-01 | 2021-12-31 | 2021-10-01 | 2021-07-02 | 2021-04-02 | 2020-12-31 | 2020-09-27 | 2020-06-28 | 2020-03-29 | 2019-12-29 | 2019-09-29 | 2019-06-30 | 2019-03-31 | 2018-12-30 | 2018-09-30 | 2018-07-01 | 2018-04-01 | 2017-12-31 | 2017-10-01 | 2017-07-02 | 2017-04-02 | 2017-01-01 | 2016-10-02 | 2016-07-03 | 2016-04-03 | 2016-01-03 | 2015-09-27 | 2015-06-28 | 2015-03-29 | 2014-12-28 | 2014-09-28 | 2014-06-29 | 2014-03-30 | 2013-12-29 | 2013-09-29 | 2013-06-30 | 2013-03-31 | 2012-12-30 | 2012-09-30 | 2012-07-01 | 2012-04-01 | 2012-01-01 | 2011-10-02 | 2011-07-03 | 2011-04-03 | 2011-01-02 | 2010-10-03 | 2010-07-04 | ||
|---|---|---|---|---|---|---|---|---|---|---|---|---|---|---|---|---|---|---|---|---|---|---|---|---|---|---|---|---|---|---|---|---|---|---|---|---|---|---|---|---|---|---|---|---|---|---|---|---|---|---|---|---|---|---|---|---|
| Net Cash Provided By Used In Investing Activities | -134.49 | -62.20 | -46.12 | -52.54 | -114.72 | -38.65 | -39.09 | -132.52 | -42.35 | -37.24 | -42.71 | -39.64 | -90.33 | -37.39 | -40.38 | -32.33 | -71.59 | -40.19 | -28.12 | -33.77 | -37.90 | -30.29 | -35.53 | -40.22 | -50.99 | -92.72 | NA | NA | NA | NA | NA | NA | NA | NA | NA | NA | NA | NA | NA | -16.86 | -16.16 | -11.67 | -11.39 | -16.08 | -16.57 | -10.67 | -10.50 | -11.83 | -10.54 | -8.71 | -12.15 | -19.48 | -15.35 | -12.45 | NA | |
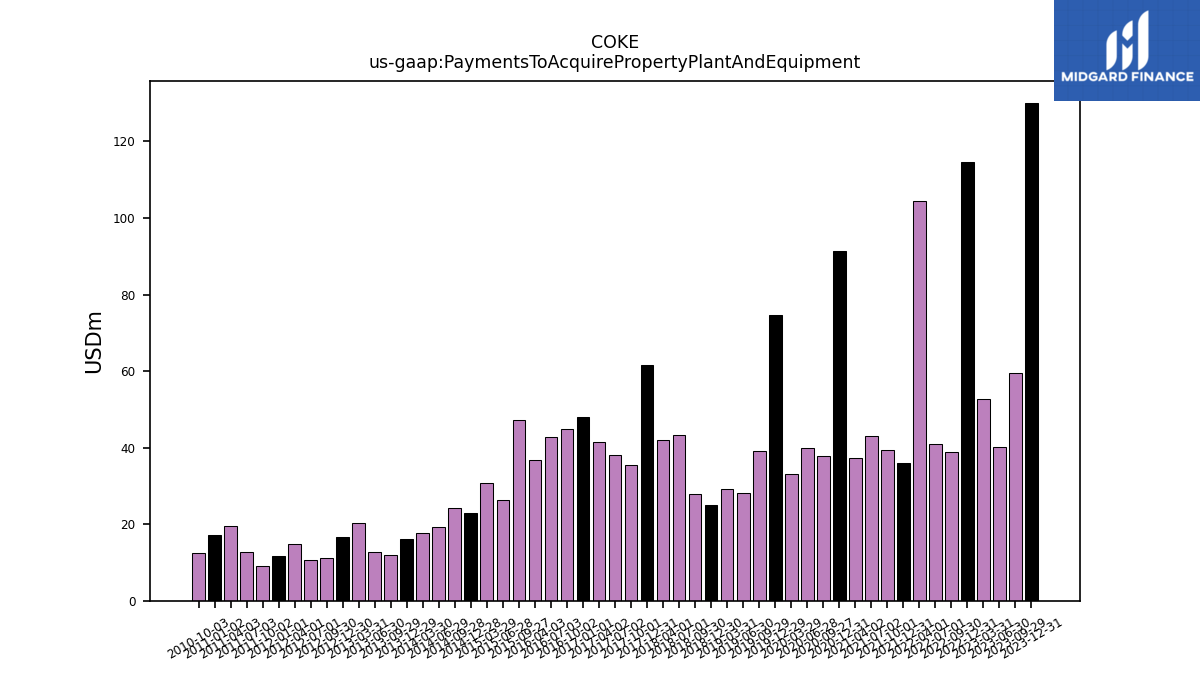
| Payments To Acquire Property Plant And Equipment | 130.04 | 59.37 | 40.19 | 52.70 | 114.68 | 38.75 | 40.83 | 104.35 | 36.07 | 39.31 | 43.10 | 37.20 | 91.32 | 37.83 | 39.79 | 33.09 | 74.63 | 39.17 | 28.27 | 29.32 | 25.13 | 27.82 | 43.23 | 42.05 | 61.65 | 35.35 | 38.03 | 41.58 | 47.99 | 44.97 | 42.84 | 36.78 | NA | 47.28 | 26.30 | 30.84 | 23.01 | 24.32 | 19.22 | 17.81 | 16.23 | 12.06 | 12.76 | 20.38 | 16.73 | 11.06 | 10.59 | 14.90 | 11.76 | 9.21 | 12.69 | 19.50 | 17.16 | 12.52 | NA |
| 2023-12-31 | 2023-09-29 | 2023-06-30 | 2023-03-31 | 2022-12-31 | 2022-09-30 | 2022-07-01 | 2022-04-01 | 2021-12-31 | 2021-10-01 | 2021-07-02 | 2021-04-02 | 2020-12-31 | 2020-09-27 | 2020-06-28 | 2020-03-29 | 2019-12-29 | 2019-09-29 | 2019-06-30 | 2019-03-31 | 2018-12-30 | 2018-09-30 | 2018-07-01 | 2018-04-01 | 2017-12-31 | 2017-10-01 | 2017-07-02 | 2017-04-02 | 2017-01-01 | 2016-10-02 | 2016-07-03 | 2016-04-03 | 2016-01-03 | 2015-09-27 | 2015-06-28 | 2015-03-29 | 2014-12-28 | 2014-09-28 | 2014-06-29 | 2014-03-30 | 2013-12-29 | 2013-09-29 | 2013-06-30 | 2013-03-31 | 2012-12-30 | 2012-09-30 | 2012-07-01 | 2012-04-01 | 2012-01-01 | 2011-10-02 | 2011-07-03 | 2011-04-03 | 2011-01-02 | 2010-10-03 | 2010-07-04 | ||
|---|---|---|---|---|---|---|---|---|---|---|---|---|---|---|---|---|---|---|---|---|---|---|---|---|---|---|---|---|---|---|---|---|---|---|---|---|---|---|---|---|---|---|---|---|---|---|---|---|---|---|---|---|---|---|---|---|
| Net Cash Provided By Used In Financing Activities | -12.60 | -12.96 | -12.14 | -40.02 | -11.08 | -137.68 | -11.84 | -13.59 | -84.10 | 1.43 | -144.39 | -45.23 | -137.76 | -22.74 | -126.54 | 38.17 | -10.57 | -75.51 | -57.67 | 23.13 | -100.74 | 51.12 | -91.21 | 112.55 | -49.42 | 37.67 | NA | NA | NA | NA | NA | NA | NA | NA | NA | NA | NA | NA | NA | 31.18 | -18.77 | -38.70 | -13.61 | 31.36 | -103.50 | -3.53 | -3.53 | -3.40 | -3.31 | -3.94 | -3.27 | -3.36 | -3.21 | -23.27 | NA | |
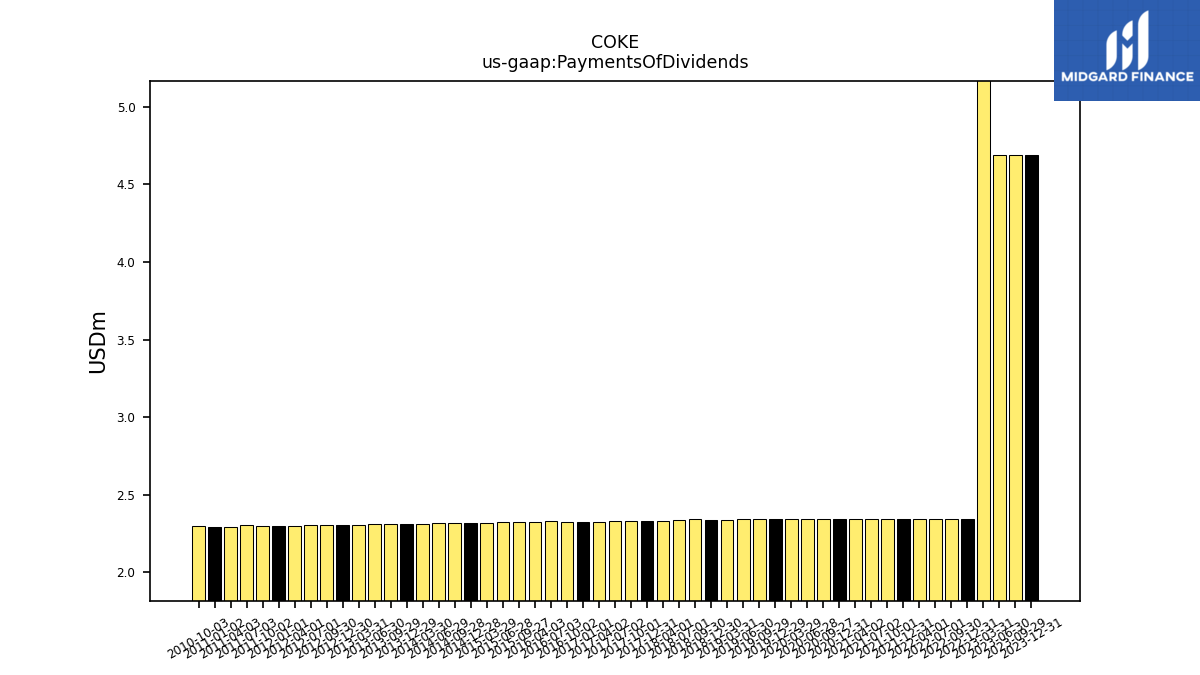
| Payments Of Dividends | 4.69 | 4.69 | 4.69 | 32.81 | 2.34 | 2.34 | 2.34 | 2.34 | 2.34 | 2.34 | 2.34 | 2.34 | 2.34 | 2.34 | 2.34 | 2.34 | 2.34 | 2.34 | 2.34 | 2.34 | 2.34 | 2.34 | 2.34 | 2.33 | 2.33 | 2.33 | 2.33 | 2.33 | 2.33 | 2.33 | 2.33 | 2.32 | NA | 2.32 | 2.32 | 2.32 | 2.32 | 2.32 | 2.32 | 2.31 | 2.31 | 2.31 | 2.31 | 2.31 | 2.31 | 2.31 | 2.31 | 2.30 | 2.30 | 2.30 | 2.30 | 2.30 | 2.30 | 2.30 | NA |
| 2023-12-31 | 2023-09-29 | 2023-06-30 | 2023-03-31 | 2022-12-31 | 2022-09-30 | 2022-07-01 | 2022-04-01 | 2021-12-31 | 2021-10-01 | 2021-07-02 | 2021-04-02 | 2020-12-31 | 2020-09-27 | 2020-06-28 | 2020-03-29 | 2019-12-29 | 2019-09-29 | 2019-06-30 | 2019-03-31 | 2018-12-30 | 2018-09-30 | 2018-07-01 | 2018-04-01 | 2017-12-31 | 2017-10-01 | 2017-07-02 | 2017-04-02 | 2017-01-01 | 2016-10-02 | 2016-07-03 | 2016-04-03 | 2016-01-03 | 2015-09-27 | 2015-06-28 | 2015-03-29 | 2014-12-28 | 2014-09-28 | 2014-06-29 | 2014-03-30 | 2013-12-29 | 2013-09-29 | 2013-06-30 | 2013-03-31 | 2012-12-30 | 2012-09-30 | 2012-07-01 | 2012-04-01 | 2012-01-01 | 2011-10-02 | 2011-07-03 | 2011-04-03 | 2011-01-02 | 2010-10-03 | 2010-07-04 | ||
|---|---|---|---|---|---|---|---|---|---|---|---|---|---|---|---|---|---|---|---|---|---|---|---|---|---|---|---|---|---|---|---|---|---|---|---|---|---|---|---|---|---|---|---|---|---|---|---|---|---|---|---|---|---|---|---|---|
| Revenues | 1630.96 | 1712.43 | 1738.83 | 1571.64 | 1572.80 | 1628.59 | 1595.21 | 1404.36 | 1402.34 | 1457.43 | 1433.09 | 1269.86 | 1278.64 | 1328.48 | 1227.21 | 1173.02 | 1178.95 | 1271.03 | 1273.66 | 1102.91 | 1136.57 | 1211.66 | 1227.27 | 1064.76 | 1117.63 | 1162.53 | 1169.29 | 865.70 | 841.56 | 849.03 | 840.38 | 625.46 | 619.72 | 618.81 | 614.68 | 453.25 | 440.64 | 457.68 | 459.47 | 388.58 | 394.34 | 434.46 | 428.98 | 383.55 | 386.70 | 419.86 | 430.69 | 377.19 | 372.86 | 405.86 | 422.89 | 359.63 | 354.38 | 395.36 | 417.36 | |
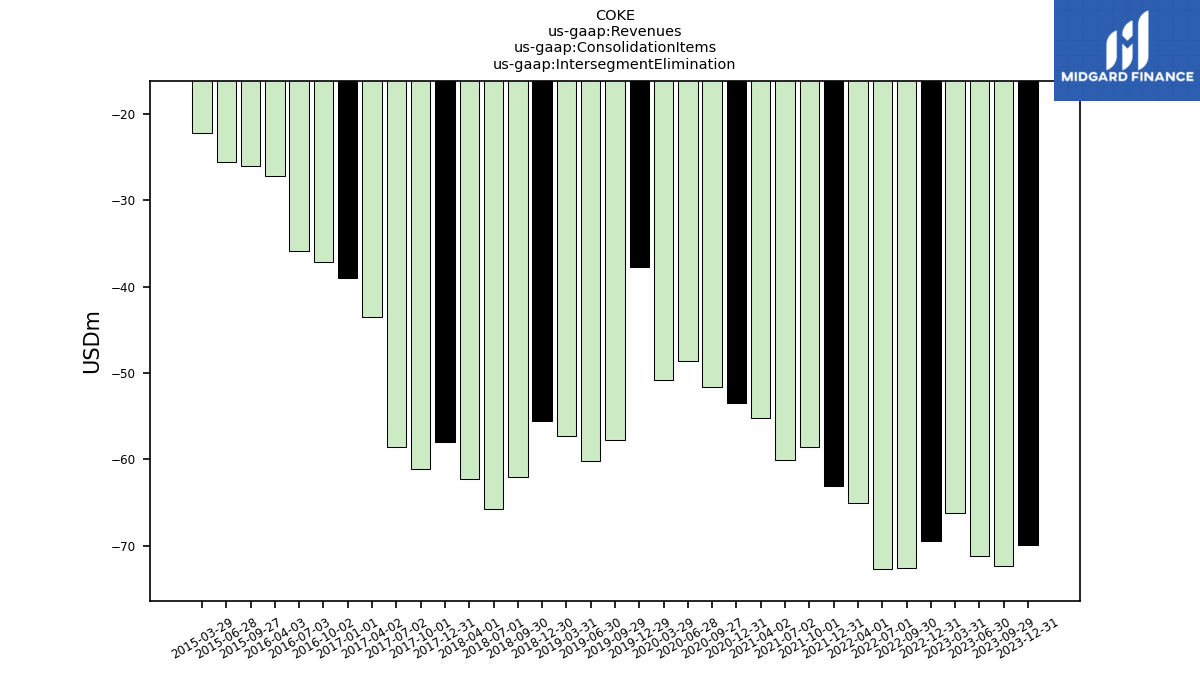
| Intersegment Elimination | -69.89 | -72.27 | -71.20 | -66.15 | -69.41 | -72.61 | -72.71 | -65.03 | -63.08 | -58.53 | -60.02 | -55.18 | -53.48 | -51.56 | -48.64 | -50.86 | -37.75 | -57.73 | -60.17 | -57.23 | -55.59 | -62.04 | -65.68 | -62.26 | -57.95 | -61.15 | -58.55 | -43.48 | -38.98 | -37.19 | -35.89 | -27.18 | NA | -26.00 | -25.62 | -22.25 | NA | NA | NA | NA | NA | NA | NA | NA | NA | NA | NA | NA | NA | NA | NA | NA | NA | NA | NA | |
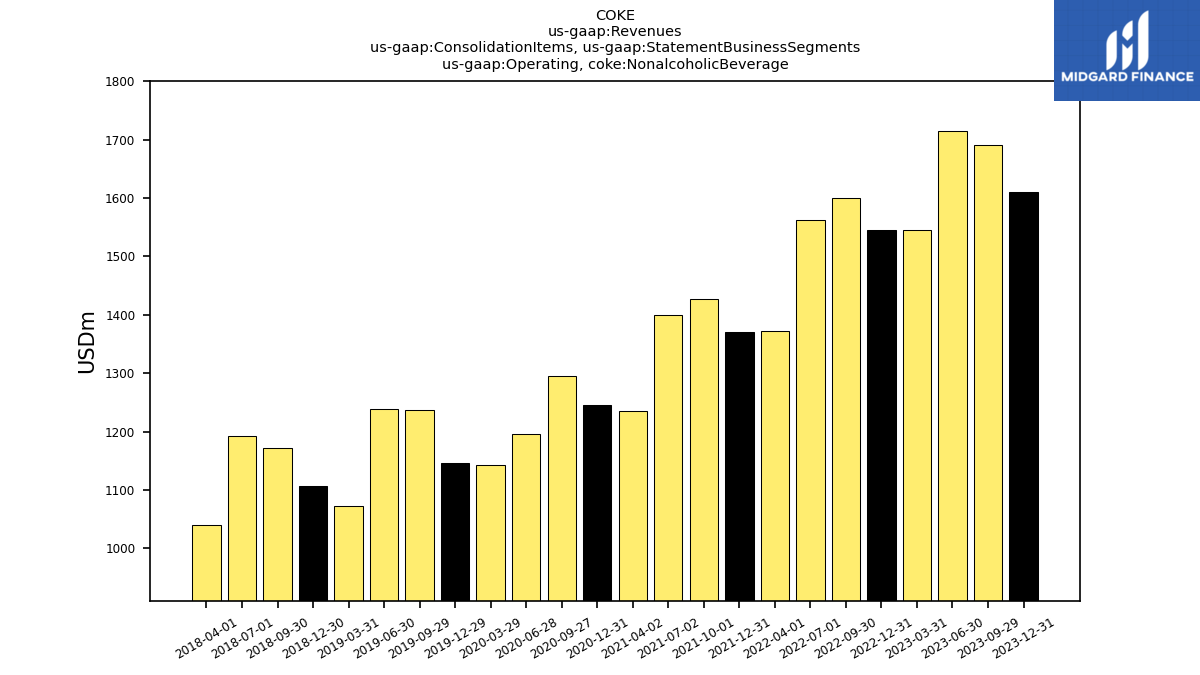
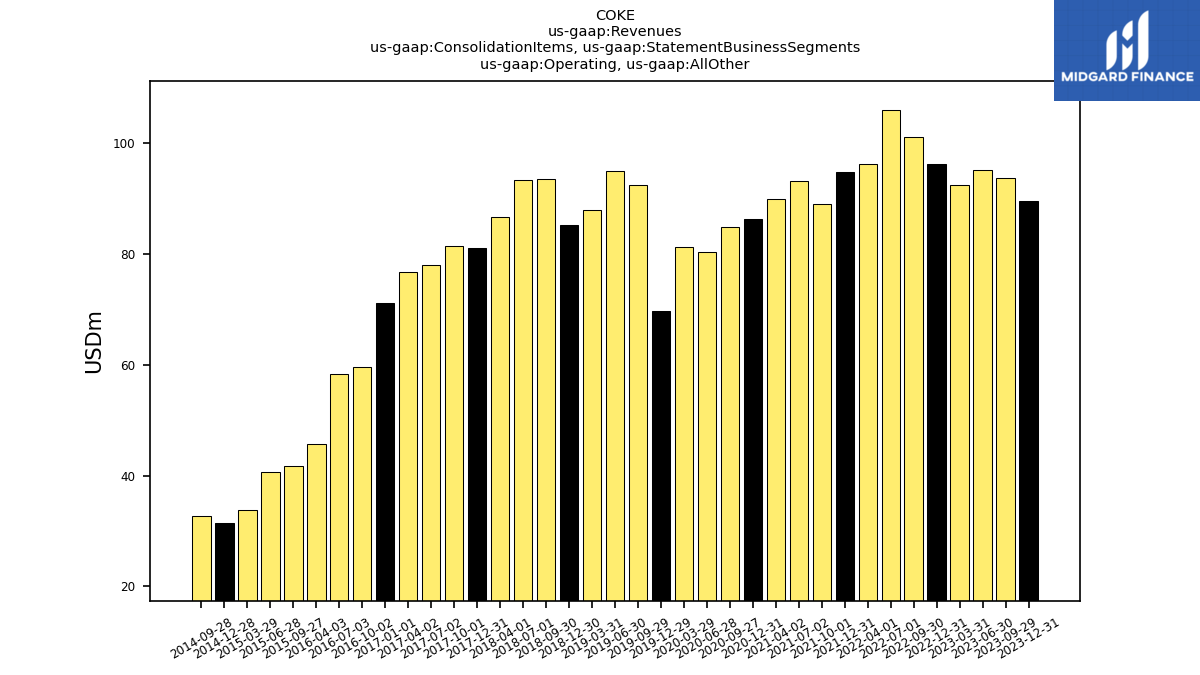
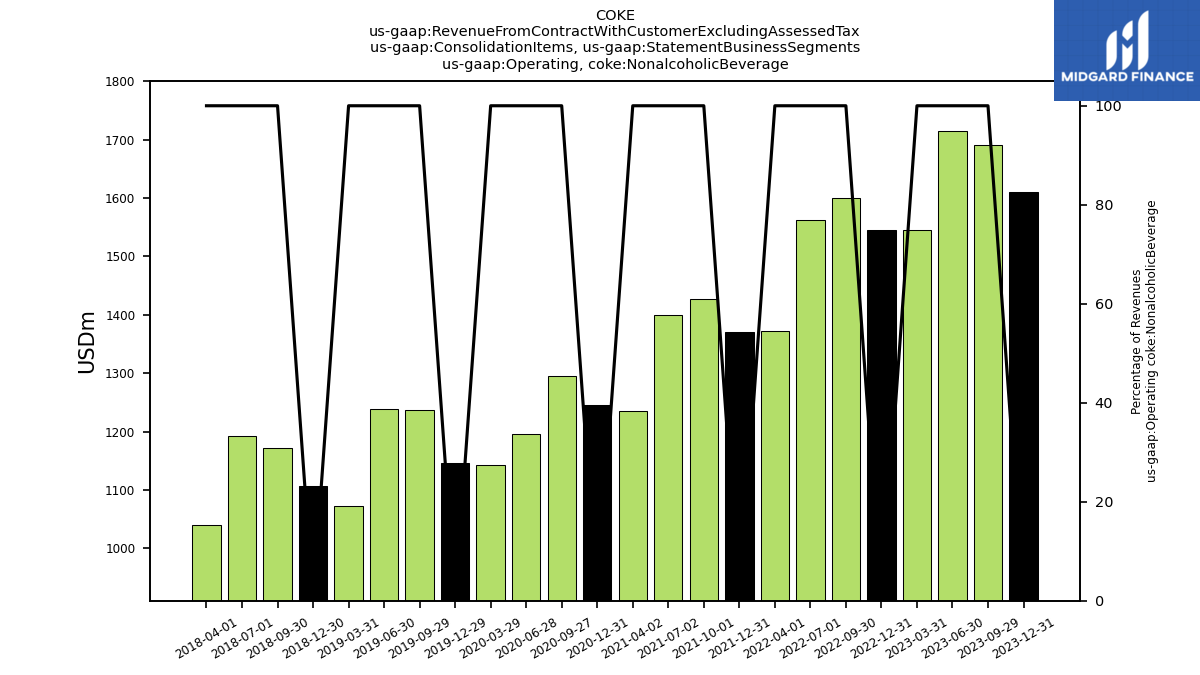
| Operating, Nonalcoholic Beverage | 1611.29 | 1691.06 | 1714.86 | 1545.41 | 1546.06 | 1600.07 | 1562.01 | 1373.22 | 1370.69 | 1426.97 | 1399.91 | 1235.09 | 1245.79 | 1295.27 | 1195.52 | 1142.58 | 1147.06 | 1236.26 | 1238.88 | 1072.23 | 1107.03 | 1172.58 | 1192.28 | 1040.42 | NA | NA | NA | NA | NA | NA | NA | NA | NA | NA | NA | NA | NA | NA | NA | NA | NA | NA | NA | NA | NA | NA | NA | NA | NA | NA | NA | NA | NA | NA | NA | |
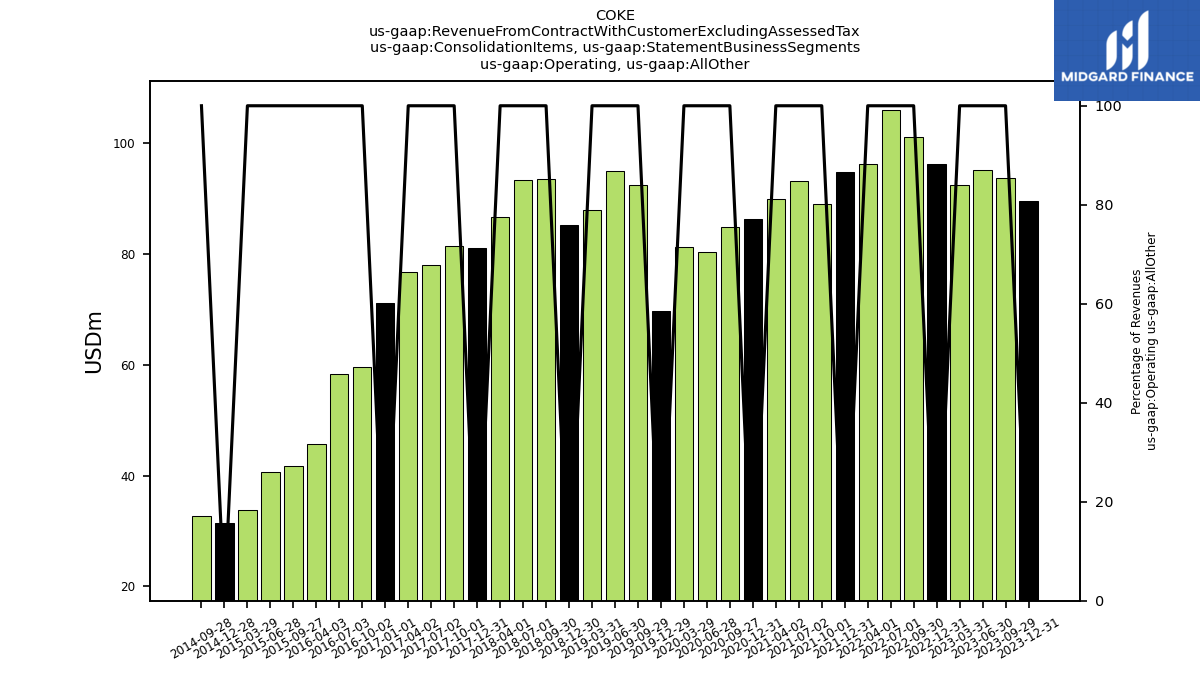
| Operating, All Other | 89.56 | 93.64 | 95.17 | 92.38 | 96.15 | 101.14 | 105.91 | 96.16 | 94.72 | 88.99 | 93.19 | 89.95 | 86.32 | 84.78 | 80.33 | 81.30 | 69.65 | 92.50 | 94.94 | 87.92 | 85.14 | 93.49 | 93.40 | 86.60 | 81.07 | 81.44 | 78.05 | 76.79 | 71.10 | 59.53 | 58.40 | 45.71 | NA | 41.76 | 40.69 | 33.81 | 31.37 | 32.72 | NA | NA | NA | NA | NA | NA | NA | NA | NA | NA | NA | NA | NA | NA | NA | NA | NA | |
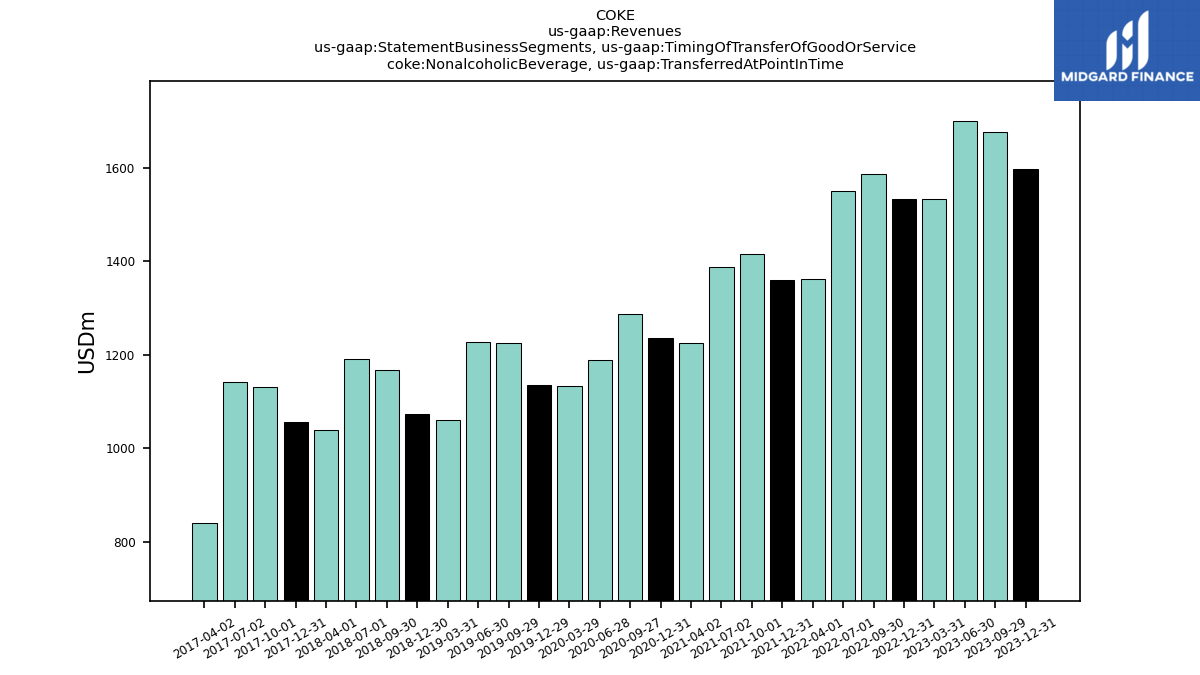
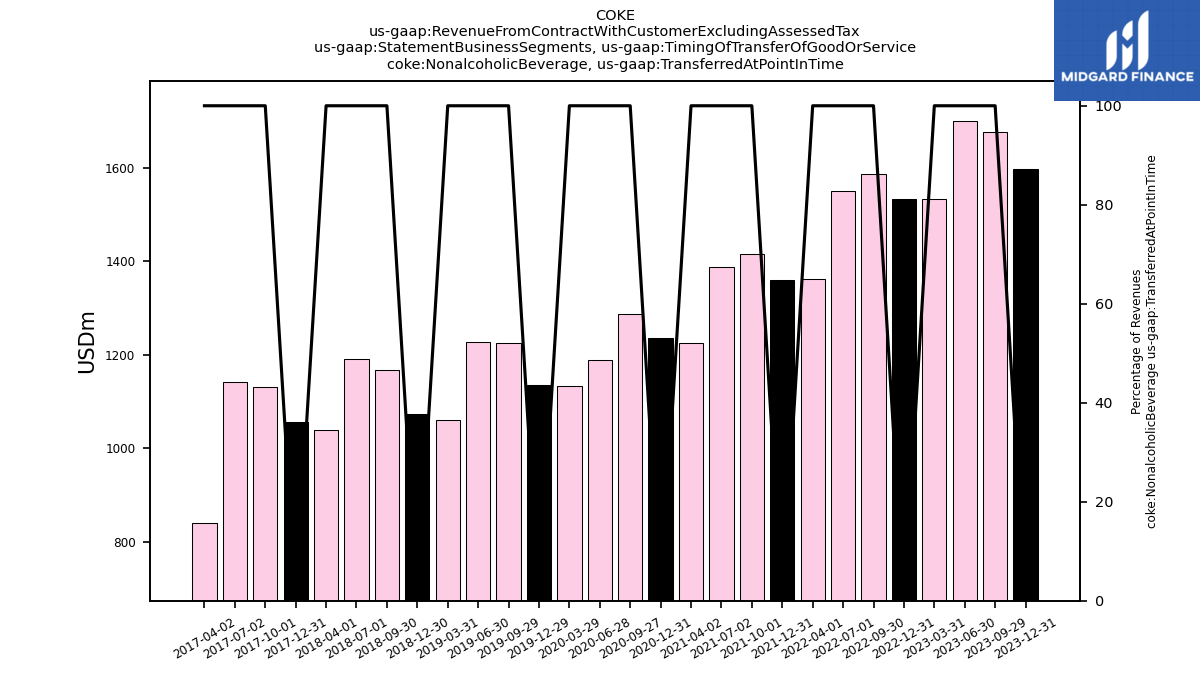
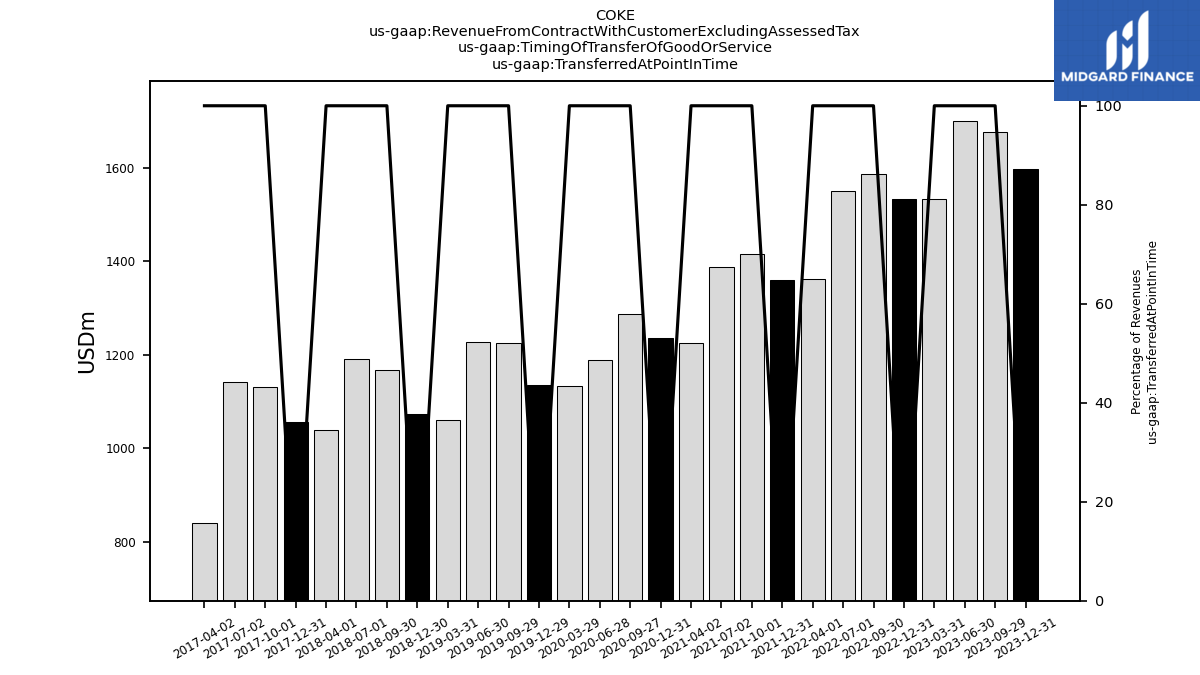
| Nonalcoholic Beverage, Transferred At Point In Time | 1598.16 | 1677.22 | 1701.49 | 1533.29 | 1534.64 | 1587.77 | 1550.26 | 1362.25 | 1359.60 | 1415.64 | 1388.99 | 1225.21 | 1235.43 | 1286.54 | 1188.48 | 1132.47 | 1136.14 | 1224.65 | 1227.98 | 1060.27 | 1073.69 | 1168.28 | 1190.35 | 1039.12 | 1057.13 | 1132.18 | 1141.48 | 840.66 | NA | NA | NA | NA | NA | NA | NA | NA | NA | NA | NA | NA | NA | NA | NA | NA | NA | NA | NA | NA | NA | NA | NA | NA | NA | NA | NA | |
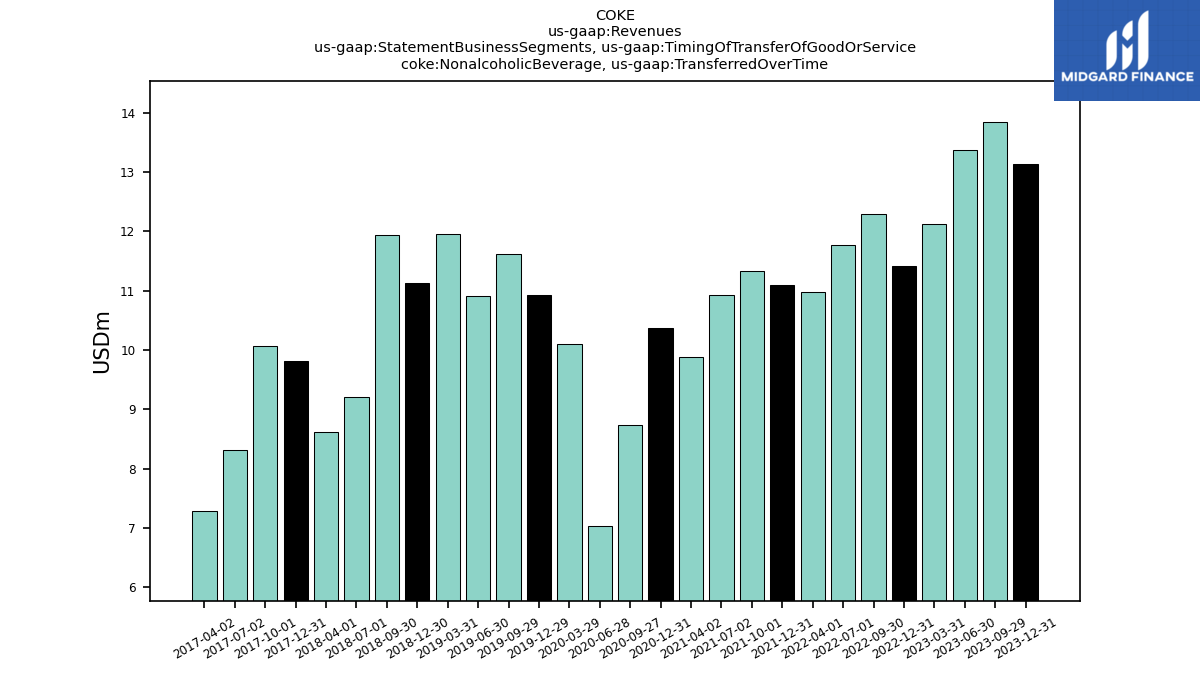
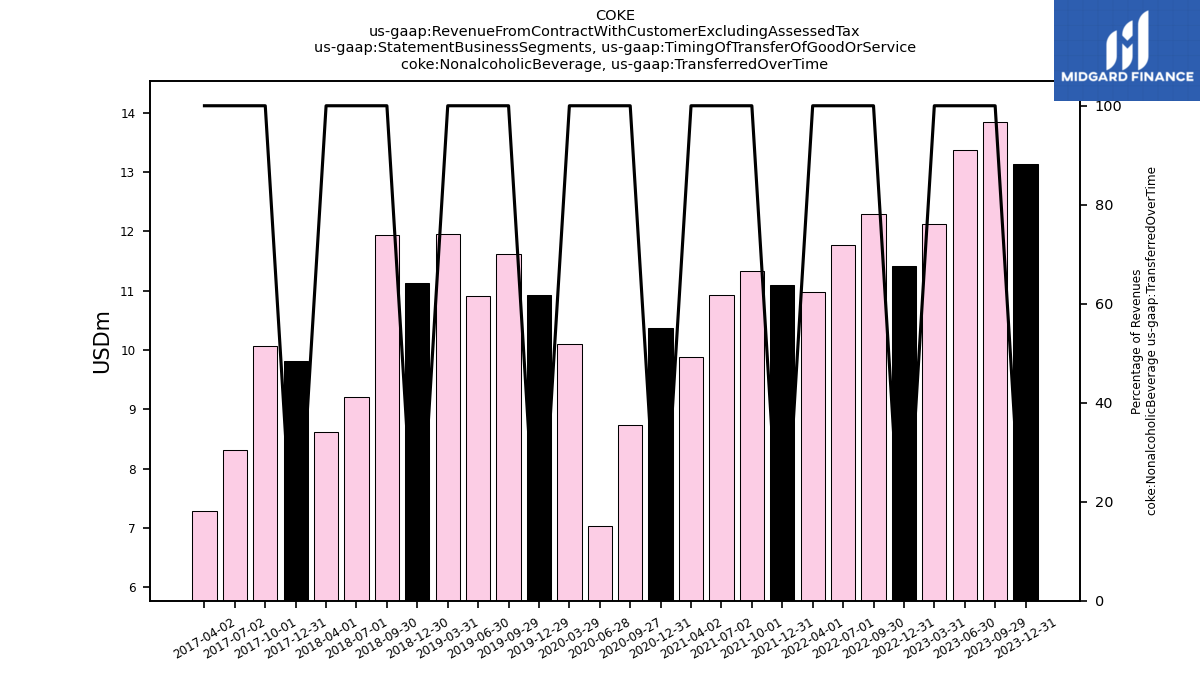
| Nonalcoholic Beverage, Transferred Over Time | 13.13 | 13.84 | 13.37 | 12.12 | 11.42 | 12.29 | 11.76 | 10.97 | 11.10 | 11.33 | 10.92 | 9.88 | 10.36 | 8.73 | 7.04 | 10.11 | 10.92 | 11.61 | 10.91 | 11.96 | 11.13 | 11.94 | 9.20 | 8.61 | 9.82 | 10.06 | 8.31 | 7.29 | NA | NA | NA | NA | NA | NA | NA | NA | NA | NA | NA | NA | NA | NA | NA | NA | NA | NA | NA | NA | NA | NA | NA | NA | NA | NA | NA | |
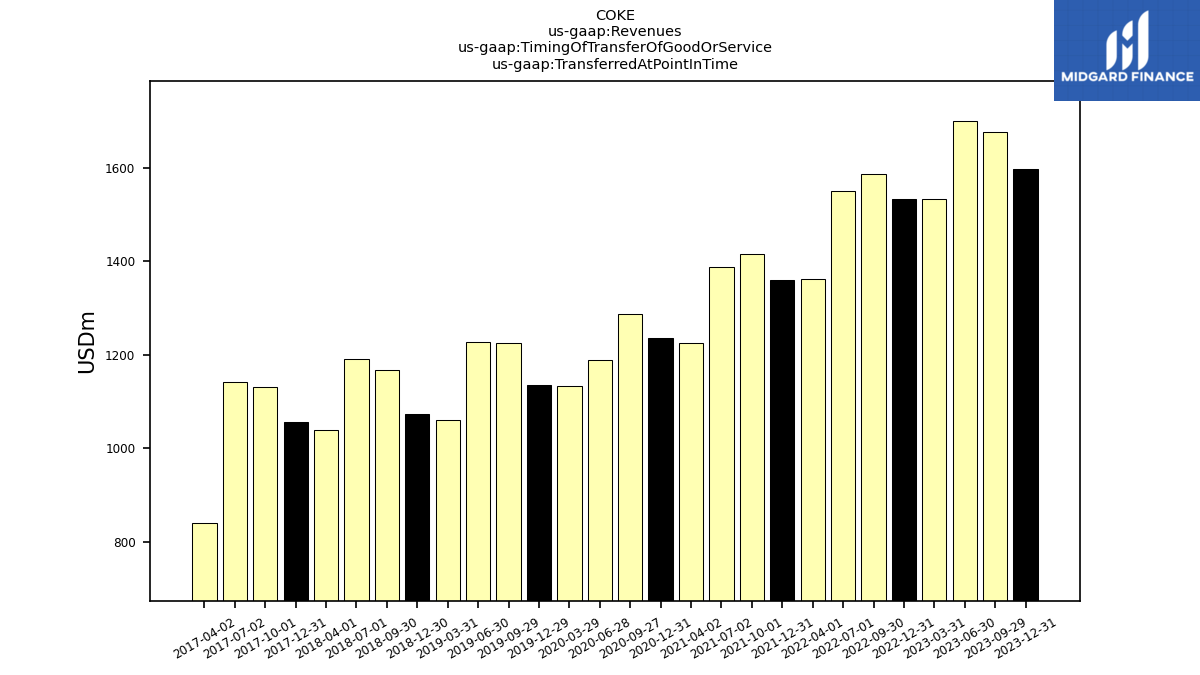
| Transferred At Point In Time | 1598.16 | 1677.22 | 1701.49 | 1533.29 | 1534.64 | 1587.77 | 1550.26 | 1362.25 | 1359.60 | 1415.64 | 1388.99 | 1225.21 | 1235.43 | 1286.54 | 1188.48 | 1132.47 | 1136.14 | 1224.65 | 1227.98 | 1060.27 | 1073.69 | 1168.28 | 1190.35 | 1039.12 | 1057.13 | 1132.18 | 1141.48 | 840.66 | NA | NA | NA | NA | NA | NA | NA | NA | NA | NA | NA | NA | NA | NA | NA | NA | NA | NA | NA | NA | NA | NA | NA | NA | NA | NA | NA | |
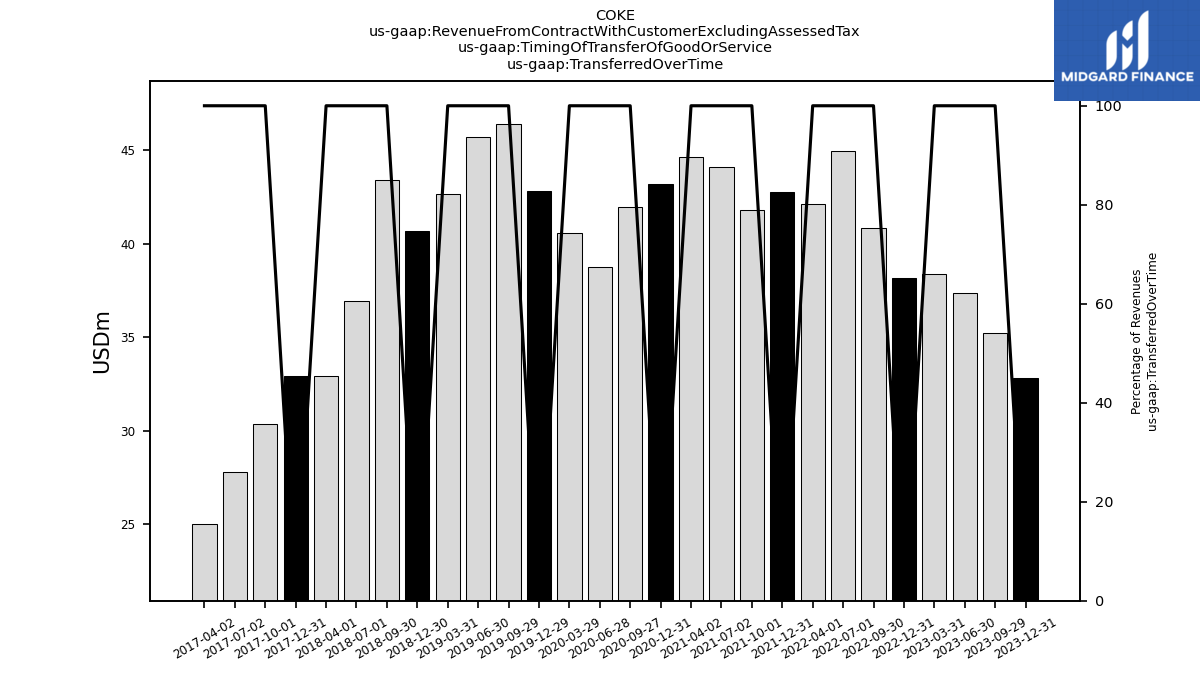
| Transferred Over Time | 32.80 | 35.21 | 37.34 | 38.35 | 38.16 | 40.82 | 44.96 | 42.11 | 42.74 | 41.79 | 44.09 | 44.65 | 43.20 | 41.94 | 38.73 | 40.55 | 42.81 | 46.38 | 45.68 | 42.64 | 40.67 | 43.38 | 36.92 | 32.95 | 32.94 | 30.34 | 27.81 | 25.04 | NA | NA | NA | NA | NA | NA | NA | NA | NA | NA | NA | NA | NA | NA | NA | NA | NA | NA | NA | NA | NA | NA | NA | NA | NA | NA | NA | |
| Revenue From Contract With Customer Excluding Assessed Tax | 1630.96 | 1712.43 | 1738.83 | 1571.64 | 1572.80 | 1628.59 | 1595.21 | 1404.36 | 1402.34 | 1457.43 | 1433.09 | 1269.86 | 1278.64 | 1328.48 | 1227.21 | 1173.02 | 1178.95 | 1271.03 | 1273.66 | 1102.91 | 1136.57 | 1211.66 | 1227.27 | 1064.76 | 1117.63 | 1162.53 | 1169.29 | 865.70 | 841.56 | 849.03 | 840.38 | 625.46 | 619.72 | 618.81 | 614.68 | 453.25 | 440.64 | 457.68 | 459.47 | 388.58 | 394.34 | 434.46 | 428.98 | 383.55 | 386.70 | 419.86 | 430.69 | 377.19 | 372.86 | 405.86 | 422.89 | 359.63 | 354.38 | 395.36 | 417.36 | |
| Intersegment Elimination | -69.89 | -72.27 | -71.20 | -66.15 | -69.41 | -72.61 | -72.71 | -65.03 | -63.08 | -58.53 | -60.02 | -55.18 | -53.48 | -51.56 | -48.64 | -50.86 | -37.75 | -57.73 | -60.17 | -57.23 | -55.59 | -62.04 | -65.68 | -62.26 | -57.95 | -61.15 | -58.55 | -43.48 | -38.98 | -37.19 | -35.89 | -27.18 | NA | -26.00 | -25.62 | -22.25 | NA | NA | NA | NA | NA | NA | NA | NA | NA | NA | NA | NA | NA | NA | NA | NA | NA | NA | NA | |
| Operating, Nonalcoholic Beverage | 1611.29 | 1691.06 | 1714.86 | 1545.41 | 1546.06 | 1600.07 | 1562.01 | 1373.22 | 1370.69 | 1426.97 | 1399.91 | 1235.09 | 1245.79 | 1295.27 | 1195.52 | 1142.58 | 1147.06 | 1236.26 | 1238.88 | 1072.23 | 1107.03 | 1172.58 | 1192.28 | 1040.42 | NA | NA | NA | NA | NA | NA | NA | NA | NA | NA | NA | NA | NA | NA | NA | NA | NA | NA | NA | NA | NA | NA | NA | NA | NA | NA | NA | NA | NA | NA | NA | |
| Operating, All Other | 89.56 | 93.64 | 95.17 | 92.38 | 96.15 | 101.14 | 105.91 | 96.16 | 94.72 | 88.99 | 93.19 | 89.95 | 86.32 | 84.78 | 80.33 | 81.30 | 69.65 | 92.50 | 94.94 | 87.92 | 85.14 | 93.49 | 93.40 | 86.60 | 81.07 | 81.44 | 78.05 | 76.79 | 71.10 | 59.53 | 58.40 | 45.71 | NA | 41.76 | 40.69 | 33.81 | 31.37 | 32.72 | NA | NA | NA | NA | NA | NA | NA | NA | NA | NA | NA | NA | NA | NA | NA | NA | NA | |
| Nonalcoholic Beverage, Transferred At Point In Time | 1598.16 | 1677.22 | 1701.49 | 1533.29 | 1534.64 | 1587.77 | 1550.26 | 1362.25 | 1359.60 | 1415.64 | 1388.99 | 1225.21 | 1235.43 | 1286.54 | 1188.48 | 1132.47 | 1136.14 | 1224.65 | 1227.98 | 1060.27 | 1073.69 | 1168.28 | 1190.35 | 1039.12 | 1057.13 | 1132.18 | 1141.48 | 840.66 | NA | NA | NA | NA | NA | NA | NA | NA | NA | NA | NA | NA | NA | NA | NA | NA | NA | NA | NA | NA | NA | NA | NA | NA | NA | NA | NA | |
| Nonalcoholic Beverage, Transferred Over Time | 13.13 | 13.84 | 13.37 | 12.12 | 11.42 | 12.29 | 11.76 | 10.97 | 11.10 | 11.33 | 10.92 | 9.88 | 10.36 | 8.73 | 7.04 | 10.11 | 10.92 | 11.61 | 10.91 | 11.96 | 11.13 | 11.94 | 9.20 | 8.61 | 9.82 | 10.06 | 8.31 | 7.29 | NA | NA | NA | NA | NA | NA | NA | NA | NA | NA | NA | NA | NA | NA | NA | NA | NA | NA | NA | NA | NA | NA | NA | NA | NA | NA | NA | |
| Transferred At Point In Time | 1598.16 | 1677.22 | 1701.49 | 1533.29 | 1534.64 | 1587.77 | 1550.26 | 1362.25 | 1359.60 | 1415.64 | 1388.99 | 1225.21 | 1235.43 | 1286.54 | 1188.48 | 1132.47 | 1136.14 | 1224.65 | 1227.98 | 1060.27 | 1073.69 | 1168.28 | 1190.35 | 1039.12 | 1057.13 | 1132.18 | 1141.48 | 840.66 | NA | NA | NA | NA | NA | NA | NA | NA | NA | NA | NA | NA | NA | NA | NA | NA | NA | NA | NA | NA | NA | NA | NA | NA | NA | NA | NA | |
| Transferred Over Time | 32.80 | 35.21 | 37.34 | 38.35 | 38.16 | 40.82 | 44.96 | 42.11 | 42.74 | 41.79 | 44.09 | 44.65 | 43.20 | 41.94 | 38.73 | 40.55 | 42.81 | 46.38 | 45.68 | 42.64 | 40.67 | 43.38 | 36.92 | 32.95 | 32.94 | 30.34 | 27.81 | 25.04 | NA | NA | NA | NA | NA | NA | NA | NA | NA | NA | NA | NA | NA | NA | NA | NA | NA | NA | NA | NA | NA | NA | NA | NA | NA | NA | NA |