
| 2023-12-31 | 2023-09-30 | 2023-06-30 | 2023-03-31 | 2022-12-31 | 2022-09-30 | 2022-06-30 | 2022-03-31 | 2021-12-31 | 2021-09-30 | 2021-06-30 | 2021-03-31 | 2020-12-31 | 2020-09-30 | 2020-06-30 | 2020-03-31 | 2019-12-31 | 2019-09-30 | 2019-06-30 | 2019-03-31 | 2018-12-31 | 2018-09-30 | 2018-06-30 | 2018-03-31 | 2017-12-31 | 2017-09-30 | 2017-06-30 | 2017-03-31 | ||
|---|---|---|---|---|---|---|---|---|---|---|---|---|---|---|---|---|---|---|---|---|---|---|---|---|---|---|---|---|---|
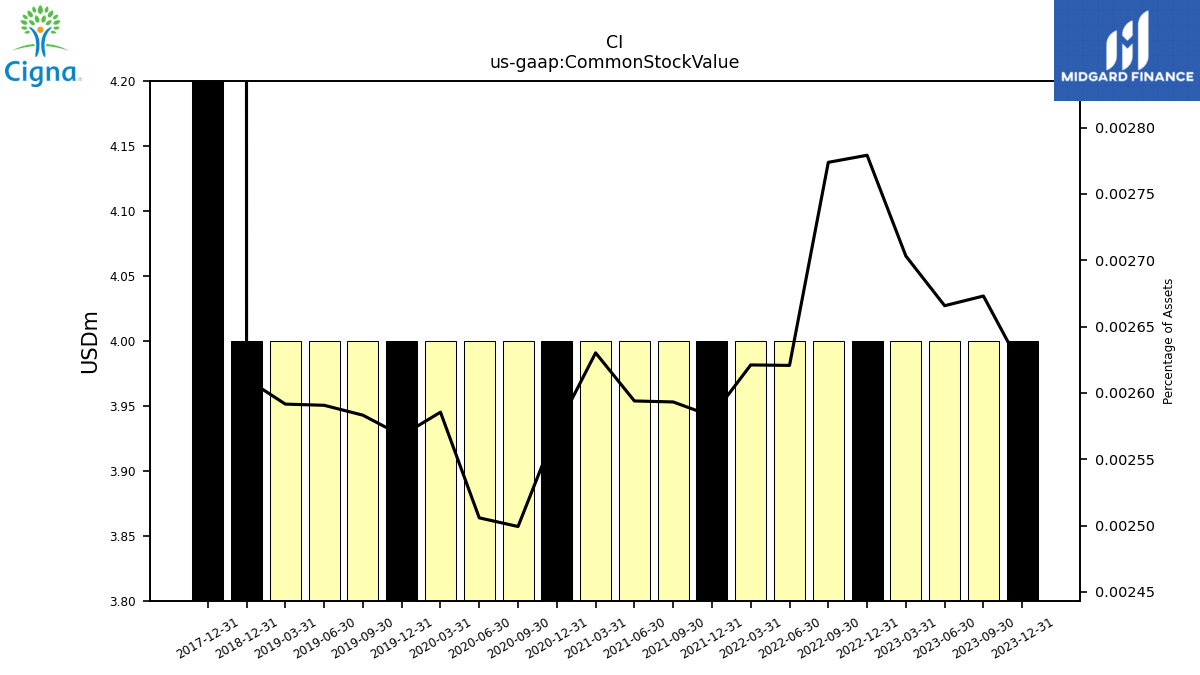
| Common Stock Value | 4.00 | 4.00 | 4.00 | 4.00 | 4.00 | 4.00 | 4.00 | 4.00 | 4.00 | 4.00 | 4.00 | 4.00 | 4.00 | 4.00 | 4.00 | 4.00 | 4.00 | 4.00 | 4.00 | 4.00 | 4.00 | NA | NA | NA | 74.00 | NA | NA | NA | |
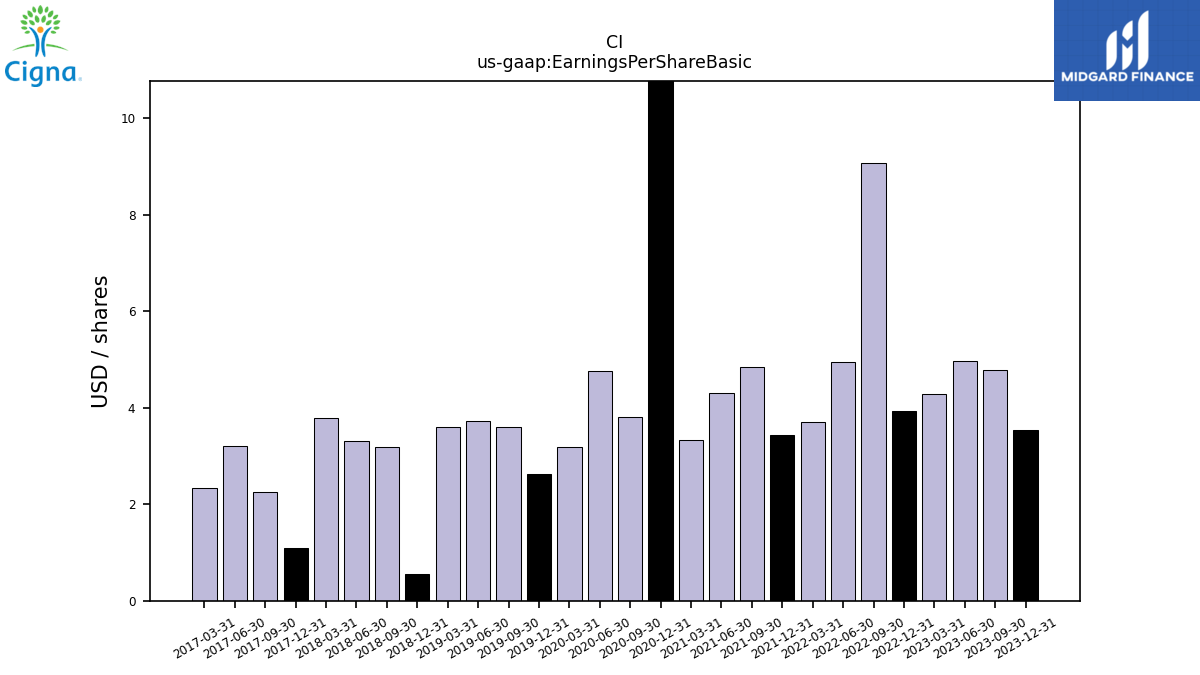
| Earnings Per Share Basic | 3.54 | 4.79 | 4.96 | 4.28 | 3.94 | 9.07 | 4.95 | 3.71 | 3.43 | 4.84 | 4.30 | 3.33 | 11.40 | 3.81 | 4.77 | 3.19 | 2.63 | 3.60 | 3.73 | 3.61 | 0.56 | 3.18 | 3.32 | 3.78 | 1.09 | 2.25 | 3.20 | 2.34 | |
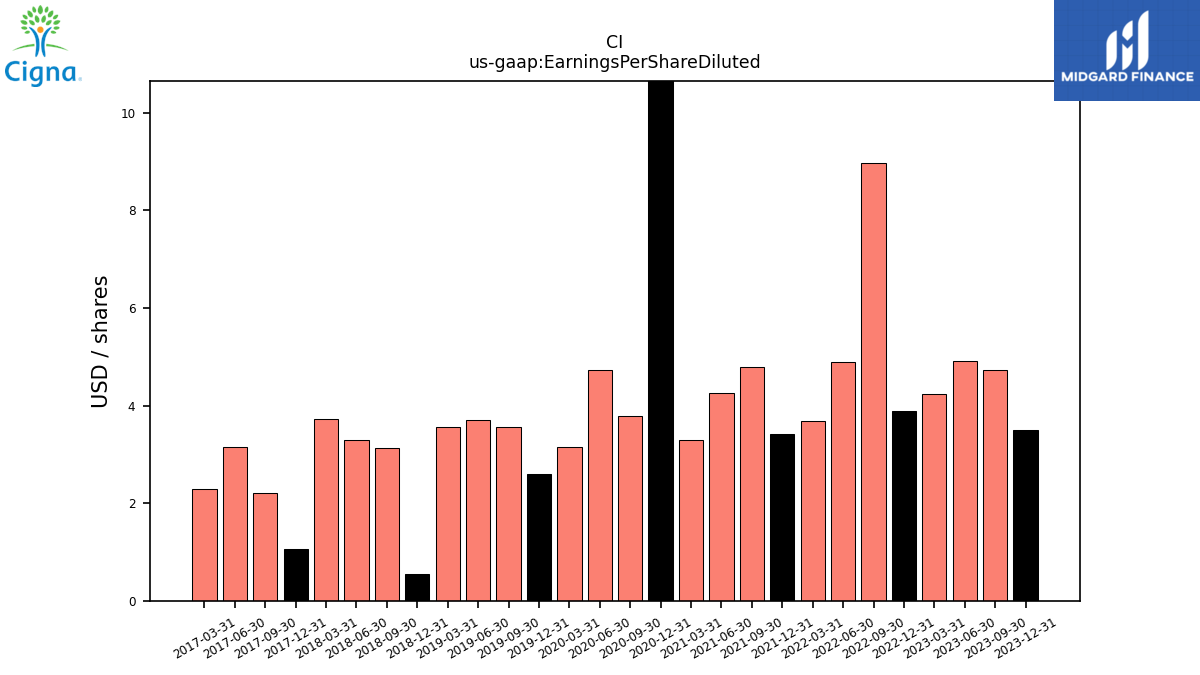
| Earnings Per Share Diluted | 3.50 | 4.74 | 4.92 | 4.24 | 3.88 | 8.97 | 4.90 | 3.68 | 3.41 | 4.80 | 4.25 | 3.30 | 11.30 | 3.78 | 4.73 | 3.15 | 2.60 | 3.57 | 3.70 | 3.56 | 0.55 | 3.14 | 3.29 | 3.72 | 1.07 | 2.21 | 3.15 | 2.30 |
| 2023-12-31 | 2023-09-30 | 2023-06-30 | 2023-03-31 | 2022-12-31 | 2022-09-30 | 2022-06-30 | 2022-03-31 | 2021-12-31 | 2021-09-30 | 2021-06-30 | 2021-03-31 | 2020-12-31 | 2020-09-30 | 2020-06-30 | 2020-03-31 | 2019-12-31 | 2019-09-30 | 2019-06-30 | 2019-03-31 | 2018-12-31 | 2018-09-30 | 2018-06-30 | 2018-03-31 | 2017-12-31 | 2017-09-30 | 2017-06-30 | 2017-03-31 | ||
|---|---|---|---|---|---|---|---|---|---|---|---|---|---|---|---|---|---|---|---|---|---|---|---|---|---|---|---|---|---|
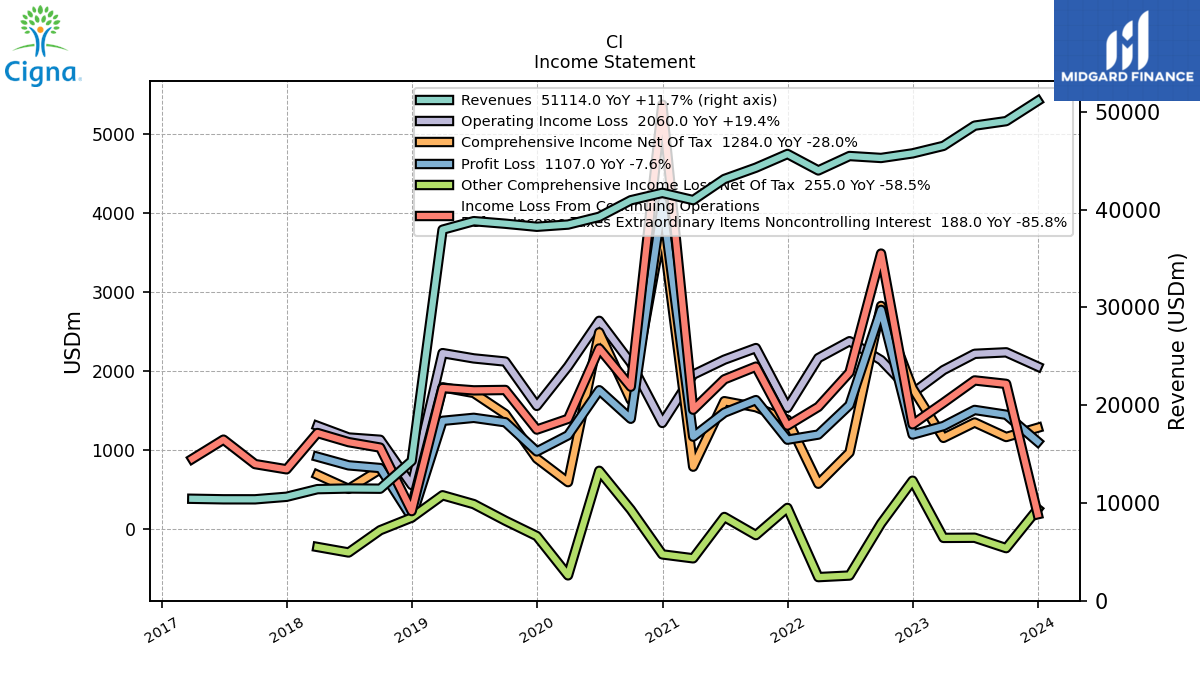
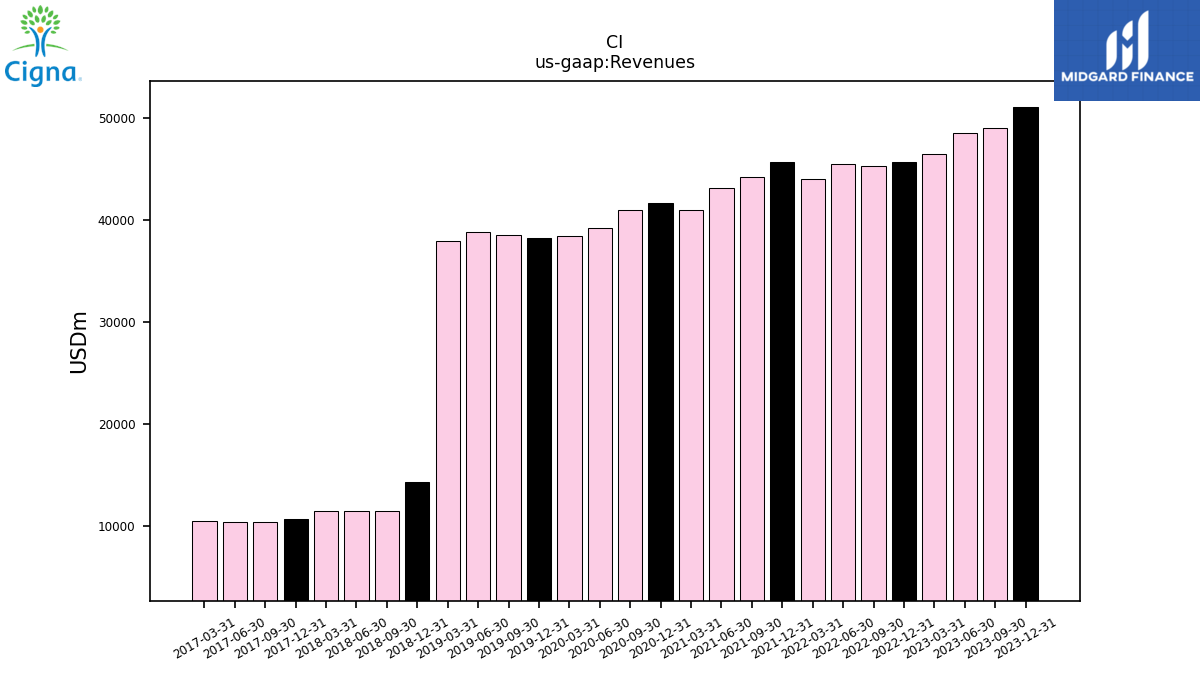
| Revenues | 51114.00 | 49048.00 | 48586.00 | 46517.00 | 45751.00 | 45280.00 | 45480.00 | 44005.00 | 45688.00 | 44288.00 | 43131.00 | 40971.00 | 41712.00 | 40955.00 | 39265.00 | 38469.00 | 38245.00 | 38556.00 | 38819.00 | 37946.00 | 14300.00 | 11457.00 | 11480.00 | 11413.00 | 10632.00 | 10372.00 | 10374.00 | 10428.00 | |
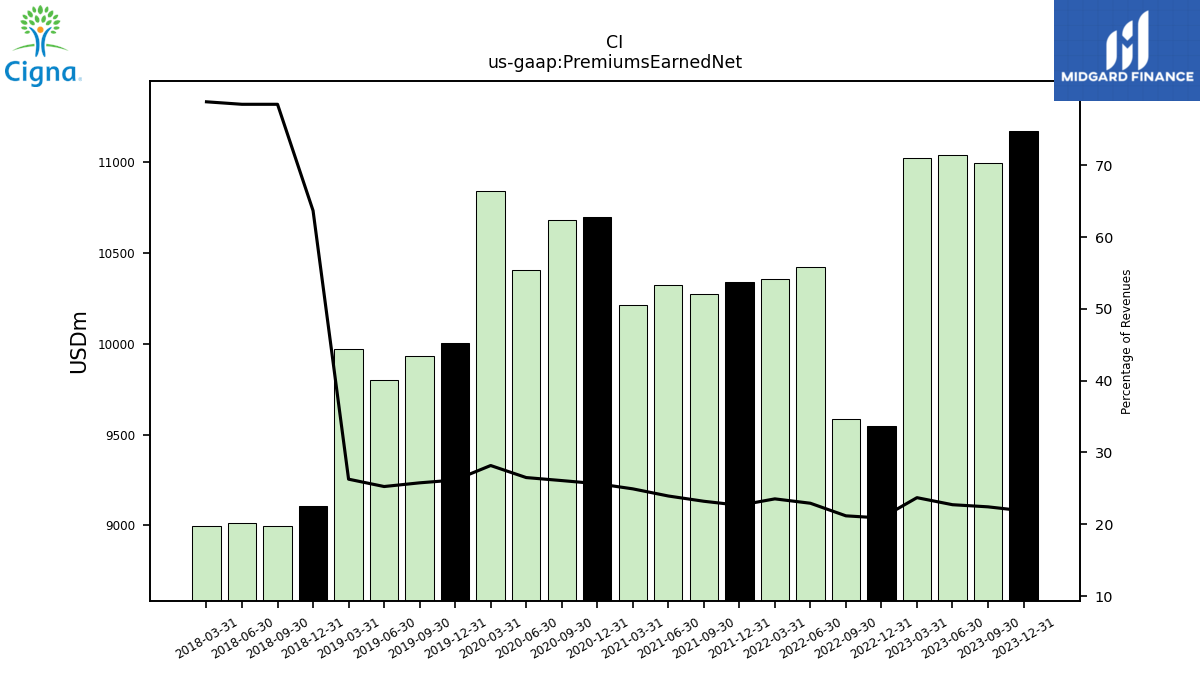
| Premiums Earned Net | 11175.00 | 10998.00 | 11039.00 | 11025.00 | 9547.00 | 9586.00 | 10426.00 | 10356.00 | 10342.00 | 10275.00 | 10323.00 | 10214.00 | 10699.00 | 10682.00 | 10406.00 | 10840.00 | 10005.00 | 9935.00 | 9803.00 | 9971.00 | 9108.00 | 8994.00 | 9012.00 | 8999.00 | NA | NA | NA | NA | |
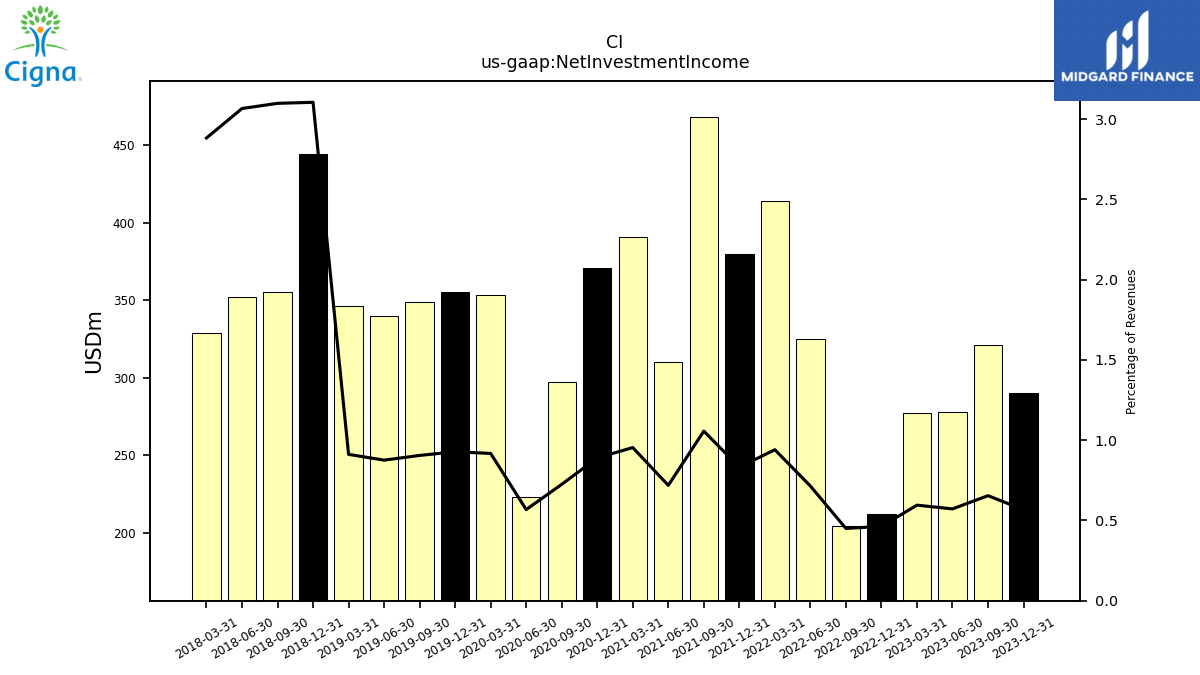
| Net Investment Income | 290.00 | 321.00 | 278.00 | 277.00 | 212.00 | 204.00 | 325.00 | 414.00 | 380.00 | 468.00 | 310.00 | 391.00 | 371.00 | 297.00 | 223.00 | 353.00 | 355.00 | 349.00 | 340.00 | 346.00 | 444.00 | 355.00 | 352.00 | 329.00 | NA | NA | NA | NA | |
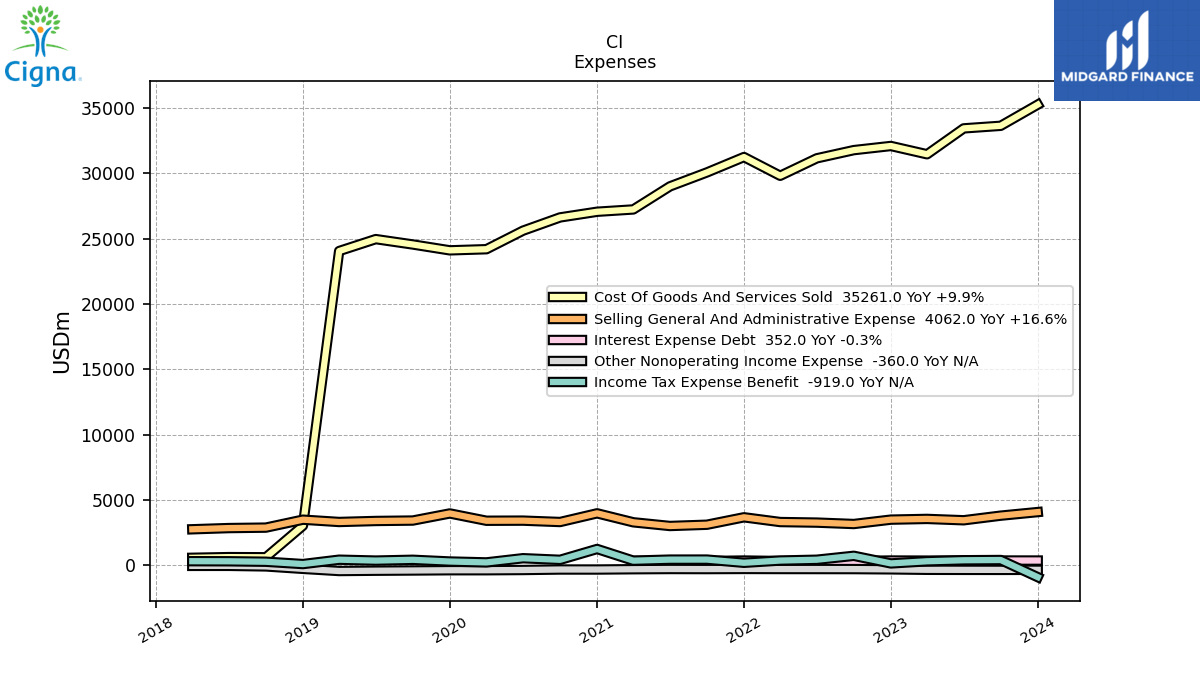
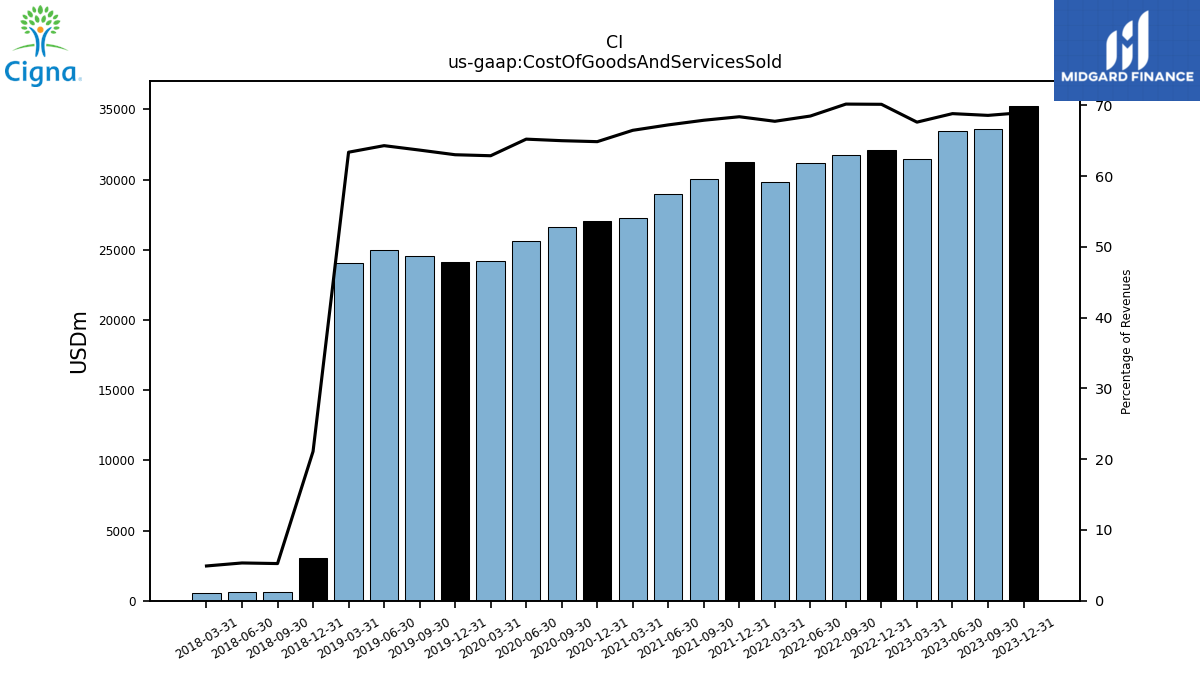
| Cost Of Goods And Services Sold | 35261.00 | 33639.00 | 33442.00 | 31459.00 | 32094.00 | 31777.00 | 31150.00 | 29813.00 | 31247.00 | 30070.00 | 29001.00 | 27235.00 | 27059.00 | 26624.00 | 25611.00 | 24190.00 | 24103.00 | 24552.00 | 24963.00 | 24050.00 | 3017.00 | 602.00 | 613.00 | 561.00 | NA | NA | NA | NA | |
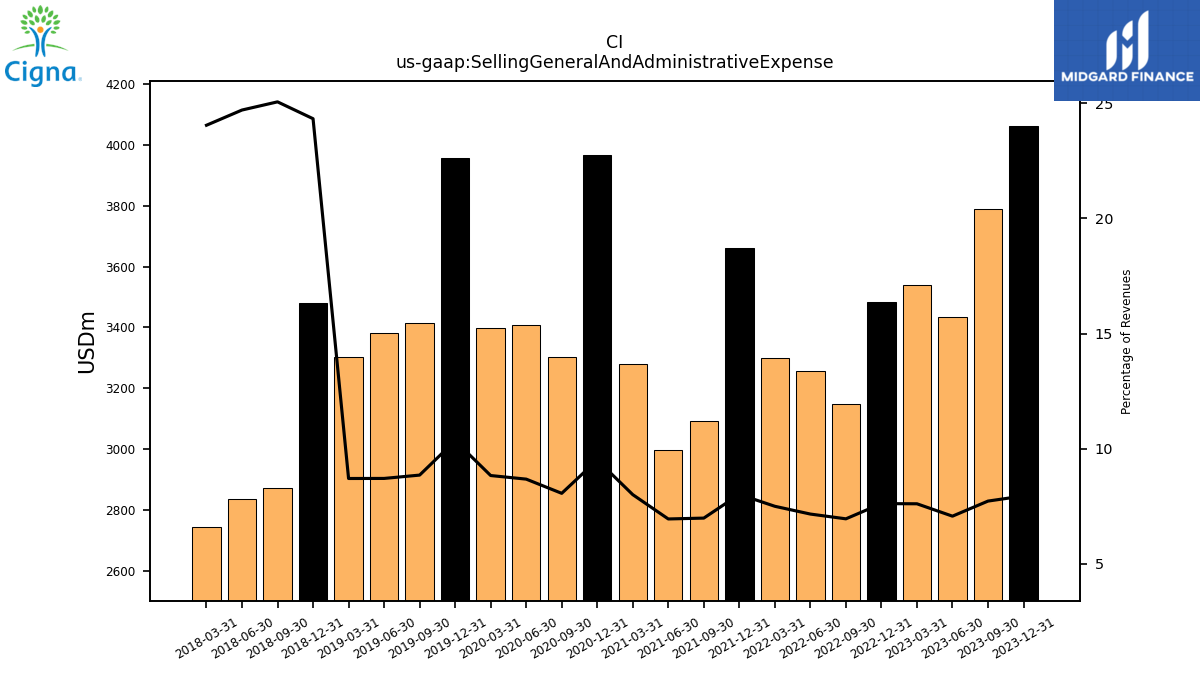
| Selling General And Administrative Expense | 4062.00 | 3788.00 | 3434.00 | 3538.00 | 3483.00 | 3148.00 | 3256.00 | 3299.00 | 3662.00 | 3093.00 | 2996.00 | 3279.00 | 3966.00 | 3301.00 | 3407.00 | 3398.00 | 3957.00 | 3413.00 | 3380.00 | 3303.00 | 3480.00 | 2872.00 | 2837.00 | 2745.00 | NA | NA | NA | NA | |
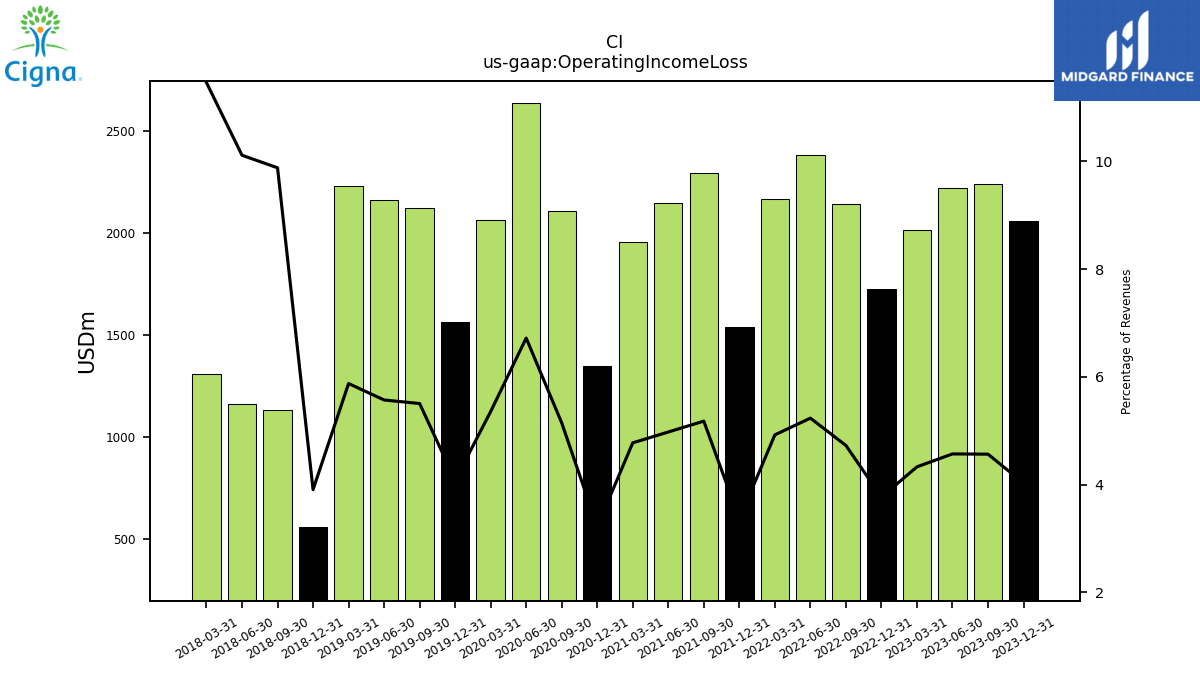
| Operating Income Loss | 2060.00 | 2240.00 | 2221.00 | 2015.00 | 1725.00 | 2141.00 | 2381.00 | 2167.00 | 1537.00 | 2294.00 | 2147.00 | 1957.00 | 1345.00 | 2108.00 | 2639.00 | 2061.00 | 1561.00 | 2123.00 | 2163.00 | 2230.00 | 559.00 | 1132.00 | 1161.00 | 1308.00 | NA | NA | NA | NA | |
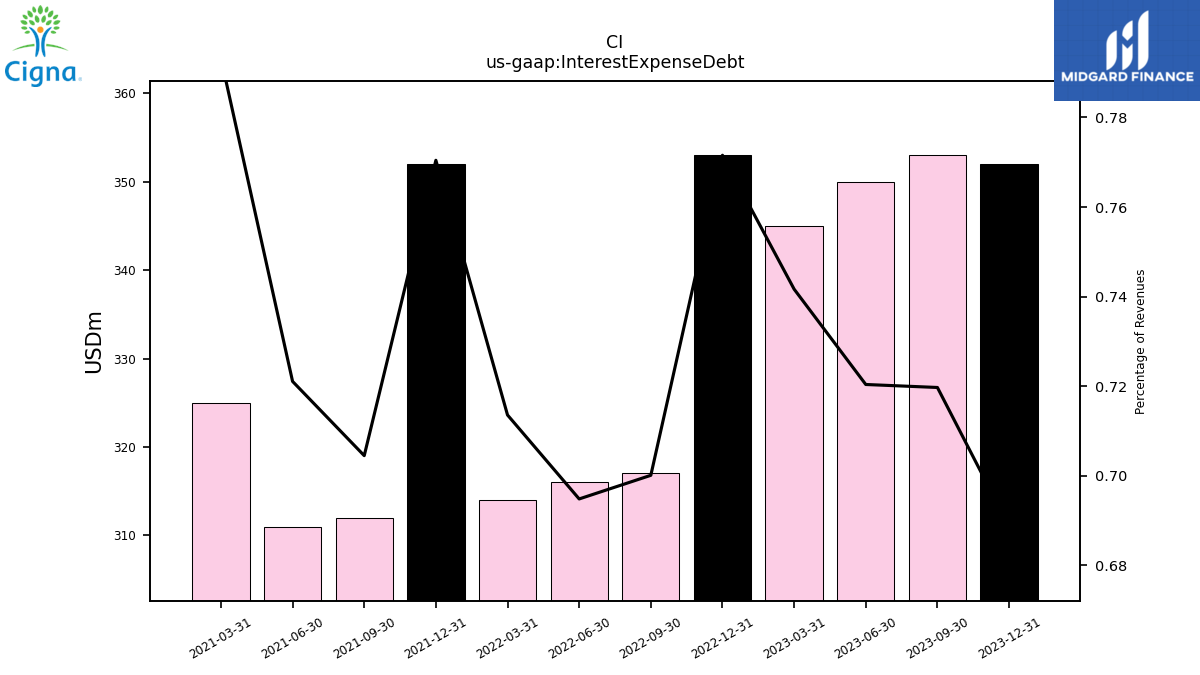
| Interest Expense Debt | 352.00 | 353.00 | 350.00 | 345.00 | 353.00 | 317.00 | 316.00 | 314.00 | 352.00 | 312.00 | 311.00 | 325.00 | NA | NA | NA | NA | NA | NA | NA | NA | NA | NA | NA | NA | NA | NA | NA | NA | |
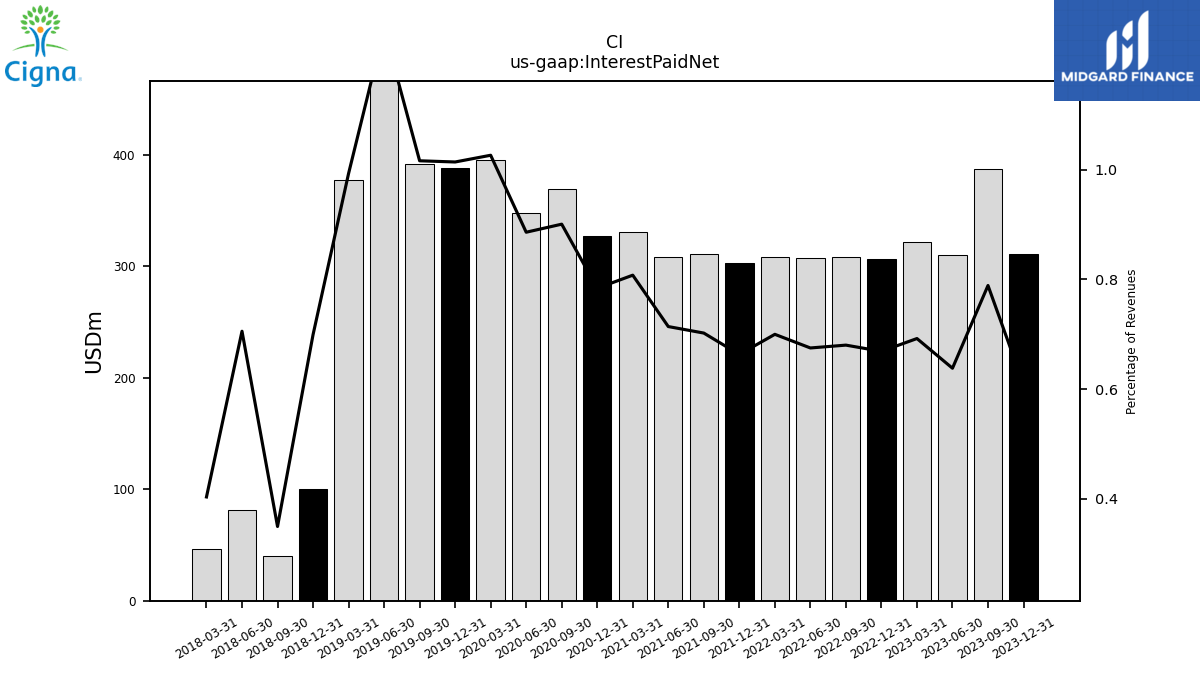
| Interest Paid Net | 311.00 | 387.00 | 310.00 | 322.00 | 306.00 | 308.00 | 307.00 | 308.00 | 303.00 | 311.00 | 308.00 | 331.00 | 327.00 | 369.00 | 348.00 | 395.00 | 388.00 | 392.00 | 488.00 | 377.00 | 100.00 | 40.00 | 81.00 | 46.00 | NA | NA | NA | NA | |
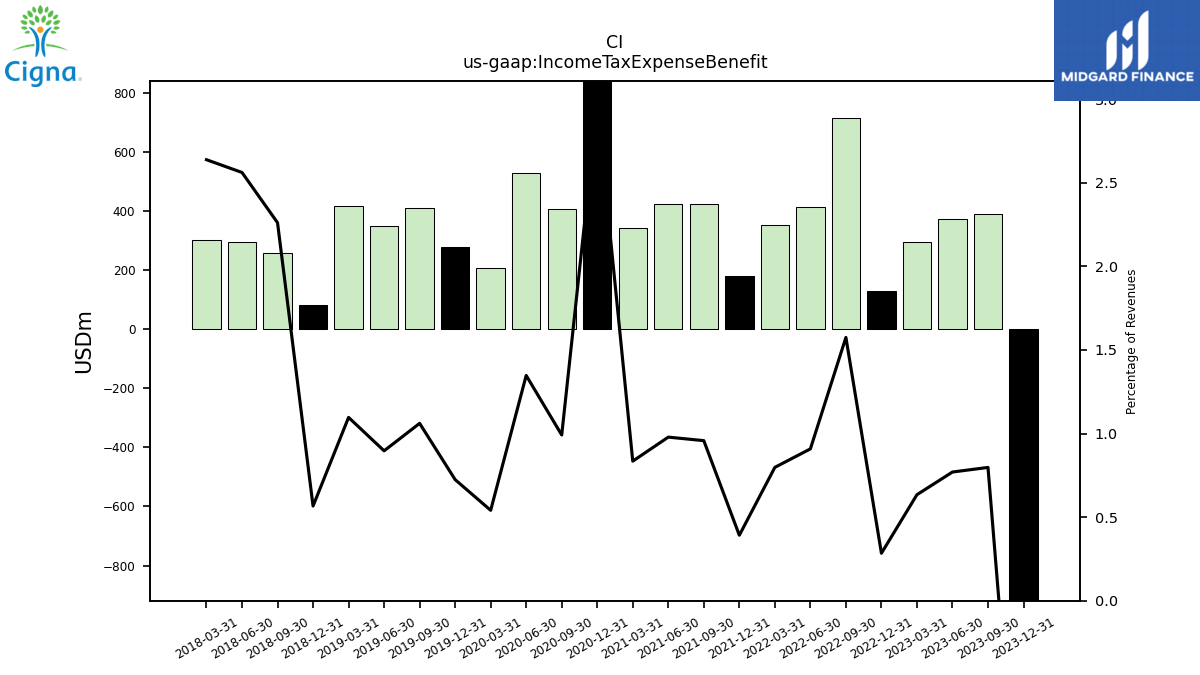
| Income Tax Expense Benefit | -919.00 | 391.00 | 374.00 | 295.00 | 130.00 | 713.00 | 413.00 | 351.00 | 179.00 | 424.00 | 422.00 | 342.00 | 1236.00 | 406.00 | 529.00 | 208.00 | 277.00 | 409.00 | 348.00 | 416.00 | 81.00 | 259.00 | 294.00 | 301.00 | NA | NA | NA | NA | |
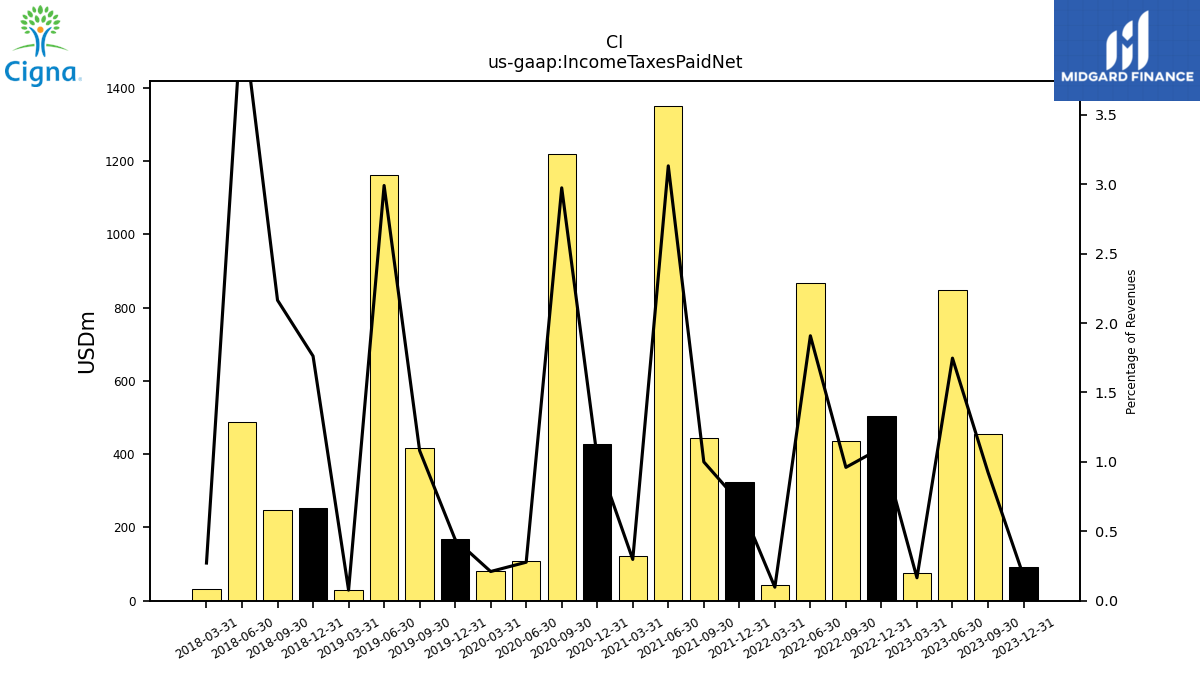
| Income Taxes Paid Net | 91.00 | 454.00 | 849.00 | 77.00 | 504.00 | 435.00 | 868.00 | 43.00 | 324.00 | 443.00 | 1351.00 | 122.00 | 429.00 | 1218.00 | 109.00 | 81.00 | 169.00 | 417.00 | 1161.00 | 29.00 | 252.00 | 248.00 | 488.00 | 31.00 | NA | NA | NA | NA | |
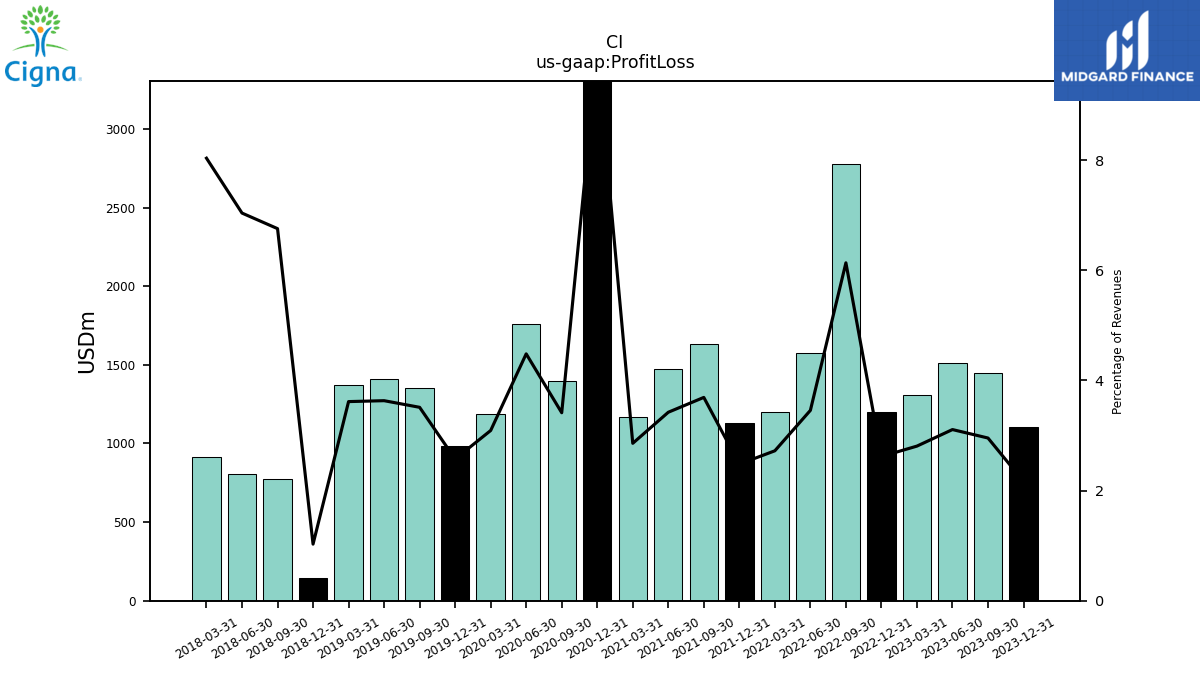
| Profit Loss | 1107.00 | 1449.00 | 1510.00 | 1306.00 | 1198.00 | 2778.00 | 1572.00 | 1198.00 | 1133.00 | 1635.00 | 1476.00 | 1171.00 | 4142.00 | 1398.00 | 1760.00 | 1189.00 | 984.00 | 1354.00 | 1410.00 | 1372.00 | 147.00 | 774.00 | 808.00 | 917.00 | NA | NA | NA | NA | |
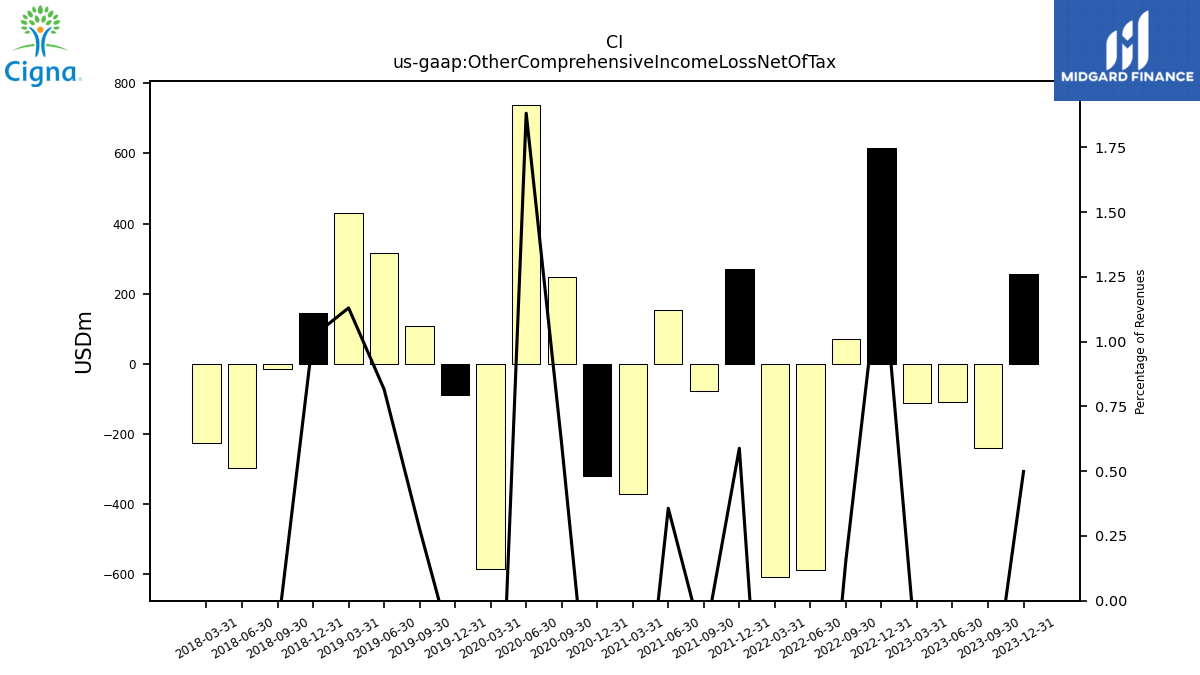
| Other Comprehensive Income Loss Net Of Tax | 255.00 | -241.00 | -109.00 | -111.00 | 614.00 | 71.00 | -588.00 | -608.00 | 269.00 | -76.00 | 154.00 | -370.00 | -320.00 | 247.00 | 739.00 | -586.00 | -88.00 | 107.00 | 317.00 | 429.00 | 146.00 | -14.00 | -296.00 | -226.00 | NA | NA | NA | NA | |
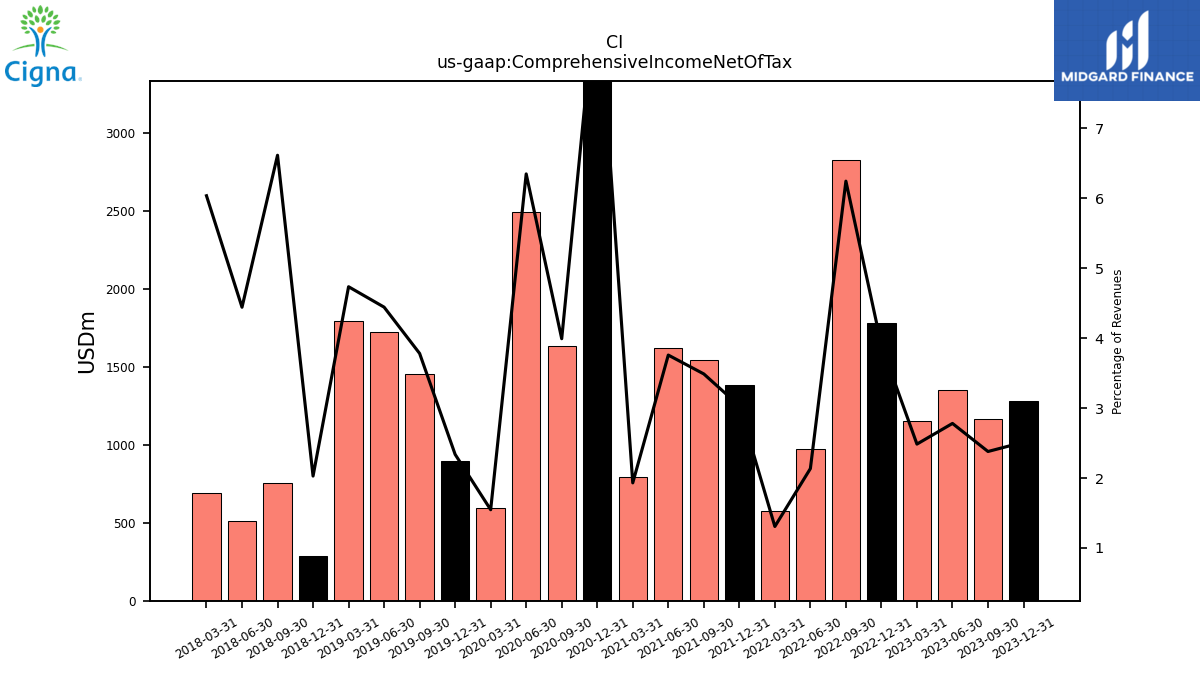
| Comprehensive Income Net Of Tax | 1284.00 | 1167.00 | 1351.00 | 1156.00 | 1783.00 | 2828.00 | 971.00 | 575.00 | 1385.00 | 1545.00 | 1621.00 | 791.00 | 3815.00 | 1635.00 | 2493.00 | 595.00 | 894.00 | 1458.00 | 1725.00 | 1797.00 | 290.00 | 758.00 | 510.00 | 689.00 | NA | NA | NA | NA | |
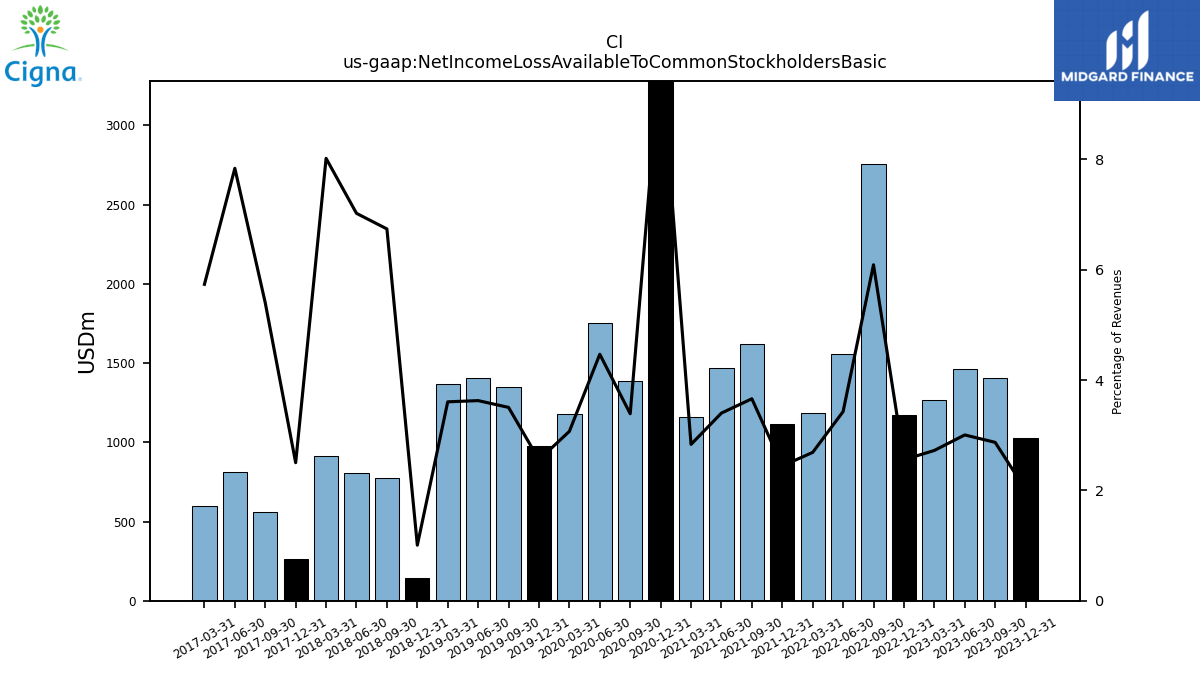
| Net Income Loss Available To Common Stockholders Basic | 1029.00 | 1408.00 | 1460.00 | 1267.00 | 1169.00 | 2757.00 | 1559.00 | 1183.00 | 1116.00 | 1621.00 | 1467.00 | 1161.00 | 4135.00 | 1388.00 | 1754.00 | 1181.00 | 977.00 | 1351.00 | 1408.00 | 1368.00 | 144.00 | 772.00 | 806.00 | 915.00 | 266.00 | 560.00 | 813.00 | 598.00 |
| 2023-12-31 | 2023-09-30 | 2023-06-30 | 2023-03-31 | 2022-12-31 | 2022-09-30 | 2022-06-30 | 2022-03-31 | 2021-12-31 | 2021-09-30 | 2021-06-30 | 2021-03-31 | 2020-12-31 | 2020-09-30 | 2020-06-30 | 2020-03-31 | 2019-12-31 | 2019-09-30 | 2019-06-30 | 2019-03-31 | 2018-12-31 | 2018-09-30 | 2018-06-30 | 2018-03-31 | 2017-12-31 | 2017-09-30 | 2017-06-30 | 2017-03-31 | ||
|---|---|---|---|---|---|---|---|---|---|---|---|---|---|---|---|---|---|---|---|---|---|---|---|---|---|---|---|---|---|
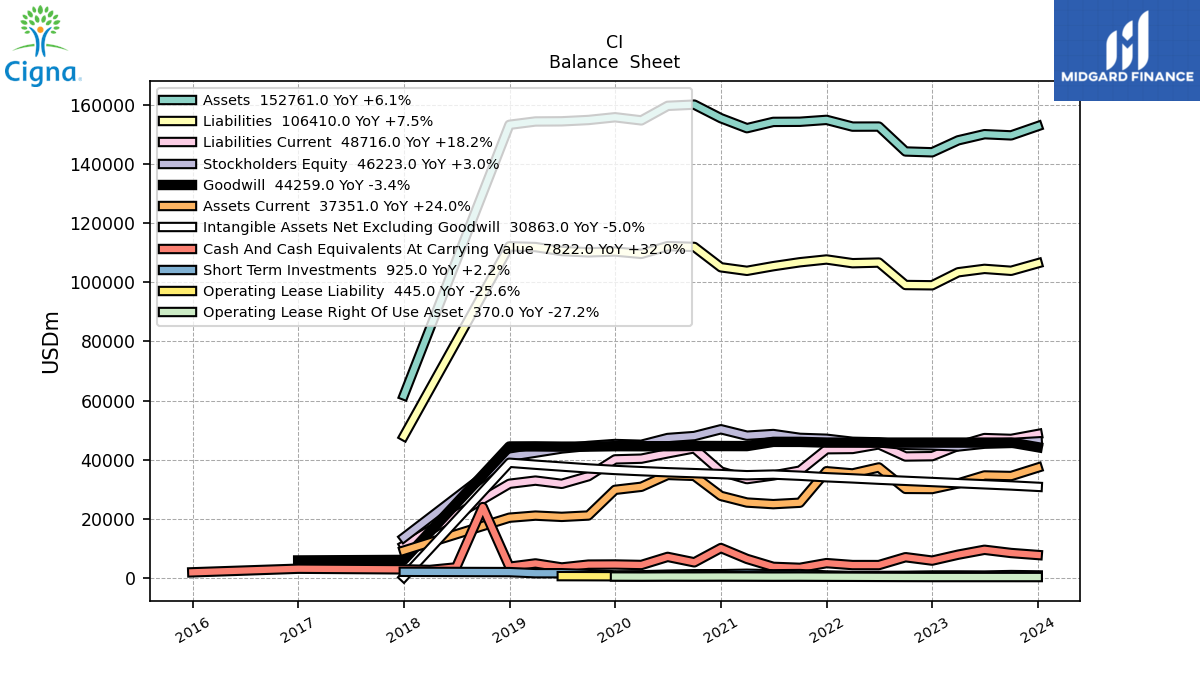
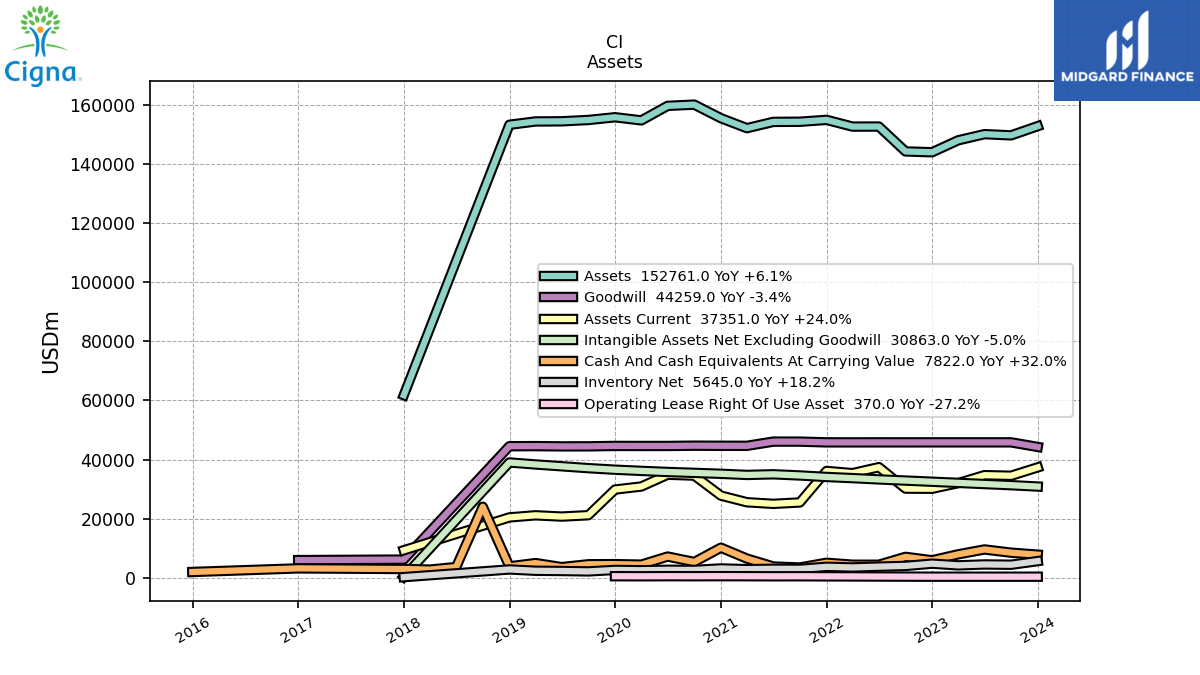
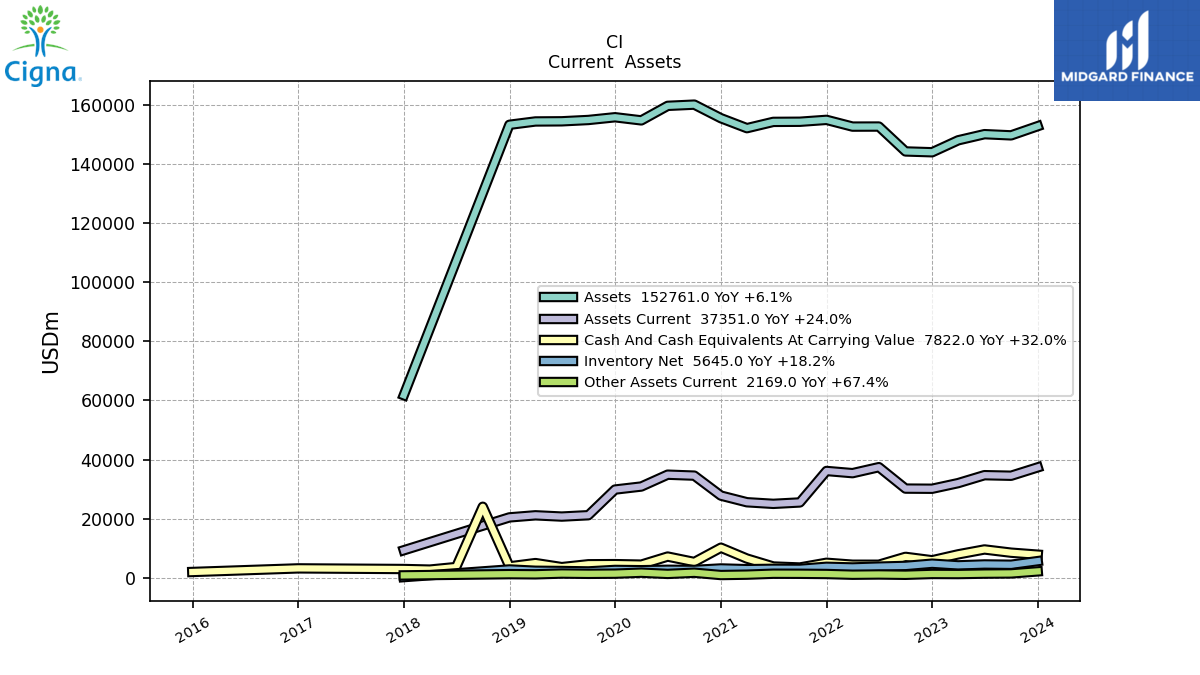
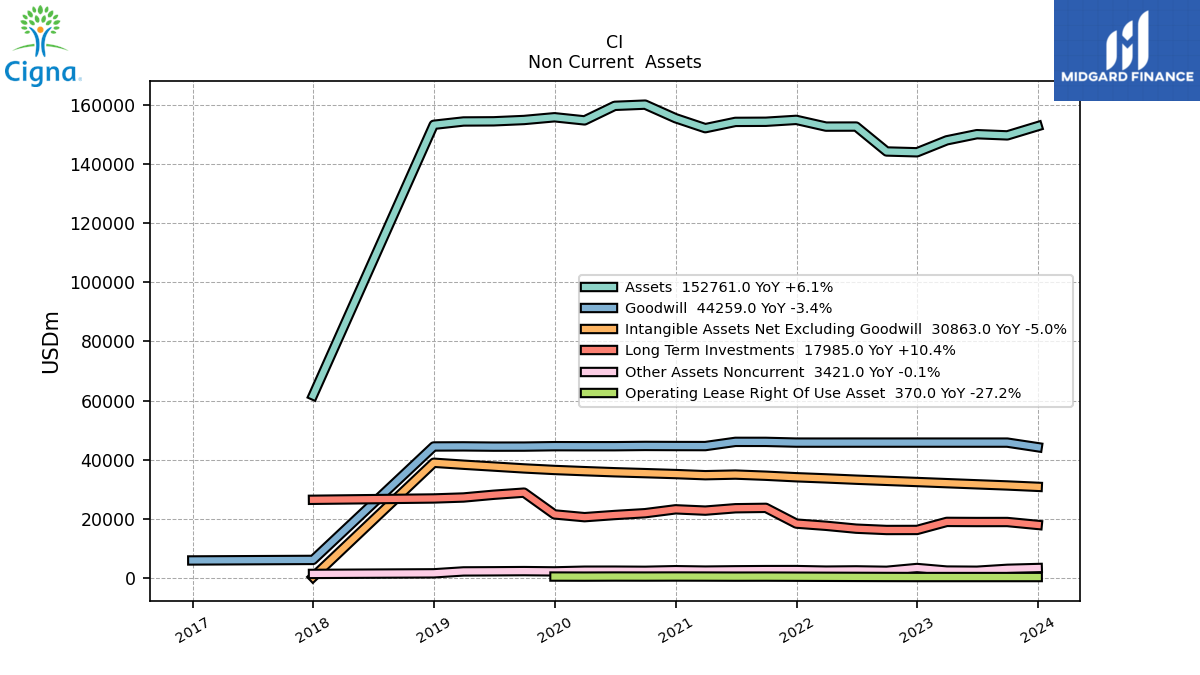
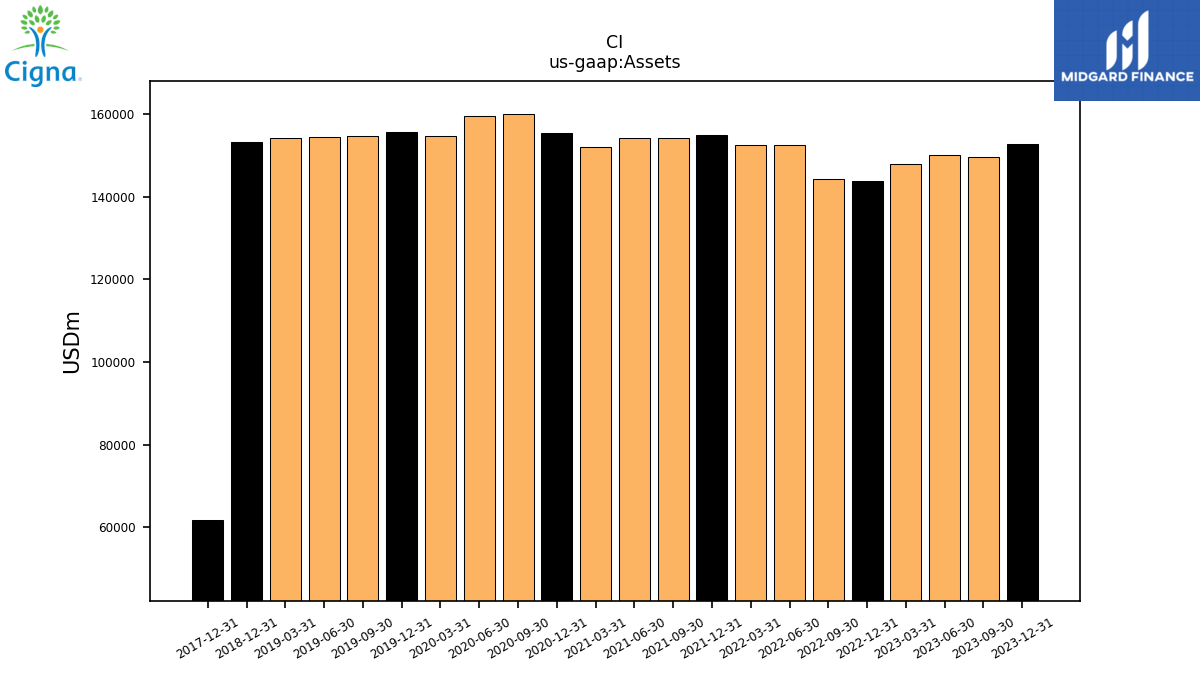
| Assets | 152761.00 | 149645.00 | 150054.00 | 147976.00 | 143932.00 | 144209.00 | 152630.00 | 152610.00 | 154889.00 | 154251.00 | 154207.00 | 152081.00 | 155451.00 | 160044.00 | 159628.00 | 154711.00 | 155774.00 | 154847.00 | 154401.00 | 154348.00 | 153226.00 | NA | NA | NA | 61759.00 | NA | NA | NA | |
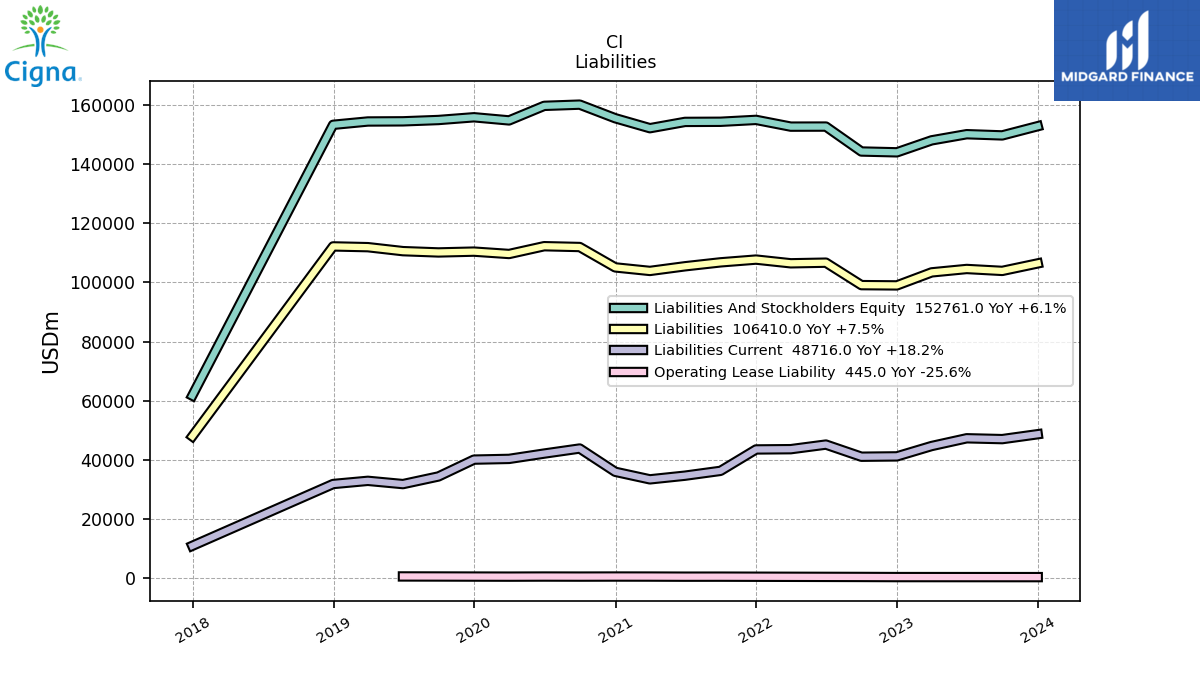
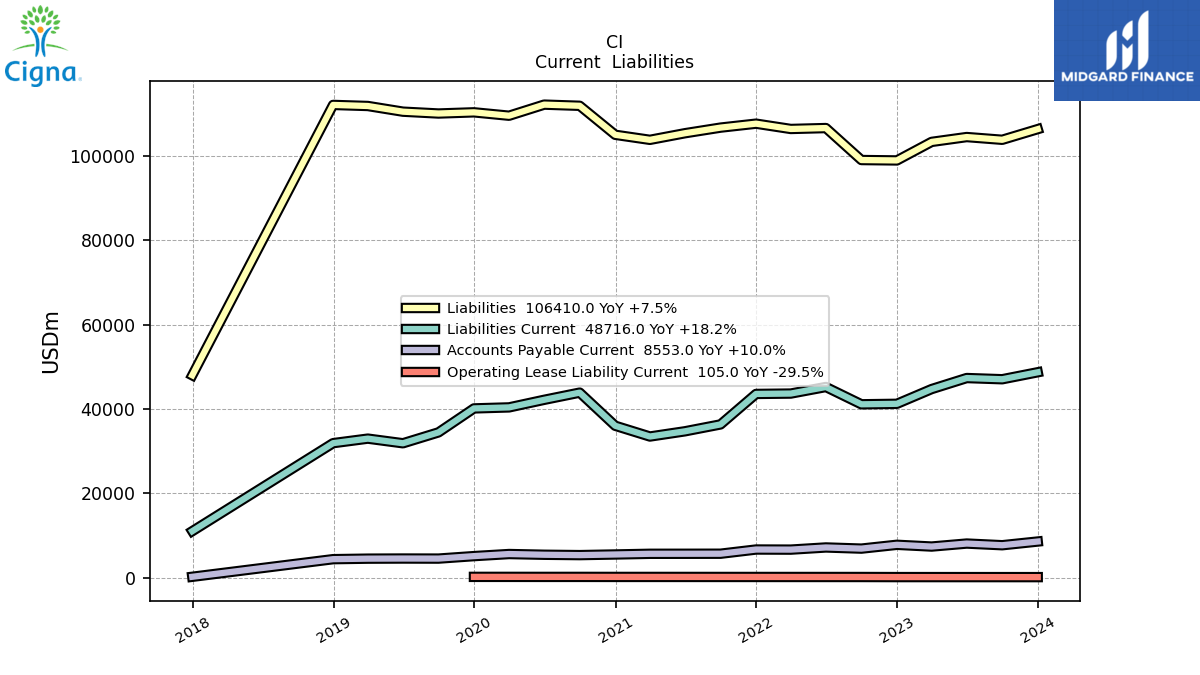
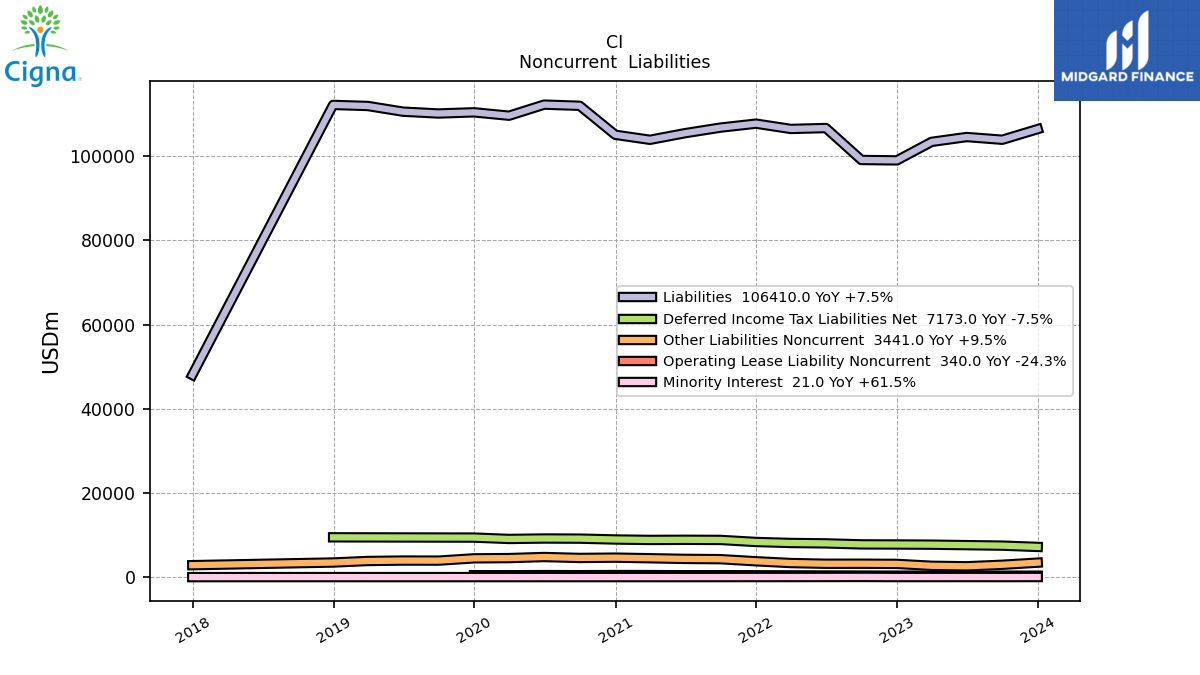
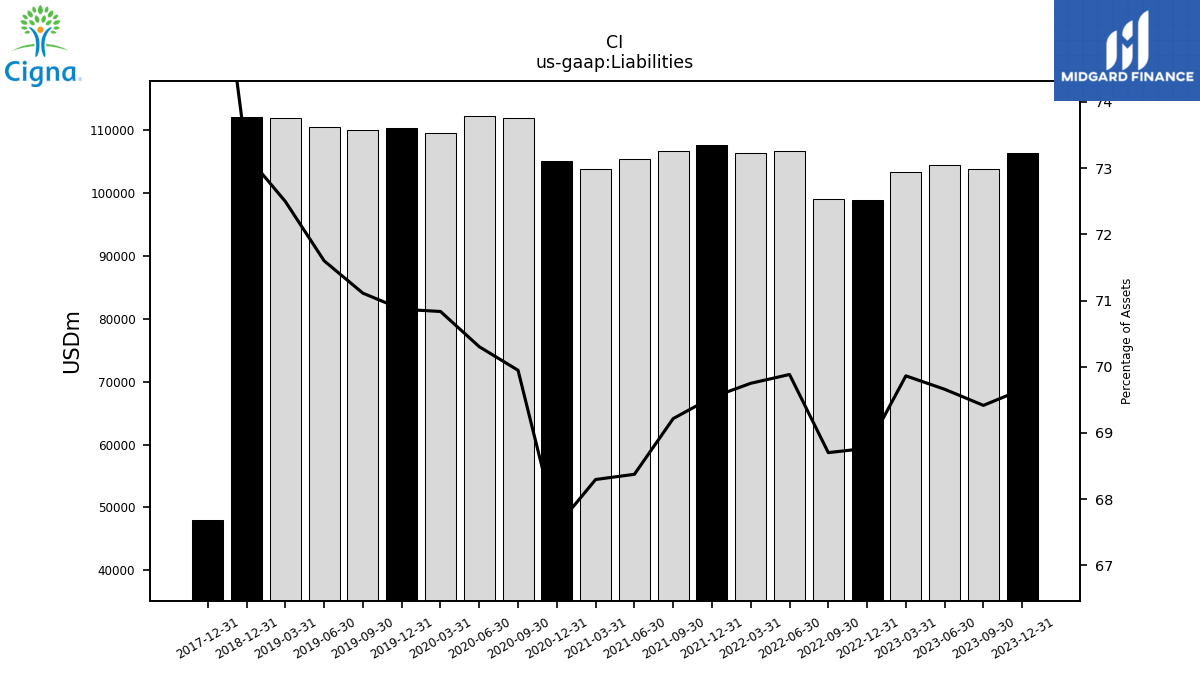
| Liabilities | 106410.00 | 103879.00 | 104528.00 | 103380.00 | 98981.00 | 99076.00 | 106663.00 | 106446.00 | 107705.00 | 106768.00 | 105440.00 | 103867.00 | 105065.00 | 111946.00 | 112223.00 | 109590.00 | 110395.00 | 110114.00 | 110552.00 | 111897.00 | 112154.00 | NA | NA | NA | 47999.00 | NA | NA | NA | |
| Liabilities And Stockholders Equity | 152761.00 | 149645.00 | 150054.00 | 147976.00 | 143932.00 | 144209.00 | 152630.00 | 152610.00 | 154889.00 | 154251.00 | 154207.00 | 152081.00 | 155451.00 | 160044.00 | 159628.00 | 154711.00 | 155774.00 | 154847.00 | 154401.00 | 154348.00 | 153226.00 | NA | NA | NA | 61759.00 | NA | NA | NA | |
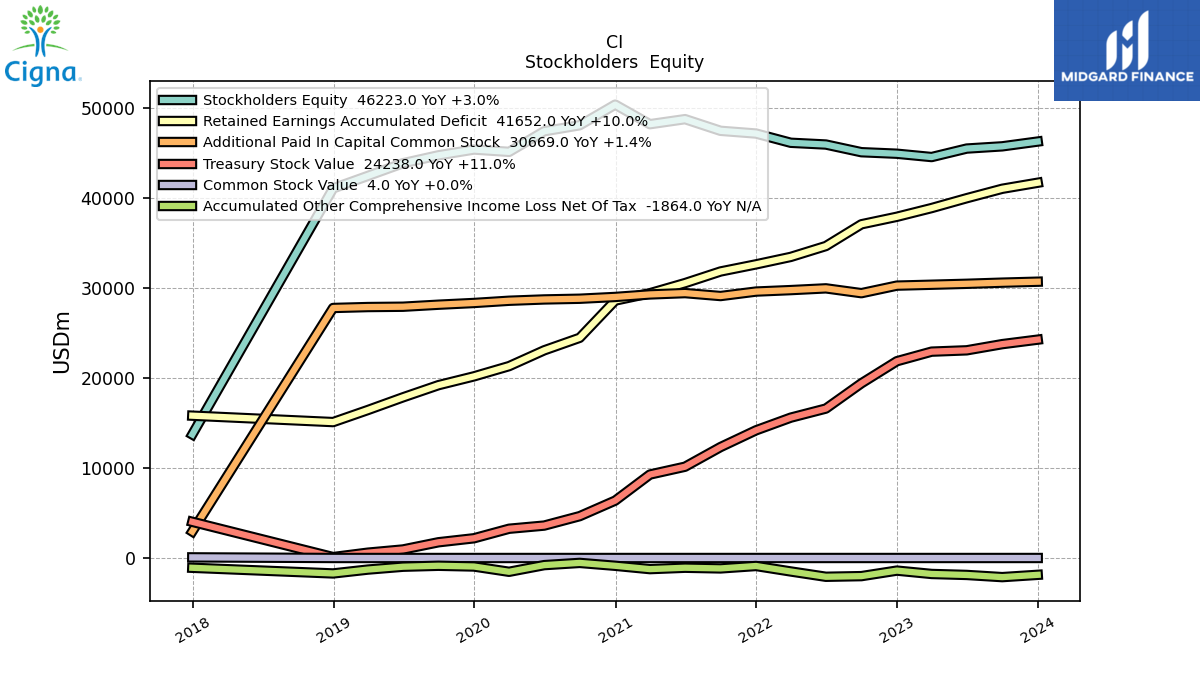
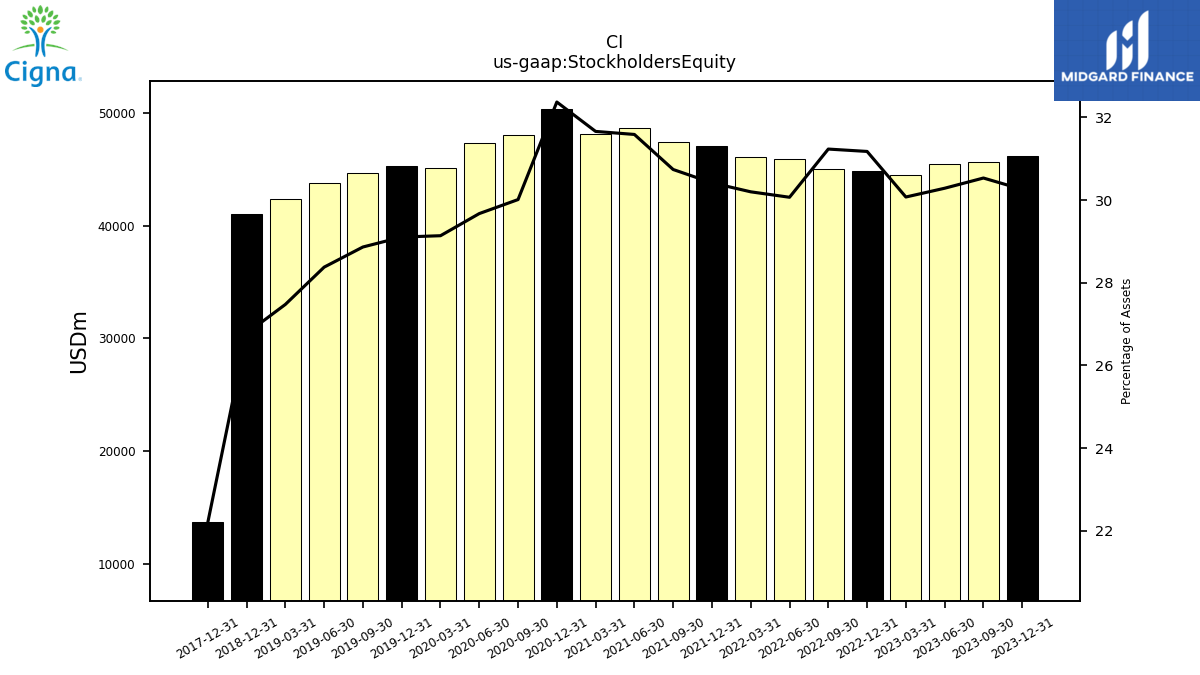
| Stockholders Equity | 46223.00 | 45691.00 | 45445.00 | 44502.00 | 44872.00 | 45041.00 | 45892.00 | 46087.00 | 47112.00 | 47415.00 | 48709.00 | 48149.00 | 50321.00 | 48032.00 | 47366.00 | 45079.00 | 45338.00 | 44696.00 | 43815.00 | 42408.00 | 41028.00 | NA | NA | NA | 13711.00 | NA | NA | NA |
| 2023-12-31 | 2023-09-30 | 2023-06-30 | 2023-03-31 | 2022-12-31 | 2022-09-30 | 2022-06-30 | 2022-03-31 | 2021-12-31 | 2021-09-30 | 2021-06-30 | 2021-03-31 | 2020-12-31 | 2020-09-30 | 2020-06-30 | 2020-03-31 | 2019-12-31 | 2019-09-30 | 2019-06-30 | 2019-03-31 | 2018-12-31 | 2018-09-30 | 2018-06-30 | 2018-03-31 | 2017-12-31 | 2017-09-30 | 2017-06-30 | 2017-03-31 | ||
|---|---|---|---|---|---|---|---|---|---|---|---|---|---|---|---|---|---|---|---|---|---|---|---|---|---|---|---|---|---|
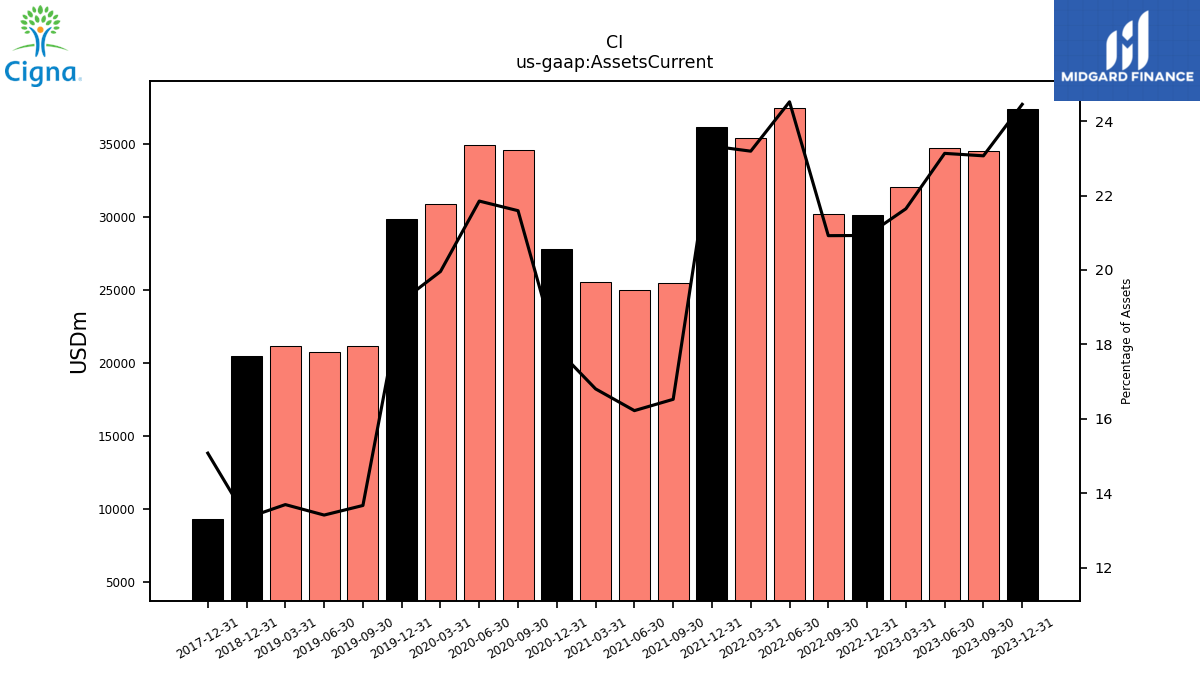
| Assets Current | 37351.00 | 34518.00 | 34711.00 | 32027.00 | 30120.00 | 30170.00 | 37422.00 | 35393.00 | 36134.00 | 25487.00 | 25011.00 | 25554.00 | 27799.00 | 34557.00 | 34880.00 | 30877.00 | 29845.00 | 21168.00 | 20709.00 | 21136.00 | 20430.00 | NA | NA | NA | 9311.00 | NA | NA | NA | |
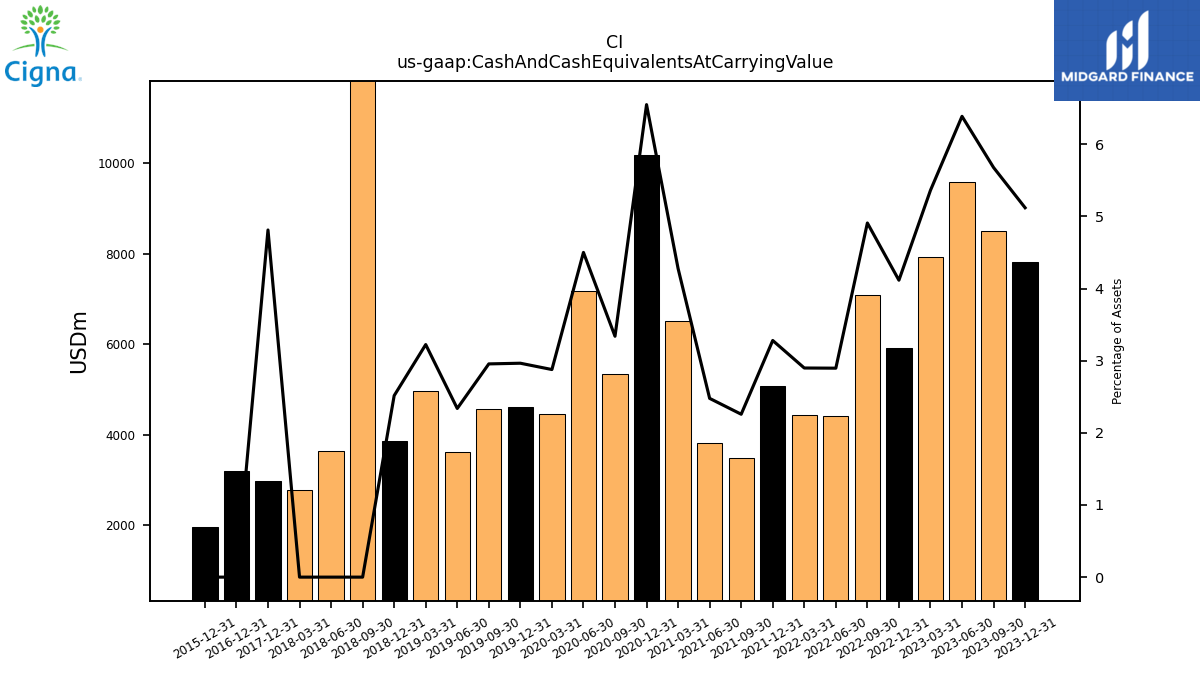
| Cash And Cash Equivalents At Carrying Value | 7822.00 | 8497.00 | 9585.00 | 7935.00 | 5924.00 | 7079.00 | 4421.00 | 4424.00 | 5081.00 | 3483.00 | 3821.00 | 6505.00 | 10182.00 | 5344.00 | 7185.00 | 4452.00 | 4619.00 | 4577.00 | 3610.00 | 4976.00 | 3855.00 | 24032.00 | 3634.00 | 2771.00 | 2972.00 | NA | NA | NA | |
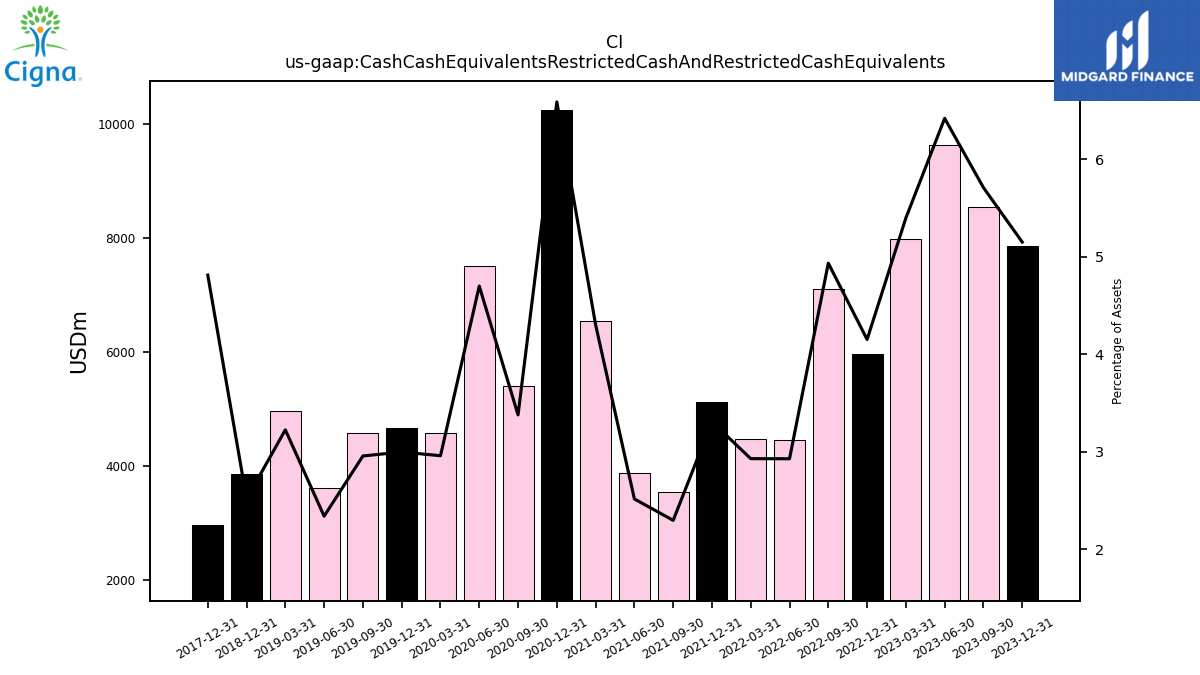
| Cash Cash Equivalents Restricted Cash And Restricted Cash Equivalents | 7870.00 | 8546.00 | 9636.00 | 7989.00 | 5976.00 | 7117.00 | 4468.00 | 4469.00 | 5123.00 | 3540.00 | 3878.00 | 6544.00 | 10245.00 | 5406.00 | 7503.00 | 4577.00 | 4668.00 | 4577.00 | 3610.00 | 4976.00 | 3855.00 | NA | NA | NA | 2972.00 | NA | NA | NA | |
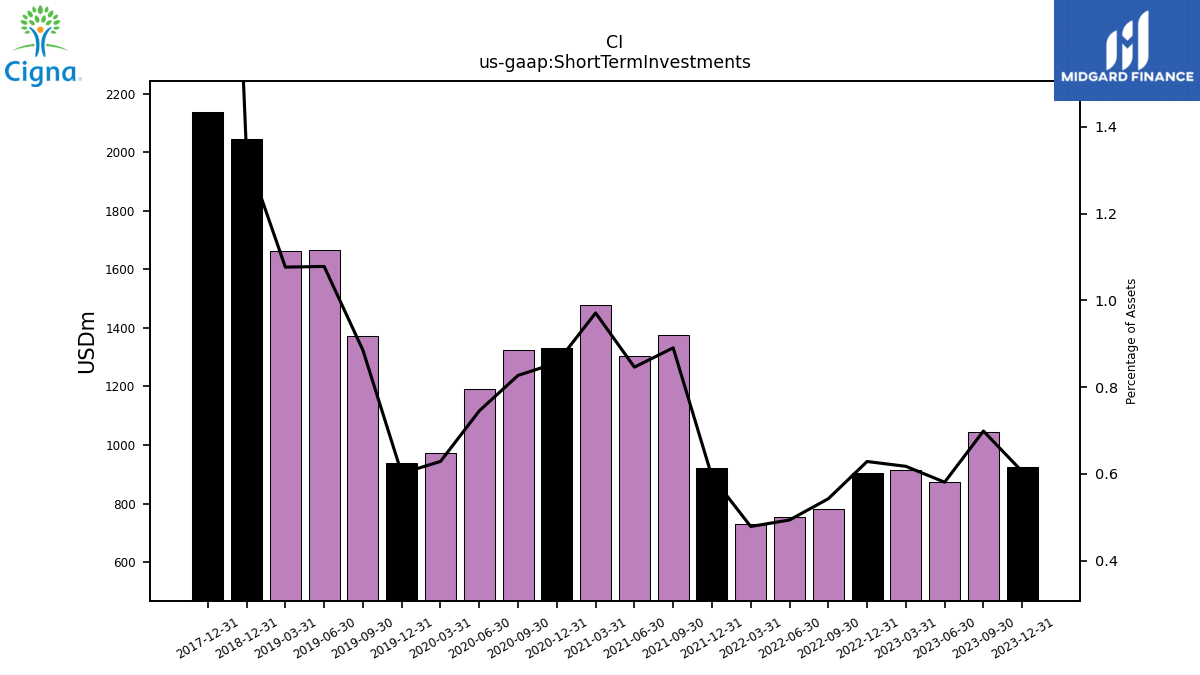
| Short Term Investments | 925.00 | 1046.00 | 872.00 | 914.00 | 905.00 | 783.00 | 754.00 | 731.00 | 920.00 | 1374.00 | 1305.00 | 1477.00 | 1331.00 | 1324.00 | 1190.00 | 973.00 | 937.00 | 1371.00 | 1665.00 | 1662.00 | 2045.00 | NA | NA | NA | 2136.00 | NA | NA | NA | |
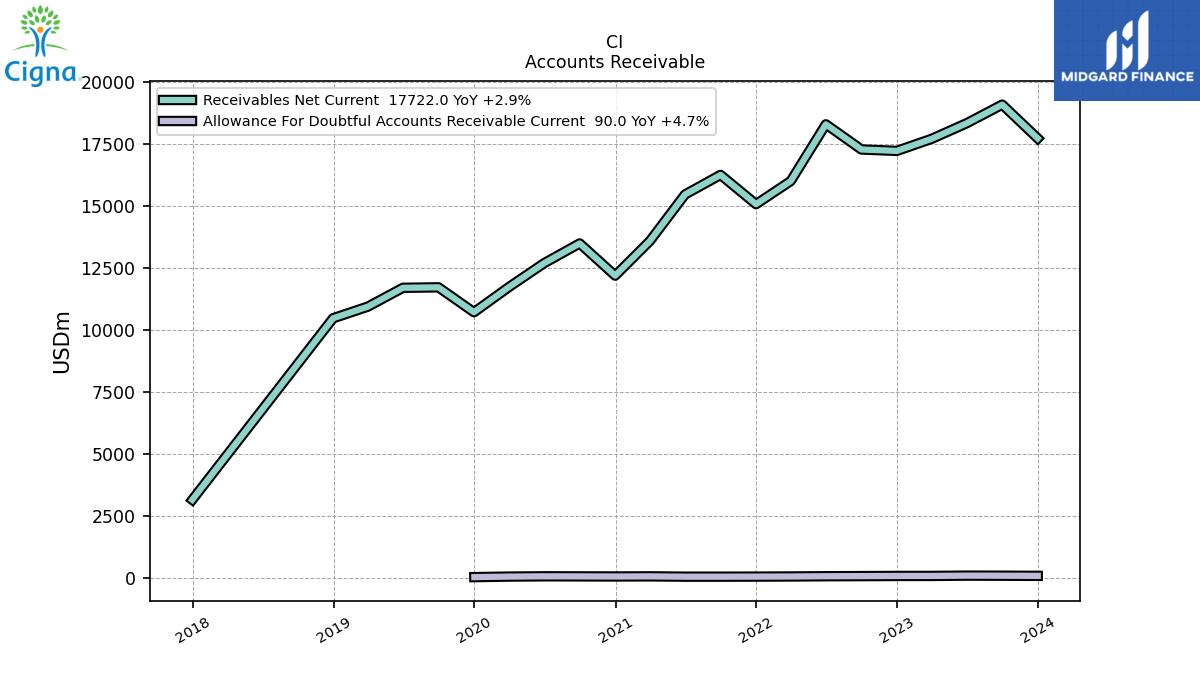
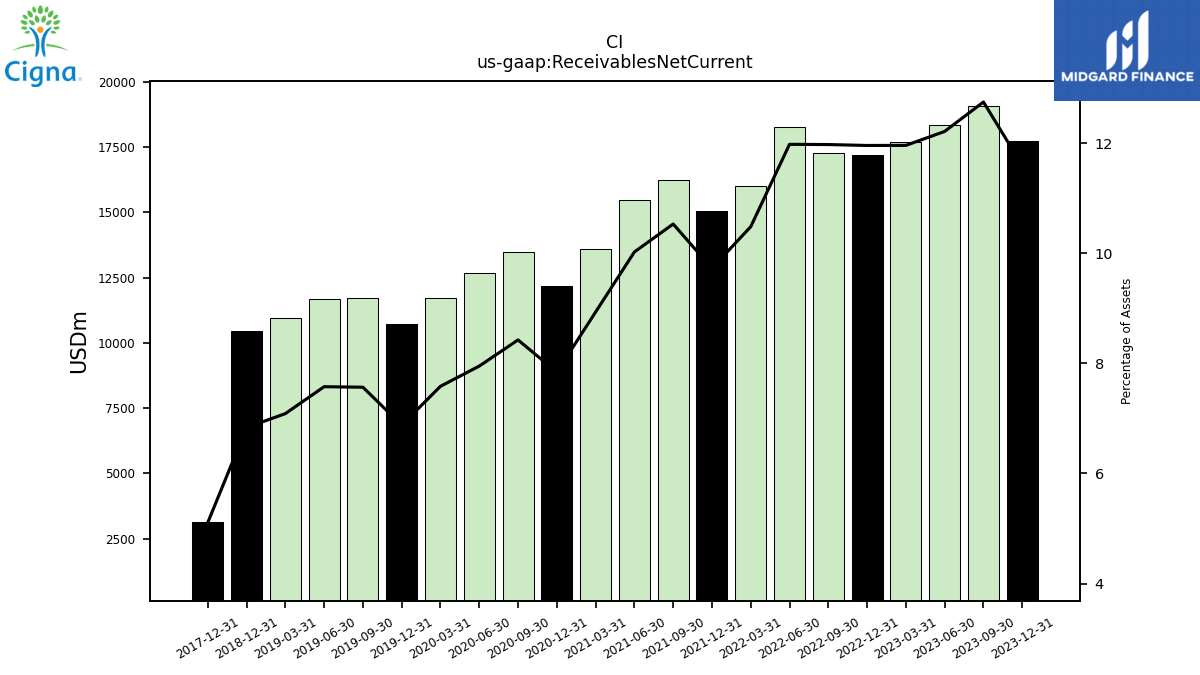
| Receivables Net Current | 17722.00 | 19083.00 | 18333.00 | 17704.00 | 17218.00 | 17275.00 | 18290.00 | 16003.00 | 15071.00 | 16250.00 | 15462.00 | 13588.00 | 12191.00 | 13488.00 | 12694.00 | 11735.00 | 10716.00 | 11719.00 | 11700.00 | 10941.00 | 10473.00 | NA | NA | NA | 3155.00 | NA | NA | NA | |
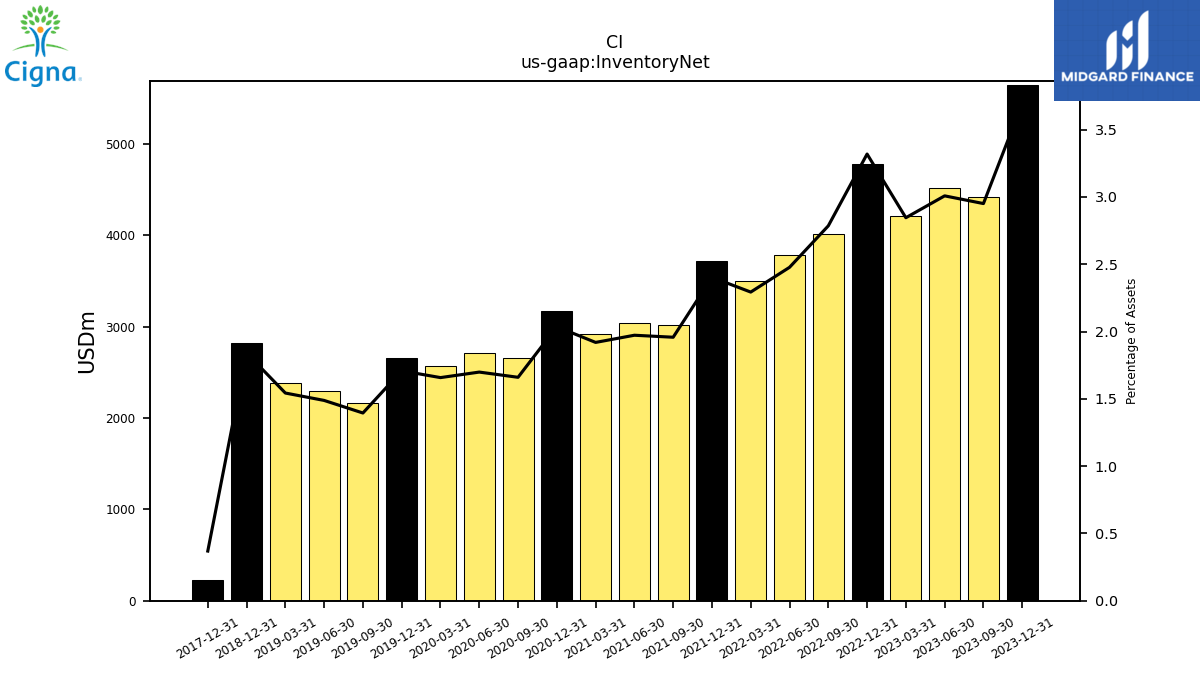
| Inventory Net | 5645.00 | 4416.00 | 4514.00 | 4211.00 | 4777.00 | 4017.00 | 3781.00 | 3500.00 | 3722.00 | 3020.00 | 3042.00 | 2919.00 | 3165.00 | 2657.00 | 2712.00 | 2565.00 | 2661.00 | 2160.00 | 2298.00 | 2382.00 | 2821.00 | NA | NA | NA | 228.00 | NA | NA | NA | |
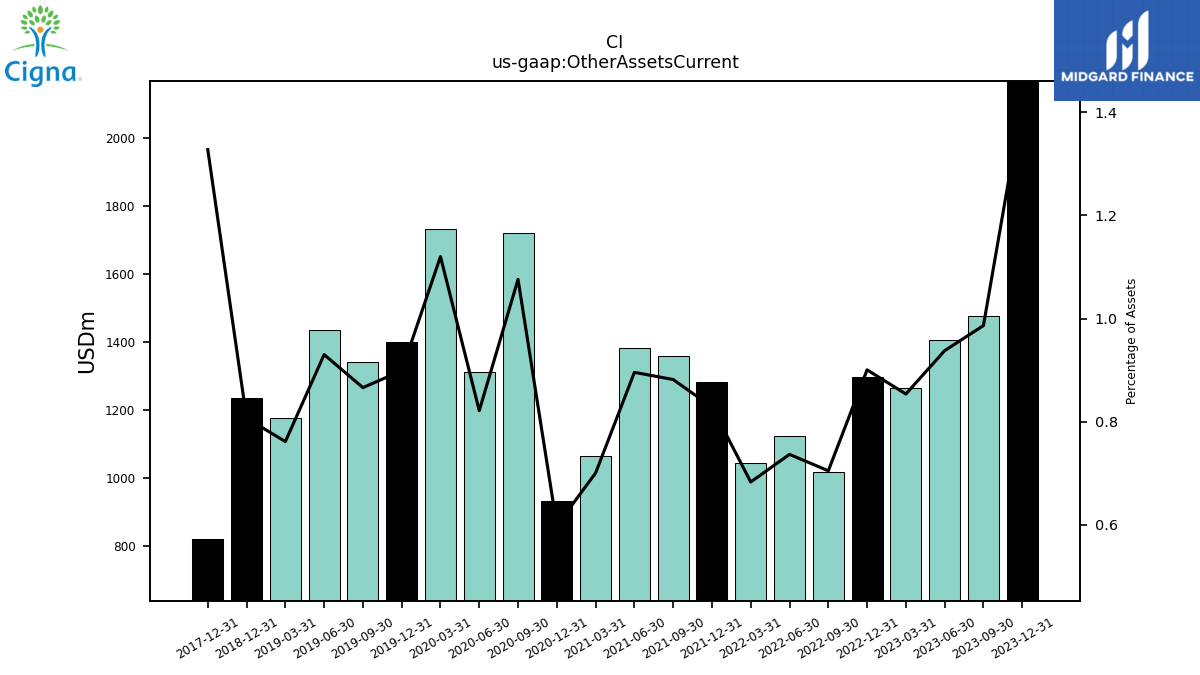
| Other Assets Current | 2169.00 | 1476.00 | 1407.00 | 1263.00 | 1296.00 | 1016.00 | 1124.00 | 1042.00 | 1283.00 | 1360.00 | 1381.00 | 1065.00 | 930.00 | 1722.00 | 1311.00 | 1733.00 | 1400.00 | 1341.00 | 1436.00 | 1175.00 | 1236.00 | NA | NA | NA | 820.00 | NA | NA | NA |
| 2023-12-31 | 2023-09-30 | 2023-06-30 | 2023-03-31 | 2022-12-31 | 2022-09-30 | 2022-06-30 | 2022-03-31 | 2021-12-31 | 2021-09-30 | 2021-06-30 | 2021-03-31 | 2020-12-31 | 2020-09-30 | 2020-06-30 | 2020-03-31 | 2019-12-31 | 2019-09-30 | 2019-06-30 | 2019-03-31 | 2018-12-31 | 2018-09-30 | 2018-06-30 | 2018-03-31 | 2017-12-31 | 2017-09-30 | 2017-06-30 | 2017-03-31 | ||
|---|---|---|---|---|---|---|---|---|---|---|---|---|---|---|---|---|---|---|---|---|---|---|---|---|---|---|---|---|---|
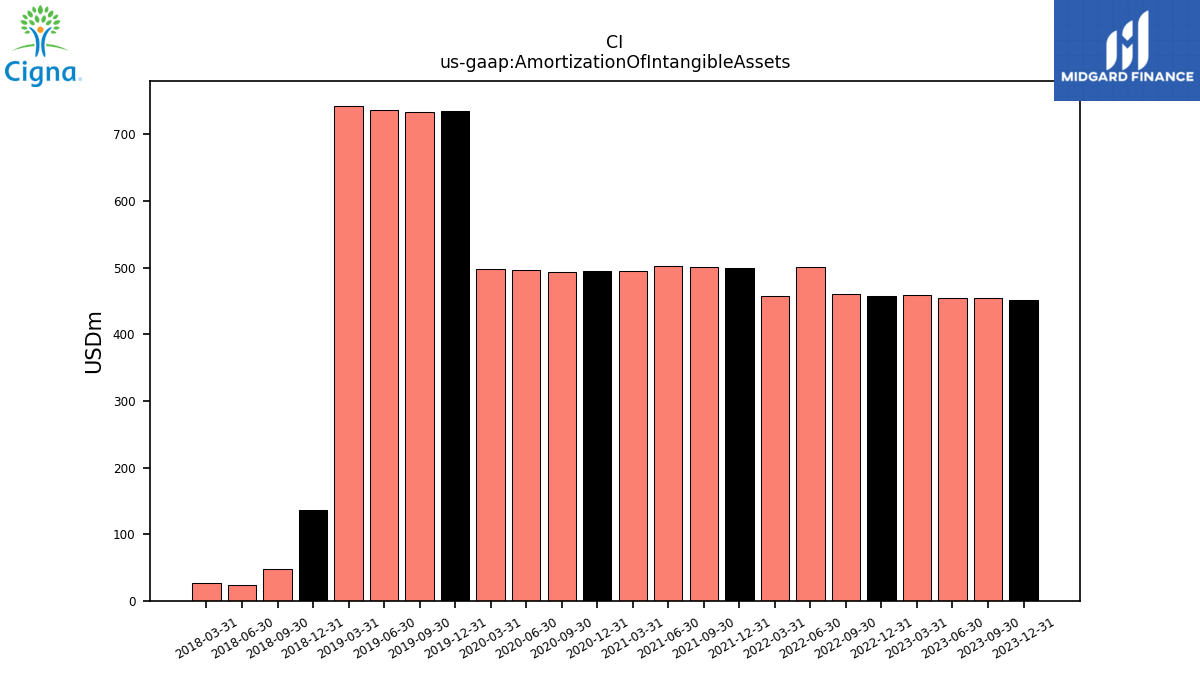
| Amortization Of Intangible Assets | 451.00 | 454.00 | 455.00 | 459.00 | 457.00 | 460.00 | 501.00 | 458.00 | 499.00 | 501.00 | 503.00 | 495.00 | 495.00 | 493.00 | 496.00 | 498.00 | 735.00 | 734.00 | 737.00 | 743.00 | 136.00 | 48.00 | 24.00 | 27.00 | NA | NA | NA | NA | |
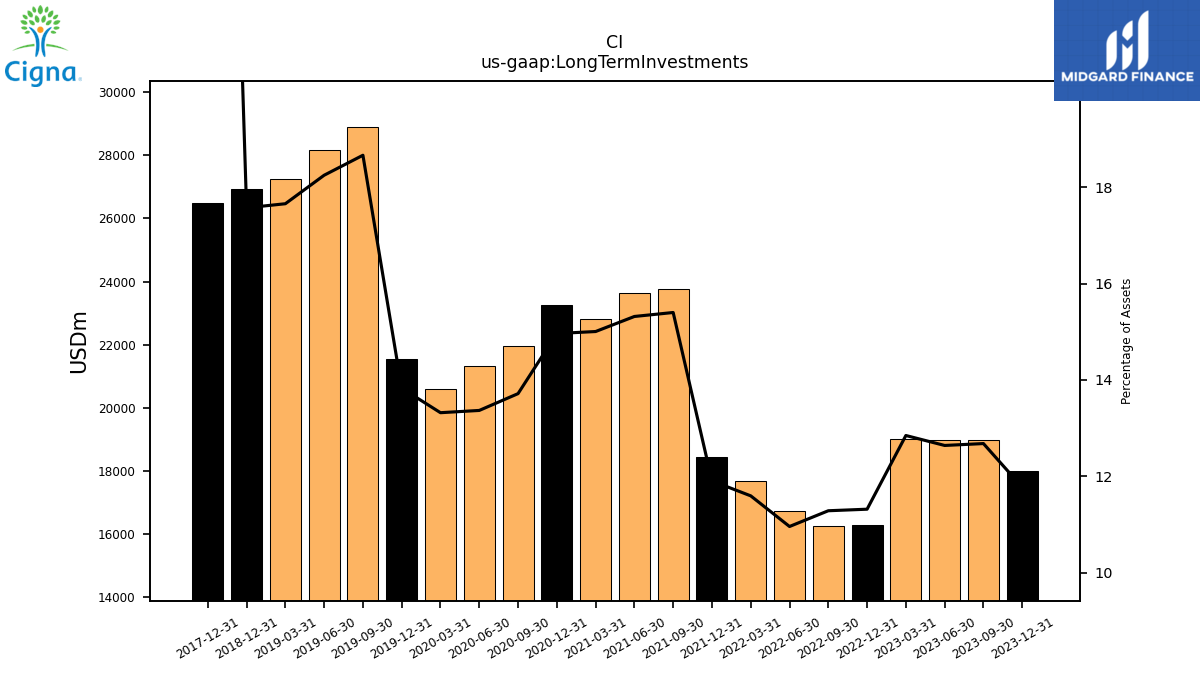
| Long Term Investments | 17985.00 | 18974.00 | 18967.00 | 19010.00 | 16288.00 | 16273.00 | 16724.00 | 17693.00 | 18438.00 | 23756.00 | 23622.00 | 22821.00 | 23262.00 | 21952.00 | 21338.00 | 20608.00 | 21542.00 | 28904.00 | 28180.00 | 27257.00 | 26929.00 | NA | NA | NA | 26483.00 | NA | NA | NA | |
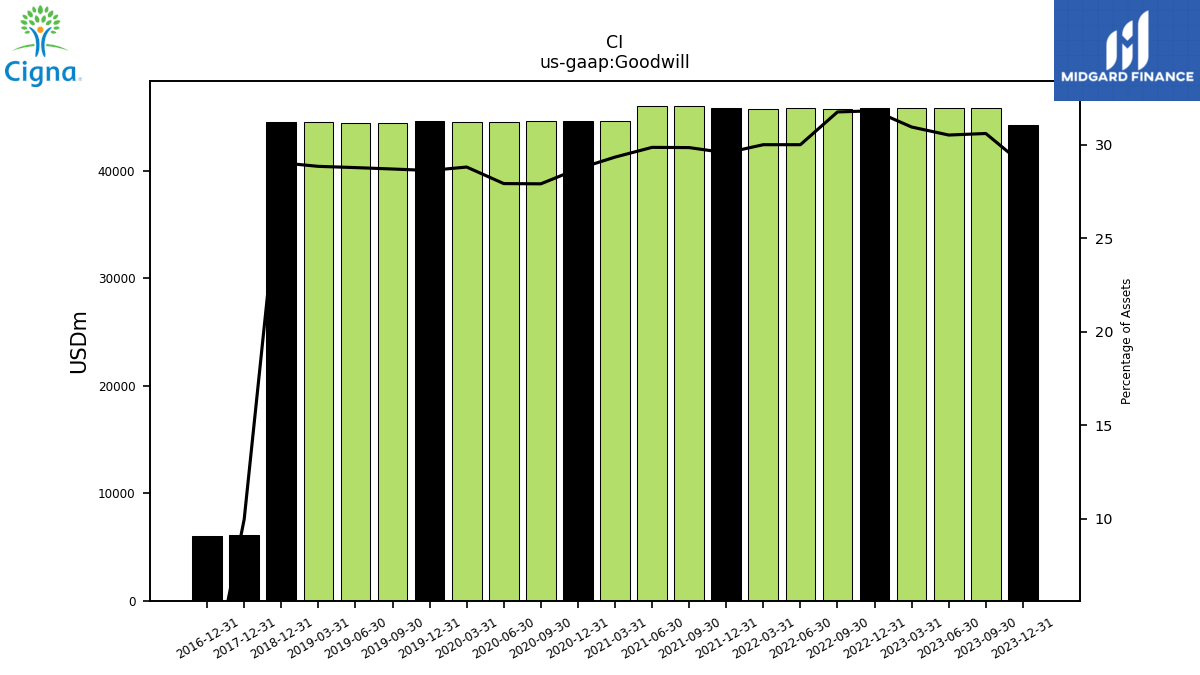
| Goodwill | 44259.00 | 45810.00 | 45811.00 | 45811.00 | 45811.00 | 45807.00 | 45810.00 | 45804.00 | 45811.00 | 46056.00 | 46063.00 | 44635.00 | 44648.00 | 44685.00 | 44590.00 | 44584.00 | 44602.00 | 44462.00 | 44449.00 | 44537.00 | 44505.00 | NA | NA | NA | 6164.00 | NA | NA | NA | |
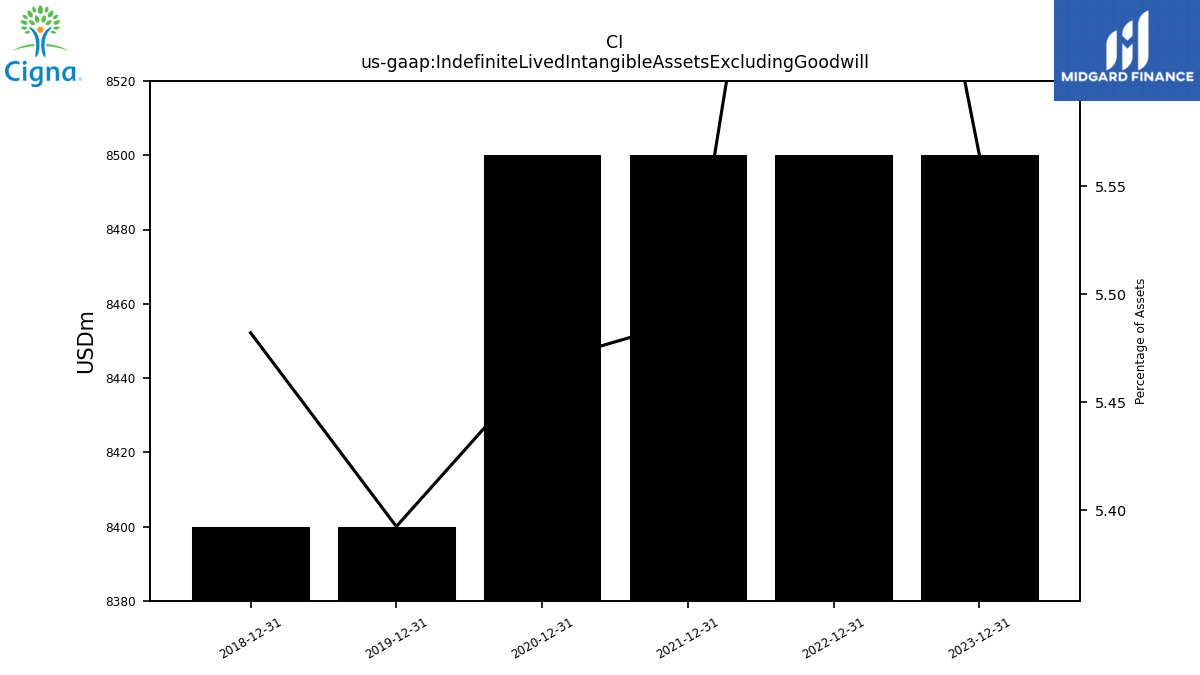
| Indefinite Lived Intangible Assets Excluding Goodwill | 8500.00 | NA | NA | NA | 8500.00 | NA | NA | NA | 8500.00 | NA | NA | NA | 8500.00 | NA | NA | NA | 8400.00 | NA | NA | NA | 8400.00 | NA | NA | NA | NA | NA | NA | NA | |
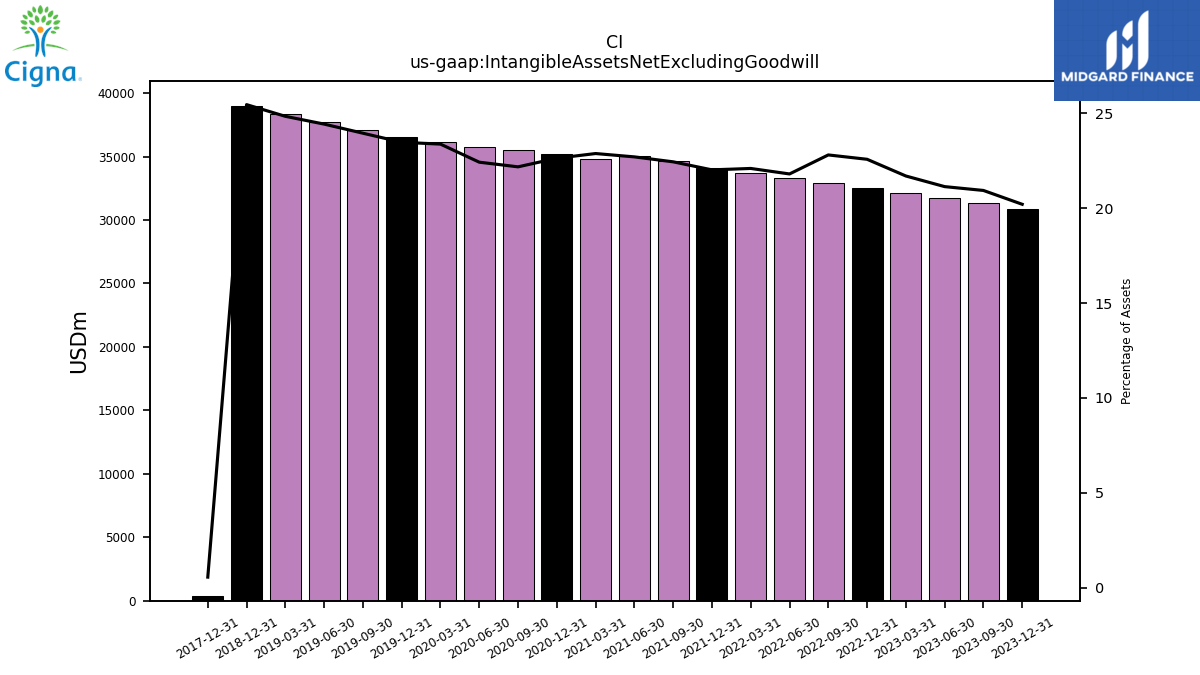
| Intangible Assets Net Excluding Goodwill | 30863.00 | 31324.00 | 31713.00 | 32102.00 | 32492.00 | 32885.00 | 33276.00 | 33714.00 | 34102.00 | 34615.00 | 35007.00 | 34792.00 | 35179.00 | 35492.00 | 35791.00 | 36162.00 | 36562.00 | 37084.00 | 37717.00 | 38338.00 | 39003.00 | NA | NA | NA | 345.00 | NA | NA | NA | |
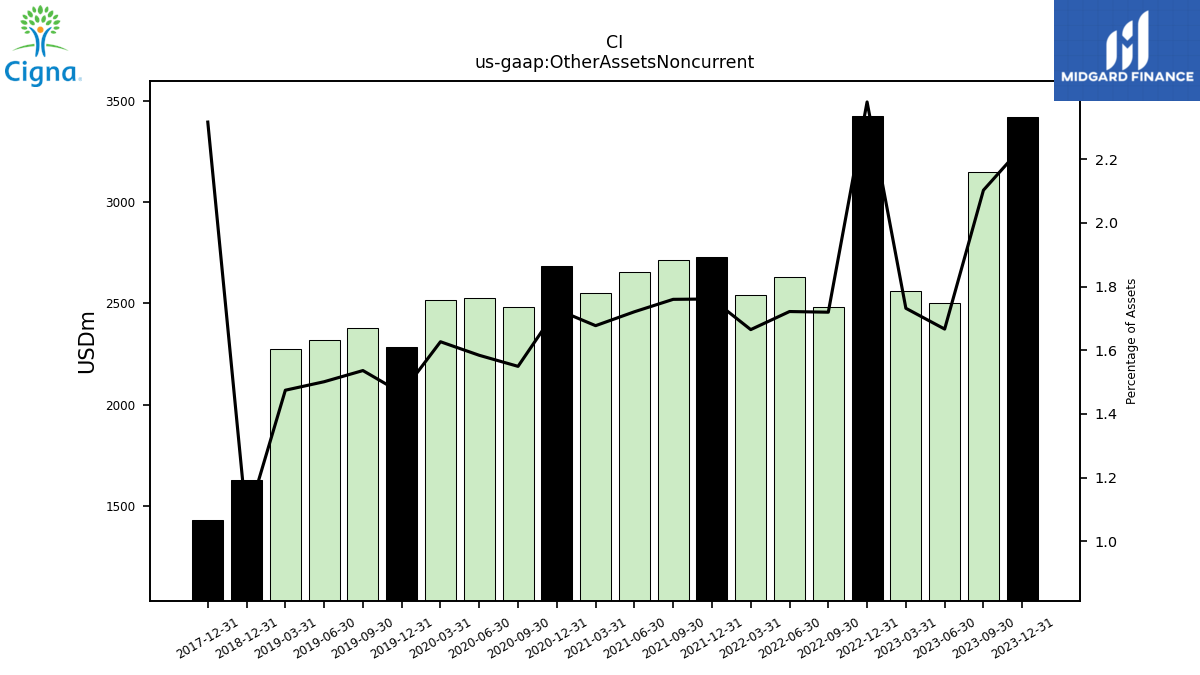
| Other Assets Noncurrent | 3421.00 | 3147.00 | 2501.00 | 2563.00 | 3426.00 | 2480.00 | 2628.00 | 2541.00 | 2728.00 | 2715.00 | 2654.00 | 2551.00 | 2687.00 | 2480.00 | 2529.00 | 2517.00 | 2283.00 | 2379.00 | 2318.00 | 2276.00 | 1630.00 | NA | NA | NA | 1431.00 | NA | NA | NA |
| 2023-12-31 | 2023-09-30 | 2023-06-30 | 2023-03-31 | 2022-12-31 | 2022-09-30 | 2022-06-30 | 2022-03-31 | 2021-12-31 | 2021-09-30 | 2021-06-30 | 2021-03-31 | 2020-12-31 | 2020-09-30 | 2020-06-30 | 2020-03-31 | 2019-12-31 | 2019-09-30 | 2019-06-30 | 2019-03-31 | 2018-12-31 | 2018-09-30 | 2018-06-30 | 2018-03-31 | 2017-12-31 | 2017-09-30 | 2017-06-30 | 2017-03-31 | ||
|---|---|---|---|---|---|---|---|---|---|---|---|---|---|---|---|---|---|---|---|---|---|---|---|---|---|---|---|---|---|
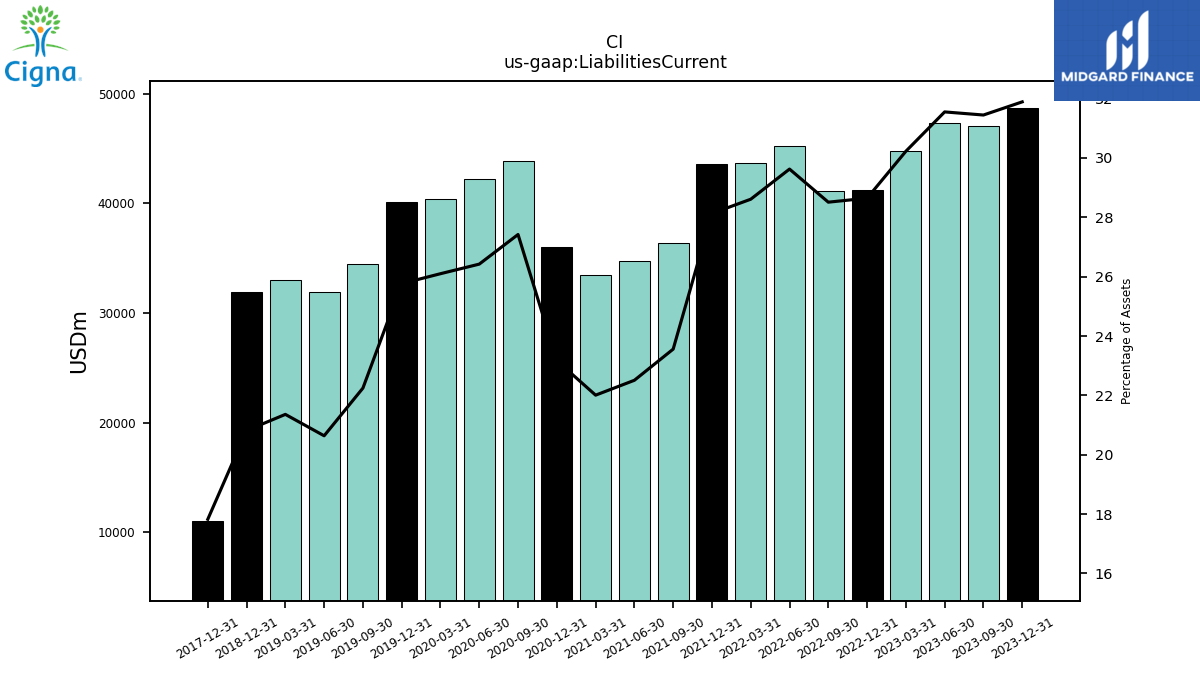
| Liabilities Current | 48716.00 | 47059.00 | 47345.00 | 44727.00 | 41229.00 | 41115.00 | 45218.00 | 43662.00 | 43572.00 | 36340.00 | 34711.00 | 33470.00 | 36022.00 | 43886.00 | 42179.00 | 40380.00 | 40138.00 | 34447.00 | 31867.00 | 32969.00 | 31895.00 | NA | NA | NA | 11009.00 | NA | NA | NA | |
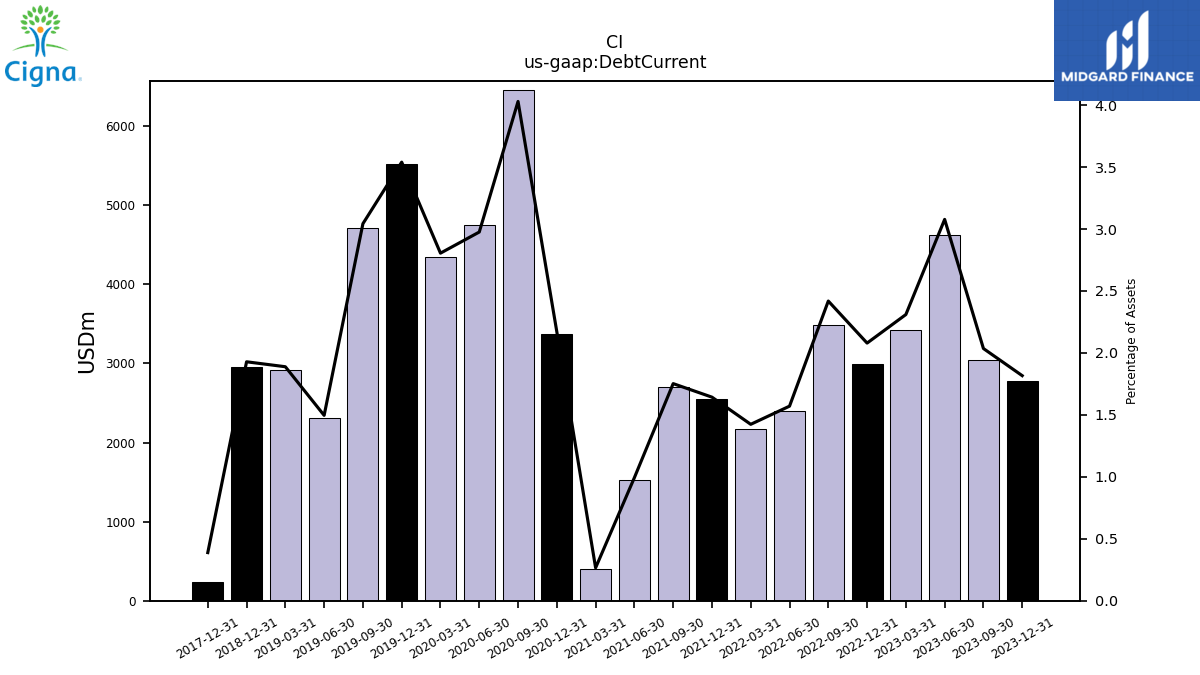
| Debt Current | 2775.00 | 3046.00 | 4618.00 | 3418.00 | 2993.00 | 3488.00 | 2397.00 | 2173.00 | 2545.00 | 2703.00 | 1532.00 | 404.00 | 3374.00 | 6449.00 | 4750.00 | 4340.00 | 5514.00 | 4712.00 | 2310.00 | 2915.00 | 2955.00 | NA | NA | NA | 240.00 | NA | NA | NA | |
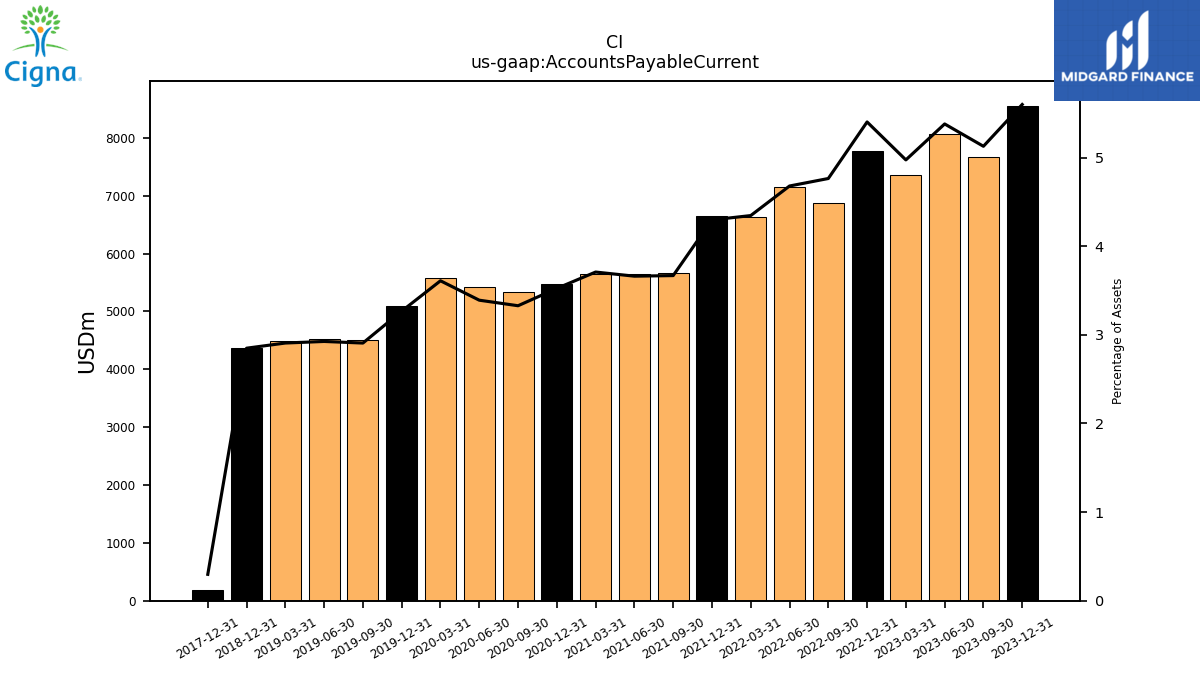
| Accounts Payable Current | 8553.00 | 7673.00 | 8072.00 | 7360.00 | 7775.00 | 6870.00 | 7142.00 | 6632.00 | 6655.00 | 5659.00 | 5647.00 | 5640.00 | 5478.00 | 5327.00 | 5413.00 | 5585.00 | 5090.00 | 4502.00 | 4517.00 | 4488.00 | 4366.00 | NA | NA | NA | 184.00 | NA | NA | NA |
| 2023-12-31 | 2023-09-30 | 2023-06-30 | 2023-03-31 | 2022-12-31 | 2022-09-30 | 2022-06-30 | 2022-03-31 | 2021-12-31 | 2021-09-30 | 2021-06-30 | 2021-03-31 | 2020-12-31 | 2020-09-30 | 2020-06-30 | 2020-03-31 | 2019-12-31 | 2019-09-30 | 2019-06-30 | 2019-03-31 | 2018-12-31 | 2018-09-30 | 2018-06-30 | 2018-03-31 | 2017-12-31 | 2017-09-30 | 2017-06-30 | 2017-03-31 | ||
|---|---|---|---|---|---|---|---|---|---|---|---|---|---|---|---|---|---|---|---|---|---|---|---|---|---|---|---|---|---|
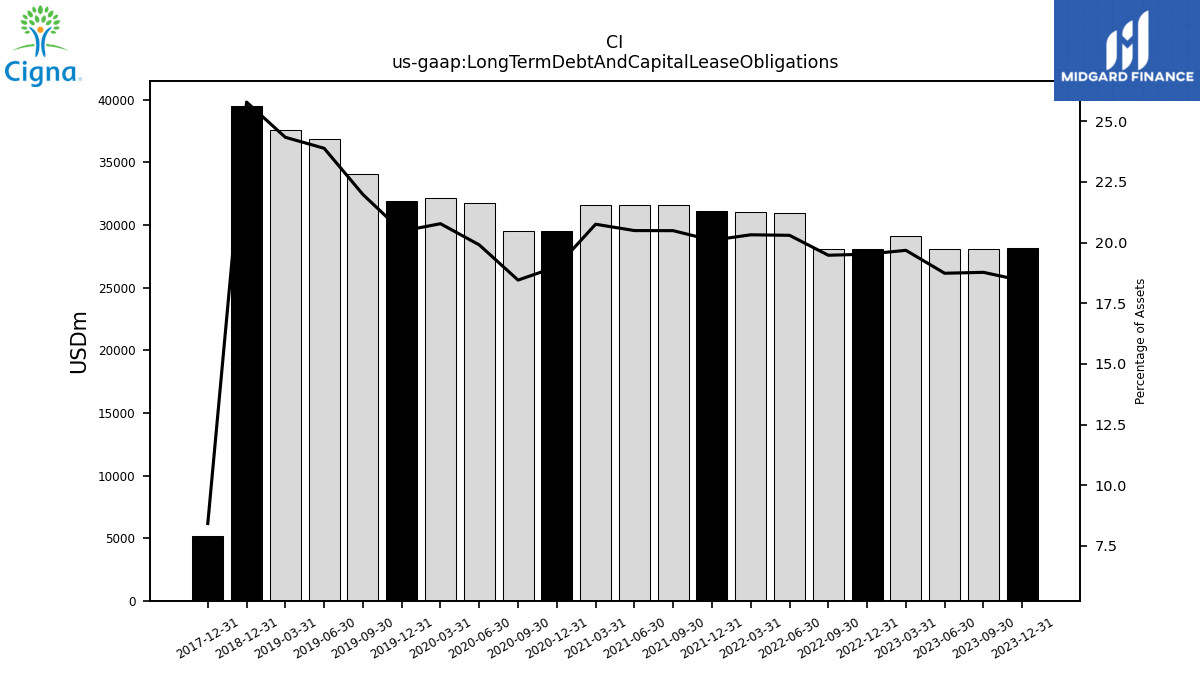
| Long Term Debt And Capital Lease Obligations | 28155.00 | 28094.00 | 28115.00 | 29124.00 | 28100.00 | 28090.00 | 30984.00 | 31013.00 | 31125.00 | 31609.00 | 31606.00 | 31568.00 | 29545.00 | 29537.00 | 31774.00 | 32147.00 | 31893.00 | 34041.00 | 36885.00 | 37571.00 | 39523.00 | NA | NA | NA | 5199.00 | NA | NA | NA | |
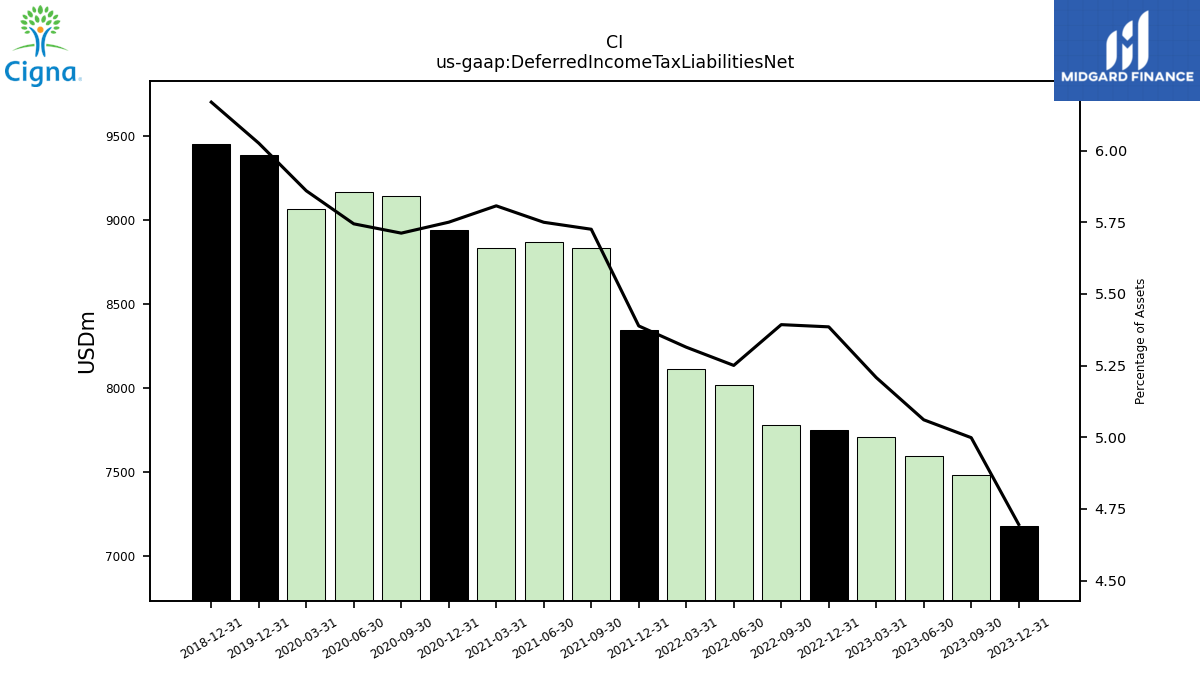
| Deferred Income Tax Liabilities Net | 7173.00 | 7480.00 | 7594.00 | 7707.00 | 7751.00 | 7777.00 | 8014.00 | 8110.00 | 8346.00 | 8832.00 | 8867.00 | 8832.00 | 8939.00 | 9142.00 | 9170.00 | 9066.00 | 9387.00 | NA | NA | NA | 9453.00 | NA | NA | NA | NA | NA | NA | NA | |
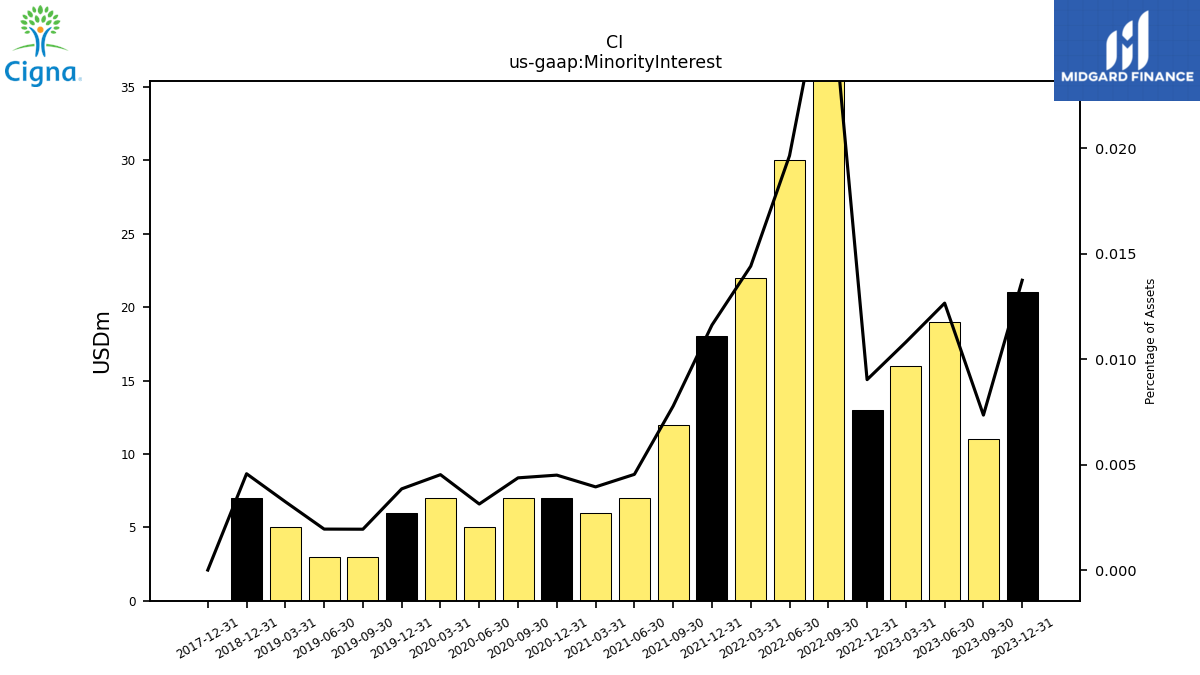
| Minority Interest | 21.00 | 11.00 | 19.00 | 16.00 | 13.00 | 42.00 | 30.00 | 22.00 | 18.00 | 12.00 | 7.00 | 6.00 | 7.00 | 7.00 | 5.00 | 7.00 | 6.00 | 3.00 | 3.00 | 5.00 | 7.00 | NA | NA | NA | 0.00 | NA | NA | NA | |
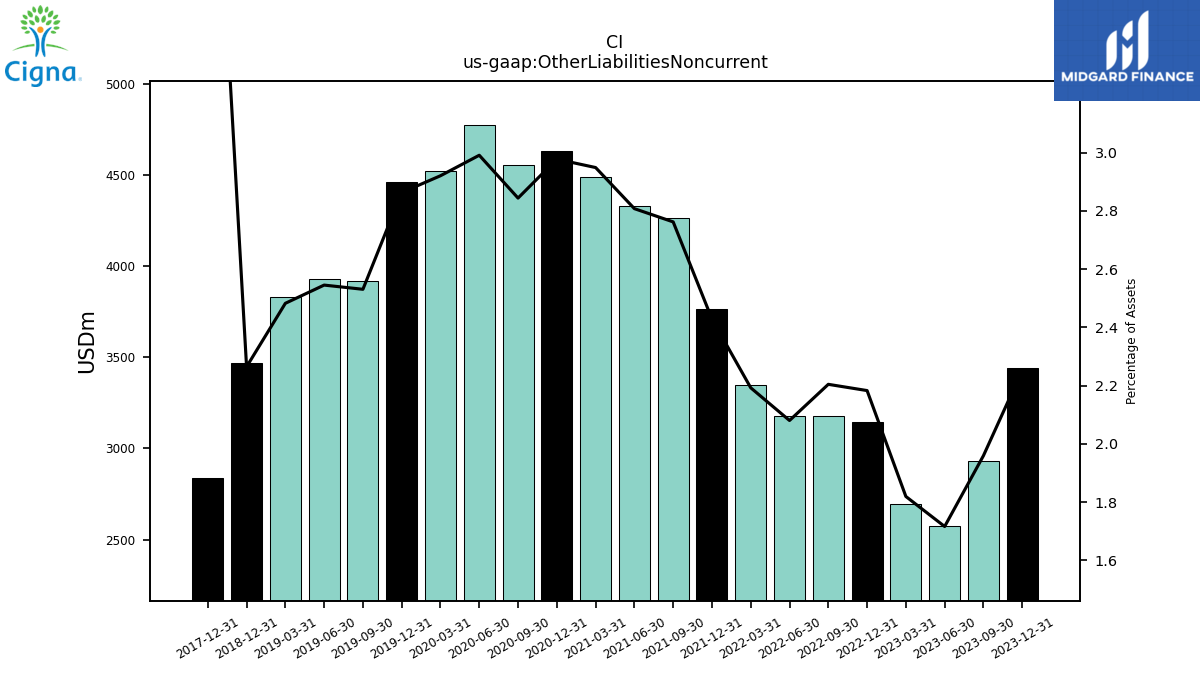
| Other Liabilities Noncurrent | 3441.00 | 2932.00 | 2575.00 | 2692.00 | 3142.00 | 3179.00 | 3175.00 | 3346.00 | 3762.00 | 4261.00 | 4330.00 | 4485.00 | 4629.00 | 4552.00 | 4775.00 | 4519.00 | 4460.00 | 3919.00 | 3930.00 | 3832.00 | 3470.00 | NA | NA | NA | 2838.00 | NA | NA | NA | |
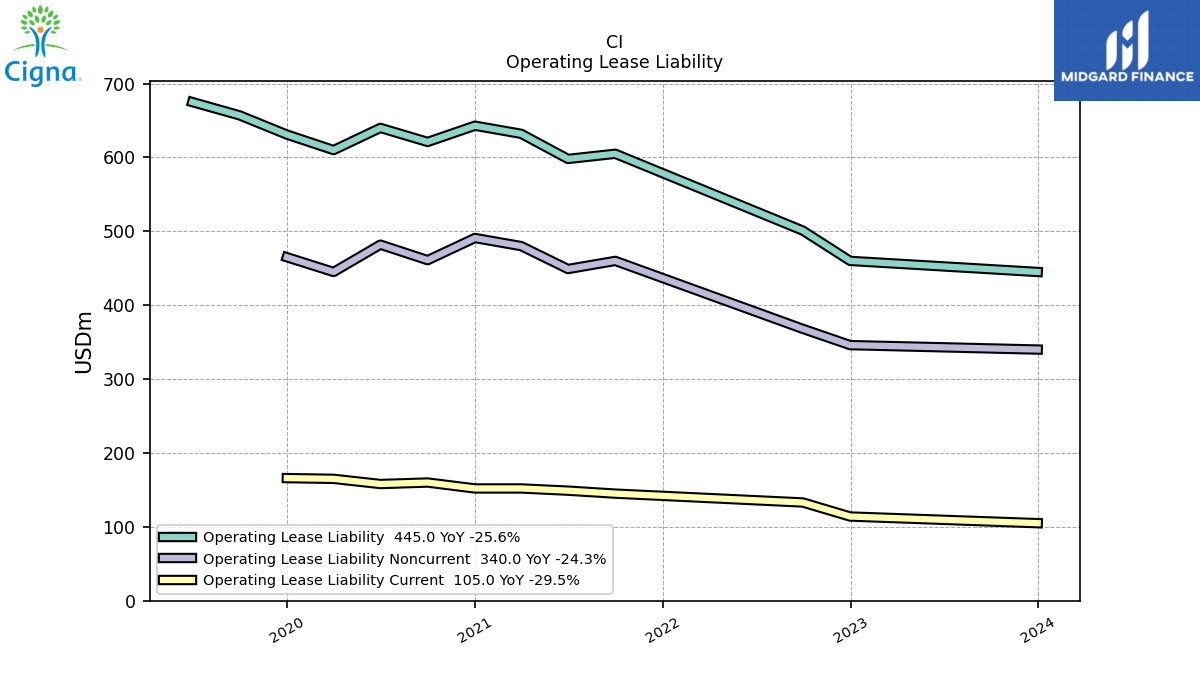
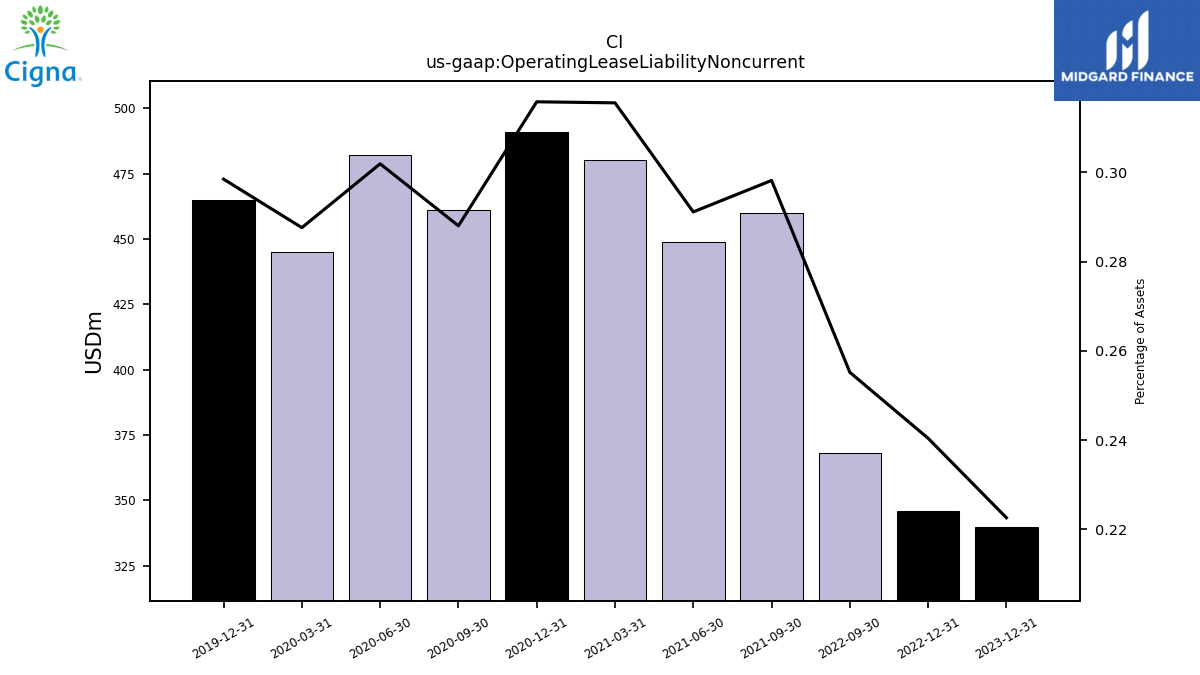
| Operating Lease Liability Noncurrent | 340.00 | NA | NA | NA | 346.00 | 368.00 | NA | NA | NA | 460.00 | 449.00 | 480.00 | 491.00 | 461.00 | 482.00 | 445.00 | 465.00 | NA | NA | NA | NA | NA | NA | NA | NA | NA | NA | NA |
| 2023-12-31 | 2023-09-30 | 2023-06-30 | 2023-03-31 | 2022-12-31 | 2022-09-30 | 2022-06-30 | 2022-03-31 | 2021-12-31 | 2021-09-30 | 2021-06-30 | 2021-03-31 | 2020-12-31 | 2020-09-30 | 2020-06-30 | 2020-03-31 | 2019-12-31 | 2019-09-30 | 2019-06-30 | 2019-03-31 | 2018-12-31 | 2018-09-30 | 2018-06-30 | 2018-03-31 | 2017-12-31 | 2017-09-30 | 2017-06-30 | 2017-03-31 | ||
|---|---|---|---|---|---|---|---|---|---|---|---|---|---|---|---|---|---|---|---|---|---|---|---|---|---|---|---|---|---|
| Stockholders Equity | 46223.00 | 45691.00 | 45445.00 | 44502.00 | 44872.00 | 45041.00 | 45892.00 | 46087.00 | 47112.00 | 47415.00 | 48709.00 | 48149.00 | 50321.00 | 48032.00 | 47366.00 | 45079.00 | 45338.00 | 44696.00 | 43815.00 | 42408.00 | 41028.00 | NA | NA | NA | 13711.00 | NA | NA | NA | |
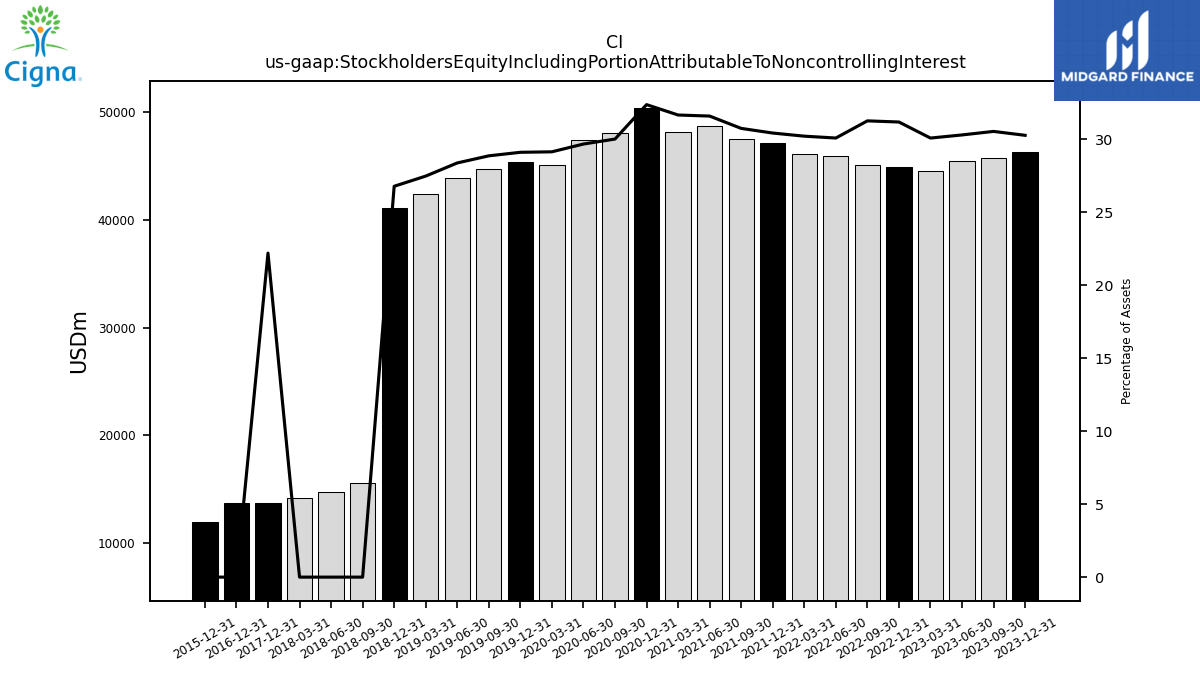
| Stockholders Equity Including Portion Attributable To Noncontrolling Interest | 46244.00 | 45702.00 | 45464.00 | 44518.00 | 44885.00 | 45083.00 | 45922.00 | 46109.00 | 47130.00 | 47427.00 | 48716.00 | 48155.00 | 50328.00 | 48039.00 | 47371.00 | 45086.00 | 45344.00 | 44699.00 | 43818.00 | 42413.00 | 41035.00 | 15555.00 | 14743.00 | 14195.00 | 13711.00 | NA | NA | NA | |
| Common Stock Value | 4.00 | 4.00 | 4.00 | 4.00 | 4.00 | 4.00 | 4.00 | 4.00 | 4.00 | 4.00 | 4.00 | 4.00 | 4.00 | 4.00 | 4.00 | 4.00 | 4.00 | 4.00 | 4.00 | 4.00 | 4.00 | NA | NA | NA | 74.00 | NA | NA | NA | |
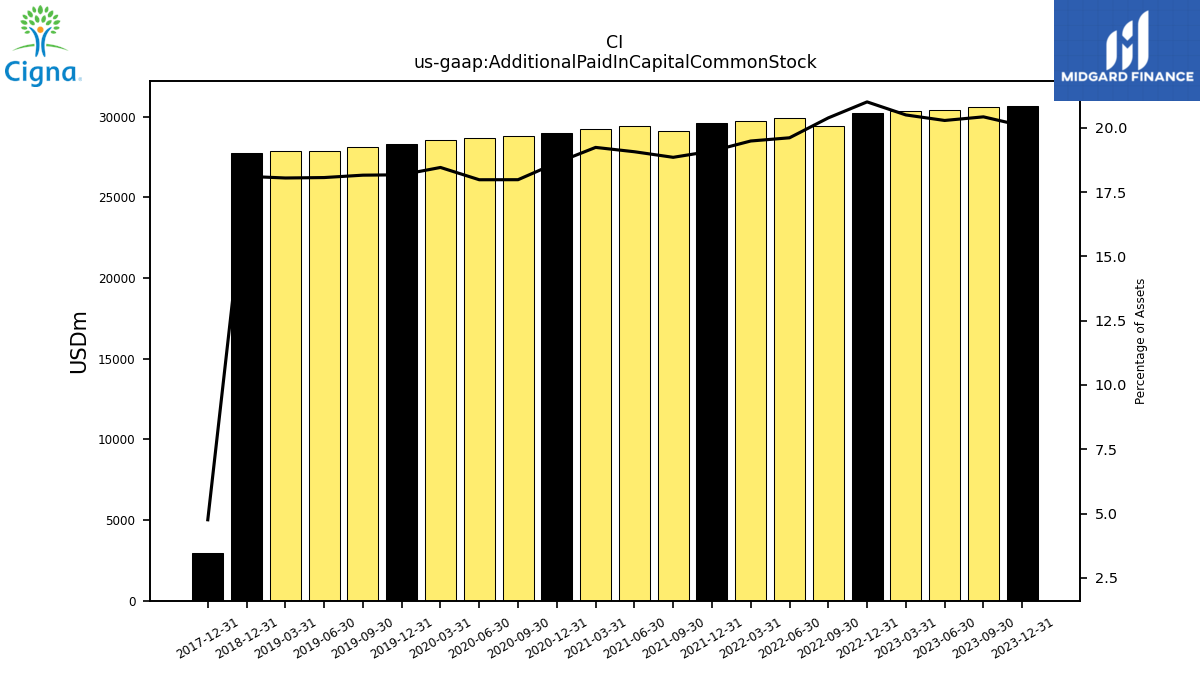
| Additional Paid In Capital Common Stock | 30669.00 | 30563.00 | 30436.00 | 30332.00 | 30233.00 | 29395.00 | 29930.00 | 29736.00 | 29574.00 | 29077.00 | 29403.00 | 29254.00 | 28975.00 | 28777.00 | 28699.00 | 28554.00 | 28306.00 | 28115.00 | 27891.00 | 27855.00 | 27751.00 | NA | NA | NA | 2940.00 | NA | NA | NA | |
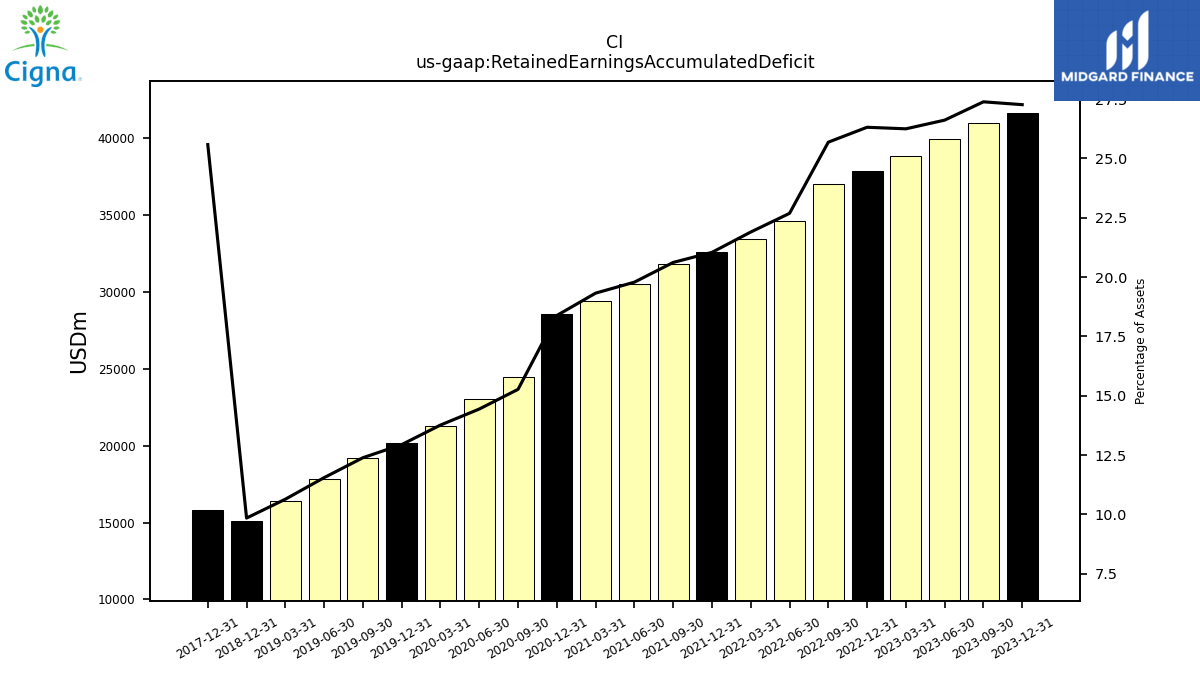
| Retained Earnings Accumulated Deficit | 41652.00 | 40982.00 | 39936.00 | 38841.00 | 37874.00 | 37041.00 | 34626.00 | 33420.00 | 32593.00 | 31803.00 | 30513.00 | 29389.00 | 28575.00 | 24440.00 | 23052.00 | 21298.00 | 20162.00 | 19185.00 | 17834.00 | 16426.00 | 15088.00 | NA | NA | NA | 15800.00 | NA | NA | NA | |
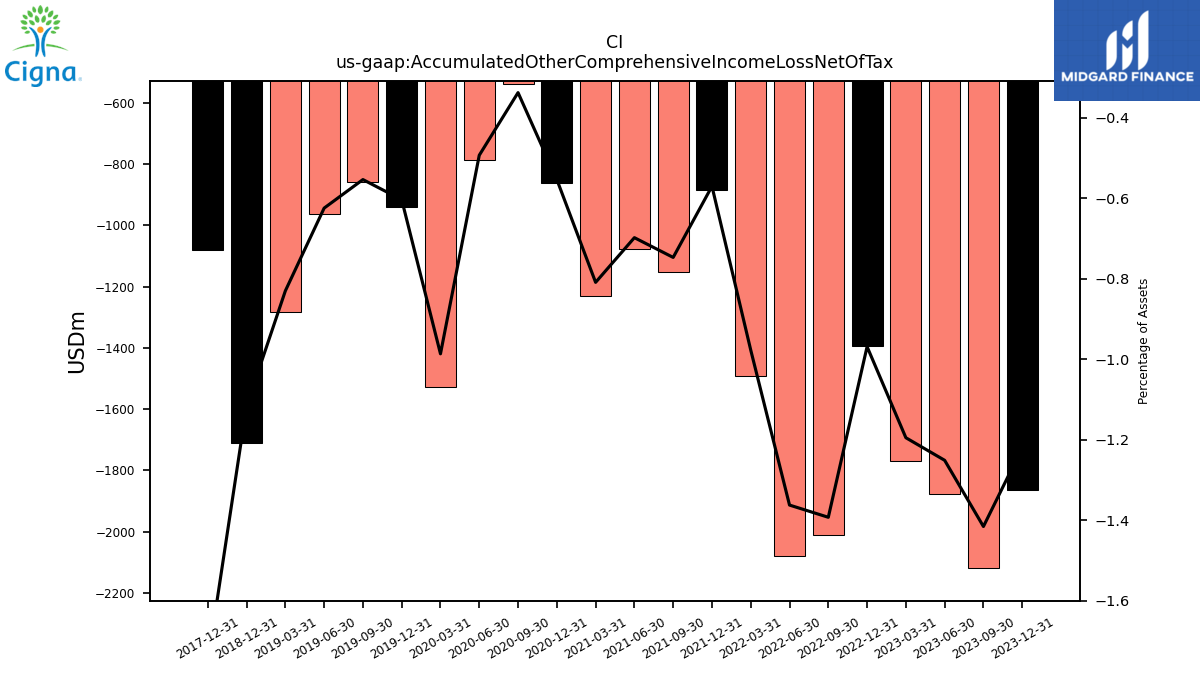
| Accumulated Other Comprehensive Income Loss Net Of Tax | -1864.00 | -2119.00 | -1878.00 | -1769.00 | -1395.00 | -2009.00 | -2080.00 | -1492.00 | -884.00 | -1153.00 | -1077.00 | -1231.00 | -861.00 | -541.00 | -788.00 | -1527.00 | -941.00 | -858.00 | -965.00 | -1282.00 | -1711.00 | NA | NA | NA | -1082.00 | NA | NA | NA | |
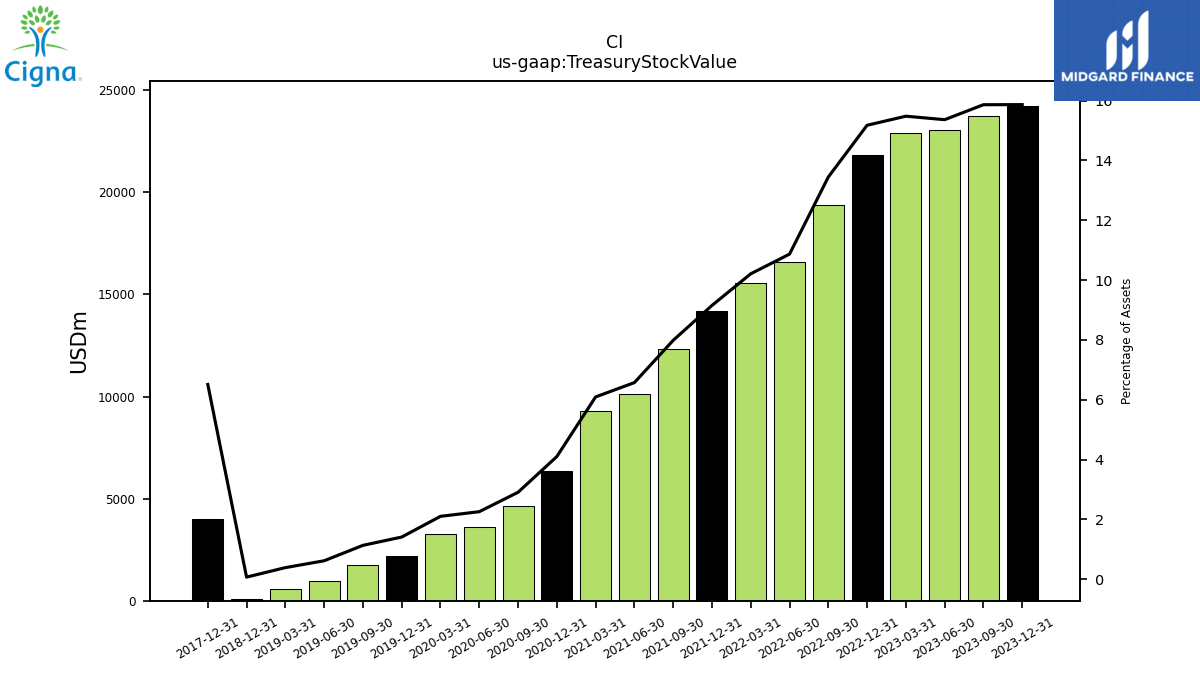
| Treasury Stock Value | 24238.00 | 23739.00 | 23053.00 | 22906.00 | 21844.00 | 19390.00 | 16588.00 | 15581.00 | 14175.00 | 12316.00 | 10134.00 | 9267.00 | 6372.00 | 4648.00 | 3601.00 | 3250.00 | 2193.00 | 1750.00 | 949.00 | 595.00 | 104.00 | NA | NA | NA | 4021.00 | NA | NA | NA | |
| Minority Interest | 21.00 | 11.00 | 19.00 | 16.00 | 13.00 | 42.00 | 30.00 | 22.00 | 18.00 | 12.00 | 7.00 | 6.00 | 7.00 | 7.00 | 5.00 | 7.00 | 6.00 | 3.00 | 3.00 | 5.00 | 7.00 | NA | NA | NA | 0.00 | NA | NA | NA |
| 2023-12-31 | 2023-09-30 | 2023-06-30 | 2023-03-31 | 2022-12-31 | 2022-09-30 | 2022-06-30 | 2022-03-31 | 2021-12-31 | 2021-09-30 | 2021-06-30 | 2021-03-31 | 2020-12-31 | 2020-09-30 | 2020-06-30 | 2020-03-31 | 2019-12-31 | 2019-09-30 | 2019-06-30 | 2019-03-31 | 2018-12-31 | 2018-09-30 | 2018-06-30 | 2018-03-31 | 2017-12-31 | 2017-09-30 | 2017-06-30 | 2017-03-31 | ||
|---|---|---|---|---|---|---|---|---|---|---|---|---|---|---|---|---|---|---|---|---|---|---|---|---|---|---|---|---|---|
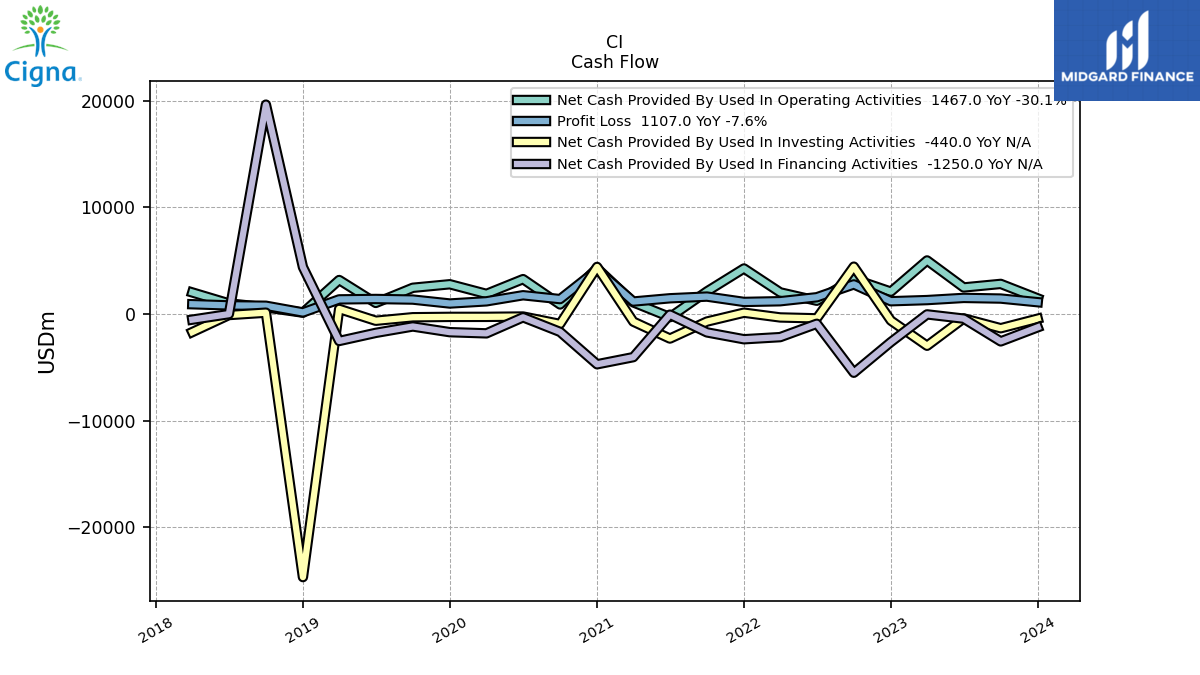
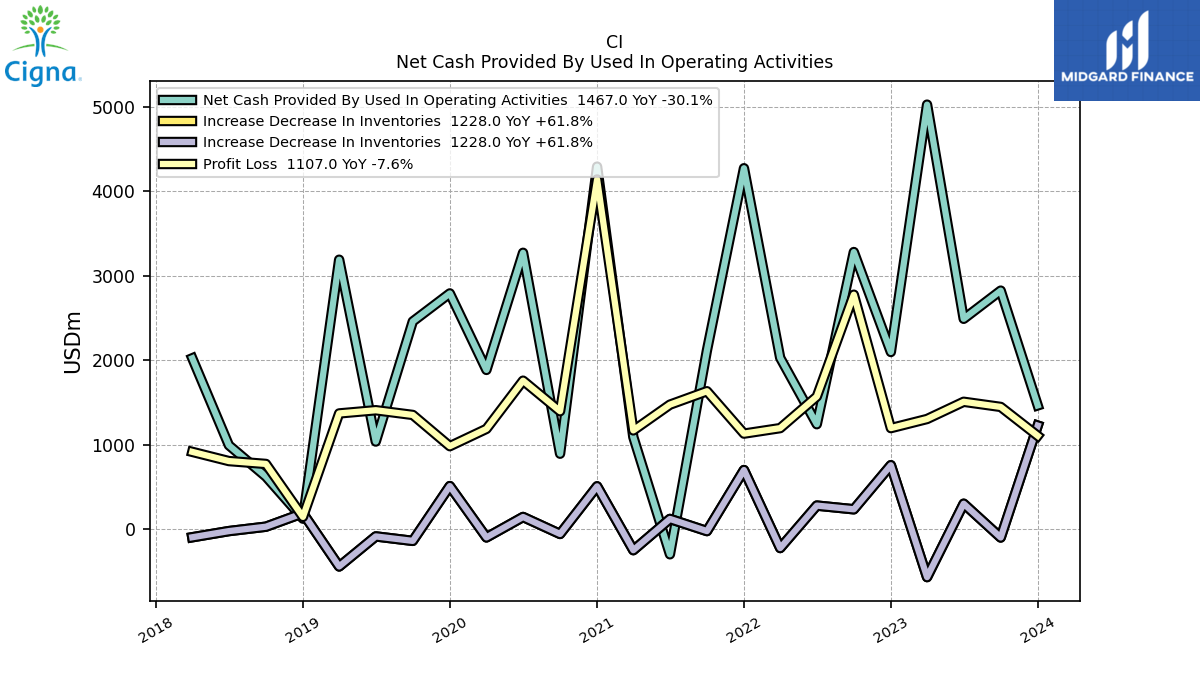
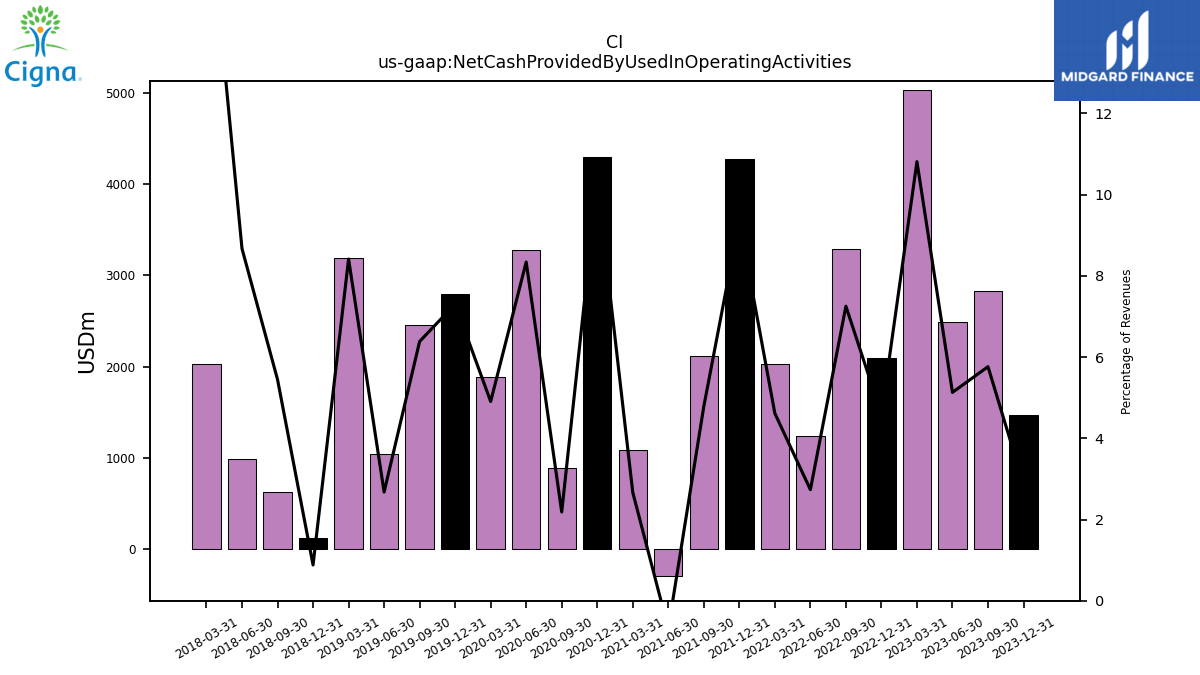
| Net Cash Provided By Used In Operating Activities | 1467.00 | 2826.00 | 2492.00 | 5028.00 | 2099.00 | 3283.00 | 1244.00 | 2030.00 | 4275.00 | 2119.00 | -296.00 | 1093.00 | 4294.00 | 895.00 | 3274.00 | 1887.00 | 2793.00 | 2461.00 | 1039.00 | 3192.00 | 126.00 | 624.00 | 995.00 | 2025.00 | NA | NA | NA | NA | |
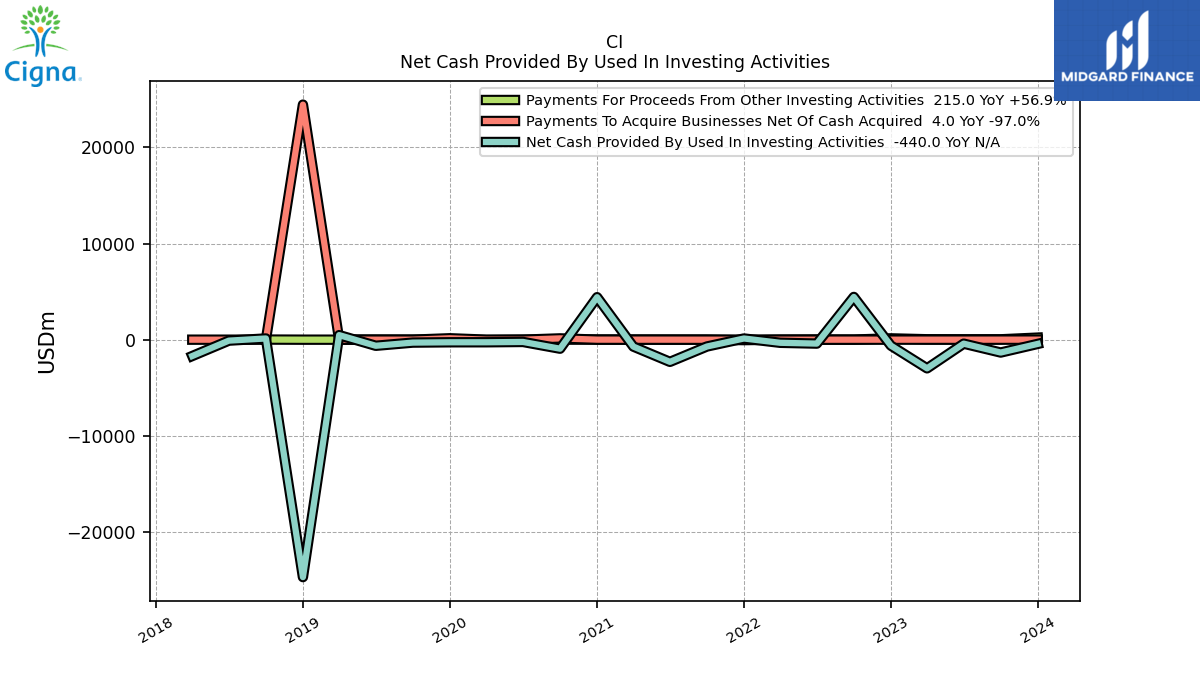
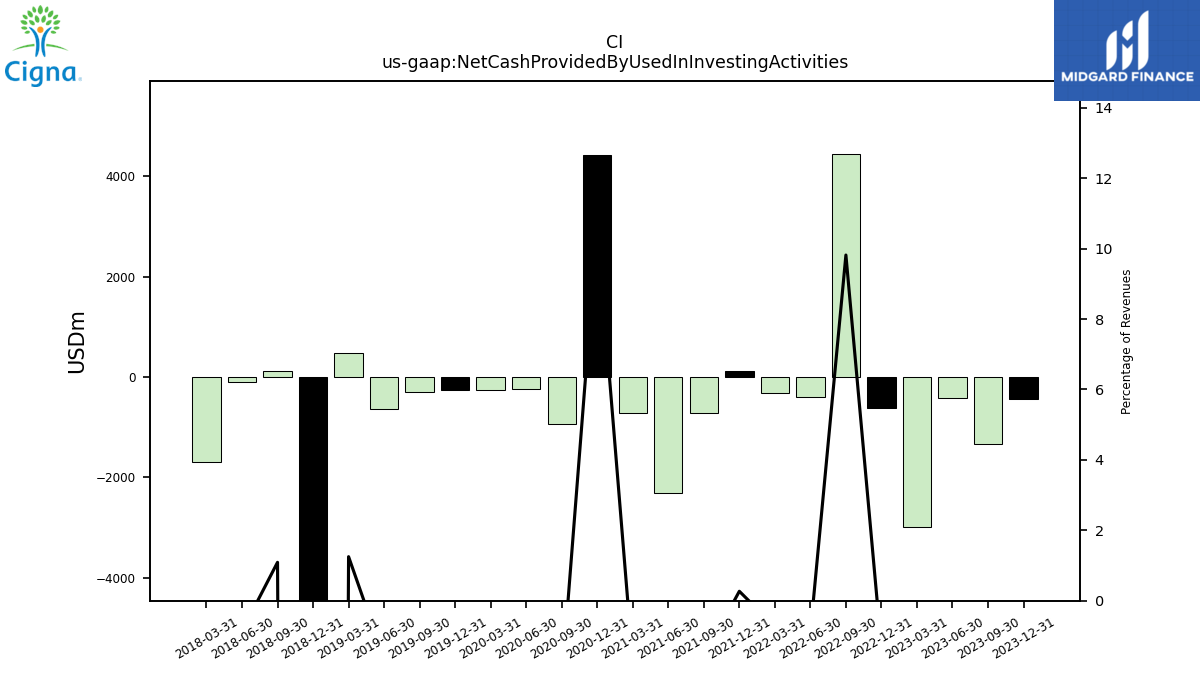
| Net Cash Provided By Used In Investing Activities | -440.00 | -1337.00 | -414.00 | -2983.00 | -616.00 | 4446.00 | -408.00 | -324.00 | 123.00 | -710.00 | -2307.00 | -717.00 | 4420.00 | -938.00 | -237.00 | -269.00 | -271.00 | -304.00 | -634.00 | 475.00 | -24704.00 | 125.00 | -99.00 | -1700.00 | NA | NA | NA | NA | |
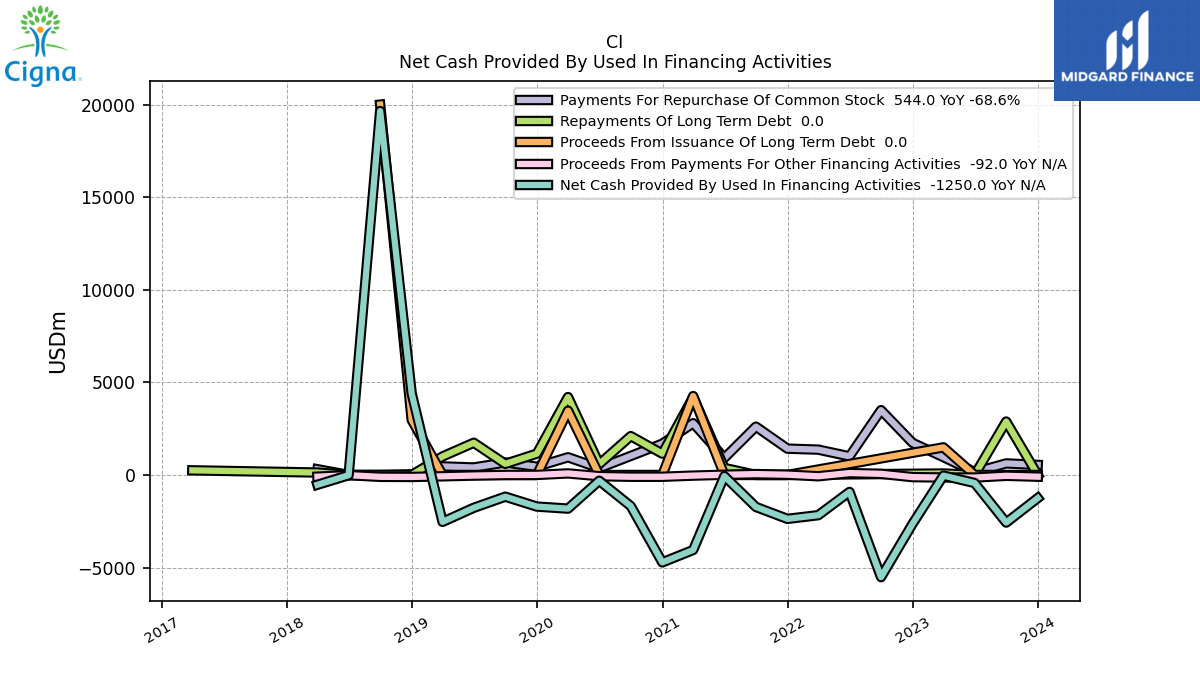
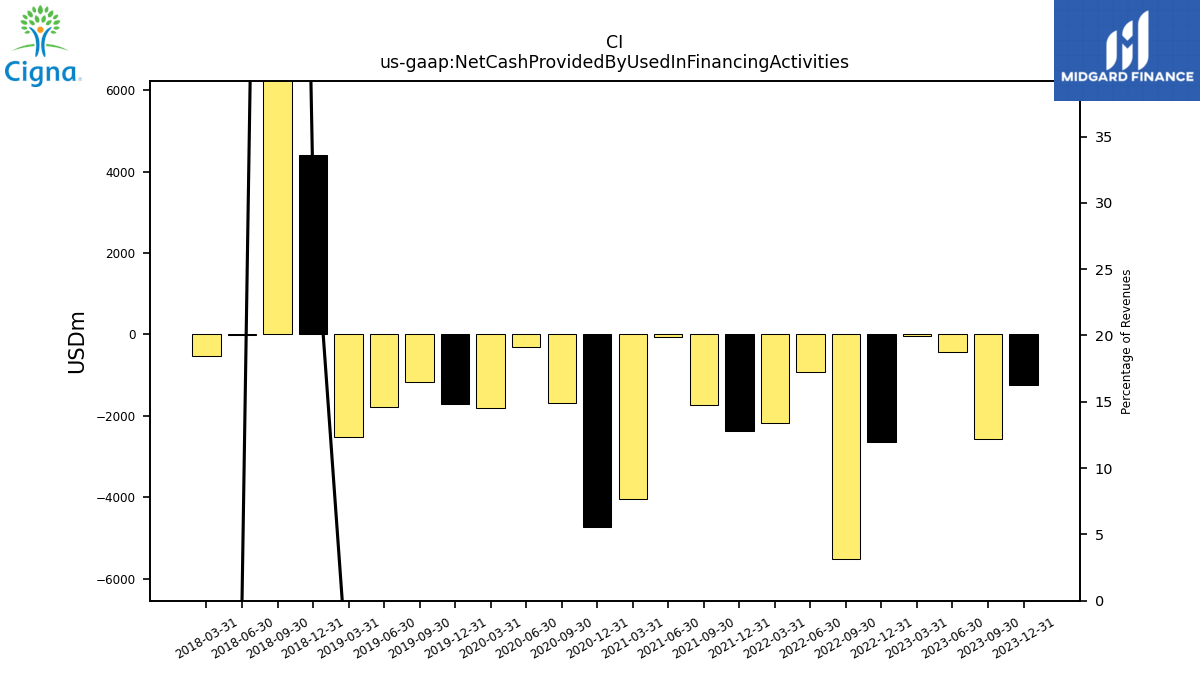
| Net Cash Provided By Used In Financing Activities | -1250.00 | -2572.00 | -435.00 | -37.00 | -2636.00 | -5517.00 | -916.00 | -2171.00 | -2371.00 | -1728.00 | -62.00 | -4051.00 | -4721.00 | -1682.00 | -312.00 | -1818.00 | -1707.00 | -1173.00 | -1773.00 | -2534.00 | 4400.00 | 19657.00 | -12.00 | -530.00 | NA | NA | NA | NA |
| 2023-12-31 | 2023-09-30 | 2023-06-30 | 2023-03-31 | 2022-12-31 | 2022-09-30 | 2022-06-30 | 2022-03-31 | 2021-12-31 | 2021-09-30 | 2021-06-30 | 2021-03-31 | 2020-12-31 | 2020-09-30 | 2020-06-30 | 2020-03-31 | 2019-12-31 | 2019-09-30 | 2019-06-30 | 2019-03-31 | 2018-12-31 | 2018-09-30 | 2018-06-30 | 2018-03-31 | 2017-12-31 | 2017-09-30 | 2017-06-30 | 2017-03-31 | ||
|---|---|---|---|---|---|---|---|---|---|---|---|---|---|---|---|---|---|---|---|---|---|---|---|---|---|---|---|---|---|
| Net Cash Provided By Used In Operating Activities | 1467.00 | 2826.00 | 2492.00 | 5028.00 | 2099.00 | 3283.00 | 1244.00 | 2030.00 | 4275.00 | 2119.00 | -296.00 | 1093.00 | 4294.00 | 895.00 | 3274.00 | 1887.00 | 2793.00 | 2461.00 | 1039.00 | 3192.00 | 126.00 | 624.00 | 995.00 | 2025.00 | NA | NA | NA | NA | |
| Profit Loss | 1107.00 | 1449.00 | 1510.00 | 1306.00 | 1198.00 | 2778.00 | 1572.00 | 1198.00 | 1133.00 | 1635.00 | 1476.00 | 1171.00 | 4142.00 | 1398.00 | 1760.00 | 1189.00 | 984.00 | 1354.00 | 1410.00 | 1372.00 | 147.00 | 774.00 | 808.00 | 917.00 | NA | NA | NA | NA | |
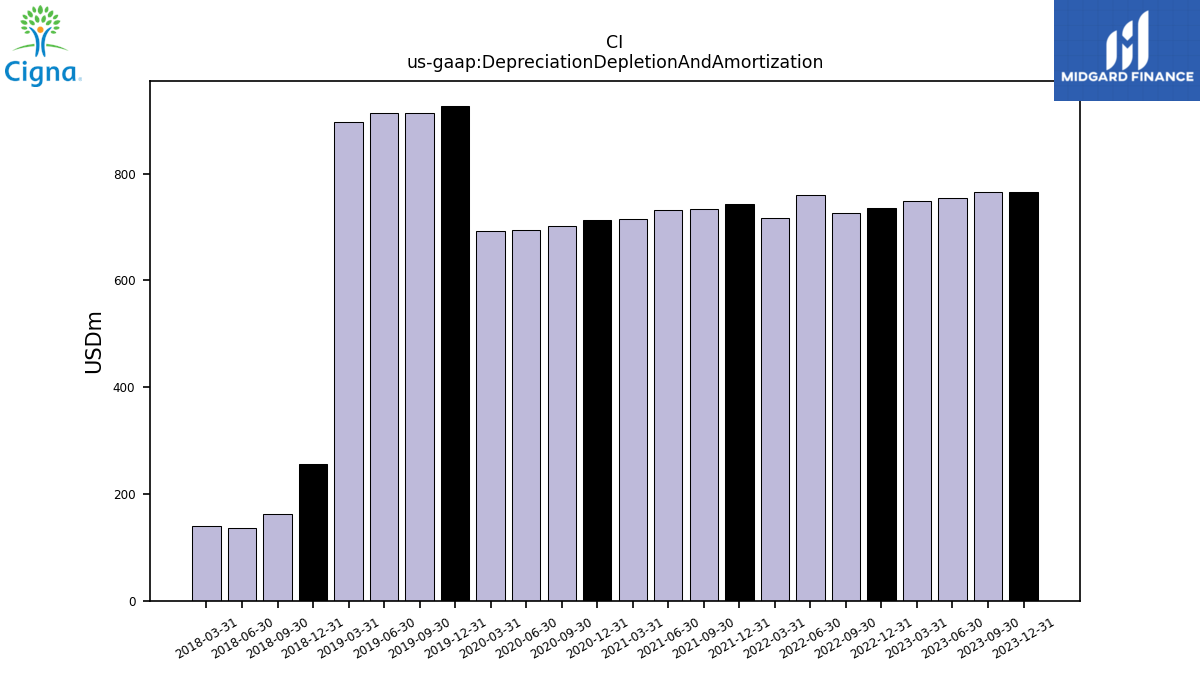
| Depreciation Depletion And Amortization | 765.00 | 766.00 | 755.00 | 749.00 | 735.00 | 726.00 | 759.00 | 717.00 | 743.00 | 734.00 | 731.00 | 715.00 | 713.00 | 702.00 | 694.00 | 693.00 | 927.00 | 913.00 | 914.00 | 897.00 | 257.00 | 162.00 | 136.00 | 140.00 | NA | NA | NA | NA | |
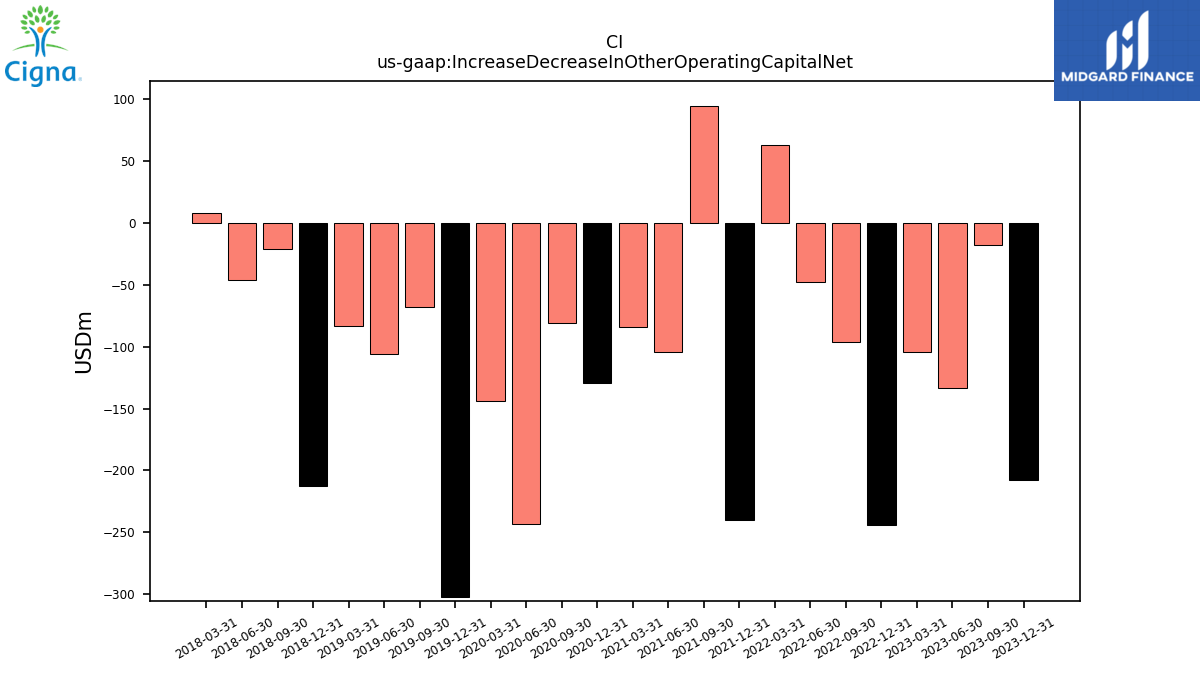
| Increase Decrease In Other Operating Capital Net | -208.00 | -18.00 | -133.00 | -104.00 | -244.00 | -96.00 | -48.00 | 63.00 | -240.00 | 95.00 | -104.00 | -84.00 | -129.00 | -81.00 | -243.00 | -144.00 | -302.00 | -68.00 | -106.00 | -83.00 | -213.00 | -21.00 | -46.00 | 8.00 | NA | NA | NA | NA | |
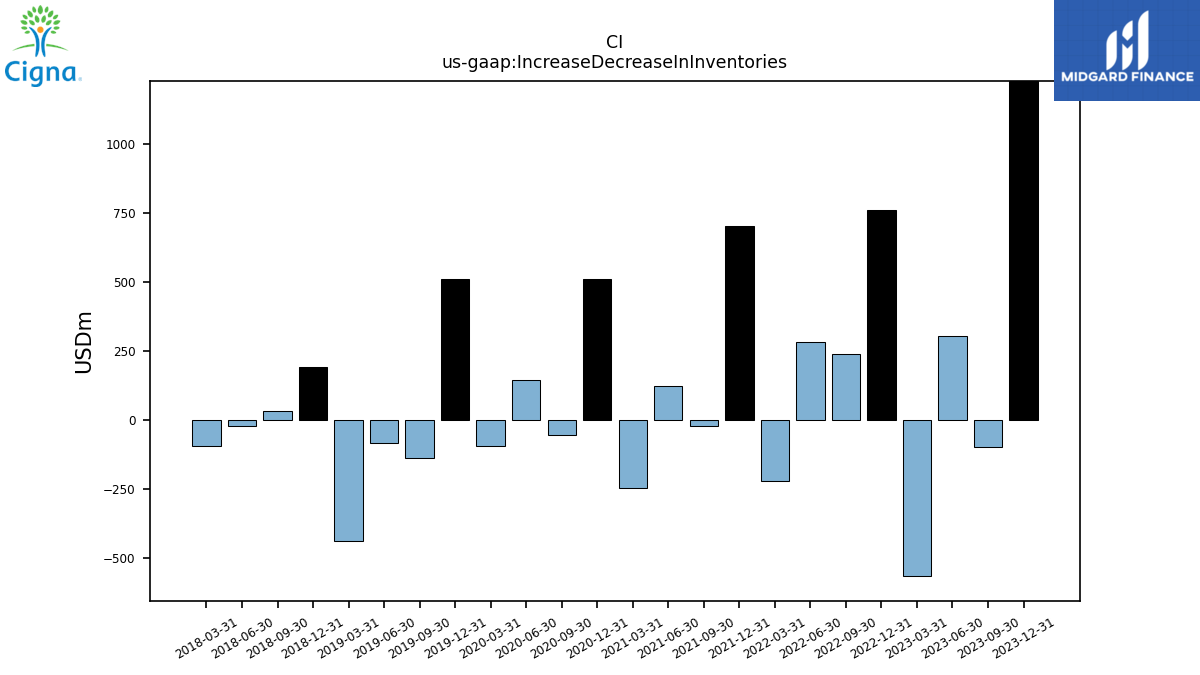
| Increase Decrease In Inventories | 1228.00 | -97.00 | 303.00 | -566.00 | 759.00 | 237.00 | 281.00 | -222.00 | 702.00 | -21.00 | 123.00 | -247.00 | 509.00 | -55.00 | 146.00 | -96.00 | 512.00 | -137.00 | -84.00 | -440.00 | 191.00 | 31.00 | -21.00 | -94.00 | NA | NA | NA | NA |
| 2023-12-31 | 2023-09-30 | 2023-06-30 | 2023-03-31 | 2022-12-31 | 2022-09-30 | 2022-06-30 | 2022-03-31 | 2021-12-31 | 2021-09-30 | 2021-06-30 | 2021-03-31 | 2020-12-31 | 2020-09-30 | 2020-06-30 | 2020-03-31 | 2019-12-31 | 2019-09-30 | 2019-06-30 | 2019-03-31 | 2018-12-31 | 2018-09-30 | 2018-06-30 | 2018-03-31 | 2017-12-31 | 2017-09-30 | 2017-06-30 | 2017-03-31 | ||
|---|---|---|---|---|---|---|---|---|---|---|---|---|---|---|---|---|---|---|---|---|---|---|---|---|---|---|---|---|---|
| Net Cash Provided By Used In Investing Activities | -440.00 | -1337.00 | -414.00 | -2983.00 | -616.00 | 4446.00 | -408.00 | -324.00 | 123.00 | -710.00 | -2307.00 | -717.00 | 4420.00 | -938.00 | -237.00 | -269.00 | -271.00 | -304.00 | -634.00 | 475.00 | -24704.00 | 125.00 | -99.00 | -1700.00 | NA | NA | NA | NA |
| 2023-12-31 | 2023-09-30 | 2023-06-30 | 2023-03-31 | 2022-12-31 | 2022-09-30 | 2022-06-30 | 2022-03-31 | 2021-12-31 | 2021-09-30 | 2021-06-30 | 2021-03-31 | 2020-12-31 | 2020-09-30 | 2020-06-30 | 2020-03-31 | 2019-12-31 | 2019-09-30 | 2019-06-30 | 2019-03-31 | 2018-12-31 | 2018-09-30 | 2018-06-30 | 2018-03-31 | 2017-12-31 | 2017-09-30 | 2017-06-30 | 2017-03-31 | ||
|---|---|---|---|---|---|---|---|---|---|---|---|---|---|---|---|---|---|---|---|---|---|---|---|---|---|---|---|---|---|
| Net Cash Provided By Used In Financing Activities | -1250.00 | -2572.00 | -435.00 | -37.00 | -2636.00 | -5517.00 | -916.00 | -2171.00 | -2371.00 | -1728.00 | -62.00 | -4051.00 | -4721.00 | -1682.00 | -312.00 | -1818.00 | -1707.00 | -1173.00 | -1773.00 | -2534.00 | 4400.00 | 19657.00 | -12.00 | -530.00 | NA | NA | NA | NA | |
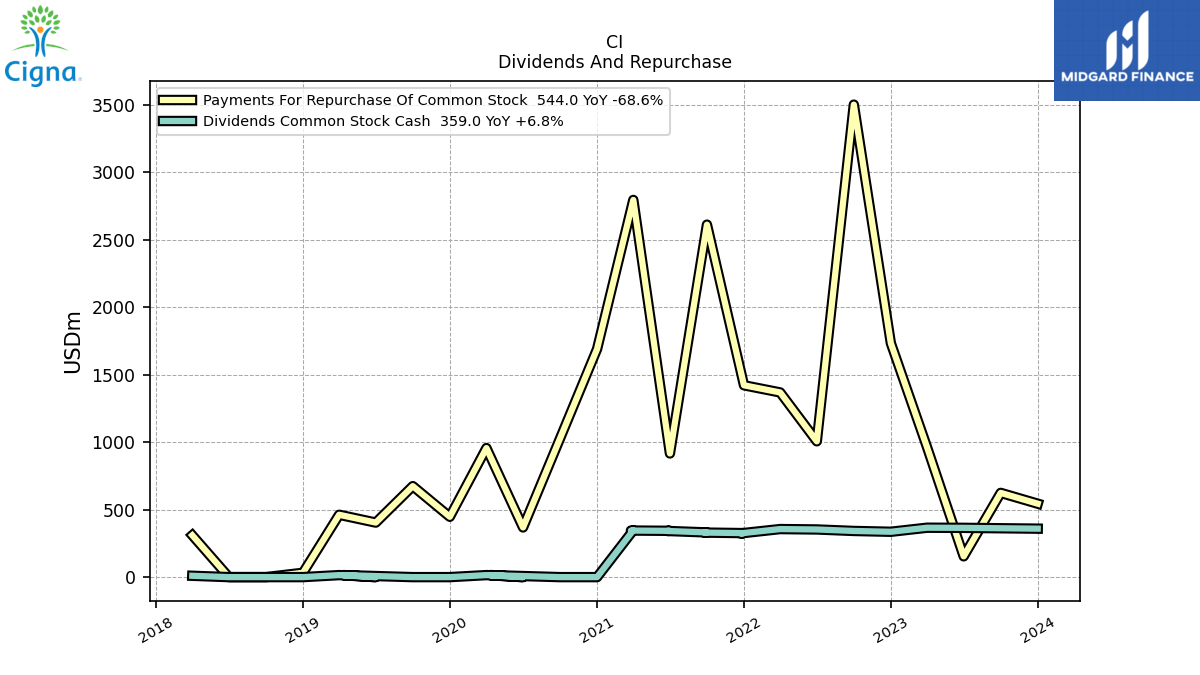
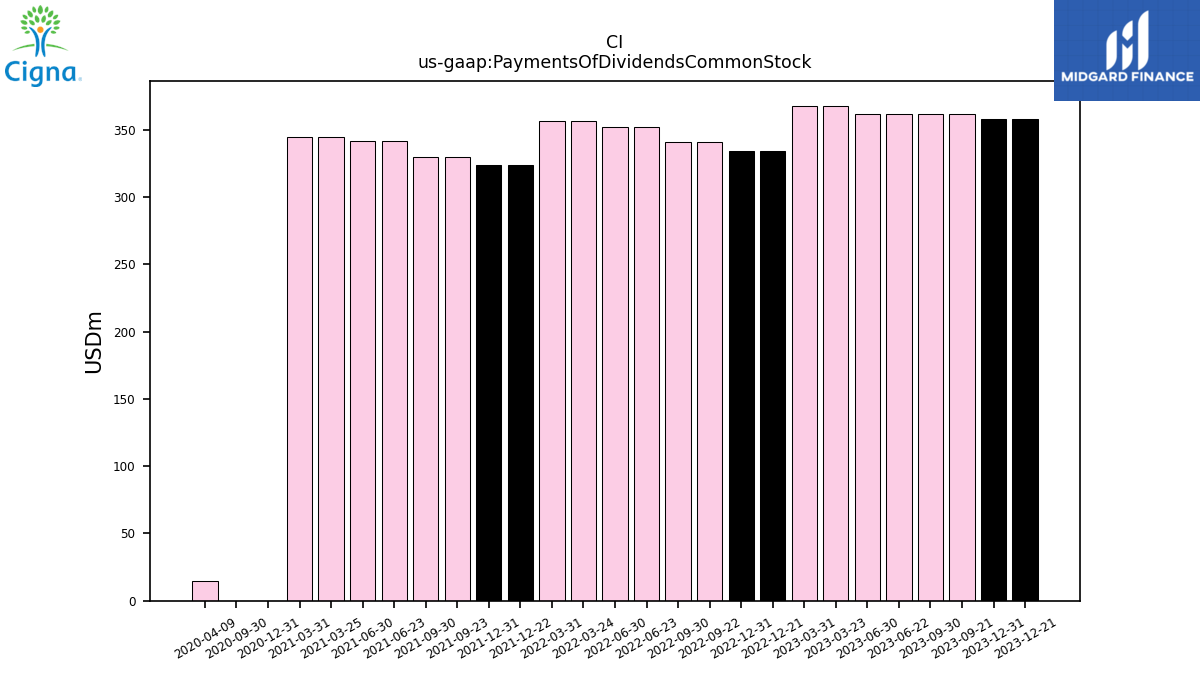
| Payments Of Dividends Common Stock | 358.00 | 362.00 | 362.00 | 368.00 | 334.00 | 341.00 | 352.00 | 357.00 | 324.00 | 330.00 | 342.00 | 345.00 | 0.00 | 0.00 | NA | NA | NA | NA | NA | NA | NA | NA | NA | NA | NA | NA | NA | NA | |
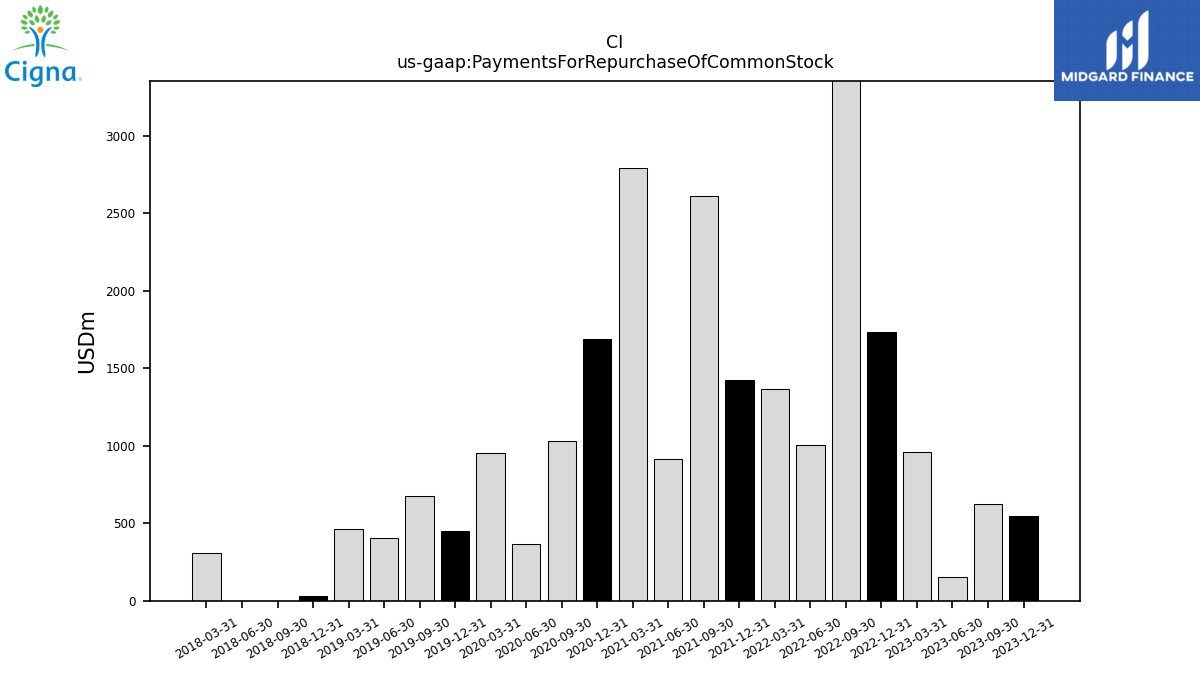
| Payments For Repurchase Of Common Stock | 544.00 | 624.00 | 154.00 | 962.00 | 1733.00 | 3500.00 | 1006.00 | 1368.00 | 1421.00 | 2611.00 | 916.00 | 2794.00 | 1690.00 | 1028.00 | 368.00 | 956.00 | 447.00 | 674.00 | 404.00 | 462.00 | 32.00 | 0.00 | 0.00 | 310.00 | NA | NA | NA | NA |
| 2023-12-31 | 2023-09-30 | 2023-06-30 | 2023-03-31 | 2022-12-31 | 2022-09-30 | 2022-06-30 | 2022-03-31 | 2021-12-31 | 2021-09-30 | 2021-06-30 | 2021-03-31 | 2020-12-31 | 2020-09-30 | 2020-06-30 | 2020-03-31 | 2019-12-31 | 2019-09-30 | 2019-06-30 | 2019-03-31 | 2018-12-31 | 2018-09-30 | 2018-06-30 | 2018-03-31 | 2017-12-31 | 2017-09-30 | 2017-06-30 | 2017-03-31 | ||
|---|---|---|---|---|---|---|---|---|---|---|---|---|---|---|---|---|---|---|---|---|---|---|---|---|---|---|---|---|---|
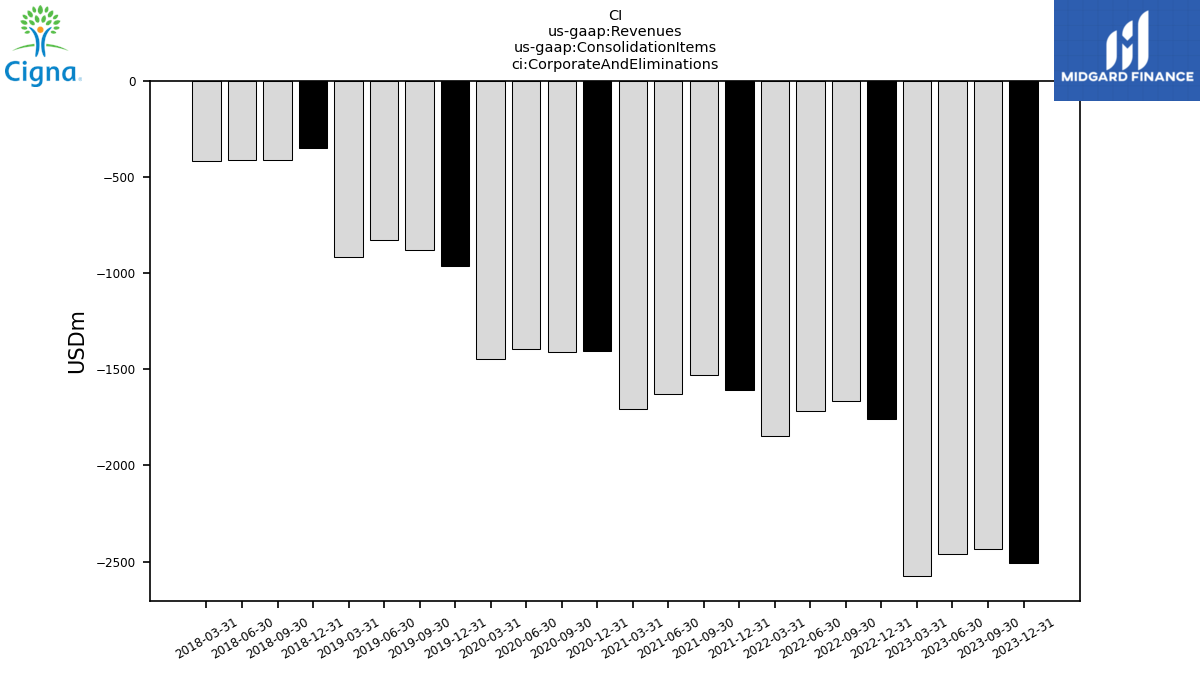
| Revenues | 51114.00 | 49048.00 | 48586.00 | 46517.00 | 45751.00 | 45280.00 | 45480.00 | 44005.00 | 45688.00 | 44288.00 | 43131.00 | 40971.00 | 41712.00 | 40955.00 | 39265.00 | 38469.00 | 38245.00 | 38556.00 | 38819.00 | 37946.00 | 14300.00 | 11457.00 | 11480.00 | 11413.00 | 10632.00 | 10372.00 | 10374.00 | 10428.00 | |
| Corporate And Eliminations | -2509.00 | -2433.00 | -2461.00 | -2575.00 | -1758.00 | -1667.00 | -1717.00 | -1849.00 | -1610.00 | -1529.00 | -1628.00 | -1708.00 | -1407.00 | -1409.00 | -1394.00 | -1445.00 | -963.00 | -881.00 | -828.00 | -916.00 | -350.00 | -413.00 | -409.00 | -418.00 | NA | NA | NA | NA | |
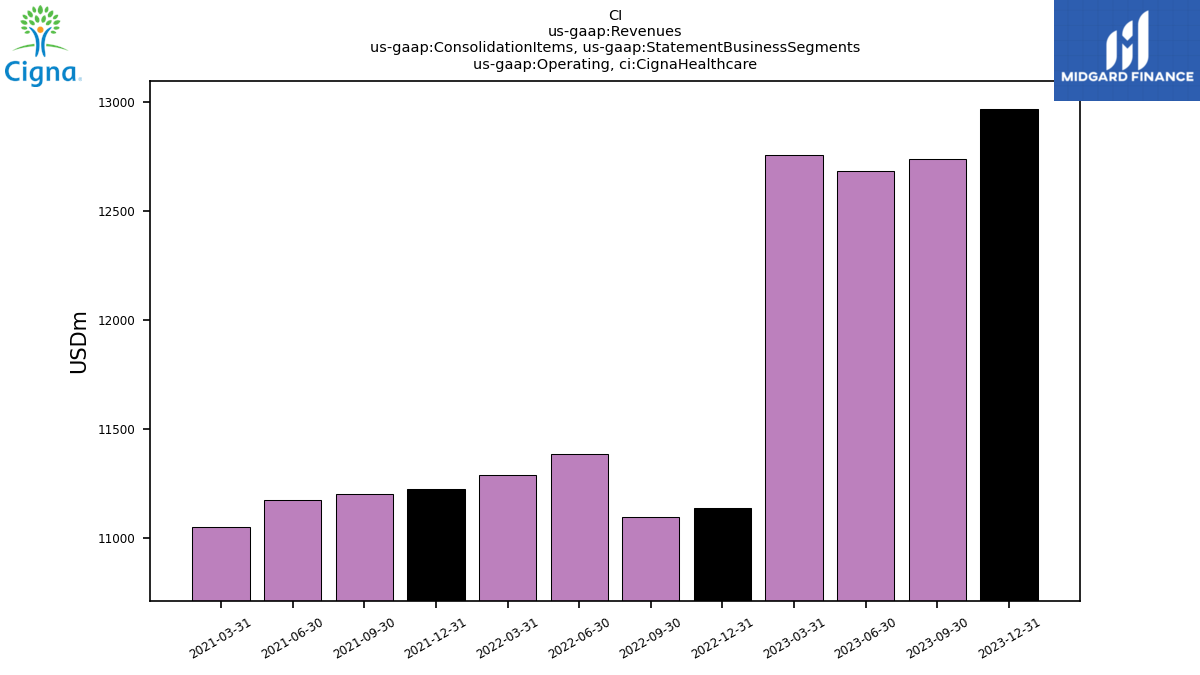
| Operating, Cigna Healthcare | 12970.00 | 12738.00 | 12684.00 | 12756.00 | 11139.00 | 11096.00 | 11386.00 | 11289.00 | 11226.00 | 11200.00 | 11173.00 | 11053.00 | NA | NA | NA | NA | NA | NA | NA | NA | NA | NA | NA | NA | NA | NA | NA | NA | |
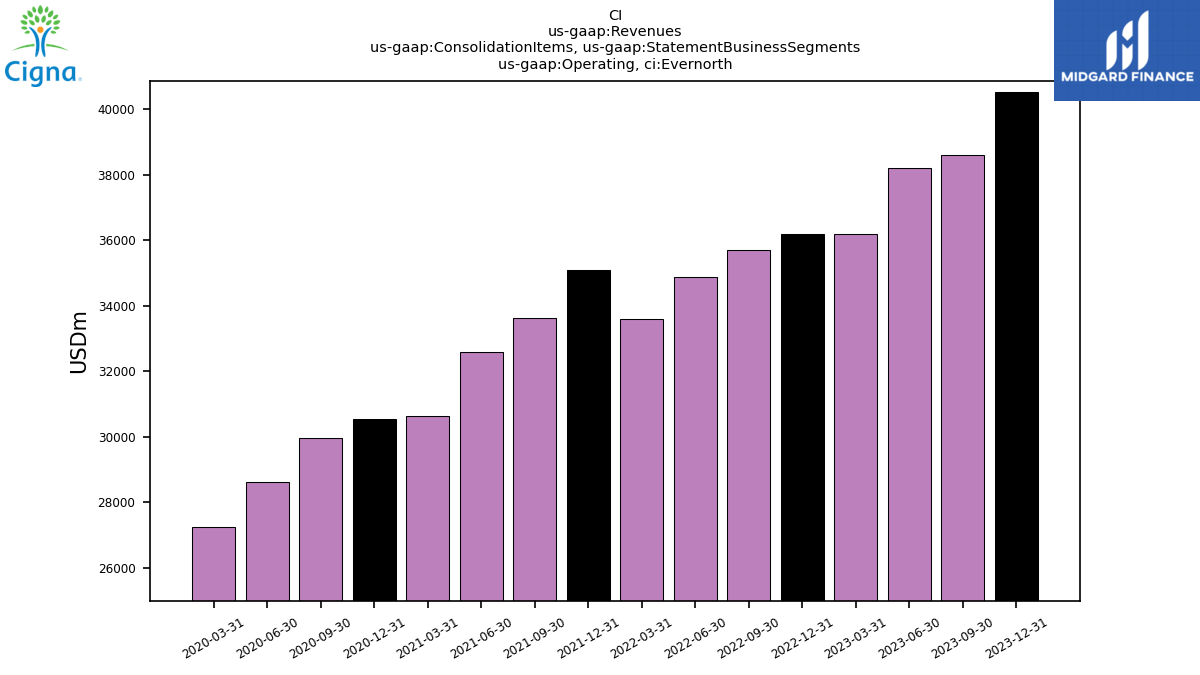
| Operating, Evernorth | 40519.00 | 38596.00 | 38205.00 | 36179.00 | 36188.00 | 35698.00 | 34863.00 | 33586.00 | 35086.00 | 33614.00 | 32592.00 | 30620.00 | 30533.00 | 29944.00 | 28602.00 | 27255.00 | NA | NA | NA | NA | NA | NA | NA | NA | NA | NA | NA | NA | |
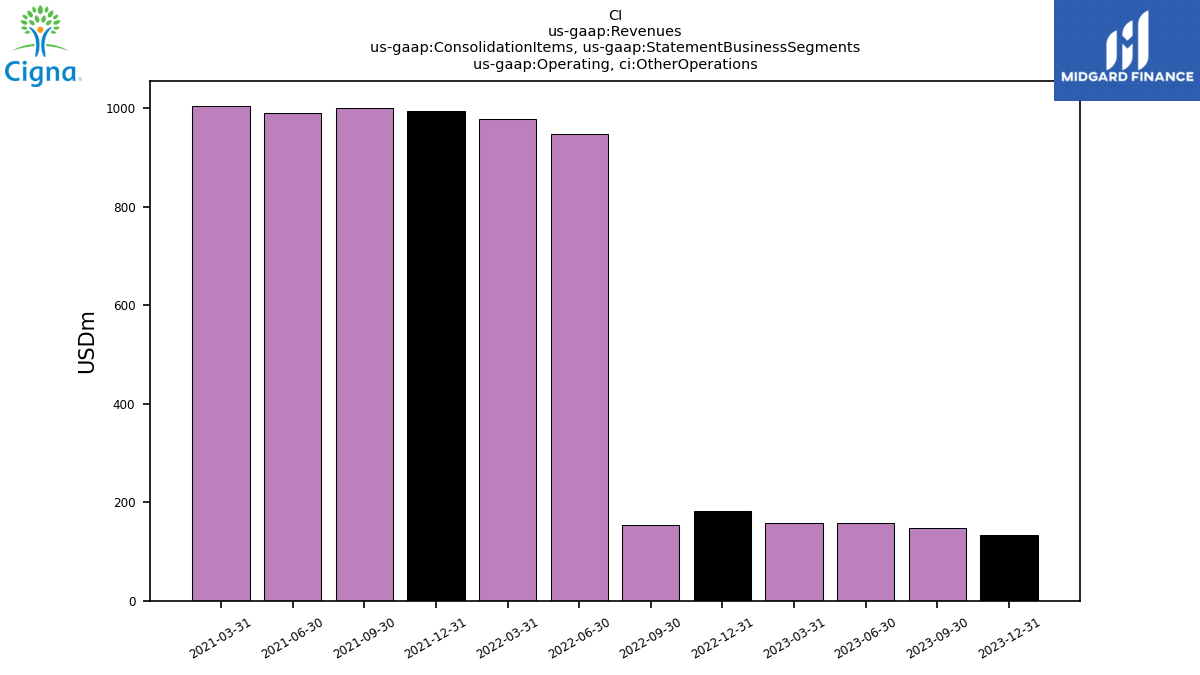
| Operating, Other Operations | 134.00 | 147.00 | 158.00 | 157.00 | 182.00 | 153.00 | 948.00 | 979.00 | 994.00 | 1000.00 | 990.00 | 1005.00 | NA | NA | NA | NA | NA | NA | NA | NA | NA | NA | NA | NA | NA | NA | NA | NA | |
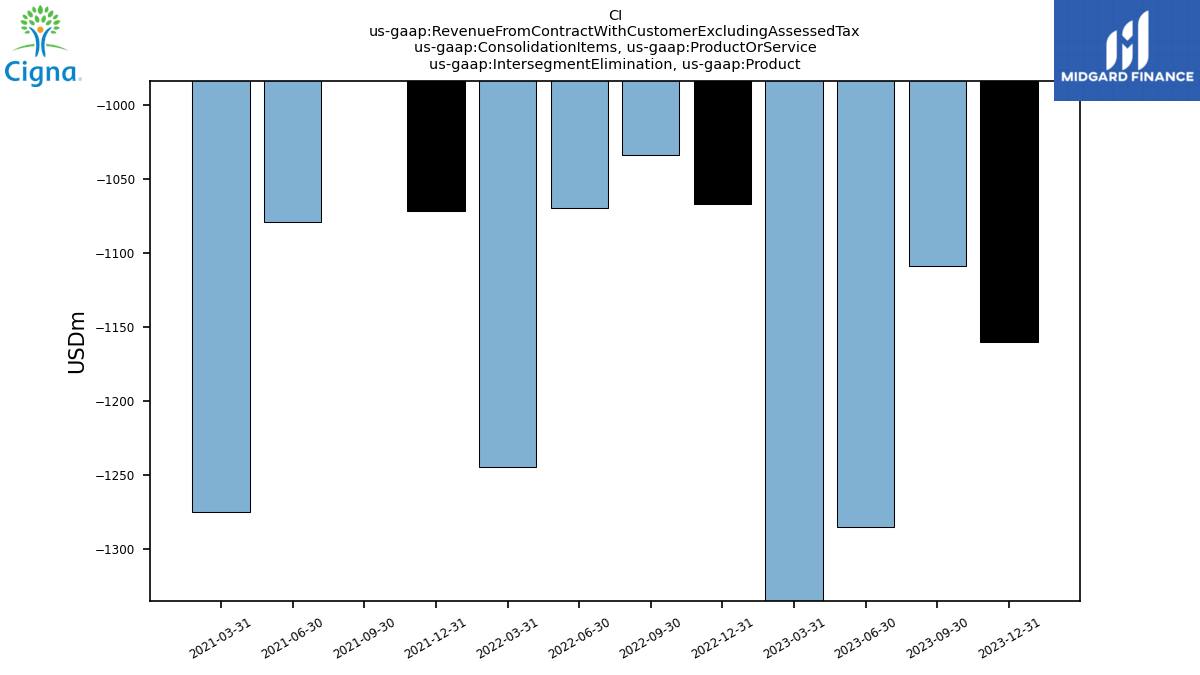
| Intersegment Elimination, Product | -1160.00 | -1109.00 | -1285.00 | -1496.00 | -1067.00 | -1034.00 | -1070.00 | -1245.00 | -1072.00 | -972.00 | -1079.00 | -1275.00 | NA | NA | NA | NA | NA | NA | NA | NA | NA | NA | NA | NA | NA | NA | NA | NA | |
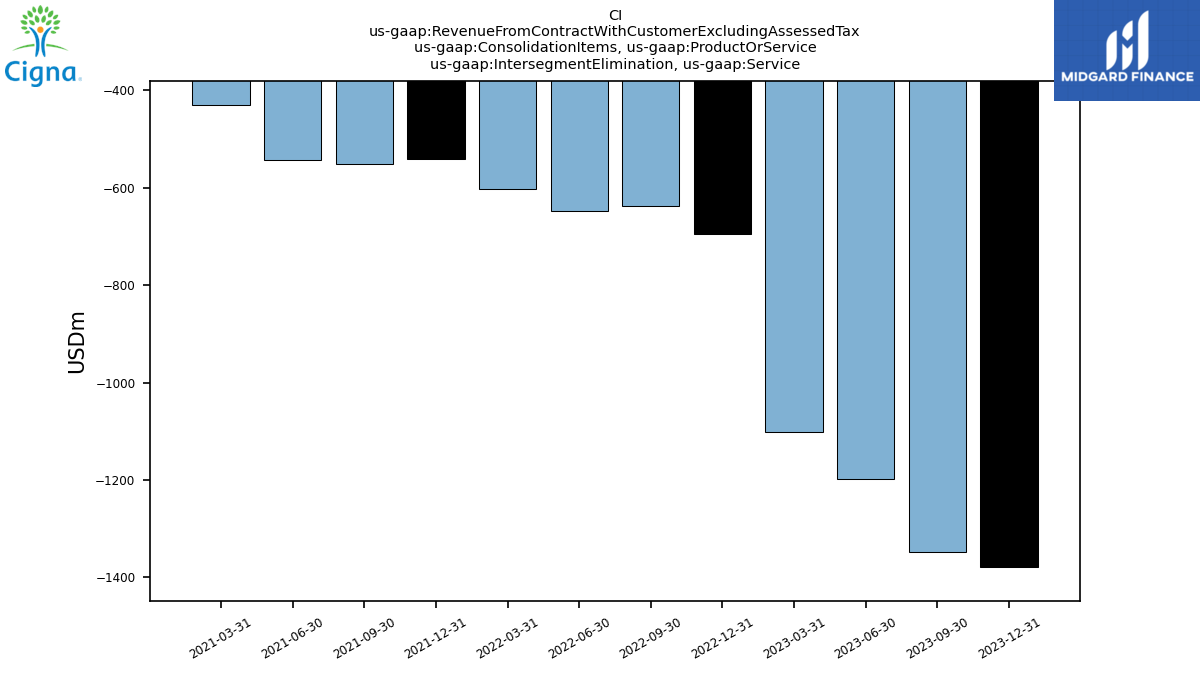
| Intersegment Elimination, Service | -1379.00 | -1347.00 | -1199.00 | -1101.00 | -696.00 | -638.00 | -647.00 | -602.00 | -542.00 | -551.00 | -543.00 | -431.00 | NA | NA | NA | NA | NA | NA | NA | NA | NA | NA | NA | NA | NA | NA | NA | NA | |
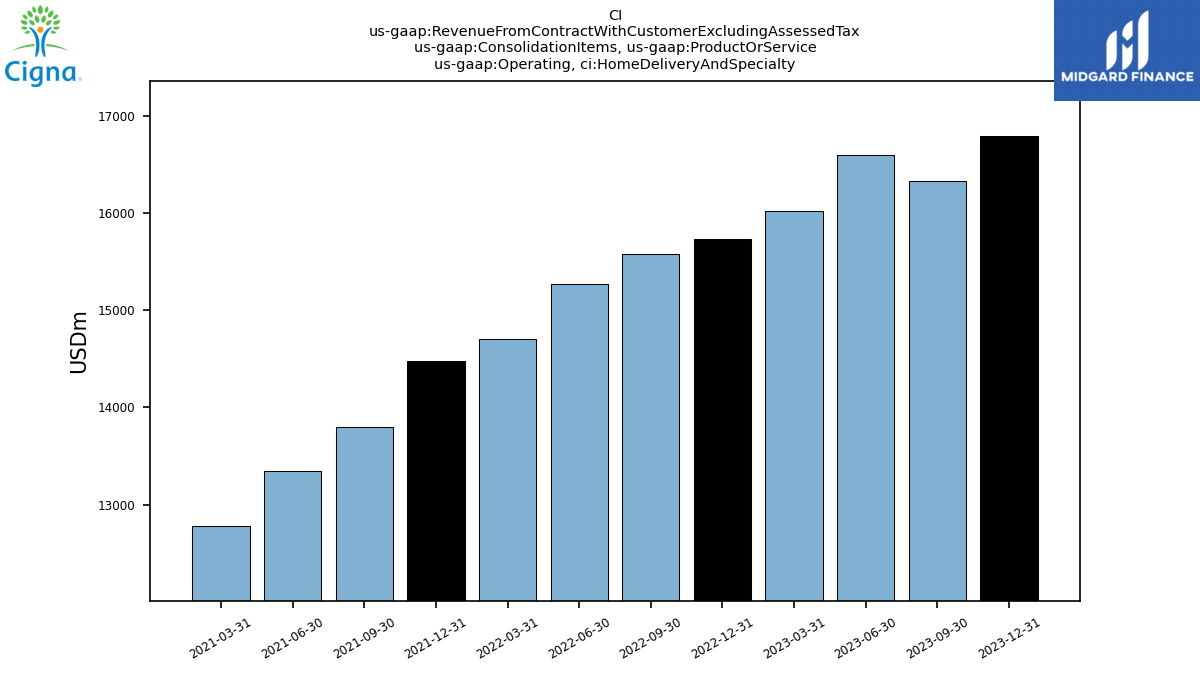
| Operating, Home Delivery And Specialty | 16789.00 | 16324.00 | 16594.00 | 16025.00 | 15733.00 | 15583.00 | 15268.00 | 14699.00 | 14480.00 | 13796.00 | 13341.00 | 12774.00 | NA | NA | NA | NA | NA | NA | NA | NA | NA | NA | NA | NA | NA | NA | NA | NA | |
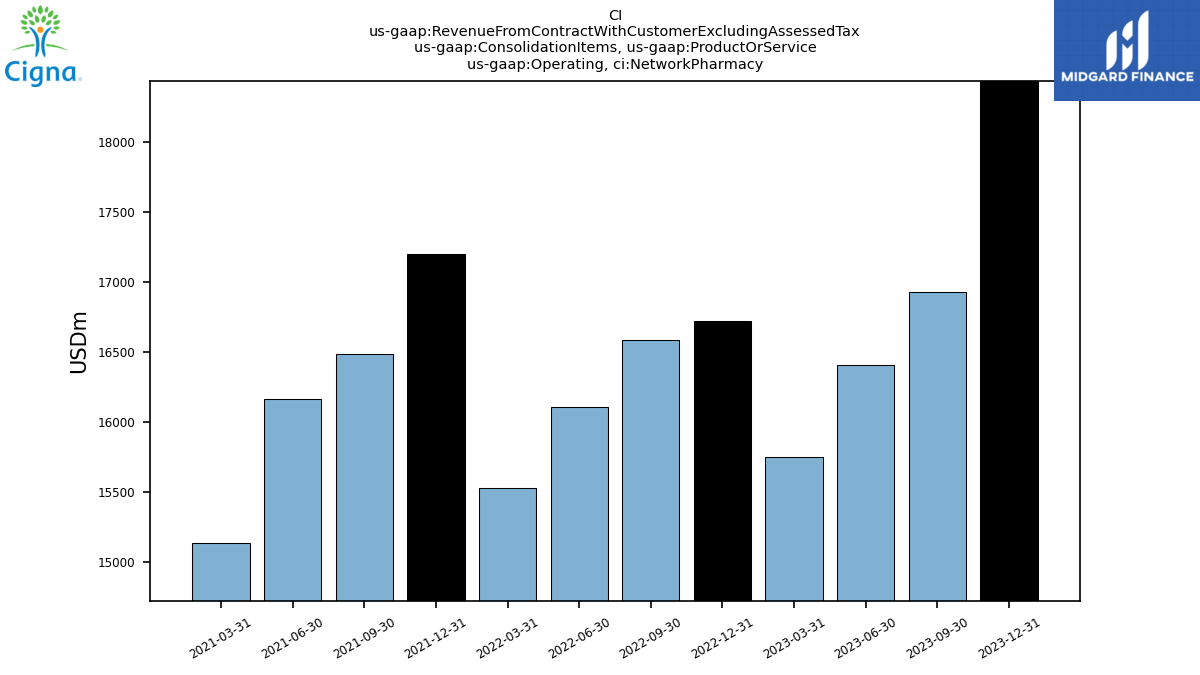
| Operating, Network Pharmacy | 18434.00 | 16926.00 | 16406.00 | 15748.00 | 16725.00 | 16583.00 | 16107.00 | 15531.00 | 17200.00 | 16488.00 | 16166.00 | 15138.00 | NA | NA | NA | NA | NA | NA | NA | NA | NA | NA | NA | NA | NA | NA | NA | NA | |
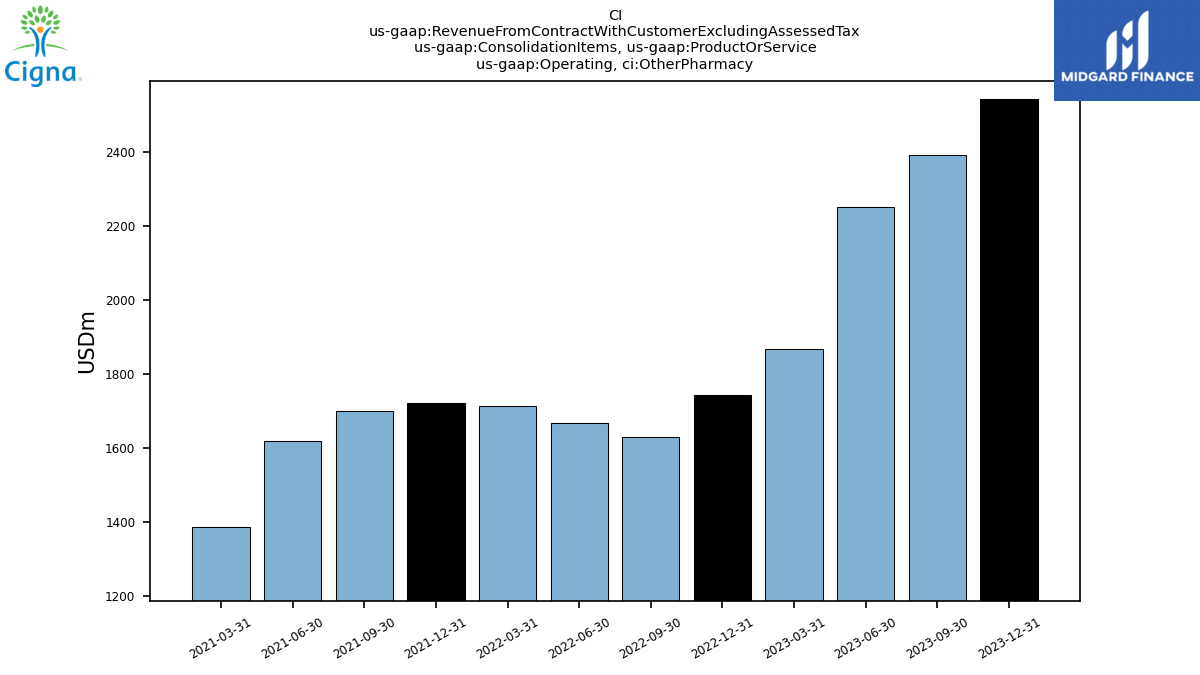
| Operating, Other Pharmacy | 2541.00 | 2390.00 | 2249.00 | 1867.00 | 1744.00 | 1630.00 | 1667.00 | 1712.00 | 1720.00 | 1701.00 | 1619.00 | 1388.00 | NA | NA | NA | NA | NA | NA | NA | NA | NA | NA | NA | NA | NA | NA | NA | NA | |
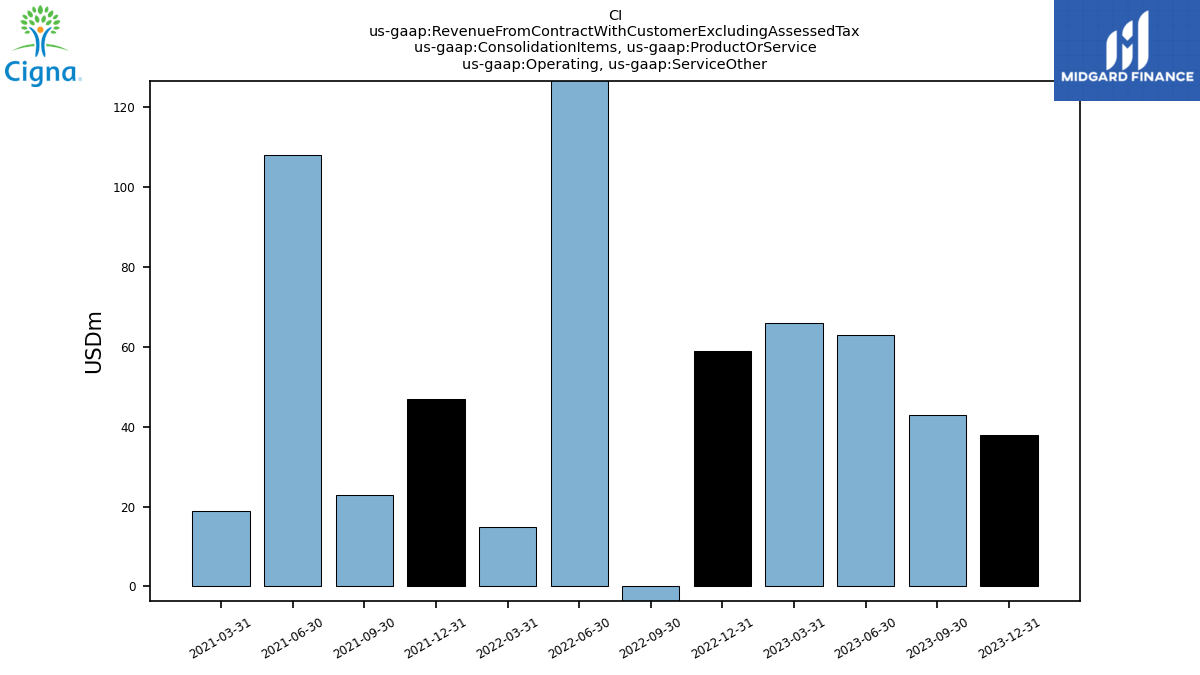
| Operating, Service Other | 38.00 | 43.00 | 63.00 | 66.00 | 59.00 | -39.00 | 132.00 | 15.00 | 47.00 | 23.00 | 108.00 | 19.00 | NA | NA | NA | NA | NA | NA | NA | NA | NA | NA | NA | NA | NA | NA | NA | NA | |
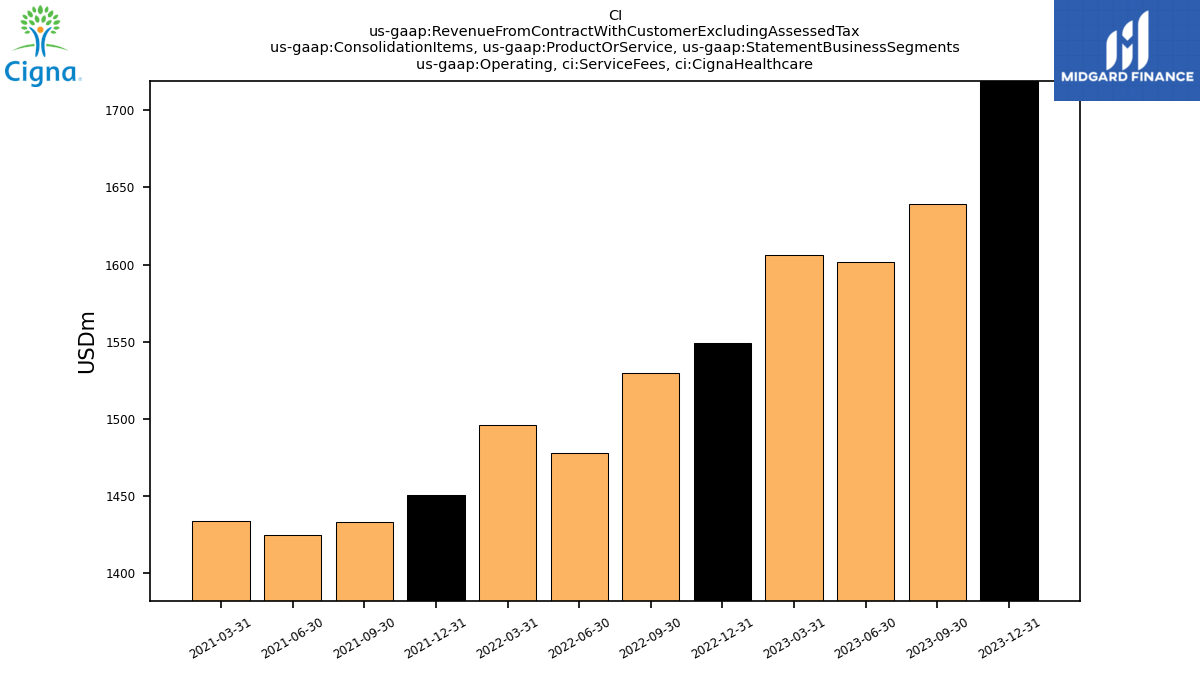
| Operating, Service Fees, Cigna Healthcare | 1719.00 | 1639.00 | 1602.00 | 1606.00 | 1549.00 | 1530.00 | 1478.00 | 1496.00 | 1451.00 | 1433.00 | 1425.00 | 1434.00 | NA | NA | NA | NA | NA | NA | NA | NA | NA | NA | NA | NA | NA | NA | NA | NA | |
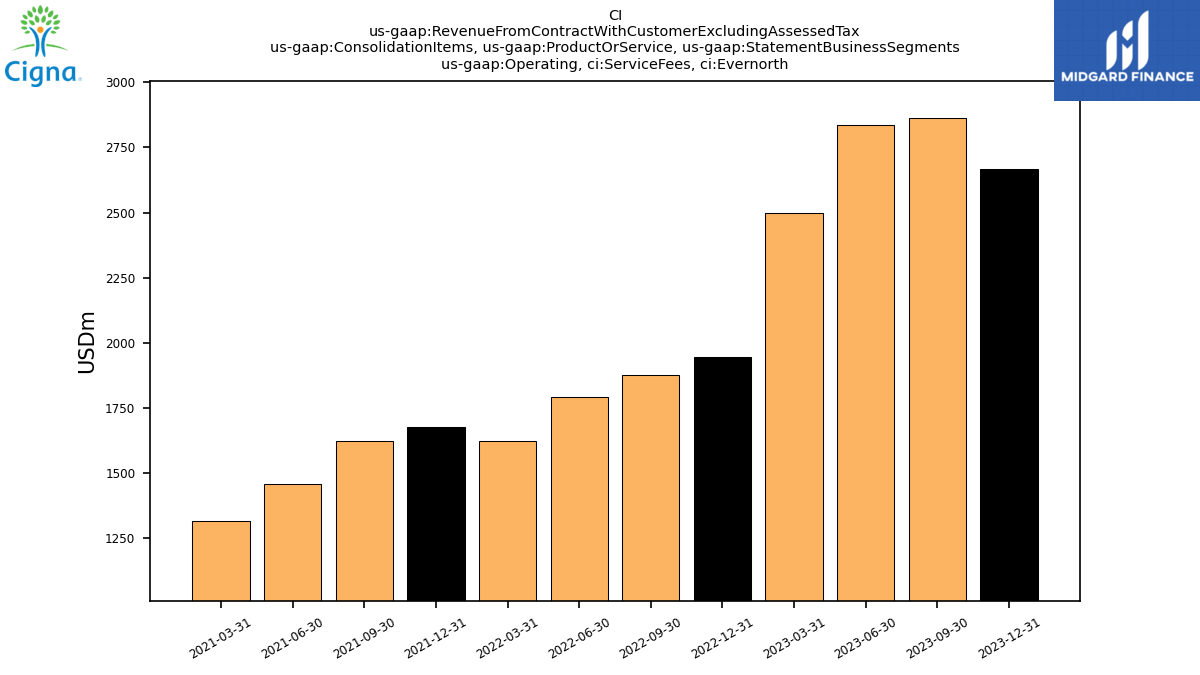
| Operating, Service Fees, Evernorth | 2667.00 | 2862.00 | 2838.00 | 2499.00 | 1945.00 | 1875.00 | 1790.00 | 1624.00 | 1677.00 | 1623.00 | 1456.00 | 1314.00 | NA | NA | NA | NA | NA | NA | NA | NA | NA | NA | NA | NA | NA | NA | NA | NA | |
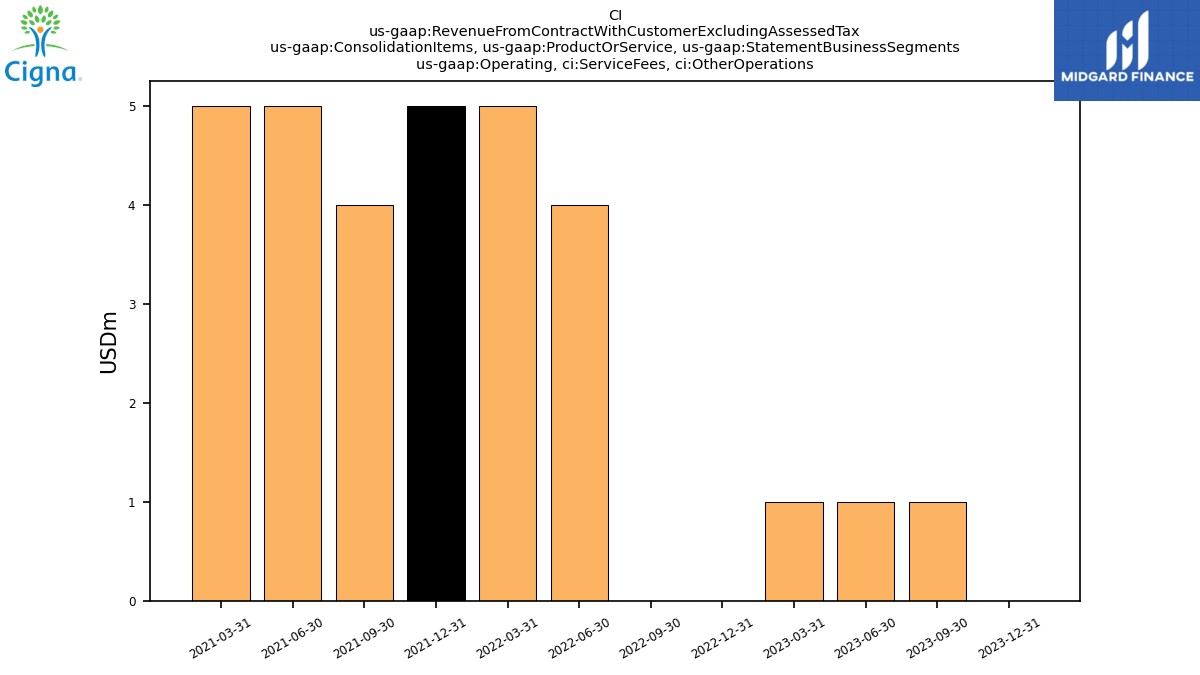
| Operating, Service Fees, Other Operations | 0.00 | 1.00 | 1.00 | 1.00 | 0.00 | 0.00 | 4.00 | 5.00 | 5.00 | 4.00 | 5.00 | 5.00 | NA | NA | NA | NA | NA | NA | NA | NA | NA | NA | NA | NA | NA | NA | NA | NA | |
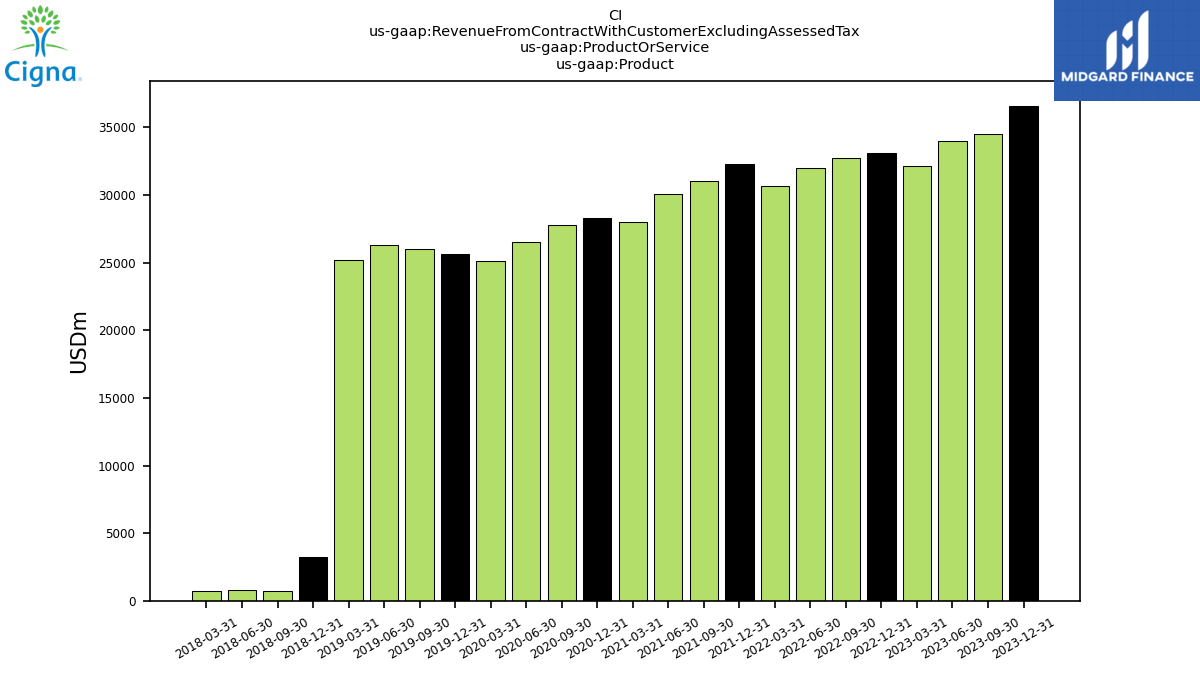
| Product | 36604.00 | 34531.00 | 33964.00 | 32144.00 | 33135.00 | 32762.00 | 31972.00 | 30697.00 | 32328.00 | 31013.00 | 30047.00 | 28025.00 | 28305.00 | 27802.00 | 26564.00 | 25098.00 | 25645.00 | 25987.00 | 26288.00 | 25179.00 | 3257.00 | 747.00 | 758.00 | 717.00 | NA | NA | NA | NA | |
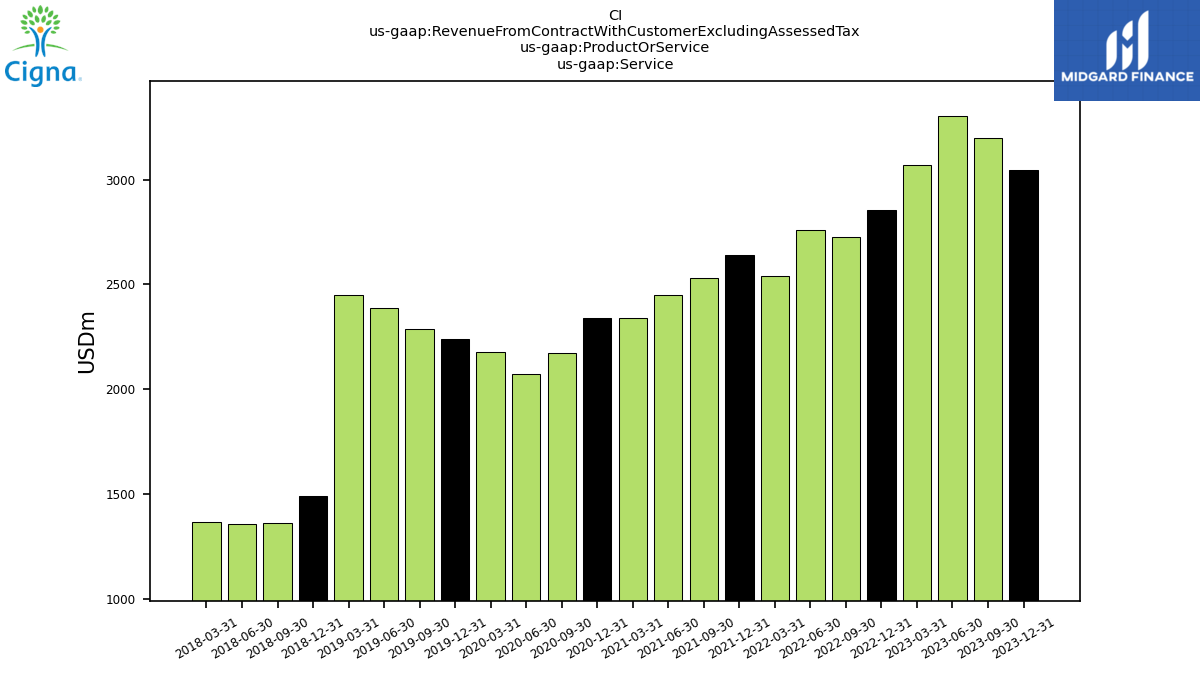
| Service | 3045.00 | 3198.00 | 3305.00 | 3071.00 | 2857.00 | 2728.00 | 2757.00 | 2538.00 | 2638.00 | 2532.00 | 2451.00 | 2341.00 | 2337.00 | 2174.00 | 2072.00 | 2178.00 | 2240.00 | 2285.00 | 2388.00 | 2450.00 | 1491.00 | 1361.00 | 1358.00 | 1368.00 | NA | NA | NA | NA |