
| 2023-12-31 | 2023-09-30 | 2023-06-30 | 2023-03-31 | 2022-12-31 | 2022-10-01 | 2022-07-02 | 2022-04-02 | 2022-01-01 | 2021-10-02 | 2021-07-03 | 2021-04-03 | 2020-09-26 | 2020-06-27 | 2020-03-28 | 2019-12-28 | 2019-09-28 | 2019-06-29 | 2019-03-30 | 2018-12-29 | 2018-09-29 | 2018-06-30 | 2018-03-31 | 2017-12-30 | 2017-09-30 | 2017-07-01 | 2017-04-01 | 2016-12-31 | 2016-10-01 | 2016-07-02 | 2016-04-02 | 2016-01-02 | 2015-10-03 | 2015-07-04 | 2015-04-04 | 2014-09-27 | 2014-06-28 | 2014-03-29 | 2013-12-28 | 2013-09-28 | 2013-06-29 | 2013-03-30 | 2012-12-29 | 2012-09-29 | 2012-06-30 | 2012-03-31 | 2011-12-31 | 2011-10-01 | 2011-07-02 | 2011-04-02 | 2011-01-01 | 2010-10-02 | 2010-07-03 | 2010-04-03 | ||
|---|---|---|---|---|---|---|---|---|---|---|---|---|---|---|---|---|---|---|---|---|---|---|---|---|---|---|---|---|---|---|---|---|---|---|---|---|---|---|---|---|---|---|---|---|---|---|---|---|---|---|---|---|---|---|---|
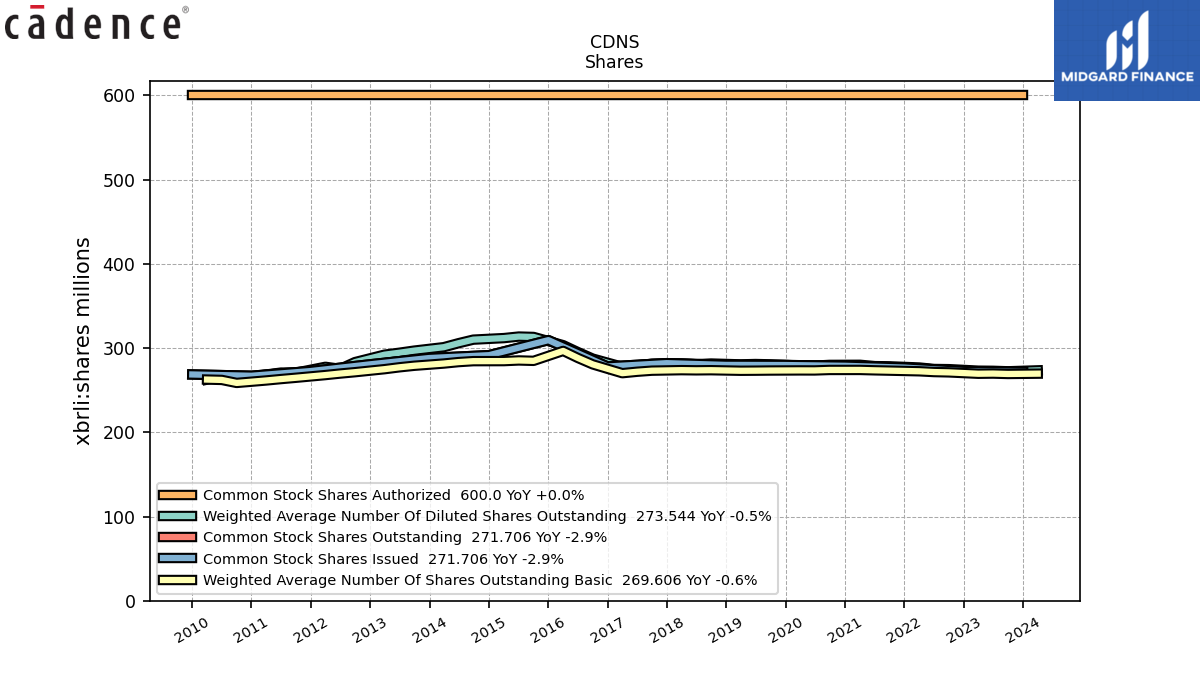
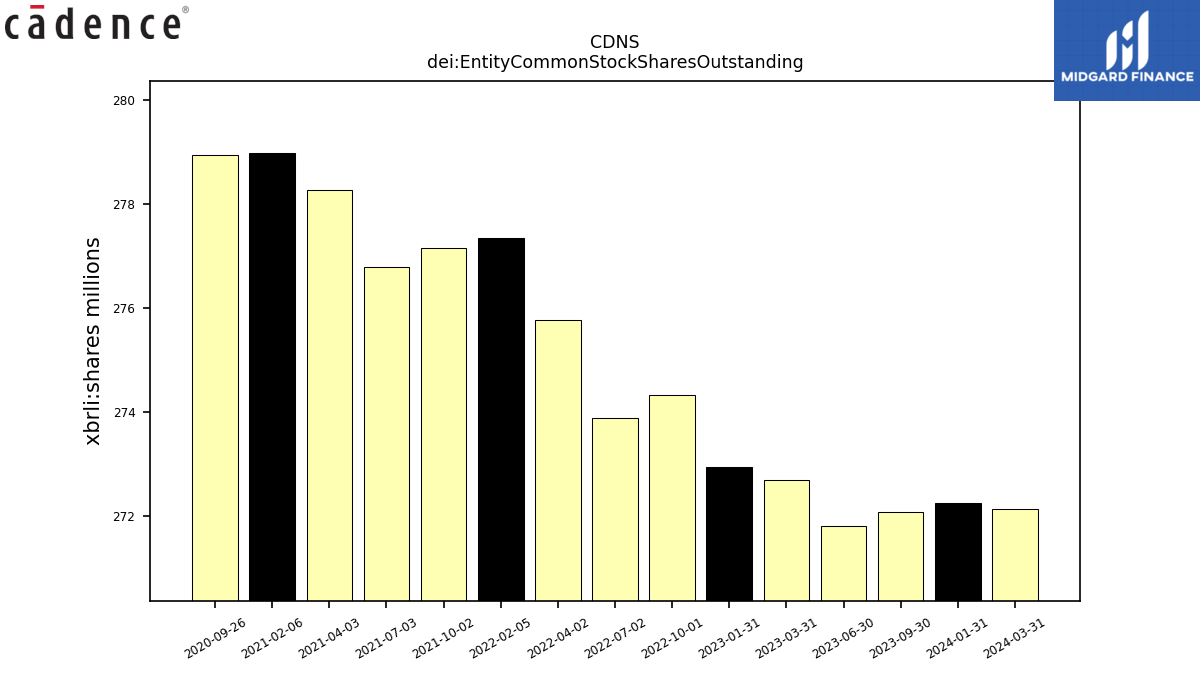
| dei: Entity Common Stock Shares Outstanding | NA | 272.06 | 271.79 | 272.68 | NA | 274.32 | 273.87 | 275.76 | NA | 277.14 | 276.78 | 278.26 | 278.93 | NA | NA | NA | NA | NA | NA | NA | NA | NA | NA | NA | NA | NA | NA | NA | NA | NA | NA | NA | NA | NA | NA | NA | NA | NA | NA | NA | NA | NA | NA | NA | NA | NA | NA | NA | NA | NA | NA | NA | NA | NA | |
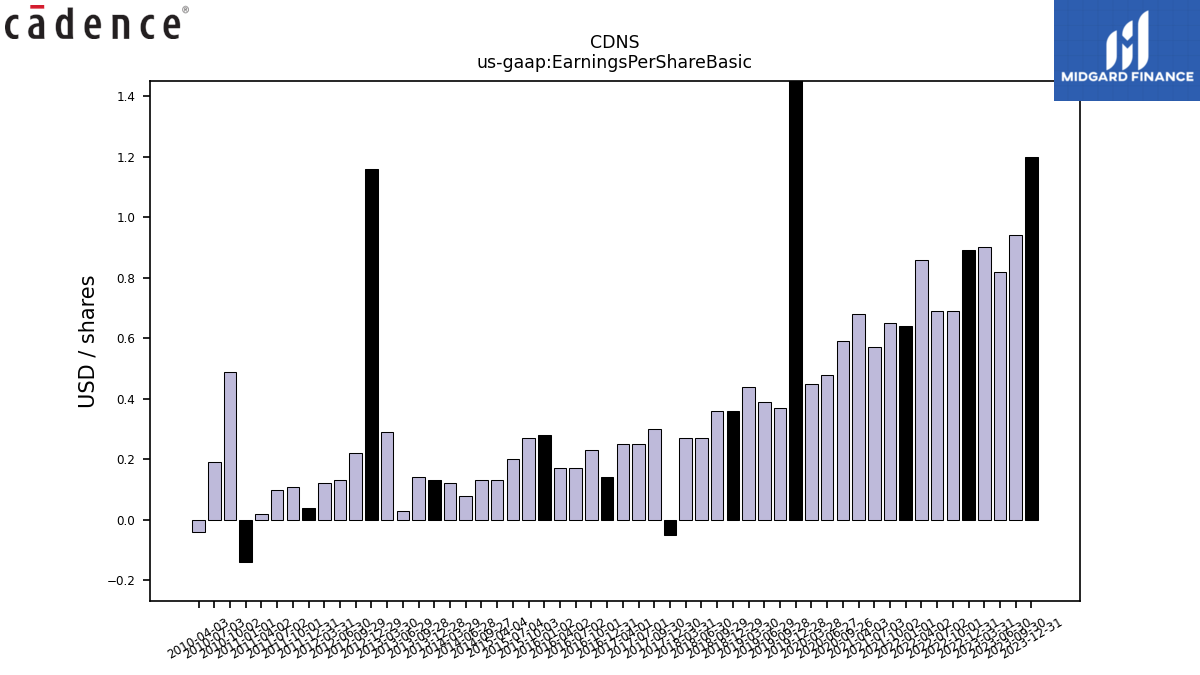
| Earnings Per Share Basic | 1.20 | 0.94 | 0.82 | 0.90 | 0.89 | 0.69 | 0.69 | 0.86 | 0.64 | 0.65 | 0.57 | 0.68 | 0.59 | 0.48 | 0.45 | 2.41 | 0.37 | 0.39 | 0.44 | 0.36 | 0.36 | 0.27 | 0.27 | -0.05 | 0.30 | 0.25 | 0.25 | 0.14 | 0.23 | 0.17 | 0.17 | 0.28 | 0.27 | 0.20 | 0.13 | 0.13 | 0.08 | 0.12 | 0.13 | 0.14 | 0.03 | 0.29 | 1.16 | 0.22 | 0.13 | 0.12 | 0.04 | 0.11 | 0.10 | 0.02 | -0.14 | 0.49 | 0.19 | -0.04 | |
| Earnings Per Share Diluted | 1.19 | 0.93 | 0.81 | 0.89 | 0.88 | 0.68 | 0.68 | 0.85 | 0.64 | 0.63 | 0.56 | 0.67 | 0.58 | 0.47 | 0.44 | 2.36 | 0.36 | 0.38 | 0.43 | 0.35 | 0.35 | 0.27 | 0.26 | -0.05 | 0.29 | 0.25 | 0.25 | 0.14 | 0.23 | 0.17 | 0.17 | 0.26 | 0.25 | 0.19 | 0.12 | 0.12 | 0.08 | 0.11 | 0.13 | 0.13 | 0.03 | 0.27 | 1.12 | 0.21 | 0.13 | 0.11 | 0.04 | 0.10 | 0.10 | 0.02 | -0.14 | 0.48 | 0.18 | -0.04 |
| 2023-12-31 | 2023-09-30 | 2023-06-30 | 2023-03-31 | 2022-12-31 | 2022-10-01 | 2022-07-02 | 2022-04-02 | 2022-01-01 | 2021-10-02 | 2021-07-03 | 2021-04-03 | 2020-09-26 | 2020-06-27 | 2020-03-28 | 2019-12-28 | 2019-09-28 | 2019-06-29 | 2019-03-30 | 2018-12-29 | 2018-09-29 | 2018-06-30 | 2018-03-31 | 2017-12-30 | 2017-09-30 | 2017-07-01 | 2017-04-01 | 2016-12-31 | 2016-10-01 | 2016-07-02 | 2016-04-02 | 2016-01-02 | 2015-10-03 | 2015-07-04 | 2015-04-04 | 2014-09-27 | 2014-06-28 | 2014-03-29 | 2013-12-28 | 2013-09-28 | 2013-06-29 | 2013-03-30 | 2012-12-29 | 2012-09-29 | 2012-06-30 | 2012-03-31 | 2011-12-31 | 2011-10-01 | 2011-07-02 | 2011-04-02 | 2011-01-01 | 2010-10-02 | 2010-07-03 | 2010-04-03 | ||
|---|---|---|---|---|---|---|---|---|---|---|---|---|---|---|---|---|---|---|---|---|---|---|---|---|---|---|---|---|---|---|---|---|---|---|---|---|---|---|---|---|---|---|---|---|---|---|---|---|---|---|---|---|---|---|---|
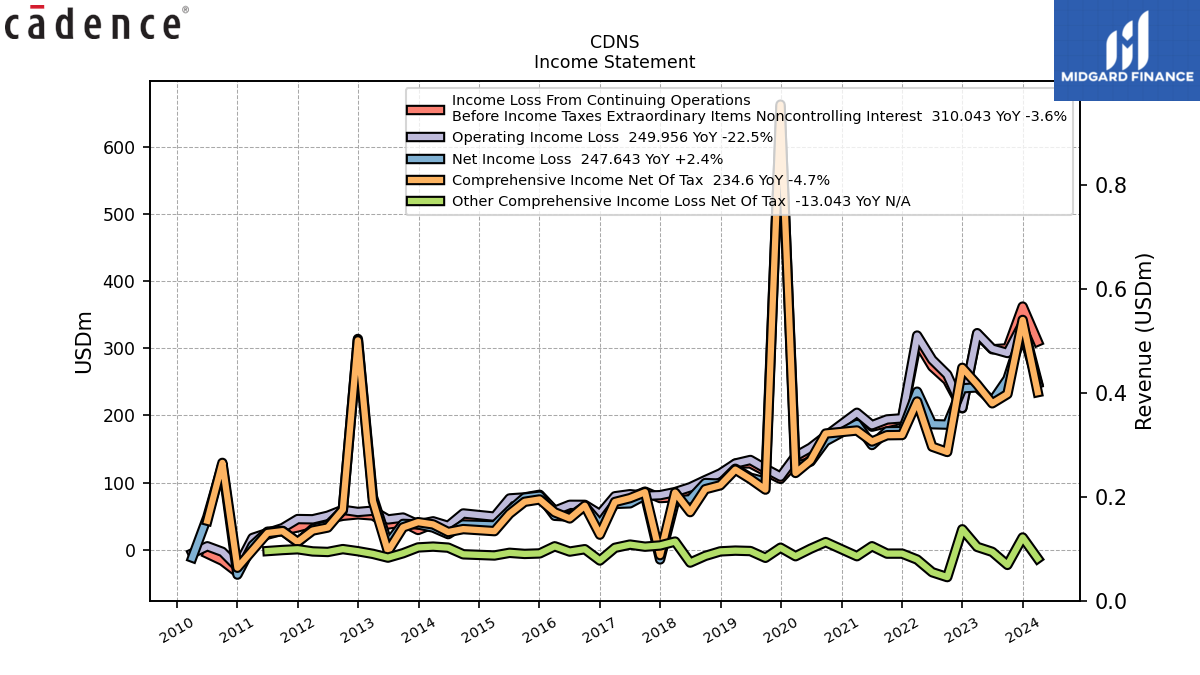
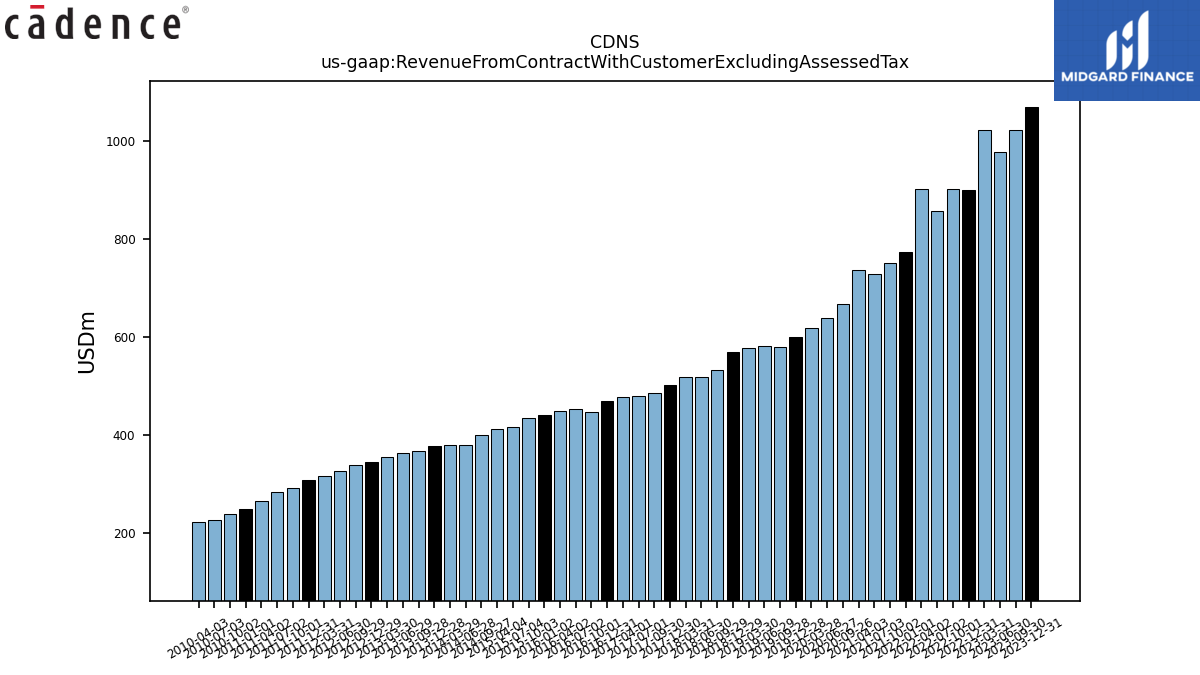
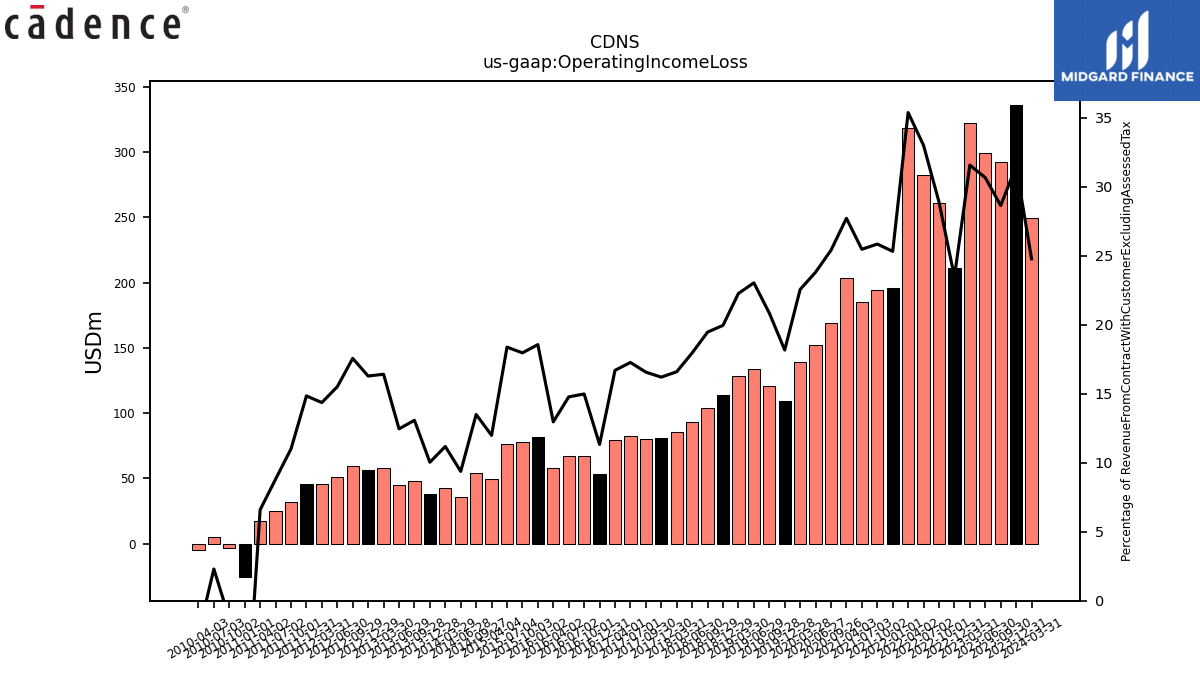
| Revenue From Contract With Customer Excluding Assessed Tax | 1068.62 | 1023.09 | 976.58 | 1021.69 | 899.88 | 902.55 | 857.52 | 901.77 | 773.04 | 750.89 | 728.28 | 736.03 | 666.61 | 638.42 | 617.96 | 599.55 | 579.60 | 580.42 | 576.74 | 569.85 | 532.47 | 518.39 | 517.31 | 501.72 | 485.40 | 479.00 | 476.91 | 468.98 | 446.22 | 453.02 | 447.86 | 441.08 | 433.76 | 415.88 | 411.37 | 400.50 | 378.79 | 378.55 | 376.72 | 366.65 | 362.48 | 354.27 | 345.58 | 338.53 | 326.48 | 315.83 | 308.01 | 292.46 | 283.27 | 266.10 | 249.02 | 237.93 | 227.06 | 221.94 | |
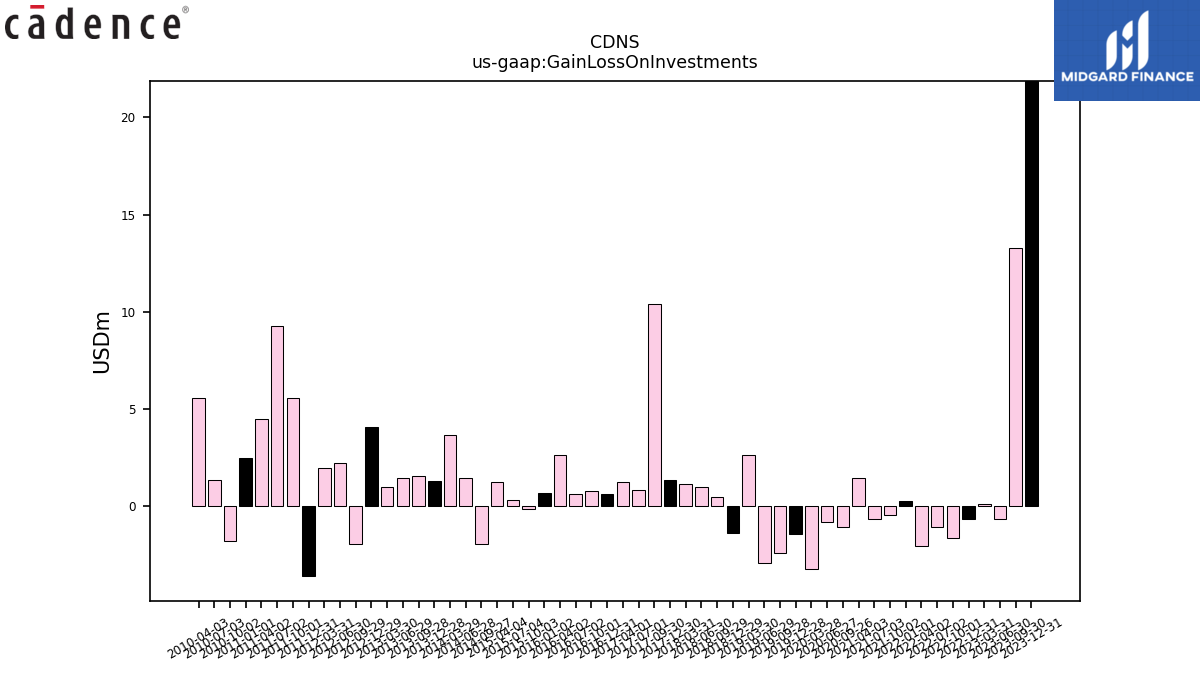
| Gain Loss On Investments | 21.87 | 13.29 | -0.68 | 0.12 | -0.65 | -1.65 | -1.09 | -2.04 | 0.25 | -0.47 | -0.64 | 1.43 | -1.08 | -0.82 | -3.21 | -1.44 | -2.40 | -2.90 | 2.65 | -1.36 | 0.48 | 1.01 | 1.12 | 1.37 | 10.42 | 0.85 | 1.23 | 0.66 | 0.81 | 0.65 | 2.62 | 0.69 | -0.16 | 0.32 | 1.27 | -1.93 | 1.48 | 3.65 | 1.28 | 1.56 | 1.47 | 1.01 | 4.10 | -1.95 | 2.22 | 1.95 | -3.59 | 5.58 | 9.26 | 4.48 | 2.48 | -1.80 | 1.34 | 5.59 | |
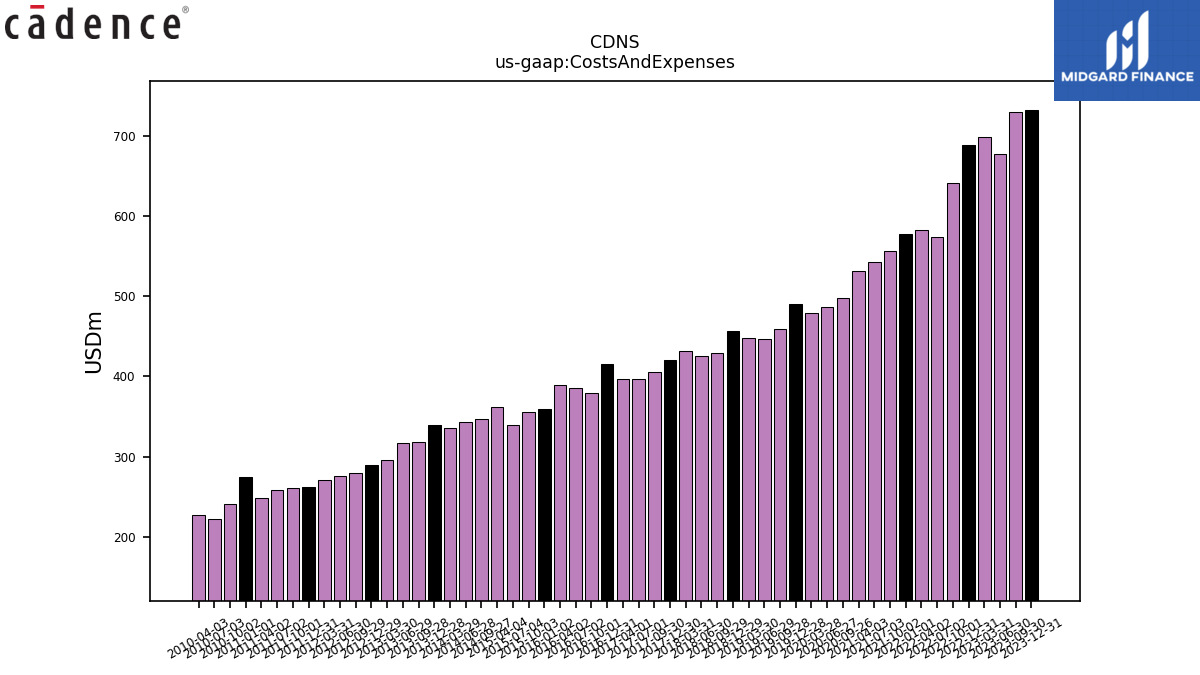
| Costs And Expenses | 732.10 | 730.19 | 677.25 | 699.23 | 688.76 | 641.80 | 574.63 | 582.84 | 577.36 | 556.86 | 542.85 | 532.09 | 497.33 | 486.47 | 478.61 | 490.66 | 458.78 | 446.74 | 448.35 | 456.16 | 428.84 | 425.33 | 431.48 | 420.44 | 405.01 | 396.31 | 397.31 | 415.86 | 379.38 | 386.12 | 389.83 | 359.24 | 355.86 | 339.48 | 362.08 | 346.45 | 343.29 | 336.24 | 338.92 | 318.72 | 317.34 | 296.13 | 289.32 | 279.09 | 275.86 | 270.48 | 262.31 | 260.28 | 258.31 | 248.56 | 274.80 | 241.02 | 221.84 | 227.26 | |
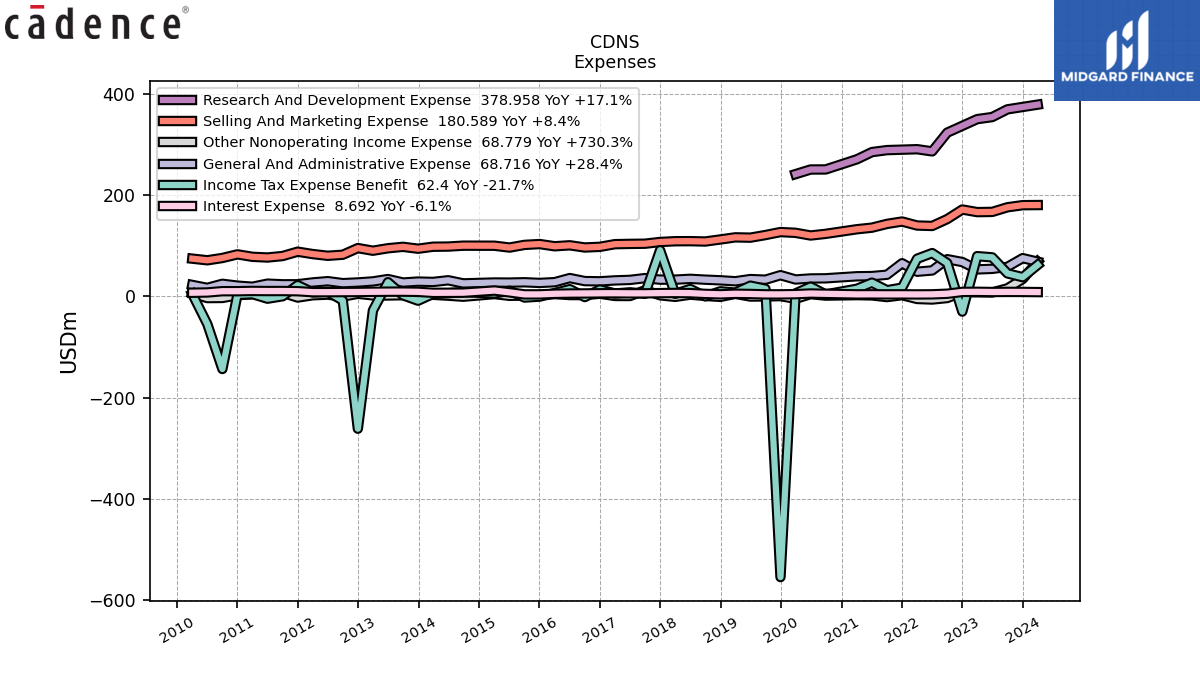
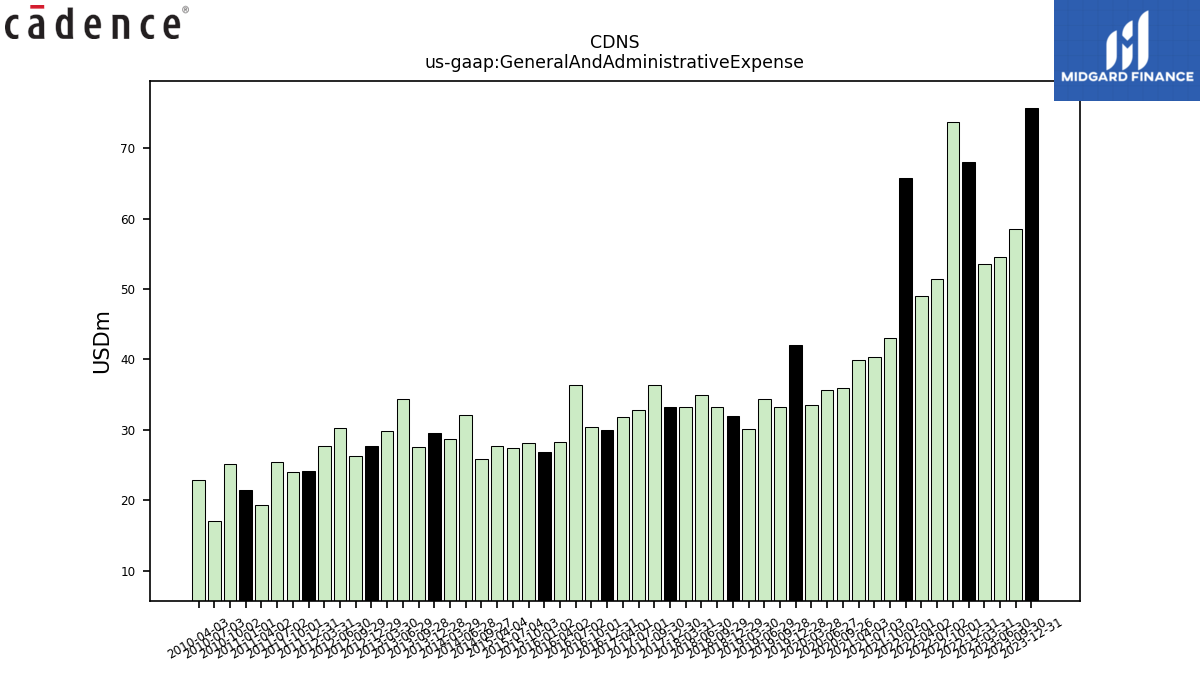
| General And Administrative Expense | 75.74 | 58.56 | 54.60 | 53.53 | 68.06 | 73.69 | 51.43 | 48.94 | 65.74 | 42.99 | 40.33 | 39.95 | 35.93 | 35.64 | 33.59 | 42.09 | 33.20 | 34.41 | 30.10 | 31.98 | 33.25 | 34.88 | 33.30 | 33.29 | 36.30 | 32.77 | 31.82 | 29.98 | 30.44 | 36.39 | 28.30 | 26.79 | 28.08 | 27.47 | 27.64 | 25.89 | 32.04 | 28.74 | 29.48 | 27.58 | 34.44 | 29.81 | 27.71 | 26.35 | 30.24 | 27.77 | 24.14 | 24.04 | 25.38 | 19.30 | 21.42 | 25.08 | 17.06 | 22.83 | |
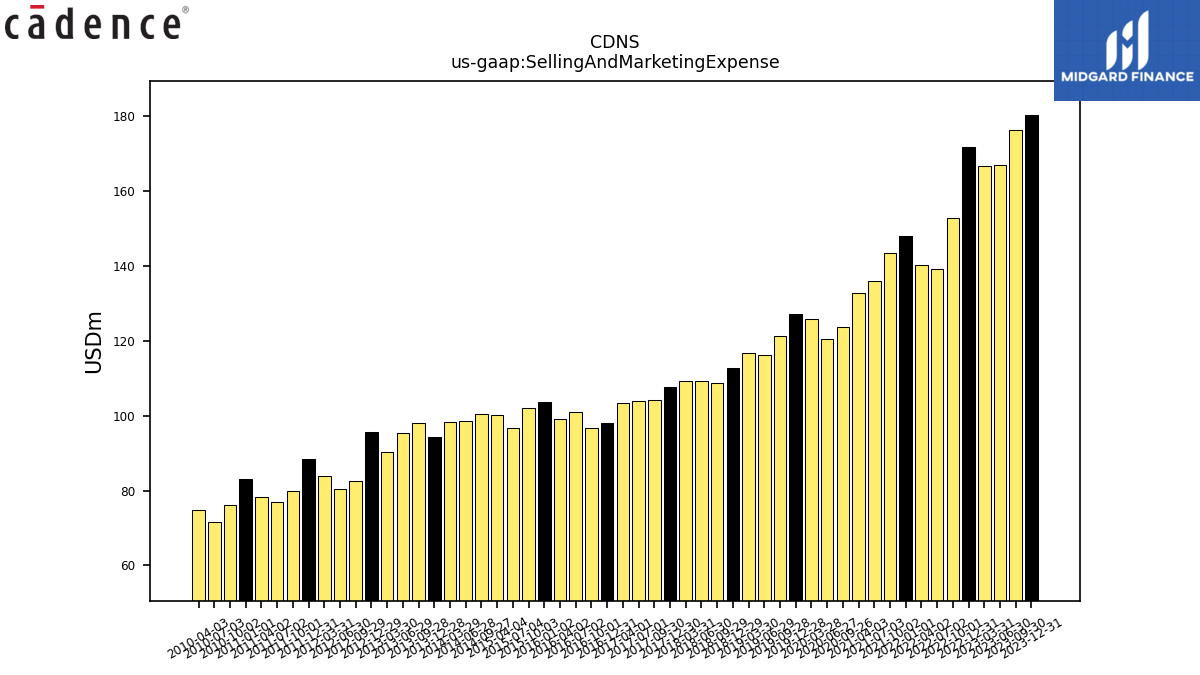
| Selling And Marketing Expense | 180.37 | 176.22 | 167.07 | 166.67 | 171.82 | 152.93 | 139.30 | 140.19 | 148.07 | 143.40 | 135.97 | 132.83 | 123.74 | 120.48 | 125.74 | 127.27 | 121.37 | 116.21 | 116.83 | 112.61 | 108.61 | 109.30 | 109.15 | 107.65 | 104.26 | 103.90 | 103.35 | 98.09 | 96.79 | 101.11 | 99.20 | 103.55 | 101.95 | 96.66 | 100.27 | 100.39 | 98.61 | 98.32 | 94.38 | 98.09 | 95.28 | 90.40 | 95.60 | 82.46 | 80.42 | 83.80 | 88.51 | 79.91 | 77.01 | 78.37 | 83.22 | 76.06 | 71.51 | 74.76 | |
| Operating Income Loss | 336.53 | 292.91 | 299.33 | 322.46 | 211.12 | 260.75 | 282.89 | 318.93 | 195.68 | 194.03 | 185.44 | 203.94 | 169.27 | 151.95 | 139.35 | 108.90 | 120.83 | 133.68 | 128.40 | 113.69 | 103.63 | 93.06 | 85.83 | 81.28 | 80.39 | 82.69 | 79.60 | 53.12 | 66.84 | 66.91 | 58.04 | 81.84 | 77.90 | 76.40 | 49.28 | 54.05 | 35.50 | 42.31 | 37.80 | 47.93 | 45.14 | 58.14 | 56.26 | 59.44 | 50.62 | 45.35 | 45.70 | 32.18 | 24.96 | 17.54 | -25.78 | -3.08 | 5.22 | -5.32 | |
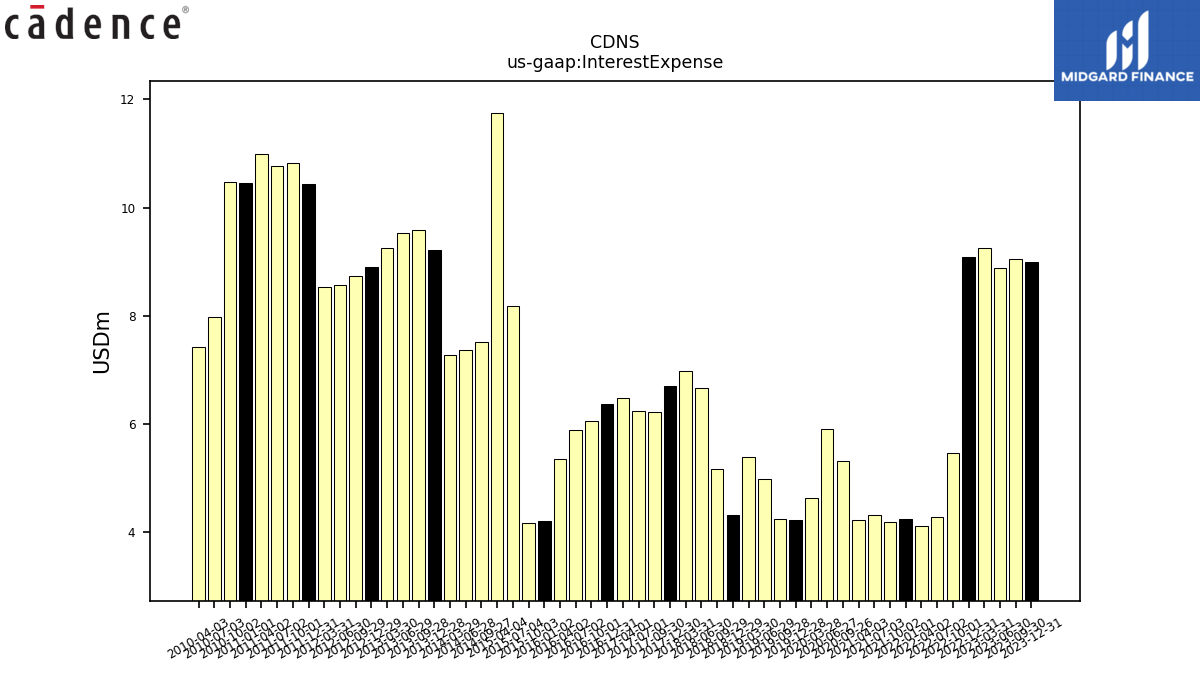
| Interest Expense | 8.99 | 9.06 | 8.88 | 9.26 | 9.08 | 5.46 | 4.28 | 4.11 | 4.25 | 4.20 | 4.32 | 4.22 | 5.33 | 5.91 | 4.64 | 4.22 | 4.24 | 4.98 | 5.39 | 4.32 | 5.18 | 6.67 | 6.97 | 6.71 | 6.22 | 6.25 | 6.48 | 6.36 | 6.05 | 5.90 | 5.36 | 4.20 | 4.18 | 8.18 | 11.75 | 7.52 | 7.37 | 7.27 | 9.21 | 9.58 | 9.53 | 9.26 | 8.90 | 8.74 | 8.57 | 8.54 | 10.44 | 10.83 | 10.77 | 10.99 | 10.46 | 10.48 | 7.97 | 7.43 | |
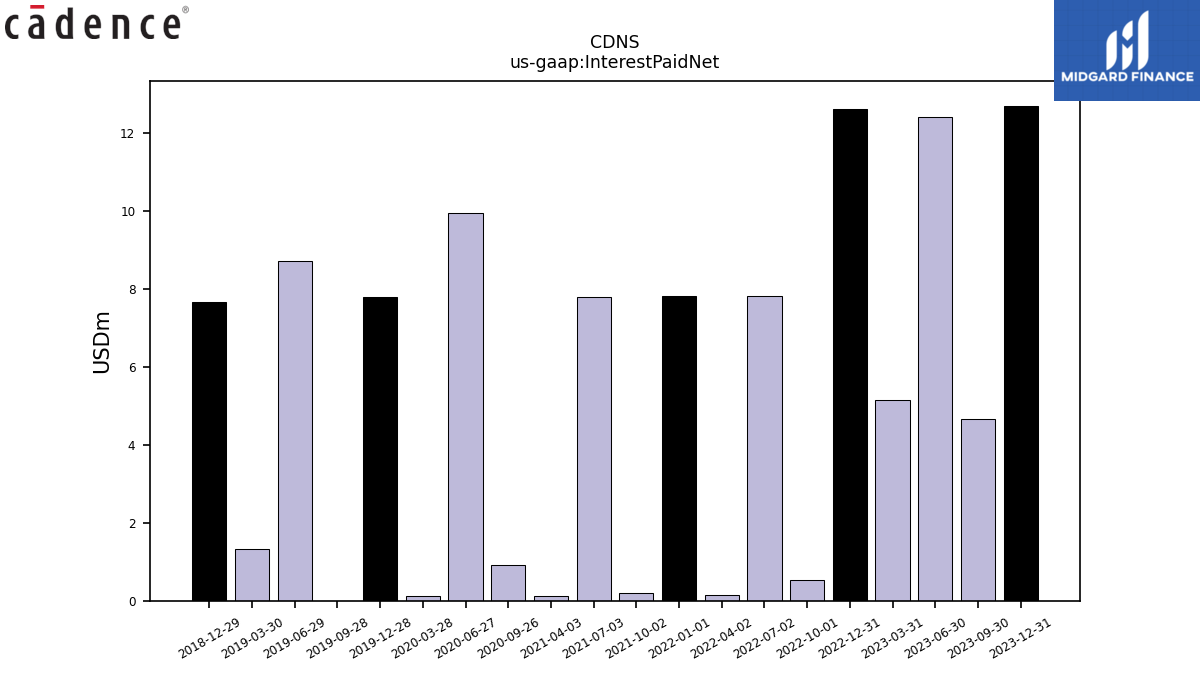
| Interest Paid Net | 12.71 | 4.66 | 12.42 | 5.14 | 12.61 | 0.54 | 7.82 | 0.16 | 7.83 | 0.20 | 7.79 | 0.13 | 0.91 | 9.94 | 0.13 | 7.79 | 0.00 | 8.73 | 1.32 | 7.66 | NA | NA | NA | NA | NA | NA | NA | NA | NA | NA | NA | NA | NA | NA | NA | NA | NA | NA | NA | NA | NA | NA | NA | NA | NA | NA | NA | NA | NA | NA | NA | NA | NA | NA | |
| Income Tax Expense Benefit | 38.16 | 45.63 | 77.30 | 79.68 | -29.87 | 65.97 | 85.72 | 74.59 | 17.48 | 12.39 | 27.36 | 15.25 | 4.08 | 19.38 | 6.19 | -554.25 | 15.19 | 21.35 | 7.69 | 10.21 | 0.24 | 14.88 | 5.28 | 91.39 | 5.39 | 8.24 | 5.92 | 13.76 | -1.09 | 14.52 | 6.88 | -0.22 | -2.06 | 11.41 | 6.05 | 8.57 | 6.50 | 5.36 | -8.27 | 2.38 | 28.20 | -27.56 | -261.15 | -8.01 | 9.34 | 8.14 | 22.33 | 0.48 | -4.33 | 4.70 | 3.37 | -143.22 | -54.46 | 5.01 | |
| Income Taxes Paid Net | 148.98 | 42.83 | 42.08 | 19.81 | 85.08 | 68.87 | 69.26 | 10.02 | 98.74 | 19.07 | 18.49 | 10.13 | 23.78 | 11.63 | 9.27 | 16.51 | 7.73 | 10.82 | 6.89 | 38.18 | 12.05 | 11.78 | 6.03 | 19.05 | 12.79 | 17.47 | 9.77 | 9.49 | 13.60 | 8.93 | 4.80 | 5.56 | 7.56 | 5.50 | 10.87 | 11.18 | 4.84 | 5.39 | -8.37 | -1.32 | 6.62 | -0.02 | 6.16 | 2.68 | 5.10 | 4.70 | 5.66 | 4.09 | 5.32 | 3.88 | 8.31 | 14.47 | NA | NA | |
| Other Comprehensive Income Loss Net Of Tax | 18.31 | -22.55 | -3.12 | 4.25 | 30.50 | -40.75 | -33.46 | -14.61 | -5.75 | -5.77 | 5.25 | -9.61 | 11.40 | 1.56 | -9.65 | 3.07 | -11.99 | -1.92 | -1.29 | -2.43 | -9.18 | -19.11 | 12.21 | 6.39 | 4.57 | 7.69 | 2.88 | -16.01 | 0.83 | -2.72 | 5.16 | -5.48 | -6.21 | -4.55 | -8.53 | -6.78 | 3.13 | 4.68 | 3.43 | -5.20 | -11.74 | -6.13 | -2.17 | 0.97 | -3.30 | -2.50 | 0.76 | -0.40 | -1.94 | NA | NA | NA | NA | NA | |
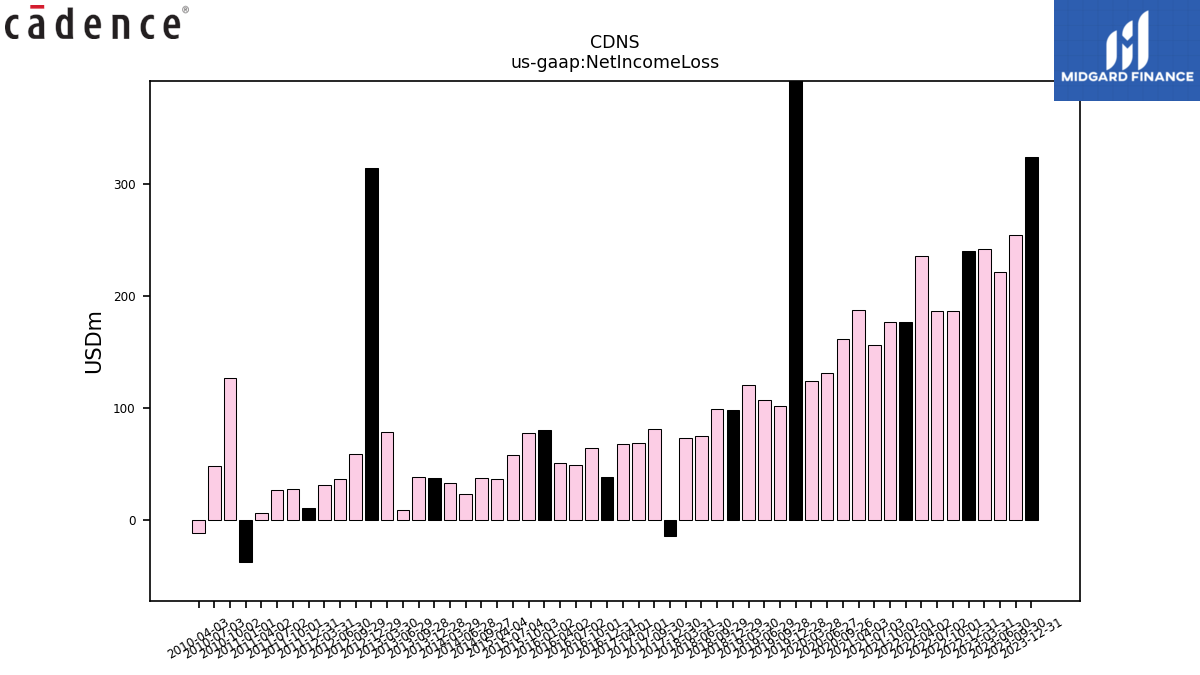
| Net Income Loss | 323.90 | 254.32 | 221.12 | 241.80 | 240.39 | 186.31 | 186.92 | 235.34 | 176.58 | 176.31 | 155.90 | 187.17 | 161.63 | 131.29 | 123.99 | 659.67 | 101.51 | 107.23 | 120.56 | 98.42 | 99.32 | 75.15 | 72.89 | -14.44 | 81.16 | 69.13 | 68.26 | 38.48 | 64.71 | 49.34 | 50.56 | 80.37 | 77.62 | 58.16 | 36.26 | 37.53 | 23.26 | 33.07 | 37.70 | 38.50 | 9.43 | 78.61 | 313.87 | 58.58 | 36.39 | 31.10 | 10.89 | 28.11 | 26.91 | 6.32 | -37.04 | 126.75 | 48.61 | -11.79 | |
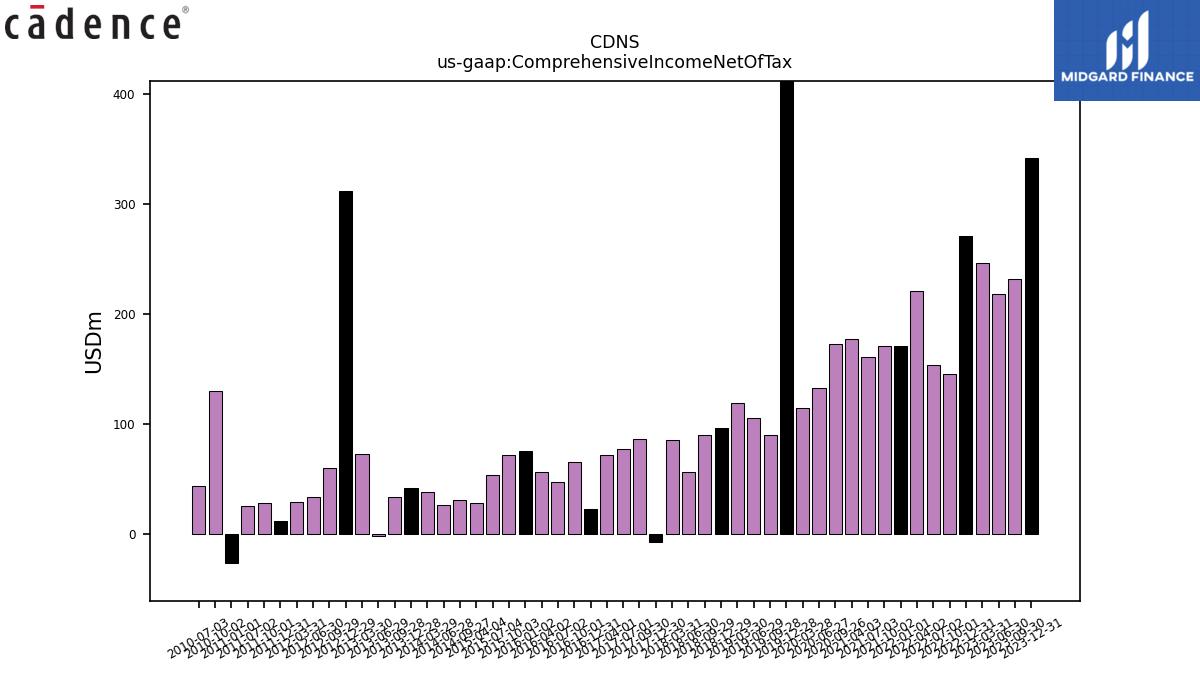
| Comprehensive Income Net Of Tax | 342.21 | 231.77 | 218.00 | 246.05 | 270.89 | 145.55 | 153.46 | 220.73 | 170.83 | 170.54 | 161.15 | 177.56 | 173.03 | 132.85 | 114.34 | 662.74 | 89.52 | 105.31 | 119.26 | 96.00 | 90.14 | 56.04 | 85.09 | -8.05 | 85.72 | 76.81 | 71.14 | 22.47 | 65.55 | 46.62 | 55.72 | 74.90 | 71.42 | 53.61 | 27.73 | 30.76 | 26.39 | 37.75 | 41.13 | 33.30 | -2.31 | 72.48 | 311.70 | 59.55 | 33.09 | 28.61 | 11.65 | 27.71 | 24.97 | NA | -26.78 | 129.39 | 43.22 | NA |
| 2023-12-31 | 2023-09-30 | 2023-06-30 | 2023-03-31 | 2022-12-31 | 2022-10-01 | 2022-07-02 | 2022-04-02 | 2022-01-01 | 2021-10-02 | 2021-07-03 | 2021-04-03 | 2020-09-26 | 2020-06-27 | 2020-03-28 | 2019-12-28 | 2019-09-28 | 2019-06-29 | 2019-03-30 | 2018-12-29 | 2018-09-29 | 2018-06-30 | 2018-03-31 | 2017-12-30 | 2017-09-30 | 2017-07-01 | 2017-04-01 | 2016-12-31 | 2016-10-01 | 2016-07-02 | 2016-04-02 | 2016-01-02 | 2015-10-03 | 2015-07-04 | 2015-04-04 | 2014-09-27 | 2014-06-28 | 2014-03-29 | 2013-12-28 | 2013-09-28 | 2013-06-29 | 2013-03-30 | 2012-12-29 | 2012-09-29 | 2012-06-30 | 2012-03-31 | 2011-12-31 | 2011-10-01 | 2011-07-02 | 2011-04-02 | 2011-01-01 | 2010-10-02 | 2010-07-03 | 2010-04-03 | ||
|---|---|---|---|---|---|---|---|---|---|---|---|---|---|---|---|---|---|---|---|---|---|---|---|---|---|---|---|---|---|---|---|---|---|---|---|---|---|---|---|---|---|---|---|---|---|---|---|---|---|---|---|---|---|---|---|
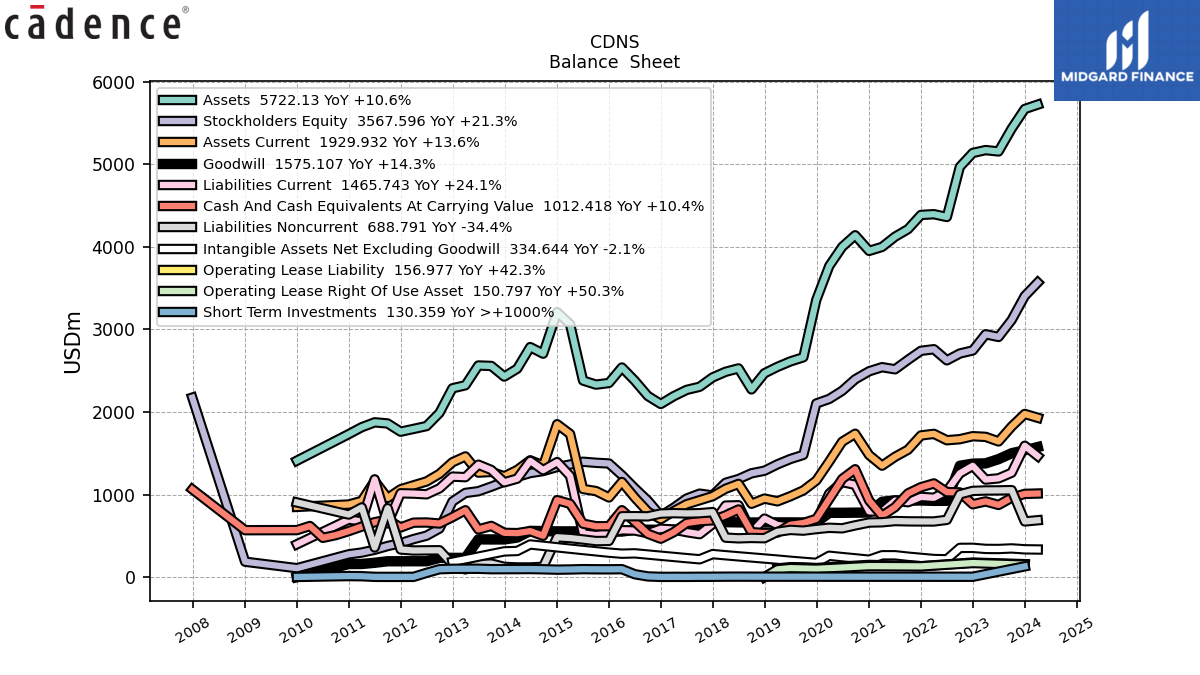
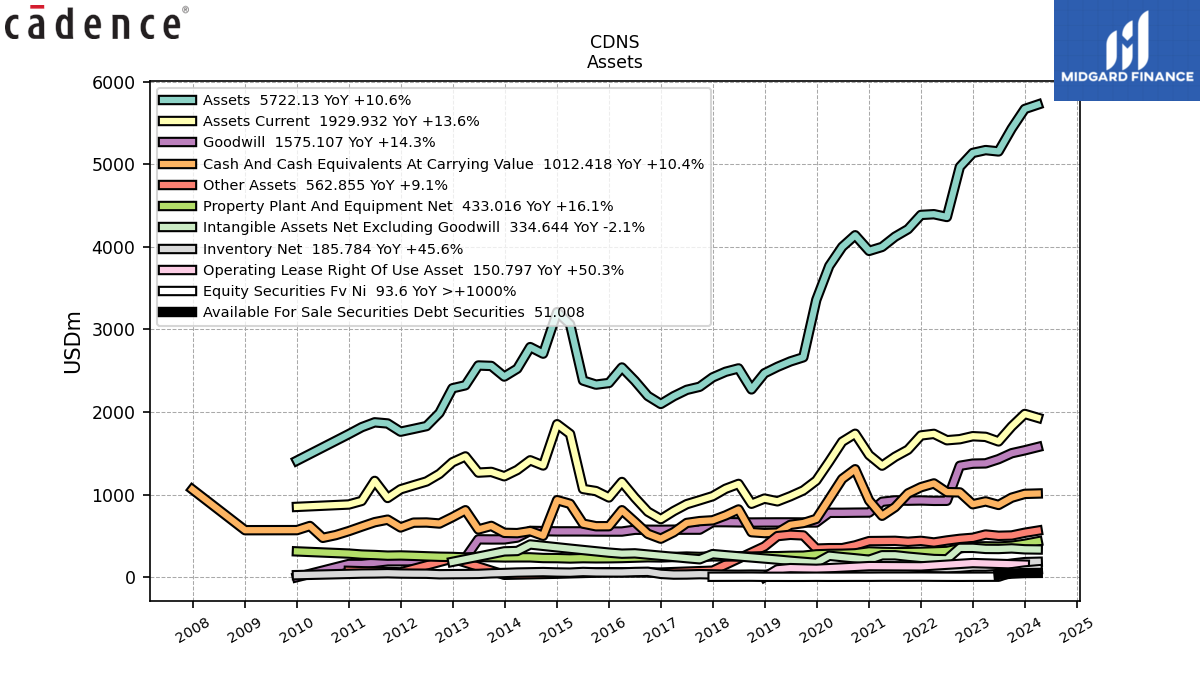
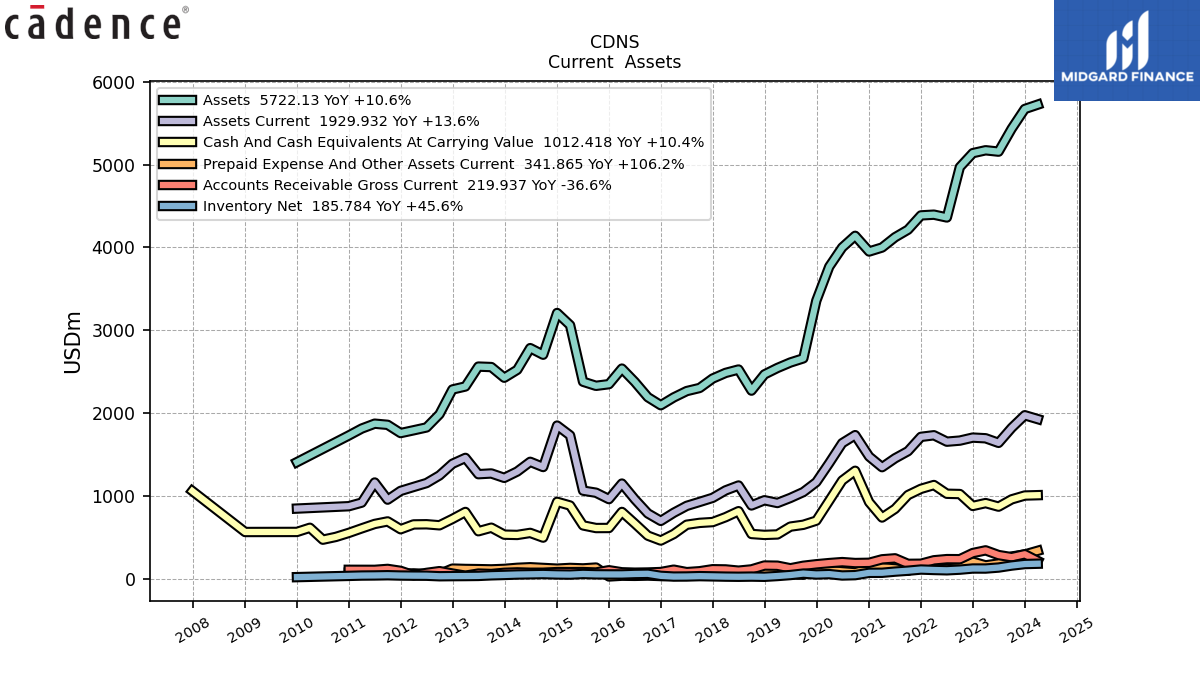
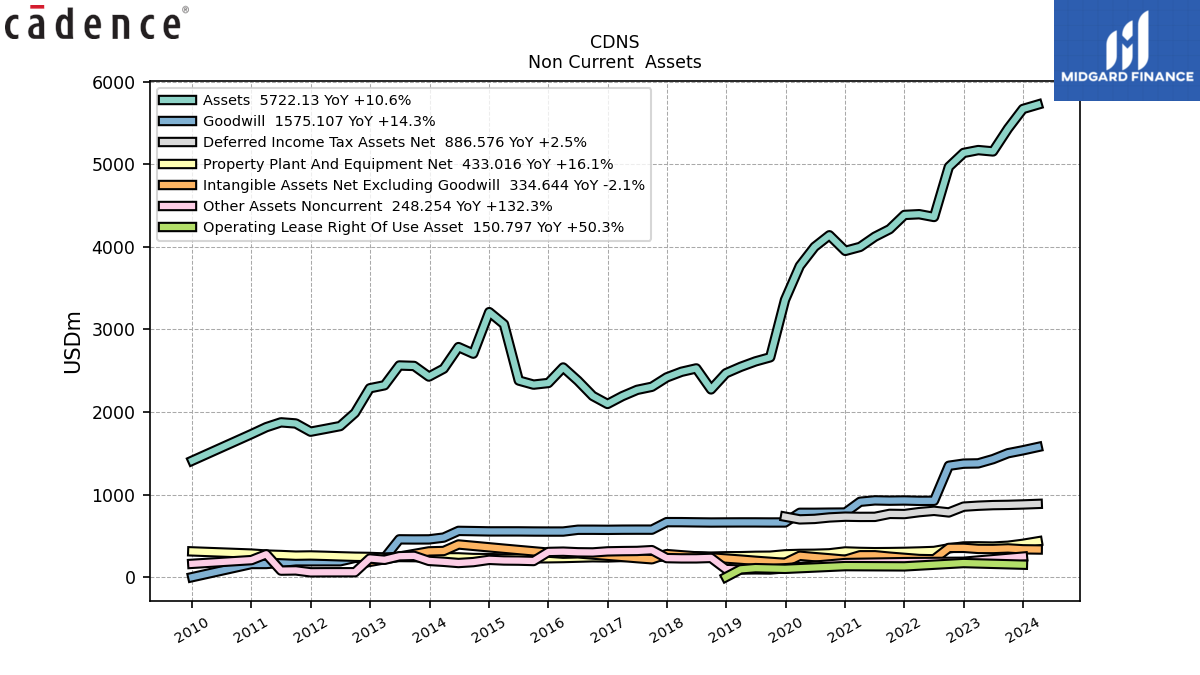
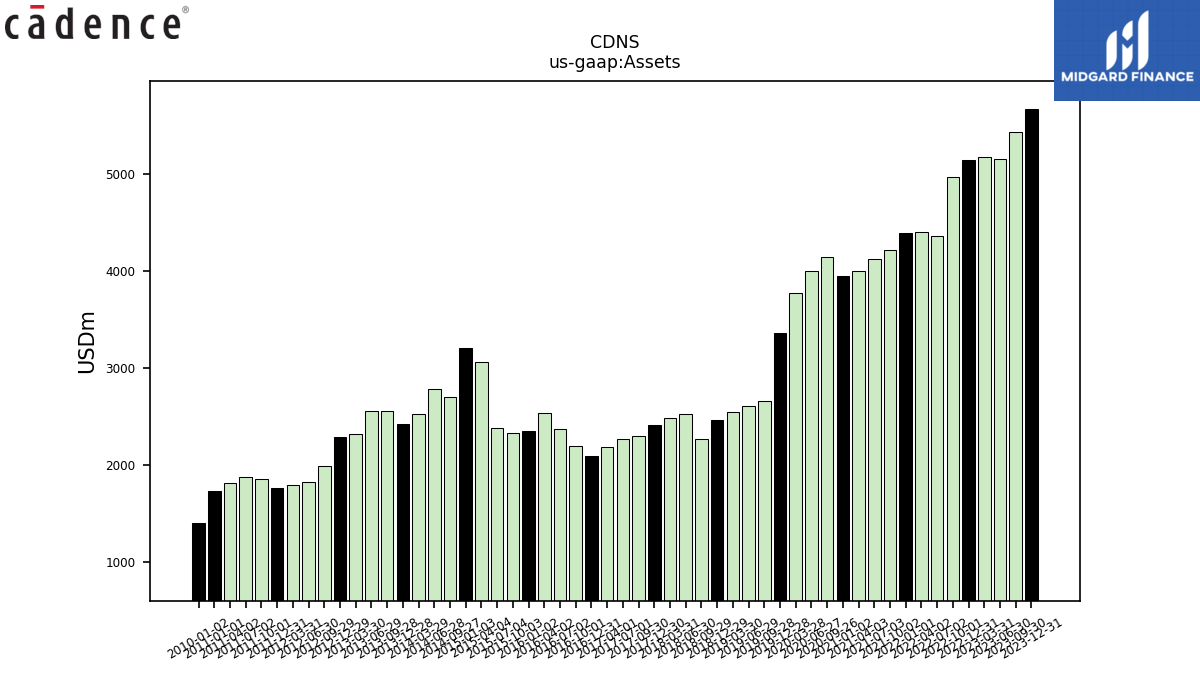
| Assets | 5669.49 | 5431.38 | 5155.12 | 5171.62 | 5137.07 | 4968.09 | 4361.27 | 4395.07 | 4386.30 | 4213.88 | 4122.55 | 3998.96 | 4140.15 | 3999.50 | 3767.97 | 3357.22 | 2662.20 | 2612.32 | 2546.31 | 2468.65 | 2273.21 | 2527.86 | 2486.67 | 2418.71 | 2305.23 | 2267.70 | 2191.20 | 2096.91 | 2194.09 | 2377.87 | 2539.02 | 2351.01 | 2331.14 | 2380.65 | 3062.57 | 2705.94 | 2785.83 | 2524.22 | 2428.60 | 2557.39 | 2563.09 | 2323.26 | 2287.00 | 1988.51 | 1829.26 | 1794.83 | 1761.27 | 1860.68 | 1874.62 | 1815.70 | 1732.12 | NA | NA | NA | |
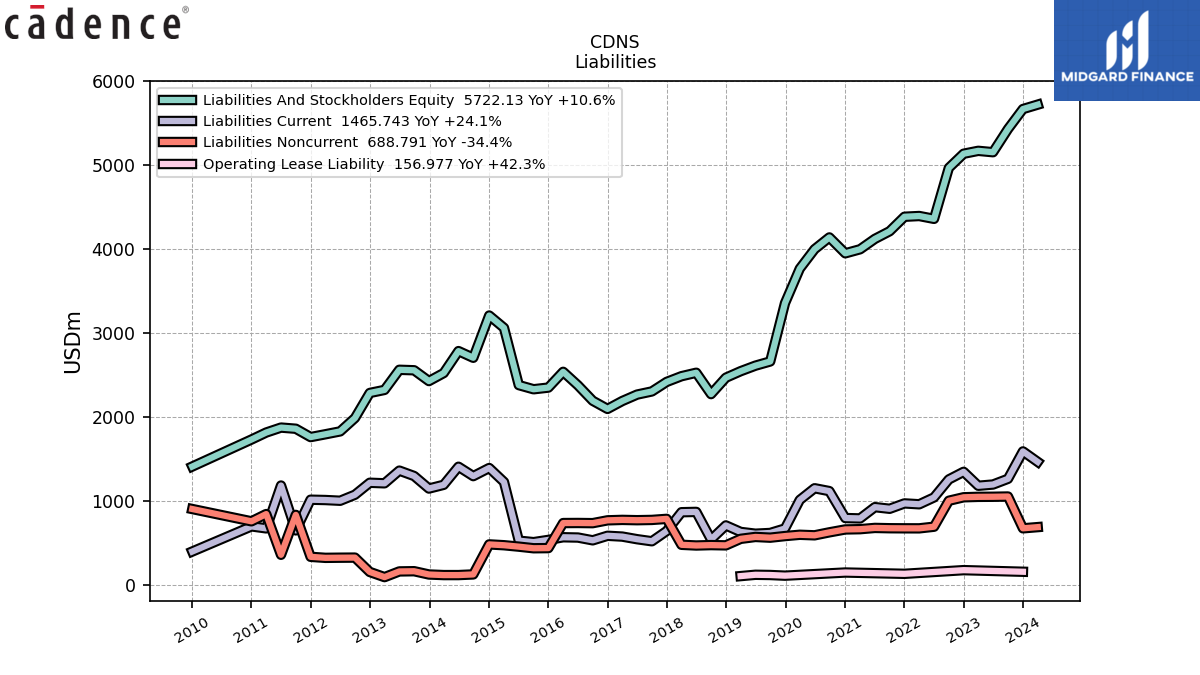
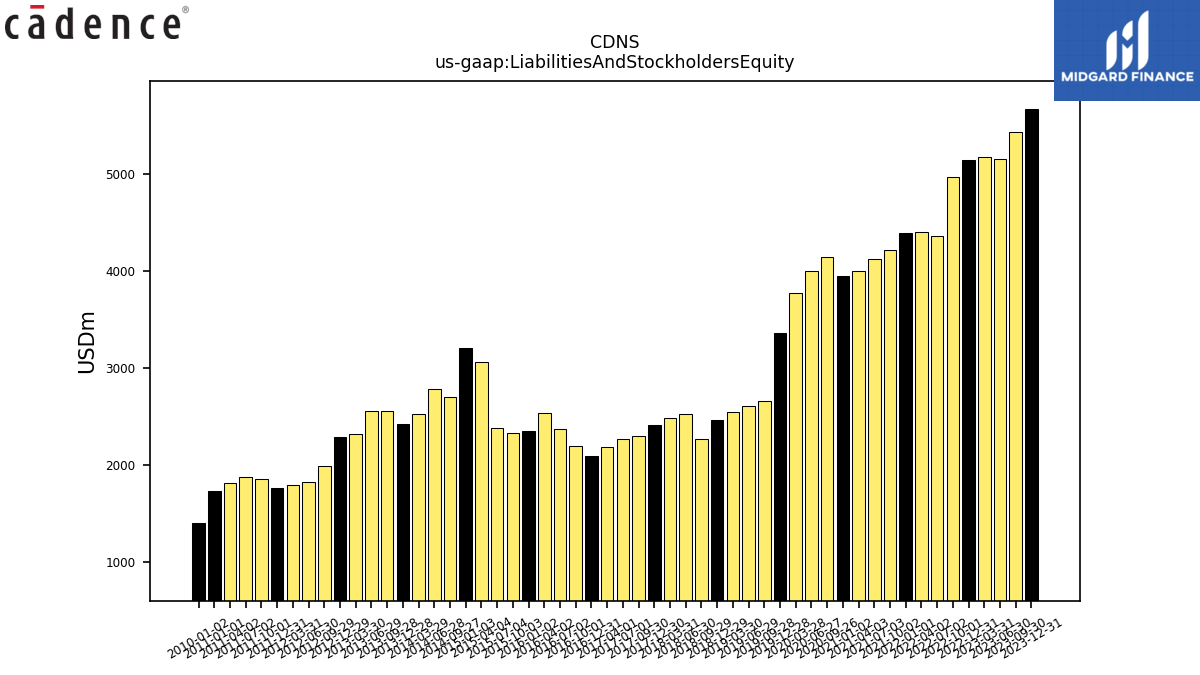
| Liabilities And Stockholders Equity | 5669.49 | 5431.38 | 5155.12 | 5171.62 | 5137.07 | 4968.09 | 4361.27 | 4395.07 | 4386.30 | 4213.88 | 4122.55 | 3998.96 | 4140.15 | 3999.50 | 3767.97 | 3357.22 | 2662.20 | 2612.32 | 2546.31 | 2468.65 | 2273.21 | 2527.86 | 2486.67 | 2418.71 | 2305.23 | 2267.70 | 2191.20 | 2096.91 | 2194.09 | 2377.87 | 2539.02 | 2351.01 | 2331.14 | 2380.65 | 3062.57 | 2705.94 | 2785.83 | 2524.22 | 2428.60 | 2557.39 | 2563.09 | 2323.26 | 2287.00 | 1988.51 | 1829.26 | 1794.83 | 1761.27 | 1860.68 | 1874.62 | 1815.70 | 1732.12 | NA | NA | NA | |
| Stockholders Equity | 3404.27 | 3113.89 | 2908.45 | 2940.88 | 2745.11 | 2708.13 | 2625.23 | 2760.18 | 2740.68 | 2631.26 | 2516.74 | 2542.43 | 2395.72 | 2256.63 | 2157.99 | 2102.89 | 1480.26 | 1430.55 | 1365.84 | 1288.40 | 1257.42 | 1187.99 | 1142.30 | 989.20 | 1010.74 | 951.79 | 840.59 | 741.77 | 926.80 | 1075.39 | 1234.05 | 1376.12 | 1384.56 | 1397.21 | 1363.19 | 1284.73 | 1260.48 | 1214.20 | 1156.11 | 1096.21 | 1040.26 | 1019.67 | 915.17 | 588.39 | 502.01 | 460.75 | 411.13 | 376.60 | 331.32 | 297.71 | 276.65 | NA | NA | NA |
| 2023-12-31 | 2023-09-30 | 2023-06-30 | 2023-03-31 | 2022-12-31 | 2022-10-01 | 2022-07-02 | 2022-04-02 | 2022-01-01 | 2021-10-02 | 2021-07-03 | 2021-04-03 | 2020-09-26 | 2020-06-27 | 2020-03-28 | 2019-12-28 | 2019-09-28 | 2019-06-29 | 2019-03-30 | 2018-12-29 | 2018-09-29 | 2018-06-30 | 2018-03-31 | 2017-12-30 | 2017-09-30 | 2017-07-01 | 2017-04-01 | 2016-12-31 | 2016-10-01 | 2016-07-02 | 2016-04-02 | 2016-01-02 | 2015-10-03 | 2015-07-04 | 2015-04-04 | 2014-09-27 | 2014-06-28 | 2014-03-29 | 2013-12-28 | 2013-09-28 | 2013-06-29 | 2013-03-30 | 2012-12-29 | 2012-09-29 | 2012-06-30 | 2012-03-31 | 2011-12-31 | 2011-10-01 | 2011-07-02 | 2011-04-02 | 2011-01-01 | 2010-10-02 | 2010-07-03 | 2010-04-03 | ||
|---|---|---|---|---|---|---|---|---|---|---|---|---|---|---|---|---|---|---|---|---|---|---|---|---|---|---|---|---|---|---|---|---|---|---|---|---|---|---|---|---|---|---|---|---|---|---|---|---|---|---|---|---|---|---|---|
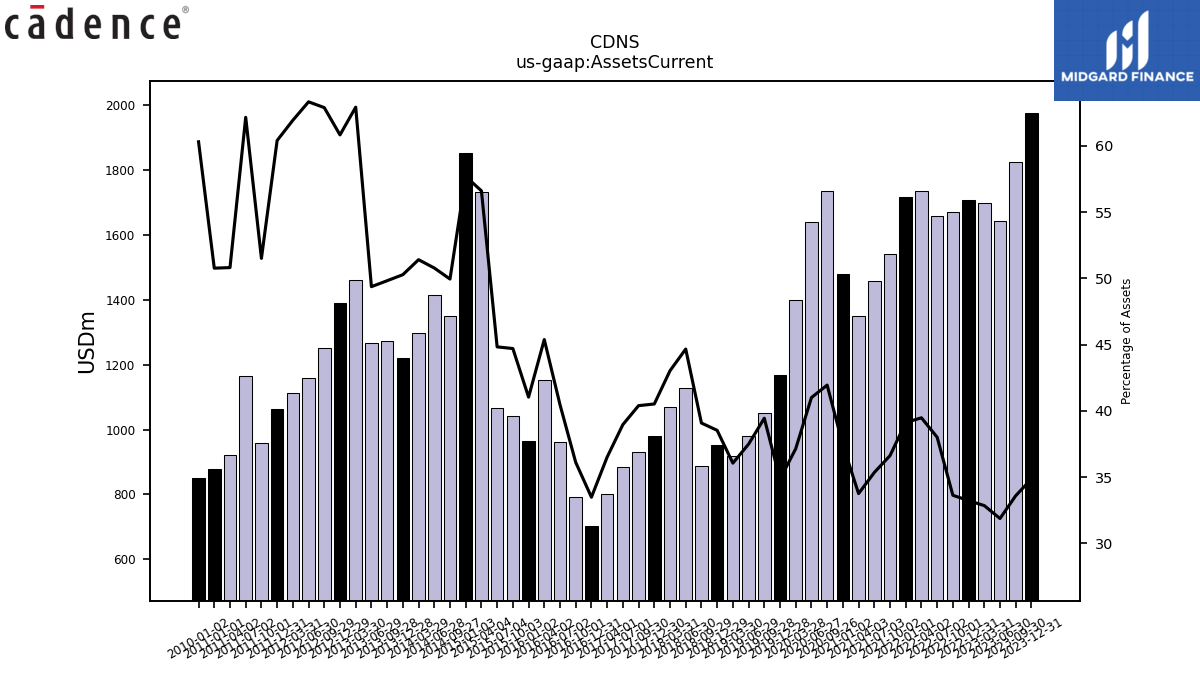
| Assets Current | 1976.22 | 1824.46 | 1643.05 | 1698.54 | 1706.77 | 1670.48 | 1657.62 | 1734.90 | 1715.77 | 1543.01 | 1457.07 | 1349.73 | 1736.48 | 1639.78 | 1399.51 | 1169.34 | 1049.95 | 979.24 | 917.95 | 951.09 | 888.38 | 1129.05 | 1069.94 | 979.99 | 931.11 | 883.45 | 800.00 | 702.03 | 792.29 | 962.18 | 1152.24 | 964.76 | 1042.08 | 1067.23 | 1733.64 | 1351.61 | 1414.72 | 1297.72 | 1221.09 | 1274.16 | 1265.50 | 1461.91 | 1391.23 | 1250.61 | 1158.45 | 1111.64 | 1063.98 | 958.46 | 1165.26 | 922.64 | 879.41 | NA | NA | NA | |
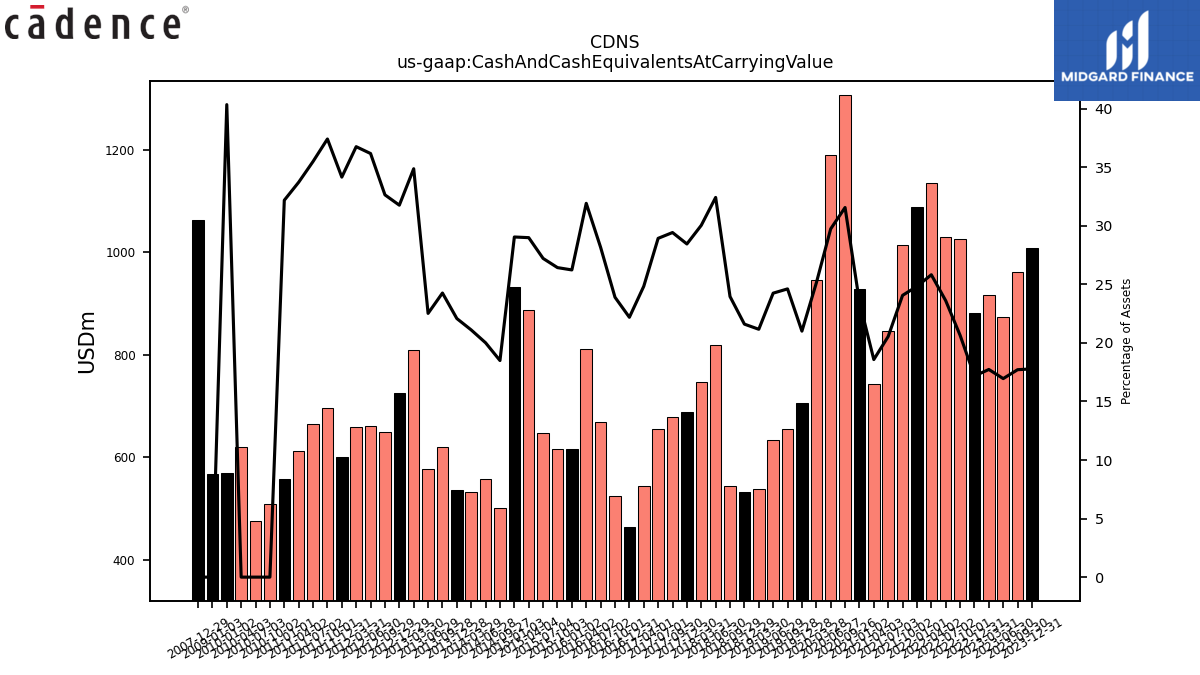
| Cash And Cash Equivalents At Carrying Value | 1008.15 | 961.98 | 873.92 | 916.96 | 882.33 | 1026.05 | 1029.54 | 1134.75 | 1088.94 | 1013.82 | 847.16 | 742.98 | 1306.56 | 1189.19 | 946.28 | 705.21 | 655.22 | 633.41 | 538.90 | 533.30 | 544.59 | 819.54 | 746.97 | 688.09 | 678.28 | 656.00 | 544.13 | 465.23 | 524.33 | 669.57 | 810.40 | 616.69 | 616.09 | 647.85 | 887.74 | 500.48 | 557.42 | 532.76 | 536.26 | 620.40 | 577.23 | 810.15 | 726.36 | 649.10 | 661.66 | 659.69 | 601.60 | 696.10 | 665.32 | 612.21 | 557.41 | 509.04 | 475.60 | 619.30 | |
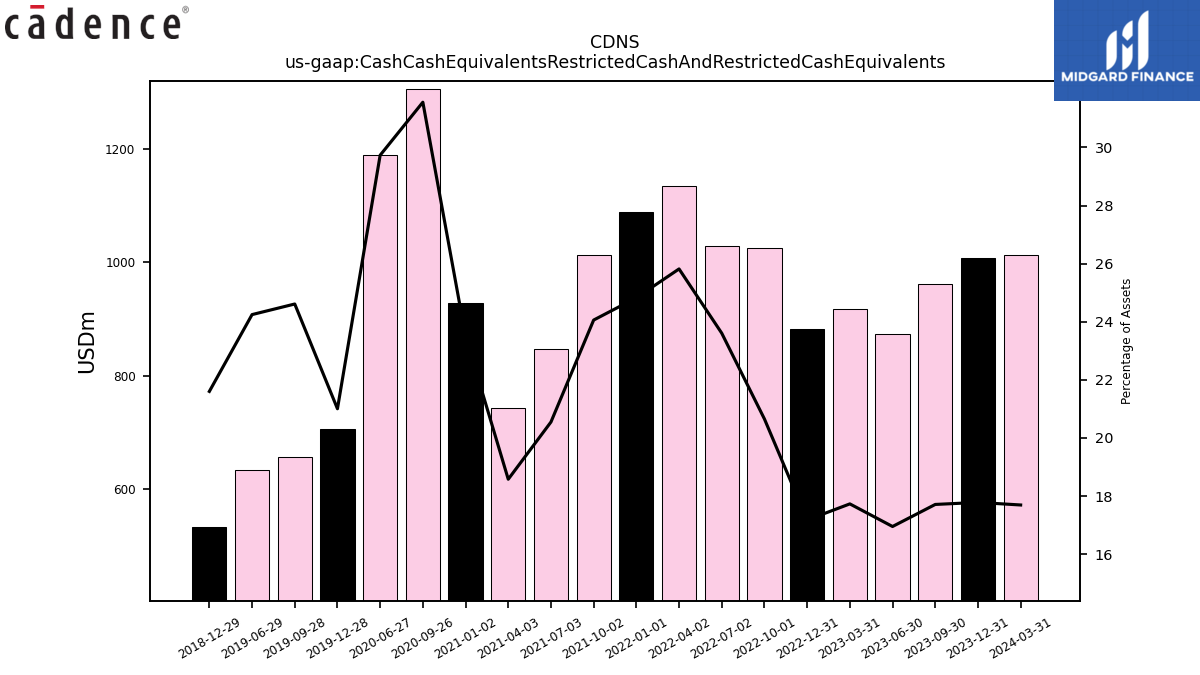
| Cash Cash Equivalents Restricted Cash And Restricted Cash Equivalents | 1008.15 | 961.98 | 873.92 | 916.96 | 882.33 | 1026.05 | 1029.54 | 1134.75 | 1088.94 | 1013.82 | 847.16 | 742.98 | 1306.56 | 1189.19 | NA | 705.21 | 655.22 | 633.41 | NA | 533.30 | NA | NA | NA | NA | NA | NA | NA | NA | NA | NA | NA | NA | NA | NA | NA | NA | NA | NA | NA | NA | NA | NA | NA | NA | NA | NA | NA | NA | NA | NA | NA | NA | NA | NA | |
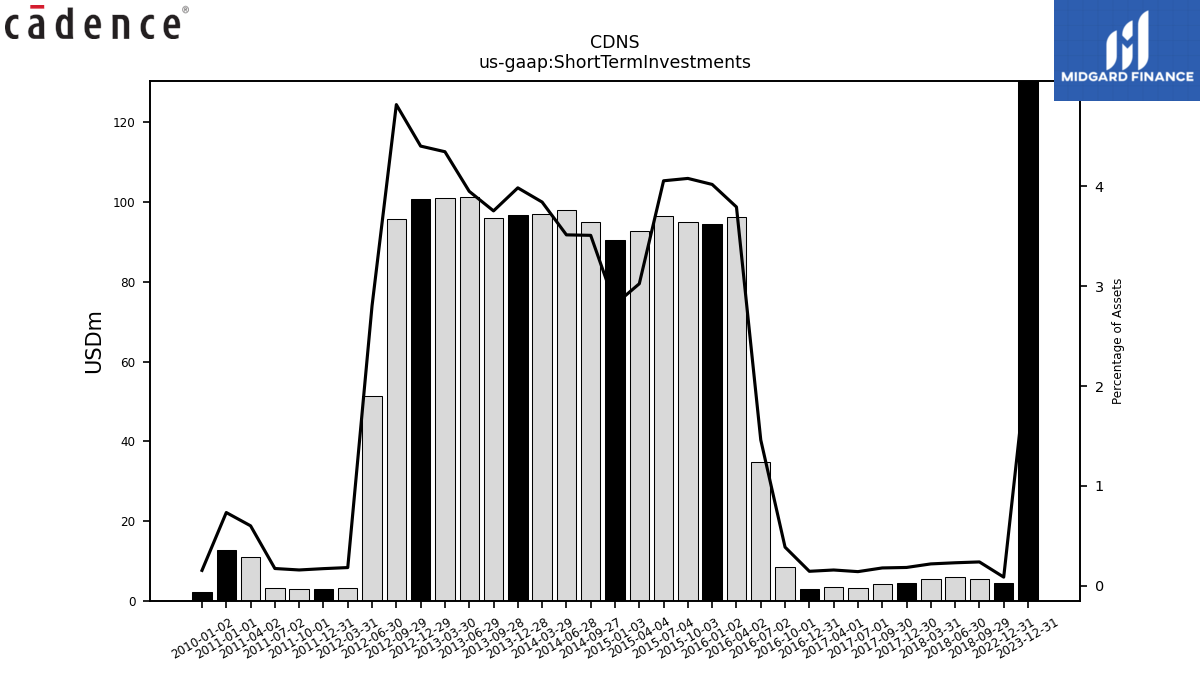
| Short Term Investments | 130.36 | NA | NA | NA | 4.49 | NA | NA | NA | NA | NA | NA | NA | NA | NA | NA | NA | NA | NA | NA | NA | 5.45 | 5.84 | 5.47 | 4.46 | 4.13 | 3.23 | 3.48 | 3.06 | 8.50 | 34.74 | 96.32 | 94.50 | 95.10 | 96.56 | 92.64 | 94.97 | 97.91 | 97.01 | 96.79 | 96.02 | 101.25 | 100.99 | 100.70 | 95.82 | 51.30 | 3.29 | 3.04 | 2.96 | 3.25 | 10.92 | 12.71 | NA | NA | NA | |
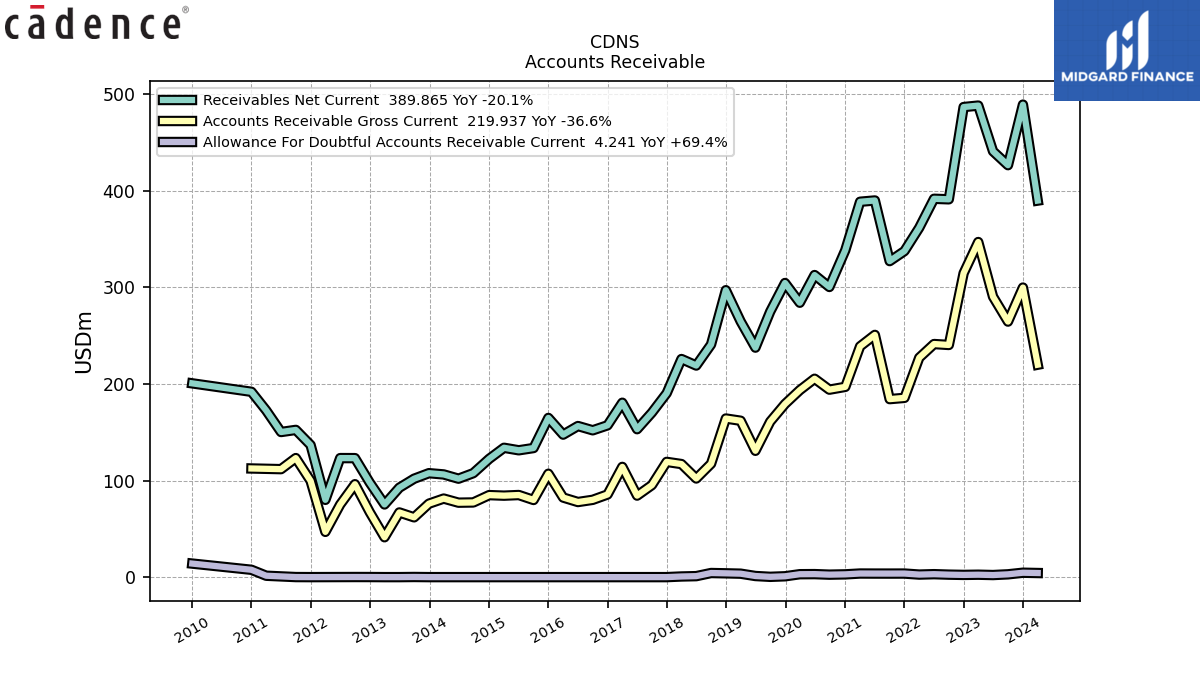
| Receivables Net Current | 489.22 | 426.50 | 440.92 | 488.24 | 486.71 | 391.18 | 391.74 | 361.79 | 337.60 | 327.19 | 389.99 | 388.67 | 300.41 | 312.76 | 284.09 | 304.55 | 274.91 | 237.61 | 264.77 | 297.08 | 240.84 | 219.07 | 225.82 | 190.43 | 170.31 | 153.15 | 180.57 | 157.17 | 152.03 | 156.44 | 147.53 | 164.85 | 133.66 | 131.32 | 133.92 | 107.63 | 101.92 | 106.32 | 107.62 | 101.90 | 92.58 | 75.25 | 97.82 | 123.21 | 123.24 | 80.00 | 136.77 | 152.43 | 150.24 | 172.54 | 191.89 | NA | NA | NA | |
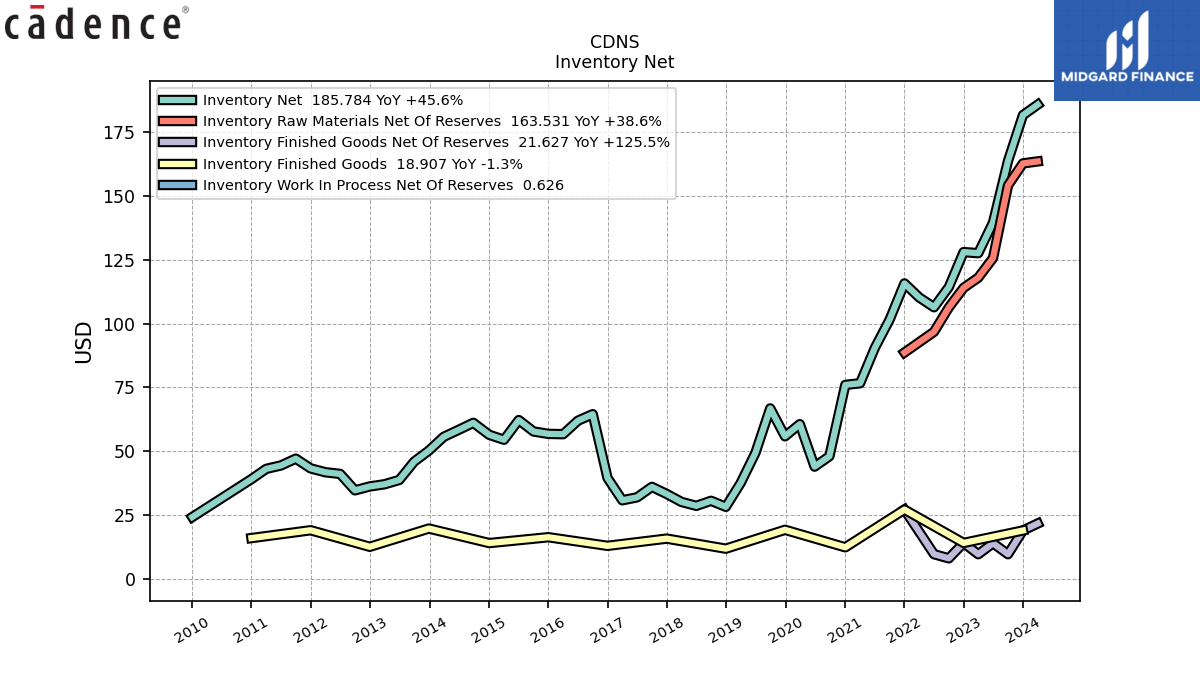
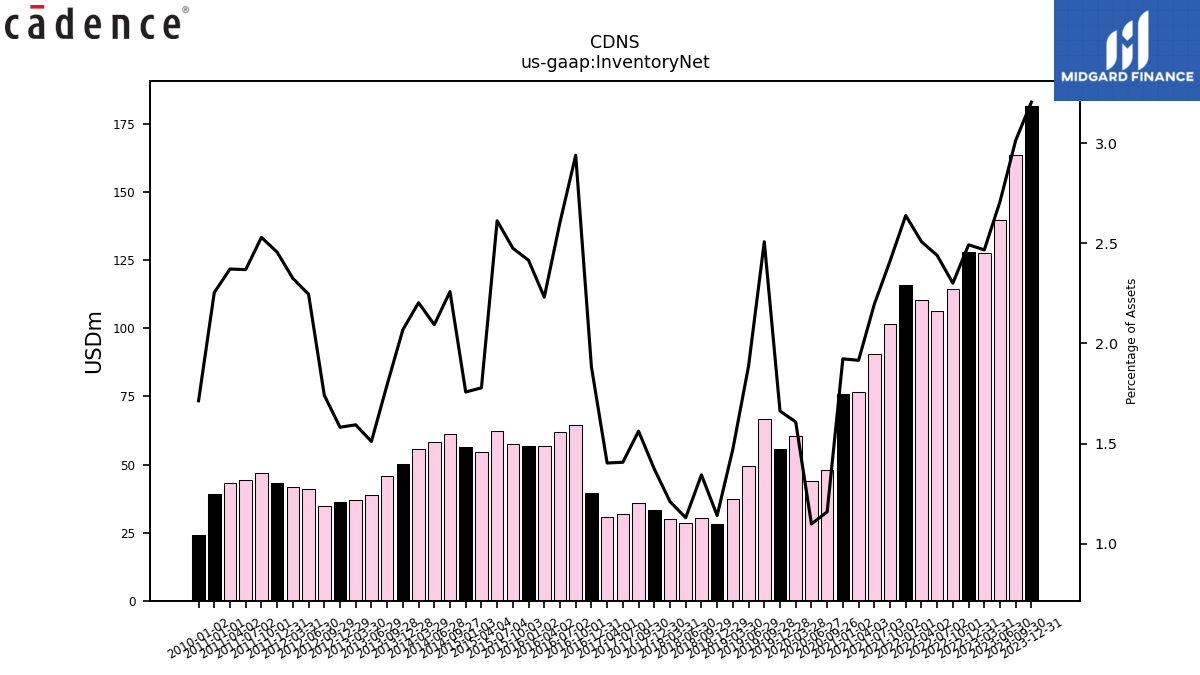
| Inventory Net | 181.66 | 163.69 | 139.58 | 127.57 | 128.00 | 114.28 | 106.37 | 110.21 | 115.72 | 101.58 | 90.48 | 76.59 | 47.98 | 43.92 | 60.58 | 55.80 | 66.75 | 49.30 | 37.48 | 28.16 | 30.54 | 28.56 | 30.09 | 33.21 | 36.00 | 31.89 | 30.73 | 39.48 | 64.48 | 61.93 | 56.63 | 56.76 | 57.69 | 62.17 | 54.45 | 61.10 | 58.31 | 55.60 | 50.22 | 45.88 | 38.70 | 37.02 | 36.16 | 34.63 | 41.07 | 41.72 | 43.24 | 47.06 | 44.39 | 43.05 | 39.03 | NA | NA | NA | |
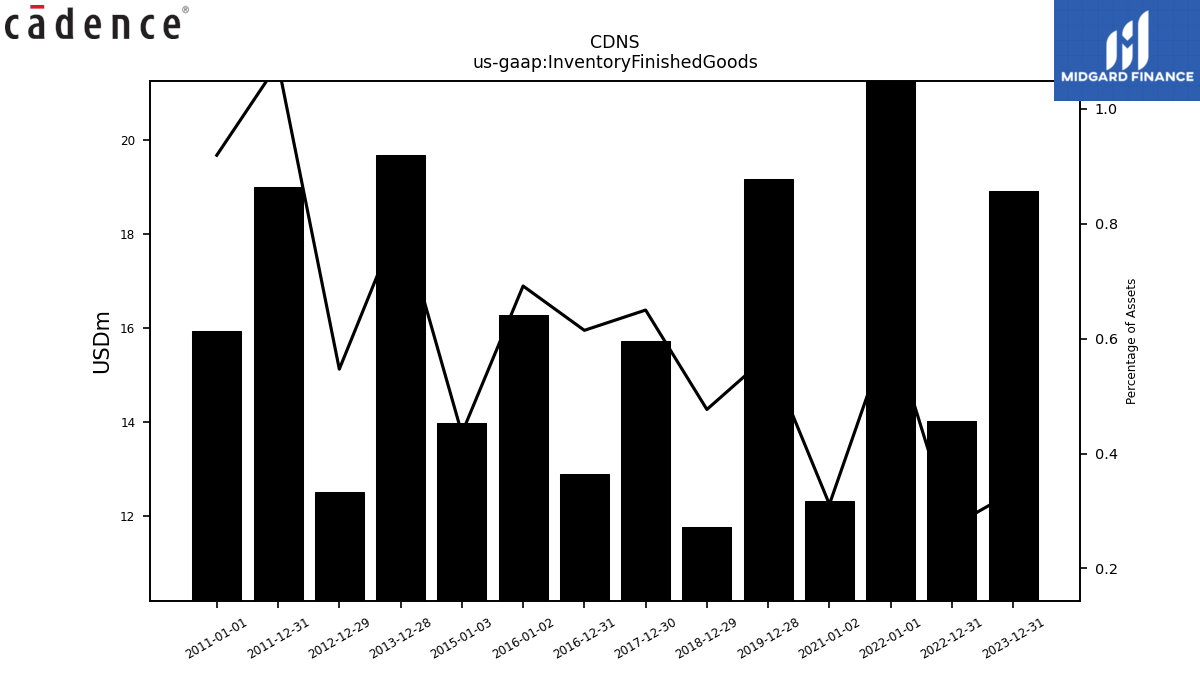
| Inventory Finished Goods | 18.91 | NA | NA | NA | 14.02 | NA | NA | NA | 27.09 | NA | NA | NA | NA | NA | NA | 19.16 | NA | NA | NA | 11.77 | NA | NA | NA | 15.72 | NA | NA | NA | 12.89 | NA | NA | NA | 16.26 | NA | NA | NA | NA | NA | NA | 19.67 | NA | NA | NA | 12.51 | NA | NA | NA | 19.00 | NA | NA | NA | 15.93 | NA | NA | NA | |
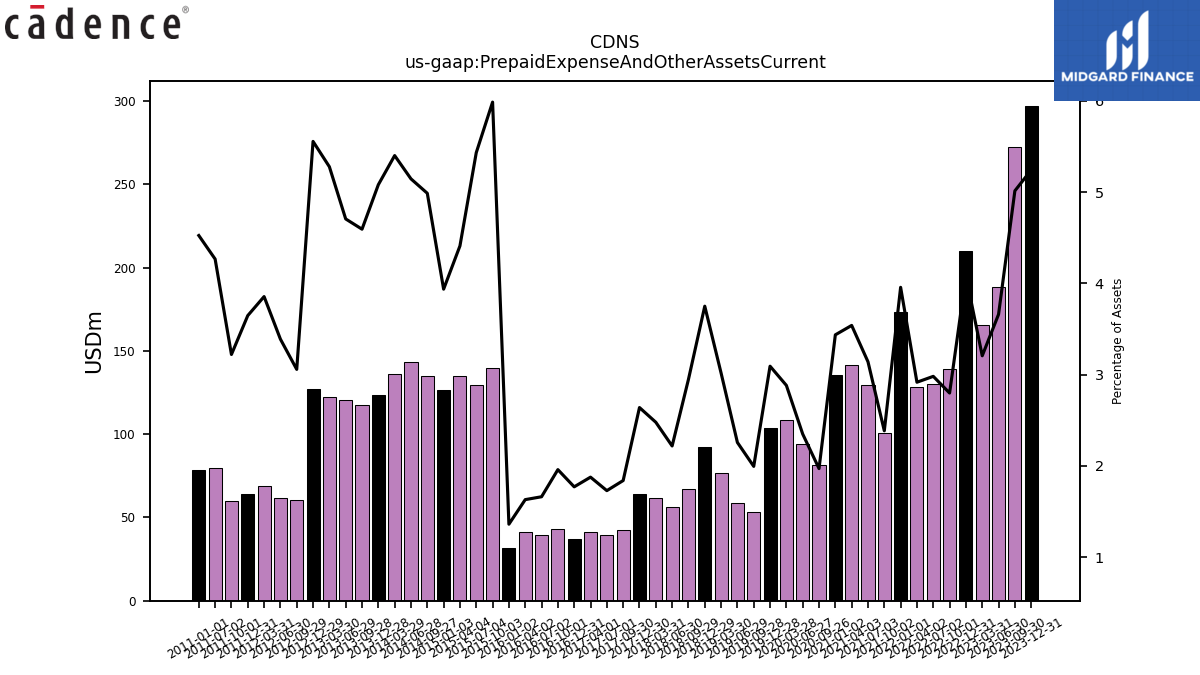
| Prepaid Expense And Other Assets Current | 297.18 | 272.28 | 188.63 | 165.78 | 209.73 | 138.97 | 129.97 | 128.14 | 173.51 | 100.43 | 129.44 | 141.49 | 81.53 | 93.92 | 108.55 | 103.78 | 53.07 | 58.92 | 76.80 | 92.55 | 66.98 | 56.04 | 61.60 | 63.81 | 42.37 | 39.17 | 41.09 | 37.10 | 42.95 | 39.48 | 41.36 | 31.97 | 139.53 | 129.32 | 135.05 | 134.93 | 143.31 | 136.30 | 123.38 | 117.46 | 120.60 | 122.60 | 127.04 | 60.78 | 61.98 | 69.18 | 64.22 | 59.91 | 79.97 | NA | 78.36 | NA | NA | NA | |
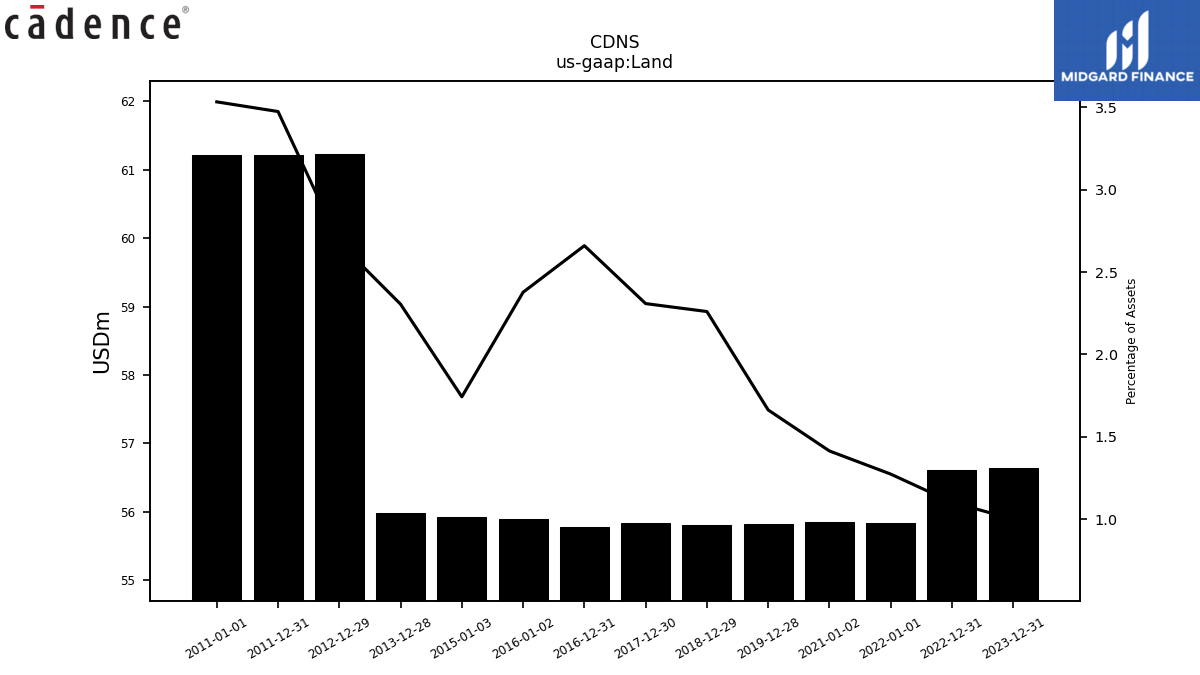
| Land | 56.64 | NA | NA | NA | 56.61 | NA | NA | NA | 55.84 | NA | NA | NA | NA | NA | NA | 55.82 | NA | NA | NA | 55.80 | NA | NA | NA | 55.84 | NA | NA | NA | 55.78 | NA | NA | NA | 55.90 | NA | NA | NA | NA | NA | NA | 55.98 | NA | NA | NA | 61.24 | NA | NA | NA | 61.21 | NA | NA | NA | 61.21 | NA | NA | NA | |
| Equity Securities Fv Ni | 80.60 | 58.40 | 5.14 | 4.75 | 4.49 | 3.96 | 4.37 | 5.08 | 5.96 | 5.57 | 5.58 | 5.47 | 4.57 | 4.16 | 3.87 | 4.60 | 3.77 | 3.62 | 3.97 | 3.89 | 5.45 | NA | NA | 4.46 | NA | NA | NA | NA | NA | NA | NA | NA | NA | NA | NA | NA | NA | NA | NA | NA | NA | NA | NA | NA | NA | NA | NA | NA | NA | NA | NA | NA | NA | NA | |
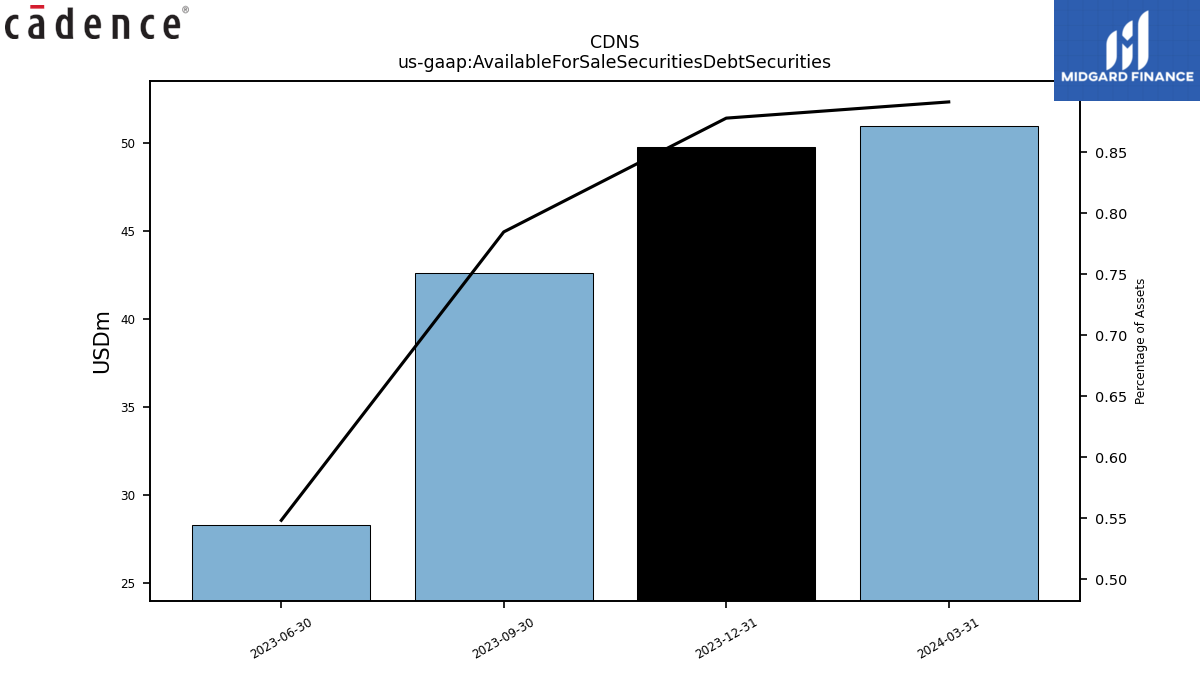
| Available For Sale Securities Debt Securities | 49.78 | 42.63 | 28.27 | NA | NA | NA | NA | NA | NA | NA | NA | NA | NA | NA | NA | NA | NA | NA | NA | NA | NA | NA | NA | NA | NA | NA | NA | NA | NA | NA | NA | NA | NA | NA | NA | NA | NA | NA | NA | NA | NA | NA | NA | NA | NA | NA | NA | NA | NA | NA | NA | NA | NA | NA |
| 2023-12-31 | 2023-09-30 | 2023-06-30 | 2023-03-31 | 2022-12-31 | 2022-10-01 | 2022-07-02 | 2022-04-02 | 2022-01-01 | 2021-10-02 | 2021-07-03 | 2021-04-03 | 2020-09-26 | 2020-06-27 | 2020-03-28 | 2019-12-28 | 2019-09-28 | 2019-06-29 | 2019-03-30 | 2018-12-29 | 2018-09-29 | 2018-06-30 | 2018-03-31 | 2017-12-30 | 2017-09-30 | 2017-07-01 | 2017-04-01 | 2016-12-31 | 2016-10-01 | 2016-07-02 | 2016-04-02 | 2016-01-02 | 2015-10-03 | 2015-07-04 | 2015-04-04 | 2014-09-27 | 2014-06-28 | 2014-03-29 | 2013-12-28 | 2013-09-28 | 2013-06-29 | 2013-03-30 | 2012-12-29 | 2012-09-29 | 2012-06-30 | 2012-03-31 | 2011-12-31 | 2011-10-01 | 2011-07-02 | 2011-04-02 | 2011-01-01 | 2010-10-02 | 2010-07-03 | 2010-04-03 | ||
|---|---|---|---|---|---|---|---|---|---|---|---|---|---|---|---|---|---|---|---|---|---|---|---|---|---|---|---|---|---|---|---|---|---|---|---|---|---|---|---|---|---|---|---|---|---|---|---|---|---|---|---|---|---|---|---|
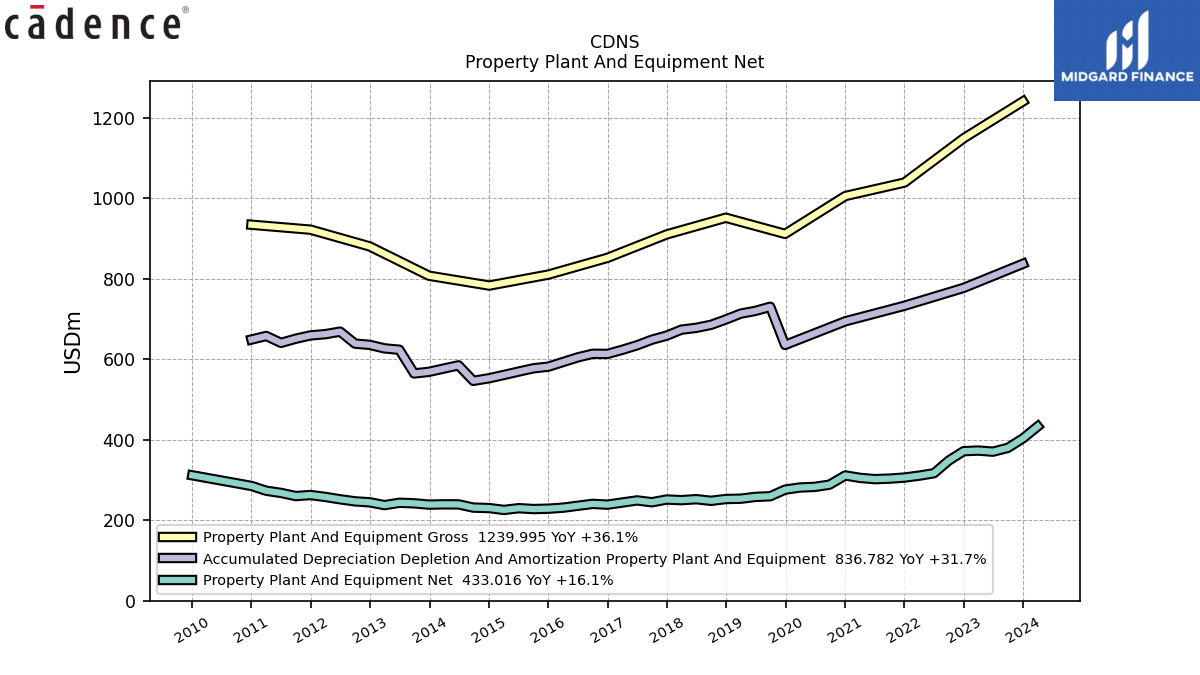
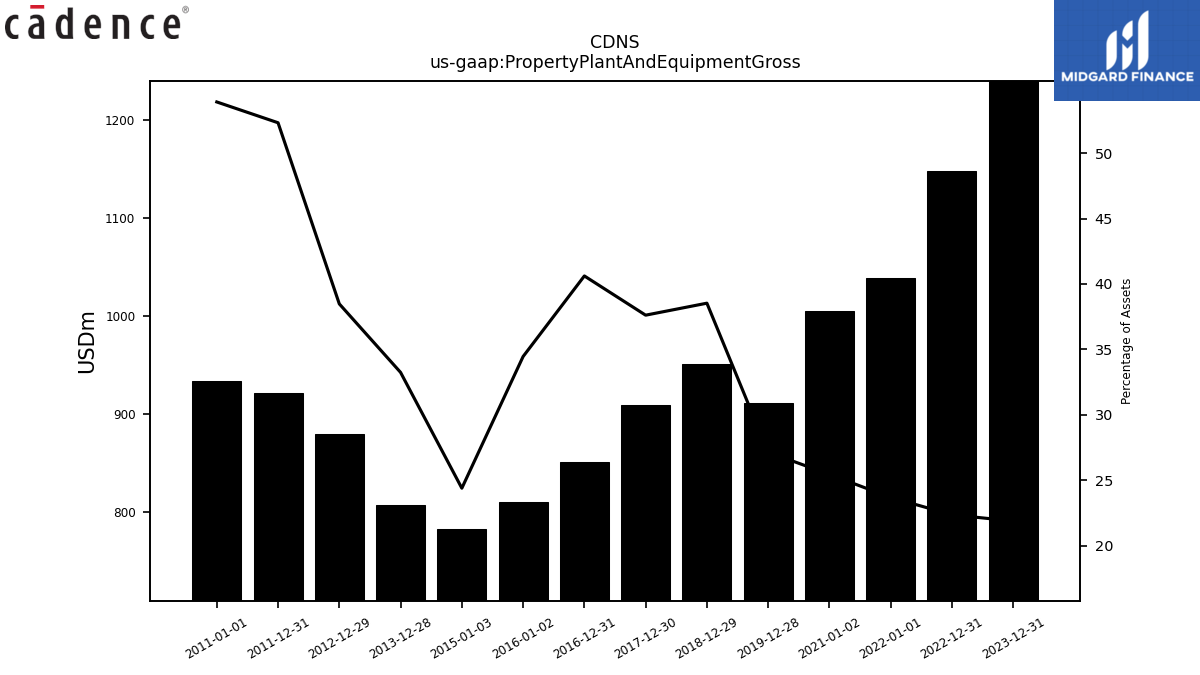
| Property Plant And Equipment Gross | 1239.99 | NA | NA | NA | 1148.39 | NA | NA | NA | 1038.48 | NA | NA | NA | NA | NA | NA | 911.03 | NA | NA | NA | 951.12 | NA | NA | NA | 909.72 | NA | NA | NA | 851.57 | NA | NA | NA | 809.94 | NA | NA | NA | NA | NA | NA | 807.21 | NA | NA | NA | 879.89 | NA | NA | NA | 921.51 | NA | NA | NA | 933.79 | NA | NA | NA | |
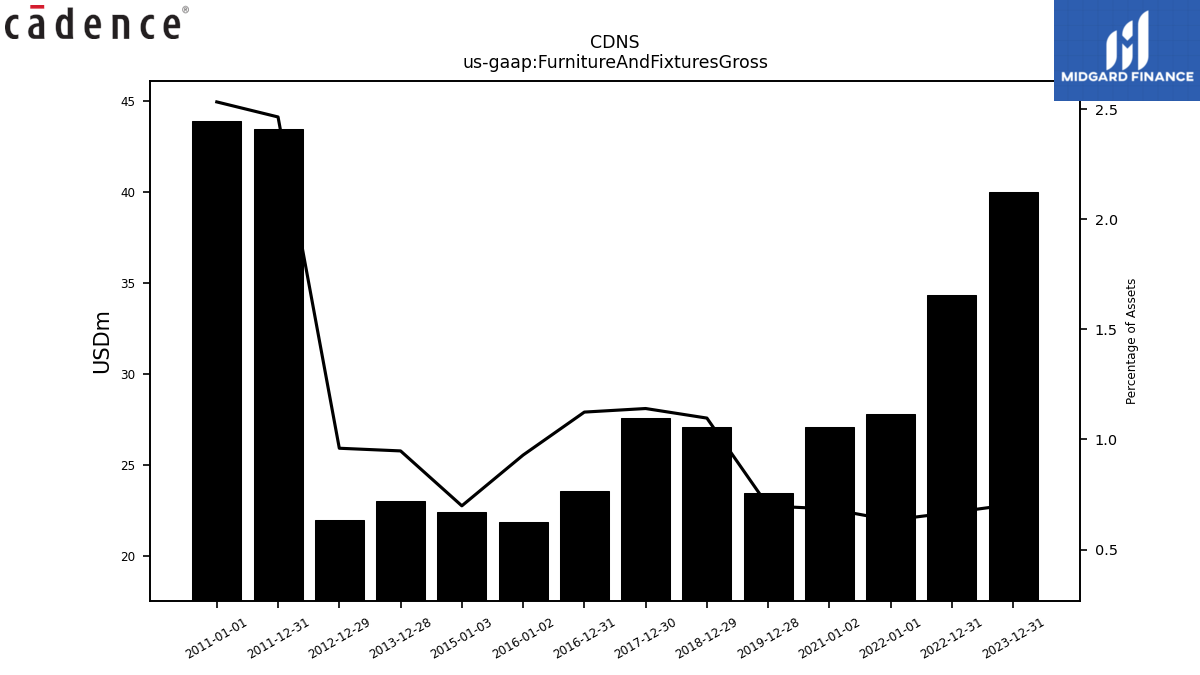
| Furniture And Fixtures Gross | 40.00 | NA | NA | NA | 34.33 | NA | NA | NA | 27.80 | NA | NA | NA | NA | NA | NA | 23.43 | NA | NA | NA | 27.09 | NA | NA | NA | 27.59 | NA | NA | NA | 23.58 | NA | NA | NA | 21.85 | NA | NA | NA | NA | NA | NA | 23.03 | NA | NA | NA | 21.96 | NA | NA | NA | 43.42 | NA | NA | NA | 43.88 | NA | NA | NA | |
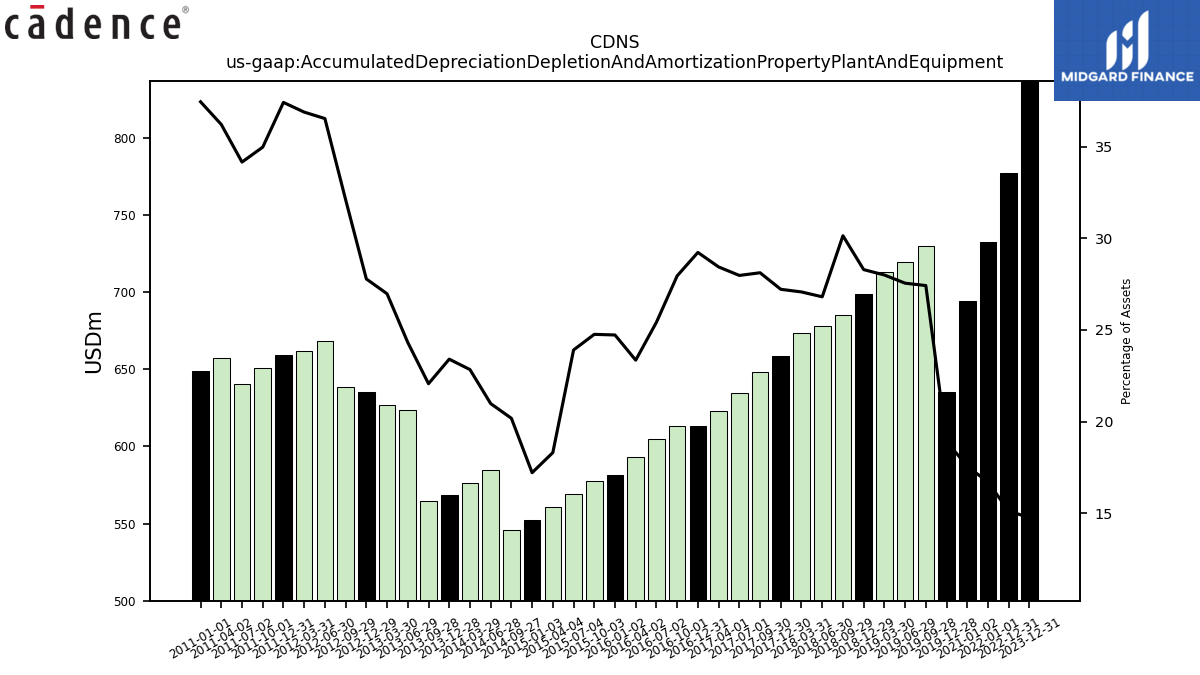
| Accumulated Depreciation Depletion And Amortization Property Plant And Equipment | 836.78 | NA | NA | NA | 776.94 | NA | NA | NA | 732.57 | NA | NA | NA | NA | NA | NA | 635.18 | 730.07 | 719.78 | 713.00 | 698.49 | 685.21 | 677.74 | 673.26 | 658.38 | 648.30 | 634.42 | 623.18 | 612.96 | 613.31 | 604.53 | 592.98 | 581.35 | 577.25 | 569.20 | 560.77 | 546.13 | 584.61 | 576.56 | 568.49 | 564.42 | 623.36 | 626.73 | 635.45 | 638.55 | 668.33 | 662.07 | 658.99 | 650.79 | 640.38 | 657.52 | 648.68 | NA | NA | NA | |
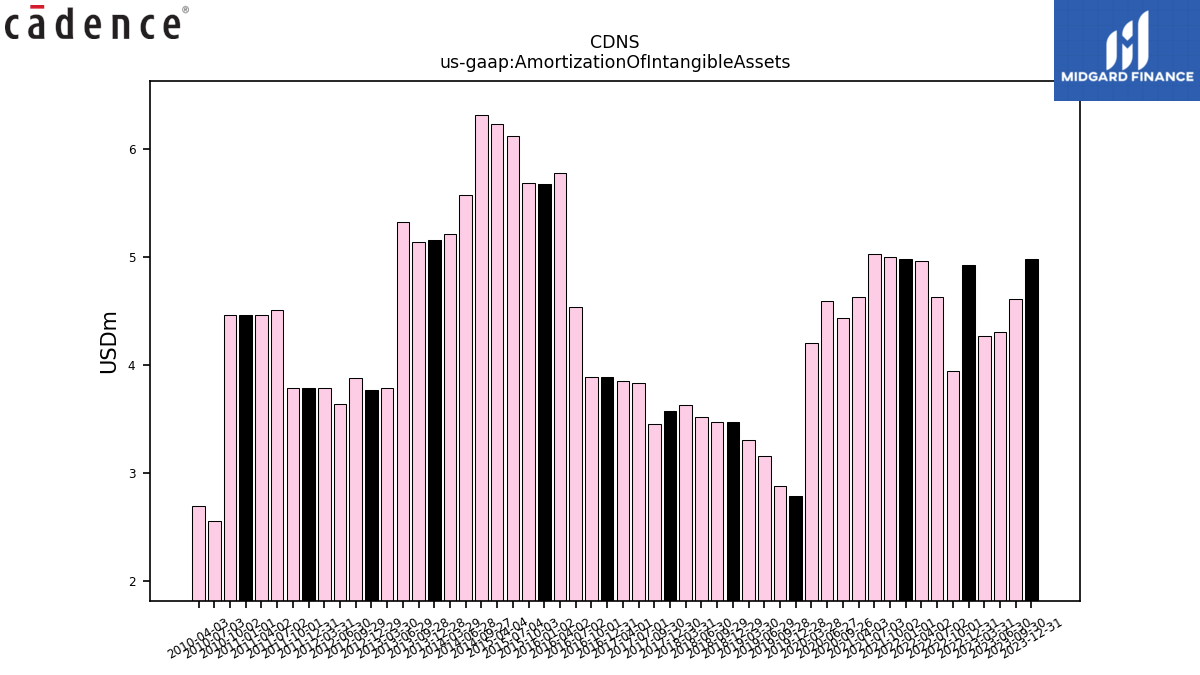
| Amortization Of Intangible Assets | 4.98 | 4.61 | 4.30 | 4.27 | 4.93 | 3.95 | 4.63 | 4.96 | 4.98 | 5.00 | 5.03 | 4.63 | 4.44 | 4.59 | 4.21 | 2.79 | 2.87 | 3.16 | 3.31 | 3.47 | 3.47 | 3.52 | 3.63 | 3.57 | 3.45 | 3.84 | 3.86 | 3.89 | 3.89 | 4.54 | 5.78 | 5.68 | 5.69 | 6.12 | 6.23 | 6.32 | 5.58 | 5.21 | 5.16 | 5.14 | 5.33 | 3.79 | 3.77 | 3.88 | 3.64 | 3.79 | 3.79 | 3.79 | 4.50 | 4.46 | 4.46 | 4.46 | 2.55 | 2.69 | |
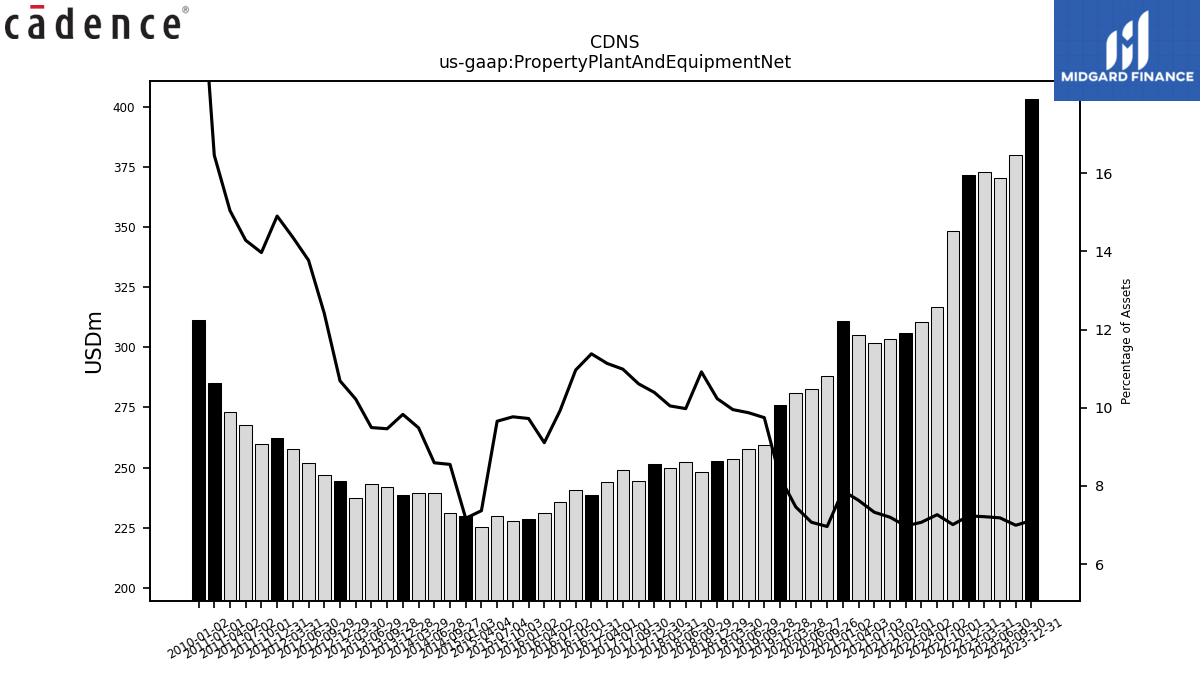
| Property Plant And Equipment Net | 403.21 | 379.78 | 370.19 | 372.96 | 371.45 | 348.24 | 316.74 | 310.69 | 305.91 | 303.31 | 301.98 | 305.09 | 288.16 | 282.74 | 281.21 | 275.86 | 259.45 | 257.88 | 253.39 | 252.63 | 248.16 | 252.19 | 249.81 | 251.34 | 244.62 | 249.14 | 243.95 | 238.61 | 240.59 | 235.91 | 231.18 | 228.60 | 227.69 | 229.84 | 225.56 | 231.34 | 239.31 | 239.43 | 238.72 | 241.97 | 243.29 | 237.46 | 244.44 | 246.86 | 251.92 | 257.74 | 262.52 | 259.94 | 267.76 | 273.16 | 285.12 | NA | NA | NA | |
| Goodwill | 1535.85 | 1500.44 | 1428.77 | 1377.62 | 1374.27 | 1348.49 | 924.46 | 923.72 | 928.36 | 925.95 | 929.52 | 912.60 | 780.84 | 778.86 | 778.99 | 661.86 | 661.68 | 662.71 | 662.87 | 662.27 | 661.34 | 663.32 | 665.62 | 666.01 | 574.91 | 575.02 | 574.54 | 572.76 | 573.89 | 573.71 | 551.90 | 551.77 | 552.41 | 553.83 | 553.94 | 557.25 | 559.96 | 478.99 | 456.90 | 456.27 | 457.56 | 232.61 | 233.27 | 233.28 | 192.24 | 192.44 | 192.12 | 192.15 | 173.75 | 159.08 | 158.89 | NA | NA | NA | |
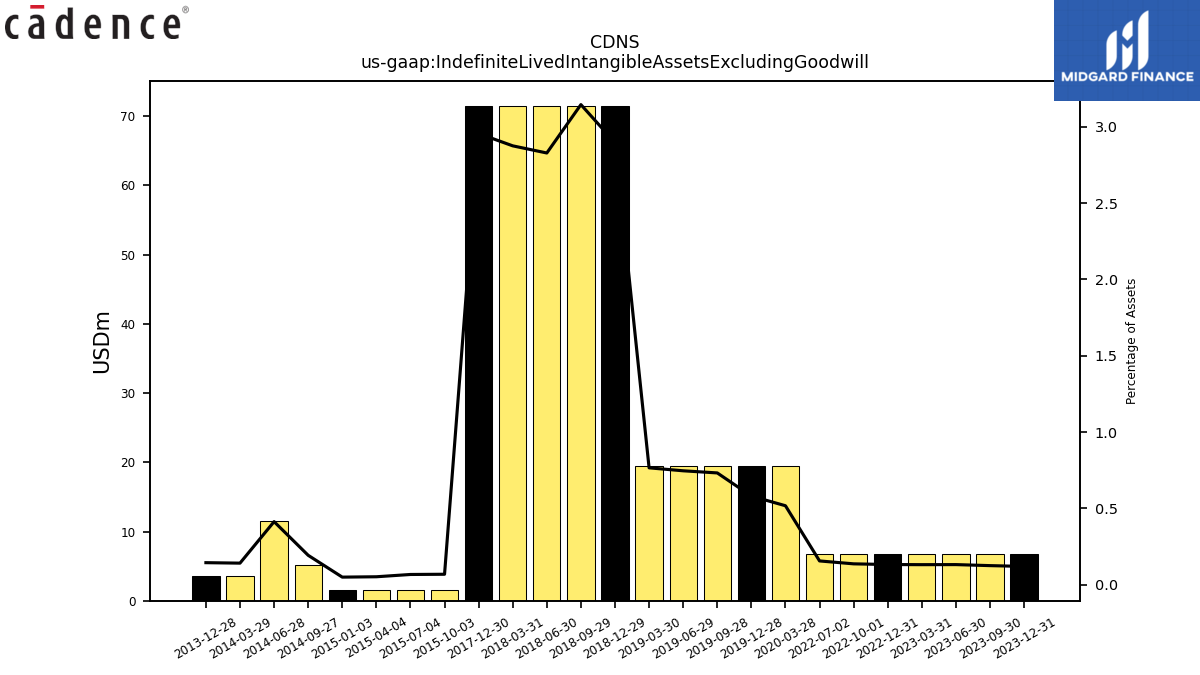
| Indefinite Lived Intangible Assets Excluding Goodwill | 6.80 | 6.80 | 6.80 | 6.80 | 6.80 | 6.80 | 6.80 | NA | NA | NA | NA | NA | NA | NA | 19.50 | 19.50 | 19.50 | 19.50 | 19.50 | 71.50 | 71.50 | 71.50 | 71.50 | 71.50 | NA | NA | NA | NA | NA | NA | NA | NA | 1.60 | 1.60 | 1.60 | 5.22 | 11.52 | 3.57 | 3.51 | NA | NA | NA | NA | NA | NA | NA | NA | NA | NA | NA | NA | NA | NA | NA | |
| Intangible Assets Net Excluding Goodwill | 336.84 | 347.62 | 340.74 | 341.74 | 354.62 | 353.91 | 215.78 | 219.11 | 233.26 | 247.63 | 264.79 | 264.67 | 227.75 | 242.54 | 258.62 | 172.38 | 185.04 | 197.84 | 212.30 | 225.46 | 238.38 | 251.38 | 264.93 | 278.83 | 216.18 | 229.78 | 244.44 | 258.81 | 273.38 | 287.89 | 283.82 | 296.48 | 312.40 | 328.34 | 344.45 | 378.83 | 395.43 | 316.50 | 311.69 | NA | NA | NA | 184.94 | NA | NA | NA | NA | NA | NA | NA | NA | NA | NA | NA | |
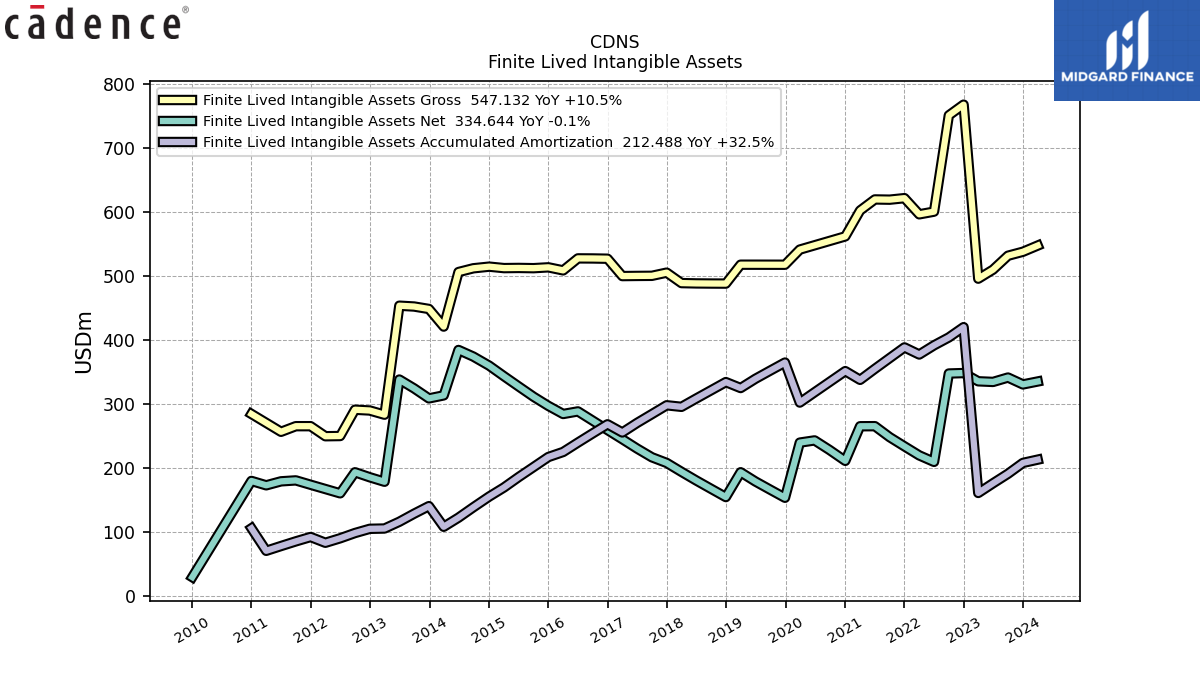
| Finite Lived Intangible Assets Net | 330.04 | 340.82 | 333.94 | 334.94 | 347.82 | 347.11 | 208.98 | 219.11 | 233.26 | 247.63 | 264.79 | 264.67 | 227.75 | 242.54 | 239.12 | 152.88 | 165.54 | 178.34 | 192.80 | 153.96 | 166.88 | 179.88 | 193.43 | 207.34 | 216.18 | 229.78 | 244.44 | 258.81 | 273.38 | 287.89 | 283.82 | 296.48 | 310.81 | 326.74 | 342.85 | 373.61 | 383.91 | 312.93 | 308.18 | 323.81 | 337.70 | 177.89 | 184.94 | 192.77 | 159.81 | 166.53 | 173.23 | 180.04 | 178.57 | 172.34 | 179.20 | NA | NA | NA | |
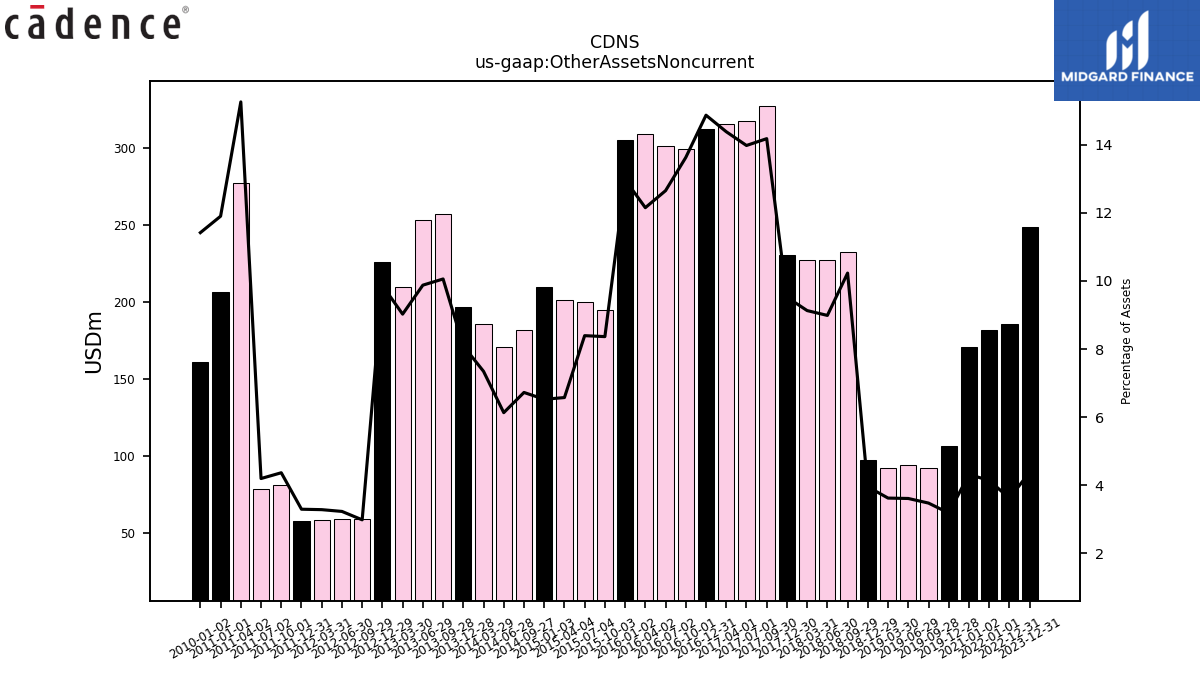
| Other Assets Noncurrent | 248.25 | NA | NA | NA | 185.90 | NA | NA | NA | 181.60 | NA | NA | NA | NA | NA | NA | 106.87 | 92.53 | 94.32 | 92.23 | 97.60 | 232.54 | 227.17 | 227.00 | 230.30 | 326.82 | 316.96 | 315.13 | 311.74 | 298.98 | 300.81 | 308.51 | 304.90 | 194.98 | 199.79 | 201.35 | 181.96 | 170.80 | 185.39 | 196.53 | 257.19 | 253.11 | 209.66 | 225.57 | 59.34 | 59.10 | 58.92 | 58.04 | 81.24 | 78.67 | 277.03 | 206.12 | NA | NA | NA | |
| Equity Securities Fv Ni | 80.60 | 58.40 | 5.14 | 4.75 | 4.49 | 3.96 | 4.37 | 5.08 | 5.96 | 5.57 | 5.58 | 5.47 | 4.57 | 4.16 | 3.87 | 4.60 | 3.77 | 3.62 | 3.97 | 3.89 | 5.45 | NA | NA | 4.46 | NA | NA | NA | NA | NA | NA | NA | NA | NA | NA | NA | NA | NA | NA | NA | NA | NA | NA | NA | NA | NA | NA | NA | NA | NA | NA | NA | NA | NA | NA | |
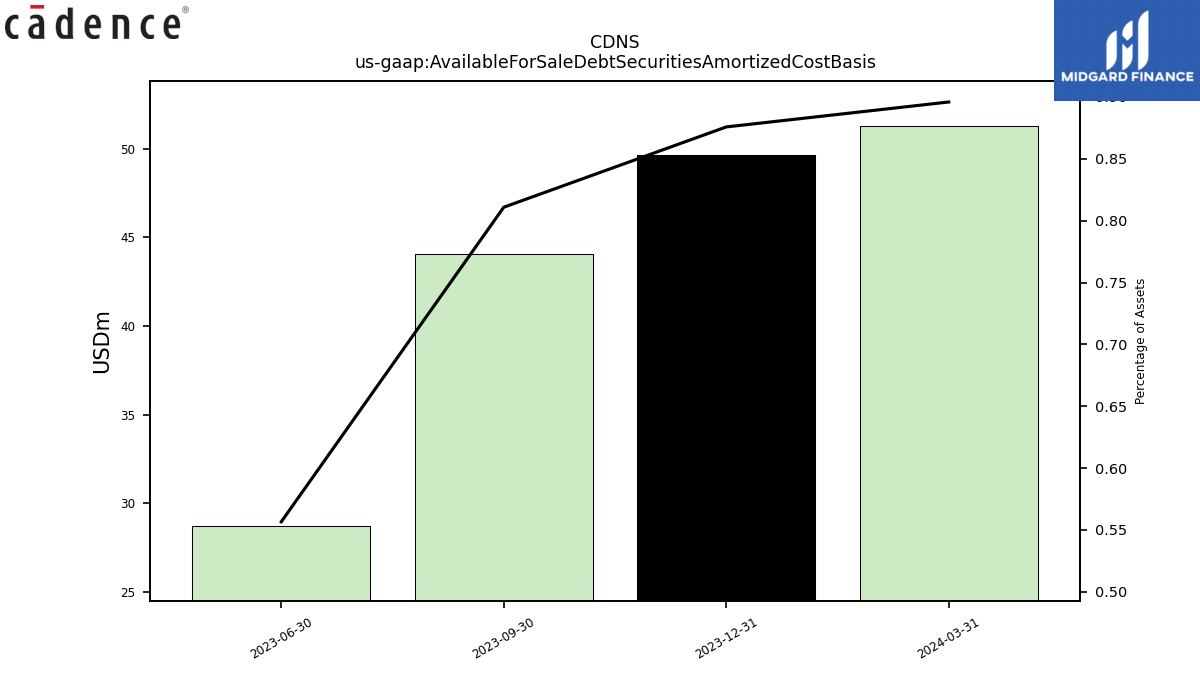
| Available For Sale Debt Securities Amortized Cost Basis | 49.65 | 44.04 | 28.69 | NA | NA | NA | NA | NA | NA | NA | NA | NA | NA | NA | NA | NA | NA | NA | NA | NA | NA | NA | NA | NA | NA | NA | NA | NA | NA | NA | NA | NA | NA | NA | NA | NA | NA | NA | NA | NA | NA | NA | NA | NA | NA | NA | NA | NA | NA | NA | NA | NA | NA | NA |
| 2023-12-31 | 2023-09-30 | 2023-06-30 | 2023-03-31 | 2022-12-31 | 2022-10-01 | 2022-07-02 | 2022-04-02 | 2022-01-01 | 2021-10-02 | 2021-07-03 | 2021-04-03 | 2020-09-26 | 2020-06-27 | 2020-03-28 | 2019-12-28 | 2019-09-28 | 2019-06-29 | 2019-03-30 | 2018-12-29 | 2018-09-29 | 2018-06-30 | 2018-03-31 | 2017-12-30 | 2017-09-30 | 2017-07-01 | 2017-04-01 | 2016-12-31 | 2016-10-01 | 2016-07-02 | 2016-04-02 | 2016-01-02 | 2015-10-03 | 2015-07-04 | 2015-04-04 | 2014-09-27 | 2014-06-28 | 2014-03-29 | 2013-12-28 | 2013-09-28 | 2013-06-29 | 2013-03-30 | 2012-12-29 | 2012-09-29 | 2012-06-30 | 2012-03-31 | 2011-12-31 | 2011-10-01 | 2011-07-02 | 2011-04-02 | 2011-01-01 | 2010-10-02 | 2010-07-03 | 2010-04-03 | ||
|---|---|---|---|---|---|---|---|---|---|---|---|---|---|---|---|---|---|---|---|---|---|---|---|---|---|---|---|---|---|---|---|---|---|---|---|---|---|---|---|---|---|---|---|---|---|---|---|---|---|---|---|---|---|---|---|
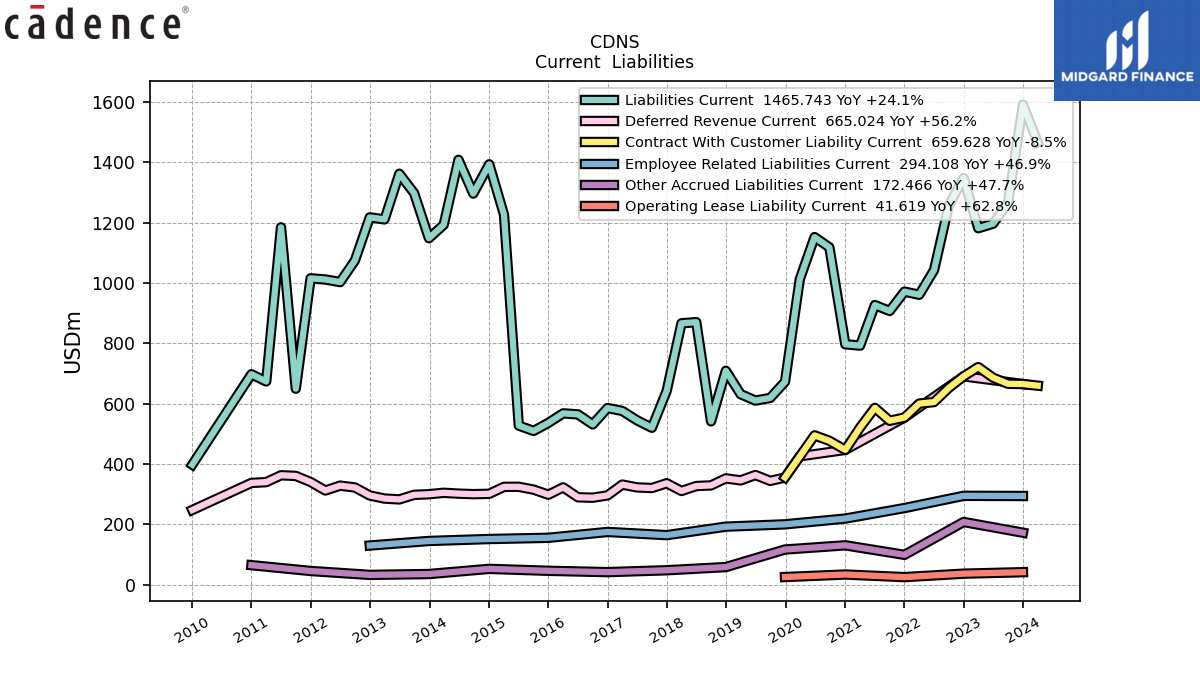
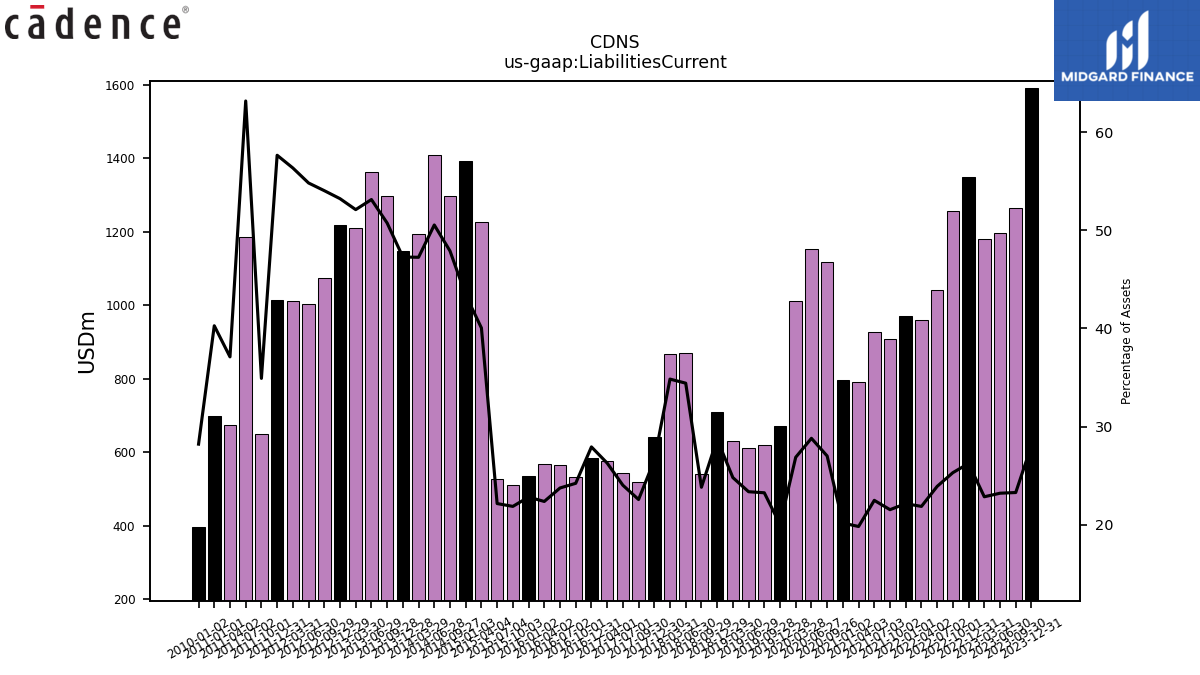
| Liabilities Current | 1590.87 | 1264.17 | 1196.30 | 1181.38 | 1347.70 | 1256.99 | 1042.49 | 960.83 | 971.23 | 907.20 | 926.72 | 792.34 | 1117.89 | 1151.89 | 1012.43 | 672.39 | 618.98 | 610.18 | 631.44 | 708.98 | 541.32 | 870.12 | 866.25 | 642.40 | 520.13 | 544.73 | 575.83 | 585.56 | 531.32 | 564.47 | 567.90 | 536.31 | 509.65 | 527.36 | 1226.44 | 1296.04 | 1408.05 | 1192.69 | 1148.21 | 1297.69 | 1361.90 | 1210.62 | 1217.27 | 1074.62 | 1002.85 | 1011.43 | 1015.37 | 649.53 | 1184.40 | 673.66 | 697.55 | NA | NA | NA | |
| Accounts Payable And Accrued Liabilities Current | 576.56 | 598.26 | 510.01 | 430.13 | 557.16 | 454.69 | 437.19 | 360.55 | 417.28 | 363.83 | 340.61 | 271.24 | 290.89 | 306.95 | 236.81 | 316.91 | 274.88 | 246.59 | 235.69 | 256.53 | 212.15 | 243.16 | 210.78 | 221.10 | 199.67 | 222.22 | 193.98 | 239.50 | 192.95 | 224.69 | 195.22 | 238.02 | 194.43 | 202.79 | 178.47 | 205.65 | 216.96 | 189.20 | 216.59 | 193.44 | 185.81 | 156.61 | 171.32 | 160.25 | 153.96 | 143.76 | 165.79 | 140.42 | 165.70 | 188.65 | 216.86 | NA | NA | NA | |
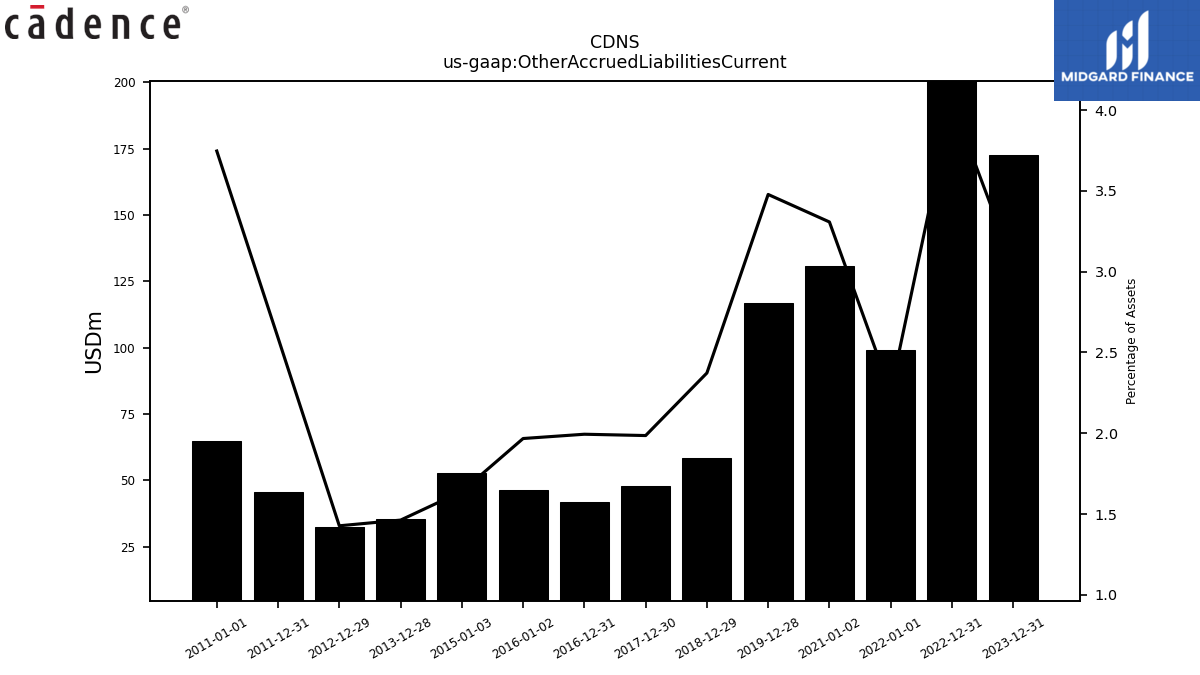
| Other Accrued Liabilities Current | 172.47 | NA | NA | NA | 207.97 | NA | NA | NA | 99.08 | NA | NA | NA | NA | NA | NA | 116.75 | NA | NA | NA | 58.58 | NA | NA | NA | 48.03 | NA | NA | NA | 41.81 | NA | NA | NA | 46.25 | NA | NA | NA | NA | NA | NA | 35.52 | NA | NA | NA | 32.65 | NA | NA | NA | 45.62 | NA | NA | NA | 64.89 | NA | NA | NA |
| 2023-12-31 | 2023-09-30 | 2023-06-30 | 2023-03-31 | 2022-12-31 | 2022-10-01 | 2022-07-02 | 2022-04-02 | 2022-01-01 | 2021-10-02 | 2021-07-03 | 2021-04-03 | 2020-09-26 | 2020-06-27 | 2020-03-28 | 2019-12-28 | 2019-09-28 | 2019-06-29 | 2019-03-30 | 2018-12-29 | 2018-09-29 | 2018-06-30 | 2018-03-31 | 2017-12-30 | 2017-09-30 | 2017-07-01 | 2017-04-01 | 2016-12-31 | 2016-10-01 | 2016-07-02 | 2016-04-02 | 2016-01-02 | 2015-10-03 | 2015-07-04 | 2015-04-04 | 2014-09-27 | 2014-06-28 | 2014-03-29 | 2013-12-28 | 2013-09-28 | 2013-06-29 | 2013-03-30 | 2012-12-29 | 2012-09-29 | 2012-06-30 | 2012-03-31 | 2011-12-31 | 2011-10-01 | 2011-07-02 | 2011-04-02 | 2011-01-01 | 2010-10-02 | 2010-07-03 | 2010-04-03 | ||
|---|---|---|---|---|---|---|---|---|---|---|---|---|---|---|---|---|---|---|---|---|---|---|---|---|---|---|---|---|---|---|---|---|---|---|---|---|---|---|---|---|---|---|---|---|---|---|---|---|---|---|---|---|---|---|---|
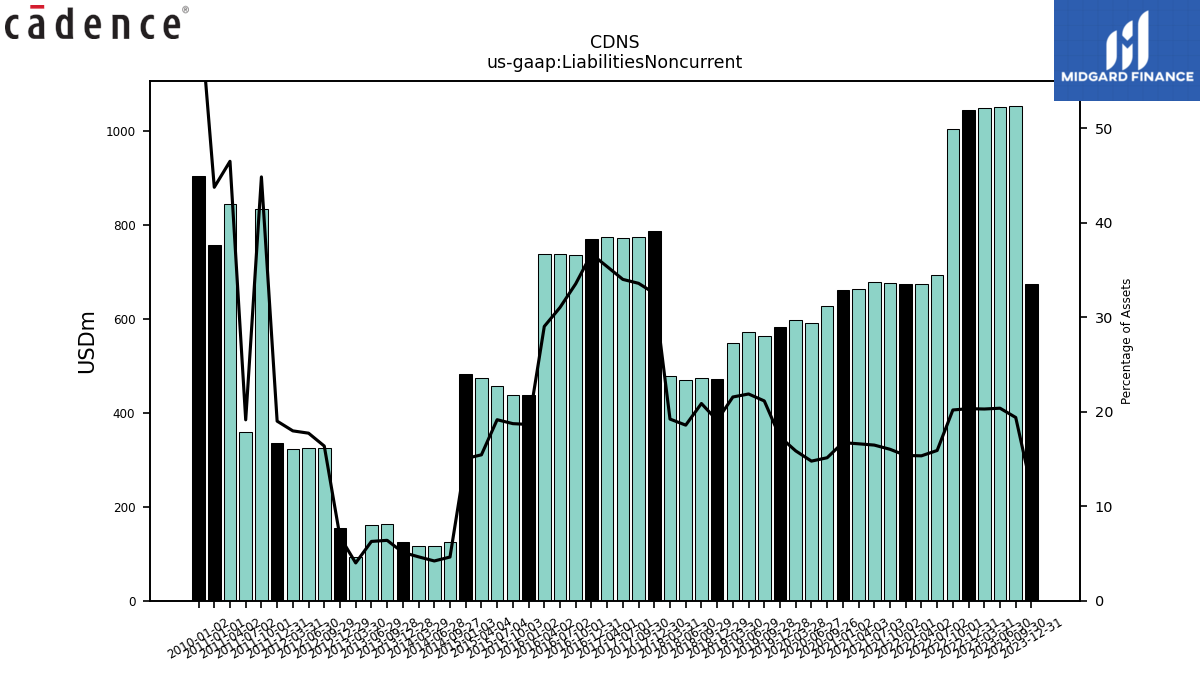
| Liabilities Noncurrent | 674.35 | 1053.31 | 1050.37 | 1049.36 | 1044.26 | 1002.97 | 693.55 | 674.06 | 674.40 | 675.42 | 679.09 | 664.19 | 626.54 | 590.98 | 597.55 | 581.94 | 562.95 | 571.60 | 549.03 | 471.27 | 474.47 | 469.76 | 478.13 | 787.11 | 774.35 | 771.18 | 774.78 | 769.58 | 735.97 | 738.01 | 737.07 | 438.59 | 436.93 | 456.07 | 472.94 | 125.17 | 117.30 | 117.32 | 124.29 | 163.49 | 160.93 | 92.97 | 154.56 | 325.51 | 324.39 | 322.65 | 334.77 | 834.55 | 358.91 | 844.34 | 757.91 | NA | NA | NA | |
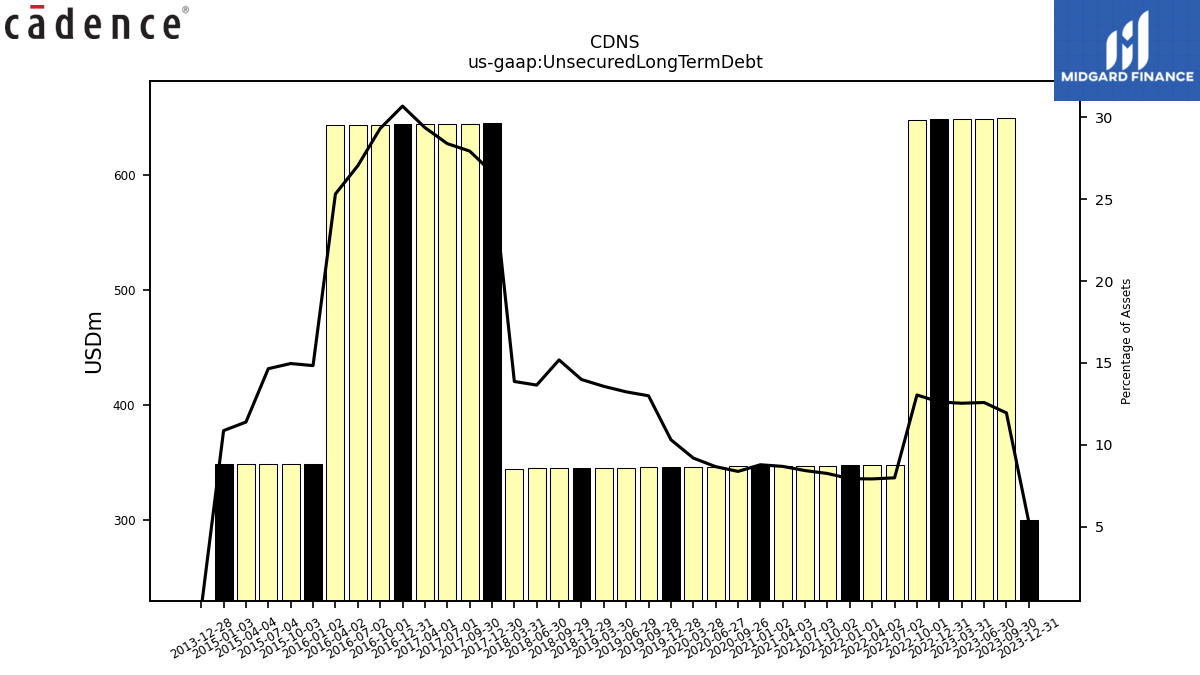
| Unsecured Long Term Debt | 299.77 | 648.80 | 648.55 | 648.30 | 648.08 | 647.80 | 348.00 | 347.79 | 347.59 | 347.38 | 347.19 | 346.99 | 346.58 | 346.39 | 346.20 | 346.02 | 345.83 | 345.65 | 345.47 | 345.29 | 345.11 | 344.94 | 344.77 | 644.37 | 644.15 | 643.93 | 643.71 | 643.49 | 643.28 | 643.07 | 642.86 | 348.79 | 348.76 | 348.73 | 348.70 | NA | NA | NA | 0.00 | NA | NA | NA | NA | NA | NA | NA | NA | NA | NA | NA | NA | NA | NA | NA | |
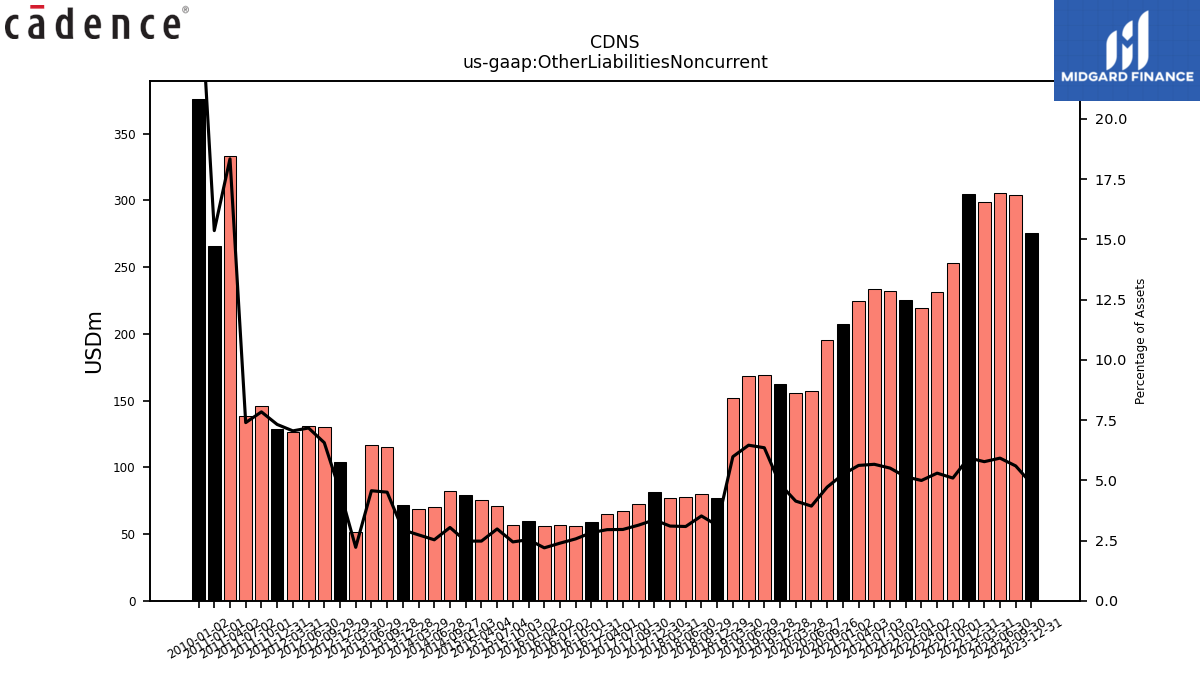
| Other Liabilities Noncurrent | 275.65 | 303.90 | 305.17 | 298.55 | 304.66 | 253.00 | 230.98 | 219.43 | 225.66 | 232.04 | 233.50 | 224.62 | 195.31 | 157.15 | 155.84 | 162.52 | 169.09 | 168.66 | 152.25 | 77.26 | 80.01 | 77.91 | 77.08 | 81.23 | 72.34 | 67.10 | 64.67 | 59.31 | 56.35 | 56.84 | 55.76 | 59.60 | 56.94 | 70.94 | 75.82 | 82.30 | 70.50 | 69.03 | 71.44 | 115.26 | 117.03 | 51.53 | 104.03 | 130.48 | 131.17 | 126.56 | 128.89 | 145.87 | 138.62 | 333.07 | 266.11 | NA | NA | NA | |
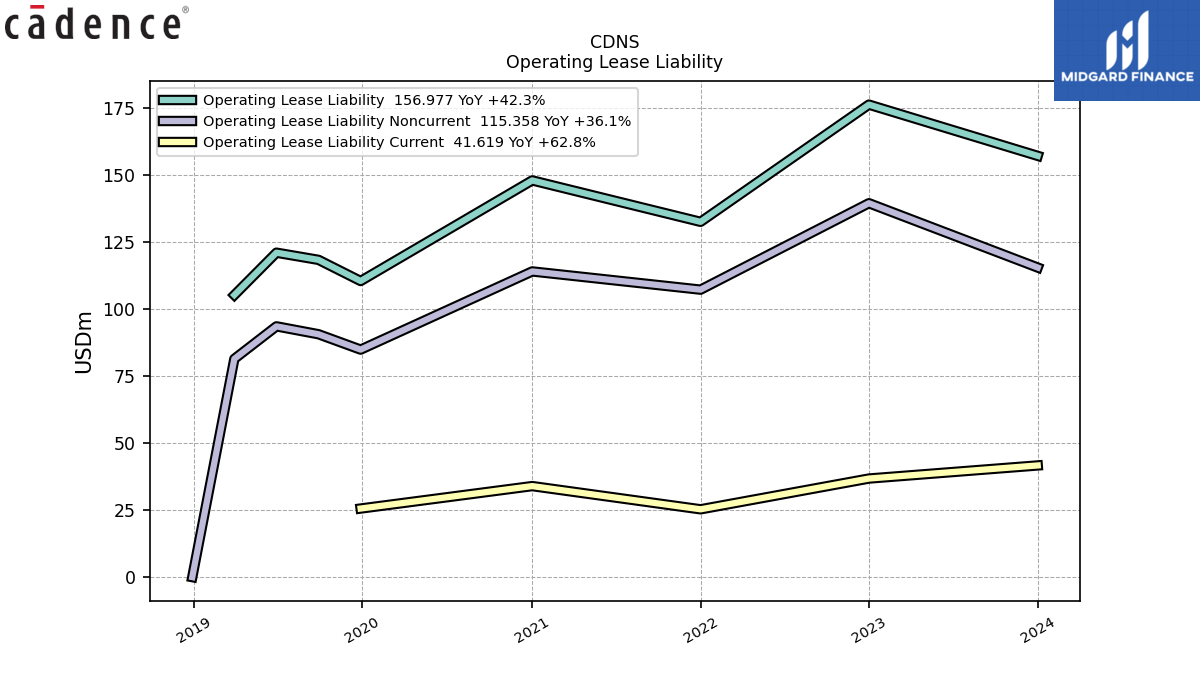
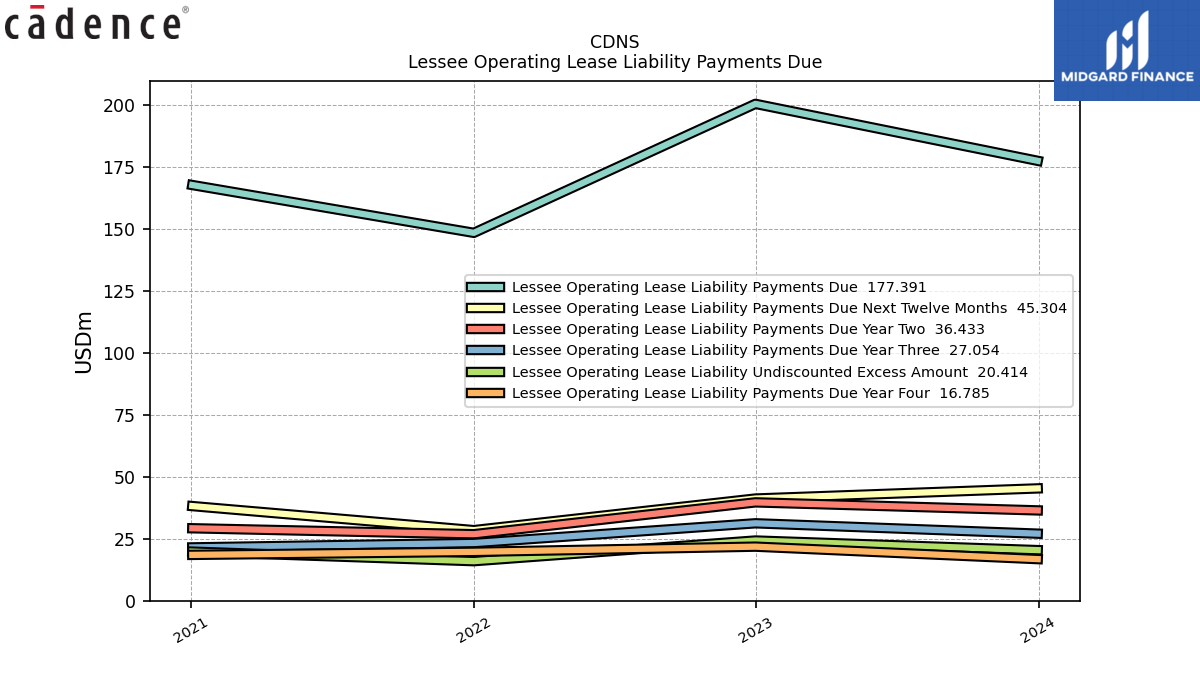
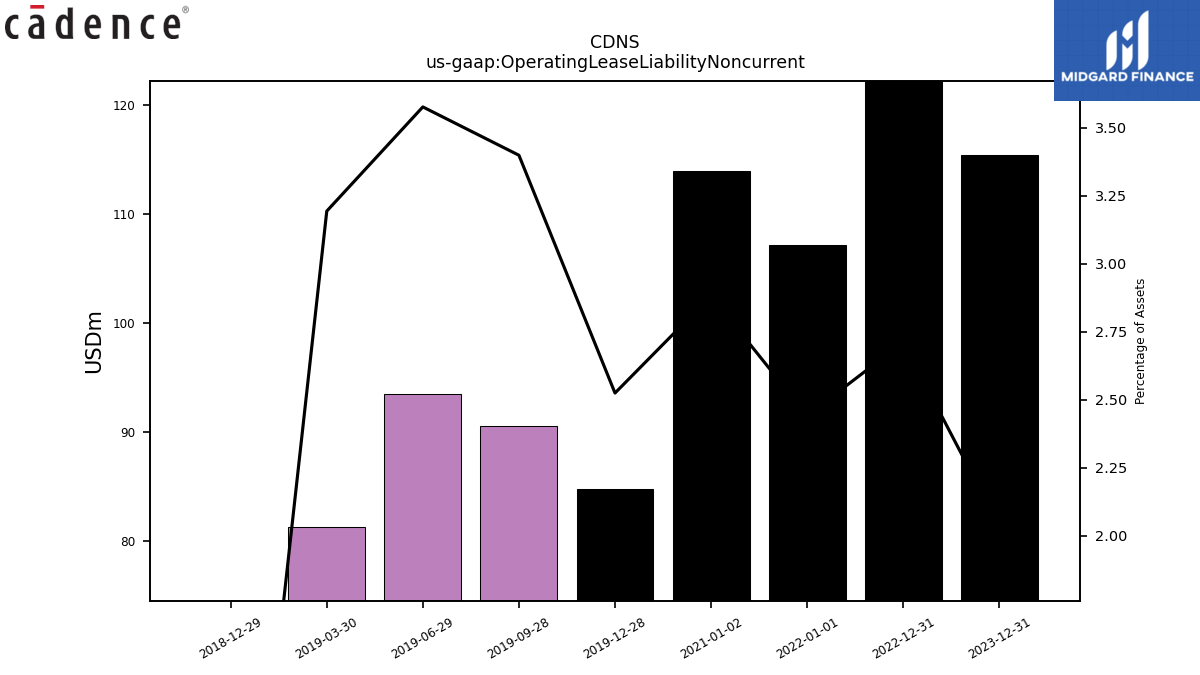
| Operating Lease Liability Noncurrent | 115.36 | NA | NA | NA | 139.34 | NA | NA | NA | 107.12 | NA | NA | NA | NA | NA | NA | 84.78 | 90.51 | 93.45 | 81.34 | 0.00 | NA | NA | NA | NA | NA | NA | NA | NA | NA | NA | NA | NA | NA | NA | NA | NA | NA | NA | NA | NA | NA | NA | NA | NA | NA | NA | NA | NA | NA | NA | NA | NA | NA | NA |
| 2023-12-31 | 2023-09-30 | 2023-06-30 | 2023-03-31 | 2022-12-31 | 2022-10-01 | 2022-07-02 | 2022-04-02 | 2022-01-01 | 2021-10-02 | 2021-07-03 | 2021-04-03 | 2020-09-26 | 2020-06-27 | 2020-03-28 | 2019-12-28 | 2019-09-28 | 2019-06-29 | 2019-03-30 | 2018-12-29 | 2018-09-29 | 2018-06-30 | 2018-03-31 | 2017-12-30 | 2017-09-30 | 2017-07-01 | 2017-04-01 | 2016-12-31 | 2016-10-01 | 2016-07-02 | 2016-04-02 | 2016-01-02 | 2015-10-03 | 2015-07-04 | 2015-04-04 | 2014-09-27 | 2014-06-28 | 2014-03-29 | 2013-12-28 | 2013-09-28 | 2013-06-29 | 2013-03-30 | 2012-12-29 | 2012-09-29 | 2012-06-30 | 2012-03-31 | 2011-12-31 | 2011-10-01 | 2011-07-02 | 2011-04-02 | 2011-01-01 | 2010-10-02 | 2010-07-03 | 2010-04-03 | ||
|---|---|---|---|---|---|---|---|---|---|---|---|---|---|---|---|---|---|---|---|---|---|---|---|---|---|---|---|---|---|---|---|---|---|---|---|---|---|---|---|---|---|---|---|---|---|---|---|---|---|---|---|---|---|---|---|
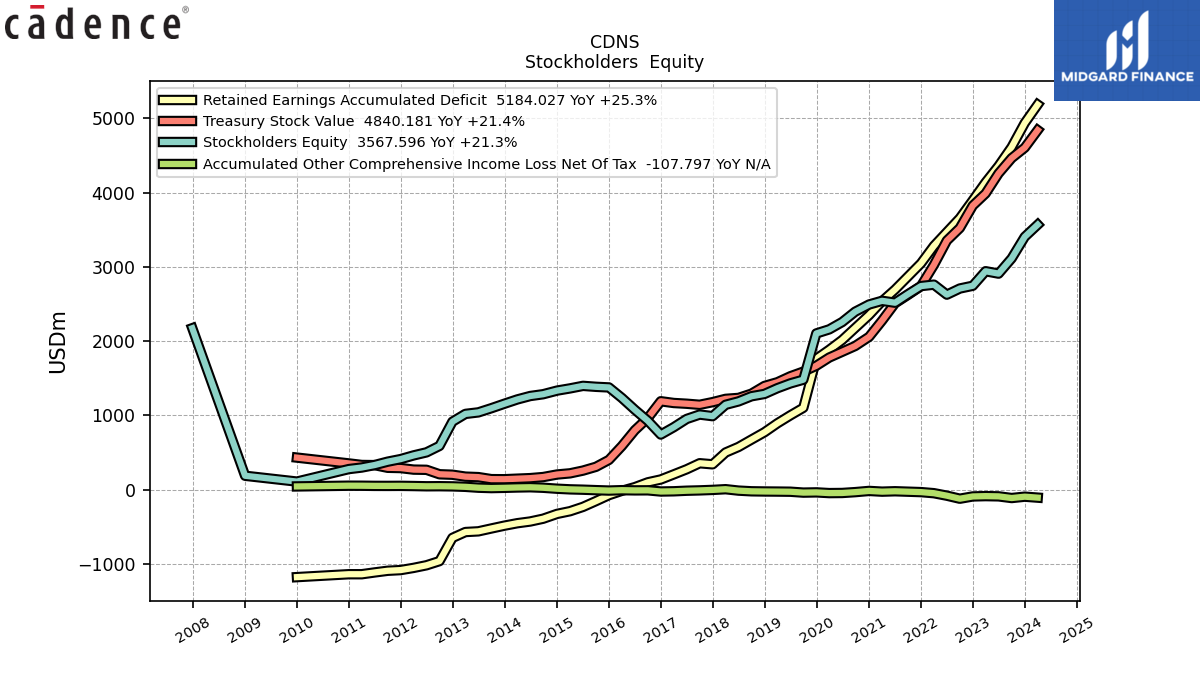
| Stockholders Equity | 3404.27 | 3113.89 | 2908.45 | 2940.88 | 2745.11 | 2708.13 | 2625.23 | 2760.18 | 2740.68 | 2631.26 | 2516.74 | 2542.43 | 2395.72 | 2256.63 | 2157.99 | 2102.89 | 1480.26 | 1430.55 | 1365.84 | 1288.40 | 1257.42 | 1187.99 | 1142.30 | 989.20 | 1010.74 | 951.79 | 840.59 | 741.77 | 926.80 | 1075.39 | 1234.05 | 1376.12 | 1384.56 | 1397.21 | 1363.19 | 1284.73 | 1260.48 | 1214.20 | 1156.11 | 1096.21 | 1040.26 | 1019.67 | 915.17 | 588.39 | 502.01 | 460.75 | 411.13 | 376.60 | 331.32 | 297.71 | 276.65 | NA | NA | NA | |
| Common Stocks Including Additional Paid In Capital | 3166.96 | 3077.95 | 2897.89 | 2878.75 | 2765.67 | 2697.63 | 2590.89 | 2552.21 | 2467.70 | 2411.79 | 2354.80 | 2307.97 | 2186.85 | 2143.02 | 2099.43 | 2046.24 | 2007.27 | 1984.46 | 1944.89 | 1936.12 | 1897.75 | 1861.13 | 1858.69 | 1829.95 | 1807.84 | 1848.72 | 1824.31 | 1820.08 | 1801.12 | 1851.72 | 1844.29 | 1863.09 | 1853.28 | 1886.42 | 1869.10 | 1820.33 | 1812.17 | 1785.07 | 1757.24 | 1739.68 | NA | NA | 1721.56 | NA | NA | NA | NA | NA | NA | NA | NA | NA | NA | NA | |
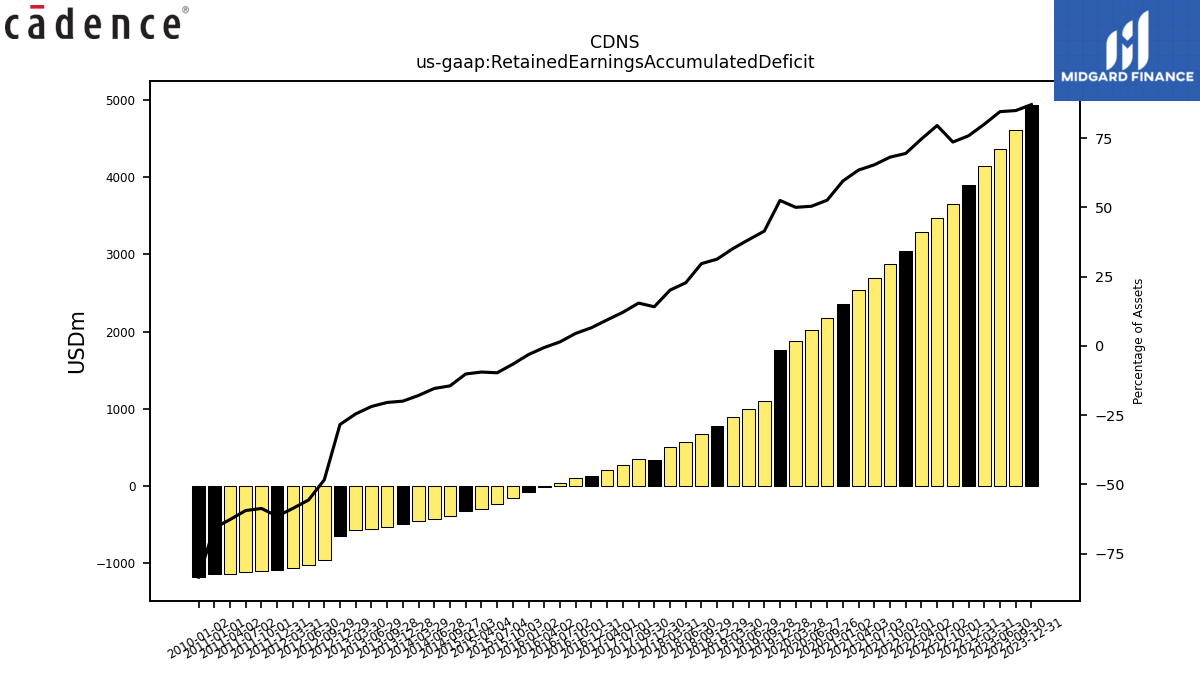
| Retained Earnings Accumulated Deficit | 4936.38 | 4612.48 | 4358.16 | 4137.04 | 3895.24 | 3654.85 | 3468.54 | 3281.62 | 3046.29 | 2869.71 | 2693.40 | 2537.50 | 2176.59 | 2014.96 | 1883.68 | 1761.69 | 1102.01 | 1000.50 | 893.26 | 772.71 | 674.28 | 574.97 | 499.82 | 341.00 | 355.44 | 274.29 | 205.16 | 136.90 | 98.42 | 33.71 | -15.62 | -73.99 | -154.37 | -231.99 | -290.15 | -391.44 | -428.97 | -452.24 | -485.31 | -523.01 | -561.51 | -570.94 | -649.55 | -962.51 | -1018.19 | -1053.74 | -1083.24 | -1092.47 | -1114.85 | -1139.02 | -1138.85 | NA | NA | NA | |
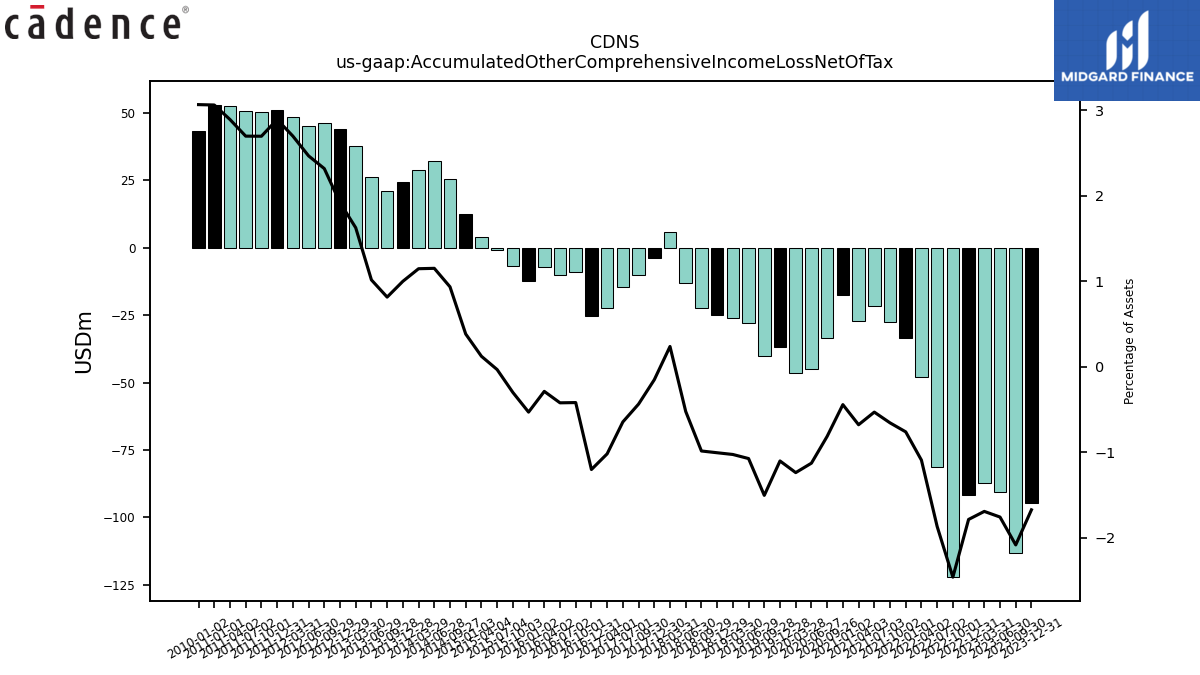
| Accumulated Other Comprehensive Income Loss Net Of Tax | -94.75 | -113.06 | -90.51 | -87.39 | -91.64 | -122.13 | -81.38 | -47.92 | -33.31 | -27.56 | -21.79 | -27.04 | -33.62 | -45.02 | -46.58 | -36.93 | -39.99 | -28.00 | -26.07 | -24.78 | -22.35 | -13.17 | 5.94 | -3.63 | -10.02 | -14.59 | -22.28 | -25.16 | -9.15 | -9.98 | -7.26 | -12.43 | -6.95 | -0.74 | 3.81 | 25.34 | 32.12 | 28.99 | 24.31 | 20.88 | 26.08 | 37.82 | 43.95 | 46.12 | 45.15 | 48.45 | 50.95 | 50.20 | 50.60 | 52.53 | 53.06 | NA | NA | NA | |
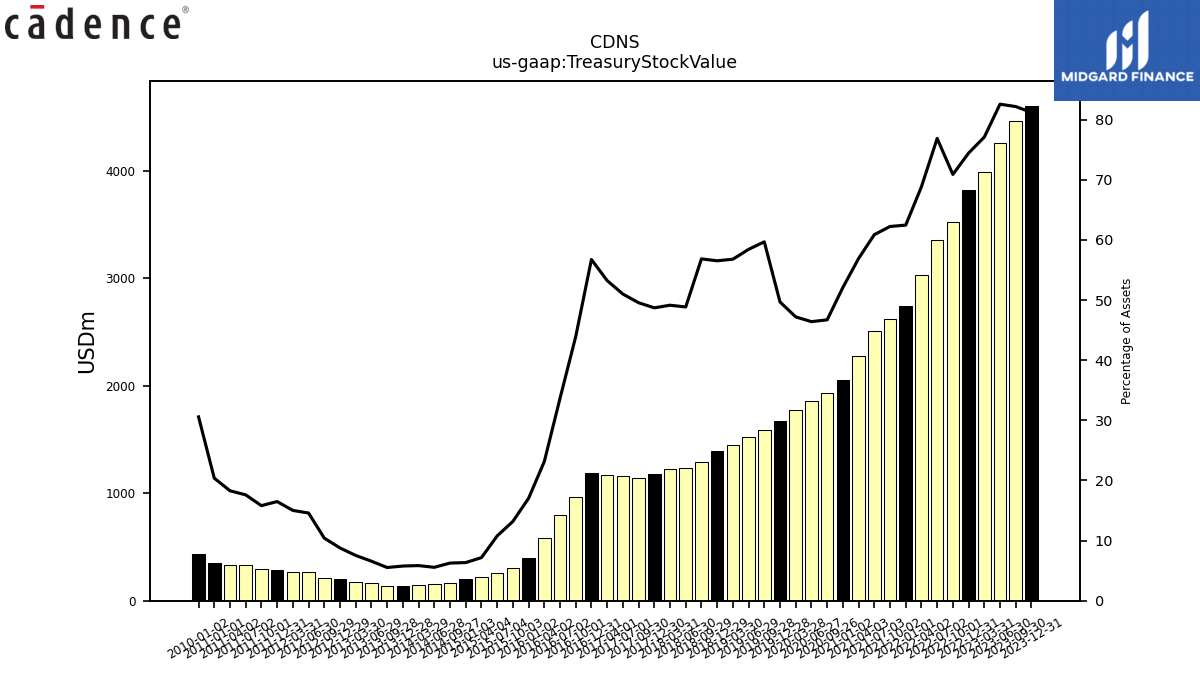
| Treasury Stock Value | 4604.32 | 4463.48 | 4257.08 | 3987.53 | 3824.16 | 3522.22 | 3352.83 | 3025.73 | 2740.00 | 2622.68 | 2509.67 | 2276.00 | 1934.11 | 1856.33 | 1778.53 | 1668.11 | 1589.03 | 1526.42 | 1446.25 | 1395.65 | 1292.27 | 1234.94 | 1222.15 | 1178.12 | 1142.52 | 1156.63 | 1166.60 | 1190.05 | 963.60 | 800.06 | 587.35 | 400.56 | 307.41 | 256.48 | 219.58 | 169.51 | 154.84 | 147.62 | 140.14 | 141.34 | 168.57 | 175.11 | 200.79 | 207.02 | 266.82 | 269.65 | 290.46 | 294.29 | 330.09 | 332.06 | 353.09 | NA | NA | NA | |
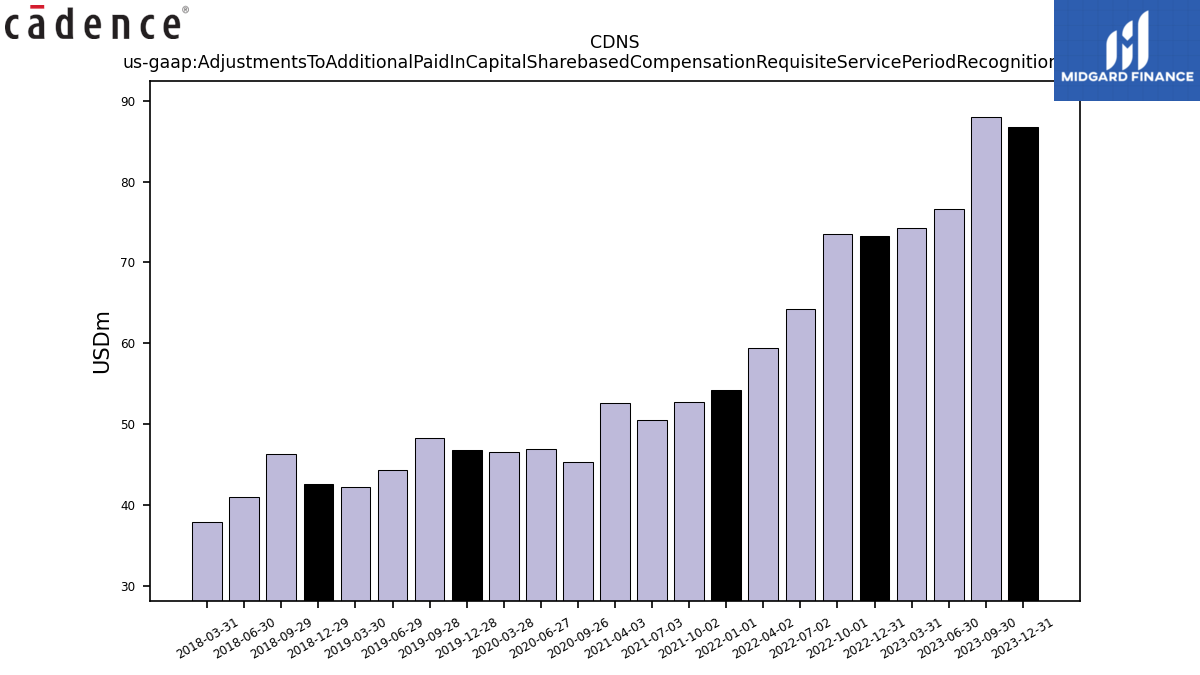
| Adjustments To Additional Paid In Capital Sharebased Compensation Requisite Service Period Recognition Value | 86.68 | 88.03 | 76.61 | 74.29 | 73.25 | 73.45 | 64.27 | 59.47 | 54.23 | 52.75 | 50.52 | 52.60 | 45.33 | 46.91 | 46.48 | 46.76 | 48.28 | 44.26 | 42.25 | 42.59 | 46.26 | 40.96 | 37.90 | NA | NA | NA | NA | NA | NA | NA | NA | NA | NA | NA | NA | NA | NA | NA | NA | NA | NA | NA | NA | NA | NA | NA | NA | NA | NA | NA | NA | NA | NA | NA |
| 2023-12-31 | 2023-09-30 | 2023-06-30 | 2023-03-31 | 2022-12-31 | 2022-10-01 | 2022-07-02 | 2022-04-02 | 2022-01-01 | 2021-10-02 | 2021-07-03 | 2021-04-03 | 2020-09-26 | 2020-06-27 | 2020-03-28 | 2019-12-28 | 2019-09-28 | 2019-06-29 | 2019-03-30 | 2018-12-29 | 2018-09-29 | 2018-06-30 | 2018-03-31 | 2017-12-30 | 2017-09-30 | 2017-07-01 | 2017-04-01 | 2016-12-31 | 2016-10-01 | 2016-07-02 | 2016-04-02 | 2016-01-02 | 2015-10-03 | 2015-07-04 | 2015-04-04 | 2014-09-27 | 2014-06-28 | 2014-03-29 | 2013-12-28 | 2013-09-28 | 2013-06-29 | 2013-03-30 | 2012-12-29 | 2012-09-29 | 2012-06-30 | 2012-03-31 | 2011-12-31 | 2011-10-01 | 2011-07-02 | 2011-04-02 | 2011-01-01 | 2010-10-02 | 2010-07-03 | 2010-04-03 | ||
|---|---|---|---|---|---|---|---|---|---|---|---|---|---|---|---|---|---|---|---|---|---|---|---|---|---|---|---|---|---|---|---|---|---|---|---|---|---|---|---|---|---|---|---|---|---|---|---|---|---|---|---|---|---|---|---|
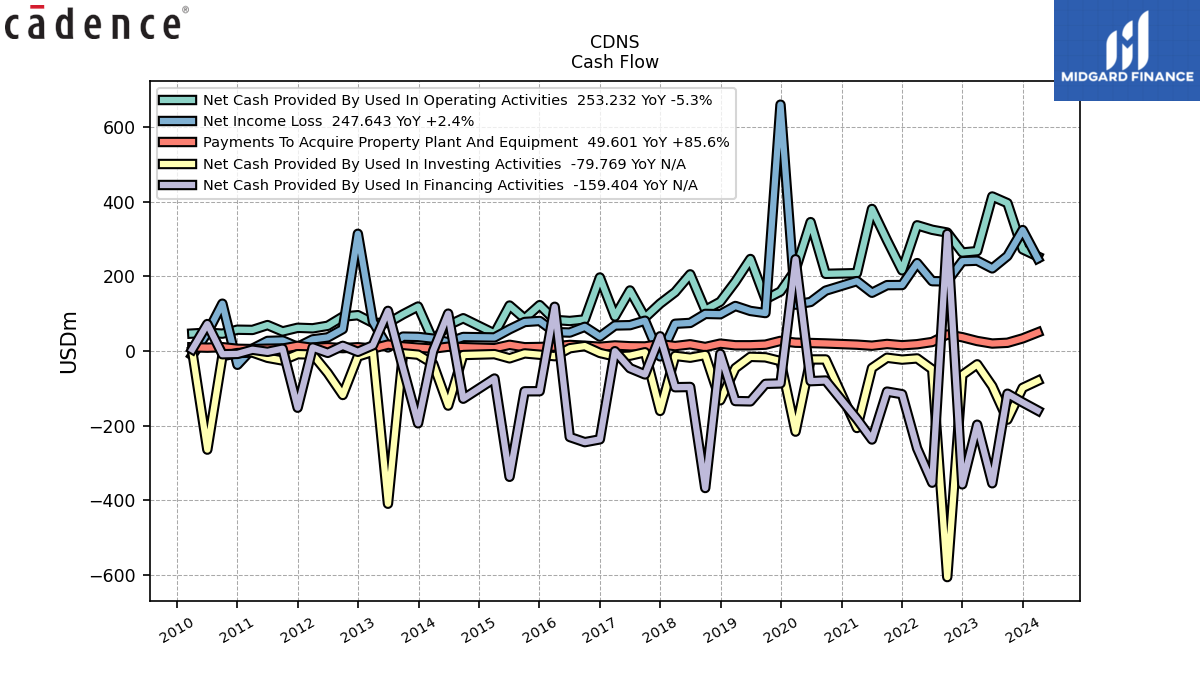
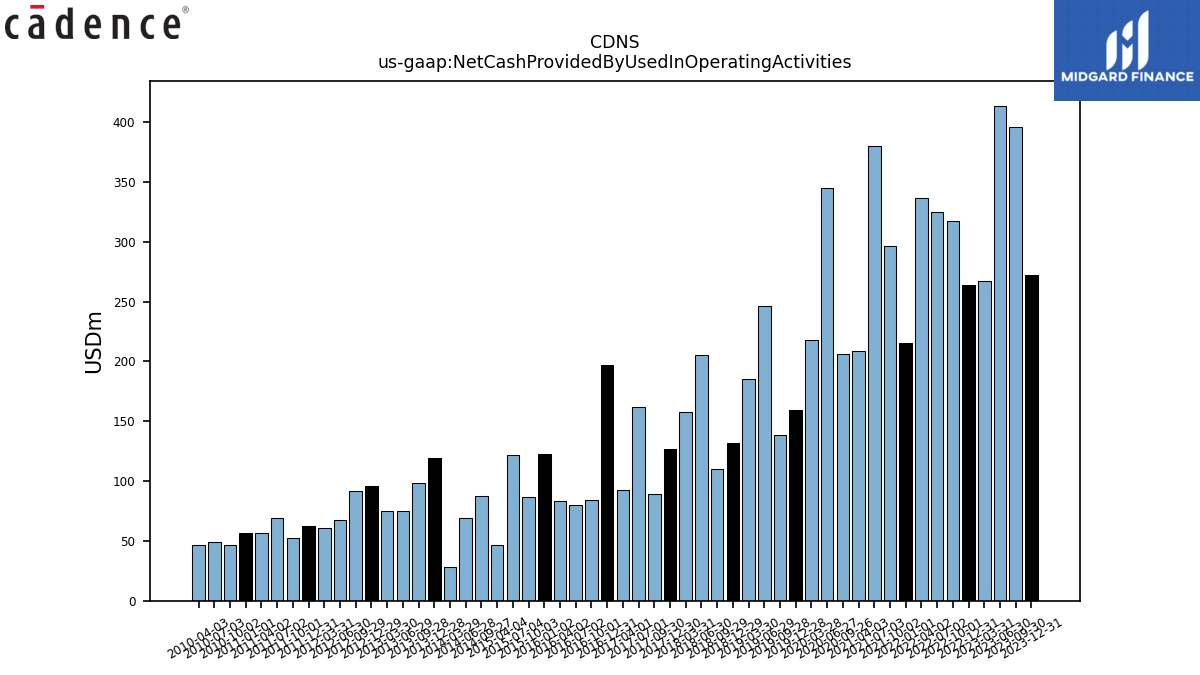
| Net Cash Provided By Used In Operating Activities | 272.09 | 395.91 | 413.77 | 267.40 | 263.63 | 317.11 | 324.54 | 336.61 | 215.86 | 296.28 | 380.38 | 208.44 | 206.56 | 345.12 | 217.72 | 159.30 | 138.53 | 246.36 | 185.41 | 131.88 | 109.95 | 205.27 | 157.65 | 126.86 | 89.31 | 162.14 | 92.43 | 196.86 | 84.46 | 80.37 | 83.19 | 122.85 | 86.91 | 121.75 | 46.69 | 87.69 | 68.86 | 28.10 | 119.16 | 98.21 | 74.89 | 75.34 | 95.88 | 91.93 | 67.48 | 60.71 | 62.14 | 52.43 | 69.41 | 56.37 | 57.01 | 46.43 | 49.00 | 46.70 | |
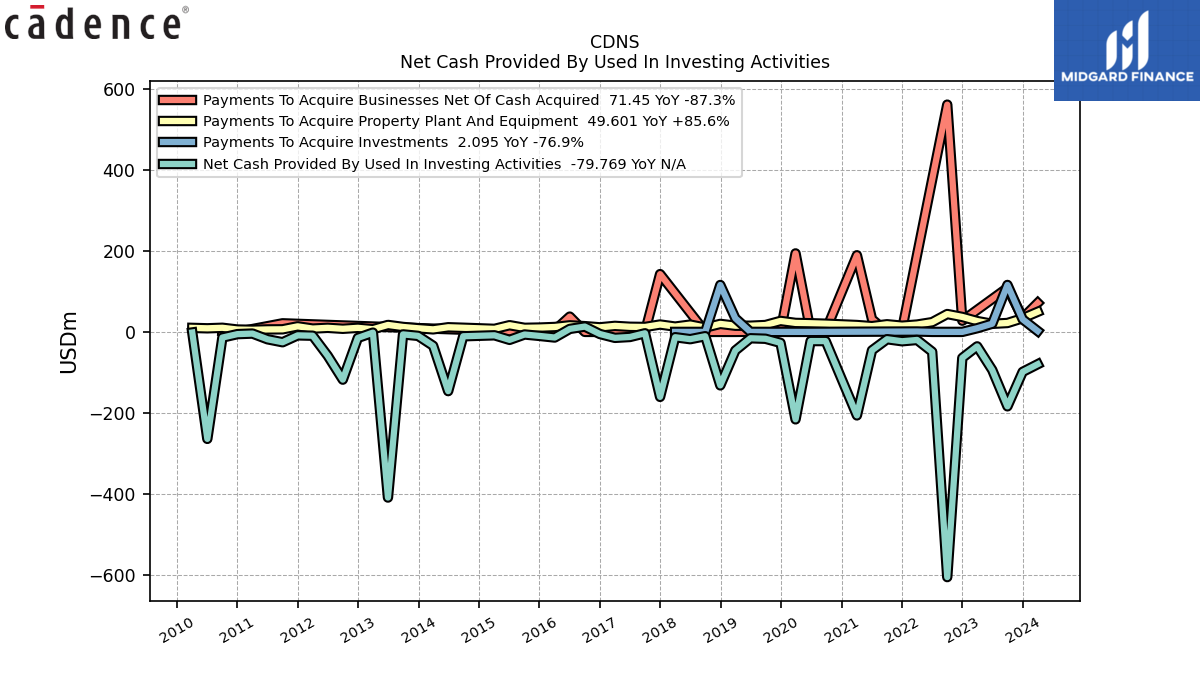
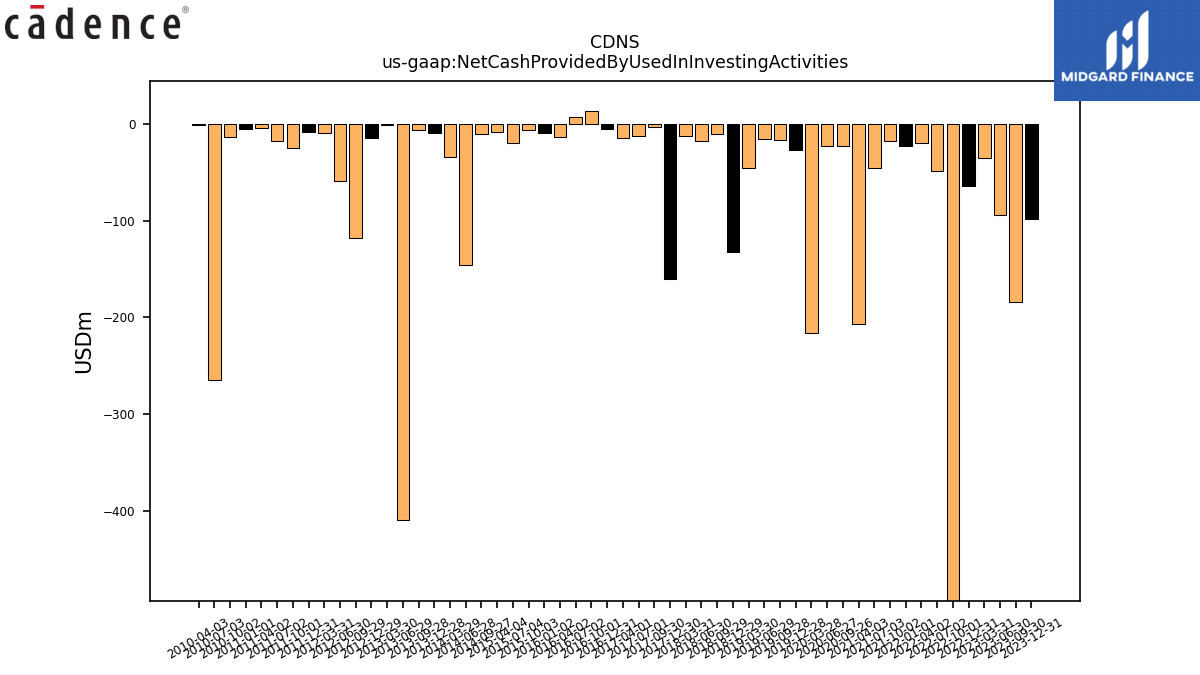
| Net Cash Provided By Used In Investing Activities | -98.68 | -183.83 | -94.07 | -35.67 | -64.18 | -605.51 | -49.07 | -19.88 | -23.08 | -18.08 | -45.57 | -206.23 | -22.65 | -22.65 | -216.00 | -27.08 | -16.96 | -15.68 | -45.99 | -132.08 | -10.66 | -17.98 | -13.13 | -160.51 | -3.40 | -12.56 | -14.74 | -5.21 | 13.14 | 7.34 | -13.91 | -9.98 | -6.42 | -19.69 | -8.42 | -10.79 | -146.30 | -34.19 | -9.84 | -6.15 | -409.09 | -1.82 | -14.86 | -117.92 | -59.02 | -9.45 | -8.55 | -25.54 | -18.26 | -4.15 | -5.53 | -13.99 | -264.18 | -1.42 | |
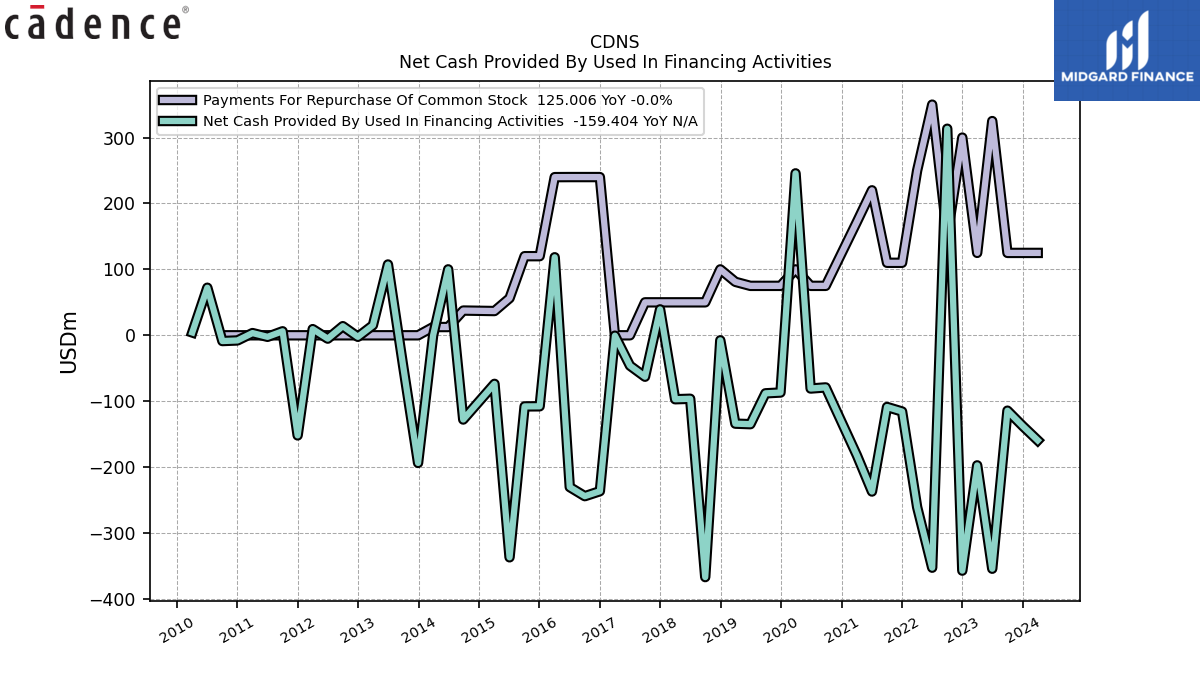
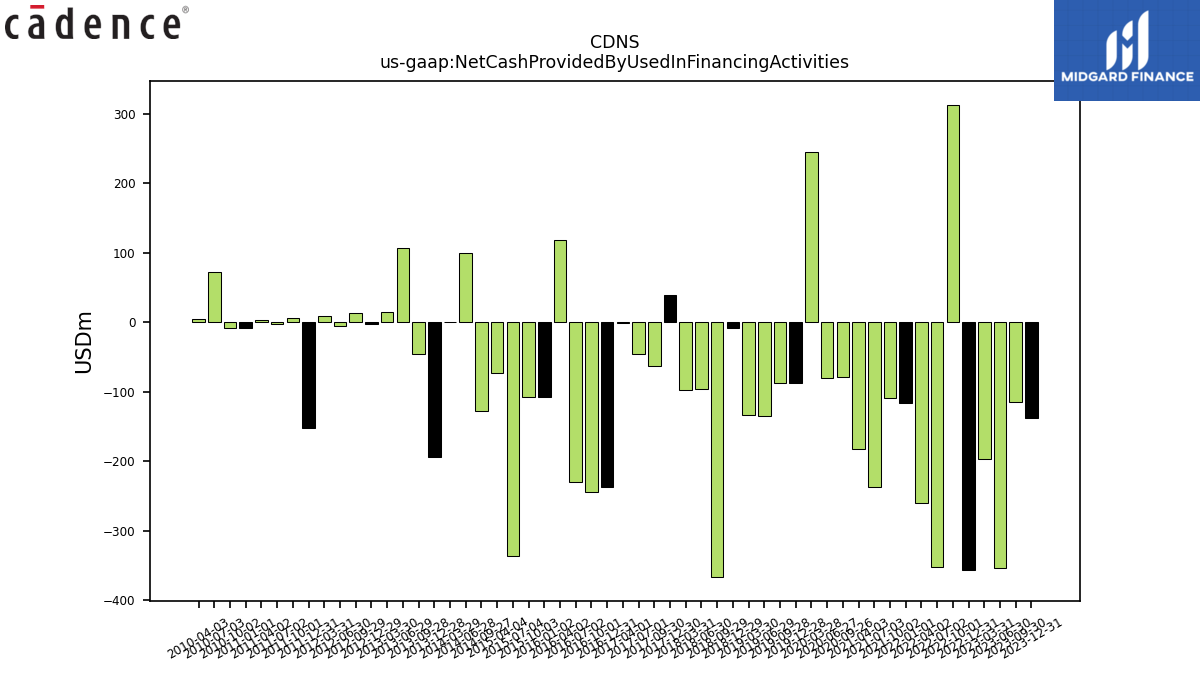
| Net Cash Provided By Used In Financing Activities | -137.60 | -114.36 | -354.25 | -197.35 | -357.15 | 313.47 | -352.68 | -260.69 | -115.65 | -108.76 | -237.11 | -182.27 | -79.08 | -80.79 | 245.76 | -86.87 | -88.06 | -134.88 | -134.08 | -7.61 | -366.97 | -96.31 | -97.06 | 39.37 | -62.87 | -46.10 | -0.55 | -236.64 | -244.14 | -230.35 | 118.43 | -107.77 | -107.92 | -336.94 | -73.68 | -127.84 | 100.09 | -0.13 | -193.73 | -45.22 | 107.47 | 15.19 | -2.31 | 13.85 | -5.10 | 9.39 | -151.94 | 6.08 | -2.32 | 3.37 | -7.82 | -8.73 | 72.22 | 4.28 |
| 2023-12-31 | 2023-09-30 | 2023-06-30 | 2023-03-31 | 2022-12-31 | 2022-10-01 | 2022-07-02 | 2022-04-02 | 2022-01-01 | 2021-10-02 | 2021-07-03 | 2021-04-03 | 2020-09-26 | 2020-06-27 | 2020-03-28 | 2019-12-28 | 2019-09-28 | 2019-06-29 | 2019-03-30 | 2018-12-29 | 2018-09-29 | 2018-06-30 | 2018-03-31 | 2017-12-30 | 2017-09-30 | 2017-07-01 | 2017-04-01 | 2016-12-31 | 2016-10-01 | 2016-07-02 | 2016-04-02 | 2016-01-02 | 2015-10-03 | 2015-07-04 | 2015-04-04 | 2014-09-27 | 2014-06-28 | 2014-03-29 | 2013-12-28 | 2013-09-28 | 2013-06-29 | 2013-03-30 | 2012-12-29 | 2012-09-29 | 2012-06-30 | 2012-03-31 | 2011-12-31 | 2011-10-01 | 2011-07-02 | 2011-04-02 | 2011-01-01 | 2010-10-02 | 2010-07-03 | 2010-04-03 | ||
|---|---|---|---|---|---|---|---|---|---|---|---|---|---|---|---|---|---|---|---|---|---|---|---|---|---|---|---|---|---|---|---|---|---|---|---|---|---|---|---|---|---|---|---|---|---|---|---|---|---|---|---|---|---|---|---|
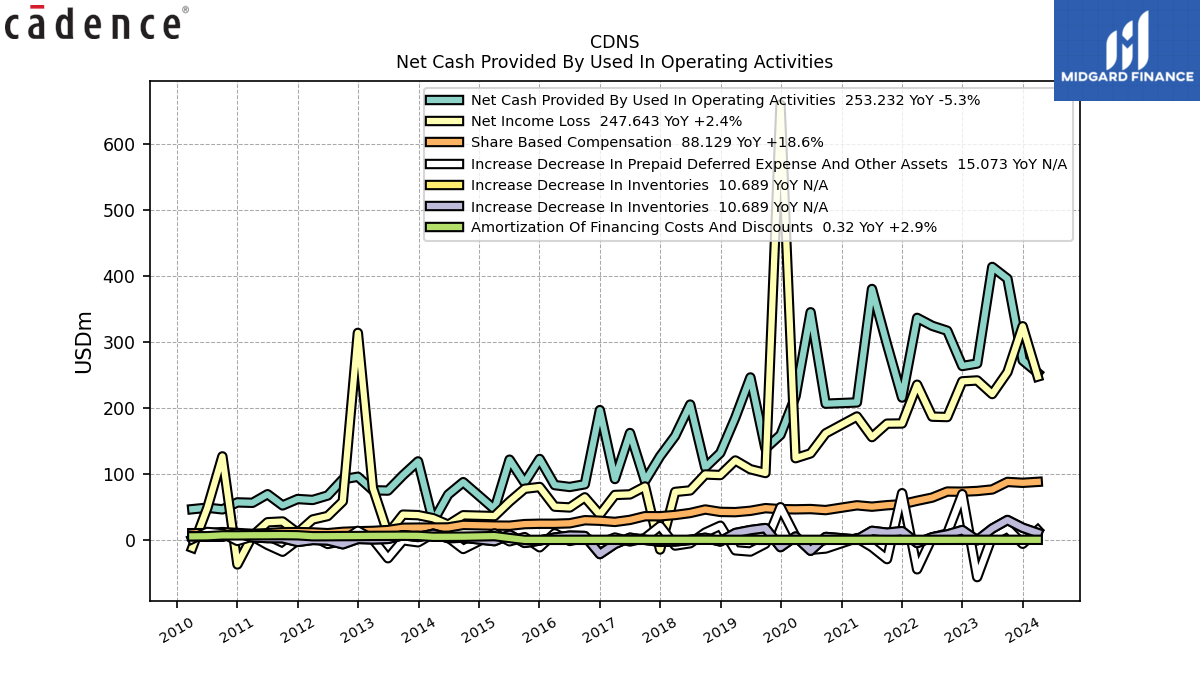
| Net Cash Provided By Used In Operating Activities | 272.09 | 395.91 | 413.77 | 267.40 | 263.63 | 317.11 | 324.54 | 336.61 | 215.86 | 296.28 | 380.38 | 208.44 | 206.56 | 345.12 | 217.72 | 159.30 | 138.53 | 246.36 | 185.41 | 131.88 | 109.95 | 205.27 | 157.65 | 126.86 | 89.31 | 162.14 | 92.43 | 196.86 | 84.46 | 80.37 | 83.19 | 122.85 | 86.91 | 121.75 | 46.69 | 87.69 | 68.86 | 28.10 | 119.16 | 98.21 | 74.89 | 75.34 | 95.88 | 91.93 | 67.48 | 60.71 | 62.14 | 52.43 | 69.41 | 56.37 | 57.01 | 46.43 | 49.00 | 46.70 | |
| Net Income Loss | 323.90 | 254.32 | 221.12 | 241.80 | 240.39 | 186.31 | 186.92 | 235.34 | 176.58 | 176.31 | 155.90 | 187.17 | 161.63 | 131.29 | 123.99 | 659.67 | 101.51 | 107.23 | 120.56 | 98.42 | 99.32 | 75.15 | 72.89 | -14.44 | 81.16 | 69.13 | 68.26 | 38.48 | 64.71 | 49.34 | 50.56 | 80.37 | 77.62 | 58.16 | 36.26 | 37.53 | 23.26 | 33.07 | 37.70 | 38.50 | 9.43 | 78.61 | 313.87 | 58.58 | 36.39 | 31.10 | 10.89 | 28.11 | 26.91 | 6.32 | -37.04 | 126.75 | 48.61 | -11.79 | |
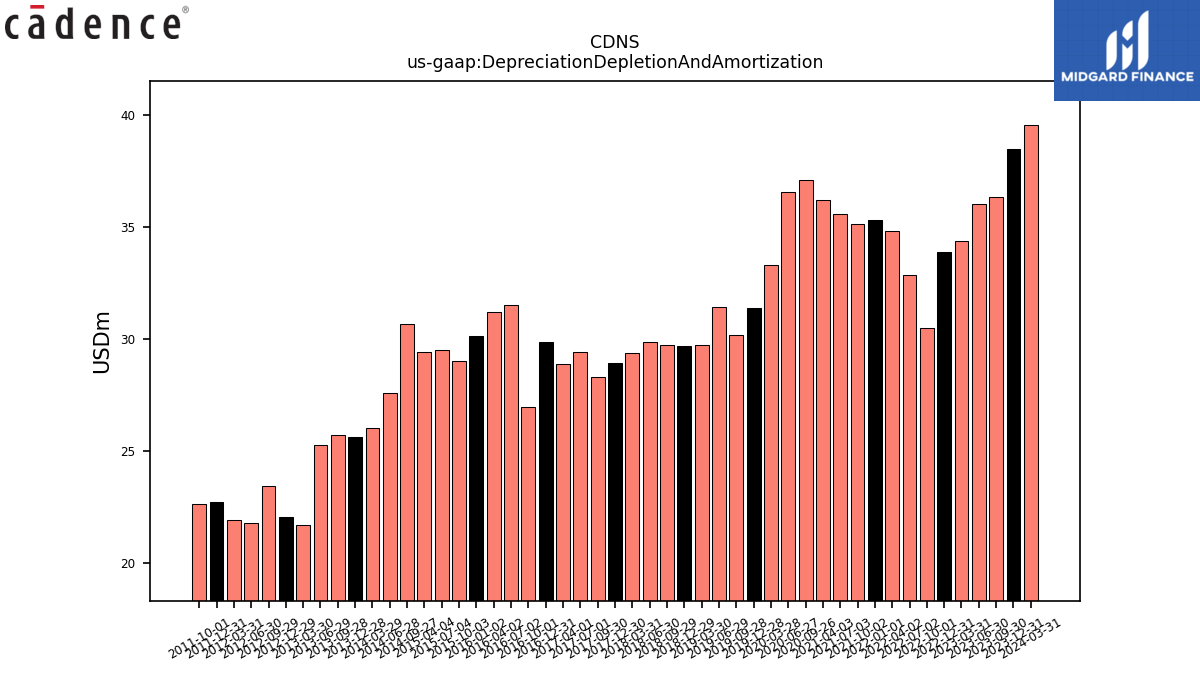
| Depreciation Depletion And Amortization | 38.51 | 36.35 | 36.03 | 34.40 | 33.91 | 30.49 | 32.87 | 34.83 | 35.35 | 35.16 | 35.58 | 36.22 | 37.12 | 36.58 | 33.32 | 31.39 | 30.20 | 31.46 | 29.74 | 29.72 | 29.72 | 29.89 | 29.39 | 28.92 | 28.30 | 29.41 | 28.89 | 29.86 | 26.97 | 31.53 | 31.23 | 30.16 | 29.04 | 29.53 | 29.43 | 30.69 | 27.59 | 26.02 | 25.63 | 25.70 | 25.30 | 21.68 | 22.05 | 23.43 | 21.80 | 21.94 | 22.71 | 22.65 | NA | NA | NA | NA | NA | NA | |
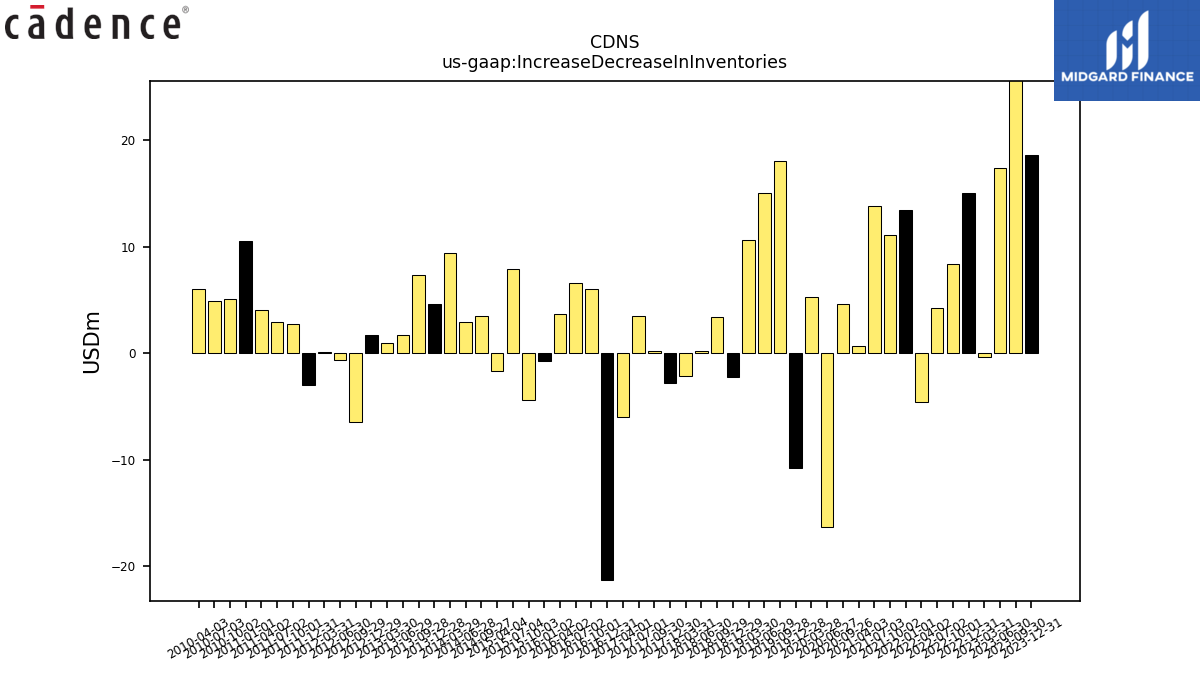
| Increase Decrease In Inventories | 18.60 | 30.31 | 17.38 | -0.40 | 15.05 | 8.39 | 4.21 | -4.58 | 13.42 | 11.08 | 13.86 | 0.67 | 4.64 | -16.28 | 5.26 | -10.76 | 18.09 | 15.07 | 10.62 | -2.21 | 3.39 | 0.17 | -2.10 | -2.75 | 0.25 | 3.46 | -6.00 | -21.27 | 6.04 | 6.58 | 3.71 | -0.74 | -4.38 | 7.92 | -1.68 | 3.53 | 2.89 | 9.37 | 4.59 | 7.33 | 1.69 | 0.98 | 1.69 | -6.44 | -0.65 | 0.15 | -2.95 | 2.78 | 2.97 | 4.02 | 10.52 | 5.08 | 4.88 | 6.05 | |
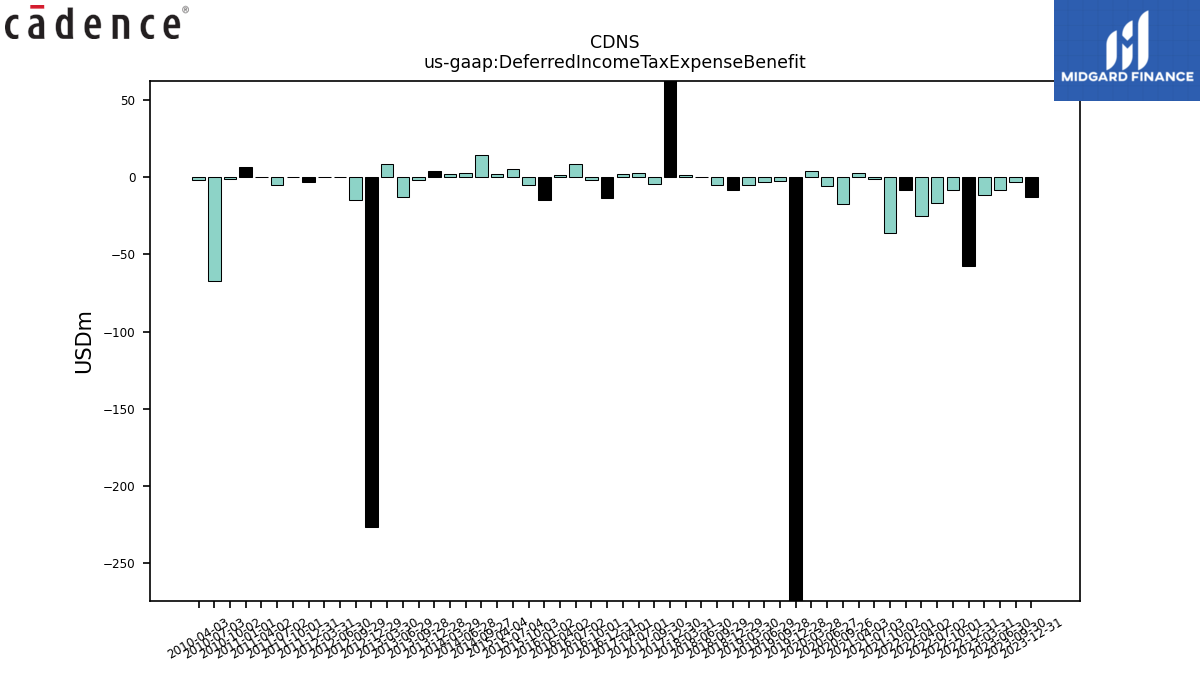
| Deferred Income Tax Expense Benefit | -13.01 | -3.33 | -8.53 | -11.64 | -57.77 | -8.24 | -16.68 | -24.92 | -8.61 | -36.28 | -1.00 | 2.71 | -17.36 | -5.51 | 3.90 | -565.80 | -2.78 | -3.19 | -4.97 | -8.46 | -4.88 | 0.30 | 1.36 | 79.72 | -4.60 | 2.82 | 1.99 | -13.53 | -1.59 | 8.63 | 1.62 | -14.86 | -5.38 | 5.23 | 1.86 | 14.19 | 2.53 | 2.25 | 4.06 | -2.01 | -13.11 | 8.70 | -226.32 | -14.57 | 0.24 | 0.22 | -3.07 | 0.07 | -4.88 | 0.07 | 6.43 | -1.35 | -67.56 | -1.71 | |
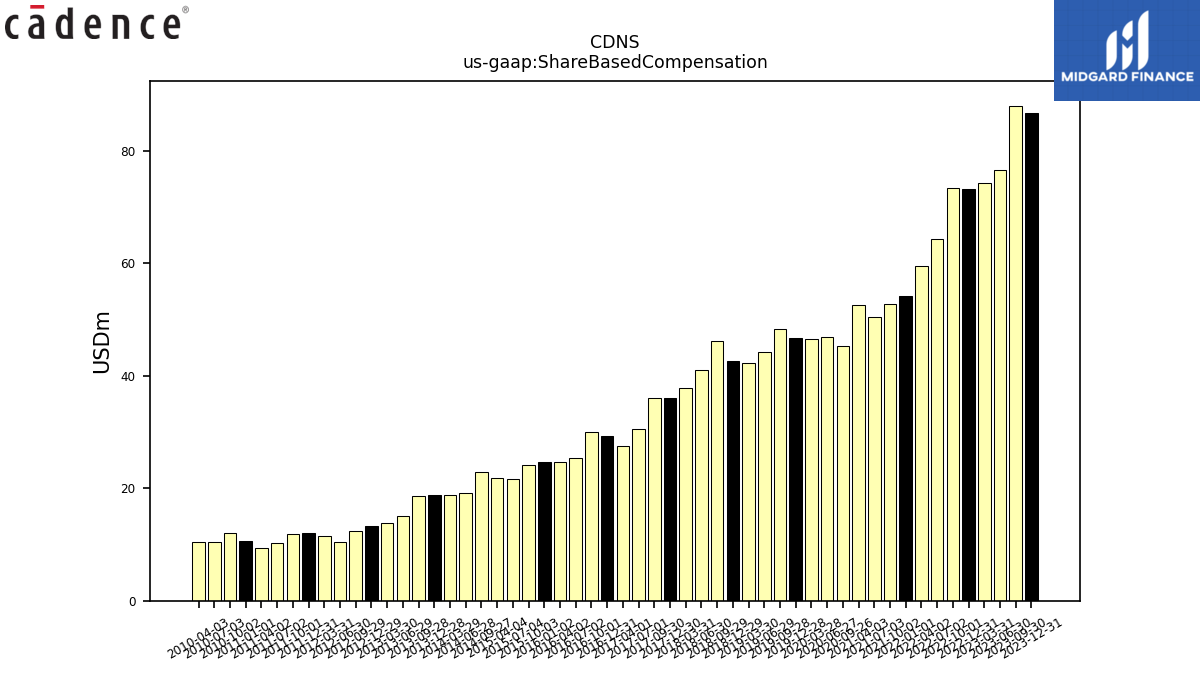
| Share Based Compensation | 86.68 | 88.03 | 76.61 | 74.29 | 73.25 | 73.45 | 64.27 | 59.47 | 54.23 | 52.75 | 50.52 | 52.60 | 45.33 | 46.91 | 46.48 | 46.76 | 48.28 | 44.26 | 42.25 | 42.59 | 46.26 | 40.96 | 37.90 | 36.02 | 36.09 | 30.48 | 27.44 | 29.23 | 30.00 | 25.36 | 24.63 | 24.66 | 24.12 | 21.70 | 21.86 | 22.88 | 19.08 | 18.86 | 18.80 | 18.57 | 15.11 | 13.81 | 13.28 | 12.40 | 10.36 | 11.53 | 12.00 | 11.89 | 10.34 | 9.36 | 10.64 | 12.01 | 10.44 | 10.37 |
| 2023-12-31 | 2023-09-30 | 2023-06-30 | 2023-03-31 | 2022-12-31 | 2022-10-01 | 2022-07-02 | 2022-04-02 | 2022-01-01 | 2021-10-02 | 2021-07-03 | 2021-04-03 | 2020-09-26 | 2020-06-27 | 2020-03-28 | 2019-12-28 | 2019-09-28 | 2019-06-29 | 2019-03-30 | 2018-12-29 | 2018-09-29 | 2018-06-30 | 2018-03-31 | 2017-12-30 | 2017-09-30 | 2017-07-01 | 2017-04-01 | 2016-12-31 | 2016-10-01 | 2016-07-02 | 2016-04-02 | 2016-01-02 | 2015-10-03 | 2015-07-04 | 2015-04-04 | 2014-09-27 | 2014-06-28 | 2014-03-29 | 2013-12-28 | 2013-09-28 | 2013-06-29 | 2013-03-30 | 2012-12-29 | 2012-09-29 | 2012-06-30 | 2012-03-31 | 2011-12-31 | 2011-10-01 | 2011-07-02 | 2011-04-02 | 2011-01-01 | 2010-10-02 | 2010-07-03 | 2010-04-03 | ||
|---|---|---|---|---|---|---|---|---|---|---|---|---|---|---|---|---|---|---|---|---|---|---|---|---|---|---|---|---|---|---|---|---|---|---|---|---|---|---|---|---|---|---|---|---|---|---|---|---|---|---|---|---|---|---|---|
| Net Cash Provided By Used In Investing Activities | -98.68 | -183.83 | -94.07 | -35.67 | -64.18 | -605.51 | -49.07 | -19.88 | -23.08 | -18.08 | -45.57 | -206.23 | -22.65 | -22.65 | -216.00 | -27.08 | -16.96 | -15.68 | -45.99 | -132.08 | -10.66 | -17.98 | -13.13 | -160.51 | -3.40 | -12.56 | -14.74 | -5.21 | 13.14 | 7.34 | -13.91 | -9.98 | -6.42 | -19.69 | -8.42 | -10.79 | -146.30 | -34.19 | -9.84 | -6.15 | -409.09 | -1.82 | -14.86 | -117.92 | -59.02 | -9.45 | -8.55 | -25.54 | -18.26 | -4.15 | -5.53 | -13.99 | -264.18 | -1.42 | |
| Payments To Acquire Property Plant And Equipment | 33.70 | 21.98 | 19.94 | 26.72 | 36.92 | 44.09 | 24.07 | 18.13 | 15.32 | 18.84 | 14.17 | 16.97 | 20.21 | 21.36 | 22.18 | 27.08 | 16.96 | 15.29 | 15.28 | 19.74 | 10.66 | 17.98 | 13.13 | 18.23 | 12.19 | 12.64 | 14.84 | 11.26 | 14.16 | 16.17 | 12.12 | 10.71 | 10.03 | 16.55 | 7.52 | 10.24 | 11.46 | 6.25 | 8.98 | 12.21 | 17.17 | 6.57 | 10.03 | 7.66 | 10.07 | 8.20 | 13.72 | 6.39 | 6.13 | 5.18 | 5.84 | 10.18 | 8.87 | 9.90 | |
| Payments To Acquire Investments | 31.02 | 115.94 | 20.16 | 9.05 | 0.00 | 0.00 | 0.00 | 1.00 | NA | NA | NA | NA | NA | 0.00 | 0.00 | 0.00 | 0.00 | 0.05 | 33.66 | 115.84 | 0.00 | 0.00 | 0.00 | NA | NA | NA | NA | NA | NA | NA | NA | NA | NA | NA | NA | NA | NA | NA | NA | NA | NA | NA | NA | NA | NA | NA | NA | NA | NA | NA | NA | NA | NA | NA |
| 2023-12-31 | 2023-09-30 | 2023-06-30 | 2023-03-31 | 2022-12-31 | 2022-10-01 | 2022-07-02 | 2022-04-02 | 2022-01-01 | 2021-10-02 | 2021-07-03 | 2021-04-03 | 2020-09-26 | 2020-06-27 | 2020-03-28 | 2019-12-28 | 2019-09-28 | 2019-06-29 | 2019-03-30 | 2018-12-29 | 2018-09-29 | 2018-06-30 | 2018-03-31 | 2017-12-30 | 2017-09-30 | 2017-07-01 | 2017-04-01 | 2016-12-31 | 2016-10-01 | 2016-07-02 | 2016-04-02 | 2016-01-02 | 2015-10-03 | 2015-07-04 | 2015-04-04 | 2014-09-27 | 2014-06-28 | 2014-03-29 | 2013-12-28 | 2013-09-28 | 2013-06-29 | 2013-03-30 | 2012-12-29 | 2012-09-29 | 2012-06-30 | 2012-03-31 | 2011-12-31 | 2011-10-01 | 2011-07-02 | 2011-04-02 | 2011-01-01 | 2010-10-02 | 2010-07-03 | 2010-04-03 | ||
|---|---|---|---|---|---|---|---|---|---|---|---|---|---|---|---|---|---|---|---|---|---|---|---|---|---|---|---|---|---|---|---|---|---|---|---|---|---|---|---|---|---|---|---|---|---|---|---|---|---|---|---|---|---|---|---|
| Net Cash Provided By Used In Financing Activities | -137.60 | -114.36 | -354.25 | -197.35 | -357.15 | 313.47 | -352.68 | -260.69 | -115.65 | -108.76 | -237.11 | -182.27 | -79.08 | -80.79 | 245.76 | -86.87 | -88.06 | -134.88 | -134.08 | -7.61 | -366.97 | -96.31 | -97.06 | 39.37 | -62.87 | -46.10 | -0.55 | -236.64 | -244.14 | -230.35 | 118.43 | -107.77 | -107.92 | -336.94 | -73.68 | -127.84 | 100.09 | -0.13 | -193.73 | -45.22 | 107.47 | 15.19 | -2.31 | 13.85 | -5.10 | 9.39 | -151.94 | 6.08 | -2.32 | 3.37 | -7.82 | -8.73 | 72.22 | 4.28 | |
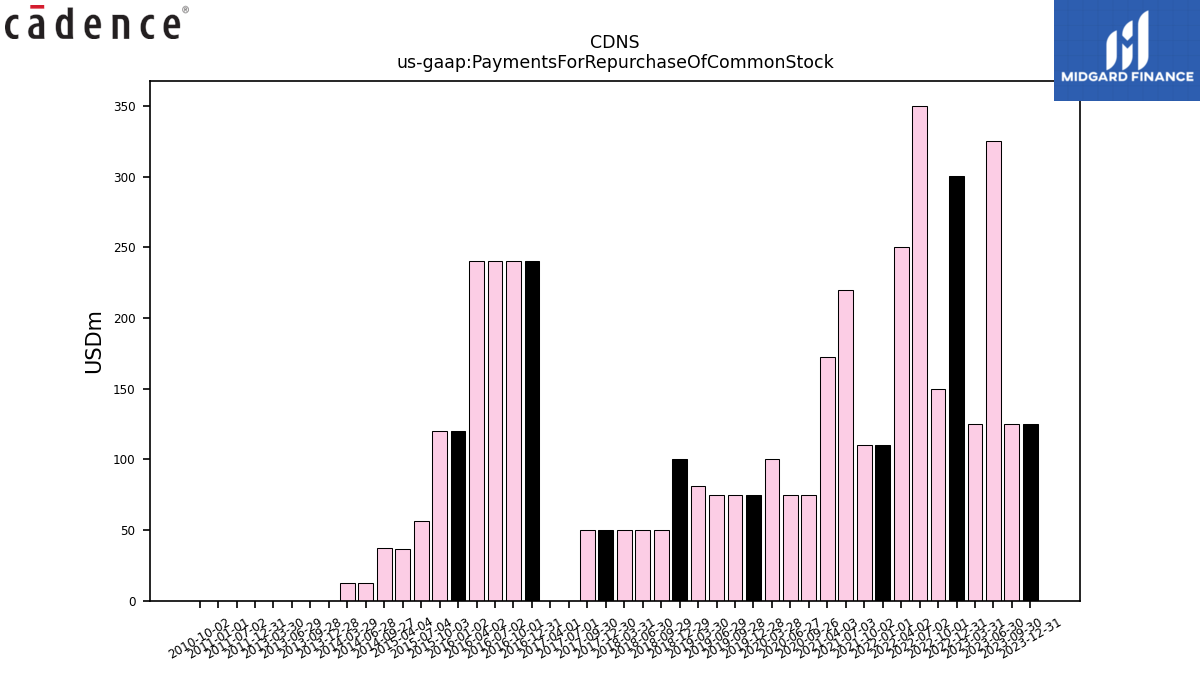
| Payments For Repurchase Of Common Stock | 125.01 | 125.01 | 325.11 | 125.01 | 300.03 | 150.01 | 350.03 | 250.02 | 110.00 | 110.01 | 220.02 | 172.27 | 75.01 | 75.01 | 100.02 | 75.02 | 75.01 | 75.01 | 81.11 | 100.02 | 50.01 | 50.01 | 50.01 | 50.01 | 50.01 | 0.00 | 0.00 | 240.09 | 240.10 | 240.10 | 240.00 | 120.05 | 120.06 | 56.28 | 36.80 | 37.54 | 12.52 | 12.52 | 0.00 | 0.00 | 0.00 | 0.00 | NA | NA | NA | NA | 0.00 | NA | 0.00 | NA | 0.00 | 0.00 | NA | NA |
| 2023-12-31 | 2023-09-30 | 2023-06-30 | 2023-03-31 | 2022-12-31 | 2022-10-01 | 2022-07-02 | 2022-04-02 | 2022-01-01 | 2021-10-02 | 2021-07-03 | 2021-04-03 | 2020-09-26 | 2020-06-27 | 2020-03-28 | 2019-12-28 | 2019-09-28 | 2019-06-29 | 2019-03-30 | 2018-12-29 | 2018-09-29 | 2018-06-30 | 2018-03-31 | 2017-12-30 | 2017-09-30 | 2017-07-01 | 2017-04-01 | 2016-12-31 | 2016-10-01 | 2016-07-02 | 2016-04-02 | 2016-01-02 | 2015-10-03 | 2015-07-04 | 2015-04-04 | 2014-09-27 | 2014-06-28 | 2014-03-29 | 2013-12-28 | 2013-09-28 | 2013-06-29 | 2013-03-30 | 2012-12-29 | 2012-09-29 | 2012-06-30 | 2012-03-31 | 2011-12-31 | 2011-10-01 | 2011-07-02 | 2011-04-02 | 2011-01-01 | 2010-10-02 | 2010-07-03 | 2010-04-03 | ||
|---|---|---|---|---|---|---|---|---|---|---|---|---|---|---|---|---|---|---|---|---|---|---|---|---|---|---|---|---|---|---|---|---|---|---|---|---|---|---|---|---|---|---|---|---|---|---|---|---|---|---|---|---|---|---|---|
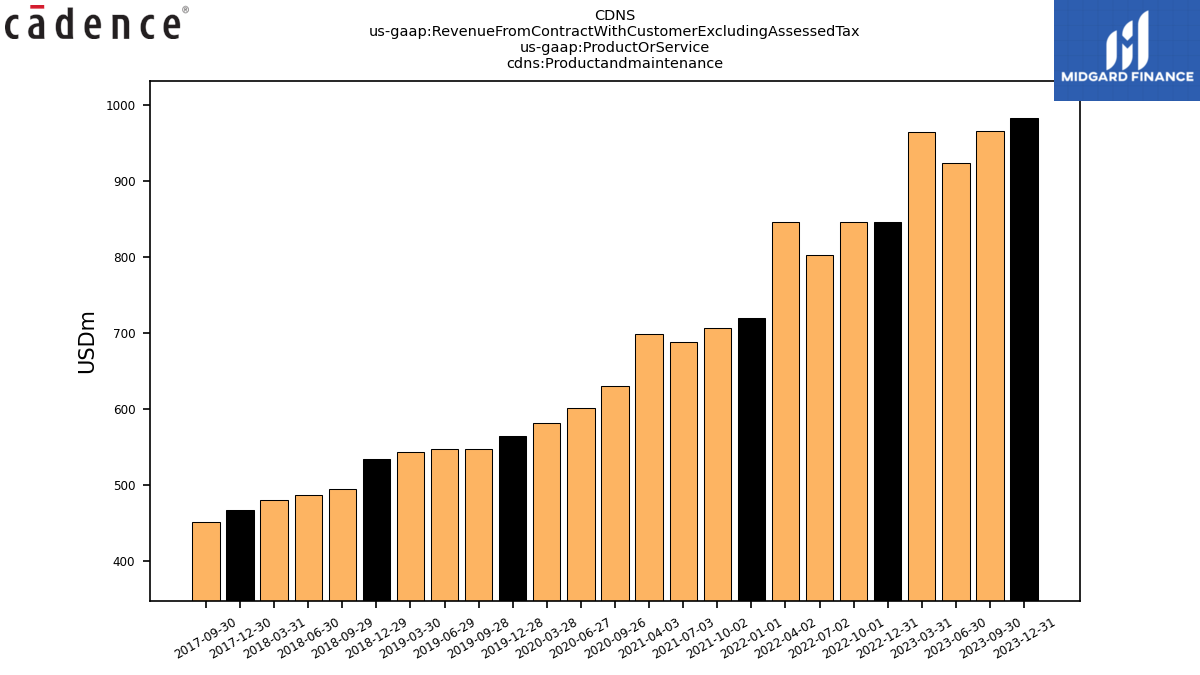
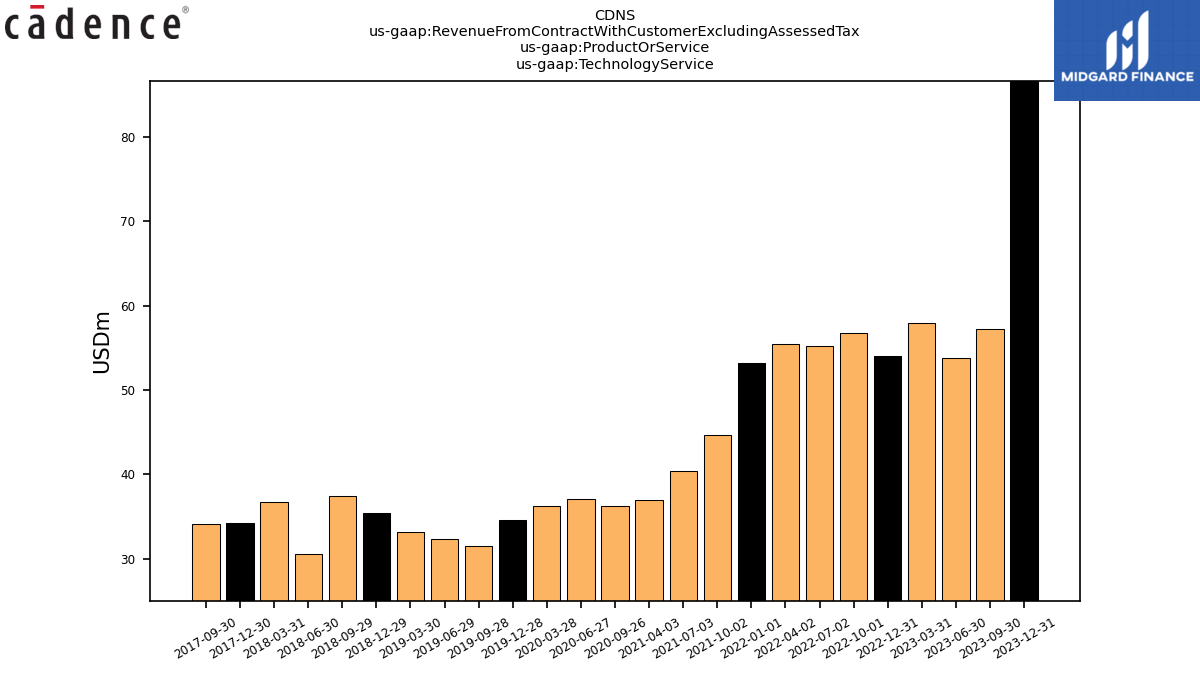
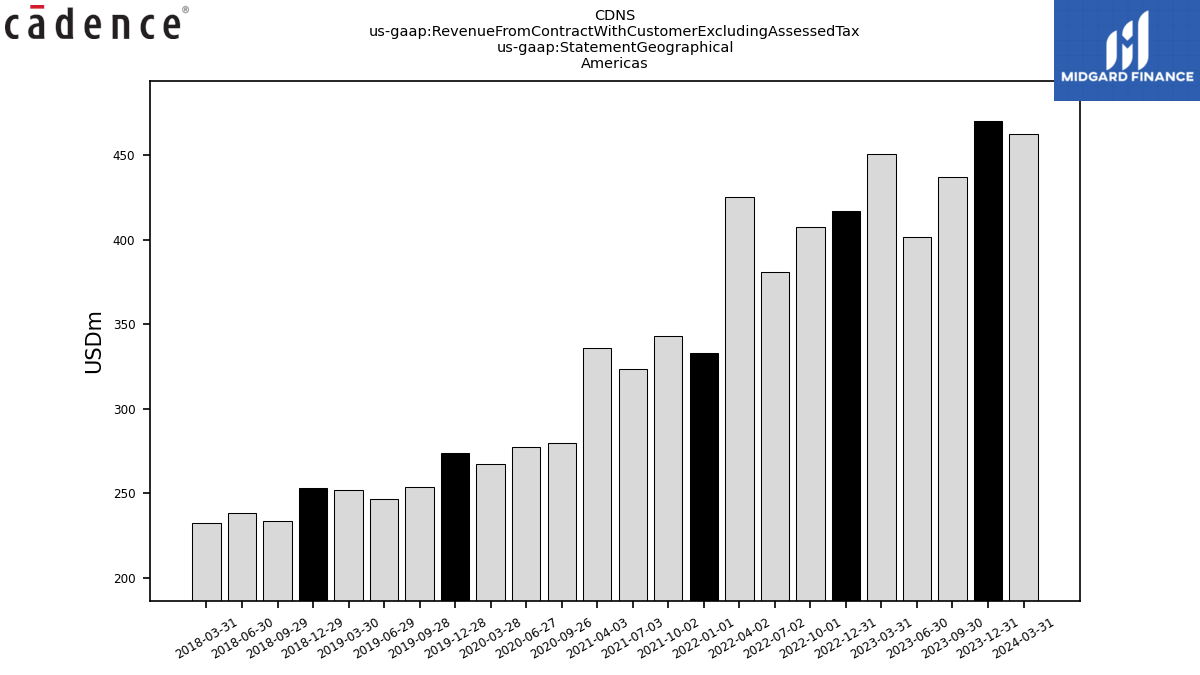
| Revenue From Contract With Customer Excluding Assessed Tax | 1068.62 | 1023.09 | 976.58 | 1021.69 | 899.88 | 902.55 | 857.52 | 901.77 | 773.04 | 750.89 | 728.28 | 736.03 | 666.61 | 638.42 | 617.96 | 599.55 | 579.60 | 580.42 | 576.74 | 569.85 | 532.47 | 518.39 | 517.31 | 501.72 | 485.40 | 479.00 | 476.91 | 468.98 | 446.22 | 453.02 | 447.86 | 441.08 | 433.76 | 415.88 | 411.37 | 400.50 | 378.79 | 378.55 | 376.72 | 366.65 | 362.48 | 354.27 | 345.58 | 338.53 | 326.48 | 315.83 | 308.01 | 292.46 | 283.27 | 266.10 | 249.02 | 237.93 | 227.06 | 221.94 | |
| Productandmaintenance | 981.99 | 965.84 | 922.79 | 963.74 | 845.88 | 845.79 | 802.28 | 846.24 | 719.85 | 706.16 | 687.88 | 699.05 | 630.33 | 601.36 | 581.70 | 564.96 | 548.11 | 548.03 | 543.52 | 534.42 | 494.99 | 487.87 | 480.61 | 467.50 | 451.23 | NA | NA | NA | NA | NA | NA | NA | NA | NA | NA | NA | NA | NA | NA | NA | NA | NA | NA | NA | NA | NA | NA | NA | NA | NA | NA | NA | NA | NA | |
| Technology Service | 86.64 | 57.25 | 53.79 | 57.95 | 54.00 | 56.77 | 55.24 | 55.52 | 53.19 | 44.73 | 40.40 | 36.97 | 36.28 | 37.06 | 36.26 | 34.59 | 31.50 | 32.39 | 33.22 | 35.43 | 37.48 | 30.52 | 36.70 | 34.22 | 34.17 | NA | NA | NA | NA | NA | NA | NA | NA | NA | NA | NA | NA | NA | NA | NA | NA | NA | NA | NA | NA | NA | NA | NA | NA | NA | NA | NA | NA | NA | |
| 470.42 | 437.35 | 401.56 | 450.46 | 417.26 | 407.39 | 381.02 | 425.34 | 332.84 | 342.95 | 323.33 | 336.00 | 280.01 | 277.12 | 267.32 | 273.96 | 253.72 | 246.51 | 251.65 | 252.89 | 233.46 | 238.35 | 232.47 | NA | NA | NA | NA | NA | NA | NA | NA | NA | NA | NA | NA | NA | NA | NA | NA | NA | NA | NA | NA | NA | NA | NA | NA | NA | NA | NA | NA | NA | NA | NA | ||
| 363.57 | 369.85 | 351.01 | 361.52 | 282.69 | 304.57 | 265.14 | 298.64 | 253.07 | 234.60 | 233.98 | 223.29 | 237.35 | 198.51 | 193.40 | 174.04 | 178.34 | 177.80 | 170.32 | 174.18 | 156.89 | 134.40 | 139.95 | 140.49 | 131.89 | NA | NA | NA | NA | NA | NA | NA | NA | NA | NA | NA | NA | NA | NA | NA | NA | NA | NA | NA | NA | NA | NA | NA | NA | NA | NA | NA | NA | NA | ||
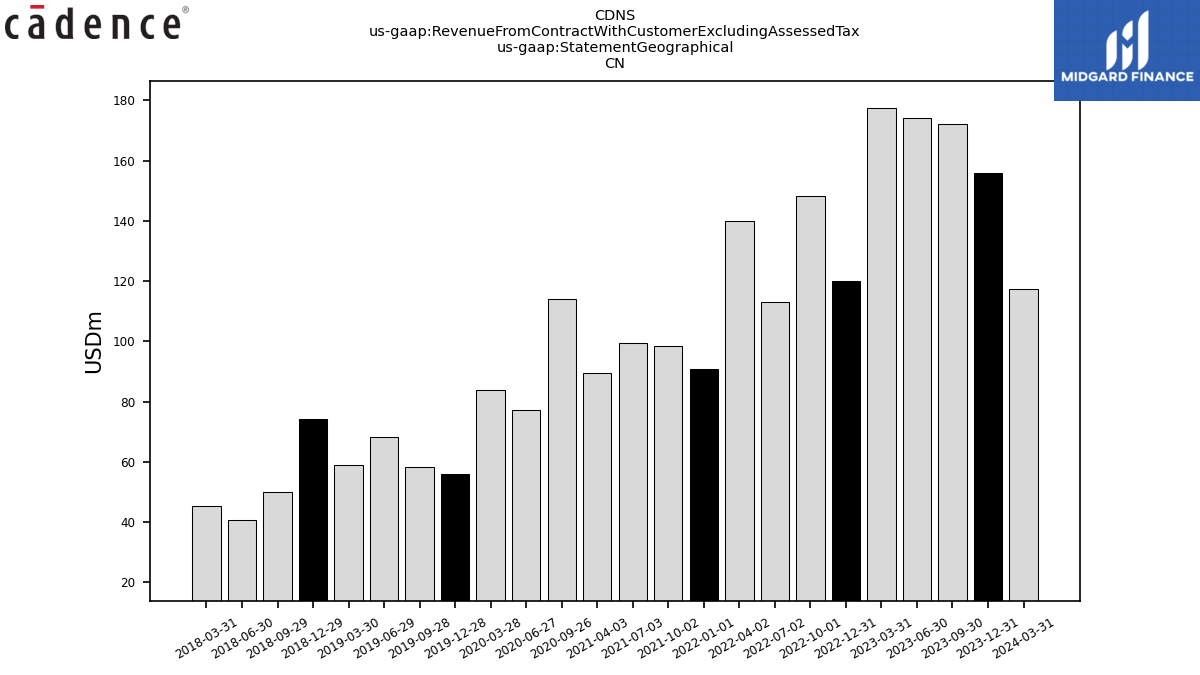
| 155.84 | 172.02 | 174.12 | 177.56 | 120.05 | 148.32 | 113.17 | 139.97 | 90.80 | 98.33 | 99.59 | 89.44 | 114.16 | 77.23 | 83.80 | 55.90 | 58.22 | 68.38 | 58.98 | 74.29 | 49.99 | 40.62 | 45.29 | NA | NA | NA | NA | NA | NA | NA | NA | NA | NA | NA | NA | NA | NA | NA | NA | NA | NA | NA | NA | NA | NA | NA | NA | NA | NA | NA | NA | NA | NA | NA | ||
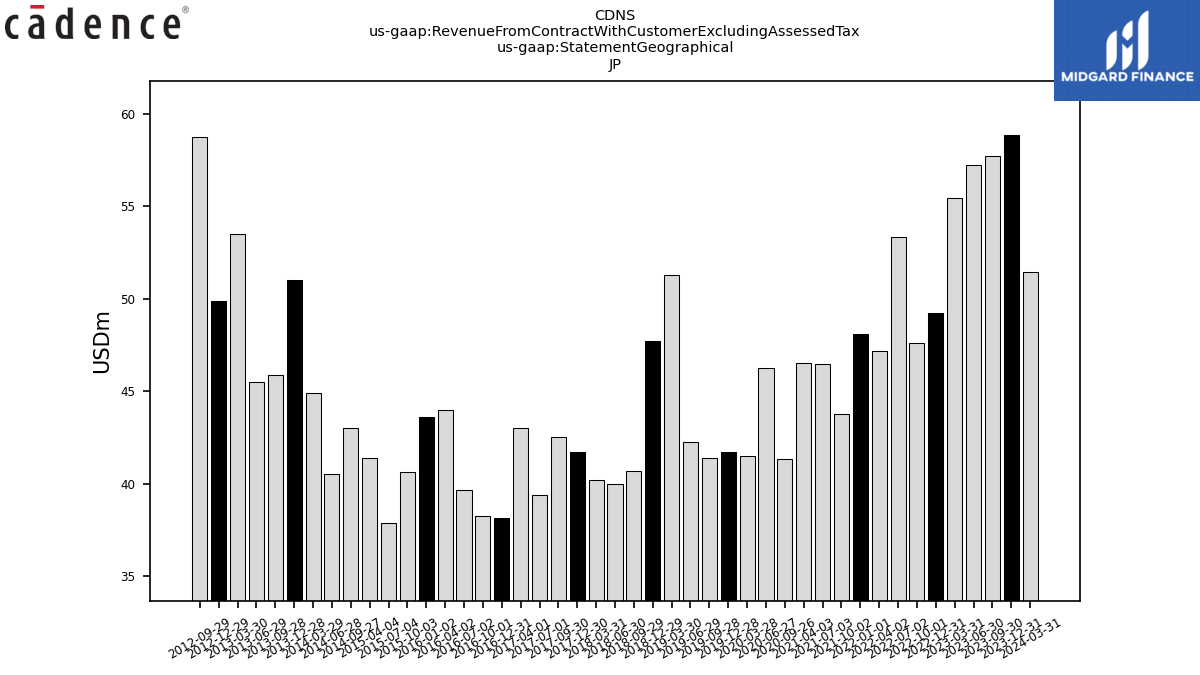
| 58.83 | 57.70 | 57.20 | 55.44 | 49.24 | 47.61 | 53.33 | 47.15 | 48.08 | 43.74 | 46.48 | 46.51 | 41.33 | 46.25 | 41.51 | 41.68 | 41.40 | 42.27 | 51.30 | 47.73 | 40.67 | 39.96 | 40.19 | 41.71 | 42.54 | 39.40 | 42.98 | 38.14 | 38.25 | 39.66 | 43.96 | 43.58 | 40.63 | 37.84 | 41.39 | 42.98 | 40.50 | 44.89 | 51.01 | 45.85 | 45.47 | 53.47 | 49.88 | 58.76 | NA | NA | NA | NA | NA | NA | NA | NA | NA | NA | ||
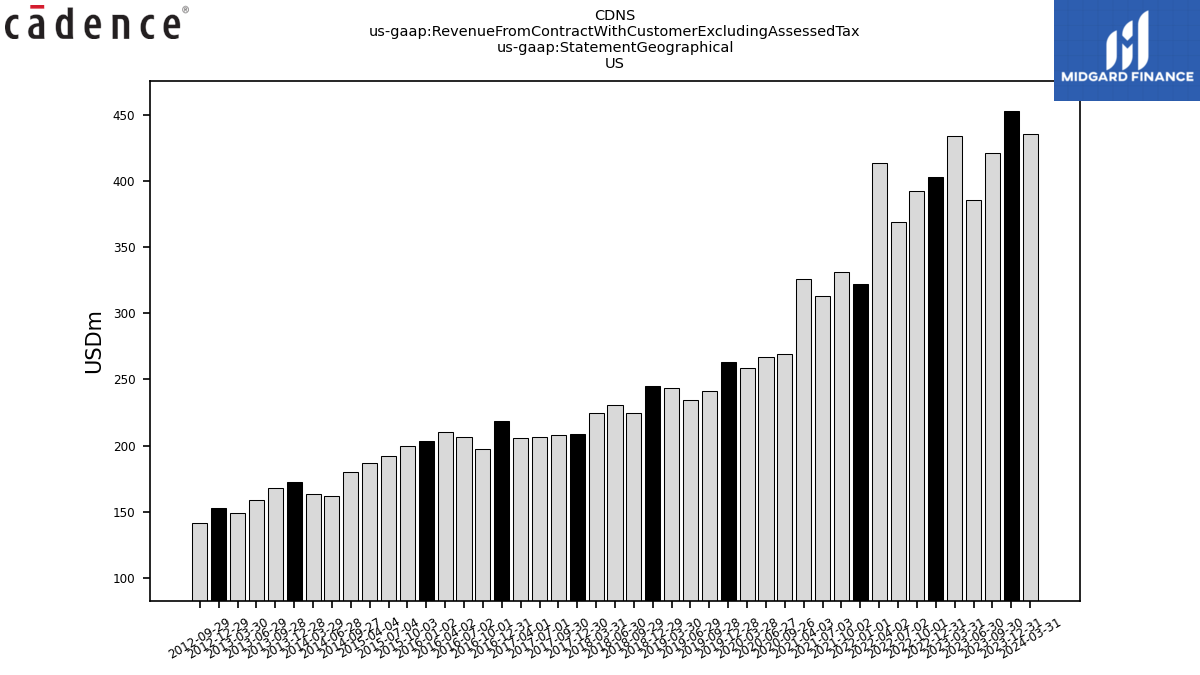
| US | 453.04 | 421.55 | 385.60 | 434.35 | 403.15 | 392.22 | 368.97 | 413.54 | 322.06 | 331.46 | 313.14 | 326.32 | 269.06 | 267.00 | 258.49 | 263.58 | 241.06 | 234.49 | 243.25 | 244.71 | 224.46 | 230.67 | 224.80 | 208.91 | 208.35 | 206.74 | 205.44 | 218.43 | 197.72 | 206.42 | 210.02 | 203.41 | 199.63 | 192.18 | 187.21 | 179.88 | 161.87 | 163.12 | 172.19 | 168.12 | 159.23 | 149.17 | 152.72 | 141.51 | NA | NA | NA | NA | NA | NA | NA | NA | NA | NA | |
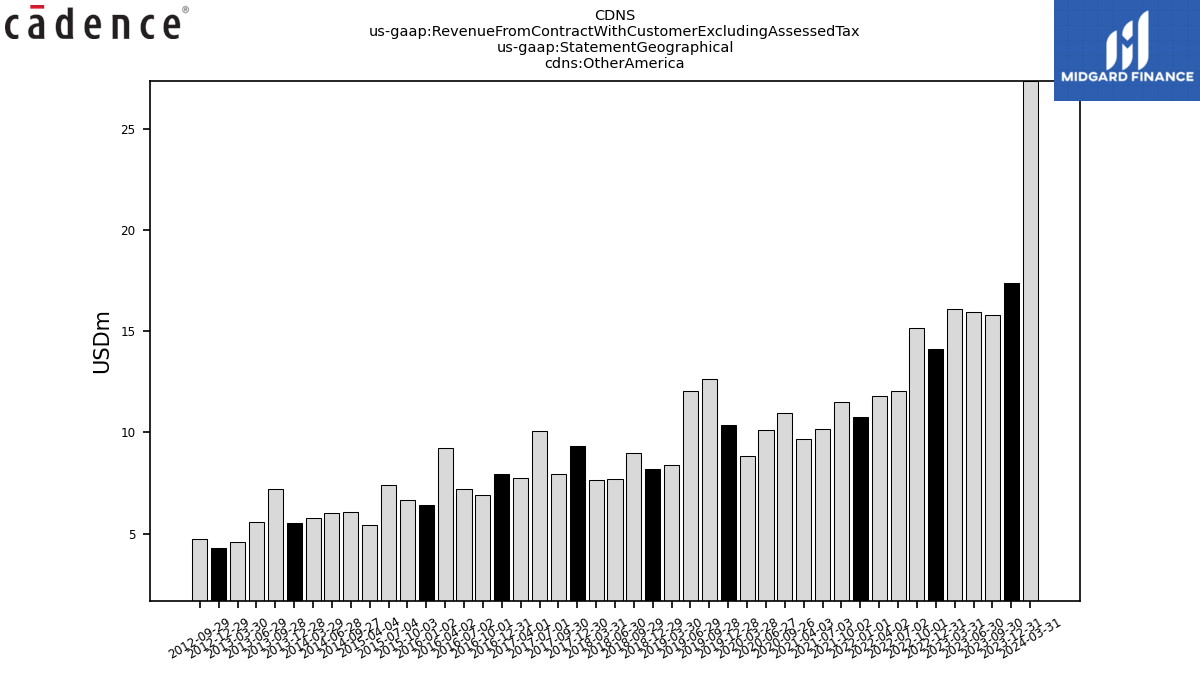
| Other America | 17.38 | 15.80 | 15.97 | 16.12 | 14.11 | 15.16 | 12.04 | 11.80 | 10.79 | 11.49 | 10.19 | 9.68 | 10.96 | 10.12 | 8.84 | 10.38 | 12.66 | 12.03 | 8.41 | 8.18 | 9.00 | 7.68 | 7.67 | 9.32 | 7.94 | 10.06 | 7.75 | 7.93 | 6.92 | 7.20 | 9.24 | 6.44 | 6.68 | 7.42 | 5.41 | 6.07 | 6.05 | 5.78 | 5.55 | 7.21 | 5.57 | 4.62 | 4.31 | 4.73 | NA | NA | NA | NA | NA | NA | NA | NA | NA | NA | |
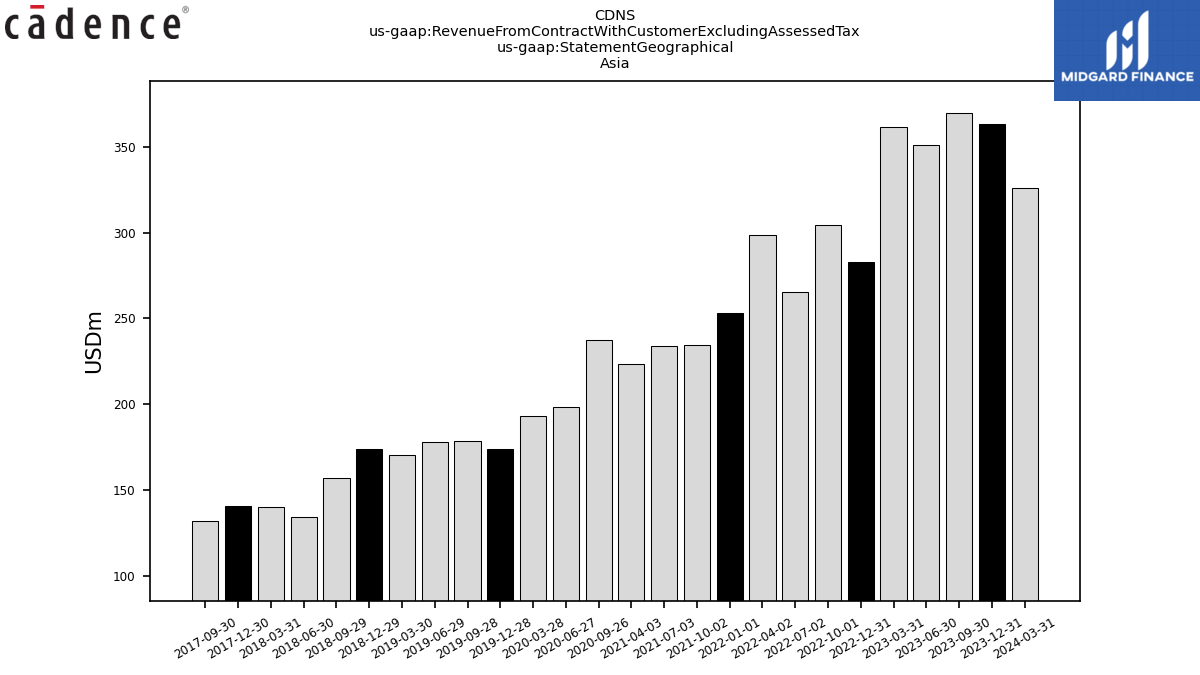
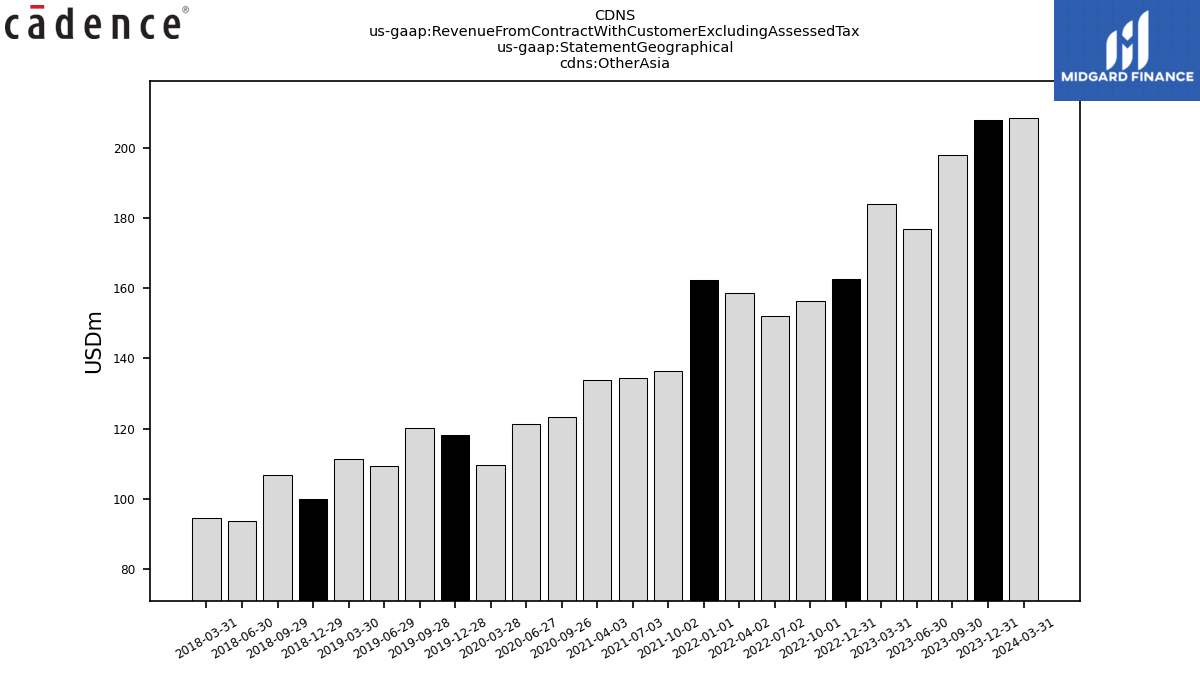
| Other Asia | 207.72 | 197.83 | 176.89 | 183.96 | 162.64 | 156.25 | 151.97 | 158.67 | 162.26 | 136.27 | 134.39 | 133.85 | 123.19 | 121.28 | 109.60 | 118.13 | 120.12 | 109.42 | 111.35 | 99.89 | 106.90 | 93.78 | 94.65 | NA | NA | NA | NA | NA | NA | NA | NA | NA | NA | NA | NA | NA | NA | NA | NA | NA | NA | NA | NA | NA | NA | NA | NA | NA | NA | NA | NA | NA | NA | NA | |
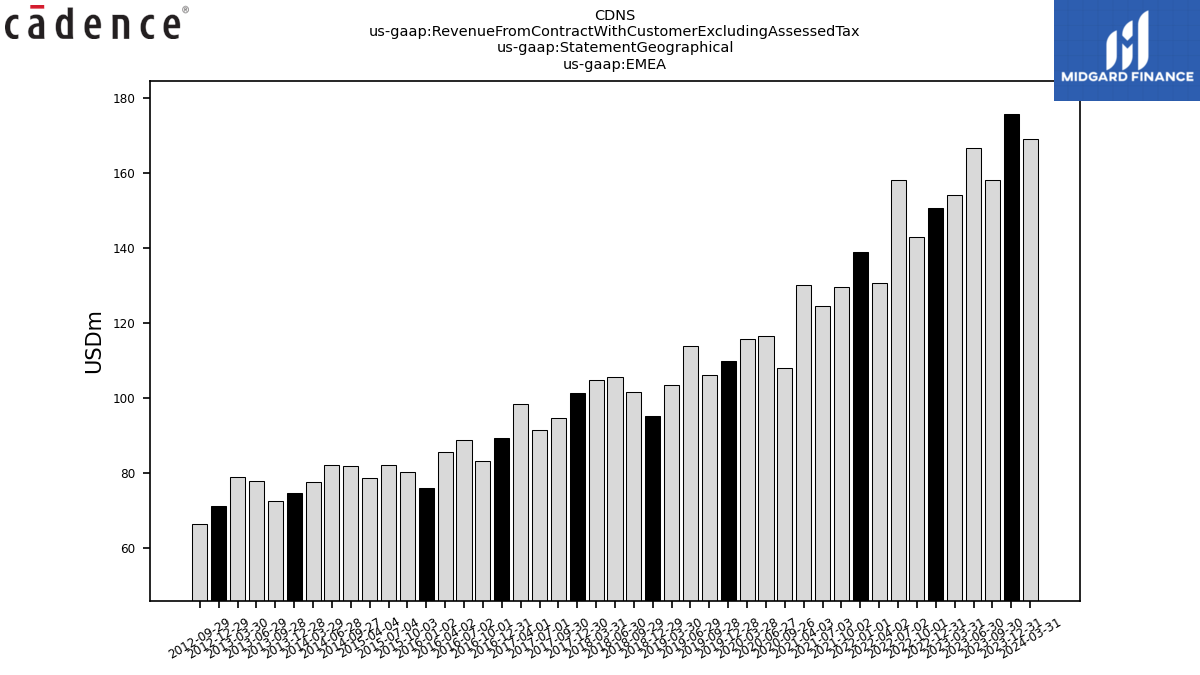
| EMEA | 175.81 | 158.19 | 166.80 | 154.27 | 150.69 | 142.98 | 158.04 | 130.63 | 139.05 | 129.61 | 124.50 | 130.23 | 107.91 | 116.54 | 115.72 | 109.87 | 106.15 | 113.83 | 103.46 | 95.04 | 101.45 | 105.67 | 104.71 | 101.29 | 94.68 | 91.41 | 98.32 | 89.39 | 83.12 | 88.72 | 85.46 | 75.91 | 80.19 | 82.01 | 78.57 | 81.92 | 82.07 | 77.53 | 74.54 | 72.38 | 77.76 | 78.92 | 71.28 | 66.39 | NA | NA | NA | NA | NA | NA | NA | NA | NA | NA |