

| 2024-02-29 | 2023-11-30 | 2023-08-31 | 2023-05-31 | 2023-02-28 | 2022-11-30 | 2022-08-31 | 2022-05-31 | 2022-02-28 | 2021-11-30 | 2021-08-31 | 2021-05-31 | 2021-02-28 | 2020-11-30 | 2020-08-31 | 2020-05-31 | 2020-02-29 | 2019-11-30 | 2019-08-31 | 2019-05-31 | 2019-02-28 | 2018-11-30 | 2018-08-31 | 2018-05-31 | 2018-02-28 | 2017-11-30 | 2017-08-31 | 2017-05-31 | 2017-02-28 | 2016-11-30 | 2016-08-31 | 2016-05-31 | 2016-02-29 | 2015-11-30 | 2015-08-31 | ||
|---|---|---|---|---|---|---|---|---|---|---|---|---|---|---|---|---|---|---|---|---|---|---|---|---|---|---|---|---|---|---|---|---|---|---|---|---|
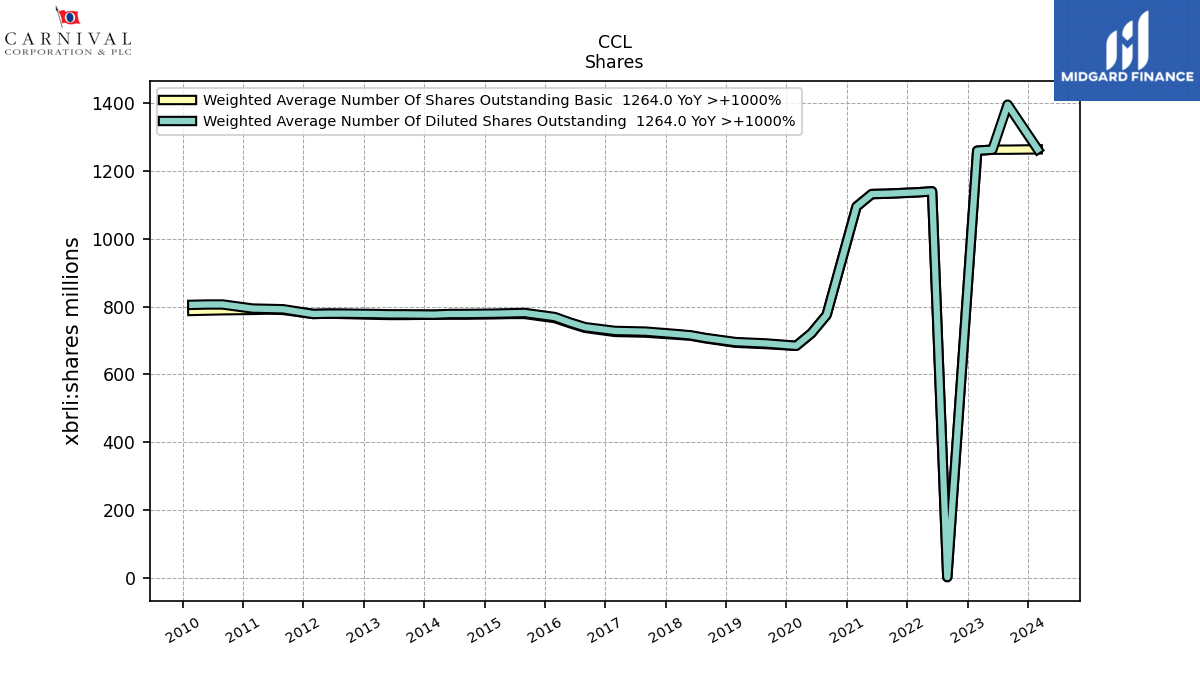
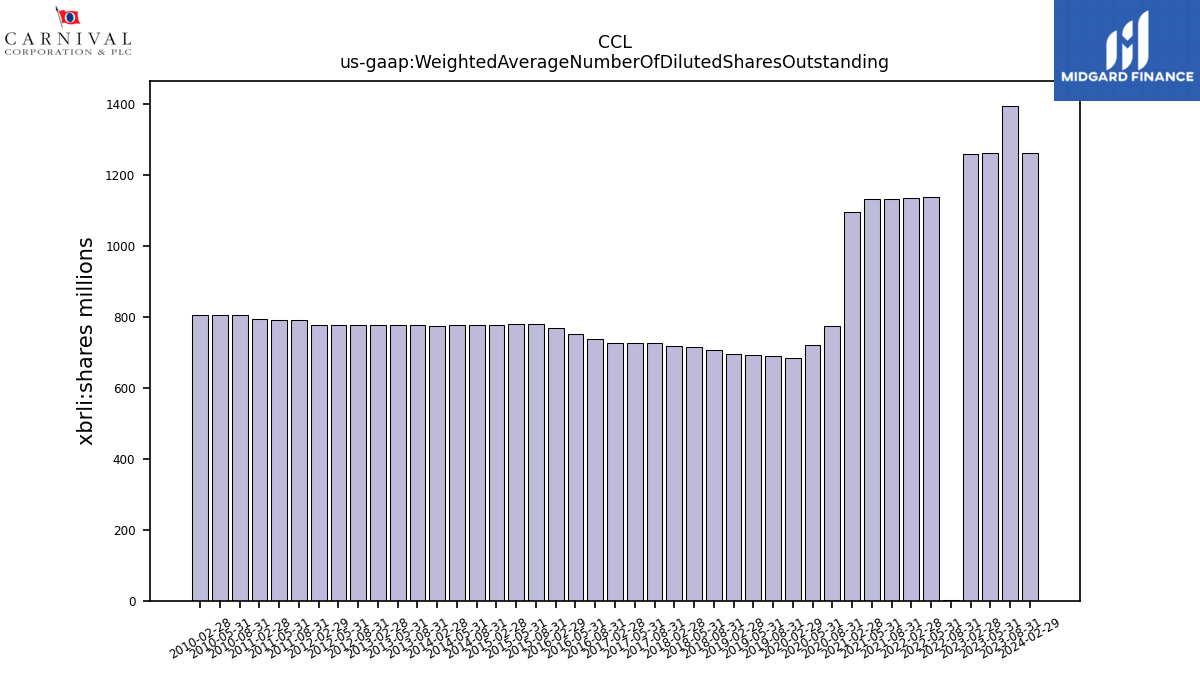
| Weighted Average Number Of Diluted Shares Outstanding | 1264.00 | NA | 1396.00 | 1263.00 | 1260.00 | NA | 1.19 | 1140.00 | 1137.00 | NA | 1133.00 | 1132.00 | 1095.00 | NA | 775.00 | 721.00 | 684.00 | NA | 691.00 | 693.00 | 695.00 | NA | 707.00 | 715.00 | 719.00 | NA | 726.00 | 727.00 | 728.00 | NA | 739.00 | 753.00 | 769.00 | NA | 781.00 | |
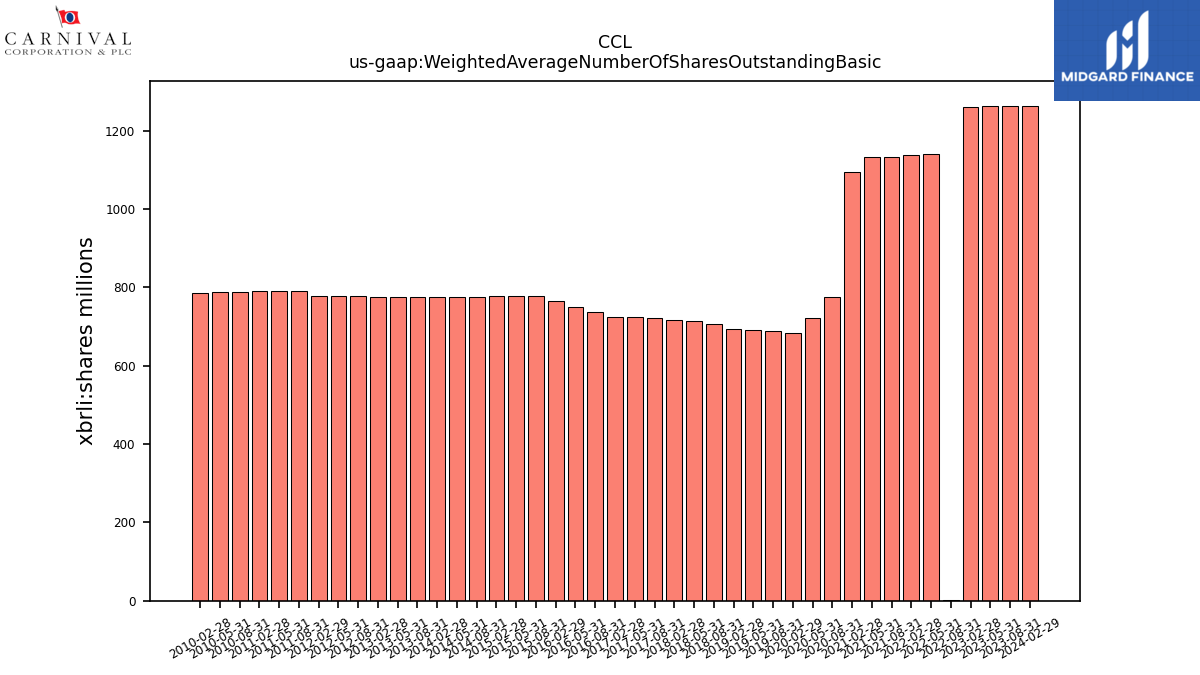
| Weighted Average Number Of Shares Outstanding Basic | 1264.00 | NA | 1263.00 | 1263.00 | 1260.00 | NA | 1.19 | 1140.00 | 1137.00 | NA | 1133.00 | 1132.00 | 1095.00 | NA | 775.00 | 721.00 | 684.00 | NA | 689.00 | 691.00 | 693.00 | NA | 706.00 | 714.00 | 717.00 | NA | 723.00 | 724.00 | 725.00 | NA | 737.00 | 751.00 | 766.00 | NA | 778.00 | |
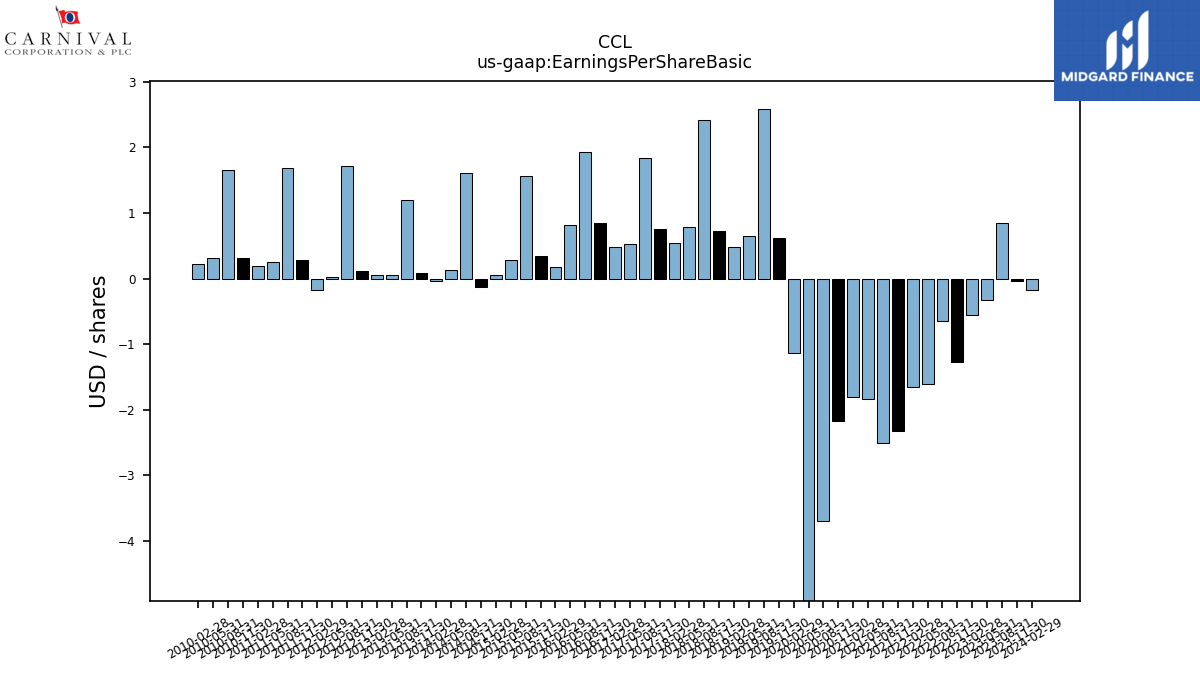
| Earnings Per Share Basic | -0.17 | -0.04 | 0.85 | -0.32 | -0.55 | -1.27 | -0.65 | -1.61 | -1.66 | -2.32 | -2.50 | -1.83 | -1.80 | -2.17 | -3.69 | -6.07 | -1.14 | 0.62 | 2.58 | 0.65 | 0.48 | 0.72 | 2.42 | 0.79 | 0.54 | 0.76 | 1.84 | 0.52 | 0.48 | 0.84 | 1.93 | 0.81 | 0.18 | 0.35 | 1.56 | |
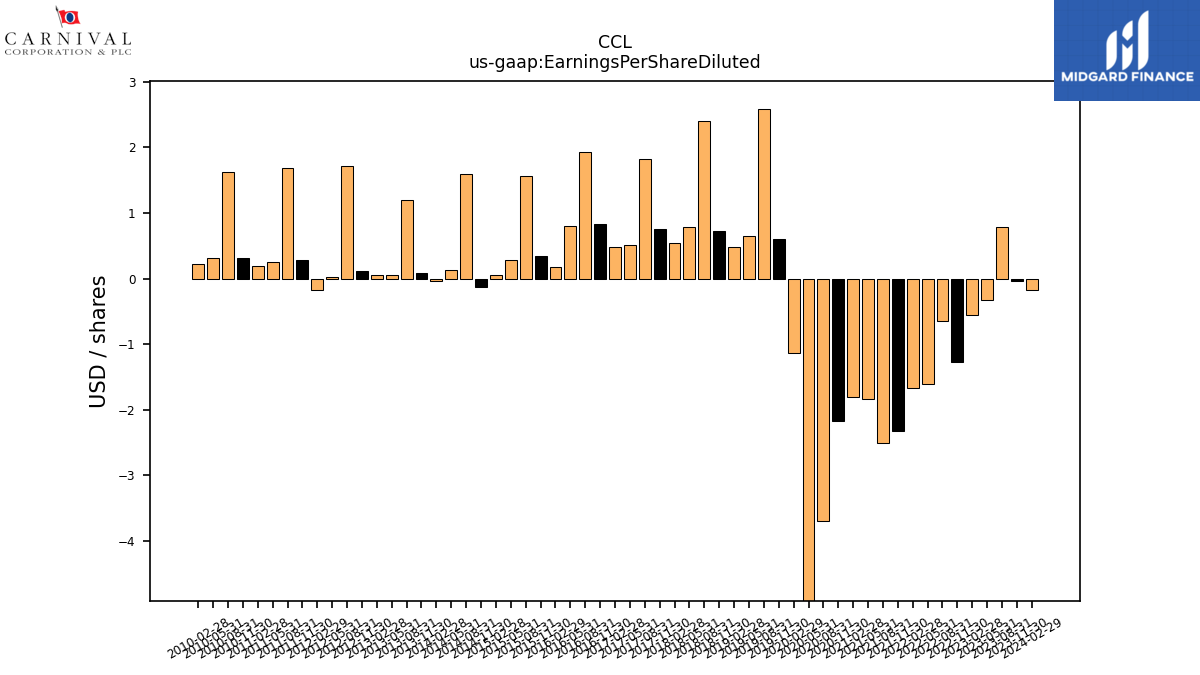
| Earnings Per Share Diluted | -0.17 | -0.04 | 0.79 | -0.32 | -0.55 | -1.27 | -0.65 | -1.61 | -1.66 | -2.32 | -2.50 | -1.83 | -1.80 | -2.17 | -3.69 | -6.07 | -1.14 | 0.61 | 2.58 | 0.65 | 0.48 | 0.72 | 2.41 | 0.78 | 0.54 | 0.75 | 1.83 | 0.52 | 0.48 | 0.84 | 1.93 | 0.80 | 0.18 | 0.35 | 1.56 |
| 2024-02-29 | 2023-11-30 | 2023-08-31 | 2023-05-31 | 2023-02-28 | 2022-11-30 | 2022-08-31 | 2022-05-31 | 2022-02-28 | 2021-11-30 | 2021-08-31 | 2021-05-31 | 2021-02-28 | 2020-11-30 | 2020-08-31 | 2020-05-31 | 2020-02-29 | 2019-11-30 | 2019-08-31 | 2019-05-31 | 2019-02-28 | 2018-11-30 | 2018-08-31 | 2018-05-31 | 2018-02-28 | 2017-11-30 | 2017-08-31 | 2017-05-31 | 2017-02-28 | 2016-11-30 | 2016-08-31 | 2016-05-31 | 2016-02-29 | 2015-11-30 | 2015-08-31 | ||
|---|---|---|---|---|---|---|---|---|---|---|---|---|---|---|---|---|---|---|---|---|---|---|---|---|---|---|---|---|---|---|---|---|---|---|---|---|
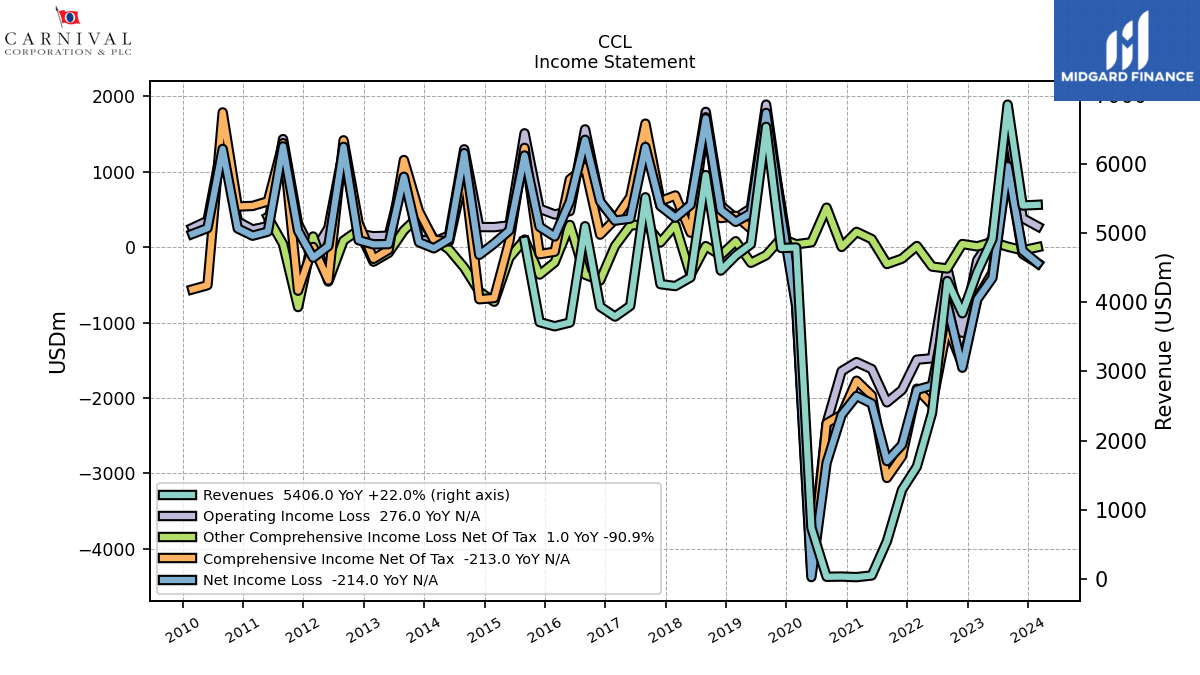
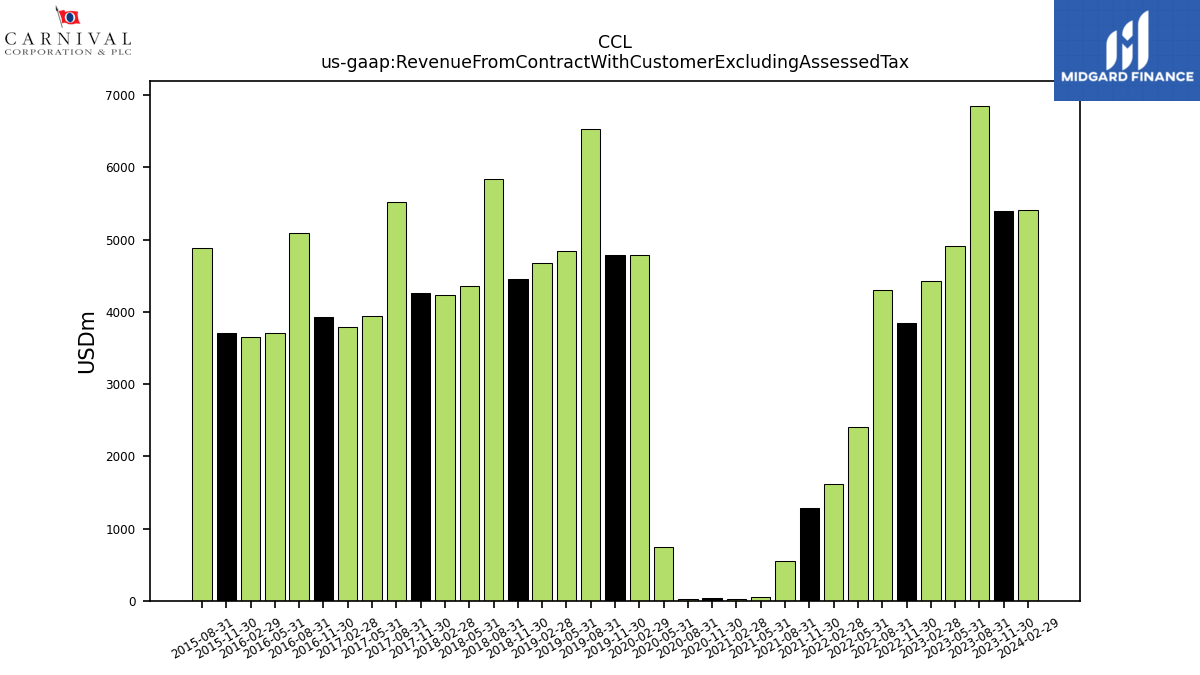
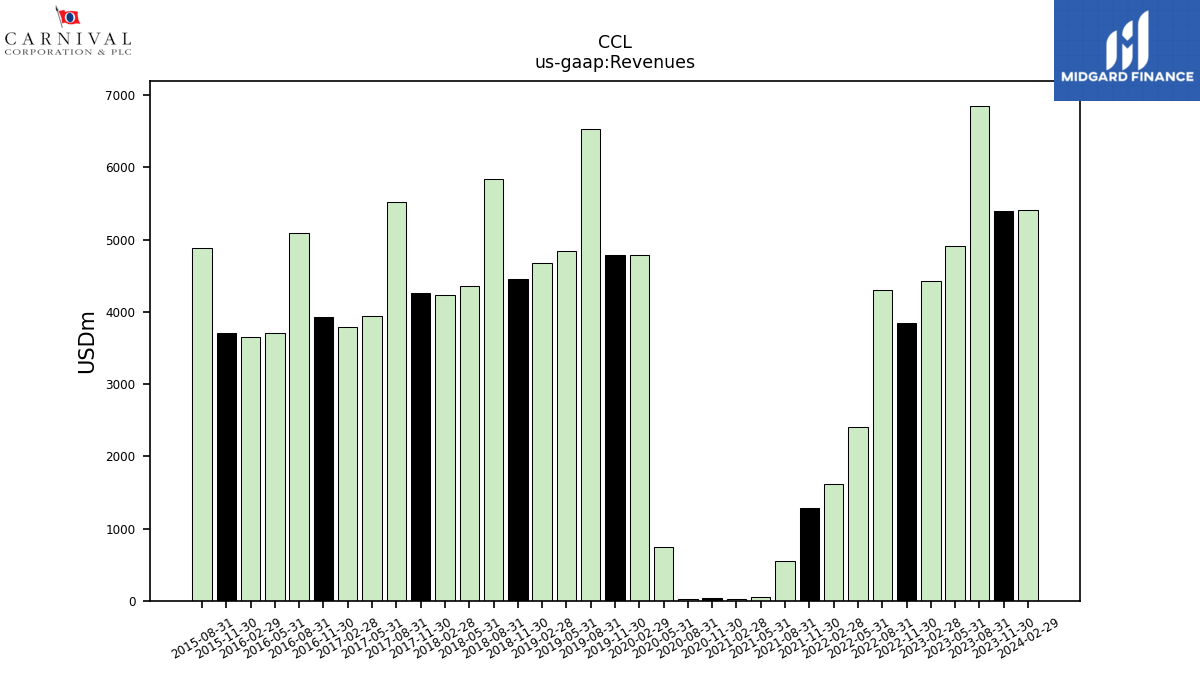
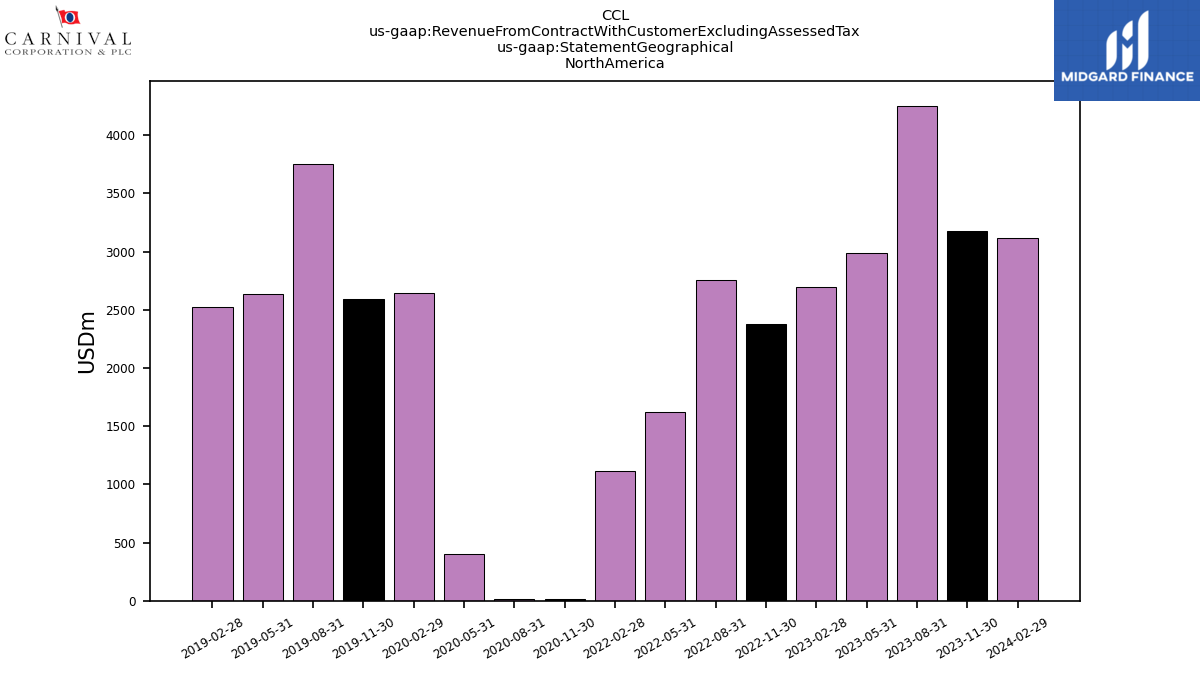
| Revenue From Contract With Customer Excluding Assessed Tax | 5406.00 | 5396.00 | 6854.00 | 4911.00 | 4432.00 | 3839.00 | 4305.00 | 2401.00 | 1623.00 | 1287.00 | 546.00 | 50.00 | 26.00 | 34.00 | 31.00 | 740.00 | 4789.00 | 4782.00 | 6533.00 | 4838.00 | 4673.00 | 4456.00 | 5836.00 | 4357.00 | 4232.00 | 4259.00 | 5515.00 | 3945.00 | 3791.00 | 3935.00 | 5097.00 | 3705.00 | 3651.00 | 3711.00 | 4883.00 | |
| Revenues | 5406.00 | 5396.00 | 6854.00 | 4911.00 | 4432.00 | 3839.00 | 4305.00 | 2401.00 | 1623.00 | 1287.00 | 546.00 | 50.00 | 26.00 | 34.00 | 31.00 | 740.00 | 4789.00 | 4782.00 | 6533.00 | 4838.00 | 4673.00 | 4456.00 | 5836.00 | 4357.00 | 4232.00 | 4259.00 | 5515.00 | 3945.00 | 3791.00 | 3935.00 | 5097.00 | 3705.00 | 3651.00 | 3711.00 | 4883.00 | |
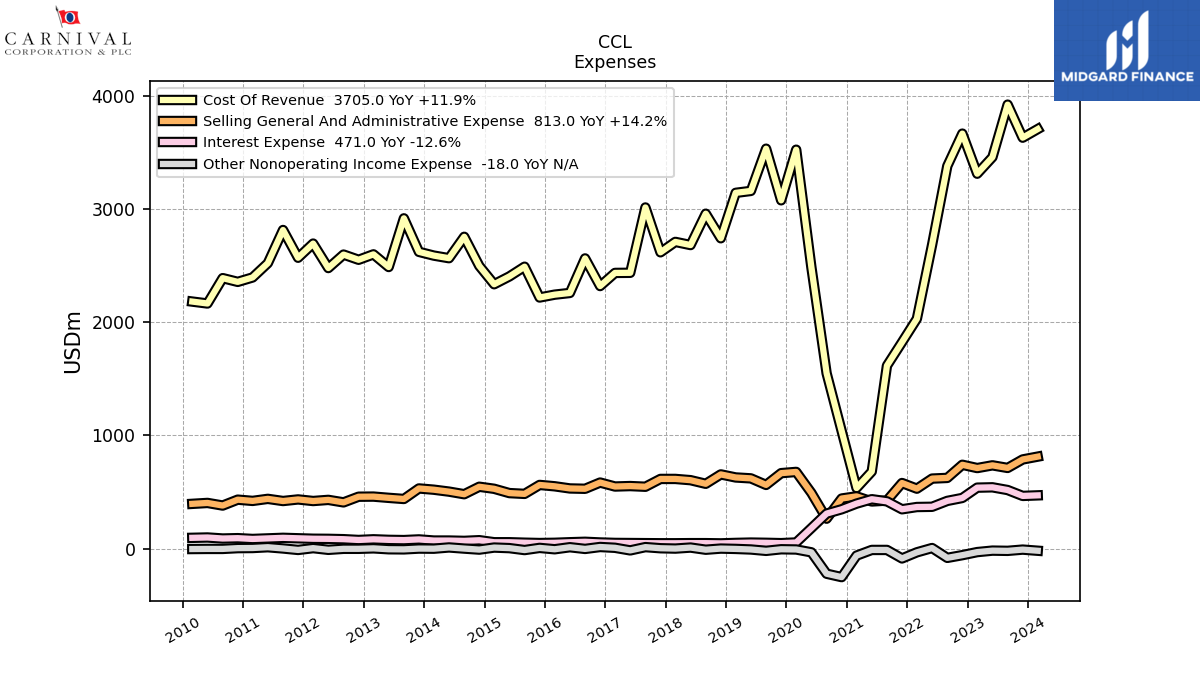
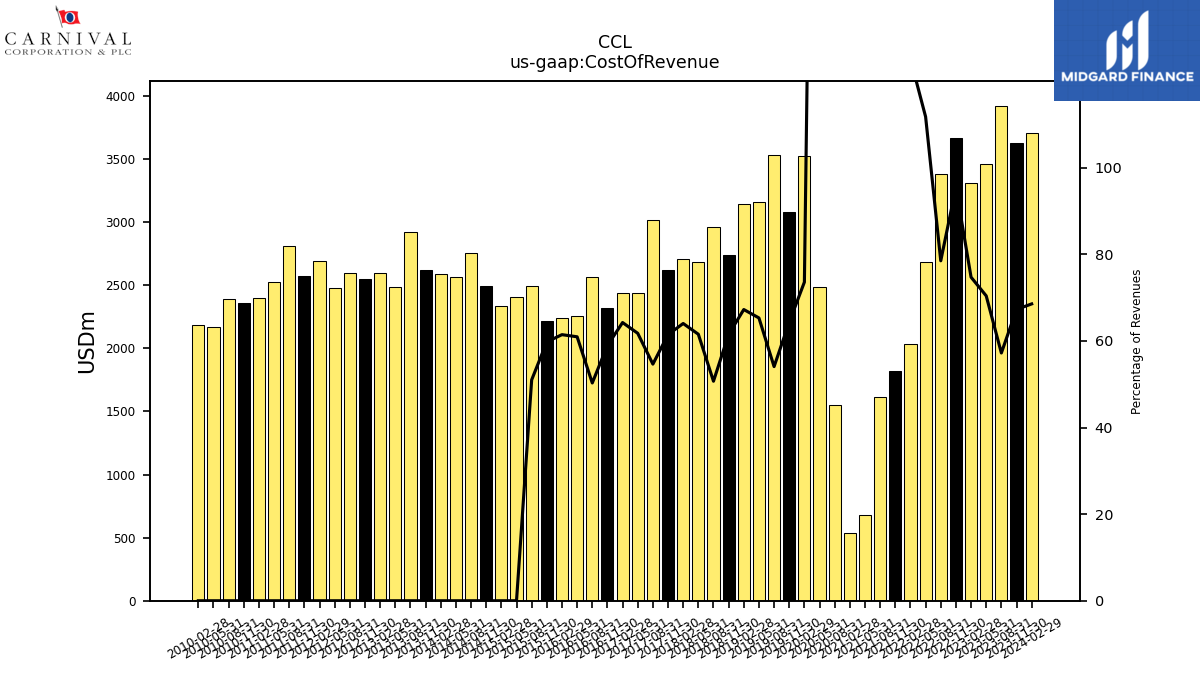
| Cost Of Revenue | 3705.00 | 3629.00 | 3921.00 | 3457.00 | 3311.00 | 3665.00 | 3379.00 | 2683.00 | 2030.00 | 1823.00 | 1616.00 | 681.00 | 535.00 | NA | 1549.00 | 2484.00 | 3523.00 | 3076.00 | 3532.00 | 3159.00 | 3142.00 | 2741.00 | 2958.00 | 2681.00 | 2709.00 | 2617.00 | 3013.00 | 2436.00 | 2435.00 | 2319.00 | 2563.00 | 2258.00 | 2243.00 | 2218.00 | 2490.00 | |
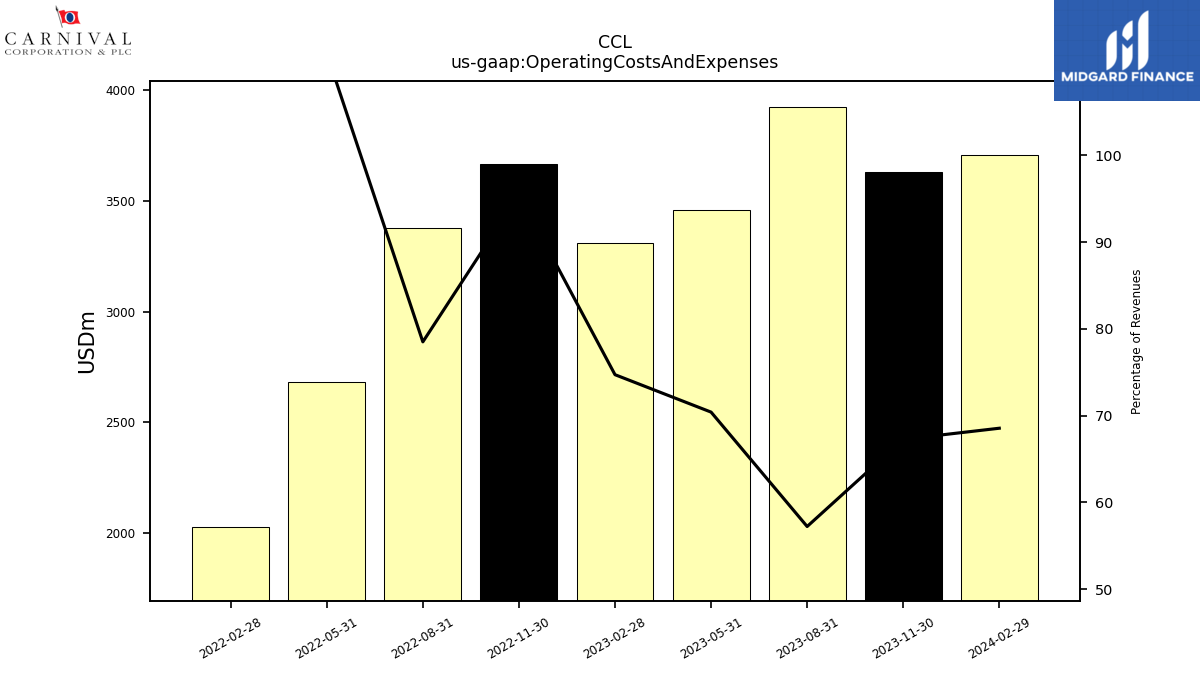
| Operating Costs And Expenses | 3705.00 | 3629.00 | 3921.00 | 3457.00 | 3311.00 | 3665.00 | 3379.00 | 2683.00 | 2030.00 | NA | NA | NA | NA | NA | NA | NA | NA | NA | NA | NA | NA | NA | NA | NA | NA | NA | NA | NA | NA | NA | NA | NA | NA | NA | NA | |
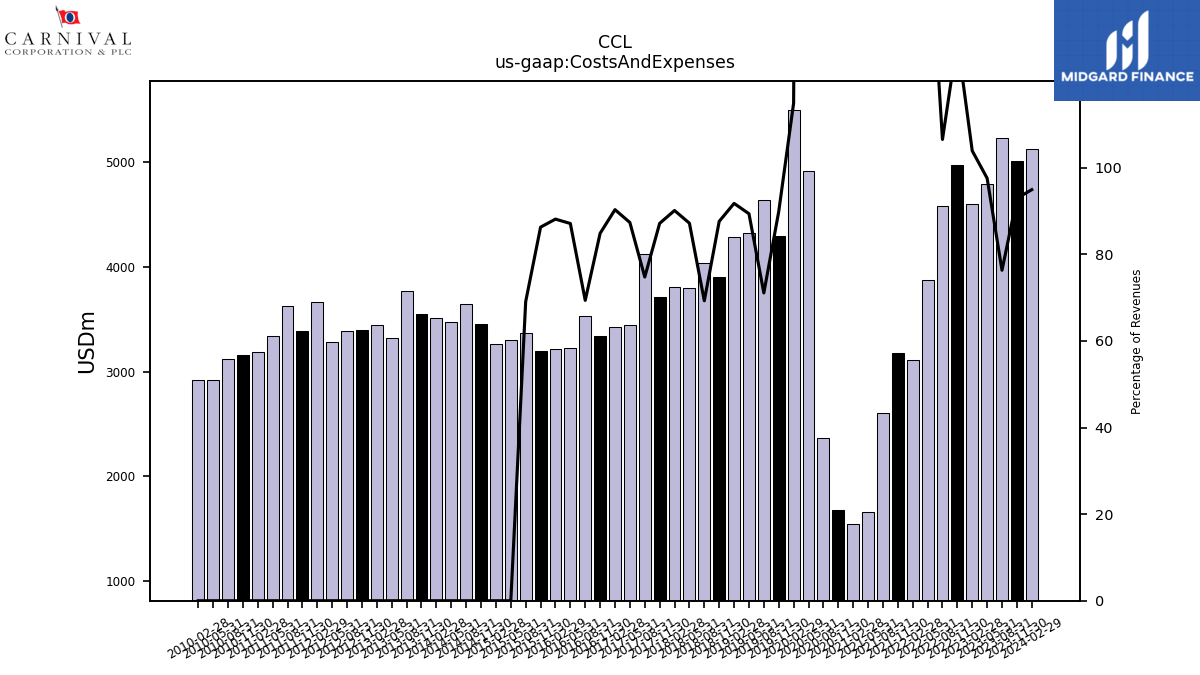
| Costs And Expenses | 5131.00 | 5013.00 | 5230.00 | 4791.00 | 4604.00 | 4974.00 | 4585.00 | 3874.00 | 3114.00 | 3180.00 | 2603.00 | 1665.00 | 1549.00 | 1676.00 | 2364.00 | 4918.00 | 5502.00 | 4297.00 | 4643.00 | 4323.00 | 4287.00 | 3903.00 | 4042.00 | 3798.00 | 3813.00 | 3711.00 | 4122.00 | 3445.00 | 3423.00 | 3338.00 | 3535.00 | 3227.00 | 3217.00 | 3201.00 | 3373.00 | |
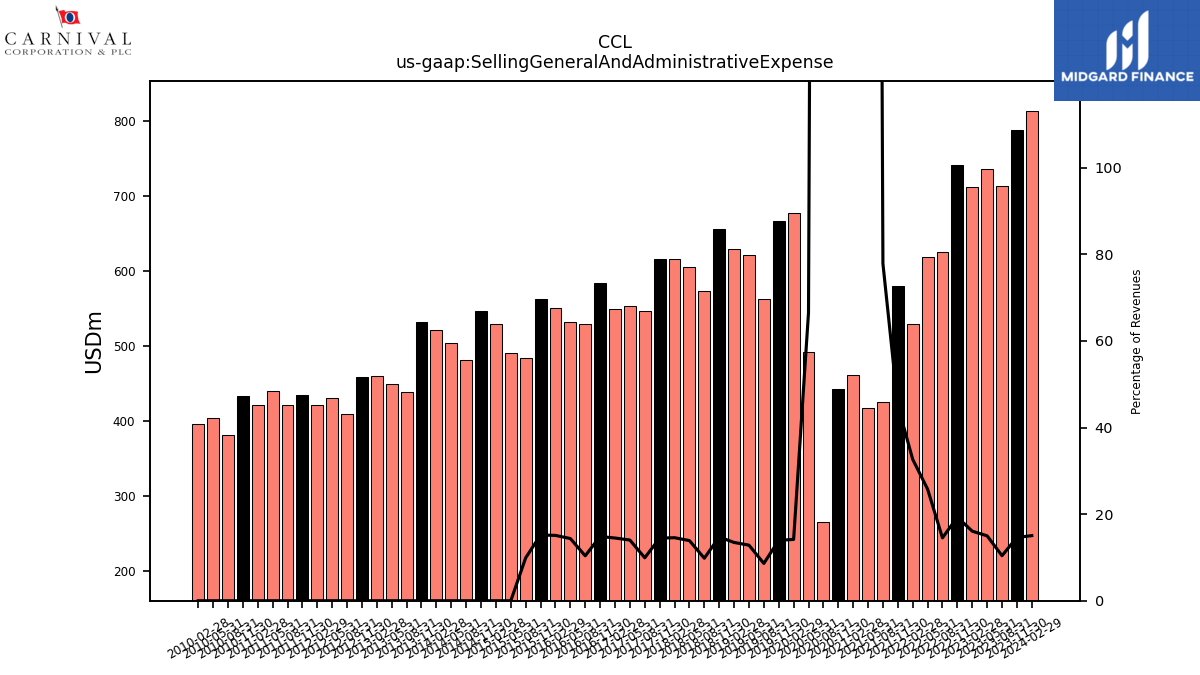
| Selling General And Administrative Expense | 813.00 | 788.00 | 713.00 | 736.00 | 712.00 | 741.00 | 625.00 | 619.00 | 530.00 | 580.00 | 425.00 | 417.00 | 462.00 | 443.00 | 265.00 | 492.00 | 678.00 | 667.00 | 563.00 | 621.00 | 629.00 | 656.00 | 573.00 | 605.00 | 616.00 | 616.00 | 547.00 | 553.00 | 549.00 | 584.00 | 529.00 | 532.00 | 551.00 | 563.00 | 484.00 | |
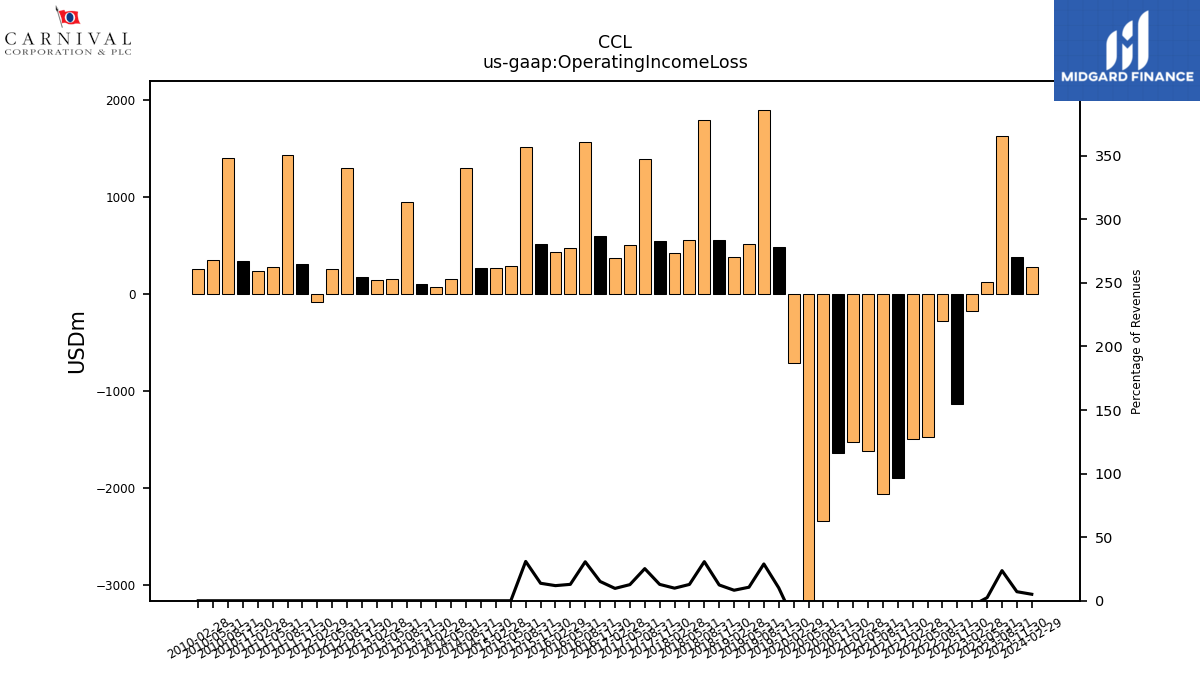
| Operating Income Loss | 276.00 | 384.00 | 1624.00 | 120.00 | -172.00 | -1135.00 | -279.00 | -1473.00 | -1491.00 | -1893.00 | -2057.00 | -1616.00 | -1524.00 | -1642.00 | -2333.00 | -4177.00 | -713.00 | 485.00 | 1890.00 | 515.00 | 386.00 | 553.00 | 1794.00 | 559.00 | 419.00 | 548.00 | 1393.00 | 500.00 | 368.00 | 597.00 | 1562.00 | 478.00 | 434.00 | 510.00 | 1510.00 | |
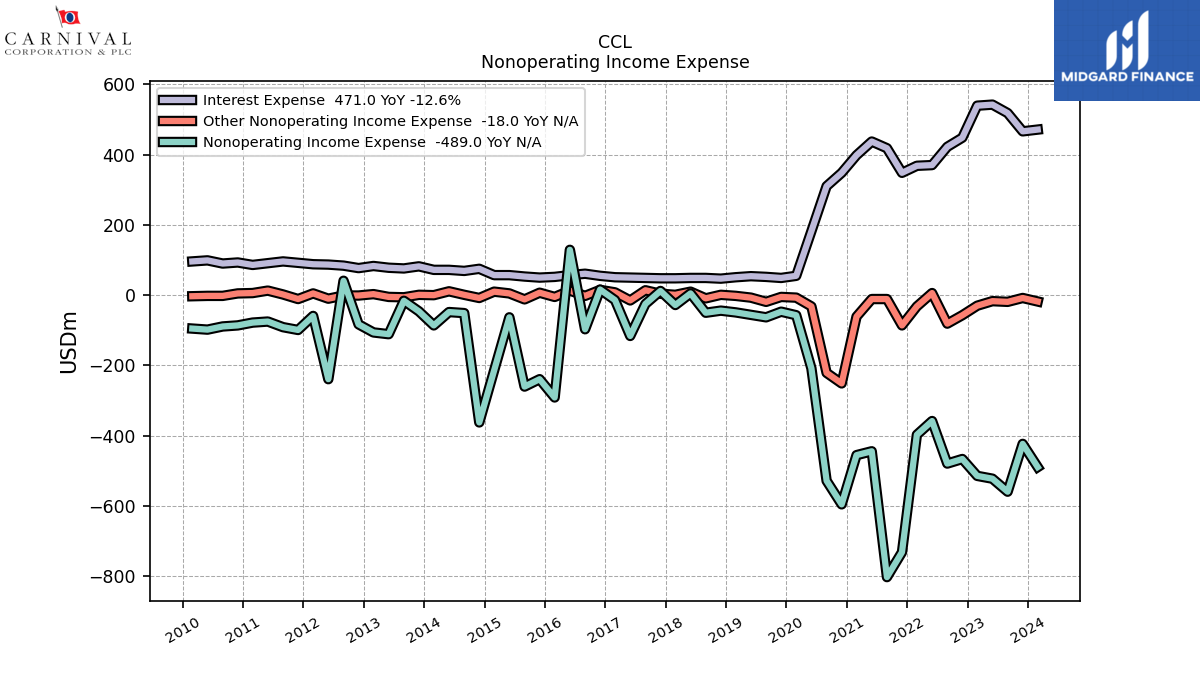
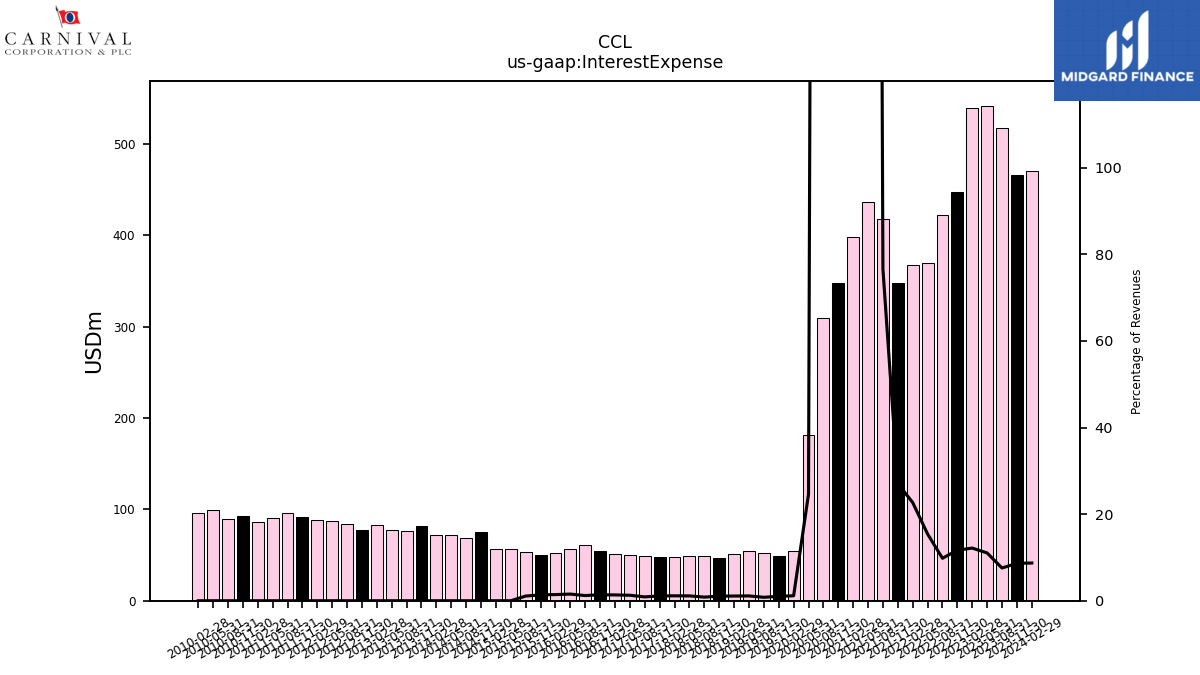
| Interest Expense | 471.00 | 466.00 | 518.00 | 542.00 | 539.00 | 448.00 | 422.00 | 370.00 | 368.00 | 348.00 | 418.00 | 437.00 | 398.00 | 348.00 | 310.00 | 182.00 | 55.00 | 49.00 | 52.00 | 54.00 | 51.00 | 47.00 | 49.00 | 49.00 | 48.00 | 48.00 | 49.00 | 50.00 | 51.00 | 55.00 | 61.00 | 57.00 | 52.00 | 50.00 | 53.00 | |
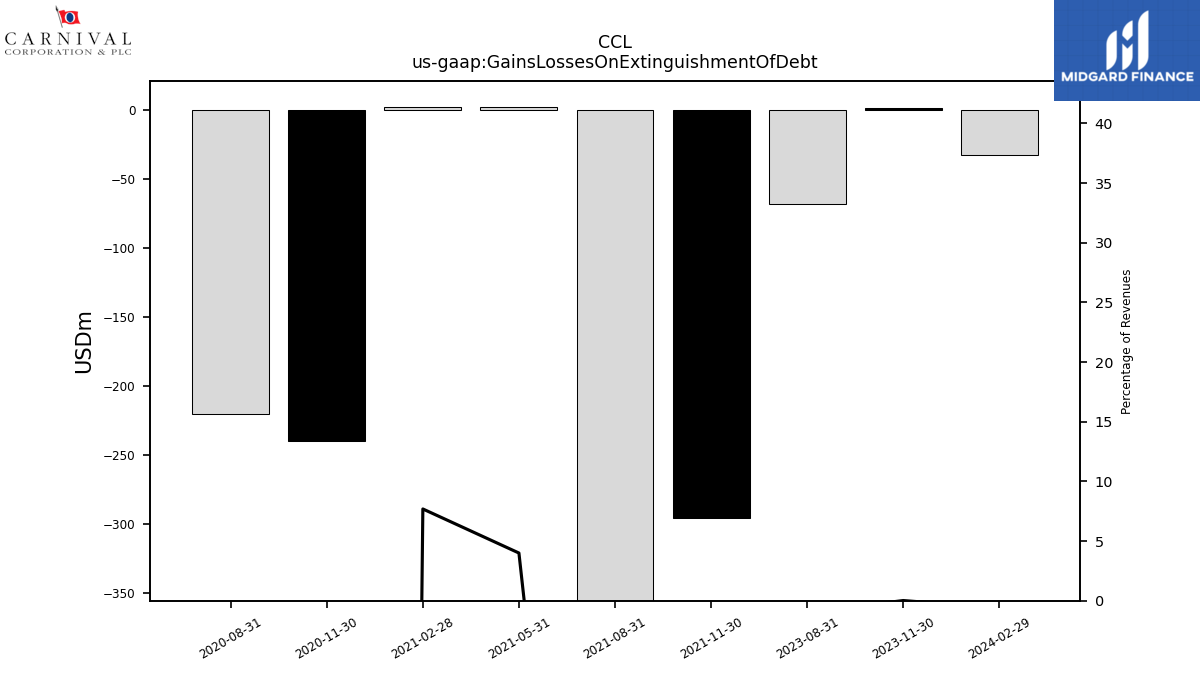
| Gains Losses On Extinguishment Of Debt | -33.00 | 1.00 | -68.00 | NA | NA | NA | NA | NA | NA | -296.00 | -376.00 | 2.00 | 2.00 | -240.00 | -220.00 | NA | NA | NA | NA | NA | NA | NA | NA | NA | NA | NA | NA | NA | NA | NA | NA | NA | NA | NA | NA | |
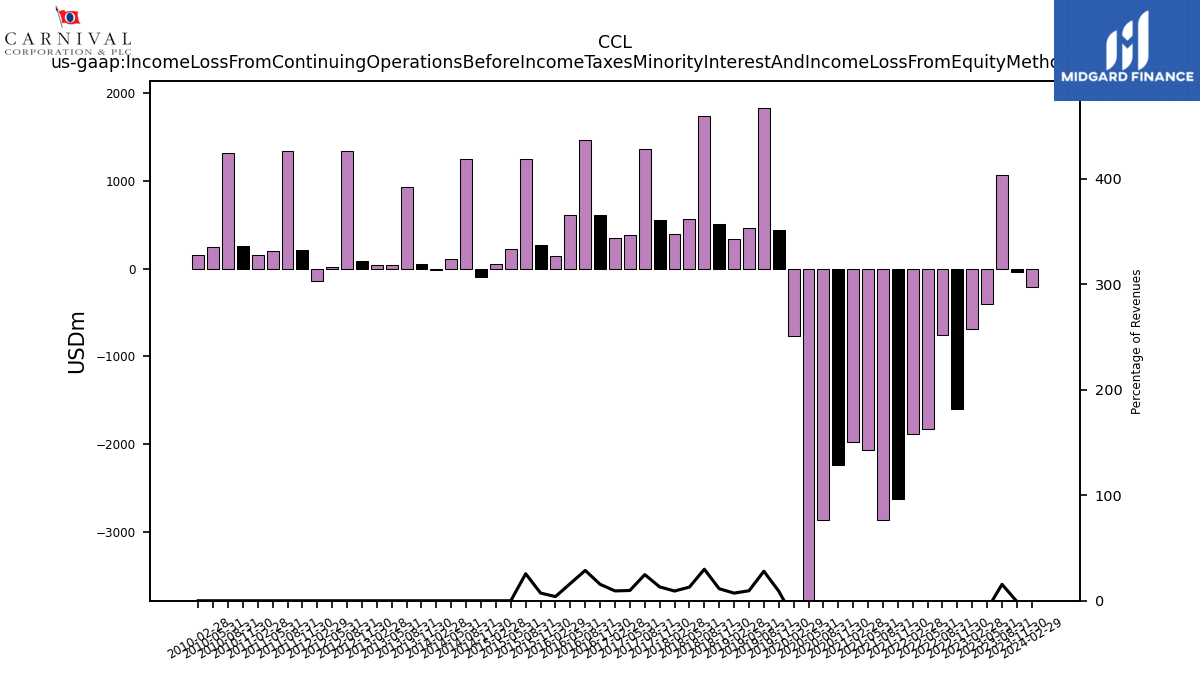
| Income Loss From Continuing Operations Before Income Taxes Minority Interest And Income Loss From Equity Method Investments | -214.00 | -39.00 | 1065.00 | -402.00 | -686.00 | -1602.00 | -759.00 | -1831.00 | -1888.00 | -2624.00 | -2859.00 | -2060.00 | -1979.00 | -2237.00 | -2861.00 | -4385.00 | -770.00 | 436.00 | 1827.00 | 459.00 | 338.00 | 508.00 | 1744.00 | 564.00 | 390.00 | 560.00 | 1368.00 | 384.00 | 354.00 | 613.00 | 1465.00 | 607.00 | 143.00 | 271.00 | 1250.00 | |
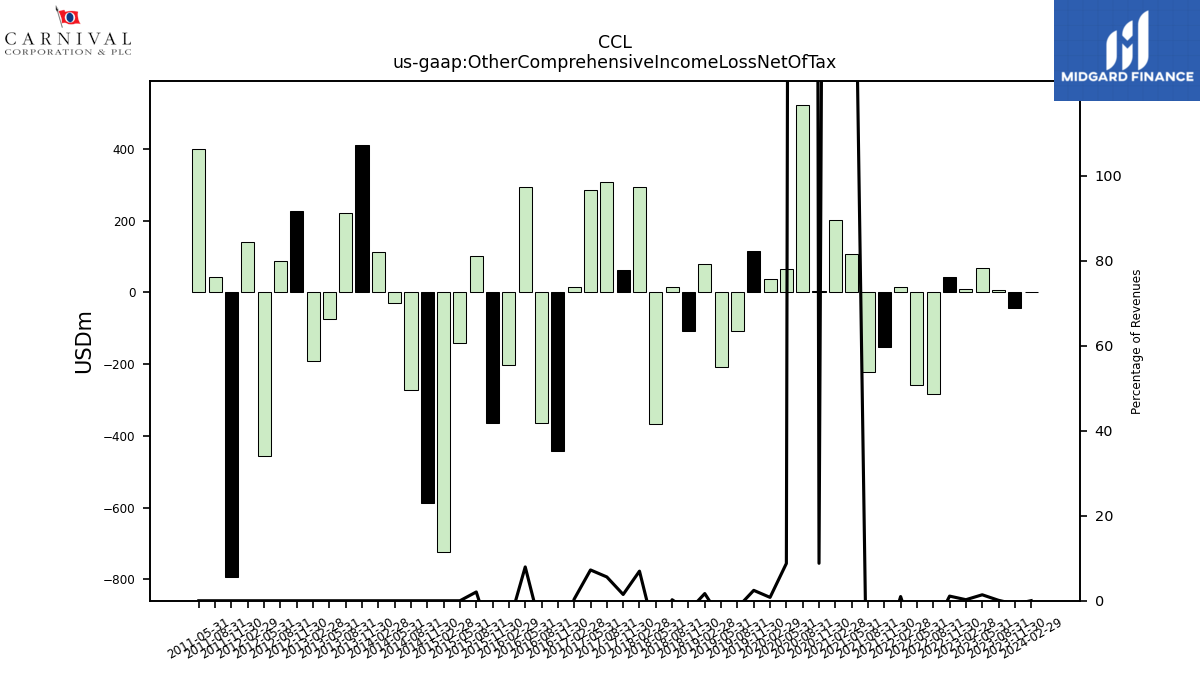
| Other Comprehensive Income Loss Net Of Tax | 1.00 | -42.00 | 7.00 | 69.00 | 11.00 | 42.00 | -282.00 | -257.00 | 16.00 | -152.00 | -223.00 | 107.00 | 203.00 | 3.00 | 524.00 | 65.00 | 38.00 | 117.00 | -107.00 | -207.00 | 79.00 | -108.00 | 14.00 | -368.00 | 295.00 | 63.00 | 309.00 | 286.00 | 15.00 | -442.00 | -364.00 | 295.00 | -202.00 | -363.00 | 101.00 | |
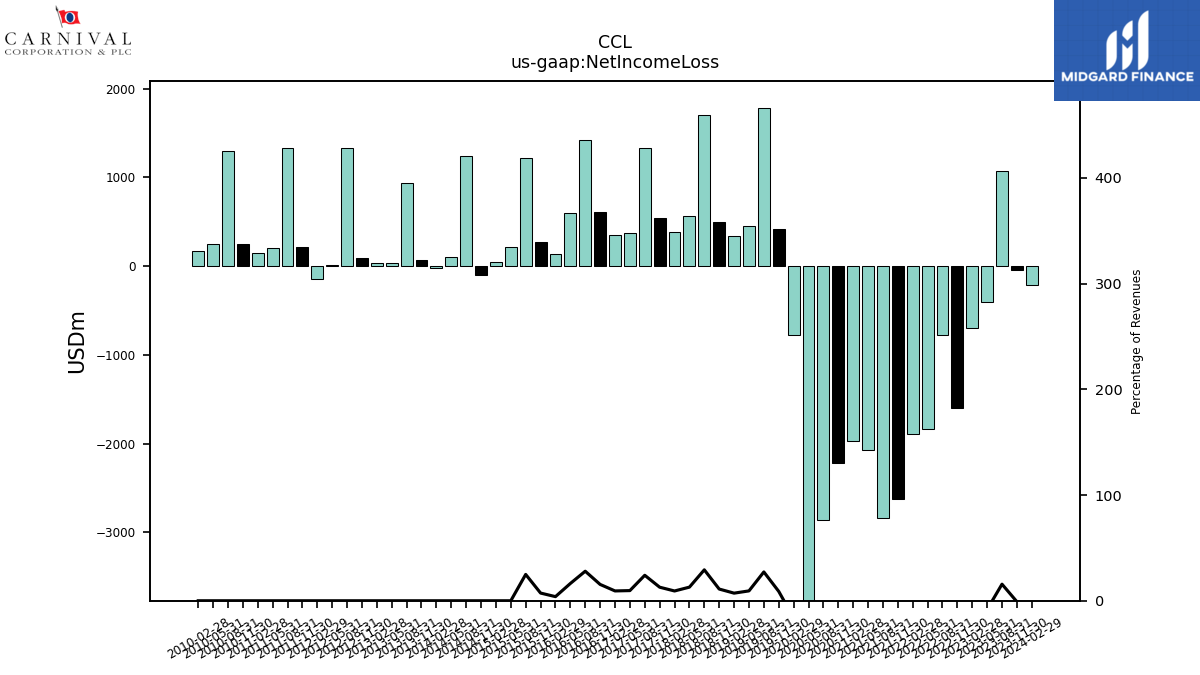
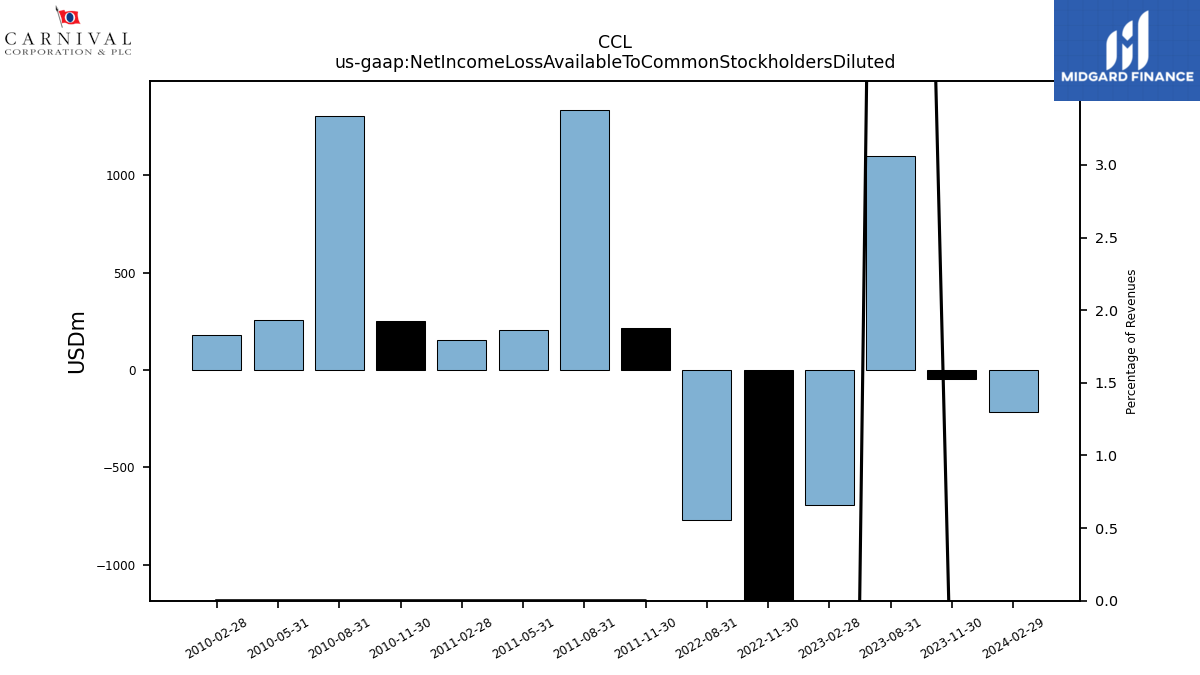
| Net Income Loss | -214.00 | -48.00 | 1074.00 | -407.00 | -693.00 | -1598.00 | -770.00 | -1834.00 | -1891.00 | -2620.00 | -2836.00 | -2072.00 | -1973.00 | -2222.00 | -2858.00 | -4374.00 | -781.00 | 423.00 | 1780.00 | 451.00 | 336.00 | 493.00 | 1707.00 | 561.00 | 391.00 | 546.00 | 1329.00 | 379.00 | 352.00 | 608.00 | 1424.00 | 605.00 | 142.00 | 270.00 | 1216.00 | |
| Comprehensive Income Net Of Tax | -213.00 | -90.00 | 1081.00 | -338.00 | -682.00 | -1556.00 | -1052.00 | -2091.00 | -1876.00 | -2773.00 | -3059.00 | -1965.00 | -1770.00 | -2219.00 | -2335.00 | -4309.00 | -743.00 | 540.00 | 1674.00 | 244.00 | 415.00 | 386.00 | 1722.00 | 193.00 | 686.00 | 609.00 | 1638.00 | 665.00 | 367.00 | 166.00 | 1060.00 | 900.00 | -60.00 | -93.00 | 1317.00 | |
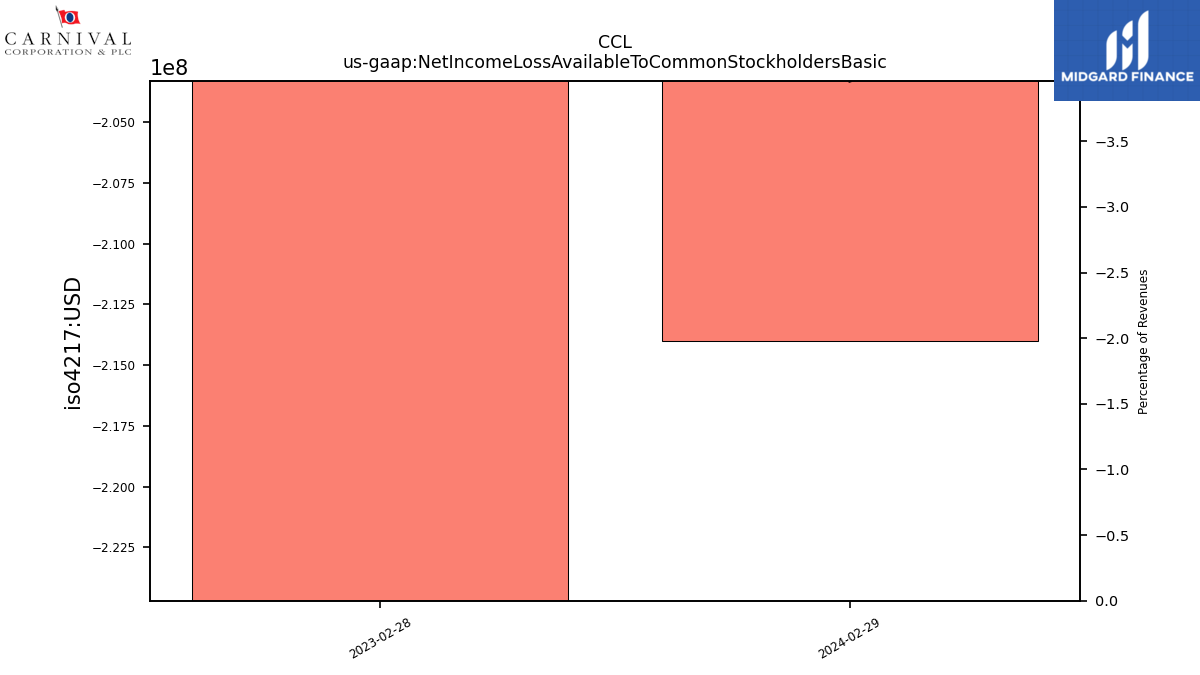
| Net Income Loss Available To Common Stockholders Basic | -214.00 | NA | NA | NA | -693.00 | NA | NA | NA | NA | NA | NA | NA | NA | NA | NA | NA | NA | NA | NA | NA | NA | NA | NA | NA | NA | NA | NA | NA | NA | NA | NA | NA | NA | NA | NA | |
| Net Income Loss Available To Common Stockholders Diluted | -214.00 | -48.00 | 1098.00 | NA | -693.00 | -1598.00 | -770.00 | NA | NA | NA | NA | NA | NA | NA | NA | NA | NA | NA | NA | NA | NA | NA | NA | NA | NA | NA | NA | NA | NA | NA | NA | NA | NA | NA | NA |
| 2024-02-29 | 2023-11-30 | 2023-08-31 | 2023-05-31 | 2023-02-28 | 2022-11-30 | 2022-08-31 | 2022-05-31 | 2022-02-28 | 2021-11-30 | 2021-08-31 | 2021-05-31 | 2021-02-28 | 2020-11-30 | 2020-08-31 | 2020-05-31 | 2020-02-29 | 2019-11-30 | 2019-08-31 | 2019-05-31 | 2019-02-28 | 2018-11-30 | 2018-08-31 | 2018-05-31 | 2018-02-28 | 2017-11-30 | 2017-08-31 | 2017-05-31 | 2017-02-28 | 2016-11-30 | 2016-08-31 | 2016-05-31 | 2016-02-29 | 2015-11-30 | 2015-08-31 | ||
|---|---|---|---|---|---|---|---|---|---|---|---|---|---|---|---|---|---|---|---|---|---|---|---|---|---|---|---|---|---|---|---|---|---|---|---|---|
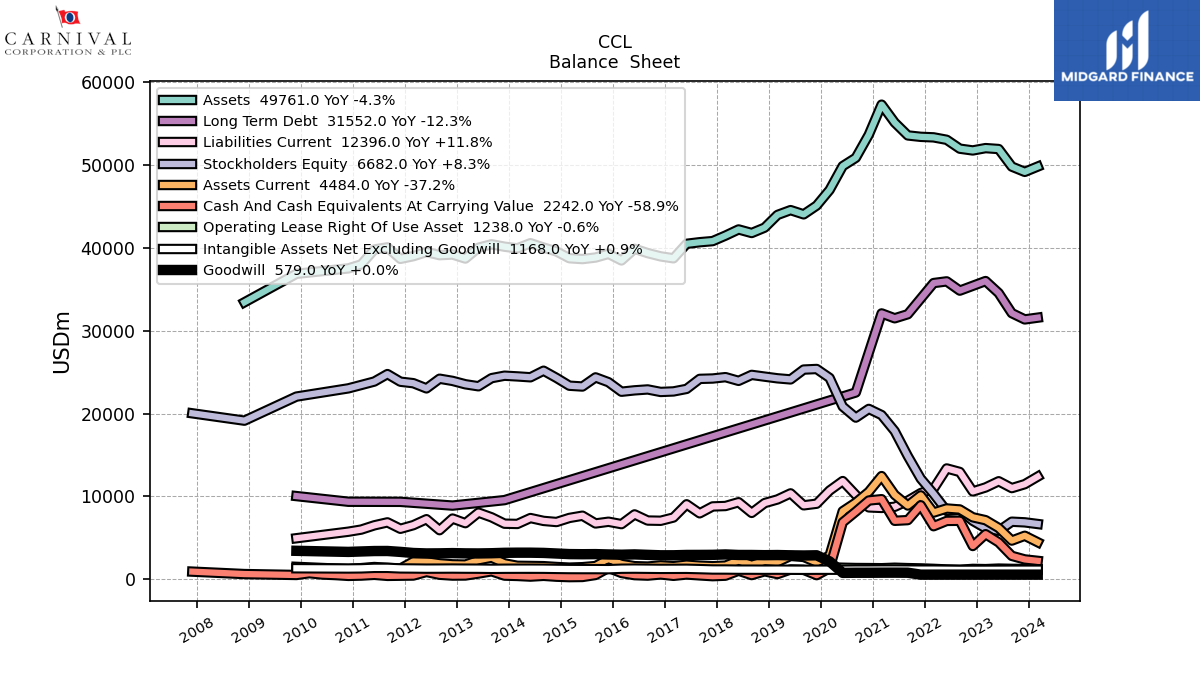
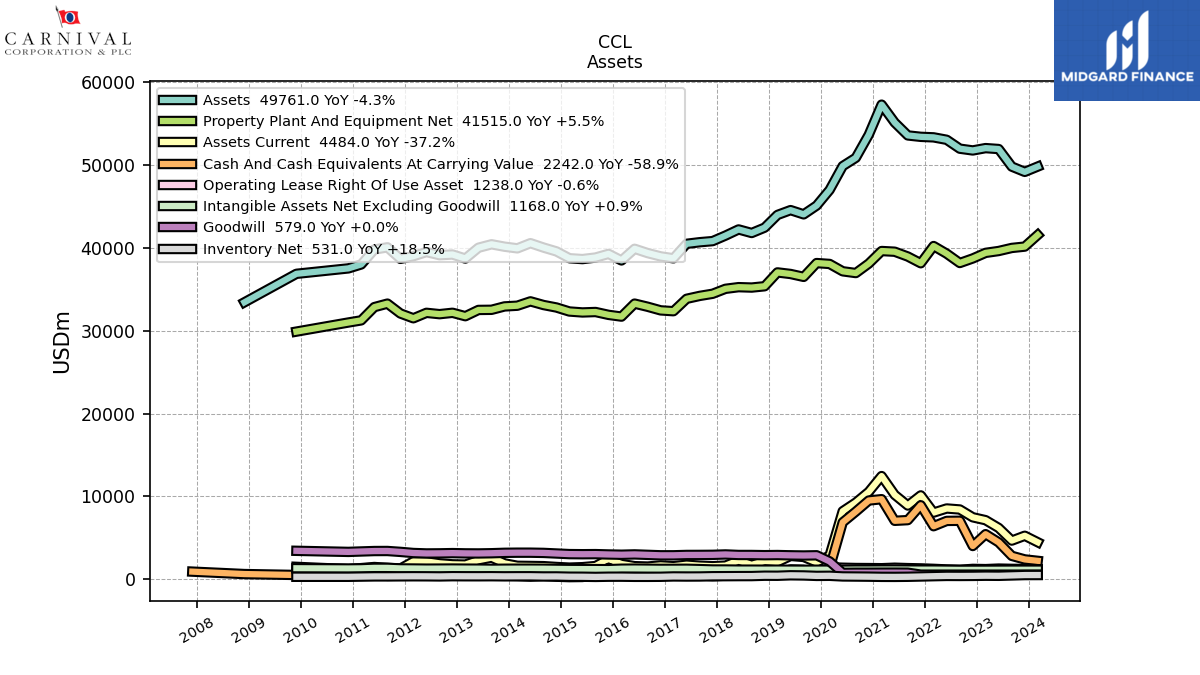
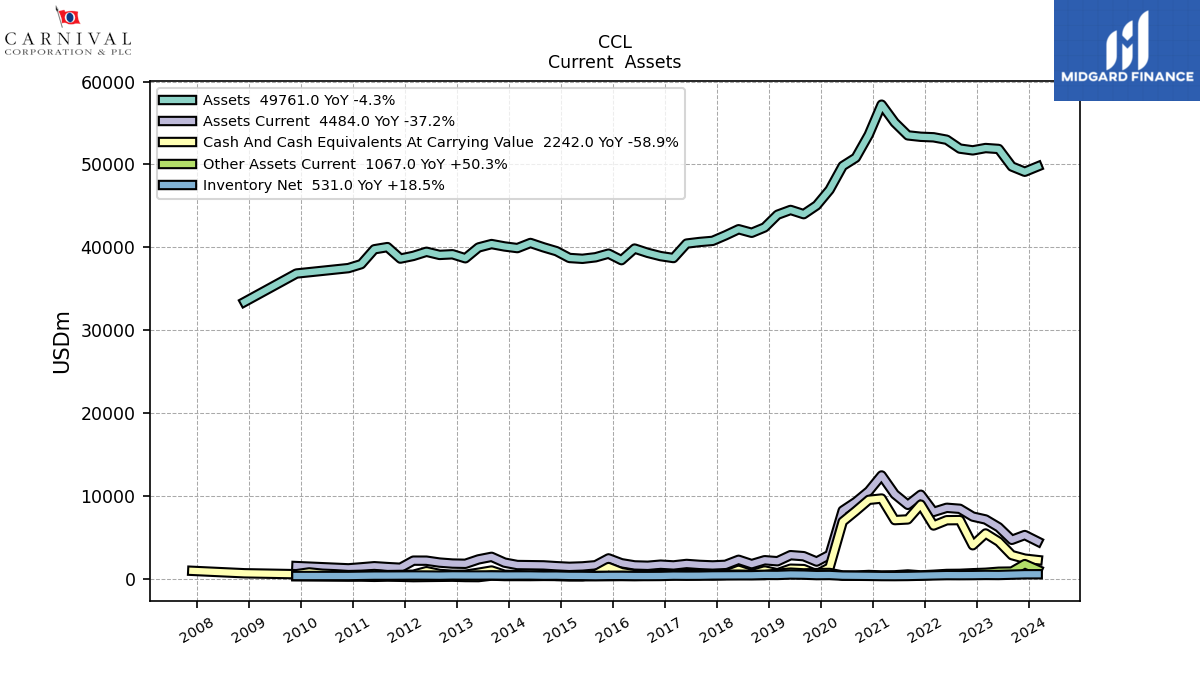
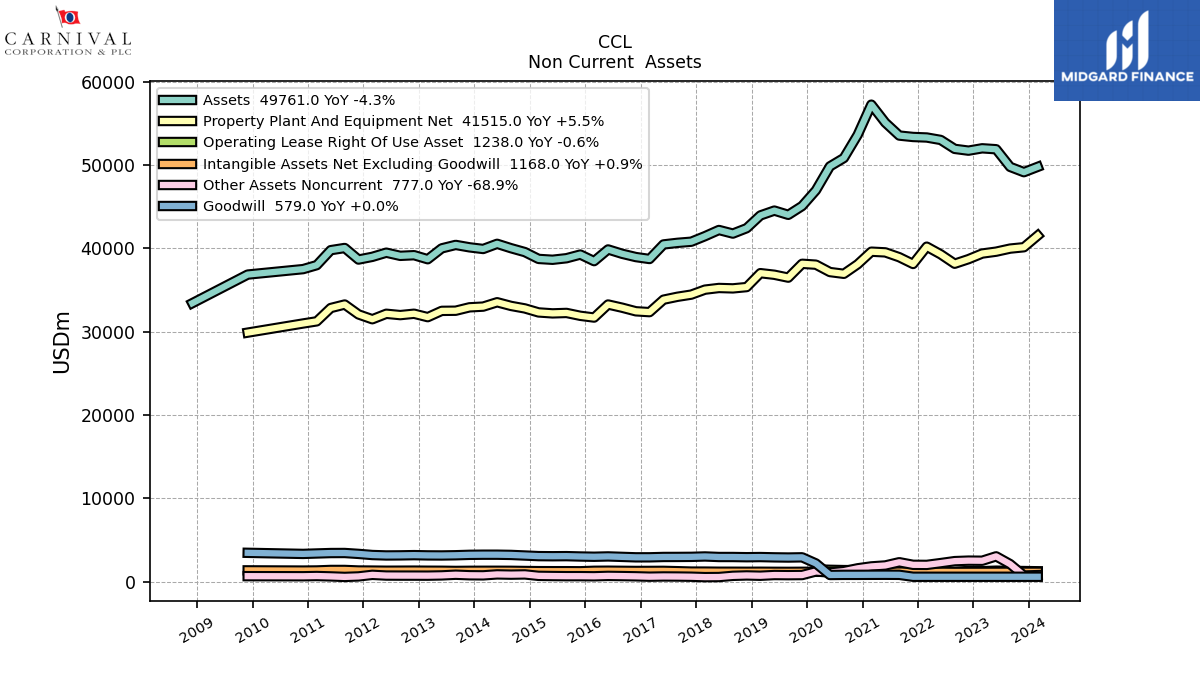
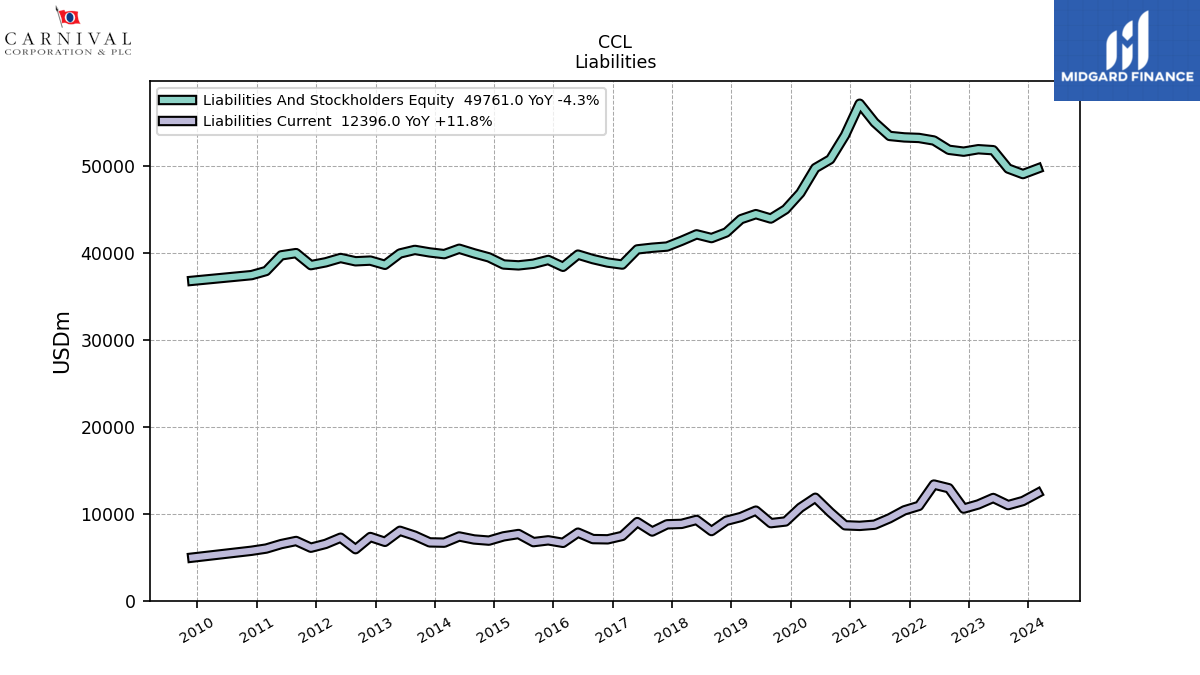
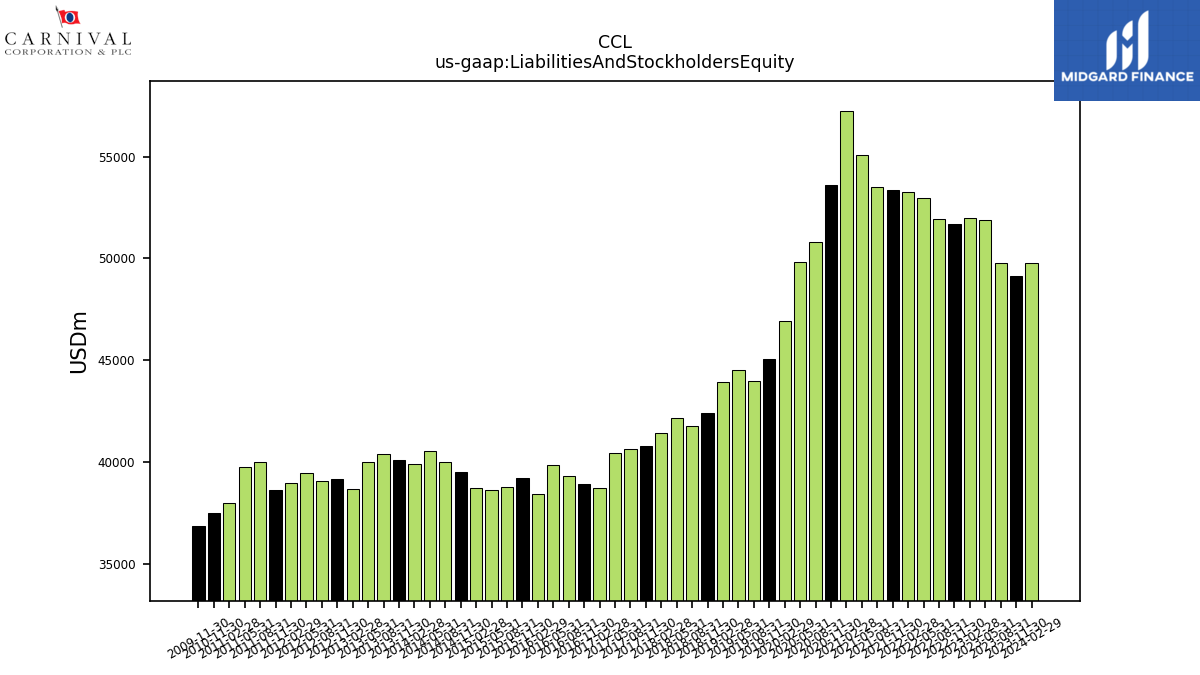
| Assets | 49761.00 | 49120.00 | 49756.00 | 51873.00 | 51985.00 | 51703.00 | 51917.00 | 52988.00 | 53281.00 | 53344.00 | 53514.00 | 55064.00 | 57226.00 | 53593.00 | 50818.00 | 49817.00 | 46943.00 | 45058.00 | 44001.00 | 44512.00 | 43930.00 | 42401.00 | 41753.00 | 42184.00 | 41441.00 | 40778.00 | 40643.00 | 40451.00 | 38703.00 | 38936.00 | 39332.00 | 39851.00 | 38446.00 | 39237.00 | 38797.00 | |
| Liabilities And Stockholders Equity | 49761.00 | 49120.00 | 49756.00 | 51873.00 | 51985.00 | 51703.00 | 51917.00 | 52988.00 | 53281.00 | 53344.00 | 53514.00 | 55064.00 | 57226.00 | 53593.00 | 50818.00 | 49817.00 | 46943.00 | 45058.00 | 44001.00 | 44512.00 | 43930.00 | 42401.00 | 41753.00 | 42184.00 | 41441.00 | 40778.00 | 40643.00 | 40451.00 | 38703.00 | 38936.00 | 39332.00 | 39851.00 | 38446.00 | 39237.00 | 38797.00 | |
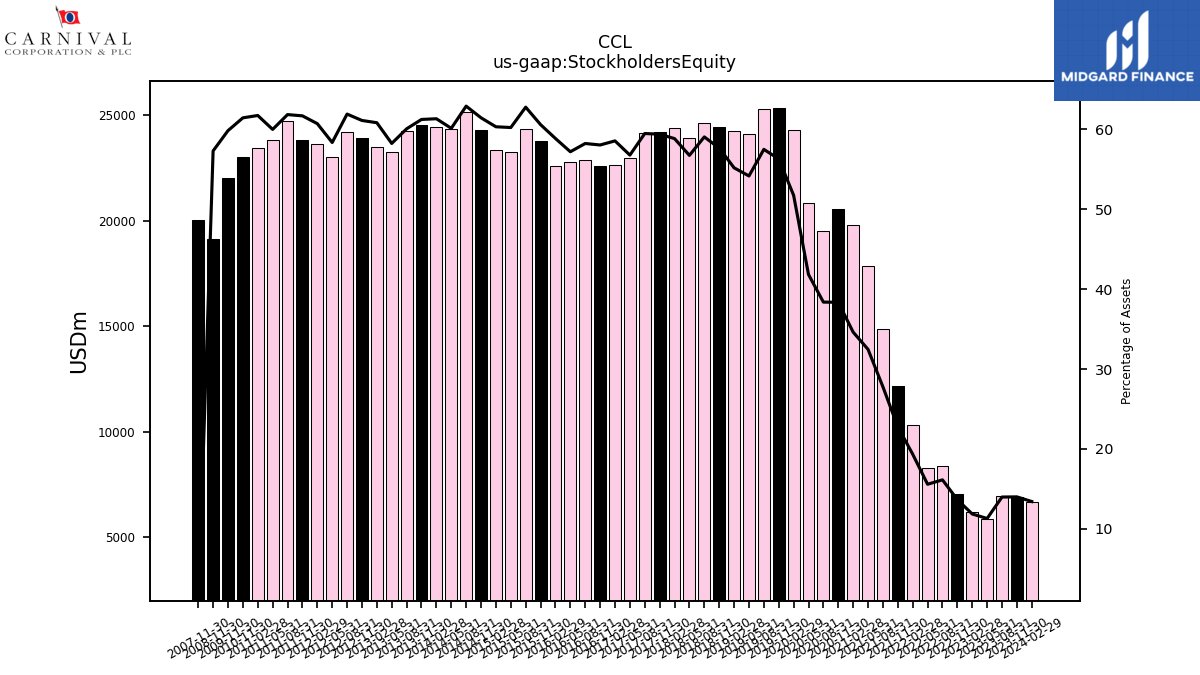
| Stockholders Equity | 6682.00 | 6882.00 | 6960.00 | 5865.00 | 6170.00 | 7065.00 | 8379.00 | 8260.00 | 10311.00 | 12144.00 | 14863.00 | 17876.00 | 19813.00 | 20555.00 | 19503.00 | 20840.00 | 24290.00 | 25365.00 | 25295.00 | 24108.00 | 24241.00 | 24443.00 | 24654.00 | 23933.00 | 24382.00 | 24216.00 | 24172.00 | 22964.00 | 22660.00 | 22597.00 | 22900.00 | 22791.00 | 22625.00 | 23771.00 | 24353.00 |
| 2024-02-29 | 2023-11-30 | 2023-08-31 | 2023-05-31 | 2023-02-28 | 2022-11-30 | 2022-08-31 | 2022-05-31 | 2022-02-28 | 2021-11-30 | 2021-08-31 | 2021-05-31 | 2021-02-28 | 2020-11-30 | 2020-08-31 | 2020-05-31 | 2020-02-29 | 2019-11-30 | 2019-08-31 | 2019-05-31 | 2019-02-28 | 2018-11-30 | 2018-08-31 | 2018-05-31 | 2018-02-28 | 2017-11-30 | 2017-08-31 | 2017-05-31 | 2017-02-28 | 2016-11-30 | 2016-08-31 | 2016-05-31 | 2016-02-29 | 2015-11-30 | 2015-08-31 | ||
|---|---|---|---|---|---|---|---|---|---|---|---|---|---|---|---|---|---|---|---|---|---|---|---|---|---|---|---|---|---|---|---|---|---|---|---|---|
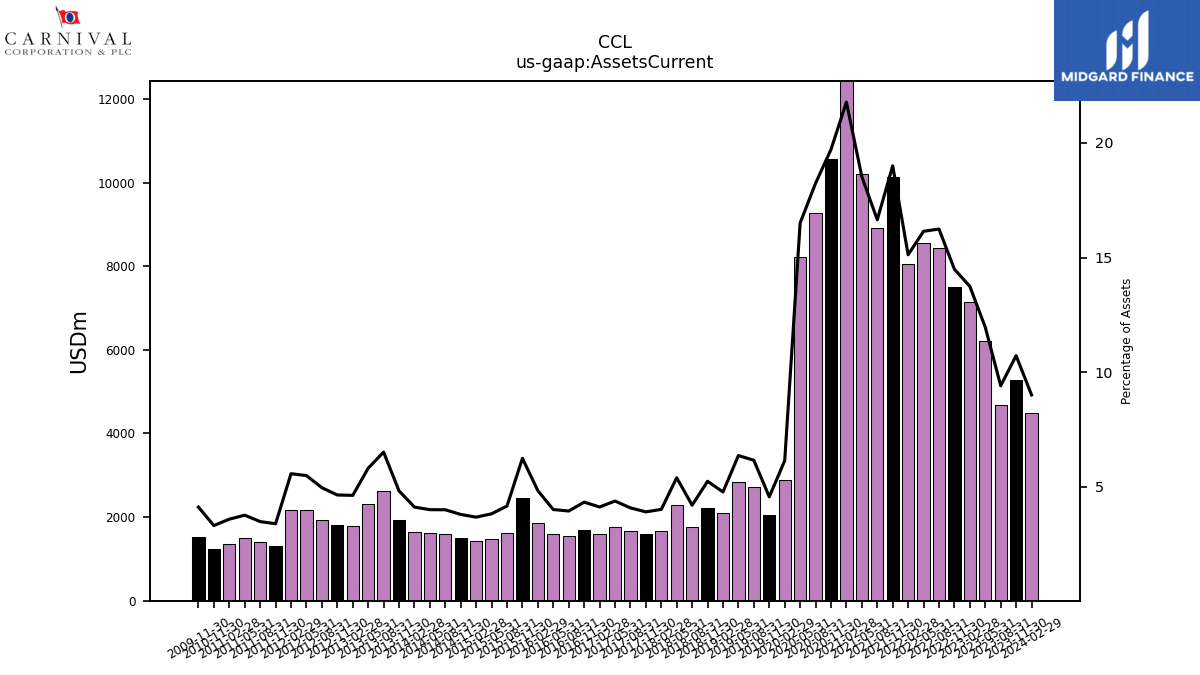
| Assets Current | 4484.00 | 5266.00 | 4683.00 | 6206.00 | 7144.00 | 7492.00 | 8432.00 | 8554.00 | 8057.00 | 10133.00 | 8909.00 | 10198.00 | 12459.00 | 10563.00 | 9268.00 | 8222.00 | 2885.00 | 2059.00 | 2712.00 | 2835.00 | 2101.00 | 2225.00 | 1755.00 | 2278.00 | 1667.00 | 1596.00 | 1661.00 | 1774.00 | 1597.00 | 1689.00 | 1554.00 | 1600.00 | 1860.00 | 2451.00 | 1617.00 | |
| Cash And Cash Equivalents At Carrying Value | 2242.00 | 2415.00 | 2842.00 | 4468.00 | 5455.00 | 4029.00 | 7071.00 | 7054.00 | 6414.00 | 8939.00 | 7151.00 | 7067.00 | 9674.00 | 9513.00 | 8176.00 | 6881.00 | 1354.00 | 518.00 | 1153.00 | 1202.00 | 649.00 | 982.00 | 526.00 | 1053.00 | 453.00 | 395.00 | 489.00 | 597.00 | 437.00 | 603.00 | 462.00 | 519.00 | 778.00 | 1395.00 | 539.00 | |
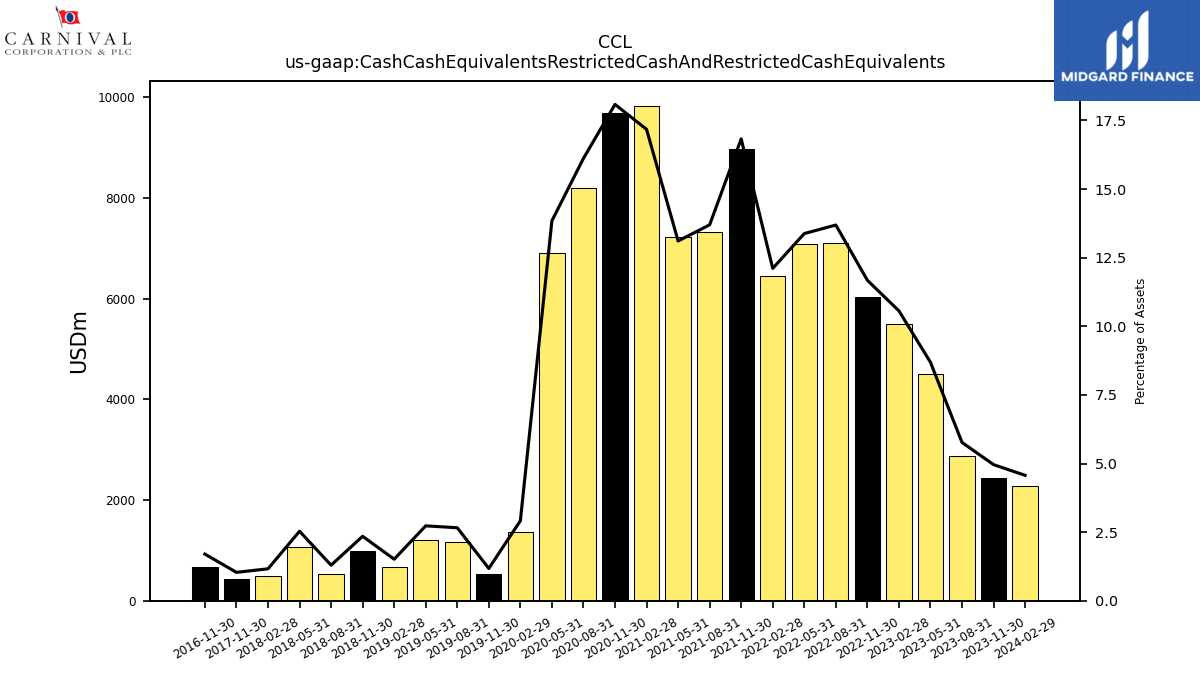
| Cash Cash Equivalents Restricted Cash And Restricted Cash Equivalents | 2274.00 | 2436.00 | 2870.00 | 4507.00 | 5491.00 | 6037.00 | 7107.00 | 7089.00 | 6452.00 | 8976.00 | 7329.00 | 7218.00 | 9829.00 | 9692.00 | 8191.00 | 6896.00 | 1368.00 | 530.00 | 1170.00 | 1215.00 | 665.00 | 996.00 | 541.00 | 1068.00 | 482.00 | 422.00 | NA | NA | NA | 662.00 | NA | NA | NA | NA | NA | |
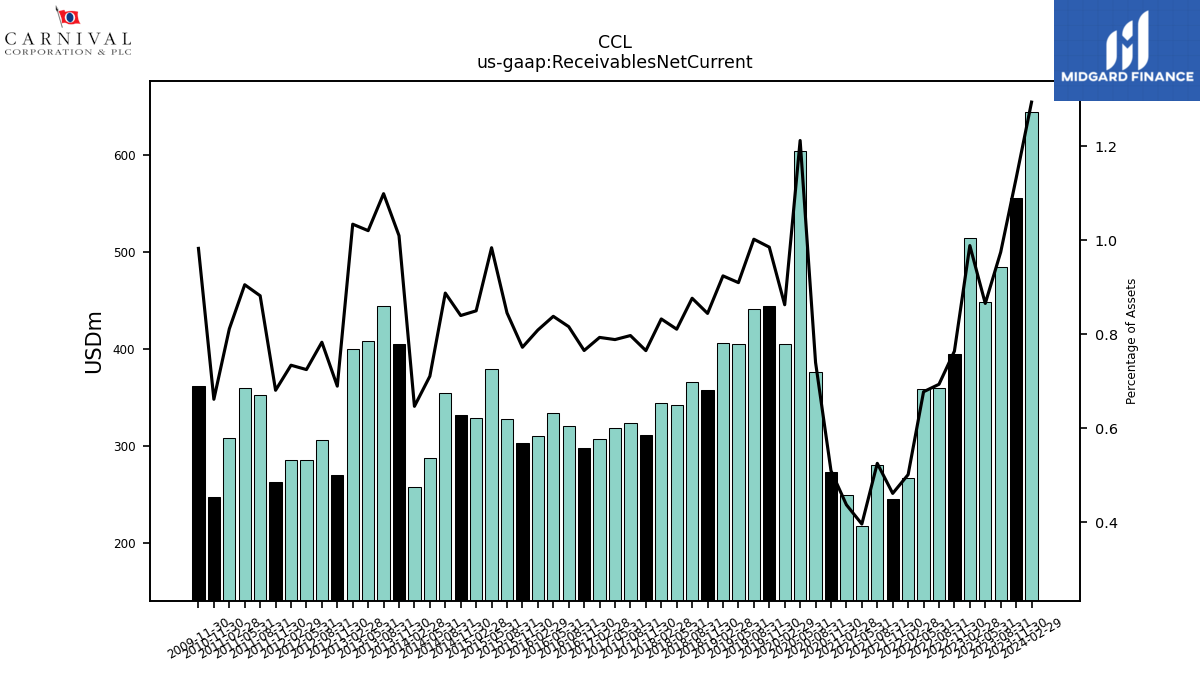
| Receivables Net Current | 644.00 | 556.00 | 485.00 | 449.00 | 514.00 | 395.00 | 360.00 | 359.00 | 267.00 | 246.00 | 281.00 | 218.00 | 250.00 | 273.00 | 376.00 | 604.00 | 405.00 | 444.00 | 441.00 | 405.00 | 406.00 | 358.00 | 366.00 | 342.00 | 345.00 | 312.00 | 324.00 | 319.00 | 307.00 | 298.00 | 321.00 | 334.00 | 311.00 | 303.00 | 328.00 | |
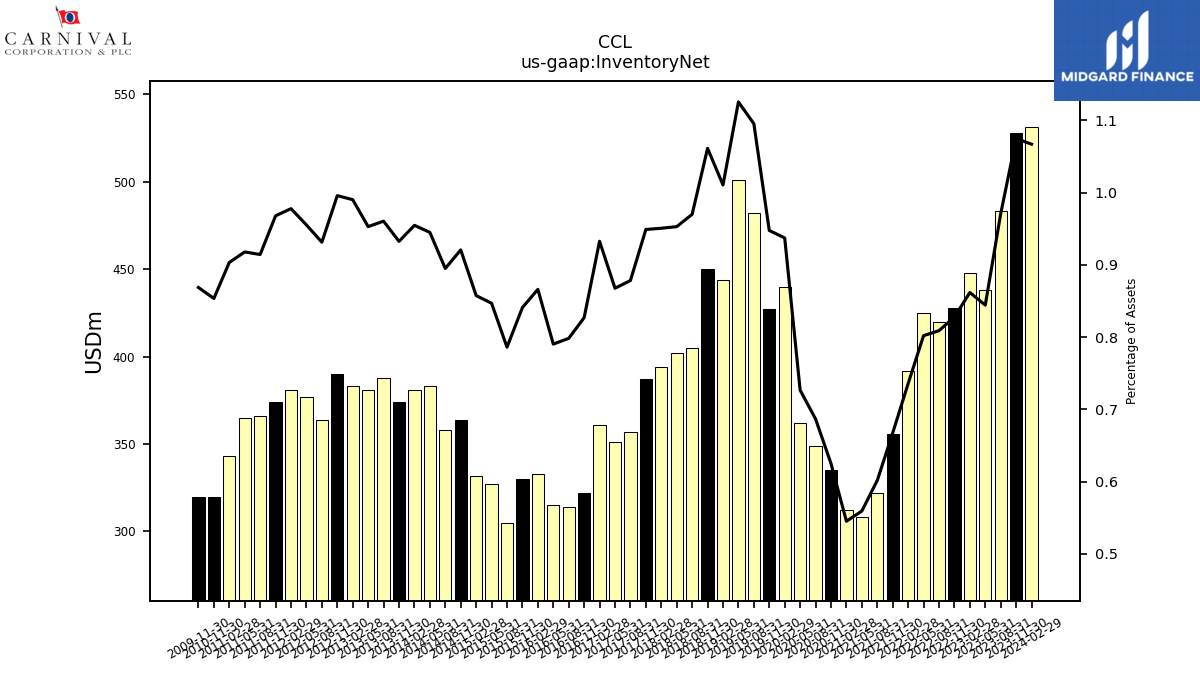
| Inventory Net | 531.00 | 528.00 | 483.00 | 438.00 | 448.00 | 428.00 | 420.00 | 425.00 | 392.00 | 356.00 | 322.00 | 308.00 | 312.00 | 335.00 | 349.00 | 362.00 | 440.00 | 427.00 | 482.00 | 501.00 | 444.00 | 450.00 | 405.00 | 402.00 | 394.00 | 387.00 | 357.00 | 351.00 | 361.00 | 322.00 | 314.00 | 315.00 | 333.00 | 330.00 | 305.00 | |
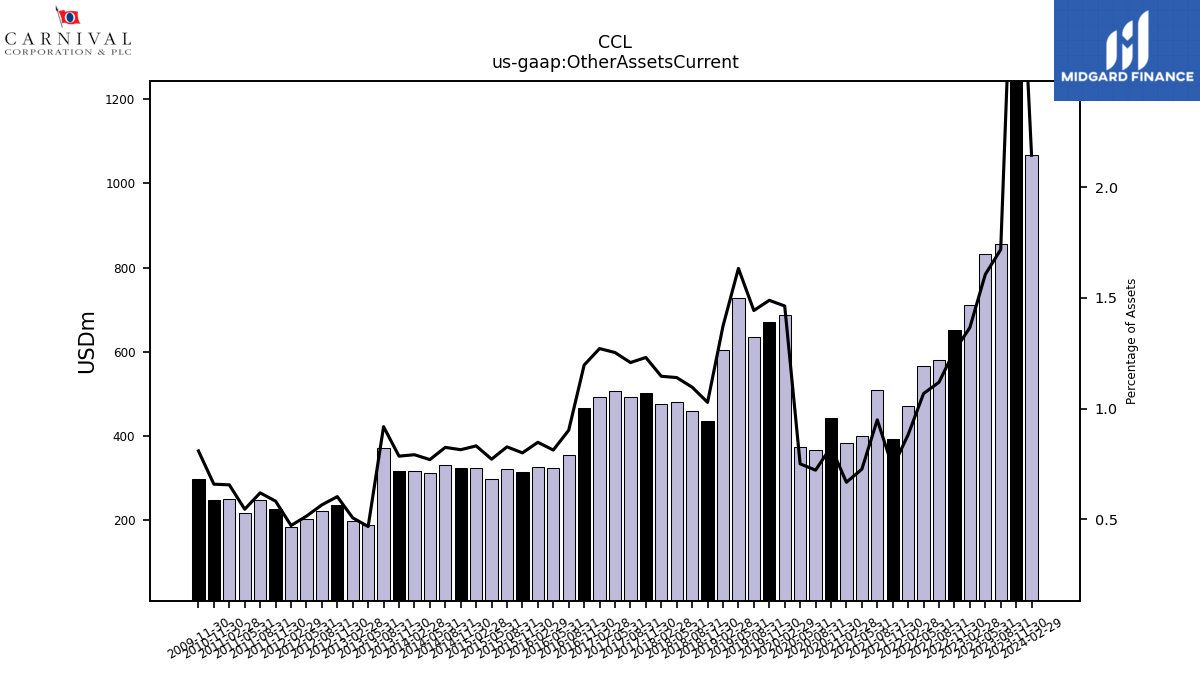
| Other Assets Current | 1067.00 | 1757.00 | 855.00 | 833.00 | 710.00 | 652.00 | 581.00 | 566.00 | 470.00 | 392.00 | 508.00 | 400.00 | 382.00 | 443.00 | 367.00 | 374.00 | 687.00 | 671.00 | 635.00 | 727.00 | 603.00 | 436.00 | 458.00 | 481.00 | 475.00 | 502.00 | 491.00 | 507.00 | 492.00 | 466.00 | 355.00 | 324.00 | 326.00 | 314.00 | 321.00 |
| 2024-02-29 | 2023-11-30 | 2023-08-31 | 2023-05-31 | 2023-02-28 | 2022-11-30 | 2022-08-31 | 2022-05-31 | 2022-02-28 | 2021-11-30 | 2021-08-31 | 2021-05-31 | 2021-02-28 | 2020-11-30 | 2020-08-31 | 2020-05-31 | 2020-02-29 | 2019-11-30 | 2019-08-31 | 2019-05-31 | 2019-02-28 | 2018-11-30 | 2018-08-31 | 2018-05-31 | 2018-02-28 | 2017-11-30 | 2017-08-31 | 2017-05-31 | 2017-02-28 | 2016-11-30 | 2016-08-31 | 2016-05-31 | 2016-02-29 | 2015-11-30 | 2015-08-31 | ||
|---|---|---|---|---|---|---|---|---|---|---|---|---|---|---|---|---|---|---|---|---|---|---|---|---|---|---|---|---|---|---|---|---|---|---|---|---|
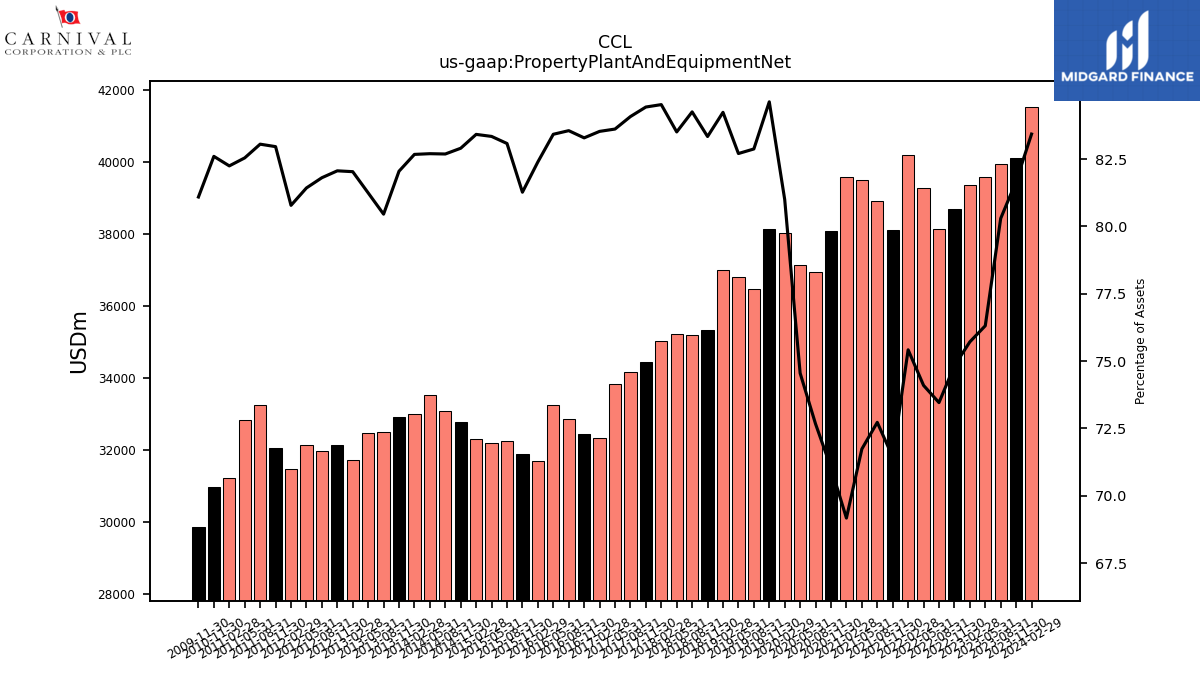
| Property Plant And Equipment Net | 41515.00 | 40116.00 | 39952.00 | 39584.00 | 39359.00 | 38687.00 | 38137.00 | 39262.00 | 40183.00 | 38107.00 | 38917.00 | 39499.00 | 39583.00 | 38073.00 | 36926.00 | 37139.00 | 38023.00 | 38131.00 | 36466.00 | 36814.00 | 37005.00 | 35336.00 | 35178.00 | 35227.00 | 35027.00 | 34430.00 | 34172.00 | 33823.00 | 32328.00 | 32429.00 | 32864.00 | 33244.00 | 31677.00 | 31888.00 | 32232.00 | |
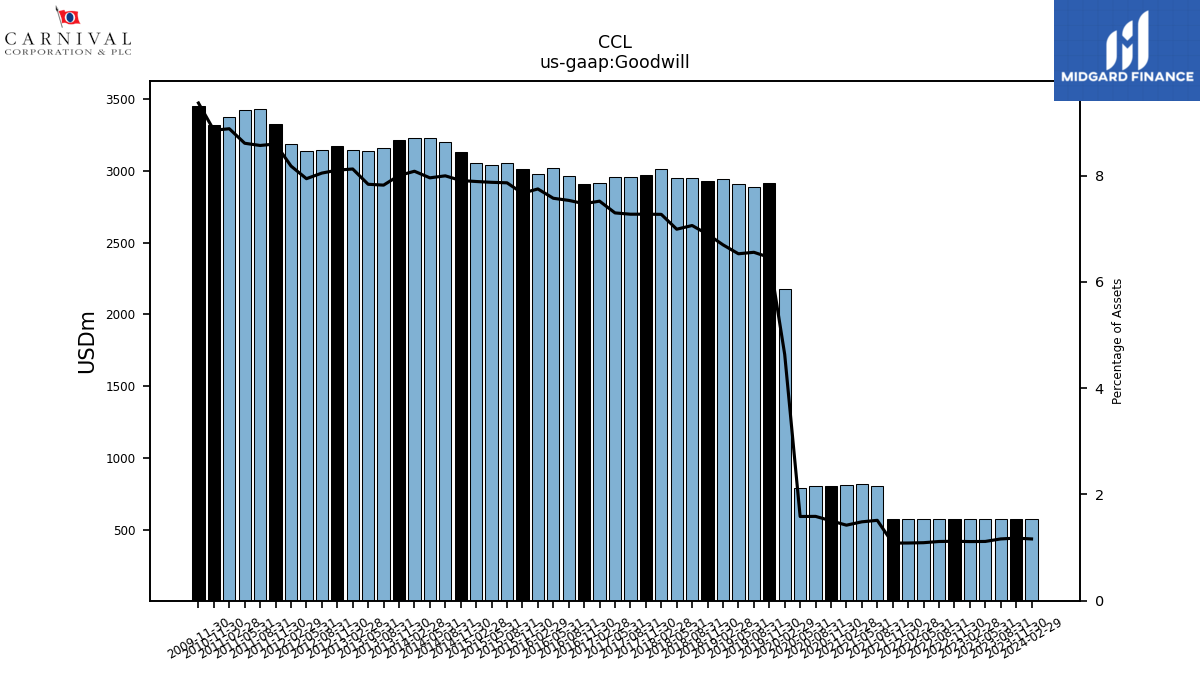
| Goodwill | 579.00 | 579.00 | 579.00 | 579.00 | 579.00 | 579.00 | 579.00 | 579.00 | 579.00 | 579.00 | 810.00 | 818.00 | 814.00 | 807.00 | 807.00 | 790.00 | 2176.00 | 2912.00 | 2886.00 | 2907.00 | 2943.00 | 2925.00 | 2949.00 | 2950.00 | 3014.00 | 2967.00 | 2957.00 | 2953.00 | 2911.00 | 2910.00 | 2964.00 | 3019.00 | 2980.00 | 3010.00 | 3052.00 | |
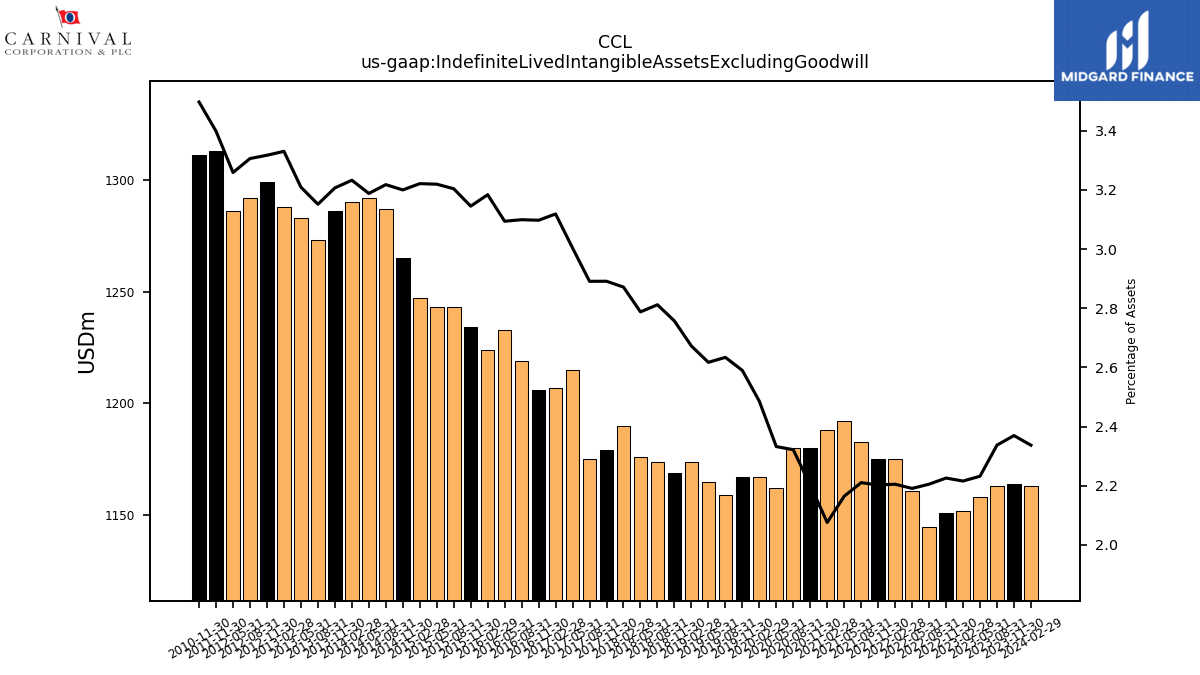
| Indefinite Lived Intangible Assets Excluding Goodwill | 1163.00 | 1164.00 | 1163.00 | 1158.00 | 1152.00 | 1151.00 | 1145.00 | 1161.00 | 1175.00 | 1175.00 | 1183.00 | 1192.00 | 1188.00 | 1180.00 | 1180.00 | 1162.00 | 1167.00 | 1167.00 | 1159.00 | 1165.00 | 1174.00 | 1169.00 | 1174.00 | 1176.00 | 1190.00 | 1179.00 | 1175.00 | 1215.00 | 1207.00 | 1206.00 | 1219.00 | 1233.00 | 1224.00 | 1234.00 | 1243.00 | |
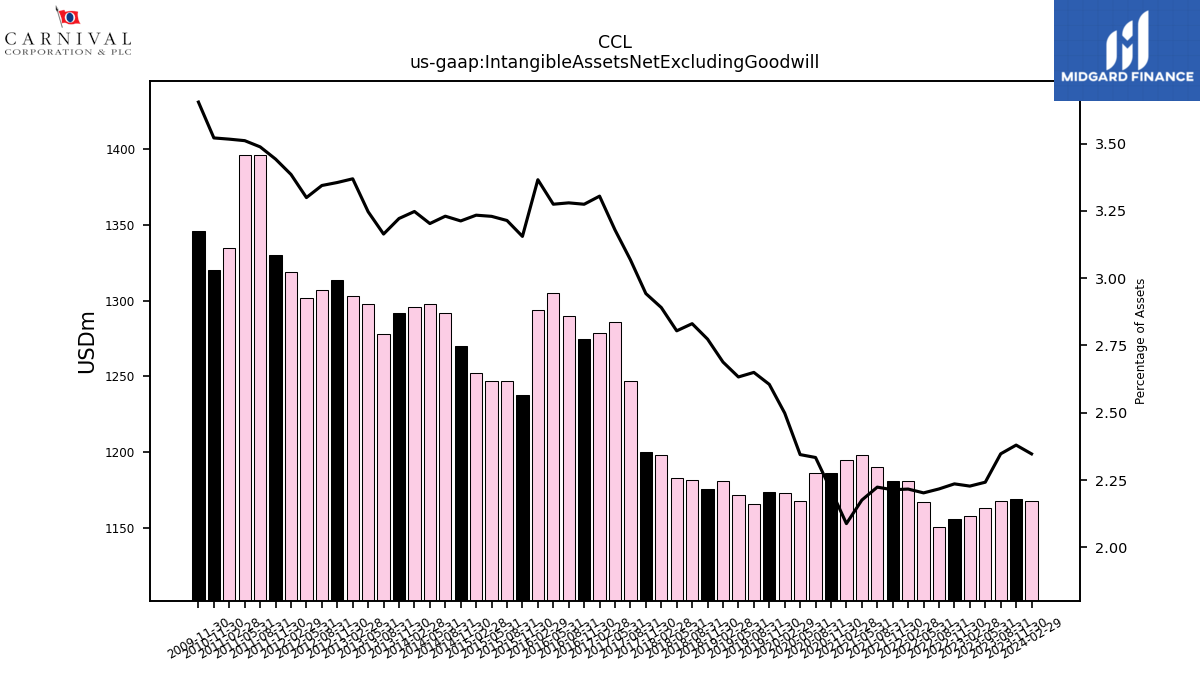
| Intangible Assets Net Excluding Goodwill | 1168.00 | 1169.00 | 1168.00 | 1163.00 | 1158.00 | 1156.00 | 1151.00 | 1167.00 | 1181.00 | 1181.00 | 1190.00 | 1198.00 | 1195.00 | 1186.00 | 1186.00 | 1168.00 | 1173.00 | 1174.00 | 1166.00 | 1172.00 | 1181.00 | 1176.00 | 1182.00 | 1183.00 | 1198.00 | 1200.00 | 1247.00 | 1286.00 | 1279.00 | 1275.00 | 1290.00 | 1305.00 | 1294.00 | 1238.00 | 1247.00 | |
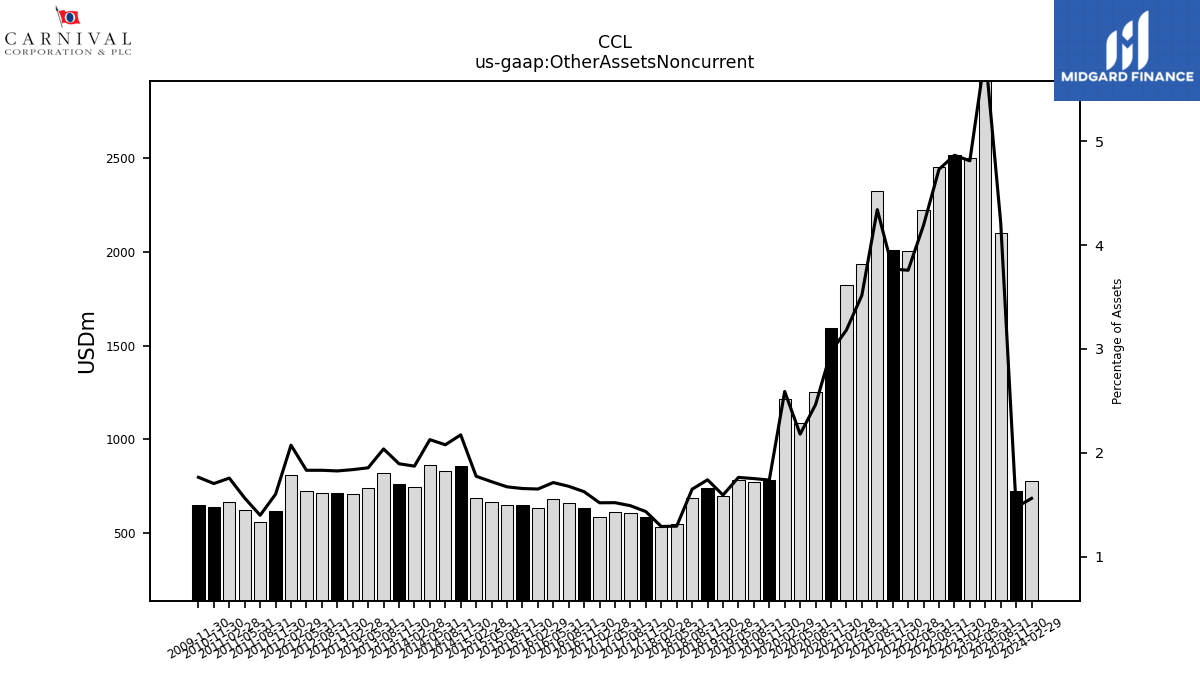
| Other Assets Noncurrent | 777.00 | 725.00 | 2098.00 | 3030.00 | 2501.00 | 2515.00 | 2455.00 | 2221.00 | 2002.00 | 2011.00 | 2323.00 | 1936.00 | 1821.00 | 1594.00 | 1252.00 | 1086.00 | 1216.00 | 783.00 | 771.00 | 785.00 | 700.00 | 738.00 | 689.00 | 546.00 | 535.00 | 585.00 | 606.00 | 615.00 | 588.00 | 633.00 | 660.00 | 683.00 | 635.00 | 650.00 | 649.00 |
| 2024-02-29 | 2023-11-30 | 2023-08-31 | 2023-05-31 | 2023-02-28 | 2022-11-30 | 2022-08-31 | 2022-05-31 | 2022-02-28 | 2021-11-30 | 2021-08-31 | 2021-05-31 | 2021-02-28 | 2020-11-30 | 2020-08-31 | 2020-05-31 | 2020-02-29 | 2019-11-30 | 2019-08-31 | 2019-05-31 | 2019-02-28 | 2018-11-30 | 2018-08-31 | 2018-05-31 | 2018-02-28 | 2017-11-30 | 2017-08-31 | 2017-05-31 | 2017-02-28 | 2016-11-30 | 2016-08-31 | 2016-05-31 | 2016-02-29 | 2015-11-30 | 2015-08-31 | ||
|---|---|---|---|---|---|---|---|---|---|---|---|---|---|---|---|---|---|---|---|---|---|---|---|---|---|---|---|---|---|---|---|---|---|---|---|---|
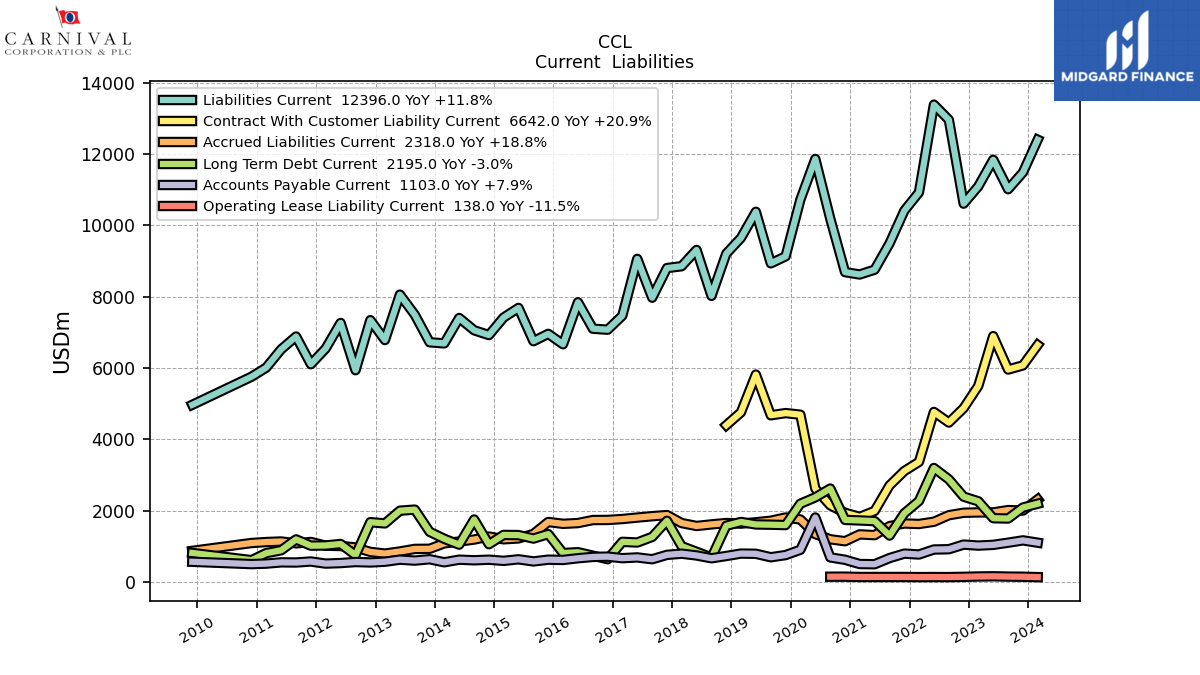
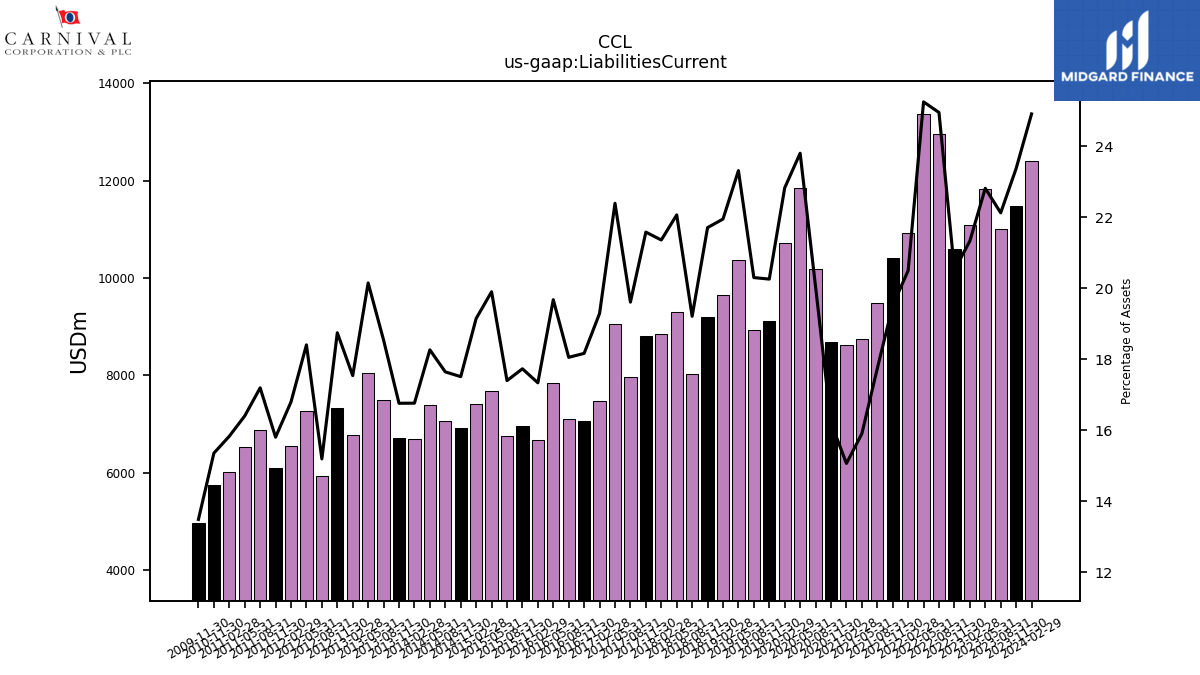
| Liabilities Current | 12396.00 | 11481.00 | 11008.00 | 11835.00 | 11088.00 | 10605.00 | 12954.00 | 13380.00 | 10920.00 | 10408.00 | 9491.00 | 8754.00 | 8619.00 | 8686.00 | 10184.00 | 11858.00 | 10716.00 | 9127.00 | 8932.00 | 10377.00 | 9642.00 | 9204.00 | 8020.00 | 9308.00 | 8851.00 | 8800.00 | 7969.00 | 9058.00 | 7465.00 | 7072.00 | 7100.00 | 7841.00 | 6664.00 | 6956.00 | 6749.00 | |
| Long Term Debt Current | 2195.00 | 2089.00 | 1780.00 | 1789.00 | 2264.00 | 2393.00 | 2877.00 | 3196.00 | 2272.00 | 1927.00 | 1303.00 | 1708.00 | 1726.00 | 1742.00 | 2621.00 | 2373.00 | 2196.00 | 1596.00 | 1607.00 | 1614.00 | 1684.00 | 1578.00 | 688.00 | 848.00 | 1006.00 | 1717.00 | 1265.00 | 1108.00 | 1127.00 | 640.00 | 739.00 | 836.00 | 813.00 | 1344.00 | 1218.00 | |
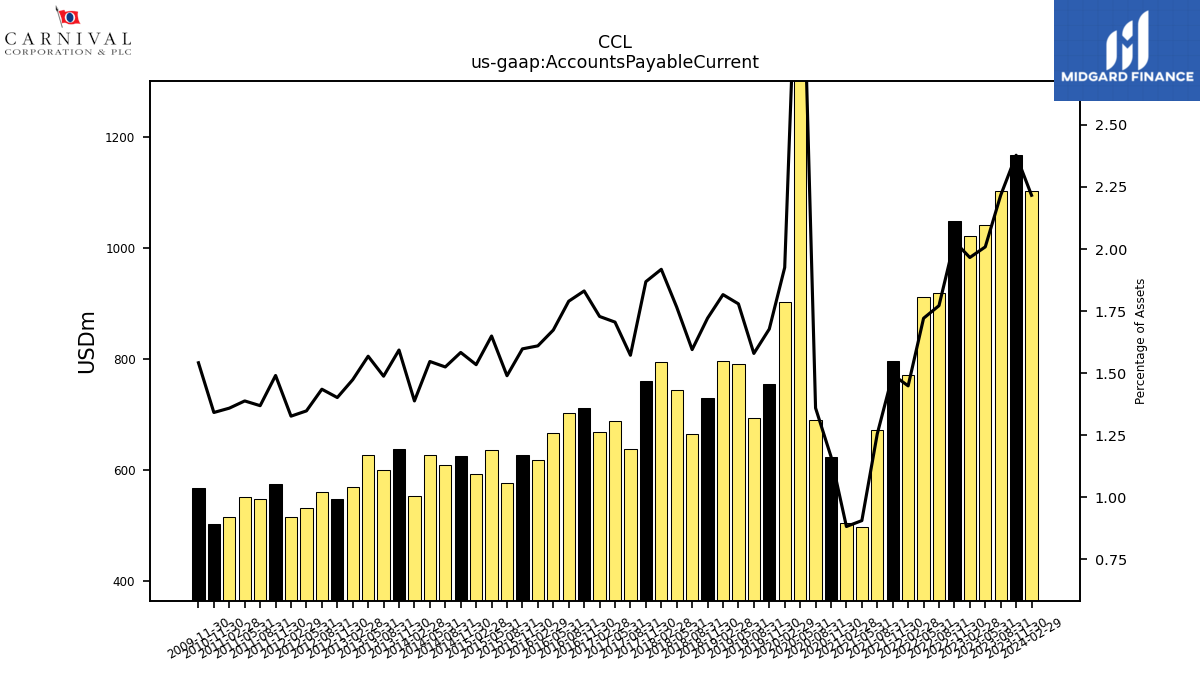
| Accounts Payable Current | 1103.00 | 1168.00 | 1103.00 | 1042.00 | 1022.00 | 1050.00 | 920.00 | 912.00 | 772.00 | 797.00 | 672.00 | 499.00 | 505.00 | 624.00 | 691.00 | 1809.00 | 904.00 | 756.00 | 695.00 | 792.00 | 798.00 | 730.00 | 666.00 | 745.00 | 795.00 | 762.00 | 639.00 | 690.00 | 669.00 | 713.00 | 704.00 | 667.00 | 619.00 | 627.00 | 578.00 | |
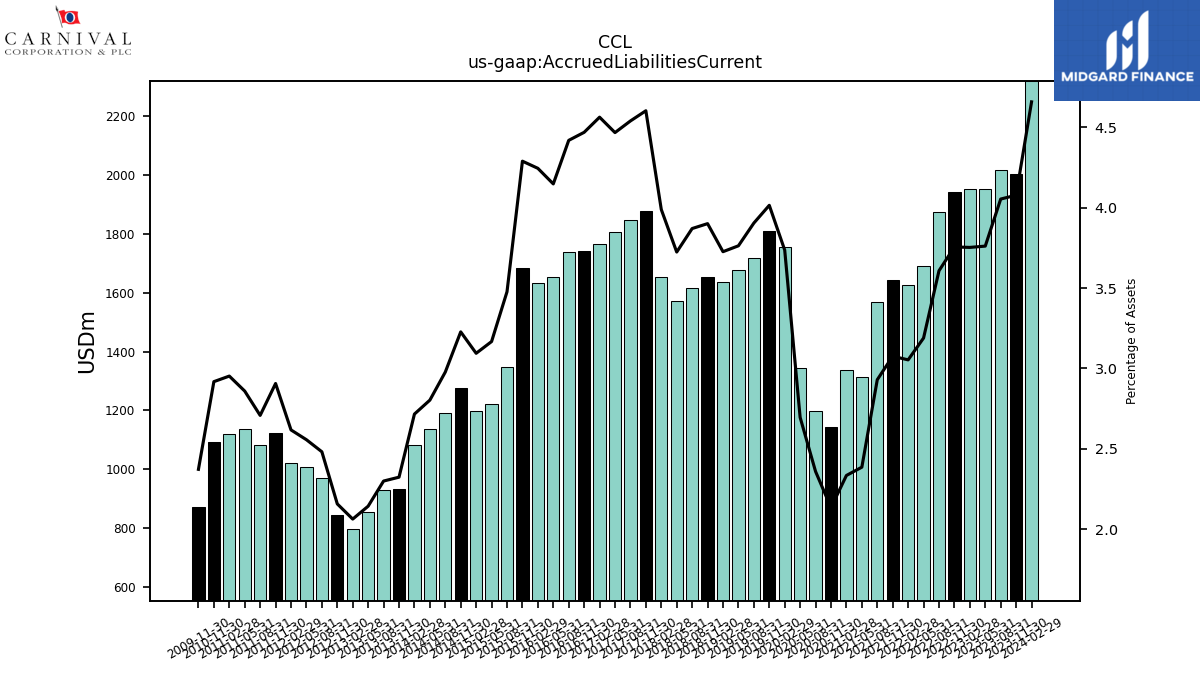
| Accrued Liabilities Current | 2318.00 | 2003.00 | 2017.00 | 1951.00 | 1951.00 | 1942.00 | 1873.00 | 1690.00 | 1627.00 | 1641.00 | 1568.00 | 1314.00 | 1336.00 | 1144.00 | 1199.00 | 1343.00 | 1754.00 | 1809.00 | 1718.00 | 1675.00 | 1637.00 | 1654.00 | 1616.00 | 1571.00 | 1653.00 | 1877.00 | 1845.00 | 1807.00 | 1766.00 | 1740.00 | 1738.00 | 1653.00 | 1632.00 | 1683.00 | 1349.00 | |
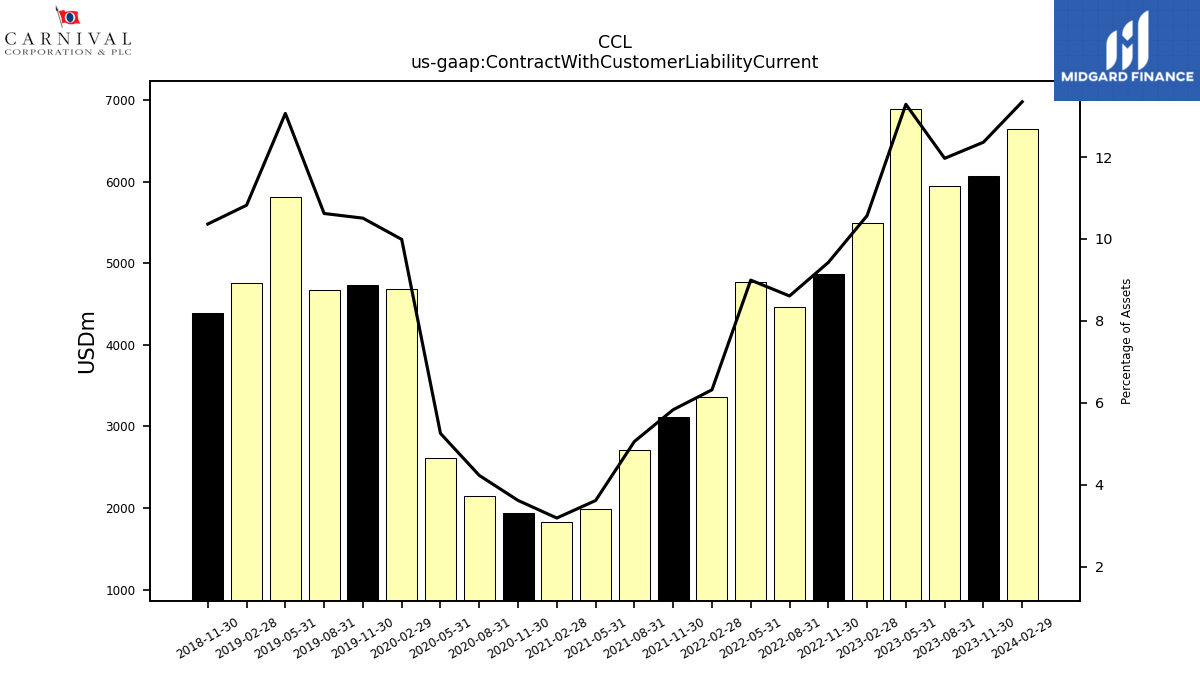
| Contract With Customer Liability Current | 6642.00 | 6072.00 | 5955.00 | 6892.00 | 5495.00 | 4874.00 | 4470.00 | 4767.00 | 3367.00 | 3112.00 | 2707.00 | 1992.00 | 1826.00 | 1940.00 | 2150.00 | 2618.00 | 4690.00 | 4735.00 | 4674.00 | 5815.00 | 4755.00 | 4395.00 | NA | NA | NA | NA | NA | NA | NA | NA | NA | NA | NA | NA | NA |
| 2024-02-29 | 2023-11-30 | 2023-08-31 | 2023-05-31 | 2023-02-28 | 2022-11-30 | 2022-08-31 | 2022-05-31 | 2022-02-28 | 2021-11-30 | 2021-08-31 | 2021-05-31 | 2021-02-28 | 2020-11-30 | 2020-08-31 | 2020-05-31 | 2020-02-29 | 2019-11-30 | 2019-08-31 | 2019-05-31 | 2019-02-28 | 2018-11-30 | 2018-08-31 | 2018-05-31 | 2018-02-28 | 2017-11-30 | 2017-08-31 | 2017-05-31 | 2017-02-28 | 2016-11-30 | 2016-08-31 | 2016-05-31 | 2016-02-29 | 2015-11-30 | 2015-08-31 | ||
|---|---|---|---|---|---|---|---|---|---|---|---|---|---|---|---|---|---|---|---|---|---|---|---|---|---|---|---|---|---|---|---|---|---|---|---|---|
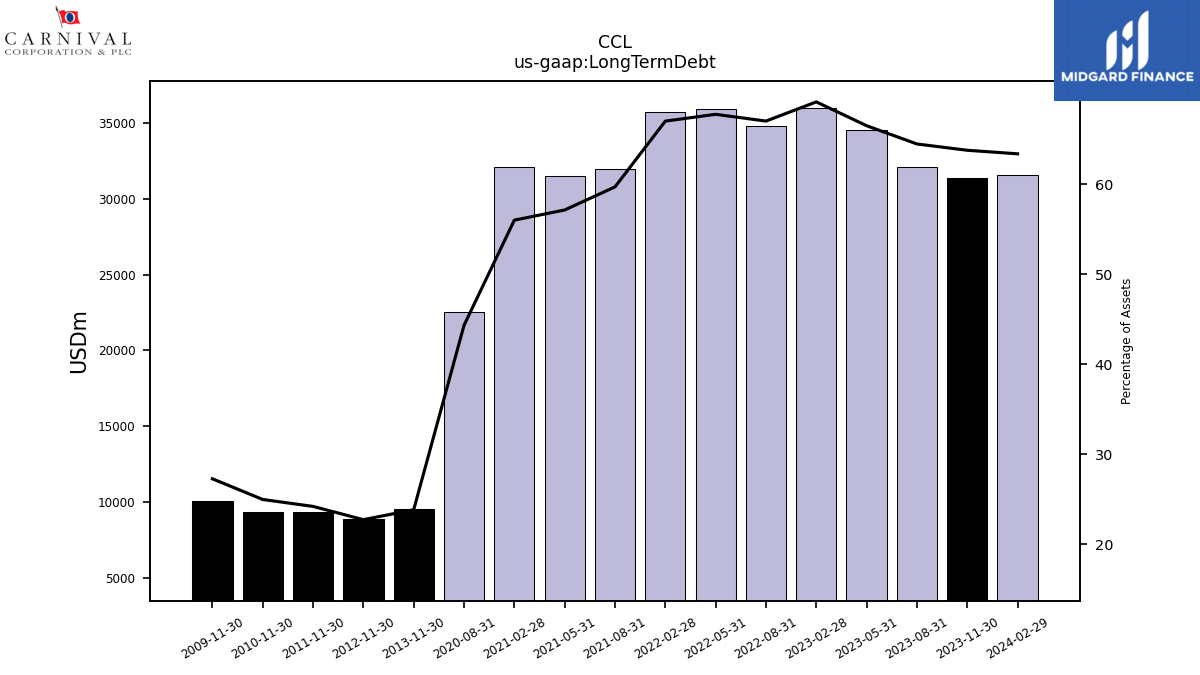
| Long Term Debt | 31552.00 | 31339.00 | 32093.00 | 34511.00 | 35963.00 | NA | 34808.00 | 35925.00 | 35721.00 | NA | 31964.00 | 31475.00 | 32065.00 | NA | 22532.00 | NA | NA | NA | NA | NA | NA | NA | NA | NA | NA | NA | NA | NA | NA | NA | NA | NA | NA | NA | NA | |
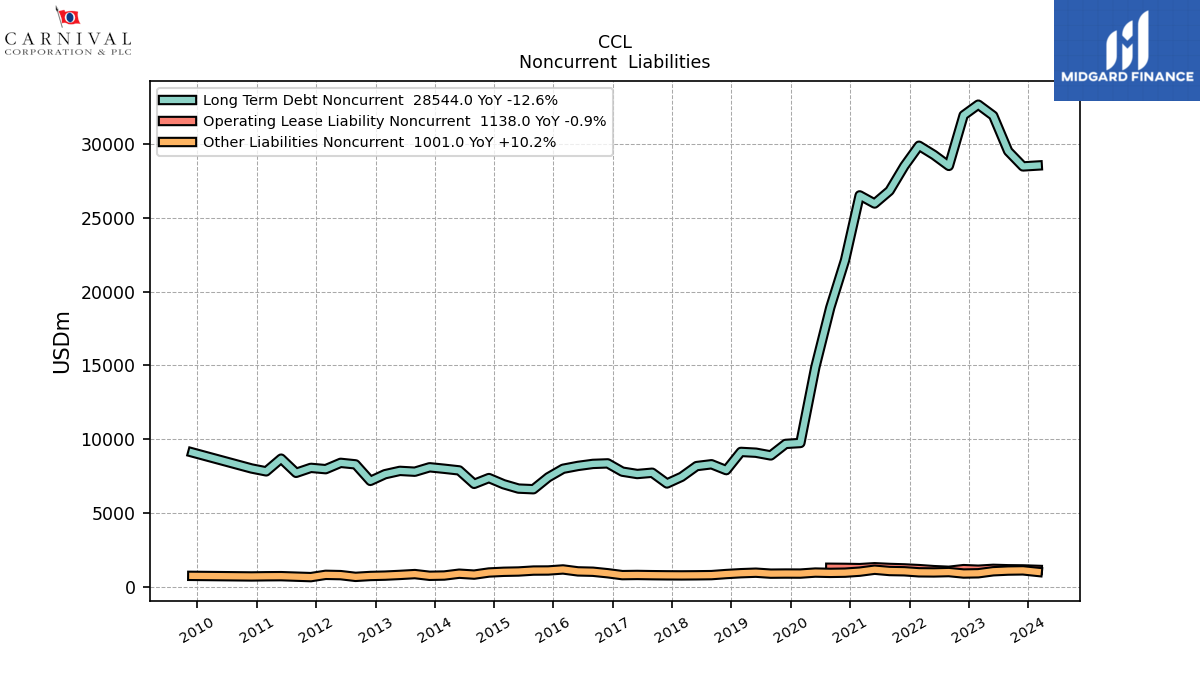
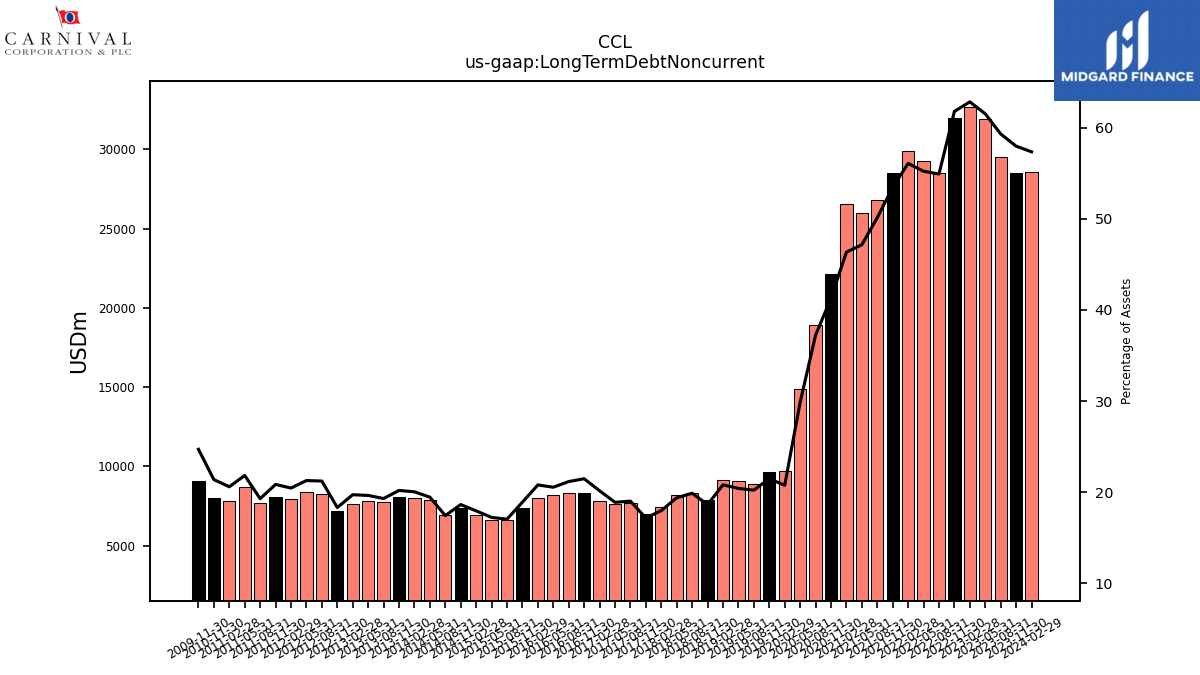
| Long Term Debt Noncurrent | 28544.00 | 28483.00 | 29516.00 | 31921.00 | 32672.00 | 31953.00 | 28518.00 | 29263.00 | 29887.00 | 28509.00 | 26831.00 | 25968.00 | 26522.00 | 22130.00 | 18916.00 | 14870.00 | 9738.00 | 9675.00 | 8893.00 | 9080.00 | 9134.00 | 7897.00 | 8297.00 | 8172.00 | 7445.00 | 6993.00 | 7723.00 | 7635.00 | 7796.00 | 8357.00 | 8320.00 | 8183.00 | 7990.00 | 7413.00 | 6604.00 | |
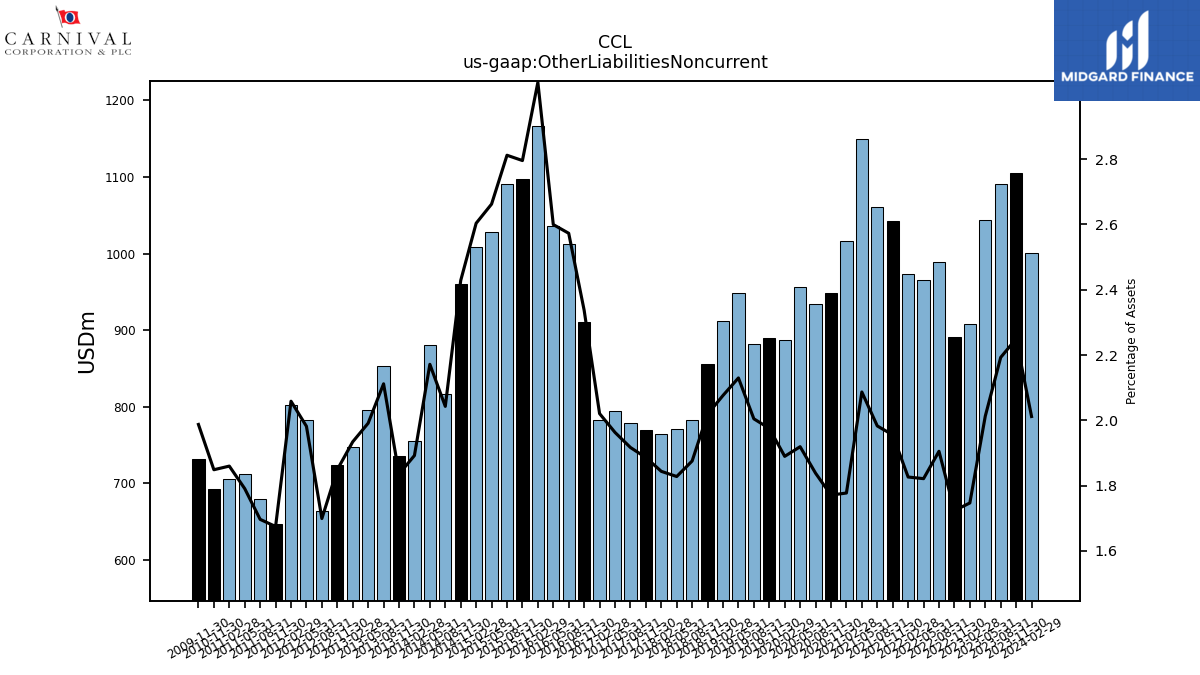
| Other Liabilities Noncurrent | 1001.00 | 1105.00 | 1091.00 | 1044.00 | 908.00 | 891.00 | 989.00 | 965.00 | 973.00 | 1043.00 | 1061.00 | 1149.00 | 1017.00 | 949.00 | 934.00 | 956.00 | 887.00 | 890.00 | 882.00 | 948.00 | 912.00 | 856.00 | 783.00 | 771.00 | 764.00 | 769.00 | 779.00 | 794.00 | 782.00 | 910.00 | 1012.00 | 1036.00 | 1167.00 | 1097.00 | 1091.00 | |
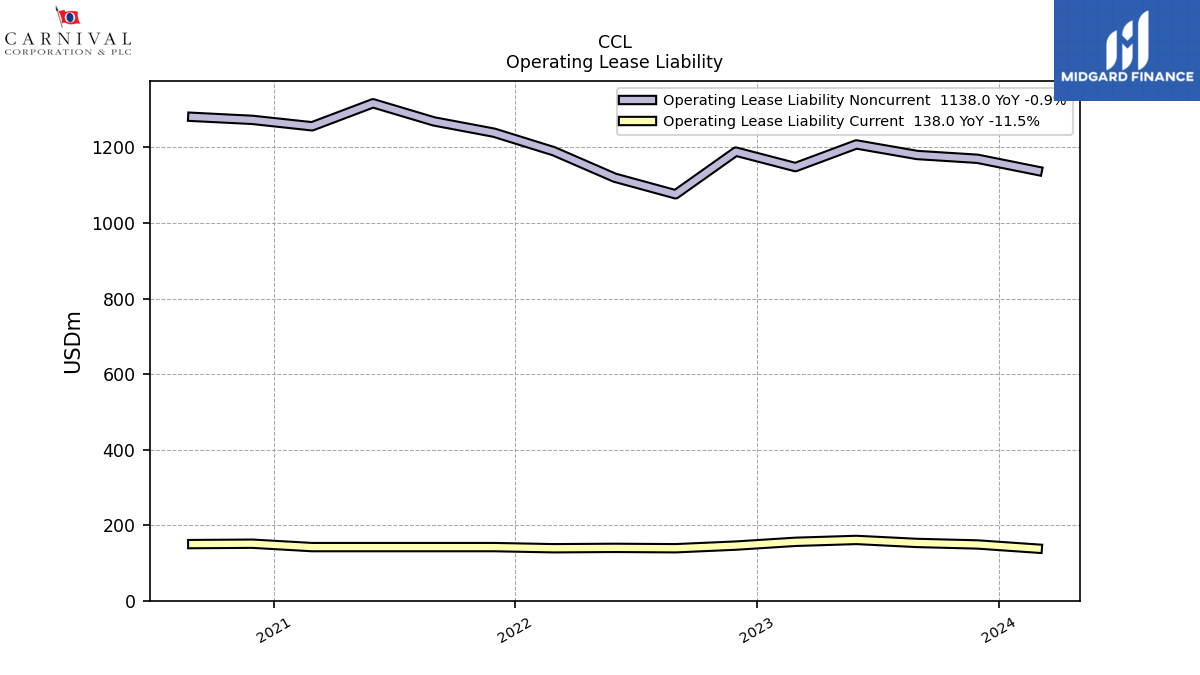
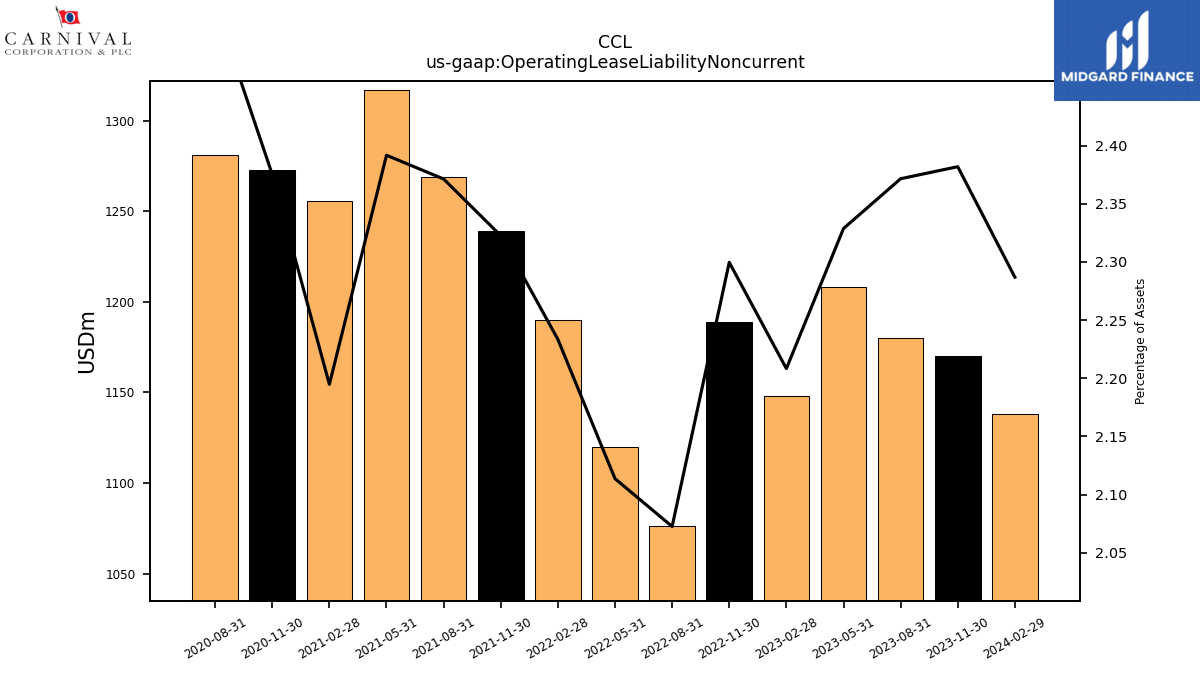
| Operating Lease Liability Noncurrent | 1138.00 | 1170.00 | 1180.00 | 1208.00 | 1148.00 | 1189.00 | 1076.00 | 1120.00 | 1190.00 | 1239.00 | 1269.00 | 1317.00 | 1256.00 | 1273.00 | 1281.00 | NA | NA | NA | NA | NA | NA | NA | NA | NA | NA | NA | NA | NA | NA | NA | NA | NA | NA | NA | NA |
| 2024-02-29 | 2023-11-30 | 2023-08-31 | 2023-05-31 | 2023-02-28 | 2022-11-30 | 2022-08-31 | 2022-05-31 | 2022-02-28 | 2021-11-30 | 2021-08-31 | 2021-05-31 | 2021-02-28 | 2020-11-30 | 2020-08-31 | 2020-05-31 | 2020-02-29 | 2019-11-30 | 2019-08-31 | 2019-05-31 | 2019-02-28 | 2018-11-30 | 2018-08-31 | 2018-05-31 | 2018-02-28 | 2017-11-30 | 2017-08-31 | 2017-05-31 | 2017-02-28 | 2016-11-30 | 2016-08-31 | 2016-05-31 | 2016-02-29 | 2015-11-30 | 2015-08-31 | ||
|---|---|---|---|---|---|---|---|---|---|---|---|---|---|---|---|---|---|---|---|---|---|---|---|---|---|---|---|---|---|---|---|---|---|---|---|---|
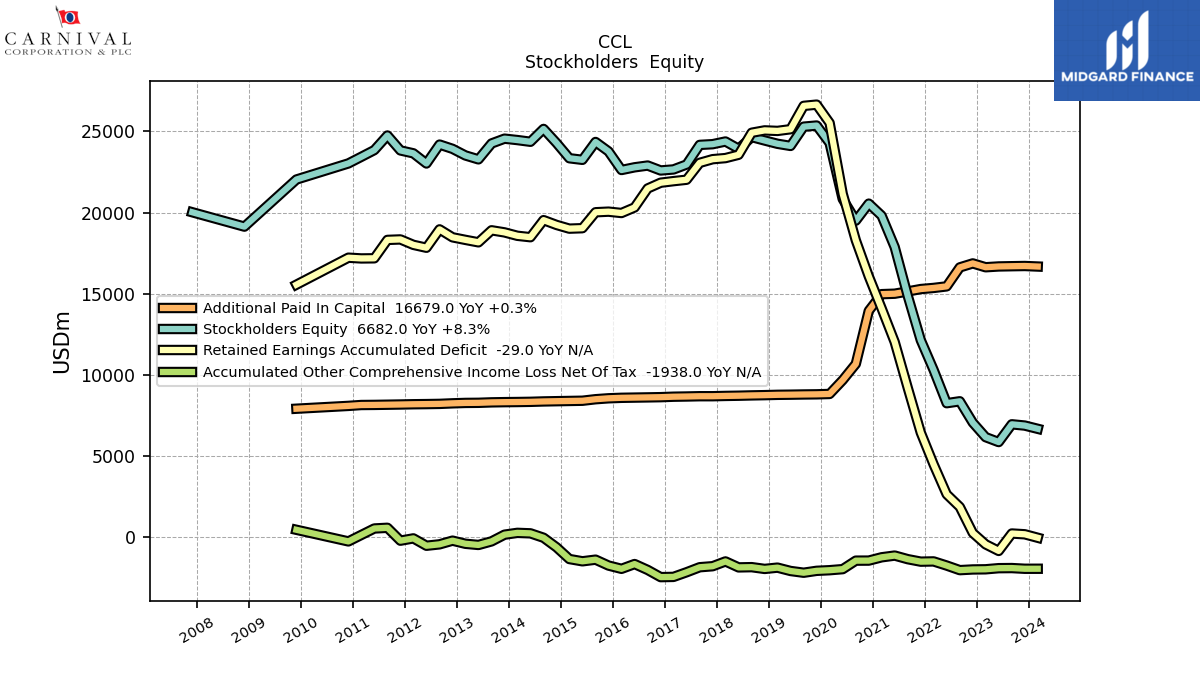
| Stockholders Equity | 6682.00 | 6882.00 | 6960.00 | 5865.00 | 6170.00 | 7065.00 | 8379.00 | 8260.00 | 10311.00 | 12144.00 | 14863.00 | 17876.00 | 19813.00 | 20555.00 | 19503.00 | 20840.00 | 24290.00 | 25365.00 | 25295.00 | 24108.00 | 24241.00 | 24443.00 | 24654.00 | 23933.00 | 24382.00 | 24216.00 | 24172.00 | 22964.00 | 22660.00 | 22597.00 | 22900.00 | 22791.00 | 22625.00 | 23771.00 | 24353.00 | |
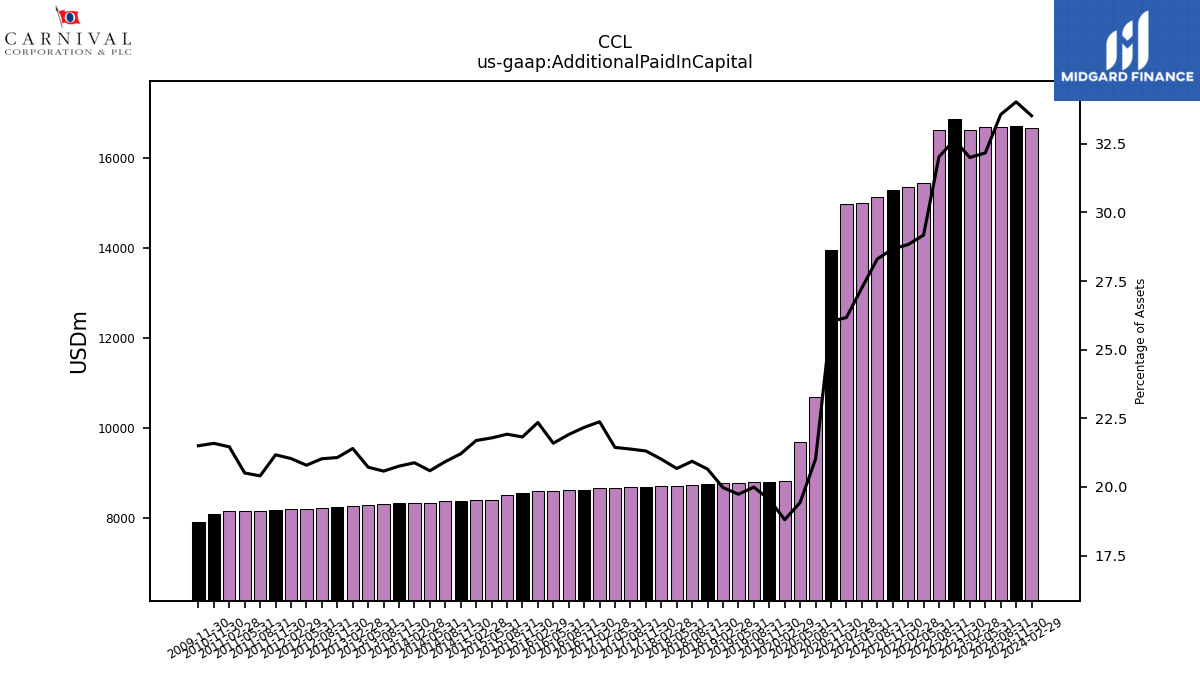
| Additional Paid In Capital | 16679.00 | 16712.00 | 16699.00 | 16684.00 | 16635.00 | 16872.00 | 16626.00 | 15457.00 | 15360.00 | 15292.00 | 15146.00 | 15005.00 | 14977.00 | 13948.00 | 10680.00 | 9683.00 | 8829.00 | 8807.00 | 8798.00 | 8785.00 | 8776.00 | 8756.00 | 8741.00 | 8721.00 | 8708.00 | 8690.00 | 8690.00 | 8673.00 | 8660.00 | 8632.00 | 8618.00 | 8605.00 | 8592.00 | 8562.00 | 8505.00 | |
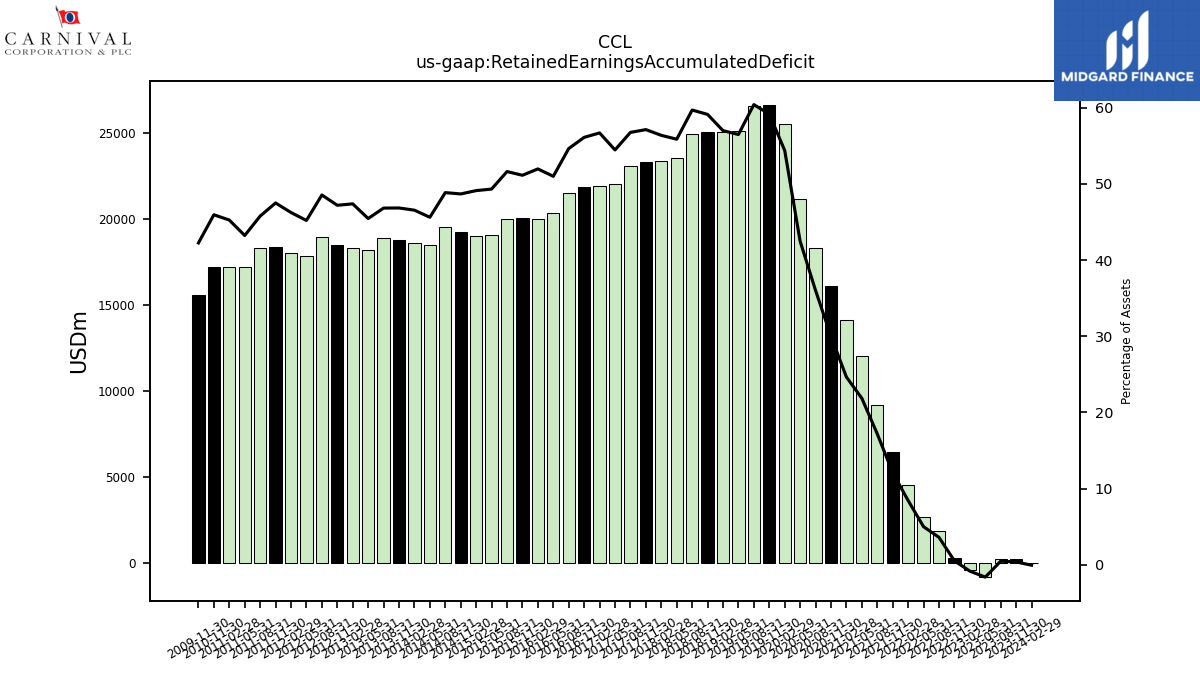
| Retained Earnings Accumulated Deficit | -29.00 | 185.00 | 233.00 | -841.00 | -434.00 | 269.00 | 1868.00 | 2649.00 | 4493.00 | 6448.00 | 9194.00 | 12030.00 | 14102.00 | 16075.00 | 18297.00 | 21155.00 | 25527.00 | 26653.00 | 26576.00 | 25138.00 | 25033.00 | 25066.00 | 24921.00 | 23564.00 | 23360.00 | 23292.00 | 23066.00 | 22026.00 | 21939.00 | 21843.00 | 21488.00 | 20320.00 | 19976.00 | 20060.00 | 20023.00 | |
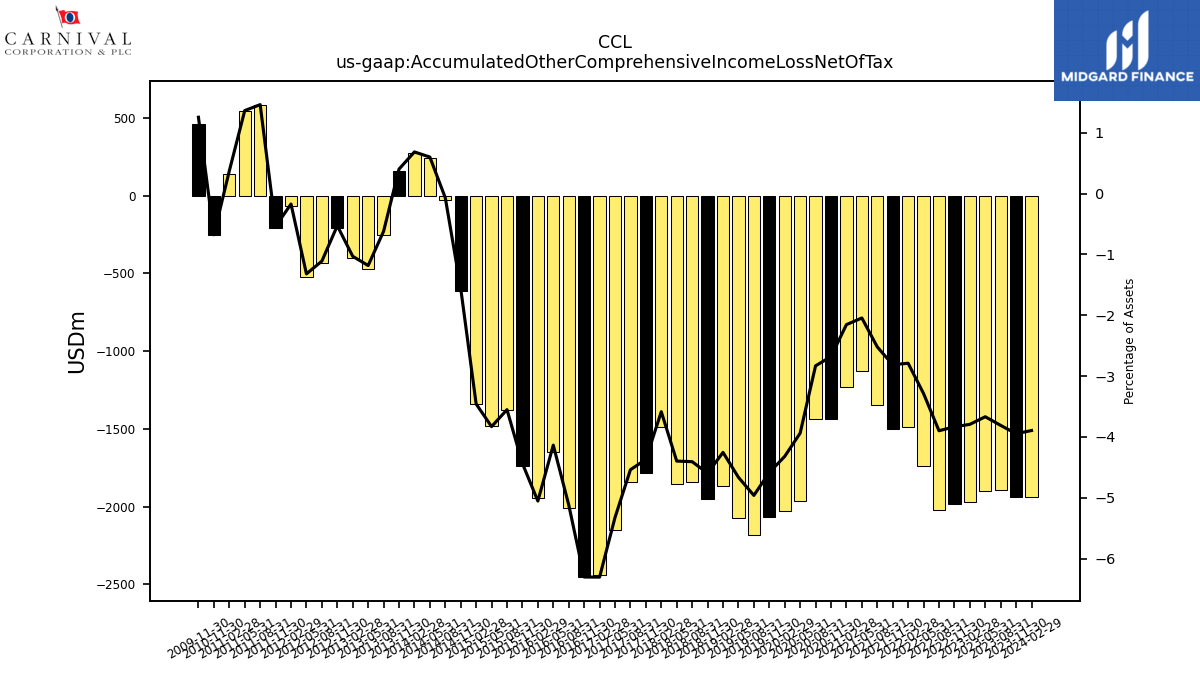
| Accumulated Other Comprehensive Income Loss Net Of Tax | -1938.00 | -1939.00 | -1896.00 | -1903.00 | -1972.00 | -1982.00 | -2024.00 | -1742.00 | -1486.00 | -1501.00 | -1349.00 | -1126.00 | -1233.00 | -1436.00 | -1439.00 | -1962.00 | -2028.00 | -2066.00 | -2183.00 | -2076.00 | -1869.00 | -1949.00 | -1840.00 | -1855.00 | -1486.00 | -1782.00 | -1845.00 | -2154.00 | -2440.00 | -2454.00 | -2012.00 | -1648.00 | -1943.00 | -1741.00 | -1378.00 |
| 2024-02-29 | 2023-11-30 | 2023-08-31 | 2023-05-31 | 2023-02-28 | 2022-11-30 | 2022-08-31 | 2022-05-31 | 2022-02-28 | 2021-11-30 | 2021-08-31 | 2021-05-31 | 2021-02-28 | 2020-11-30 | 2020-08-31 | 2020-05-31 | 2020-02-29 | 2019-11-30 | 2019-08-31 | 2019-05-31 | 2019-02-28 | 2018-11-30 | 2018-08-31 | 2018-05-31 | 2018-02-28 | 2017-11-30 | 2017-08-31 | 2017-05-31 | 2017-02-28 | 2016-11-30 | 2016-08-31 | 2016-05-31 | 2016-02-29 | 2015-11-30 | 2015-08-31 | ||
|---|---|---|---|---|---|---|---|---|---|---|---|---|---|---|---|---|---|---|---|---|---|---|---|---|---|---|---|---|---|---|---|---|---|---|---|---|
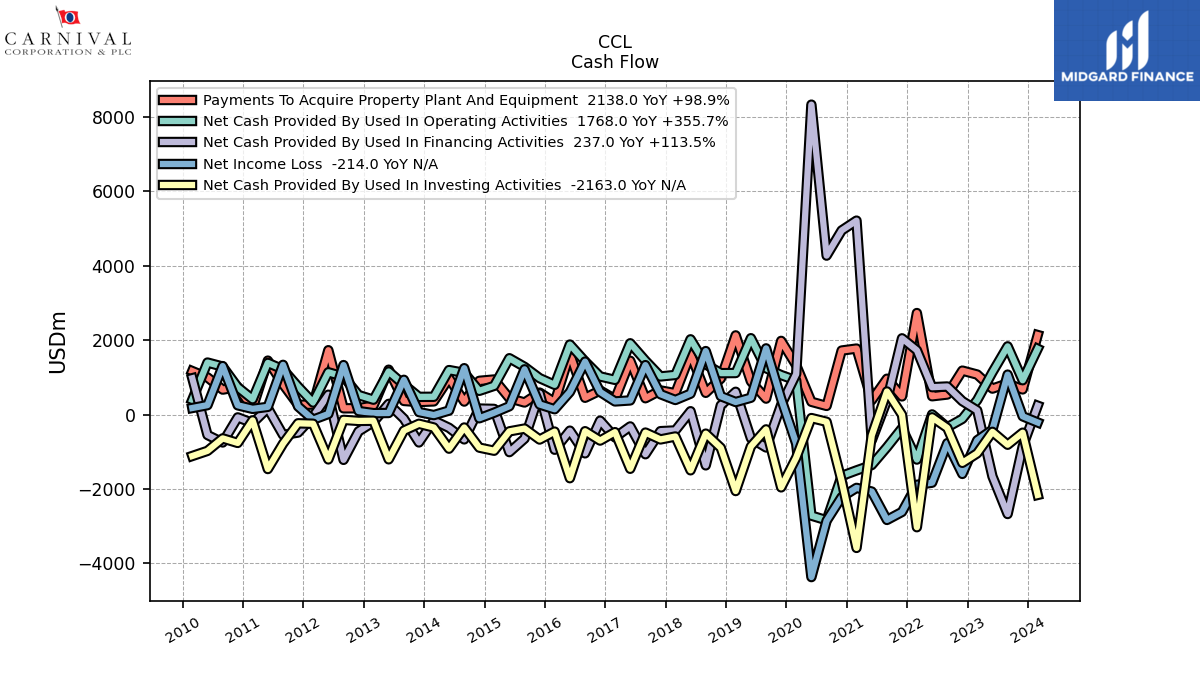
| Net Cash Provided By Used In Operating Activities | 1768.00 | 922.00 | 1834.00 | 1137.00 | 388.00 | -117.00 | -344.00 | 3.00 | -1212.00 | -368.00 | -879.00 | -1359.00 | -1503.00 | -1652.00 | -2845.00 | -2720.00 | 916.00 | 1061.00 | 1245.00 | 2053.00 | 1116.00 | 1113.00 | 1349.00 | 2023.00 | 1064.00 | 1024.00 | 1449.00 | 1917.00 | 932.00 | 1024.00 | 1429.00 | 1883.00 | 798.00 | 978.00 | 1281.00 | |
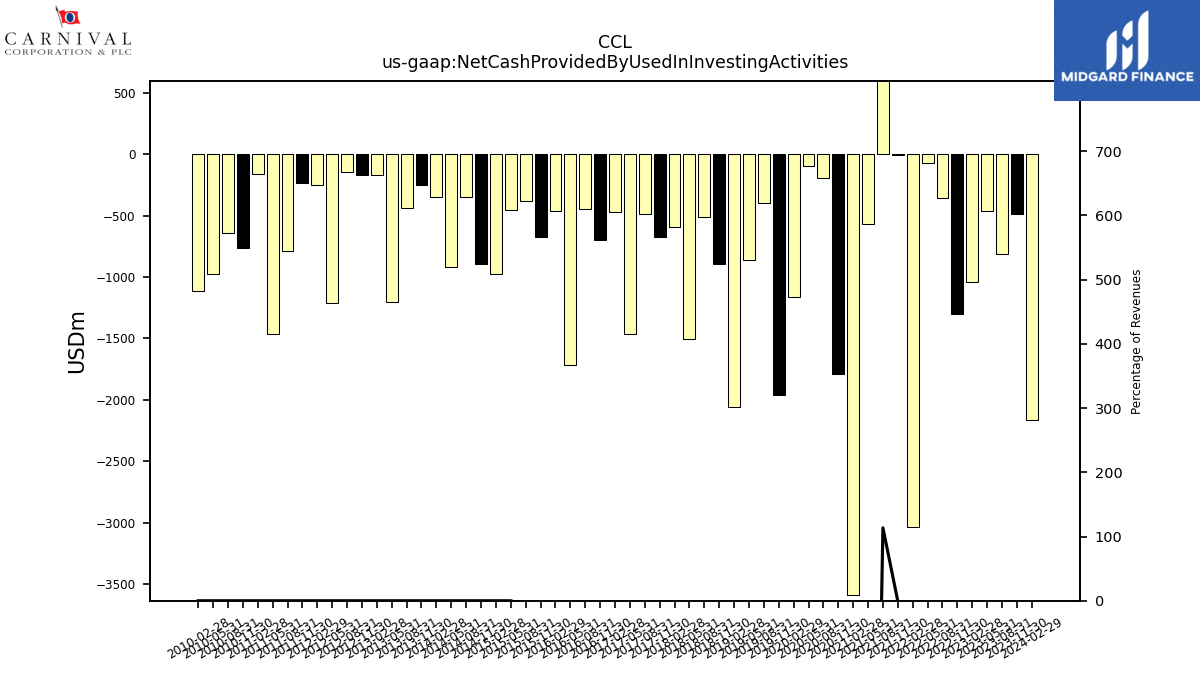
| Net Cash Provided By Used In Investing Activities | -2163.00 | -488.00 | -813.00 | -465.00 | -1044.00 | -1300.00 | -360.00 | -75.00 | -3032.00 | -8.00 | 620.00 | -566.00 | -3589.00 | -1788.00 | -196.00 | -95.00 | -1161.00 | -1960.00 | -399.00 | -859.00 | -2059.00 | -896.00 | -514.00 | -1501.00 | -591.00 | -670.00 | -485.00 | -1460.00 | -474.00 | -701.00 | -449.00 | -1714.00 | -459.00 | -673.00 | -378.00 | |
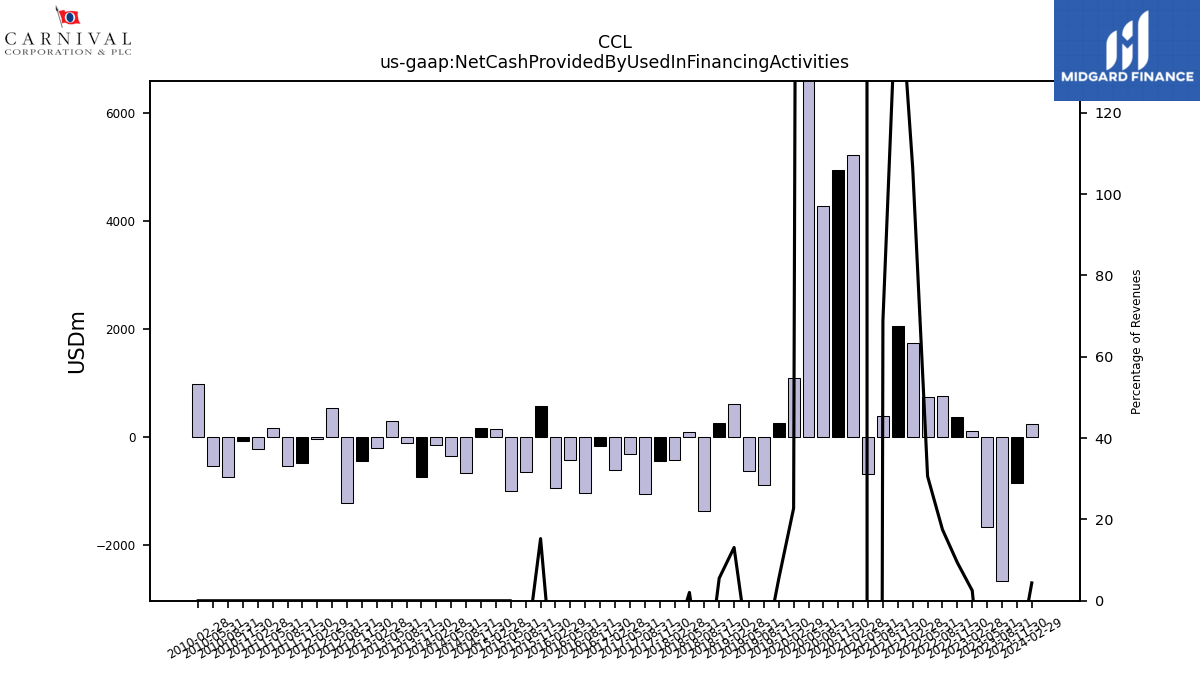
| Net Cash Provided By Used In Financing Activities | 237.00 | -860.00 | -2677.00 | -1663.00 | 111.00 | 360.00 | 754.00 | 735.00 | 1728.00 | 2050.00 | 376.00 | -693.00 | 5216.00 | 4951.00 | 4274.00 | 8336.00 | 1089.00 | 257.00 | -886.00 | -638.00 | 612.00 | 247.00 | -1368.00 | 89.00 | -428.00 | -448.00 | -1069.00 | -320.00 | -615.00 | -165.00 | -1045.00 | -434.00 | -947.00 | 567.00 | -648.00 |
| 2024-02-29 | 2023-11-30 | 2023-08-31 | 2023-05-31 | 2023-02-28 | 2022-11-30 | 2022-08-31 | 2022-05-31 | 2022-02-28 | 2021-11-30 | 2021-08-31 | 2021-05-31 | 2021-02-28 | 2020-11-30 | 2020-08-31 | 2020-05-31 | 2020-02-29 | 2019-11-30 | 2019-08-31 | 2019-05-31 | 2019-02-28 | 2018-11-30 | 2018-08-31 | 2018-05-31 | 2018-02-28 | 2017-11-30 | 2017-08-31 | 2017-05-31 | 2017-02-28 | 2016-11-30 | 2016-08-31 | 2016-05-31 | 2016-02-29 | 2015-11-30 | 2015-08-31 | ||
|---|---|---|---|---|---|---|---|---|---|---|---|---|---|---|---|---|---|---|---|---|---|---|---|---|---|---|---|---|---|---|---|---|---|---|---|---|
| Net Cash Provided By Used In Operating Activities | 1768.00 | 922.00 | 1834.00 | 1137.00 | 388.00 | -117.00 | -344.00 | 3.00 | -1212.00 | -368.00 | -879.00 | -1359.00 | -1503.00 | -1652.00 | -2845.00 | -2720.00 | 916.00 | 1061.00 | 1245.00 | 2053.00 | 1116.00 | 1113.00 | 1349.00 | 2023.00 | 1064.00 | 1024.00 | 1449.00 | 1917.00 | 932.00 | 1024.00 | 1429.00 | 1883.00 | 798.00 | 978.00 | 1281.00 | |
| Net Income Loss | -214.00 | -48.00 | 1074.00 | -407.00 | -693.00 | -1598.00 | -770.00 | -1834.00 | -1891.00 | -2620.00 | -2836.00 | -2072.00 | -1973.00 | -2222.00 | -2858.00 | -4374.00 | -781.00 | 423.00 | 1780.00 | 451.00 | 336.00 | 493.00 | 1707.00 | 561.00 | 391.00 | 546.00 | 1329.00 | 379.00 | 352.00 | 608.00 | 1424.00 | 605.00 | 142.00 | 270.00 | 1216.00 | |
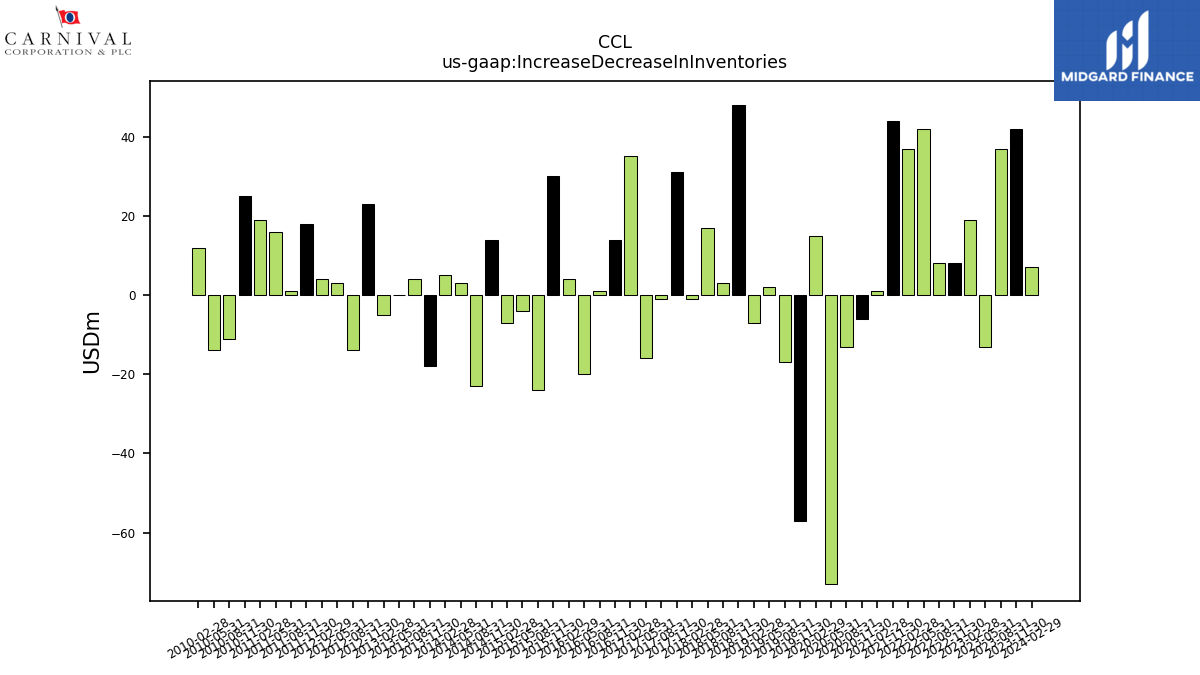
| Increase Decrease In Inventories | 7.00 | 42.00 | 37.00 | -13.00 | 19.00 | 8.00 | 8.00 | 42.00 | 37.00 | 44.00 | NA | NA | 1.00 | -6.00 | -13.00 | -73.00 | 15.00 | -57.00 | -17.00 | 2.00 | -7.00 | 48.00 | 3.00 | 17.00 | -1.00 | 31.00 | -1.00 | -16.00 | 35.00 | 14.00 | 1.00 | -20.00 | 4.00 | 30.00 | -24.00 | |
| Increase Decrease In Accounts Payable | -11.00 | 46.00 | 54.00 | 12.00 | -35.00 | 107.00 | 37.00 | 163.00 | -24.00 | 191.00 | 134.00 | 9.00 | -128.00 | -68.00 | -1149.00 | 904.00 | 148.00 | 59.00 | -93.00 | 3.00 | 65.00 | 70.00 | -80.00 | -33.00 | 19.00 | 122.00 | -63.00 | 9.00 | -47.00 | 21.00 | 52.00 | 43.00 | -7.00 | 59.00 | -62.00 | |
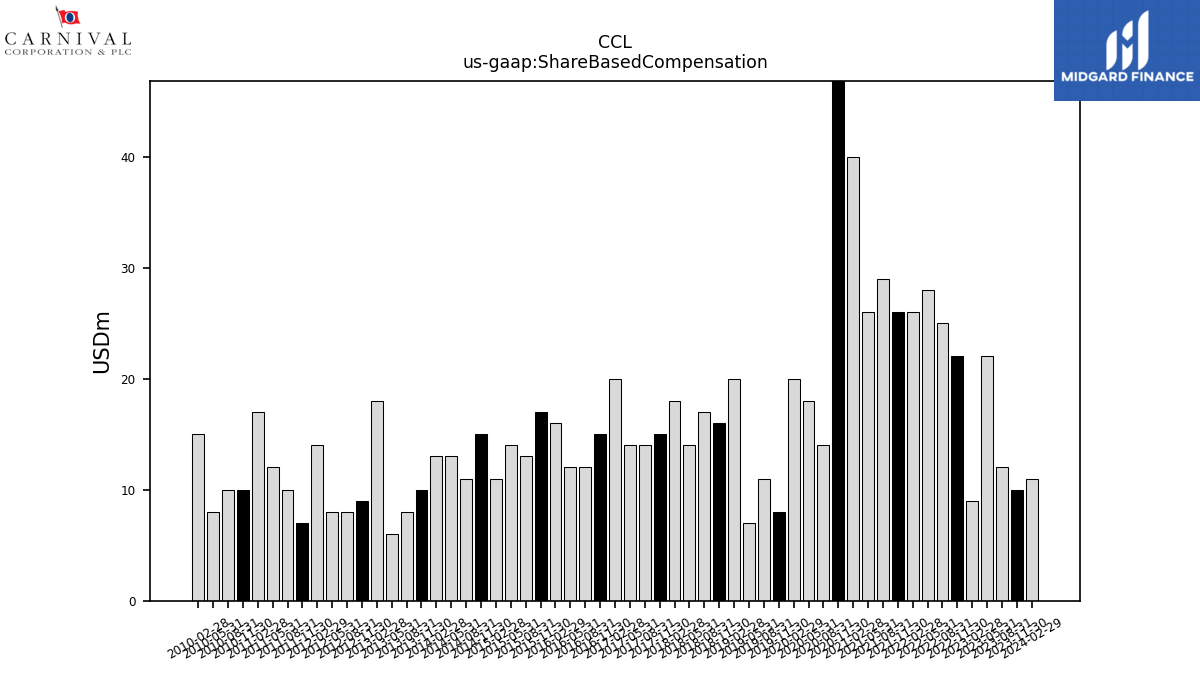
| Share Based Compensation | 11.00 | 10.00 | 12.00 | 22.00 | 9.00 | 22.00 | 25.00 | 28.00 | 26.00 | 26.00 | 29.00 | 26.00 | 40.00 | 53.00 | 14.00 | 18.00 | 20.00 | 8.00 | 11.00 | 7.00 | 20.00 | 16.00 | 17.00 | 14.00 | 18.00 | 15.00 | 14.00 | 14.00 | 20.00 | 15.00 | 12.00 | 12.00 | 16.00 | 17.00 | 13.00 |
| 2024-02-29 | 2023-11-30 | 2023-08-31 | 2023-05-31 | 2023-02-28 | 2022-11-30 | 2022-08-31 | 2022-05-31 | 2022-02-28 | 2021-11-30 | 2021-08-31 | 2021-05-31 | 2021-02-28 | 2020-11-30 | 2020-08-31 | 2020-05-31 | 2020-02-29 | 2019-11-30 | 2019-08-31 | 2019-05-31 | 2019-02-28 | 2018-11-30 | 2018-08-31 | 2018-05-31 | 2018-02-28 | 2017-11-30 | 2017-08-31 | 2017-05-31 | 2017-02-28 | 2016-11-30 | 2016-08-31 | 2016-05-31 | 2016-02-29 | 2015-11-30 | 2015-08-31 | ||
|---|---|---|---|---|---|---|---|---|---|---|---|---|---|---|---|---|---|---|---|---|---|---|---|---|---|---|---|---|---|---|---|---|---|---|---|---|
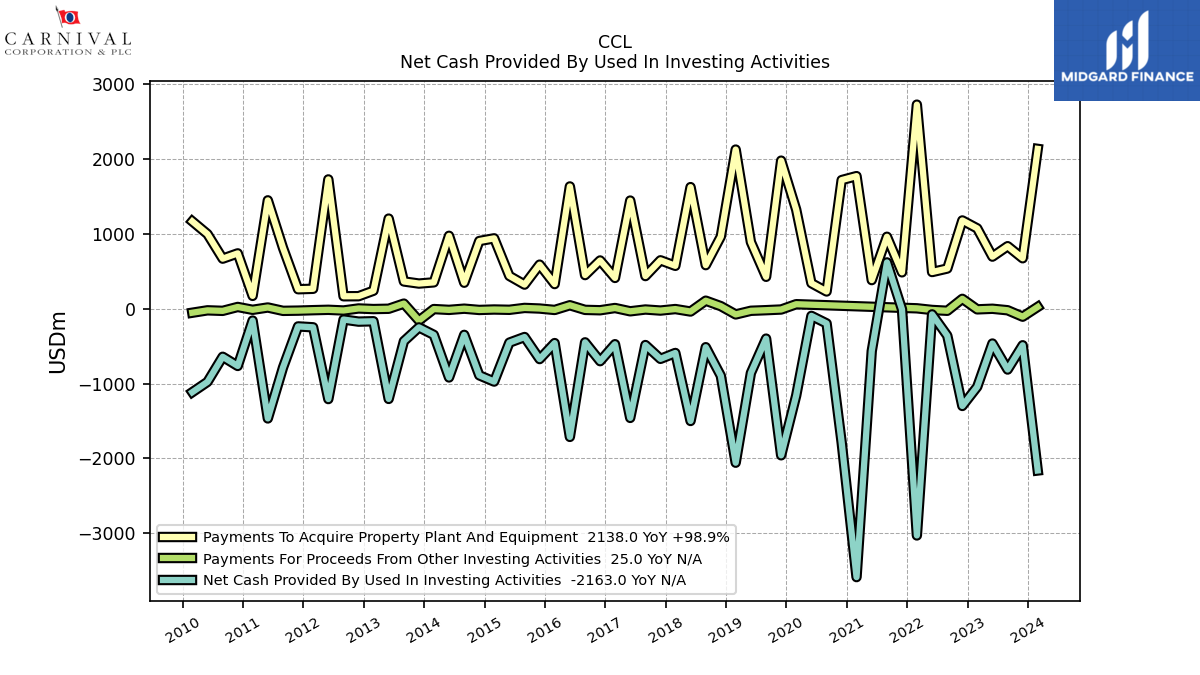
| Net Cash Provided By Used In Investing Activities | -2163.00 | -488.00 | -813.00 | -465.00 | -1044.00 | -1300.00 | -360.00 | -75.00 | -3032.00 | -8.00 | 620.00 | -566.00 | -3589.00 | -1788.00 | -196.00 | -95.00 | -1161.00 | -1960.00 | -399.00 | -859.00 | -2059.00 | -896.00 | -514.00 | -1501.00 | -591.00 | -670.00 | -485.00 | -1460.00 | -474.00 | -701.00 | -449.00 | -1714.00 | -459.00 | -673.00 | -378.00 | |
| Payments To Acquire Property Plant And Equipment | 2138.00 | 675.00 | 837.00 | 697.00 | 1075.00 | 1181.00 | 538.00 | 491.00 | 2730.00 | 487.00 | 963.00 | 383.00 | 1774.00 | 1721.00 | 231.00 | 342.00 | 1326.00 | 1981.00 | 427.00 | 892.00 | 2129.00 | 965.00 | 583.00 | 1627.00 | 574.00 | 648.00 | 437.00 | 1447.00 | 412.00 | 646.00 | 450.00 | 1636.00 | 330.00 | 590.00 | 323.00 |
| 2024-02-29 | 2023-11-30 | 2023-08-31 | 2023-05-31 | 2023-02-28 | 2022-11-30 | 2022-08-31 | 2022-05-31 | 2022-02-28 | 2021-11-30 | 2021-08-31 | 2021-05-31 | 2021-02-28 | 2020-11-30 | 2020-08-31 | 2020-05-31 | 2020-02-29 | 2019-11-30 | 2019-08-31 | 2019-05-31 | 2019-02-28 | 2018-11-30 | 2018-08-31 | 2018-05-31 | 2018-02-28 | 2017-11-30 | 2017-08-31 | 2017-05-31 | 2017-02-28 | 2016-11-30 | 2016-08-31 | 2016-05-31 | 2016-02-29 | 2015-11-30 | 2015-08-31 | ||
|---|---|---|---|---|---|---|---|---|---|---|---|---|---|---|---|---|---|---|---|---|---|---|---|---|---|---|---|---|---|---|---|---|---|---|---|---|
| Net Cash Provided By Used In Financing Activities | 237.00 | -860.00 | -2677.00 | -1663.00 | 111.00 | 360.00 | 754.00 | 735.00 | 1728.00 | 2050.00 | 376.00 | -693.00 | 5216.00 | 4951.00 | 4274.00 | 8336.00 | 1089.00 | 257.00 | -886.00 | -638.00 | 612.00 | 247.00 | -1368.00 | 89.00 | -428.00 | -448.00 | -1069.00 | -320.00 | -615.00 | -165.00 | -1045.00 | -434.00 | -947.00 | 567.00 | -648.00 |
| 2024-02-29 | 2023-11-30 | 2023-08-31 | 2023-05-31 | 2023-02-28 | 2022-11-30 | 2022-08-31 | 2022-05-31 | 2022-02-28 | 2021-11-30 | 2021-08-31 | 2021-05-31 | 2021-02-28 | 2020-11-30 | 2020-08-31 | 2020-05-31 | 2020-02-29 | 2019-11-30 | 2019-08-31 | 2019-05-31 | 2019-02-28 | 2018-11-30 | 2018-08-31 | 2018-05-31 | 2018-02-28 | 2017-11-30 | 2017-08-31 | 2017-05-31 | 2017-02-28 | 2016-11-30 | 2016-08-31 | 2016-05-31 | 2016-02-29 | 2015-11-30 | 2015-08-31 | ||
|---|---|---|---|---|---|---|---|---|---|---|---|---|---|---|---|---|---|---|---|---|---|---|---|---|---|---|---|---|---|---|---|---|---|---|---|---|
| Revenues | 5406.00 | 5396.00 | 6854.00 | 4911.00 | 4432.00 | 3839.00 | 4305.00 | 2401.00 | 1623.00 | 1287.00 | 546.00 | 50.00 | 26.00 | 34.00 | 31.00 | 740.00 | 4789.00 | 4782.00 | 6533.00 | 4838.00 | 4673.00 | 4456.00 | 5836.00 | 4357.00 | 4232.00 | 4259.00 | 5515.00 | 3945.00 | 3791.00 | 3935.00 | 5097.00 | 3705.00 | 3651.00 | 3711.00 | 4883.00 | |
| Revenue From Contract With Customer Excluding Assessed Tax | 5406.00 | 5396.00 | 6854.00 | 4911.00 | 4432.00 | 3839.00 | 4305.00 | 2401.00 | 1623.00 | 1287.00 | 546.00 | 50.00 | 26.00 | 34.00 | 31.00 | 740.00 | 4789.00 | 4782.00 | 6533.00 | 4838.00 | 4673.00 | 4456.00 | 5836.00 | 4357.00 | 4232.00 | 4259.00 | 5515.00 | 3945.00 | 3791.00 | 3935.00 | 5097.00 | 3705.00 | 3651.00 | 3711.00 | 4883.00 | |
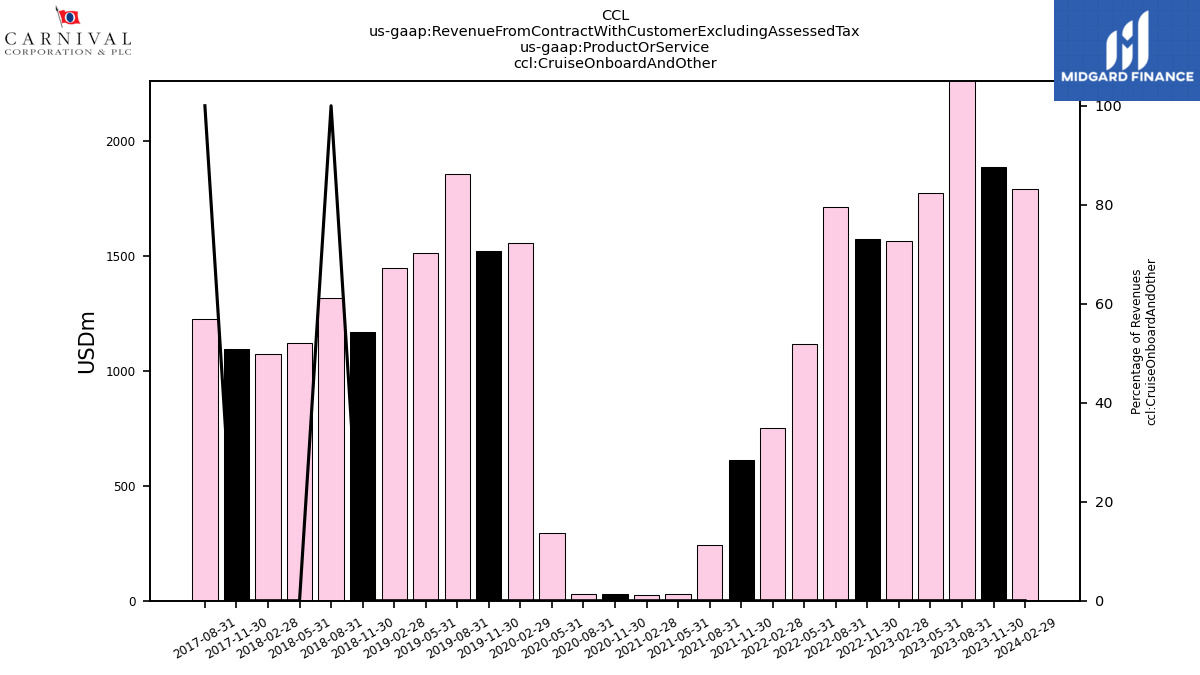
| Cruise Onboard And Other | 1790.00 | 1886.00 | 2308.00 | 1770.00 | 1563.00 | 1570.00 | 1711.00 | 1116.00 | 750.00 | 613.00 | 243.00 | 29.00 | 23.00 | 29.00 | 31.00 | 294.00 | 1556.00 | 1520.00 | 1855.00 | 1510.00 | 1446.00 | 1170.00 | 1316.00 | 1122.00 | 1071.00 | 1093.00 | 1223.00 | NA | NA | NA | NA | NA | NA | NA | NA | |
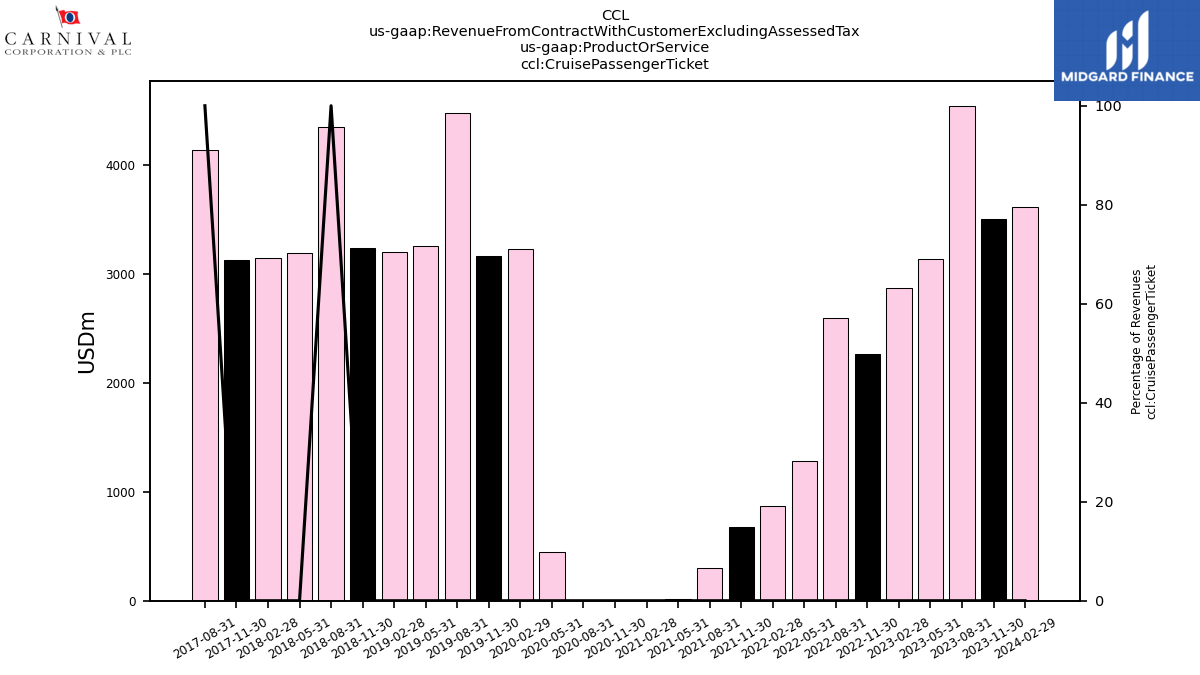
| Cruise Passenger Ticket | 3617.00 | 3510.00 | 4546.00 | 3141.00 | 2870.00 | 2269.00 | 2595.00 | 1285.00 | 873.00 | 674.00 | 303.00 | 20.00 | 3.00 | 4.00 | 0.00 | 446.00 | 3234.00 | 3170.00 | 4477.00 | 3257.00 | 3199.00 | 3236.00 | 4353.00 | 3193.00 | 3148.00 | 3130.00 | 4138.00 | NA | NA | NA | NA | NA | NA | NA | NA | |
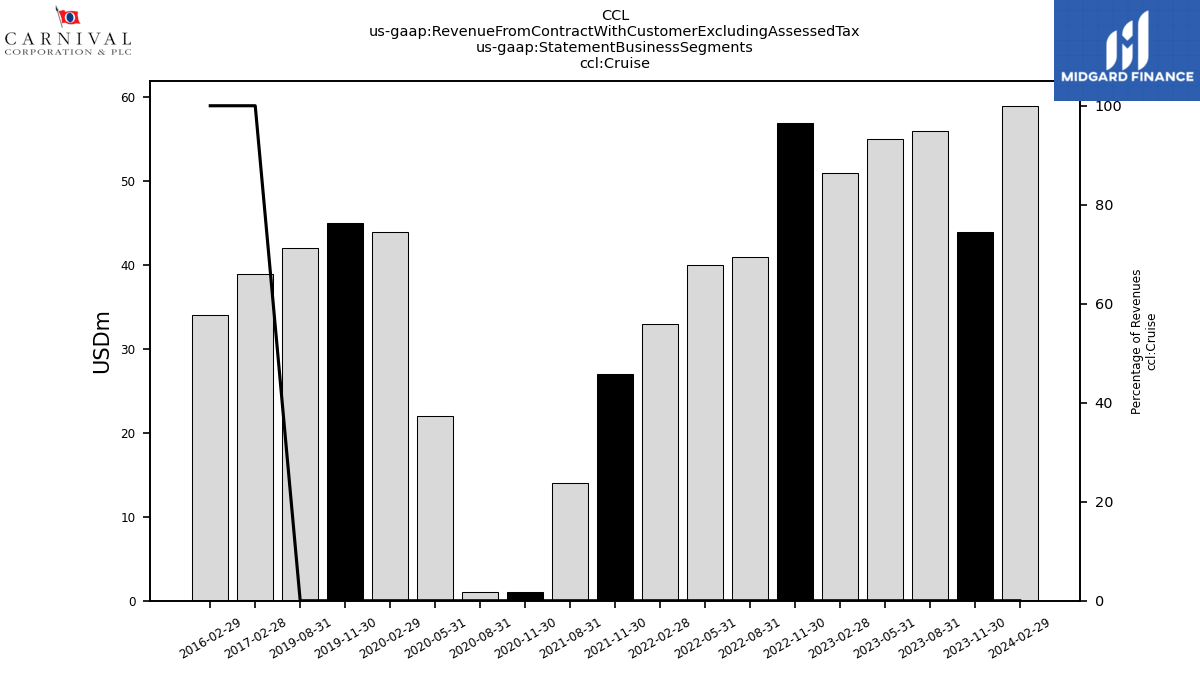
| Cruise | 59.00 | 44.00 | 56.00 | 55.00 | 51.00 | 57.00 | 41.00 | 40.00 | 33.00 | 27.00 | 14.00 | NA | NA | 1.00 | 1.00 | 22.00 | 44.00 | 45.00 | 42.00 | NA | NA | NA | NA | NA | NA | NA | NA | NA | 39.00 | NA | NA | NA | 34.00 | NA | NA | |
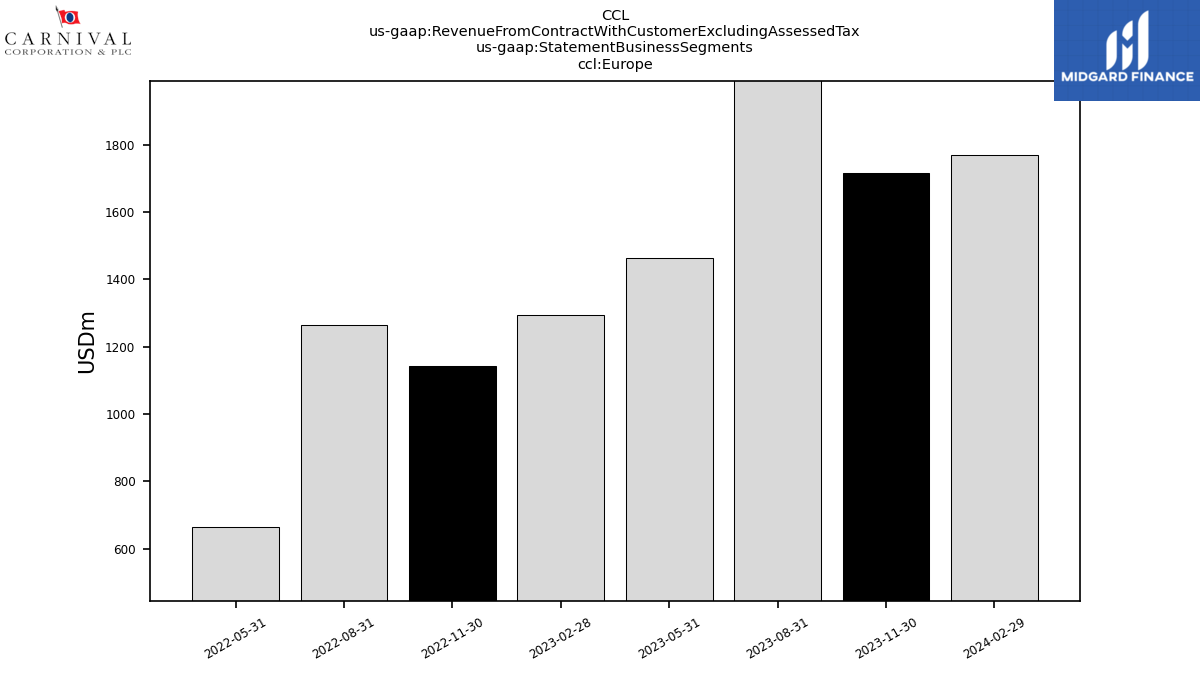
| Europe | 1769.00 | 1716.00 | 2060.00 | 1465.00 | 1294.00 | 1142.00 | 1266.00 | 666.00 | NA | NA | NA | NA | NA | NA | NA | NA | NA | NA | NA | NA | NA | NA | NA | NA | NA | NA | NA | NA | NA | NA | NA | NA | NA | NA | NA | |
| North America And Australia | 3574.00 | NA | NA | NA | 3078.00 | NA | NA | NA | NA | NA | NA | NA | NA | NA | NA | NA | NA | NA | NA | NA | NA | NA | NA | NA | NA | NA | NA | NA | NA | NA | NA | NA | NA | NA | NA | |
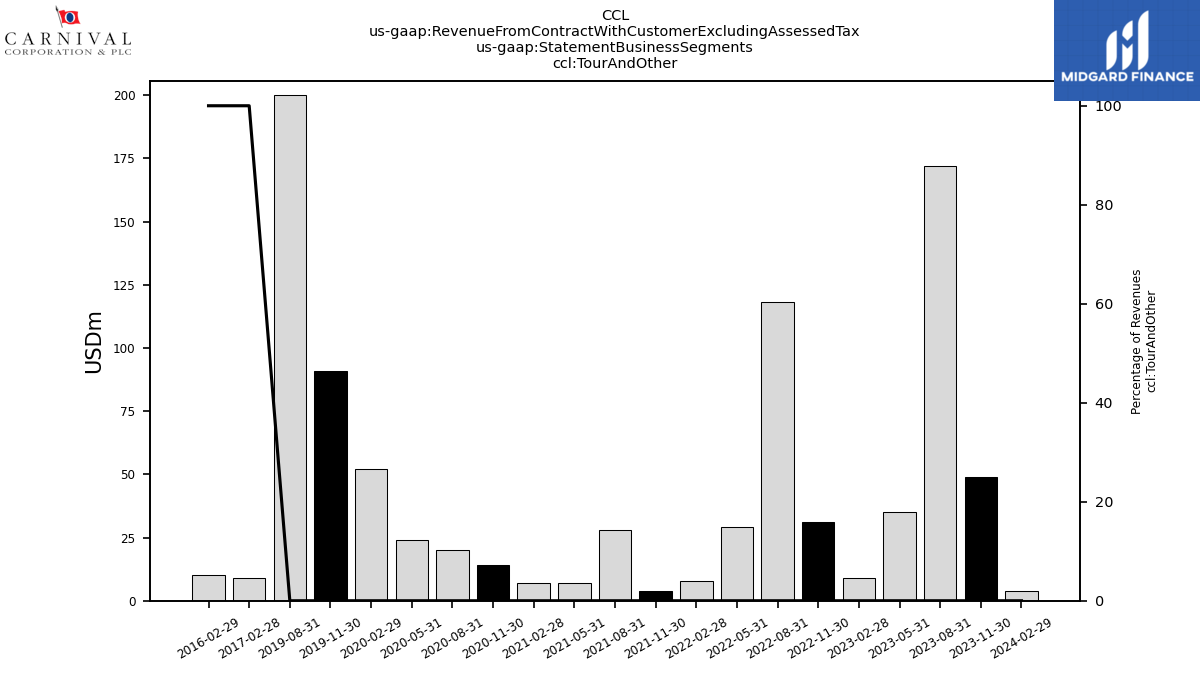
| Tour And Other | 4.00 | 49.00 | 172.00 | 35.00 | 9.00 | 31.00 | 118.00 | 29.00 | 8.00 | 4.00 | 28.00 | 7.00 | 7.00 | 14.00 | 20.00 | 24.00 | 52.00 | 91.00 | 200.00 | NA | NA | NA | NA | NA | NA | NA | NA | NA | 9.00 | NA | NA | NA | 10.00 | NA | NA | |
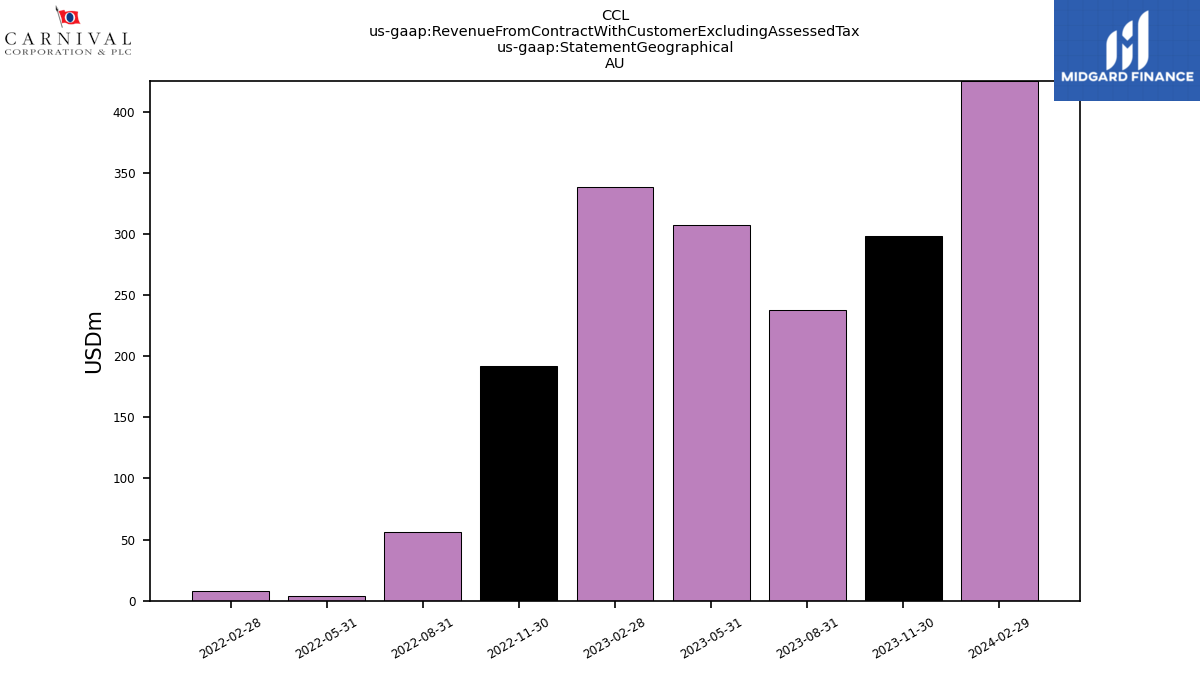
| 425.00 | 298.00 | 238.00 | 307.00 | 338.00 | 192.00 | 56.00 | 4.00 | 8.00 | NA | NA | NA | NA | NA | NA | NA | NA | NA | NA | NA | NA | NA | NA | NA | NA | NA | NA | NA | NA | NA | NA | NA | NA | NA | NA | ||
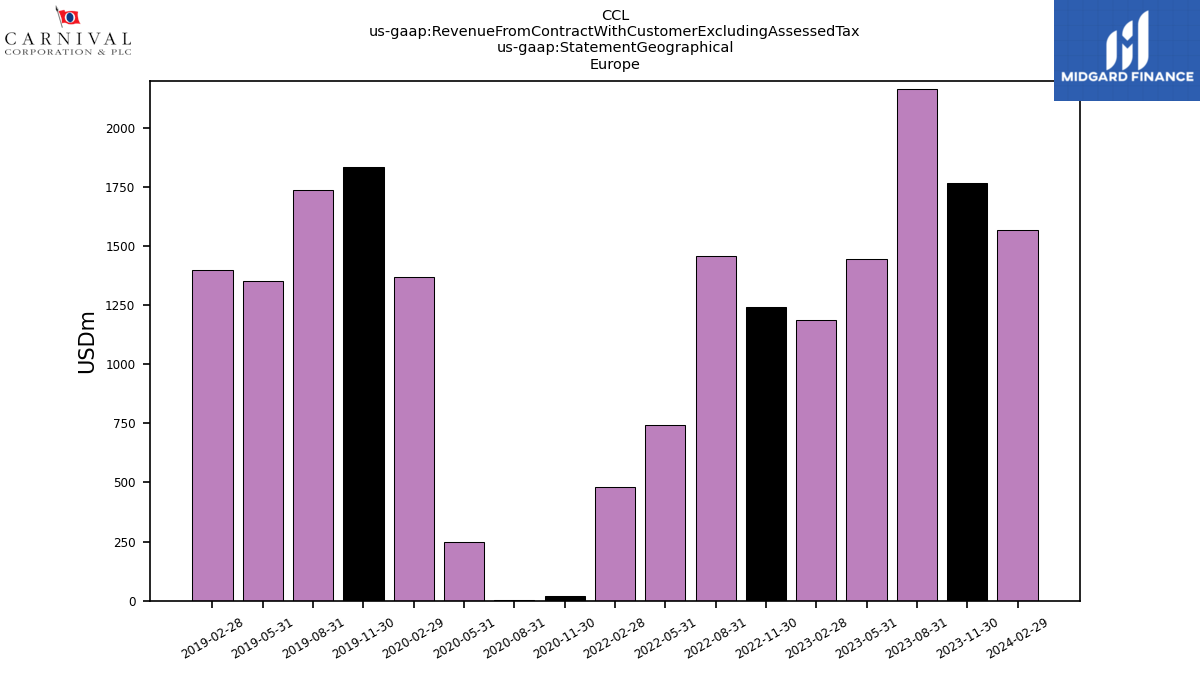
| 1567.00 | 1767.00 | 2165.00 | 1446.00 | 1187.00 | 1242.00 | 1456.00 | 741.00 | 479.00 | NA | NA | NA | NA | 21.00 | 5.00 | 250.00 | 1367.00 | 1832.00 | 1738.00 | 1350.00 | 1399.00 | NA | NA | NA | NA | NA | NA | NA | NA | NA | NA | NA | NA | NA | NA | ||
| 3121.00 | 3175.00 | 4253.00 | 2988.00 | 2696.00 | 2375.00 | 2753.00 | 1620.00 | 1119.00 | NA | NA | NA | NA | 19.00 | 14.00 | 404.00 | 2647.00 | 2592.00 | 3751.00 | 2639.00 | 2520.00 | NA | NA | NA | NA | NA | NA | NA | NA | NA | NA | NA | NA | NA | NA | ||
| All Other Geographic Areas | 293.00 | 157.00 | 198.00 | 169.00 | 211.00 | 68.00 | 22.00 | 24.00 | 18.00 | NA | NA | NA | NA | -12.00 | 10.00 | 21.00 | 161.00 | -12.00 | 107.00 | 108.00 | 170.00 | NA | NA | NA | NA | NA | NA | NA | NA | NA | NA | NA | NA | NA | NA |
