
| 2024-02-03 | 2023-10-28 | 2023-07-29 | 2023-04-29 | 2023-01-28 | 2022-10-29 | 2022-07-30 | 2022-04-30 | 2022-01-29 | 2021-10-30 | 2021-07-31 | 2021-05-01 | 2021-01-30 | 2020-10-31 | 2020-08-01 | 2020-05-02 | 2020-02-01 | 2019-11-02 | 2019-08-03 | 2019-05-04 | 2019-02-02 | 2018-11-03 | 2018-08-04 | 2018-05-05 | 2018-02-03 | 2017-10-28 | 2017-07-29 | 2017-04-29 | 2017-01-28 | 2016-10-29 | 2016-07-30 | 2016-04-30 | 2016-01-30 | 2015-10-31 | 2015-08-01 | 2015-05-02 | 2015-01-31 | 2014-11-01 | 2014-08-02 | 2014-05-03 | 2014-02-01 | 2013-11-02 | 2013-08-03 | 2013-05-04 | 2013-02-02 | 2012-10-27 | 2012-07-28 | 2012-04-28 | 2012-01-28 | 2011-10-29 | 2011-07-30 | 2011-04-30 | 2011-01-29 | 2010-10-30 | 2010-07-31 | ||
|---|---|---|---|---|---|---|---|---|---|---|---|---|---|---|---|---|---|---|---|---|---|---|---|---|---|---|---|---|---|---|---|---|---|---|---|---|---|---|---|---|---|---|---|---|---|---|---|---|---|---|---|---|---|---|---|---|
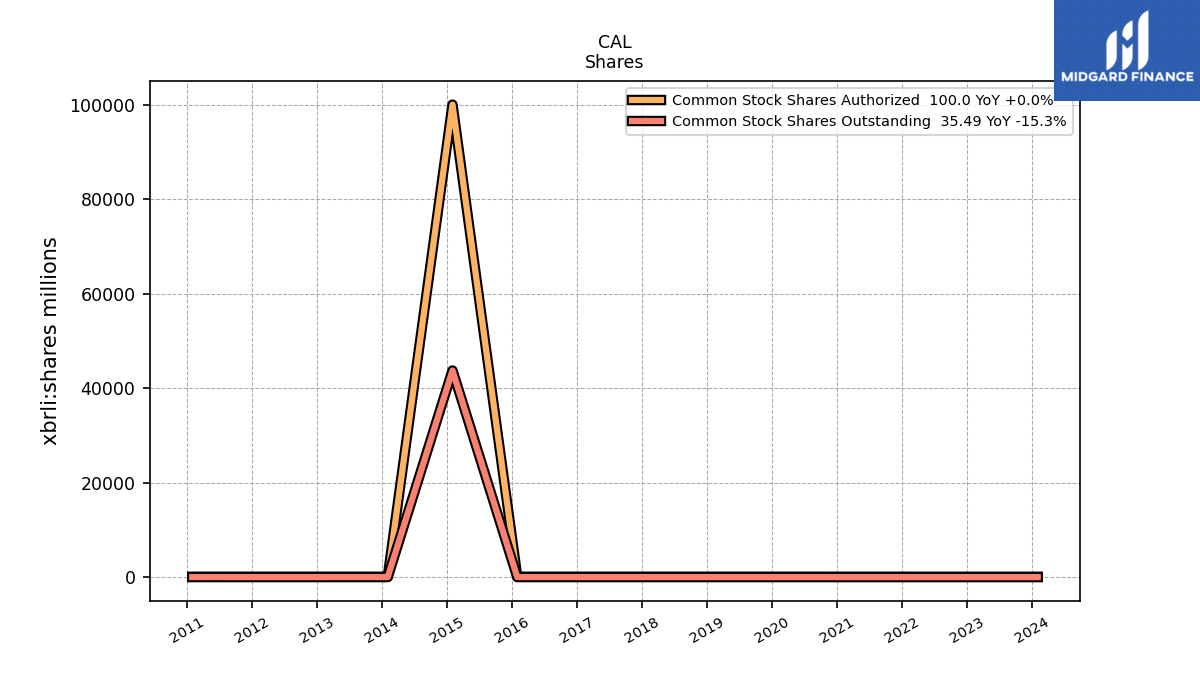
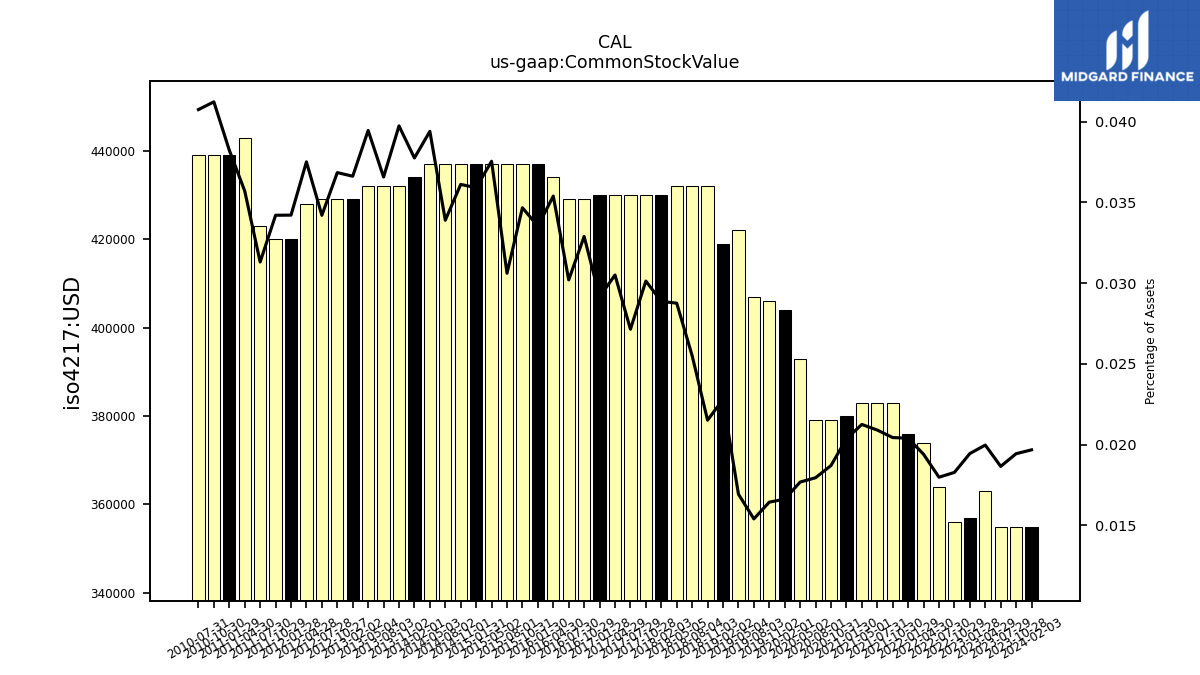
| Common Stock Value | 0.35 | 0.35 | 0.35 | 0.36 | 0.36 | 0.36 | 0.36 | 0.37 | 0.38 | 0.38 | 0.38 | 0.38 | 0.38 | 0.38 | 0.38 | 0.39 | 0.40 | 0.41 | 0.41 | 0.42 | 0.42 | 0.43 | 0.43 | 0.43 | 0.43 | 0.43 | 0.43 | 0.43 | 0.43 | 0.43 | 0.43 | 0.43 | 0.44 | 0.44 | 0.44 | 0.44 | 0.44 | 0.44 | 0.44 | 0.44 | 0.43 | 0.43 | 0.43 | 0.43 | 0.43 | 0.43 | 0.43 | 0.43 | 0.42 | 0.42 | 0.42 | 0.44 | 0.44 | 0.44 | 0.44 |
| 2024-02-03 | 2023-10-28 | 2023-07-29 | 2023-04-29 | 2023-01-28 | 2022-10-29 | 2022-07-30 | 2022-04-30 | 2022-01-29 | 2021-10-30 | 2021-07-31 | 2021-05-01 | 2021-01-30 | 2020-10-31 | 2020-08-01 | 2020-05-02 | 2020-02-01 | 2019-11-02 | 2019-08-03 | 2019-05-04 | 2019-02-02 | 2018-11-03 | 2018-08-04 | 2018-05-05 | 2018-02-03 | 2017-10-28 | 2017-07-29 | 2017-04-29 | 2017-01-28 | 2016-10-29 | 2016-07-30 | 2016-04-30 | 2016-01-30 | 2015-10-31 | 2015-08-01 | 2015-05-02 | 2015-01-31 | 2014-11-01 | 2014-08-02 | 2014-05-03 | 2014-02-01 | 2013-11-02 | 2013-08-03 | 2013-05-04 | 2013-02-02 | 2012-10-27 | 2012-07-28 | 2012-04-28 | 2012-01-28 | 2011-10-29 | 2011-07-30 | 2011-04-30 | 2011-01-29 | 2010-10-30 | 2010-07-31 | ||
|---|---|---|---|---|---|---|---|---|---|---|---|---|---|---|---|---|---|---|---|---|---|---|---|---|---|---|---|---|---|---|---|---|---|---|---|---|---|---|---|---|---|---|---|---|---|---|---|---|---|---|---|---|---|---|---|---|
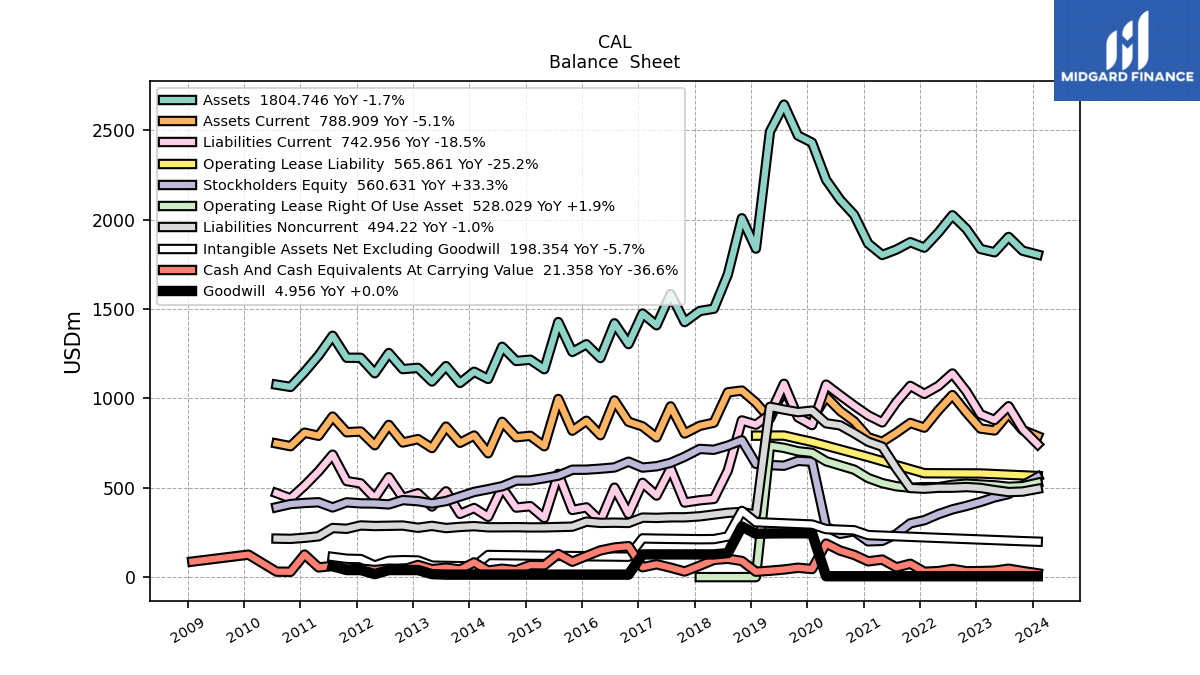
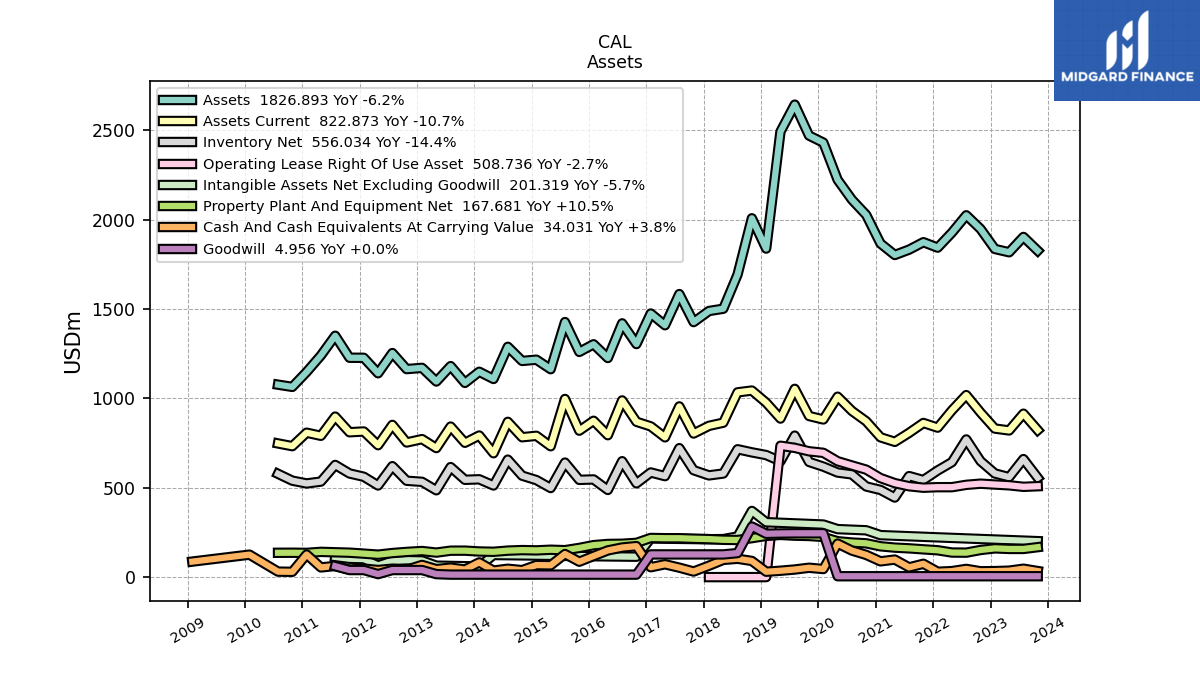
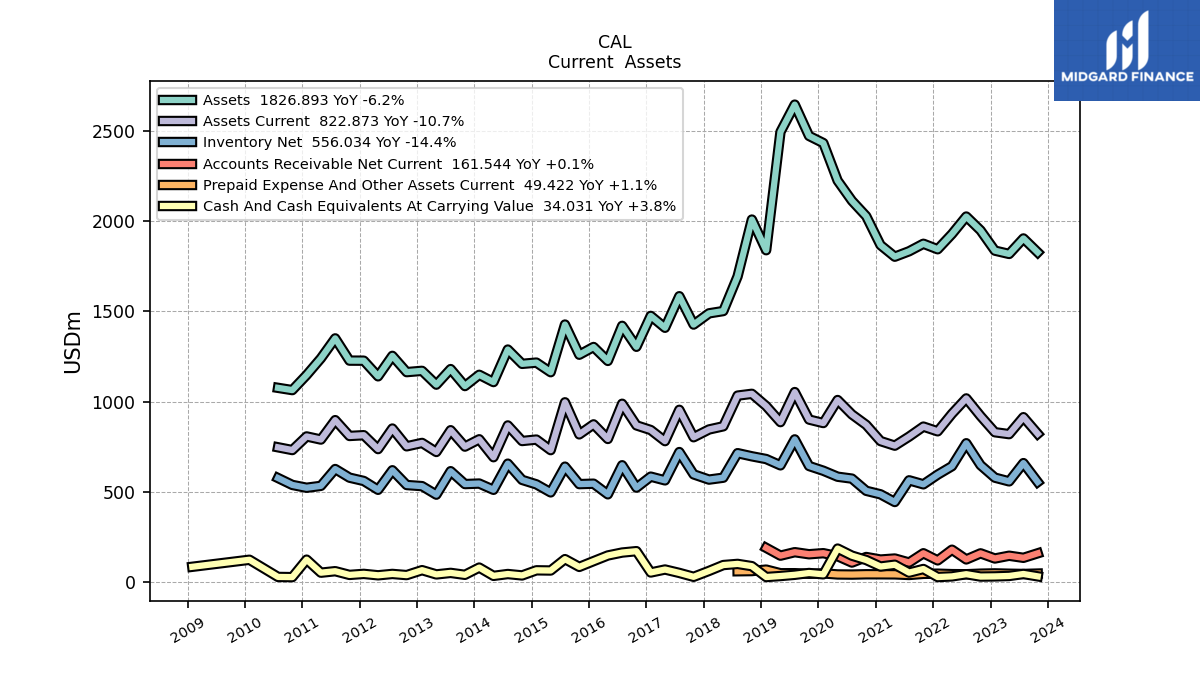
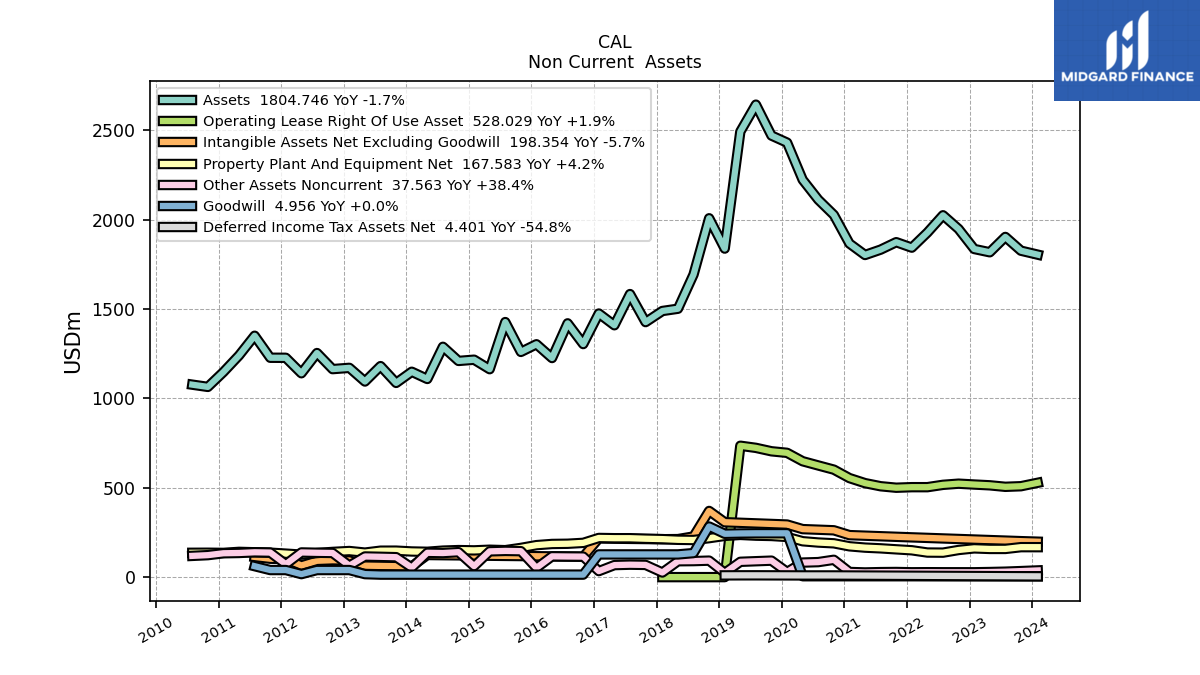
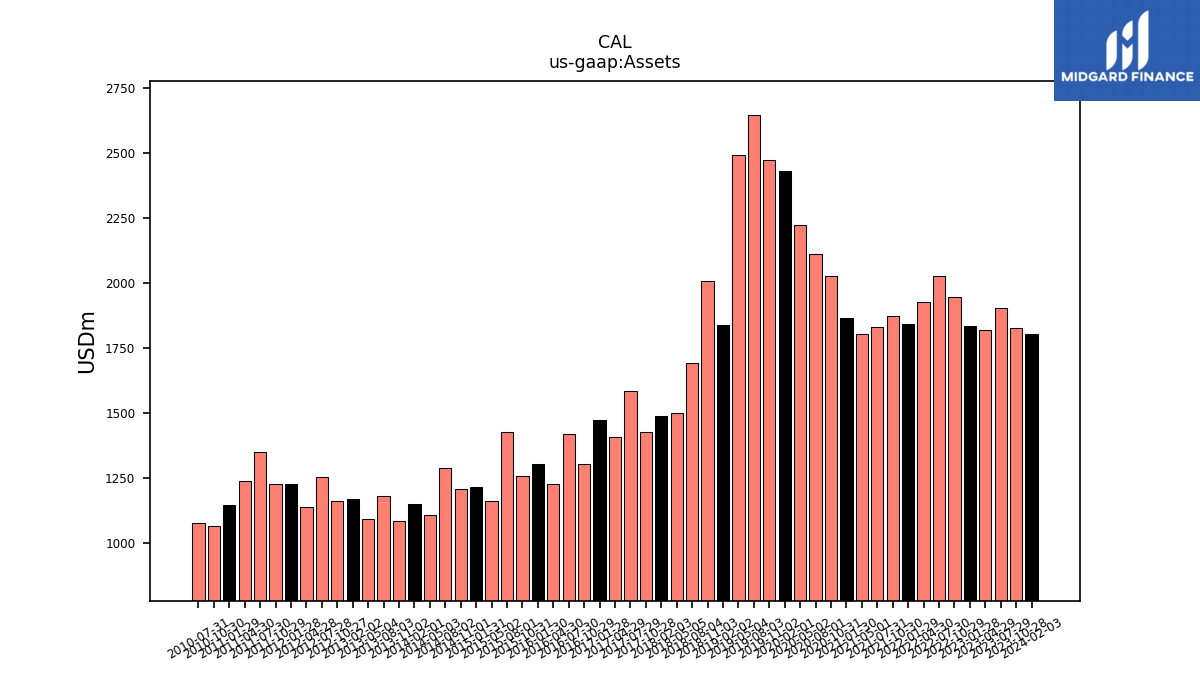
| Assets | 1804.75 | 1826.89 | 1903.96 | 1818.08 | 1836.47 | 1948.31 | 2025.21 | 1928.30 | 1843.93 | 1874.56 | 1832.90 | 1802.82 | 1867.05 | 2027.06 | 2112.39 | 2223.68 | 2431.71 | 2471.21 | 2644.39 | 2493.07 | 1838.57 | 2008.40 | 1693.64 | 1502.07 | 1489.41 | 1427.15 | 1584.16 | 1409.56 | 1475.27 | 1304.19 | 1420.39 | 1226.09 | 1303.32 | 1260.28 | 1427.47 | 1163.67 | 1216.81 | 1209.86 | 1289.08 | 1108.96 | 1149.40 | 1086.91 | 1181.02 | 1094.71 | 1171.26 | 1164.10 | 1254.17 | 1140.82 | 1227.48 | 1227.76 | 1350.92 | 1240.57 | 1148.04 | 1064.60 | 1077.13 | |
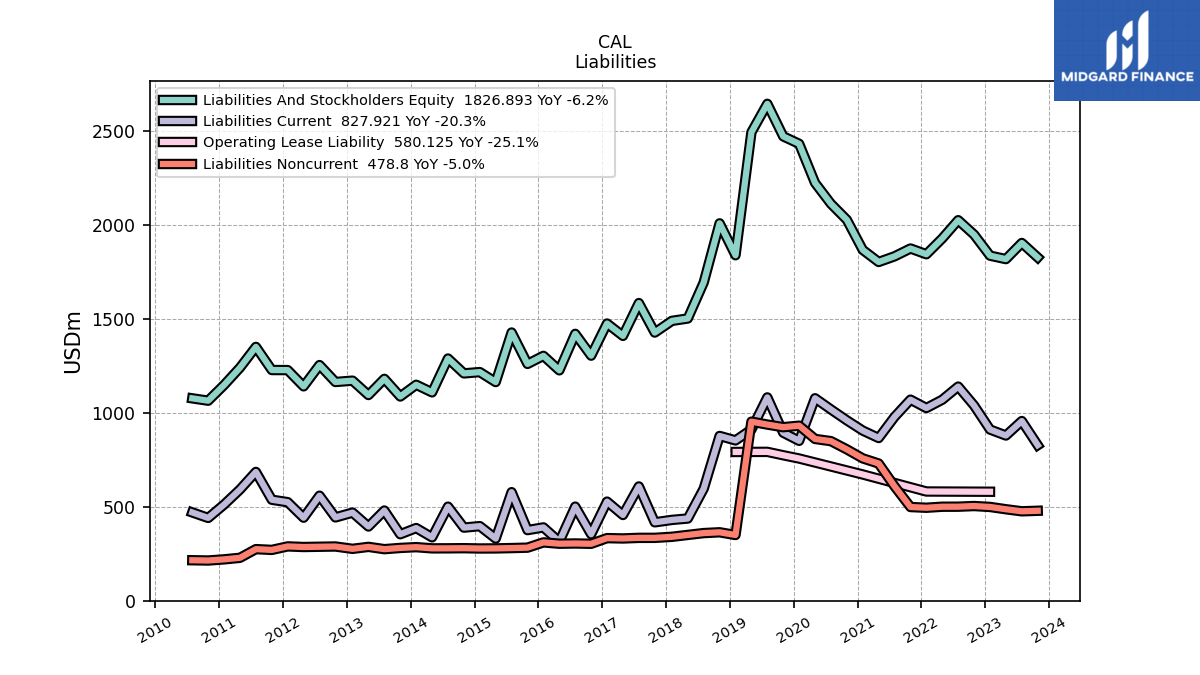
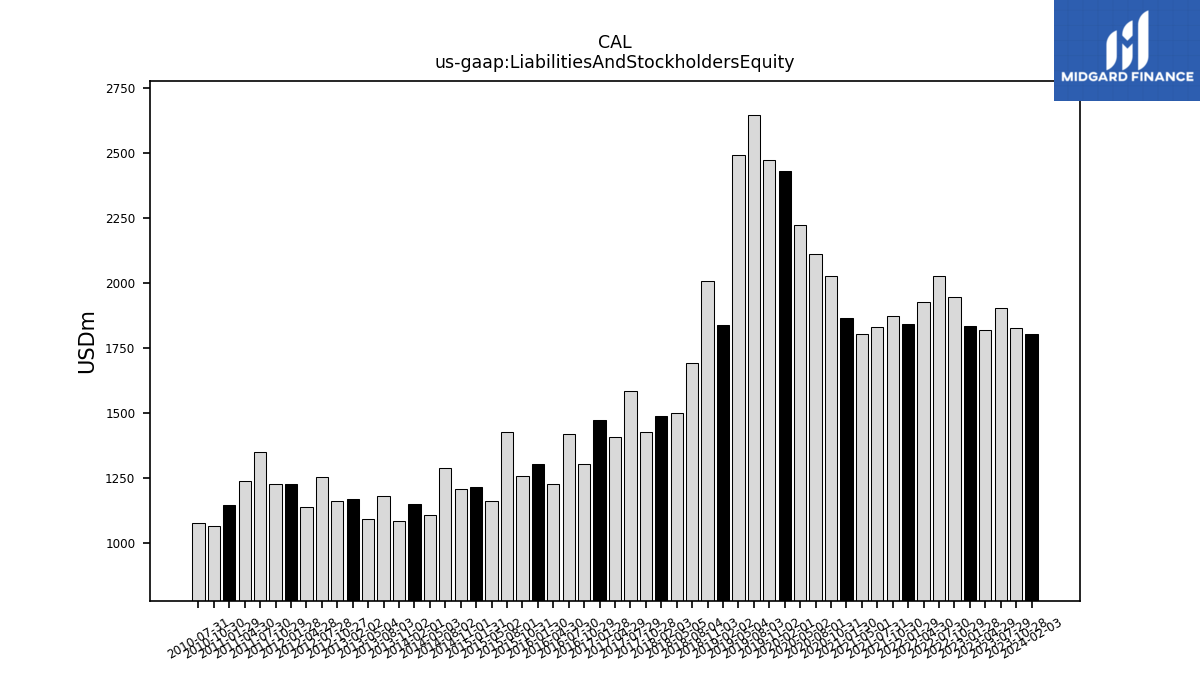
| Liabilities And Stockholders Equity | 1804.75 | 1826.89 | 1903.96 | 1818.08 | 1836.47 | 1948.31 | 2025.21 | 1928.30 | 1843.93 | 1874.56 | 1832.90 | 1802.82 | 1867.05 | 2027.06 | 2112.39 | 2223.68 | 2431.71 | 2471.21 | 2644.39 | 2493.07 | 1838.57 | 2008.40 | 1693.64 | 1502.07 | 1489.41 | 1427.15 | 1584.16 | 1409.56 | 1475.27 | 1304.19 | 1420.39 | 1226.09 | 1303.32 | 1260.28 | 1427.47 | 1163.67 | 1216.81 | 1209.86 | 1289.08 | 1108.96 | 1149.40 | 1086.91 | 1181.02 | 1094.71 | 1171.26 | 1164.10 | 1254.17 | 1140.82 | 1227.48 | 1227.76 | 1350.92 | 1240.57 | 1148.04 | 1064.60 | 1077.13 | |
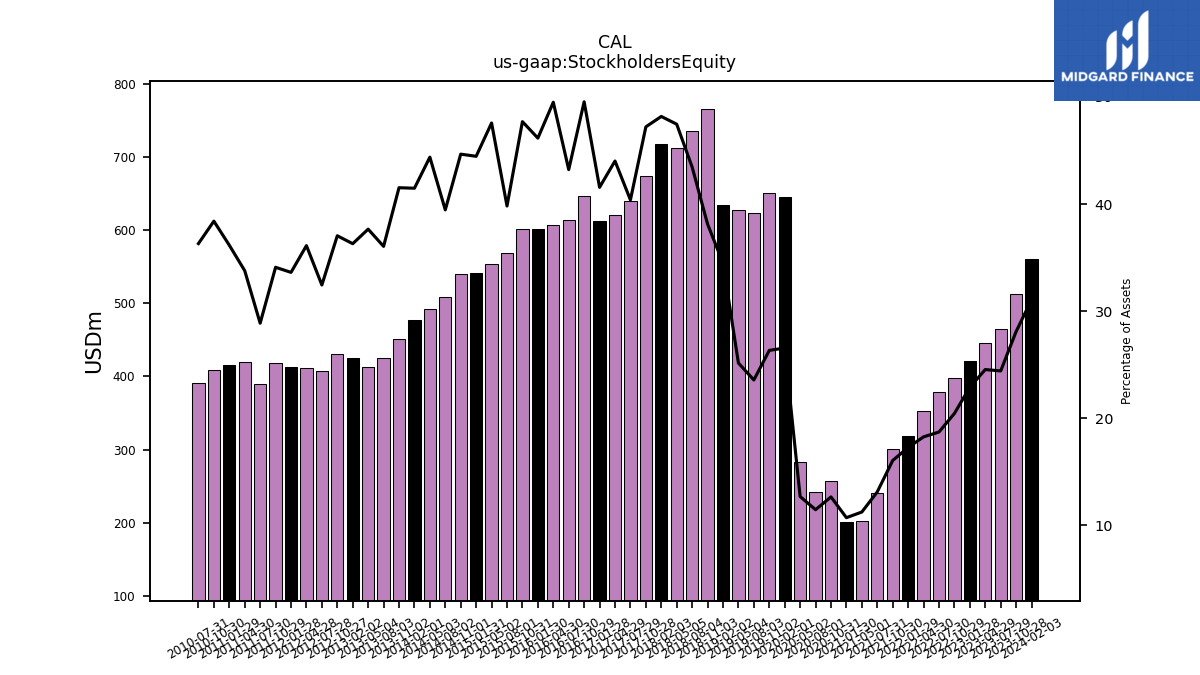
| Stockholders Equity | 560.63 | 513.38 | 464.99 | 446.32 | 420.68 | 398.44 | 379.13 | 352.24 | 318.57 | 301.10 | 240.70 | 202.87 | 200.25 | 256.67 | 242.24 | 282.30 | 645.95 | 650.84 | 623.43 | 627.24 | 634.05 | 765.75 | 735.85 | 712.71 | 717.49 | 673.64 | 639.73 | 620.39 | 613.12 | 646.11 | 613.79 | 606.88 | 601.48 | 601.00 | 568.35 | 553.47 | 540.91 | 540.25 | 508.58 | 492.07 | 476.70 | 451.30 | 425.72 | 412.19 | 425.13 | 431.14 | 406.90 | 412.01 | 412.67 | 418.60 | 390.08 | 419.02 | 415.08 | 408.80 | 391.07 |
| 2024-02-03 | 2023-10-28 | 2023-07-29 | 2023-04-29 | 2023-01-28 | 2022-10-29 | 2022-07-30 | 2022-04-30 | 2022-01-29 | 2021-10-30 | 2021-07-31 | 2021-05-01 | 2021-01-30 | 2020-10-31 | 2020-08-01 | 2020-05-02 | 2020-02-01 | 2019-11-02 | 2019-08-03 | 2019-05-04 | 2019-02-02 | 2018-11-03 | 2018-08-04 | 2018-05-05 | 2018-02-03 | 2017-10-28 | 2017-07-29 | 2017-04-29 | 2017-01-28 | 2016-10-29 | 2016-07-30 | 2016-04-30 | 2016-01-30 | 2015-10-31 | 2015-08-01 | 2015-05-02 | 2015-01-31 | 2014-11-01 | 2014-08-02 | 2014-05-03 | 2014-02-01 | 2013-11-02 | 2013-08-03 | 2013-05-04 | 2013-02-02 | 2012-10-27 | 2012-07-28 | 2012-04-28 | 2012-01-28 | 2011-10-29 | 2011-07-30 | 2011-04-30 | 2011-01-29 | 2010-10-30 | 2010-07-31 | ||
|---|---|---|---|---|---|---|---|---|---|---|---|---|---|---|---|---|---|---|---|---|---|---|---|---|---|---|---|---|---|---|---|---|---|---|---|---|---|---|---|---|---|---|---|---|---|---|---|---|---|---|---|---|---|---|---|---|
| Assets Current | 788.91 | 822.87 | 914.82 | 820.88 | 831.46 | 921.08 | 1018.79 | 933.64 | 836.48 | 862.70 | 807.36 | 757.12 | 782.56 | 872.15 | 930.05 | 1009.79 | 882.30 | 901.65 | 1053.79 | 887.31 | 976.45 | 1044.17 | 1034.17 | 864.33 | 846.79 | 803.67 | 955.53 | 782.21 | 843.75 | 869.45 | 989.11 | 794.18 | 875.07 | 819.65 | 997.17 | 732.36 | 790.90 | 782.92 | 869.18 | 693.14 | 792.55 | 751.90 | 842.61 | 722.15 | 772.43 | 753.49 | 851.98 | 738.15 | 815.14 | 810.81 | 898.44 | 790.91 | 808.28 | 732.85 | 748.16 | |
| Cash And Cash Equivalents At Carrying Value | 21.36 | 34.03 | 47.10 | 36.15 | 33.70 | 32.77 | 45.95 | 33.72 | 30.11 | 74.77 | 54.68 | 98.24 | 88.30 | 124.33 | 148.54 | 187.72 | 45.22 | 52.50 | 42.60 | 35.78 | 30.20 | 90.49 | 102.88 | 96.48 | 64.05 | 31.38 | 52.94 | 71.82 | 55.33 | 173.44 | 165.73 | 149.53 | 118.15 | 86.30 | 129.34 | 66.33 | 67.40 | 39.08 | 46.88 | 36.67 | 82.55 | 42.41 | 53.14 | 44.67 | 68.22 | 40.88 | 47.40 | 39.79 | 47.68 | 41.95 | 62.55 | 54.23 | 126.55 | 29.71 | 30.72 | |
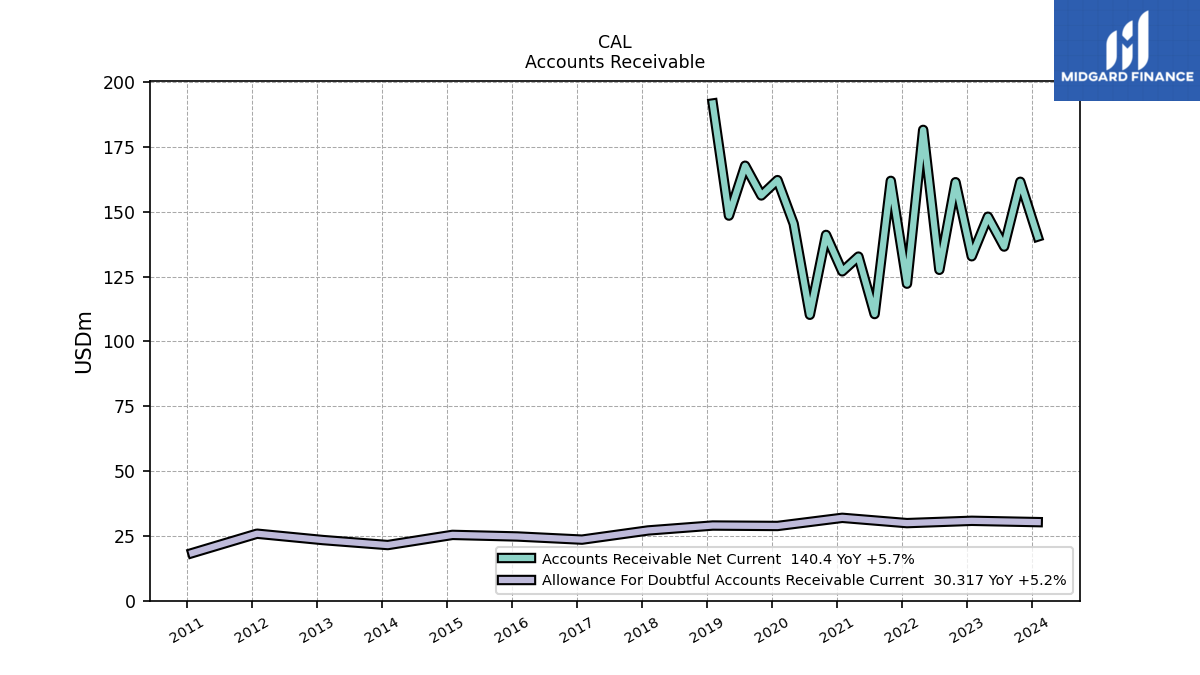
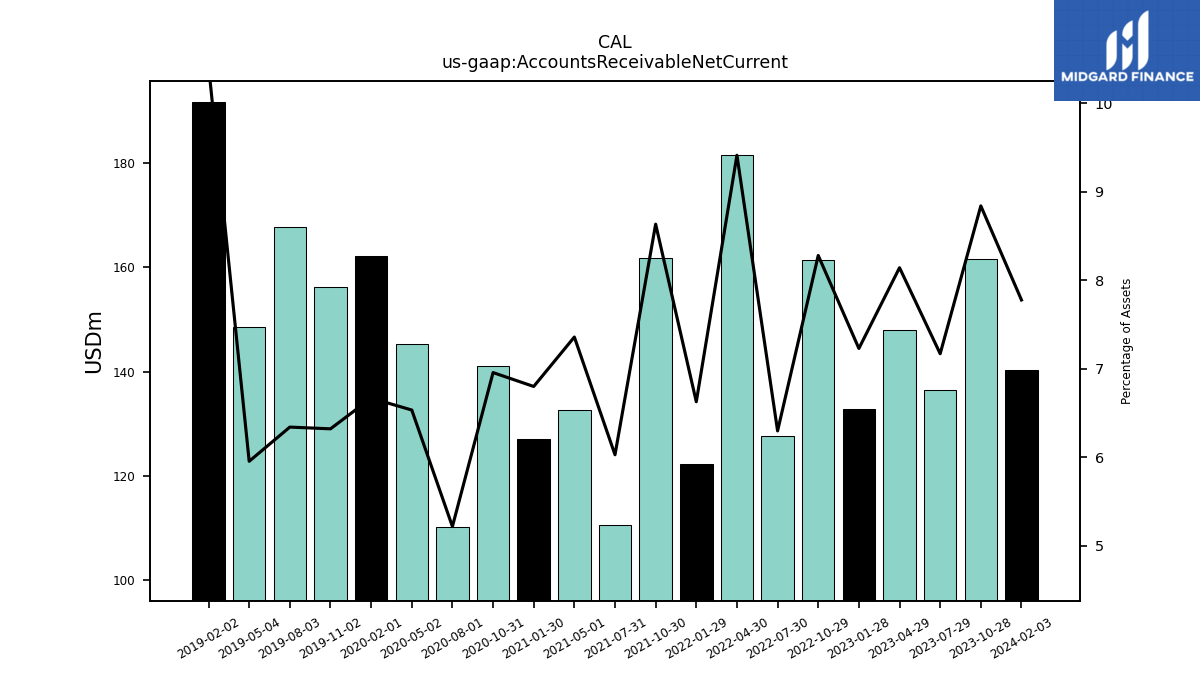
| Accounts Receivable Net Current | 140.40 | 161.54 | 136.55 | 148.07 | 132.80 | 161.37 | 127.58 | 181.55 | 122.24 | 161.89 | 110.52 | 132.70 | 126.99 | 141.06 | 110.25 | 145.33 | 162.18 | 156.25 | 167.73 | 148.49 | 191.72 | NA | NA | NA | NA | NA | NA | NA | NA | NA | NA | NA | NA | NA | NA | NA | NA | NA | NA | NA | NA | NA | NA | NA | NA | NA | NA | NA | NA | NA | NA | NA | NA | NA | NA | |
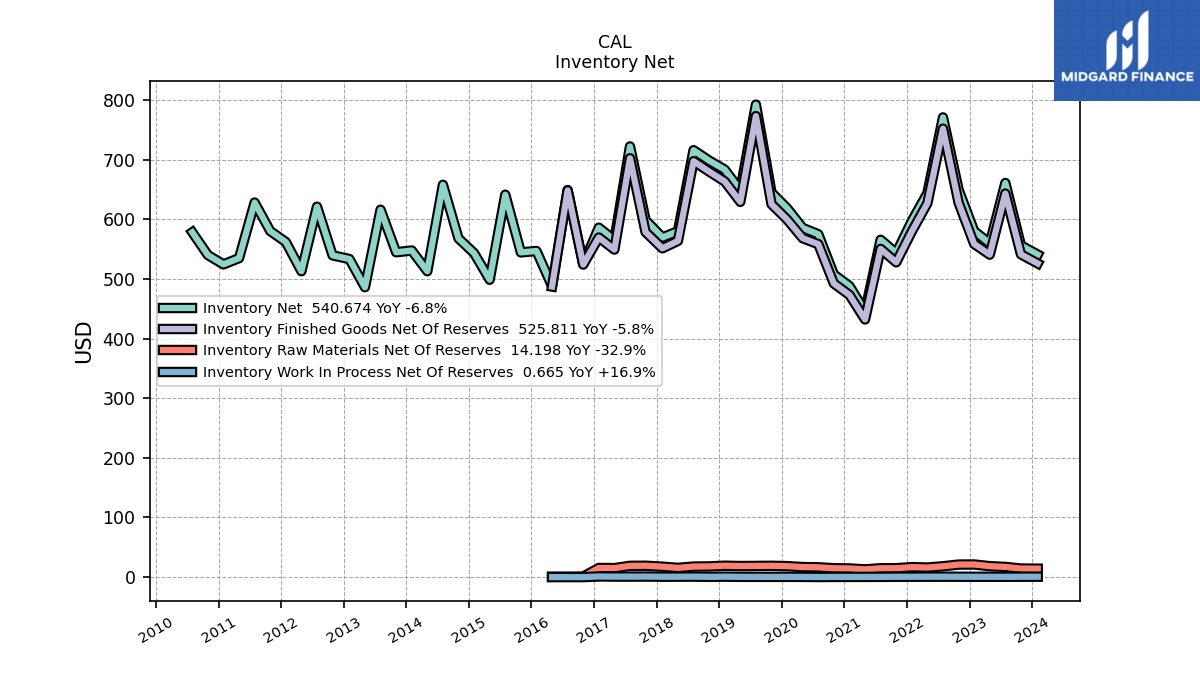
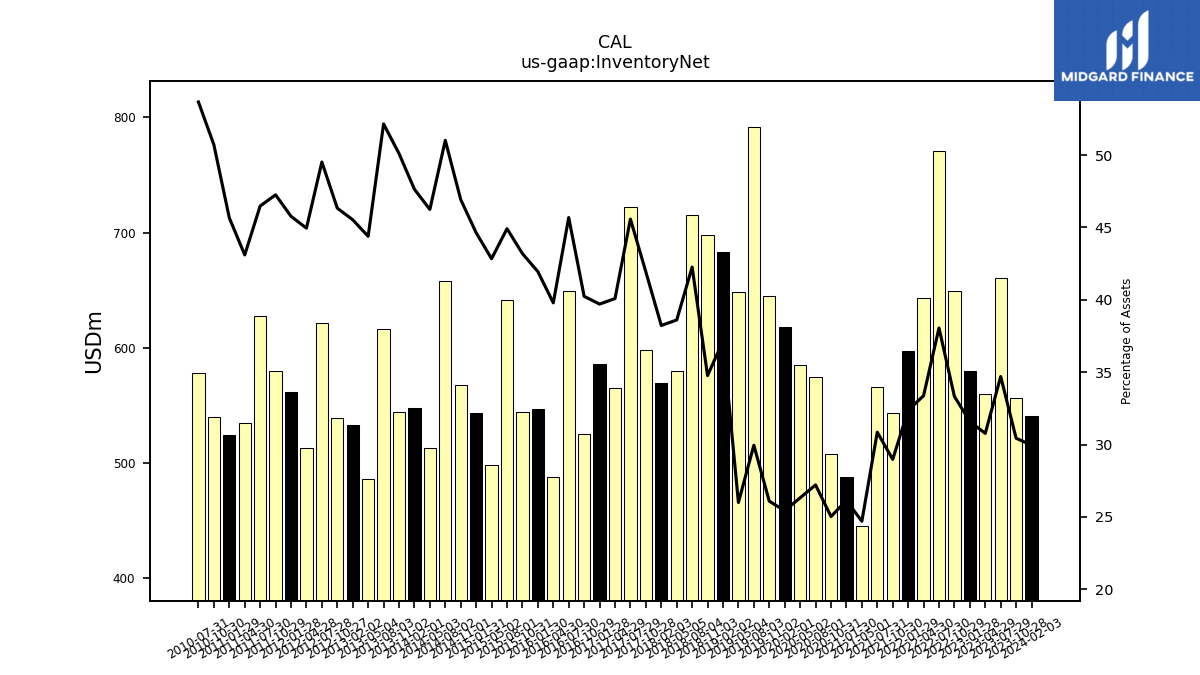
| Inventory Net | 540.67 | 556.03 | 660.69 | 559.47 | 580.22 | 649.26 | 770.65 | 643.53 | 596.81 | 543.22 | 565.51 | 445.30 | 487.95 | 507.37 | 574.83 | 585.31 | 618.41 | 644.65 | 792.06 | 648.14 | 683.17 | 698.26 | 715.71 | 579.90 | 569.38 | 598.37 | 722.00 | 565.05 | 585.76 | 524.82 | 648.88 | 487.88 | 546.75 | 544.34 | 641.13 | 498.51 | 543.10 | 567.78 | 657.66 | 512.81 | 547.53 | 544.59 | 615.92 | 485.92 | 533.27 | 539.36 | 621.07 | 512.82 | 561.80 | 580.15 | 627.93 | 534.73 | 524.25 | 539.88 | 578.09 | |
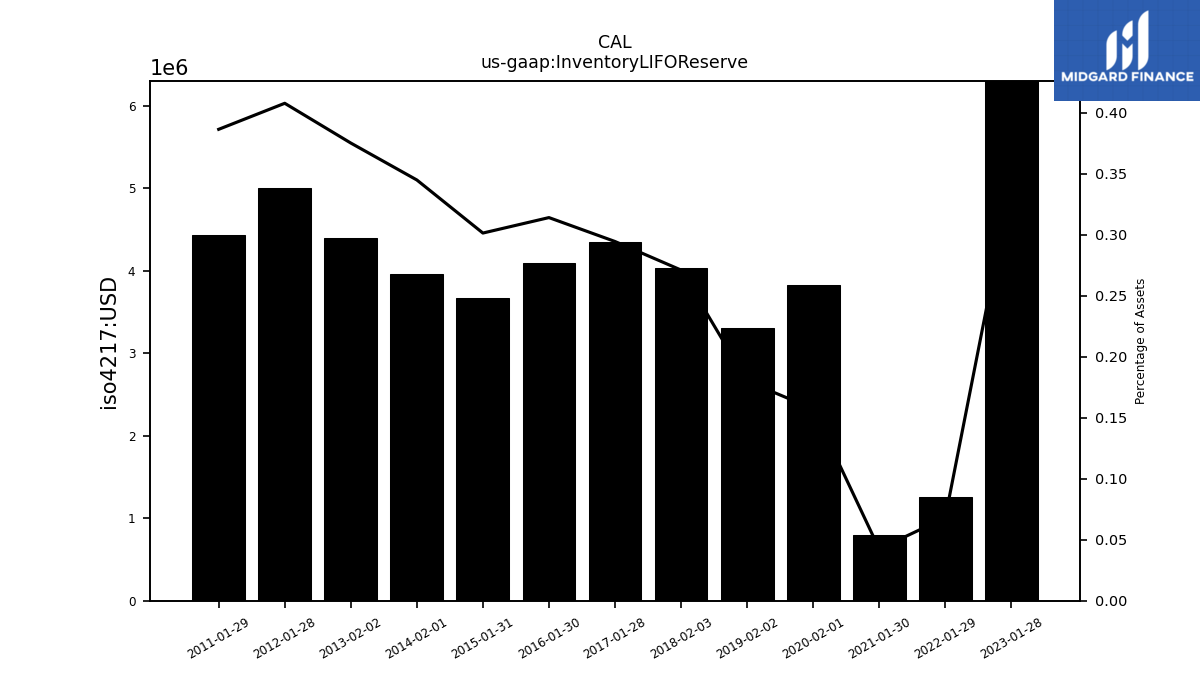
| Inventory L I F O Reserve | 10.25 | NA | NA | NA | 6.30 | NA | NA | NA | 1.25 | NA | NA | NA | 0.79 | NA | NA | NA | 3.83 | NA | NA | NA | 3.31 | NA | NA | NA | 4.04 | NA | NA | NA | 4.34 | NA | NA | NA | 4.09 | NA | NA | NA | 3.67 | NA | NA | NA | 3.96 | NA | NA | NA | 4.39 | NA | NA | NA | 5.01 | NA | NA | NA | 4.44 | NA | NA | |
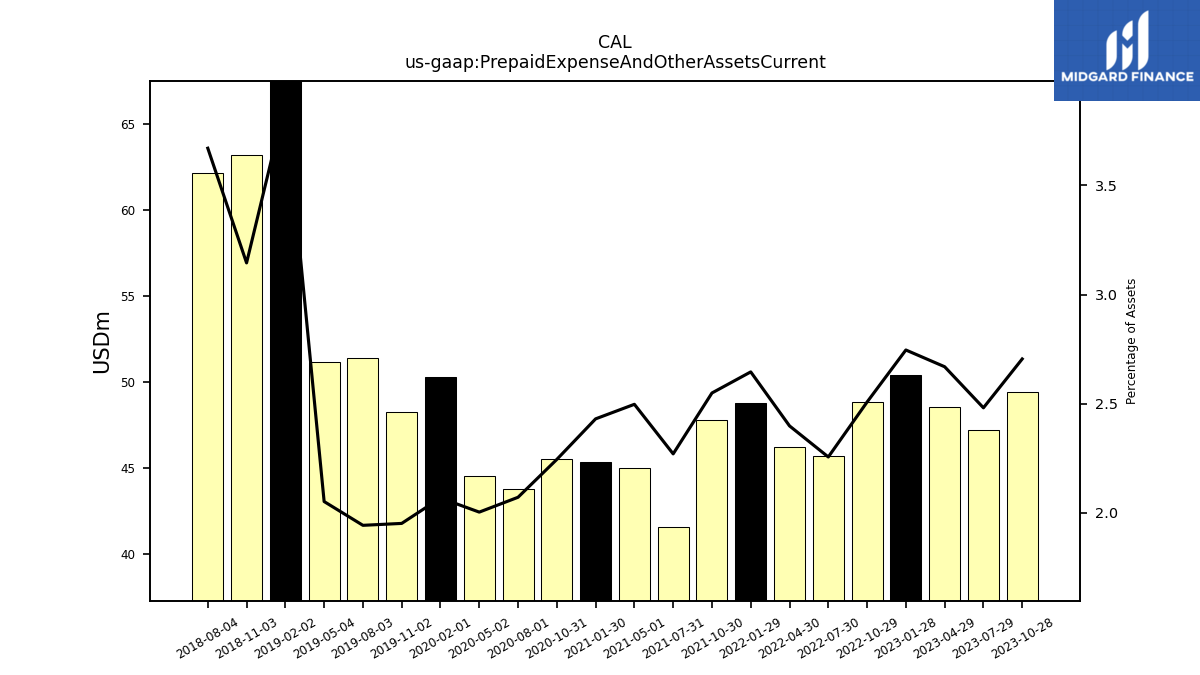
| Prepaid Expense And Other Assets Current | 55.48 | 49.42 | 47.25 | 48.53 | 50.43 | 48.86 | 45.70 | 46.25 | 48.79 | 47.79 | 41.62 | 45.03 | 45.39 | 45.51 | 43.77 | 44.56 | 50.30 | 48.24 | 51.39 | 51.17 | 71.35 | 63.17 | 62.16 | NA | NA | NA | NA | NA | NA | NA | NA | NA | NA | NA | NA | NA | NA | NA | NA | NA | NA | NA | NA | NA | NA | NA | NA | NA | NA | NA | NA | NA | NA | NA | NA |
| 2024-02-03 | 2023-10-28 | 2023-07-29 | 2023-04-29 | 2023-01-28 | 2022-10-29 | 2022-07-30 | 2022-04-30 | 2022-01-29 | 2021-10-30 | 2021-07-31 | 2021-05-01 | 2021-01-30 | 2020-10-31 | 2020-08-01 | 2020-05-02 | 2020-02-01 | 2019-11-02 | 2019-08-03 | 2019-05-04 | 2019-02-02 | 2018-11-03 | 2018-08-04 | 2018-05-05 | 2018-02-03 | 2017-10-28 | 2017-07-29 | 2017-04-29 | 2017-01-28 | 2016-10-29 | 2016-07-30 | 2016-04-30 | 2016-01-30 | 2015-10-31 | 2015-08-01 | 2015-05-02 | 2015-01-31 | 2014-11-01 | 2014-08-02 | 2014-05-03 | 2014-02-01 | 2013-11-02 | 2013-08-03 | 2013-05-04 | 2013-02-02 | 2012-10-27 | 2012-07-28 | 2012-04-28 | 2012-01-28 | 2011-10-29 | 2011-07-30 | 2011-04-30 | 2011-01-29 | 2010-10-30 | 2010-07-31 | ||
|---|---|---|---|---|---|---|---|---|---|---|---|---|---|---|---|---|---|---|---|---|---|---|---|---|---|---|---|---|---|---|---|---|---|---|---|---|---|---|---|---|---|---|---|---|---|---|---|---|---|---|---|---|---|---|---|---|
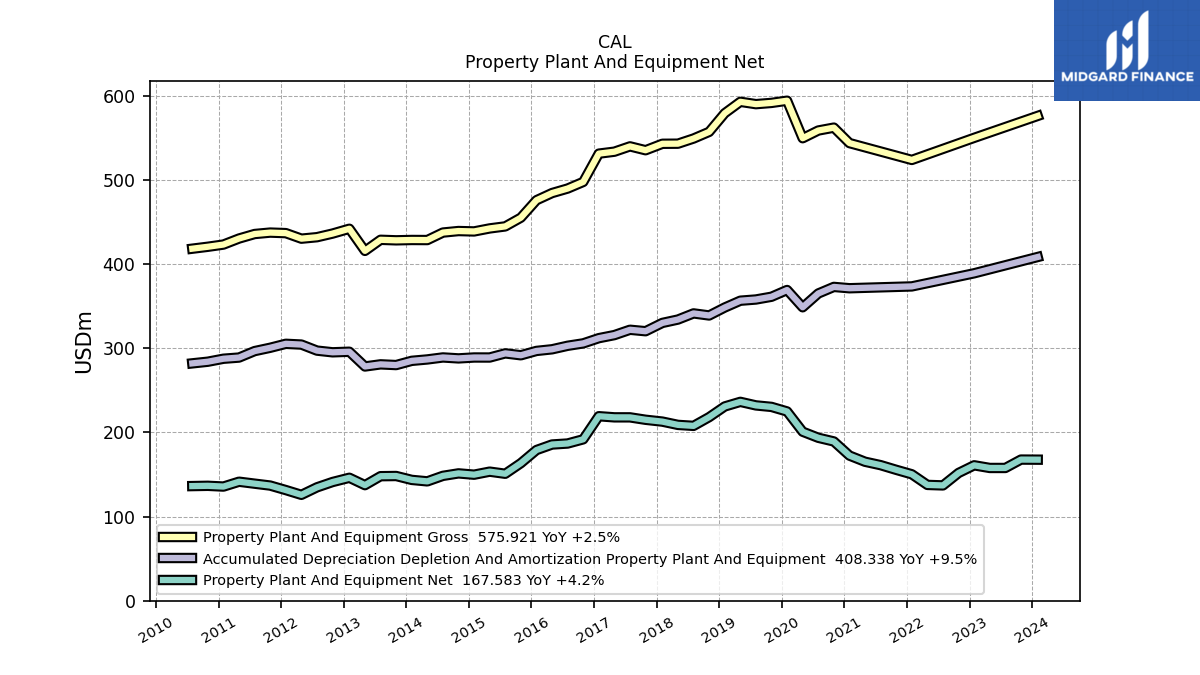
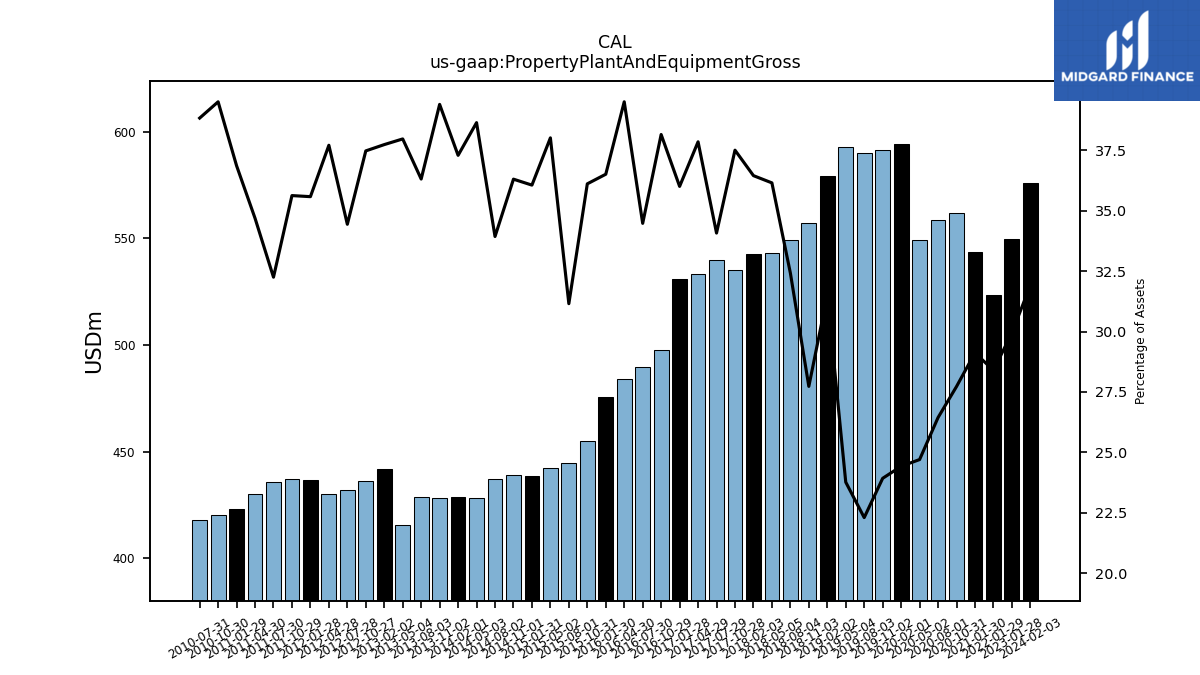
| Property Plant And Equipment Gross | 575.92 | NA | NA | NA | 549.86 | NA | NA | NA | 523.62 | NA | NA | NA | 543.64 | 562.00 | 558.57 | 549.39 | 593.98 | 591.37 | 589.88 | 592.67 | 579.09 | 556.97 | 549.05 | 542.93 | 542.81 | 535.15 | 539.73 | 533.42 | 531.10 | 497.49 | 489.64 | 484.28 | 475.75 | 455.04 | 444.67 | 442.27 | 438.70 | 439.17 | 437.36 | 428.45 | 428.54 | 428.14 | 428.76 | 415.58 | 441.89 | 436.16 | 431.86 | 430.10 | 436.68 | 437.33 | 435.62 | 430.27 | 423.10 | 420.49 | 418.19 | |
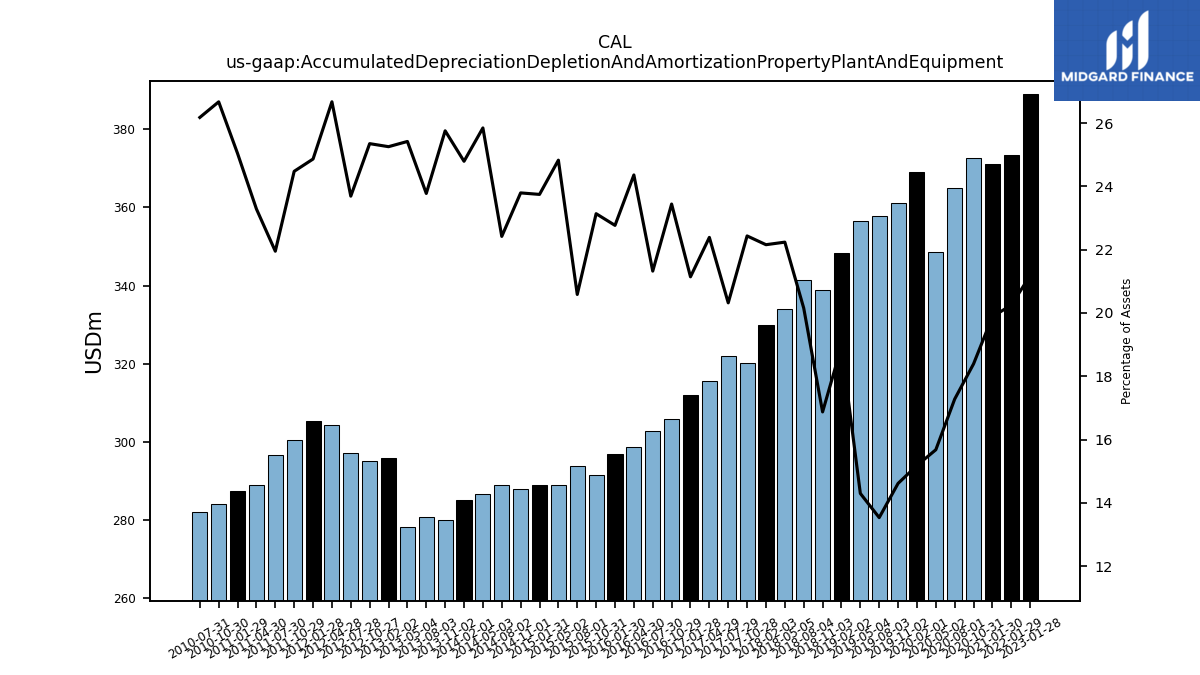
| Accumulated Depreciation Depletion And Amortization Property Plant And Equipment | 408.34 | NA | NA | NA | 388.98 | NA | NA | NA | 373.38 | NA | NA | NA | 371.21 | 372.80 | 364.97 | 348.59 | 369.13 | 361.11 | 357.84 | 356.41 | 348.30 | 338.86 | 341.32 | 334.03 | 330.01 | 320.17 | 321.89 | 315.57 | 311.91 | 305.73 | 302.86 | 298.69 | 296.74 | 291.60 | 293.83 | 288.92 | 288.95 | 287.88 | 289.01 | 286.64 | 284.98 | 279.95 | 280.81 | 278.28 | 295.80 | 295.11 | 297.13 | 304.30 | 305.21 | 300.51 | 296.55 | 288.88 | 287.47 | 283.95 | 281.98 | |
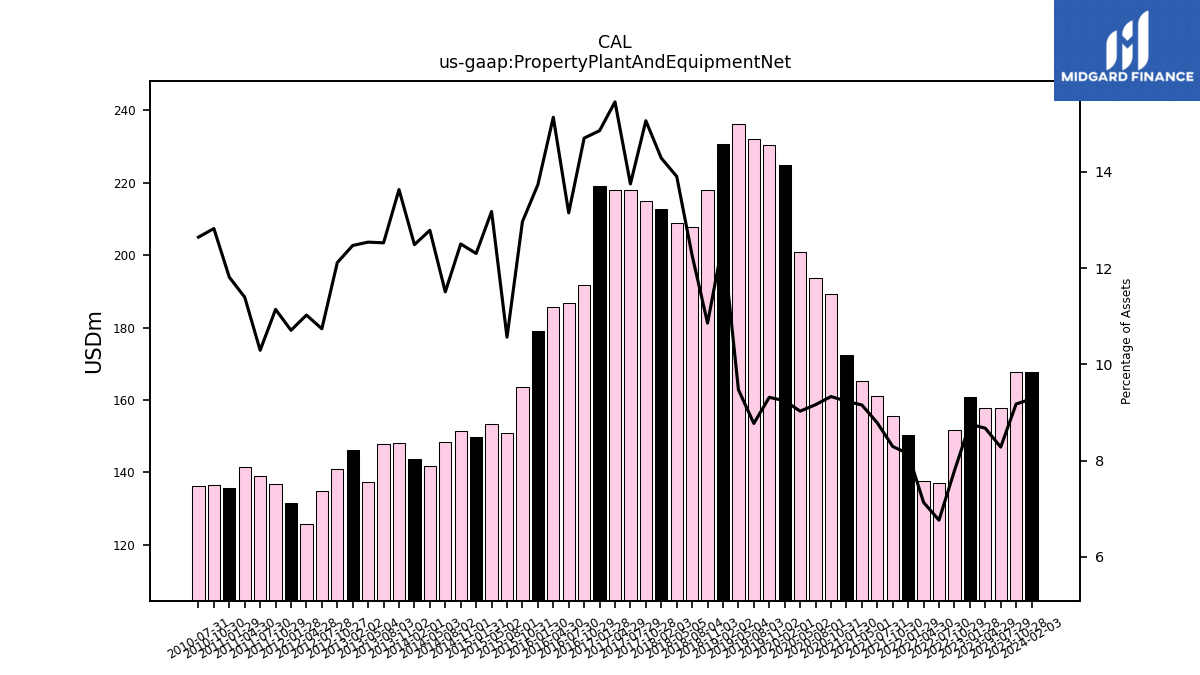
| Property Plant And Equipment Net | 167.58 | 167.68 | 157.72 | 157.73 | 160.88 | 151.80 | 137.01 | 137.60 | 150.24 | 155.52 | 161.07 | 165.12 | 172.44 | 189.21 | 193.59 | 200.80 | 224.85 | 230.26 | 232.04 | 236.26 | 230.78 | 218.10 | 207.73 | 208.90 | 212.80 | 214.98 | 217.84 | 217.85 | 219.20 | 191.75 | 186.78 | 185.59 | 179.01 | 163.44 | 150.84 | 153.35 | 149.74 | 151.29 | 148.36 | 141.82 | 143.56 | 148.18 | 147.96 | 137.30 | 146.09 | 141.05 | 134.72 | 125.80 | 131.47 | 136.82 | 139.08 | 141.40 | 135.63 | 136.53 | 136.21 | |
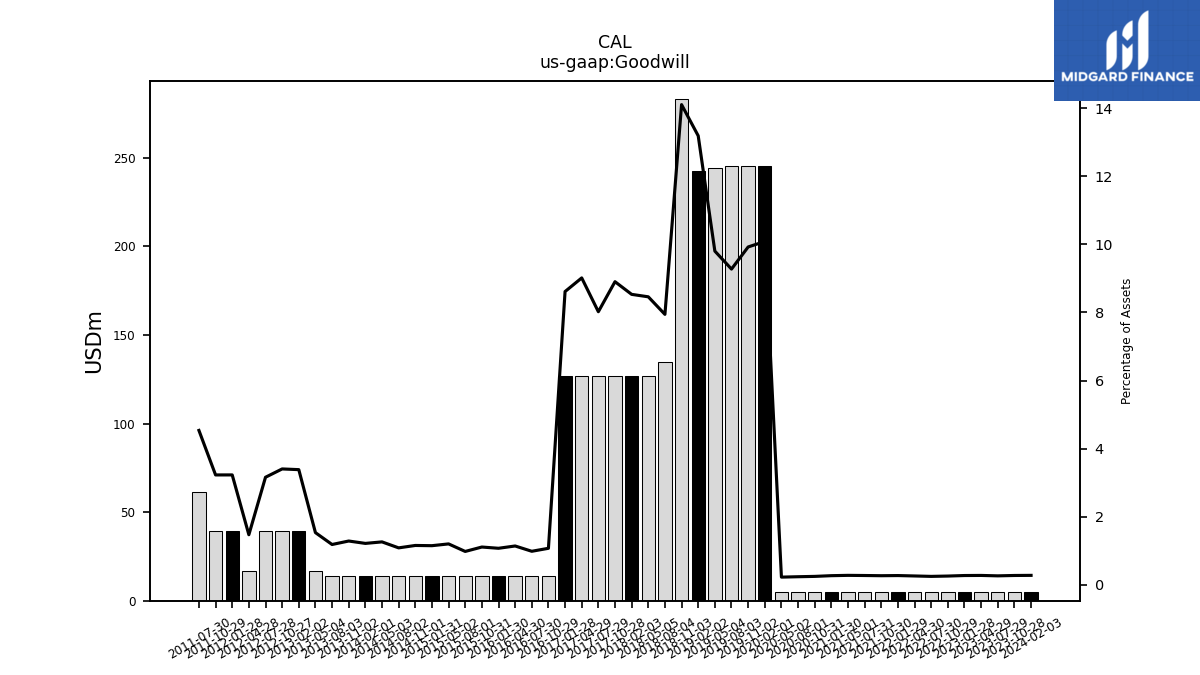
| Goodwill | 4.96 | 4.96 | 4.96 | 4.96 | 4.96 | 4.96 | 4.96 | 4.96 | 4.96 | 4.96 | 4.96 | 4.96 | 4.96 | 4.96 | 4.96 | 4.96 | 245.28 | 245.28 | 245.28 | 244.41 | 242.53 | 283.35 | 134.55 | 127.08 | 127.08 | 127.08 | 127.08 | 127.08 | 127.10 | 13.95 | 13.95 | 13.95 | 13.95 | 13.95 | 13.95 | 13.95 | 13.95 | 13.95 | 13.95 | 13.95 | 13.95 | 13.95 | 13.95 | 16.75 | 39.60 | 39.60 | 39.60 | 16.75 | 39.60 | 39.60 | 61.25 | NA | NA | NA | NA | |
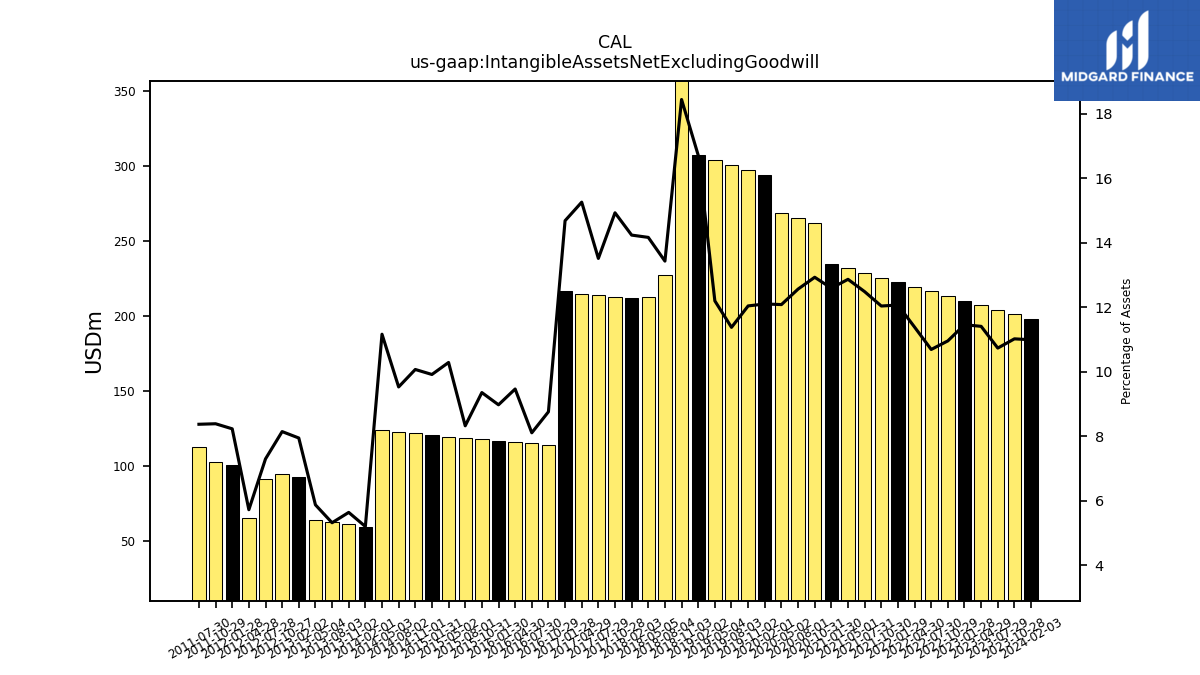
| Intangible Assets Net Excluding Goodwill | 198.35 | 201.32 | 204.36 | 207.40 | 210.44 | 213.46 | 216.49 | 219.52 | 222.55 | 225.67 | 228.82 | 231.97 | 235.12 | 262.12 | 265.40 | 268.69 | 294.30 | 297.57 | 300.83 | 304.10 | 307.37 | 370.51 | 227.50 | 212.82 | 212.09 | 213.10 | 214.11 | 215.13 | 216.66 | 114.19 | 115.11 | 116.03 | 116.94 | 117.86 | 118.78 | 119.70 | 120.63 | 121.82 | 122.81 | 123.80 | 59.72 | 61.23 | 62.73 | 64.24 | 93.02 | 94.77 | 91.47 | 65.22 | 100.99 | 102.94 | 113.05 | NA | NA | NA | NA | |
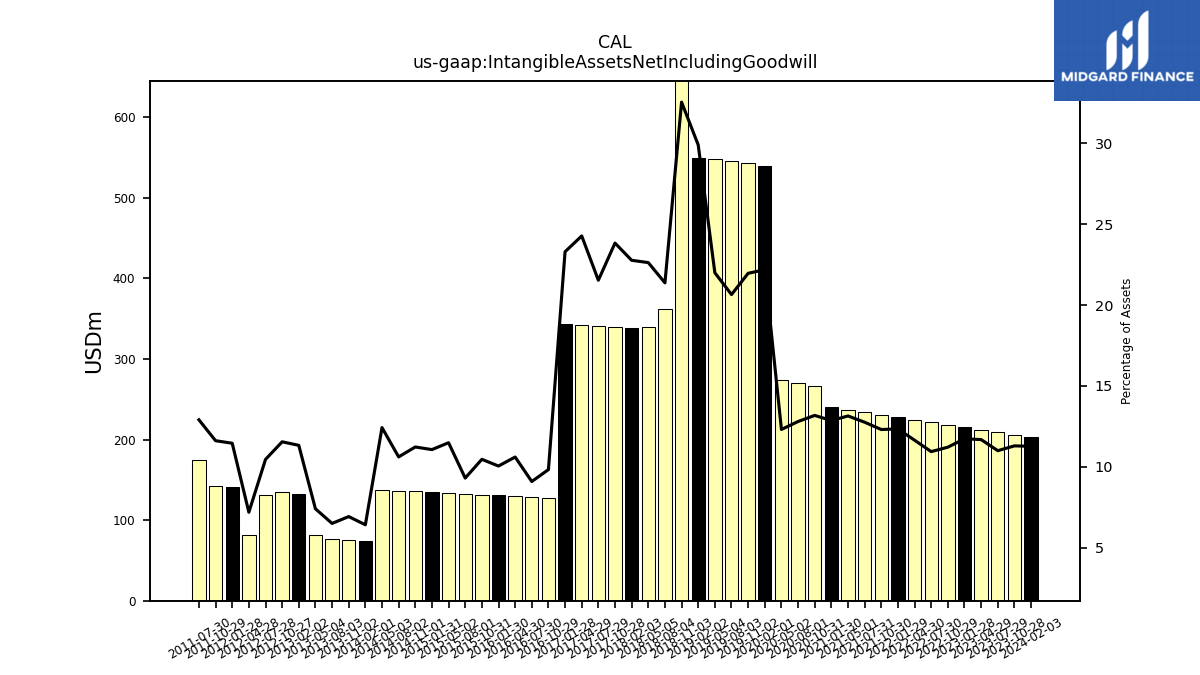
| Intangible Assets Net Including Goodwill | 203.31 | 206.28 | 209.31 | 212.35 | 215.39 | 218.42 | 221.45 | 224.47 | 227.50 | 230.62 | 233.78 | 236.92 | 240.07 | 267.07 | 270.36 | 273.65 | 539.58 | 542.85 | 546.11 | 548.51 | 549.90 | 653.85 | 362.05 | 339.90 | 339.17 | 340.18 | 341.19 | 342.21 | 343.76 | 128.14 | 129.06 | 129.98 | 130.90 | 131.82 | 132.74 | 133.66 | 134.59 | 135.77 | 136.76 | 137.75 | 73.67 | 75.18 | 76.69 | 81.00 | 132.63 | 134.38 | 131.07 | 81.97 | 140.59 | 142.54 | 174.30 | NA | NA | NA | NA | |
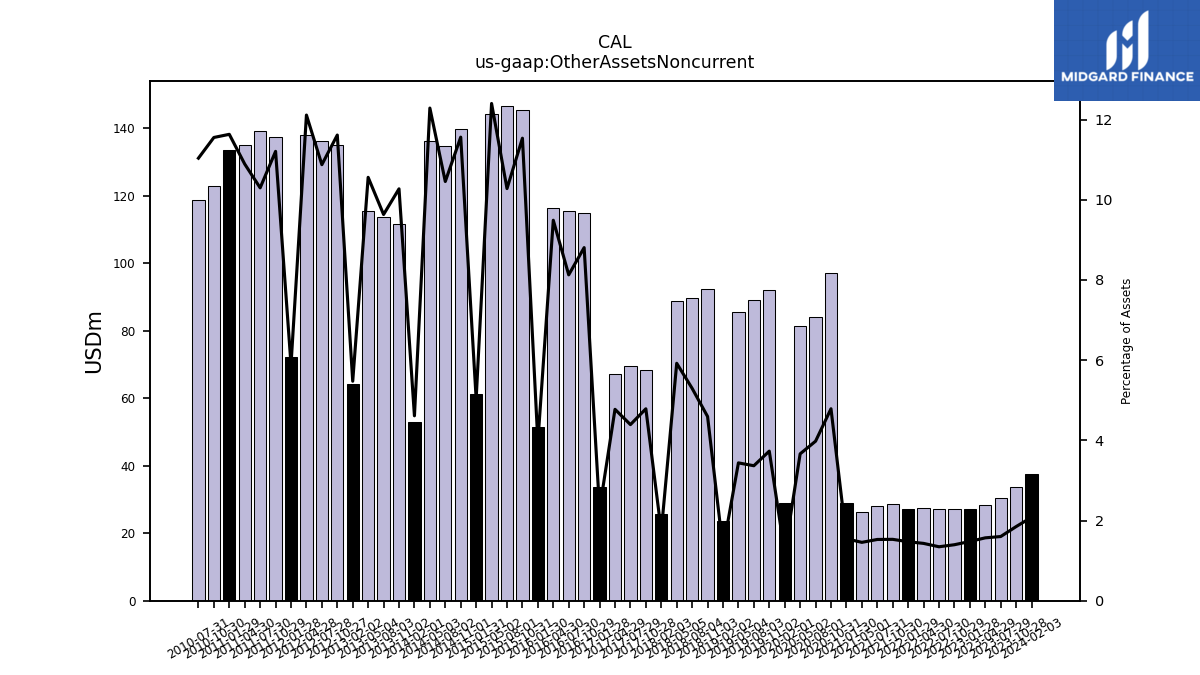
| Other Assets Noncurrent | 37.56 | 33.79 | 30.49 | 28.52 | 27.15 | 27.22 | 27.26 | 27.58 | 27.14 | 28.71 | 28.01 | 26.25 | 28.85 | 97.05 | 84.05 | 81.46 | 28.99 | 92.21 | 89.04 | 85.71 | 23.78 | 92.28 | 89.70 | 88.94 | 25.78 | 68.32 | 69.59 | 67.29 | 33.60 | 114.85 | 115.45 | 116.35 | 51.61 | 145.38 | 146.73 | 144.31 | 61.31 | 139.88 | 134.78 | 136.26 | 53.01 | 111.65 | 113.76 | 115.59 | 64.12 | 135.19 | 136.40 | 138.18 | 72.22 | 137.59 | 139.11 | 135.10 | 133.54 | 123.00 | 118.88 |
| 2024-02-03 | 2023-10-28 | 2023-07-29 | 2023-04-29 | 2023-01-28 | 2022-10-29 | 2022-07-30 | 2022-04-30 | 2022-01-29 | 2021-10-30 | 2021-07-31 | 2021-05-01 | 2021-01-30 | 2020-10-31 | 2020-08-01 | 2020-05-02 | 2020-02-01 | 2019-11-02 | 2019-08-03 | 2019-05-04 | 2019-02-02 | 2018-11-03 | 2018-08-04 | 2018-05-05 | 2018-02-03 | 2017-10-28 | 2017-07-29 | 2017-04-29 | 2017-01-28 | 2016-10-29 | 2016-07-30 | 2016-04-30 | 2016-01-30 | 2015-10-31 | 2015-08-01 | 2015-05-02 | 2015-01-31 | 2014-11-01 | 2014-08-02 | 2014-05-03 | 2014-02-01 | 2013-11-02 | 2013-08-03 | 2013-05-04 | 2013-02-02 | 2012-10-27 | 2012-07-28 | 2012-04-28 | 2012-01-28 | 2011-10-29 | 2011-07-30 | 2011-04-30 | 2011-01-29 | 2010-10-30 | 2010-07-31 | ||
|---|---|---|---|---|---|---|---|---|---|---|---|---|---|---|---|---|---|---|---|---|---|---|---|---|---|---|---|---|---|---|---|---|---|---|---|---|---|---|---|---|---|---|---|---|---|---|---|---|---|---|---|---|---|---|---|---|
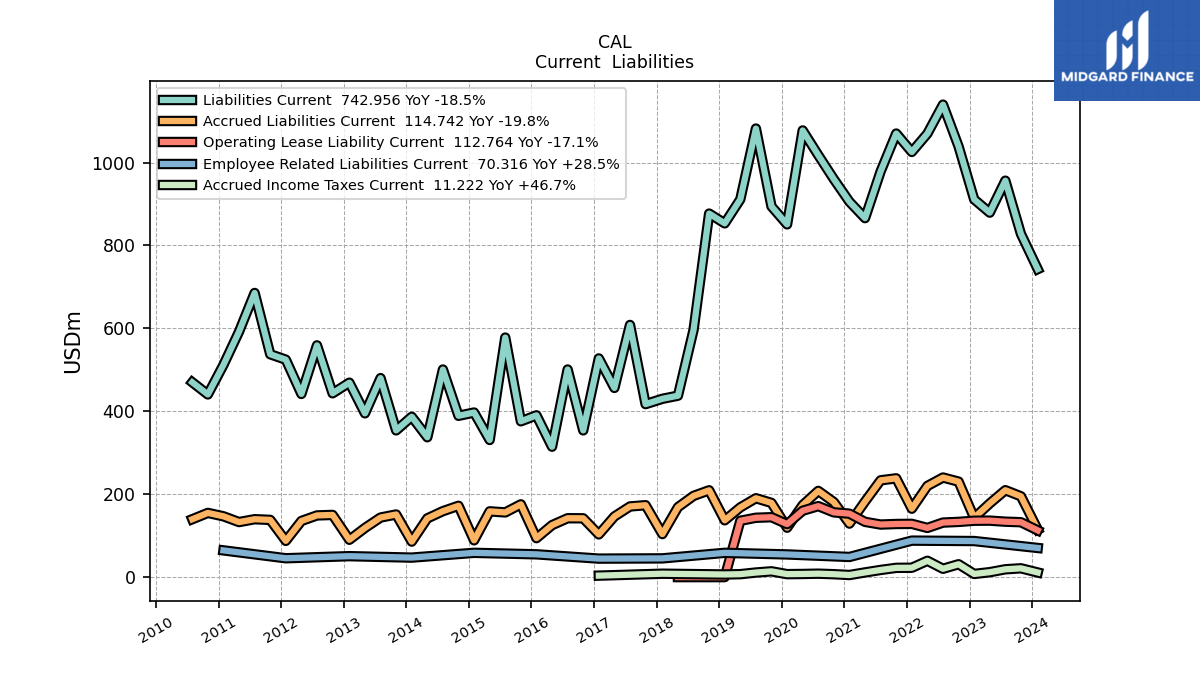
| Liabilities Current | 742.96 | 827.92 | 956.37 | 879.28 | 911.20 | 1038.91 | 1139.80 | 1069.89 | 1025.61 | 1070.06 | 978.67 | 865.94 | 905.51 | 959.91 | 1017.90 | 1077.54 | 850.95 | 894.23 | 1082.13 | 911.30 | 853.34 | 876.98 | 596.38 | 437.66 | 430.16 | 417.32 | 608.31 | 456.35 | 527.60 | 353.97 | 500.84 | 314.56 | 390.30 | 375.90 | 577.89 | 330.82 | 397.08 | 389.14 | 500.85 | 337.42 | 386.86 | 353.96 | 480.08 | 395.07 | 469.11 | 443.48 | 559.09 | 441.86 | 524.58 | 537.60 | 685.52 | 592.19 | 511.90 | 440.68 | 470.02 | |
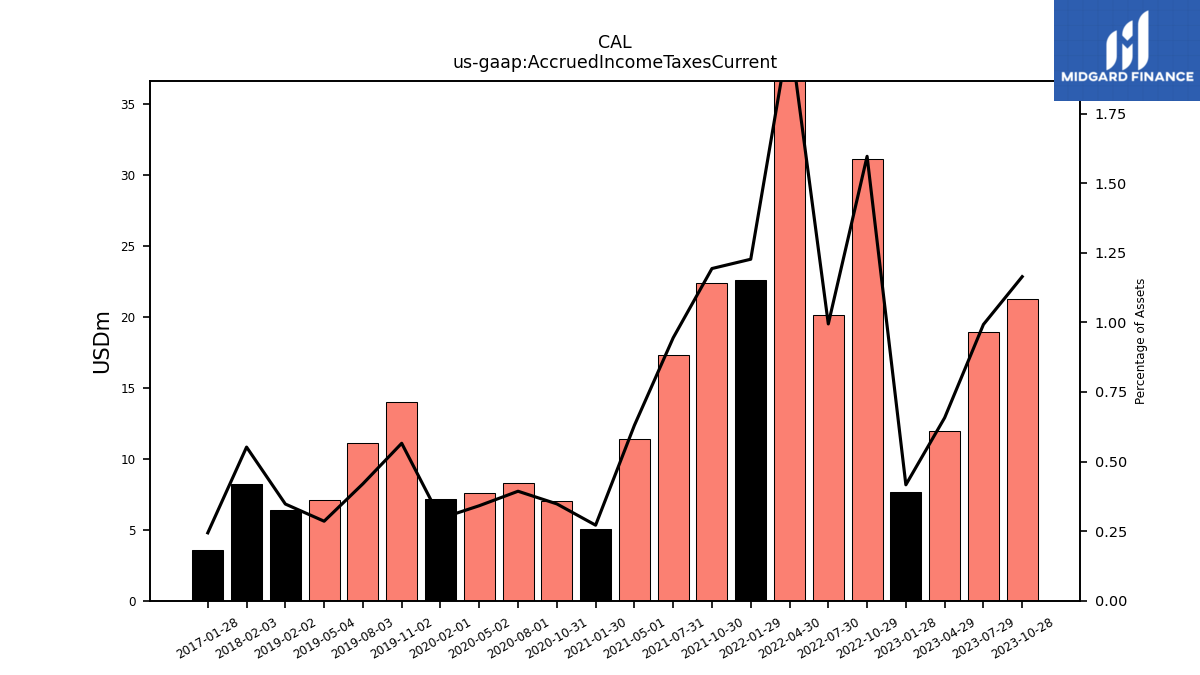
| Accrued Income Taxes Current | 11.22 | 21.27 | 18.90 | 11.95 | 7.65 | 31.11 | 20.14 | 39.42 | 22.62 | 22.37 | 17.31 | 11.36 | 5.07 | 7.05 | 8.31 | 7.59 | 7.19 | 13.98 | 11.11 | 7.12 | 6.39 | NA | NA | NA | 8.22 | NA | NA | NA | 3.60 | NA | NA | NA | NA | NA | NA | NA | NA | NA | NA | NA | NA | NA | NA | NA | NA | NA | NA | NA | NA | NA | NA | NA | NA | NA | NA | |
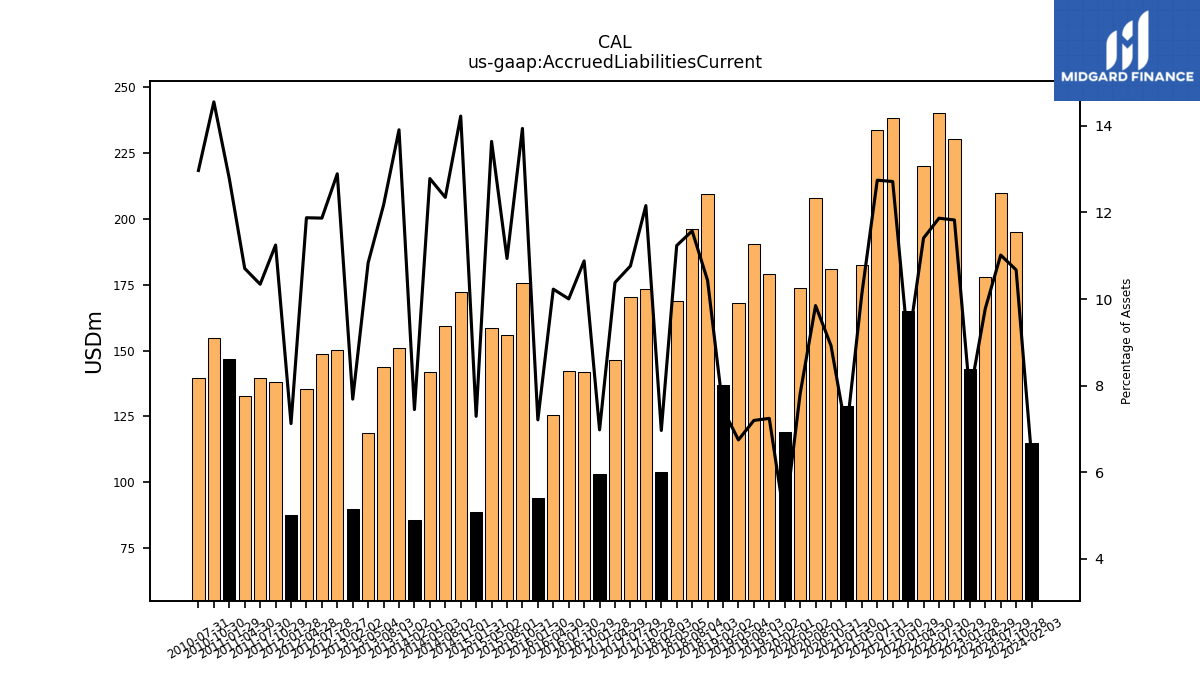
| Accrued Liabilities Current | 114.74 | 194.97 | 209.71 | 177.77 | 143.05 | 230.38 | 240.29 | 219.96 | 164.99 | 238.30 | 233.56 | 182.42 | 129.10 | 180.93 | 208.02 | 173.75 | 119.16 | 179.03 | 190.33 | 168.22 | 137.06 | 209.48 | 195.99 | 168.75 | 103.75 | 173.49 | 170.50 | 146.31 | 102.98 | 141.89 | 142.09 | 125.41 | 93.98 | 175.65 | 156.11 | 158.70 | 88.74 | 172.08 | 159.15 | 141.72 | 85.60 | 151.14 | 143.74 | 118.63 | 90.07 | 150.06 | 148.84 | 135.48 | 87.45 | 138.07 | 139.70 | 132.81 | 146.72 | 154.90 | 139.68 |
| 2024-02-03 | 2023-10-28 | 2023-07-29 | 2023-04-29 | 2023-01-28 | 2022-10-29 | 2022-07-30 | 2022-04-30 | 2022-01-29 | 2021-10-30 | 2021-07-31 | 2021-05-01 | 2021-01-30 | 2020-10-31 | 2020-08-01 | 2020-05-02 | 2020-02-01 | 2019-11-02 | 2019-08-03 | 2019-05-04 | 2019-02-02 | 2018-11-03 | 2018-08-04 | 2018-05-05 | 2018-02-03 | 2017-10-28 | 2017-07-29 | 2017-04-29 | 2017-01-28 | 2016-10-29 | 2016-07-30 | 2016-04-30 | 2016-01-30 | 2015-10-31 | 2015-08-01 | 2015-05-02 | 2015-01-31 | 2014-11-01 | 2014-08-02 | 2014-05-03 | 2014-02-01 | 2013-11-02 | 2013-08-03 | 2013-05-04 | 2013-02-02 | 2012-10-27 | 2012-07-28 | 2012-04-28 | 2012-01-28 | 2011-10-29 | 2011-07-30 | 2011-04-30 | 2011-01-29 | 2010-10-30 | 2010-07-31 | ||
|---|---|---|---|---|---|---|---|---|---|---|---|---|---|---|---|---|---|---|---|---|---|---|---|---|---|---|---|---|---|---|---|---|---|---|---|---|---|---|---|---|---|---|---|---|---|---|---|---|---|---|---|---|---|---|---|---|
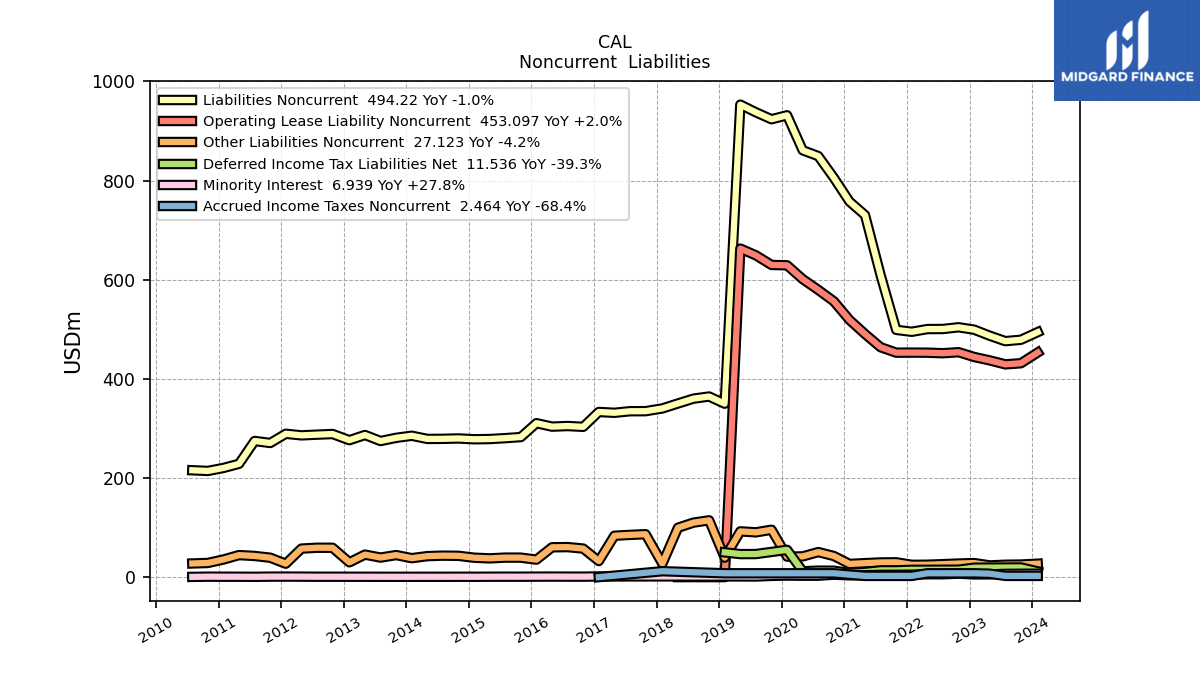
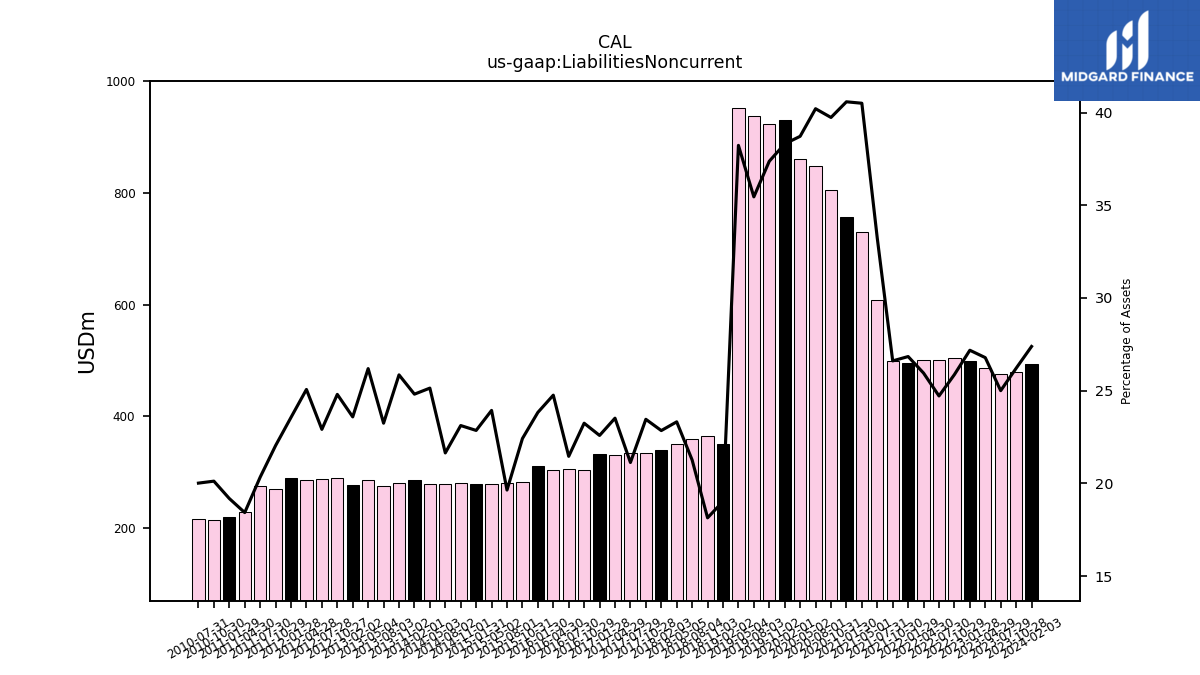
| Liabilities Noncurrent | 494.22 | 478.80 | 476.01 | 486.93 | 499.16 | 503.99 | 500.53 | 500.38 | 494.93 | 498.75 | 608.94 | 730.23 | 757.69 | 805.50 | 849.36 | 861.02 | 931.63 | 923.63 | 937.59 | 953.14 | 349.80 | 364.34 | 360.07 | 350.26 | 340.29 | 334.74 | 334.67 | 331.48 | 333.19 | 303.16 | 304.79 | 303.56 | 310.55 | 282.53 | 280.36 | 278.54 | 278.11 | 279.70 | 278.98 | 278.77 | 285.19 | 280.99 | 274.54 | 286.70 | 276.25 | 288.69 | 287.38 | 285.96 | 289.18 | 270.57 | 274.68 | 228.56 | 220.23 | 214.19 | 215.57 | |
| Deferred Income Tax Liabilities Net | 11.54 | 19.50 | 19.34 | 19.18 | 19.00 | 15.04 | 14.94 | 14.81 | 14.73 | 13.60 | 13.57 | 10.26 | 8.24 | 12.94 | 13.05 | 11.78 | 55.01 | NA | 46.57 | 46.44 | 49.99 | NA | NA | NA | NA | NA | NA | NA | NA | NA | NA | NA | NA | NA | NA | NA | NA | NA | NA | NA | NA | NA | NA | NA | NA | NA | NA | NA | NA | NA | NA | NA | NA | NA | NA | |
| Minority Interest | 6.94 | 6.79 | 6.59 | 5.56 | 5.43 | 6.97 | 5.74 | 5.79 | 4.82 | 4.65 | 4.59 | 3.79 | 3.61 | 4.98 | 2.89 | 2.83 | 3.18 | 2.51 | 1.25 | 1.40 | 1.38 | 1.33 | 1.34 | 1.43 | 1.47 | 1.44 | 1.45 | 1.35 | 1.37 | 0.95 | 0.98 | 1.10 | 0.99 | 0.85 | 0.88 | 0.85 | 0.71 | 0.76 | 0.67 | 0.70 | 0.66 | 0.66 | 0.68 | 0.74 | 0.77 | 0.80 | 0.80 | 0.98 | 1.05 | 0.99 | 0.65 | 0.79 | 0.83 | 0.92 | 0.47 | |
| Other Liabilities Noncurrent | 27.12 | 25.36 | 25.02 | 23.63 | 28.30 | 27.44 | 26.15 | 25.04 | 24.82 | 29.90 | 29.61 | 28.19 | 26.61 | 42.63 | 50.50 | 41.82 | 41.41 | 95.62 | 90.33 | 92.34 | 39.24 | 114.59 | 109.97 | 99.65 | 27.15 | 86.58 | 85.21 | 83.48 | 32.36 | 57.57 | 60.57 | 60.17 | 35.23 | 39.30 | 39.38 | 37.85 | 39.17 | 42.98 | 43.32 | 42.34 | 38.21 | 44.48 | 39.43 | 45.44 | 29.85 | 59.20 | 59.29 | 57.54 | 27.05 | 39.16 | 42.69 | 44.44 | 35.55 | 28.55 | 27.55 | |
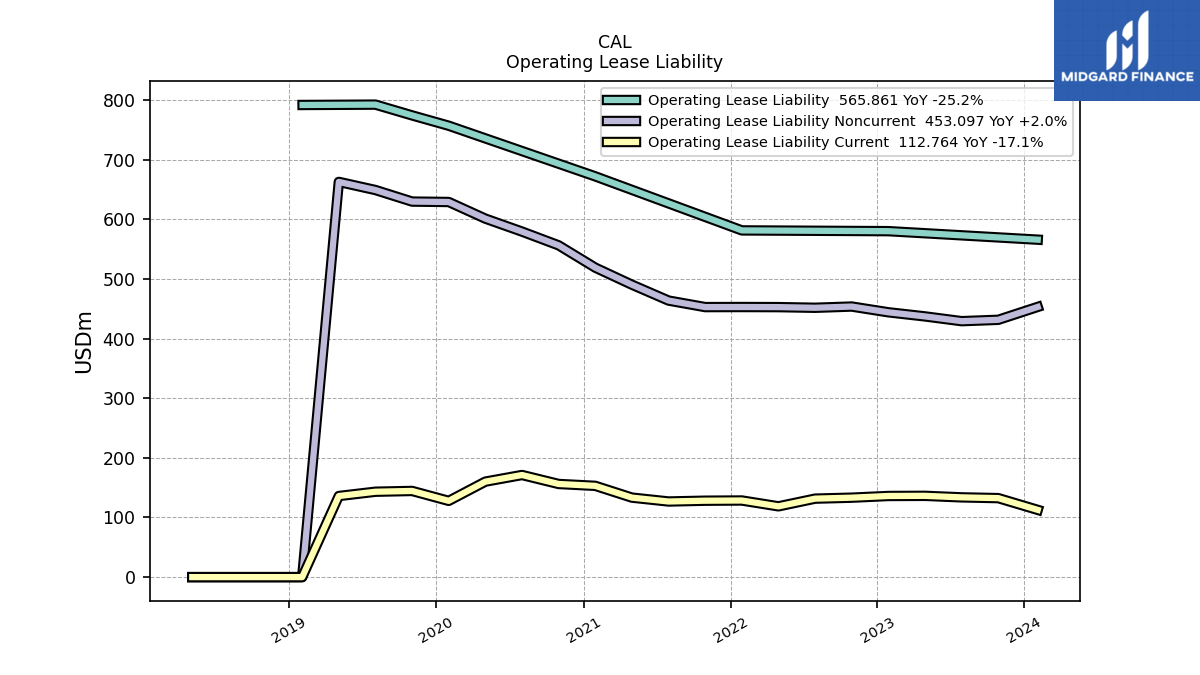
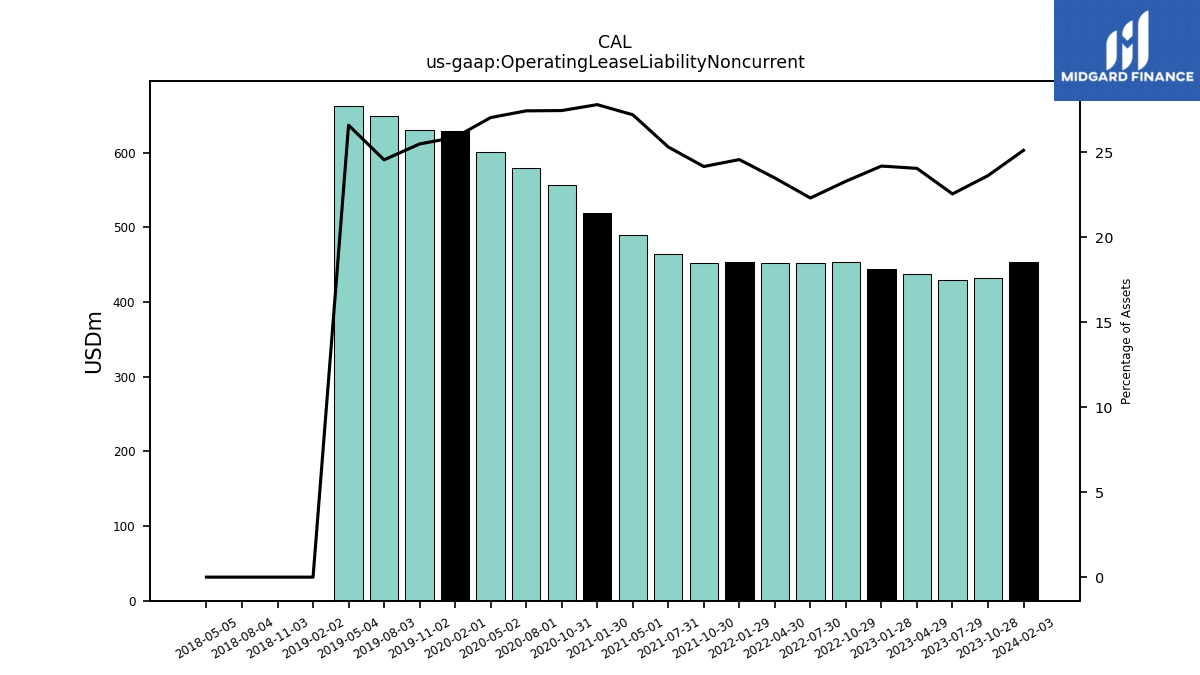
| Operating Lease Liability Noncurrent | 453.10 | 431.47 | 429.19 | 437.17 | 444.07 | 453.72 | 451.66 | 452.74 | 452.91 | 452.79 | 463.75 | 490.36 | 518.94 | 556.34 | 579.40 | 601.13 | 629.03 | 629.73 | 649.10 | 662.75 | 0.00 | 0.00 | 0.00 | 0.00 | NA | NA | NA | NA | NA | NA | NA | NA | NA | NA | NA | NA | NA | NA | NA | NA | NA | NA | NA | NA | NA | NA | NA | NA | NA | NA | NA | NA | NA | NA | NA |
| 2024-02-03 | 2023-10-28 | 2023-07-29 | 2023-04-29 | 2023-01-28 | 2022-10-29 | 2022-07-30 | 2022-04-30 | 2022-01-29 | 2021-10-30 | 2021-07-31 | 2021-05-01 | 2021-01-30 | 2020-10-31 | 2020-08-01 | 2020-05-02 | 2020-02-01 | 2019-11-02 | 2019-08-03 | 2019-05-04 | 2019-02-02 | 2018-11-03 | 2018-08-04 | 2018-05-05 | 2018-02-03 | 2017-10-28 | 2017-07-29 | 2017-04-29 | 2017-01-28 | 2016-10-29 | 2016-07-30 | 2016-04-30 | 2016-01-30 | 2015-10-31 | 2015-08-01 | 2015-05-02 | 2015-01-31 | 2014-11-01 | 2014-08-02 | 2014-05-03 | 2014-02-01 | 2013-11-02 | 2013-08-03 | 2013-05-04 | 2013-02-02 | 2012-10-27 | 2012-07-28 | 2012-04-28 | 2012-01-28 | 2011-10-29 | 2011-07-30 | 2011-04-30 | 2011-01-29 | 2010-10-30 | 2010-07-31 | ||
|---|---|---|---|---|---|---|---|---|---|---|---|---|---|---|---|---|---|---|---|---|---|---|---|---|---|---|---|---|---|---|---|---|---|---|---|---|---|---|---|---|---|---|---|---|---|---|---|---|---|---|---|---|---|---|---|---|
| Stockholders Equity | 560.63 | 513.38 | 464.99 | 446.32 | 420.68 | 398.44 | 379.13 | 352.24 | 318.57 | 301.10 | 240.70 | 202.87 | 200.25 | 256.67 | 242.24 | 282.30 | 645.95 | 650.84 | 623.43 | 627.24 | 634.05 | 765.75 | 735.85 | 712.71 | 717.49 | 673.64 | 639.73 | 620.39 | 613.12 | 646.11 | 613.79 | 606.88 | 601.48 | 601.00 | 568.35 | 553.47 | 540.91 | 540.25 | 508.58 | 492.07 | 476.70 | 451.30 | 425.72 | 412.19 | 425.13 | 431.14 | 406.90 | 412.01 | 412.67 | 418.60 | 390.08 | 419.02 | 415.08 | 408.80 | 391.07 | |
| Stockholders Equity Including Portion Attributable To Noncontrolling Interest | 567.57 | 520.17 | 471.58 | 451.88 | 426.11 | 405.41 | 384.88 | 358.03 | 323.39 | 305.75 | 245.29 | 206.66 | 203.85 | 261.65 | 245.13 | 285.12 | 649.13 | 653.35 | 624.68 | 628.63 | 635.43 | 767.09 | 737.19 | 714.14 | 718.96 | 675.09 | 641.17 | 621.73 | 614.49 | 647.06 | 614.76 | 607.98 | 602.47 | 601.86 | 569.23 | 554.32 | 541.62 | 541.02 | 509.25 | 492.77 | 477.36 | 451.96 | 426.40 | 412.93 | 425.90 | 431.94 | 407.70 | 412.99 | 413.72 | 419.59 | 390.72 | 419.81 | 415.91 | 409.73 | 391.55 | |
| Common Stock Value | 0.35 | 0.35 | 0.35 | 0.36 | 0.36 | 0.36 | 0.36 | 0.37 | 0.38 | 0.38 | 0.38 | 0.38 | 0.38 | 0.38 | 0.38 | 0.39 | 0.40 | 0.41 | 0.41 | 0.42 | 0.42 | 0.43 | 0.43 | 0.43 | 0.43 | 0.43 | 0.43 | 0.43 | 0.43 | 0.43 | 0.43 | 0.43 | 0.44 | 0.44 | 0.44 | 0.44 | 0.44 | 0.44 | 0.44 | 0.44 | 0.43 | 0.43 | 0.43 | 0.43 | 0.43 | 0.43 | 0.43 | 0.43 | 0.42 | 0.42 | 0.42 | 0.44 | 0.44 | 0.44 | 0.44 | |
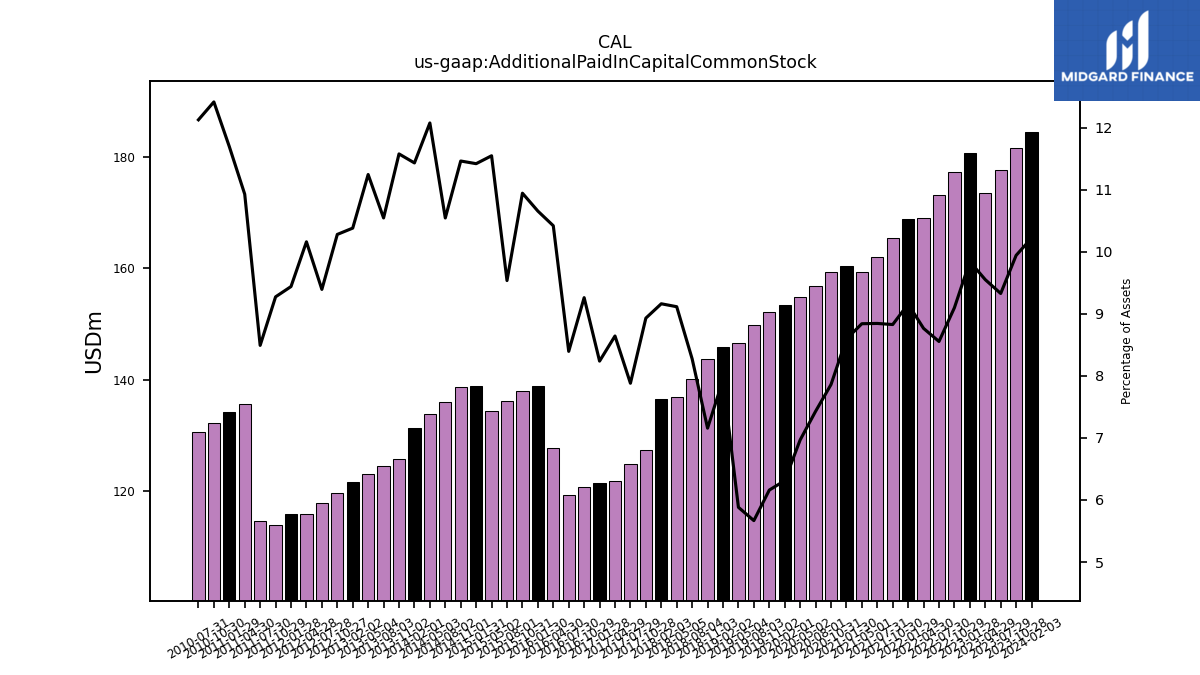
| Additional Paid In Capital Common Stock | 184.45 | 181.63 | 177.60 | 173.64 | 180.75 | 177.27 | 173.25 | 169.03 | 168.83 | 165.47 | 162.12 | 159.38 | 160.45 | 159.33 | 156.91 | 154.93 | 153.49 | 152.21 | 149.88 | 146.64 | 145.89 | 143.75 | 140.15 | 136.91 | 136.46 | 127.45 | 124.85 | 121.83 | 121.54 | 120.78 | 119.24 | 127.75 | 138.88 | 137.93 | 136.13 | 134.37 | 138.96 | 138.68 | 135.93 | 133.92 | 131.40 | 125.83 | 124.54 | 123.10 | 121.59 | 119.67 | 117.81 | 115.91 | 115.87 | 113.86 | 114.71 | 135.57 | 134.27 | 132.17 | 130.62 | |
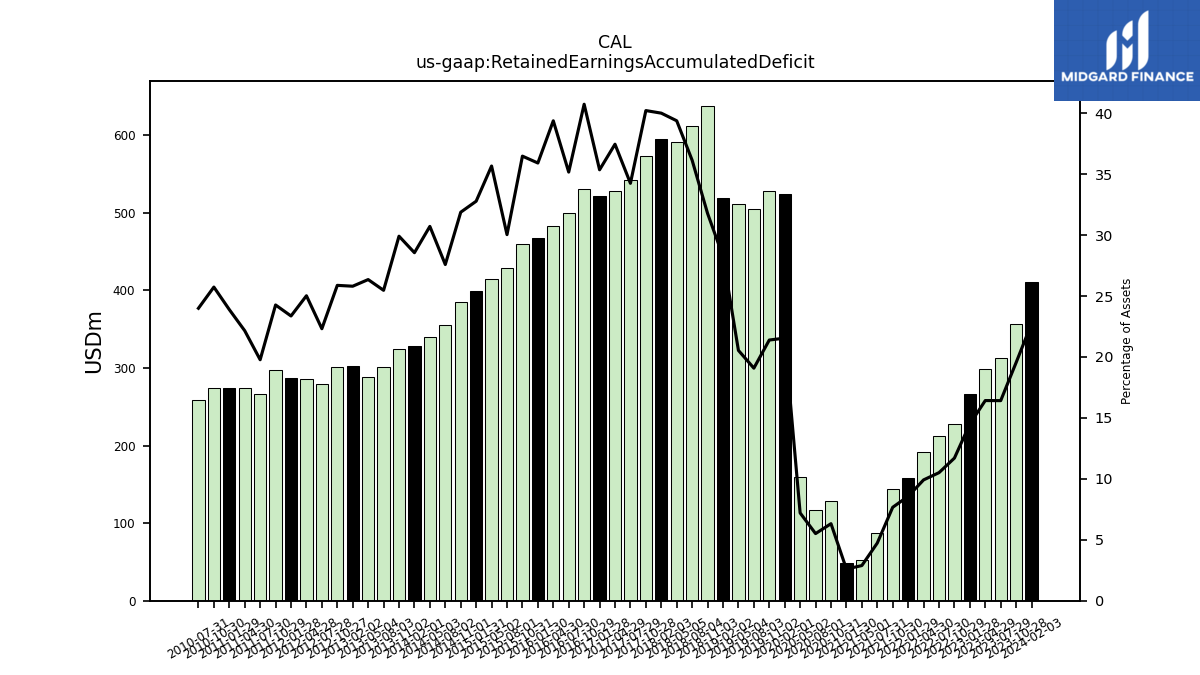
| Retained Earnings Accumulated Deficit | 410.33 | 356.99 | 312.56 | 298.57 | 266.33 | 228.01 | 212.80 | 191.16 | 157.97 | 143.71 | 86.76 | 52.04 | 48.56 | 128.15 | 116.39 | 160.19 | 523.90 | 528.54 | 504.55 | 512.05 | 519.35 | 638.19 | 612.04 | 591.43 | 595.77 | 573.88 | 542.50 | 527.91 | 521.58 | 531.22 | 499.49 | 482.74 | 468.03 | 459.68 | 428.75 | 414.99 | 398.80 | 385.62 | 355.57 | 340.57 | 328.19 | 325.06 | 300.77 | 288.43 | 302.22 | 301.19 | 279.90 | 285.44 | 286.74 | 297.91 | 267.11 | 274.81 | 274.23 | 273.95 | 258.44 | |
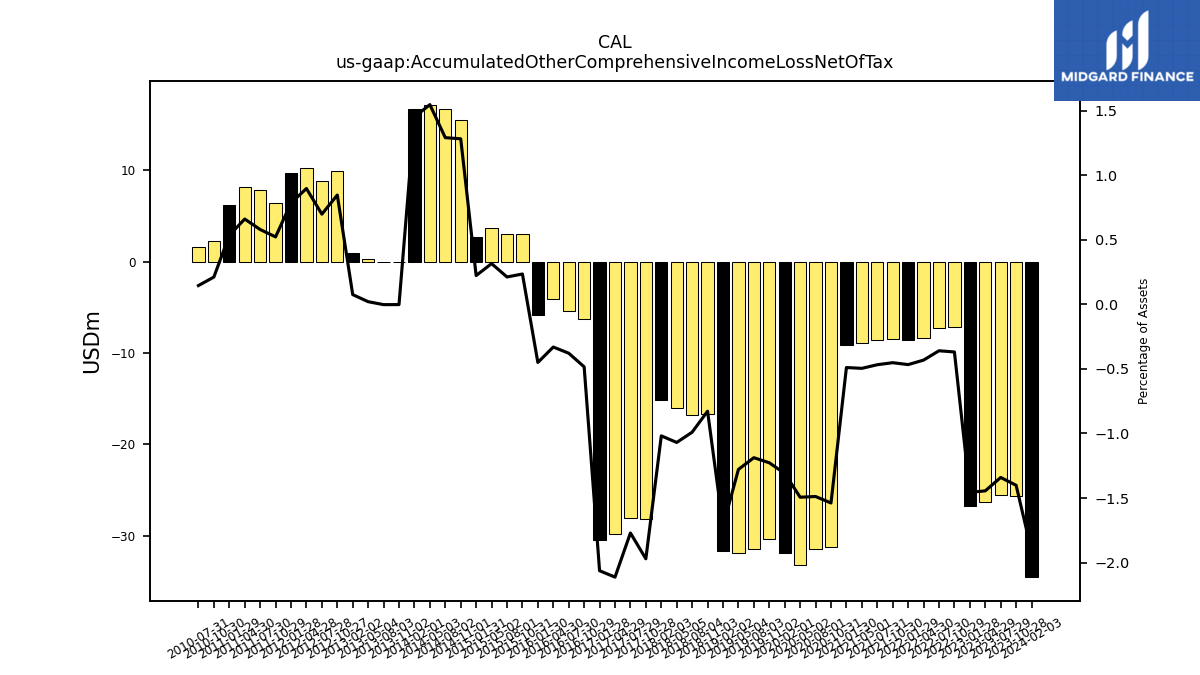
| Accumulated Other Comprehensive Income Loss Net Of Tax | -34.50 | -25.60 | -25.53 | -26.26 | -26.75 | -7.19 | -7.28 | -8.33 | -8.61 | -8.47 | -8.57 | -8.94 | -9.14 | -31.18 | -31.44 | -33.22 | -31.84 | -30.32 | -31.41 | -31.87 | -31.60 | -16.62 | -16.77 | -16.07 | -15.17 | -28.12 | -28.05 | -29.78 | -30.43 | -6.31 | -5.38 | -4.05 | -5.86 | 2.96 | 3.03 | 3.67 | 2.71 | 15.51 | 16.64 | 17.15 | 16.68 | -0.02 | -0.03 | 0.23 | 0.88 | 9.86 | 8.76 | 10.23 | 9.64 | 6.41 | 7.83 | 8.20 | 6.14 | 2.25 | 1.57 | |
| Minority Interest | 6.94 | 6.79 | 6.59 | 5.56 | 5.43 | 6.97 | 5.74 | 5.79 | 4.82 | 4.65 | 4.59 | 3.79 | 3.61 | 4.98 | 2.89 | 2.83 | 3.18 | 2.51 | 1.25 | 1.40 | 1.38 | 1.33 | 1.34 | 1.43 | 1.47 | 1.44 | 1.45 | 1.35 | 1.37 | 0.95 | 0.98 | 1.10 | 0.99 | 0.85 | 0.88 | 0.85 | 0.71 | 0.76 | 0.67 | 0.70 | 0.66 | 0.66 | 0.68 | 0.74 | 0.77 | 0.80 | 0.80 | 0.98 | 1.05 | 0.99 | 0.65 | 0.79 | 0.83 | 0.92 | 0.47 |
