

| 2023-12-31 | 2023-09-30 | 2023-06-30 | 2023-03-31 | 2022-12-31 | 2022-09-30 | 2022-06-30 | 2022-03-31 | 2021-12-31 | 2021-09-30 | 2021-06-30 | 2021-03-31 | 2020-12-31 | 2020-09-30 | 2020-06-30 | 2020-03-31 | 2019-09-30 | 2019-06-30 | ||
|---|---|---|---|---|---|---|---|---|---|---|---|---|---|---|---|---|---|---|---|
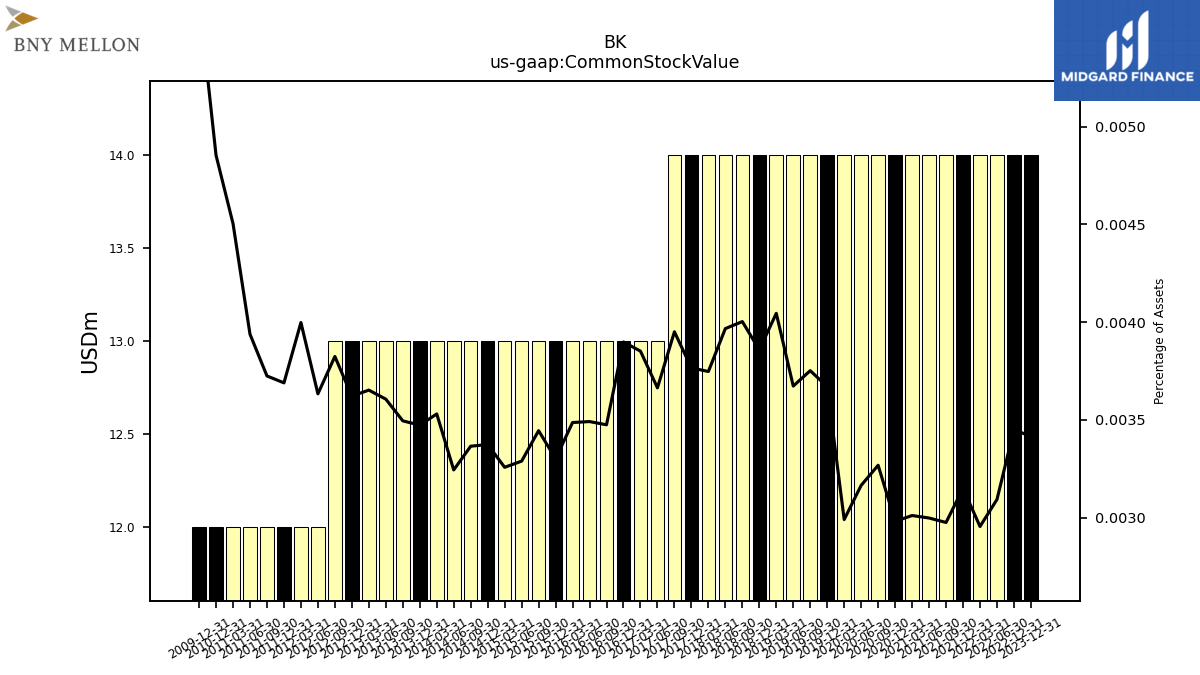
| Common Stock Value | 14.00 | NA | NA | NA | 14.00 | NA | 14.00 | 14.00 | 14.00 | 14.00 | 14.00 | 14.00 | 14.00 | 14.00 | 14.00 | 14.00 | 14.00 | 14.00 | |
| Earnings Per Share Basic | 0.23 | 1.23 | 1.31 | 1.13 | 0.63 | 0.39 | 1.03 | 0.86 | 1.01 | 1.04 | 1.14 | 0.97 | 0.79 | 0.98 | 1.01 | 1.05 | 1.07 | 1.01 | |
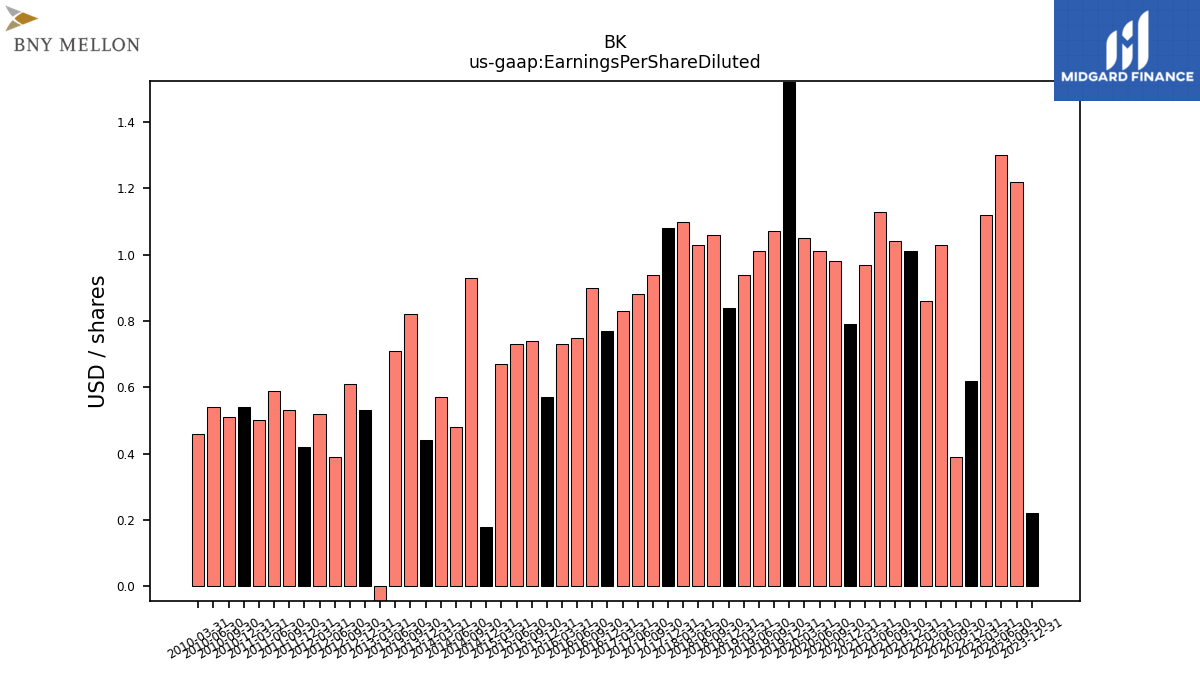
| Earnings Per Share Diluted | 0.22 | 1.22 | 1.30 | 1.12 | 0.62 | 0.39 | 1.03 | 0.86 | 1.01 | 1.04 | 1.13 | 0.97 | 0.79 | 0.98 | 1.01 | 1.05 | 1.07 | 1.01 | |
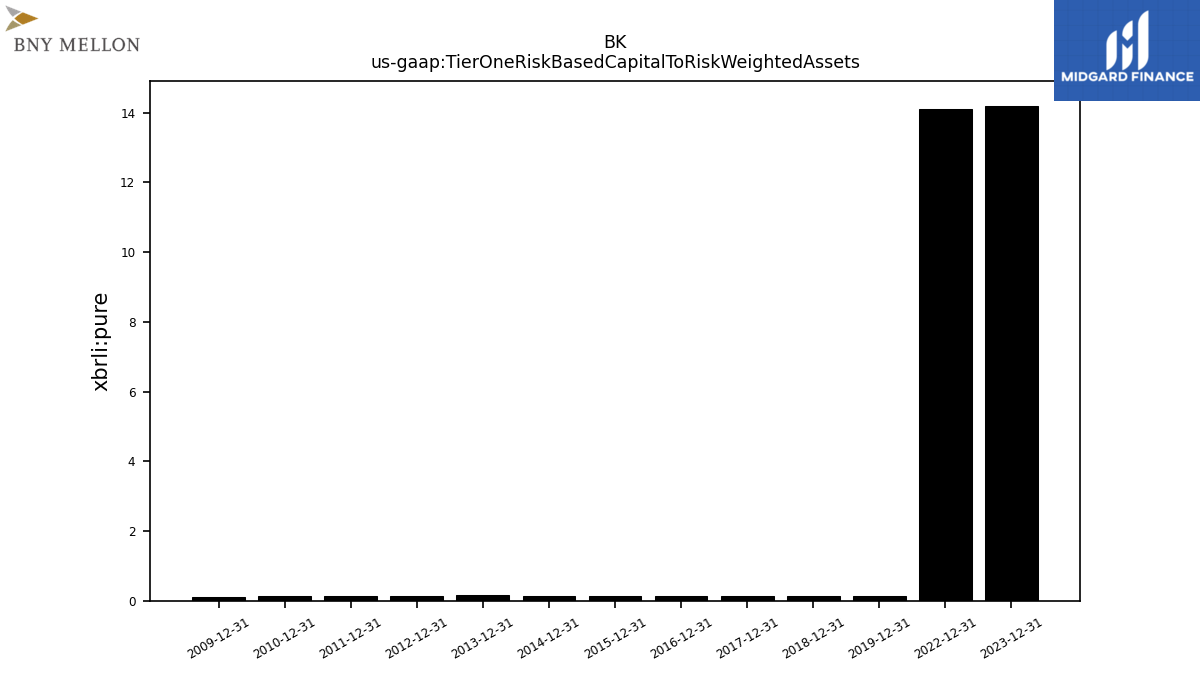
| Tier One Risk Based Capital To Risk Weighted Assets | 0.00 | NA | NA | NA | 0.00 | NA | NA | NA | NA | NA | NA | NA | NA | NA | NA | NA | NA | NA | |
| Capital To Risk Weighted Assets | 0.00 | NA | NA | NA | 0.00 | NA | NA | NA | NA | NA | NA | NA | NA | NA | NA | NA | NA | NA |
| 2023-12-31 | 2023-09-30 | 2023-06-30 | 2023-03-31 | 2022-12-31 | 2022-09-30 | 2022-06-30 | 2022-03-31 | 2021-12-31 | 2021-09-30 | 2021-06-30 | 2021-03-31 | 2020-12-31 | 2020-09-30 | 2020-06-30 | 2020-03-31 | 2019-09-30 | 2019-06-30 | ||
|---|---|---|---|---|---|---|---|---|---|---|---|---|---|---|---|---|---|---|---|
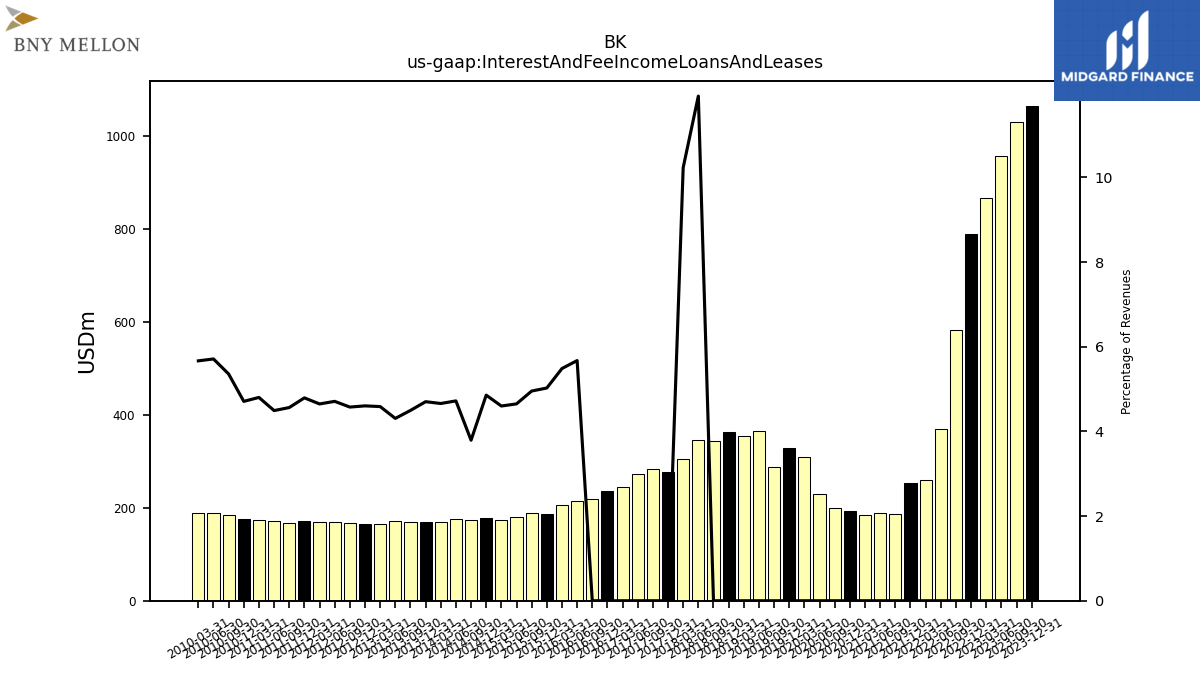
| Interest And Fee Income Loans And Leases | 1064.00 | 1029.00 | 957.00 | 866.00 | 788.00 | 581.00 | 370.00 | 260.00 | 253.00 | 186.00 | 188.00 | 185.00 | 193.00 | 199.00 | 230.00 | 309.00 | 287.00 | 365.00 | |
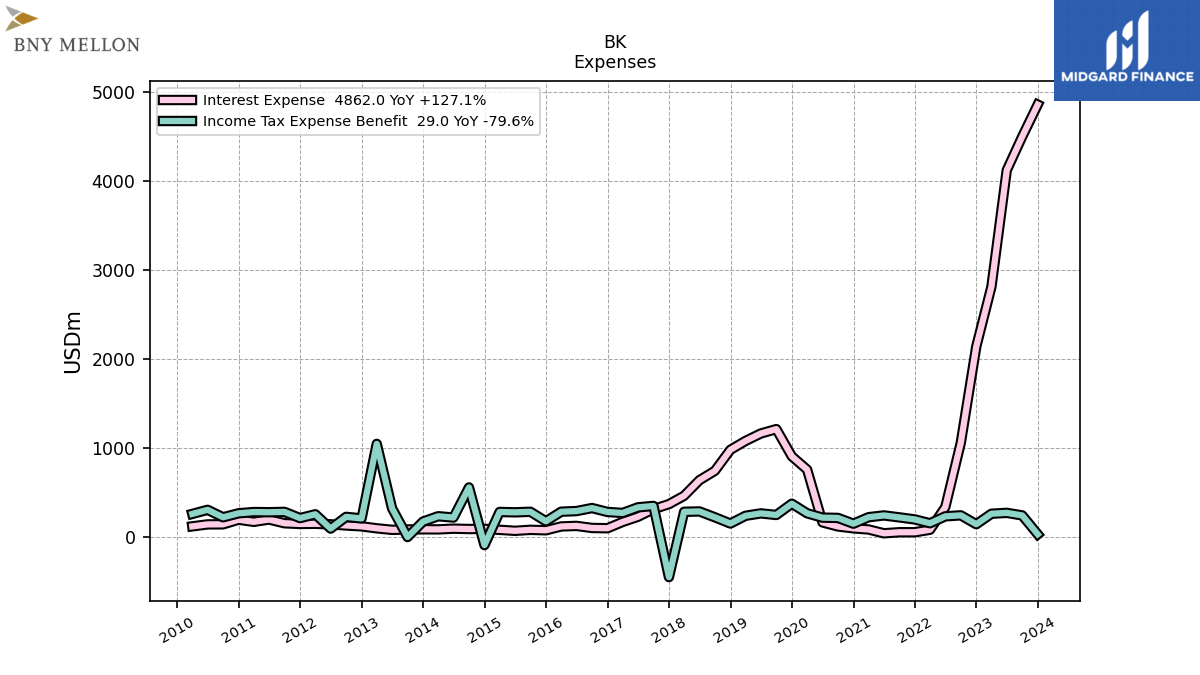
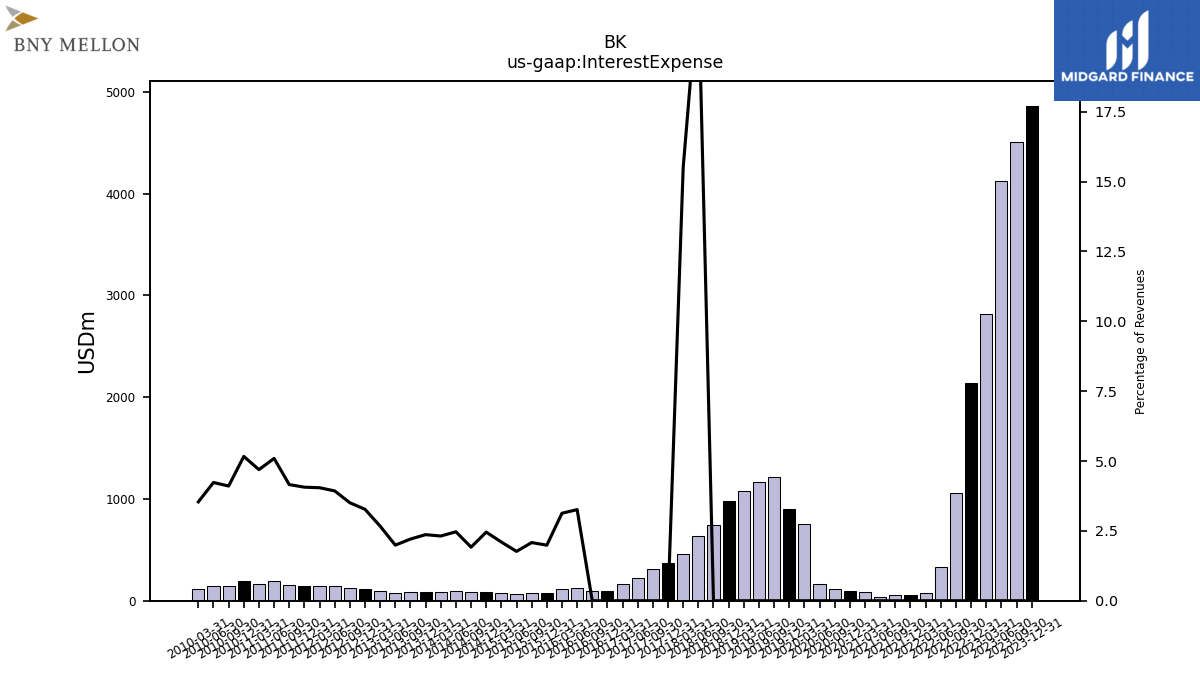
| Interest Expense | 4862.00 | 4503.00 | 4124.00 | 2814.00 | 2141.00 | 1058.00 | 335.00 | 80.00 | 52.00 | 52.00 | 40.00 | 83.00 | 96.00 | 117.00 | 163.00 | 756.00 | 1212.00 | 1163.00 | |
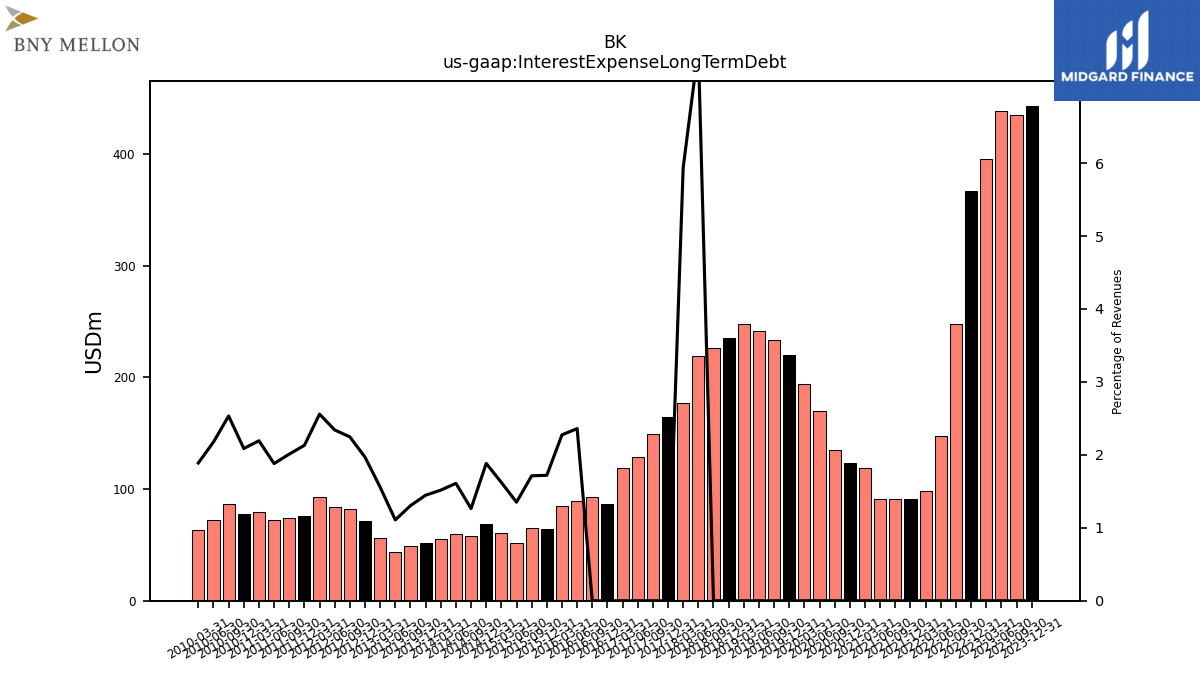
| Interest Expense Long Term Debt | 443.00 | 435.00 | 438.00 | 395.00 | 367.00 | 248.00 | 147.00 | 98.00 | 91.00 | 91.00 | 91.00 | 119.00 | 123.00 | 135.00 | 170.00 | 194.00 | 233.00 | 241.00 | |
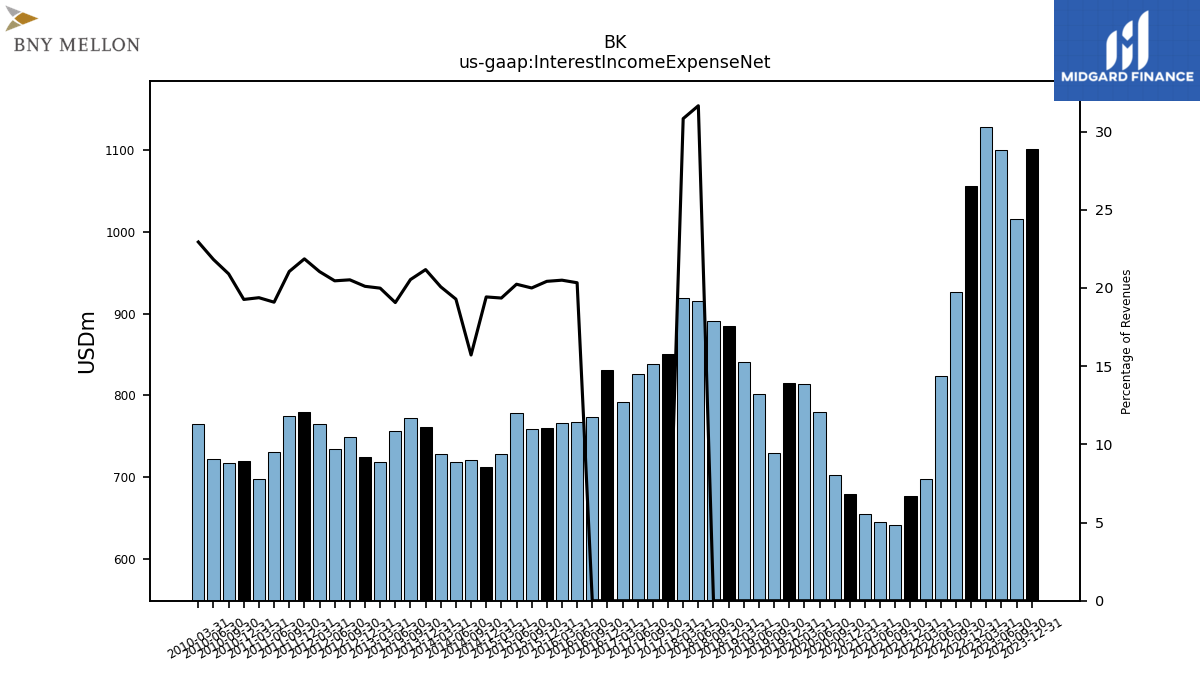
| Interest Income Expense Net | 1101.00 | 1016.00 | 1100.00 | 1128.00 | 1056.00 | 926.00 | 824.00 | 698.00 | 677.00 | 641.00 | 645.00 | 655.00 | 680.00 | 703.00 | 780.00 | 814.00 | 730.00 | 802.00 | |
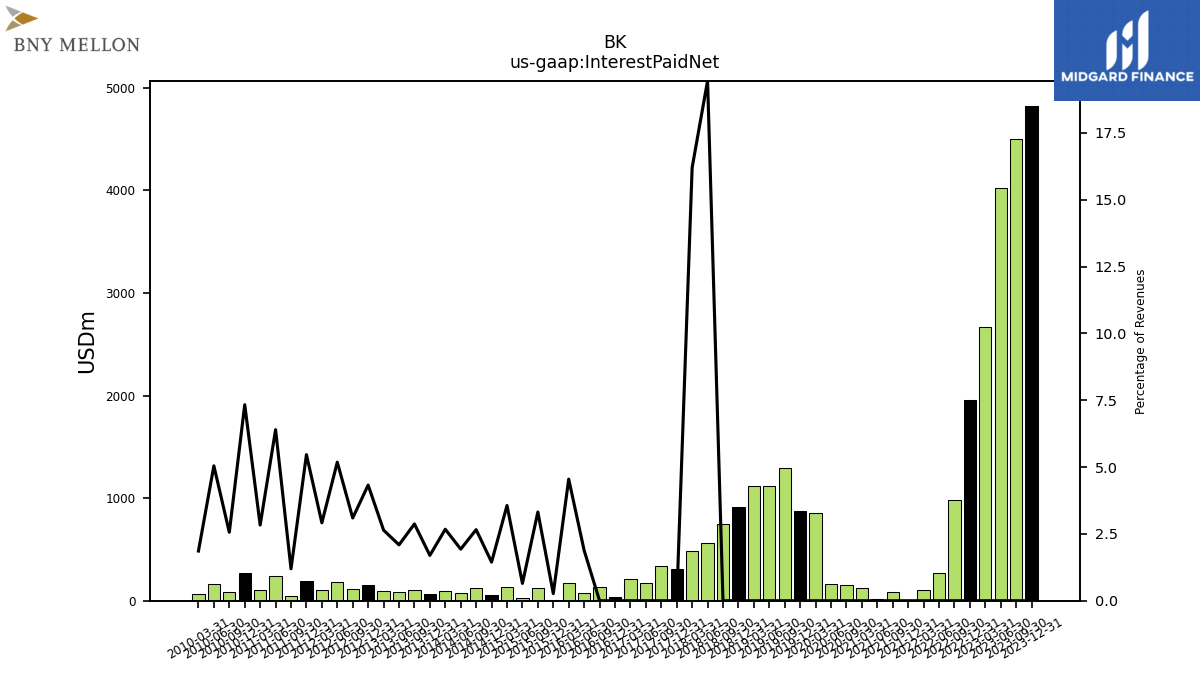
| Interest Paid Net | 4825.00 | 4505.00 | 4020.00 | 2671.00 | 1952.00 | 981.00 | 267.00 | 107.00 | 7.00 | 81.00 | 19.00 | 126.00 | NA | 153.00 | 162.00 | 851.00 | 1290.00 | 1116.00 | |
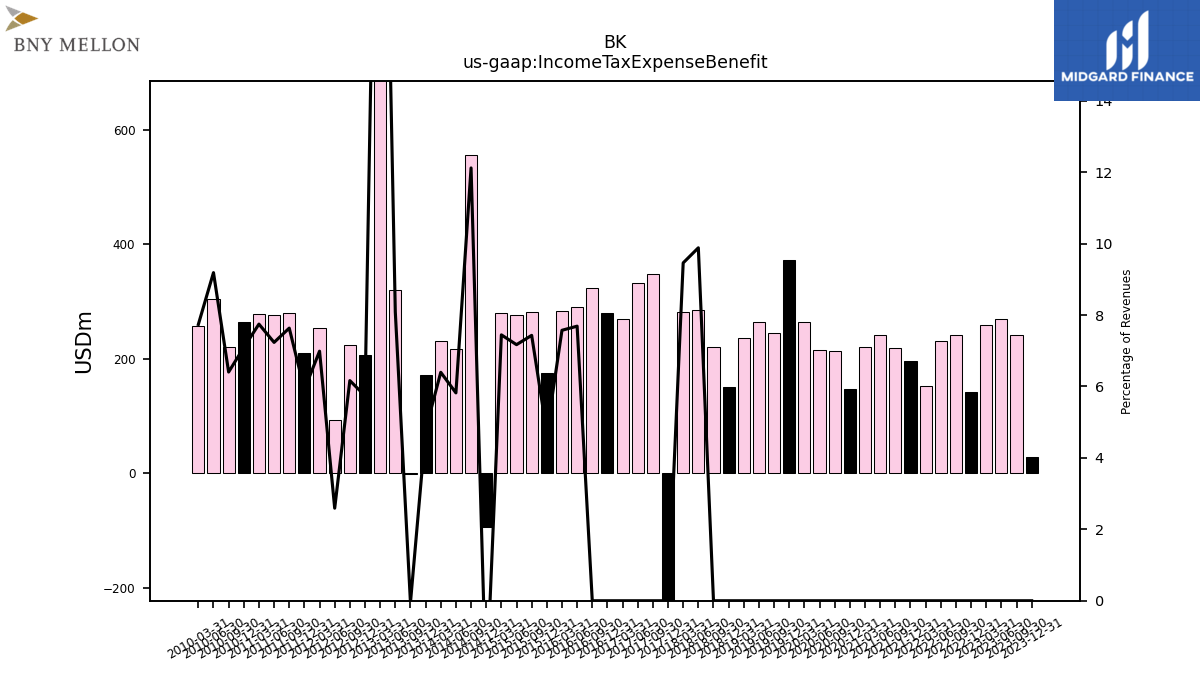
| Income Tax Expense Benefit | 29.00 | 241.00 | 270.00 | 260.00 | 142.00 | 242.00 | 231.00 | 153.00 | 196.00 | 219.00 | 241.00 | 221.00 | 148.00 | 213.00 | 216.00 | 265.00 | 246.00 | 264.00 | |
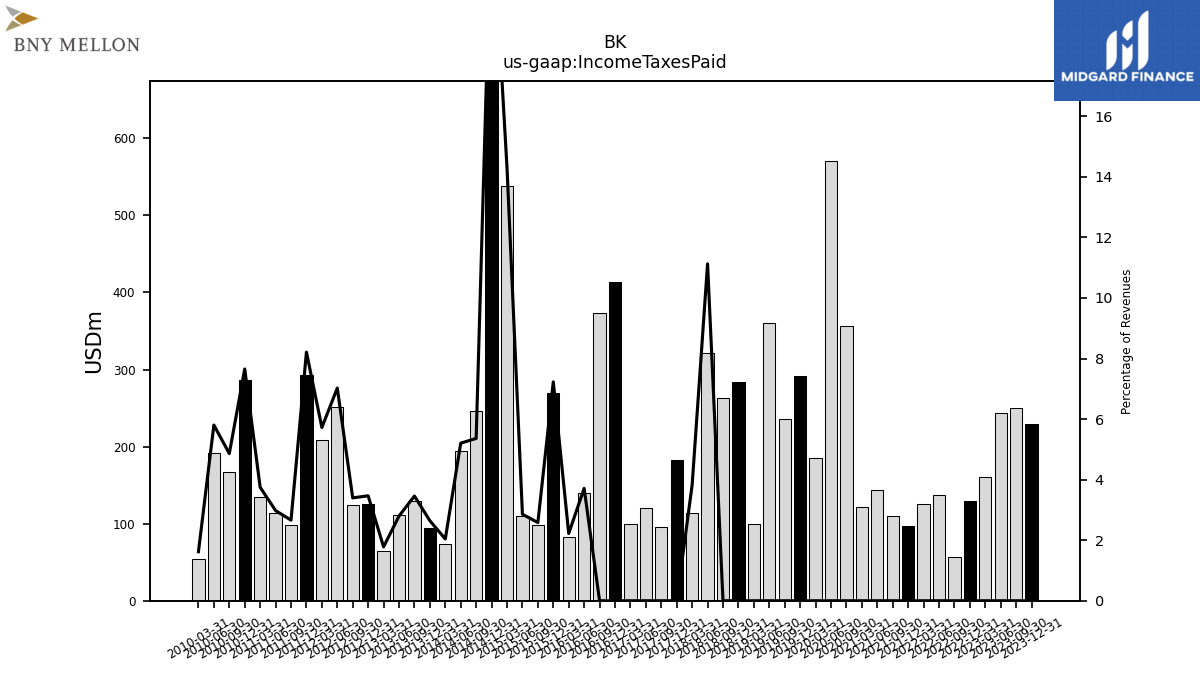
| Income Taxes Paid | 229.00 | 250.00 | 243.00 | 160.00 | 130.00 | 57.00 | 137.00 | 125.00 | 97.00 | 110.00 | 144.00 | 122.00 | NA | 356.00 | 571.00 | 185.00 | 236.00 | 361.00 | |
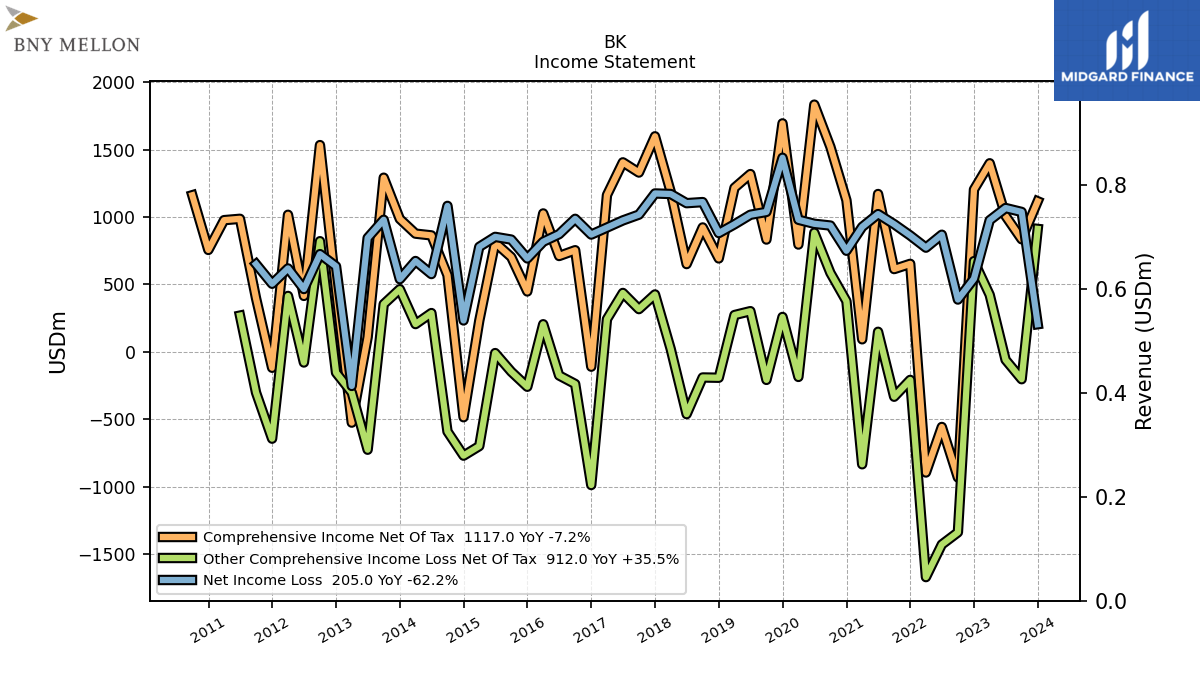
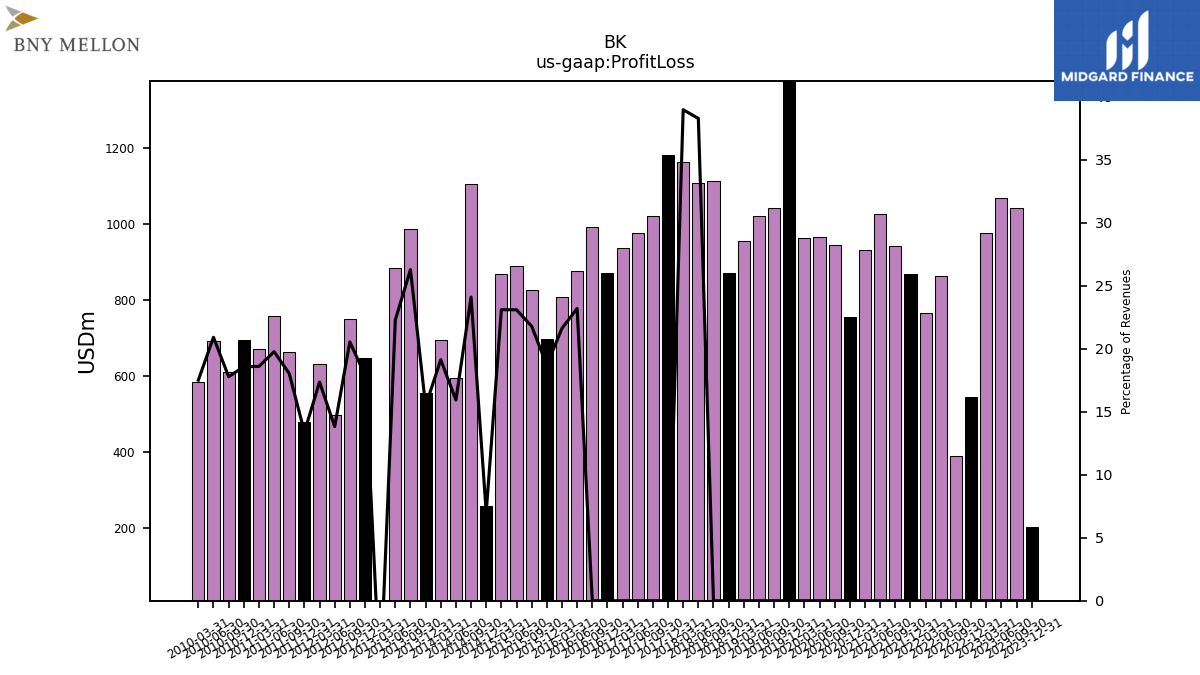
| Profit Loss | 203.00 | 1041.00 | 1068.00 | 976.00 | 543.00 | 388.00 | 864.00 | 765.00 | 869.00 | 943.00 | 1027.00 | 932.00 | 755.00 | 944.00 | 965.00 | 962.00 | 1041.00 | 1021.00 | |
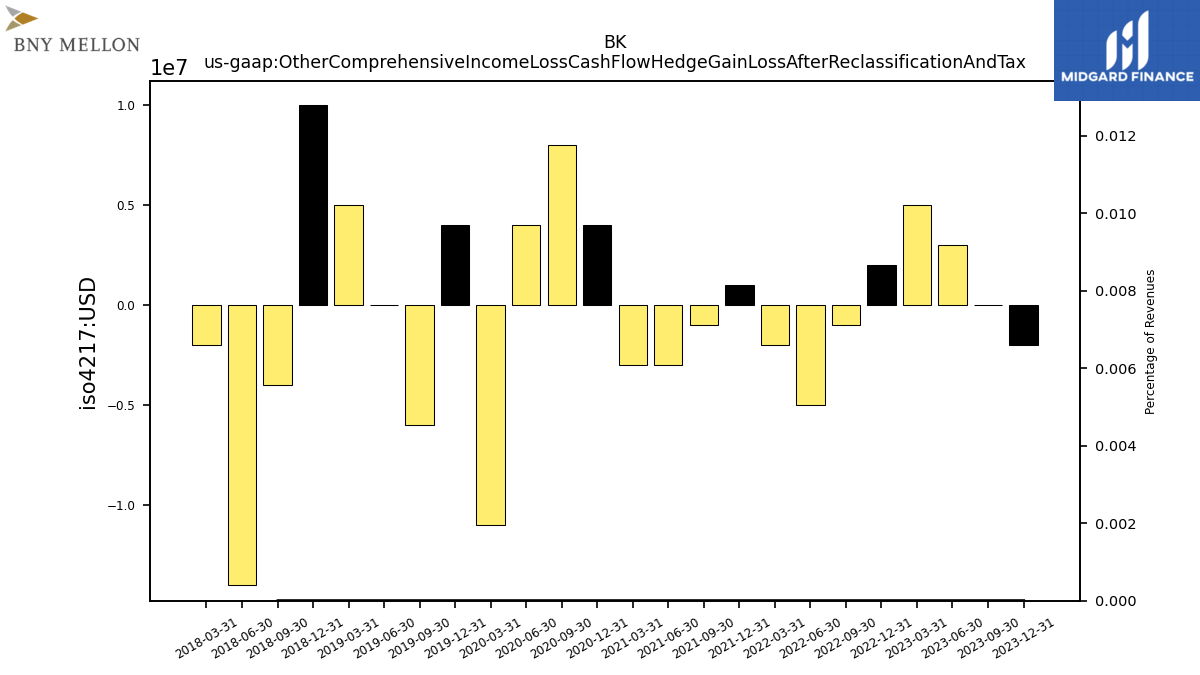
| Other Comprehensive Income Loss Cash Flow Hedge Gain Loss After Reclassification And Tax | -2.00 | 0.00 | 3.00 | 5.00 | 2.00 | -1.00 | -5.00 | -2.00 | 1.00 | -1.00 | -3.00 | -3.00 | 4.00 | 8.00 | 4.00 | -11.00 | -6.00 | 0.00 | |
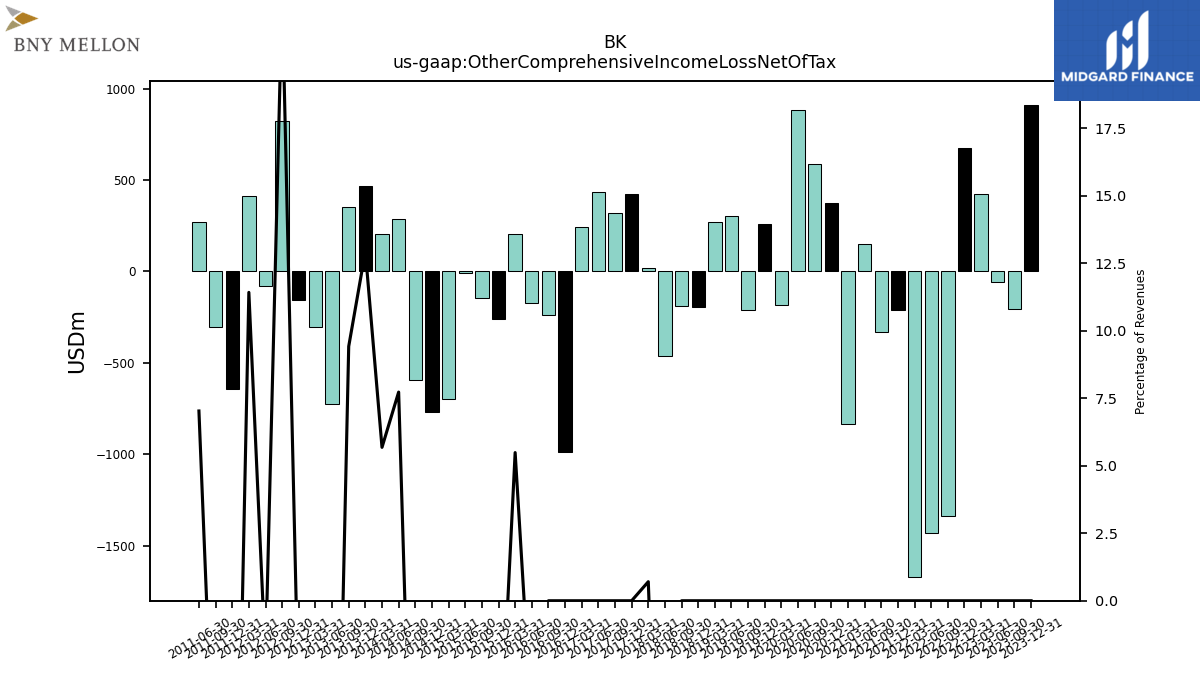
| Other Comprehensive Income Loss Net Of Tax | 912.00 | -203.00 | -59.00 | 423.00 | 673.00 | -1339.00 | -1429.00 | -1671.00 | -208.00 | -333.00 | 149.00 | -834.00 | 376.00 | 586.00 | 884.00 | -186.00 | -208.00 | 302.00 | |
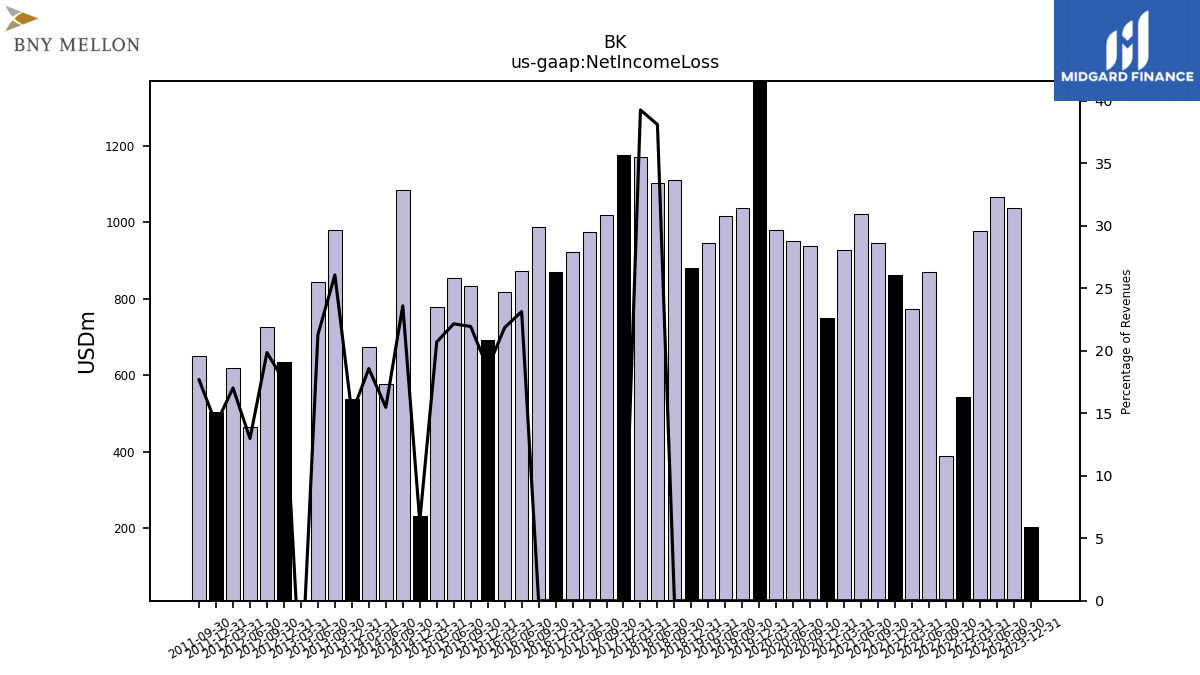
| Net Income Loss | 205.00 | 1038.00 | 1067.00 | 976.00 | 543.00 | 388.00 | 869.00 | 773.00 | 863.00 | 947.00 | 1022.00 | 927.00 | 750.00 | 937.00 | 950.00 | 980.00 | 1038.00 | 1017.00 | |
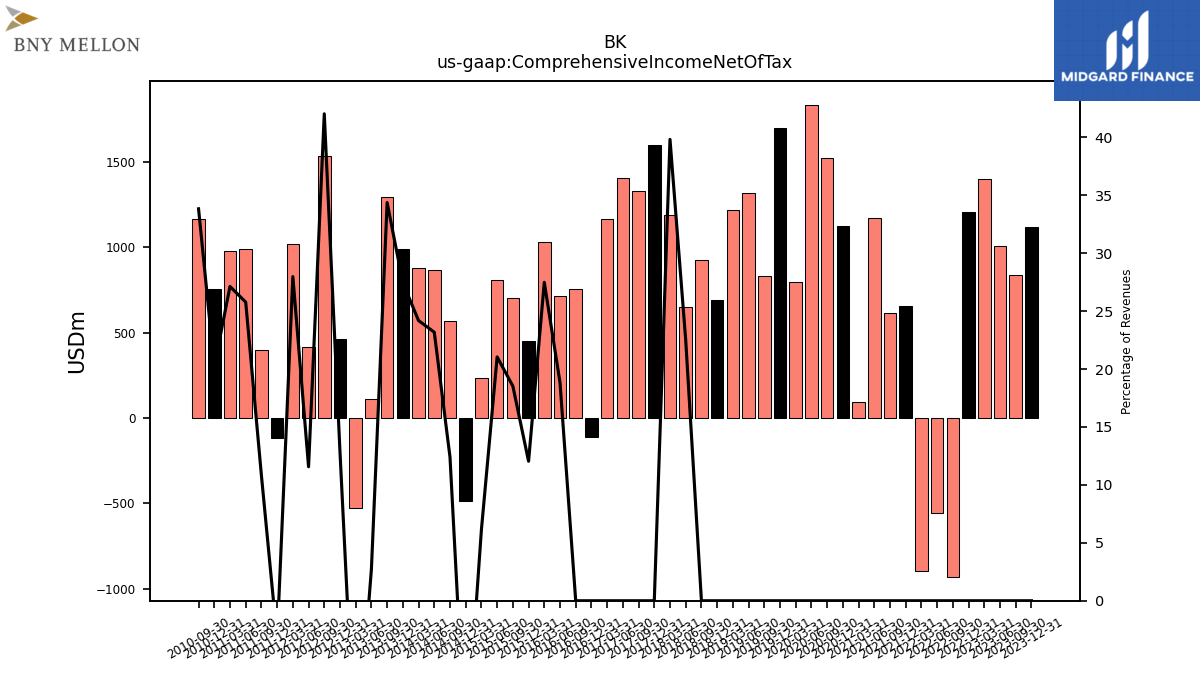
| Comprehensive Income Net Of Tax | 1117.00 | 835.00 | 1008.00 | 1399.00 | 1204.00 | -932.00 | -557.00 | -895.00 | 653.00 | 614.00 | 1171.00 | 93.00 | 1124.00 | 1521.00 | 1834.00 | 796.00 | 833.00 | 1319.00 | |
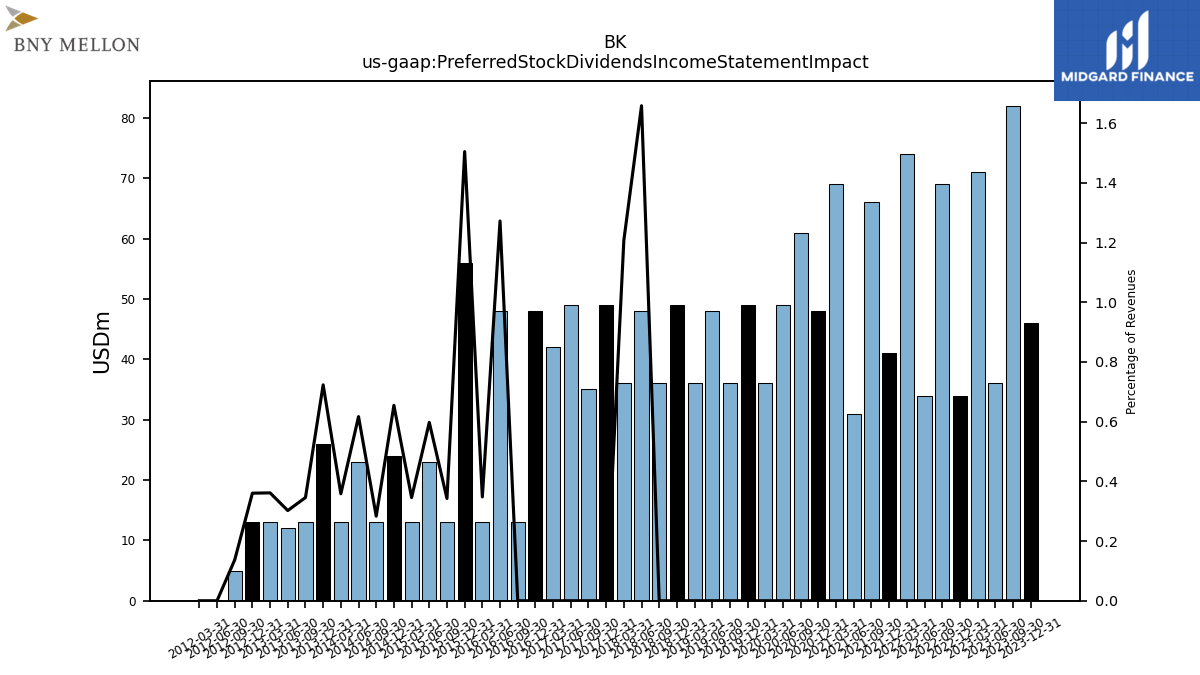
| Preferred Stock Dividends Income Statement Impact | 46.00 | 82.00 | 36.00 | 71.00 | 34.00 | 69.00 | 34.00 | 74.00 | 41.00 | 66.00 | 31.00 | 69.00 | 48.00 | 61.00 | 49.00 | 36.00 | 36.00 | 48.00 | |
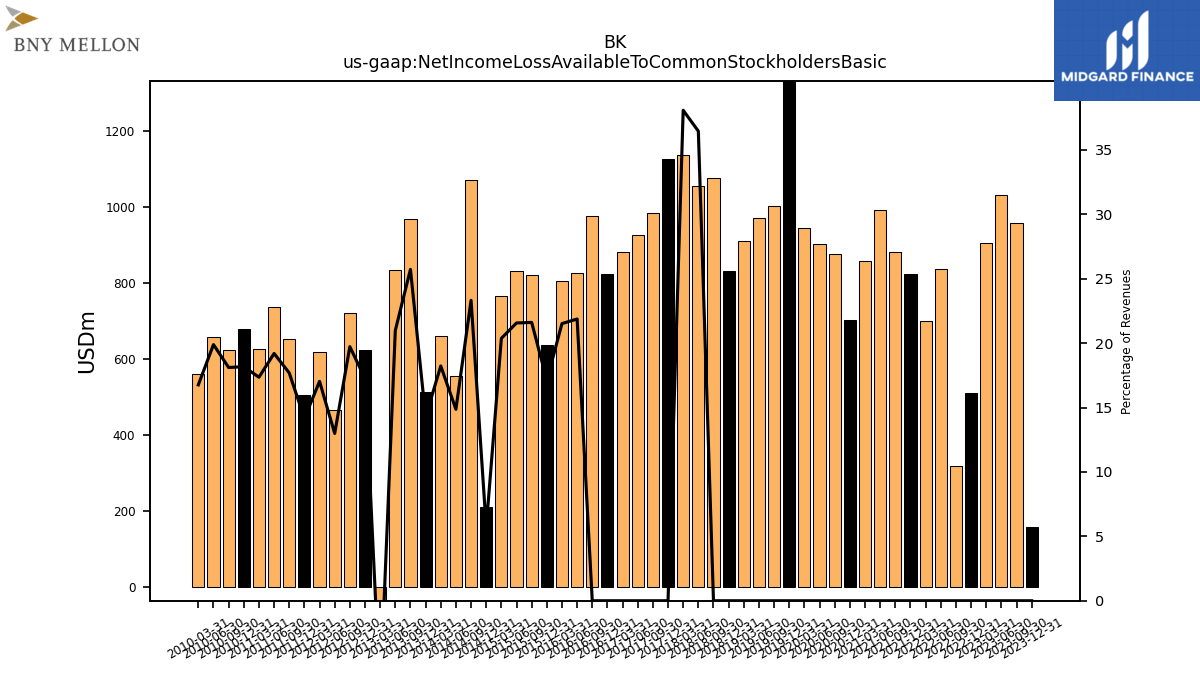
| Net Income Loss Available To Common Stockholders Basic | 159.00 | 956.00 | 1031.00 | 905.00 | 509.00 | 319.00 | 835.00 | 699.00 | 822.00 | 881.00 | 991.00 | 858.00 | 702.00 | 876.00 | 901.00 | 944.00 | 1002.00 | 969.00 | |
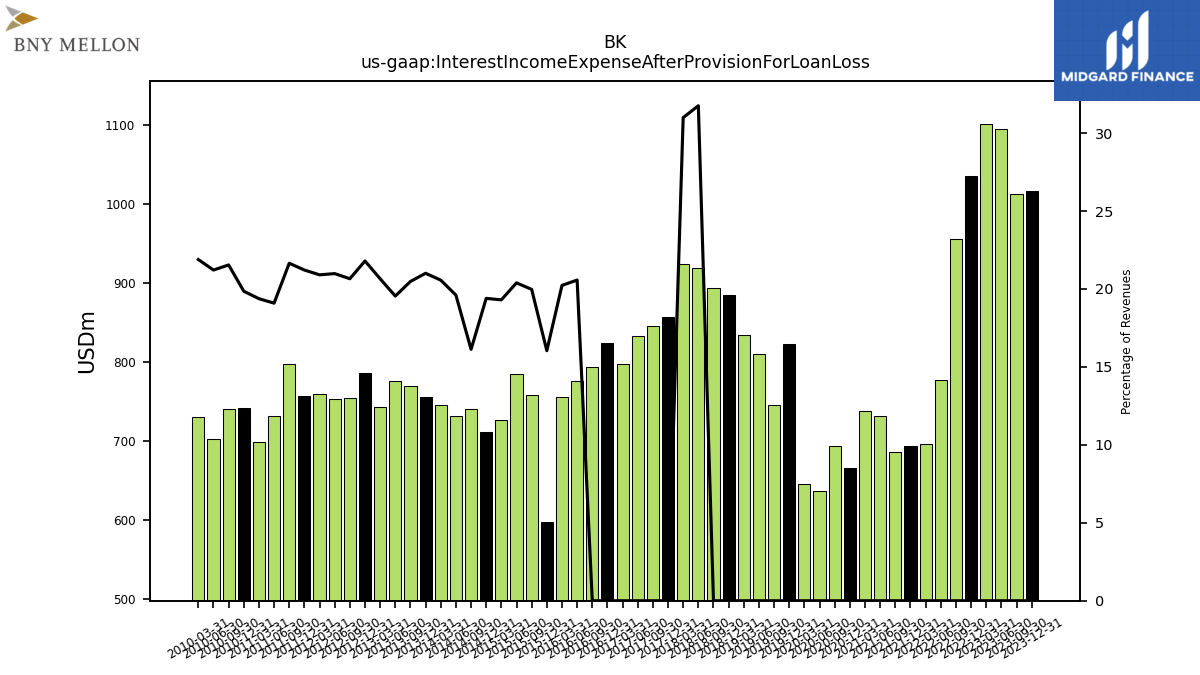
| Interest Income Expense After Provision For Loan Loss | 1017.00 | 1013.00 | 1095.00 | 1101.00 | 1036.00 | 956.00 | 777.00 | 696.00 | 694.00 | 686.00 | 731.00 | 738.00 | 665.00 | 694.00 | 637.00 | 645.00 | 746.00 | 810.00 | |
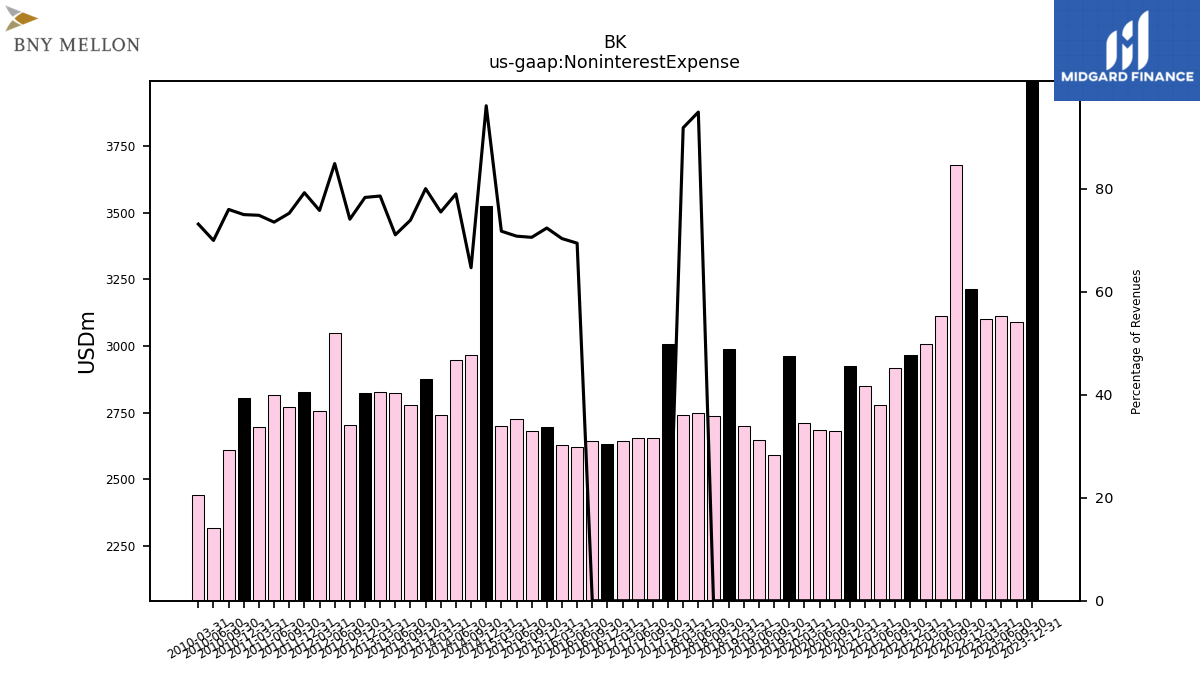
| Noninterest Expense | 3995.00 | 3089.00 | 3111.00 | 3100.00 | 3213.00 | 3679.00 | 3112.00 | 3006.00 | 2967.00 | 2918.00 | 2778.00 | 2851.00 | 2925.00 | 2681.00 | 2686.00 | 2712.00 | 2590.00 | 2647.00 | |
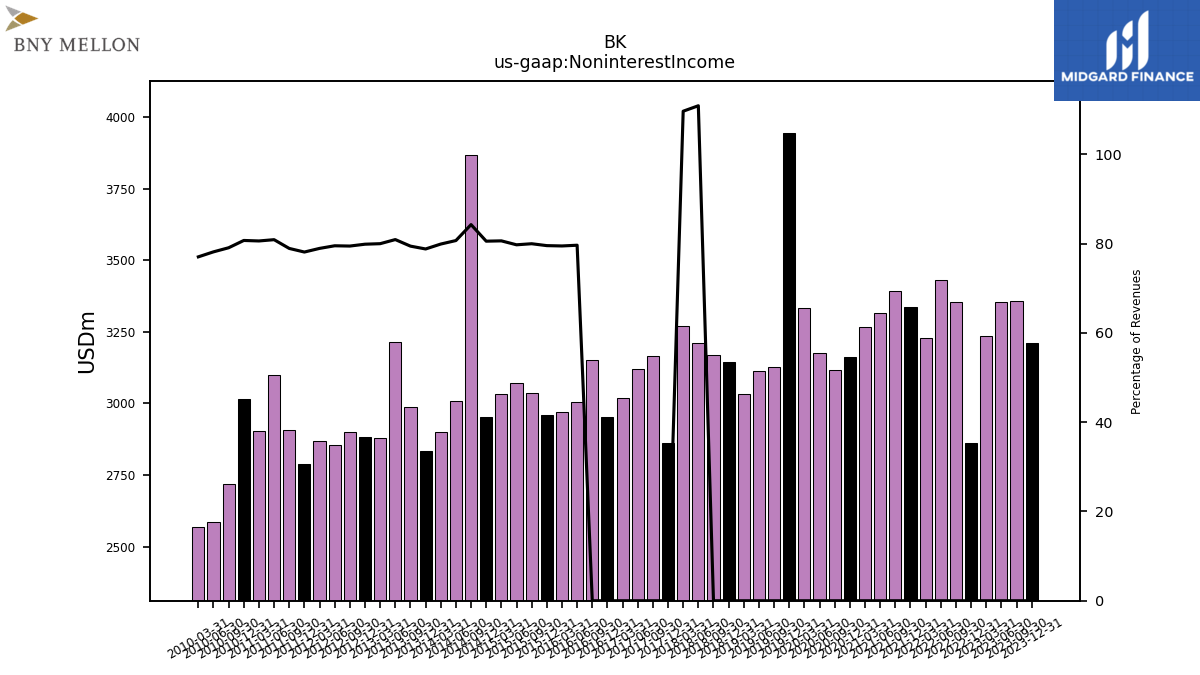
| Noninterest Income | 3210.00 | 3358.00 | 3354.00 | 3235.00 | 2862.00 | 3353.00 | 3430.00 | 3228.00 | 3338.00 | 3394.00 | 3315.00 | 3266.00 | 3163.00 | 3117.00 | 3176.00 | 3332.00 | 3128.00 | 3112.00 |
| 2023-12-31 | 2023-09-30 | 2023-06-30 | 2023-03-31 | 2022-12-31 | 2022-09-30 | 2022-06-30 | 2022-03-31 | 2021-12-31 | 2021-09-30 | 2021-06-30 | 2021-03-31 | 2020-12-31 | 2020-09-30 | 2020-06-30 | 2020-03-31 | 2019-09-30 | 2019-06-30 | ||
|---|---|---|---|---|---|---|---|---|---|---|---|---|---|---|---|---|---|---|---|
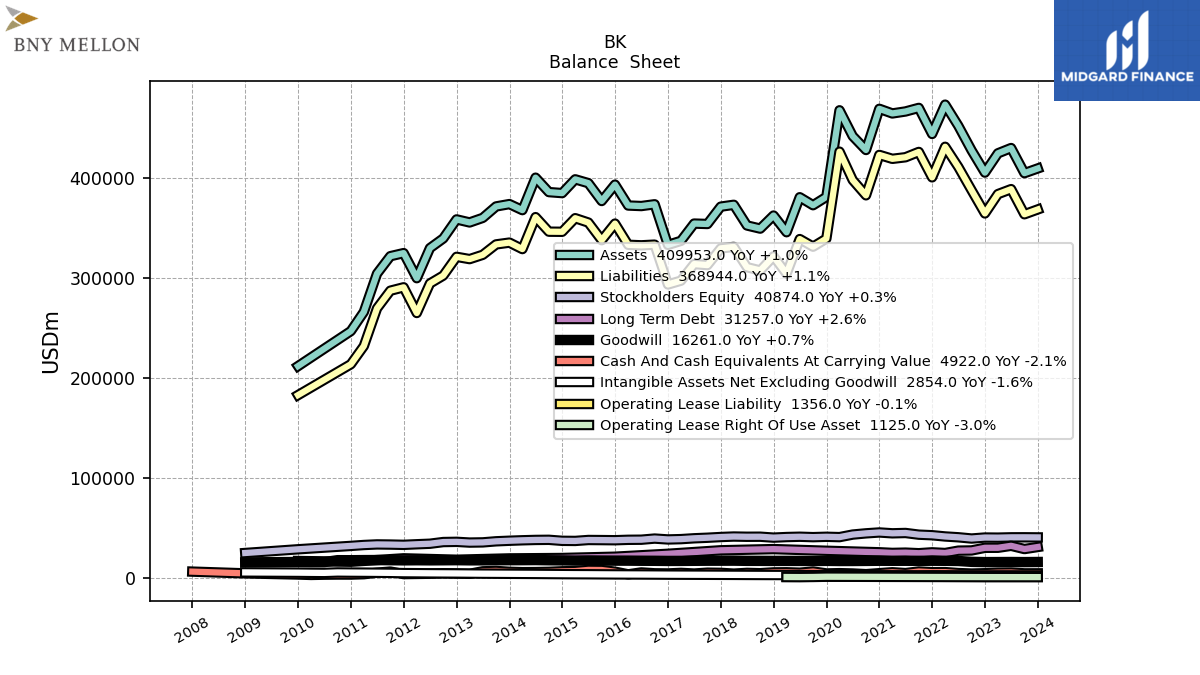
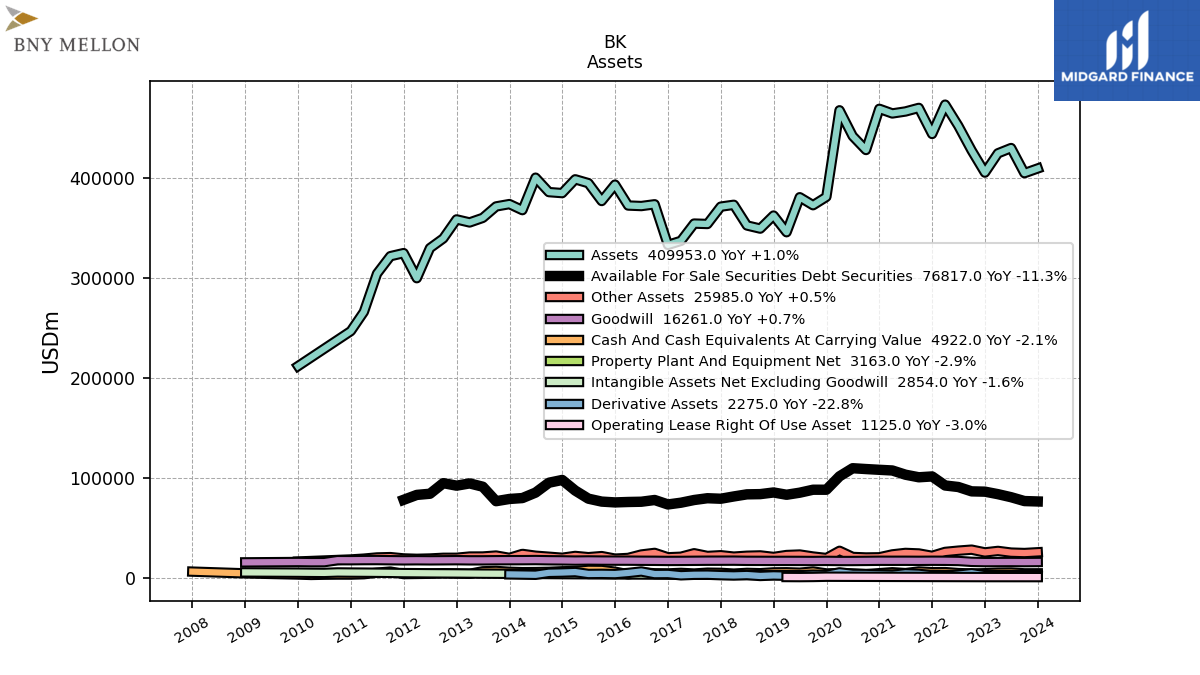
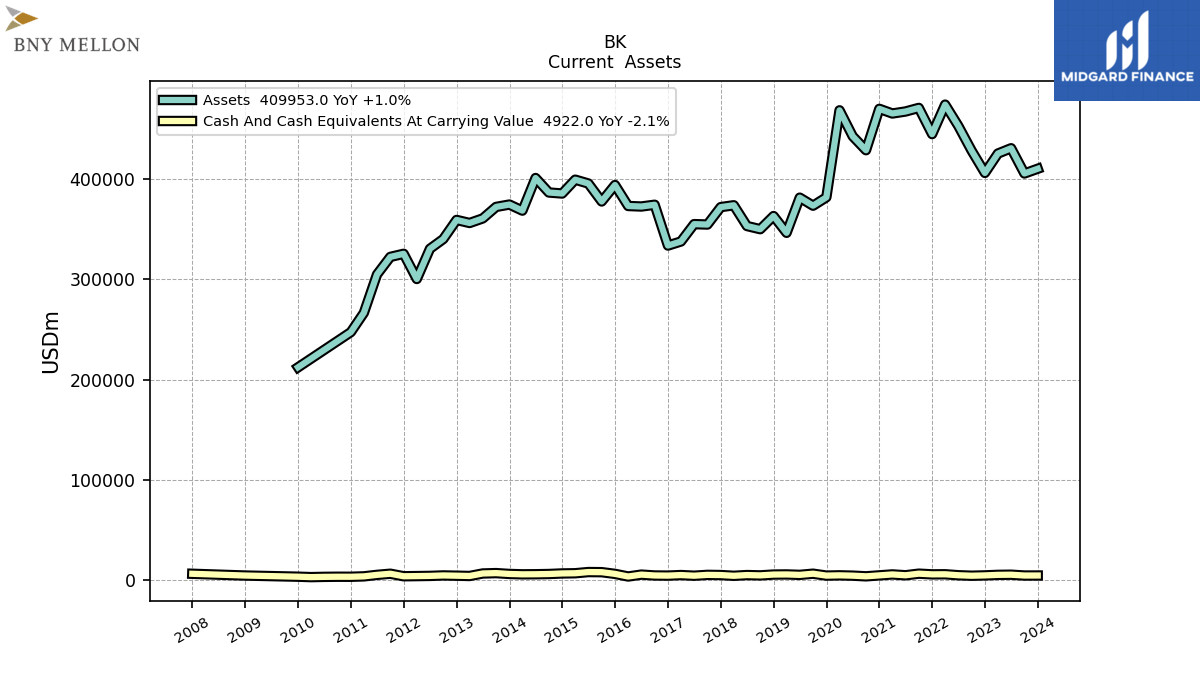
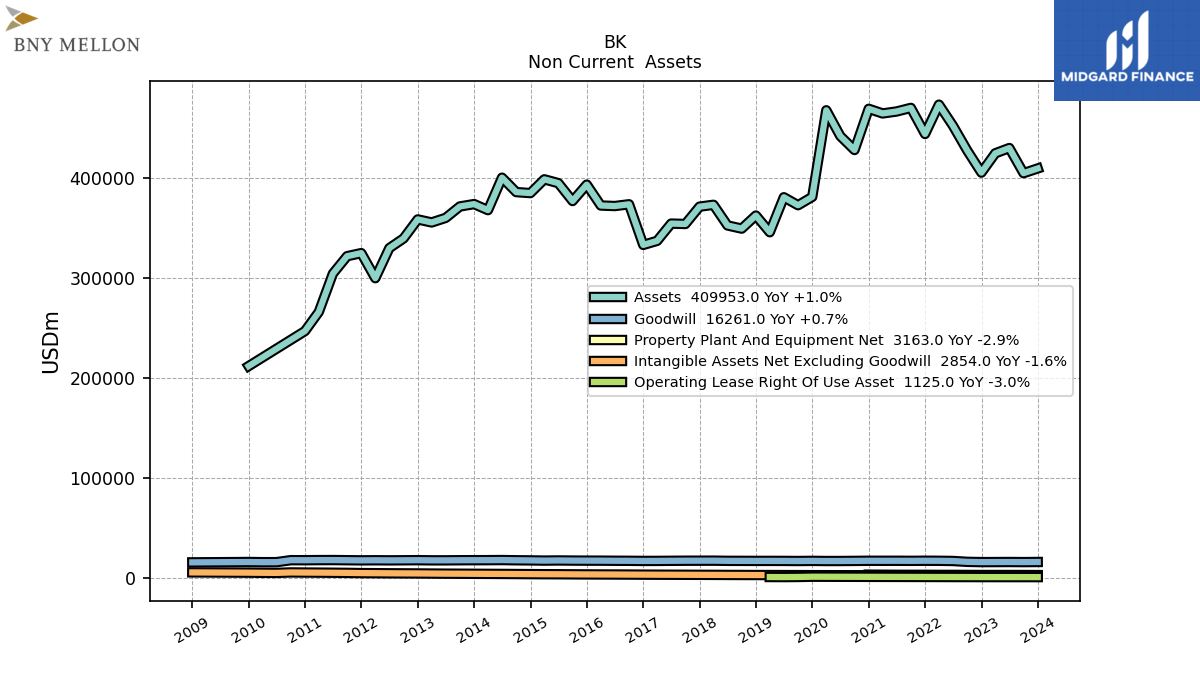
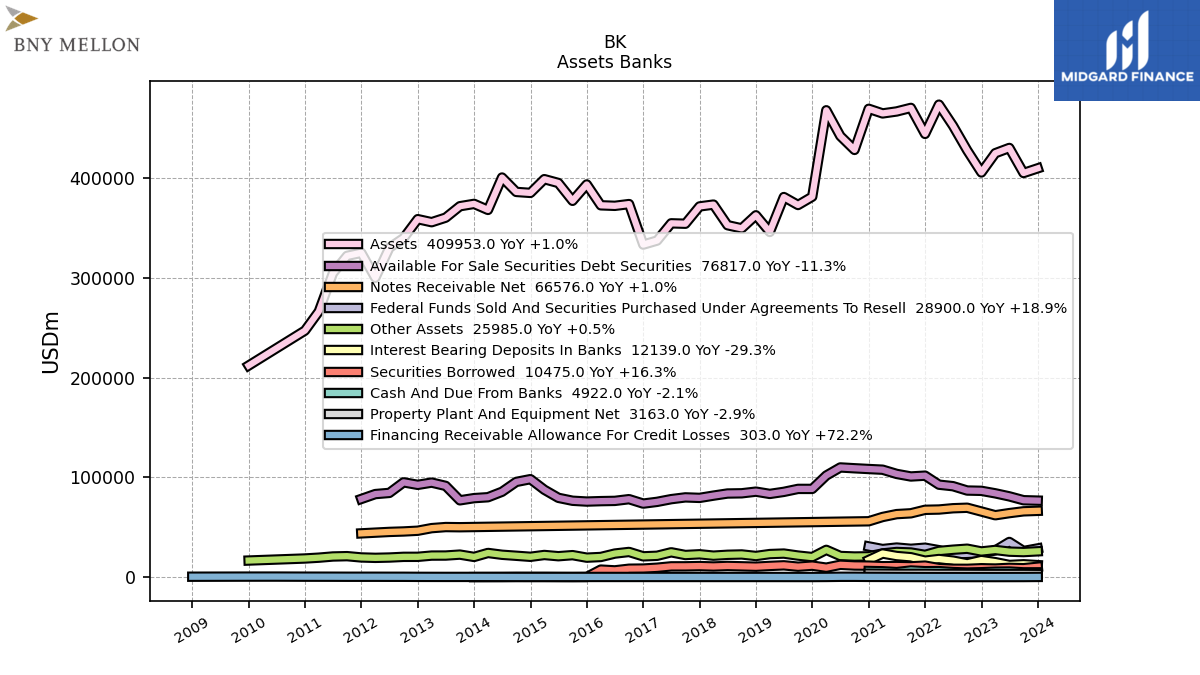
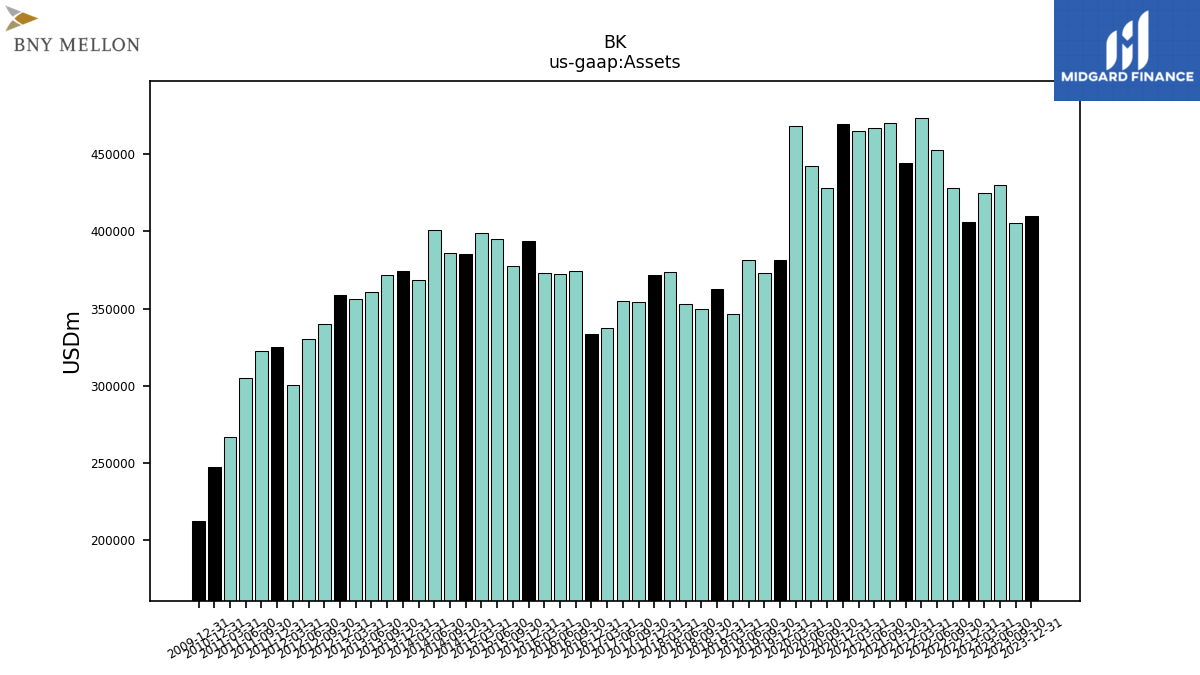
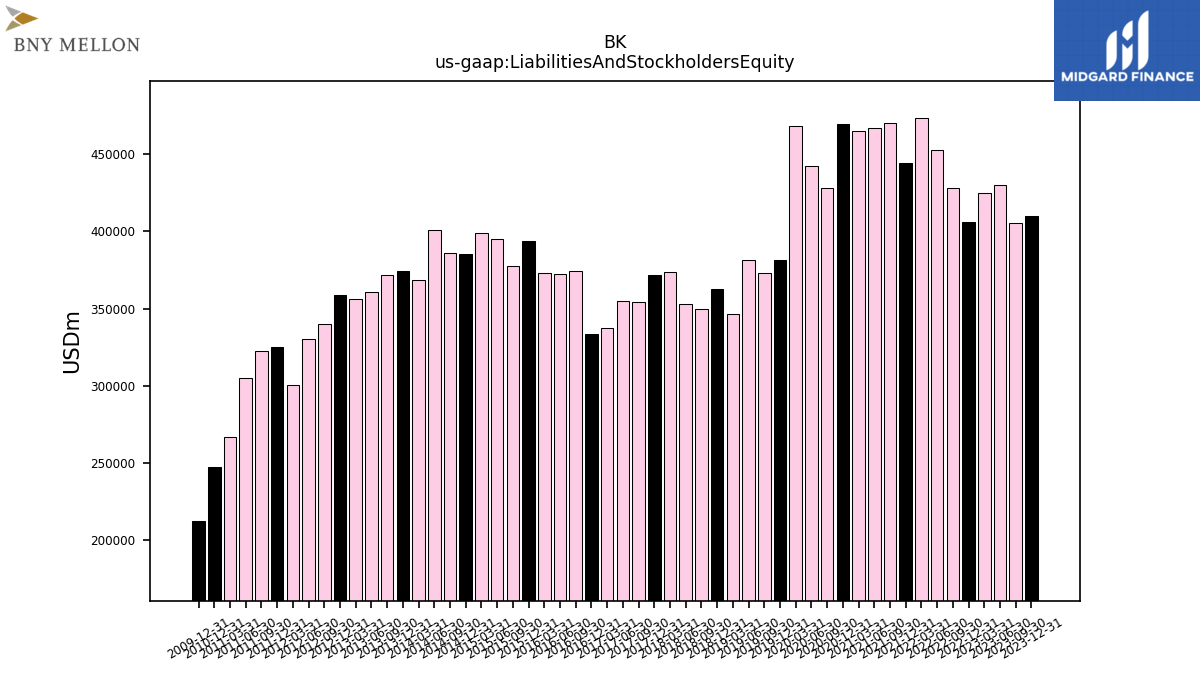
| Assets | 409953.00 | 405248.00 | 430382.00 | 425112.00 | 405783.00 | 427953.00 | 452621.00 | 473811.00 | 444438.00 | 470533.00 | 466963.00 | 464984.00 | 469633.00 | 428398.00 | 442316.00 | 468155.00 | 373168.00 | 381168.00 | |
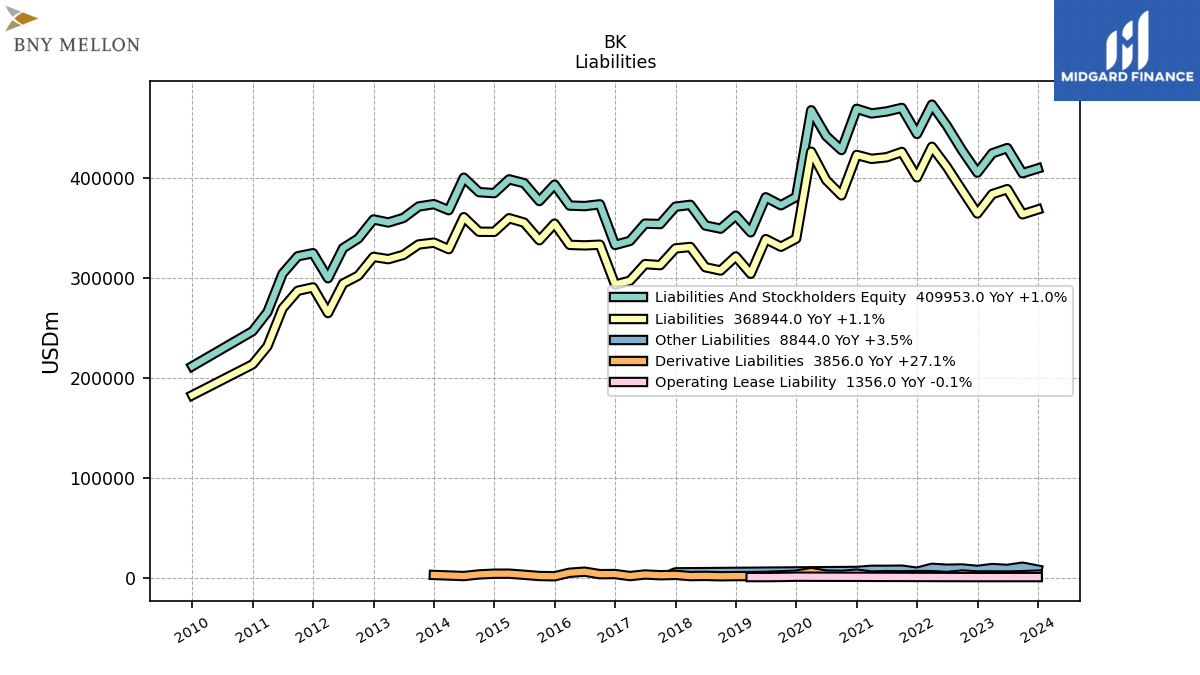
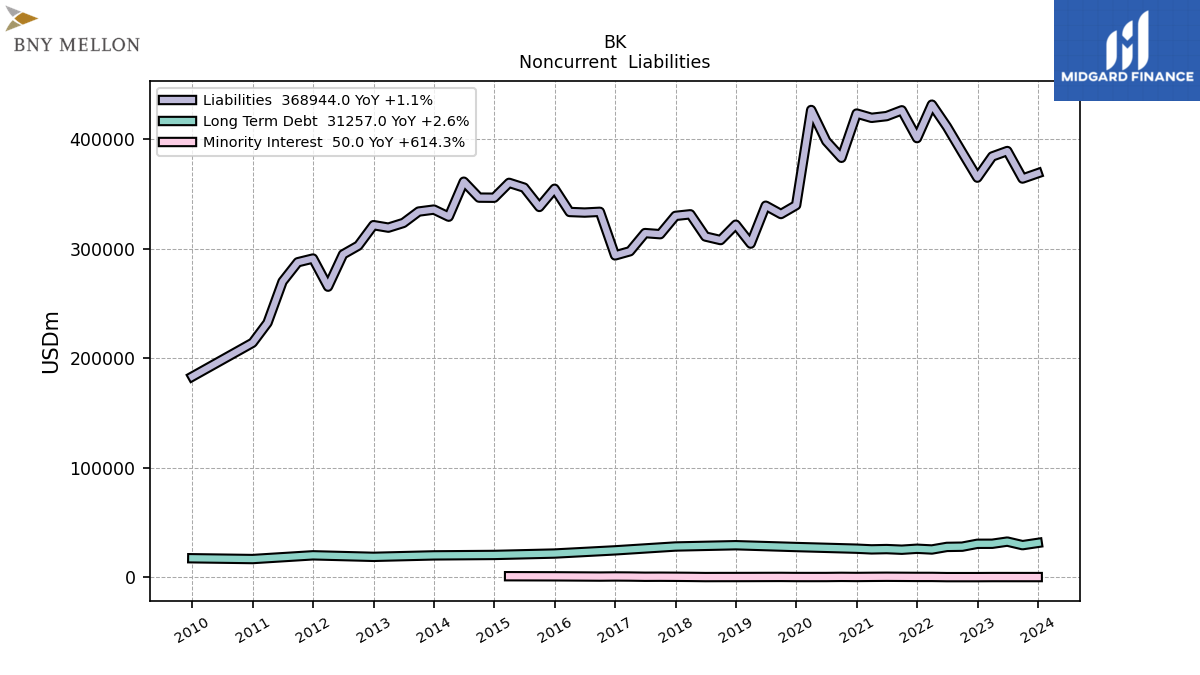
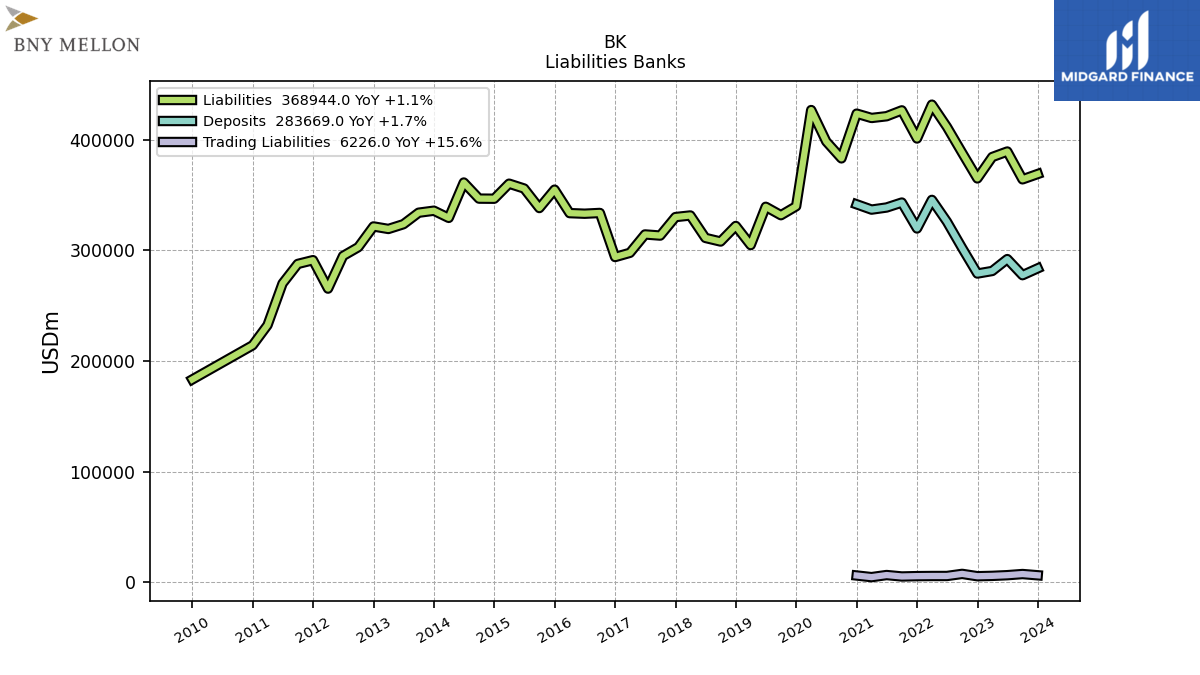
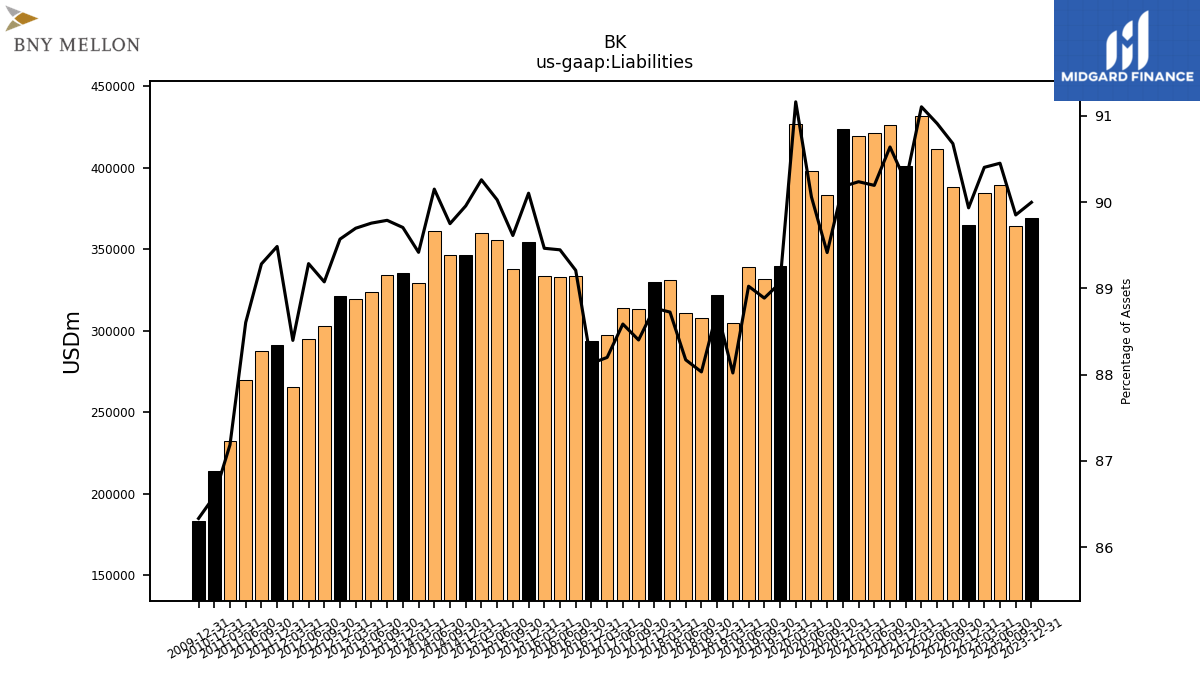
| Liabilities | 368944.00 | 364117.00 | 389280.00 | 384310.00 | 364933.00 | 388057.00 | 411476.00 | 431659.00 | 401047.00 | 426481.00 | 421169.00 | 419581.00 | 423513.00 | 383051.00 | 398350.00 | 426776.00 | 331698.00 | 339333.00 | |
| Liabilities And Stockholders Equity | 409953.00 | 405248.00 | 430382.00 | 425112.00 | 405783.00 | 427953.00 | 452621.00 | 473811.00 | 444438.00 | 470533.00 | 466963.00 | 464984.00 | 469633.00 | 428398.00 | 442316.00 | 468155.00 | 373168.00 | 381168.00 | |
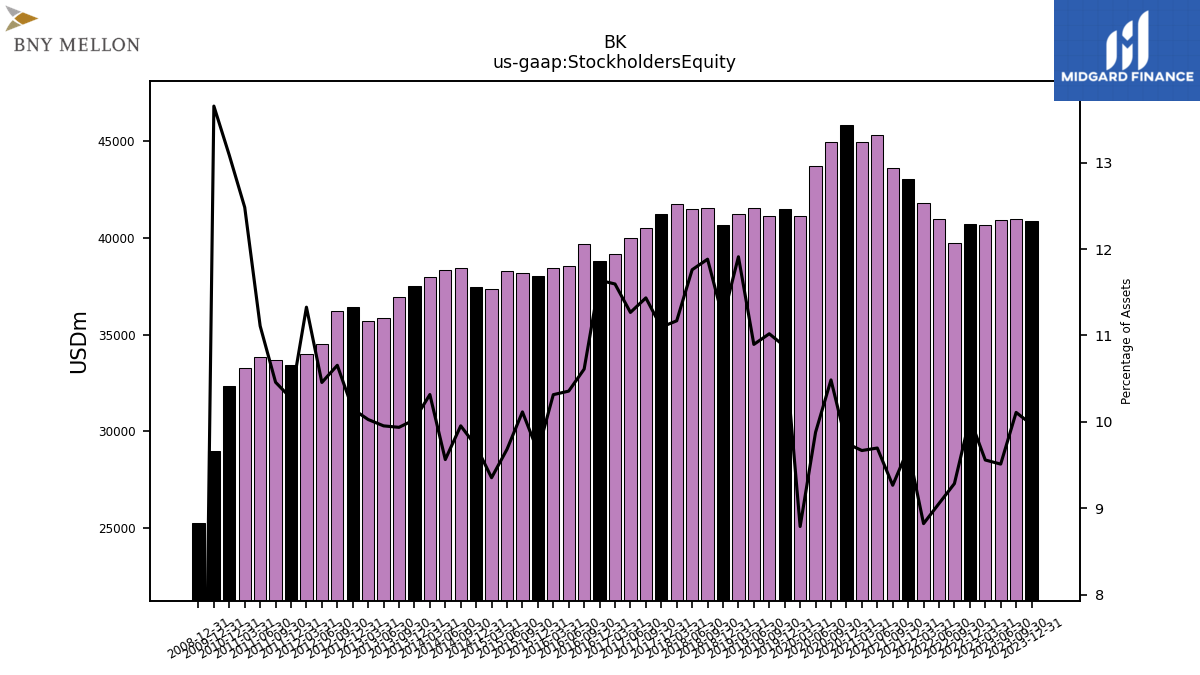
| Stockholders Equity | 40874.00 | 40966.00 | 40933.00 | 40634.00 | 40734.00 | 39737.00 | 40984.00 | 41799.00 | 43034.00 | 43601.00 | 45281.00 | 44954.00 | 45801.00 | 44917.00 | 43697.00 | 41145.00 | 41120.00 | 41533.00 | |
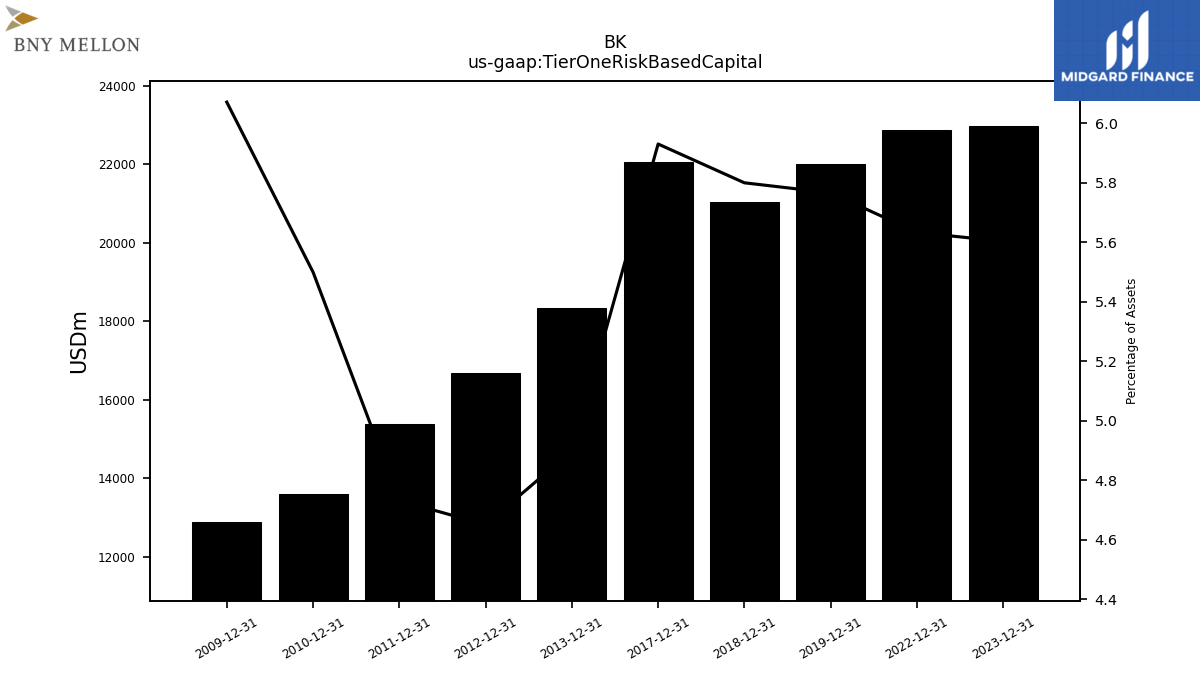
| Tier One Risk Based Capital | 22967.00 | NA | NA | NA | 22856.00 | NA | NA | NA | NA | NA | NA | NA | NA | NA | NA | NA | NA | NA |
| 2023-12-31 | 2023-09-30 | 2023-06-30 | 2023-03-31 | 2022-12-31 | 2022-09-30 | 2022-06-30 | 2022-03-31 | 2021-12-31 | 2021-09-30 | 2021-06-30 | 2021-03-31 | 2020-12-31 | 2020-09-30 | 2020-06-30 | 2020-03-31 | 2019-09-30 | 2019-06-30 | ||
|---|---|---|---|---|---|---|---|---|---|---|---|---|---|---|---|---|---|---|---|
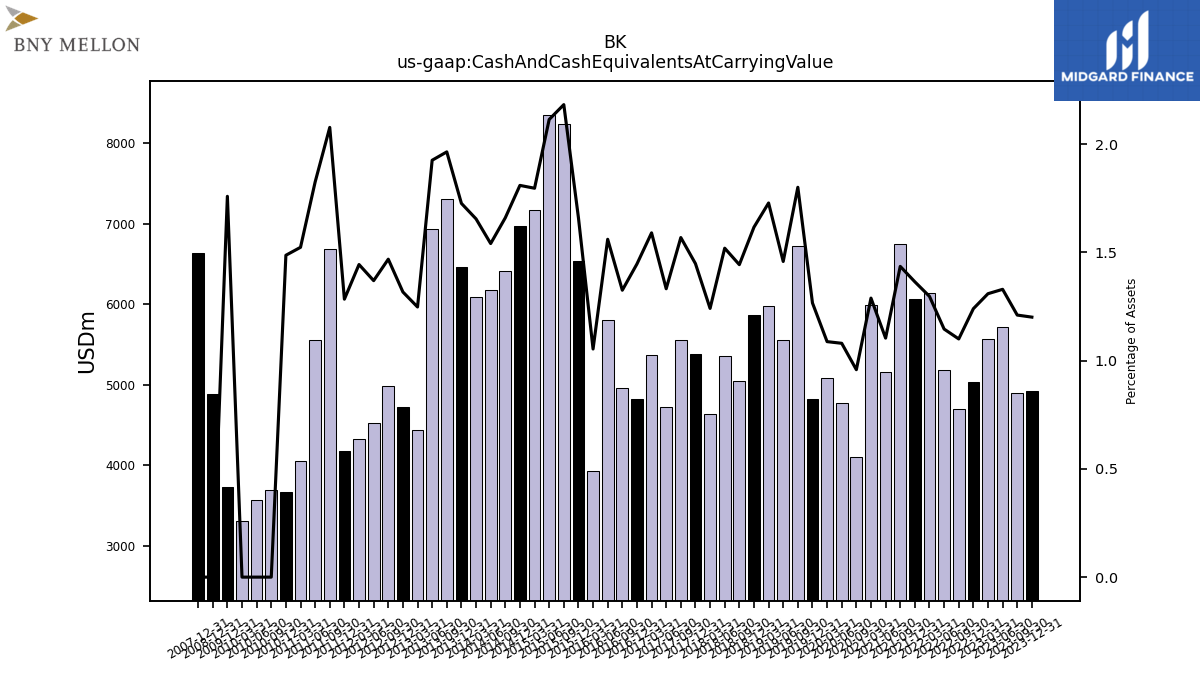
| Cash And Cash Equivalents At Carrying Value | 4922.00 | 4904.00 | 5720.00 | 5564.00 | 5030.00 | 4707.00 | 5185.00 | 6143.00 | 6061.00 | 6752.00 | 5154.00 | 5991.00 | NA | 4104.00 | 4776.00 | 5091.00 | 6718.00 | 5556.00 | |
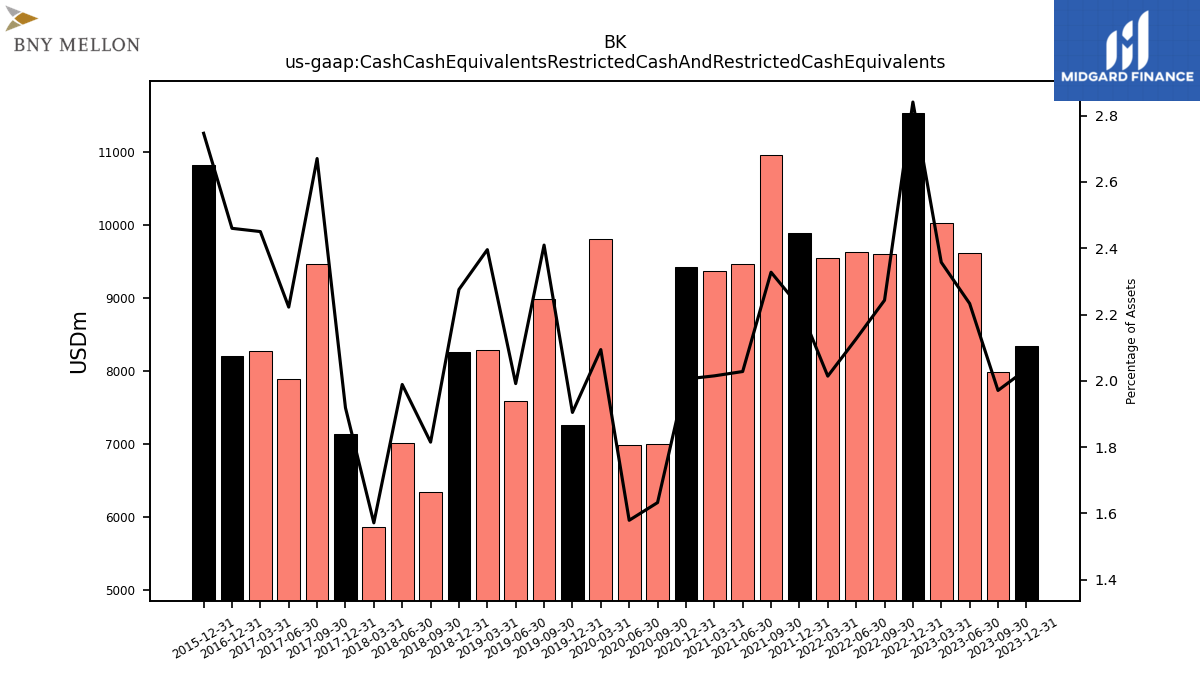
| Cash Cash Equivalents Restricted Cash And Restricted Cash Equivalents | 8342.00 | 7988.00 | 9612.00 | 10023.00 | 11529.00 | 9600.00 | 9626.00 | 9544.00 | 9883.00 | 10953.00 | 9471.00 | 9370.00 | 9419.00 | 6995.00 | 6986.00 | 9805.00 | 8992.00 | 7592.00 | |
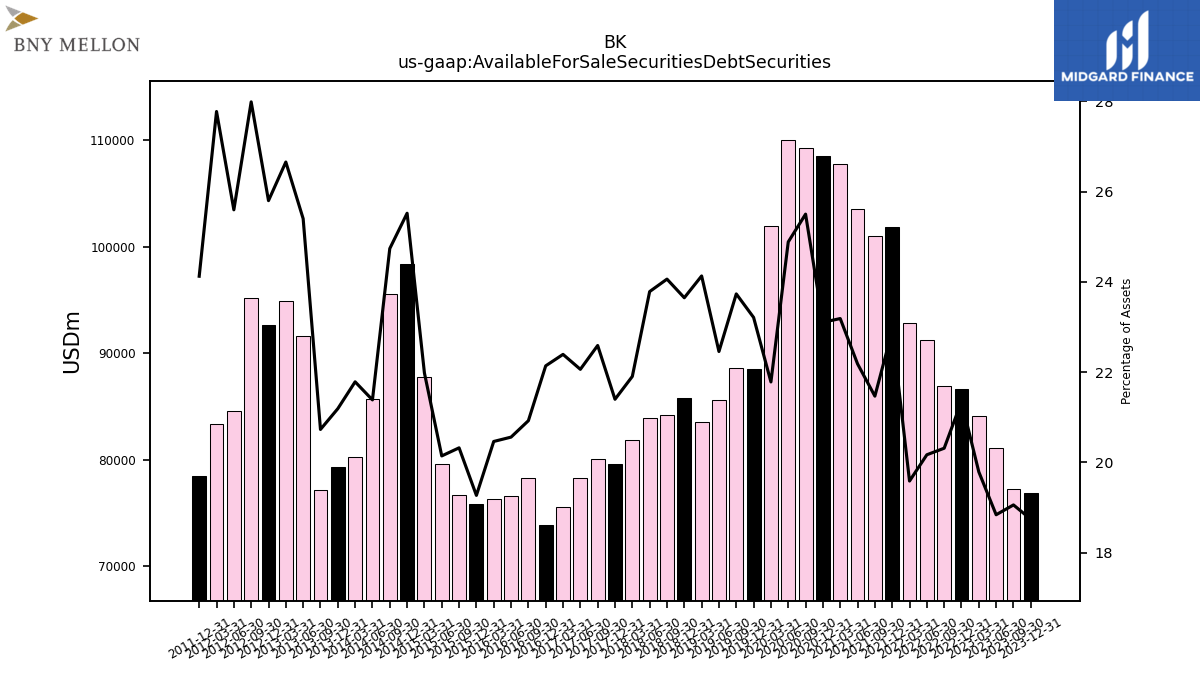
| Available For Sale Securities Debt Securities | 76817.00 | 77218.00 | 81071.00 | 84117.00 | 86622.00 | 86924.00 | 91278.00 | 92794.00 | 101839.00 | 101007.00 | 103581.00 | 107812.00 | 108495.00 | 109243.00 | 110067.00 | 101968.00 | 88562.00 | 85593.00 |
| 2023-12-31 | 2023-09-30 | 2023-06-30 | 2023-03-31 | 2022-12-31 | 2022-09-30 | 2022-06-30 | 2022-03-31 | 2021-12-31 | 2021-09-30 | 2021-06-30 | 2021-03-31 | 2020-12-31 | 2020-09-30 | 2020-06-30 | 2020-03-31 | 2019-09-30 | 2019-06-30 | ||
|---|---|---|---|---|---|---|---|---|---|---|---|---|---|---|---|---|---|---|---|
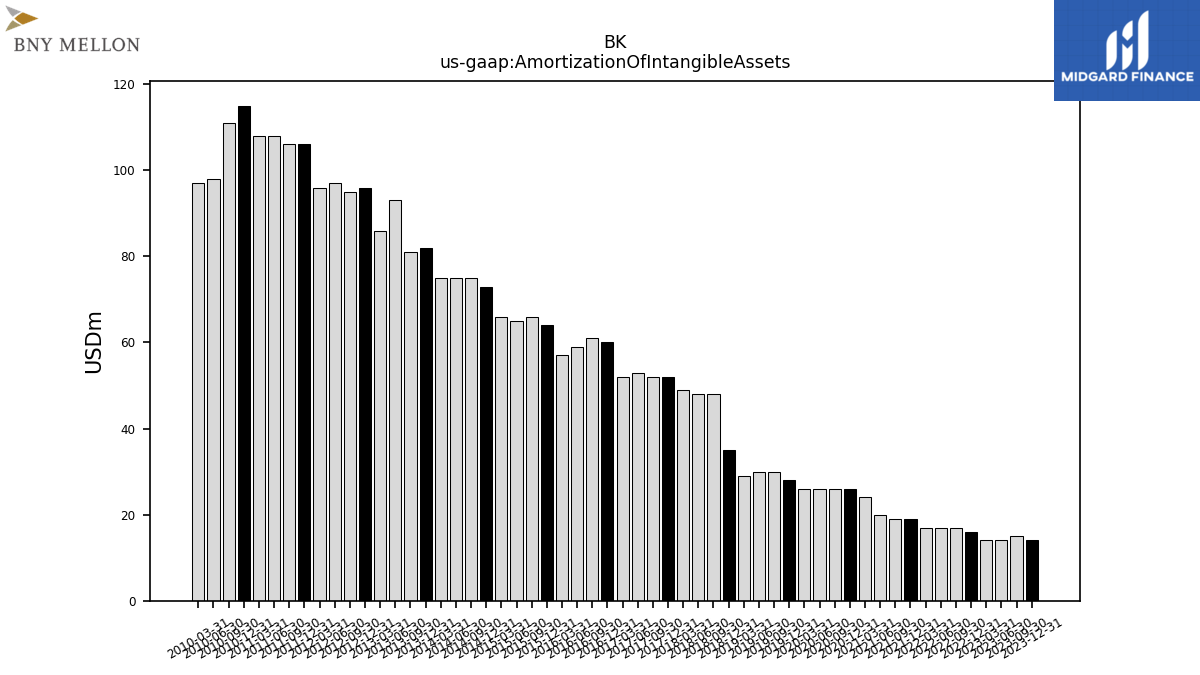
| Amortization Of Intangible Assets | 14.00 | 15.00 | 14.00 | 14.00 | 16.00 | 17.00 | 17.00 | 17.00 | 19.00 | 19.00 | 20.00 | 24.00 | 26.00 | 26.00 | 26.00 | 26.00 | 30.00 | 30.00 | |
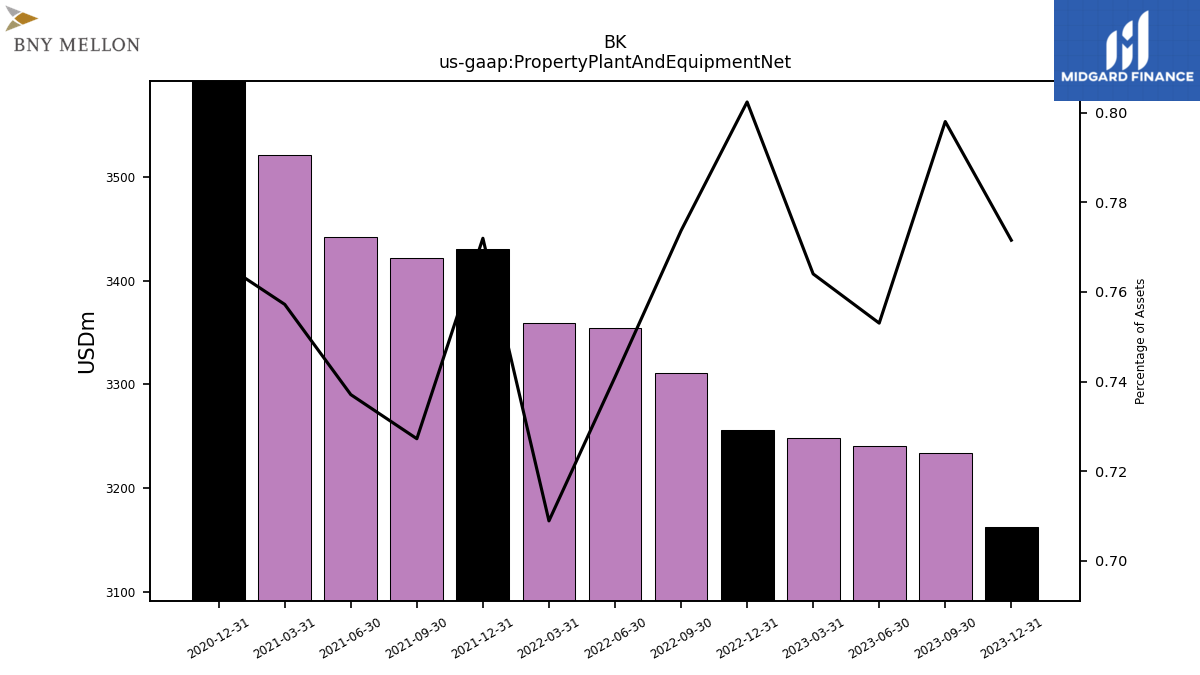
| Property Plant And Equipment Net | 3163.00 | 3234.00 | 3241.00 | 3248.00 | 3256.00 | 3311.00 | 3354.00 | 3359.00 | 3431.00 | 3422.00 | 3442.00 | 3521.00 | 3602.00 | NA | NA | NA | NA | NA | |
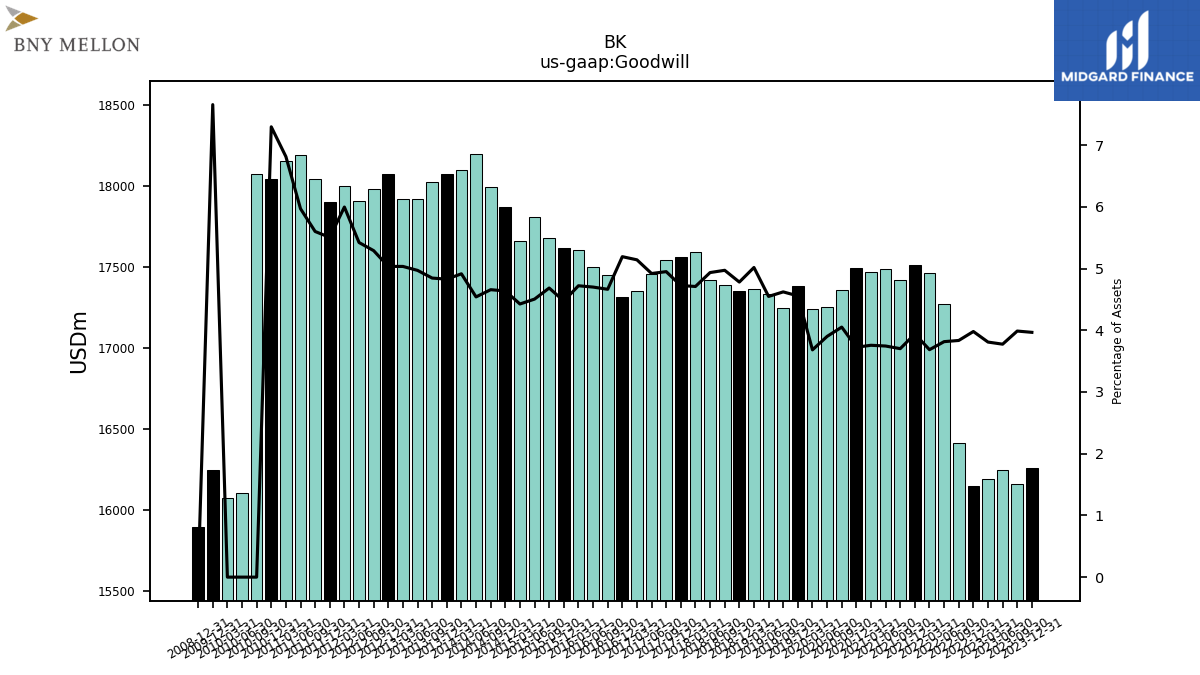
| Goodwill | 16261.00 | 16159.00 | 16246.00 | 16192.00 | 16150.00 | 16412.00 | 17271.00 | 17462.00 | 17512.00 | 17420.00 | 17487.00 | 17469.00 | 17496.00 | 17357.00 | 17253.00 | 17240.00 | 17248.00 | 17337.00 | |
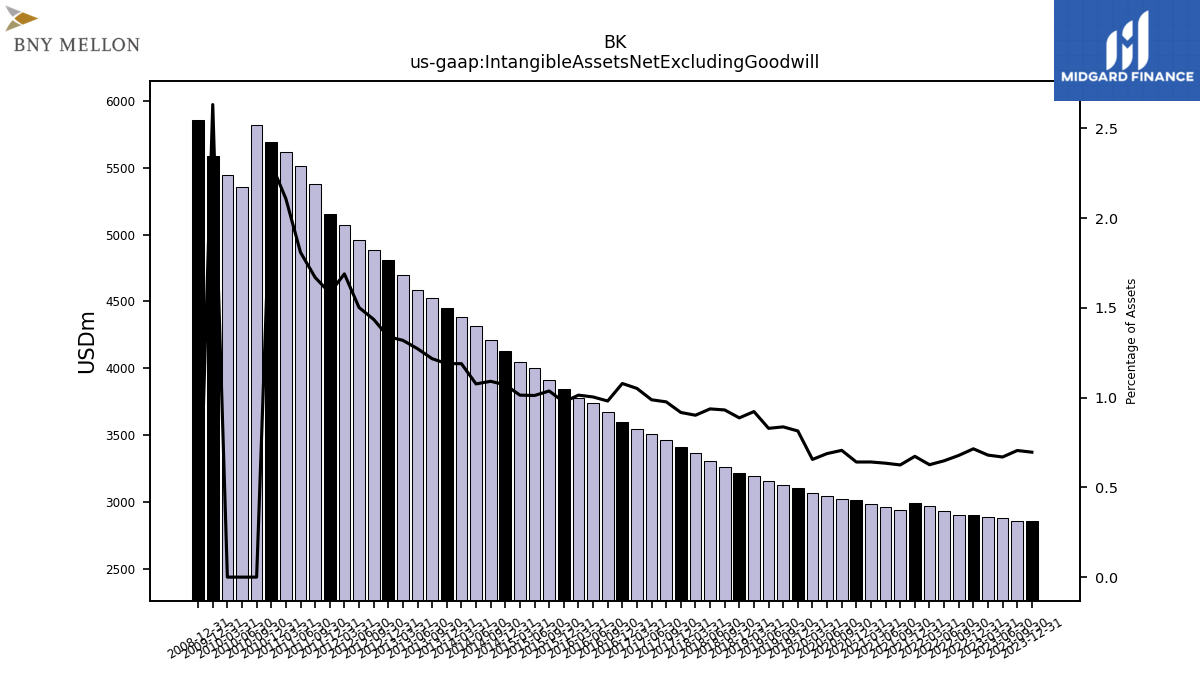
| Intangible Assets Net Excluding Goodwill | 2854.00 | 2859.00 | 2881.00 | 2890.00 | 2901.00 | 2902.00 | 2934.00 | 2968.00 | 2991.00 | 2941.00 | 2964.00 | 2983.00 | 3012.00 | 3026.00 | 3045.00 | 3070.00 | 3124.00 | 3160.00 | |
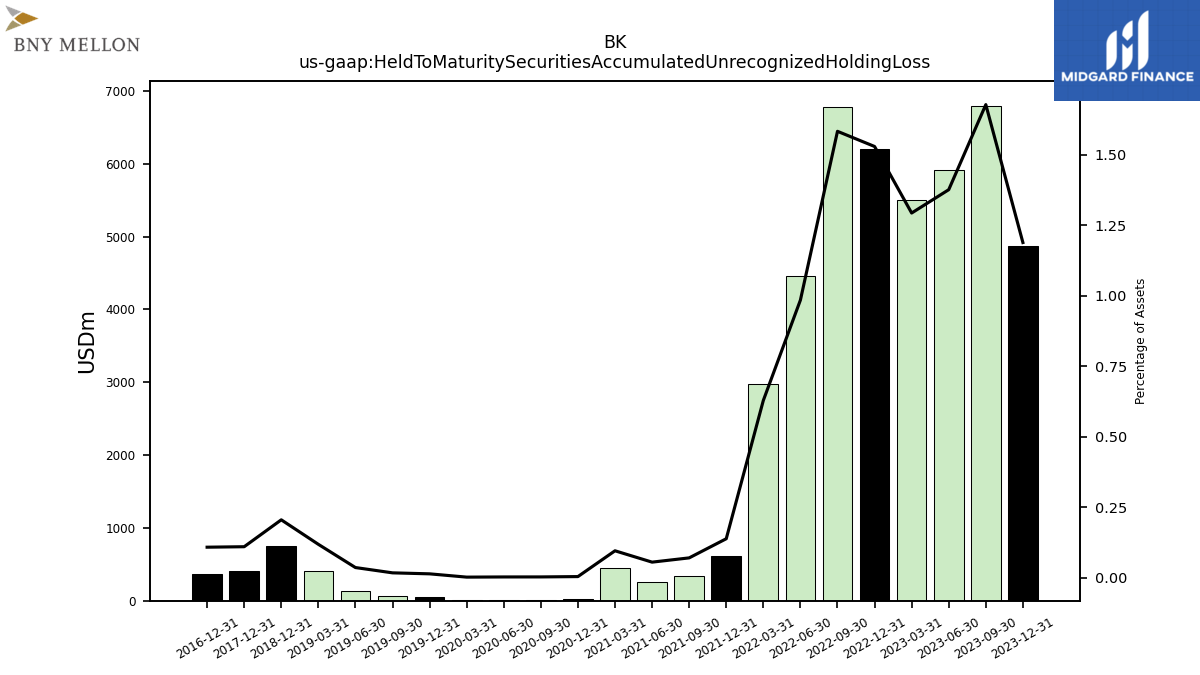
| Held To Maturity Securities Accumulated Unrecognized Holding Loss | 4873.00 | 6798.00 | 5922.00 | 5498.00 | 6205.00 | 6774.00 | 4457.00 | 2980.00 | 617.00 | 334.00 | 261.00 | 447.00 | 22.00 | 15.00 | 15.00 | 13.00 | 67.00 | 140.00 | |
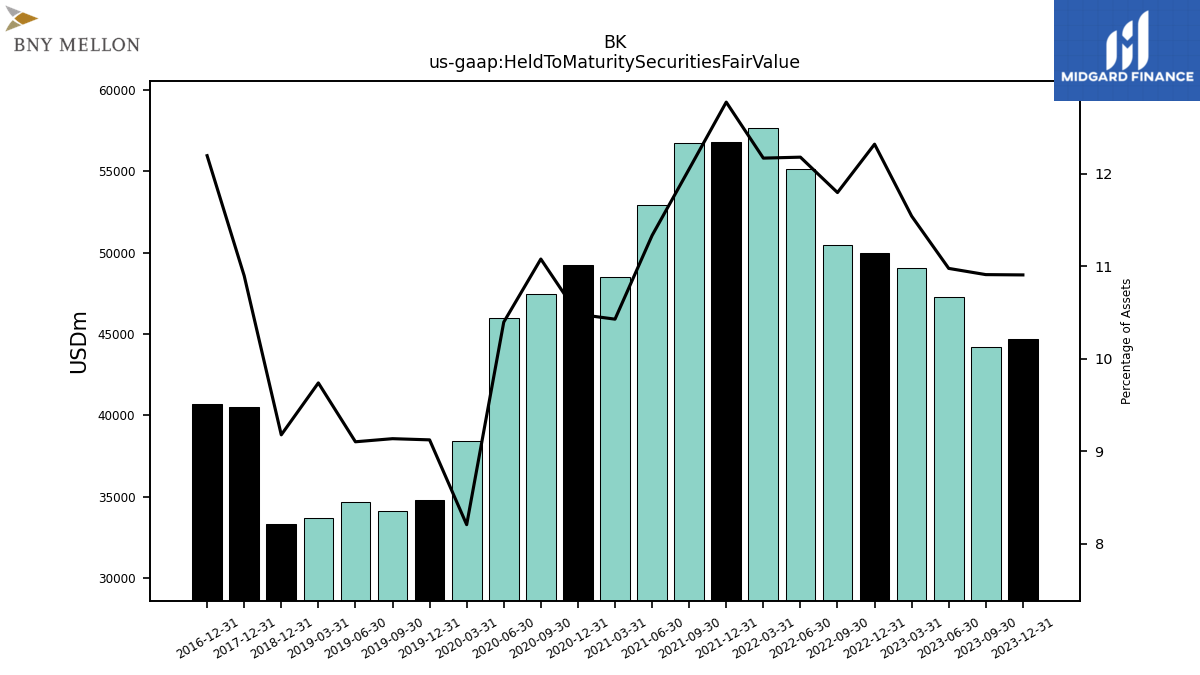
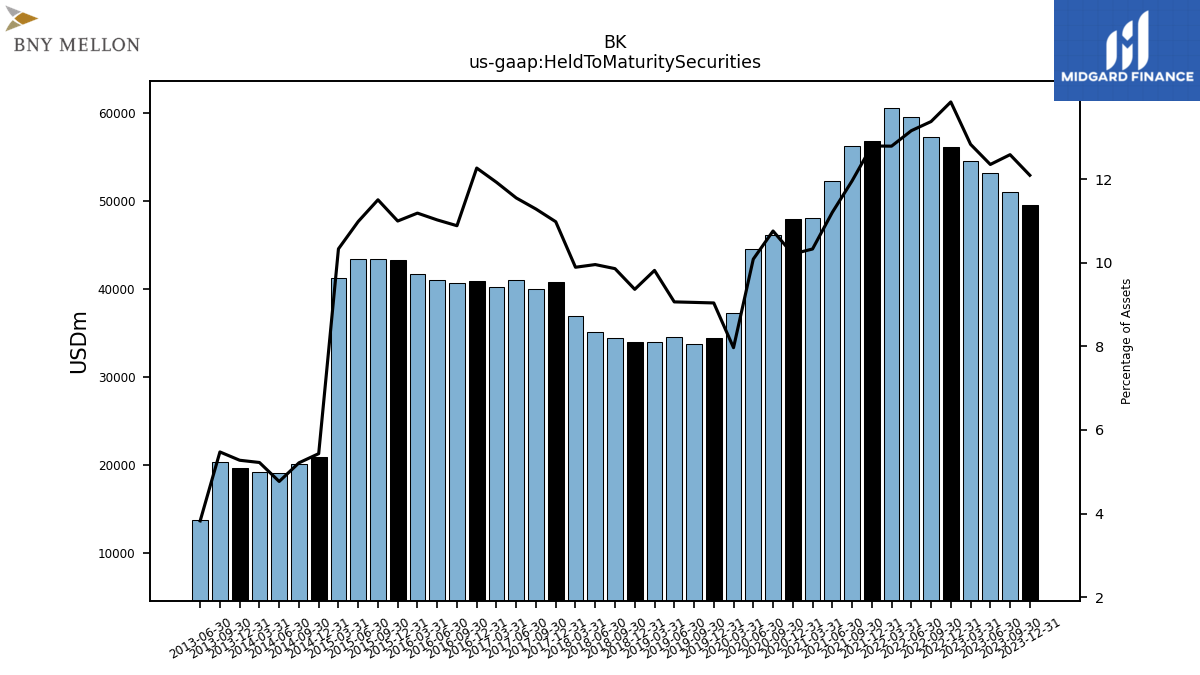
| Held To Maturity Securities Fair Value | 44711.00 | 44211.00 | 47242.00 | 49067.00 | 49992.00 | 50485.00 | 55127.00 | 57659.00 | 56775.00 | 56708.00 | 52919.00 | 48489.00 | 49224.00 | 47458.00 | 45983.00 | 38418.00 | 34092.00 | 34695.00 | |
| Held To Maturity Securities | 49578.00 | 51007.00 | 53162.00 | 54561.00 | 56194.00 | 57257.00 | 59566.00 | 60602.00 | 56866.00 | 56267.00 | 52325.00 | 48032.00 | 47946.00 | 46096.00 | 44615.00 | 37305.00 | 33778.00 | 34549.00 | |
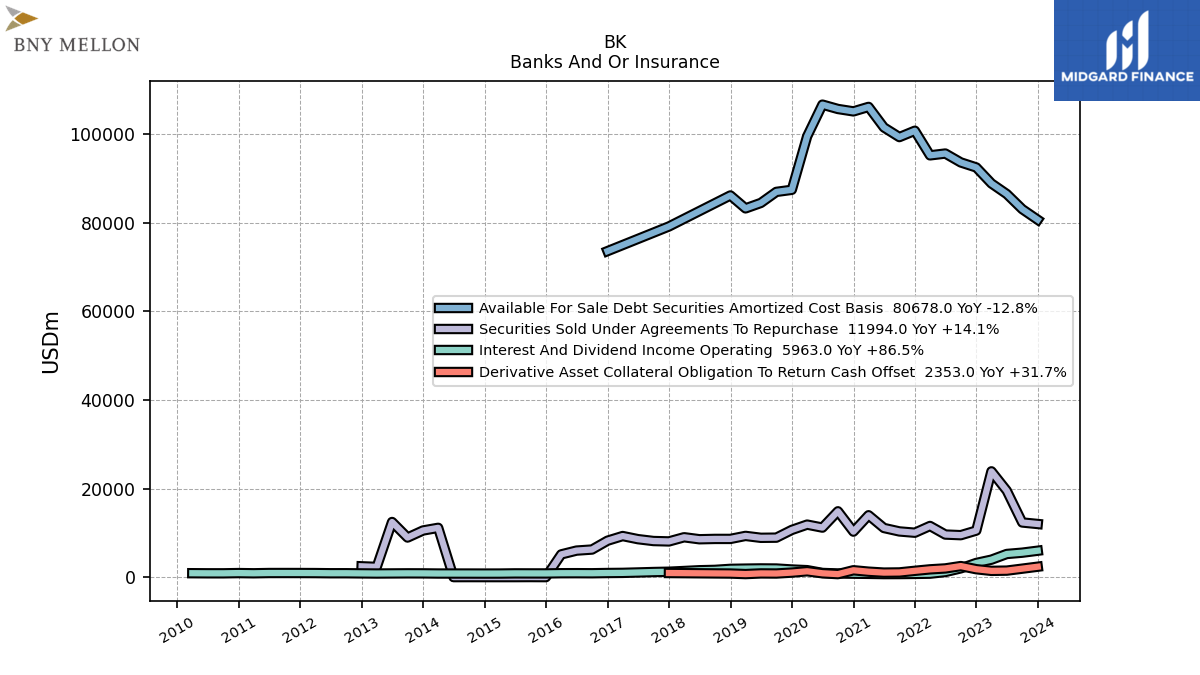
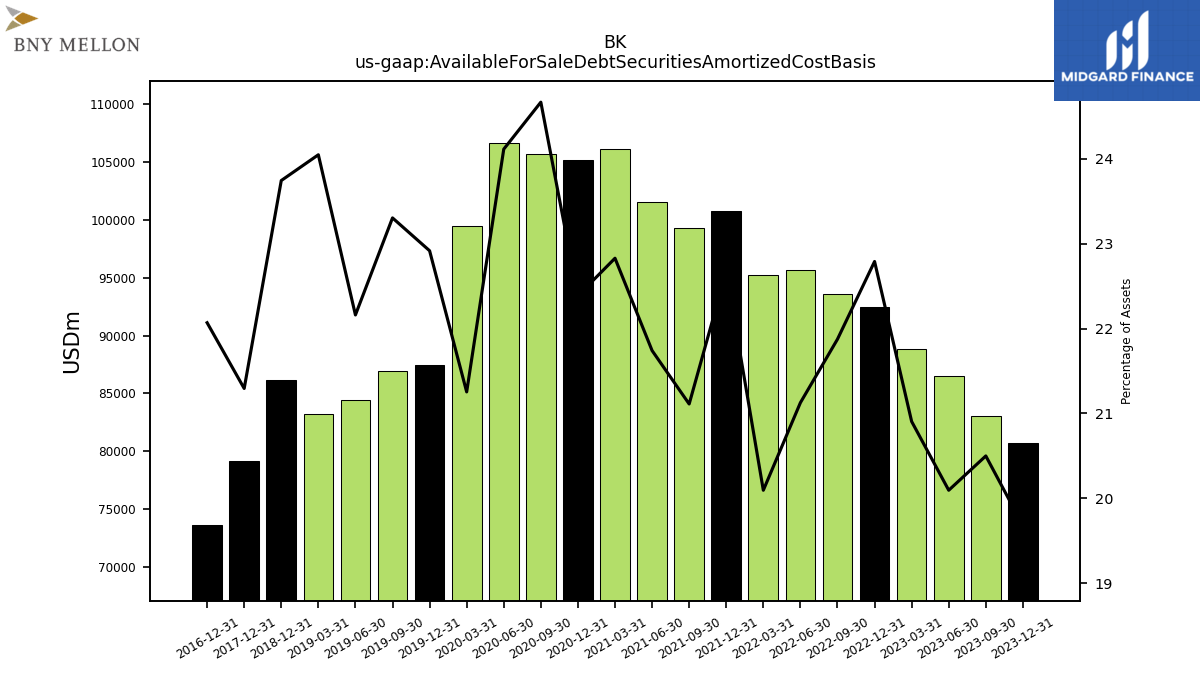
| Available For Sale Debt Securities Amortized Cost Basis | 80678.00 | 83074.00 | 86486.00 | 88872.00 | 92484.00 | 93619.00 | 95627.00 | 95213.00 | 100774.00 | 99338.00 | 101525.00 | 106156.00 | 105141.00 | 105684.00 | 106668.00 | 99503.00 | 86968.00 | 84472.00 | |
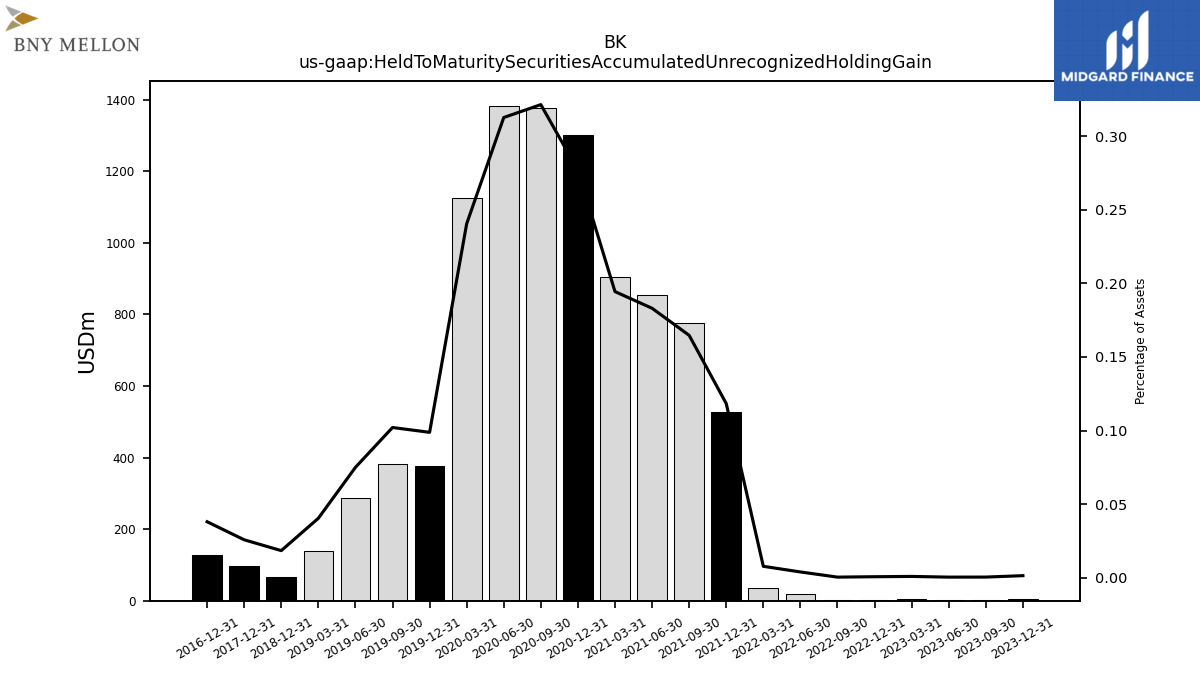
| Held To Maturity Securities Accumulated Unrecognized Holding Gain | 6.00 | 2.00 | 2.00 | 4.00 | 3.00 | 2.00 | 18.00 | 37.00 | 526.00 | 775.00 | 855.00 | 904.00 | 1300.00 | 1377.00 | 1383.00 | 1126.00 | 381.00 | 286.00 | |
| Held To Maturity Securities Accumulated Unrecognized Holding Loss | 4873.00 | 6798.00 | 5922.00 | 5498.00 | 6205.00 | 6774.00 | 4457.00 | 2980.00 | 617.00 | 334.00 | 261.00 | 447.00 | 22.00 | 15.00 | 15.00 | 13.00 | 67.00 | 140.00 |
| 2023-12-31 | 2023-09-30 | 2023-06-30 | 2023-03-31 | 2022-12-31 | 2022-09-30 | 2022-06-30 | 2022-03-31 | 2021-12-31 | 2021-09-30 | 2021-06-30 | 2021-03-31 | 2020-12-31 | 2020-09-30 | 2020-06-30 | 2020-03-31 | 2019-09-30 | 2019-06-30 | ||
|---|---|---|---|---|---|---|---|---|---|---|---|---|---|---|---|---|---|---|---|
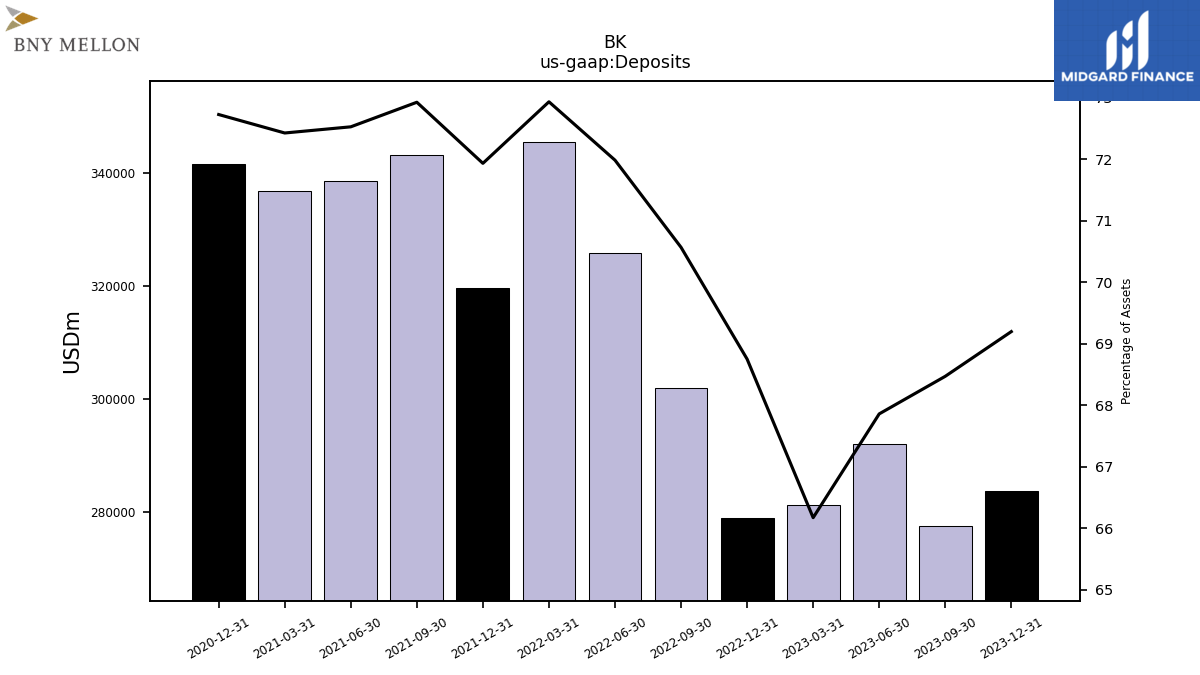
| Time Deposit Maturities Year One | 1900.00 | NA | NA | NA | NA | NA | NA | NA | NA | NA | NA | NA | NA | NA | NA | NA | NA | NA | |
| Deposits | 283669.00 | 277467.00 | 292045.00 | 281294.00 | 278970.00 | 301989.00 | 325813.00 | 345565.00 | 319694.00 | 343139.00 | 338670.00 | 336768.00 | 341545.00 | NA | NA | NA | NA | NA |
| 2023-12-31 | 2023-09-30 | 2023-06-30 | 2023-03-31 | 2022-12-31 | 2022-09-30 | 2022-06-30 | 2022-03-31 | 2021-12-31 | 2021-09-30 | 2021-06-30 | 2021-03-31 | 2020-12-31 | 2020-09-30 | 2020-06-30 | 2020-03-31 | 2019-09-30 | 2019-06-30 | ||
|---|---|---|---|---|---|---|---|---|---|---|---|---|---|---|---|---|---|---|---|
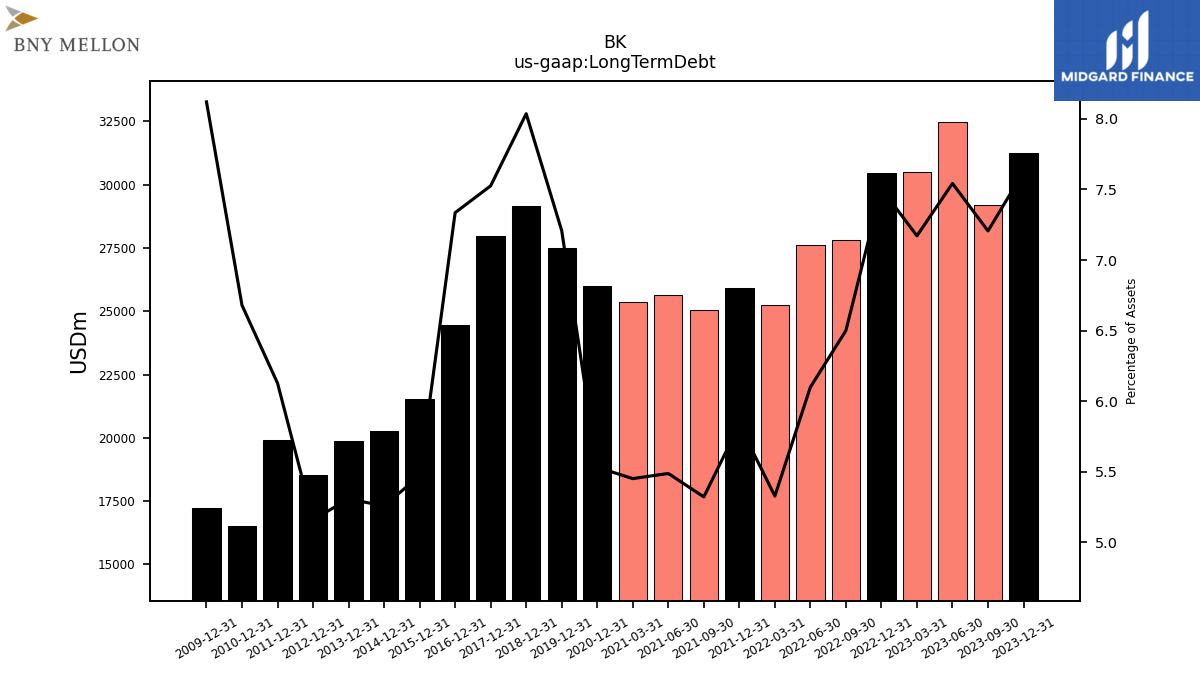
| Long Term Debt | 31257.00 | 29205.00 | 32463.00 | 30489.00 | 30458.00 | 27820.00 | 27610.00 | 25246.00 | 25931.00 | 25043.00 | 25629.00 | 25350.00 | 25984.00 | NA | NA | NA | NA | NA | |
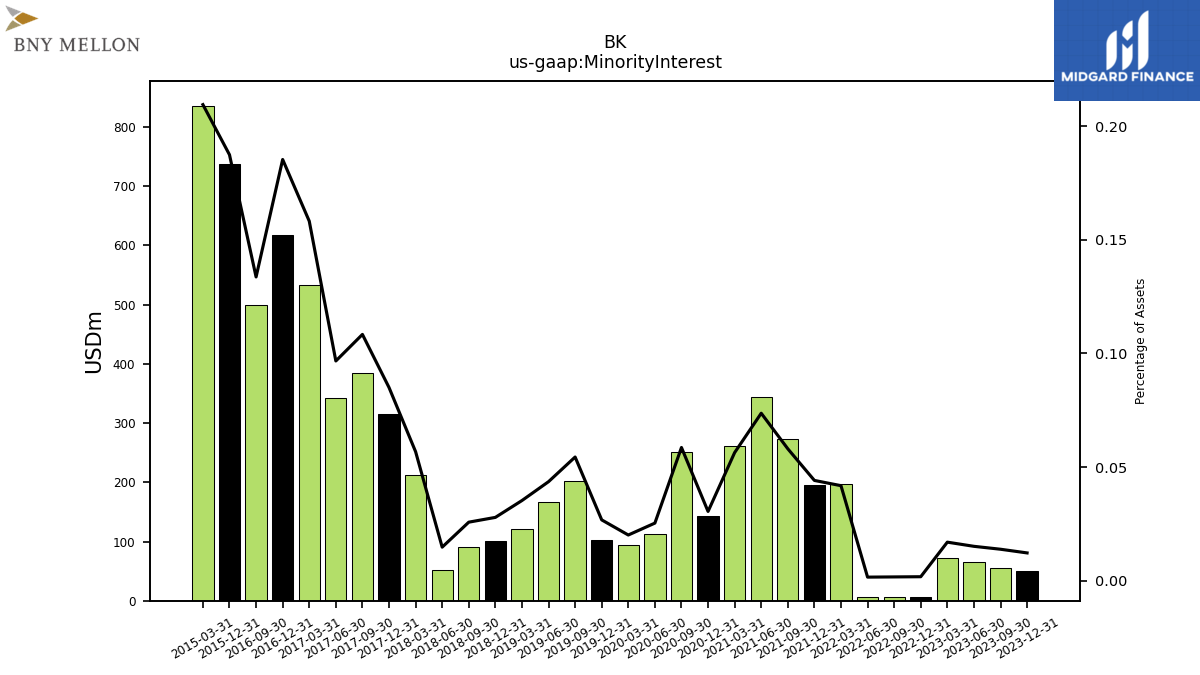
| Minority Interest | 50.00 | 56.00 | 65.00 | 72.00 | 7.00 | 7.00 | 7.00 | 198.00 | 196.00 | 273.00 | 344.00 | 262.00 | 143.00 | 251.00 | 112.00 | 94.00 | 203.00 | 166.00 |
| 2023-12-31 | 2023-09-30 | 2023-06-30 | 2023-03-31 | 2022-12-31 | 2022-09-30 | 2022-06-30 | 2022-03-31 | 2021-12-31 | 2021-09-30 | 2021-06-30 | 2021-03-31 | 2020-12-31 | 2020-09-30 | 2020-06-30 | 2020-03-31 | 2019-09-30 | 2019-06-30 | ||
|---|---|---|---|---|---|---|---|---|---|---|---|---|---|---|---|---|---|---|---|
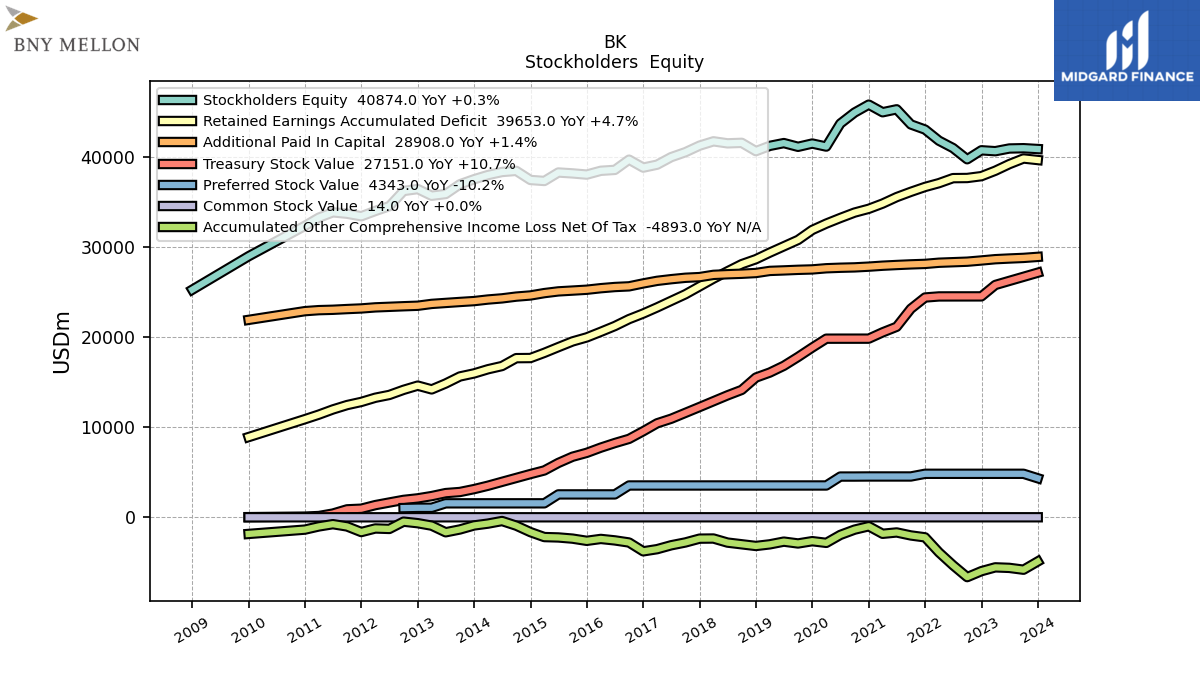
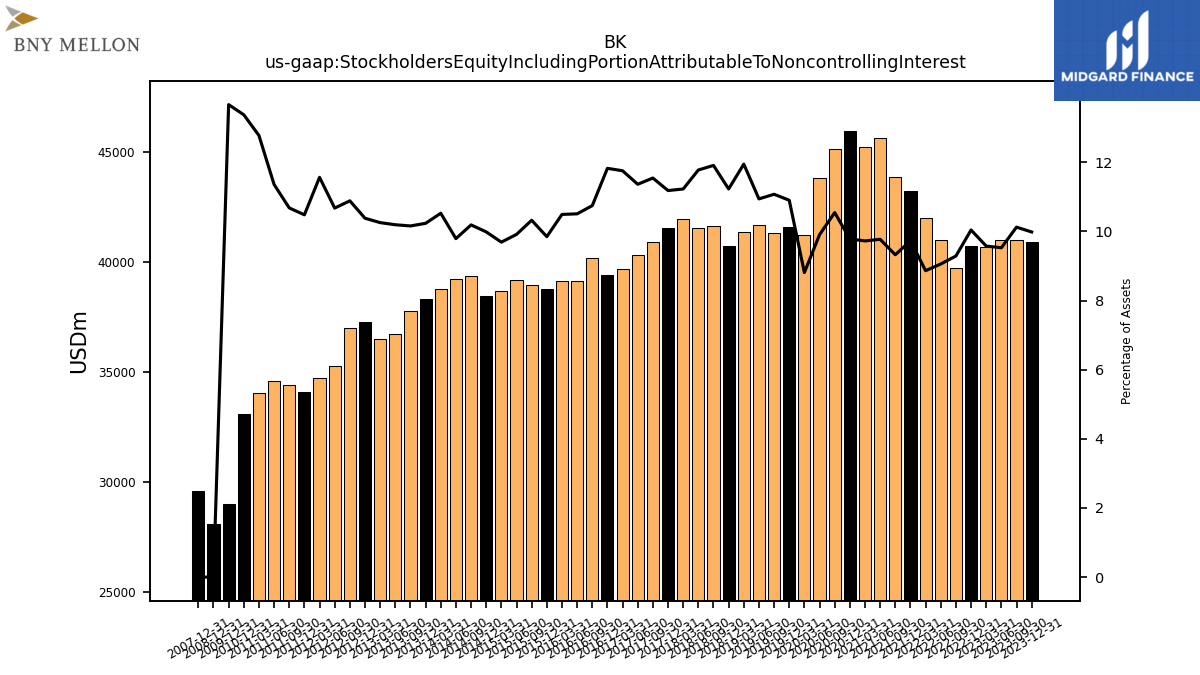
| Stockholders Equity | 40874.00 | 40966.00 | 40933.00 | 40634.00 | 40734.00 | 39737.00 | 40984.00 | 41799.00 | 43034.00 | 43601.00 | 45281.00 | 44954.00 | 45801.00 | 44917.00 | 43697.00 | 41145.00 | 41120.00 | 41533.00 | |
| Stockholders Equity Including Portion Attributable To Noncontrolling Interest | 40924.00 | 41022.00 | 40998.00 | 40706.00 | 40741.00 | 39744.00 | 40991.00 | 41997.00 | 43230.00 | 43874.00 | 45625.00 | 45216.00 | 45944.00 | 45168.00 | 43809.00 | 41239.00 | 41323.00 | 41699.00 | |
| Common Stock Value | 14.00 | NA | NA | NA | 14.00 | NA | 14.00 | 14.00 | 14.00 | 14.00 | 14.00 | 14.00 | 14.00 | 14.00 | 14.00 | 14.00 | 14.00 | 14.00 | |
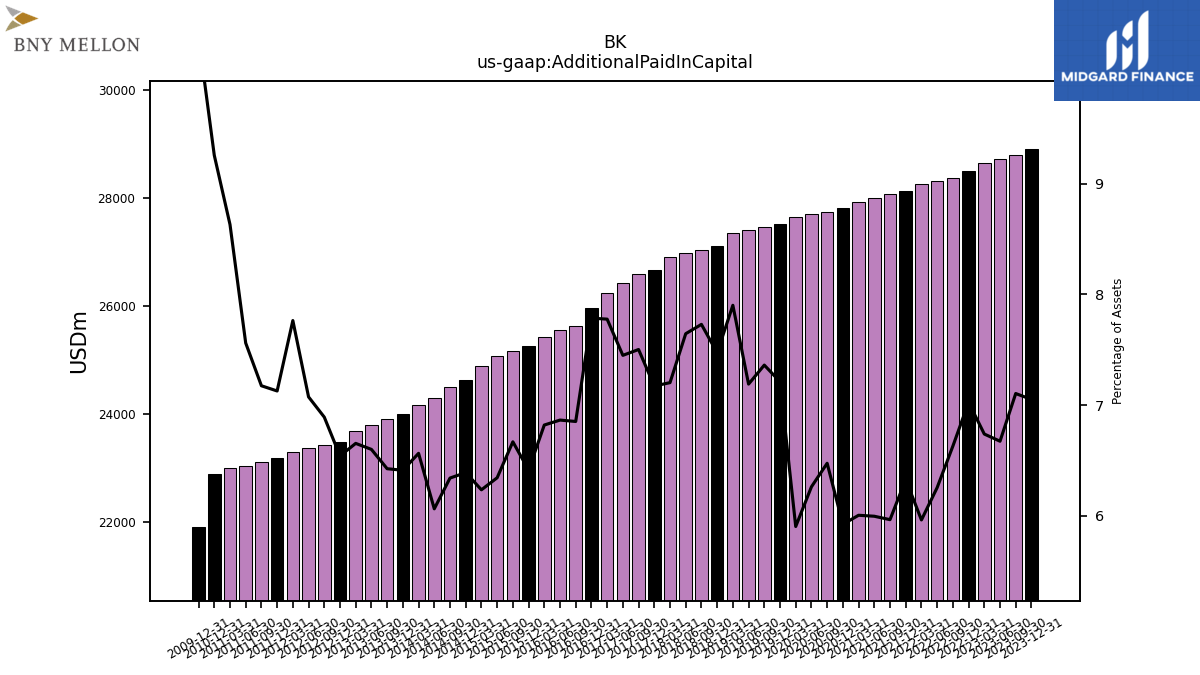
| Additional Paid In Capital | 28908.00 | 28793.00 | 28726.00 | 28650.00 | 28508.00 | 28374.00 | 28316.00 | 28258.00 | 28128.00 | 28075.00 | 28006.00 | 27928.00 | 27823.00 | 27741.00 | 27702.00 | 27644.00 | 27471.00 | 27406.00 | |
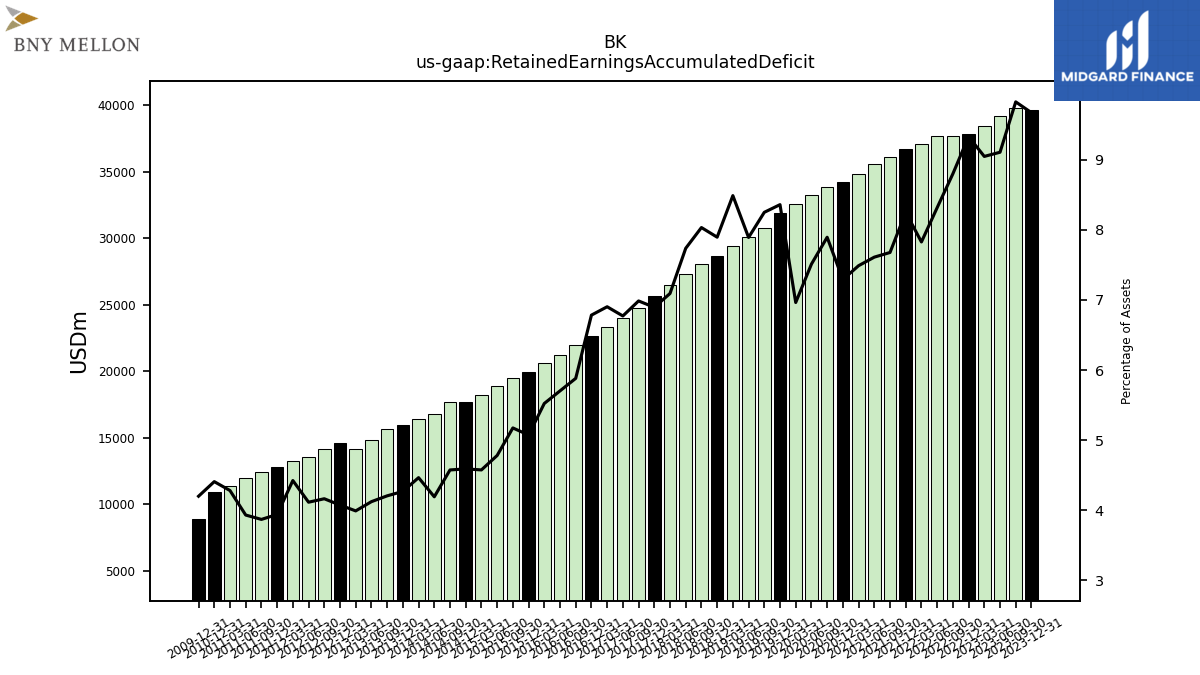
| Retained Earnings Accumulated Deficit | 39653.00 | 39822.00 | 39199.00 | 38465.00 | 37864.00 | 37660.00 | 37644.00 | 37088.00 | 36667.00 | 36125.00 | 35540.00 | 34822.00 | 34241.00 | 33821.00 | 33224.00 | 32601.00 | 30789.00 | 30081.00 | |
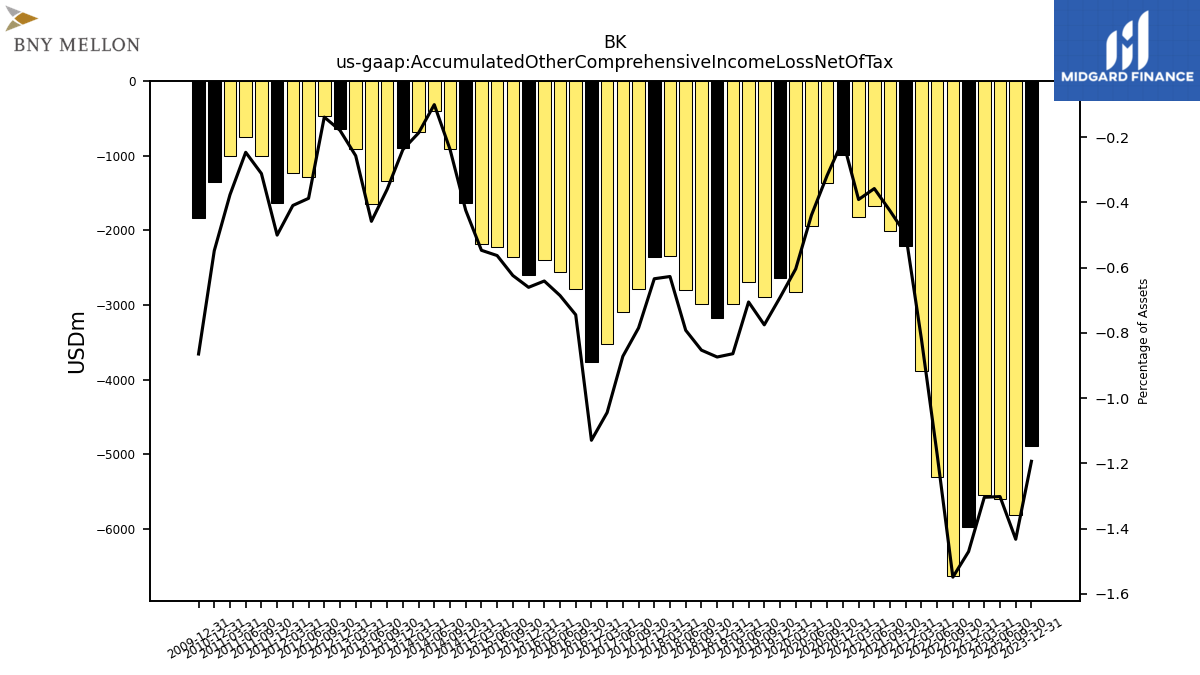
| Accumulated Other Comprehensive Income Loss Net Of Tax | -4893.00 | -5805.00 | -5602.00 | -5543.00 | -5966.00 | -6627.00 | -5307.00 | -3881.00 | -2213.00 | -2003.00 | -1670.00 | -1819.00 | -985.00 | -1359.00 | -1943.00 | -2827.00 | -2893.00 | -2688.00 | |
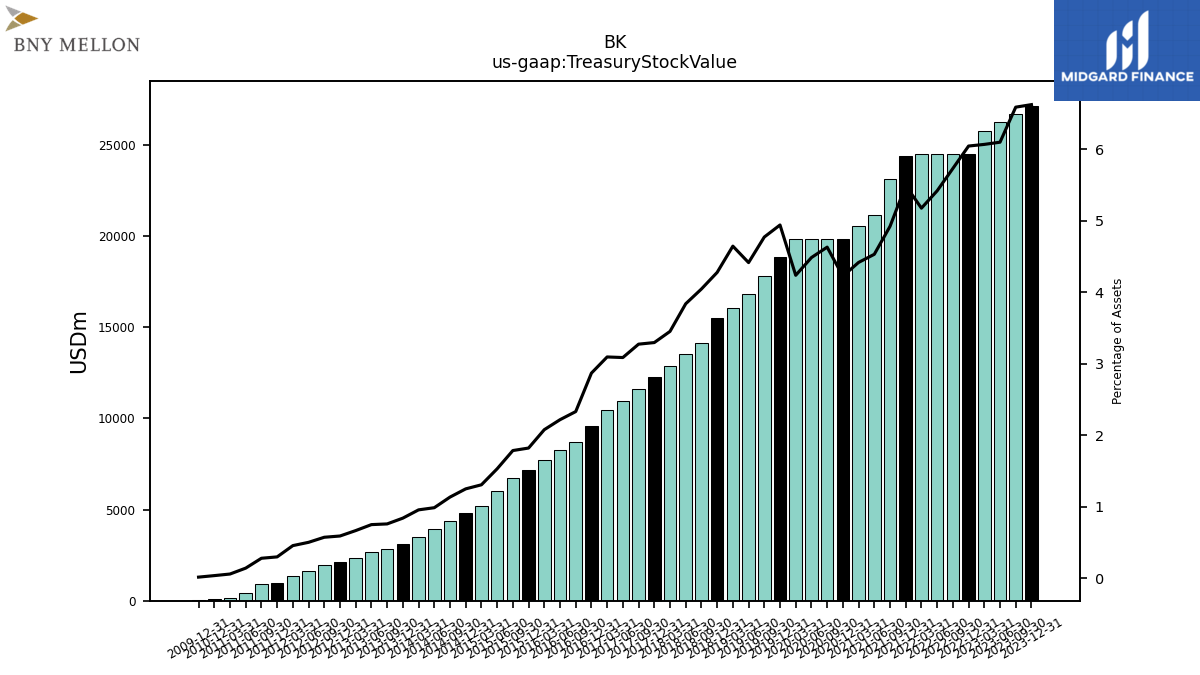
| Treasury Stock Value | 27151.00 | 26696.00 | 26242.00 | 25790.00 | 24524.00 | 24522.00 | 24521.00 | 24518.00 | 24400.00 | 23151.00 | 21150.00 | 20532.00 | 19833.00 | 19832.00 | 19832.00 | 19829.00 | 17803.00 | 16822.00 | |
| Minority Interest | 50.00 | 56.00 | 65.00 | 72.00 | 7.00 | 7.00 | 7.00 | 198.00 | 196.00 | 273.00 | 344.00 | 262.00 | 143.00 | 251.00 | 112.00 | 94.00 | 203.00 | 166.00 |
| 2023-12-31 | 2023-09-30 | 2023-06-30 | 2023-03-31 | 2022-12-31 | 2022-09-30 | 2022-06-30 | 2022-03-31 | 2021-12-31 | 2021-09-30 | 2021-06-30 | 2021-03-31 | 2020-12-31 | 2020-09-30 | 2020-06-30 | 2020-03-31 | 2019-09-30 | 2019-06-30 | ||
|---|---|---|---|---|---|---|---|---|---|---|---|---|---|---|---|---|---|---|---|
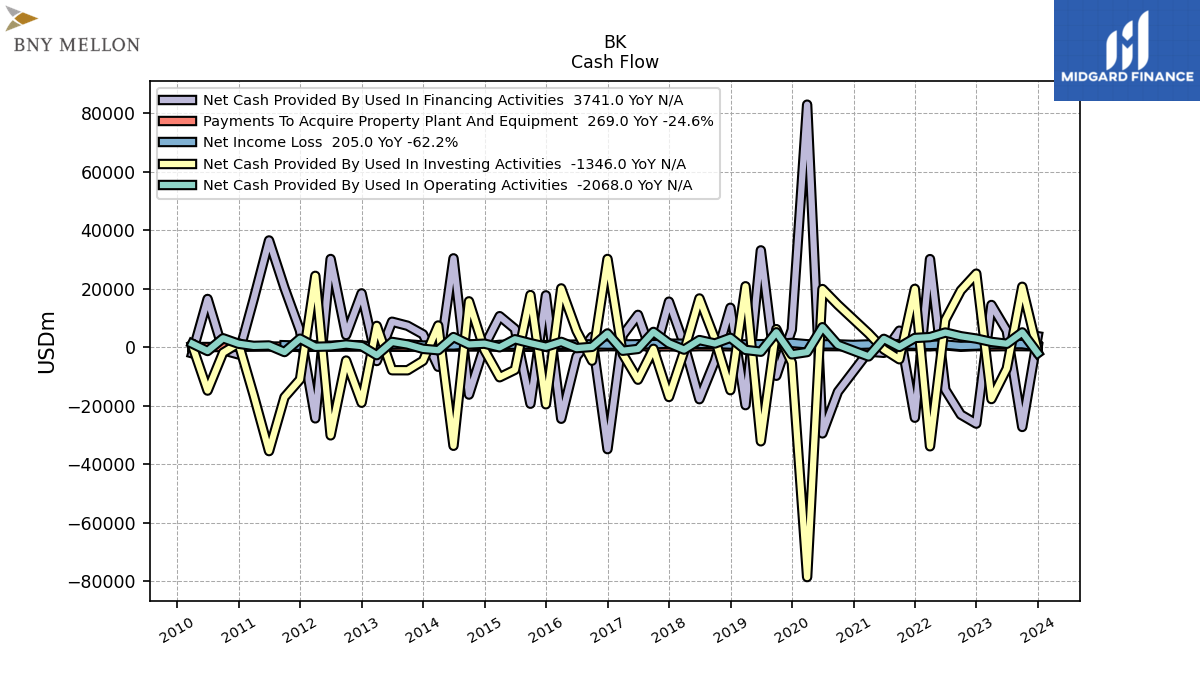
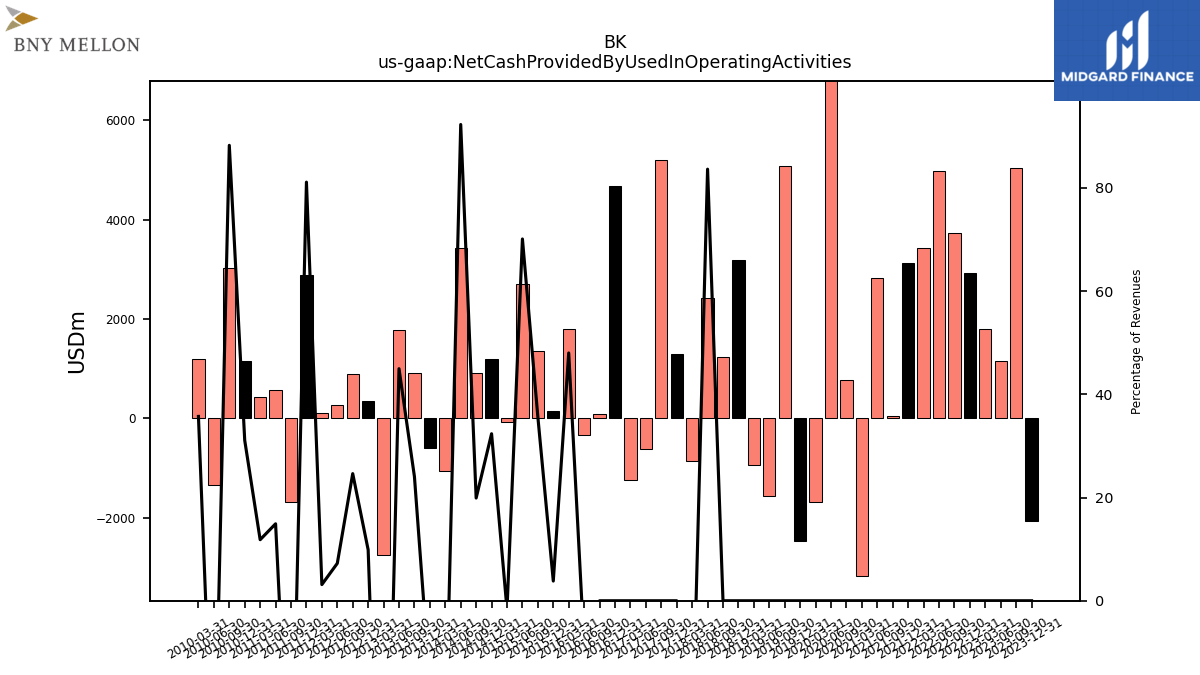
| Net Cash Provided By Used In Operating Activities | -2068.00 | 5040.00 | 1148.00 | 1792.00 | 2924.00 | 3725.00 | 4990.00 | 3429.00 | 3129.00 | 54.00 | 2829.00 | -3174.00 | NA | 778.00 | 6810.00 | -1685.00 | 5081.00 | -1565.00 | |
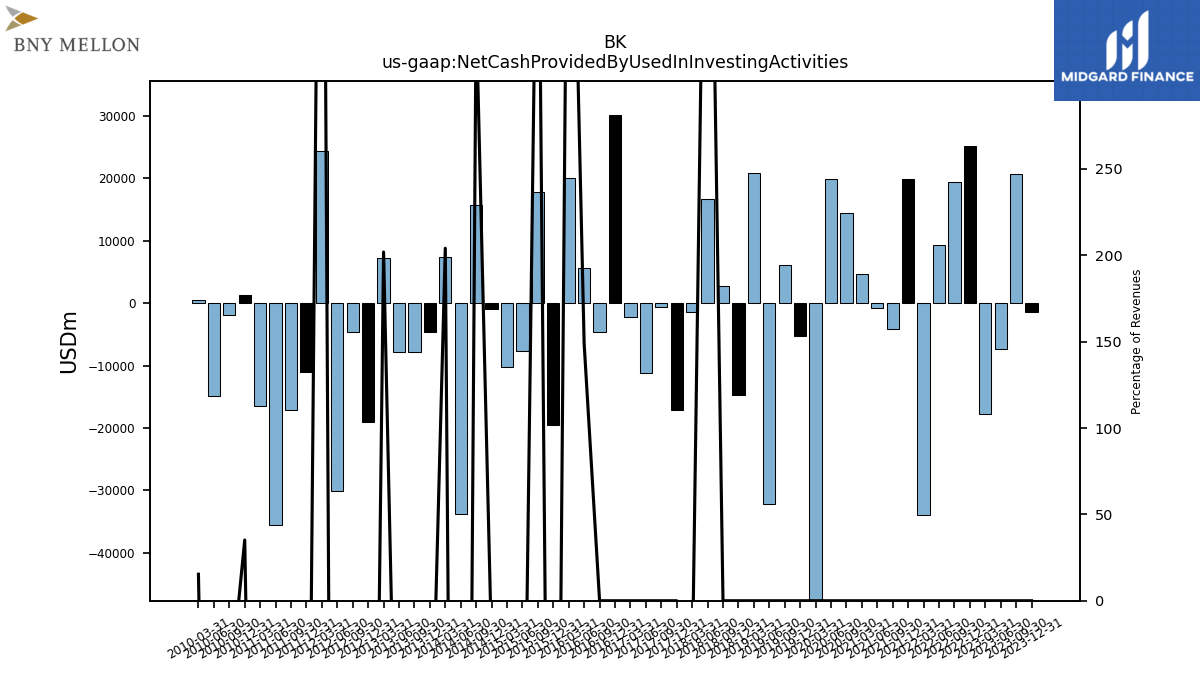
| Net Cash Provided By Used In Investing Activities | -1346.00 | 20631.00 | -7343.00 | -17752.00 | 25124.00 | 19345.00 | 9306.00 | -33901.00 | 19931.00 | -4158.00 | -779.00 | 4678.00 | NA | 14446.00 | 19855.00 | -78601.00 | 6156.00 | -32196.00 | |
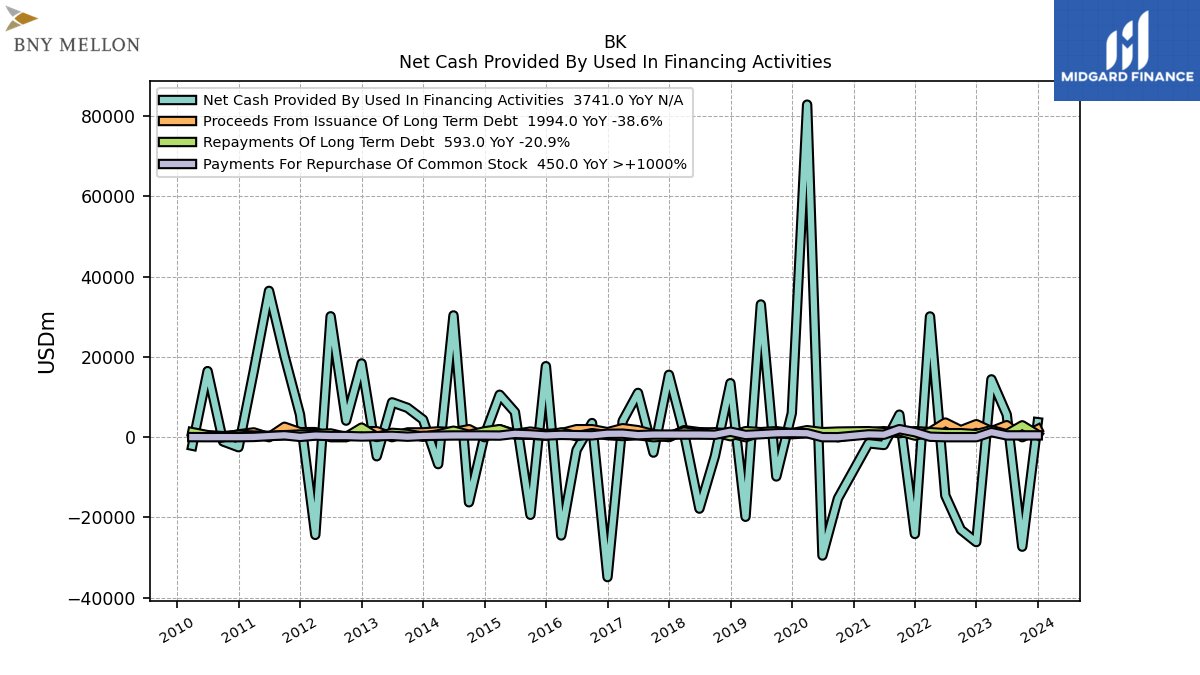
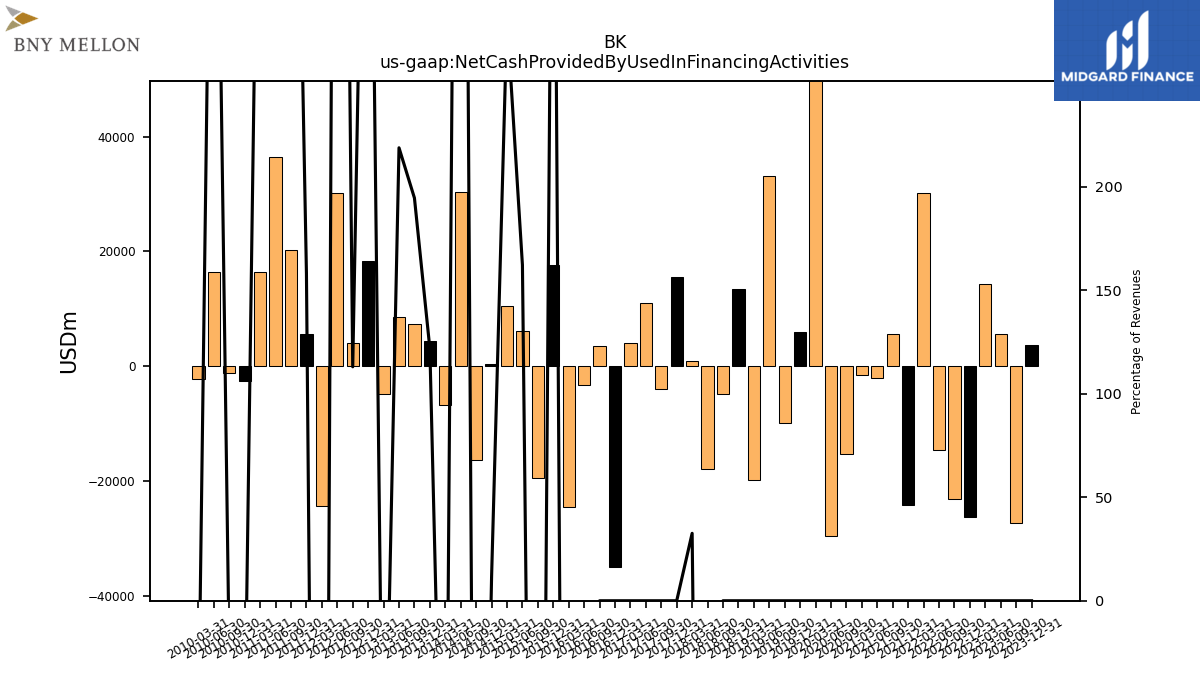
| Net Cash Provided By Used In Financing Activities | 3741.00 | -27287.00 | 5614.00 | 14413.00 | -26150.00 | -23061.00 | -14538.00 | 30095.00 | -24127.00 | 5626.00 | -1941.00 | -1520.00 | NA | -15255.00 | -29490.00 | 82880.00 | -9791.00 | 33082.00 |
| 2023-12-31 | 2023-09-30 | 2023-06-30 | 2023-03-31 | 2022-12-31 | 2022-09-30 | 2022-06-30 | 2022-03-31 | 2021-12-31 | 2021-09-30 | 2021-06-30 | 2021-03-31 | 2020-12-31 | 2020-09-30 | 2020-06-30 | 2020-03-31 | 2019-09-30 | 2019-06-30 | ||
|---|---|---|---|---|---|---|---|---|---|---|---|---|---|---|---|---|---|---|---|
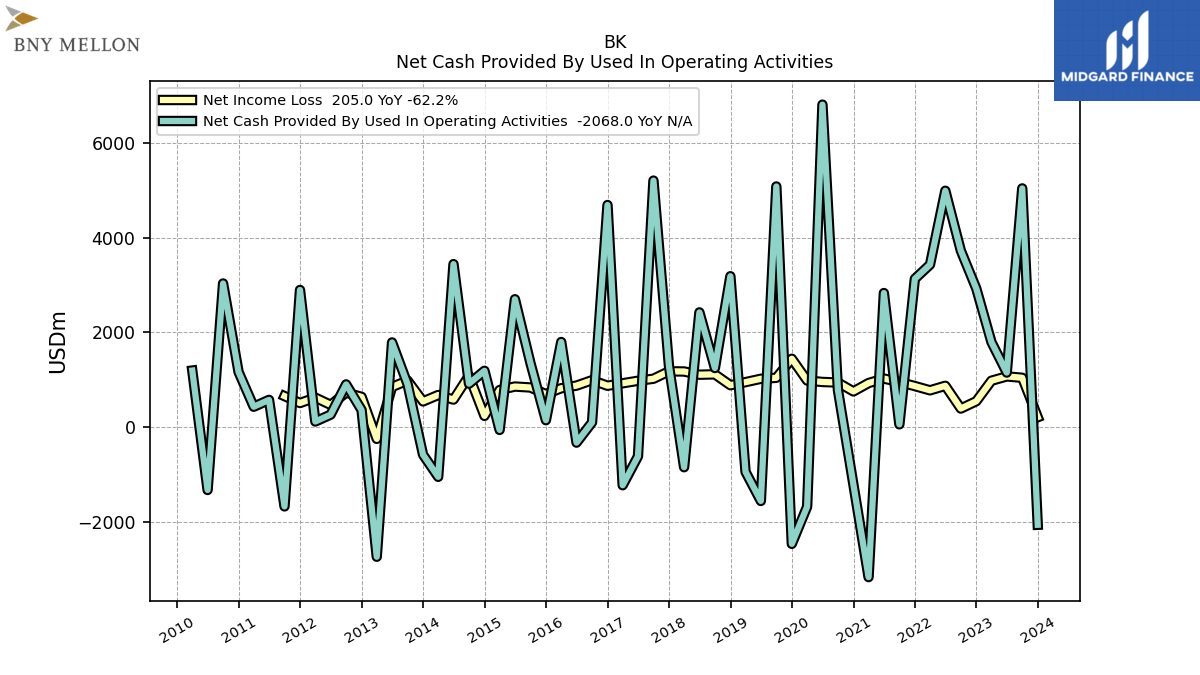
| Net Cash Provided By Used In Operating Activities | -2068.00 | 5040.00 | 1148.00 | 1792.00 | 2924.00 | 3725.00 | 4990.00 | 3429.00 | 3129.00 | 54.00 | 2829.00 | -3174.00 | NA | 778.00 | 6810.00 | -1685.00 | 5081.00 | -1565.00 | |
| Net Income Loss | 205.00 | 1038.00 | 1067.00 | 976.00 | 543.00 | 388.00 | 869.00 | 773.00 | 863.00 | 947.00 | 1022.00 | 927.00 | 750.00 | 937.00 | 950.00 | 980.00 | 1038.00 | 1017.00 | |
| Profit Loss | 203.00 | 1041.00 | 1068.00 | 976.00 | 543.00 | 388.00 | 864.00 | 765.00 | 869.00 | 943.00 | 1027.00 | 932.00 | 755.00 | 944.00 | 965.00 | 962.00 | 1041.00 | 1021.00 | |
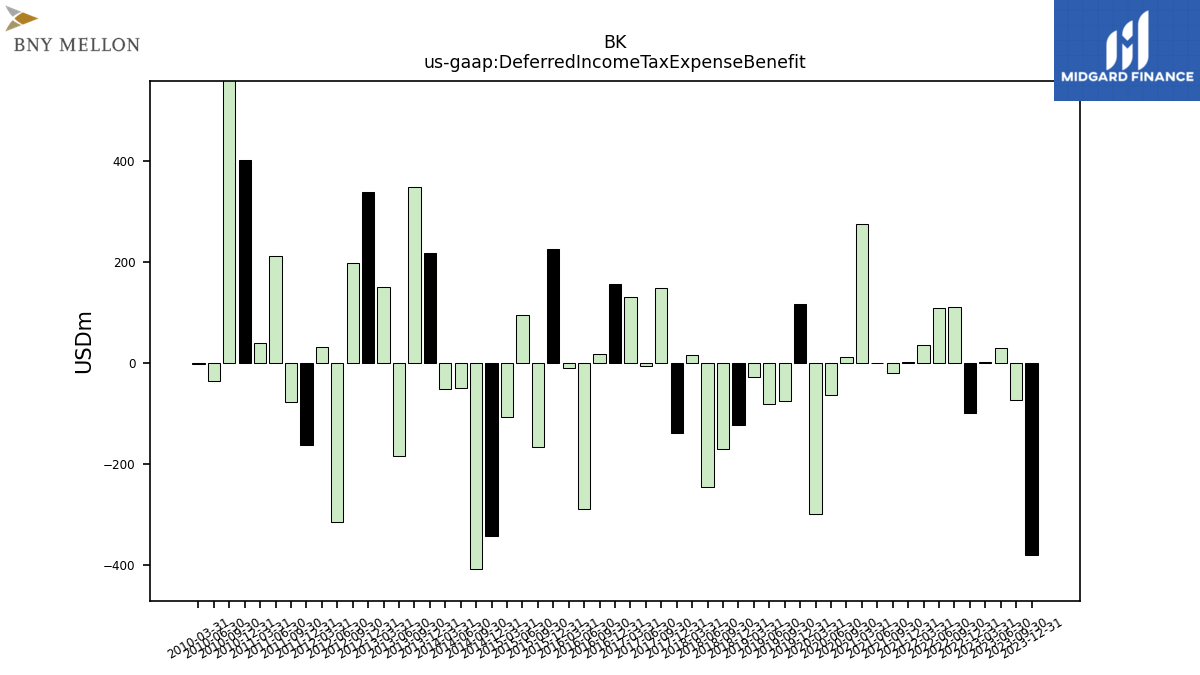
| Deferred Income Tax Expense Benefit | -381.00 | -74.00 | 30.00 | 2.00 | -100.00 | 110.00 | 109.00 | 36.00 | 2.00 | -19.00 | -1.00 | 275.00 | NA | 12.00 | -63.00 | -300.00 | -75.00 | -82.00 |
| 2023-12-31 | 2023-09-30 | 2023-06-30 | 2023-03-31 | 2022-12-31 | 2022-09-30 | 2022-06-30 | 2022-03-31 | 2021-12-31 | 2021-09-30 | 2021-06-30 | 2021-03-31 | 2020-12-31 | 2020-09-30 | 2020-06-30 | 2020-03-31 | 2019-09-30 | 2019-06-30 | ||
|---|---|---|---|---|---|---|---|---|---|---|---|---|---|---|---|---|---|---|---|
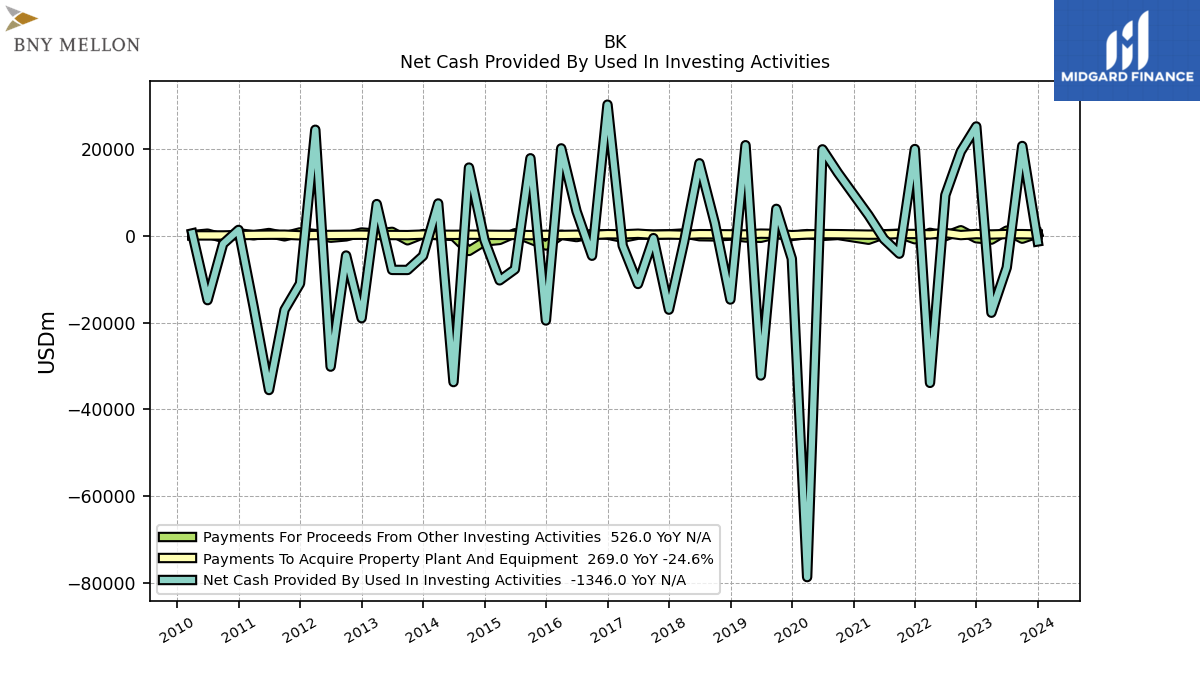
| Net Cash Provided By Used In Investing Activities | -1346.00 | 20631.00 | -7343.00 | -17752.00 | 25124.00 | 19345.00 | 9306.00 | -33901.00 | 19931.00 | -4158.00 | -779.00 | 4678.00 | NA | 14446.00 | 19855.00 | -78601.00 | 6156.00 | -32196.00 | |
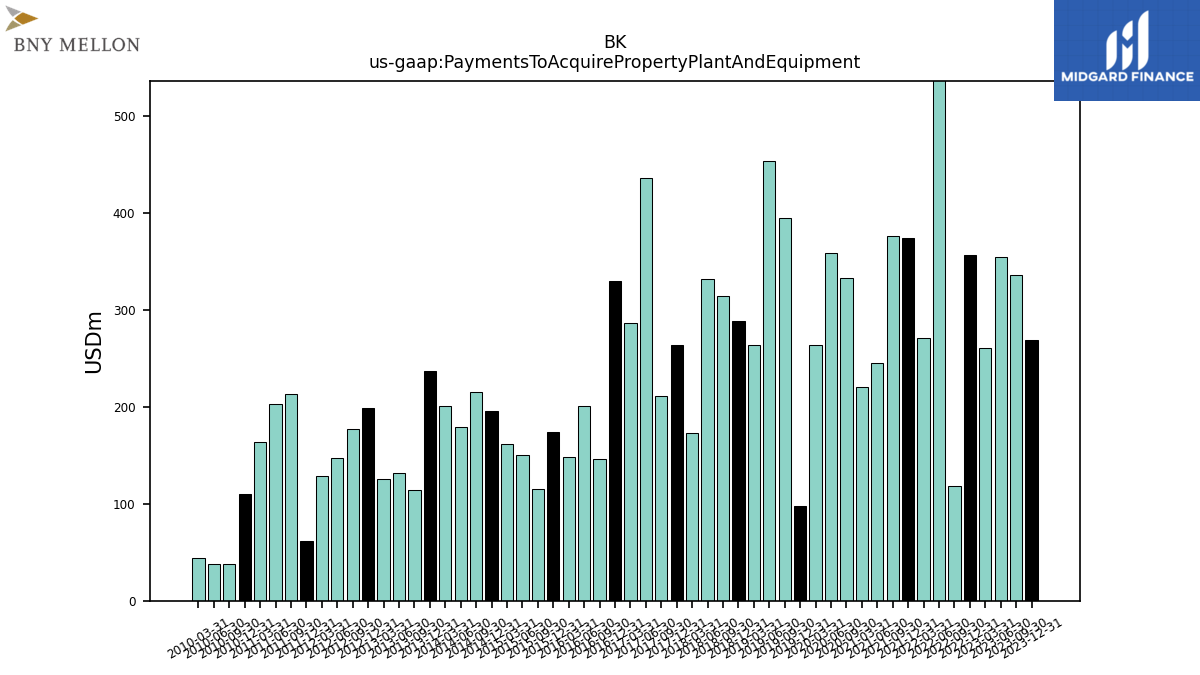
| Payments To Acquire Property Plant And Equipment | 269.00 | 336.00 | 354.00 | 261.00 | 357.00 | 118.00 | 600.00 | 271.00 | 374.00 | 376.00 | 245.00 | 220.00 | NA | 333.00 | 359.00 | 264.00 | 395.00 | 453.00 |
| 2023-12-31 | 2023-09-30 | 2023-06-30 | 2023-03-31 | 2022-12-31 | 2022-09-30 | 2022-06-30 | 2022-03-31 | 2021-12-31 | 2021-09-30 | 2021-06-30 | 2021-03-31 | 2020-12-31 | 2020-09-30 | 2020-06-30 | 2020-03-31 | 2019-09-30 | 2019-06-30 | ||
|---|---|---|---|---|---|---|---|---|---|---|---|---|---|---|---|---|---|---|---|
| Net Cash Provided By Used In Financing Activities | 3741.00 | -27287.00 | 5614.00 | 14413.00 | -26150.00 | -23061.00 | -14538.00 | 30095.00 | -24127.00 | 5626.00 | -1941.00 | -1520.00 | NA | -15255.00 | -29490.00 | 82880.00 | -9791.00 | 33082.00 | |
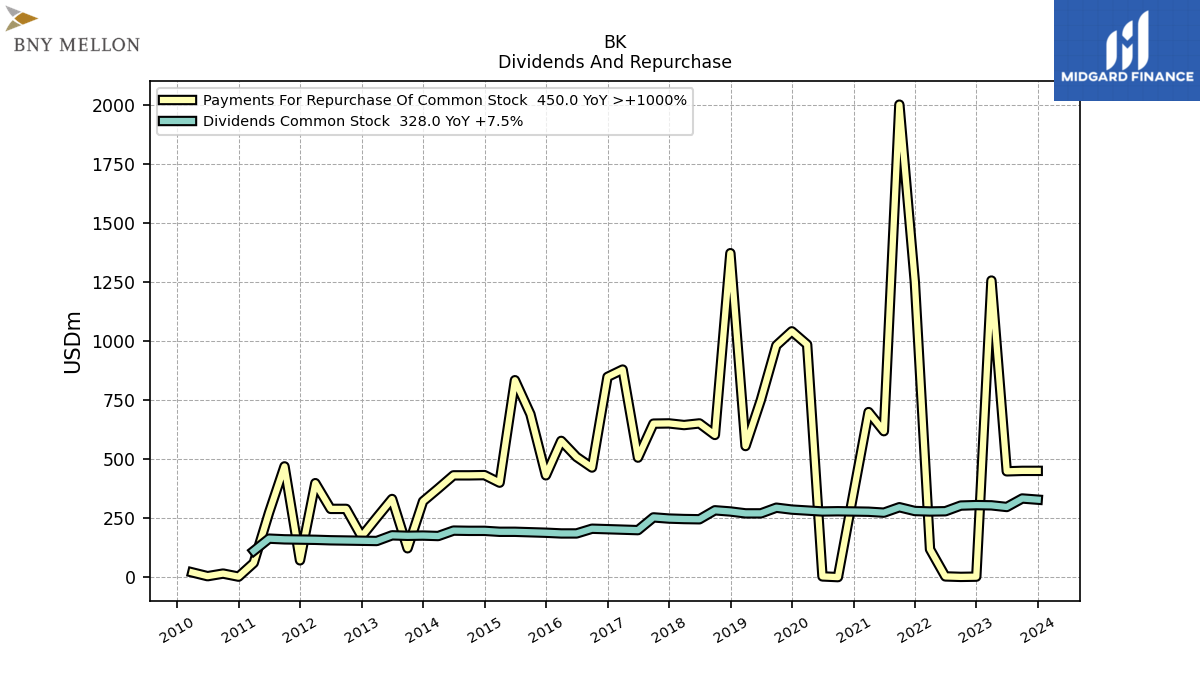
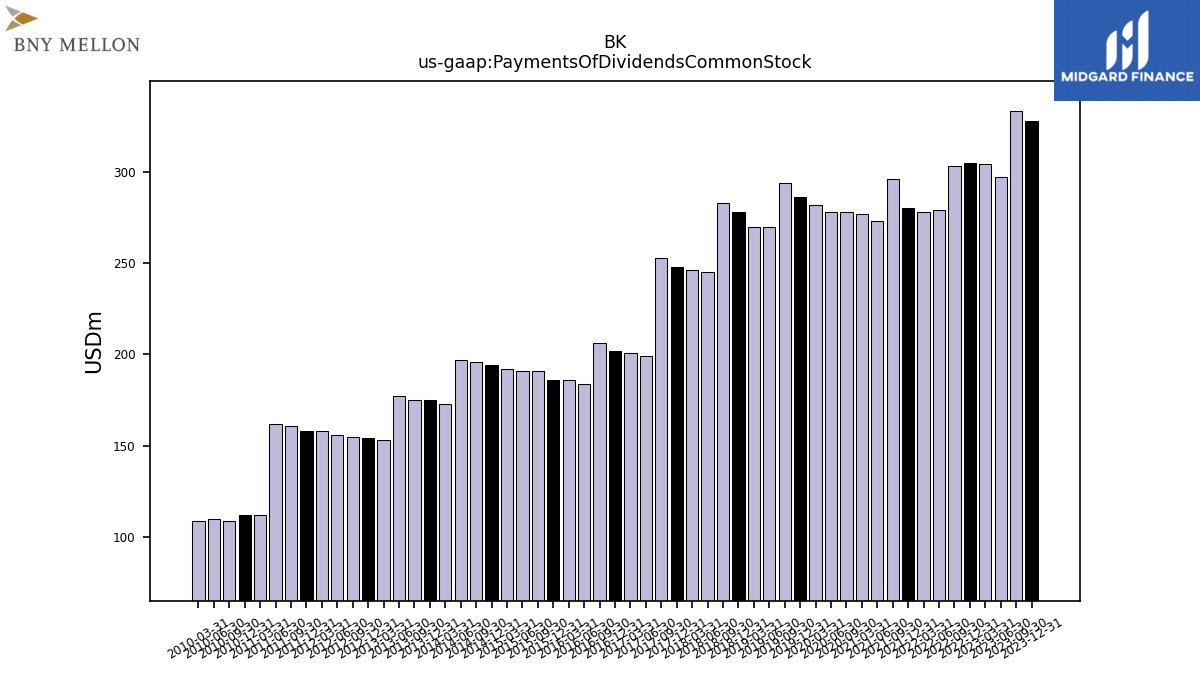
| Payments Of Dividends Common Stock | 328.00 | 333.00 | 297.00 | 304.00 | 305.00 | 303.00 | 279.00 | 278.00 | 280.00 | 296.00 | 273.00 | 277.00 | NA | 278.00 | 278.00 | 282.00 | 294.00 | 270.00 | |
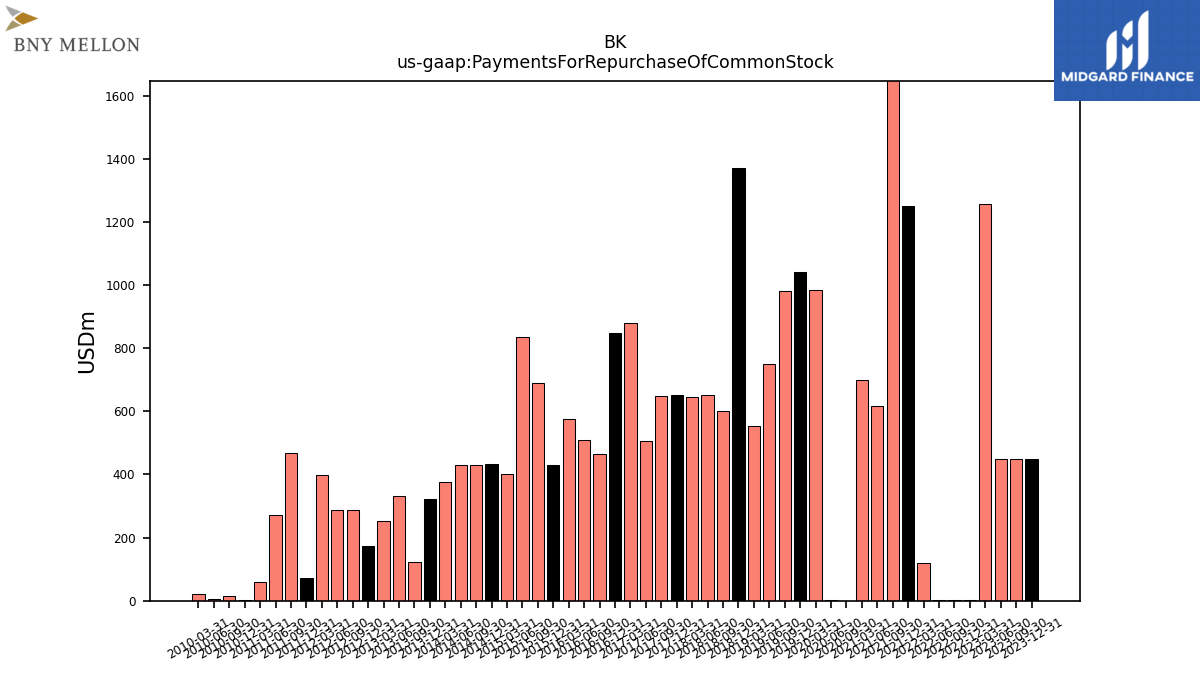
| Payments For Repurchase Of Common Stock | 450.00 | 450.00 | 448.00 | 1256.00 | 2.00 | 1.00 | 3.00 | 118.00 | 1249.00 | 2001.00 | 618.00 | 699.00 | NA | 0.00 | 3.00 | 985.00 | 981.00 | 750.00 |
| 2023-12-31 | 2023-09-30 | 2023-06-30 | 2023-03-31 | 2022-12-31 | 2022-09-30 | 2022-06-30 | 2022-03-31 | 2021-12-31 | 2021-09-30 | 2021-06-30 | 2021-03-31 | 2020-12-31 | 2020-09-30 | 2020-06-30 | 2020-03-31 | 2019-09-30 | 2019-06-30 | ||
|---|---|---|---|---|---|---|---|---|---|---|---|---|---|---|---|---|---|---|---|
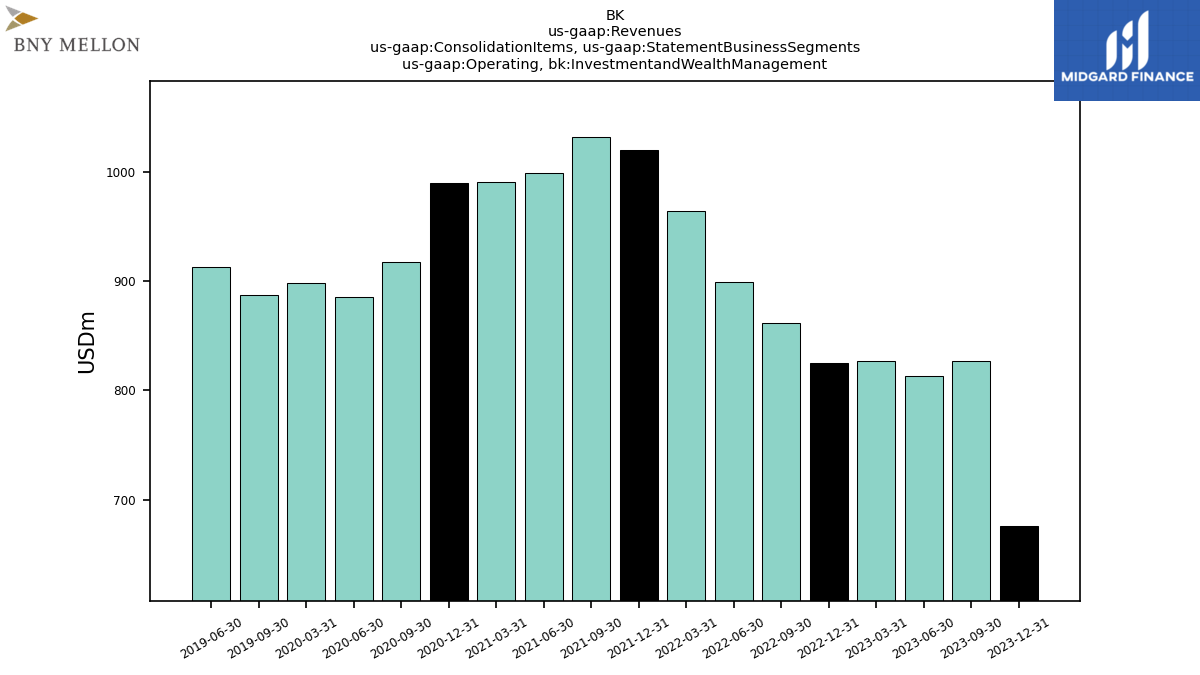
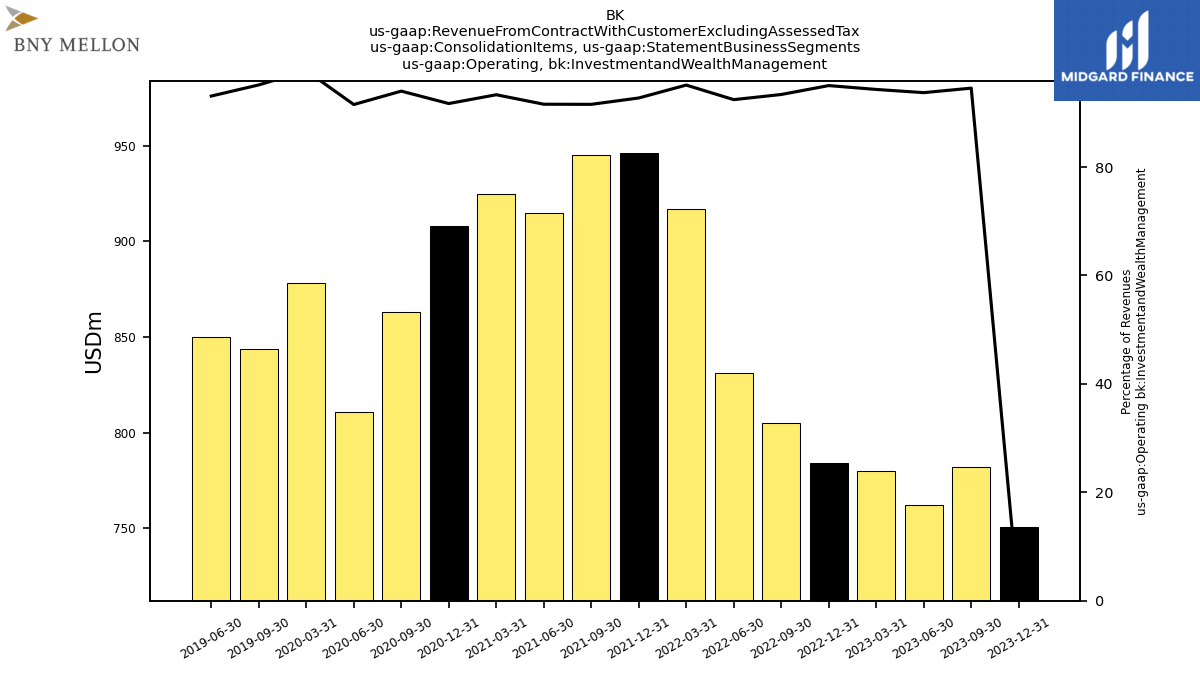
| Operating, Investmentand Wealth Management | 676.00 | 827.00 | 813.00 | 827.00 | 825.00 | 862.00 | 899.00 | 964.00 | 1020.00 | 1032.00 | 999.00 | 991.00 | 990.00 | 918.00 | 886.00 | 898.00 | 887.00 | 913.00 | |
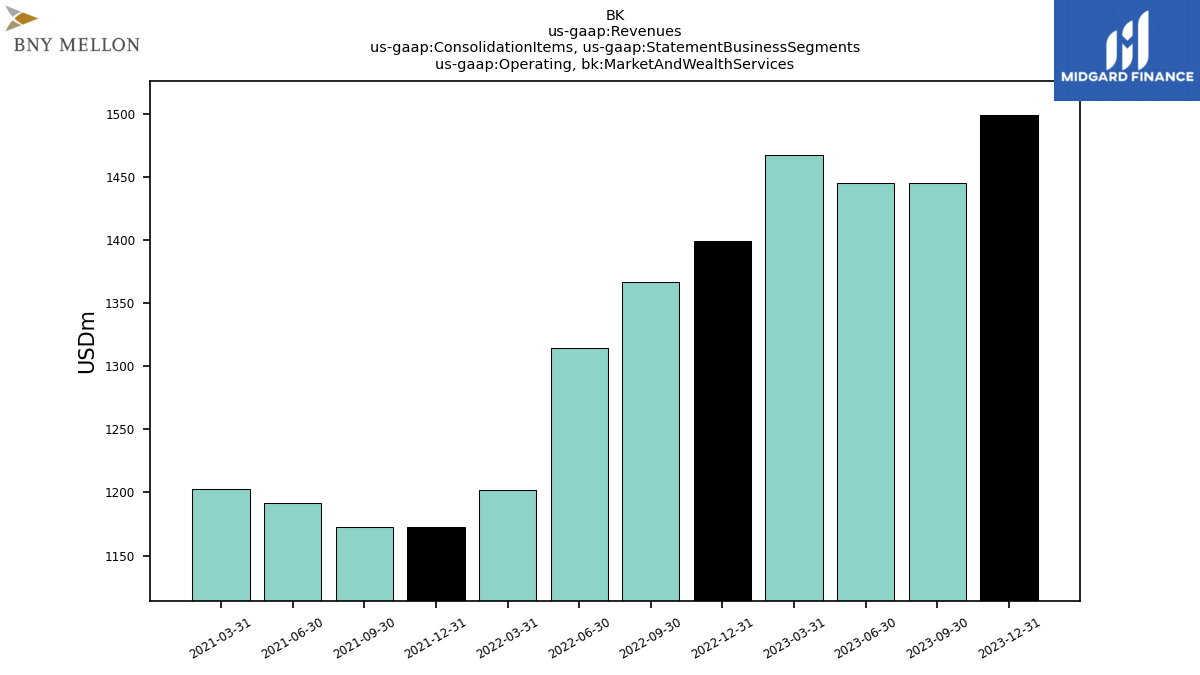
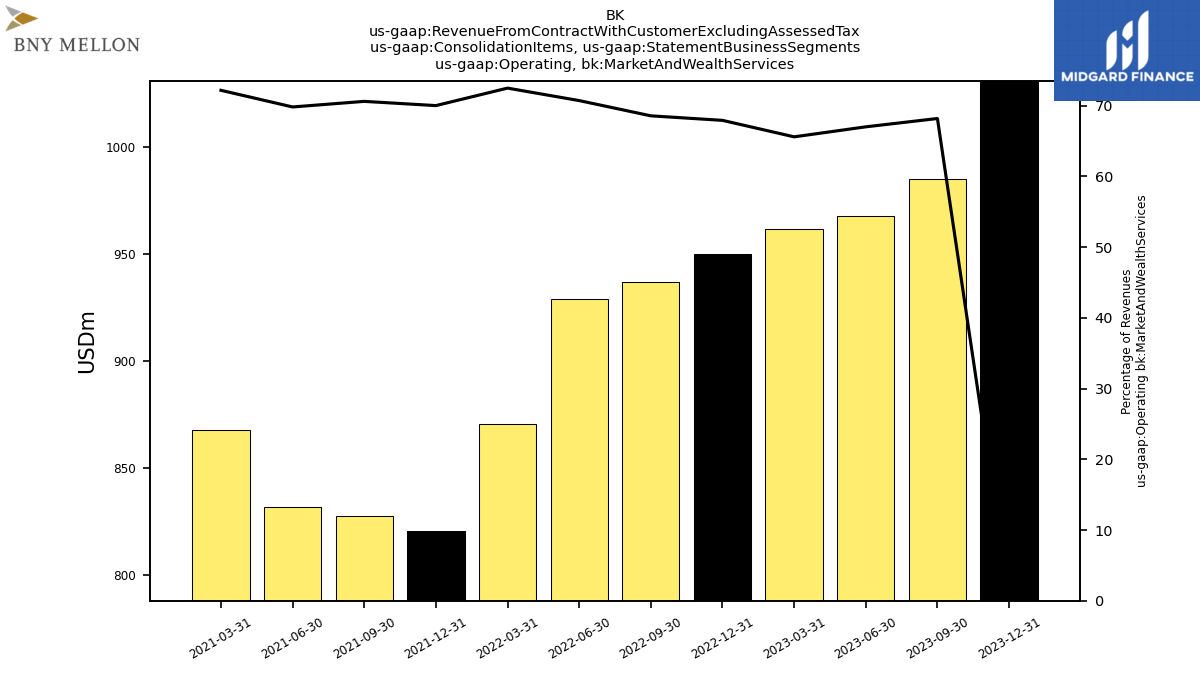
| Operating, Market And Wealth Services | 1499.00 | 1445.00 | 1445.00 | 1467.00 | 1399.00 | 1367.00 | 1314.00 | 1202.00 | 1173.00 | 1173.00 | 1192.00 | 1203.00 | NA | NA | NA | NA | NA | NA | |
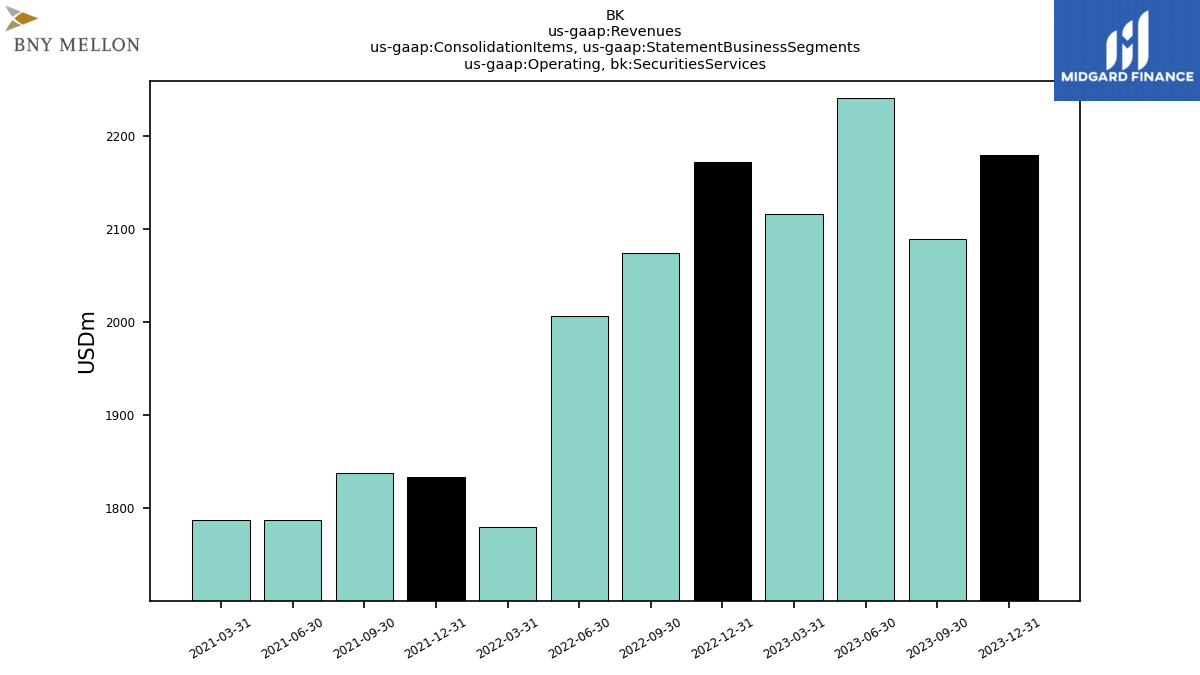
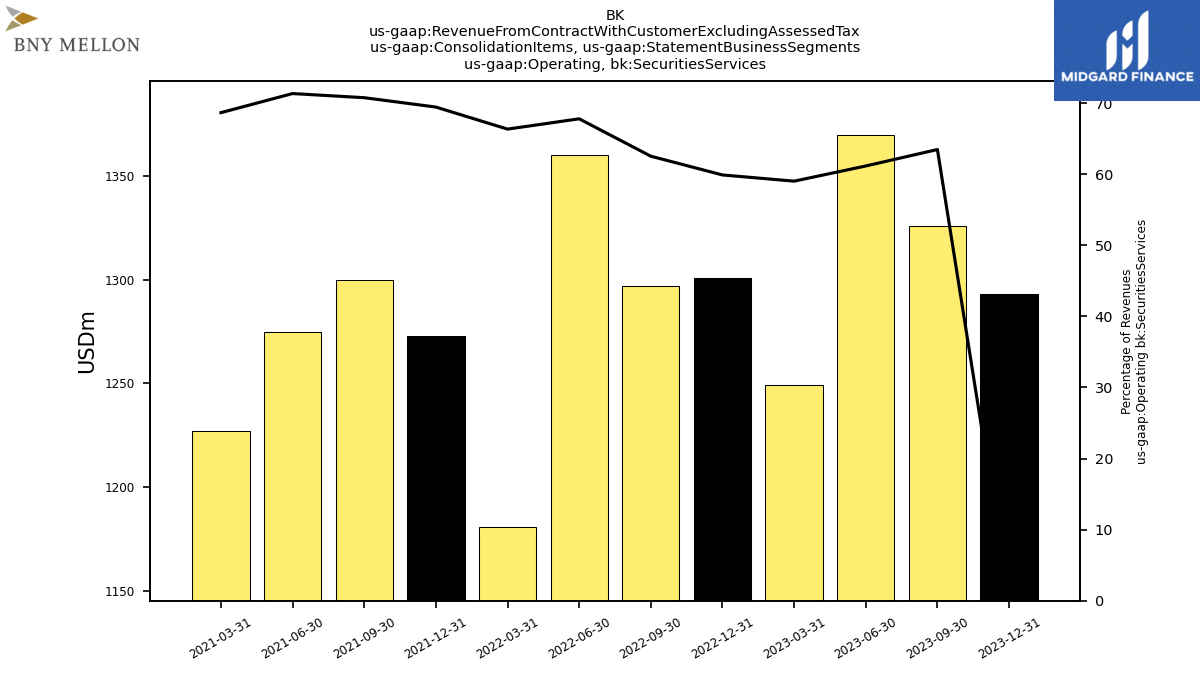
| Operating, Securities Services | 2179.00 | 2089.00 | 2240.00 | 2116.00 | 2172.00 | 2074.00 | 2006.00 | 1780.00 | 1833.00 | 1837.00 | 1787.00 | 1787.00 | NA | NA | NA | NA | NA | NA | |
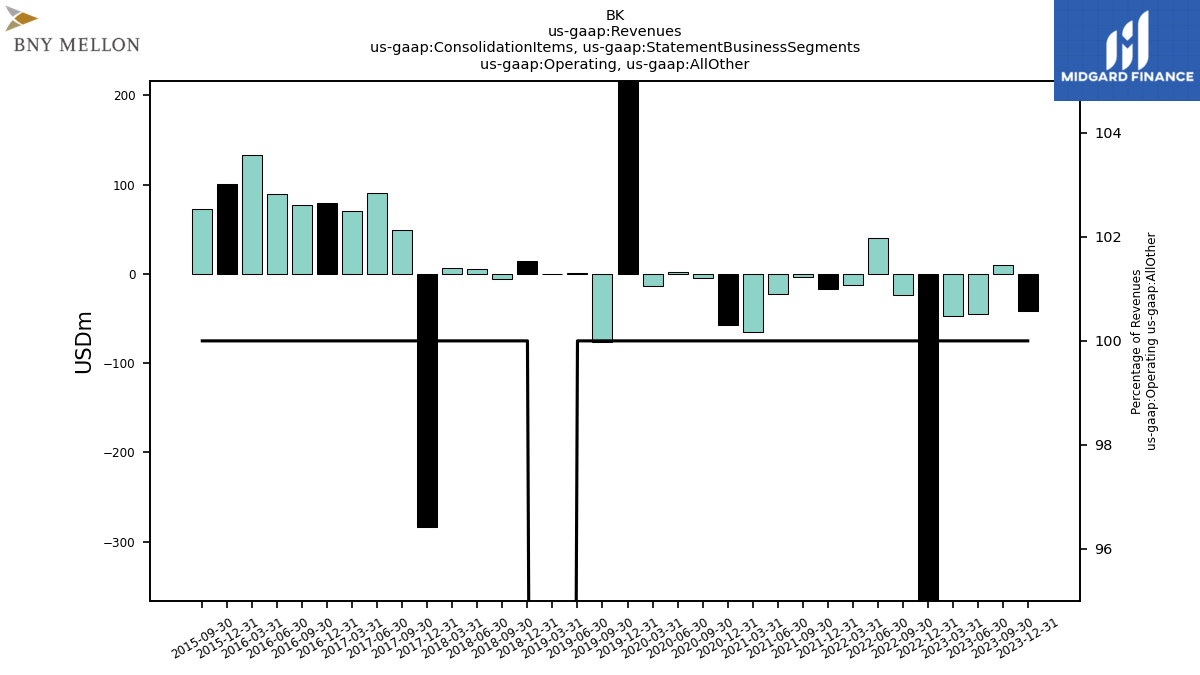
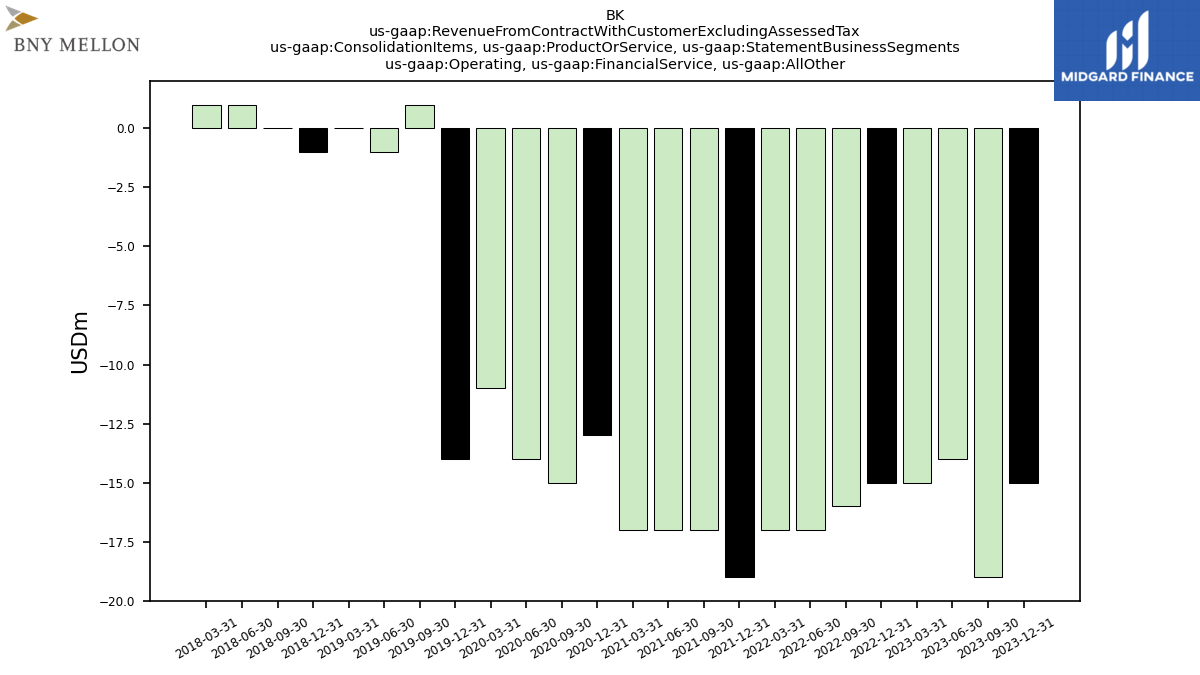
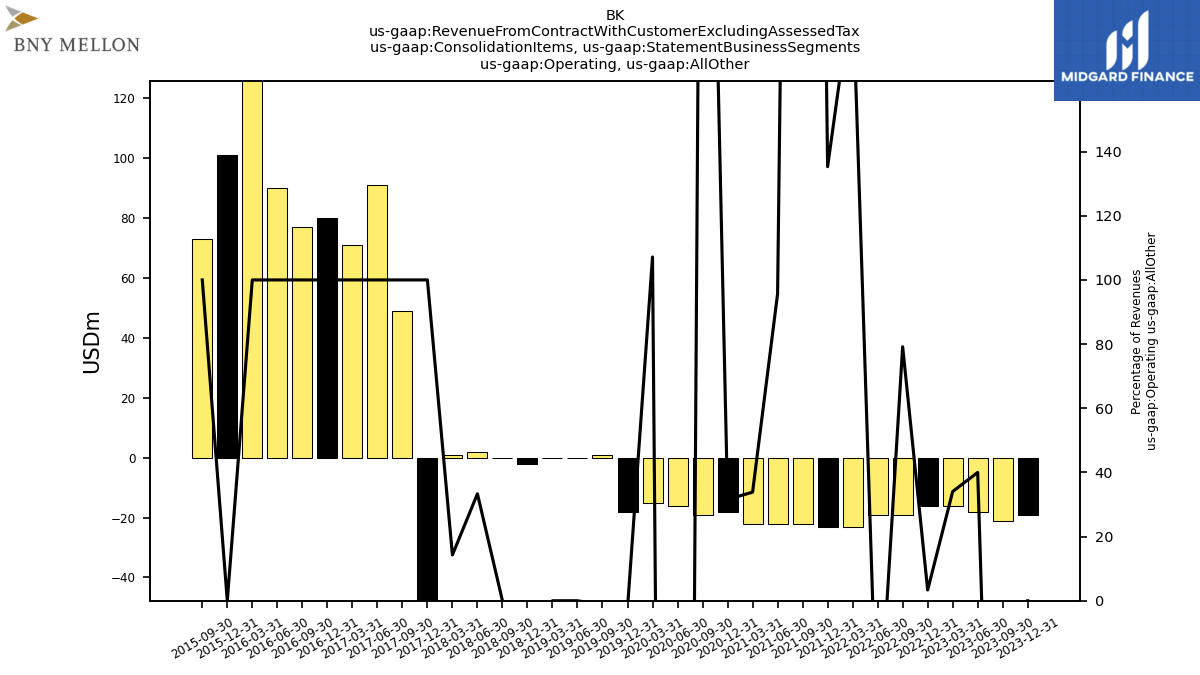
| Operating, All Other | -41.00 | 10.00 | -45.00 | -47.00 | -478.00 | -24.00 | 40.00 | -12.00 | -17.00 | -3.00 | -23.00 | -65.00 | -57.00 | -5.00 | 2.00 | -14.00 | -76.00 | 1.00 | |
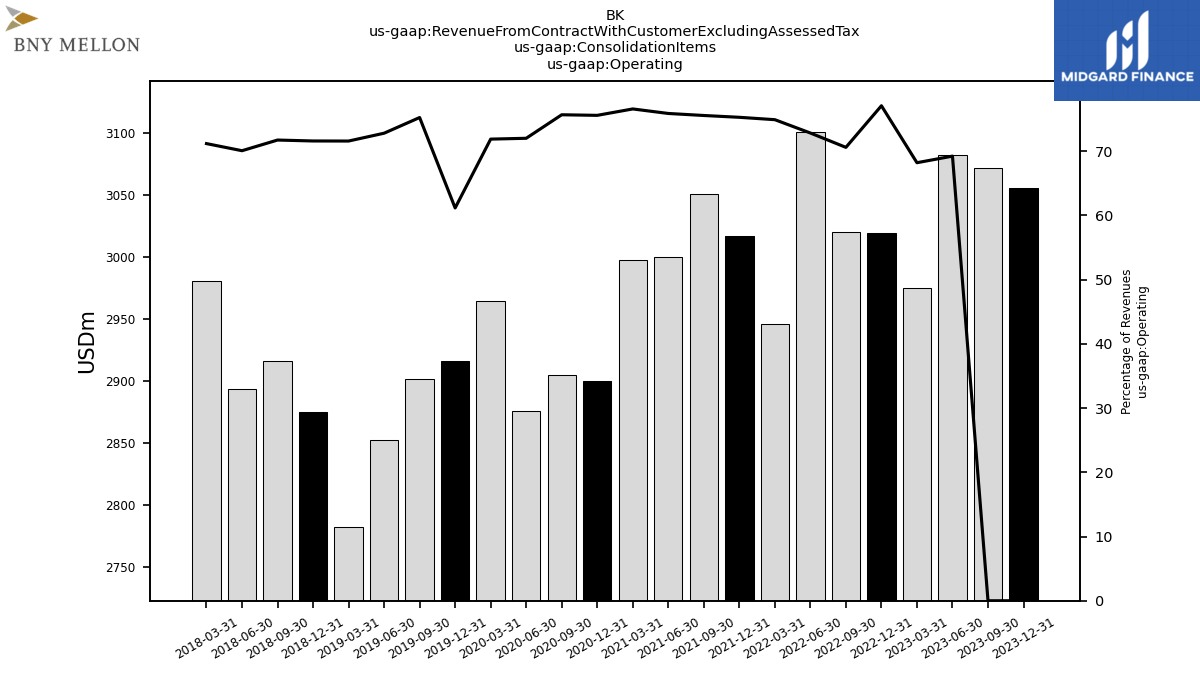
| Operating | 3056.00 | 3072.00 | 3082.00 | 2975.00 | 3019.00 | 3020.00 | 3101.00 | 2946.00 | 3017.00 | 3051.00 | 3000.00 | 2998.00 | 2900.00 | 2905.00 | 2876.00 | 2965.00 | 2902.00 | 2853.00 | |
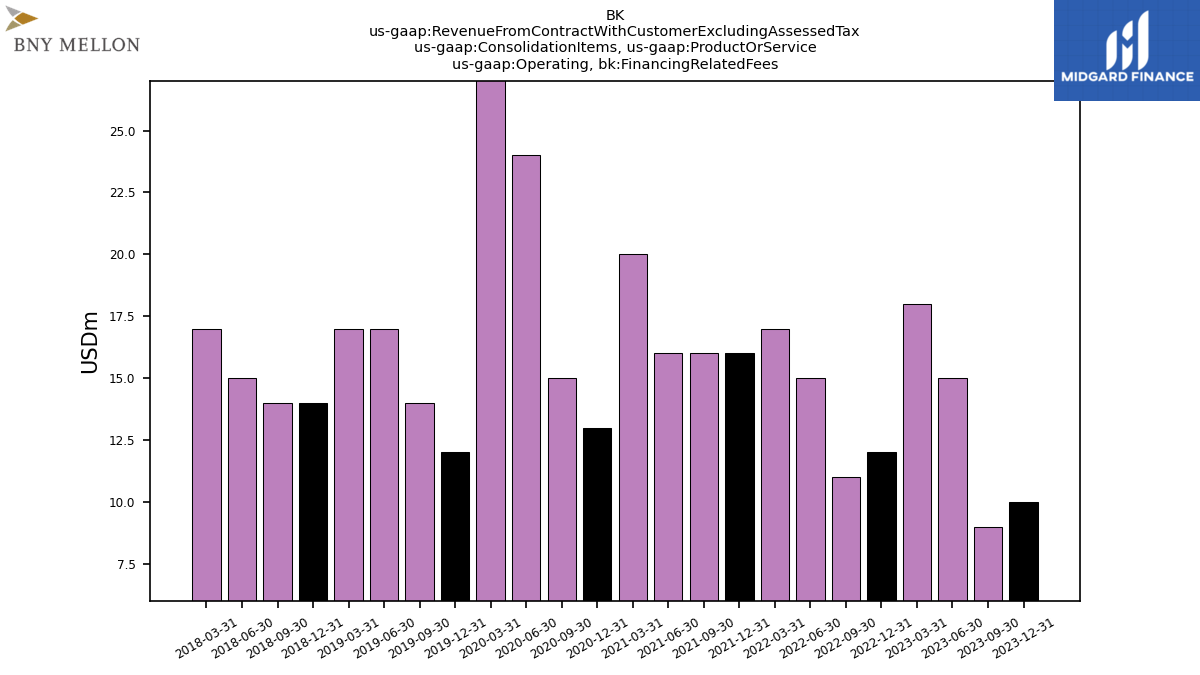
| Operating, Financing Related Fees | 10.00 | 9.00 | 15.00 | 18.00 | 12.00 | 11.00 | 15.00 | 17.00 | 16.00 | 16.00 | 16.00 | 20.00 | 13.00 | 15.00 | 24.00 | 28.00 | 14.00 | 17.00 | |
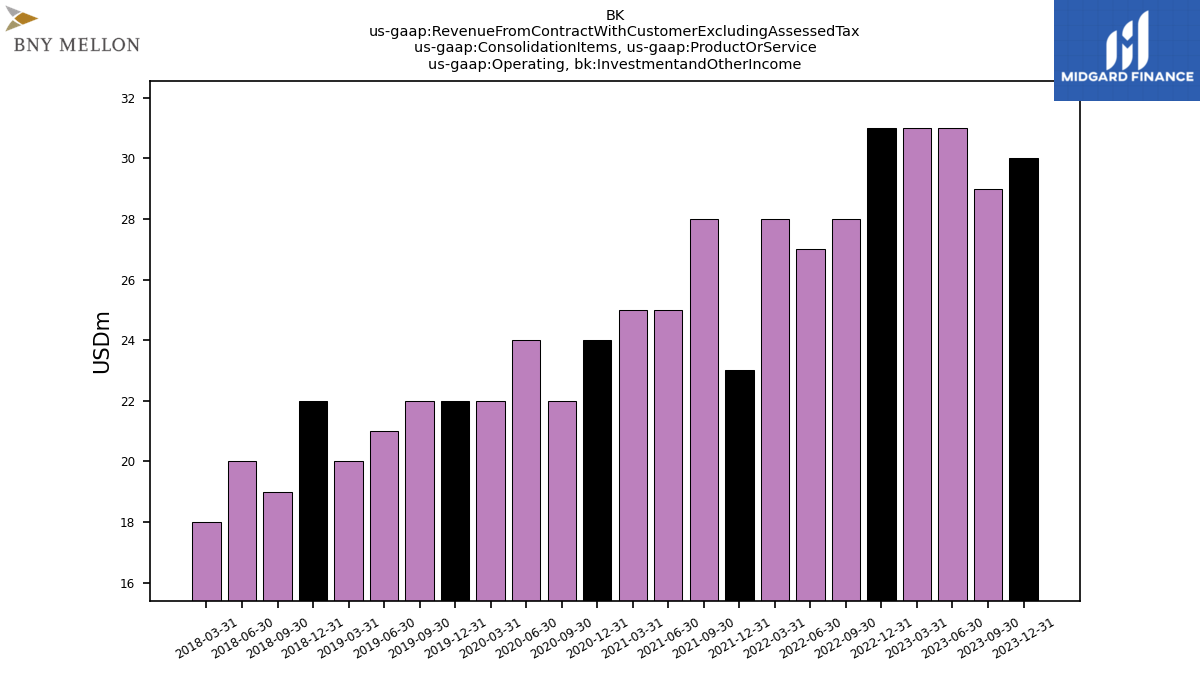
| Operating, Investmentand Other Income | 30.00 | 29.00 | 31.00 | 31.00 | 31.00 | 28.00 | 27.00 | 28.00 | 23.00 | 28.00 | 25.00 | 25.00 | 24.00 | 22.00 | 24.00 | 22.00 | 22.00 | 21.00 | |
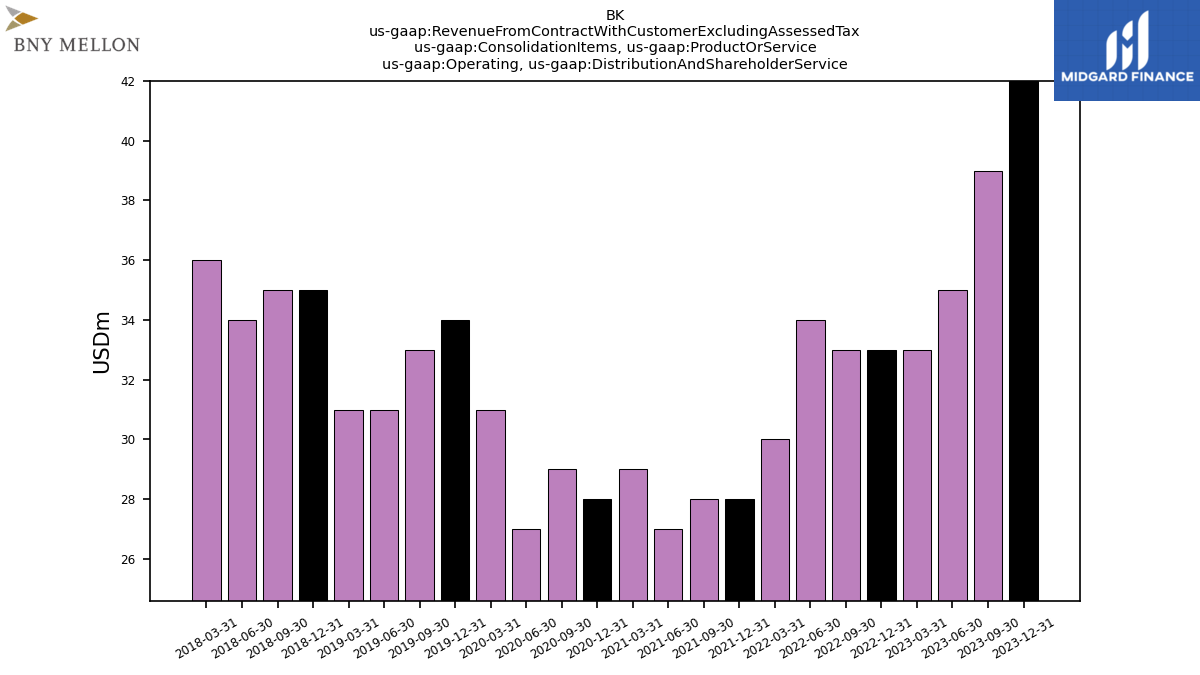
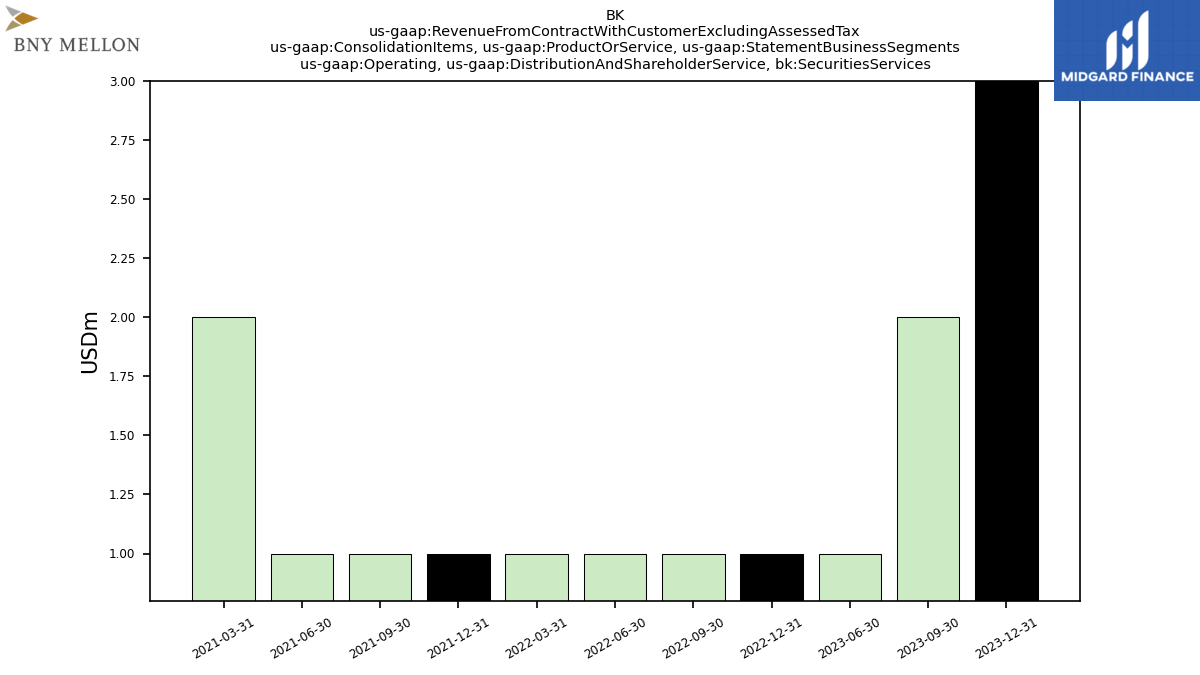
| Operating, Distribution And Shareholder Service | 42.00 | 39.00 | 35.00 | 33.00 | 33.00 | 33.00 | 34.00 | 30.00 | 28.00 | 28.00 | 27.00 | 29.00 | 28.00 | 29.00 | 27.00 | 31.00 | 33.00 | 31.00 | |
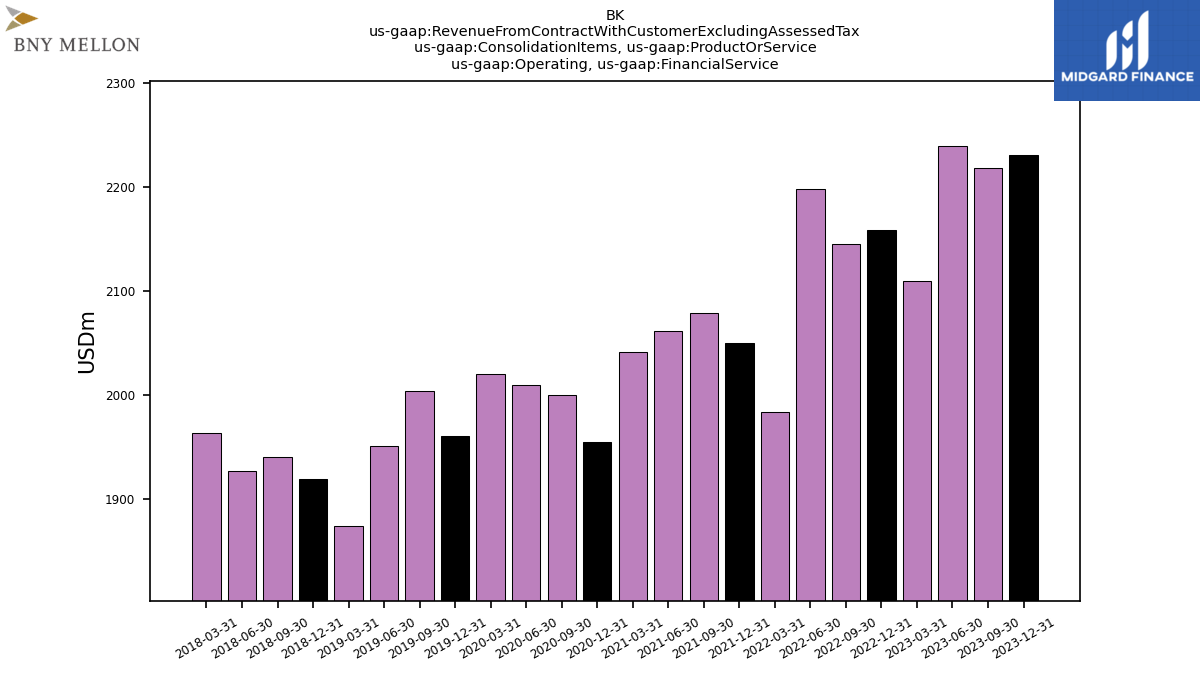
| Operating, Financial Service | 2231.00 | 2219.00 | 2240.00 | 2110.00 | 2159.00 | 2146.00 | 2199.00 | 1984.00 | 2050.00 | 2079.00 | 2062.00 | 2042.00 | 1955.00 | 2000.00 | 2010.00 | 2021.00 | 2004.00 | 1951.00 | |
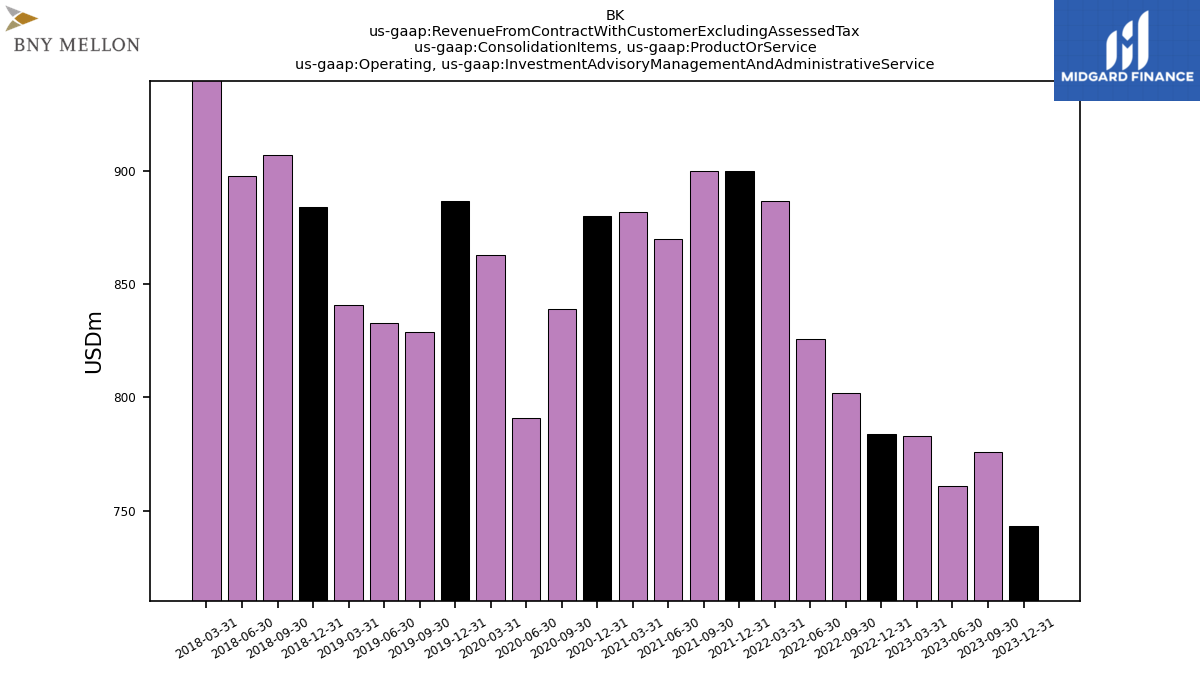
| Operating, Investment Advisory Management And Administrative Service | 743.00 | 776.00 | 761.00 | 783.00 | 784.00 | 802.00 | 826.00 | 887.00 | 900.00 | 900.00 | 870.00 | 882.00 | 880.00 | 839.00 | 791.00 | 863.00 | 829.00 | 833.00 | |
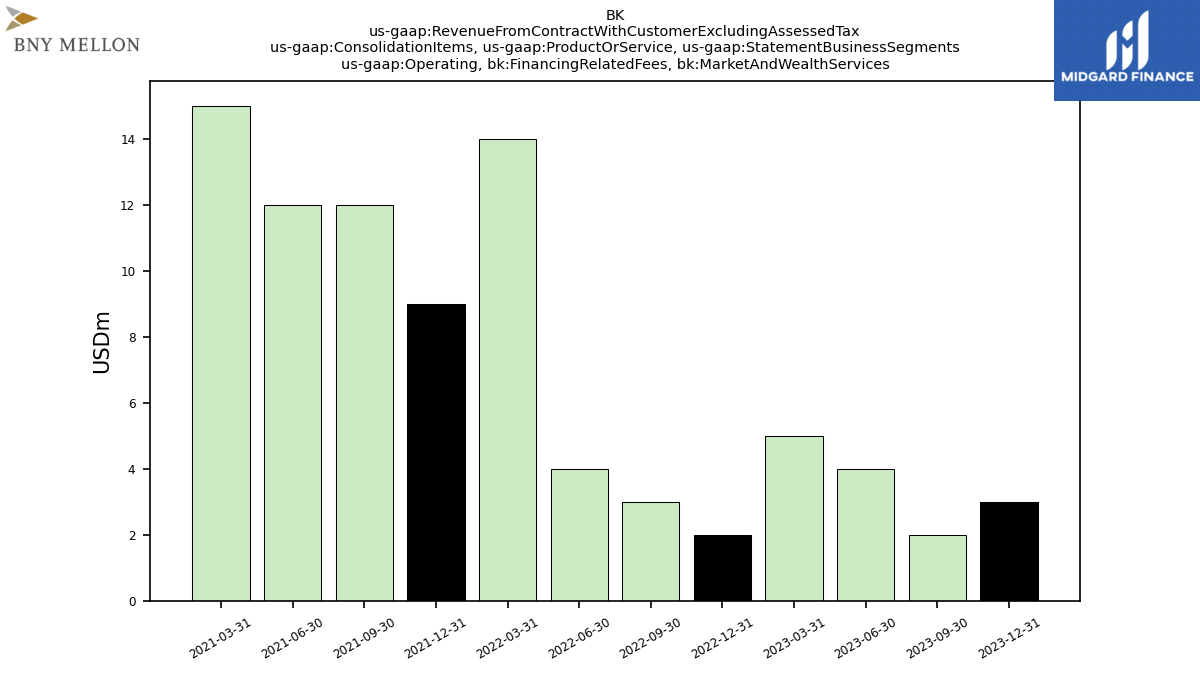
| Operating, Financing Related Fees, Market And Wealth Services | 3.00 | 2.00 | 4.00 | 5.00 | 2.00 | 3.00 | 4.00 | 14.00 | 9.00 | 12.00 | 12.00 | 15.00 | NA | NA | NA | NA | NA | NA | |
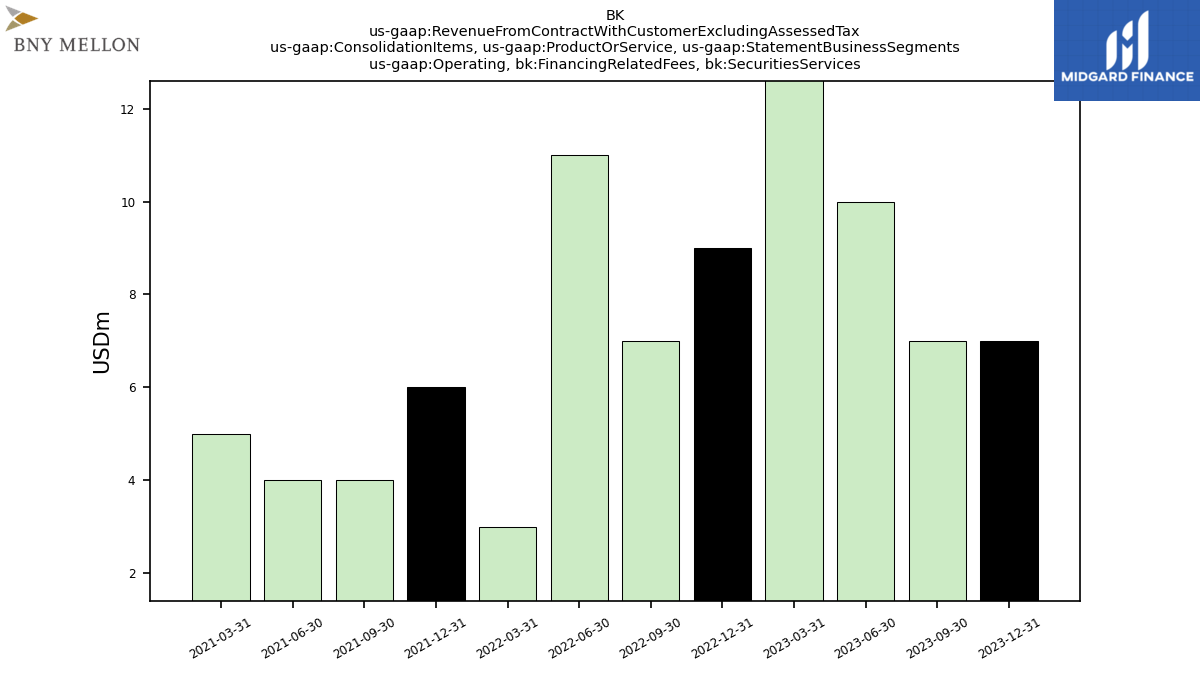
| Operating, Financing Related Fees, Securities Services | 7.00 | 7.00 | 10.00 | 13.00 | 9.00 | 7.00 | 11.00 | 3.00 | 6.00 | 4.00 | 4.00 | 5.00 | NA | NA | NA | NA | NA | NA | |
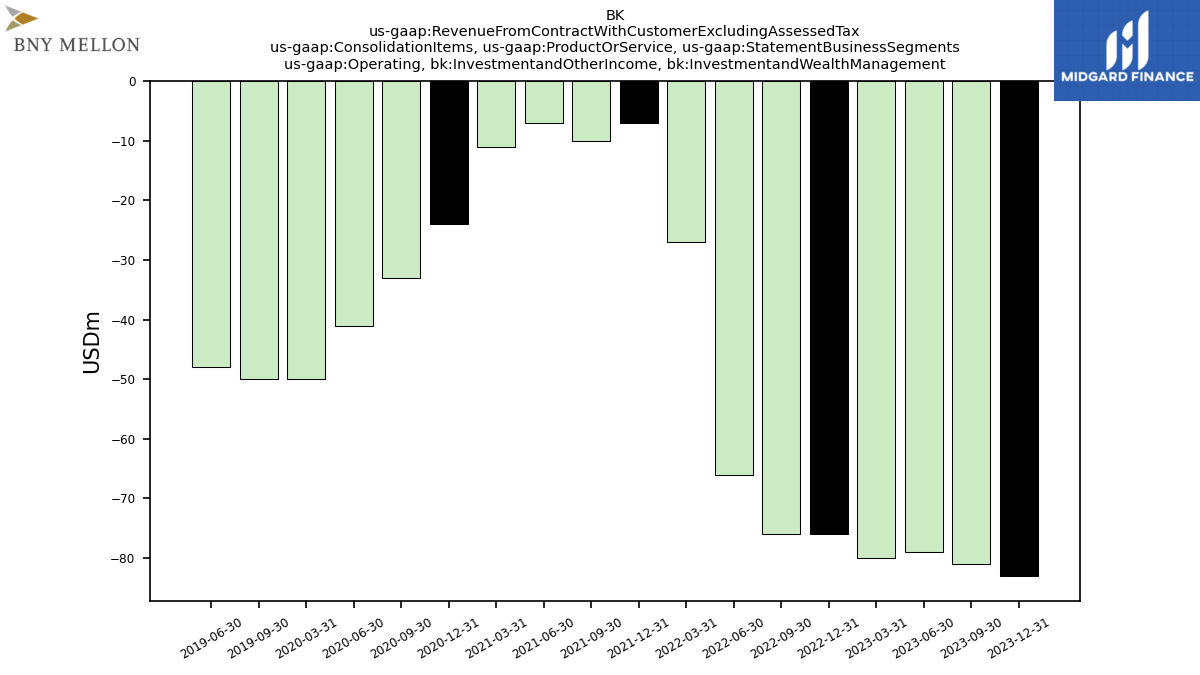
| Operating, Investmentand Other Income, Investmentand Wealth Management | -83.00 | -81.00 | -79.00 | -80.00 | -76.00 | -76.00 | -66.00 | -27.00 | -7.00 | -10.00 | -7.00 | -11.00 | -24.00 | -33.00 | -41.00 | -50.00 | -50.00 | -48.00 | |
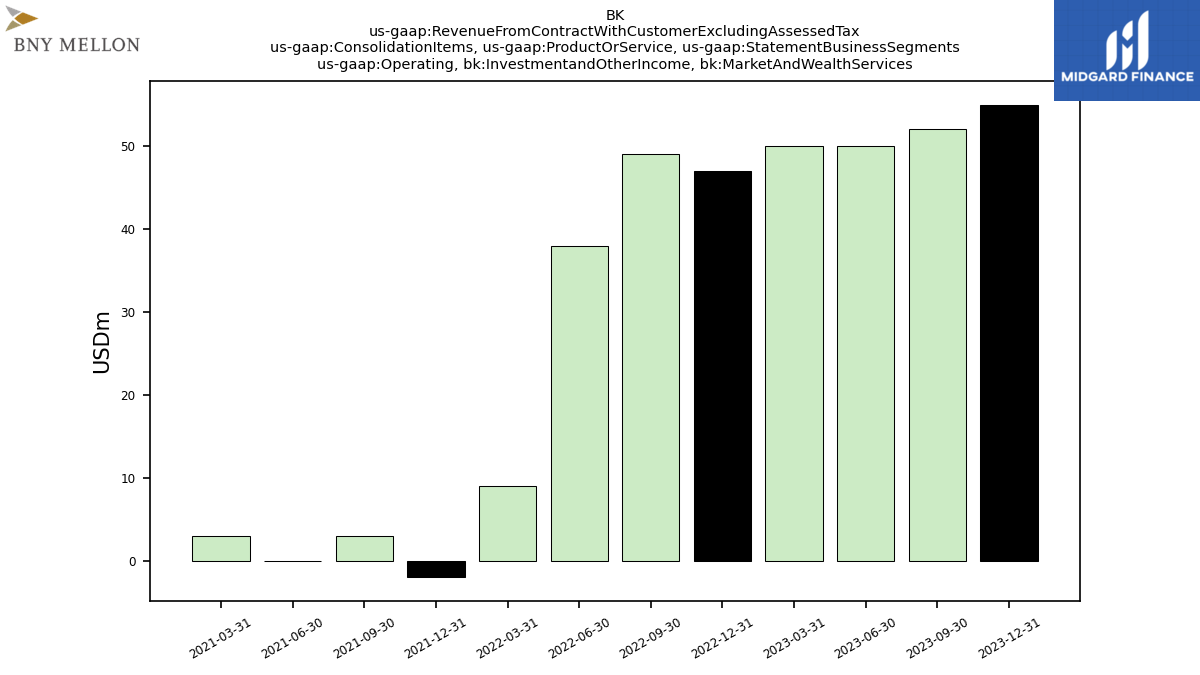
| Operating, Investmentand Other Income, Market And Wealth Services | 55.00 | 52.00 | 50.00 | 50.00 | 47.00 | 49.00 | 38.00 | 9.00 | -2.00 | 3.00 | 0.00 | 3.00 | NA | NA | NA | NA | NA | NA | |
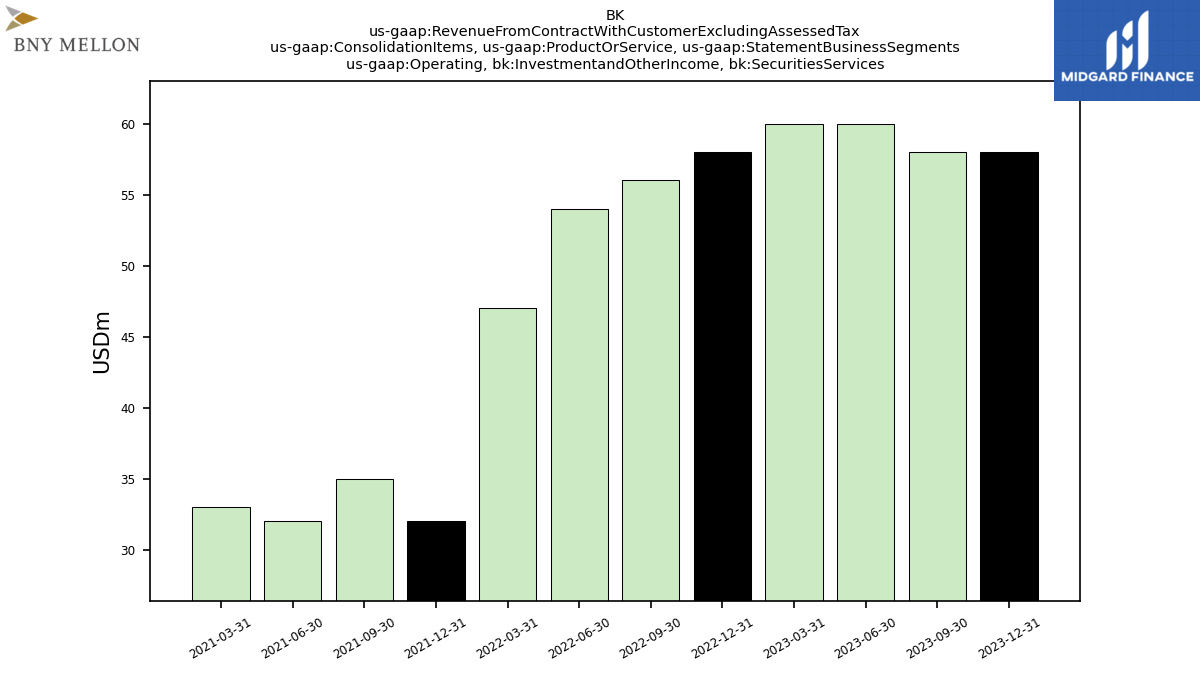
| Operating, Investmentand Other Income, Securities Services | 58.00 | 58.00 | 60.00 | 60.00 | 58.00 | 56.00 | 54.00 | 47.00 | 32.00 | 35.00 | 32.00 | 33.00 | NA | NA | NA | NA | NA | NA | |
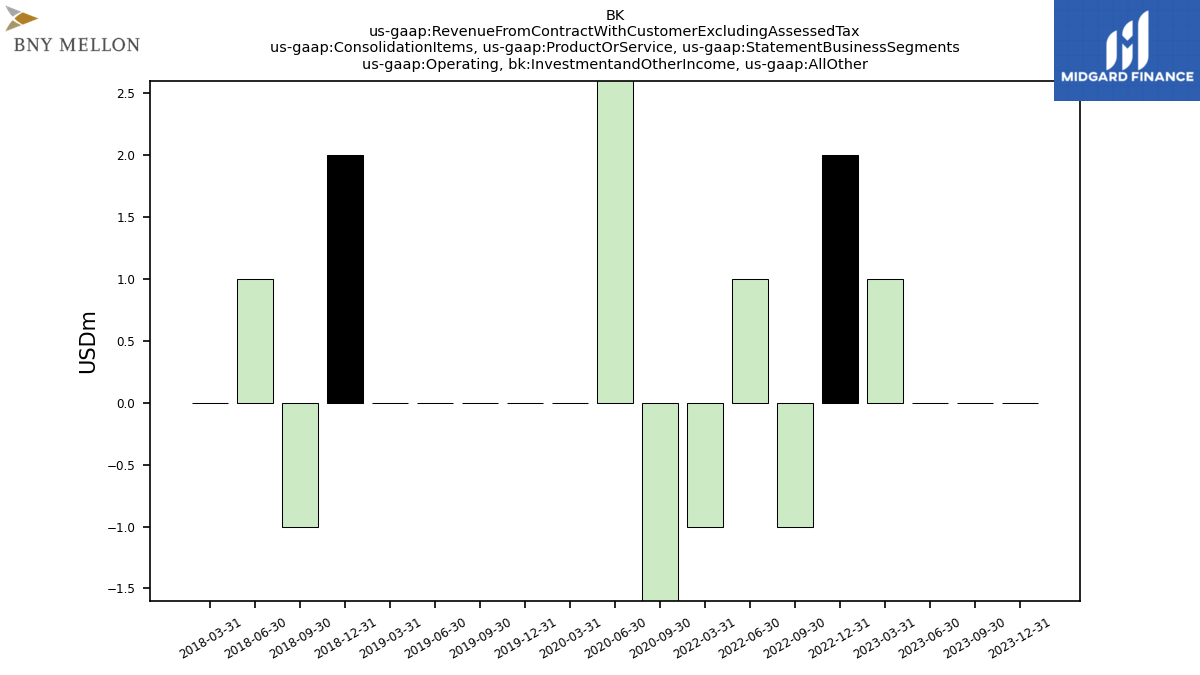
| Operating, Investmentand Other Income, All Other | 0.00 | 0.00 | 0.00 | 1.00 | 2.00 | -1.00 | 1.00 | -1.00 | NA | NA | NA | NA | NA | -2.00 | 3.00 | 0.00 | 0.00 | 0.00 | |
| Operating, Distribution And Shareholder Service, Investmentand Wealth Management | 66.00 | 62.00 | 58.00 | 55.00 | 54.00 | 55.00 | 51.00 | 32.00 | 29.00 | 28.00 | 28.00 | 28.00 | 29.00 | 31.00 | 34.00 | 43.00 | 45.00 | 44.00 | |
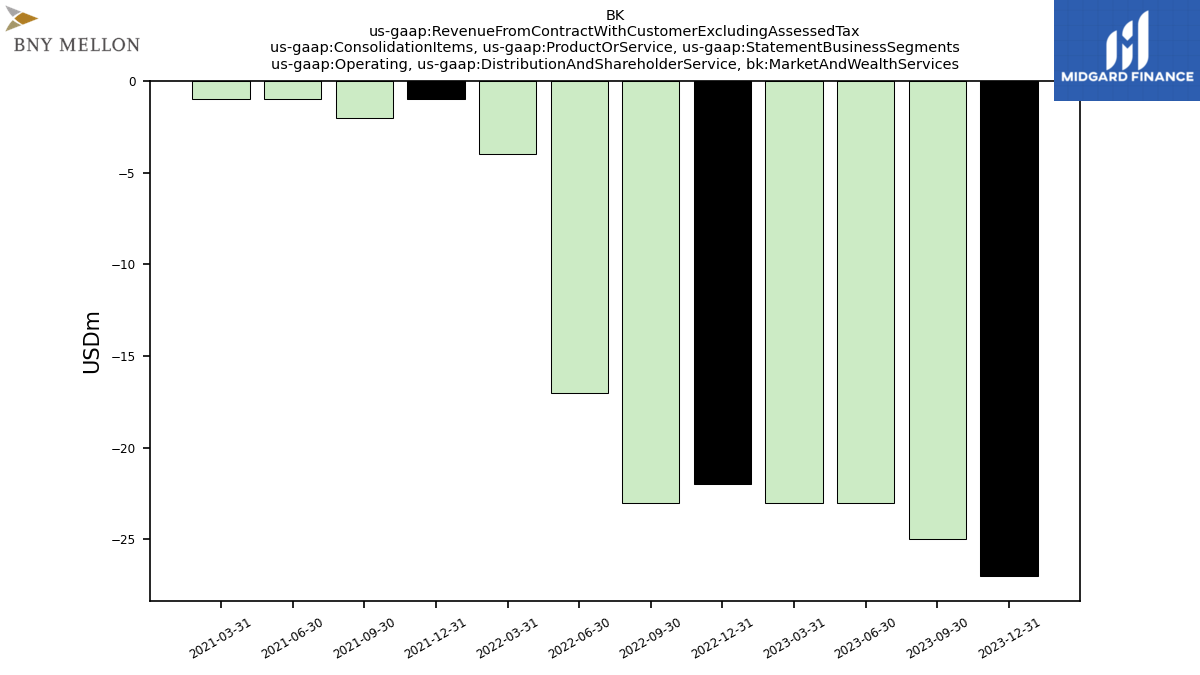
| Operating, Distribution And Shareholder Service, Market And Wealth Services | -27.00 | -25.00 | -23.00 | -23.00 | -22.00 | -23.00 | -17.00 | -4.00 | -1.00 | -2.00 | -1.00 | -1.00 | NA | NA | NA | NA | NA | NA | |
| Operating, Distribution And Shareholder Service, Securities Services | 3.00 | 2.00 | 1.00 | NA | 1.00 | 1.00 | 1.00 | 1.00 | 1.00 | 1.00 | 1.00 | 2.00 | NA | NA | NA | NA | NA | NA | |
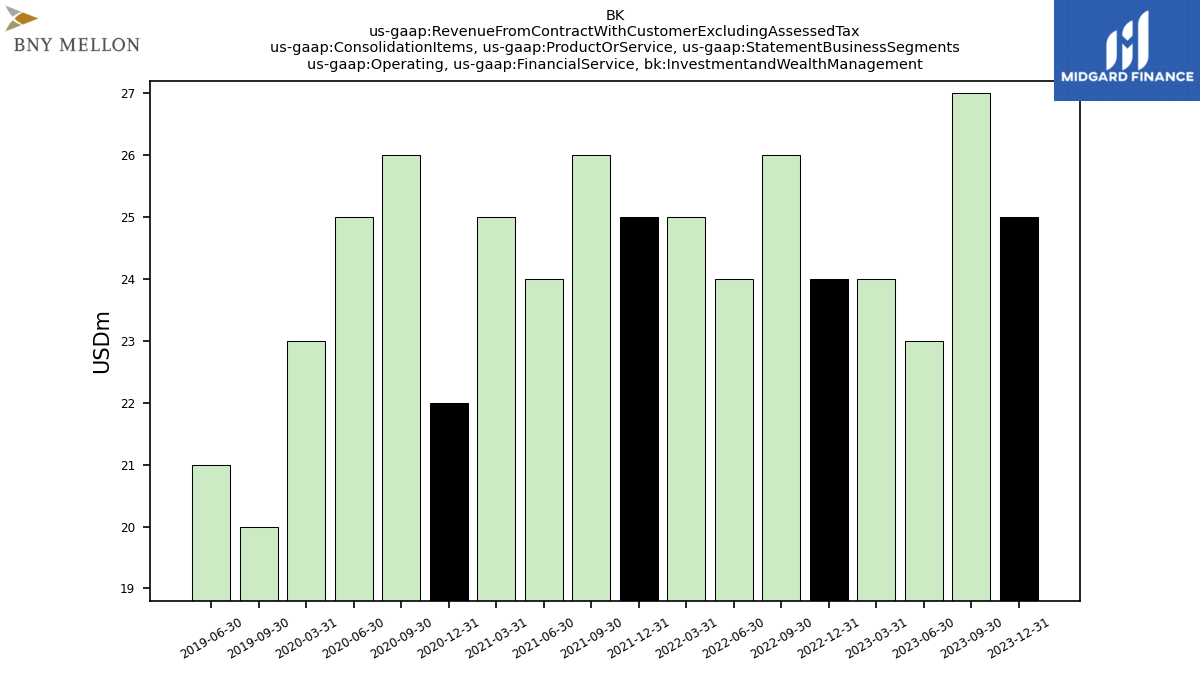
| Operating, Financial Service, Investmentand Wealth Management | 25.00 | 27.00 | 23.00 | 24.00 | 24.00 | 26.00 | 24.00 | 25.00 | 25.00 | 26.00 | 24.00 | 25.00 | 22.00 | 26.00 | 25.00 | 23.00 | 20.00 | 21.00 | |
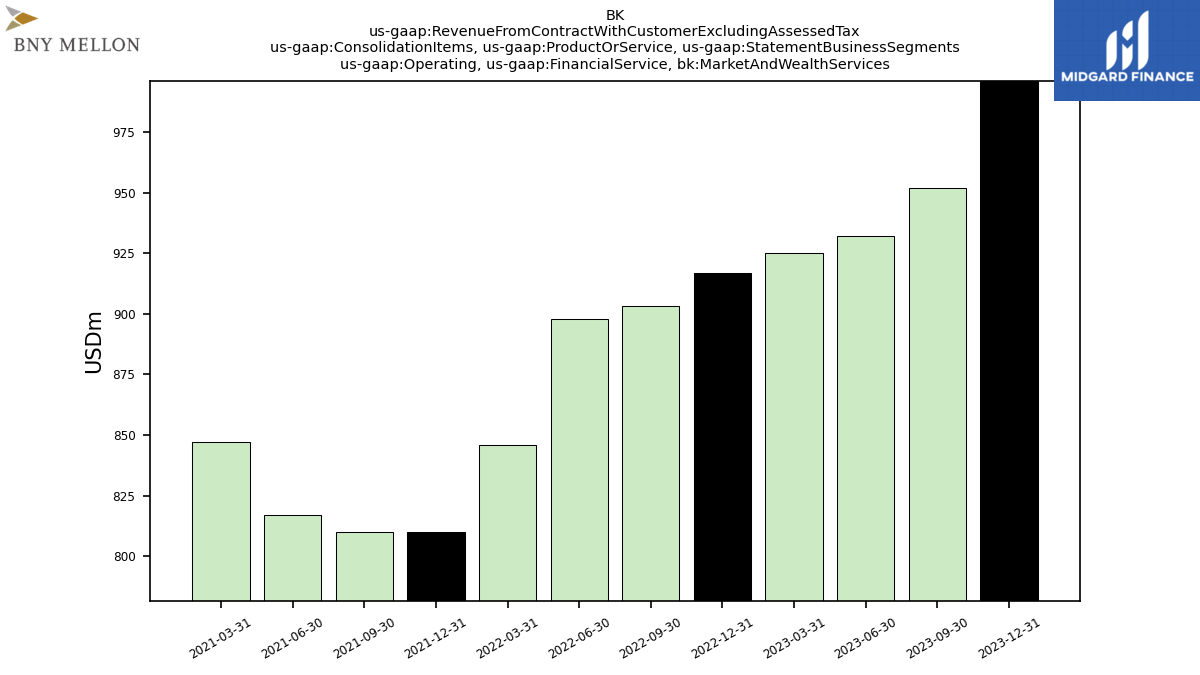
| Operating, Financial Service, Market And Wealth Services | 996.00 | 952.00 | 932.00 | 925.00 | 917.00 | 903.00 | 898.00 | 846.00 | 810.00 | 810.00 | 817.00 | 847.00 | NA | NA | NA | NA | NA | NA | |
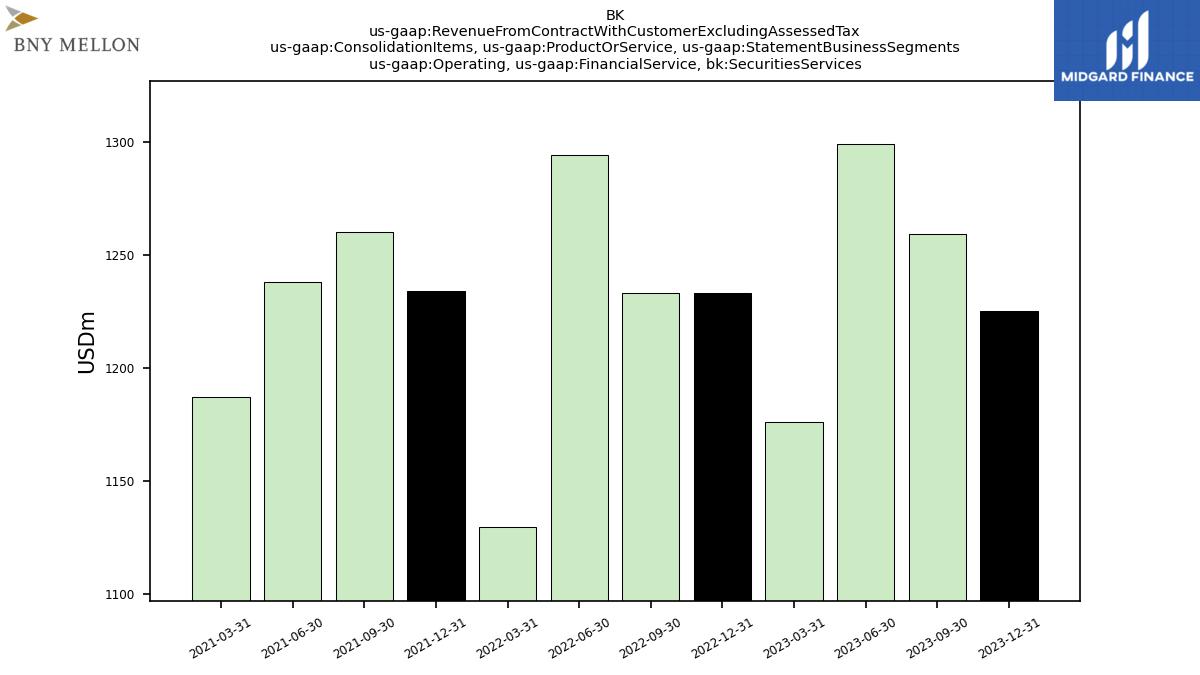
| Operating, Financial Service, Securities Services | 1225.00 | 1259.00 | 1299.00 | 1176.00 | 1233.00 | 1233.00 | 1294.00 | 1130.00 | 1234.00 | 1260.00 | 1238.00 | 1187.00 | NA | NA | NA | NA | NA | NA | |
| Operating, Financial Service, All Other | -15.00 | -19.00 | -14.00 | -15.00 | -15.00 | -16.00 | -17.00 | -17.00 | -19.00 | -17.00 | -17.00 | -17.00 | -13.00 | -15.00 | -14.00 | -11.00 | 1.00 | -1.00 | |
| Operating, Investment Advisory Management And Administrative Service, Investmentand Wealth Management | 742.00 | 774.00 | 760.00 | 781.00 | 781.00 | 800.00 | 822.00 | 887.00 | 899.00 | 901.00 | 870.00 | 883.00 | 881.00 | 838.00 | 792.00 | 862.00 | 829.00 | 833.00 | |
| Operating, Investment Advisory Management And Administrative Service, Market And Wealth Services | 4.00 | 4.00 | 5.00 | 5.00 | 6.00 | 5.00 | 6.00 | 6.00 | 5.00 | 5.00 | 4.00 | 4.00 | NA | NA | NA | NA | NA | NA | |
| Operating, Investment Advisory Management And Administrative Service, All Other | -3.00 | -2.00 | -4.00 | -3.00 | -3.00 | -3.00 | -2.00 | -6.00 | -4.00 | -6.00 | -4.00 | -5.00 | -5.00 | -3.00 | -5.00 | -4.00 | 0.00 | 0.00 | |
| Operating, Investmentand Wealth Management | 751.00 | 782.00 | 762.00 | 780.00 | 784.00 | 805.00 | 831.00 | 917.00 | 946.00 | 945.00 | 915.00 | 925.00 | 908.00 | 863.00 | 811.00 | 878.00 | 844.00 | 850.00 | |
| Operating, Market And Wealth Services | 1031.00 | 985.00 | 968.00 | 962.00 | 950.00 | 937.00 | 929.00 | 871.00 | 821.00 | 828.00 | 832.00 | 868.00 | NA | NA | NA | NA | NA | NA | |
| Operating, Securities Services | 1293.00 | 1326.00 | 1370.00 | 1249.00 | 1301.00 | 1297.00 | 1360.00 | 1181.00 | 1273.00 | 1300.00 | 1275.00 | 1227.00 | NA | NA | NA | NA | NA | NA | |
| Operating, All Other | -19.00 | -21.00 | -18.00 | -16.00 | -16.00 | -19.00 | -19.00 | -23.00 | -23.00 | -22.00 | -22.00 | -22.00 | -18.00 | -19.00 | -16.00 | -15.00 | 1.00 | 0.00 |