
| 2023-12-31 | 2023-09-30 | 2023-06-30 | 2023-03-31 | 2022-12-31 | 2022-09-30 | 2022-06-30 | 2022-03-31 | 2021-12-31 | 2021-09-30 | 2021-06-30 | 2021-03-31 | 2020-12-31 | 2020-09-30 | 2020-06-30 | 2020-03-31 | 2019-12-31 | 2019-09-30 | 2019-06-30 | 2019-03-31 | 2018-12-31 | 2018-09-30 | 2018-06-30 | 2018-03-31 | 2017-12-31 | 2017-09-30 | 2017-06-30 | 2017-03-31 | 2016-12-31 | 2016-09-30 | 2016-06-30 | 2016-03-31 | 2015-12-31 | 2015-09-30 | 2015-06-30 | 2015-03-31 | 2014-12-31 | 2014-09-30 | 2014-06-30 | 2014-03-31 | 2013-12-31 | 2013-09-30 | 2013-06-30 | 2013-03-31 | 2012-12-31 | 2012-09-30 | 2012-06-30 | 2012-03-31 | 2011-12-31 | 2011-09-30 | 2011-06-30 | 2010-12-31 | ||
|---|---|---|---|---|---|---|---|---|---|---|---|---|---|---|---|---|---|---|---|---|---|---|---|---|---|---|---|---|---|---|---|---|---|---|---|---|---|---|---|---|---|---|---|---|---|---|---|---|---|---|---|---|---|
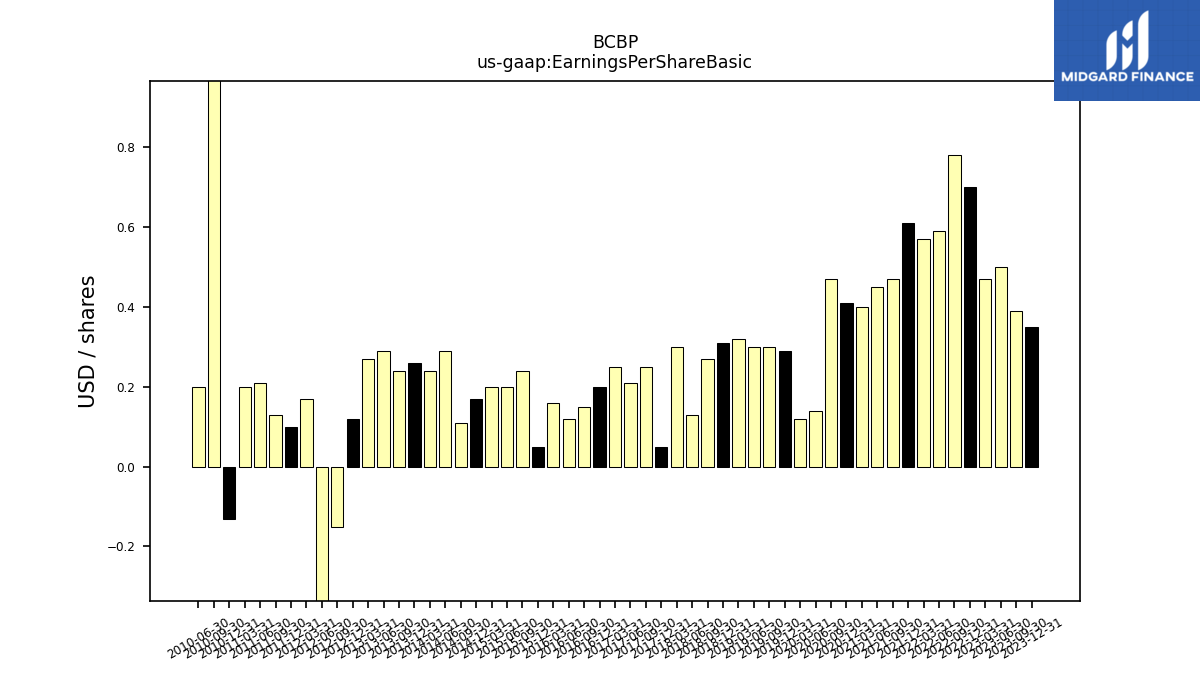
| Earnings Per Share Basic | 0.35 | 0.39 | 0.50 | 0.47 | 0.70 | 0.78 | 0.59 | 0.57 | 0.61 | 0.47 | 0.45 | 0.40 | 0.41 | 0.47 | 0.14 | 0.12 | 0.29 | 0.30 | 0.30 | 0.32 | 0.31 | 0.27 | 0.13 | 0.30 | 0.05 | 0.25 | 0.21 | 0.25 | 0.20 | 0.15 | 0.12 | 0.16 | 0.05 | 0.24 | 0.20 | 0.20 | 0.17 | 0.11 | 0.29 | 0.24 | 0.26 | 0.24 | 0.29 | 0.27 | 0.12 | -0.15 | -0.37 | 0.17 | 0.10 | 0.13 | 0.21 | -0.13 | |
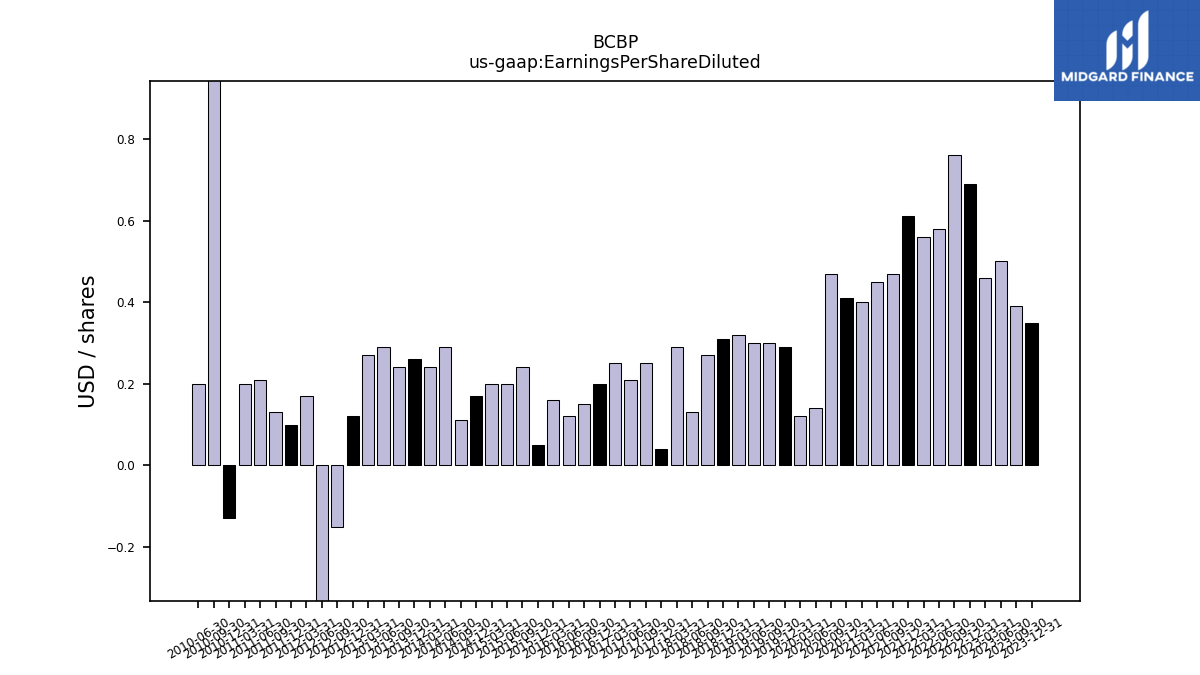
| Earnings Per Share Diluted | 0.35 | 0.39 | 0.50 | 0.46 | 0.69 | 0.76 | 0.58 | 0.56 | 0.61 | 0.47 | 0.45 | 0.40 | 0.41 | 0.47 | 0.14 | 0.12 | 0.29 | 0.30 | 0.30 | 0.32 | 0.31 | 0.27 | 0.13 | 0.29 | 0.04 | 0.25 | 0.21 | 0.25 | 0.20 | 0.15 | 0.12 | 0.16 | 0.05 | 0.24 | 0.20 | 0.20 | 0.17 | 0.11 | 0.29 | 0.24 | 0.26 | 0.24 | 0.29 | 0.27 | 0.12 | -0.15 | -0.37 | 0.17 | 0.10 | 0.13 | 0.21 | -0.13 |
| 2023-12-31 | 2023-09-30 | 2023-06-30 | 2023-03-31 | 2022-12-31 | 2022-09-30 | 2022-06-30 | 2022-03-31 | 2021-12-31 | 2021-09-30 | 2021-06-30 | 2021-03-31 | 2020-12-31 | 2020-09-30 | 2020-06-30 | 2020-03-31 | 2019-12-31 | 2019-09-30 | 2019-06-30 | 2019-03-31 | 2018-12-31 | 2018-09-30 | 2018-06-30 | 2018-03-31 | 2017-12-31 | 2017-09-30 | 2017-06-30 | 2017-03-31 | 2016-12-31 | 2016-09-30 | 2016-06-30 | 2016-03-31 | 2015-12-31 | 2015-09-30 | 2015-06-30 | 2015-03-31 | 2014-12-31 | 2014-09-30 | 2014-06-30 | 2014-03-31 | 2013-12-31 | 2013-09-30 | 2013-06-30 | 2013-03-31 | 2012-12-31 | 2012-09-30 | 2012-06-30 | 2012-03-31 | 2011-12-31 | 2011-09-30 | 2011-06-30 | 2010-12-31 | ||
|---|---|---|---|---|---|---|---|---|---|---|---|---|---|---|---|---|---|---|---|---|---|---|---|---|---|---|---|---|---|---|---|---|---|---|---|---|---|---|---|---|---|---|---|---|---|---|---|---|---|---|---|---|---|
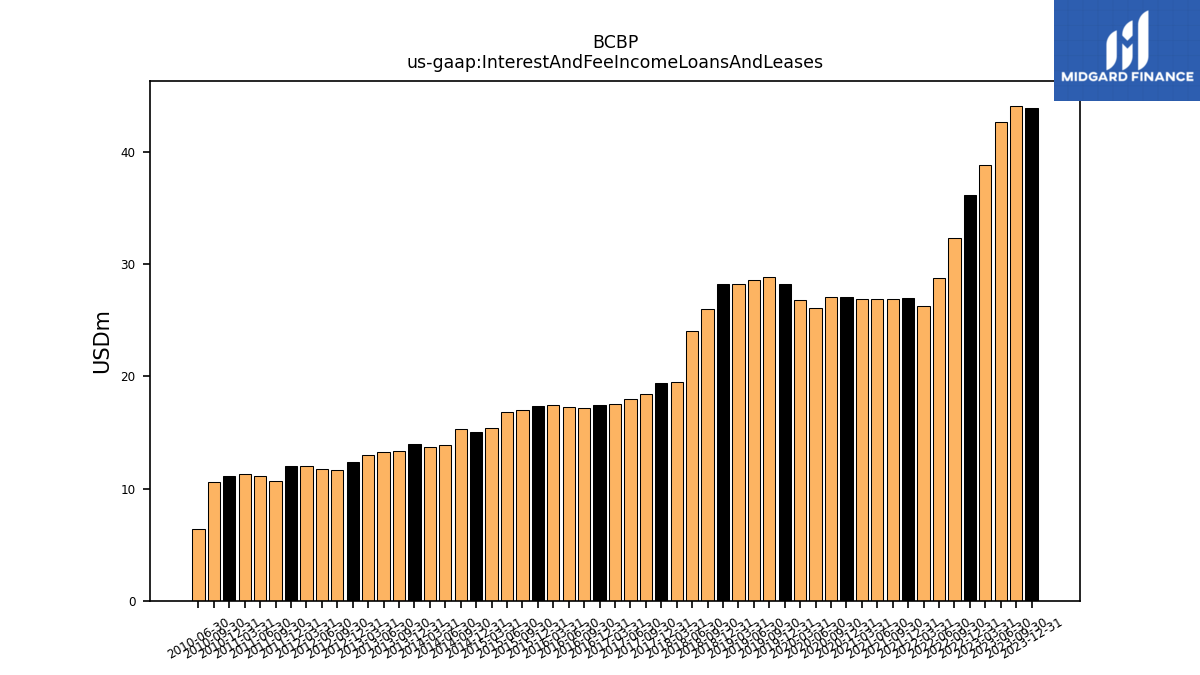
| Interest And Fee Income Loans And Leases | 43.89 | 44.13 | 42.64 | 38.89 | 36.17 | 32.30 | 28.78 | 26.32 | 26.99 | 26.92 | 26.89 | 26.86 | 27.09 | 27.13 | 26.12 | 26.81 | 28.25 | 28.86 | 28.63 | 28.23 | 28.24 | 26.02 | 24.05 | 19.52 | 19.39 | 18.40 | 18.03 | 17.54 | 17.46 | 17.19 | 17.26 | 17.49 | 17.36 | 17.03 | 16.86 | 15.37 | 15.01 | 15.29 | 13.88 | 13.68 | 13.94 | 13.34 | 13.25 | 12.99 | 12.40 | 11.63 | 11.76 | 11.97 | 12.01 | 10.66 | 11.09 | 11.15 | |
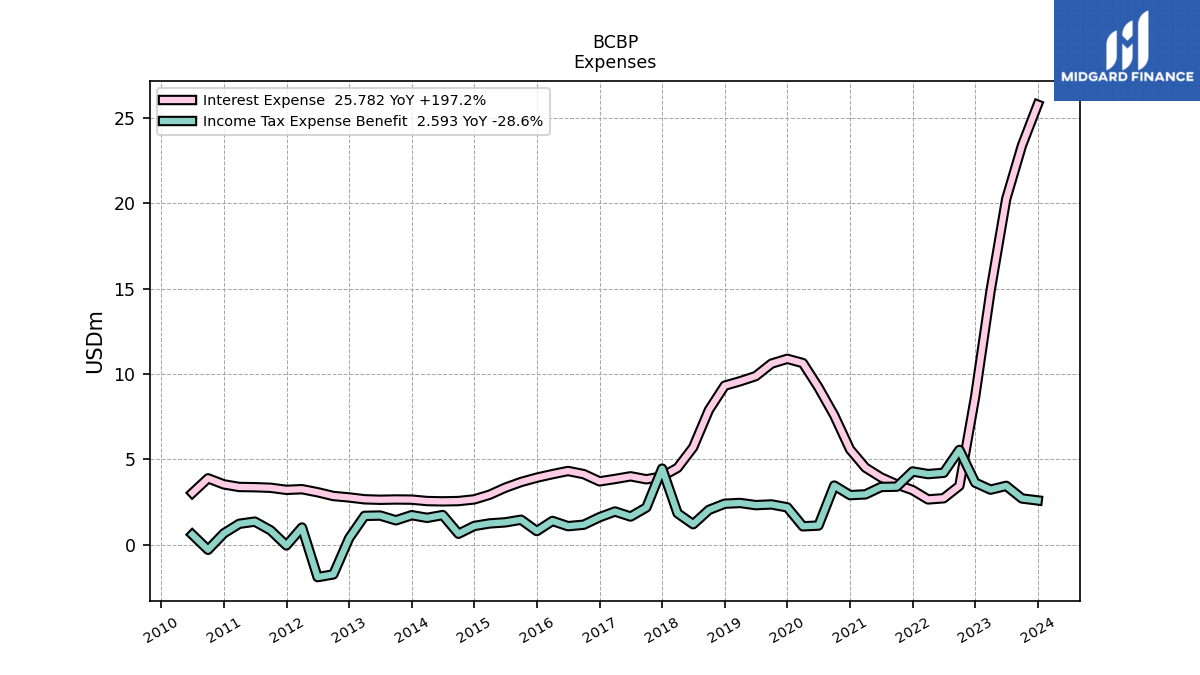
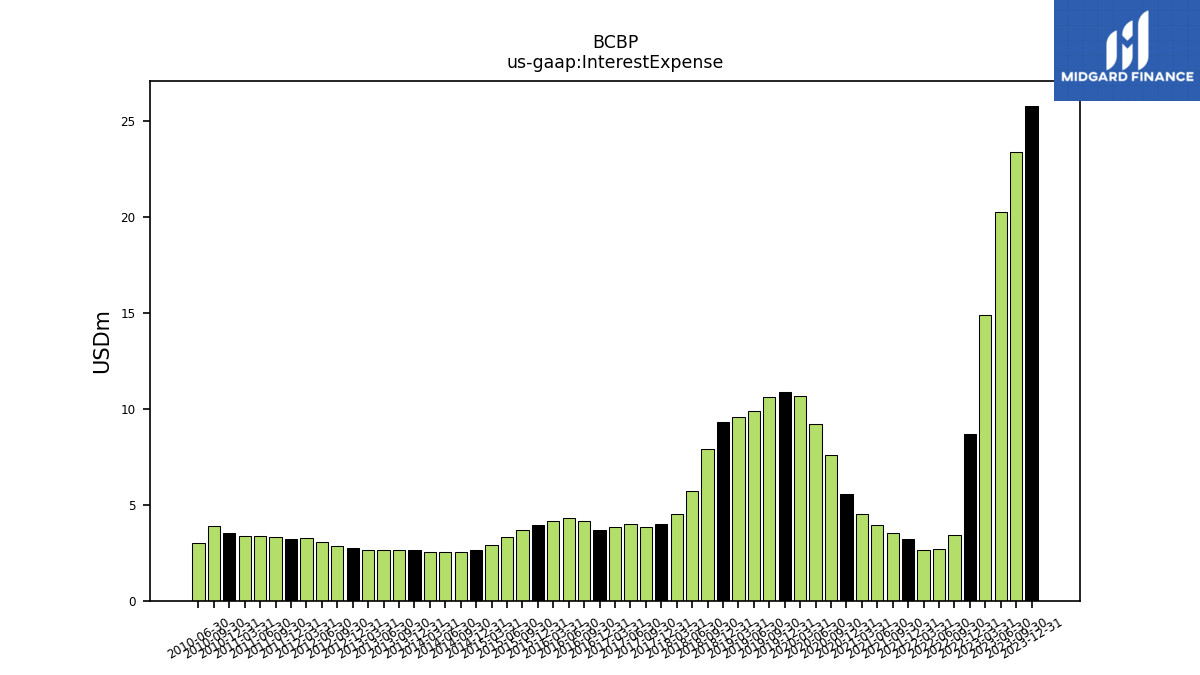
| Interest Expense | 25.78 | 23.39 | 20.25 | 14.88 | 8.68 | 3.45 | 2.72 | 2.65 | 3.20 | 3.53 | 3.94 | 4.51 | 5.58 | 7.58 | 9.21 | 10.64 | 10.89 | 10.61 | 9.88 | 9.58 | 9.32 | 7.89 | 5.71 | 4.50 | 4.00 | 3.83 | 4.01 | 3.85 | 3.71 | 4.13 | 4.32 | 4.13 | 3.93 | 3.67 | 3.34 | 2.93 | 2.65 | 2.56 | 2.54 | 2.56 | 2.64 | 2.65 | 2.63 | 2.66 | 2.77 | 2.85 | 3.07 | 3.25 | 3.21 | 3.33 | 3.37 | 3.54 | |
| Interest Income Expense Net | 23.92 | 25.68 | 26.99 | 27.47 | 30.18 | 30.95 | 27.74 | 25.07 | 25.15 | 24.61 | 24.06 | 23.56 | 22.75 | 20.89 | 17.99 | 18.78 | 20.08 | 20.76 | 20.86 | 20.90 | 21.17 | 20.08 | 19.99 | 16.44 | 16.64 | 15.57 | 15.06 | 14.61 | 14.40 | 13.60 | 13.36 | 13.70 | 13.68 | 13.54 | 13.70 | 12.59 | 12.53 | 13.05 | 12.24 | 12.06 | 12.20 | 11.59 | 11.57 | 11.42 | 10.90 | 10.26 | 10.25 | 10.30 | 10.63 | 9.39 | 9.88 | 8.89 | |
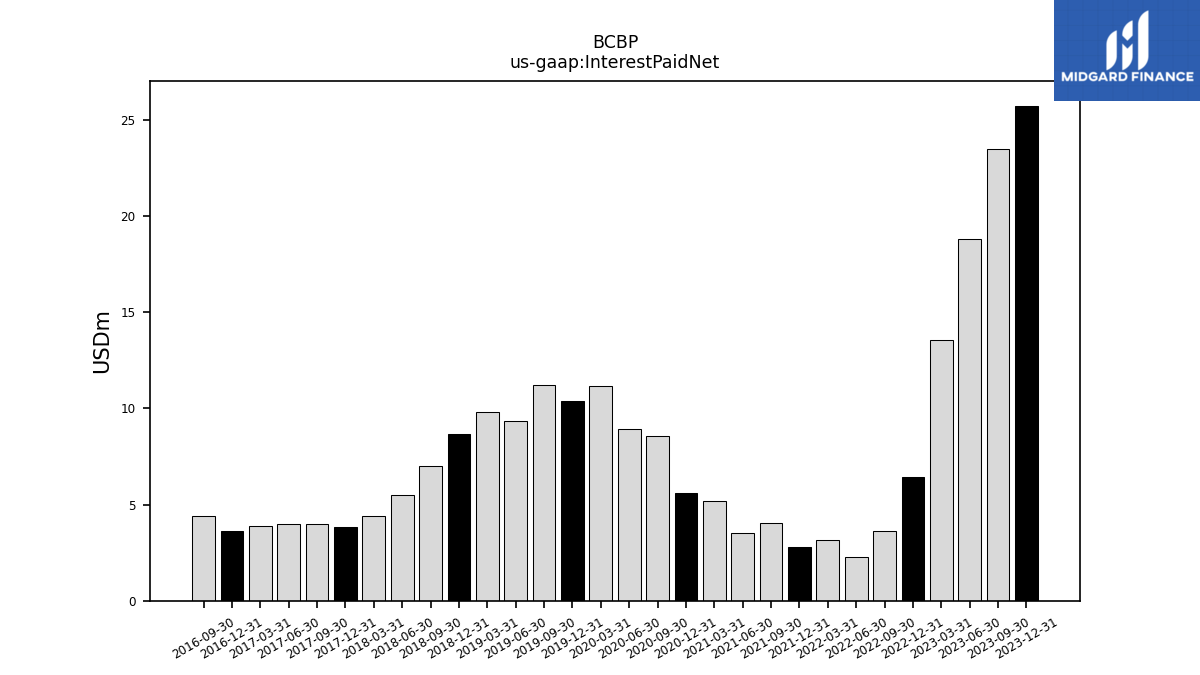
| Interest Paid Net | 25.74 | 23.47 | 18.80 | 13.58 | 6.44 | 3.62 | 2.27 | 3.15 | 2.81 | 4.07 | 3.55 | 5.17 | 5.61 | 8.58 | 8.91 | 11.16 | 10.41 | 11.23 | 9.32 | 9.84 | 8.68 | 7.02 | 5.52 | 4.42 | 3.82 | 3.99 | 4.01 | 3.89 | 3.64 | 4.43 | NA | NA | NA | NA | NA | NA | NA | NA | NA | NA | NA | NA | NA | NA | NA | NA | NA | NA | NA | NA | NA | NA | |
| Income Tax Expense Benefit | 2.59 | 2.71 | 3.45 | 3.23 | 3.63 | 5.55 | 4.21 | 4.14 | 4.29 | 3.40 | 3.38 | 2.95 | 2.90 | 3.46 | 1.12 | 1.08 | 2.19 | 2.36 | 2.32 | 2.44 | 2.40 | 2.04 | 1.20 | 1.84 | 4.46 | 2.18 | 1.65 | 1.95 | 1.61 | 1.17 | 1.08 | 1.39 | 0.80 | 1.46 | 1.31 | 1.25 | 1.10 | 0.64 | 1.74 | 1.57 | 1.73 | 1.43 | 1.71 | 1.69 | 0.38 | -1.74 | -1.90 | 1.01 | -0.04 | 0.84 | 1.35 | 0.66 | |
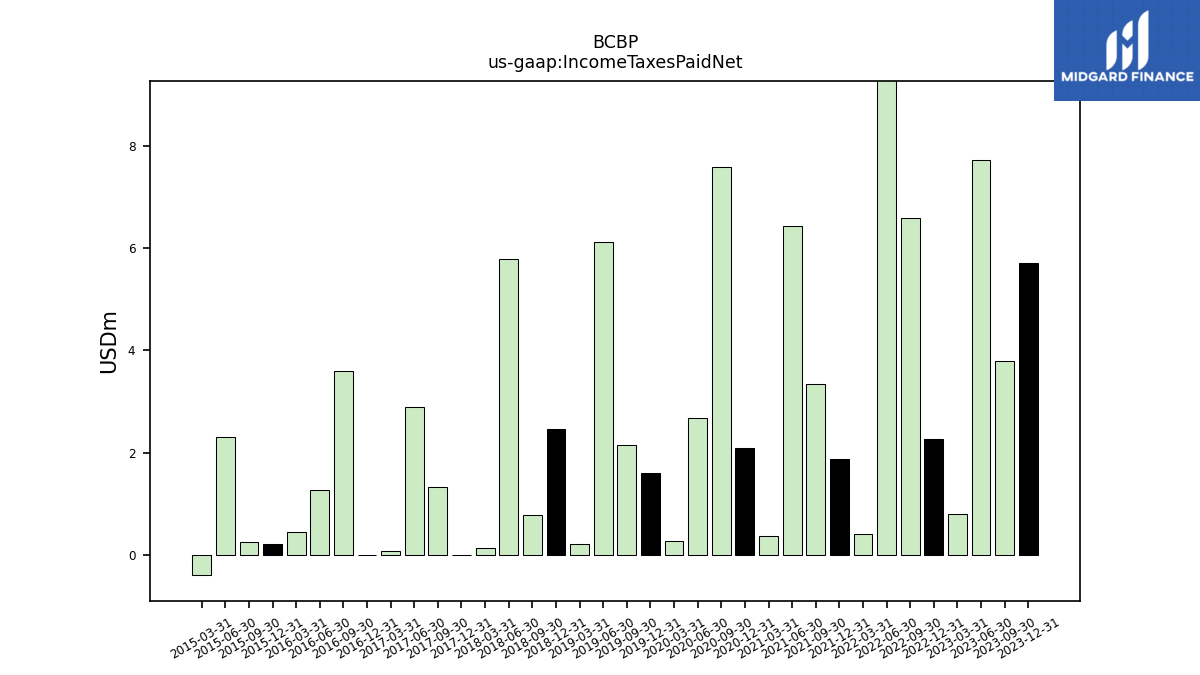
| Income Taxes Paid Net | 5.71 | 3.80 | 7.72 | 0.80 | 2.27 | 6.58 | 9.54 | 0.41 | 1.87 | 3.35 | 6.42 | 0.38 | 2.10 | 7.59 | 2.69 | 0.28 | 1.60 | 2.15 | 6.12 | 0.22 | 2.46 | 0.77 | 5.79 | 0.14 | 0.00 | 1.32 | 2.89 | 0.07 | 0.00 | 3.59 | 1.27 | 0.45 | 0.21 | 0.26 | 2.31 | -0.40 | NA | NA | NA | NA | NA | NA | NA | NA | NA | NA | NA | NA | NA | NA | NA | NA | |
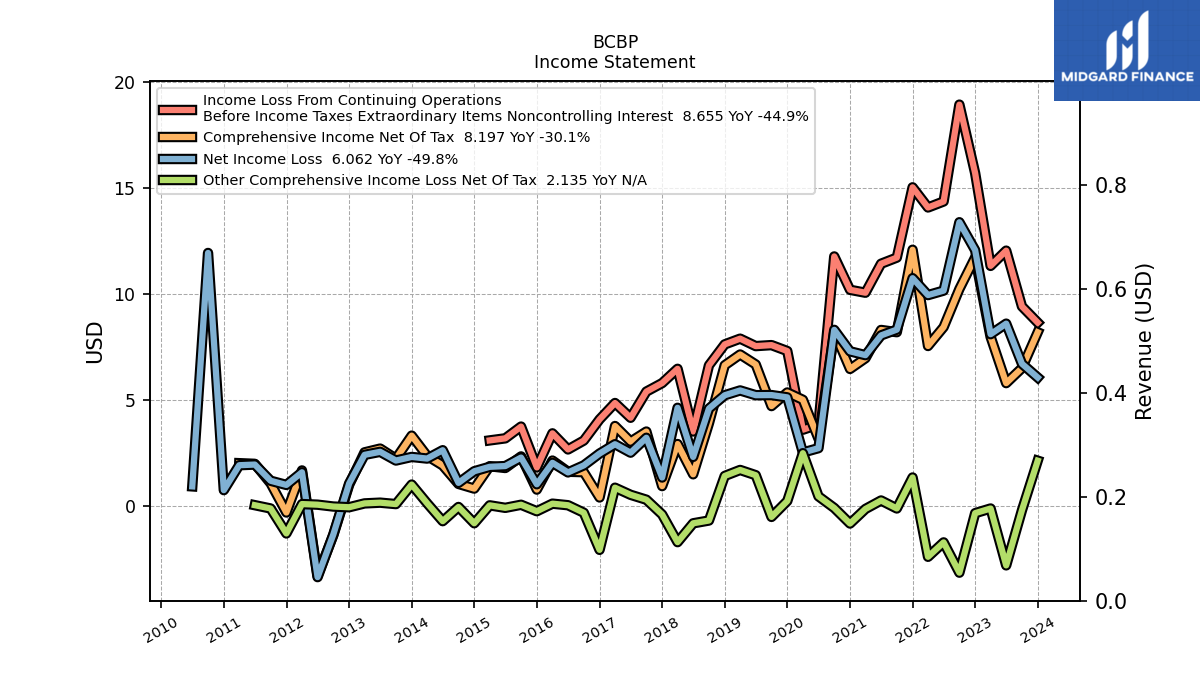
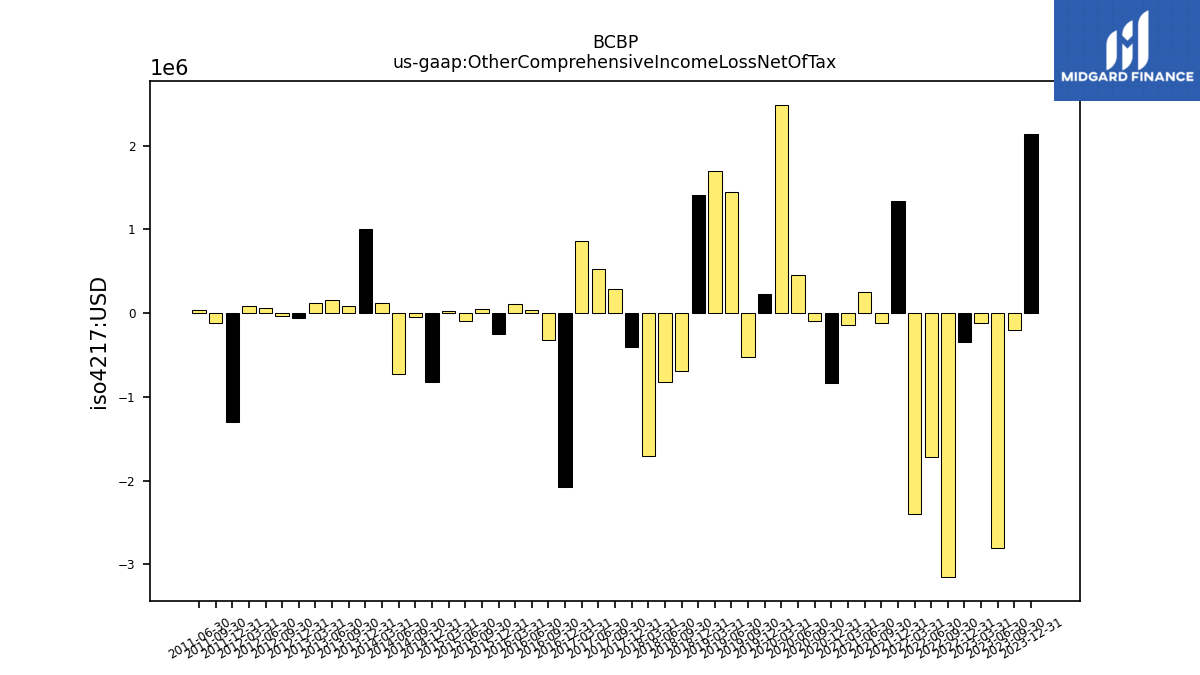
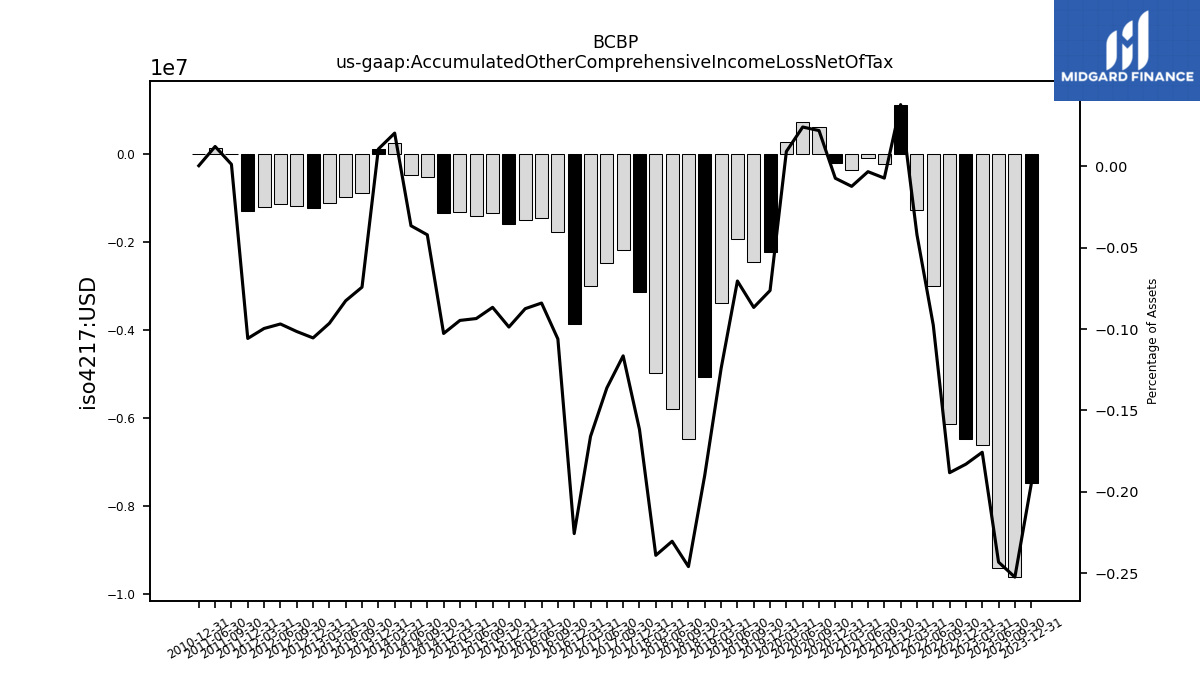
| Other Comprehensive Income Loss Net Of Tax | 2.13 | -0.20 | -2.81 | -0.12 | -0.34 | -3.15 | -1.72 | -2.40 | 1.34 | -0.12 | 0.26 | -0.14 | -0.83 | -0.10 | 0.45 | 2.49 | 0.23 | -0.52 | 1.45 | 1.70 | 1.41 | -0.69 | -0.82 | -1.71 | -0.41 | 0.29 | 0.52 | 0.86 | -2.08 | -0.32 | 0.03 | 0.11 | -0.25 | 0.05 | -0.09 | 0.03 | -0.82 | -0.05 | -0.72 | 0.13 | 1.01 | 0.09 | 0.15 | 0.12 | -0.06 | -0.03 | 0.06 | 0.09 | -1.30 | -0.12 | 0.03 | NA | |
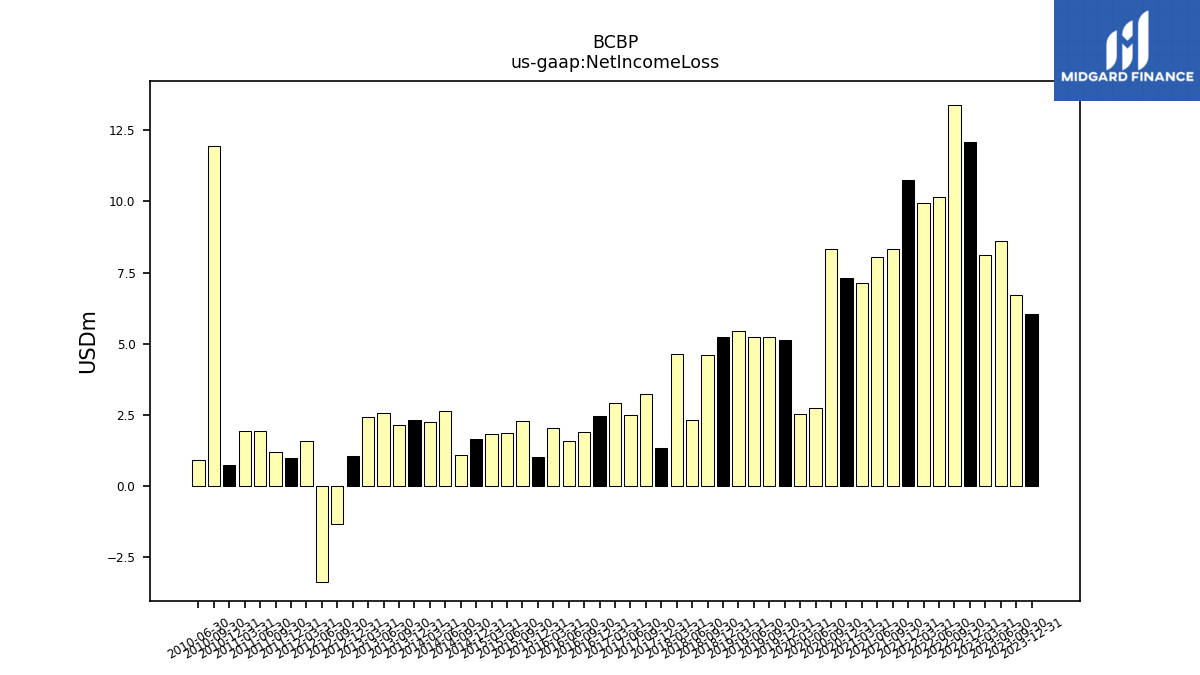
| Net Income Loss | 6.06 | 6.71 | 8.60 | 8.11 | 12.07 | 13.39 | 10.16 | 9.95 | 10.75 | 8.32 | 8.05 | 7.12 | 7.30 | 8.31 | 2.73 | 2.52 | 5.12 | 5.23 | 5.23 | 5.45 | 5.22 | 4.59 | 2.31 | 4.63 | 1.34 | 3.22 | 2.51 | 2.91 | 2.47 | 1.91 | 1.58 | 2.04 | 1.02 | 2.28 | 1.88 | 1.85 | 1.64 | 1.09 | 2.63 | 2.23 | 2.31 | 2.14 | 2.55 | 2.41 | 1.06 | -1.34 | -3.36 | 1.59 | 0.99 | 1.19 | 1.95 | 0.74 | |
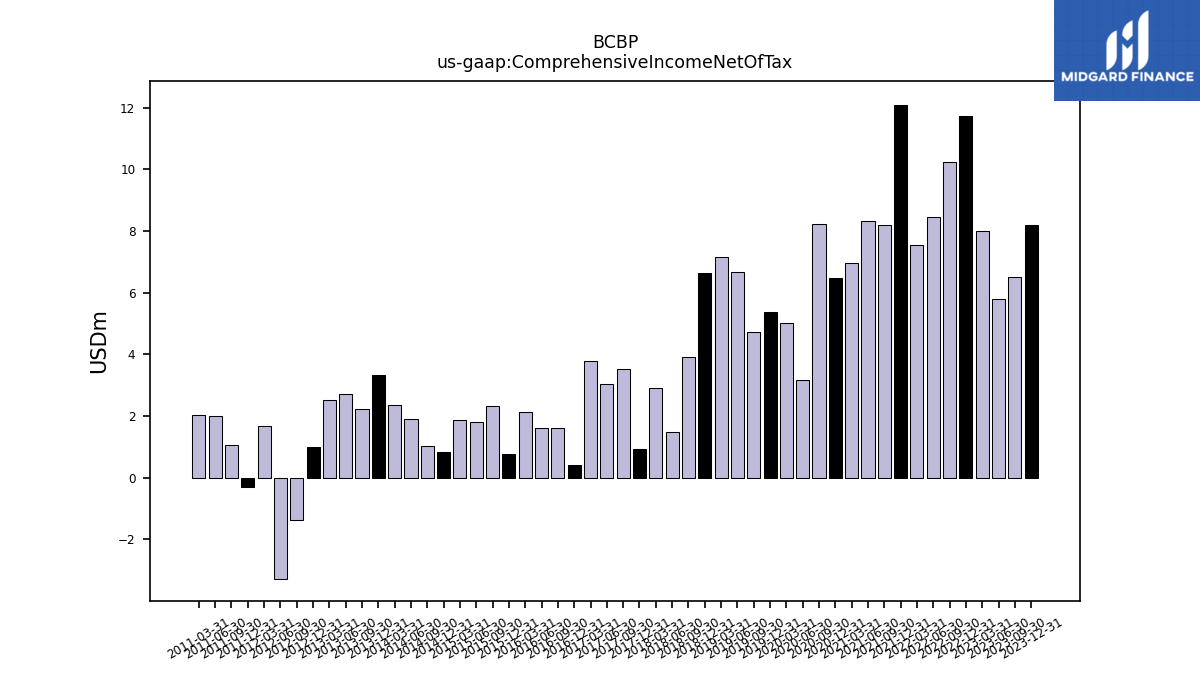
| Comprehensive Income Net Of Tax | 8.20 | 6.51 | 5.80 | 7.98 | 11.73 | 10.24 | 8.44 | 7.55 | 12.09 | 8.20 | 8.31 | 6.97 | 6.47 | 8.21 | 3.18 | 5.01 | 5.36 | 4.71 | 6.68 | 7.15 | 6.64 | 3.90 | 1.49 | 2.92 | 0.93 | 3.51 | 3.04 | 3.77 | 0.40 | 1.59 | 1.61 | 2.14 | 0.77 | 2.34 | 1.79 | 1.87 | 0.82 | 1.04 | 1.91 | 2.36 | 3.32 | 2.23 | 2.71 | 2.53 | 0.99 | -1.38 | -3.30 | 1.68 | -0.31 | 1.07 | 1.99 | NA | |
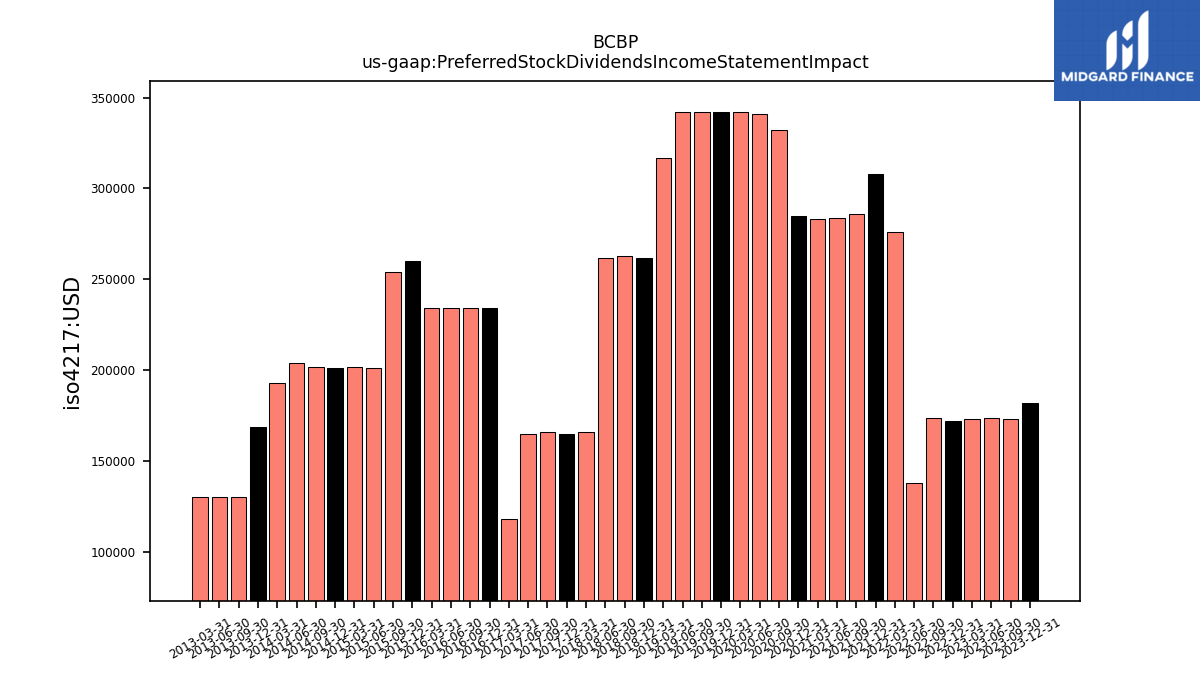
| Preferred Stock Dividends Income Statement Impact | 0.18 | 0.17 | 0.17 | 0.17 | 0.17 | 0.17 | 0.14 | 0.28 | 0.31 | 0.29 | 0.28 | 0.28 | 0.28 | 0.33 | 0.34 | 0.34 | 0.34 | 0.34 | 0.34 | 0.32 | 0.26 | 0.26 | 0.26 | 0.17 | 0.17 | 0.17 | 0.17 | 0.12 | 0.23 | 0.23 | 0.23 | 0.23 | 0.26 | 0.25 | 0.20 | 0.20 | 0.20 | 0.20 | 0.20 | 0.19 | 0.17 | 0.13 | 0.13 | 0.13 | NA | NA | NA | NA | NA | NA | NA | NA | |
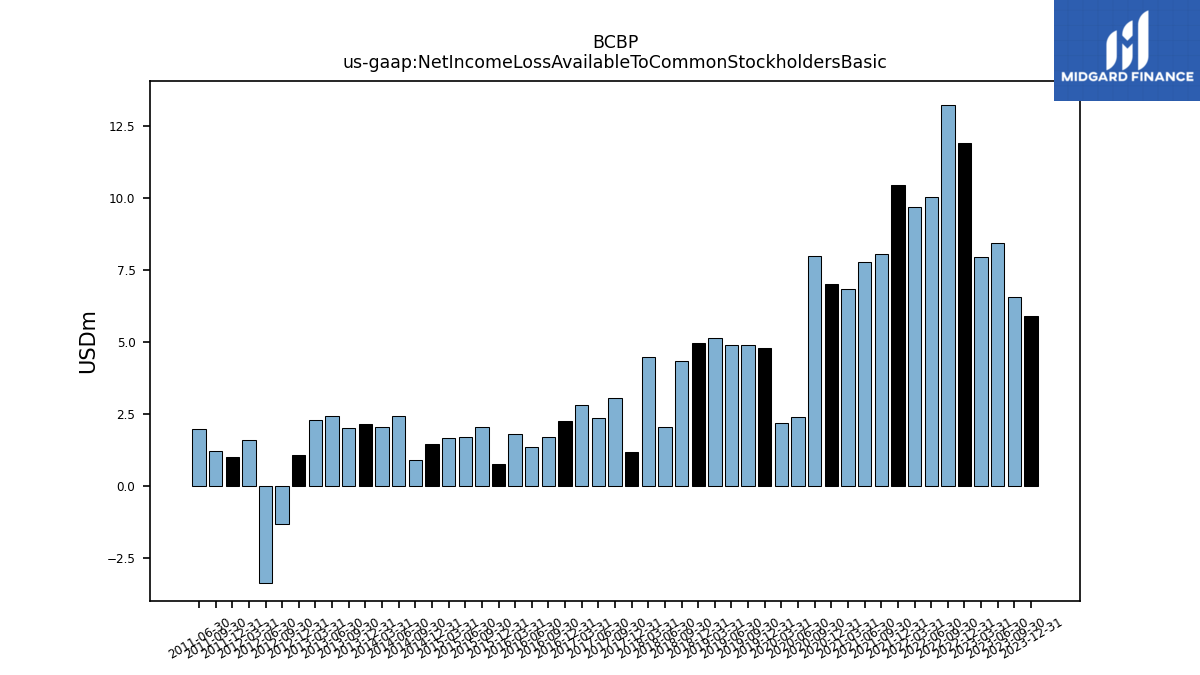
| Net Income Loss Available To Common Stockholders Basic | 5.88 | 6.54 | 8.43 | 7.93 | 11.90 | 13.22 | 10.03 | 9.68 | 10.44 | 8.04 | 7.77 | 6.83 | 7.01 | 7.98 | 2.38 | 2.18 | 4.78 | 4.89 | 4.88 | 5.13 | 4.96 | 4.33 | 2.05 | 4.47 | 1.18 | 3.05 | 2.35 | 2.79 | 2.24 | 1.68 | 1.35 | 1.80 | 0.76 | 2.03 | 1.68 | 1.64 | 1.44 | 0.89 | 2.43 | 2.04 | 2.14 | 2.01 | 2.42 | 2.28 | 1.06 | -1.34 | -3.36 | 1.59 | 0.99 | 1.19 | 1.95 | NA | |
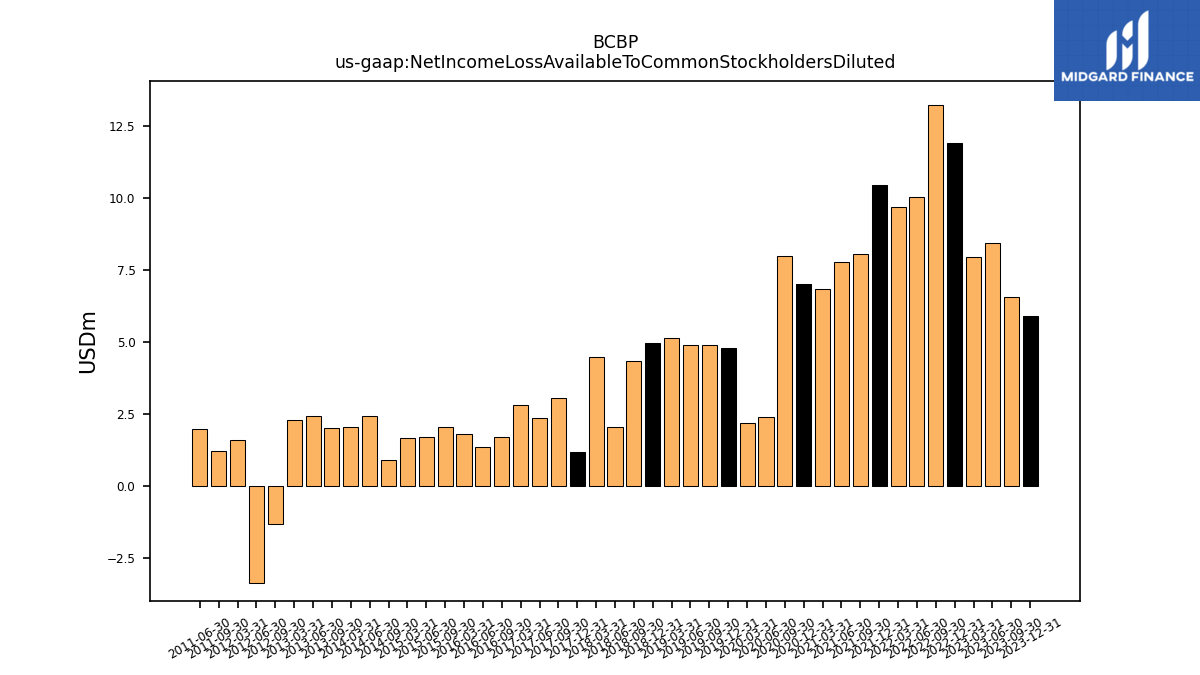
| Net Income Loss Available To Common Stockholders Diluted | 5.88 | 6.54 | 8.43 | 7.93 | 11.90 | 13.22 | 10.03 | 9.68 | 10.44 | 8.04 | 7.77 | 6.83 | 7.01 | 7.98 | 2.38 | 2.18 | 4.78 | 4.89 | 4.88 | 5.13 | 4.96 | 4.33 | 2.05 | 4.47 | 1.17 | 3.05 | 2.35 | 2.79 | NA | 1.68 | 1.35 | 1.80 | NA | 2.03 | 1.68 | 1.64 | NA | 0.89 | 2.43 | 2.04 | NA | 2.01 | 2.42 | 2.28 | NA | -1.34 | -3.36 | 1.59 | NA | 1.19 | 1.95 | NA | |
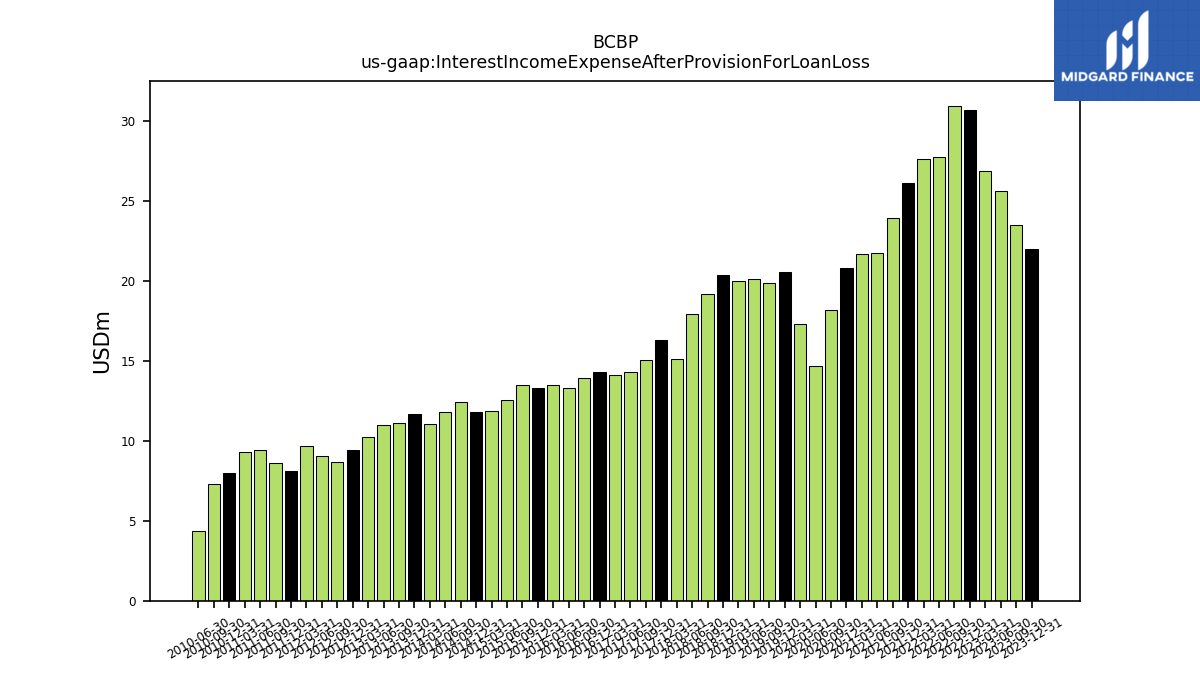
| Interest Income Expense After Provision For Loan Loss | 22.00 | 23.48 | 25.64 | 26.85 | 30.68 | 30.95 | 27.74 | 27.65 | 26.14 | 23.93 | 21.77 | 21.70 | 20.84 | 18.16 | 14.69 | 17.28 | 20.55 | 19.86 | 20.11 | 20.01 | 20.35 | 19.17 | 17.93 | 15.10 | 16.32 | 15.06 | 14.29 | 14.11 | 14.30 | 13.90 | 13.33 | 13.51 | 13.32 | 13.47 | 12.57 | 11.87 | 11.83 | 12.40 | 11.79 | 11.06 | 11.70 | 11.14 | 10.97 | 10.22 | 9.40 | 8.65 | 9.05 | 9.70 | 8.13 | 8.59 | 9.43 | 7.99 | |
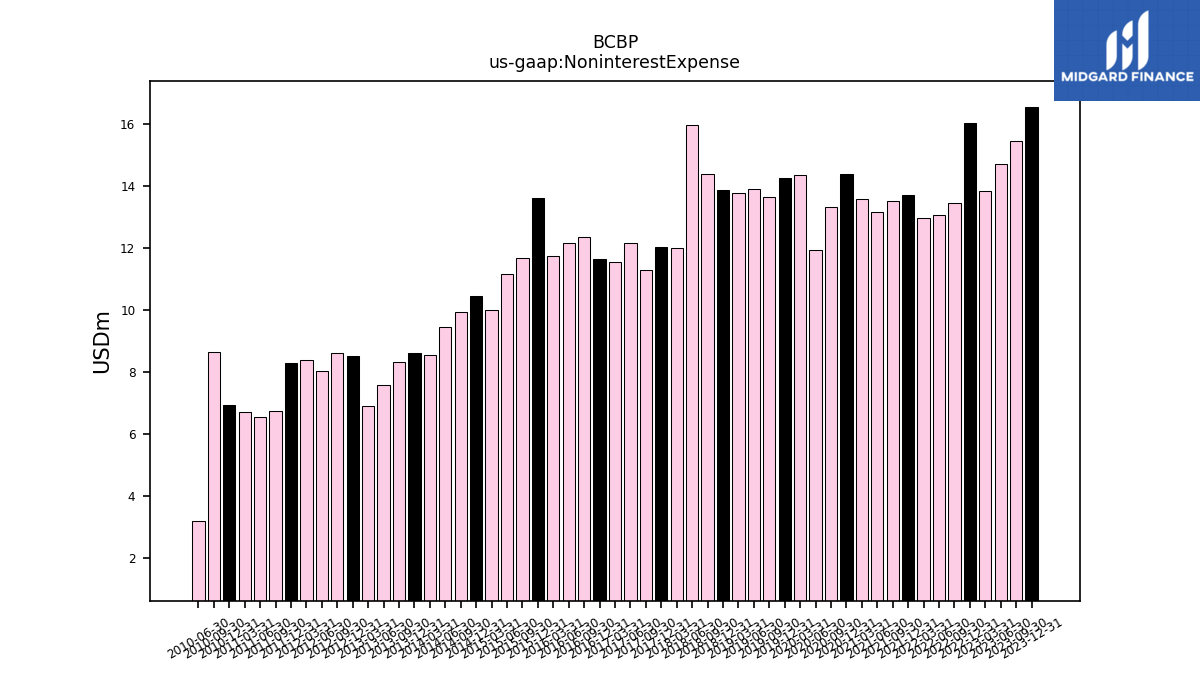
| Noninterest Expense | 16.57 | 15.46 | 14.71 | 13.85 | 16.04 | 13.45 | 13.06 | 12.96 | 13.71 | 13.53 | 13.16 | 13.58 | 14.38 | 13.34 | 11.95 | 14.36 | 14.26 | 13.65 | 13.89 | 13.78 | 13.88 | 14.39 | 15.98 | 12.01 | 12.03 | 11.30 | 12.15 | 11.56 | 11.65 | 12.34 | 12.17 | 11.74 | 13.61 | 11.69 | 11.16 | 9.98 | 10.46 | 9.93 | 9.47 | 8.56 | 8.61 | 8.33 | 7.59 | 6.90 | 8.51 | 8.62 | 8.04 | 8.38 | 8.29 | 6.75 | 6.56 | 6.94 | |
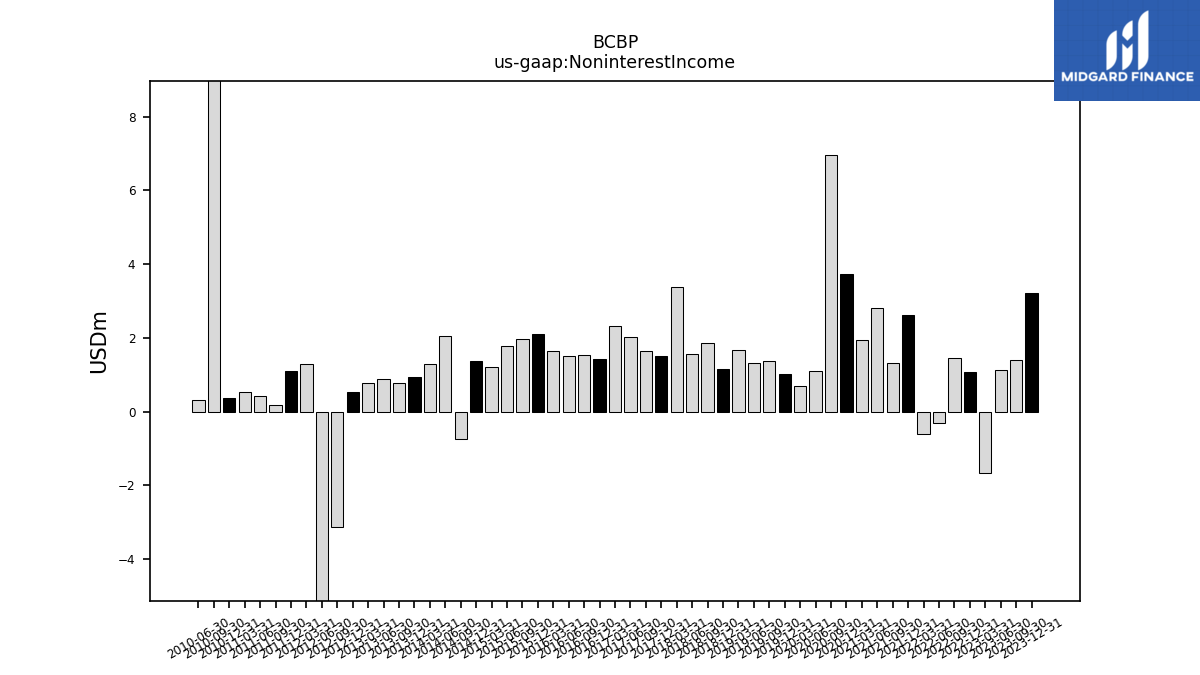
| Noninterest Income | 3.23 | 1.41 | 1.12 | -1.66 | 1.06 | 1.45 | -0.31 | -0.60 | 2.61 | 1.32 | 2.82 | 1.95 | 3.74 | 6.96 | 1.11 | 0.68 | 1.02 | 1.38 | 1.33 | 1.66 | 1.16 | 1.85 | 1.56 | 3.39 | 1.51 | 1.63 | 2.02 | 2.31 | 1.43 | 1.53 | 1.51 | 1.65 | 2.11 | 1.96 | 1.79 | 1.21 | 1.37 | -0.75 | 2.04 | 1.30 | 0.95 | 0.76 | 0.88 | 0.78 | 0.54 | -3.12 | -6.27 | 1.28 | 1.10 | 0.18 | 0.43 | 0.35 |
| 2023-12-31 | 2023-09-30 | 2023-06-30 | 2023-03-31 | 2022-12-31 | 2022-09-30 | 2022-06-30 | 2022-03-31 | 2021-12-31 | 2021-09-30 | 2021-06-30 | 2021-03-31 | 2020-12-31 | 2020-09-30 | 2020-06-30 | 2020-03-31 | 2019-12-31 | 2019-09-30 | 2019-06-30 | 2019-03-31 | 2018-12-31 | 2018-09-30 | 2018-06-30 | 2018-03-31 | 2017-12-31 | 2017-09-30 | 2017-06-30 | 2017-03-31 | 2016-12-31 | 2016-09-30 | 2016-06-30 | 2016-03-31 | 2015-12-31 | 2015-09-30 | 2015-06-30 | 2015-03-31 | 2014-12-31 | 2014-09-30 | 2014-06-30 | 2014-03-31 | 2013-12-31 | 2013-09-30 | 2013-06-30 | 2013-03-31 | 2012-12-31 | 2012-09-30 | 2012-06-30 | 2012-03-31 | 2011-12-31 | 2011-09-30 | 2011-06-30 | 2010-12-31 | ||
|---|---|---|---|---|---|---|---|---|---|---|---|---|---|---|---|---|---|---|---|---|---|---|---|---|---|---|---|---|---|---|---|---|---|---|---|---|---|---|---|---|---|---|---|---|---|---|---|---|---|---|---|---|---|
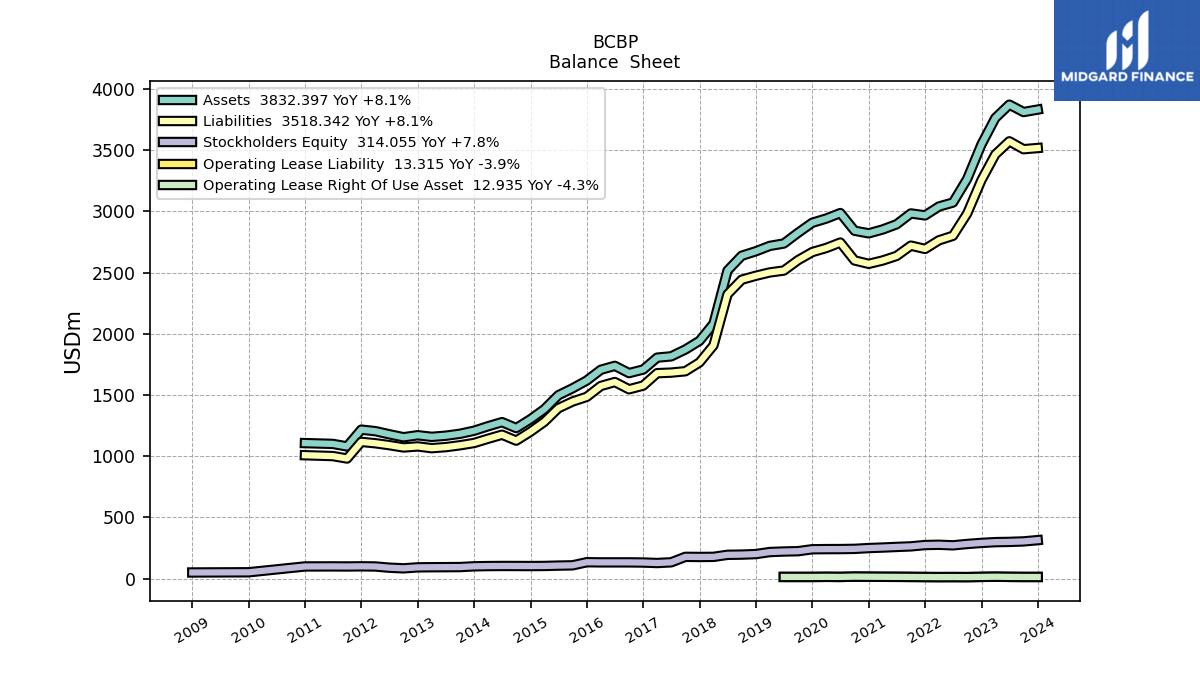
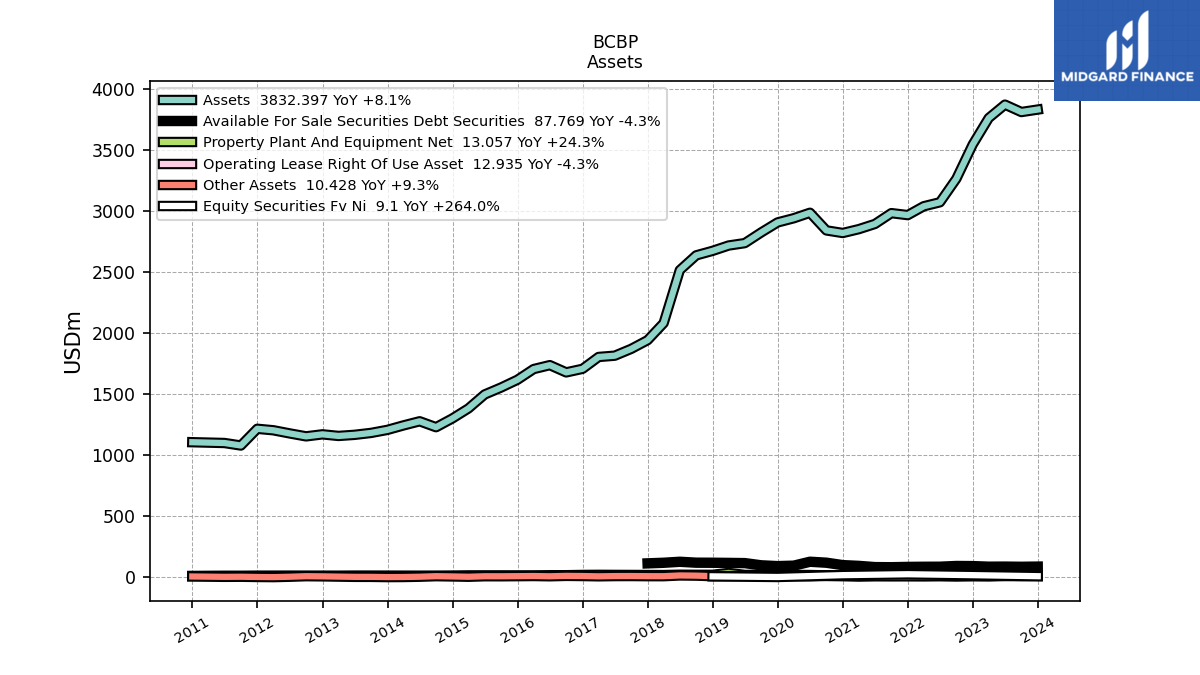
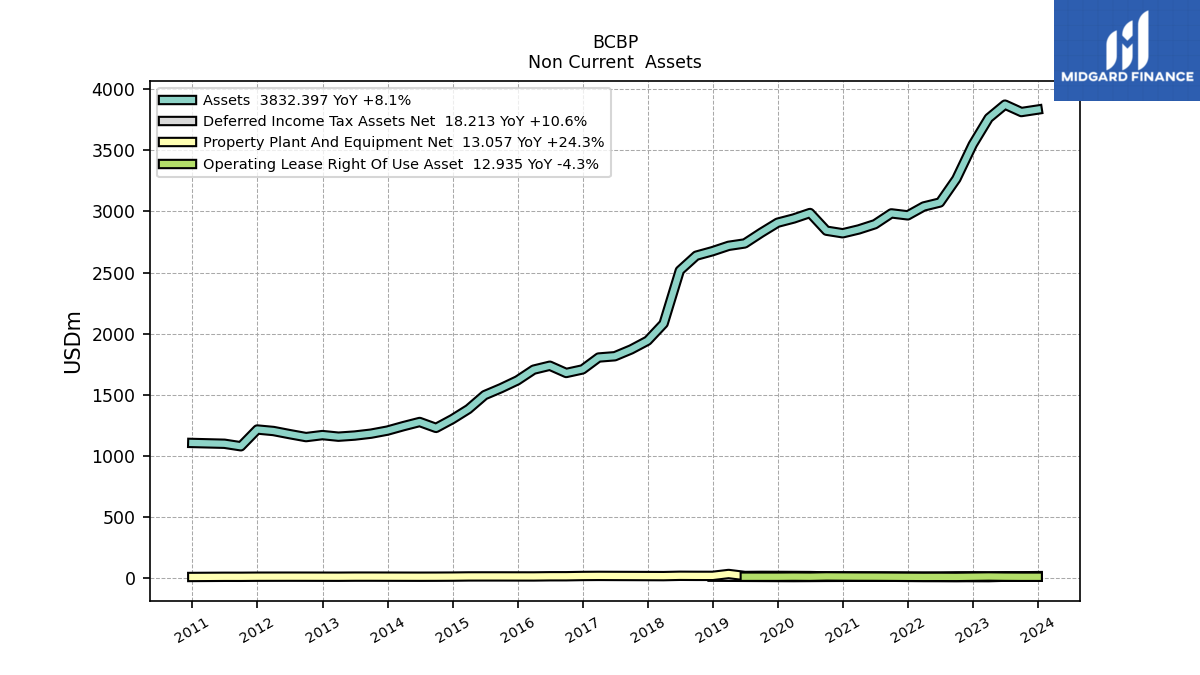
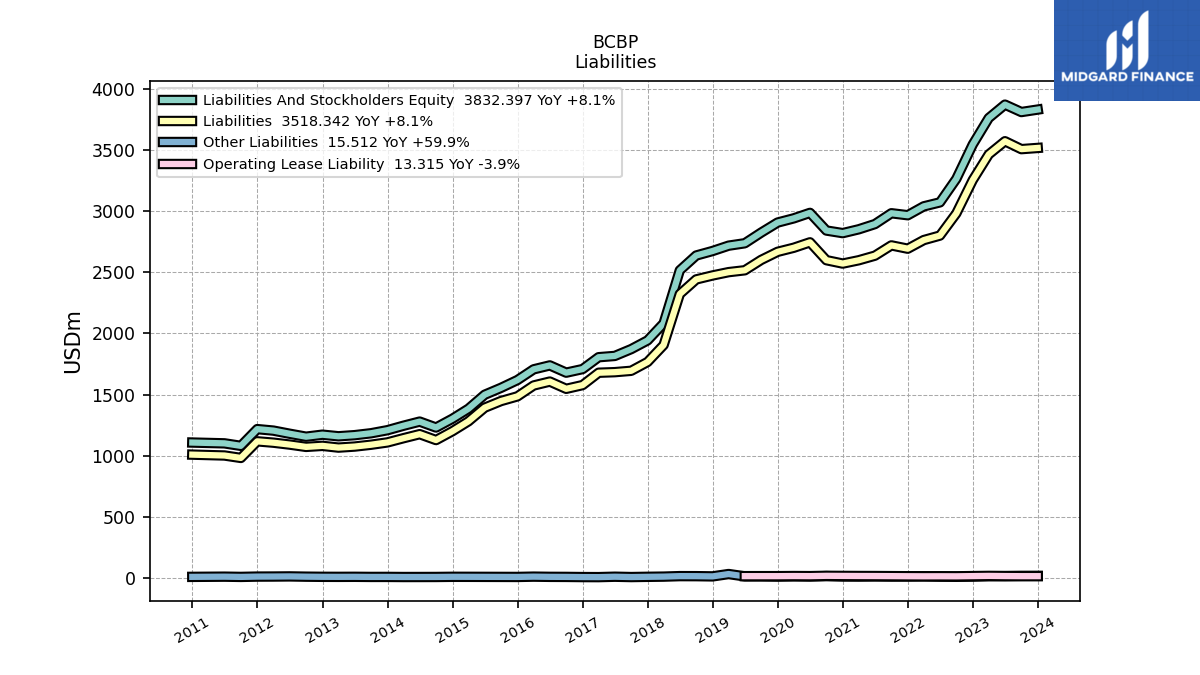
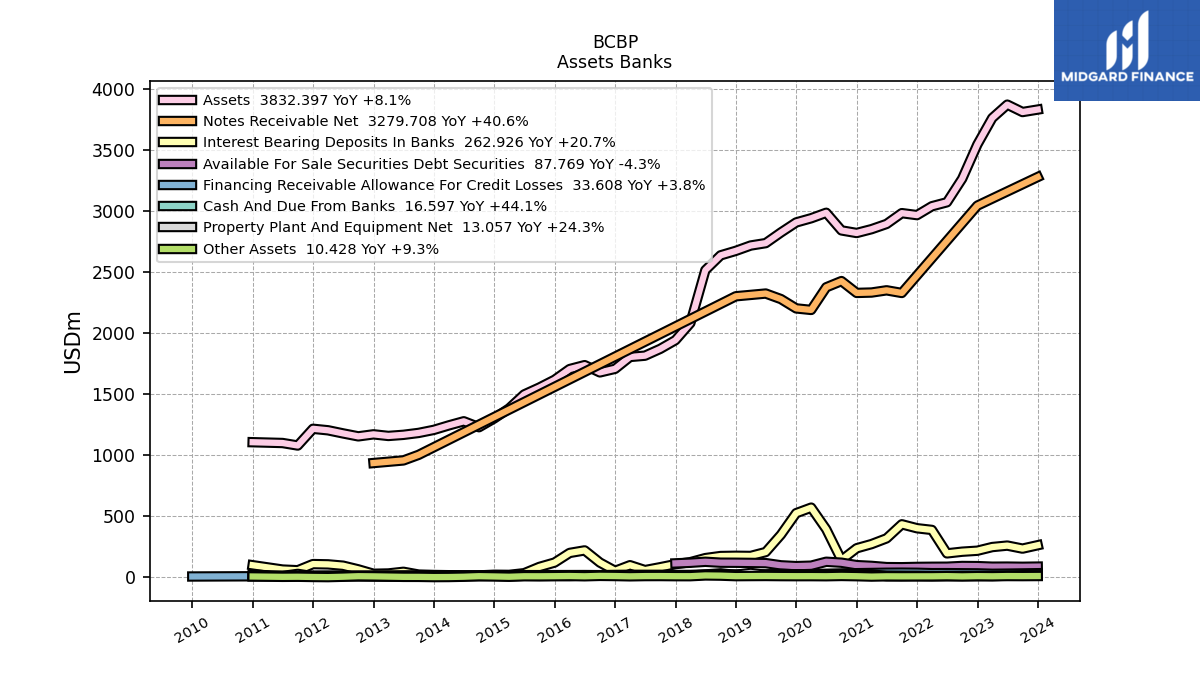
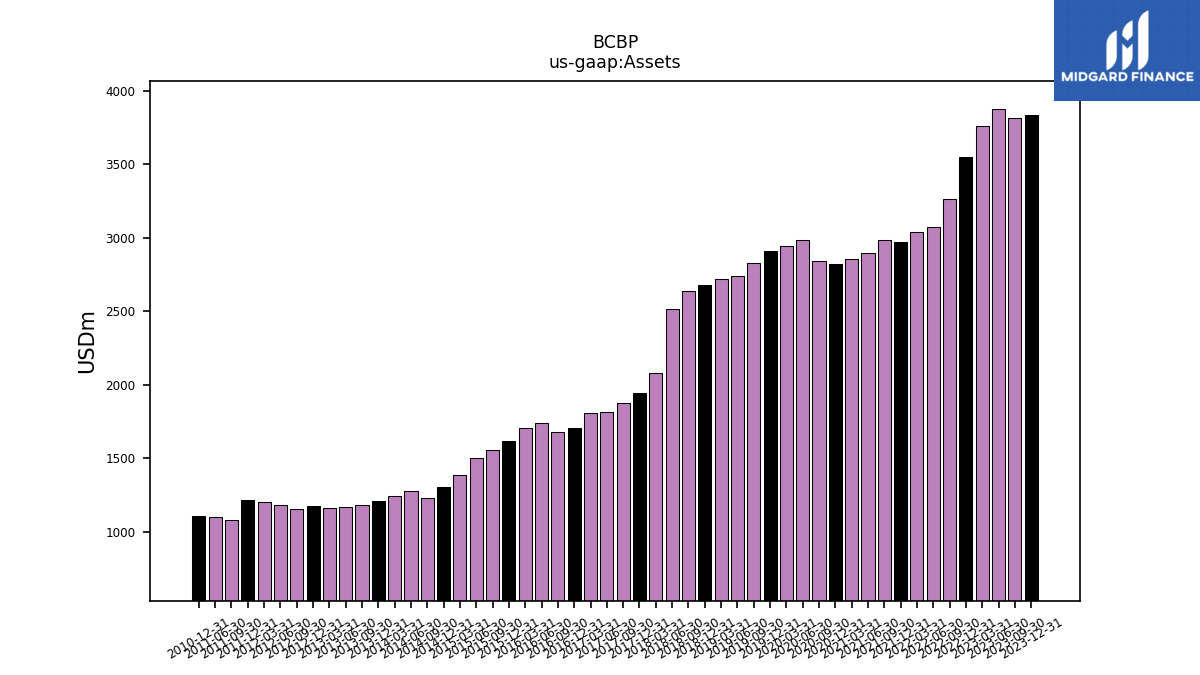
| Assets | 3832.40 | 3812.12 | 3872.85 | 3763.06 | 3546.19 | 3265.61 | 3072.77 | 3040.31 | 2967.53 | 2983.79 | 2895.19 | 2852.46 | 2821.02 | 2842.32 | 2986.88 | 2942.00 | 2907.47 | 2825.50 | 2738.13 | 2718.40 | 2674.73 | 2637.87 | 2516.56 | 2082.31 | 1942.84 | 1871.74 | 1815.84 | 1805.33 | 1708.21 | 1678.94 | 1738.34 | 1706.15 | 1618.41 | 1554.86 | 1498.09 | 1383.76 | 1301.90 | 1229.82 | 1278.38 | 1244.49 | 1207.96 | 1182.97 | 1167.36 | 1158.19 | 1171.36 | 1154.82 | 1179.00 | 1204.55 | 1216.91 | 1079.74 | 1100.35 | 1106.89 | |
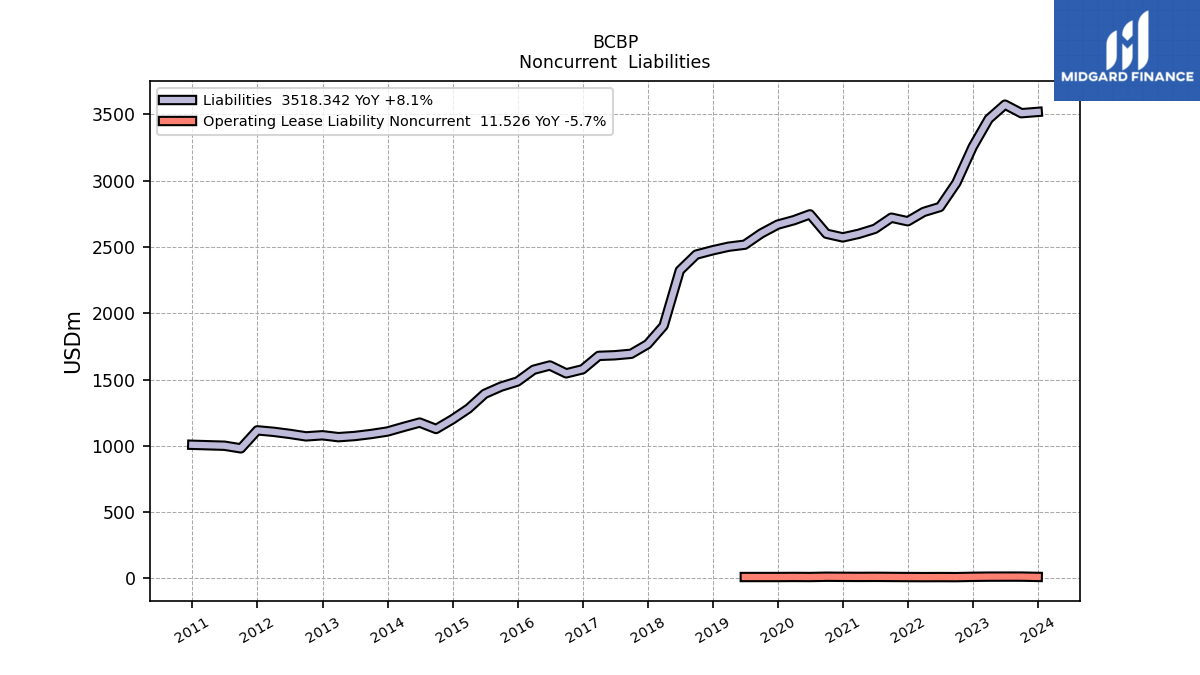
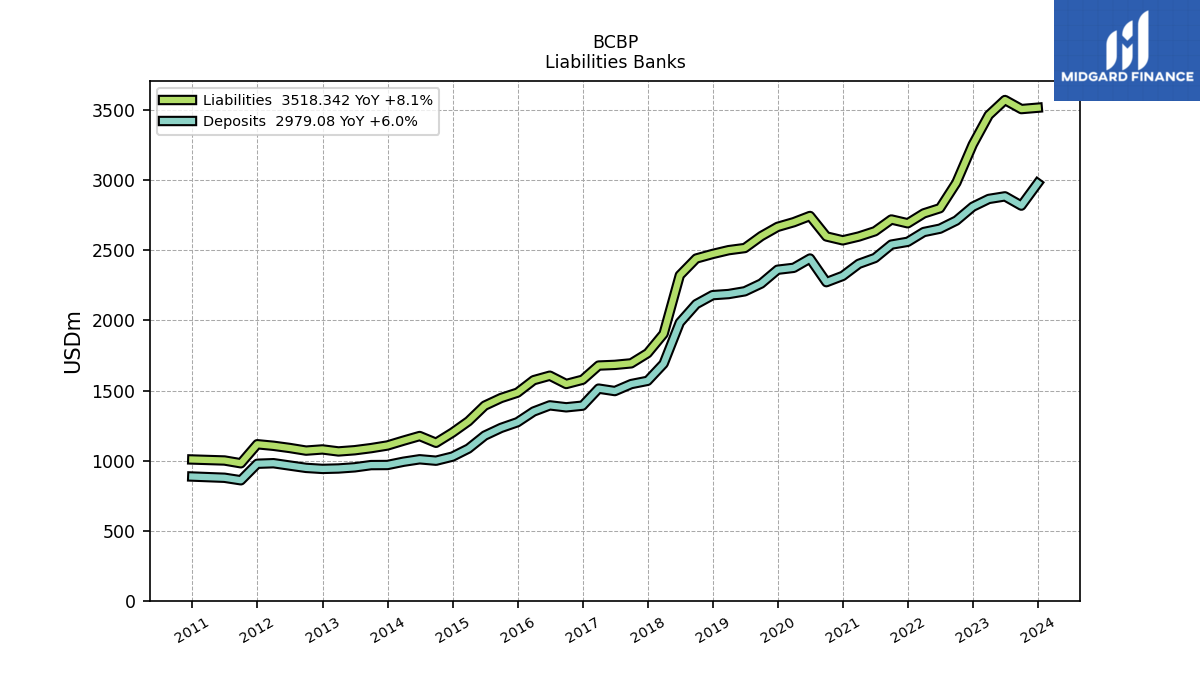
| Liabilities | 3518.34 | 3508.48 | 3573.23 | 3465.44 | 3254.94 | 2982.93 | 2801.13 | 2764.15 | 2693.50 | 2720.71 | 2636.67 | 2599.01 | 2571.80 | 2599.63 | 2745.86 | 2701.36 | 2667.99 | 2601.78 | 2516.98 | 2501.68 | 2474.52 | 2442.11 | 2322.49 | 1904.93 | 1766.38 | 1694.17 | 1683.06 | 1678.32 | 1577.13 | 1546.64 | 1606.04 | 1573.84 | 1484.86 | 1446.65 | 1392.11 | 1280.81 | 1199.65 | 1127.11 | 1175.52 | 1142.37 | 1107.90 | 1089.04 | 1074.06 | 1065.45 | 1079.78 | 1071.31 | 1090.16 | 1105.79 | 1116.86 | 980.85 | 1000.83 | 1007.91 | |
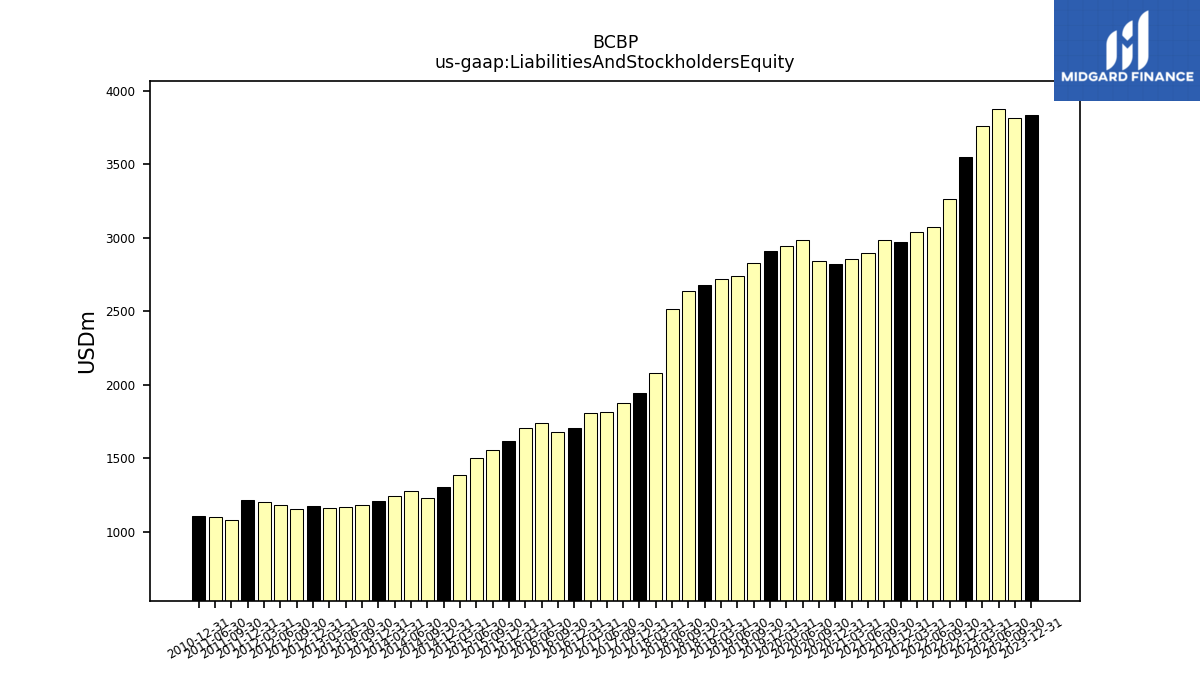
| Liabilities And Stockholders Equity | 3832.40 | 3812.12 | 3872.85 | 3763.06 | 3546.19 | 3265.61 | 3072.77 | 3040.31 | 2967.53 | 2983.79 | 2895.19 | 2852.46 | 2821.02 | 2842.32 | 2986.88 | 2942.00 | 2907.47 | 2825.50 | 2738.13 | 2718.40 | 2674.73 | 2637.87 | 2516.56 | 2082.31 | 1942.84 | 1871.74 | 1815.84 | 1805.33 | 1708.21 | 1678.94 | 1738.34 | 1706.15 | 1618.41 | 1554.86 | 1498.09 | 1383.76 | 1301.90 | 1229.82 | 1278.38 | 1244.49 | 1207.96 | 1182.97 | 1167.36 | 1158.19 | 1171.36 | 1154.82 | 1179.00 | 1204.55 | 1216.91 | 1079.74 | 1100.35 | 1106.89 | |
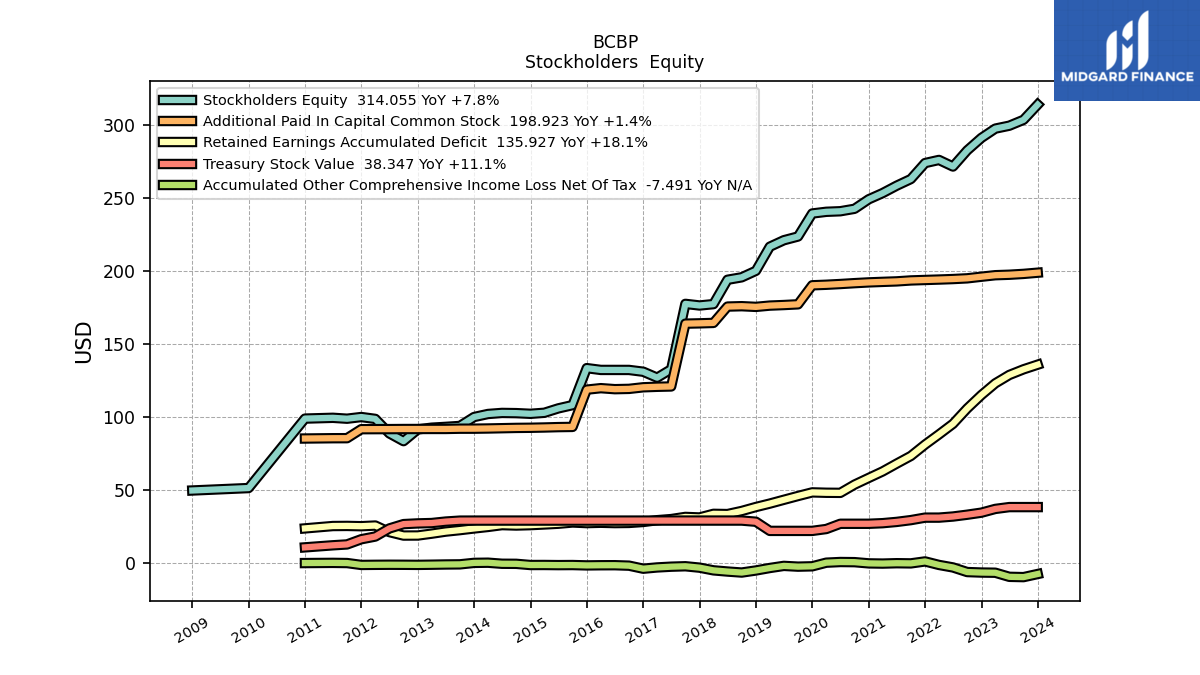
| Stockholders Equity | 314.06 | 303.64 | 299.62 | 297.62 | 291.25 | 282.68 | 271.64 | 276.16 | 274.02 | 263.08 | 258.52 | 253.45 | 249.21 | 242.69 | 241.02 | 240.64 | 239.47 | 223.72 | 221.15 | 216.72 | 200.22 | 195.76 | 194.08 | 177.39 | 176.45 | 177.57 | 132.78 | 127.01 | 131.08 | 132.30 | 132.31 | 132.31 | 133.54 | 108.20 | 105.97 | 102.95 | 102.25 | 102.71 | 102.86 | 102.12 | 100.06 | 93.93 | 93.30 | 92.74 | 91.58 | 83.51 | 88.84 | 98.76 | 100.05 | 98.90 | 99.51 | 98.97 |
| 2023-12-31 | 2023-09-30 | 2023-06-30 | 2023-03-31 | 2022-12-31 | 2022-09-30 | 2022-06-30 | 2022-03-31 | 2021-12-31 | 2021-09-30 | 2021-06-30 | 2021-03-31 | 2020-12-31 | 2020-09-30 | 2020-06-30 | 2020-03-31 | 2019-12-31 | 2019-09-30 | 2019-06-30 | 2019-03-31 | 2018-12-31 | 2018-09-30 | 2018-06-30 | 2018-03-31 | 2017-12-31 | 2017-09-30 | 2017-06-30 | 2017-03-31 | 2016-12-31 | 2016-09-30 | 2016-06-30 | 2016-03-31 | 2015-12-31 | 2015-09-30 | 2015-06-30 | 2015-03-31 | 2014-12-31 | 2014-09-30 | 2014-06-30 | 2014-03-31 | 2013-12-31 | 2013-09-30 | 2013-06-30 | 2013-03-31 | 2012-12-31 | 2012-09-30 | 2012-06-30 | 2012-03-31 | 2011-12-31 | 2011-09-30 | 2011-06-30 | 2010-12-31 | ||
|---|---|---|---|---|---|---|---|---|---|---|---|---|---|---|---|---|---|---|---|---|---|---|---|---|---|---|---|---|---|---|---|---|---|---|---|---|---|---|---|---|---|---|---|---|---|---|---|---|---|---|---|---|---|
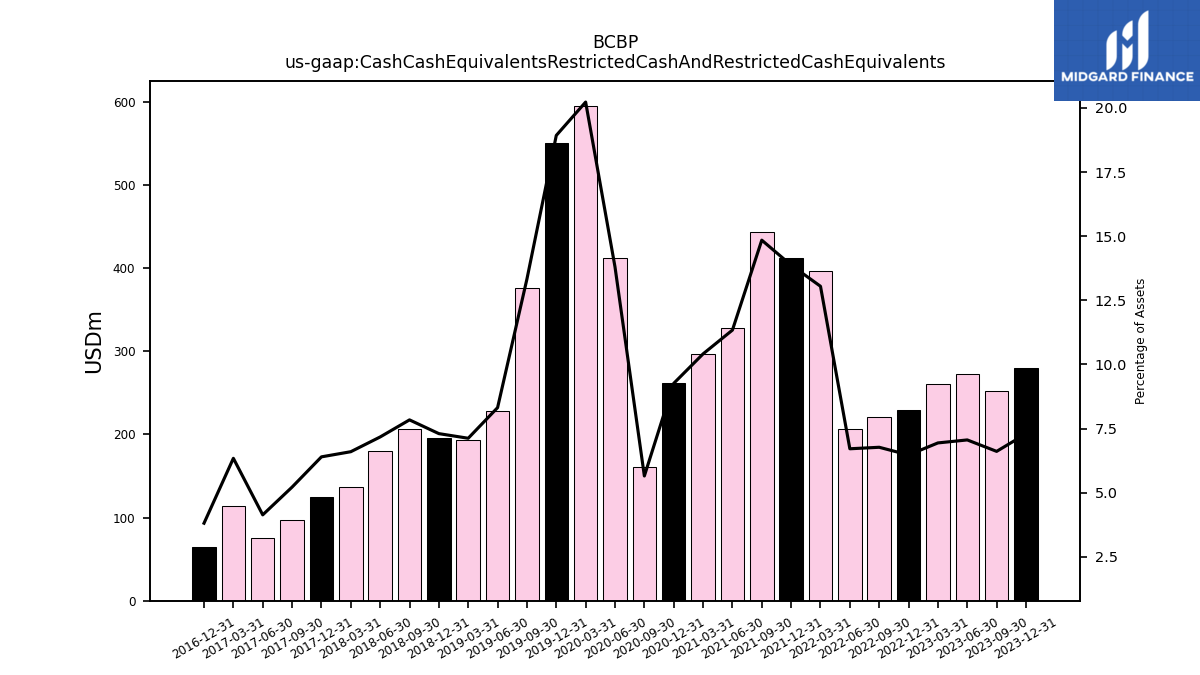
| Cash Cash Equivalents Restricted Cash And Restricted Cash Equivalents | 279.52 | 251.92 | 273.21 | 261.07 | 229.36 | 221.02 | 206.17 | 396.65 | 411.63 | 442.94 | 328.26 | 296.94 | 261.23 | 160.55 | 412.25 | 595.19 | 550.35 | 376.61 | 227.64 | 193.55 | 195.26 | 206.71 | 180.44 | 137.33 | 124.23 | 97.62 | 75.05 | 114.42 | 65.04 | NA | NA | NA | NA | NA | NA | NA | NA | NA | NA | NA | NA | NA | NA | NA | NA | NA | NA | NA | NA | NA | NA | NA | |
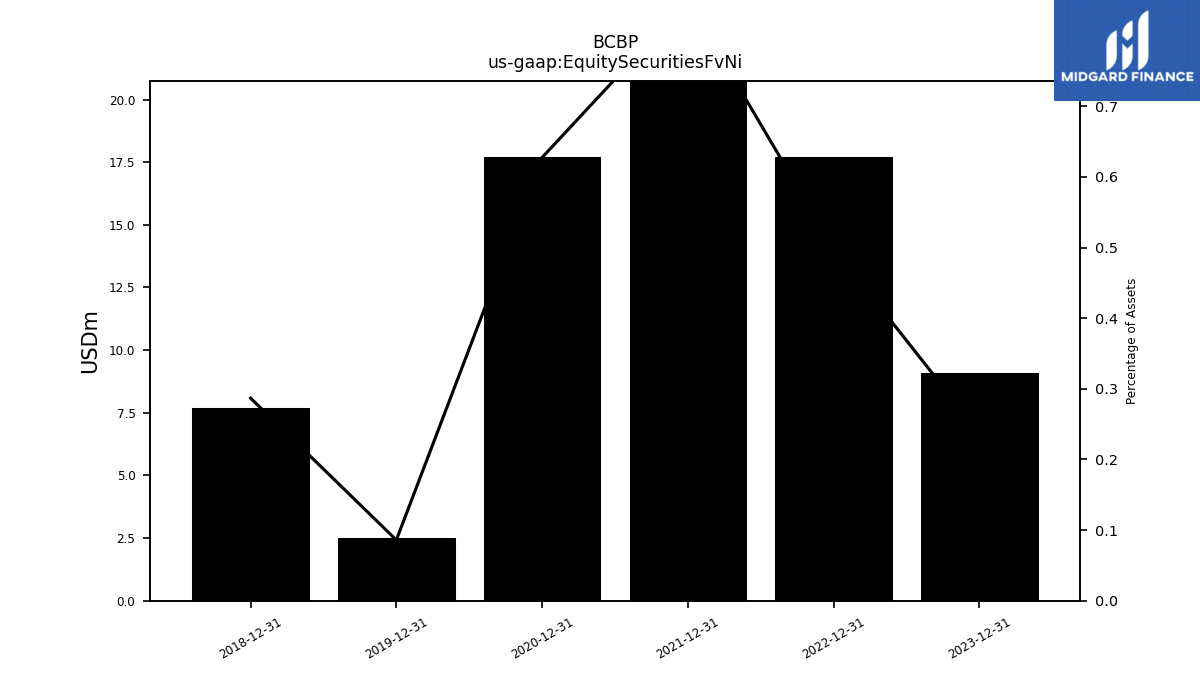
| Equity Securities Fv Ni | 9.10 | NA | NA | NA | 17.70 | NA | NA | NA | 25.20 | NA | NA | NA | 17.70 | NA | NA | NA | 2.50 | NA | NA | NA | 7.67 | NA | NA | NA | NA | NA | NA | NA | NA | NA | NA | NA | NA | NA | NA | NA | NA | NA | NA | NA | NA | NA | NA | NA | NA | NA | NA | NA | NA | NA | NA | NA | |
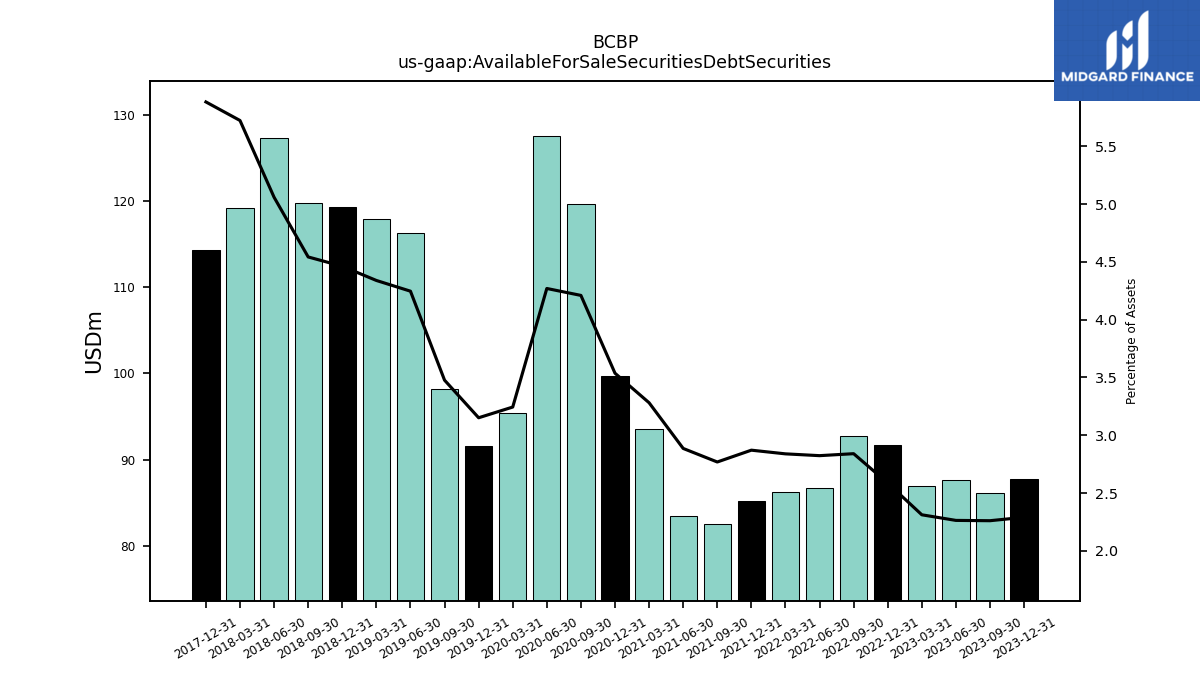
| Available For Sale Securities Debt Securities | 87.77 | 86.17 | 87.65 | 86.99 | 91.72 | 92.75 | 86.75 | 86.31 | 85.19 | 82.60 | 83.54 | 93.58 | 99.76 | 119.64 | 127.52 | 95.43 | 91.61 | 98.22 | 116.26 | 117.94 | 119.33 | 119.81 | 127.29 | 119.16 | 114.30 | NA | NA | NA | NA | NA | NA | NA | NA | NA | NA | NA | NA | NA | NA | NA | NA | NA | NA | NA | NA | NA | NA | NA | NA | NA | NA | NA |
| 2023-12-31 | 2023-09-30 | 2023-06-30 | 2023-03-31 | 2022-12-31 | 2022-09-30 | 2022-06-30 | 2022-03-31 | 2021-12-31 | 2021-09-30 | 2021-06-30 | 2021-03-31 | 2020-12-31 | 2020-09-30 | 2020-06-30 | 2020-03-31 | 2019-12-31 | 2019-09-30 | 2019-06-30 | 2019-03-31 | 2018-12-31 | 2018-09-30 | 2018-06-30 | 2018-03-31 | 2017-12-31 | 2017-09-30 | 2017-06-30 | 2017-03-31 | 2016-12-31 | 2016-09-30 | 2016-06-30 | 2016-03-31 | 2015-12-31 | 2015-09-30 | 2015-06-30 | 2015-03-31 | 2014-12-31 | 2014-09-30 | 2014-06-30 | 2014-03-31 | 2013-12-31 | 2013-09-30 | 2013-06-30 | 2013-03-31 | 2012-12-31 | 2012-09-30 | 2012-06-30 | 2012-03-31 | 2011-12-31 | 2011-09-30 | 2011-06-30 | 2010-12-31 | ||
|---|---|---|---|---|---|---|---|---|---|---|---|---|---|---|---|---|---|---|---|---|---|---|---|---|---|---|---|---|---|---|---|---|---|---|---|---|---|---|---|---|---|---|---|---|---|---|---|---|---|---|---|---|---|
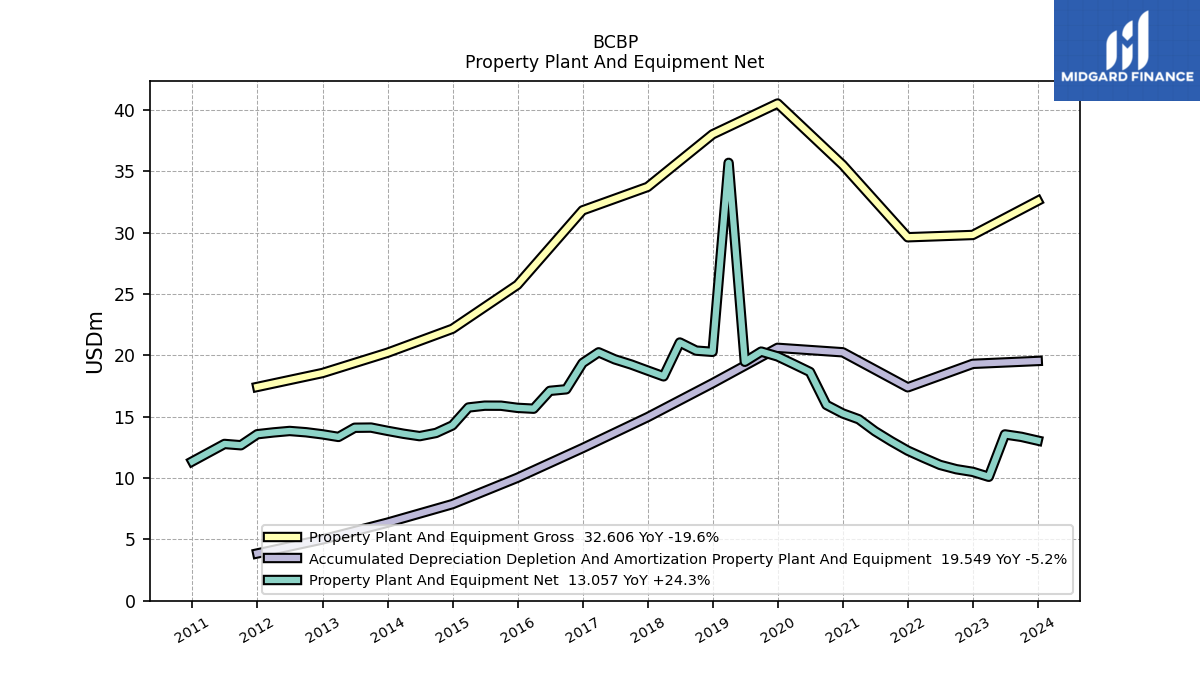
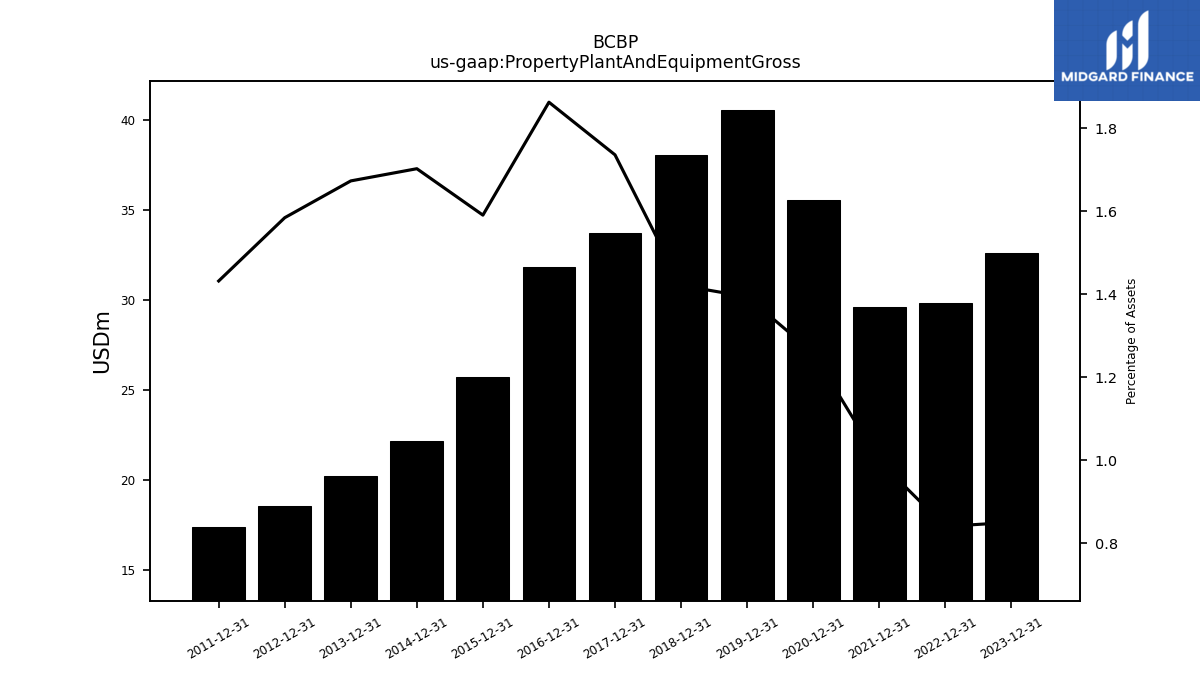
| Property Plant And Equipment Gross | 32.61 | NA | NA | NA | 29.82 | NA | NA | NA | 29.64 | NA | NA | NA | 35.53 | NA | NA | NA | 40.54 | NA | NA | NA | 38.03 | NA | NA | NA | 33.74 | NA | NA | NA | 31.83 | NA | NA | NA | 25.75 | NA | NA | NA | 22.17 | NA | NA | NA | 20.22 | NA | NA | NA | 18.57 | NA | NA | NA | 17.43 | NA | NA | NA | |
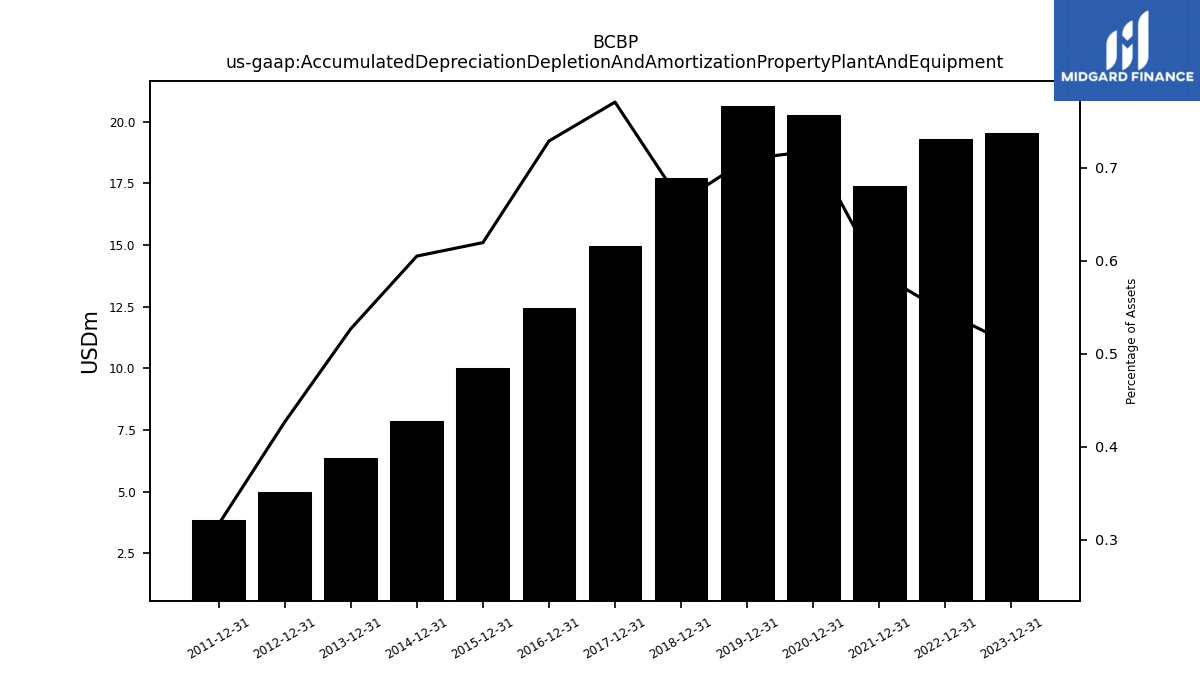
| Accumulated Depreciation Depletion And Amortization Property Plant And Equipment | 19.55 | NA | NA | NA | 19.31 | NA | NA | NA | 17.40 | NA | NA | NA | 20.26 | NA | NA | NA | 20.62 | NA | NA | NA | 17.73 | NA | NA | NA | 14.97 | NA | NA | NA | 12.45 | NA | NA | NA | 10.03 | NA | NA | NA | 7.88 | NA | NA | NA | 6.36 | NA | NA | NA | 5.00 | NA | NA | NA | 3.86 | NA | NA | NA | |
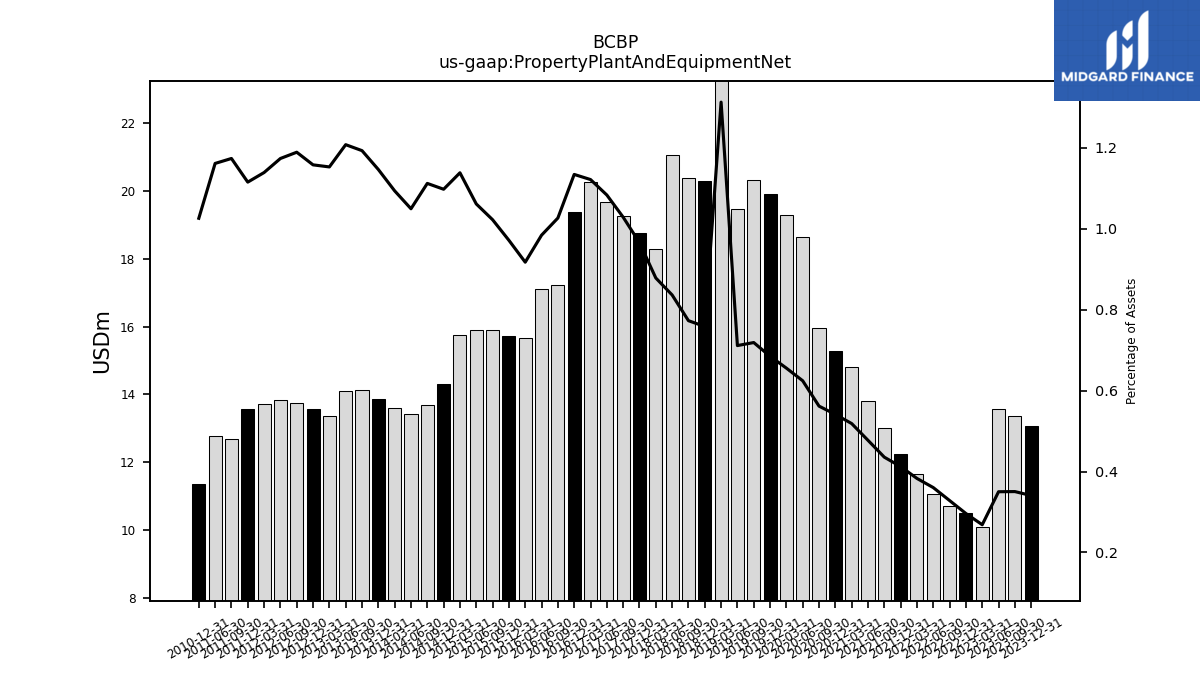
| Property Plant And Equipment Net | 13.06 | 13.36 | 13.56 | 10.11 | 10.51 | 10.72 | 11.07 | 11.65 | 12.24 | 13.00 | 13.82 | 14.80 | 15.27 | 15.97 | 18.65 | 19.29 | 19.92 | 20.32 | 19.48 | 35.70 | 20.29 | 20.39 | 21.05 | 18.30 | 18.77 | 19.26 | 19.68 | 20.25 | 19.38 | 17.24 | 17.11 | 15.66 | 15.73 | 15.90 | 15.90 | 15.76 | 14.29 | 13.68 | 13.42 | 13.62 | 13.85 | 14.12 | 14.10 | 13.36 | 13.57 | 13.74 | 13.84 | 13.72 | 13.58 | 12.68 | 12.78 | 11.36 | |
| Intangible Assets Net Including Goodwill | 5.25 | 5.29 | 5.32 | 5.36 | 5.38 | 5.39 | 5.41 | 5.42 | 5.43 | 5.45 | 5.46 | 5.47 | 5.49 | 5.50 | 5.52 | 5.54 | 5.55 | 5.57 | 5.59 | 5.58 | 5.60 | NA | NA | NA | NA | NA | NA | NA | NA | NA | NA | NA | NA | NA | NA | NA | NA | NA | NA | NA | NA | NA | NA | NA | NA | NA | NA | NA | NA | NA | NA | NA | |
| Equity Securities Fv Ni | 9.10 | NA | NA | NA | 17.70 | NA | NA | NA | 25.20 | NA | NA | NA | 17.70 | NA | NA | NA | 2.50 | NA | NA | NA | 7.67 | NA | NA | NA | NA | NA | NA | NA | NA | NA | NA | NA | NA | NA | NA | NA | NA | NA | NA | NA | NA | NA | NA | NA | NA | NA | NA | NA | NA | NA | NA | NA | |
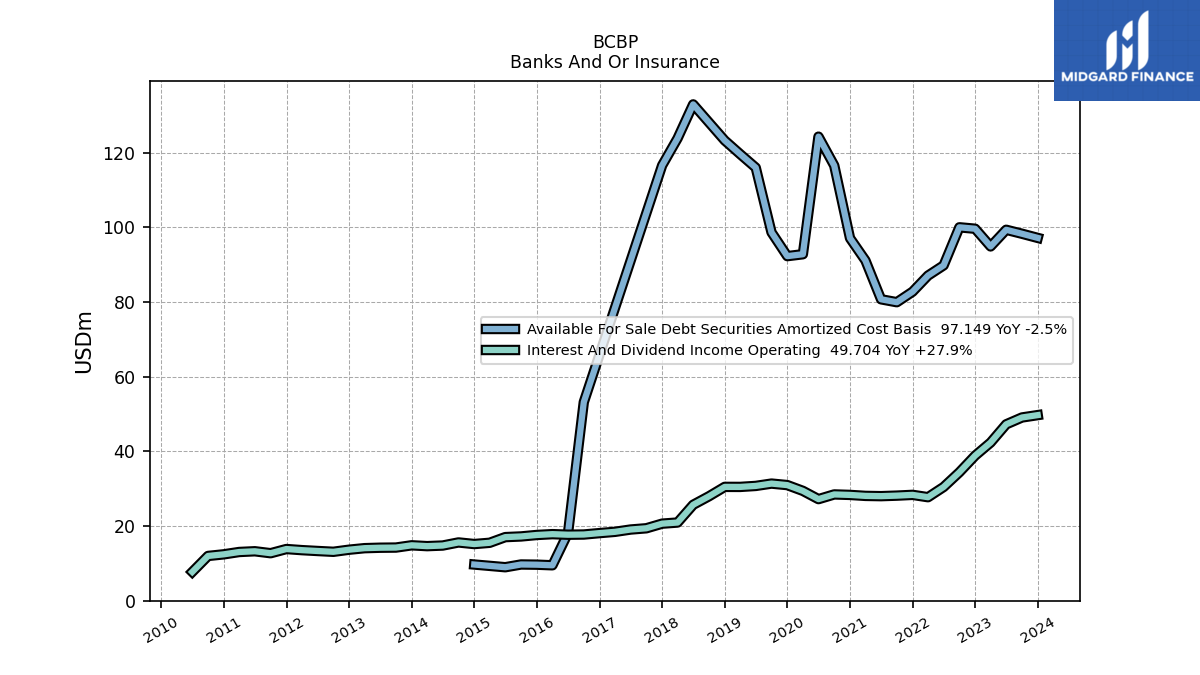
| Available For Sale Debt Securities Amortized Cost Basis | 97.15 | 98.26 | 99.33 | 94.86 | 99.60 | 99.99 | 89.79 | 87.06 | 82.75 | 79.93 | 80.71 | 91.09 | 97.07 | 116.51 | 124.26 | 92.77 | 92.27 | 98.64 | 115.96 | 119.58 | 123.24 | NA | 132.90 | 123.80 | 116.56 | NA | NA | NA | NA | 53.18 | 18.14 | 9.49 | 9.66 | 9.71 | 8.98 | NA | 9.70 | NA | NA | NA | NA | NA | NA | NA | NA | NA | NA | NA | NA | NA | NA | NA |
| 2023-12-31 | 2023-09-30 | 2023-06-30 | 2023-03-31 | 2022-12-31 | 2022-09-30 | 2022-06-30 | 2022-03-31 | 2021-12-31 | 2021-09-30 | 2021-06-30 | 2021-03-31 | 2020-12-31 | 2020-09-30 | 2020-06-30 | 2020-03-31 | 2019-12-31 | 2019-09-30 | 2019-06-30 | 2019-03-31 | 2018-12-31 | 2018-09-30 | 2018-06-30 | 2018-03-31 | 2017-12-31 | 2017-09-30 | 2017-06-30 | 2017-03-31 | 2016-12-31 | 2016-09-30 | 2016-06-30 | 2016-03-31 | 2015-12-31 | 2015-09-30 | 2015-06-30 | 2015-03-31 | 2014-12-31 | 2014-09-30 | 2014-06-30 | 2014-03-31 | 2013-12-31 | 2013-09-30 | 2013-06-30 | 2013-03-31 | 2012-12-31 | 2012-09-30 | 2012-06-30 | 2012-03-31 | 2011-12-31 | 2011-09-30 | 2011-06-30 | 2010-12-31 | ||
|---|---|---|---|---|---|---|---|---|---|---|---|---|---|---|---|---|---|---|---|---|---|---|---|---|---|---|---|---|---|---|---|---|---|---|---|---|---|---|---|---|---|---|---|---|---|---|---|---|---|---|---|---|---|
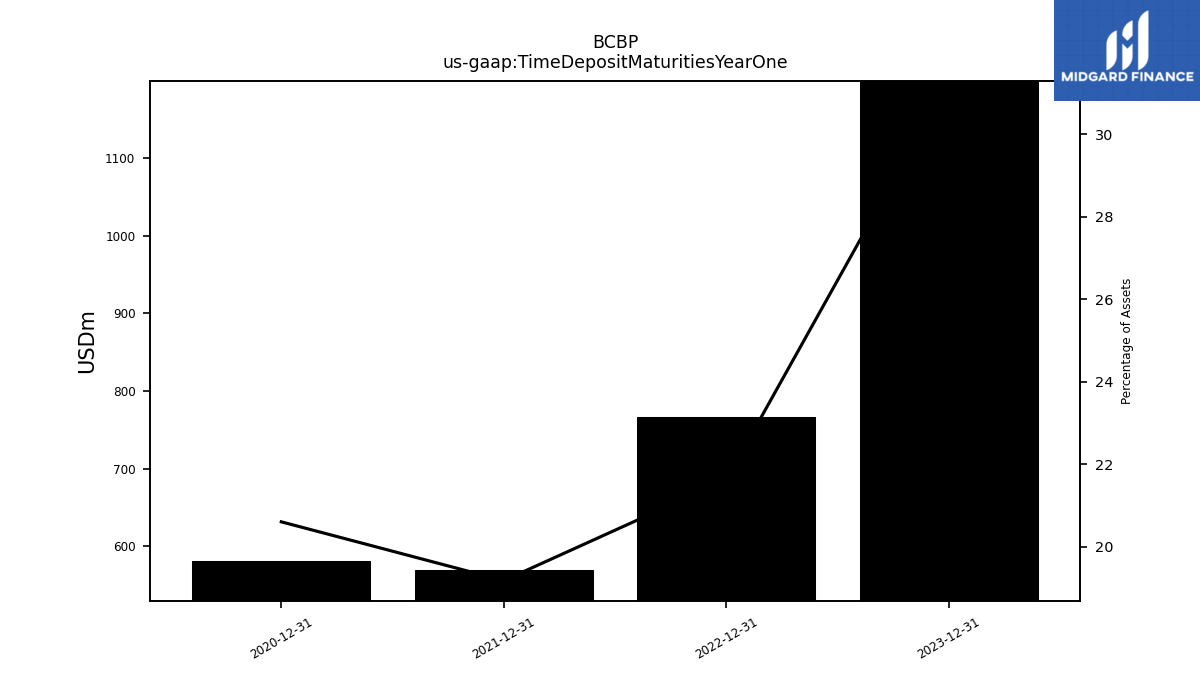
| Time Deposit Maturities Year One | 1199.12 | NA | NA | NA | 766.82 | NA | NA | NA | 569.23 | NA | NA | NA | 581.32 | NA | NA | NA | NA | NA | NA | NA | NA | NA | NA | NA | NA | NA | NA | NA | NA | NA | NA | NA | NA | NA | NA | NA | NA | NA | NA | NA | NA | NA | NA | NA | NA | NA | NA | NA | NA | NA | NA | NA | |
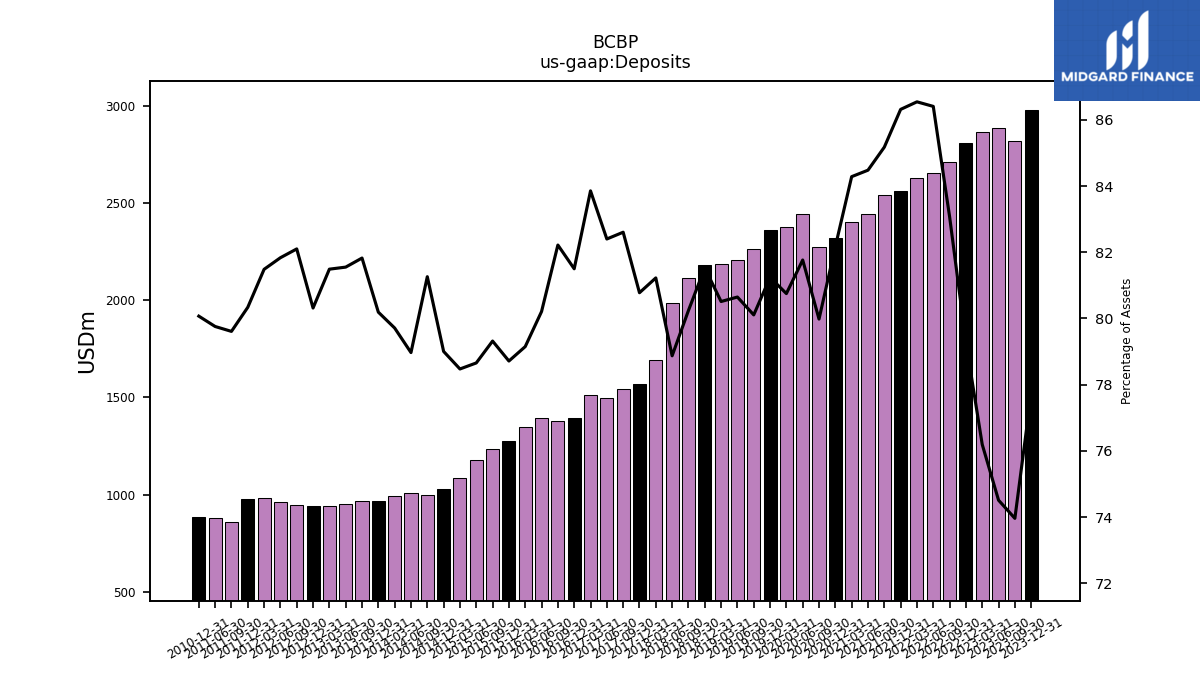
| Deposits | 2979.08 | 2819.56 | 2885.72 | 2867.21 | 2811.61 | 2712.95 | 2655.03 | 2631.18 | 2561.40 | 2541.41 | 2445.81 | 2404.14 | 2318.05 | 2273.34 | 2442.23 | 2375.72 | 2362.06 | 2263.46 | 2208.22 | 2188.63 | 2180.72 | 2116.62 | 1984.88 | 1691.35 | 1569.37 | 1546.15 | 1496.26 | 1513.84 | 1392.20 | 1380.38 | 1394.31 | 1350.42 | 1273.93 | 1233.28 | 1178.35 | 1085.90 | 1028.56 | 999.37 | 1009.54 | 992.00 | 968.67 | 967.97 | 951.99 | 943.80 | 940.79 | 948.12 | 964.83 | 981.52 | 977.62 | 859.58 | 877.61 | 886.29 |
| 2023-12-31 | 2023-09-30 | 2023-06-30 | 2023-03-31 | 2022-12-31 | 2022-09-30 | 2022-06-30 | 2022-03-31 | 2021-12-31 | 2021-09-30 | 2021-06-30 | 2021-03-31 | 2020-12-31 | 2020-09-30 | 2020-06-30 | 2020-03-31 | 2019-12-31 | 2019-09-30 | 2019-06-30 | 2019-03-31 | 2018-12-31 | 2018-09-30 | 2018-06-30 | 2018-03-31 | 2017-12-31 | 2017-09-30 | 2017-06-30 | 2017-03-31 | 2016-12-31 | 2016-09-30 | 2016-06-30 | 2016-03-31 | 2015-12-31 | 2015-09-30 | 2015-06-30 | 2015-03-31 | 2014-12-31 | 2014-09-30 | 2014-06-30 | 2014-03-31 | 2013-12-31 | 2013-09-30 | 2013-06-30 | 2013-03-31 | 2012-12-31 | 2012-09-30 | 2012-06-30 | 2012-03-31 | 2011-12-31 | 2011-09-30 | 2011-06-30 | 2010-12-31 | ||
|---|---|---|---|---|---|---|---|---|---|---|---|---|---|---|---|---|---|---|---|---|---|---|---|---|---|---|---|---|---|---|---|---|---|---|---|---|---|---|---|---|---|---|---|---|---|---|---|---|---|---|---|---|---|
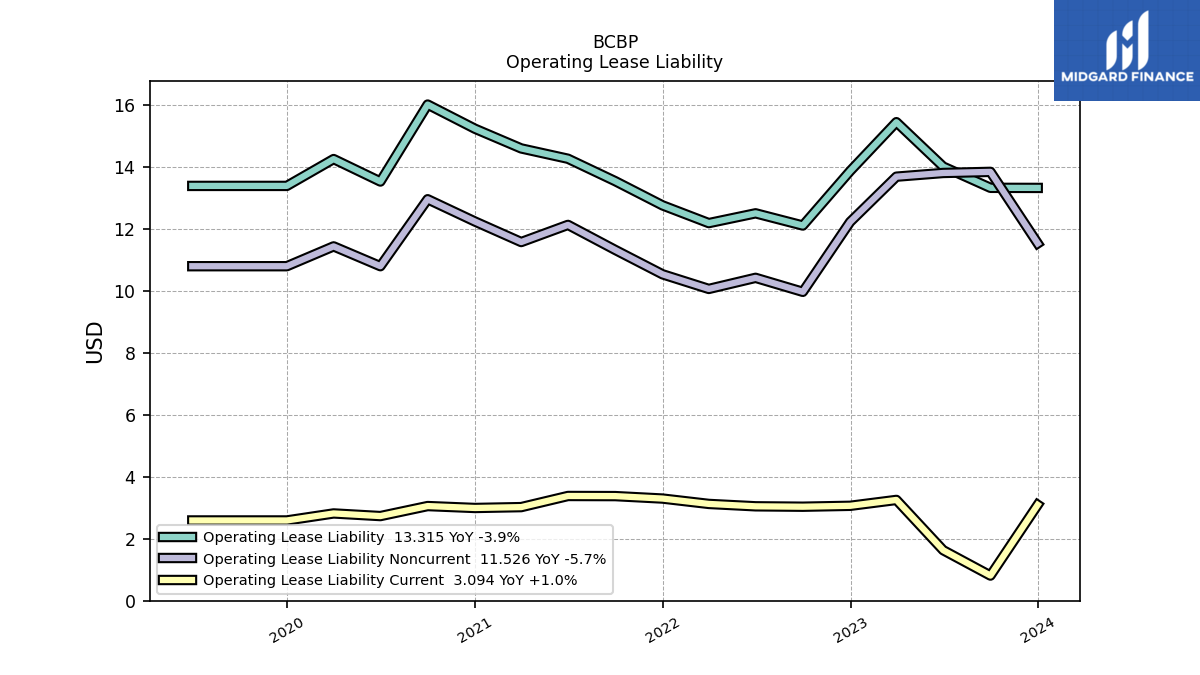
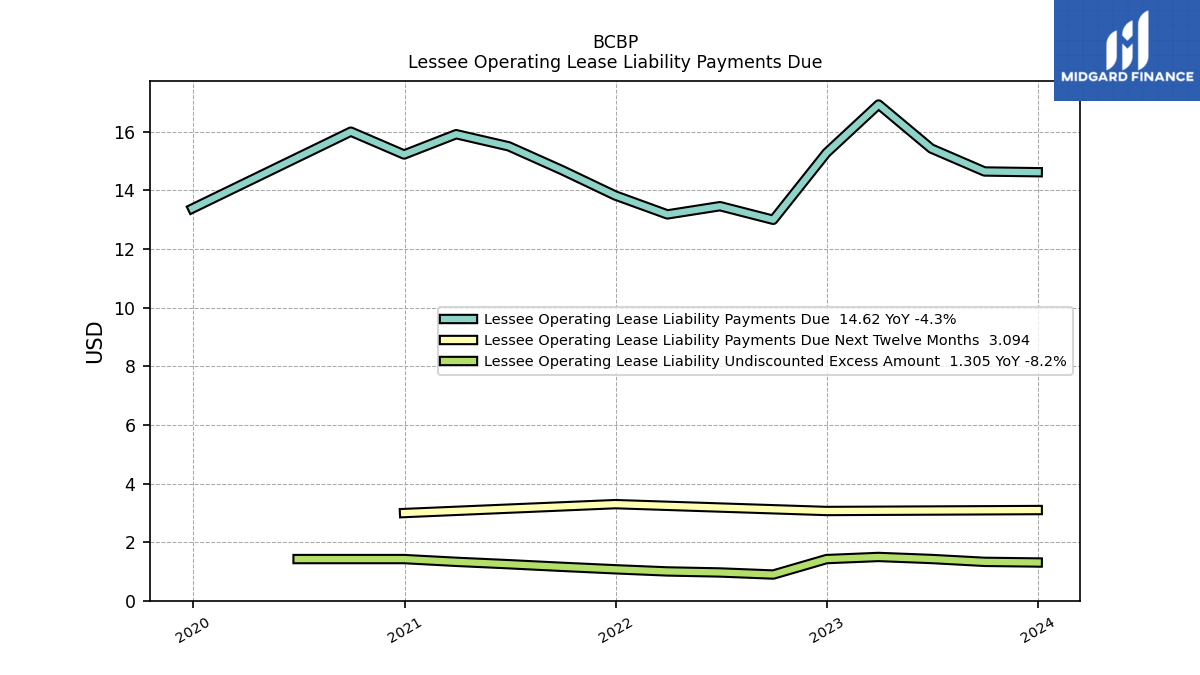
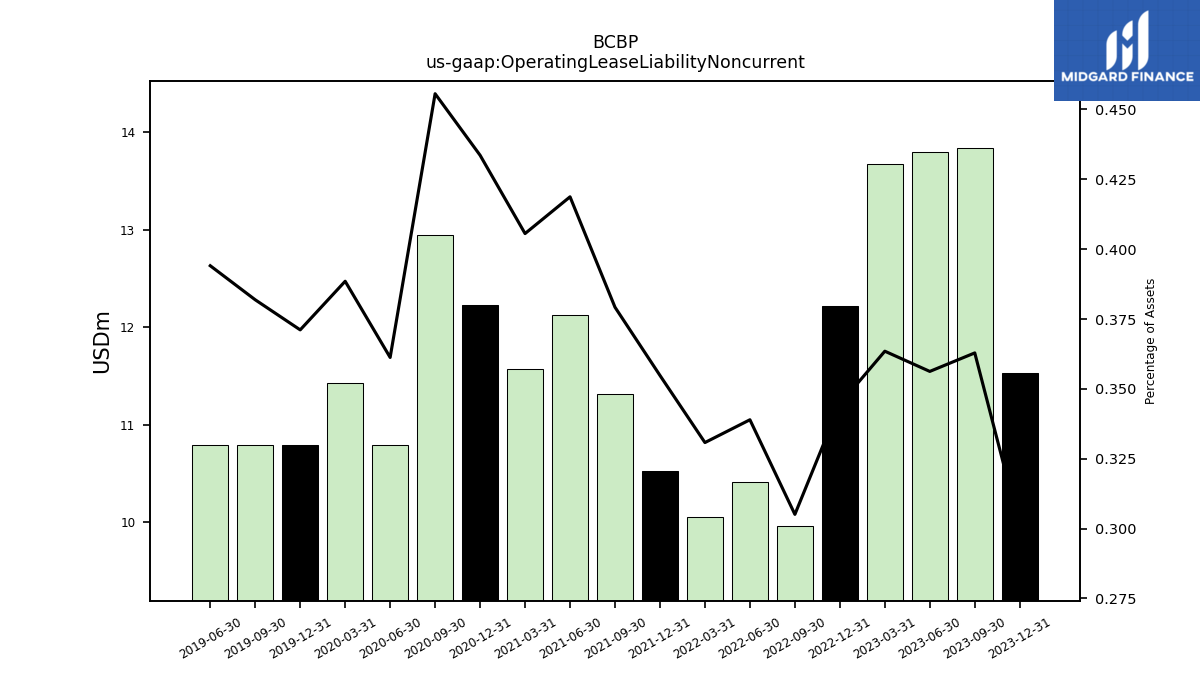
| Operating Lease Liability Noncurrent | 11.53 | 13.83 | 13.80 | 13.68 | 12.22 | 9.96 | 10.41 | 10.06 | 10.53 | 11.31 | 12.12 | 11.57 | 12.23 | 12.95 | 10.79 | 11.43 | 10.79 | 10.79 | 10.79 | NA | NA | NA | NA | NA | NA | NA | NA | NA | NA | NA | NA | NA | NA | NA | NA | NA | NA | NA | NA | NA | NA | NA | NA | NA | NA | NA | NA | NA | NA | NA | NA | NA |
| 2023-12-31 | 2023-09-30 | 2023-06-30 | 2023-03-31 | 2022-12-31 | 2022-09-30 | 2022-06-30 | 2022-03-31 | 2021-12-31 | 2021-09-30 | 2021-06-30 | 2021-03-31 | 2020-12-31 | 2020-09-30 | 2020-06-30 | 2020-03-31 | 2019-12-31 | 2019-09-30 | 2019-06-30 | 2019-03-31 | 2018-12-31 | 2018-09-30 | 2018-06-30 | 2018-03-31 | 2017-12-31 | 2017-09-30 | 2017-06-30 | 2017-03-31 | 2016-12-31 | 2016-09-30 | 2016-06-30 | 2016-03-31 | 2015-12-31 | 2015-09-30 | 2015-06-30 | 2015-03-31 | 2014-12-31 | 2014-09-30 | 2014-06-30 | 2014-03-31 | 2013-12-31 | 2013-09-30 | 2013-06-30 | 2013-03-31 | 2012-12-31 | 2012-09-30 | 2012-06-30 | 2012-03-31 | 2011-12-31 | 2011-09-30 | 2011-06-30 | 2010-12-31 | ||
|---|---|---|---|---|---|---|---|---|---|---|---|---|---|---|---|---|---|---|---|---|---|---|---|---|---|---|---|---|---|---|---|---|---|---|---|---|---|---|---|---|---|---|---|---|---|---|---|---|---|---|---|---|---|
| Stockholders Equity | 314.06 | 303.64 | 299.62 | 297.62 | 291.25 | 282.68 | 271.64 | 276.16 | 274.02 | 263.08 | 258.52 | 253.45 | 249.21 | 242.69 | 241.02 | 240.64 | 239.47 | 223.72 | 221.15 | 216.72 | 200.22 | 195.76 | 194.08 | 177.39 | 176.45 | 177.57 | 132.78 | 127.01 | 131.08 | 132.30 | 132.31 | 132.31 | 133.54 | 108.20 | 105.97 | 102.95 | 102.25 | 102.71 | 102.86 | 102.12 | 100.06 | 93.93 | 93.30 | 92.74 | 91.58 | 83.51 | 88.84 | 98.76 | 100.05 | 98.90 | 99.51 | 98.97 | |
| Additional Paid In Capital Common Stock | 198.92 | 198.10 | 197.52 | 197.20 | 196.16 | 195.06 | 194.57 | 194.22 | 193.93 | 193.61 | 192.97 | 192.63 | 192.28 | 191.75 | 191.16 | 190.66 | 190.29 | 177.25 | 176.77 | 176.38 | 175.50 | 175.97 | 175.72 | 164.51 | 164.23 | 164.01 | 120.98 | 120.76 | 120.42 | 119.33 | 119.13 | 119.82 | 118.80 | 93.27 | 93.14 | 92.88 | 92.69 | 92.59 | 92.39 | 92.20 | 92.06 | 92.05 | 91.88 | 91.88 | 91.85 | 91.83 | 91.77 | 91.75 | 91.72 | 85.56 | 85.53 | 85.33 | |
| Retained Earnings Accumulated Deficit | 135.93 | 132.73 | 128.87 | 123.12 | 115.11 | 105.89 | 95.39 | 88.13 | 81.17 | 73.39 | 68.12 | 62.78 | 58.34 | 53.74 | 48.10 | 48.17 | 48.43 | 45.95 | 43.35 | 40.75 | 38.41 | 35.69 | 33.57 | 33.73 | 31.24 | 31.61 | 30.14 | 29.38 | 28.16 | 27.50 | 27.39 | 27.61 | 27.38 | 27.80 | 26.95 | 26.45 | 25.98 | 25.72 | 26.01 | 24.75 | 23.71 | 22.57 | 21.56 | 20.15 | 18.88 | 18.85 | 21.24 | 25.71 | 25.25 | 25.45 | 25.37 | 23.75 | |
| Accumulated Other Comprehensive Income Loss Net Of Tax | -7.49 | -9.63 | -9.42 | -6.61 | -6.49 | -6.15 | -3.00 | -1.27 | 1.13 | -0.21 | -0.09 | -0.35 | -0.20 | 0.63 | 0.72 | 0.27 | -2.22 | -2.45 | -1.93 | -3.38 | -5.08 | -6.49 | -5.80 | -4.98 | -3.14 | -2.18 | -2.47 | -3.00 | -3.86 | -1.78 | -1.46 | -1.49 | -1.60 | -1.35 | -1.40 | -1.31 | -1.34 | -0.52 | -0.47 | 0.26 | 0.13 | -0.88 | -0.96 | -1.12 | -1.24 | -1.17 | -1.14 | -1.20 | -1.29 | 0.01 | 0.14 | 0.01 | |
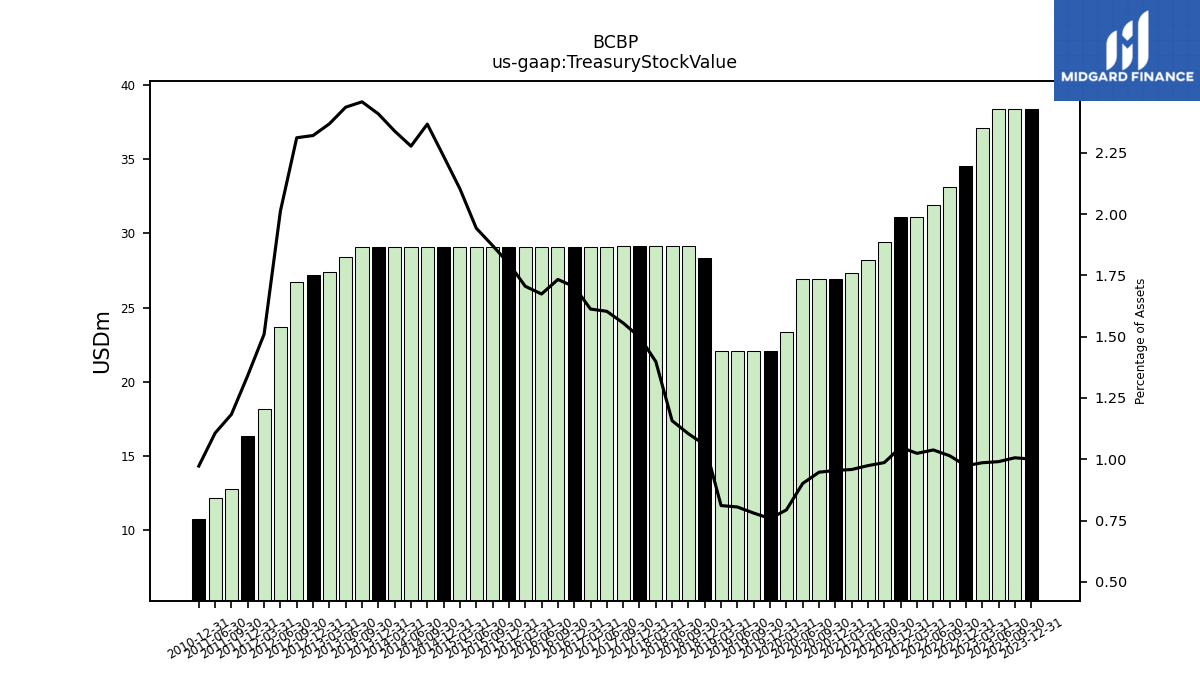
| Treasury Stock Value | 38.35 | 38.35 | 38.35 | 37.09 | 34.53 | 33.12 | 31.89 | 31.13 | 31.12 | 29.43 | 28.20 | 27.33 | 26.92 | 26.92 | 26.92 | 23.34 | 22.05 | 22.05 | 22.05 | 22.05 | 28.32 | 29.12 | 29.12 | 29.12 | 29.12 | 29.12 | 29.11 | 29.11 | 29.10 | 29.10 | 29.10 | 29.10 | 29.10 | 29.10 | 29.10 | 29.10 | 29.11 | 29.11 | 29.11 | 29.10 | 29.09 | 29.07 | 28.43 | 27.42 | 27.18 | 26.69 | 23.72 | 18.18 | 16.33 | 12.77 | 12.18 | 10.76 | |
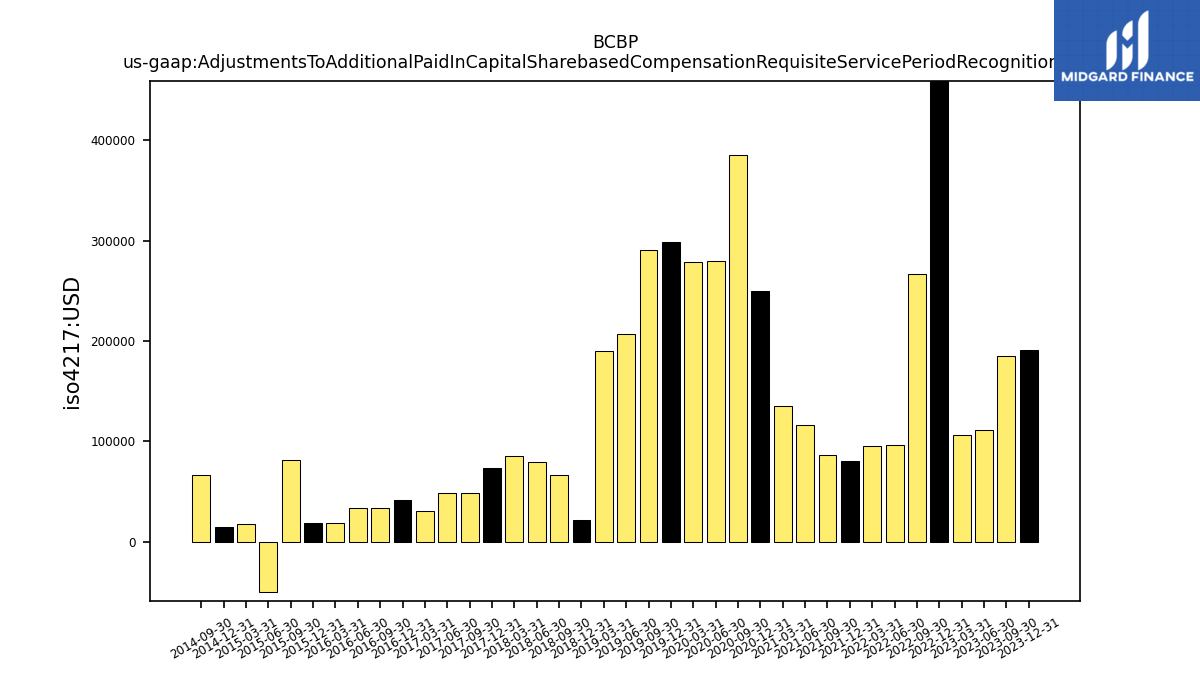
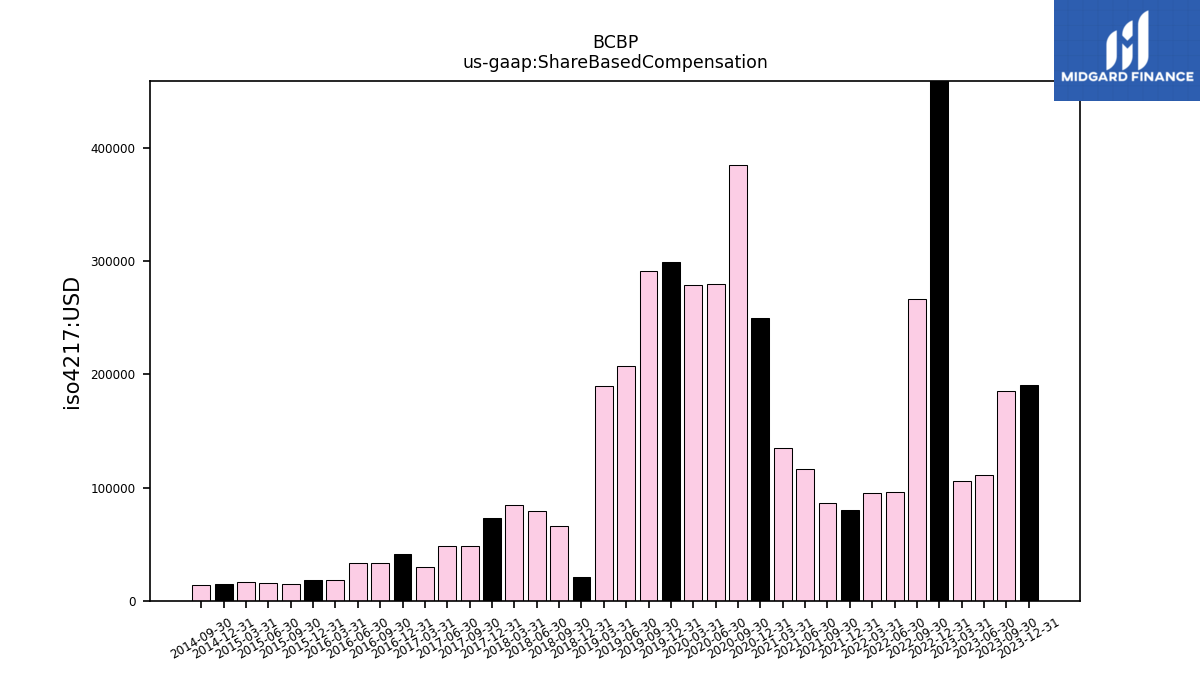
| Adjustments To Additional Paid In Capital Sharebased Compensation Requisite Service Period Recognition Value | 0.19 | 0.18 | 0.11 | 0.11 | 0.67 | 0.27 | 0.10 | 0.10 | 0.08 | 0.09 | 0.12 | 0.14 | 0.25 | 0.39 | 0.28 | 0.28 | 0.30 | 0.29 | 0.21 | 0.19 | 0.02 | 0.07 | 0.08 | 0.09 | 0.07 | 0.05 | 0.05 | 0.03 | 0.04 | 0.03 | 0.03 | 0.02 | 0.02 | 0.08 | -0.05 | 0.02 | 0.01 | 0.07 | NA | NA | NA | NA | NA | NA | NA | NA | NA | NA | NA | NA | NA | NA |
| 2023-12-31 | 2023-09-30 | 2023-06-30 | 2023-03-31 | 2022-12-31 | 2022-09-30 | 2022-06-30 | 2022-03-31 | 2021-12-31 | 2021-09-30 | 2021-06-30 | 2021-03-31 | 2020-12-31 | 2020-09-30 | 2020-06-30 | 2020-03-31 | 2019-12-31 | 2019-09-30 | 2019-06-30 | 2019-03-31 | 2018-12-31 | 2018-09-30 | 2018-06-30 | 2018-03-31 | 2017-12-31 | 2017-09-30 | 2017-06-30 | 2017-03-31 | 2016-12-31 | 2016-09-30 | 2016-06-30 | 2016-03-31 | 2015-12-31 | 2015-09-30 | 2015-06-30 | 2015-03-31 | 2014-12-31 | 2014-09-30 | 2014-06-30 | 2014-03-31 | 2013-12-31 | 2013-09-30 | 2013-06-30 | 2013-03-31 | 2012-12-31 | 2012-09-30 | 2012-06-30 | 2012-03-31 | 2011-12-31 | 2011-09-30 | 2011-06-30 | 2010-12-31 | ||
|---|---|---|---|---|---|---|---|---|---|---|---|---|---|---|---|---|---|---|---|---|---|---|---|---|---|---|---|---|---|---|---|---|---|---|---|---|---|---|---|---|---|---|---|---|---|---|---|---|---|---|---|---|---|
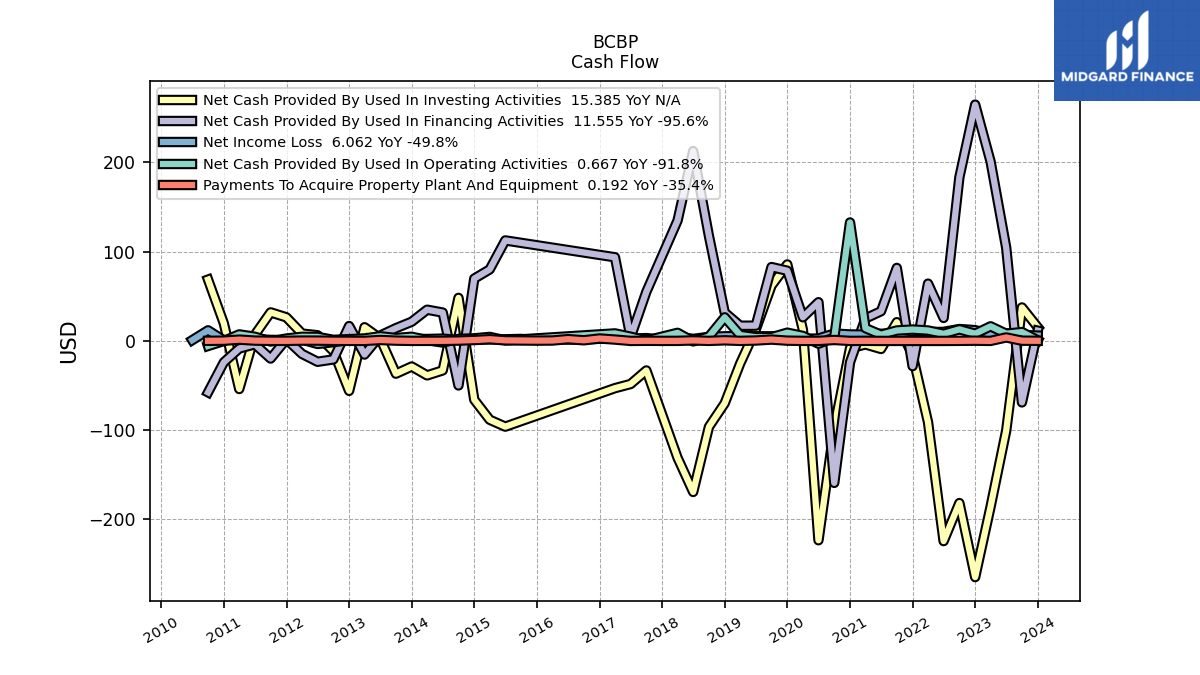
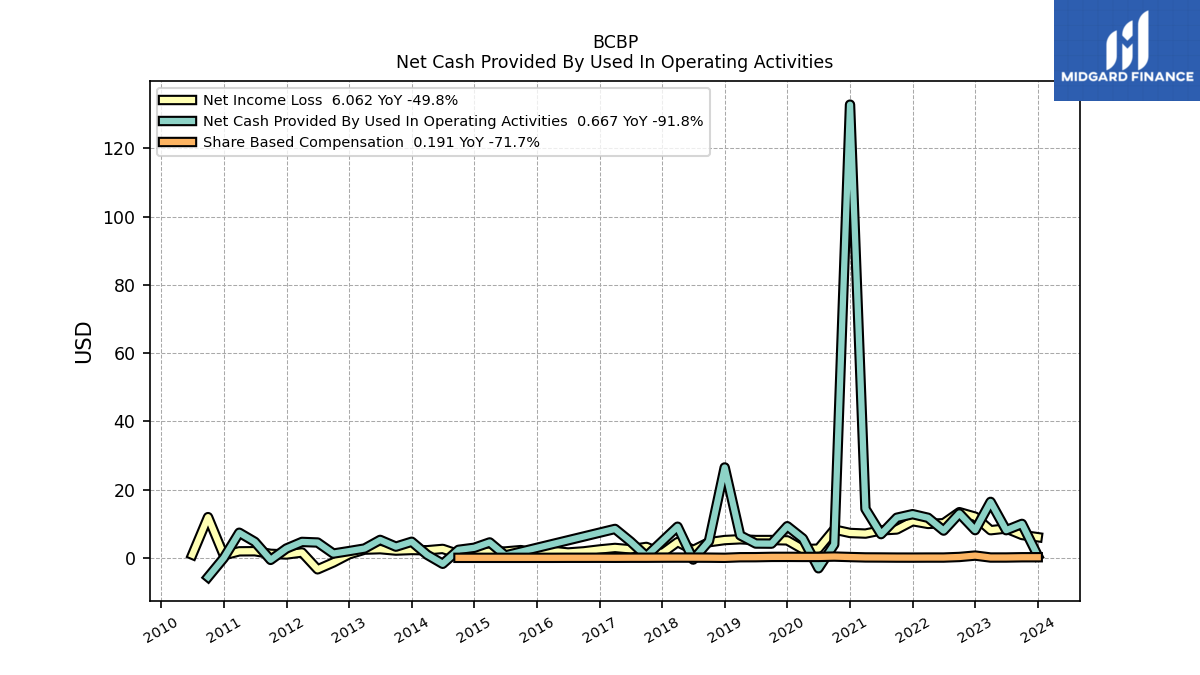
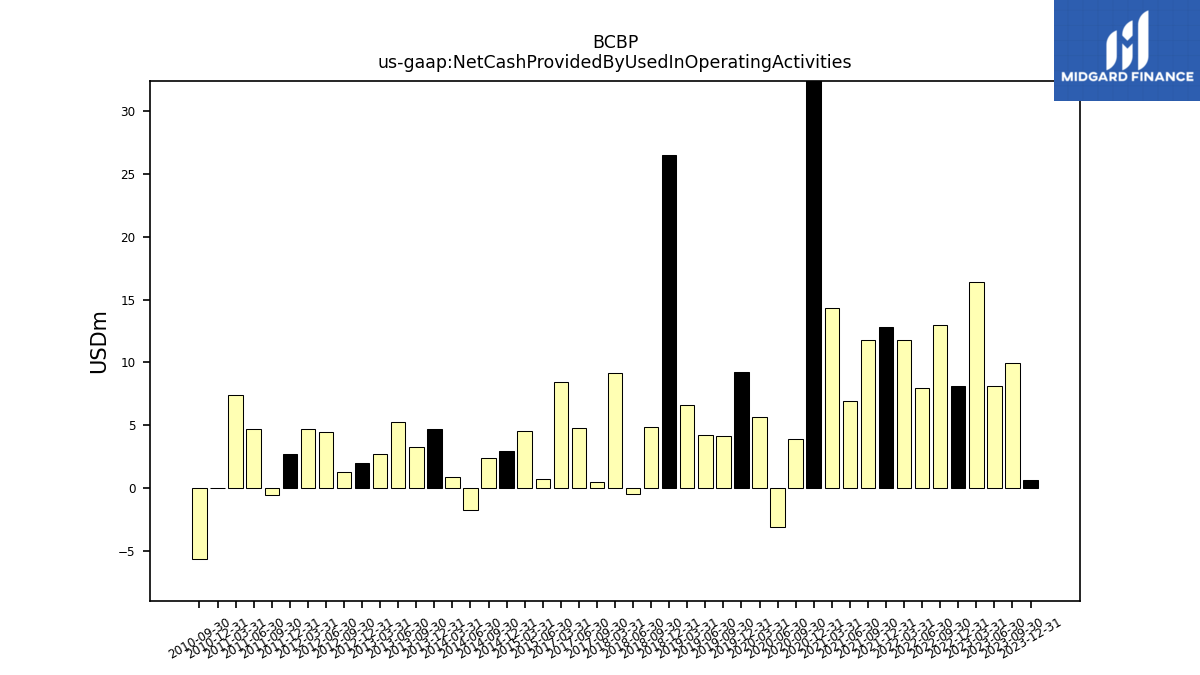
| Net Cash Provided By Used In Operating Activities | 0.67 | 9.97 | 8.11 | 16.41 | 8.13 | 13.02 | 7.99 | 11.75 | 12.81 | 11.76 | 6.96 | 14.37 | 132.79 | 3.94 | -3.06 | 5.67 | 9.28 | 4.17 | 4.20 | 6.61 | 26.50 | 4.89 | -0.50 | 9.13 | NA | 0.49 | 4.76 | 8.48 | NA | NA | NA | NA | NA | NA | 0.70 | 4.54 | 2.96 | 2.36 | -1.74 | 0.92 | 4.73 | 3.29 | 5.27 | 2.75 | 2.00 | 1.26 | 4.50 | 4.68 | 2.75 | -0.59 | 4.70 | -0.03 | |
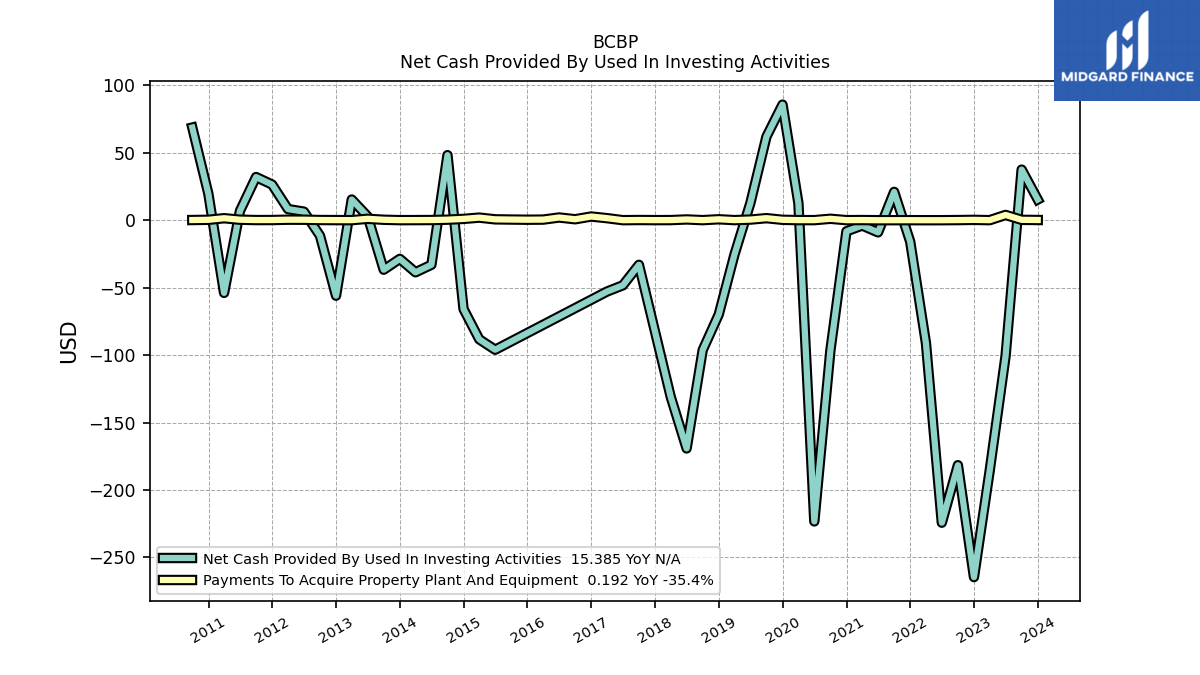
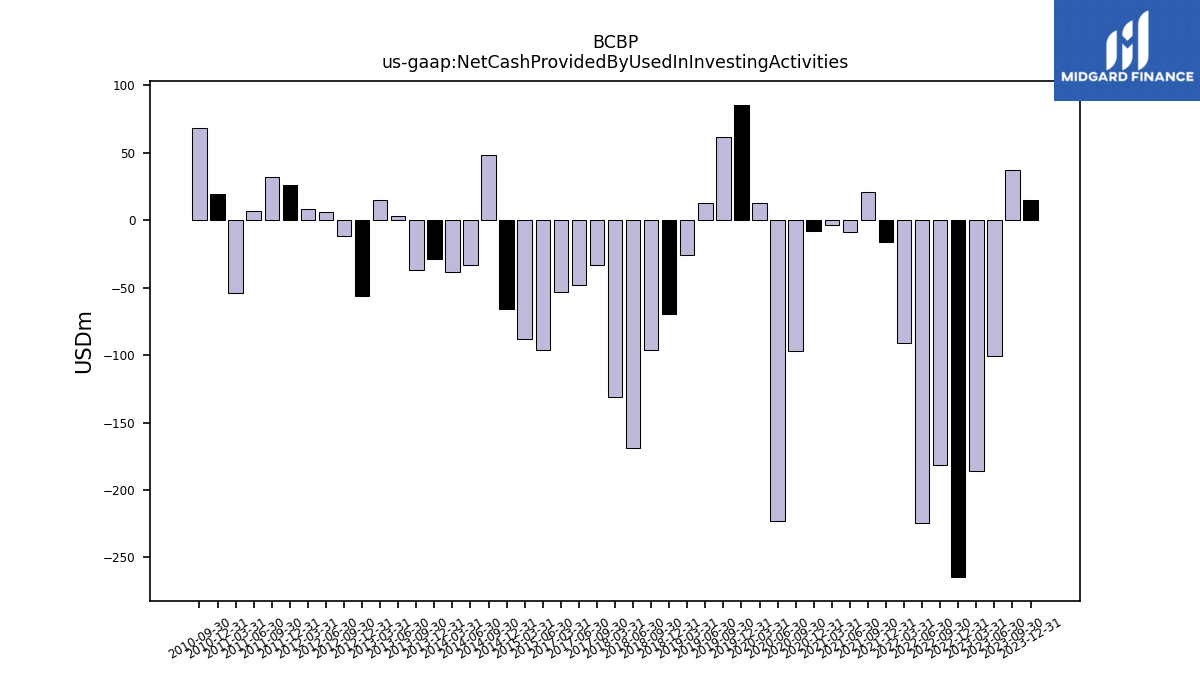
| Net Cash Provided By Used In Investing Activities | 15.38 | 37.58 | -100.58 | -185.70 | -264.62 | -181.62 | -224.27 | -90.99 | -15.88 | 21.06 | -8.96 | -3.88 | -8.19 | -96.62 | -223.31 | 12.63 | 85.75 | 62.00 | 12.75 | -25.40 | -69.84 | -96.23 | -169.19 | -130.94 | NA | -33.04 | -48.24 | -52.87 | NA | NA | NA | NA | NA | NA | -96.01 | -88.28 | -65.86 | 48.30 | -32.99 | -38.57 | -28.62 | -36.66 | 2.86 | 15.38 | -55.94 | -11.42 | 6.40 | 8.28 | 26.49 | 32.05 | 6.93 | 19.73 | |
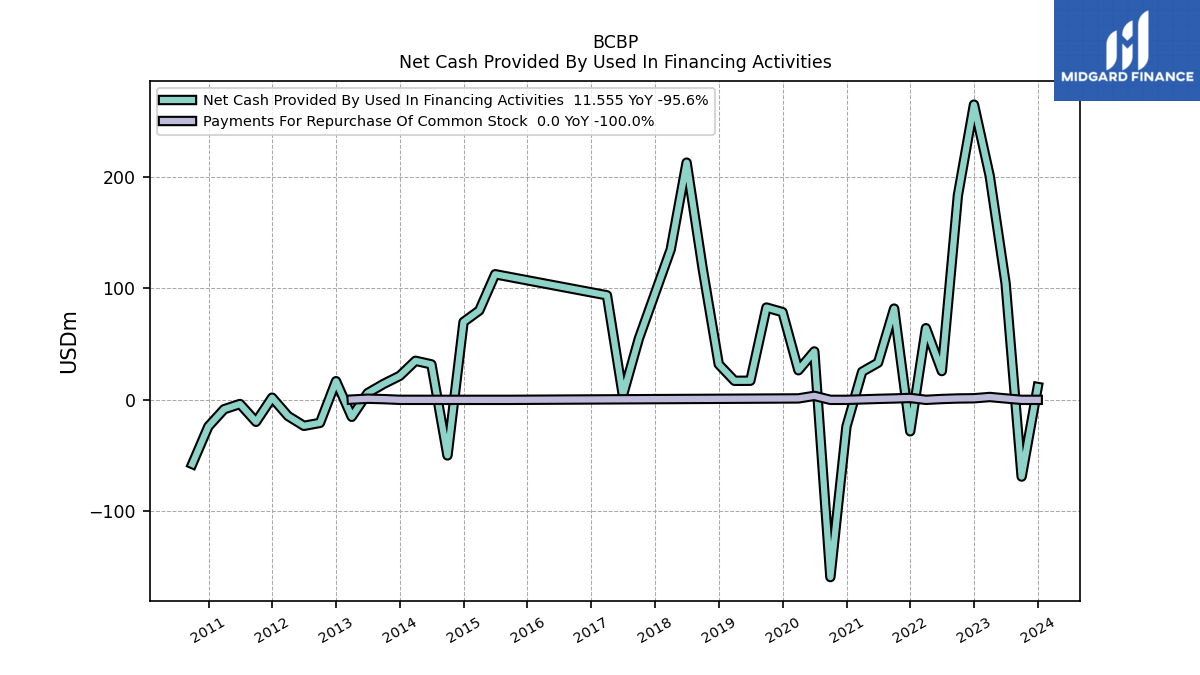
| Net Cash Provided By Used In Financing Activities | 11.55 | -68.84 | 104.61 | 201.01 | 264.83 | 183.45 | 25.80 | 64.26 | -28.23 | 81.86 | 33.33 | 25.22 | -23.92 | -159.03 | 43.43 | 26.53 | 78.71 | 82.80 | 17.14 | 17.07 | 31.89 | 117.60 | 212.80 | 134.91 | NA | 55.12 | 4.10 | 93.77 | NA | NA | NA | NA | NA | NA | 112.67 | 80.15 | 69.89 | -49.86 | 31.83 | 35.04 | 21.55 | 14.34 | 6.05 | -15.24 | 16.74 | -20.68 | -23.31 | -14.47 | 1.96 | -19.72 | -3.71 | -23.91 |
| 2023-12-31 | 2023-09-30 | 2023-06-30 | 2023-03-31 | 2022-12-31 | 2022-09-30 | 2022-06-30 | 2022-03-31 | 2021-12-31 | 2021-09-30 | 2021-06-30 | 2021-03-31 | 2020-12-31 | 2020-09-30 | 2020-06-30 | 2020-03-31 | 2019-12-31 | 2019-09-30 | 2019-06-30 | 2019-03-31 | 2018-12-31 | 2018-09-30 | 2018-06-30 | 2018-03-31 | 2017-12-31 | 2017-09-30 | 2017-06-30 | 2017-03-31 | 2016-12-31 | 2016-09-30 | 2016-06-30 | 2016-03-31 | 2015-12-31 | 2015-09-30 | 2015-06-30 | 2015-03-31 | 2014-12-31 | 2014-09-30 | 2014-06-30 | 2014-03-31 | 2013-12-31 | 2013-09-30 | 2013-06-30 | 2013-03-31 | 2012-12-31 | 2012-09-30 | 2012-06-30 | 2012-03-31 | 2011-12-31 | 2011-09-30 | 2011-06-30 | 2010-12-31 | ||
|---|---|---|---|---|---|---|---|---|---|---|---|---|---|---|---|---|---|---|---|---|---|---|---|---|---|---|---|---|---|---|---|---|---|---|---|---|---|---|---|---|---|---|---|---|---|---|---|---|---|---|---|---|---|
| Net Cash Provided By Used In Operating Activities | 0.67 | 9.97 | 8.11 | 16.41 | 8.13 | 13.02 | 7.99 | 11.75 | 12.81 | 11.76 | 6.96 | 14.37 | 132.79 | 3.94 | -3.06 | 5.67 | 9.28 | 4.17 | 4.20 | 6.61 | 26.50 | 4.89 | -0.50 | 9.13 | NA | 0.49 | 4.76 | 8.48 | NA | NA | NA | NA | NA | NA | 0.70 | 4.54 | 2.96 | 2.36 | -1.74 | 0.92 | 4.73 | 3.29 | 5.27 | 2.75 | 2.00 | 1.26 | 4.50 | 4.68 | 2.75 | -0.59 | 4.70 | -0.03 | |
| Net Income Loss | 6.06 | 6.71 | 8.60 | 8.11 | 12.07 | 13.39 | 10.16 | 9.95 | 10.75 | 8.32 | 8.05 | 7.12 | 7.30 | 8.31 | 2.73 | 2.52 | 5.12 | 5.23 | 5.23 | 5.45 | 5.22 | 4.59 | 2.31 | 4.63 | 1.34 | 3.22 | 2.51 | 2.91 | 2.47 | 1.91 | 1.58 | 2.04 | 1.02 | 2.28 | 1.88 | 1.85 | 1.64 | 1.09 | 2.63 | 2.23 | 2.31 | 2.14 | 2.55 | 2.41 | 1.06 | -1.34 | -3.36 | 1.59 | 0.99 | 1.19 | 1.95 | 0.74 | |
| Deferred Income Tax Expense Benefit | -3.32 | -0.10 | -0.27 | 1.15 | -0.50 | -1.24 | 0.00 | 0.73 | -0.04 | 0.30 | -0.62 | -0.62 | -0.07 | -0.81 | -0.84 | -0.29 | 2.14 | -0.29 | -0.30 | -0.27 | -1.79 | 0.00 | 0.05 | -0.33 | 1.62 | 1.73 | -0.13 | 0.71 | 0.03 | 1.53 | -0.01 | -0.06 | -0.72 | 1.37 | -0.41 | -0.23 | -1.35 | 3.21 | NA | NA | -0.85 | 0.55 | -0.19 | -0.35 | -0.65 | 0.73 | 0.54 | -0.78 | -2.03 | 0.41 | -0.10 | -0.04 | |
| Share Based Compensation | 0.19 | 0.18 | 0.11 | 0.11 | 0.67 | 0.27 | 0.10 | 0.10 | 0.08 | 0.09 | 0.12 | 0.14 | 0.25 | 0.39 | 0.28 | 0.28 | 0.30 | 0.29 | 0.21 | 0.19 | 0.02 | 0.07 | 0.08 | 0.09 | 0.07 | 0.05 | 0.05 | 0.03 | 0.04 | 0.03 | 0.03 | 0.02 | 0.02 | 0.01 | 0.02 | 0.02 | 0.01 | 0.01 | NA | NA | NA | NA | NA | NA | NA | NA | NA | NA | NA | NA | NA | NA |
| 2023-12-31 | 2023-09-30 | 2023-06-30 | 2023-03-31 | 2022-12-31 | 2022-09-30 | 2022-06-30 | 2022-03-31 | 2021-12-31 | 2021-09-30 | 2021-06-30 | 2021-03-31 | 2020-12-31 | 2020-09-30 | 2020-06-30 | 2020-03-31 | 2019-12-31 | 2019-09-30 | 2019-06-30 | 2019-03-31 | 2018-12-31 | 2018-09-30 | 2018-06-30 | 2018-03-31 | 2017-12-31 | 2017-09-30 | 2017-06-30 | 2017-03-31 | 2016-12-31 | 2016-09-30 | 2016-06-30 | 2016-03-31 | 2015-12-31 | 2015-09-30 | 2015-06-30 | 2015-03-31 | 2014-12-31 | 2014-09-30 | 2014-06-30 | 2014-03-31 | 2013-12-31 | 2013-09-30 | 2013-06-30 | 2013-03-31 | 2012-12-31 | 2012-09-30 | 2012-06-30 | 2012-03-31 | 2011-12-31 | 2011-09-30 | 2011-06-30 | 2010-12-31 | ||
|---|---|---|---|---|---|---|---|---|---|---|---|---|---|---|---|---|---|---|---|---|---|---|---|---|---|---|---|---|---|---|---|---|---|---|---|---|---|---|---|---|---|---|---|---|---|---|---|---|---|---|---|---|---|
| Net Cash Provided By Used In Investing Activities | 15.38 | 37.58 | -100.58 | -185.70 | -264.62 | -181.62 | -224.27 | -90.99 | -15.88 | 21.06 | -8.96 | -3.88 | -8.19 | -96.62 | -223.31 | 12.63 | 85.75 | 62.00 | 12.75 | -25.40 | -69.84 | -96.23 | -169.19 | -130.94 | NA | -33.04 | -48.24 | -52.87 | NA | NA | NA | NA | NA | NA | -96.01 | -88.28 | -65.86 | 48.30 | -32.99 | -38.57 | -28.62 | -36.66 | 2.86 | 15.38 | -55.94 | -11.42 | 6.40 | 8.28 | 26.49 | 32.05 | 6.93 | 19.73 | |
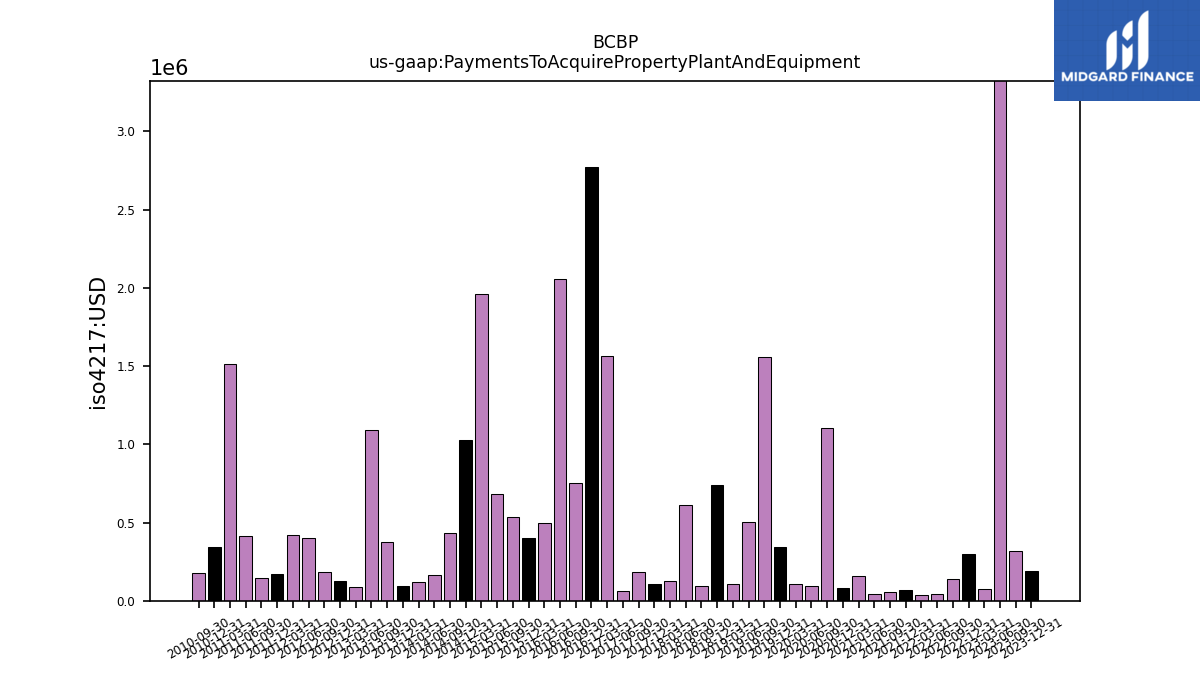
| Payments To Acquire Property Plant And Equipment | 0.19 | 0.32 | 3.94 | 0.08 | 0.30 | 0.14 | 0.04 | 0.04 | 0.07 | 0.06 | 0.04 | 0.16 | 0.08 | 1.10 | 0.10 | 0.11 | 0.34 | 1.55 | 0.51 | 0.11 | 0.74 | 0.09 | 0.61 | 0.13 | 0.10 | 0.18 | 0.06 | 1.56 | 2.77 | 0.76 | 2.05 | 0.49 | 0.40 | 0.53 | 0.68 | 1.96 | 1.03 | 0.44 | 0.17 | 0.12 | 0.09 | 0.38 | 1.09 | 0.09 | 0.12 | 0.18 | 0.40 | 0.42 | 0.17 | 0.15 | 0.41 | 0.34 |
| 2023-12-31 | 2023-09-30 | 2023-06-30 | 2023-03-31 | 2022-12-31 | 2022-09-30 | 2022-06-30 | 2022-03-31 | 2021-12-31 | 2021-09-30 | 2021-06-30 | 2021-03-31 | 2020-12-31 | 2020-09-30 | 2020-06-30 | 2020-03-31 | 2019-12-31 | 2019-09-30 | 2019-06-30 | 2019-03-31 | 2018-12-31 | 2018-09-30 | 2018-06-30 | 2018-03-31 | 2017-12-31 | 2017-09-30 | 2017-06-30 | 2017-03-31 | 2016-12-31 | 2016-09-30 | 2016-06-30 | 2016-03-31 | 2015-12-31 | 2015-09-30 | 2015-06-30 | 2015-03-31 | 2014-12-31 | 2014-09-30 | 2014-06-30 | 2014-03-31 | 2013-12-31 | 2013-09-30 | 2013-06-30 | 2013-03-31 | 2012-12-31 | 2012-09-30 | 2012-06-30 | 2012-03-31 | 2011-12-31 | 2011-09-30 | 2011-06-30 | 2010-12-31 | ||
|---|---|---|---|---|---|---|---|---|---|---|---|---|---|---|---|---|---|---|---|---|---|---|---|---|---|---|---|---|---|---|---|---|---|---|---|---|---|---|---|---|---|---|---|---|---|---|---|---|---|---|---|---|---|
| Net Cash Provided By Used In Financing Activities | 11.55 | -68.84 | 104.61 | 201.01 | 264.83 | 183.45 | 25.80 | 64.26 | -28.23 | 81.86 | 33.33 | 25.22 | -23.92 | -159.03 | 43.43 | 26.53 | 78.71 | 82.80 | 17.14 | 17.07 | 31.89 | 117.60 | 212.80 | 134.91 | NA | 55.12 | 4.10 | 93.77 | NA | NA | NA | NA | NA | NA | 112.67 | 80.15 | 69.89 | -49.86 | 31.83 | 35.04 | 21.55 | 14.34 | 6.05 | -15.24 | 16.74 | -20.68 | -23.31 | -14.47 | 1.96 | -19.72 | -3.71 | -23.91 | |
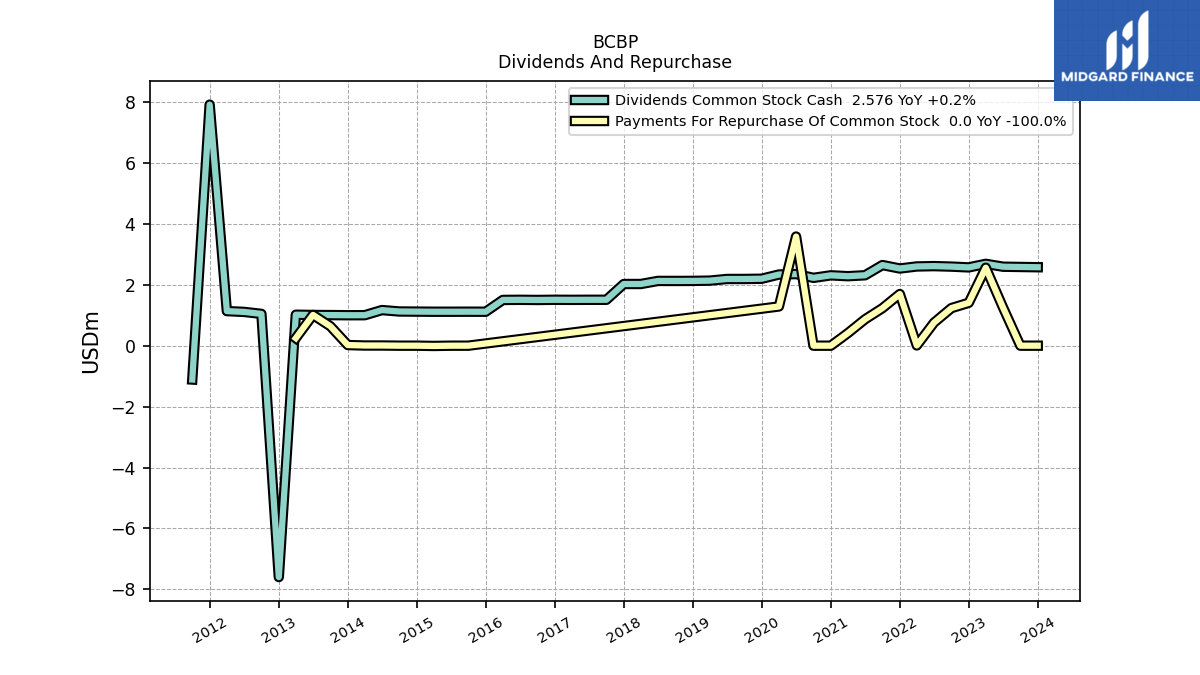
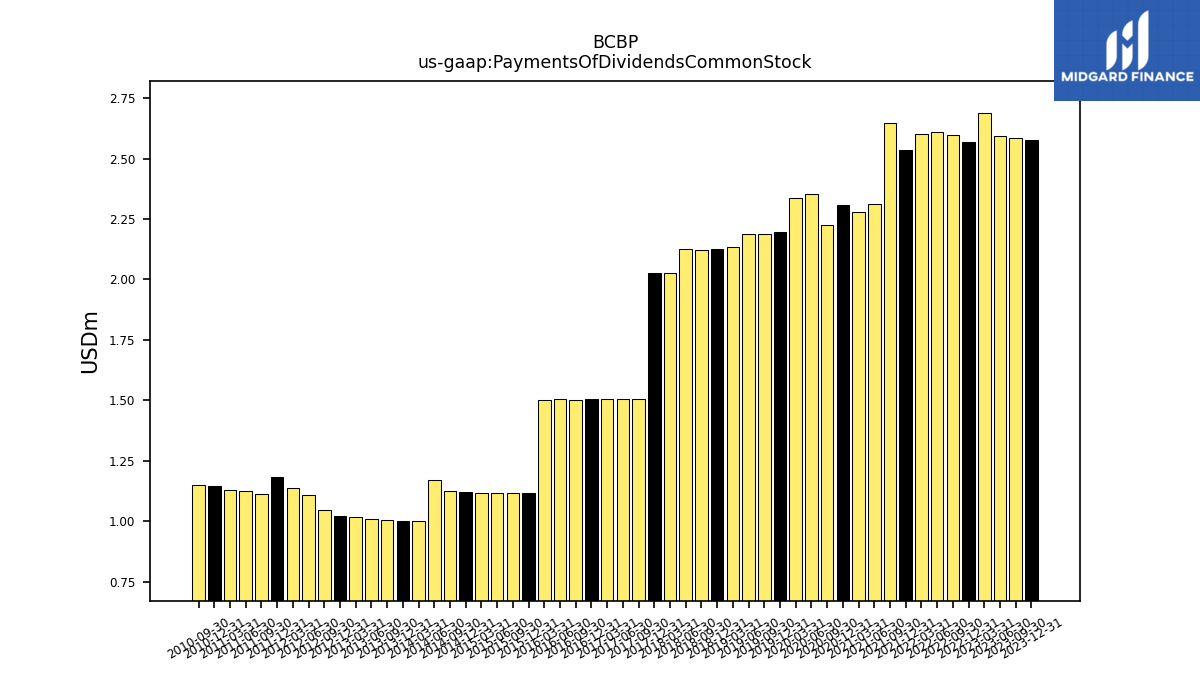
| Payments Of Dividends Common Stock | 2.58 | 2.58 | 2.59 | 2.69 | 2.57 | 2.60 | 2.61 | 2.60 | 2.53 | 2.65 | 2.31 | 2.28 | 2.31 | 2.23 | 2.35 | 2.34 | 2.20 | 2.19 | 2.19 | 2.14 | 2.13 | 2.12 | 2.13 | 2.02 | 2.02 | 1.51 | 1.51 | 1.50 | 1.51 | 1.50 | 1.51 | 1.50 | 1.11 | 1.12 | 1.11 | 1.11 | 1.12 | 1.12 | 1.17 | 1.00 | 1.00 | 1.00 | 1.01 | 1.02 | 1.02 | 1.04 | 1.11 | 1.14 | 1.18 | 1.11 | 1.13 | 1.14 | |
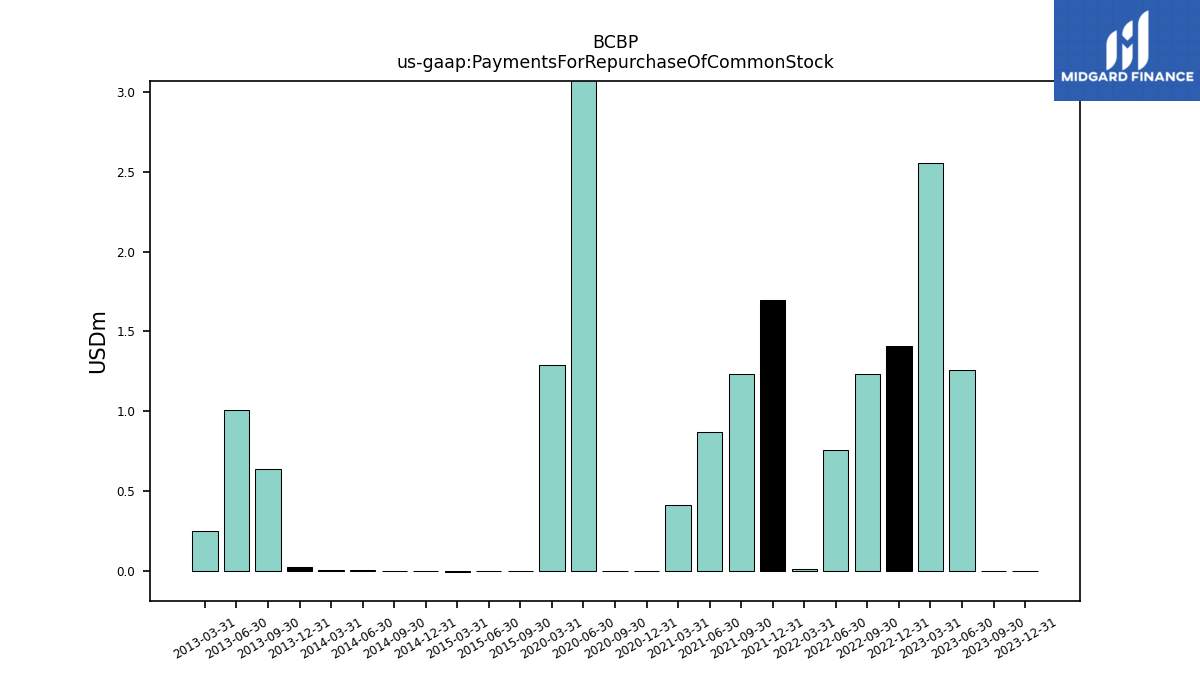
| Payments For Repurchase Of Common Stock | 0.00 | 0.00 | 1.26 | 2.56 | 1.41 | 1.23 | 0.76 | 0.01 | 1.70 | 1.23 | 0.87 | 0.41 | 0.00 | 0.00 | 3.58 | 1.29 | NA | NA | NA | NA | NA | NA | NA | NA | NA | NA | NA | NA | NA | NA | NA | NA | NA | 0.00 | 0.00 | -0.01 | 0.00 | 0.00 | 0.01 | 0.01 | 0.02 | 0.64 | 1.01 | 0.25 | NA | NA | NA | NA | NA | NA | NA | NA |