
| 2023-12-31 | 2023-09-30 | 2023-06-30 | 2023-03-31 | 2022-12-31 | 2022-09-30 | 2022-06-30 | 2022-03-31 | 2021-12-31 | 2021-09-30 | 2021-06-30 | 2021-03-31 | 2020-12-31 | 2020-09-30 | 2020-06-30 | 2020-03-31 | 2019-12-31 | 2019-09-30 | 2019-06-30 | 2019-03-31 | 2018-12-31 | 2018-09-30 | 2018-06-30 | 2018-03-31 | 2017-12-31 | 2017-09-30 | 2017-06-30 | 2017-03-31 | 2016-12-31 | 2016-09-30 | 2016-06-30 | 2016-03-31 | ||
|---|---|---|---|---|---|---|---|---|---|---|---|---|---|---|---|---|---|---|---|---|---|---|---|---|---|---|---|---|---|---|---|---|---|
| Earnings Per Share Basic | 1.15 | -0.70 | -1.70 | -1.27 | -0.45 | -1.09 | -1.56 | -1.56 | -0.55 | -0.86 | -0.65 | -0.61 | 0.33 | 0.07 | -0.53 | -0.24 | 0.49 | -0.10 | -0.05 | 0.10 | 0.27 | 0.18 | NA | 0.08 | NA | NA | NA | NA | NA | NA | NA | NA | |
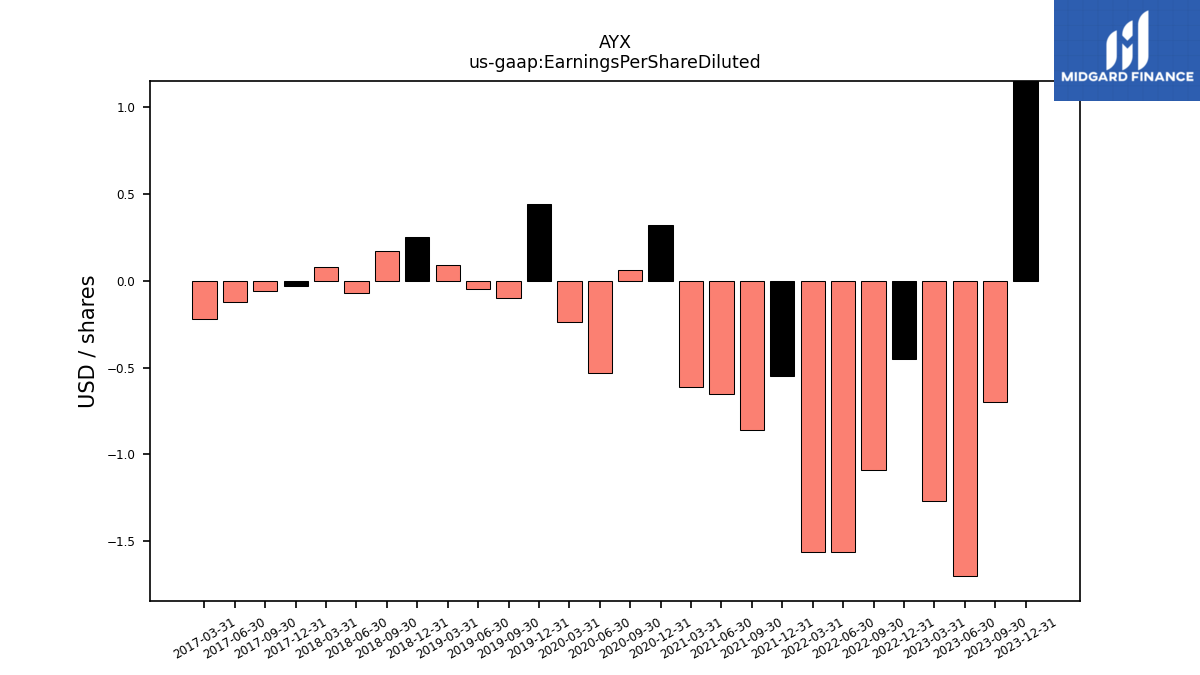
| Earnings Per Share Diluted | 1.15 | -0.70 | -1.70 | -1.27 | -0.45 | -1.09 | -1.56 | -1.56 | -0.55 | -0.86 | -0.65 | -0.61 | 0.32 | 0.06 | -0.53 | -0.24 | 0.44 | -0.10 | -0.05 | 0.09 | 0.25 | 0.17 | -0.07 | 0.08 | -0.03 | -0.06 | -0.12 | -0.22 | NA | NA | NA | NA |
| 2023-12-31 | 2023-09-30 | 2023-06-30 | 2023-03-31 | 2022-12-31 | 2022-09-30 | 2022-06-30 | 2022-03-31 | 2021-12-31 | 2021-09-30 | 2021-06-30 | 2021-03-31 | 2020-12-31 | 2020-09-30 | 2020-06-30 | 2020-03-31 | 2019-12-31 | 2019-09-30 | 2019-06-30 | 2019-03-31 | 2018-12-31 | 2018-09-30 | 2018-06-30 | 2018-03-31 | 2017-12-31 | 2017-09-30 | 2017-06-30 | 2017-03-31 | 2016-12-31 | 2016-09-30 | 2016-06-30 | 2016-03-31 | ||
|---|---|---|---|---|---|---|---|---|---|---|---|---|---|---|---|---|---|---|---|---|---|---|---|---|---|---|---|---|---|---|---|---|---|
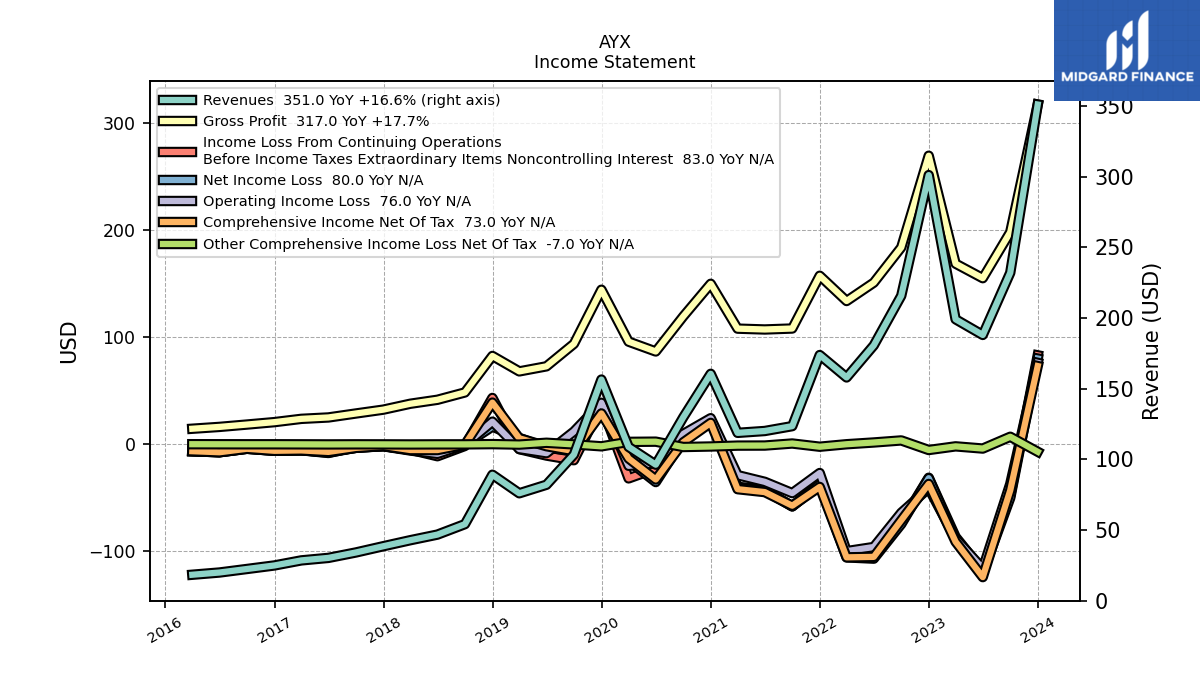
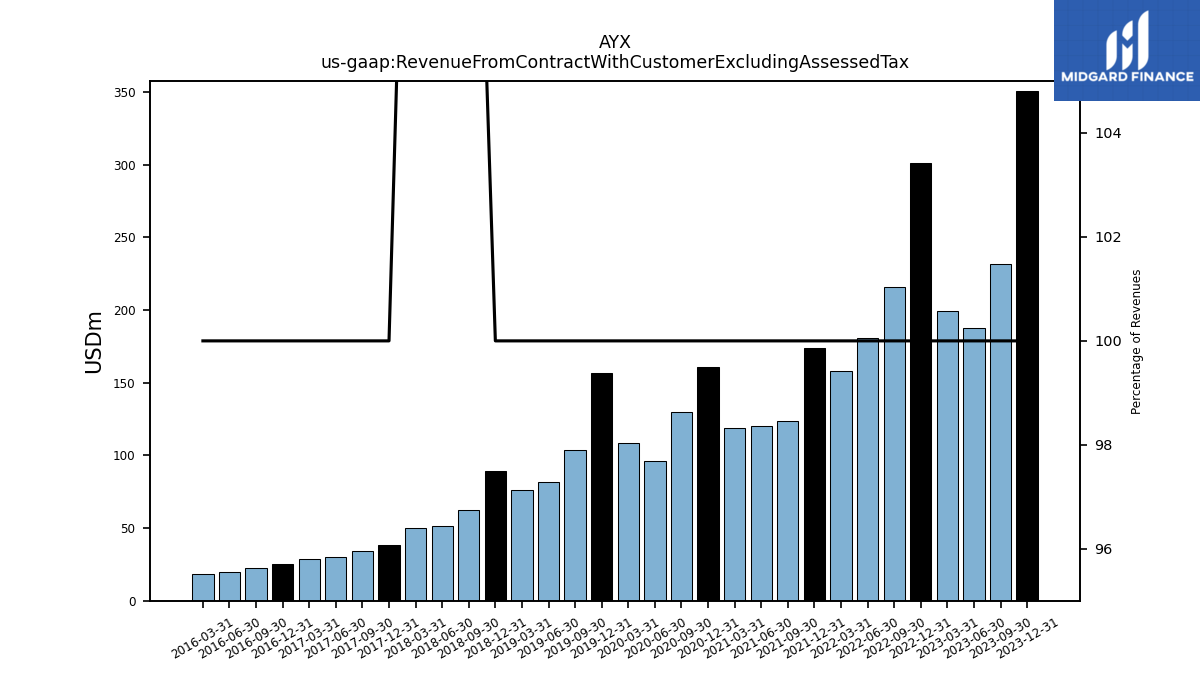
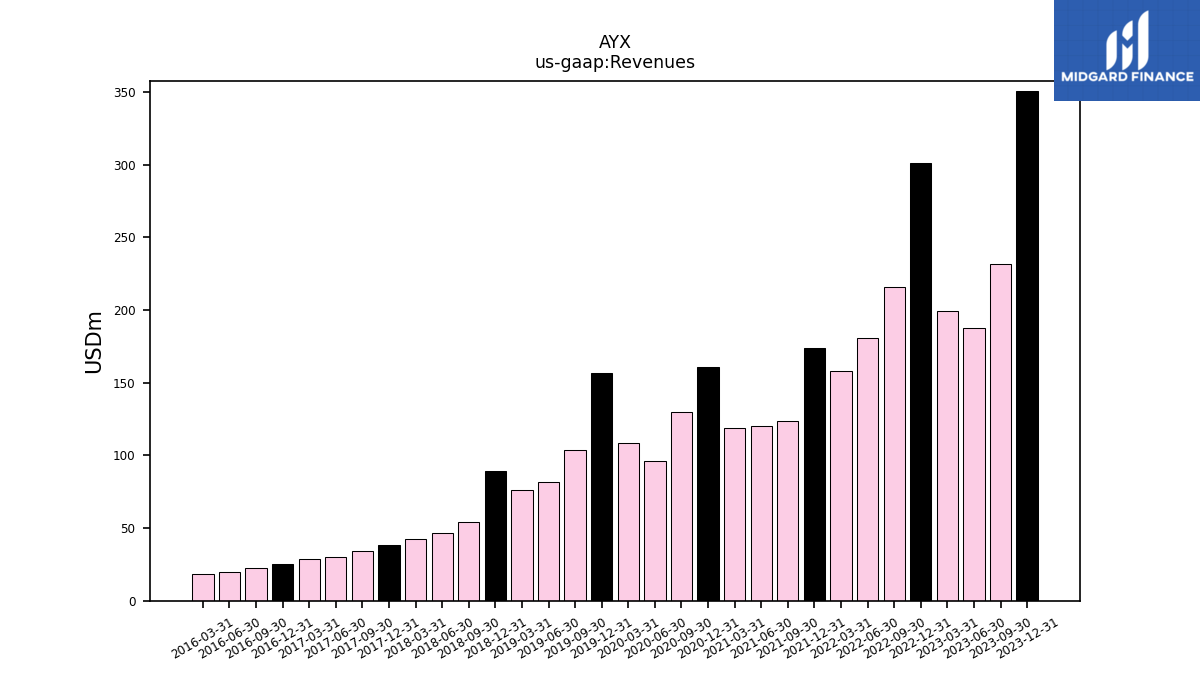
| Revenue From Contract With Customer Excluding Assessed Tax | 351.00 | 232.00 | 188.00 | 199.09 | 301.08 | 215.71 | 180.62 | 157.94 | 173.81 | 123.50 | 120.07 | 118.76 | 160.53 | 129.72 | 96.23 | 108.83 | 156.45 | 103.40 | 82.04 | 76.02 | 89.15 | 62.59 | 51.50 | 50.33 | 38.59 | 34.16 | 30.32 | 28.55 | 24.96 | 22.46 | 19.97 | 18.39 | |
| Revenues | 351.00 | 232.00 | 188.00 | 199.09 | 301.08 | 215.71 | 180.62 | 157.94 | 173.81 | 123.50 | 120.07 | 118.76 | 160.53 | 129.72 | 96.23 | 108.83 | 156.45 | 103.40 | 82.04 | 76.02 | 89.15 | 54.18 | 46.80 | 42.82 | 38.59 | 34.16 | 30.32 | 28.55 | 24.96 | 22.46 | 19.97 | 18.39 | |
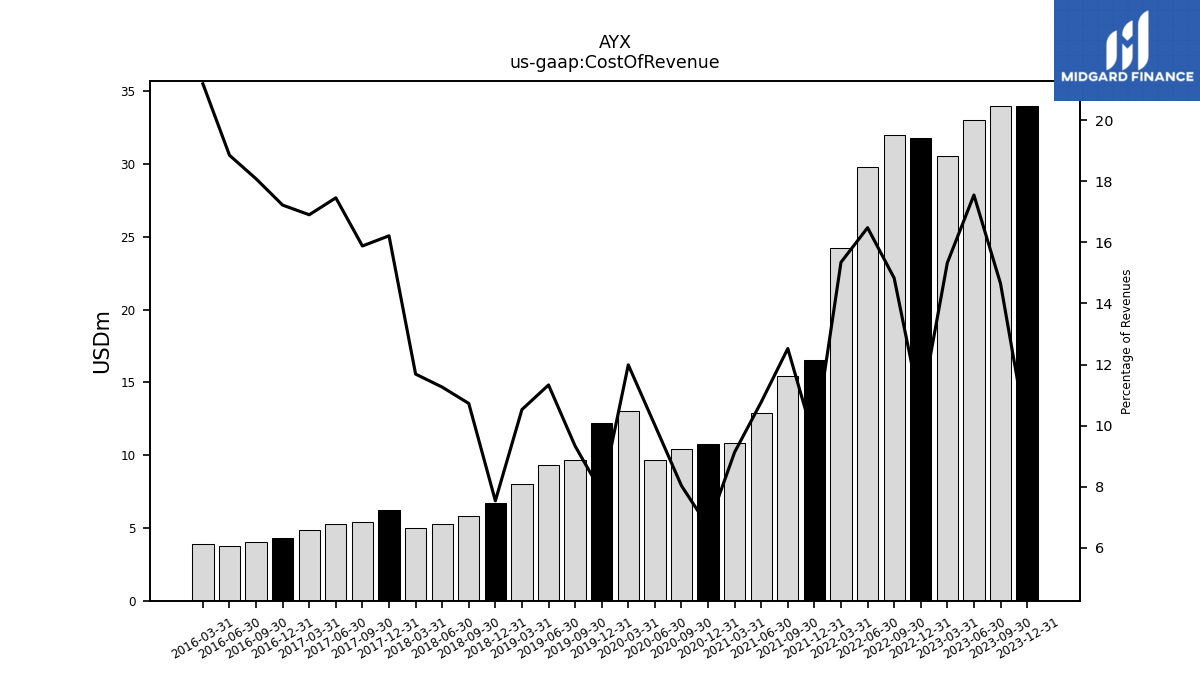
| Cost Of Revenue | 34.00 | 34.00 | 33.00 | 30.52 | 31.78 | 31.99 | 29.77 | 24.24 | 16.52 | 15.47 | 12.93 | 10.84 | 10.74 | 10.41 | 9.63 | 13.05 | 12.21 | 9.64 | 9.29 | 8.00 | 6.72 | 5.81 | 5.27 | 5.00 | 6.26 | 5.42 | 5.29 | 4.83 | 4.30 | 4.06 | 3.77 | 3.90 | |
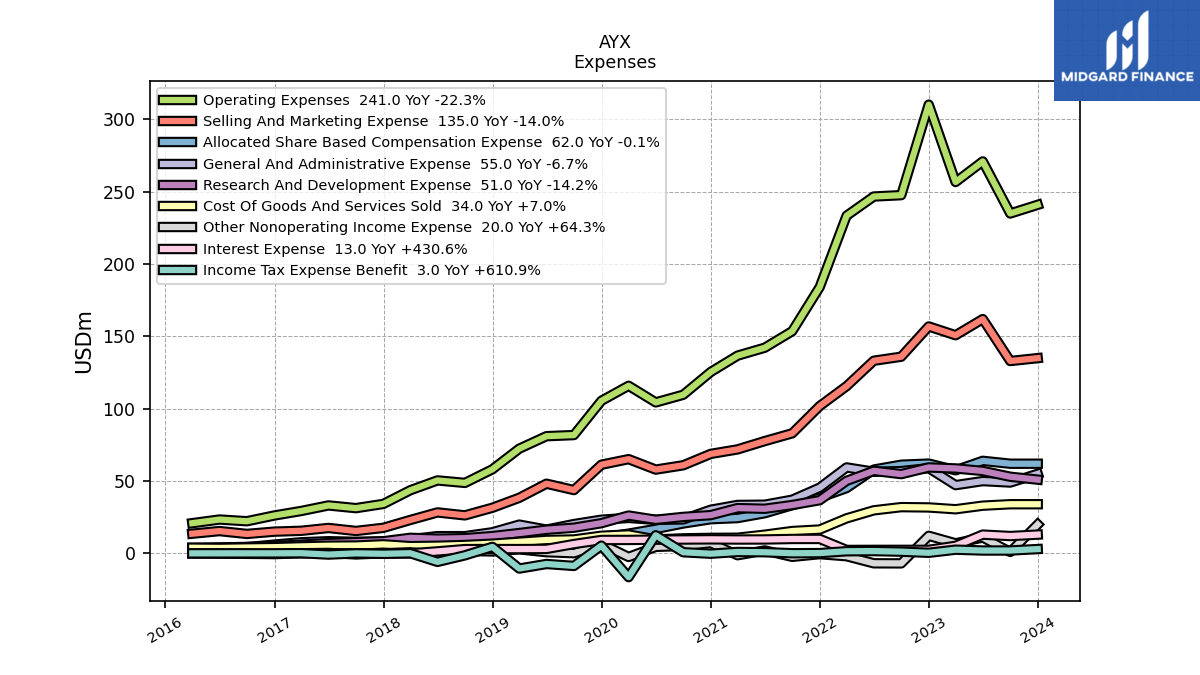
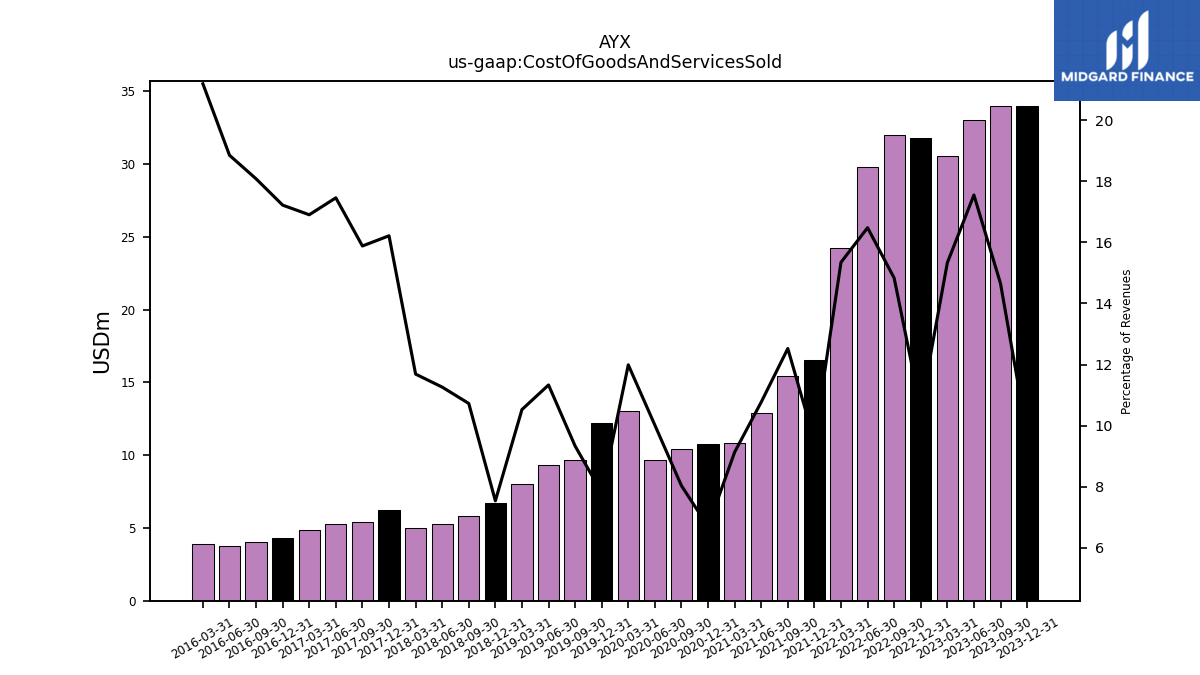
| Cost Of Goods And Services Sold | 34.00 | 34.00 | 33.00 | 30.52 | 31.78 | 31.99 | 29.77 | 24.24 | 16.52 | 15.47 | 12.93 | 10.84 | 10.74 | 10.41 | 9.63 | 13.05 | 12.21 | 9.64 | 9.29 | 8.00 | 6.72 | 5.81 | 5.27 | 5.00 | 6.26 | 5.42 | 5.29 | 4.83 | 4.30 | 4.06 | 3.77 | 3.90 | |
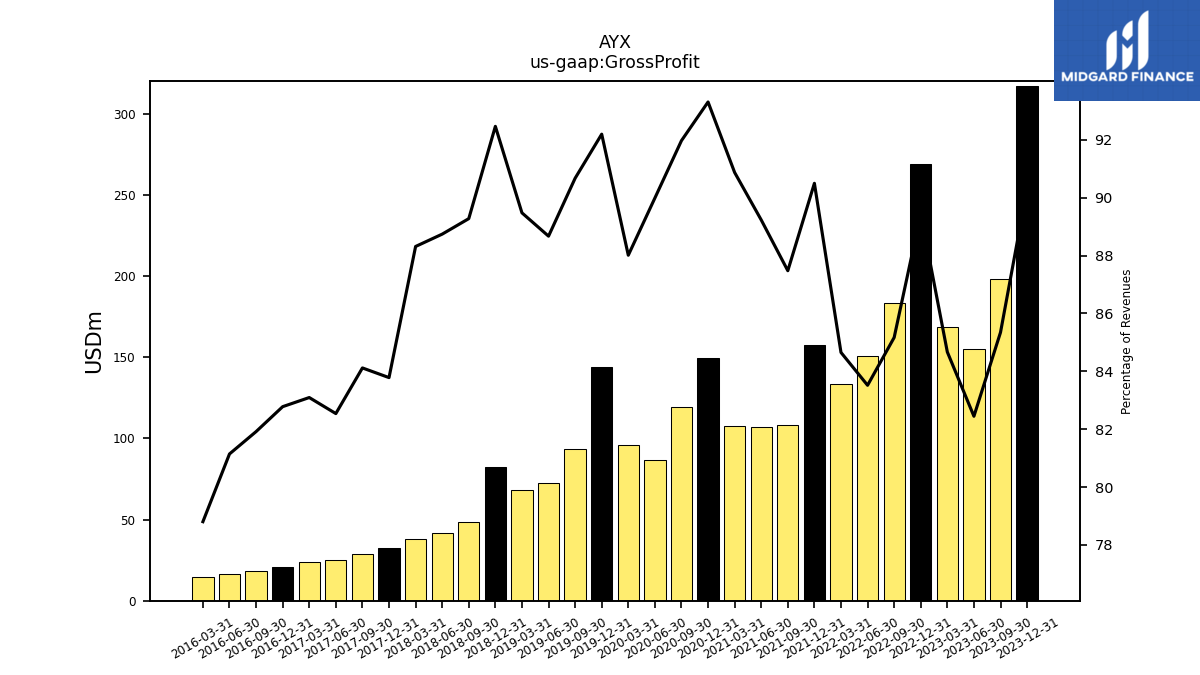
| Gross Profit | 317.00 | 198.00 | 155.00 | 168.56 | 269.30 | 183.72 | 150.85 | 133.70 | 157.29 | 108.03 | 107.14 | 107.92 | 149.78 | 119.30 | 86.60 | 95.78 | 144.24 | 93.75 | 72.75 | 68.02 | 82.43 | 48.37 | 41.53 | 37.82 | 32.33 | 28.73 | 25.02 | 23.72 | 20.66 | 18.40 | 16.21 | 14.49 | |
| Operating Expenses | 241.00 | 235.00 | 271.00 | 256.75 | 310.25 | 247.67 | 246.72 | 233.44 | 184.11 | 153.62 | 142.19 | 136.73 | 125.42 | 109.67 | 104.39 | 115.89 | 105.50 | 81.82 | 81.04 | 72.42 | 58.14 | 48.74 | 50.45 | 43.66 | 34.21 | 31.29 | 33.16 | 29.33 | 26.21 | 22.25 | 23.42 | 20.90 | |
| Research And Development Expense | 51.00 | 53.00 | 57.00 | 58.74 | 59.42 | 54.80 | 57.08 | 50.15 | 36.77 | 33.46 | 30.87 | 31.32 | 26.45 | 25.23 | 23.26 | 26.18 | 20.89 | 17.75 | 16.38 | 14.07 | 11.97 | 10.53 | 10.18 | 10.77 | 8.40 | 7.77 | 7.15 | 6.02 | 5.06 | 4.50 | 4.07 | 3.85 | |
| General And Administrative Expense | 55.00 | 49.00 | 50.00 | 47.20 | 58.94 | 56.89 | 56.45 | 59.44 | 45.46 | 37.12 | 33.67 | 33.50 | 30.18 | 23.52 | 23.20 | 24.54 | 23.29 | 20.28 | 16.47 | 19.90 | 14.61 | 11.92 | 11.94 | 9.79 | 8.13 | 8.01 | 8.43 | 7.68 | 6.10 | 4.30 | 3.91 | 3.42 | |
| Selling And Marketing Expense | 135.00 | 133.00 | 162.00 | 150.82 | 156.89 | 135.98 | 133.19 | 115.61 | 101.88 | 83.03 | 77.66 | 71.91 | 68.79 | 60.92 | 57.94 | 65.17 | 61.32 | 43.78 | 48.19 | 38.45 | 31.56 | 26.29 | 28.34 | 23.10 | 17.69 | 15.51 | 17.59 | 15.63 | 15.05 | 13.46 | 15.44 | 13.63 | |
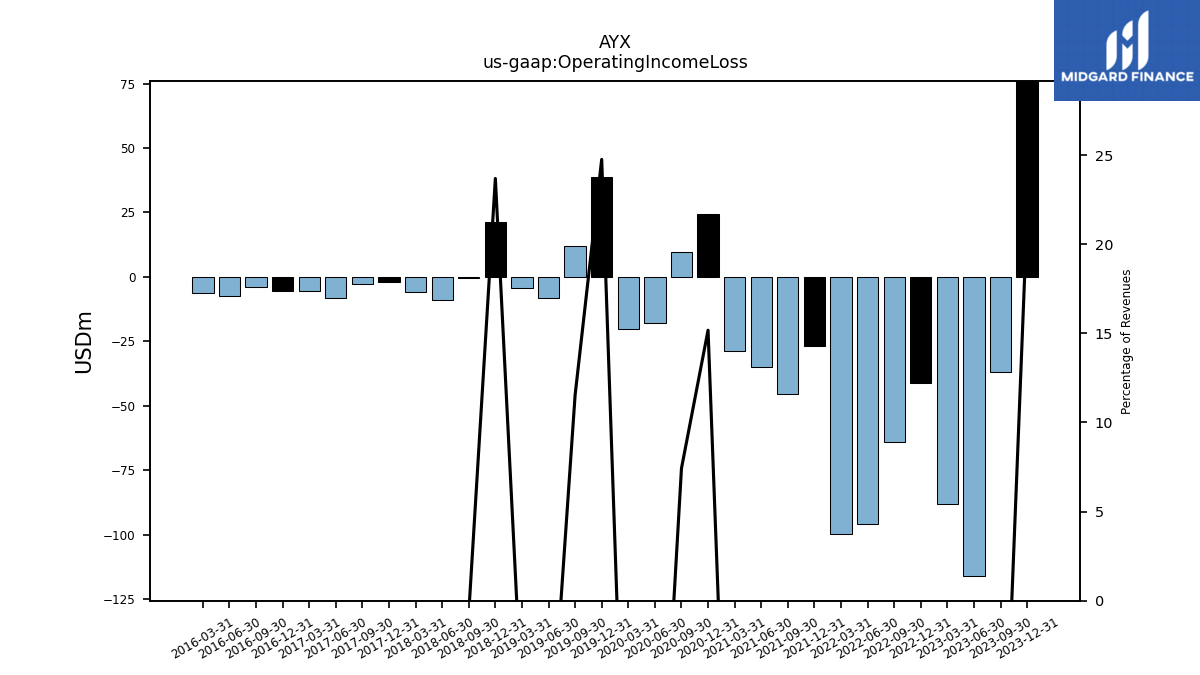
| Operating Income Loss | 76.00 | -37.00 | -116.00 | -88.19 | -40.95 | -63.95 | -95.87 | -99.74 | -26.82 | -45.58 | -35.05 | -28.81 | 24.36 | 9.63 | -17.79 | -20.11 | 38.73 | 11.94 | -8.29 | -4.40 | 21.12 | -0.37 | -8.93 | -5.85 | -1.88 | -2.56 | -8.14 | -5.61 | -5.55 | -3.85 | -7.21 | -6.41 | |
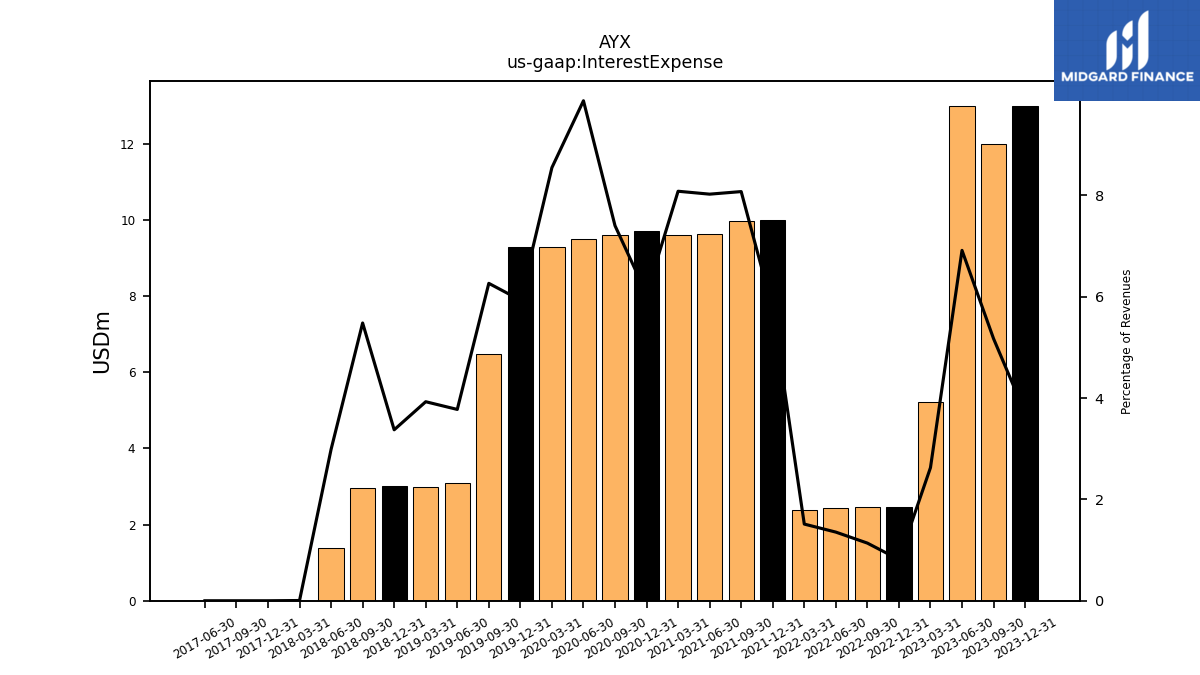
| Interest Expense | 13.00 | 12.00 | 13.00 | 5.23 | 2.45 | 2.45 | 2.45 | 2.39 | 10.00 | 9.97 | 9.63 | 9.60 | 9.72 | 9.60 | 9.50 | 9.30 | 9.28 | 6.48 | 3.10 | 2.99 | 3.01 | 2.97 | 1.40 | 0.00 | 0.00 | 0.00 | 0.00 | NA | NA | NA | NA | NA | |
| Interest Paid Net | 0.00 | 24.00 | 0.00 | 3.00 | 0.21 | 3.00 | 0.21 | 3.00 | 0.21 | 3.00 | 0.21 | 3.00 | 0.21 | 3.00 | 0.21 | 2.82 | 0.21 | 0.14 | 0.57 | 0.00 | 0.62 | 0.00 | NA | NA | NA | NA | NA | NA | NA | NA | NA | NA | |
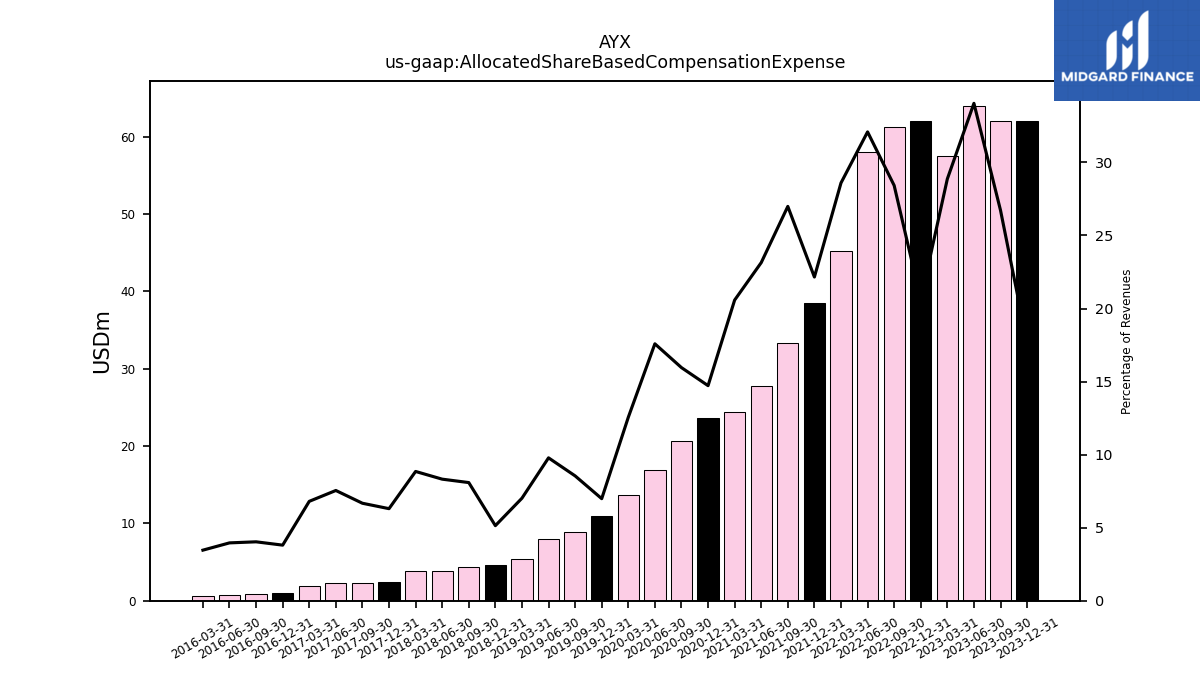
| Allocated Share Based Compensation Expense | 62.00 | 62.00 | 64.00 | 57.47 | 62.09 | 61.31 | 57.96 | 45.16 | 38.51 | 33.33 | 27.79 | 24.44 | 23.63 | 20.70 | 16.92 | 13.66 | 10.93 | 8.84 | 8.02 | 5.33 | 4.58 | 4.38 | 3.89 | 3.79 | 2.43 | 2.28 | 2.29 | 1.94 | 0.95 | 0.91 | 0.79 | 0.64 | |
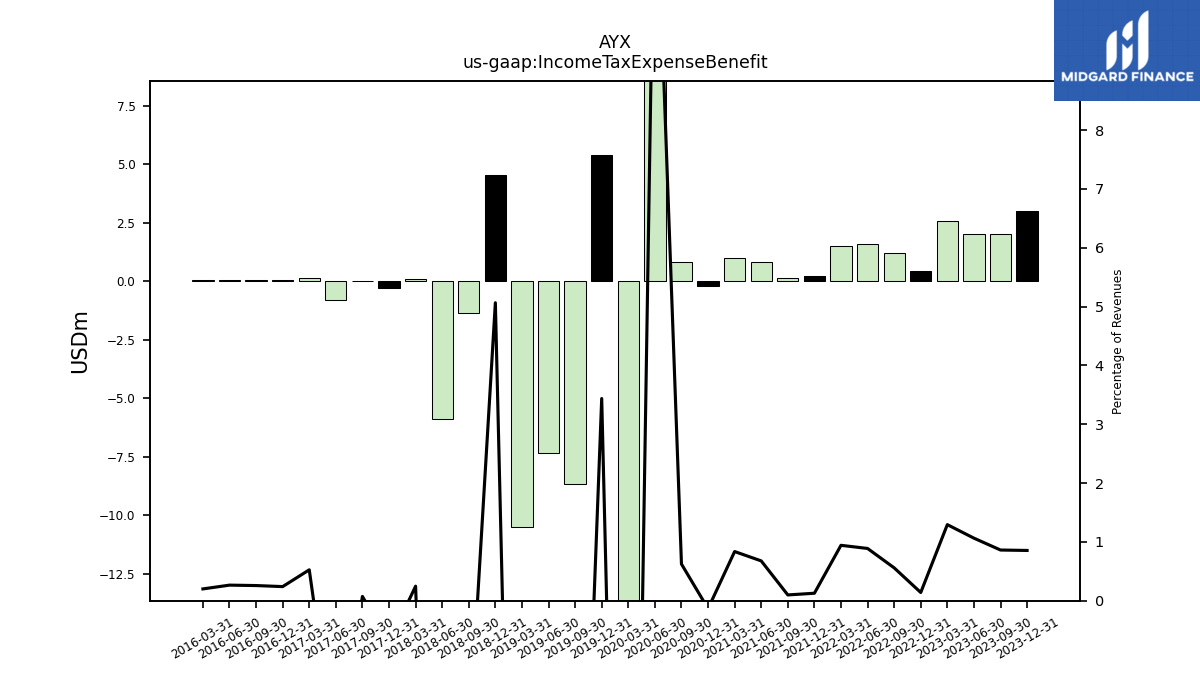
| Income Tax Expense Benefit | 3.00 | 2.00 | 2.00 | 2.58 | 0.42 | 1.21 | 1.60 | 1.49 | 0.22 | 0.12 | 0.81 | 0.99 | -0.22 | 0.81 | 12.53 | -16.40 | 5.38 | -8.66 | -7.32 | -10.47 | 4.51 | -1.34 | -5.86 | 0.11 | -0.27 | 0.03 | -0.81 | 0.15 | 0.06 | 0.06 | 0.05 | 0.04 | |
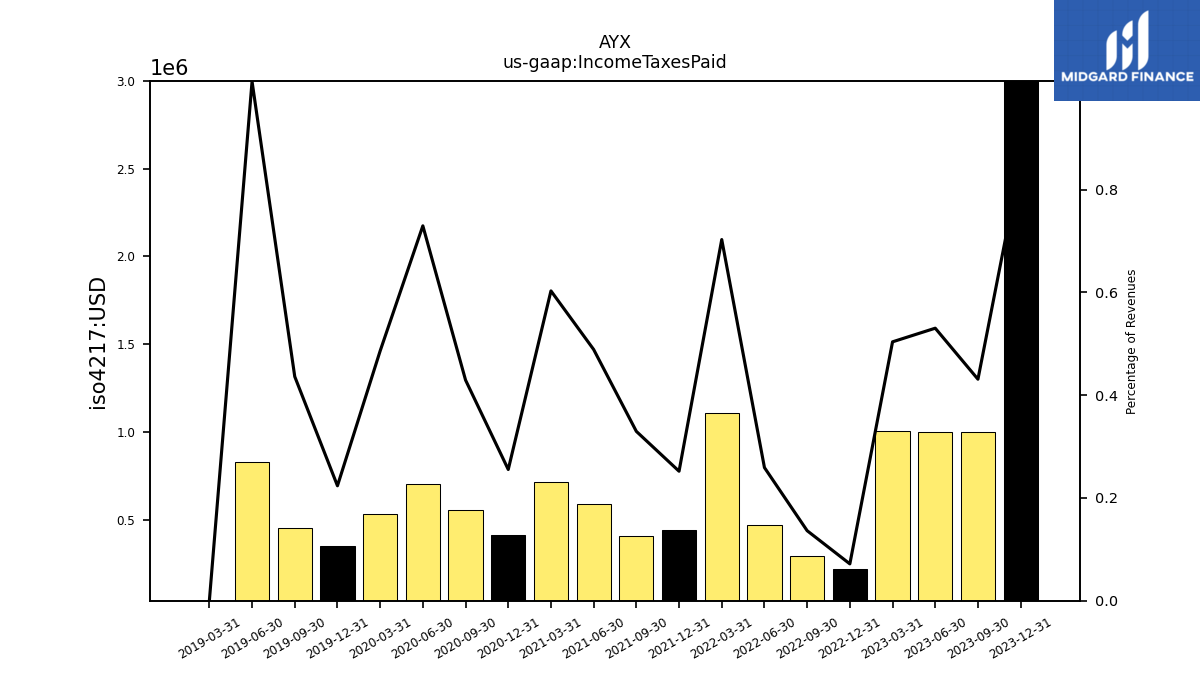
| Income Taxes Paid | 3.00 | 1.00 | 1.00 | 1.00 | 0.22 | 0.29 | 0.47 | 1.11 | 0.44 | 0.41 | 0.59 | 0.72 | 0.41 | 0.56 | 0.70 | 0.53 | 0.35 | 0.45 | 0.83 | 0.00 | NA | NA | NA | NA | NA | NA | NA | NA | NA | NA | NA | NA | |
| Other Comprehensive Income Loss Net Of Tax | -7.00 | 7.00 | -4.00 | -1.95 | -5.37 | 3.58 | 1.67 | 0.03 | -2.29 | 0.71 | -1.20 | -1.26 | -2.08 | -2.56 | 2.43 | 2.24 | -1.92 | -0.14 | 1.41 | -0.31 | 0.14 | -0.10 | -0.09 | -0.17 | -0.10 | -0.06 | -0.14 | -0.06 | -0.00 | -0.01 | 0.02 | 0.06 | |
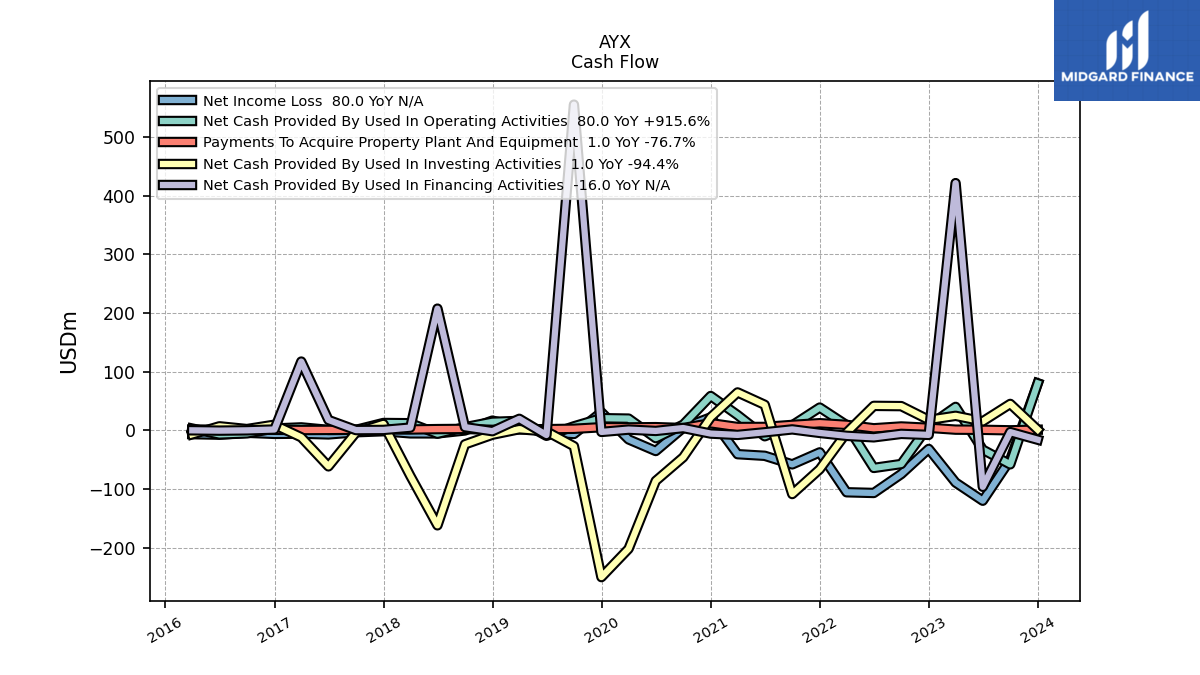
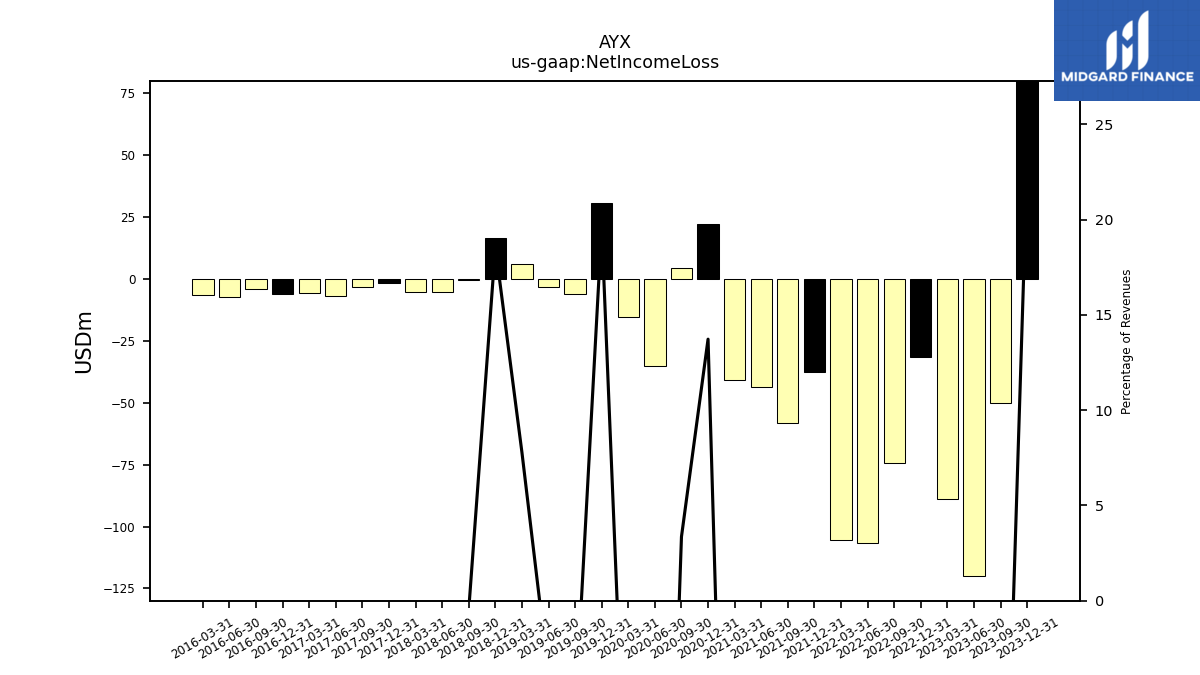
| Net Income Loss | 80.00 | -50.00 | -120.00 | -89.03 | -31.65 | -74.51 | -106.77 | -105.57 | -37.55 | -58.04 | -43.44 | -40.66 | 22.04 | 4.36 | -35.29 | -15.47 | 30.69 | -6.24 | -3.22 | 5.91 | 16.54 | -0.24 | -5.29 | -5.19 | -1.54 | -3.30 | -6.99 | -5.67 | -6.08 | -4.19 | -7.46 | -6.53 | |
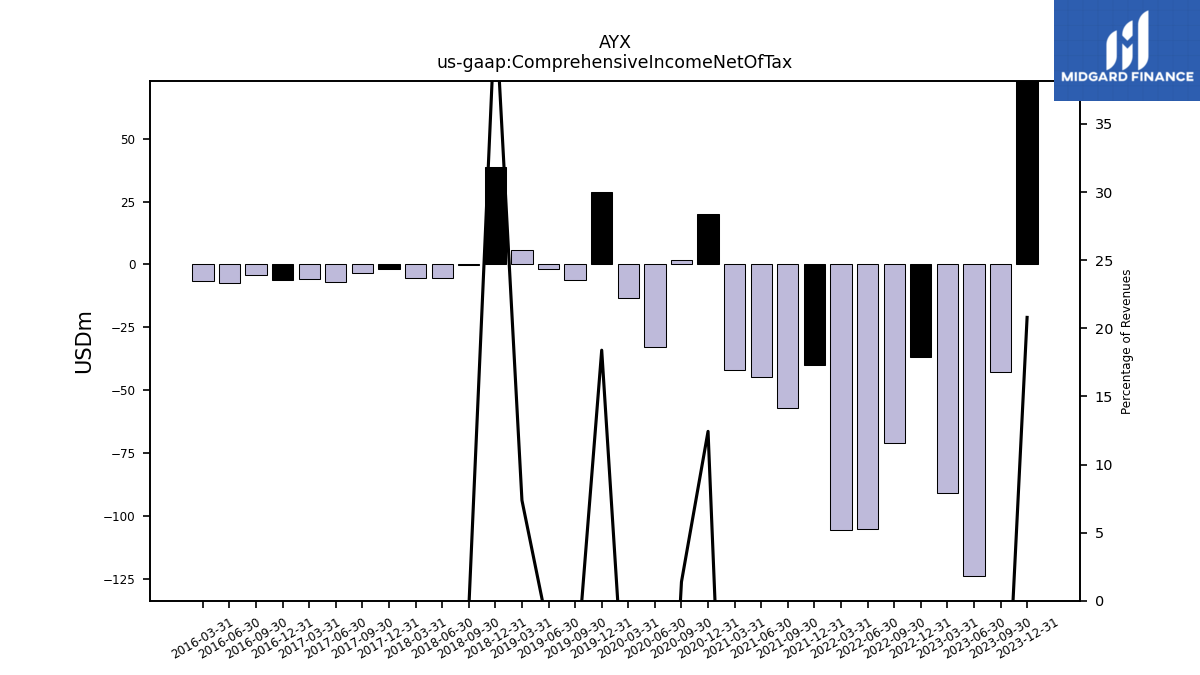
| Comprehensive Income Net Of Tax | 73.00 | -43.00 | -124.00 | -90.99 | -37.02 | -70.94 | -105.10 | -105.54 | -39.84 | -57.33 | -44.64 | -41.92 | 19.96 | 1.80 | -32.86 | -13.23 | 28.77 | -6.38 | -1.81 | 5.61 | 38.89 | -0.34 | -5.39 | -5.36 | -1.64 | -3.35 | -7.13 | -5.73 | -6.08 | -4.20 | -7.44 | -6.47 | |
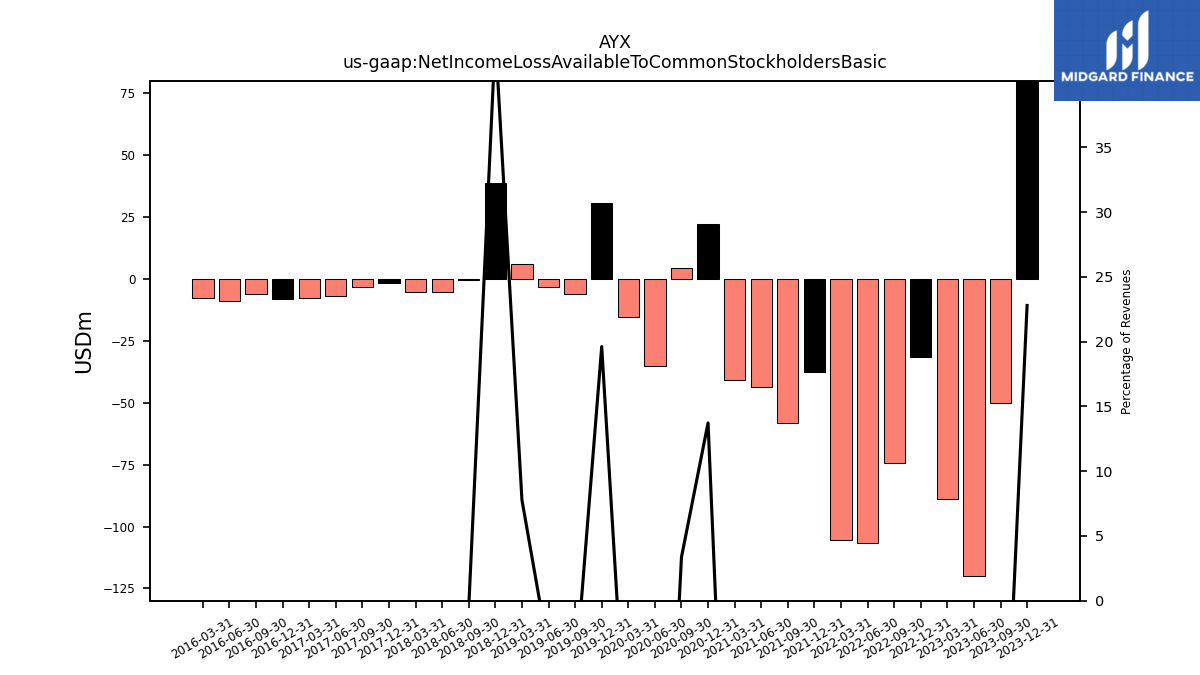
| Net Income Loss Available To Common Stockholders Basic | 80.00 | -50.00 | -120.00 | -89.03 | -31.65 | -74.51 | -106.77 | -105.57 | -37.55 | -58.04 | -43.44 | -40.66 | 22.04 | 4.36 | -35.29 | -15.47 | 30.69 | -6.24 | -3.22 | 5.91 | 38.74 | -0.24 | -5.29 | -5.19 | -1.54 | -3.30 | -6.99 | -7.65 | -8.05 | -5.92 | -8.91 | -7.81 |
| 2023-12-31 | 2023-09-30 | 2023-06-30 | 2023-03-31 | 2022-12-31 | 2022-09-30 | 2022-06-30 | 2022-03-31 | 2021-12-31 | 2021-09-30 | 2021-06-30 | 2021-03-31 | 2020-12-31 | 2020-09-30 | 2020-06-30 | 2020-03-31 | 2019-12-31 | 2019-09-30 | 2019-06-30 | 2019-03-31 | 2018-12-31 | 2018-09-30 | 2018-06-30 | 2018-03-31 | 2017-12-31 | 2017-09-30 | 2017-06-30 | 2017-03-31 | 2016-12-31 | 2016-09-30 | 2016-06-30 | 2016-03-31 | ||
|---|---|---|---|---|---|---|---|---|---|---|---|---|---|---|---|---|---|---|---|---|---|---|---|---|---|---|---|---|---|---|---|---|---|
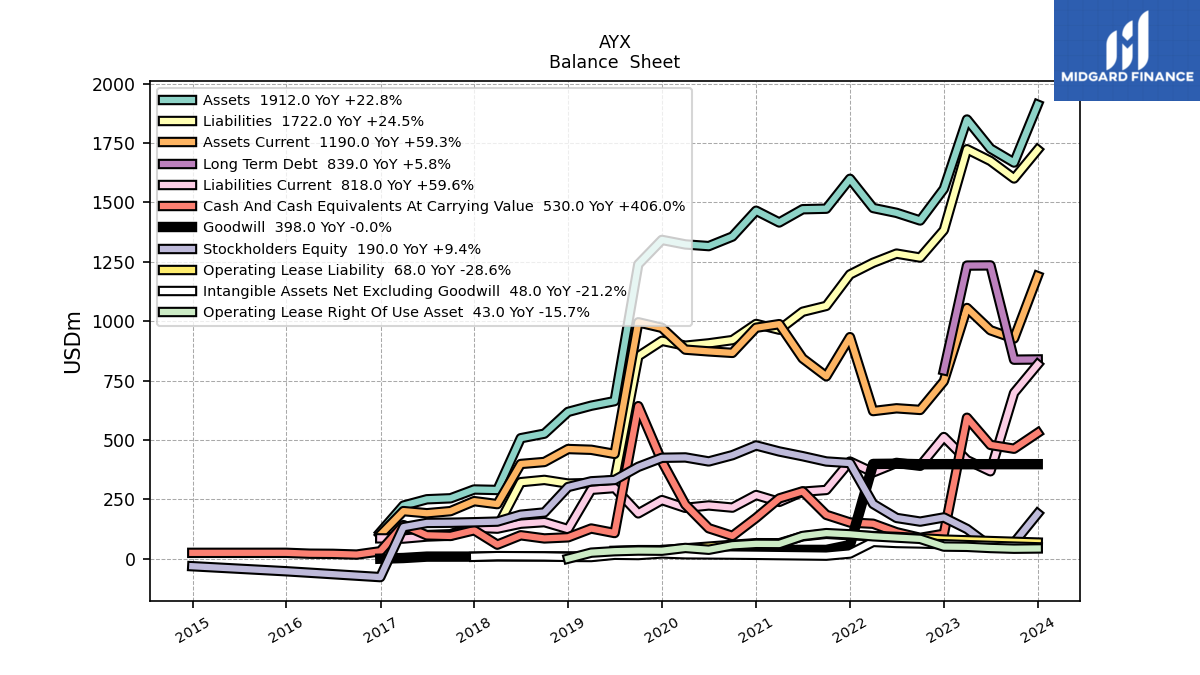
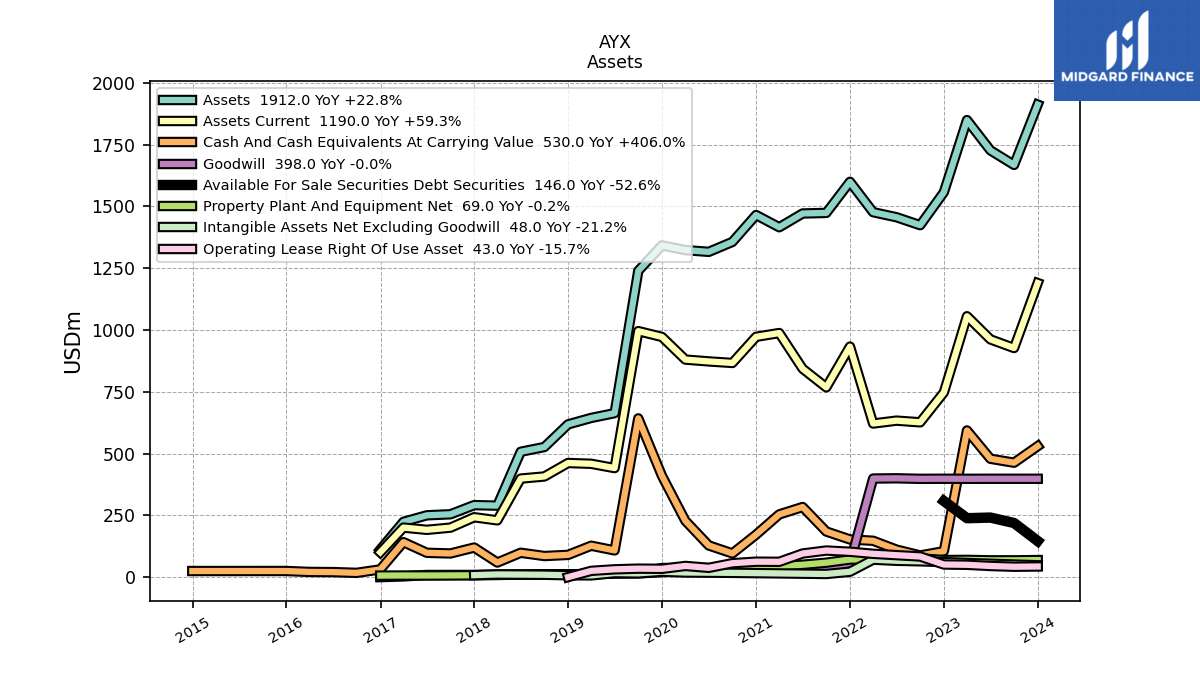
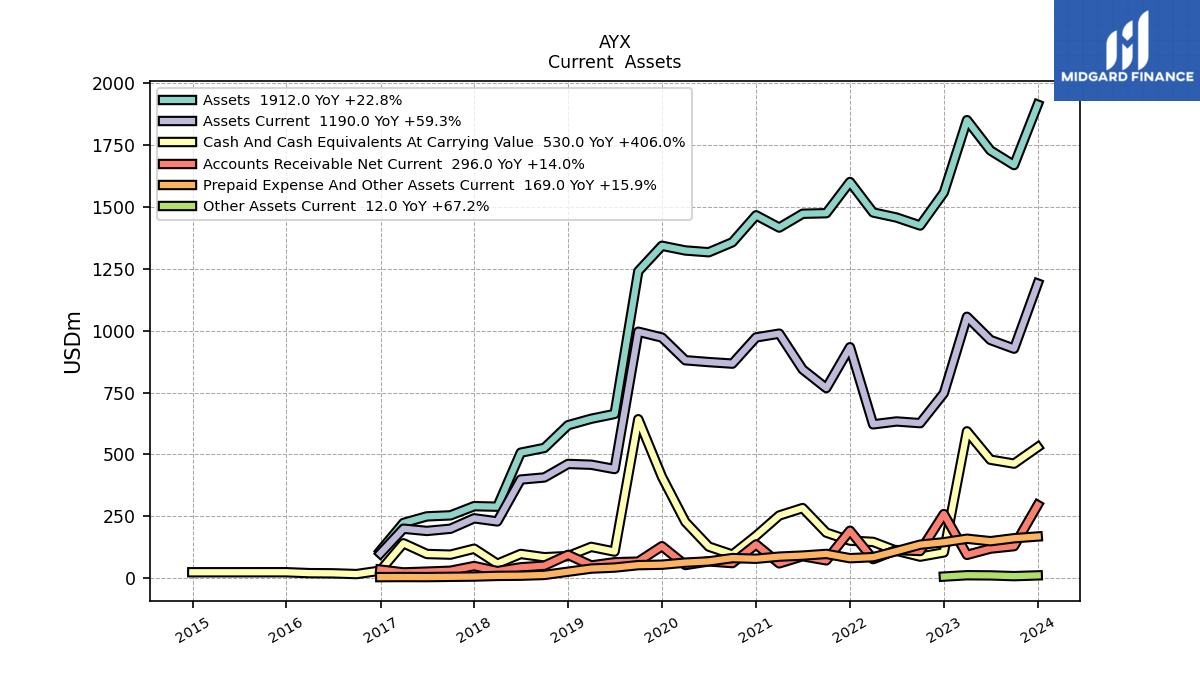
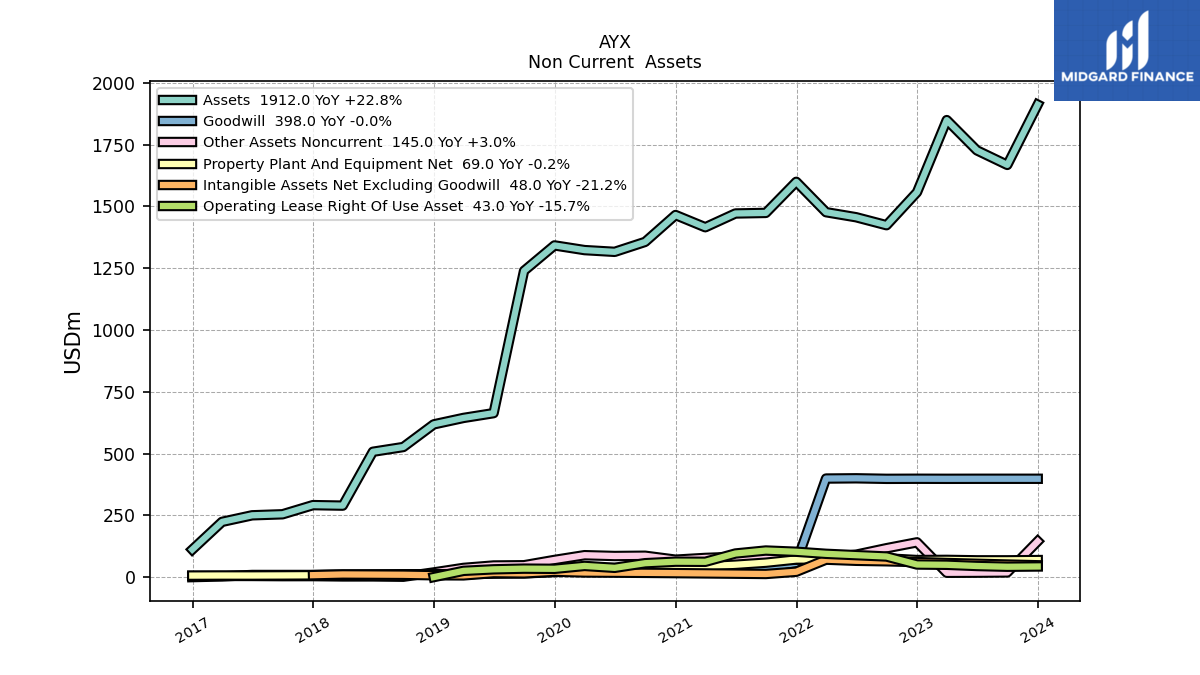
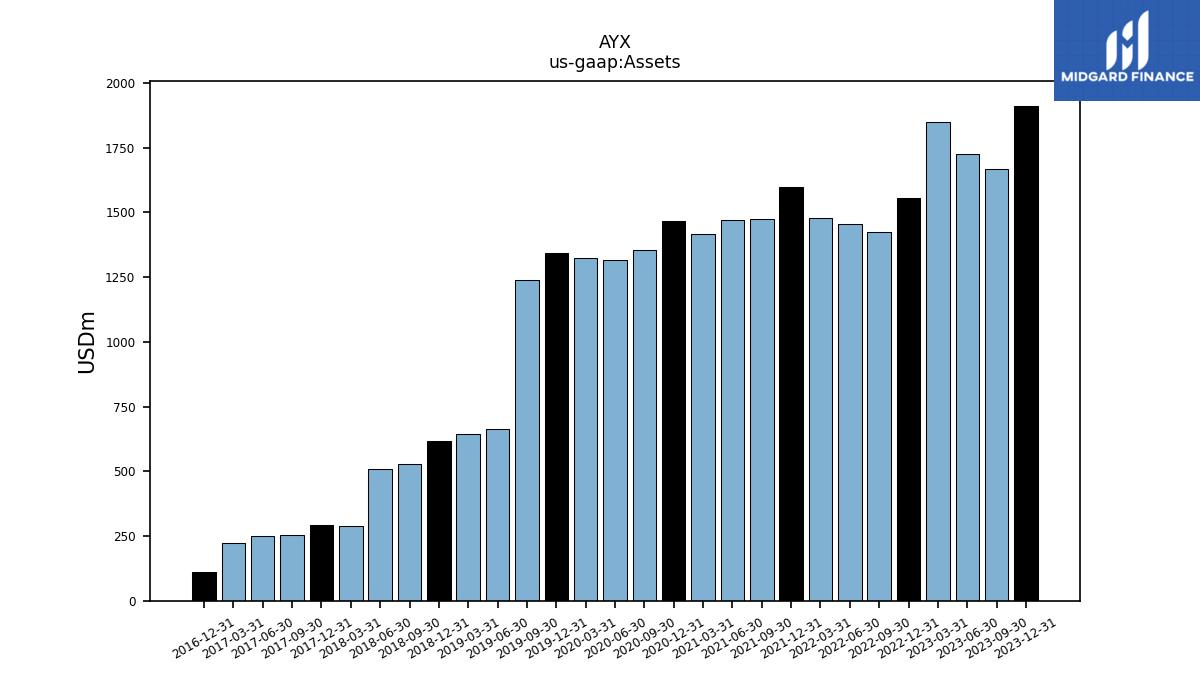
| Assets | 1912.00 | 1668.00 | 1727.00 | 1849.40 | 1557.28 | 1424.03 | 1456.29 | 1476.69 | 1599.69 | 1473.79 | 1471.51 | 1415.75 | 1465.30 | 1356.47 | 1316.24 | 1323.32 | 1342.34 | 1239.31 | 663.50 | 644.19 | 618.17 | 526.49 | 507.29 | 289.29 | 291.42 | 254.35 | 250.17 | 223.67 | 111.42 | NA | NA | NA | |
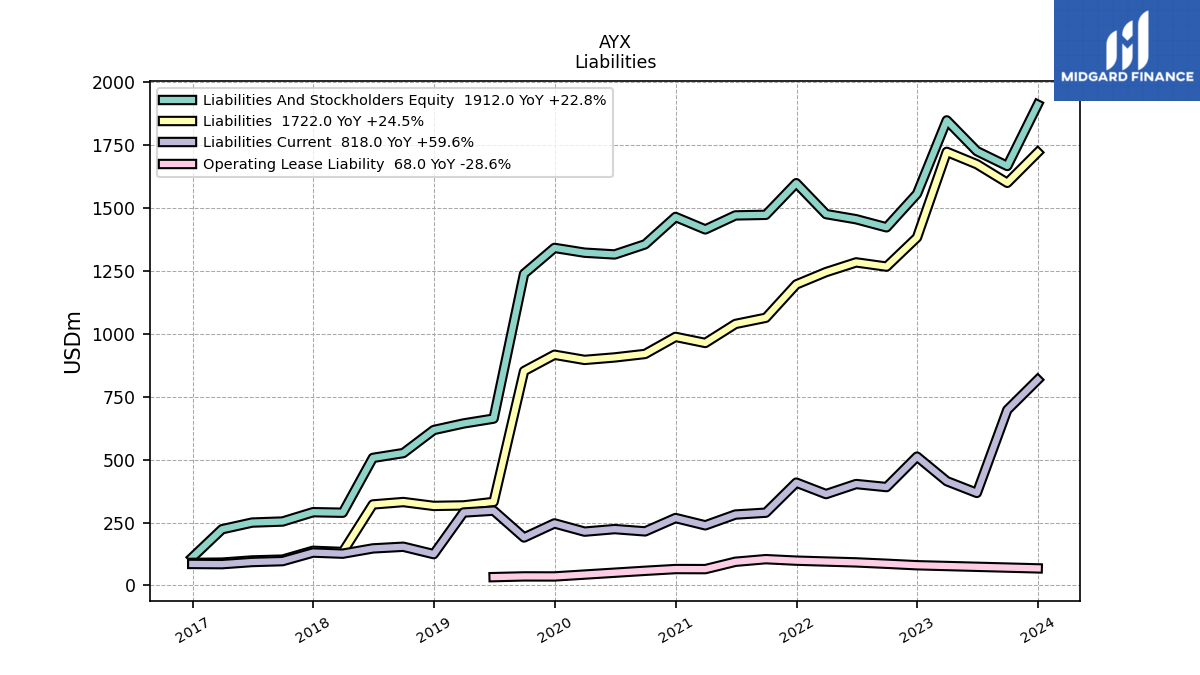
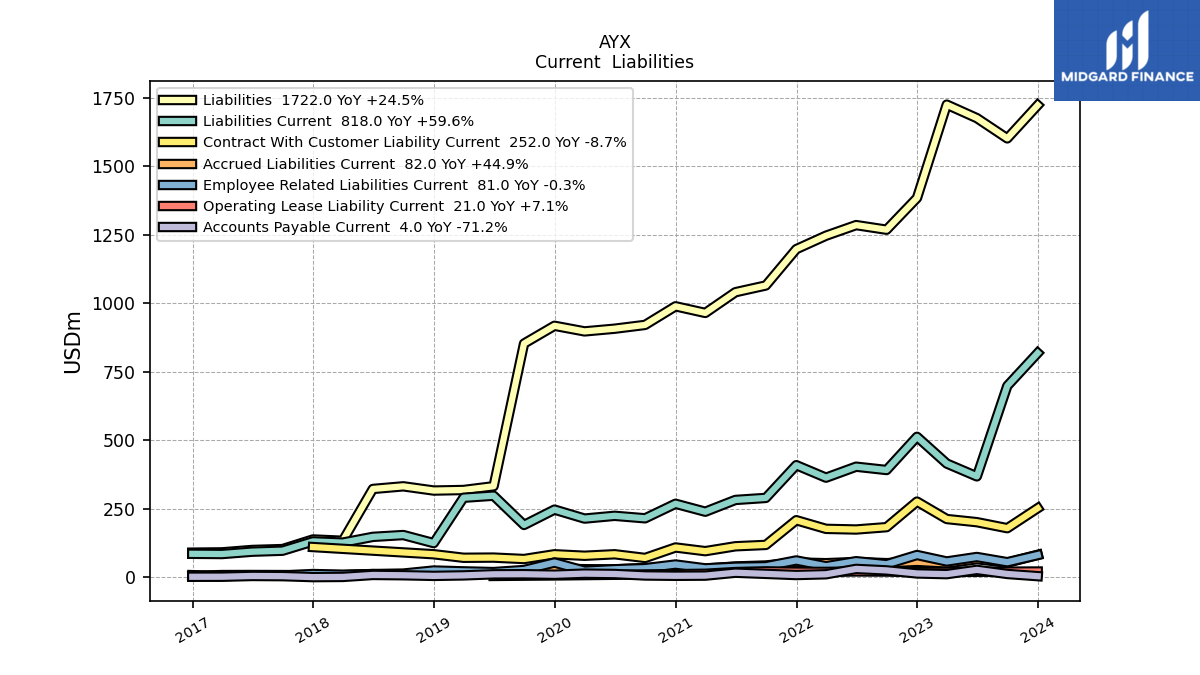
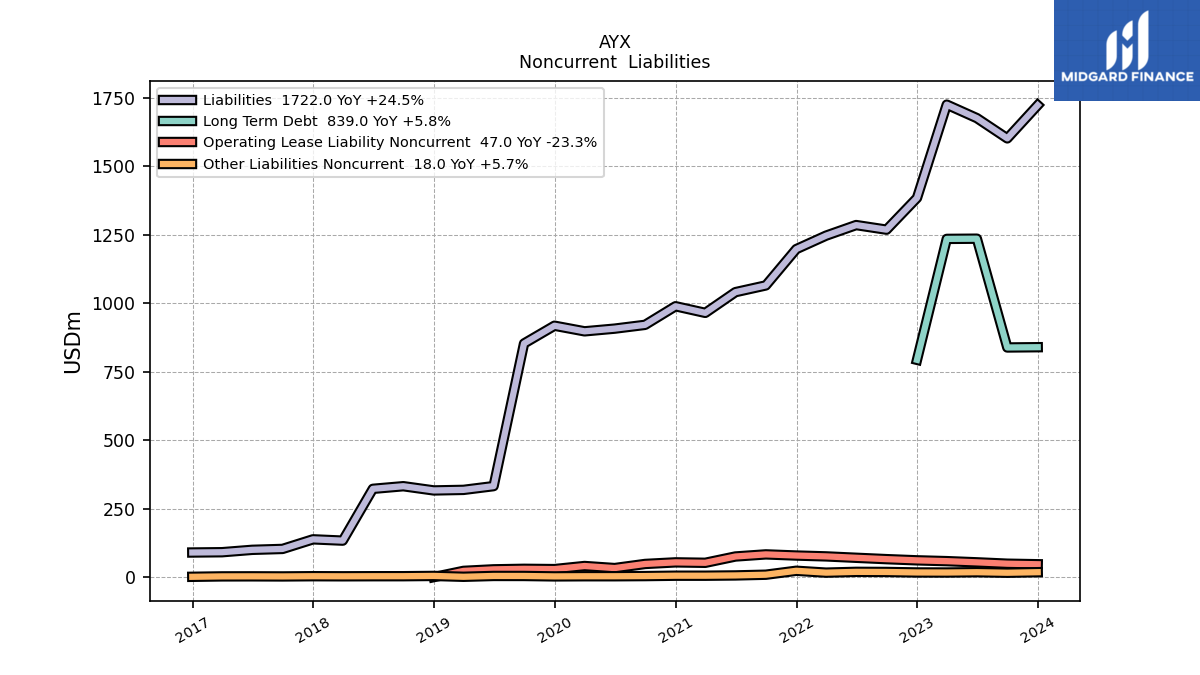
| Liabilities | 1722.00 | 1601.00 | 1675.00 | 1724.21 | 1383.63 | 1267.88 | 1284.69 | 1246.10 | 1196.93 | 1064.46 | 1039.88 | 964.26 | 988.50 | 920.58 | 906.76 | 896.94 | 917.43 | 852.57 | 332.07 | 318.35 | 316.35 | 331.77 | 322.18 | 133.16 | 137.91 | 102.89 | 99.58 | 90.90 | 89.84 | NA | NA | NA | |
| Liabilities And Stockholders Equity | 1912.00 | 1668.00 | 1727.00 | 1849.40 | 1557.28 | 1424.03 | 1456.29 | 1476.69 | 1599.69 | 1473.79 | 1471.51 | 1415.75 | 1465.30 | 1356.47 | 1316.24 | 1323.32 | 1342.34 | 1239.31 | 663.50 | 644.19 | 618.17 | 526.49 | 507.29 | 289.29 | 291.42 | 254.35 | 250.17 | 223.67 | 111.42 | NA | NA | NA | |
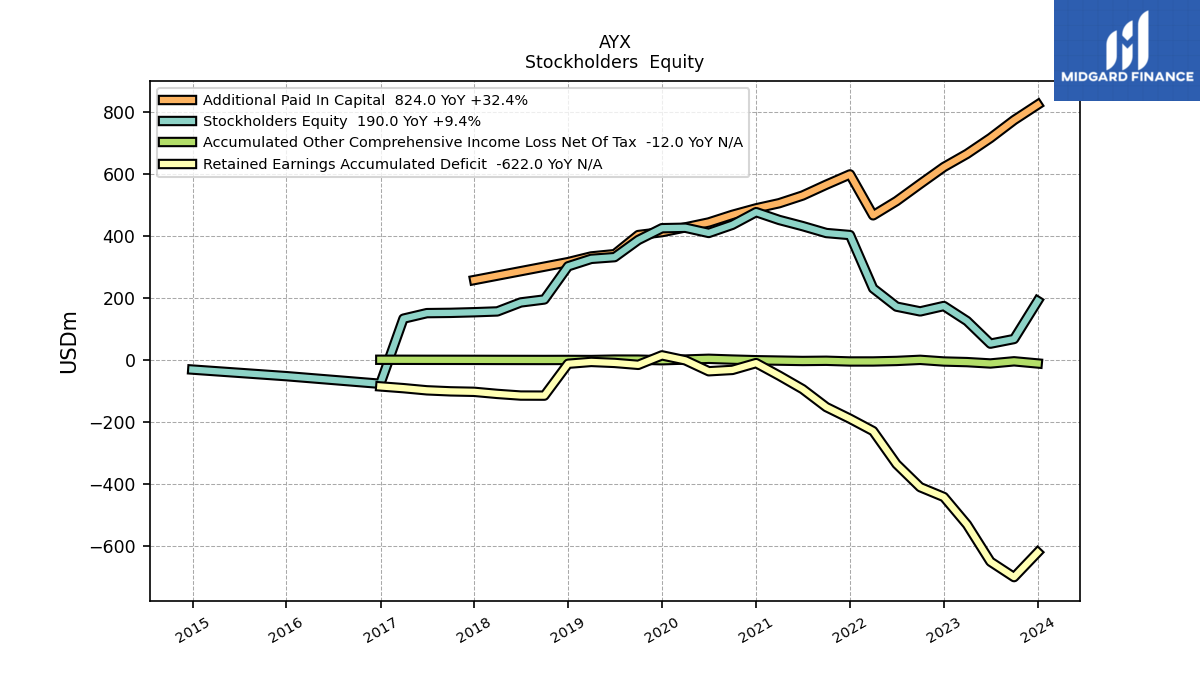
| Stockholders Equity | 190.00 | 67.00 | 52.00 | 125.18 | 173.66 | 156.15 | 171.60 | 230.59 | 402.75 | 409.33 | 431.63 | 451.49 | 476.79 | 435.89 | 409.48 | 426.38 | 424.91 | 386.74 | 331.43 | 325.84 | 301.82 | 194.72 | 185.11 | 156.13 | 153.50 | 151.45 | 150.60 | 132.78 | -77.61 | NA | NA | NA |
| 2023-12-31 | 2023-09-30 | 2023-06-30 | 2023-03-31 | 2022-12-31 | 2022-09-30 | 2022-06-30 | 2022-03-31 | 2021-12-31 | 2021-09-30 | 2021-06-30 | 2021-03-31 | 2020-12-31 | 2020-09-30 | 2020-06-30 | 2020-03-31 | 2019-12-31 | 2019-09-30 | 2019-06-30 | 2019-03-31 | 2018-12-31 | 2018-09-30 | 2018-06-30 | 2018-03-31 | 2017-12-31 | 2017-09-30 | 2017-06-30 | 2017-03-31 | 2016-12-31 | 2016-09-30 | 2016-06-30 | 2016-03-31 | ||
|---|---|---|---|---|---|---|---|---|---|---|---|---|---|---|---|---|---|---|---|---|---|---|---|---|---|---|---|---|---|---|---|---|---|
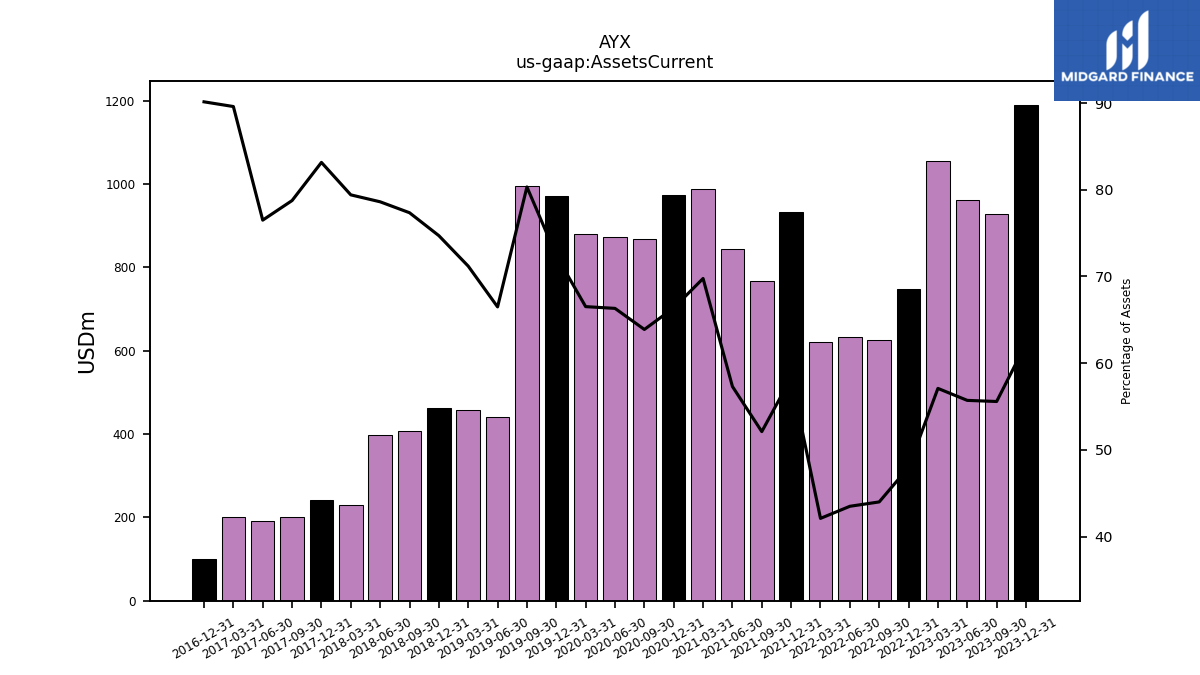
| Assets Current | 1190.00 | 927.00 | 962.00 | 1055.75 | 747.15 | 626.42 | 633.27 | 621.55 | 932.93 | 767.87 | 843.29 | 987.72 | 972.47 | 866.61 | 872.90 | 880.28 | 971.99 | 995.49 | 441.15 | 458.62 | 461.81 | 407.25 | 398.80 | 229.74 | 242.34 | 200.32 | 191.38 | 200.42 | 100.44 | NA | NA | NA | |
| Cash And Cash Equivalents At Carrying Value | 530.00 | 463.00 | 479.00 | 593.49 | 104.75 | 87.73 | 111.31 | 147.14 | 152.38 | 184.52 | 283.73 | 253.76 | 171.89 | 95.95 | 128.18 | 228.02 | 409.95 | 642.45 | 108.00 | 127.04 | 89.97 | 85.32 | 98.57 | 59.08 | 119.72 | 95.78 | 98.42 | 141.59 | 31.31 | 17.31 | 20.37 | 21.05 | |
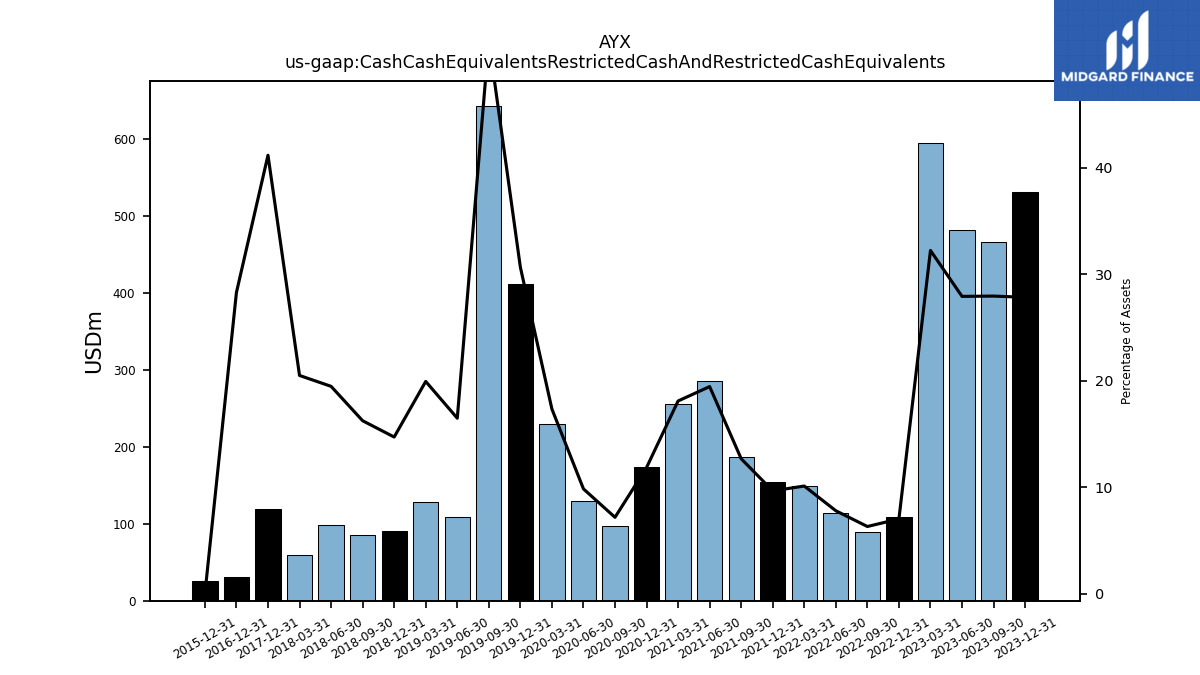
| Cash Cash Equivalents Restricted Cash And Restricted Cash Equivalents | 532.00 | 466.00 | 482.00 | 595.81 | 109.45 | 90.02 | 113.56 | 149.39 | 154.62 | 186.82 | 286.18 | 256.21 | 173.66 | 97.43 | 129.65 | 229.50 | 411.42 | 643.81 | 109.36 | 128.39 | 90.96 | 85.52 | 98.77 | 59.28 | 119.92 | NA | NA | NA | 31.51 | NA | NA | NA | |
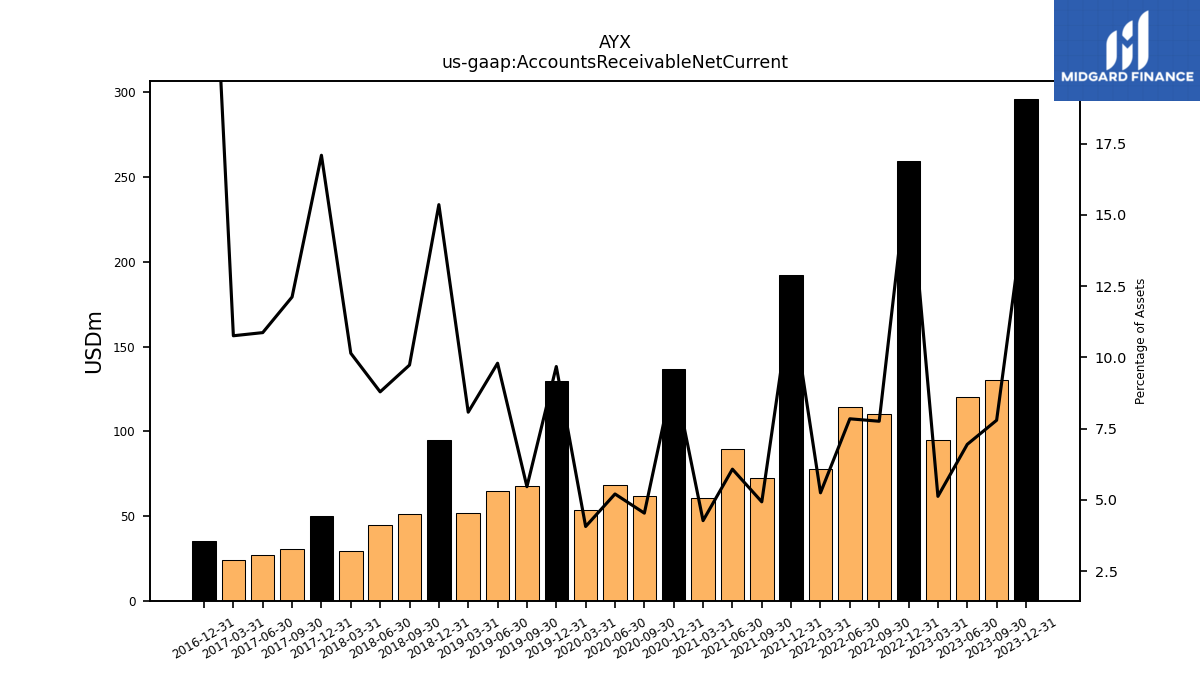
| Accounts Receivable Net Current | 296.00 | 130.00 | 120.00 | 94.77 | 259.59 | 110.49 | 114.24 | 77.51 | 192.32 | 72.69 | 89.44 | 60.50 | 136.99 | 61.53 | 68.55 | 53.82 | 129.91 | 67.70 | 64.98 | 52.03 | 94.92 | 51.23 | 44.59 | 29.34 | 49.80 | 30.82 | 27.19 | 24.06 | 35.37 | NA | NA | NA | |
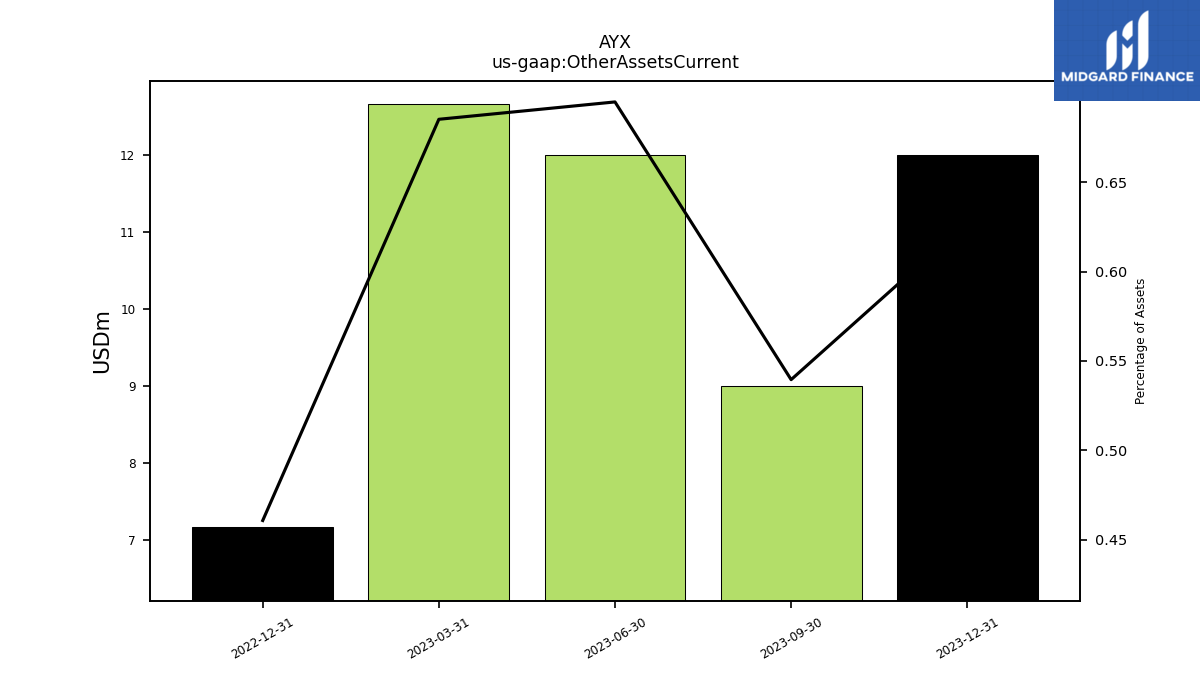
| Other Assets Current | 12.00 | 9.00 | 12.00 | 12.67 | 7.18 | NA | NA | NA | NA | NA | NA | NA | NA | NA | NA | NA | NA | NA | NA | NA | NA | NA | NA | NA | NA | NA | NA | NA | NA | NA | NA | NA | |
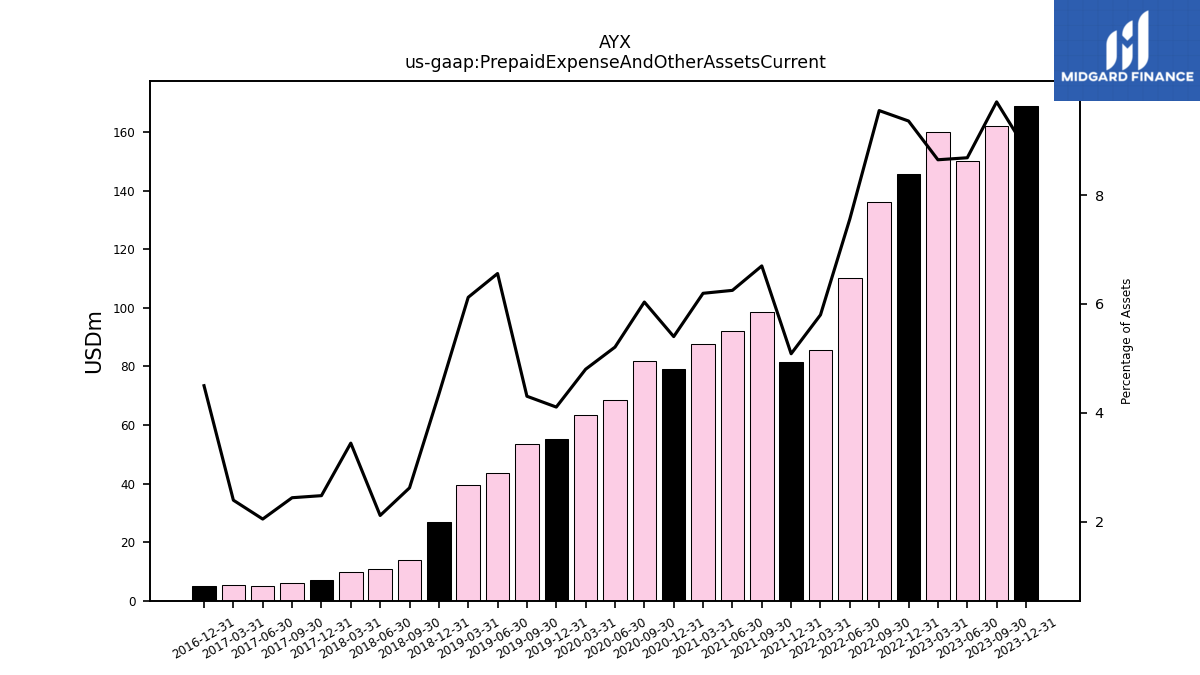
| Prepaid Expense And Other Assets Current | 169.00 | 162.00 | 150.00 | 159.95 | 145.77 | 136.03 | 110.13 | 85.66 | 81.36 | 98.73 | 91.97 | 87.72 | 79.14 | 81.87 | 68.56 | 63.55 | 55.13 | 53.36 | 43.52 | 39.44 | 26.85 | 13.81 | 10.73 | 9.96 | 7.23 | 6.21 | 5.13 | 5.36 | 5.01 | NA | NA | NA | |
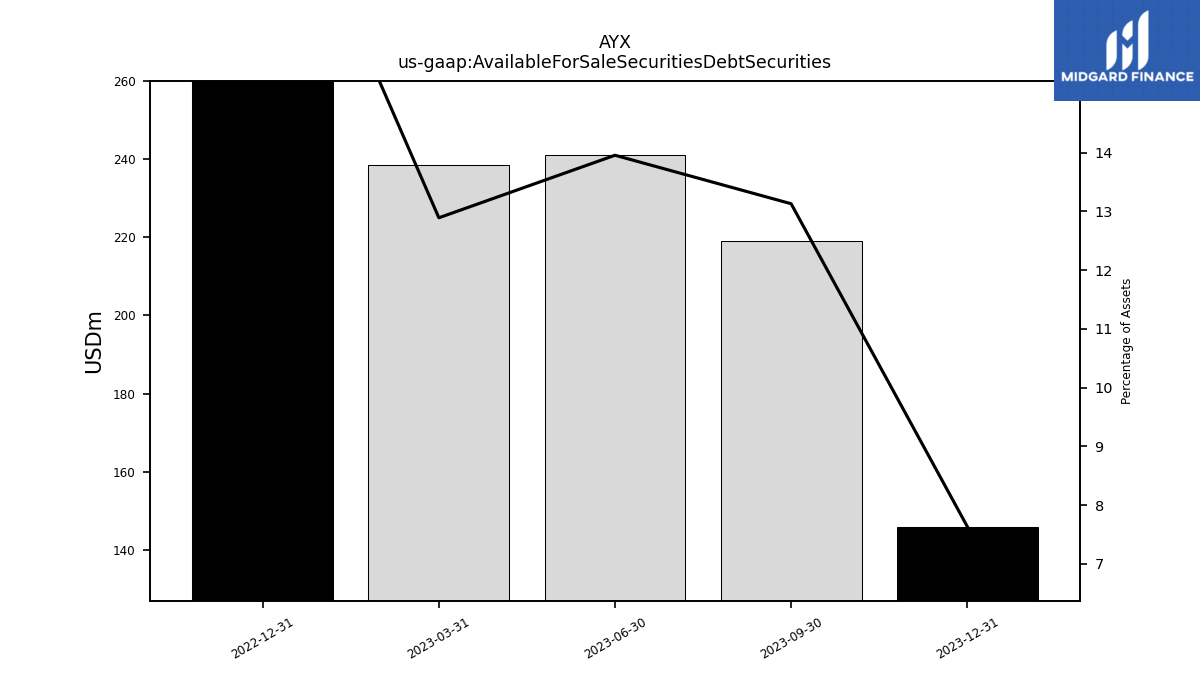
| Available For Sale Securities Debt Securities | 146.00 | 219.00 | 241.00 | 238.40 | 308.00 | NA | NA | NA | NA | NA | NA | NA | NA | NA | NA | NA | NA | NA | NA | NA | NA | NA | NA | NA | NA | NA | NA | NA | NA | NA | NA | NA |
| 2023-12-31 | 2023-09-30 | 2023-06-30 | 2023-03-31 | 2022-12-31 | 2022-09-30 | 2022-06-30 | 2022-03-31 | 2021-12-31 | 2021-09-30 | 2021-06-30 | 2021-03-31 | 2020-12-31 | 2020-09-30 | 2020-06-30 | 2020-03-31 | 2019-12-31 | 2019-09-30 | 2019-06-30 | 2019-03-31 | 2018-12-31 | 2018-09-30 | 2018-06-30 | 2018-03-31 | 2017-12-31 | 2017-09-30 | 2017-06-30 | 2017-03-31 | 2016-12-31 | 2016-09-30 | 2016-06-30 | 2016-03-31 | ||
|---|---|---|---|---|---|---|---|---|---|---|---|---|---|---|---|---|---|---|---|---|---|---|---|---|---|---|---|---|---|---|---|---|---|
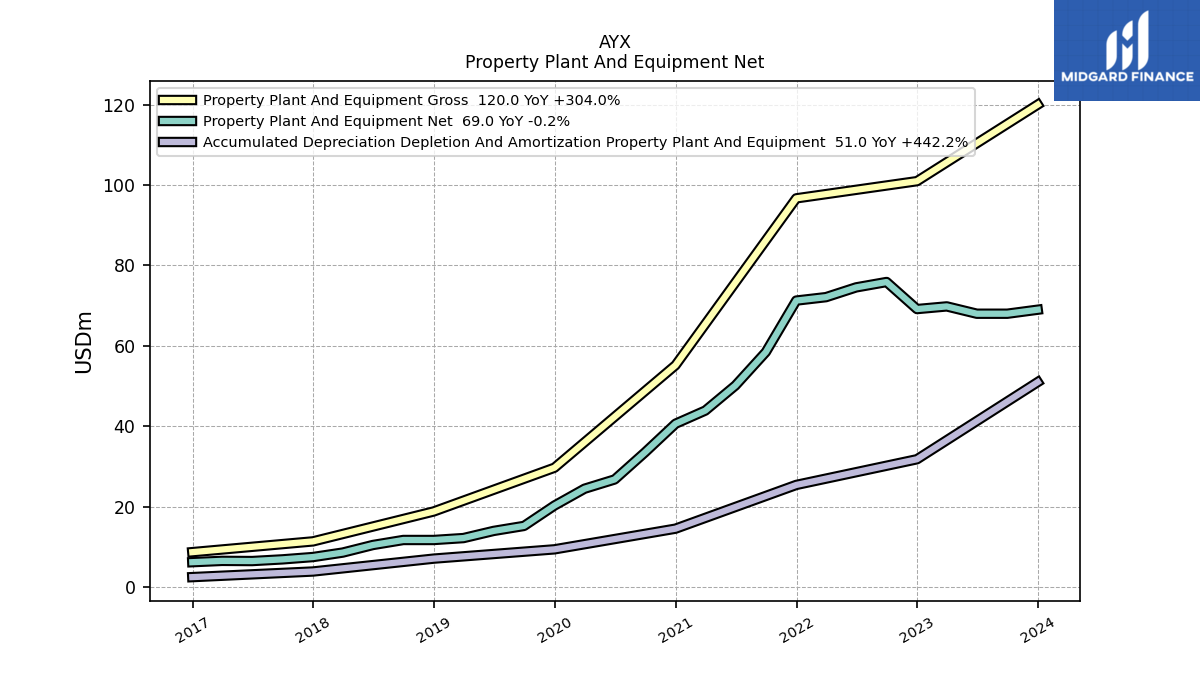
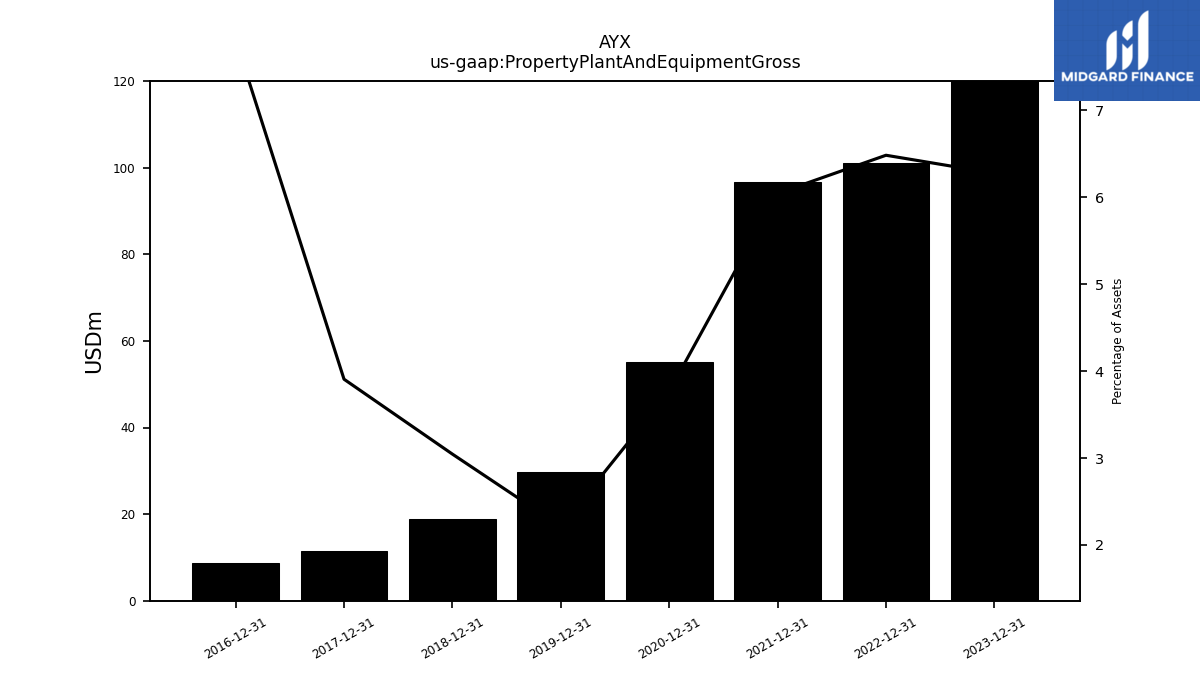
| Property Plant And Equipment Gross | 120.00 | NA | NA | NA | 100.97 | NA | NA | NA | 96.69 | NA | NA | NA | 55.19 | NA | NA | NA | 29.70 | NA | NA | NA | 18.83 | NA | NA | NA | 11.39 | NA | NA | NA | 8.71 | NA | NA | NA | |
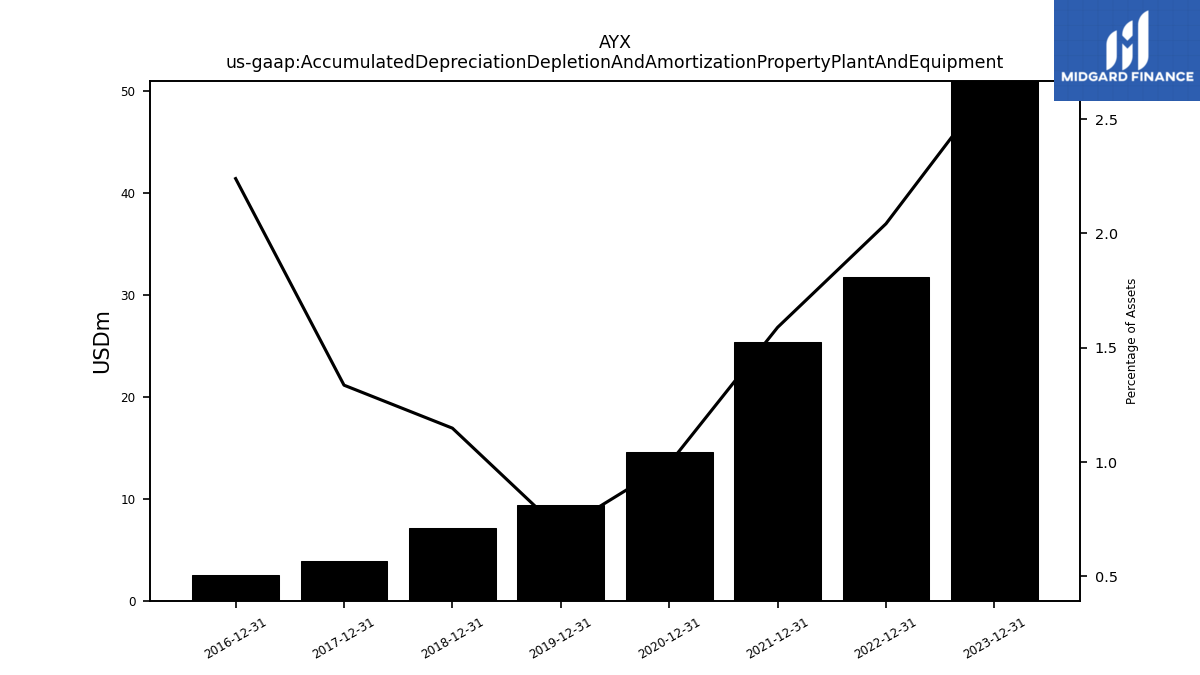
| Accumulated Depreciation Depletion And Amortization Property Plant And Equipment | 51.00 | NA | NA | NA | 31.81 | NA | NA | NA | 25.42 | NA | NA | NA | 14.55 | NA | NA | NA | 9.41 | NA | NA | NA | 7.10 | NA | NA | NA | 3.89 | NA | NA | NA | 2.50 | NA | NA | NA | |
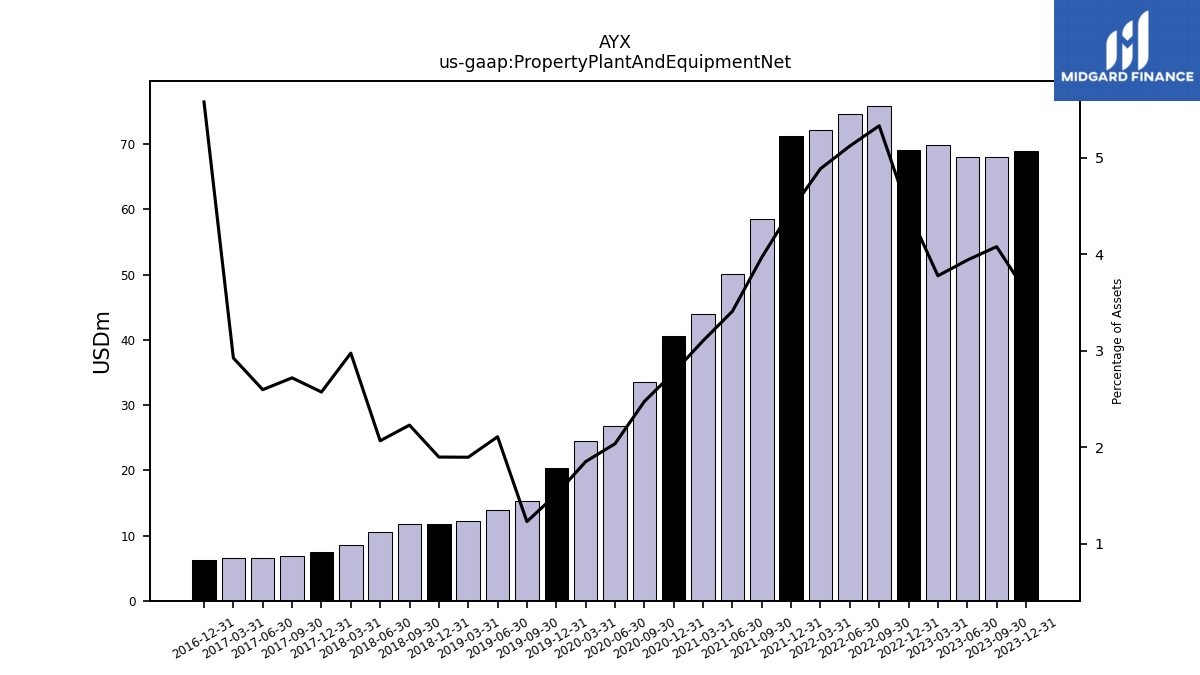
| Property Plant And Equipment Net | 69.00 | 68.00 | 68.00 | 69.82 | 69.16 | 75.89 | 74.55 | 72.12 | 71.27 | 58.46 | 50.15 | 43.91 | 40.65 | 33.55 | 26.79 | 24.48 | 20.30 | 15.23 | 13.98 | 12.21 | 11.73 | 11.73 | 10.48 | 8.60 | 7.49 | 6.91 | 6.49 | 6.54 | 6.21 | NA | NA | NA | |
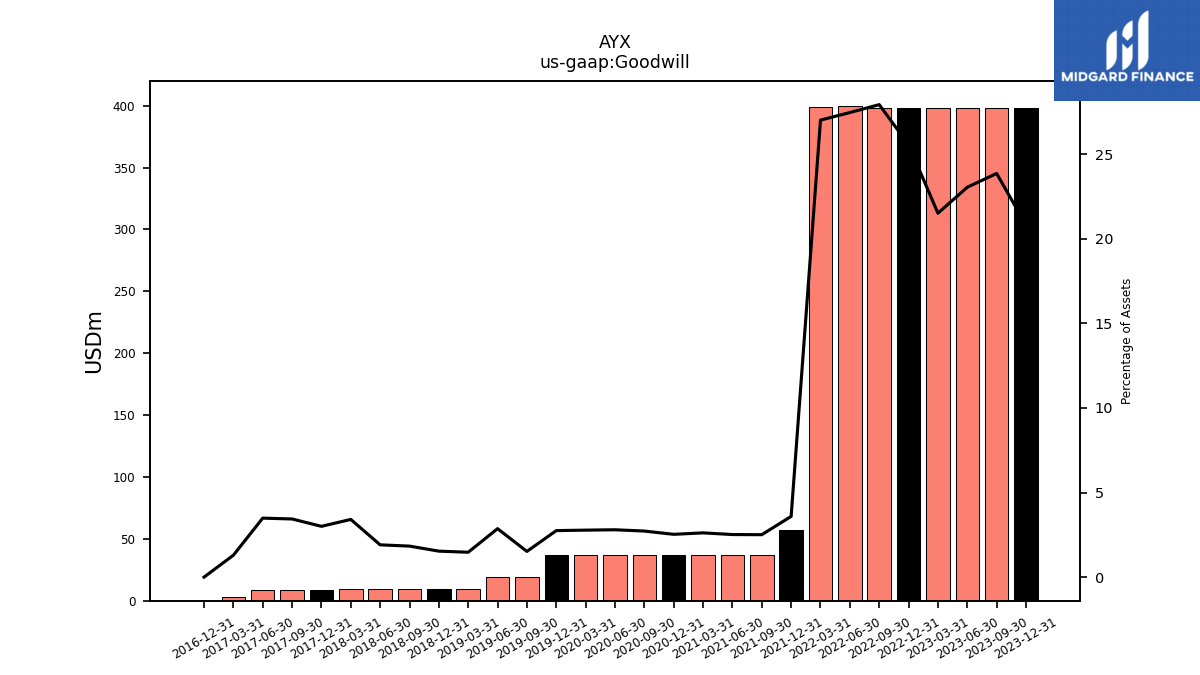
| Goodwill | 398.00 | 398.00 | 398.00 | 397.82 | 398.09 | 397.72 | 399.90 | 398.92 | 57.41 | 36.97 | 37.04 | 37.04 | 37.07 | 36.93 | 36.84 | 36.76 | 36.91 | 18.84 | 19.00 | 9.47 | 9.49 | 9.65 | 9.68 | 9.87 | 8.75 | 8.74 | 8.72 | 2.90 | 0.00 | NA | NA | NA | |
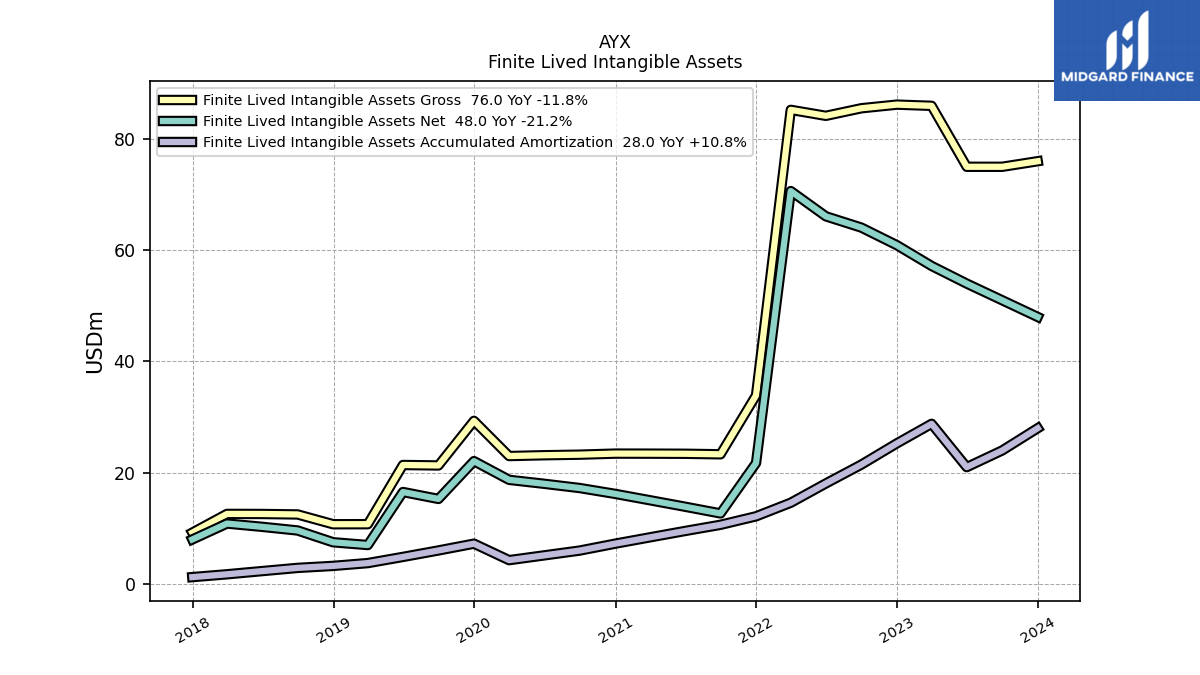
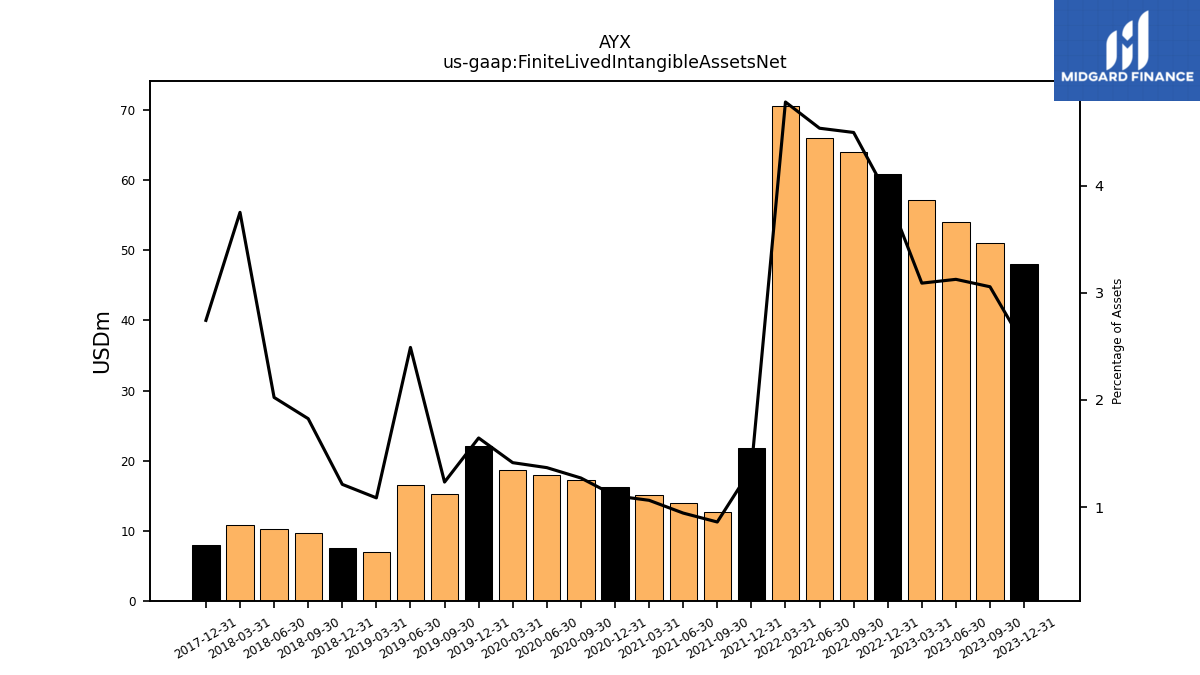
| Intangible Assets Net Excluding Goodwill | 48.00 | 51.00 | 54.00 | 57.17 | 60.90 | 64.06 | 66.09 | 70.64 | 21.74 | 12.68 | 13.88 | 15.05 | 16.19 | 17.24 | 18.00 | 18.72 | 22.08 | 15.28 | 16.53 | 6.99 | 7.49 | 9.61 | 10.27 | 10.86 | 8.00 | NA | NA | NA | NA | NA | NA | NA | |
| Finite Lived Intangible Assets Net | 48.00 | 51.00 | 54.00 | 57.17 | 60.90 | 64.06 | 66.09 | 70.64 | 21.74 | 12.68 | 13.88 | 15.05 | 16.19 | 17.24 | 18.00 | 18.72 | 22.08 | 15.28 | 16.53 | 6.99 | 7.49 | 9.61 | 10.27 | 10.86 | 8.00 | NA | NA | NA | NA | NA | NA | NA | |
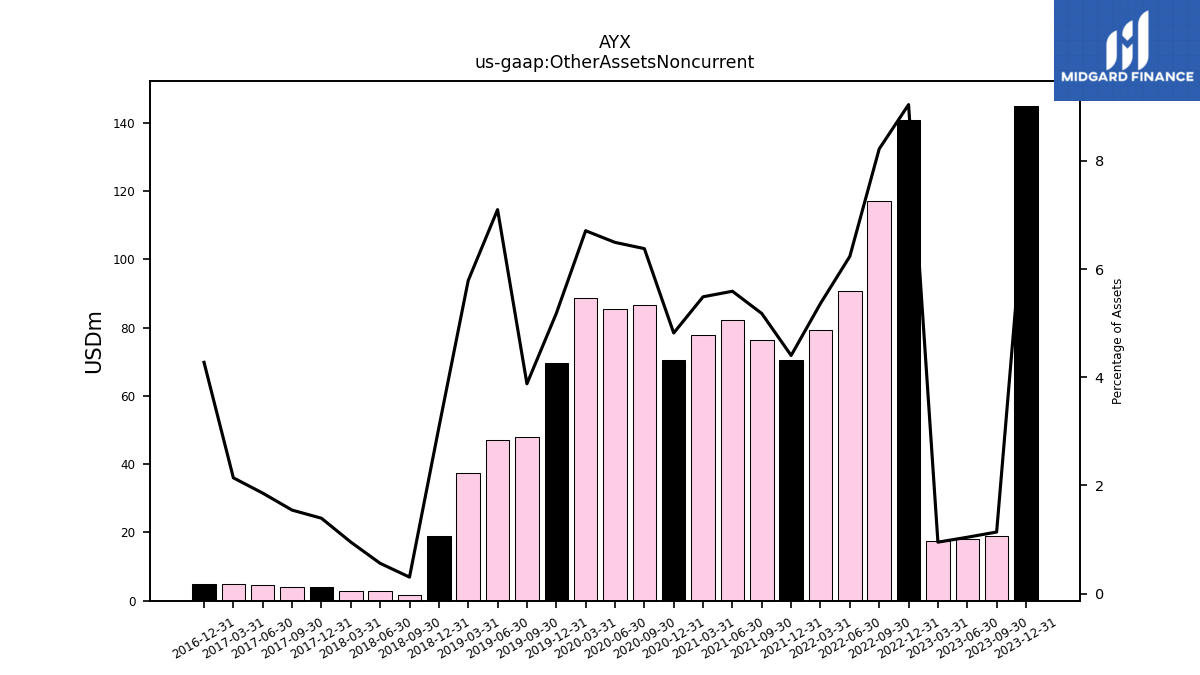
| Other Assets Noncurrent | 145.00 | 19.00 | 18.00 | 17.60 | 140.81 | 117.09 | 90.83 | 79.23 | 70.44 | 76.34 | 82.27 | 77.70 | 70.62 | 86.53 | 85.48 | 88.80 | 69.54 | 48.09 | 47.11 | 37.30 | 18.98 | 1.61 | 2.84 | 2.76 | 4.06 | 3.93 | 4.65 | 4.79 | 4.76 | NA | NA | NA |
| 2023-12-31 | 2023-09-30 | 2023-06-30 | 2023-03-31 | 2022-12-31 | 2022-09-30 | 2022-06-30 | 2022-03-31 | 2021-12-31 | 2021-09-30 | 2021-06-30 | 2021-03-31 | 2020-12-31 | 2020-09-30 | 2020-06-30 | 2020-03-31 | 2019-12-31 | 2019-09-30 | 2019-06-30 | 2019-03-31 | 2018-12-31 | 2018-09-30 | 2018-06-30 | 2018-03-31 | 2017-12-31 | 2017-09-30 | 2017-06-30 | 2017-03-31 | 2016-12-31 | 2016-09-30 | 2016-06-30 | 2016-03-31 | ||
|---|---|---|---|---|---|---|---|---|---|---|---|---|---|---|---|---|---|---|---|---|---|---|---|---|---|---|---|---|---|---|---|---|---|
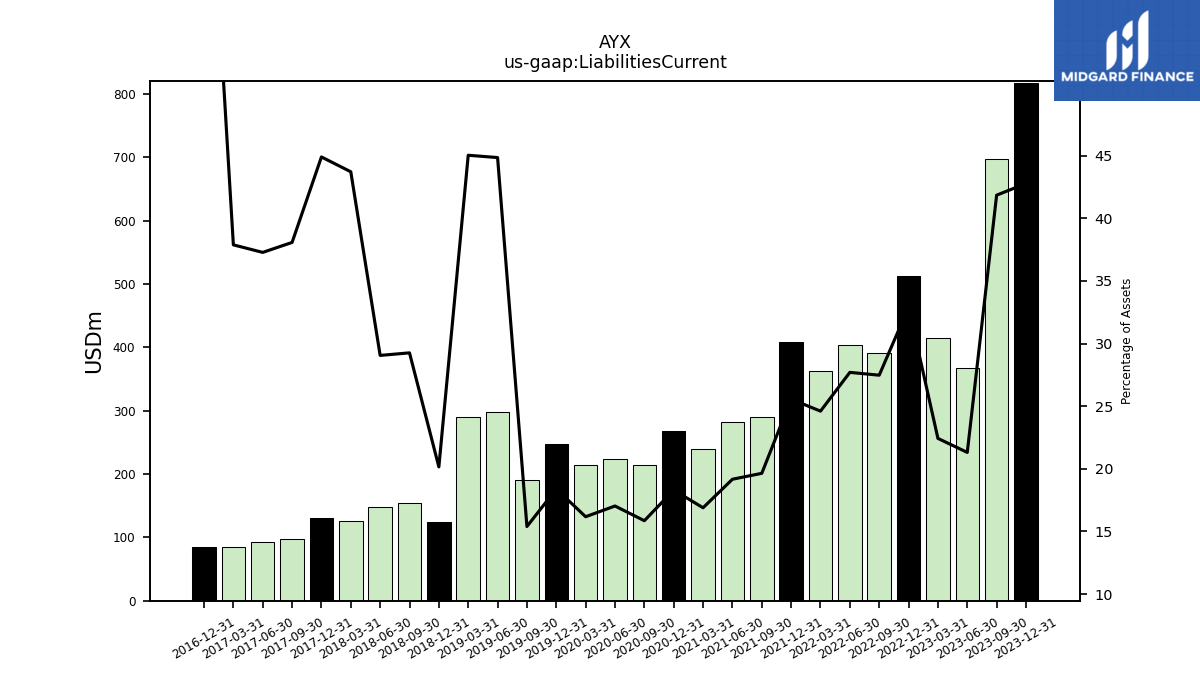
| Liabilities Current | 818.00 | 698.00 | 368.00 | 414.81 | 512.41 | 391.24 | 403.40 | 363.33 | 408.95 | 289.46 | 282.05 | 239.13 | 268.18 | 215.09 | 224.18 | 214.06 | 246.83 | 190.79 | 297.57 | 290.11 | 124.58 | 154.04 | 147.39 | 126.46 | 130.84 | 96.84 | 93.26 | 84.73 | 85.58 | NA | NA | NA | |
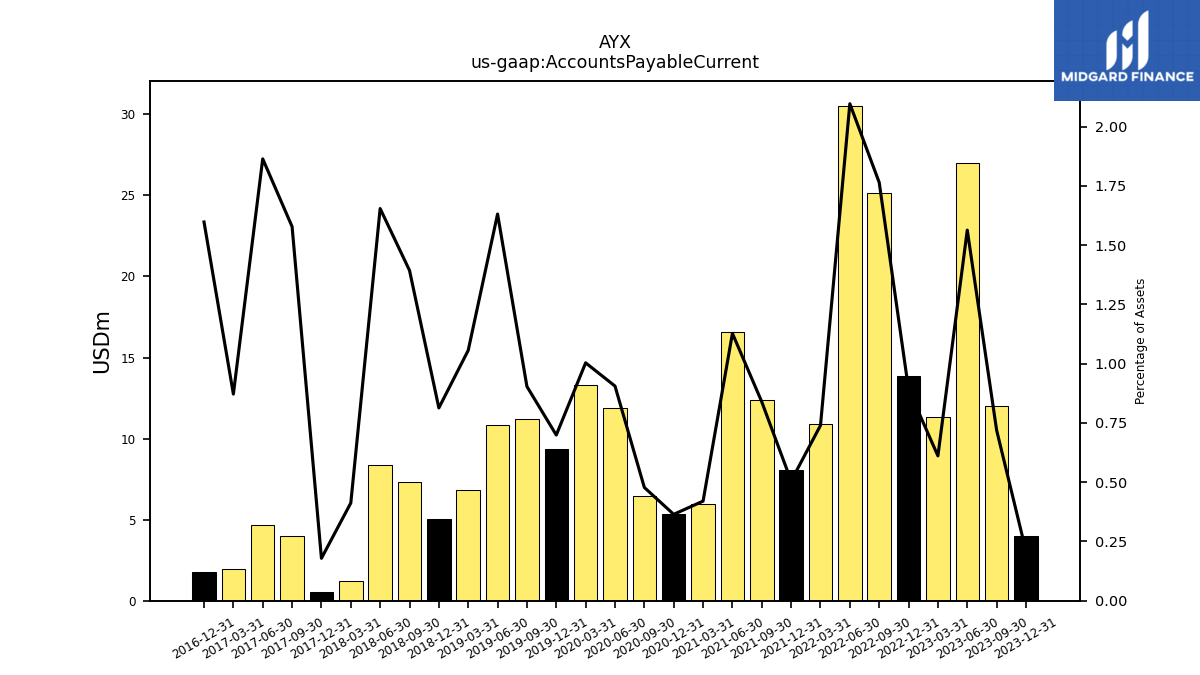
| Accounts Payable Current | 4.00 | 12.00 | 27.00 | 11.30 | 13.88 | 25.13 | 30.53 | 10.92 | 8.09 | 12.37 | 16.59 | 5.95 | 5.34 | 6.48 | 11.92 | 13.28 | 9.38 | 11.20 | 10.82 | 6.80 | 5.03 | 7.34 | 8.39 | 1.19 | 0.52 | 4.01 | 4.66 | 1.95 | 1.78 | NA | NA | NA | |
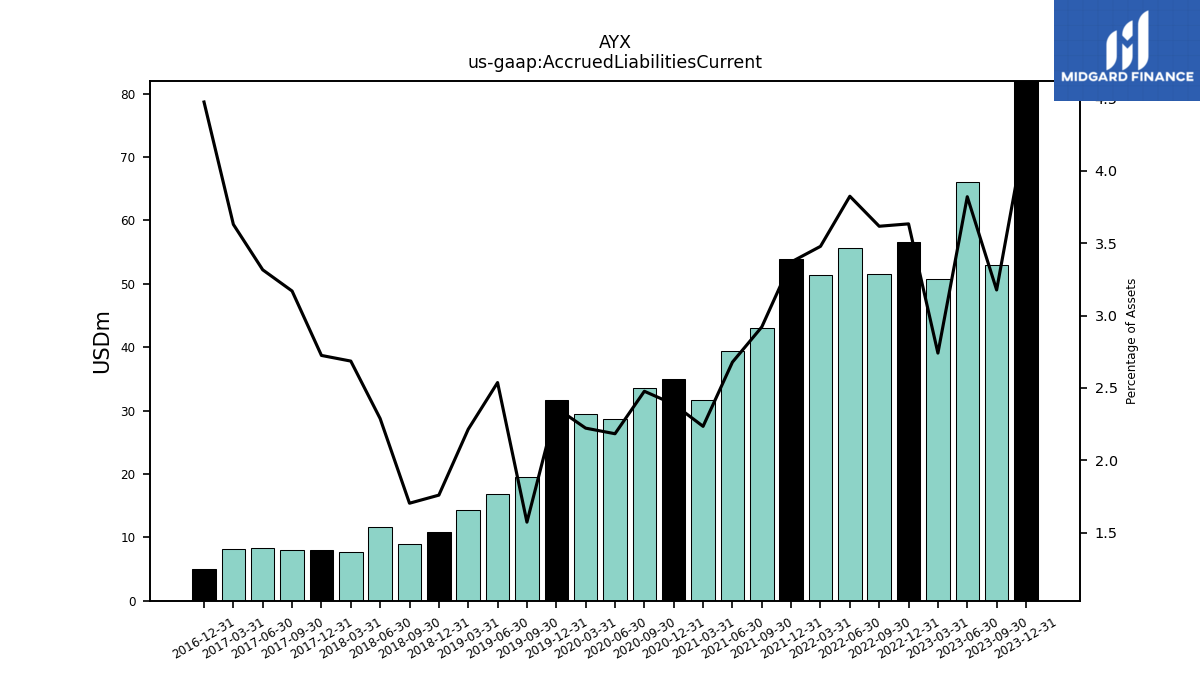
| Accrued Liabilities Current | 82.00 | 53.00 | 66.00 | 50.70 | 56.59 | 51.52 | 55.70 | 51.37 | 53.92 | 43.06 | 39.41 | 31.64 | 34.99 | 33.61 | 28.75 | 29.41 | 31.71 | 19.50 | 16.84 | 14.27 | 10.88 | 8.97 | 11.61 | 7.77 | 7.94 | 8.06 | 8.30 | 8.12 | 4.99 | NA | NA | NA | |
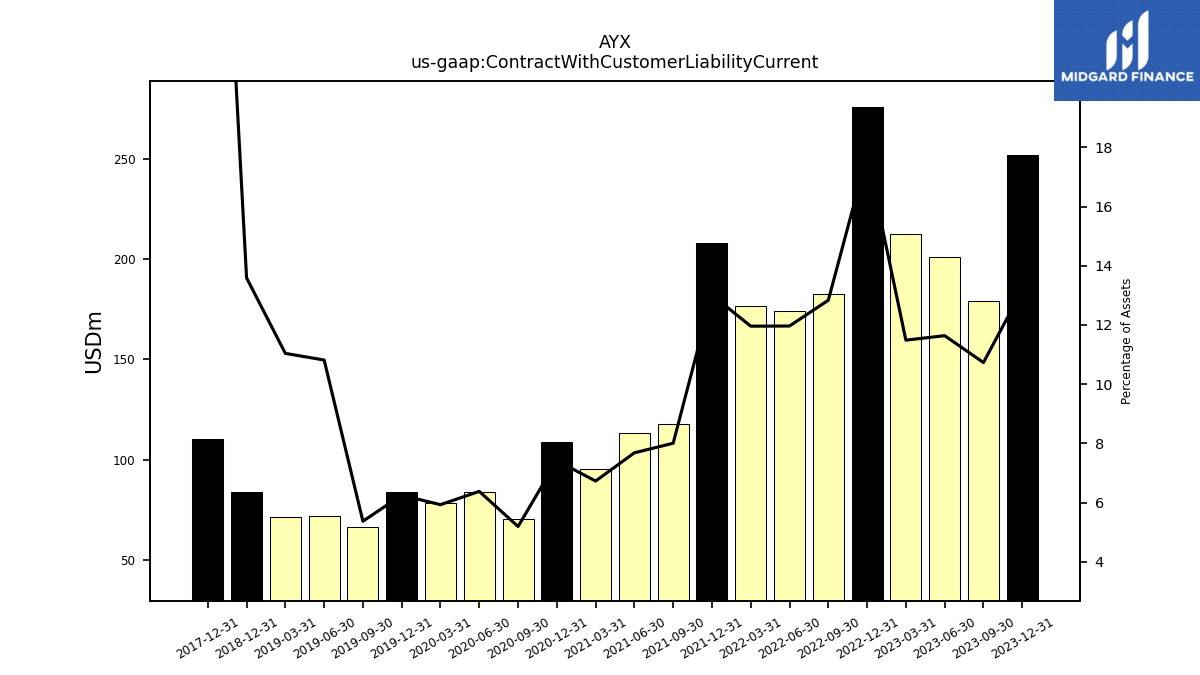
| Contract With Customer Liability Current | 252.00 | 179.00 | 201.00 | 212.46 | 276.16 | 182.78 | 174.25 | 176.60 | 208.15 | 117.99 | 113.04 | 95.26 | 108.66 | 70.44 | 83.96 | 78.47 | 83.89 | 66.56 | 71.77 | 71.12 | 84.02 | NA | NA | NA | 110.21 | NA | NA | NA | NA | NA | NA | NA |
| 2023-12-31 | 2023-09-30 | 2023-06-30 | 2023-03-31 | 2022-12-31 | 2022-09-30 | 2022-06-30 | 2022-03-31 | 2021-12-31 | 2021-09-30 | 2021-06-30 | 2021-03-31 | 2020-12-31 | 2020-09-30 | 2020-06-30 | 2020-03-31 | 2019-12-31 | 2019-09-30 | 2019-06-30 | 2019-03-31 | 2018-12-31 | 2018-09-30 | 2018-06-30 | 2018-03-31 | 2017-12-31 | 2017-09-30 | 2017-06-30 | 2017-03-31 | 2016-12-31 | 2016-09-30 | 2016-06-30 | 2016-03-31 | ||
|---|---|---|---|---|---|---|---|---|---|---|---|---|---|---|---|---|---|---|---|---|---|---|---|---|---|---|---|---|---|---|---|---|---|
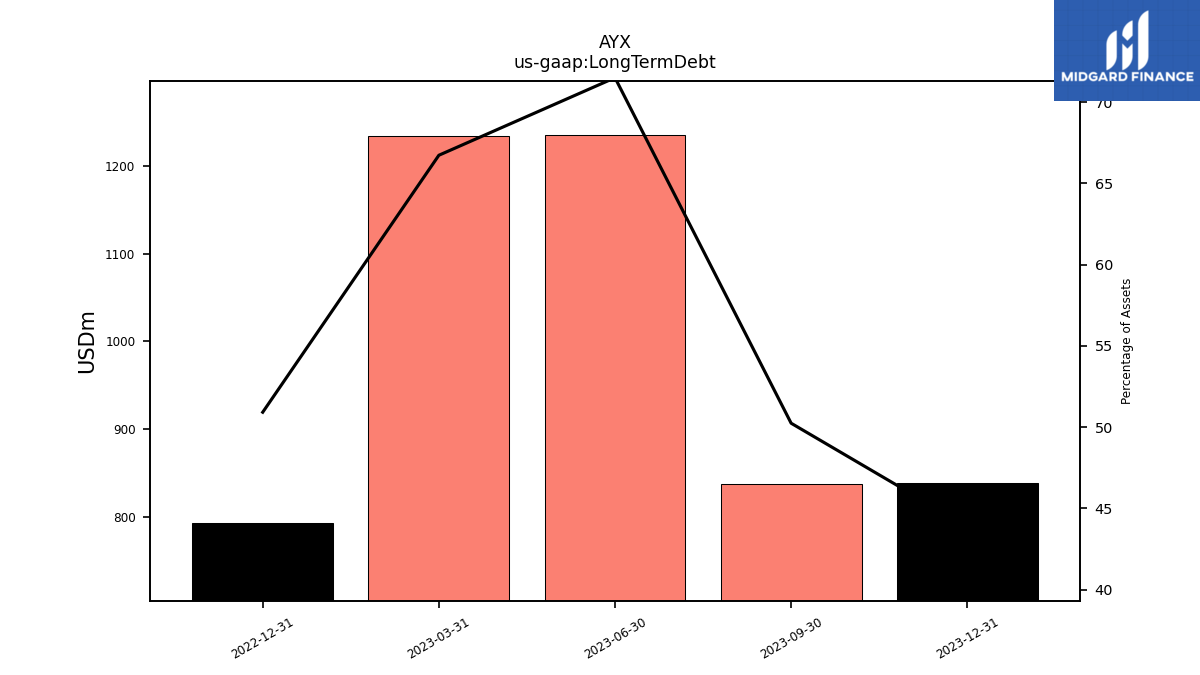
| Long Term Debt | 839.00 | 838.00 | 1235.00 | 1234.25 | 792.92 | NA | NA | NA | NA | NA | NA | NA | NA | NA | NA | NA | NA | NA | NA | NA | NA | NA | NA | NA | NA | NA | NA | NA | NA | NA | NA | NA | |
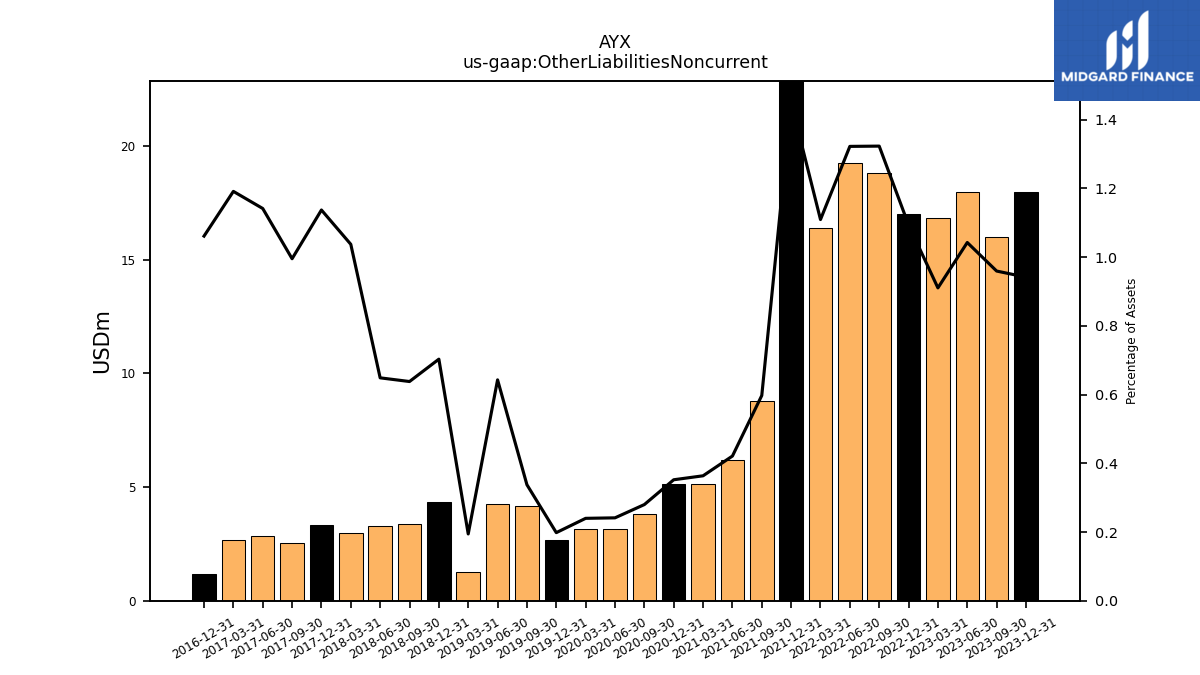
| Other Liabilities Noncurrent | 18.00 | 16.00 | 18.00 | 16.83 | 17.03 | 18.84 | 19.25 | 16.38 | 23.19 | 8.80 | 6.20 | 5.15 | 5.16 | 3.80 | 3.17 | 3.17 | 2.66 | 4.18 | 4.26 | 1.25 | 4.34 | 3.36 | 3.29 | 3.00 | 3.31 | 2.53 | 2.85 | 2.66 | 1.18 | NA | NA | NA | |
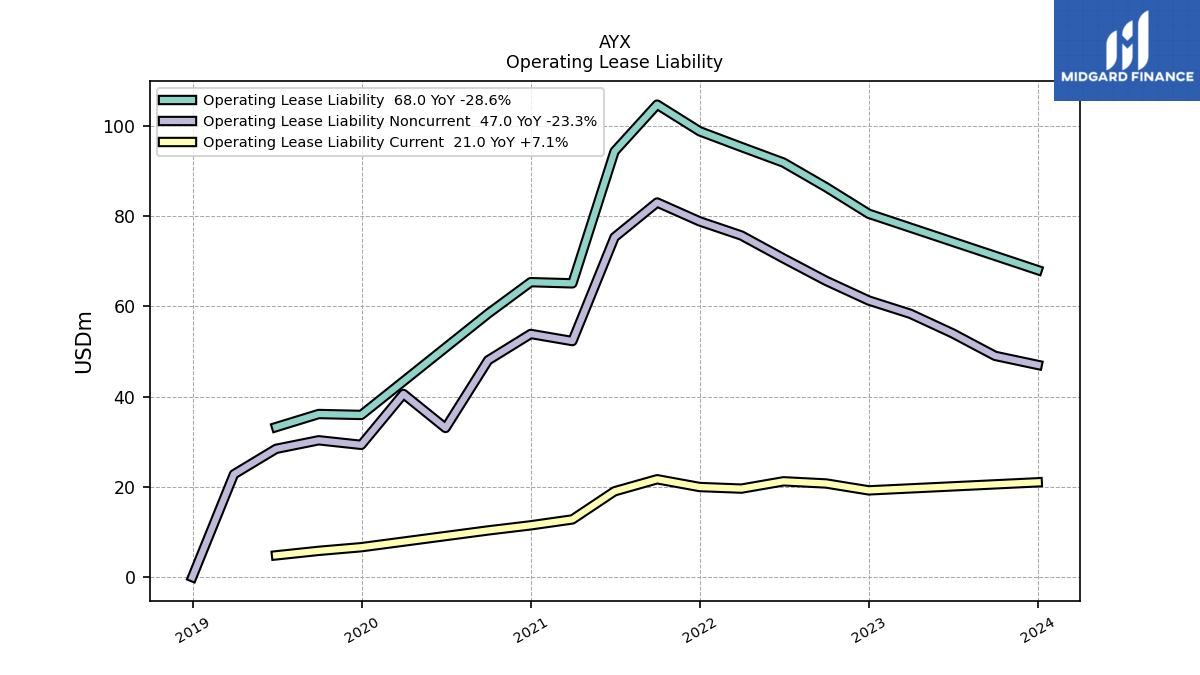
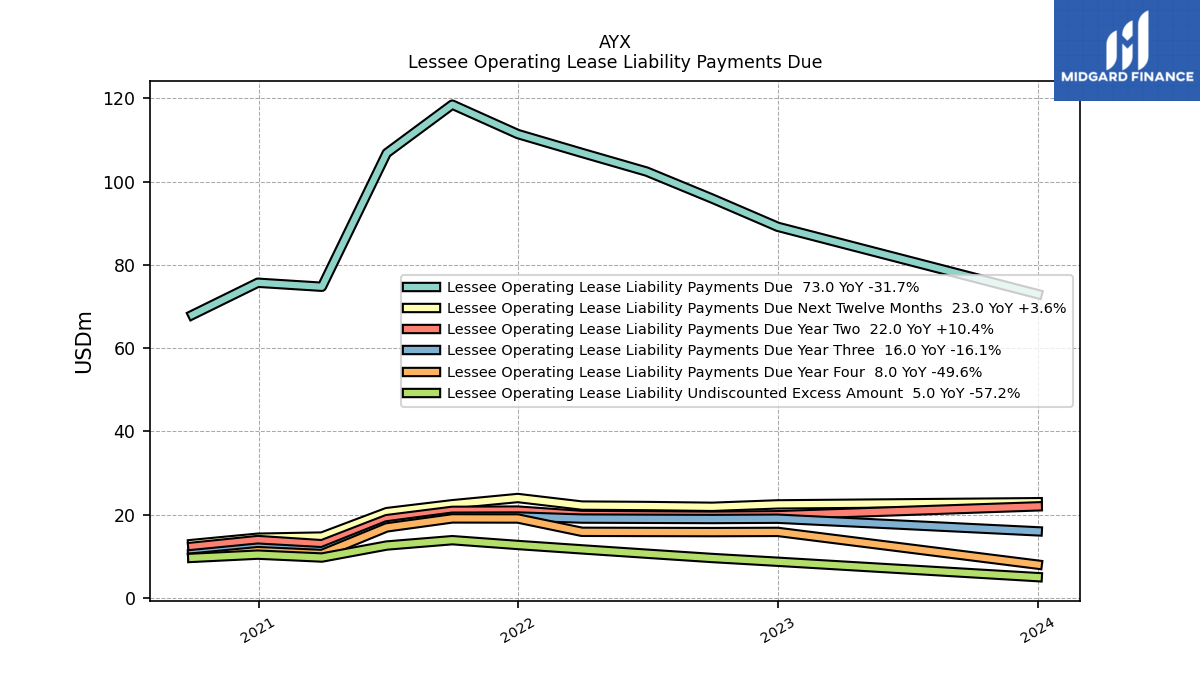
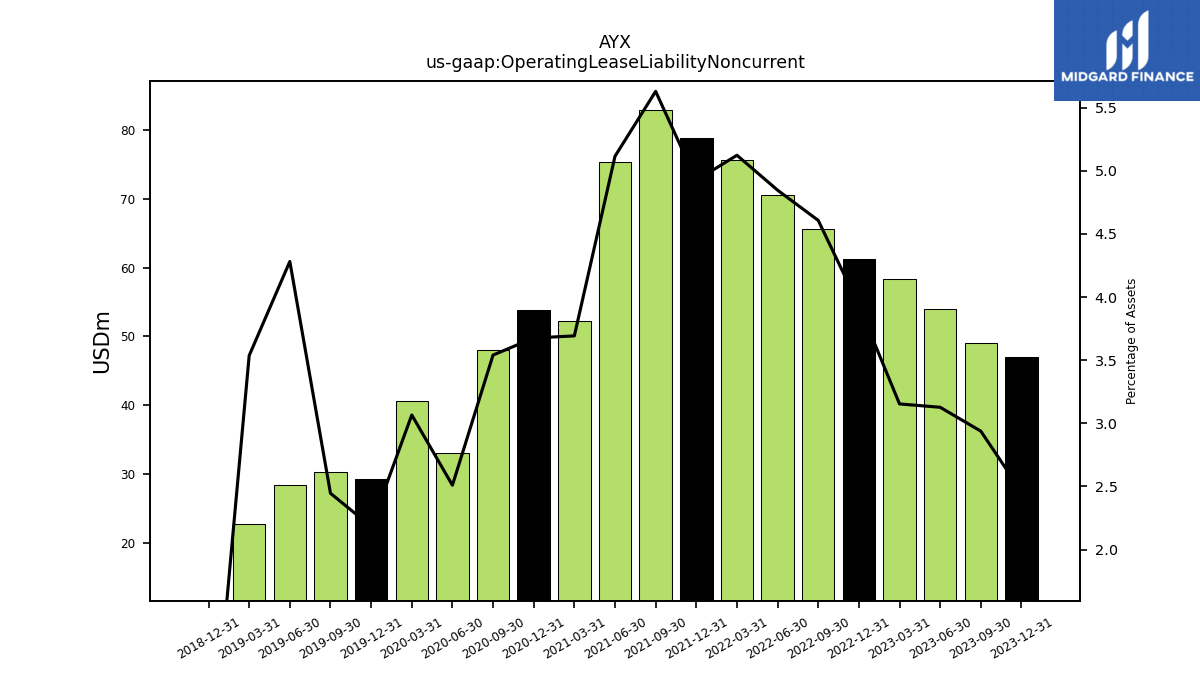
| Operating Lease Liability Noncurrent | 47.00 | 49.00 | 54.00 | 58.32 | 61.27 | 65.61 | 70.58 | 75.66 | 78.78 | 82.97 | 75.28 | 52.28 | 53.86 | 48.03 | 33.03 | 40.57 | 29.29 | 30.31 | 28.41 | 22.78 | 0.00 | NA | NA | NA | NA | NA | NA | NA | NA | NA | NA | NA |
| 2023-12-31 | 2023-09-30 | 2023-06-30 | 2023-03-31 | 2022-12-31 | 2022-09-30 | 2022-06-30 | 2022-03-31 | 2021-12-31 | 2021-09-30 | 2021-06-30 | 2021-03-31 | 2020-12-31 | 2020-09-30 | 2020-06-30 | 2020-03-31 | 2019-12-31 | 2019-09-30 | 2019-06-30 | 2019-03-31 | 2018-12-31 | 2018-09-30 | 2018-06-30 | 2018-03-31 | 2017-12-31 | 2017-09-30 | 2017-06-30 | 2017-03-31 | 2016-12-31 | 2016-09-30 | 2016-06-30 | 2016-03-31 | ||
|---|---|---|---|---|---|---|---|---|---|---|---|---|---|---|---|---|---|---|---|---|---|---|---|---|---|---|---|---|---|---|---|---|---|
| Stockholders Equity | 190.00 | 67.00 | 52.00 | 125.18 | 173.66 | 156.15 | 171.60 | 230.59 | 402.75 | 409.33 | 431.63 | 451.49 | 476.79 | 435.89 | 409.48 | 426.38 | 424.91 | 386.74 | 331.43 | 325.84 | 301.82 | 194.72 | 185.11 | 156.13 | 153.50 | 151.45 | 150.60 | 132.78 | -77.61 | NA | NA | NA | |
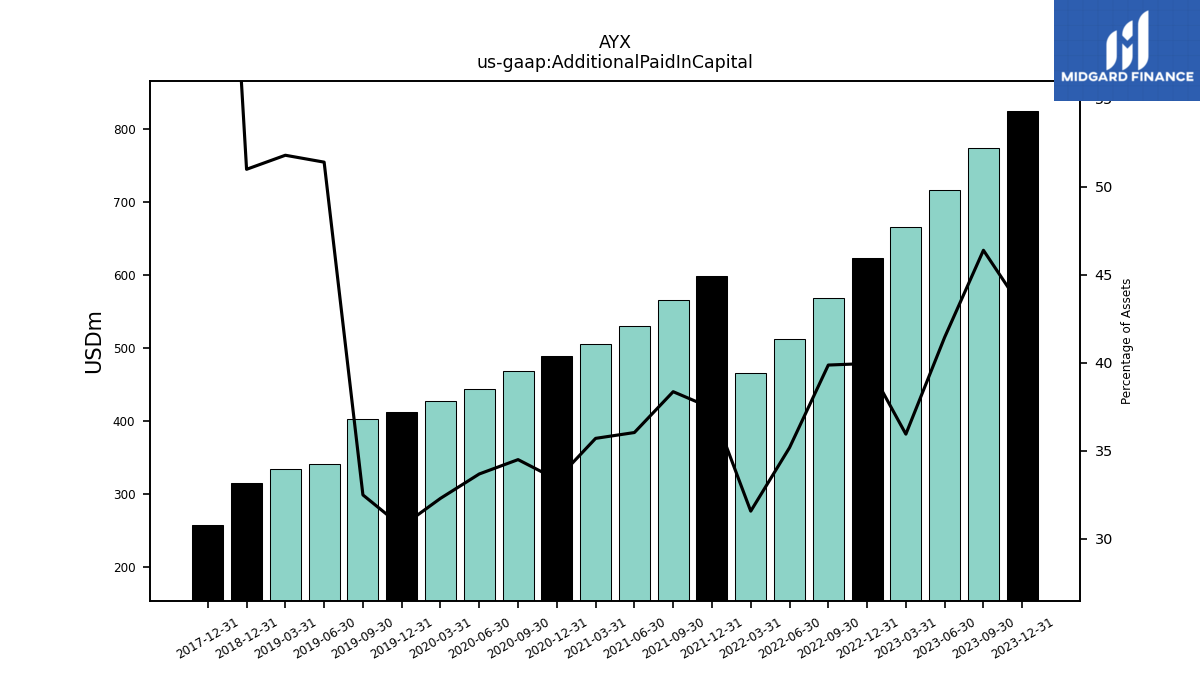
| Additional Paid In Capital | 824.00 | 774.00 | 716.00 | 664.95 | 622.43 | 567.91 | 512.42 | 466.32 | 598.71 | 565.45 | 530.42 | 505.64 | 489.02 | 468.08 | 443.47 | 427.51 | 412.19 | 402.79 | 341.11 | 333.71 | 315.29 | NA | NA | NA | 257.40 | NA | NA | NA | NA | NA | NA | NA | |
| Retained Earnings Accumulated Deficit | -622.00 | -702.00 | -652.00 | -532.19 | -443.16 | -411.51 | -336.99 | -230.23 | -190.43 | -152.88 | -94.84 | -51.40 | -10.75 | -32.78 | -37.14 | -1.85 | 14.23 | -16.45 | -10.21 | -6.99 | -12.91 | -115.85 | -115.61 | -110.31 | -103.55 | -102.01 | -98.71 | -91.71 | -86.05 | NA | NA | NA | |
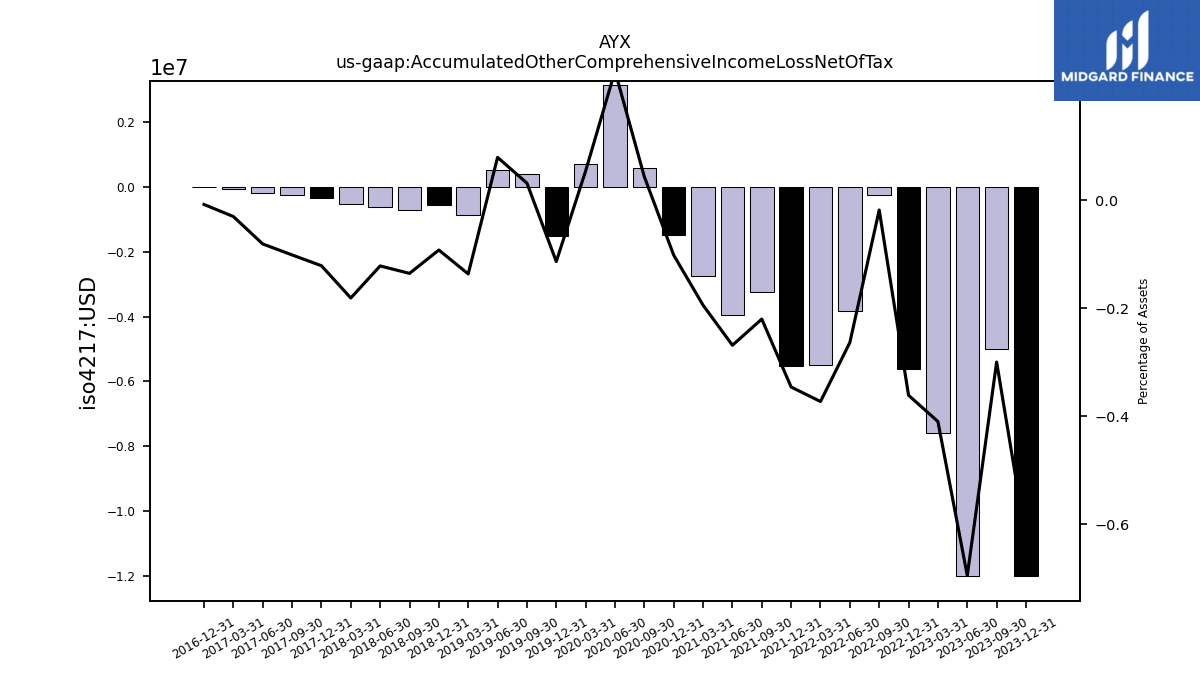
| Accumulated Other Comprehensive Income Loss Net Of Tax | -12.00 | -5.00 | -12.00 | -7.58 | -5.63 | -0.26 | -3.84 | -5.50 | -5.53 | -3.25 | -3.95 | -2.75 | -1.49 | 0.58 | 3.15 | 0.71 | -1.53 | 0.39 | 0.53 | -0.88 | -0.57 | -0.71 | -0.62 | -0.52 | -0.35 | -0.26 | -0.20 | -0.07 | -0.01 | NA | NA | NA |
| 2023-12-31 | 2023-09-30 | 2023-06-30 | 2023-03-31 | 2022-12-31 | 2022-09-30 | 2022-06-30 | 2022-03-31 | 2021-12-31 | 2021-09-30 | 2021-06-30 | 2021-03-31 | 2020-12-31 | 2020-09-30 | 2020-06-30 | 2020-03-31 | 2019-12-31 | 2019-09-30 | 2019-06-30 | 2019-03-31 | 2018-12-31 | 2018-09-30 | 2018-06-30 | 2018-03-31 | 2017-12-31 | 2017-09-30 | 2017-06-30 | 2017-03-31 | 2016-12-31 | 2016-09-30 | 2016-06-30 | 2016-03-31 | ||
|---|---|---|---|---|---|---|---|---|---|---|---|---|---|---|---|---|---|---|---|---|---|---|---|---|---|---|---|---|---|---|---|---|---|
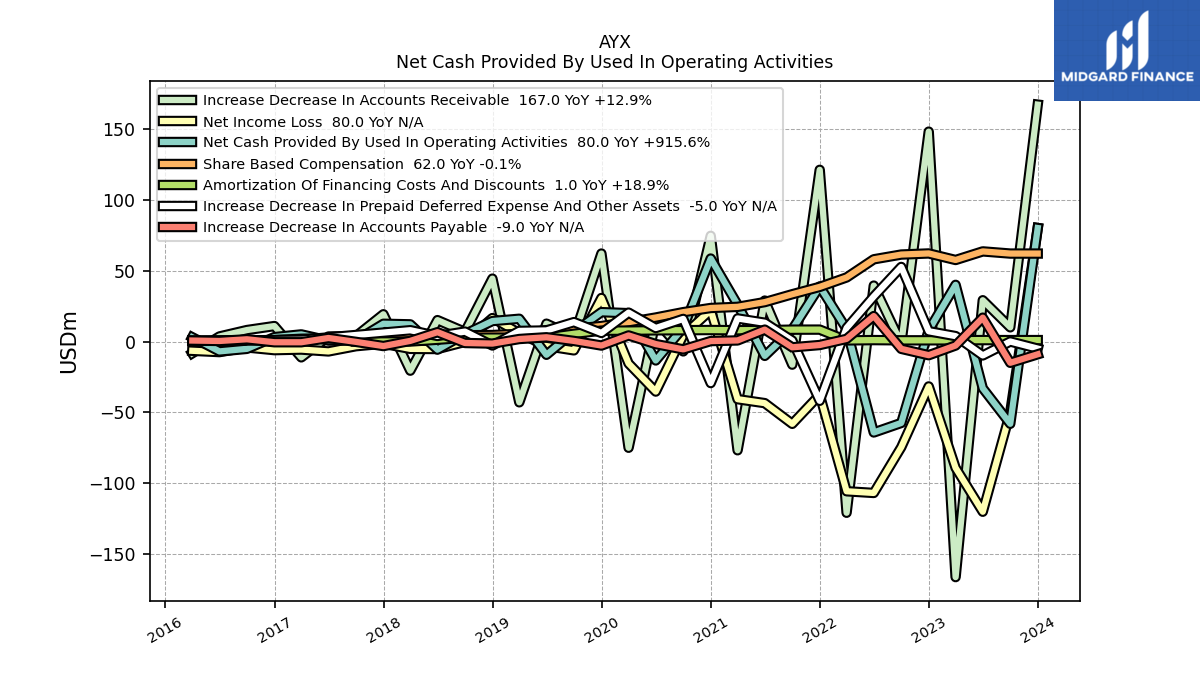
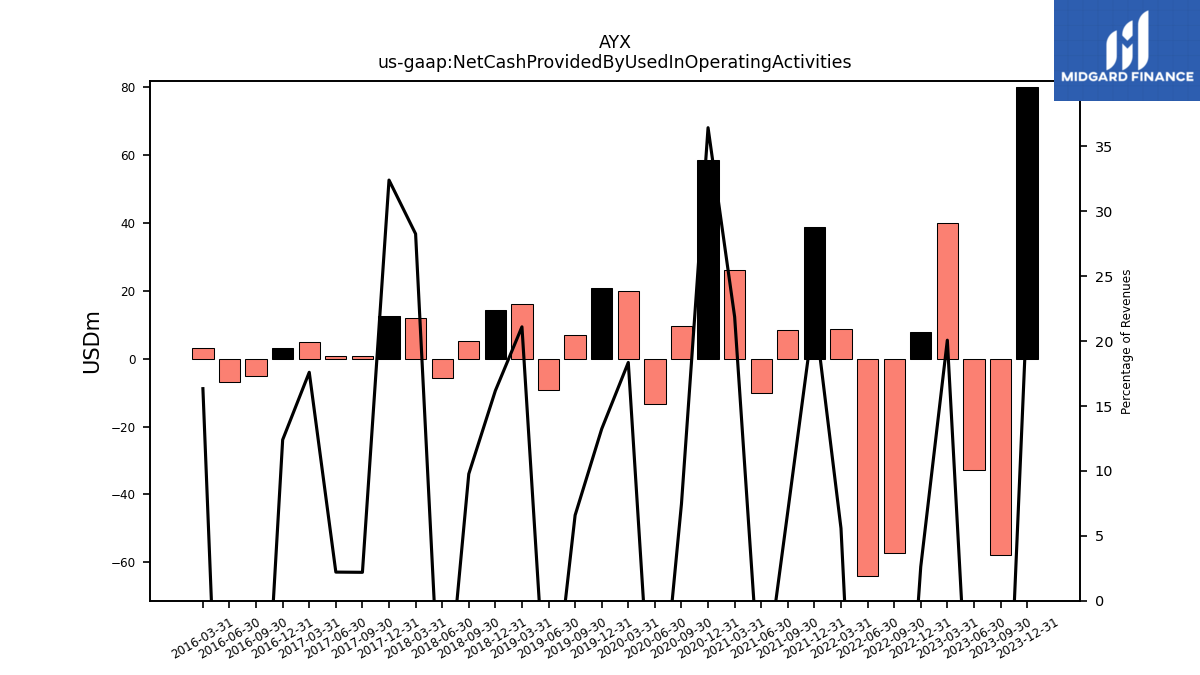
| Net Cash Provided By Used In Operating Activities | 80.00 | -58.00 | -32.96 | 39.96 | 7.88 | -57.41 | -64.13 | 8.82 | 38.82 | 8.51 | -10.13 | 25.97 | 58.49 | 9.68 | -13.36 | 19.98 | 20.71 | 6.81 | -9.37 | 16.04 | 14.42 | 5.29 | -5.73 | 12.10 | 12.50 | 0.75 | 0.67 | 5.02 | 3.10 | -5.17 | -6.96 | 3.00 | |
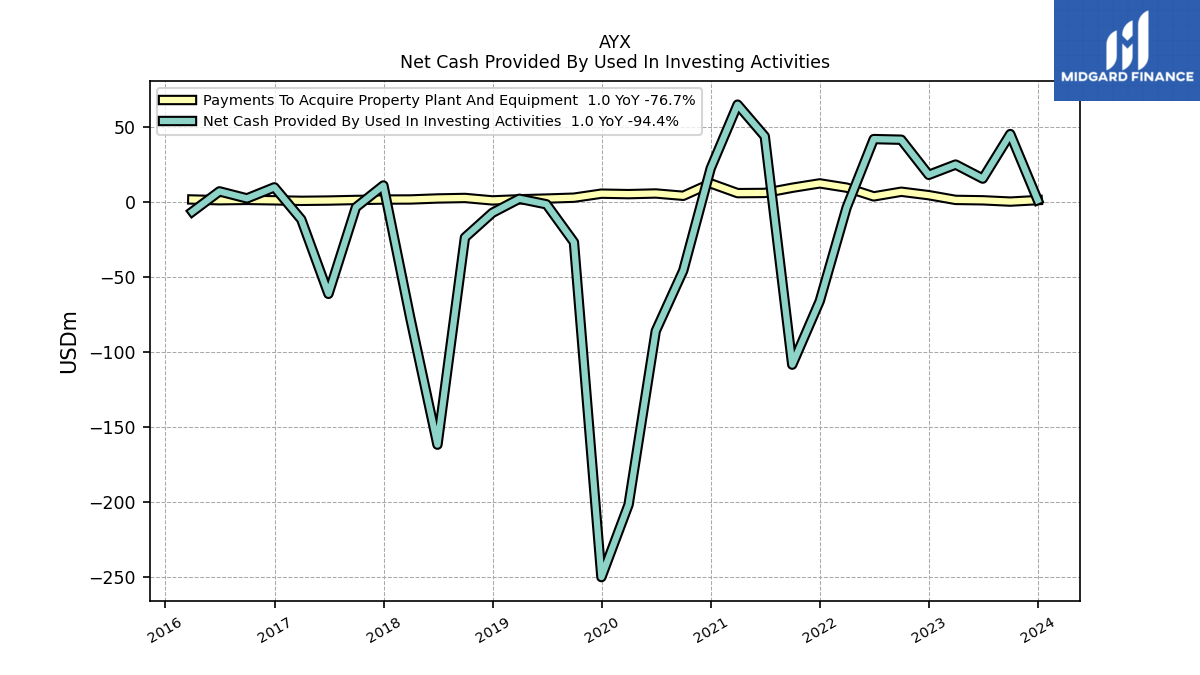
| Net Cash Provided By Used In Investing Activities | 1.00 | 45.00 | 15.31 | 24.69 | 17.80 | 41.23 | 41.66 | -3.99 | -66.33 | -108.64 | 43.48 | 64.61 | 22.20 | -45.96 | -86.19 | -201.90 | -250.19 | -27.05 | -1.80 | 1.90 | -7.46 | -23.91 | -161.94 | -77.55 | 10.76 | -3.80 | -61.48 | -11.90 | 9.51 | 2.14 | 6.82 | -6.73 | |
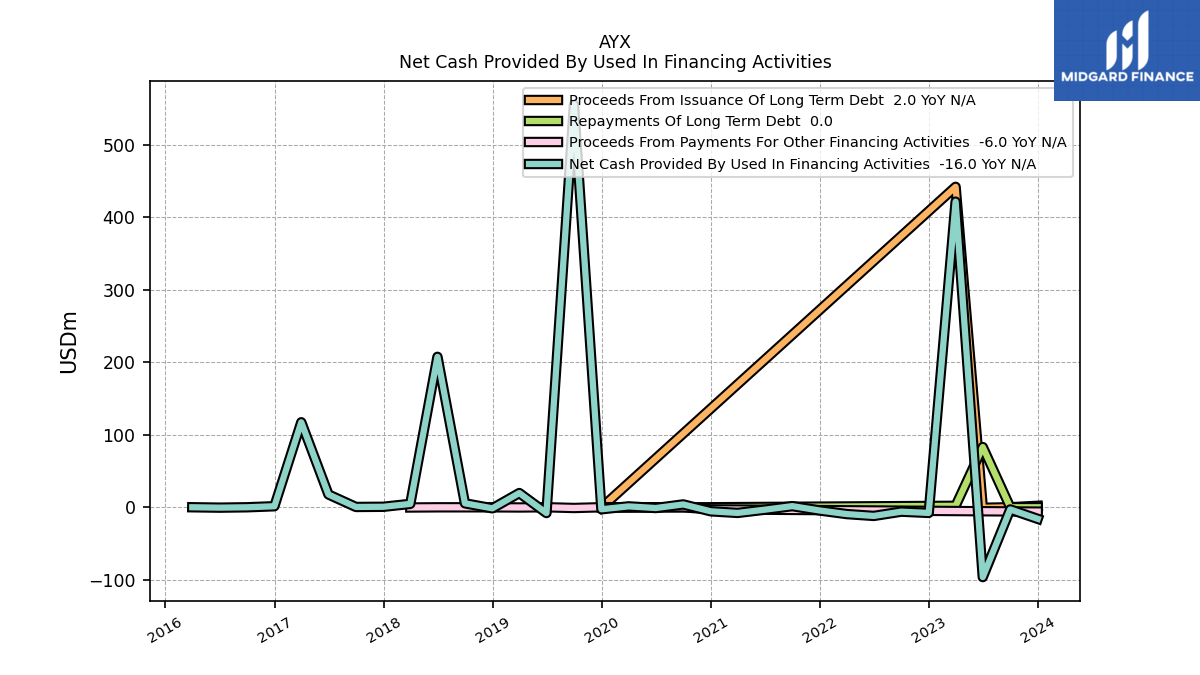
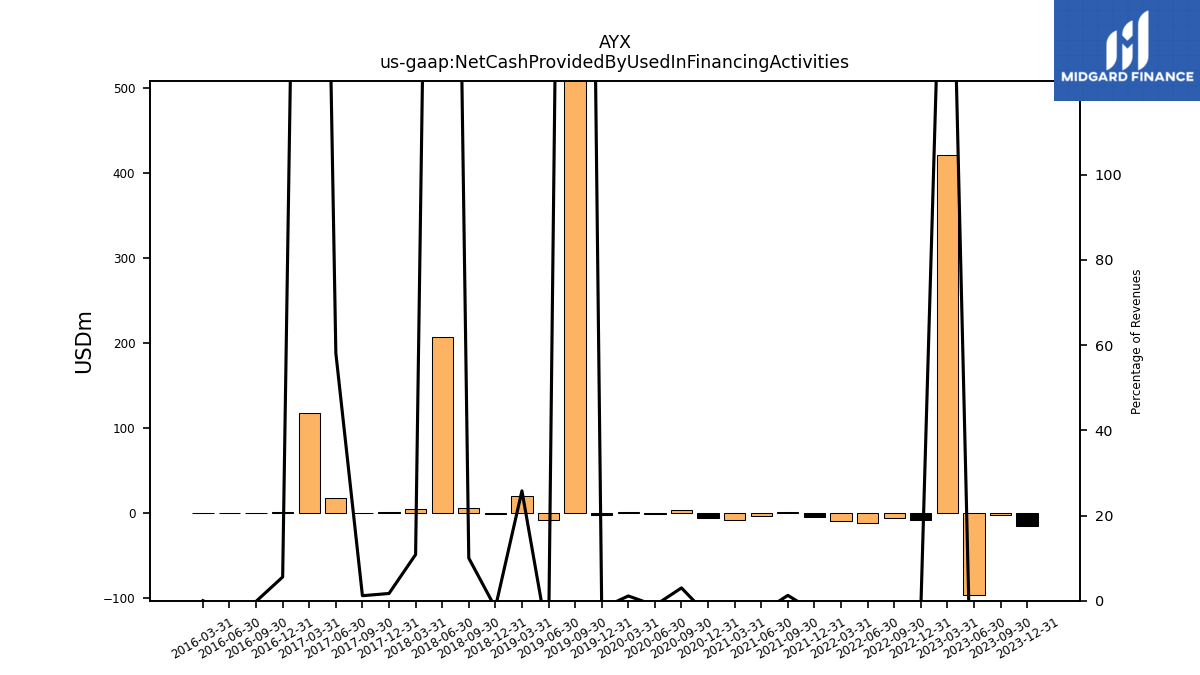
| Net Cash Provided By Used In Financing Activities | -16.00 | -3.00 | -96.31 | 421.31 | -7.81 | -6.07 | -11.96 | -9.38 | -4.45 | 1.56 | -3.36 | -7.83 | -5.57 | 3.91 | -1.06 | 1.22 | -2.78 | 555.05 | -8.02 | 19.60 | -1.47 | 5.42 | 207.38 | 4.64 | 0.66 | 0.40 | 17.62 | 117.19 | 1.39 | -0.03 | -0.54 | 0.00 |
| 2023-12-31 | 2023-09-30 | 2023-06-30 | 2023-03-31 | 2022-12-31 | 2022-09-30 | 2022-06-30 | 2022-03-31 | 2021-12-31 | 2021-09-30 | 2021-06-30 | 2021-03-31 | 2020-12-31 | 2020-09-30 | 2020-06-30 | 2020-03-31 | 2019-12-31 | 2019-09-30 | 2019-06-30 | 2019-03-31 | 2018-12-31 | 2018-09-30 | 2018-06-30 | 2018-03-31 | 2017-12-31 | 2017-09-30 | 2017-06-30 | 2017-03-31 | 2016-12-31 | 2016-09-30 | 2016-06-30 | 2016-03-31 | ||
|---|---|---|---|---|---|---|---|---|---|---|---|---|---|---|---|---|---|---|---|---|---|---|---|---|---|---|---|---|---|---|---|---|---|
| Net Cash Provided By Used In Operating Activities | 80.00 | -58.00 | -32.96 | 39.96 | 7.88 | -57.41 | -64.13 | 8.82 | 38.82 | 8.51 | -10.13 | 25.97 | 58.49 | 9.68 | -13.36 | 19.98 | 20.71 | 6.81 | -9.37 | 16.04 | 14.42 | 5.29 | -5.73 | 12.10 | 12.50 | 0.75 | 0.67 | 5.02 | 3.10 | -5.17 | -6.96 | 3.00 | |
| Net Income Loss | 80.00 | -50.00 | -120.00 | -89.03 | -31.65 | -74.51 | -106.77 | -105.57 | -37.55 | -58.04 | -43.44 | -40.66 | 22.04 | 4.36 | -35.29 | -15.47 | 30.69 | -6.24 | -3.22 | 5.91 | 16.54 | -0.24 | -5.29 | -5.19 | -1.54 | -3.30 | -6.99 | -5.67 | -6.08 | -4.19 | -7.46 | -6.53 | |
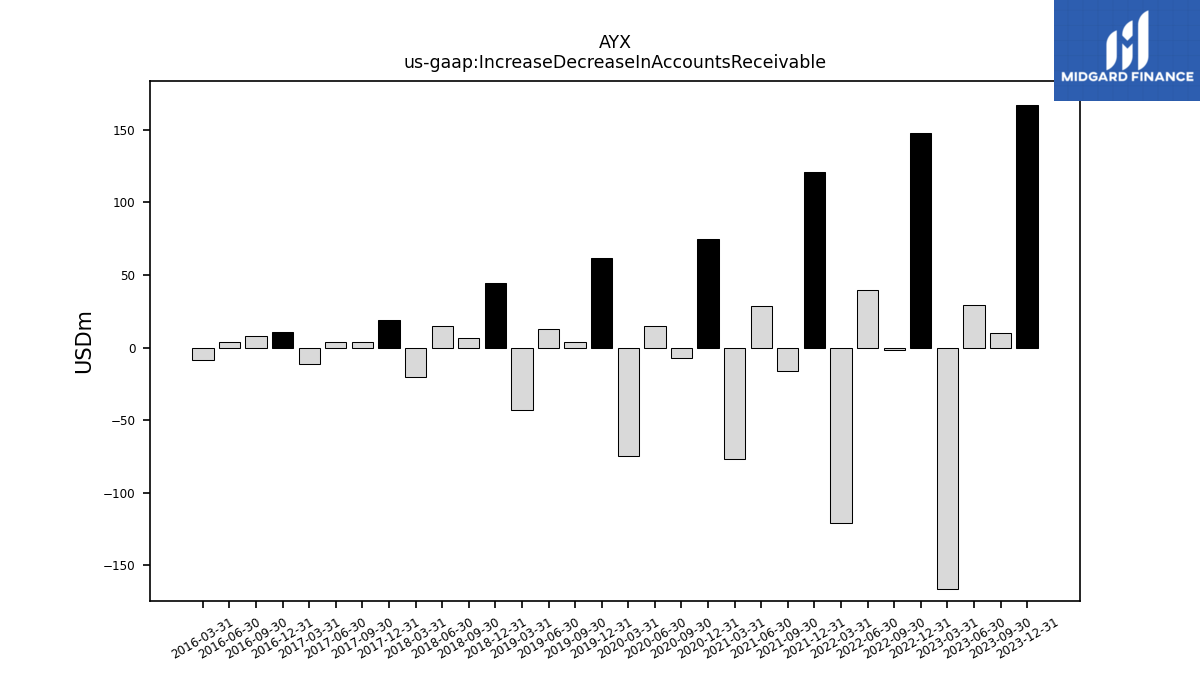
| Increase Decrease In Accounts Receivable | 167.00 | 10.00 | 29.10 | -166.10 | 147.97 | -1.42 | 39.43 | -120.73 | 121.04 | -16.32 | 28.88 | -76.68 | 74.52 | -6.97 | 14.72 | -74.90 | 62.02 | 3.59 | 12.59 | -42.88 | 44.34 | 6.77 | 15.08 | -20.55 | 19.22 | 3.77 | 3.52 | -11.18 | 10.91 | 8.08 | 3.56 | -8.29 | |
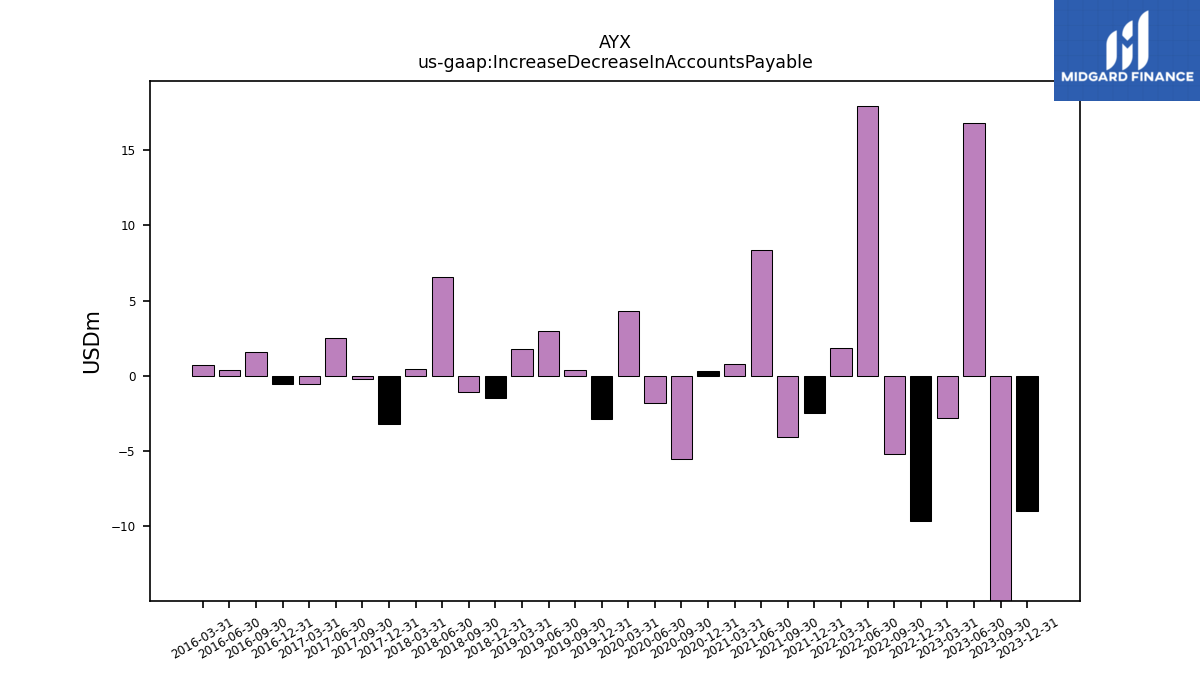
| Increase Decrease In Accounts Payable | -9.00 | -15.00 | 16.82 | -2.82 | -9.65 | -5.17 | 17.94 | 1.85 | -2.47 | -4.09 | 8.39 | 0.76 | 0.31 | -5.54 | -1.80 | 4.29 | -2.85 | 0.41 | 2.99 | 1.76 | -1.46 | -1.04 | 6.58 | 0.44 | -3.20 | -0.24 | 2.49 | -0.53 | -0.51 | 1.58 | 0.38 | 0.69 | |
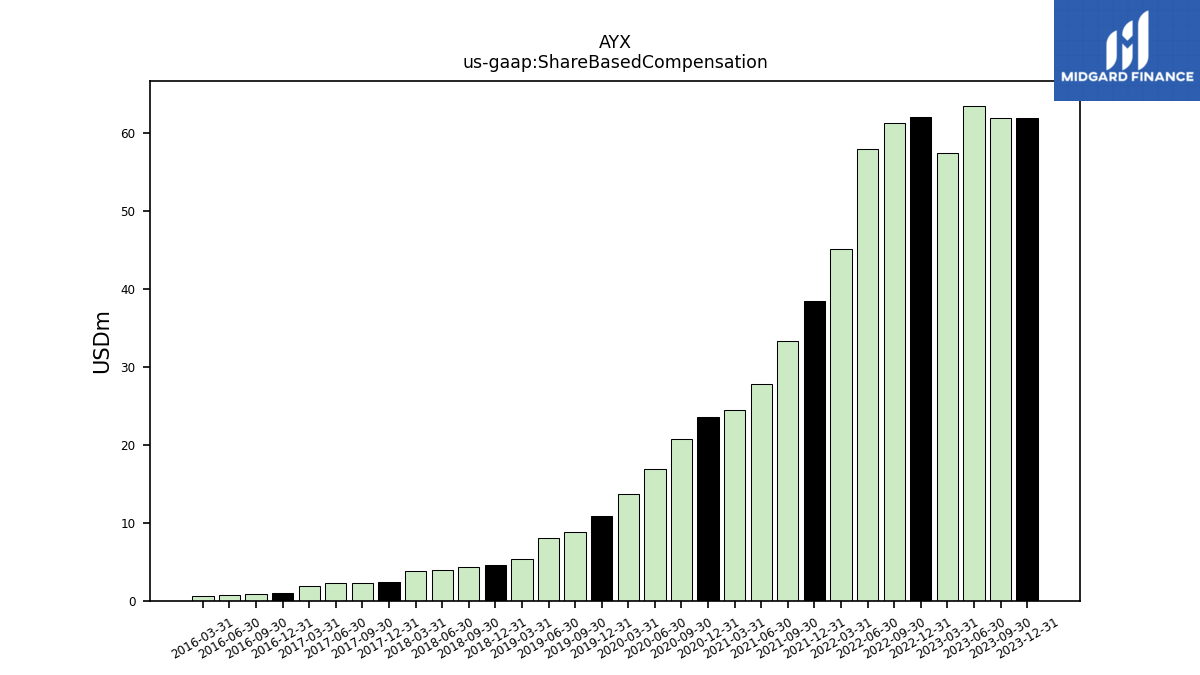
| Share Based Compensation | 62.00 | 62.00 | 63.53 | 57.47 | 62.09 | 61.31 | 57.96 | 45.16 | 38.51 | 33.33 | 27.79 | 24.44 | 23.63 | 20.70 | 16.92 | 13.66 | 10.93 | 8.84 | 8.02 | 5.33 | 4.58 | 4.38 | 3.89 | 3.79 | 2.43 | 2.28 | 2.23 | 1.94 | 0.95 | 0.91 | 0.79 | 0.64 |
| 2023-12-31 | 2023-09-30 | 2023-06-30 | 2023-03-31 | 2022-12-31 | 2022-09-30 | 2022-06-30 | 2022-03-31 | 2021-12-31 | 2021-09-30 | 2021-06-30 | 2021-03-31 | 2020-12-31 | 2020-09-30 | 2020-06-30 | 2020-03-31 | 2019-12-31 | 2019-09-30 | 2019-06-30 | 2019-03-31 | 2018-12-31 | 2018-09-30 | 2018-06-30 | 2018-03-31 | 2017-12-31 | 2017-09-30 | 2017-06-30 | 2017-03-31 | 2016-12-31 | 2016-09-30 | 2016-06-30 | 2016-03-31 | ||
|---|---|---|---|---|---|---|---|---|---|---|---|---|---|---|---|---|---|---|---|---|---|---|---|---|---|---|---|---|---|---|---|---|---|
| Net Cash Provided By Used In Investing Activities | 1.00 | 45.00 | 15.31 | 24.69 | 17.80 | 41.23 | 41.66 | -3.99 | -66.33 | -108.64 | 43.48 | 64.61 | 22.20 | -45.96 | -86.19 | -201.90 | -250.19 | -27.05 | -1.80 | 1.90 | -7.46 | -23.91 | -161.94 | -77.55 | 10.76 | -3.80 | -61.48 | -11.90 | 9.51 | 2.14 | 6.82 | -6.73 | |
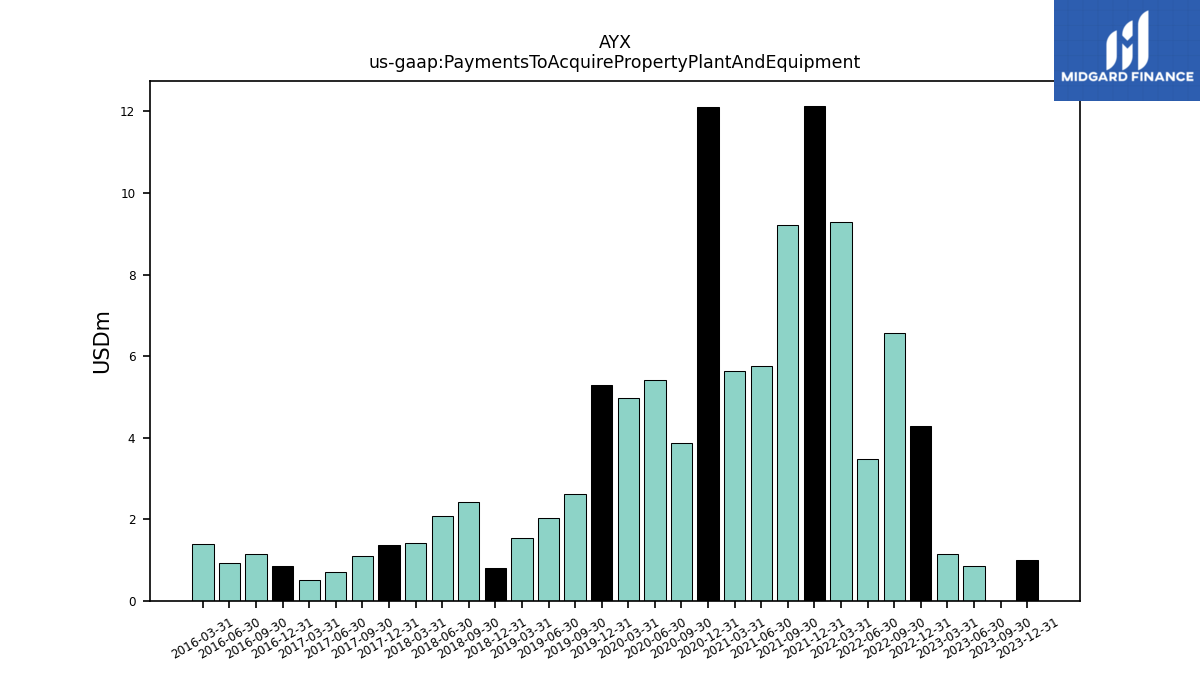
| Payments To Acquire Property Plant And Equipment | 1.00 | 0.00 | 0.86 | 1.14 | 4.28 | 6.57 | 3.48 | 9.30 | 12.14 | 9.21 | 5.77 | 5.64 | 12.10 | 3.87 | 5.41 | 4.98 | 5.29 | 2.61 | 2.02 | 1.53 | 0.80 | 2.42 | 2.09 | 1.42 | 1.37 | 1.09 | 0.70 | 0.51 | 0.85 | 1.14 | 0.92 | 1.40 |
| 2023-12-31 | 2023-09-30 | 2023-06-30 | 2023-03-31 | 2022-12-31 | 2022-09-30 | 2022-06-30 | 2022-03-31 | 2021-12-31 | 2021-09-30 | 2021-06-30 | 2021-03-31 | 2020-12-31 | 2020-09-30 | 2020-06-30 | 2020-03-31 | 2019-12-31 | 2019-09-30 | 2019-06-30 | 2019-03-31 | 2018-12-31 | 2018-09-30 | 2018-06-30 | 2018-03-31 | 2017-12-31 | 2017-09-30 | 2017-06-30 | 2017-03-31 | 2016-12-31 | 2016-09-30 | 2016-06-30 | 2016-03-31 | ||
|---|---|---|---|---|---|---|---|---|---|---|---|---|---|---|---|---|---|---|---|---|---|---|---|---|---|---|---|---|---|---|---|---|---|
| Net Cash Provided By Used In Financing Activities | -16.00 | -3.00 | -96.31 | 421.31 | -7.81 | -6.07 | -11.96 | -9.38 | -4.45 | 1.56 | -3.36 | -7.83 | -5.57 | 3.91 | -1.06 | 1.22 | -2.78 | 555.05 | -8.02 | 19.60 | -1.47 | 5.42 | 207.38 | 4.64 | 0.66 | 0.40 | 17.62 | 117.19 | 1.39 | -0.03 | -0.54 | 0.00 |
| 2023-12-31 | 2023-09-30 | 2023-06-30 | 2023-03-31 | 2022-12-31 | 2022-09-30 | 2022-06-30 | 2022-03-31 | 2021-12-31 | 2021-09-30 | 2021-06-30 | 2021-03-31 | 2020-12-31 | 2020-09-30 | 2020-06-30 | 2020-03-31 | 2019-12-31 | 2019-09-30 | 2019-06-30 | 2019-03-31 | 2018-12-31 | 2018-09-30 | 2018-06-30 | 2018-03-31 | 2017-12-31 | 2017-09-30 | 2017-06-30 | 2017-03-31 | 2016-12-31 | 2016-09-30 | 2016-06-30 | 2016-03-31 | ||
|---|---|---|---|---|---|---|---|---|---|---|---|---|---|---|---|---|---|---|---|---|---|---|---|---|---|---|---|---|---|---|---|---|---|
| Revenues | 351.00 | 232.00 | 188.00 | 199.09 | 301.08 | 215.71 | 180.62 | 157.94 | 173.81 | 123.50 | 120.07 | 118.76 | 160.53 | 129.72 | 96.23 | 108.83 | 156.45 | 103.40 | 82.04 | 76.02 | 89.15 | 54.18 | 46.80 | 42.82 | 38.59 | 34.16 | 30.32 | 28.55 | 24.96 | 22.46 | 19.97 | 18.39 | |
| Revenue From Contract With Customer Excluding Assessed Tax | 351.00 | 232.00 | 188.00 | 199.09 | 301.08 | 215.71 | 180.62 | 157.94 | 173.81 | 123.50 | 120.07 | 118.76 | 160.53 | 129.72 | 96.23 | 108.83 | 156.45 | 103.40 | 82.04 | 76.02 | 89.15 | 62.59 | 51.50 | 50.33 | 38.59 | 34.16 | 30.32 | 28.55 | 24.96 | 22.46 | 19.97 | 18.39 | |
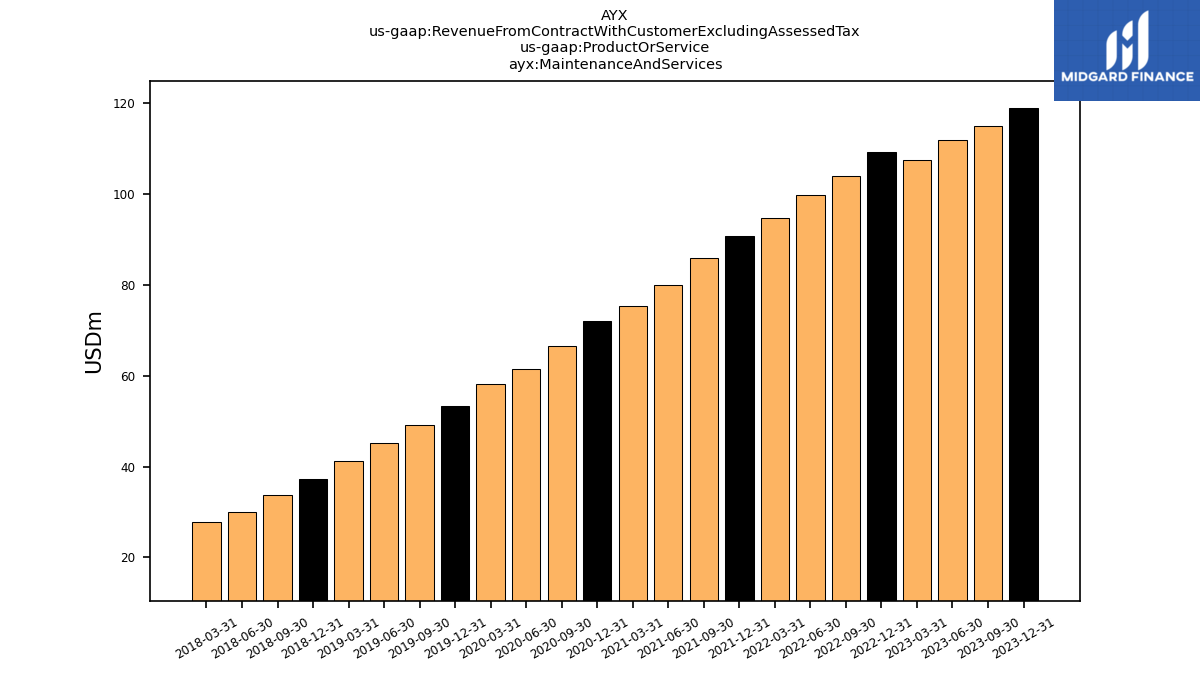
| Maintenance And Services | 119.00 | 115.00 | 112.00 | 107.56 | 109.29 | 104.12 | 99.89 | 94.85 | 90.70 | 86.02 | 80.05 | 75.40 | 72.03 | 66.57 | 61.59 | 58.09 | 53.24 | 49.06 | 45.20 | 41.21 | 37.26 | 33.77 | 30.02 | 27.85 | NA | NA | NA | NA | NA | NA | NA | NA | |
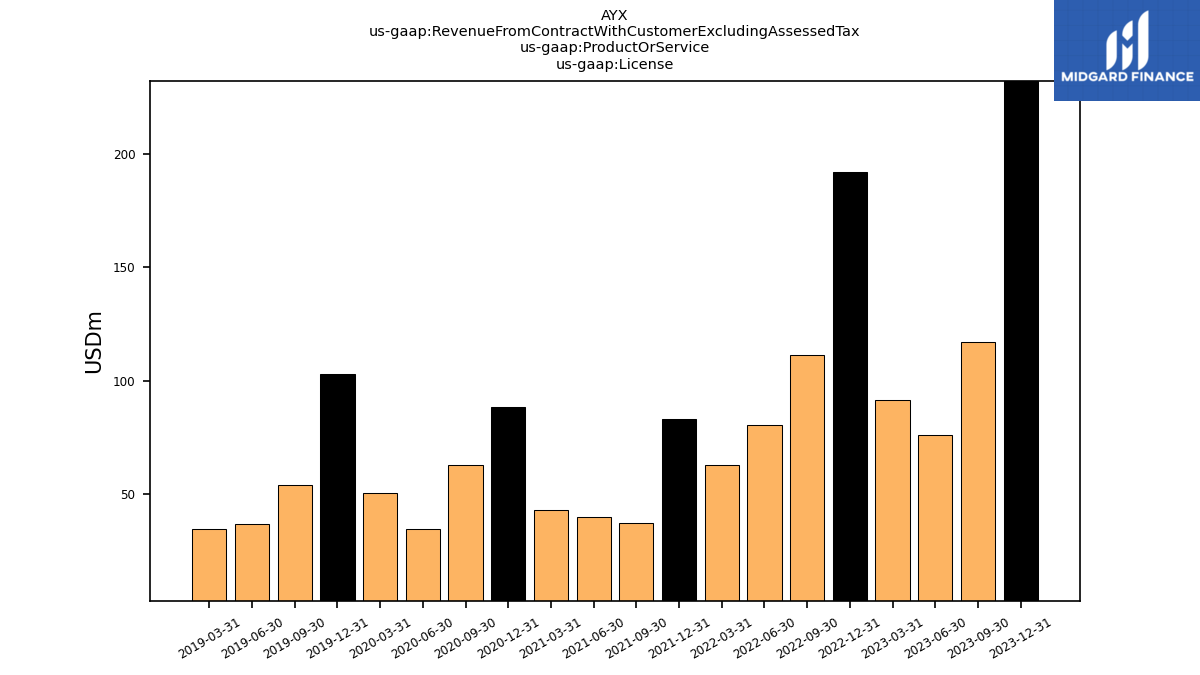
| License | 232.00 | 117.00 | 76.00 | 91.53 | 191.79 | 111.59 | 80.74 | 63.09 | 83.11 | 37.48 | 40.02 | 43.36 | 88.50 | 63.14 | 34.65 | 50.74 | 103.21 | 54.33 | 36.84 | 34.81 | NA | NA | NA | NA | NA | NA | NA | NA | NA | NA | NA | NA | |
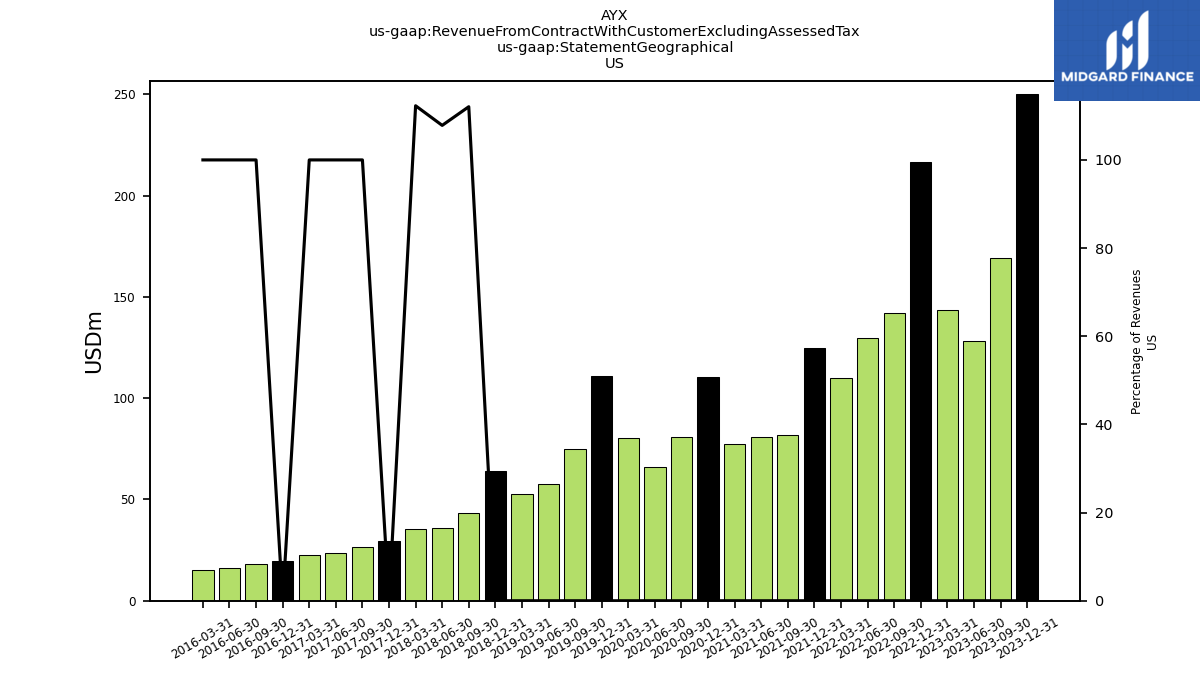
| US | 250.00 | 169.00 | 128.00 | 143.66 | 216.37 | 141.95 | 129.50 | 110.03 | 124.94 | 81.81 | 81.06 | 77.24 | 110.62 | 81.06 | 65.97 | 80.53 | 110.72 | 74.71 | 57.78 | 52.90 | 64.16 | 43.18 | 36.16 | 35.28 | 29.35 | 26.29 | 23.70 | 22.60 | 19.79 | 18.16 | 16.23 | 15.24 | |
| Non Us | 101.00 | 63.00 | 60.00 | 55.42 | 84.70 | 73.76 | 51.12 | 47.91 | 48.87 | 41.69 | 39.01 | 41.52 | 49.91 | 48.65 | 30.26 | 28.30 | 45.73 | 28.69 | 24.26 | 23.12 | 24.99 | 19.41 | 15.35 | 15.05 | 9.24 | 7.87 | 6.62 | 5.95 | 5.17 | 4.30 | 3.74 | 3.15 |