
| 2024-01-27 | 2023-10-28 | 2023-07-29 | 2023-04-30 | 2023-01-28 | 2022-10-29 | 2022-07-30 | 2022-04-30 | 2022-01-29 | 2021-10-30 | 2021-07-31 | 2021-04-30 | 2021-01-30 | 2020-10-31 | 2020-08-01 | 2020-04-30 | 2020-01-31 | 2020-01-25 | 2019-10-31 | 2019-10-26 | 2019-07-31 | 2019-07-27 | 2019-04-30 | 2019-01-31 | 2019-01-26 | 2018-10-31 | 2018-10-27 | 2018-07-31 | 2018-07-28 | 2018-04-30 | 2018-01-27 | 2017-10-28 | 2017-07-29 | 2017-04-30 | 2017-01-28 | 2016-10-29 | 2016-07-30 | 2016-04-30 | 2016-01-30 | 2015-10-31 | 2015-08-01 | 2015-04-30 | 2015-01-31 | 2014-11-01 | 2014-08-02 | 2014-04-30 | 2014-01-25 | 2013-10-26 | 2013-07-27 | 2013-04-30 | 2013-01-26 | 2012-10-27 | 2012-07-28 | 2012-04-30 | 2012-01-28 | 2011-10-29 | 2011-07-30 | 2011-04-30 | 2011-01-29 | 2010-10-30 | 2010-07-31 | ||
|---|---|---|---|---|---|---|---|---|---|---|---|---|---|---|---|---|---|---|---|---|---|---|---|---|---|---|---|---|---|---|---|---|---|---|---|---|---|---|---|---|---|---|---|---|---|---|---|---|---|---|---|---|---|---|---|---|---|---|---|---|---|---|
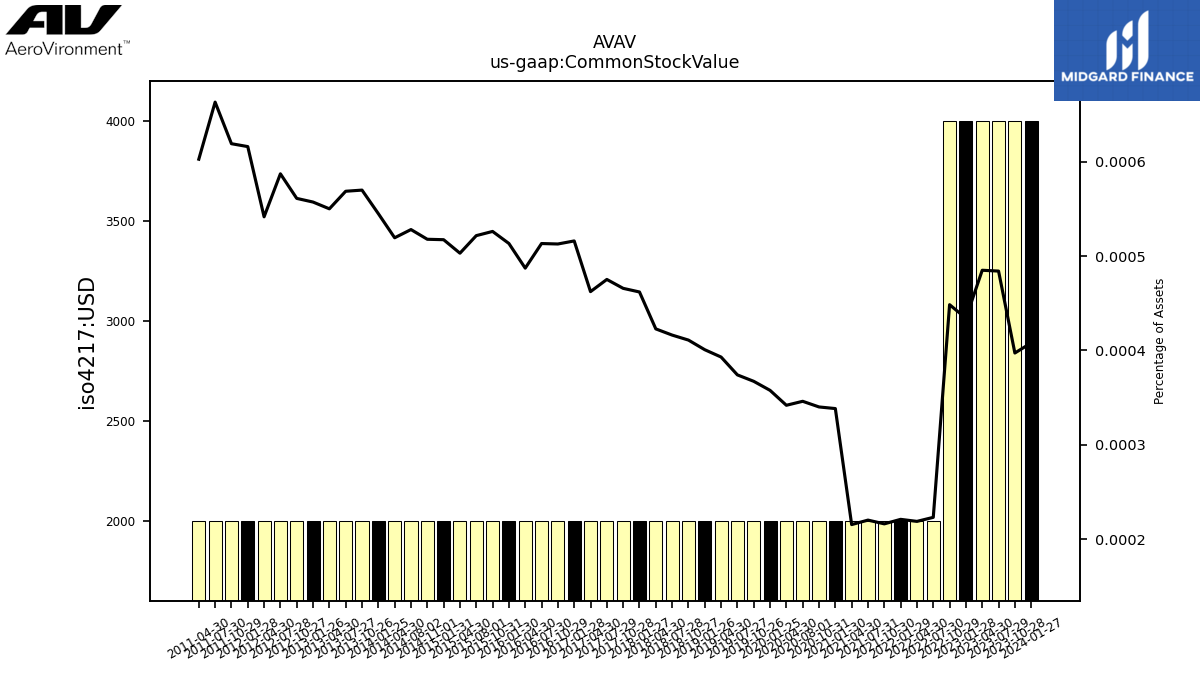
| Common Stock Value | 0.00 | 0.00 | 0.00 | 0.00 | 0.00 | 0.00 | 0.00 | 0.00 | 0.00 | 0.00 | 0.00 | 0.00 | 0.00 | 0.00 | 0.00 | 0.00 | NA | 0.00 | NA | 0.00 | NA | 0.00 | 0.00 | NA | 0.00 | NA | 0.00 | NA | 0.00 | 0.00 | 0.00 | 0.00 | 0.00 | 0.00 | 0.00 | 0.00 | 0.00 | 0.00 | 0.00 | 0.00 | 0.00 | 0.00 | 0.00 | 0.00 | 0.00 | 0.00 | 0.00 | 0.00 | 0.00 | 0.00 | 0.00 | 0.00 | 0.00 | 0.00 | 0.00 | 0.00 | 0.00 | 0.00 | NA | NA | NA | |
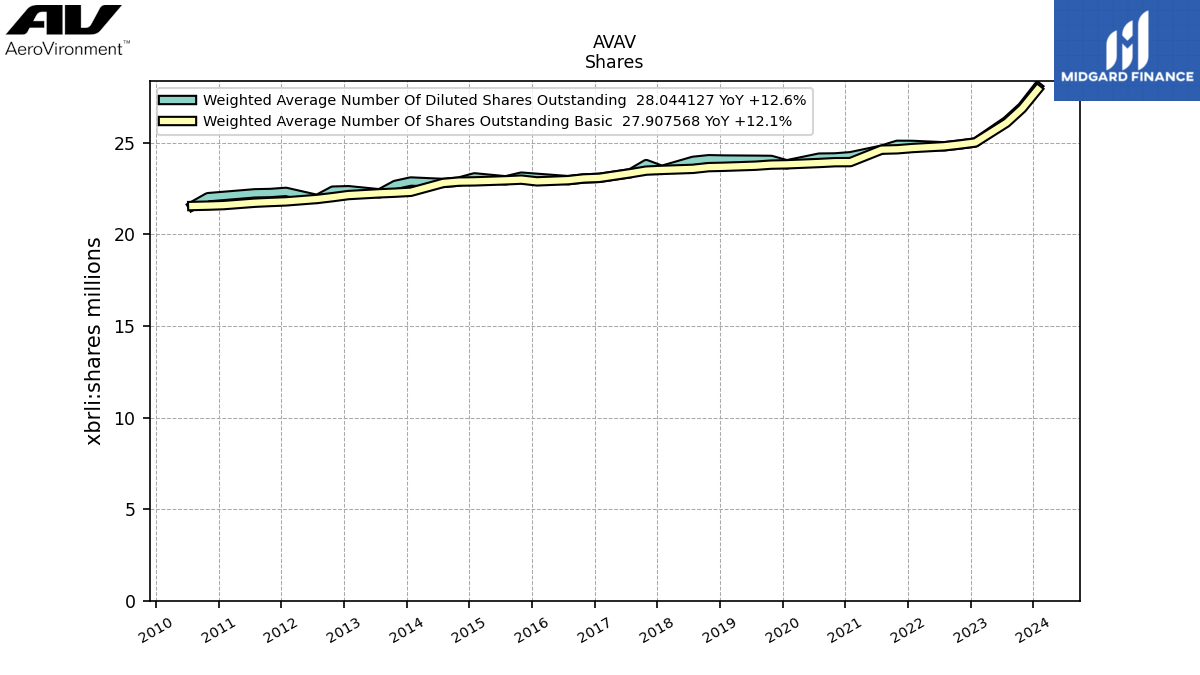
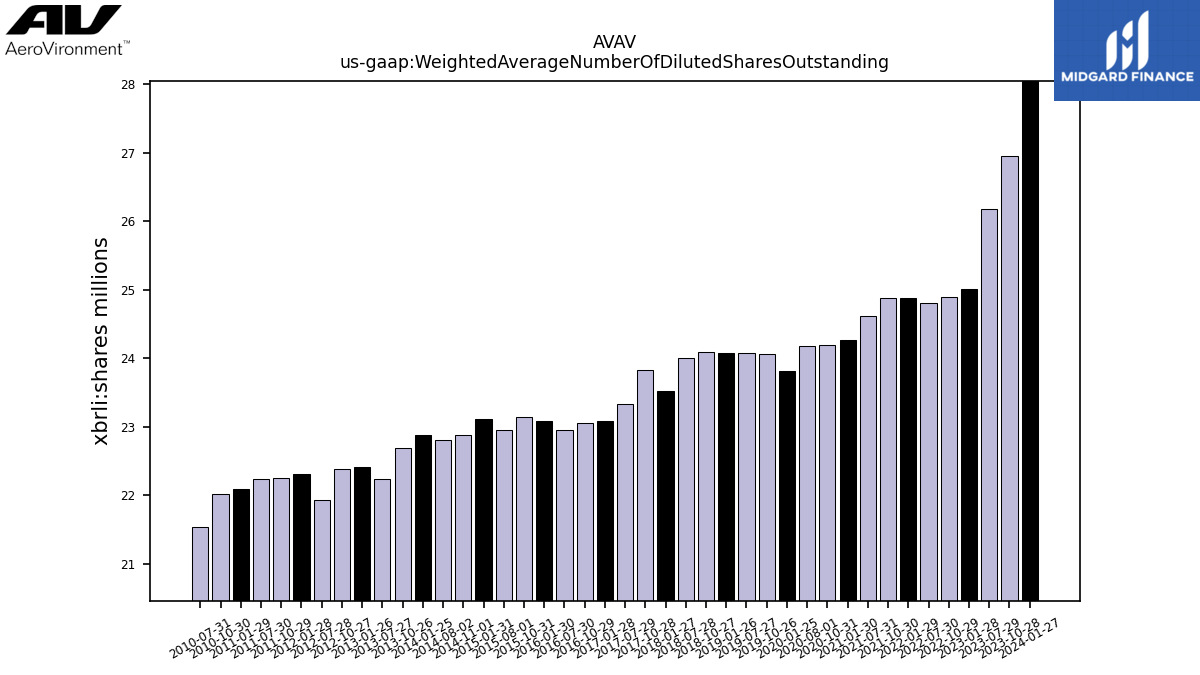
| Weighted Average Number Of Diluted Shares Outstanding | 28.04 | 26.96 | 26.18 | NA | 25.01 | 24.90 | 24.80 | NA | 24.88 | 24.89 | 24.62 | NA | 24.26 | 24.20 | 24.19 | NA | NA | 23.82 | NA | 24.06 | NA | 24.07 | NA | NA | 24.08 | NA | 24.10 | NA | 24.01 | NA | 23.52 | 23.83 | 23.34 | NA | 23.08 | 23.05 | 22.96 | NA | 23.08 | 23.15 | 22.95 | NA | 23.11 | 22.88 | 22.80 | NA | 22.88 | 22.70 | 22.24 | NA | 22.41 | 22.38 | 21.93 | NA | 22.32 | 22.26 | 22.24 | NA | 22.10 | 22.03 | 21.55 | |
| Weighted Average Number Of Shares Outstanding Basic | 27.91 | 26.87 | 26.09 | NA | 25.01 | 24.90 | 24.80 | NA | 24.71 | 24.64 | 24.62 | NA | 23.94 | 23.94 | 23.89 | NA | NA | 23.82 | NA | 23.80 | NA | 23.75 | NA | NA | 23.69 | NA | 23.67 | NA | 23.57 | NA | 23.52 | 23.48 | 23.34 | NA | 23.08 | 23.05 | 22.96 | NA | 22.89 | 22.99 | 22.95 | NA | 22.89 | 22.88 | 22.80 | NA | 22.32 | 22.27 | 22.24 | NA | 22.14 | 22.03 | 21.93 | NA | 21.80 | 21.76 | 21.72 | NA | 21.59 | 21.57 | 21.55 | |
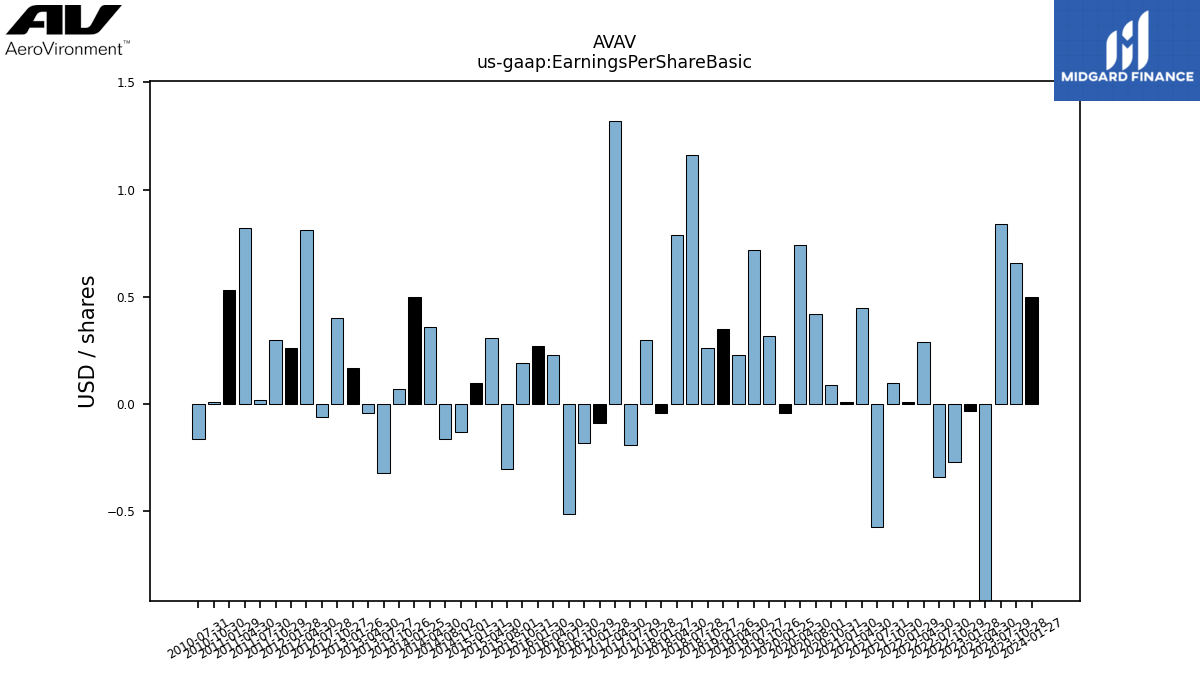
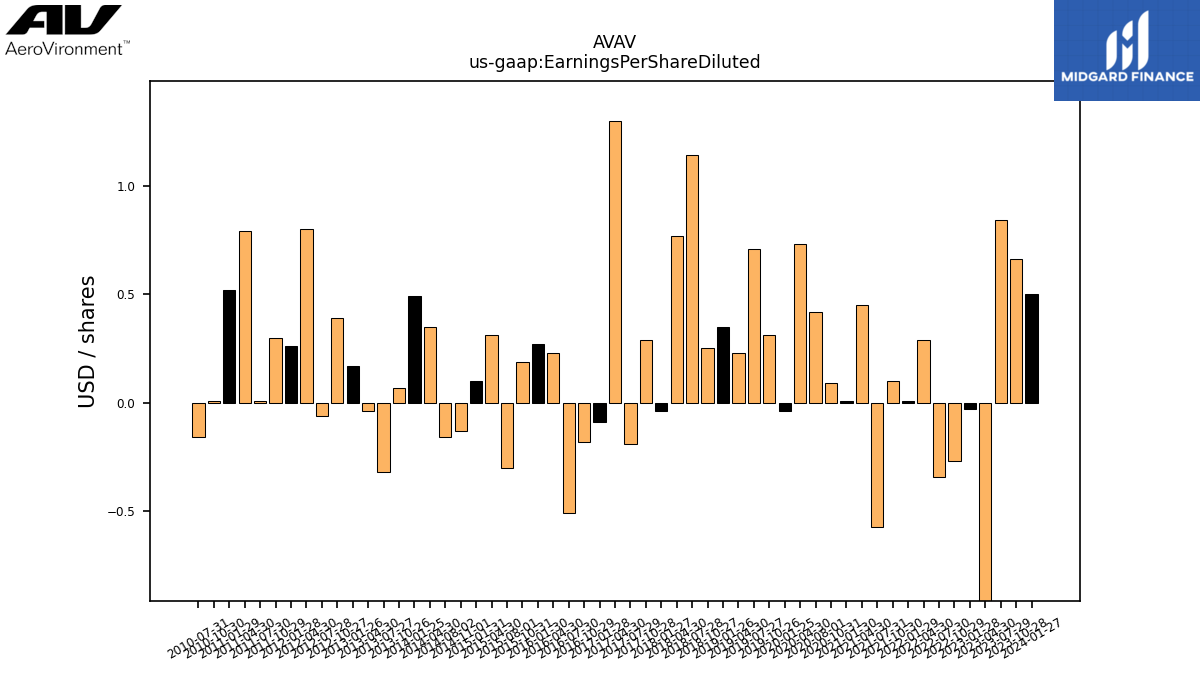
| Earnings Per Share Basic | 0.50 | 0.66 | 0.84 | -6.41 | -0.03 | -0.27 | -0.34 | 0.29 | 0.01 | 0.10 | -0.57 | 0.45 | 0.01 | 0.09 | 0.42 | 0.74 | NA | -0.04 | NA | 0.32 | NA | 0.72 | 0.23 | NA | 0.35 | NA | 0.26 | NA | 1.16 | 0.79 | -0.04 | 0.30 | -0.19 | 1.32 | -0.09 | -0.18 | -0.51 | 0.23 | 0.27 | 0.19 | -0.30 | 0.31 | 0.10 | -0.13 | -0.16 | 0.36 | 0.50 | 0.07 | -0.32 | -0.04 | 0.17 | 0.40 | -0.06 | 0.81 | 0.26 | 0.30 | 0.02 | 0.82 | 0.53 | 0.01 | -0.16 | |
| Earnings Per Share Diluted | 0.50 | 0.66 | 0.84 | -6.41 | -0.03 | -0.27 | -0.34 | 0.29 | 0.01 | 0.10 | -0.57 | 0.45 | 0.01 | 0.09 | 0.42 | 0.73 | NA | -0.04 | NA | 0.31 | NA | 0.71 | 0.23 | NA | 0.35 | NA | 0.25 | NA | 1.14 | 0.77 | -0.04 | 0.29 | -0.19 | 1.30 | -0.09 | -0.18 | -0.51 | 0.23 | 0.27 | 0.19 | -0.30 | 0.31 | 0.10 | -0.13 | -0.16 | 0.35 | 0.49 | 0.07 | -0.32 | -0.04 | 0.17 | 0.39 | -0.06 | 0.80 | 0.26 | 0.30 | 0.01 | 0.79 | 0.52 | 0.01 | -0.16 |
| 2024-01-27 | 2023-10-28 | 2023-07-29 | 2023-04-30 | 2023-01-28 | 2022-10-29 | 2022-07-30 | 2022-04-30 | 2022-01-29 | 2021-10-30 | 2021-07-31 | 2021-04-30 | 2021-01-30 | 2020-10-31 | 2020-08-01 | 2020-04-30 | 2020-01-31 | 2020-01-25 | 2019-10-31 | 2019-10-26 | 2019-07-31 | 2019-07-27 | 2019-04-30 | 2019-01-31 | 2019-01-26 | 2018-10-31 | 2018-10-27 | 2018-07-31 | 2018-07-28 | 2018-04-30 | 2018-01-27 | 2017-10-28 | 2017-07-29 | 2017-04-30 | 2017-01-28 | 2016-10-29 | 2016-07-30 | 2016-04-30 | 2016-01-30 | 2015-10-31 | 2015-08-01 | 2015-04-30 | 2015-01-31 | 2014-11-01 | 2014-08-02 | 2014-04-30 | 2014-01-25 | 2013-10-26 | 2013-07-27 | 2013-04-30 | 2013-01-26 | 2012-10-27 | 2012-07-28 | 2012-04-30 | 2012-01-28 | 2011-10-29 | 2011-07-30 | 2011-04-30 | 2011-01-29 | 2010-10-30 | 2010-07-31 | ||
|---|---|---|---|---|---|---|---|---|---|---|---|---|---|---|---|---|---|---|---|---|---|---|---|---|---|---|---|---|---|---|---|---|---|---|---|---|---|---|---|---|---|---|---|---|---|---|---|---|---|---|---|---|---|---|---|---|---|---|---|---|---|---|
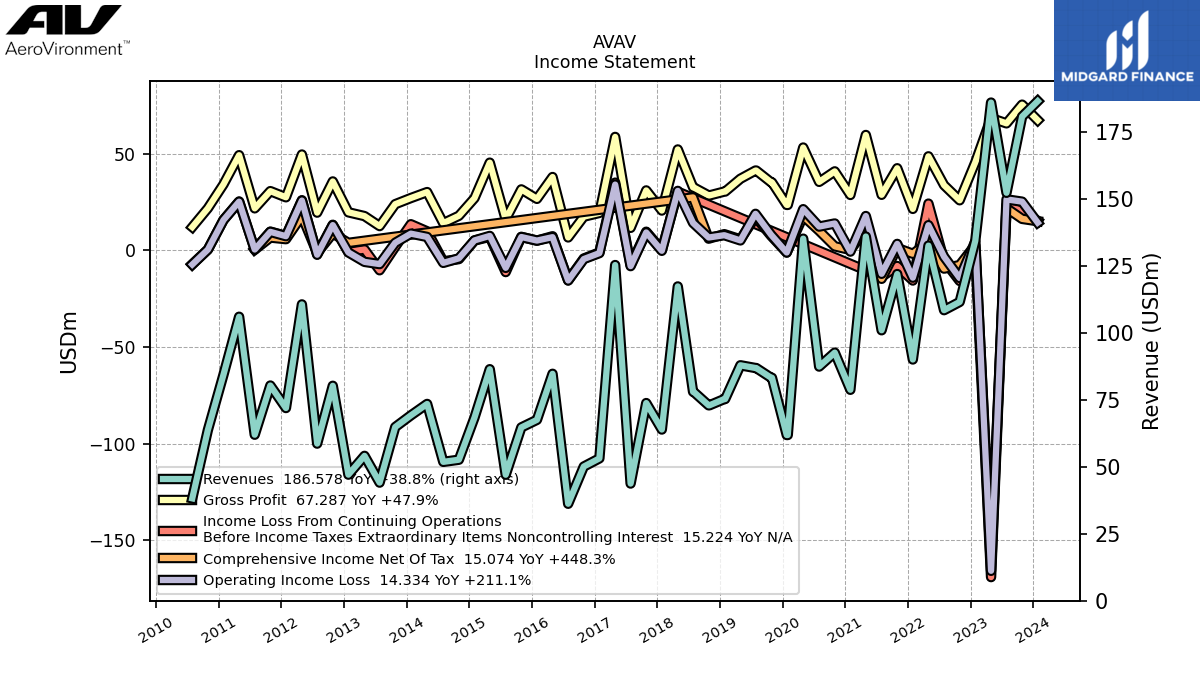
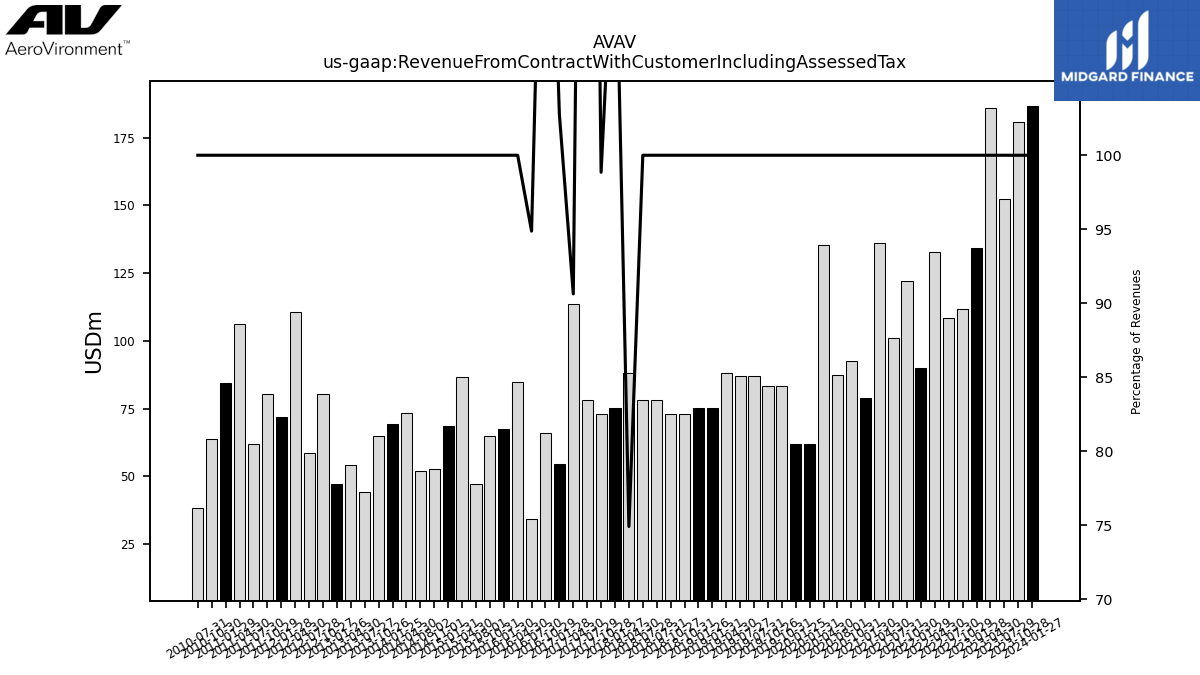
| Revenue From Contract With Customer Including Assessed Tax | 186.58 | 180.82 | 152.35 | 186.04 | 134.40 | 111.58 | 108.52 | 132.62 | 90.09 | 122.01 | 101.01 | 136.01 | 78.78 | 92.67 | 87.45 | 135.22 | 61.89 | 61.89 | 83.27 | 83.27 | 86.91 | 86.91 | 87.93 | 75.32 | 75.32 | 72.98 | 72.98 | 78.04 | 78.04 | 87.93 | 75.32 | 72.98 | 78.04 | 113.63 | 54.63 | 65.80 | 34.36 | 84.76 | 67.56 | 64.73 | 47.05 | 86.47 | 68.40 | 52.66 | 51.87 | 73.50 | 69.22 | 64.87 | 44.12 | 54.11 | 47.09 | 80.28 | 58.68 | 110.67 | 71.96 | 80.37 | 62.00 | 106.06 | 84.43 | 63.78 | 38.23 | |
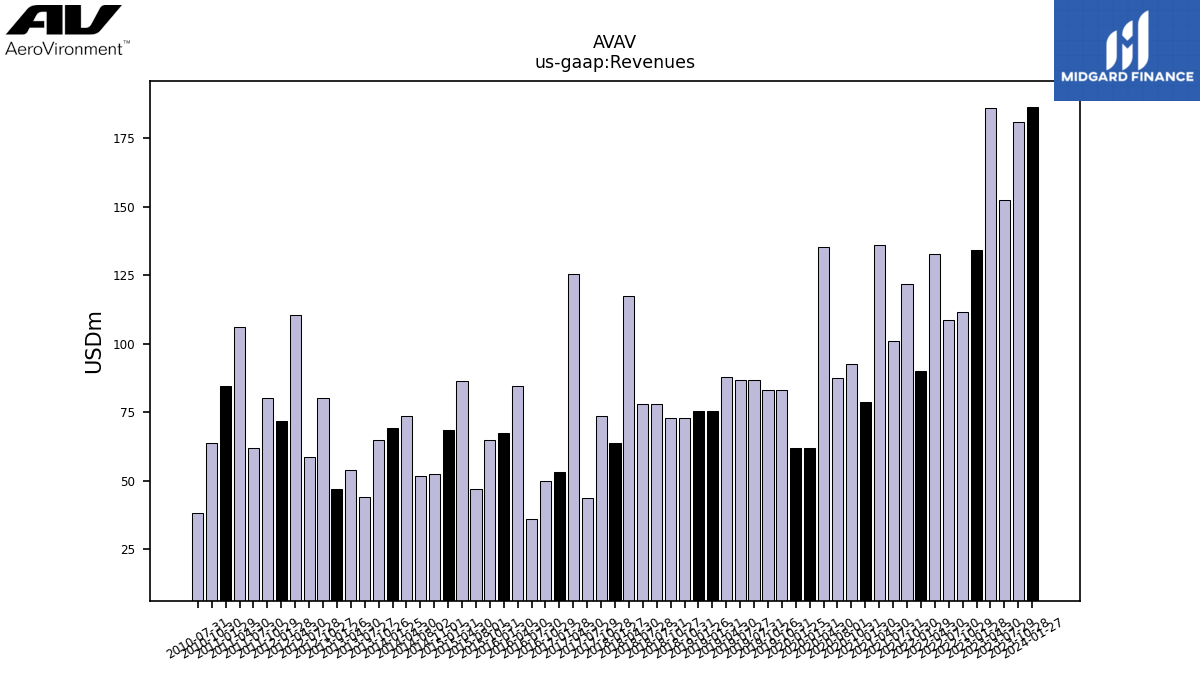
| Revenues | 186.58 | 180.82 | 152.35 | 186.04 | 134.40 | 111.58 | 108.52 | 132.62 | 90.09 | 122.01 | 101.01 | 136.01 | 78.78 | 92.67 | 87.45 | 135.22 | 61.89 | 61.89 | 83.27 | 83.27 | 86.91 | 86.91 | 87.93 | 75.32 | 75.32 | 72.98 | 72.98 | 78.04 | 78.04 | 117.38 | 63.94 | 73.83 | 43.76 | 125.38 | 53.16 | 50.12 | 36.22 | 84.76 | 67.56 | 64.73 | 47.05 | 86.47 | 68.40 | 52.66 | 51.87 | 73.50 | 69.22 | 64.87 | 44.12 | 54.11 | 47.09 | 80.28 | 58.68 | 110.67 | 71.96 | 80.37 | 62.00 | 106.06 | 84.43 | 63.78 | 38.23 | |
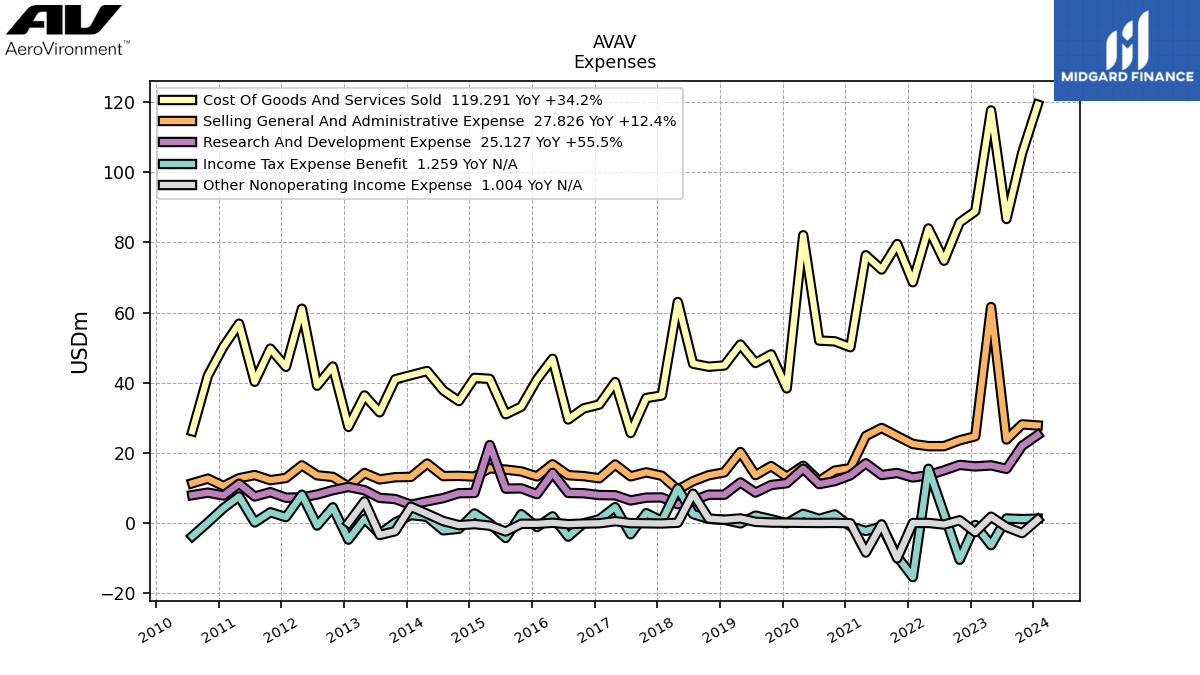
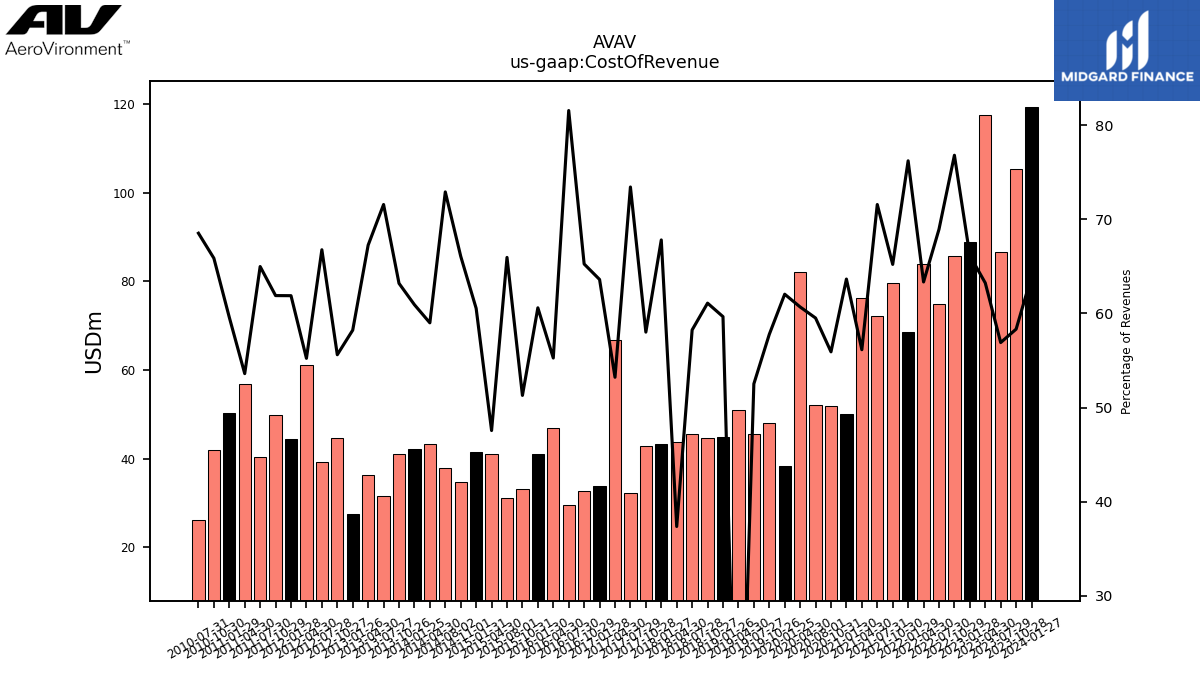
| Cost Of Revenue | 119.29 | 105.47 | 86.69 | 117.64 | 88.89 | 85.69 | 74.80 | 84.00 | 68.66 | 79.55 | 72.29 | 76.36 | 50.14 | 51.81 | 52.04 | 82.06 | NA | 38.40 | NA | 48.10 | NA | 45.64 | 50.91 | NA | 44.93 | NA | 44.58 | NA | 45.45 | 43.85 | 43.35 | 42.83 | 32.13 | 66.72 | 33.81 | 32.70 | 29.54 | 46.84 | 40.94 | 33.20 | 31.03 | 41.12 | 41.40 | 34.79 | 37.81 | 43.36 | 42.17 | 40.99 | 31.57 | 36.39 | 27.41 | 44.64 | 39.17 | 61.12 | 44.53 | 49.74 | 40.28 | 56.85 | 50.30 | 42.01 | 26.19 | |
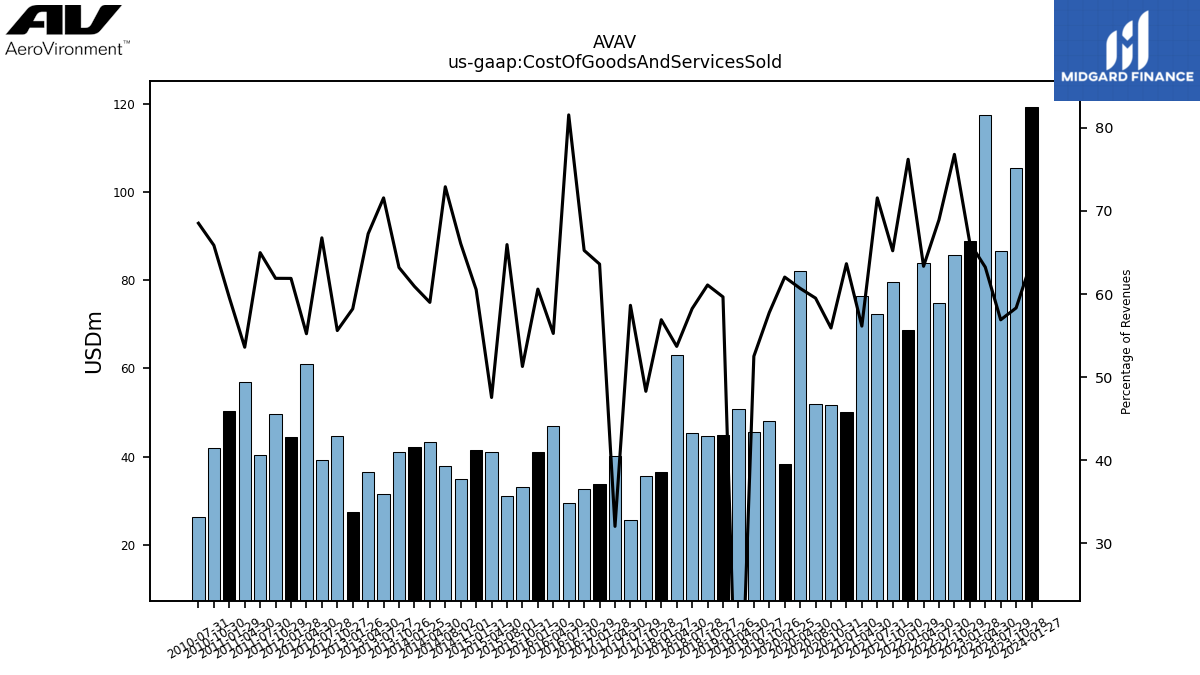
| Cost Of Goods And Services Sold | 119.29 | 105.47 | 86.69 | 117.64 | 88.89 | 85.69 | 74.80 | 84.00 | 68.66 | 79.55 | 72.29 | 76.36 | 50.14 | 51.81 | 52.04 | 82.06 | NA | 38.40 | NA | 48.10 | NA | 45.64 | 50.91 | NA | 44.93 | NA | 44.58 | NA | 45.45 | 63.03 | 36.38 | 35.66 | 25.66 | 40.19 | 33.81 | 32.70 | 29.54 | 46.84 | 40.94 | 33.20 | 31.03 | 41.12 | 41.40 | 34.79 | 37.81 | 43.36 | 42.17 | 40.99 | 31.57 | 36.39 | 27.41 | 44.64 | 39.17 | 61.12 | 44.53 | 49.74 | 40.28 | 56.85 | 50.30 | 42.01 | 26.19 | |
| Gross Profit | 67.29 | 75.35 | 65.66 | 68.40 | 45.51 | 25.89 | 33.71 | 48.62 | 21.44 | 42.45 | 28.72 | 59.66 | 28.64 | 40.85 | 35.41 | 53.17 | 23.50 | 23.50 | 35.17 | 35.17 | 41.27 | 41.27 | 37.02 | 30.39 | 30.39 | 28.40 | 28.40 | 32.59 | 32.59 | 52.18 | 20.59 | 31.00 | 11.63 | 58.66 | 19.35 | 17.42 | 6.68 | 37.92 | 26.62 | 31.53 | 16.02 | 45.35 | 26.99 | 17.87 | 14.05 | 30.14 | 27.05 | 23.88 | 12.54 | 17.72 | 19.67 | 35.64 | 19.50 | 49.55 | 27.43 | 30.63 | 21.71 | 49.21 | 34.13 | 21.77 | 12.04 | |
| Research And Development Expense | 25.13 | 22.02 | 15.47 | 16.46 | 16.16 | 16.59 | 15.04 | 13.67 | 13.01 | 14.30 | 13.71 | 17.05 | 13.63 | 11.98 | 11.10 | 15.53 | NA | 11.38 | NA | 10.86 | NA | 8.71 | 11.60 | NA | 8.09 | NA | 8.11 | NA | 6.43 | 5.39 | 7.31 | 7.27 | 6.46 | 7.94 | 7.99 | 8.52 | 8.60 | 14.32 | 8.25 | 9.90 | 9.83 | 22.26 | 8.58 | 8.53 | 7.12 | 6.22 | 5.24 | 6.86 | 7.19 | 9.39 | 10.31 | 9.39 | 8.14 | 7.34 | 7.24 | 8.82 | 7.59 | 11.24 | 7.87 | 8.69 | 7.97 | |
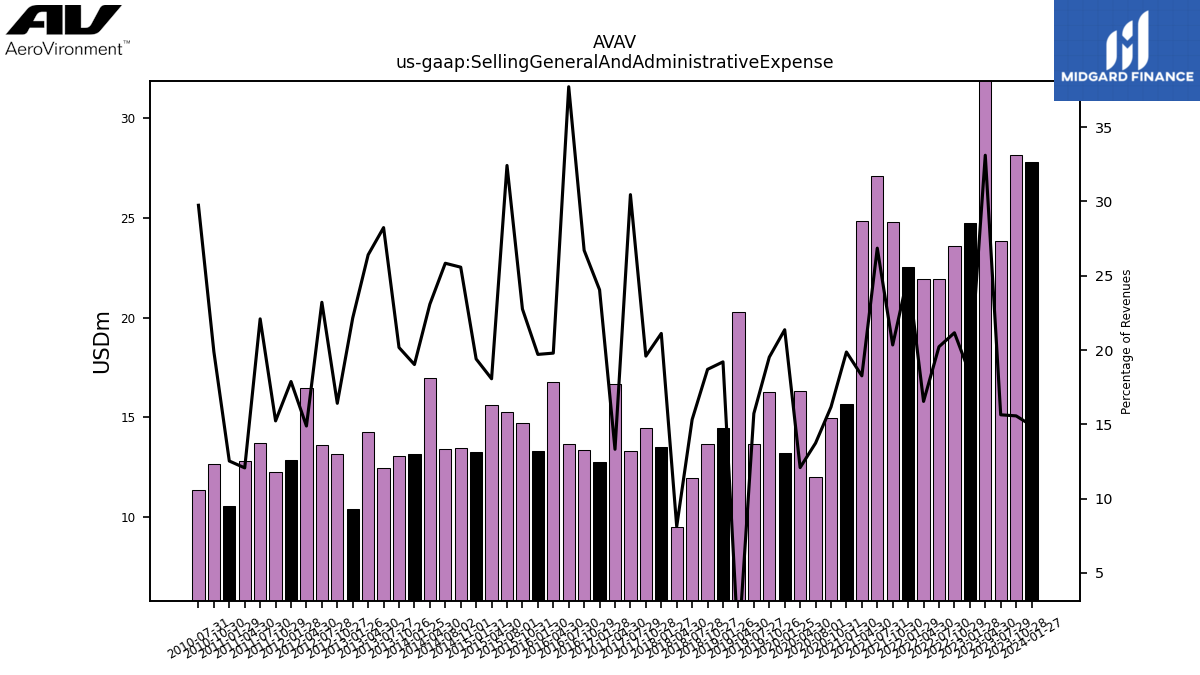
| Selling General And Administrative Expense | 27.83 | 28.15 | 23.83 | 61.60 | 24.75 | 23.61 | 21.94 | 21.94 | 22.55 | 24.82 | 27.13 | 24.84 | 15.65 | 14.98 | 12.01 | 16.34 | NA | 13.22 | NA | 16.25 | NA | 13.67 | 20.28 | NA | 14.46 | NA | 13.65 | NA | 11.96 | 9.53 | 13.50 | 14.46 | 13.33 | 16.70 | 12.79 | 13.39 | 13.66 | 16.77 | 13.31 | 14.73 | 15.26 | 15.62 | 13.27 | 13.47 | 13.40 | 16.97 | 13.17 | 13.08 | 12.46 | 14.29 | 10.43 | 13.18 | 13.62 | 16.47 | 12.87 | 12.24 | 13.70 | 12.80 | 10.58 | 12.69 | 11.37 | |
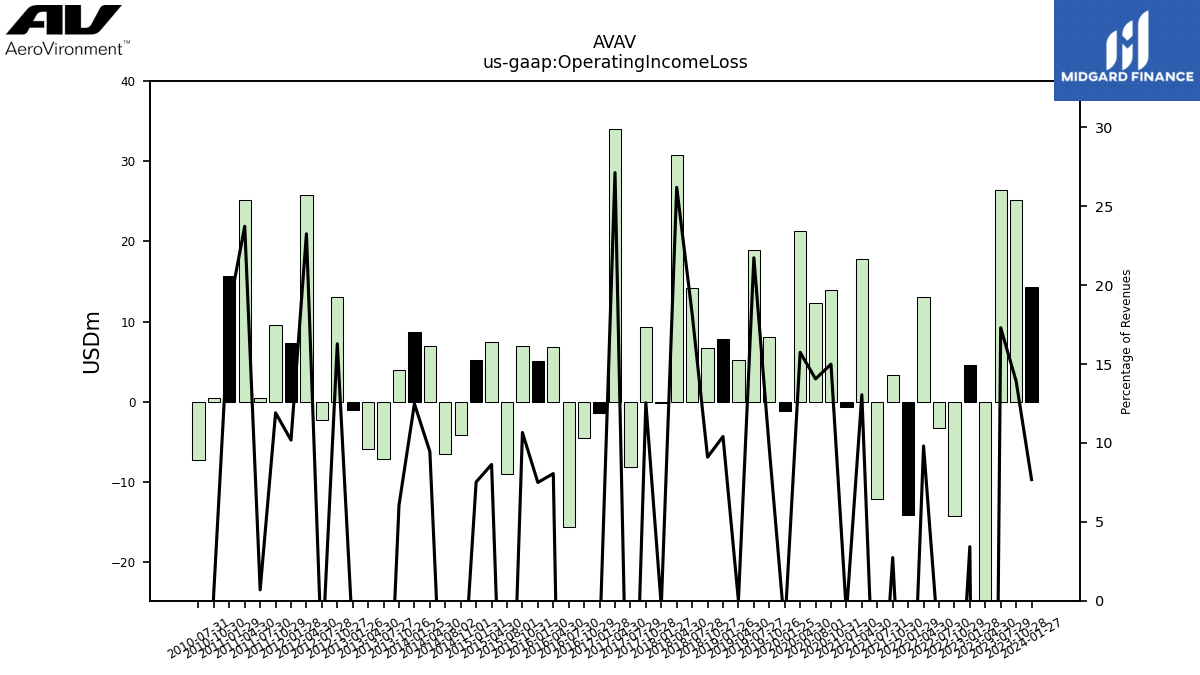
| Operating Income Loss | 14.33 | 25.18 | 26.37 | -165.68 | 4.61 | -14.31 | -3.27 | 13.01 | -14.13 | 3.34 | -12.11 | 17.76 | -0.64 | 13.90 | 12.30 | 21.30 | NA | -1.11 | NA | 8.05 | NA | 18.89 | 5.14 | NA | 7.84 | NA | 6.64 | NA | 14.20 | 30.75 | -0.23 | 9.26 | -8.16 | 34.02 | -1.43 | -4.49 | -15.58 | 6.83 | 5.07 | 6.90 | -9.06 | 7.47 | 5.15 | -4.13 | -6.47 | 6.95 | 8.64 | 3.93 | -7.10 | -5.95 | -1.07 | 13.07 | -2.25 | 25.74 | 7.33 | 9.57 | 0.43 | 25.18 | 15.68 | 0.40 | -7.31 | |
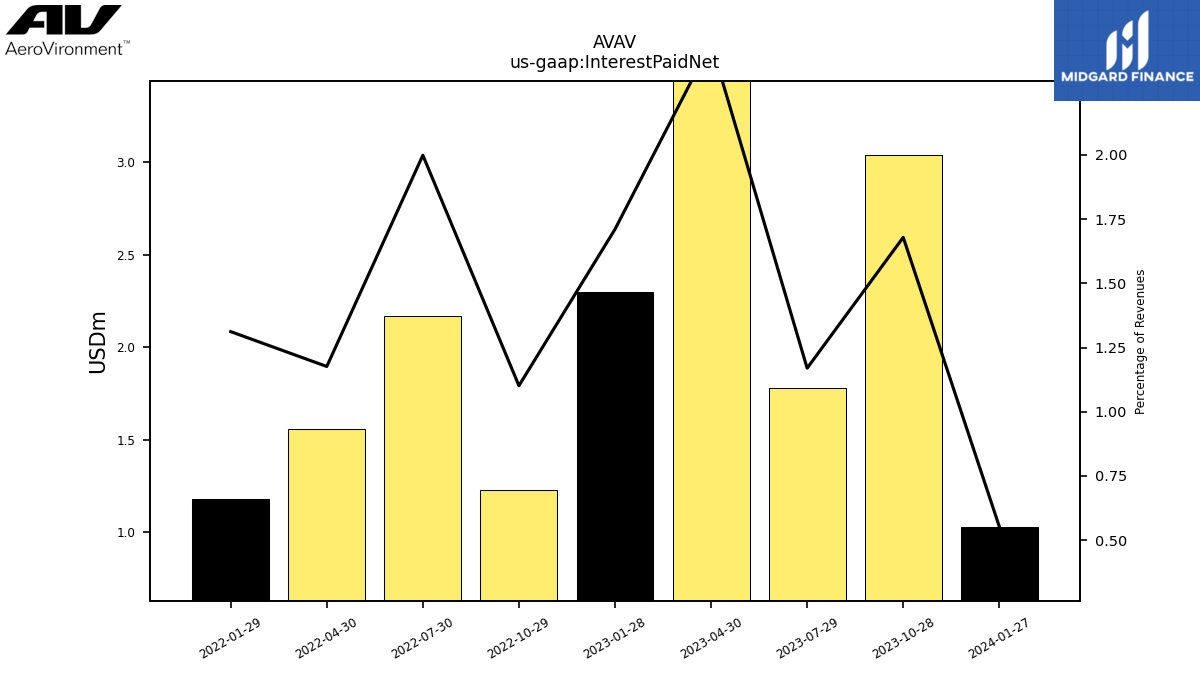
| Interest Paid Net | 1.03 | 3.04 | 1.78 | 4.53 | 2.30 | 1.23 | 2.17 | 1.56 | 1.18 | NA | NA | NA | NA | NA | NA | NA | NA | NA | NA | NA | NA | NA | NA | NA | NA | NA | NA | NA | NA | NA | NA | NA | NA | NA | NA | NA | NA | NA | NA | NA | NA | NA | NA | NA | NA | NA | NA | NA | NA | NA | NA | NA | NA | NA | NA | NA | NA | NA | NA | NA | NA | |
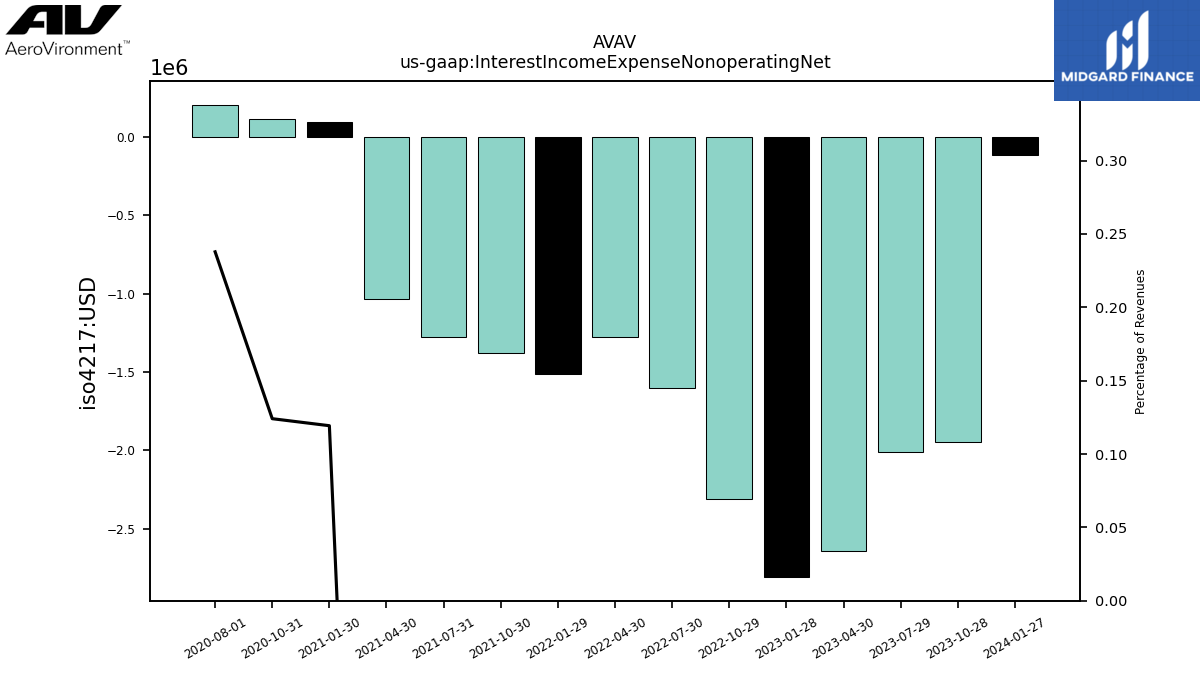
| Interest Income Expense Nonoperating Net | -0.11 | -1.95 | -2.01 | -2.65 | -2.81 | -2.31 | -1.60 | -1.28 | -1.51 | -1.38 | -1.27 | -1.03 | 0.09 | 0.12 | 0.21 | NA | NA | NA | NA | NA | NA | NA | NA | NA | NA | NA | NA | NA | NA | NA | NA | NA | NA | NA | NA | NA | NA | NA | NA | NA | NA | NA | NA | NA | NA | NA | NA | NA | NA | NA | NA | NA | NA | NA | NA | NA | NA | NA | NA | NA | NA | |
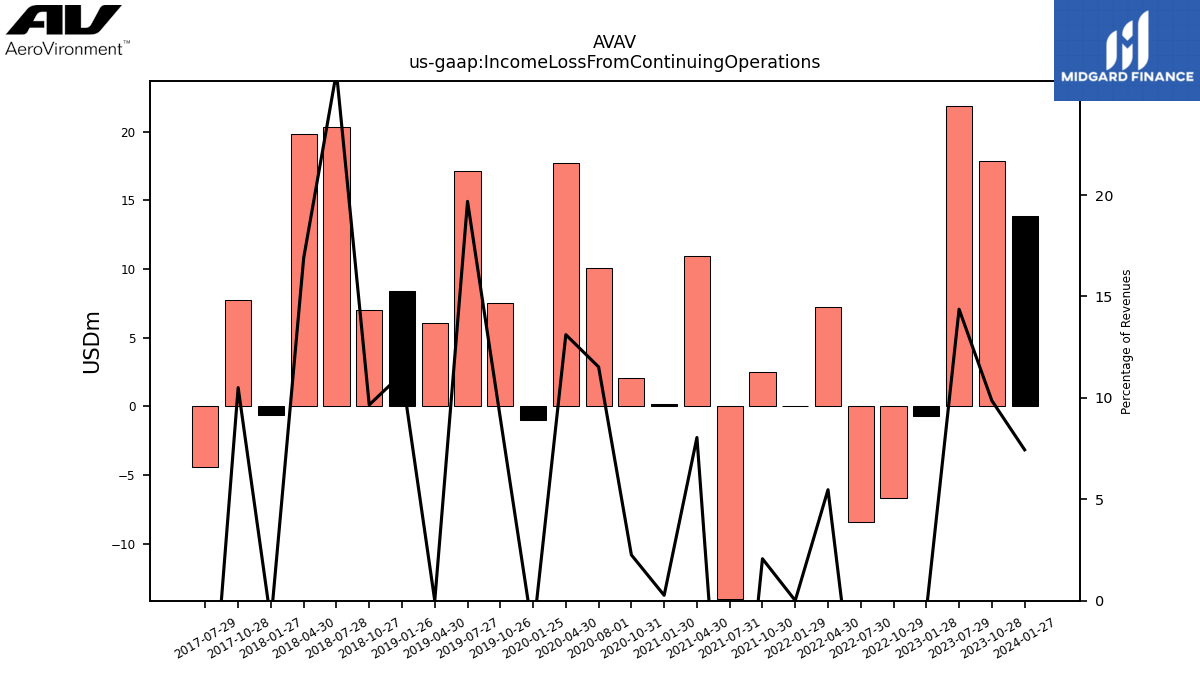
| Income Loss From Continuing Operations | 13.88 | 17.84 | 21.89 | NA | -0.68 | -6.67 | -8.39 | 7.26 | 0.01 | 2.52 | -13.98 | 10.95 | 0.21 | 2.09 | 10.08 | 17.74 | NA | -1.01 | NA | 7.50 | NA | 17.11 | 6.10 | NA | 8.43 | NA | 7.05 | NA | 20.34 | 19.84 | -0.65 | 7.76 | -4.37 | NA | NA | NA | NA | NA | NA | NA | NA | NA | NA | NA | NA | NA | NA | NA | NA | NA | NA | NA | NA | NA | NA | NA | NA | NA | NA | NA | NA | |
| Income Tax Expense Benefit | 1.26 | 1.14 | 1.31 | -6.28 | -0.53 | -10.46 | 2.61 | 15.49 | -15.40 | -9.51 | -0.96 | -2.23 | -0.92 | 2.49 | 1.21 | 2.65 | NA | -0.04 | NA | 1.11 | NA | 2.13 | -0.08 | NA | 0.95 | NA | 1.21 | NA | 2.57 | 9.90 | 0.63 | 2.83 | -3.18 | 4.56 | 1.10 | -0.05 | -3.86 | 1.92 | -1.13 | 2.56 | -4.25 | -0.09 | 2.76 | -1.62 | -2.06 | 1.80 | 2.30 | 0.17 | -3.08 | 1.26 | -4.72 | 4.50 | -0.69 | 8.10 | 1.71 | 3.09 | 0.18 | 7.60 | 4.27 | 0.18 | -3.74 | |
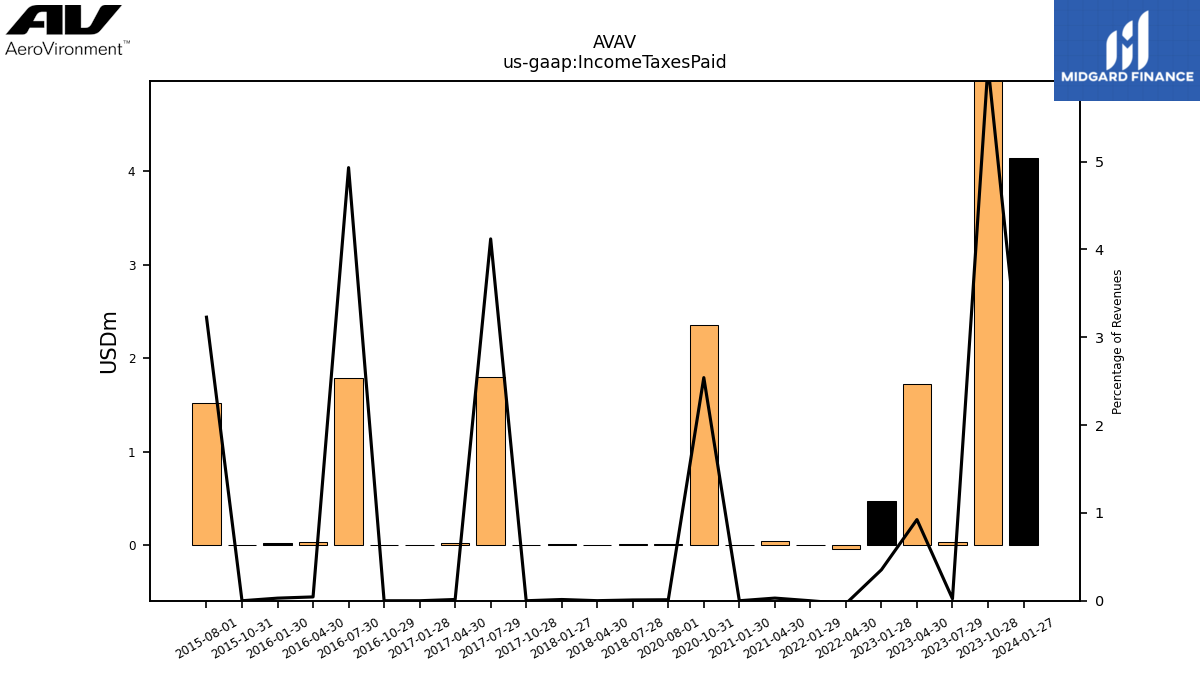
| Income Taxes Paid | 4.14 | 11.02 | 0.04 | 1.72 | 0.47 | NA | NA | -0.04 | 0.00 | NA | NA | 0.04 | 0.00 | 2.35 | 0.01 | NA | NA | NA | NA | NA | NA | NA | NA | NA | NA | NA | NA | NA | 0.01 | 0.00 | 0.01 | 0.00 | 1.80 | 0.02 | 0.00 | 0.00 | 1.79 | 0.04 | 0.02 | 0.00 | 1.52 | NA | NA | NA | NA | NA | NA | NA | NA | NA | NA | NA | NA | NA | NA | NA | NA | NA | NA | NA | NA | |
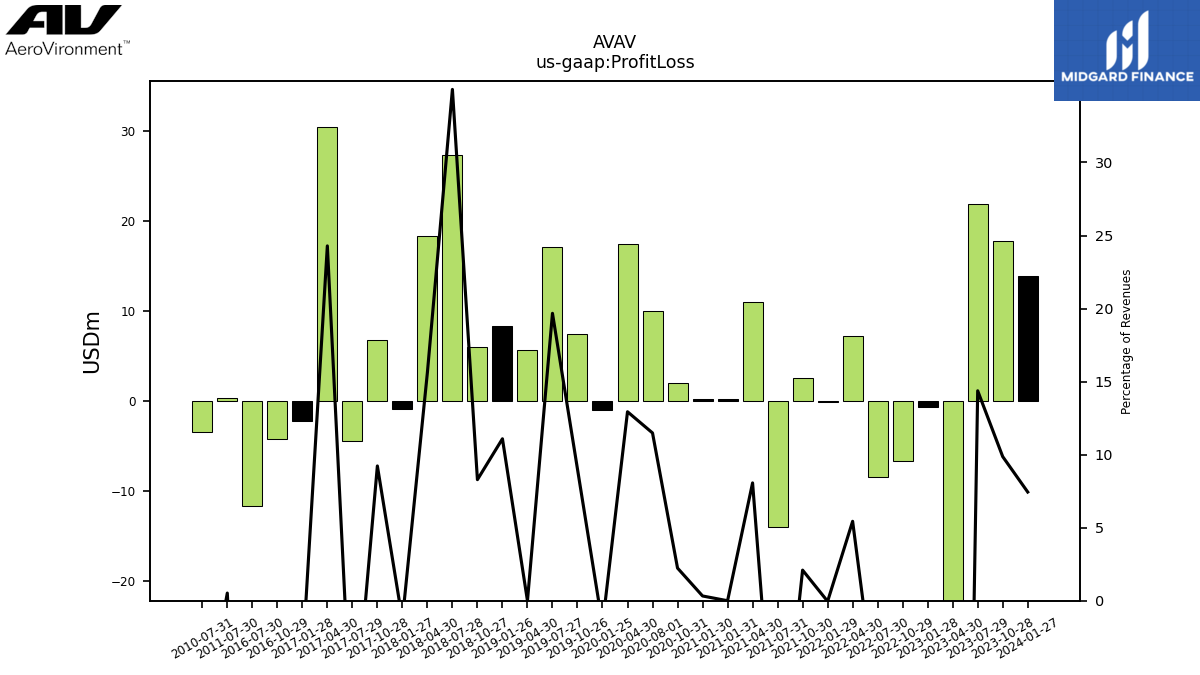
| Profit Loss | 13.88 | 17.84 | 21.89 | -160.47 | -0.68 | -6.63 | -8.39 | 7.21 | -0.04 | 2.56 | -13.92 | 10.97 | 0.26 | 2.07 | 10.04 | 17.49 | NA | -1.03 | NA | 7.50 | NA | 17.10 | 5.70 | NA | 8.35 | NA | 6.05 | NA | 27.32 | 18.34 | -0.84 | 6.81 | -4.47 | 30.45 | -2.18 | -4.17 | -11.64 | NA | NA | NA | NA | NA | NA | NA | NA | NA | NA | NA | NA | NA | NA | NA | NA | NA | NA | NA | 0.33 | NA | NA | NA | -3.44 | |
| Comprehensive Income Net Of Tax | 15.07 | 16.28 | 21.83 | -159.87 | 2.75 | -7.59 | -9.44 | 4.18 | -1.75 | 1.24 | -14.72 | 10.94 | 0.22 | 2.08 | 10.10 | 17.73 | NA | -1.12 | NA | 7.51 | NA | 17.28 | 5.68 | NA | 8.37 | NA | 6.05 | NA | 27.37 | NA | NA | NA | NA | NA | NA | NA | NA | NA | NA | NA | NA | NA | NA | NA | NA | NA | NA | NA | NA | NA | 3.88 | 8.73 | -1.35 | 17.80 | 5.79 | 6.63 | 0.33 | NA | NA | NA | NA | |
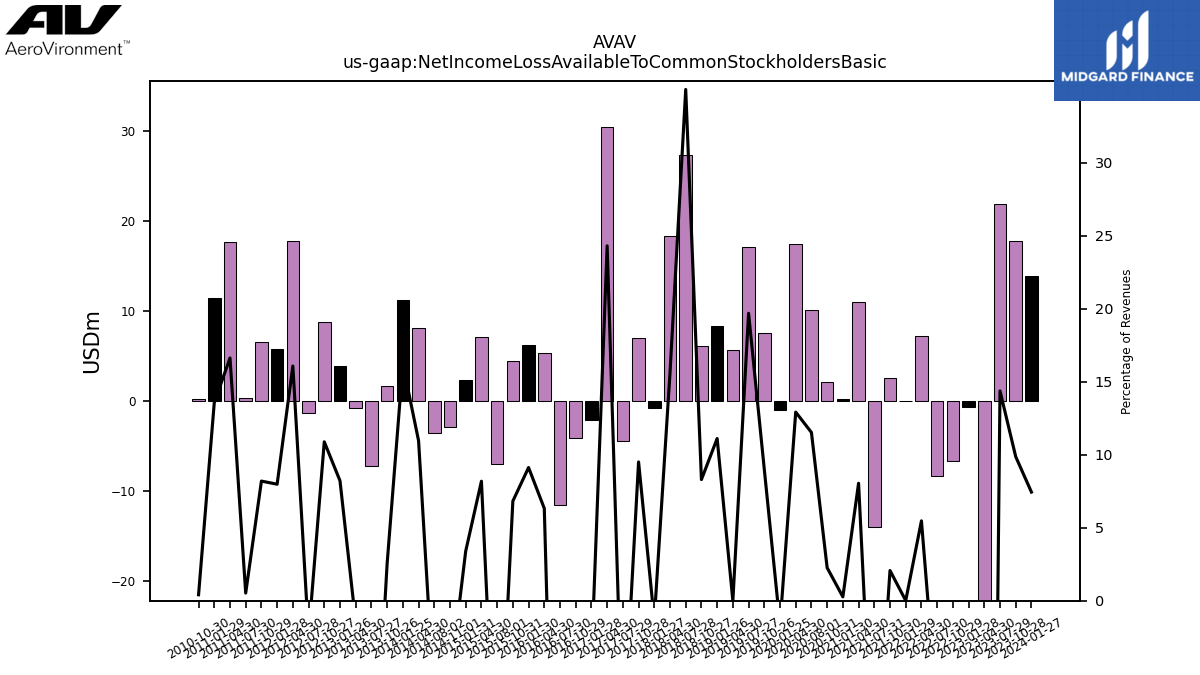
| Net Income Loss Available To Common Stockholders Basic | 13.88 | 17.84 | 21.89 | -160.47 | -0.68 | -6.67 | -8.39 | 7.26 | 0.01 | 2.52 | -13.98 | 10.95 | 0.21 | 2.09 | 10.08 | 17.47 | NA | -1.01 | NA | 7.50 | NA | 17.11 | 5.68 | NA | 8.37 | NA | 6.06 | NA | 27.33 | 18.32 | -0.83 | 7.02 | -4.44 | 30.48 | -2.18 | -4.17 | -11.64 | 5.36 | 6.16 | 4.42 | -6.98 | 7.08 | 2.33 | -2.90 | -3.61 | 8.06 | 11.22 | 1.66 | -7.21 | -0.80 | 3.87 | 8.74 | -1.39 | 17.79 | 5.74 | 6.59 | 0.33 | 17.64 | 11.45 | 0.26 | NA |
| 2024-01-27 | 2023-10-28 | 2023-07-29 | 2023-04-30 | 2023-01-28 | 2022-10-29 | 2022-07-30 | 2022-04-30 | 2022-01-29 | 2021-10-30 | 2021-07-31 | 2021-04-30 | 2021-01-30 | 2020-10-31 | 2020-08-01 | 2020-04-30 | 2020-01-31 | 2020-01-25 | 2019-10-31 | 2019-10-26 | 2019-07-31 | 2019-07-27 | 2019-04-30 | 2019-01-31 | 2019-01-26 | 2018-10-31 | 2018-10-27 | 2018-07-31 | 2018-07-28 | 2018-04-30 | 2018-01-27 | 2017-10-28 | 2017-07-29 | 2017-04-30 | 2017-01-28 | 2016-10-29 | 2016-07-30 | 2016-04-30 | 2016-01-30 | 2015-10-31 | 2015-08-01 | 2015-04-30 | 2015-01-31 | 2014-11-01 | 2014-08-02 | 2014-04-30 | 2014-01-25 | 2013-10-26 | 2013-07-27 | 2013-04-30 | 2013-01-26 | 2012-10-27 | 2012-07-28 | 2012-04-30 | 2012-01-28 | 2011-10-29 | 2011-07-30 | 2011-04-30 | 2011-01-29 | 2010-10-30 | 2010-07-31 | ||
|---|---|---|---|---|---|---|---|---|---|---|---|---|---|---|---|---|---|---|---|---|---|---|---|---|---|---|---|---|---|---|---|---|---|---|---|---|---|---|---|---|---|---|---|---|---|---|---|---|---|---|---|---|---|---|---|---|---|---|---|---|---|---|
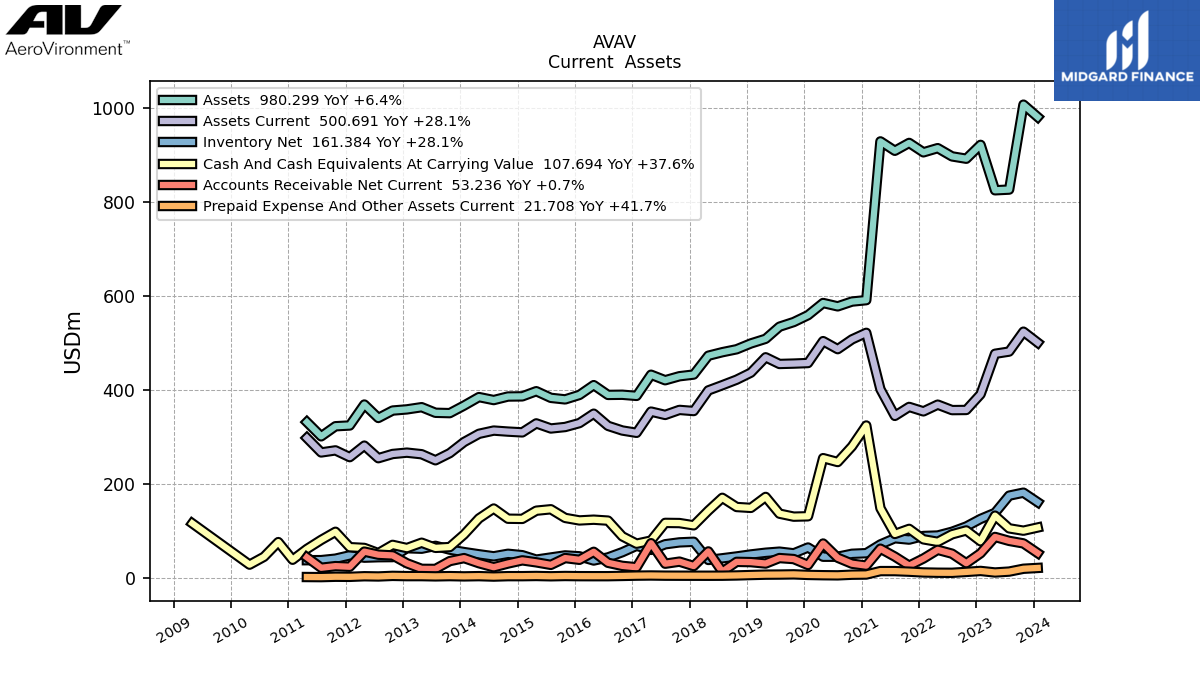
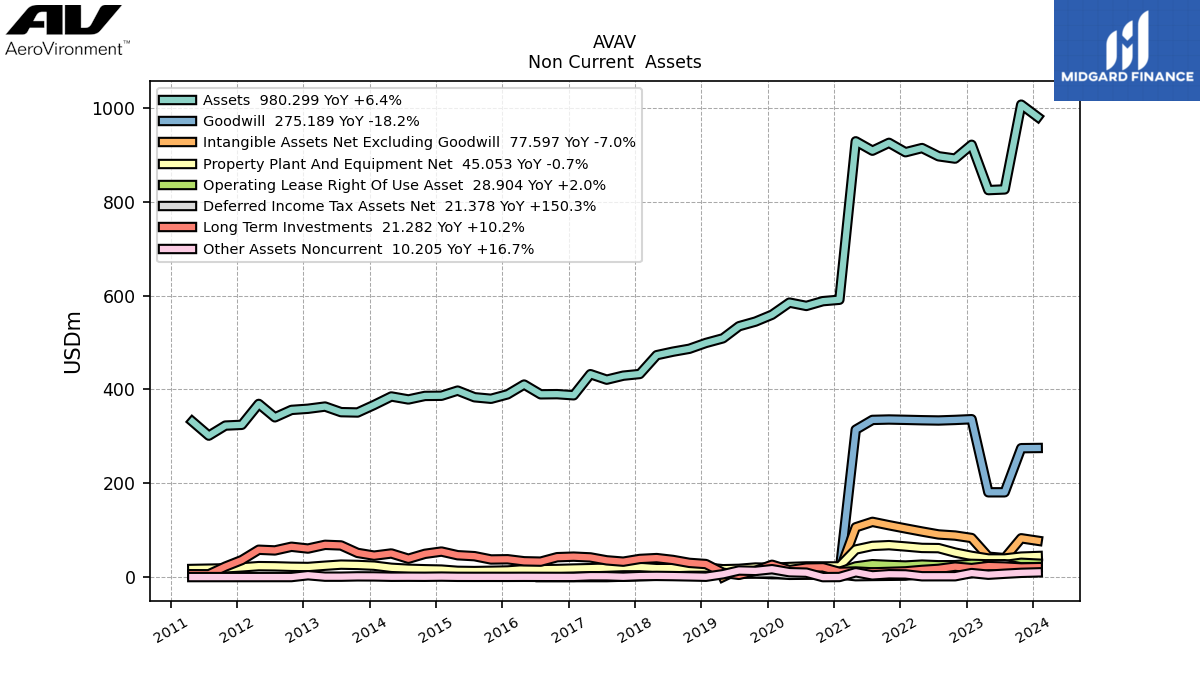
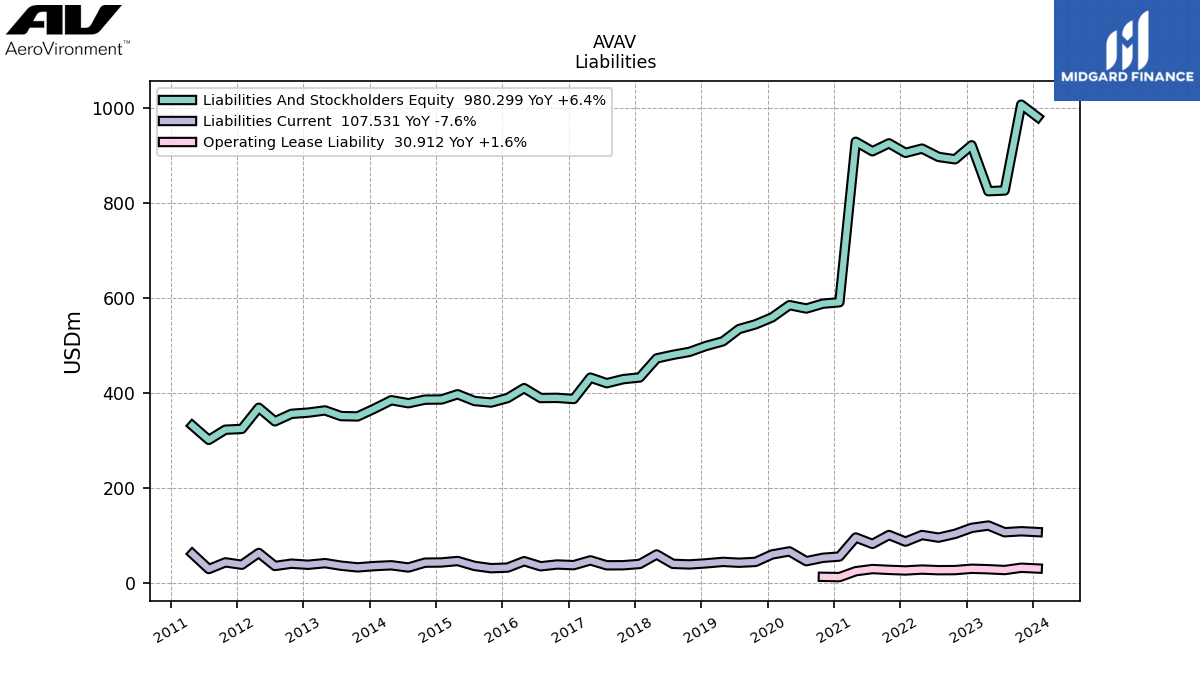
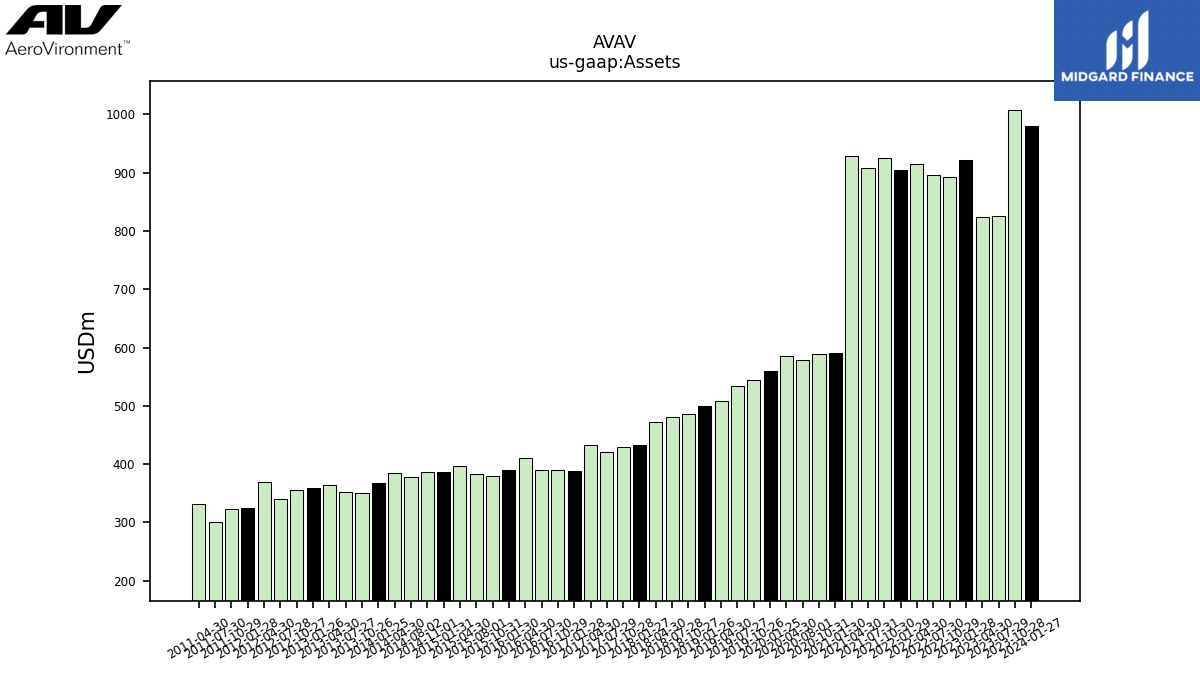
| Assets | 980.30 | 1006.70 | 826.06 | 824.58 | 921.20 | 891.68 | 896.65 | 914.20 | 905.26 | 925.31 | 908.55 | 928.57 | 590.99 | 588.01 | 577.82 | 584.95 | NA | 559.08 | NA | 544.49 | NA | 534.58 | 508.84 | NA | 498.96 | NA | 486.57 | NA | 480.36 | 472.91 | 432.85 | 429.26 | 420.74 | 432.50 | 387.46 | 389.90 | 389.53 | 410.39 | 389.49 | 380.03 | 383.27 | 397.47 | 386.47 | 386.13 | 378.60 | 384.95 | 366.88 | 350.82 | 351.56 | 363.46 | 358.79 | 356.31 | 340.49 | 369.15 | 324.55 | 322.94 | 301.47 | 331.75 | NA | NA | NA | |
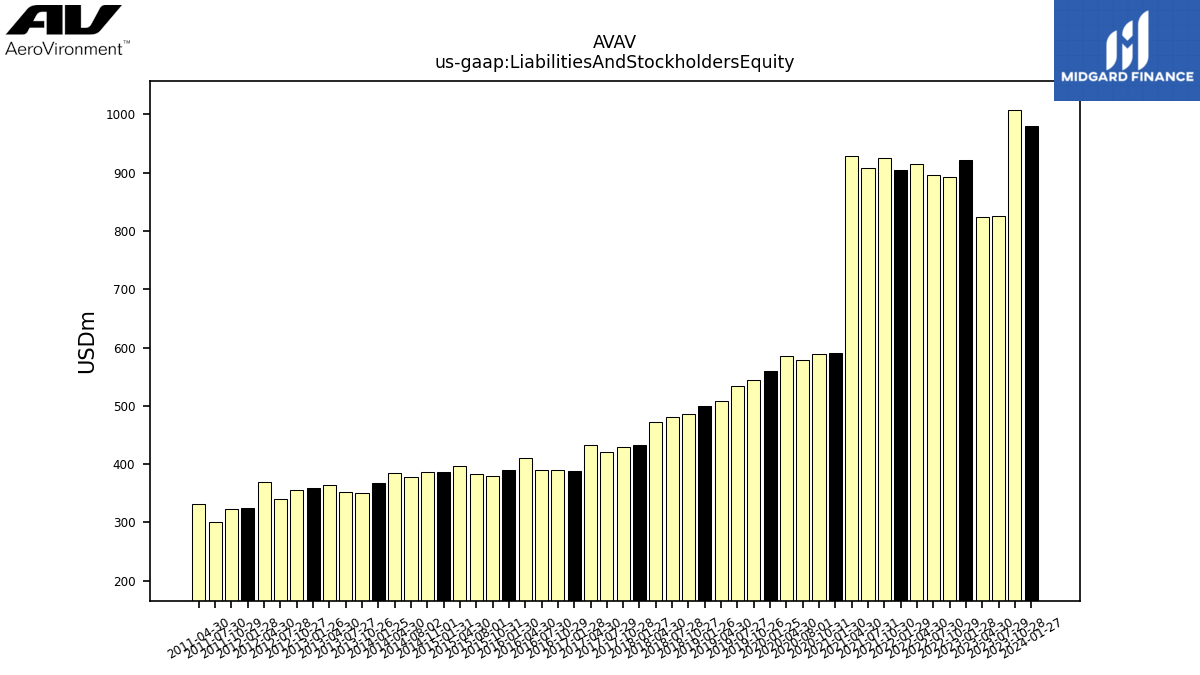
| Liabilities And Stockholders Equity | 980.30 | 1006.70 | 826.06 | 824.58 | 921.20 | 891.68 | 896.65 | 914.20 | 905.26 | 925.31 | 908.55 | 928.57 | 590.99 | 588.01 | 577.82 | 584.95 | NA | 559.08 | NA | 544.49 | NA | 534.58 | 508.84 | NA | 498.96 | NA | 486.57 | NA | 480.36 | 472.91 | 432.85 | 429.26 | 420.74 | 432.50 | 387.46 | 389.90 | 389.53 | 410.39 | 389.49 | 380.03 | 383.27 | 397.47 | 386.47 | 386.13 | 378.60 | 384.95 | 366.88 | 350.82 | 351.56 | 363.46 | 358.79 | 356.31 | 340.49 | 369.15 | 324.55 | 322.94 | 301.47 | 331.75 | NA | NA | NA |
| 2024-01-27 | 2023-10-28 | 2023-07-29 | 2023-04-30 | 2023-01-28 | 2022-10-29 | 2022-07-30 | 2022-04-30 | 2022-01-29 | 2021-10-30 | 2021-07-31 | 2021-04-30 | 2021-01-30 | 2020-10-31 | 2020-08-01 | 2020-04-30 | 2020-01-31 | 2020-01-25 | 2019-10-31 | 2019-10-26 | 2019-07-31 | 2019-07-27 | 2019-04-30 | 2019-01-31 | 2019-01-26 | 2018-10-31 | 2018-10-27 | 2018-07-31 | 2018-07-28 | 2018-04-30 | 2018-01-27 | 2017-10-28 | 2017-07-29 | 2017-04-30 | 2017-01-28 | 2016-10-29 | 2016-07-30 | 2016-04-30 | 2016-01-30 | 2015-10-31 | 2015-08-01 | 2015-04-30 | 2015-01-31 | 2014-11-01 | 2014-08-02 | 2014-04-30 | 2014-01-25 | 2013-10-26 | 2013-07-27 | 2013-04-30 | 2013-01-26 | 2012-10-27 | 2012-07-28 | 2012-04-30 | 2012-01-28 | 2011-10-29 | 2011-07-30 | 2011-04-30 | 2011-01-29 | 2010-10-30 | 2010-07-31 | ||
|---|---|---|---|---|---|---|---|---|---|---|---|---|---|---|---|---|---|---|---|---|---|---|---|---|---|---|---|---|---|---|---|---|---|---|---|---|---|---|---|---|---|---|---|---|---|---|---|---|---|---|---|---|---|---|---|---|---|---|---|---|---|---|
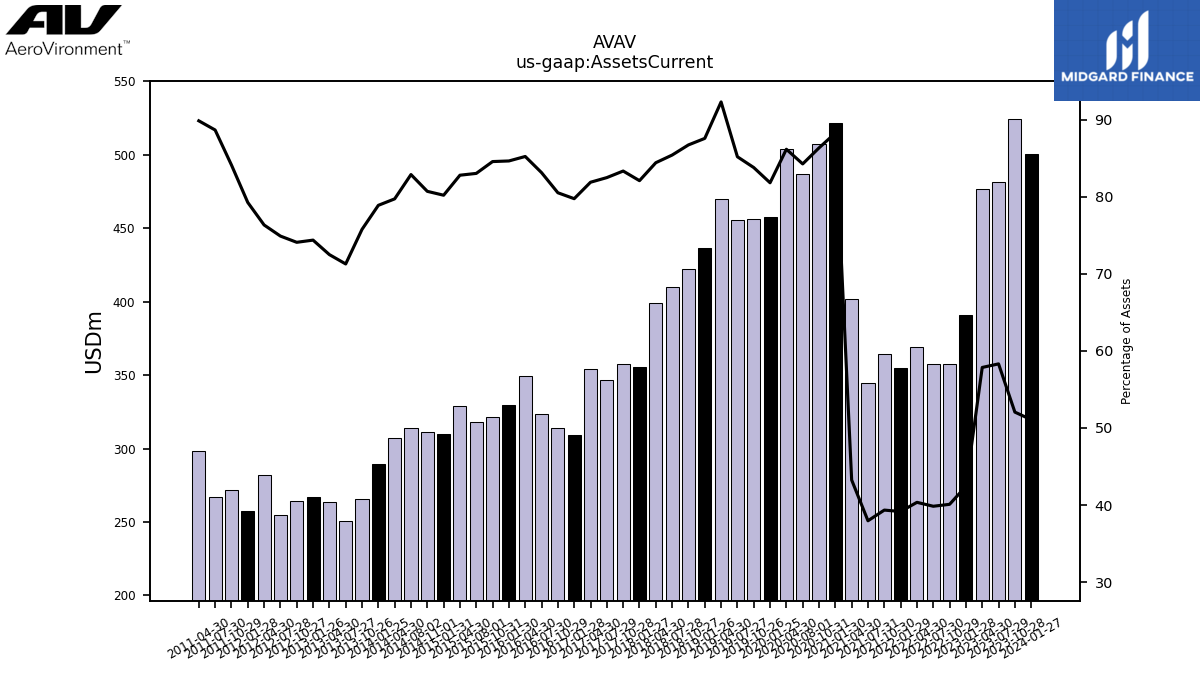
| Assets Current | 500.69 | 524.04 | 481.69 | 477.00 | 390.88 | 357.53 | 357.27 | 368.91 | 354.52 | 364.08 | 344.92 | 401.64 | 521.54 | 507.60 | 486.79 | 503.93 | NA | 457.33 | NA | 456.15 | NA | 455.33 | 469.59 | NA | 436.88 | NA | 421.91 | NA | 410.20 | 399.15 | 355.25 | 357.67 | 346.99 | 354.08 | 308.95 | 313.89 | 323.76 | 349.70 | 329.63 | 321.32 | 318.18 | 329.03 | 309.90 | 311.57 | 313.73 | 306.86 | 289.38 | 265.76 | 250.56 | 263.45 | 266.81 | 263.95 | 254.99 | 281.77 | 257.21 | 271.62 | 267.24 | 298.03 | NA | NA | NA | |
| Cash And Cash Equivalents At Carrying Value | 107.69 | 100.91 | 105.87 | 132.86 | 78.28 | 101.42 | 93.18 | 77.23 | 82.53 | 104.77 | 93.92 | 148.74 | 324.54 | 280.10 | 246.84 | 255.14 | NA | 131.50 | NA | 130.74 | NA | 137.09 | 172.71 | NA | 149.37 | NA | 151.25 | NA | 170.79 | 143.52 | 112.30 | 117.11 | 117.47 | 79.90 | 73.28 | 88.88 | 122.31 | 124.29 | 122.71 | 128.03 | 146.45 | 143.41 | 125.98 | 126.34 | 148.05 | 126.97 | 92.75 | 66.13 | 64.34 | 75.33 | 63.98 | 70.77 | 53.21 | 64.22 | 65.86 | 98.59 | 81.25 | 62.04 | 39.10 | 76.66 | 45.44 | |
| Cash Cash Equivalents Restricted Cash And Restricted Cash Equivalents | 107.69 | 100.91 | 105.87 | 132.86 | 85.21 | 101.42 | 93.18 | 77.23 | 84.35 | 106.59 | 95.75 | 157.06 | 324.54 | 280.10 | 246.84 | 255.14 | NA | 136.50 | NA | 135.74 | NA | 142.09 | 172.71 | NA | NA | NA | NA | NA | NA | NA | NA | NA | NA | NA | NA | NA | NA | NA | NA | NA | NA | NA | NA | NA | NA | NA | NA | NA | NA | NA | NA | NA | NA | NA | NA | NA | NA | NA | NA | NA | NA | |
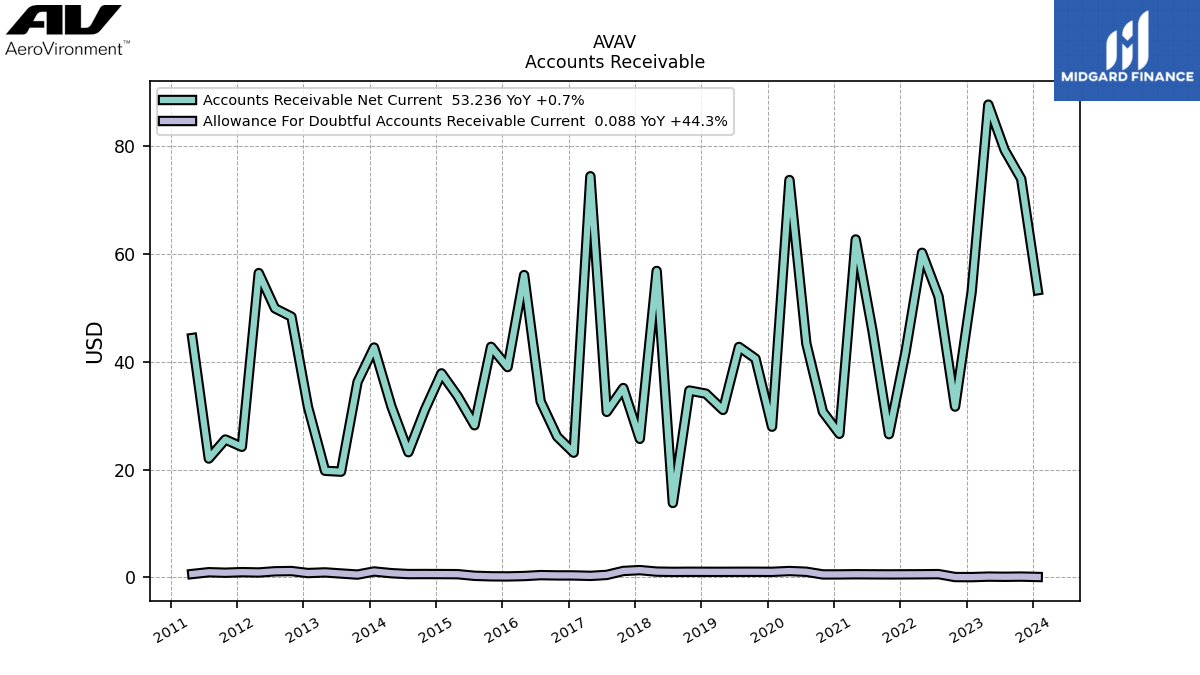
| Accounts Receivable Net Current | 53.24 | 73.86 | 79.21 | 87.63 | 52.87 | 31.66 | 52.06 | 60.17 | 41.74 | 26.55 | 45.76 | 62.65 | 26.62 | 30.70 | 43.36 | 73.66 | NA | 27.94 | NA | 40.56 | NA | 42.72 | 31.05 | NA | 34.06 | NA | 34.64 | NA | 13.80 | 56.81 | 25.69 | 35.11 | 30.68 | 74.36 | 23.12 | 26.10 | 32.63 | 56.05 | 38.99 | 42.75 | 28.20 | 33.61 | 37.83 | 31.10 | 23.21 | 31.74 | 42.62 | 36.24 | 19.60 | 19.77 | 31.60 | 48.33 | 49.88 | 56.42 | 24.21 | 25.57 | 22.03 | 44.38 | NA | NA | NA | |
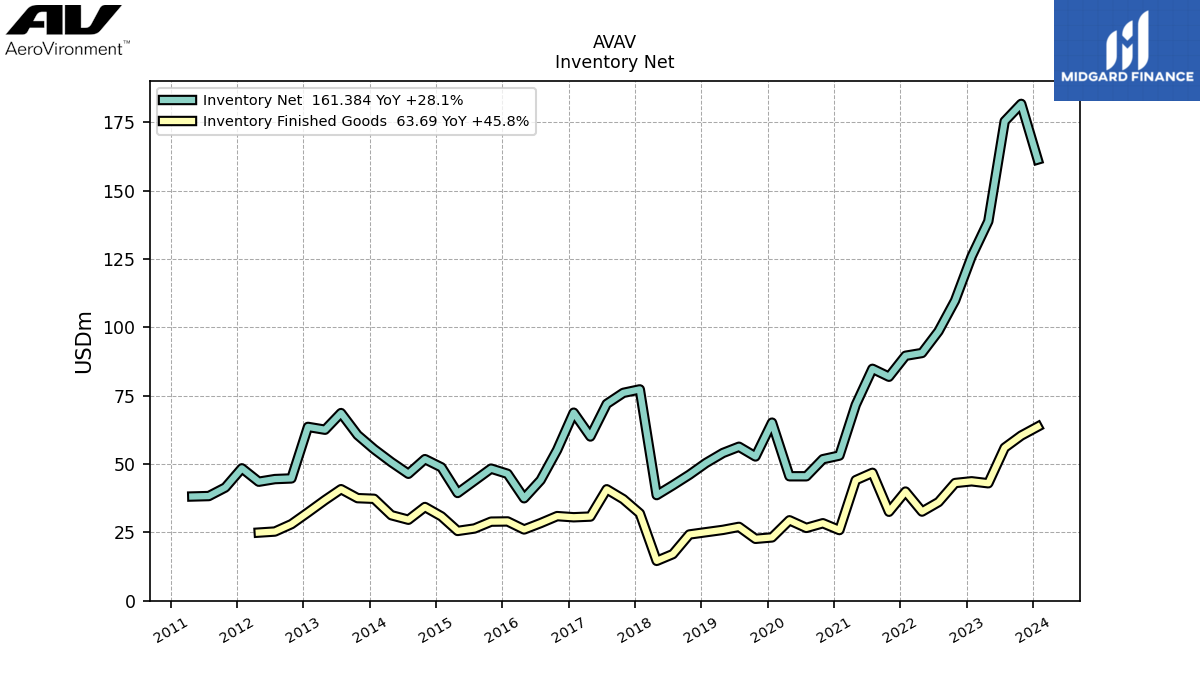
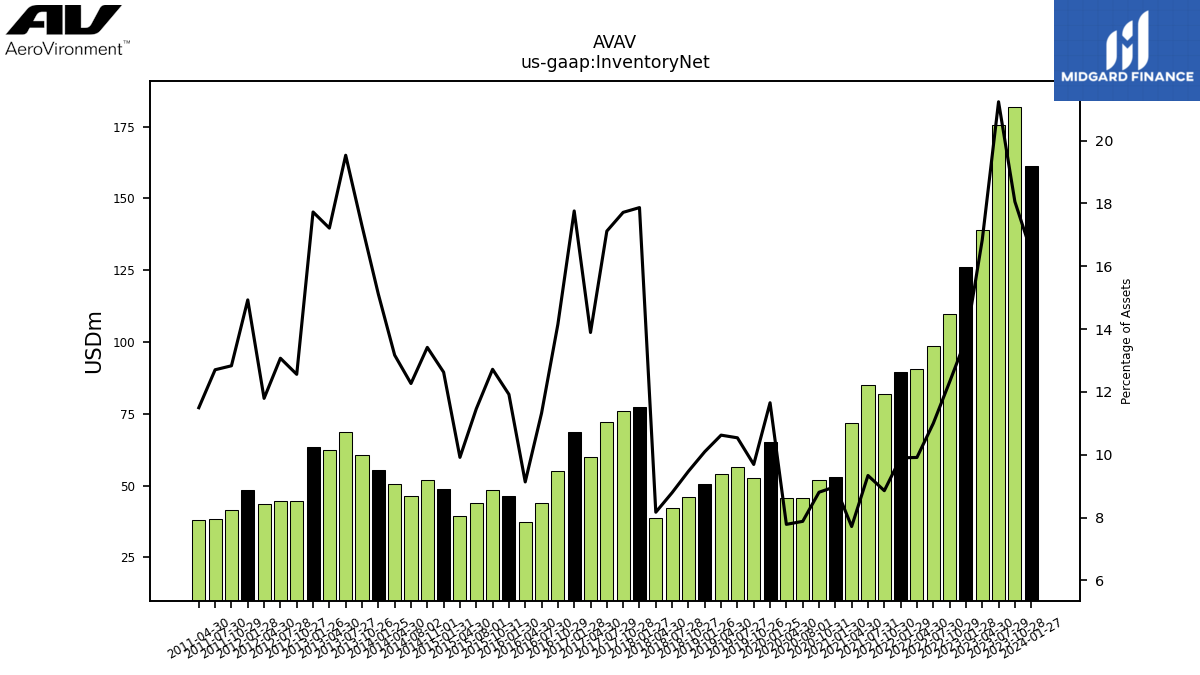
| Inventory Net | 161.38 | 181.77 | 175.40 | 138.81 | 125.94 | 109.81 | 98.60 | 90.63 | 89.62 | 81.94 | 84.85 | 71.65 | 53.10 | 51.78 | 45.53 | 45.53 | NA | 65.16 | NA | 52.77 | NA | 56.34 | 54.06 | NA | 50.38 | NA | 46.10 | NA | 42.24 | 38.64 | 77.33 | 76.04 | 72.02 | 60.08 | 68.81 | 55.17 | 44.10 | 37.49 | 46.43 | 48.34 | 43.92 | 39.41 | 48.80 | 51.80 | 46.44 | 50.70 | 55.44 | 60.63 | 68.66 | 62.56 | 63.60 | 44.75 | 44.51 | 43.54 | 48.45 | 41.44 | 38.30 | 38.14 | NA | NA | NA | |
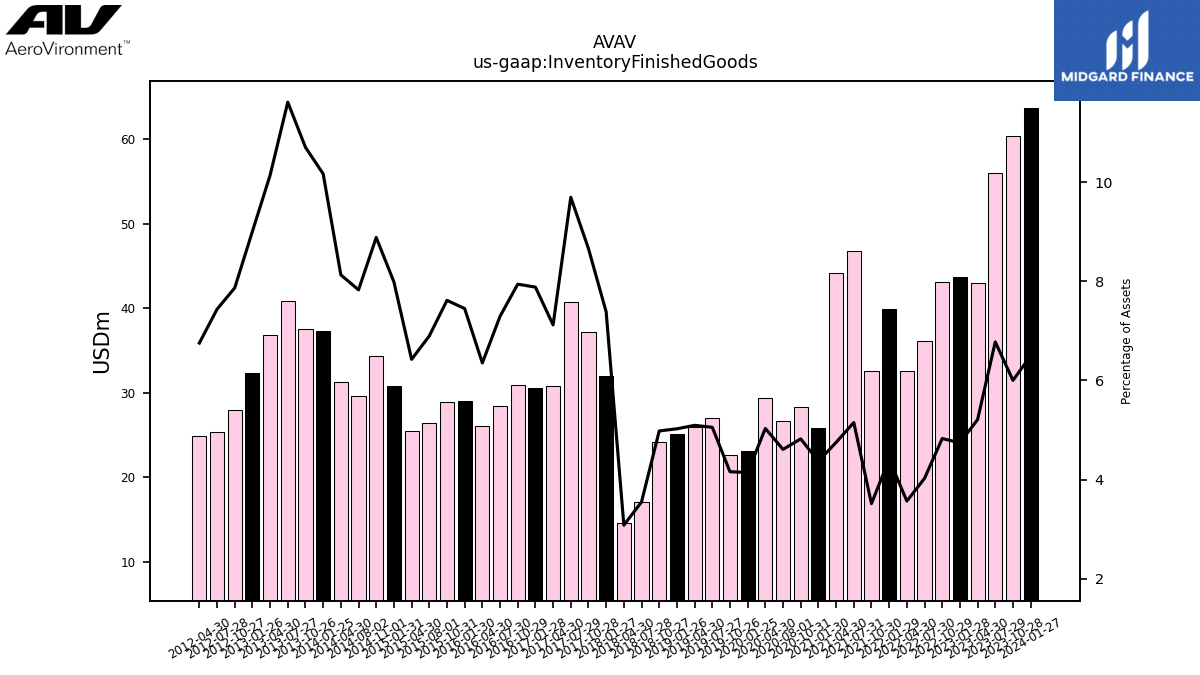
| Inventory Finished Goods | 63.69 | 60.41 | 55.99 | 42.97 | 43.70 | 43.06 | 36.10 | 32.62 | 39.94 | 32.55 | 46.81 | 44.11 | 25.84 | 28.36 | 26.64 | 29.44 | NA | 23.17 | NA | 22.65 | NA | 27.03 | 25.93 | NA | 25.08 | NA | 24.24 | NA | 17.06 | 14.58 | 31.96 | 37.16 | 40.78 | 30.79 | 30.54 | 30.96 | 28.41 | 26.07 | 29.02 | 28.94 | 26.43 | 25.54 | 30.86 | 34.30 | 29.63 | 31.29 | 37.29 | 37.54 | 40.82 | 36.84 | 32.31 | 28.03 | 25.32 | 24.93 | NA | NA | NA | NA | NA | NA | NA | |
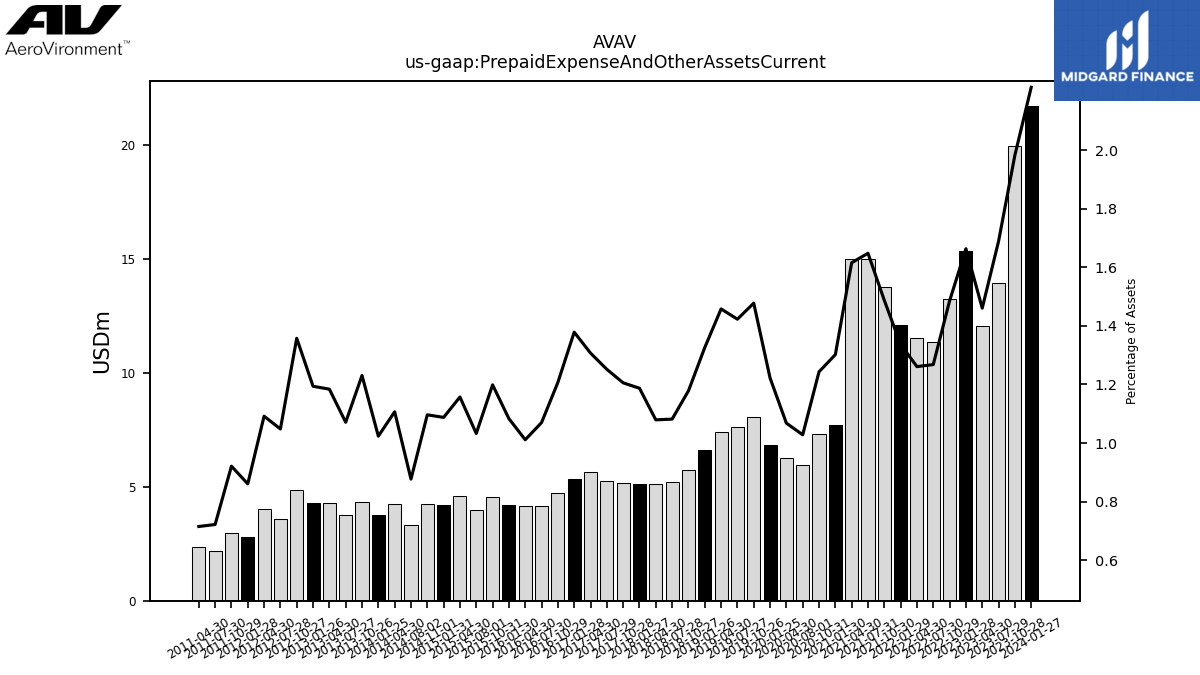
| Prepaid Expense And Other Assets Current | 21.71 | 19.96 | 13.95 | 12.04 | 15.32 | 13.24 | 11.37 | 11.53 | 12.10 | 13.76 | 14.97 | 15.00 | 7.69 | 7.31 | 5.94 | 6.25 | NA | 6.83 | NA | 8.04 | NA | 7.61 | 7.42 | NA | 6.62 | NA | 5.73 | NA | 5.20 | 5.10 | 5.14 | 5.17 | 5.27 | 5.65 | 5.34 | 4.71 | 4.17 | 4.15 | 4.22 | 4.55 | 3.96 | 4.60 | 4.20 | 4.23 | 3.32 | 4.26 | 3.75 | 4.32 | 3.77 | 4.30 | 4.28 | 4.84 | 3.57 | 4.03 | 2.79 | 2.97 | 2.18 | 2.37 | NA | NA | NA |
| 2024-01-27 | 2023-10-28 | 2023-07-29 | 2023-04-30 | 2023-01-28 | 2022-10-29 | 2022-07-30 | 2022-04-30 | 2022-01-29 | 2021-10-30 | 2021-07-31 | 2021-04-30 | 2021-01-30 | 2020-10-31 | 2020-08-01 | 2020-04-30 | 2020-01-31 | 2020-01-25 | 2019-10-31 | 2019-10-26 | 2019-07-31 | 2019-07-27 | 2019-04-30 | 2019-01-31 | 2019-01-26 | 2018-10-31 | 2018-10-27 | 2018-07-31 | 2018-07-28 | 2018-04-30 | 2018-01-27 | 2017-10-28 | 2017-07-29 | 2017-04-30 | 2017-01-28 | 2016-10-29 | 2016-07-30 | 2016-04-30 | 2016-01-30 | 2015-10-31 | 2015-08-01 | 2015-04-30 | 2015-01-31 | 2014-11-01 | 2014-08-02 | 2014-04-30 | 2014-01-25 | 2013-10-26 | 2013-07-27 | 2013-04-30 | 2013-01-26 | 2012-10-27 | 2012-07-28 | 2012-04-30 | 2012-01-28 | 2011-10-29 | 2011-07-30 | 2011-04-30 | 2011-01-29 | 2010-10-30 | 2010-07-31 | ||
|---|---|---|---|---|---|---|---|---|---|---|---|---|---|---|---|---|---|---|---|---|---|---|---|---|---|---|---|---|---|---|---|---|---|---|---|---|---|---|---|---|---|---|---|---|---|---|---|---|---|---|---|---|---|---|---|---|---|---|---|---|---|---|
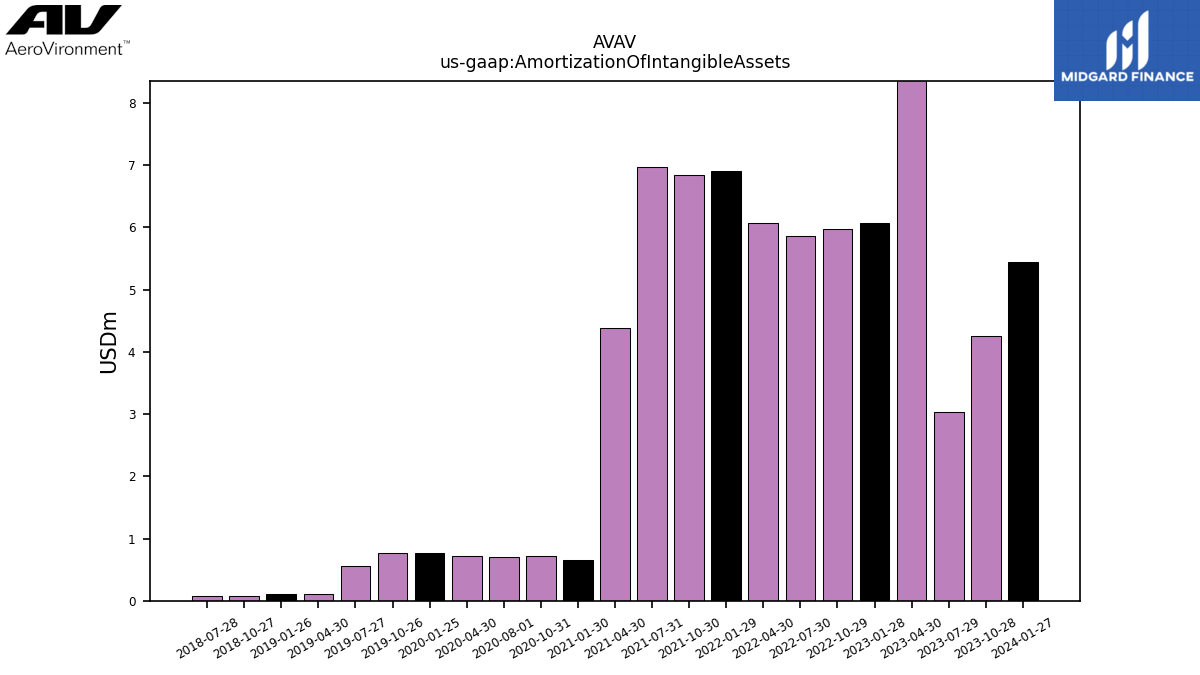
| Amortization Of Intangible Assets | 5.45 | 4.26 | 3.03 | 40.20 | 6.07 | 5.98 | 5.87 | 6.07 | 6.91 | 6.84 | 6.97 | 4.38 | 0.66 | 0.71 | 0.71 | 0.72 | NA | 0.78 | NA | 0.78 | NA | 0.55 | 0.10 | NA | 0.10 | NA | 0.08 | NA | 0.07 | NA | NA | NA | NA | NA | NA | NA | NA | NA | NA | NA | NA | NA | NA | NA | NA | NA | NA | NA | NA | NA | NA | NA | NA | NA | NA | NA | NA | NA | NA | NA | NA | |
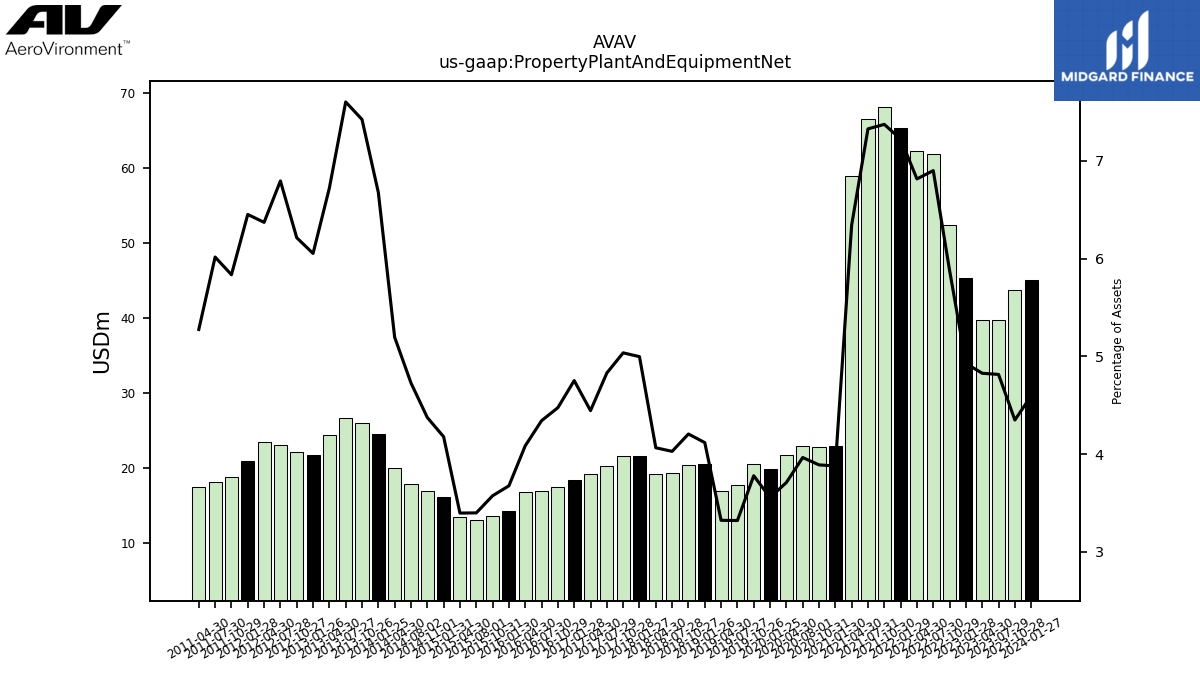
| Property Plant And Equipment Net | 45.05 | 43.77 | 39.77 | 39.80 | 45.39 | 52.41 | 61.86 | 62.30 | 65.38 | 68.22 | 66.56 | 58.90 | 22.92 | 22.87 | 22.91 | 21.69 | NA | 19.88 | NA | 20.57 | NA | 17.75 | 16.91 | NA | 20.54 | NA | 20.46 | NA | 19.35 | 19.22 | 21.63 | 21.61 | 20.32 | 19.22 | 18.41 | 17.45 | 16.91 | 16.76 | 14.31 | 13.58 | 13.02 | 13.50 | 16.14 | 16.89 | 17.90 | 20.00 | 24.49 | 26.04 | 26.73 | 24.43 | 21.71 | 22.14 | 23.13 | 23.52 | 20.94 | 18.84 | 18.13 | 17.50 | NA | NA | NA | |
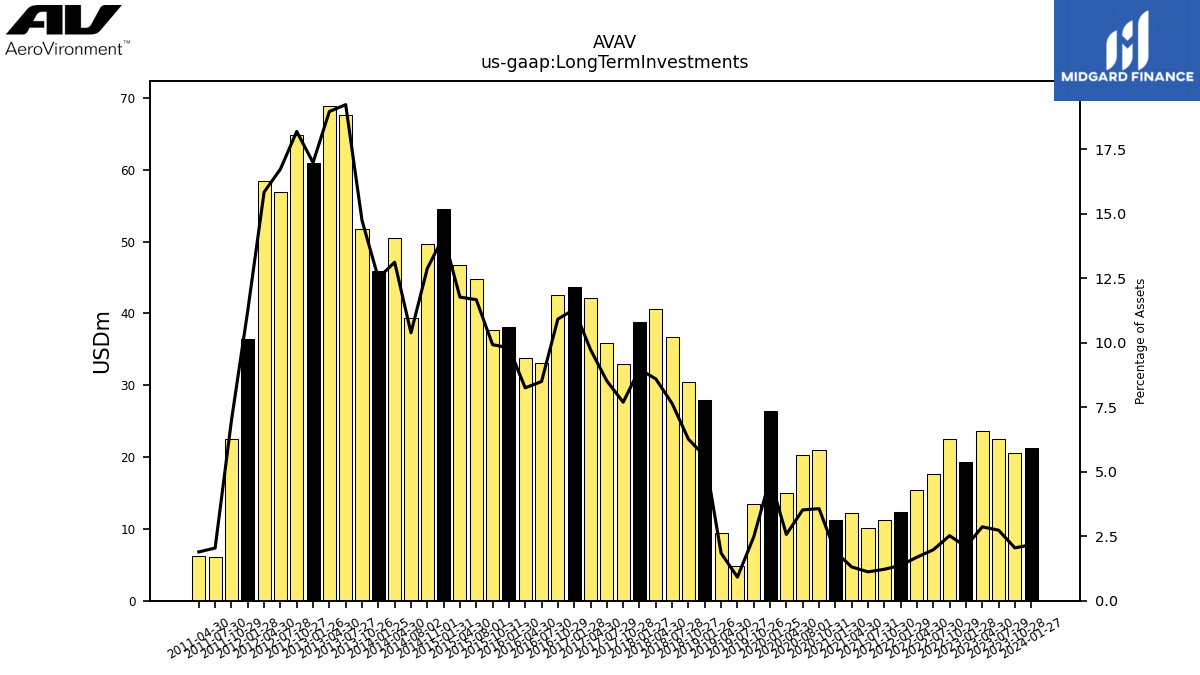
| Long Term Investments | 21.28 | 20.61 | 22.58 | 23.61 | 19.32 | 22.46 | 17.71 | 15.43 | 12.39 | 11.27 | 10.16 | 12.16 | 11.22 | 20.98 | 20.34 | 15.03 | NA | 26.41 | NA | 13.48 | NA | 4.89 | 9.39 | NA | 27.95 | NA | 30.46 | NA | 36.71 | 40.66 | 38.82 | 33.02 | 35.84 | 42.10 | 43.75 | 42.56 | 33.10 | 33.86 | 38.17 | 37.72 | 44.73 | 46.77 | 54.58 | 49.72 | 39.31 | 50.51 | 45.88 | 51.71 | 67.59 | 68.92 | 60.93 | 64.80 | 56.96 | 58.46 | 36.50 | 22.56 | 6.15 | 6.28 | NA | NA | NA | |
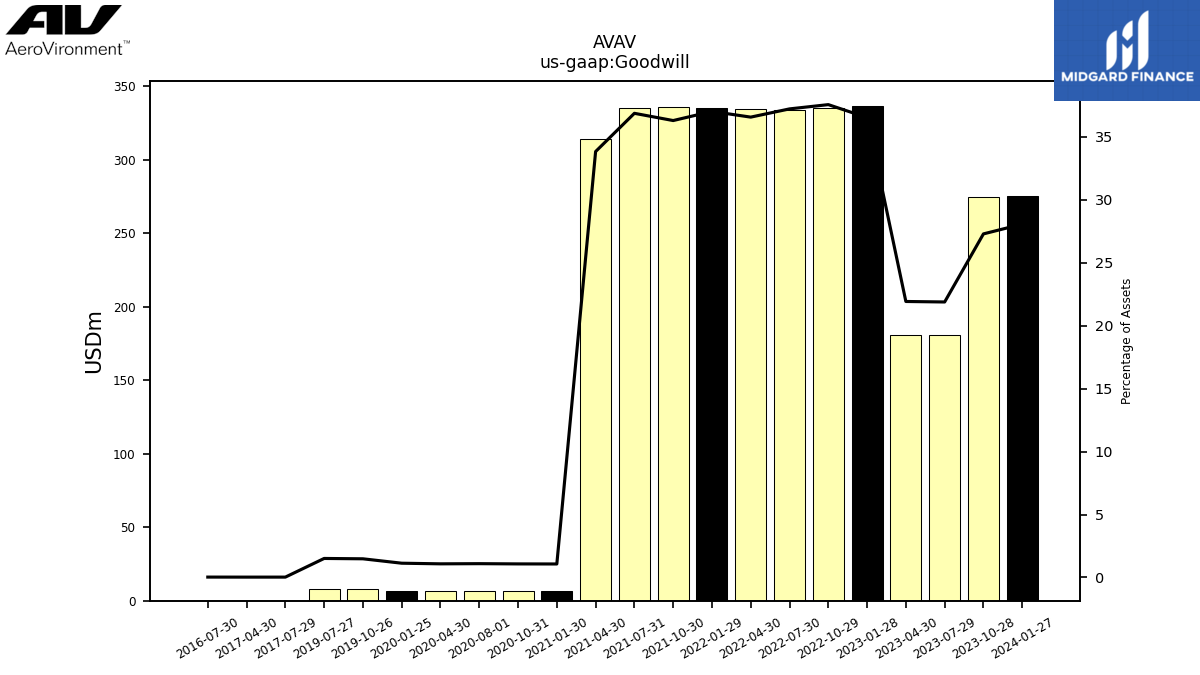
| Goodwill | 275.19 | 274.78 | 180.80 | 180.80 | 336.56 | 334.96 | 333.79 | 334.35 | 335.16 | 335.89 | 335.03 | 314.20 | 6.34 | 6.34 | 6.34 | 6.34 | NA | 6.34 | NA | 8.08 | NA | 8.08 | NA | NA | NA | NA | NA | NA | NA | NA | NA | NA | 0.12 | 0.12 | NA | NA | 0.12 | NA | NA | NA | NA | NA | NA | NA | NA | NA | NA | NA | NA | NA | NA | NA | NA | NA | NA | NA | NA | NA | NA | NA | NA | |
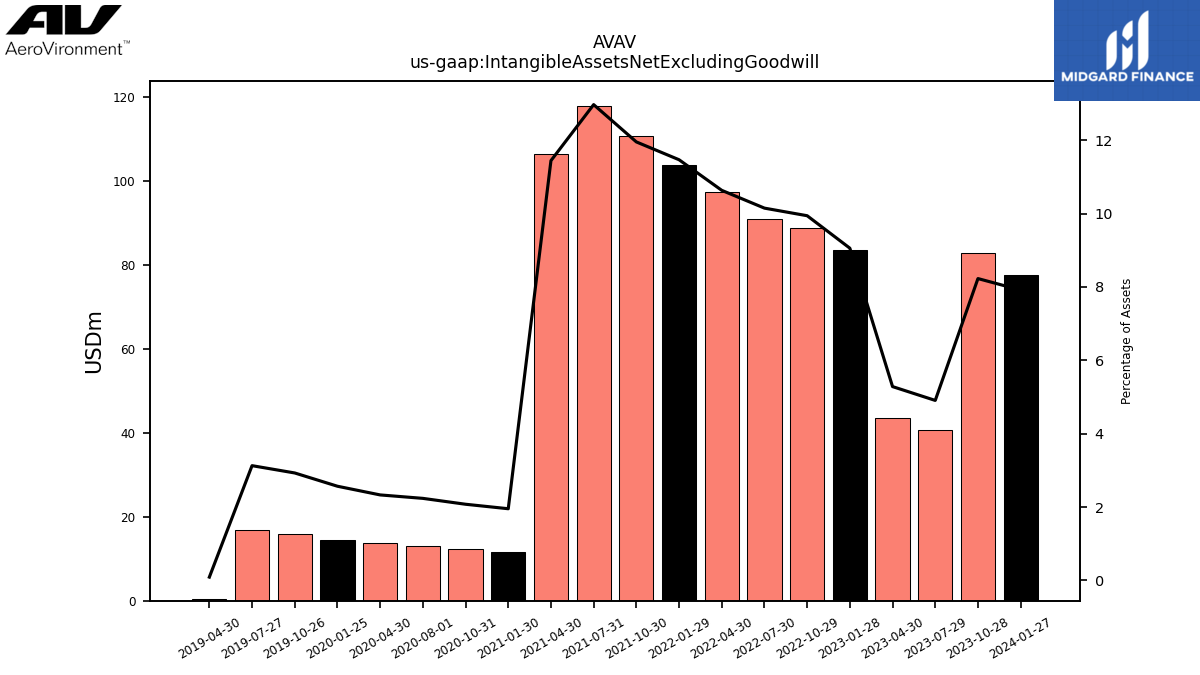
| Intangible Assets Net Excluding Goodwill | 77.60 | 82.85 | 40.54 | 43.58 | 83.44 | 88.66 | 91.01 | 97.22 | 103.83 | 110.62 | 117.86 | 106.27 | 11.55 | 12.21 | 12.93 | 13.64 | NA | 14.36 | NA | 15.95 | NA | 16.73 | 0.46 | NA | NA | NA | NA | NA | NA | NA | NA | NA | NA | NA | NA | NA | NA | NA | NA | NA | NA | NA | NA | NA | NA | NA | NA | NA | NA | NA | NA | NA | NA | NA | NA | NA | NA | NA | NA | NA | NA | |
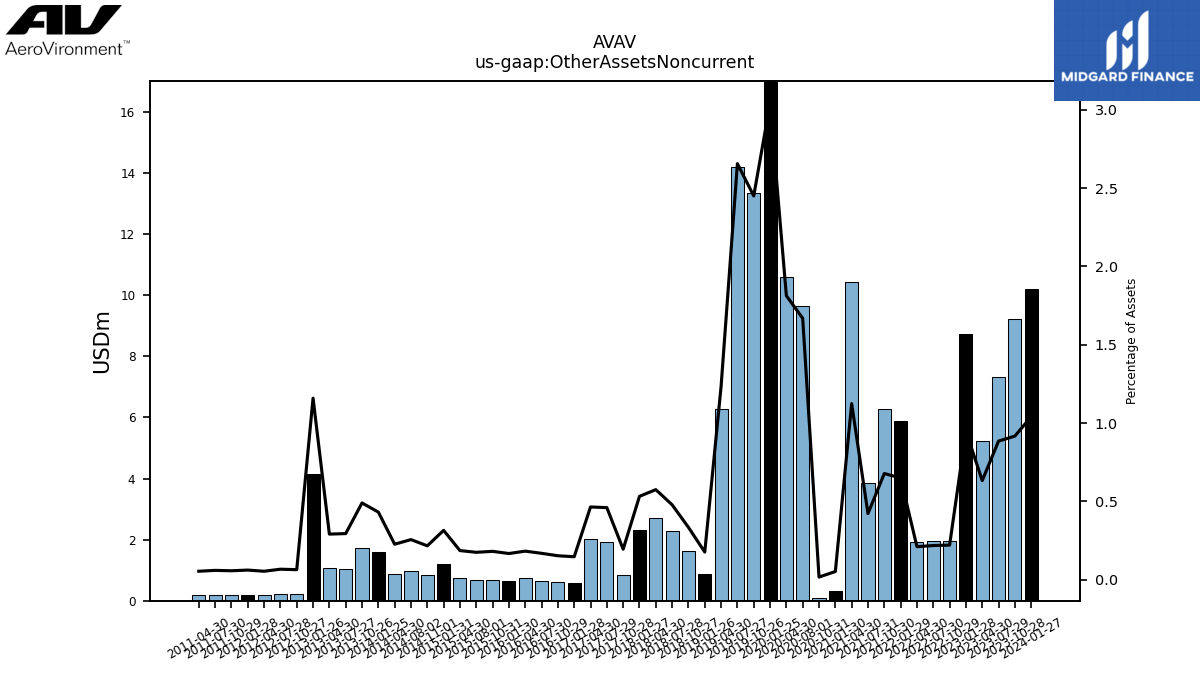
| Other Assets Noncurrent | 10.21 | 9.23 | 7.31 | 5.22 | 8.74 | 1.97 | 1.96 | 1.93 | 5.88 | 6.28 | 3.84 | 10.44 | 0.31 | 0.10 | 9.64 | 10.61 | NA | 17.00 | NA | 13.34 | NA | 14.20 | 6.28 | NA | 0.88 | NA | 1.63 | NA | 2.30 | 2.72 | 2.31 | 0.84 | 1.94 | 2.01 | 0.57 | 0.60 | 0.66 | 0.75 | 0.65 | 0.69 | 0.67 | 0.74 | 1.22 | 0.84 | 0.97 | 0.87 | 1.58 | 1.72 | 1.04 | 1.06 | 4.16 | 0.23 | 0.23 | 0.20 | 0.20 | 0.19 | 0.18 | 0.18 | NA | NA | NA |
| 2024-01-27 | 2023-10-28 | 2023-07-29 | 2023-04-30 | 2023-01-28 | 2022-10-29 | 2022-07-30 | 2022-04-30 | 2022-01-29 | 2021-10-30 | 2021-07-31 | 2021-04-30 | 2021-01-30 | 2020-10-31 | 2020-08-01 | 2020-04-30 | 2020-01-31 | 2020-01-25 | 2019-10-31 | 2019-10-26 | 2019-07-31 | 2019-07-27 | 2019-04-30 | 2019-01-31 | 2019-01-26 | 2018-10-31 | 2018-10-27 | 2018-07-31 | 2018-07-28 | 2018-04-30 | 2018-01-27 | 2017-10-28 | 2017-07-29 | 2017-04-30 | 2017-01-28 | 2016-10-29 | 2016-07-30 | 2016-04-30 | 2016-01-30 | 2015-10-31 | 2015-08-01 | 2015-04-30 | 2015-01-31 | 2014-11-01 | 2014-08-02 | 2014-04-30 | 2014-01-25 | 2013-10-26 | 2013-07-27 | 2013-04-30 | 2013-01-26 | 2012-10-27 | 2012-07-28 | 2012-04-30 | 2012-01-28 | 2011-10-29 | 2011-07-30 | 2011-04-30 | 2011-01-29 | 2010-10-30 | 2010-07-31 | ||
|---|---|---|---|---|---|---|---|---|---|---|---|---|---|---|---|---|---|---|---|---|---|---|---|---|---|---|---|---|---|---|---|---|---|---|---|---|---|---|---|---|---|---|---|---|---|---|---|---|---|---|---|---|---|---|---|---|---|---|---|---|---|---|
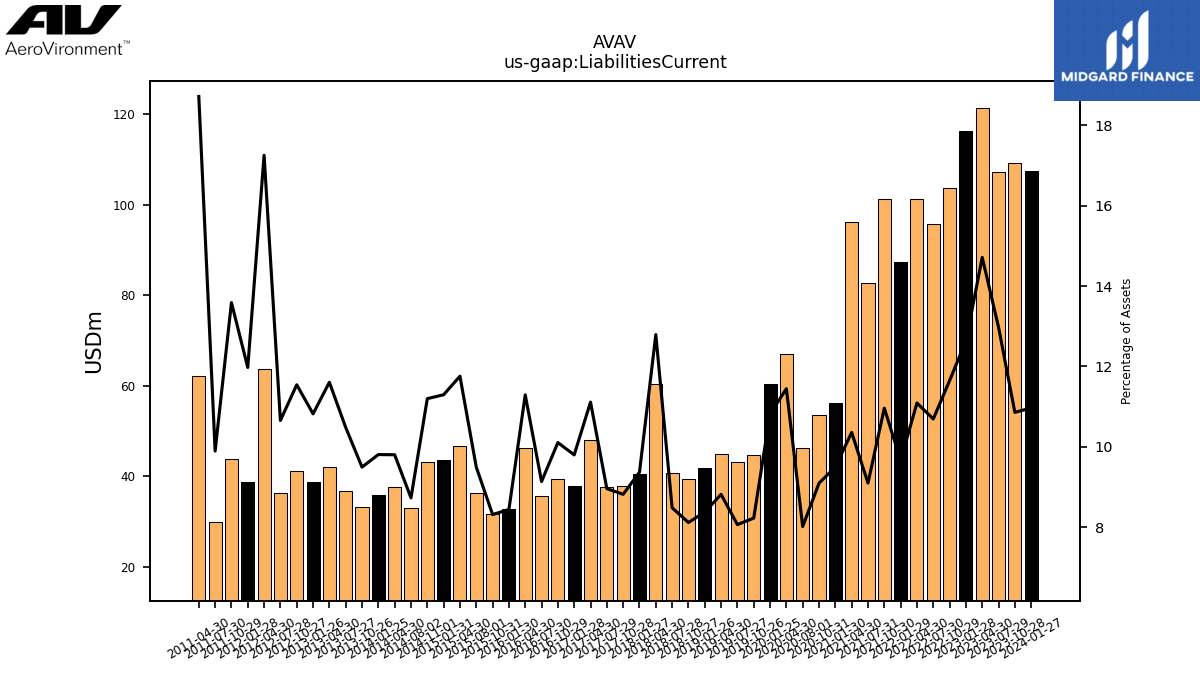
| Liabilities Current | 107.53 | 109.30 | 107.19 | 121.33 | 116.40 | 103.85 | 95.88 | 101.39 | 87.48 | 101.43 | 82.66 | 96.19 | 56.13 | 53.48 | 46.32 | 66.95 | NA | 60.48 | NA | 44.79 | NA | 43.11 | 44.87 | NA | 41.79 | NA | 39.49 | NA | 40.75 | 60.50 | 40.55 | 37.85 | 37.70 | 48.06 | 37.97 | 39.40 | 35.59 | 46.34 | 32.87 | 31.60 | 36.40 | 46.73 | 43.66 | 43.24 | 33.05 | 37.73 | 35.98 | 33.31 | 36.85 | 42.19 | 38.83 | 41.13 | 36.28 | 63.70 | 38.87 | 43.89 | 29.83 | 62.10 | NA | NA | NA | |
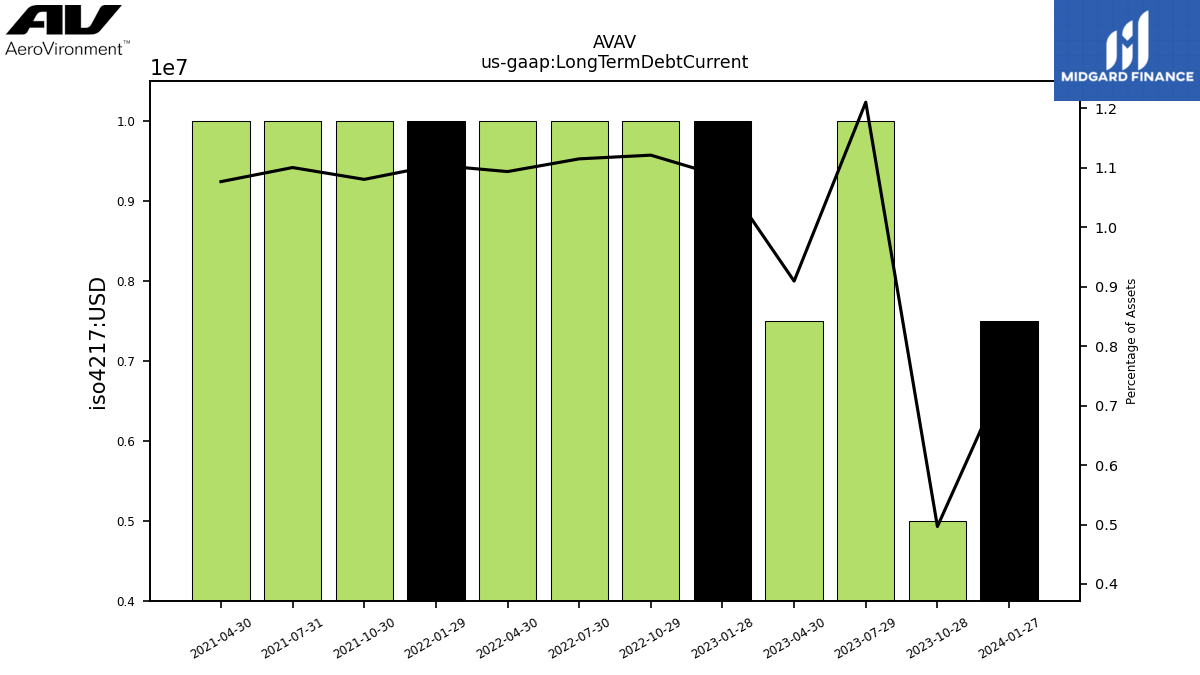
| Long Term Debt Current | 7.50 | 5.00 | 10.00 | 7.50 | 10.00 | 10.00 | 10.00 | 10.00 | 10.00 | 10.00 | 10.00 | 10.00 | NA | NA | NA | NA | NA | NA | NA | NA | NA | NA | NA | NA | NA | NA | NA | NA | NA | NA | NA | NA | NA | NA | NA | NA | NA | NA | NA | NA | NA | NA | NA | NA | NA | NA | NA | NA | NA | NA | NA | NA | NA | NA | NA | NA | NA | NA | NA | NA | NA | |
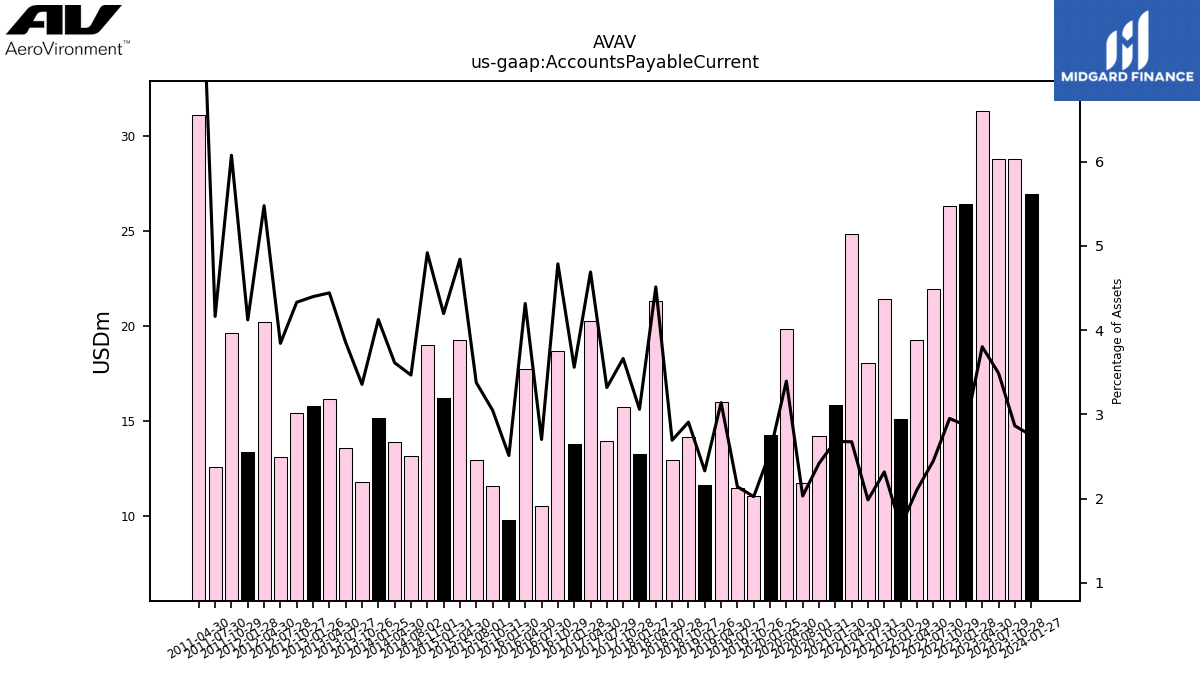
| Accounts Payable Current | 26.97 | 28.83 | 28.82 | 31.36 | 26.42 | 26.32 | 21.95 | 19.24 | 15.12 | 21.44 | 18.05 | 24.84 | 15.84 | 14.22 | 11.74 | 19.86 | NA | 14.27 | NA | 11.02 | NA | 11.45 | 15.97 | NA | 11.63 | NA | 14.15 | NA | 12.94 | 21.34 | 13.25 | 15.72 | 13.97 | 20.28 | 13.79 | 18.66 | 10.53 | 17.71 | 9.79 | 11.59 | 12.94 | 19.24 | 16.21 | 18.99 | 13.12 | 13.91 | 15.13 | 11.77 | 13.54 | 16.14 | 15.78 | 15.43 | 13.09 | 20.21 | 13.38 | 19.62 | 12.55 | 31.13 | NA | NA | NA | |
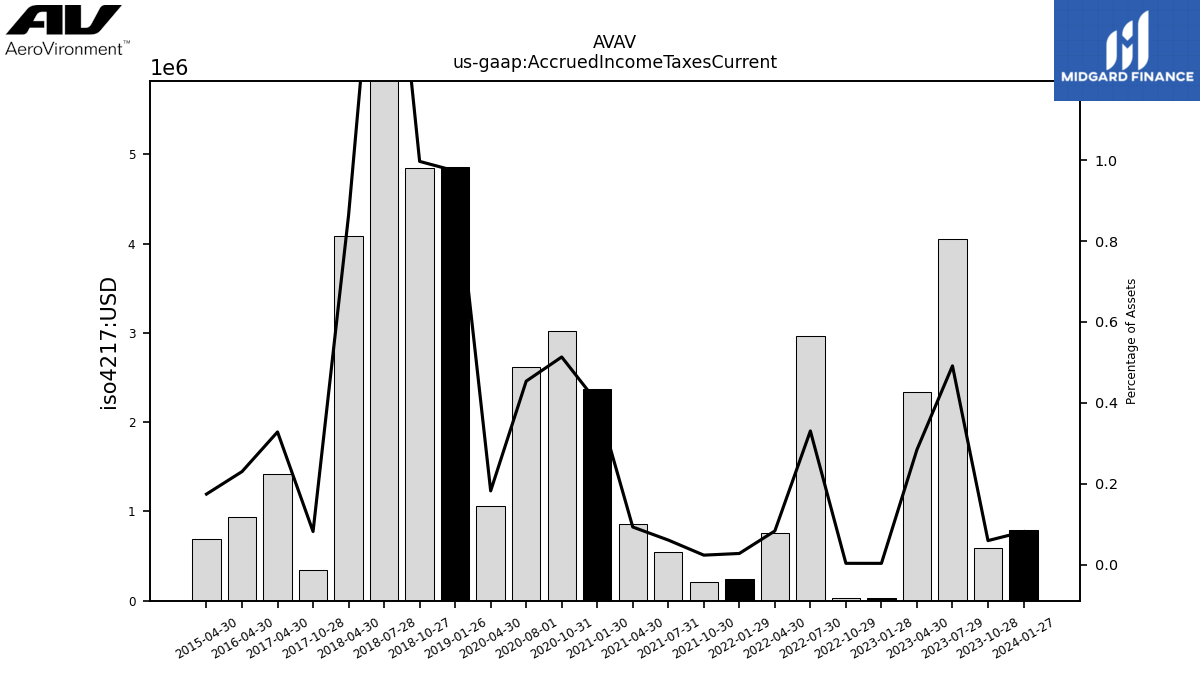
| Accrued Income Taxes Current | 0.80 | 0.59 | 4.06 | 2.34 | 0.03 | 0.03 | 2.96 | 0.76 | 0.25 | 0.21 | 0.55 | 0.86 | 2.37 | 3.02 | 2.62 | 1.06 | NA | NA | NA | NA | NA | NA | NA | NA | 4.86 | NA | 4.85 | NA | 8.90 | 4.08 | NA | 0.35 | NA | 1.42 | NA | NA | NA | 0.94 | NA | NA | NA | 0.69 | NA | NA | NA | NA | NA | NA | NA | NA | NA | NA | NA | NA | NA | NA | NA | NA | NA | NA | NA | |
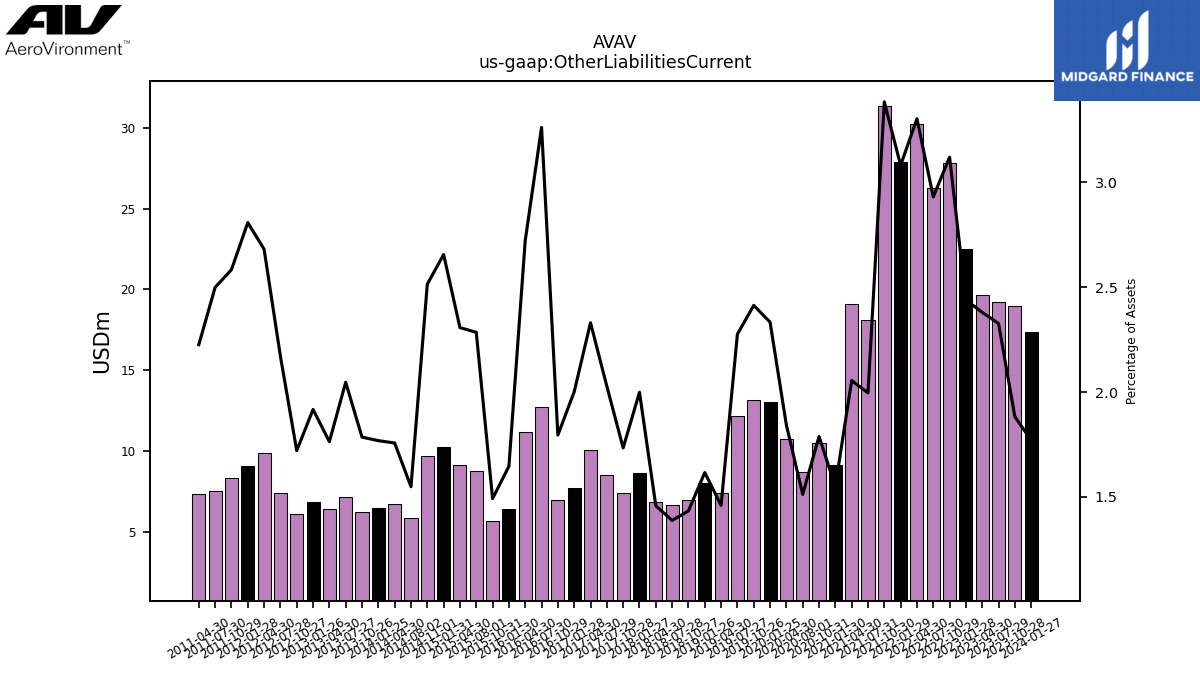
| Other Liabilities Current | 17.35 | 18.95 | 19.22 | 19.63 | 22.47 | 27.82 | 26.28 | 30.20 | 27.90 | 31.31 | 18.13 | 19.08 | 9.16 | 10.51 | 8.73 | 10.78 | NA | 13.05 | NA | 13.14 | NA | 12.17 | 7.42 | NA | 8.06 | NA | 6.97 | NA | 6.66 | 6.89 | 8.65 | 7.44 | 8.53 | 10.08 | 7.75 | 7.00 | 12.71 | 11.17 | 6.41 | 5.67 | 8.76 | 9.17 | 10.26 | 9.71 | 5.86 | 6.76 | 6.49 | 6.26 | 7.19 | 6.41 | 6.88 | 6.13 | 7.39 | 9.90 | 9.11 | 8.34 | 7.54 | 7.38 | NA | NA | NA | |
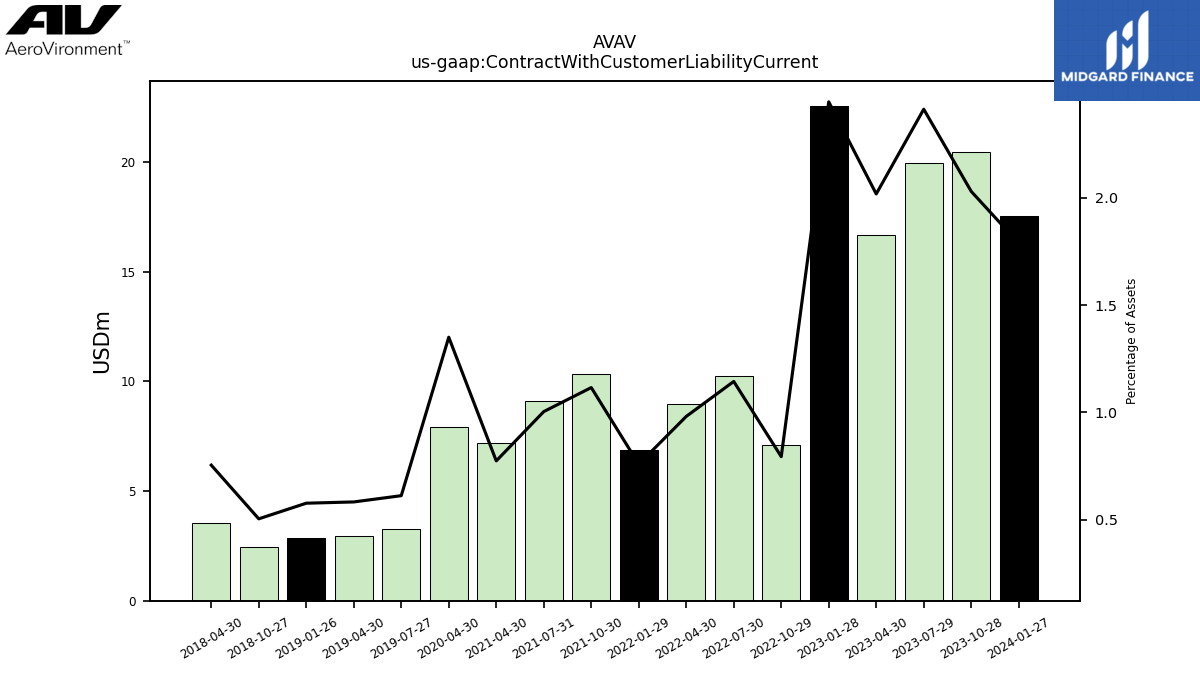
| Contract With Customer Liability Current | 17.54 | 20.44 | 19.94 | 16.64 | 22.55 | 7.07 | 10.26 | 8.97 | 6.86 | 10.32 | 9.12 | 7.18 | NA | NA | NA | 7.90 | NA | NA | NA | NA | NA | 3.27 | 2.96 | NA | 2.88 | NA | 2.45 | NA | NA | 3.56 | NA | NA | NA | NA | NA | NA | NA | NA | NA | NA | NA | NA | NA | NA | NA | NA | NA | NA | NA | NA | NA | NA | NA | NA | NA | NA | NA | NA | NA | NA | NA |
| 2024-01-27 | 2023-10-28 | 2023-07-29 | 2023-04-30 | 2023-01-28 | 2022-10-29 | 2022-07-30 | 2022-04-30 | 2022-01-29 | 2021-10-30 | 2021-07-31 | 2021-04-30 | 2021-01-30 | 2020-10-31 | 2020-08-01 | 2020-04-30 | 2020-01-31 | 2020-01-25 | 2019-10-31 | 2019-10-26 | 2019-07-31 | 2019-07-27 | 2019-04-30 | 2019-01-31 | 2019-01-26 | 2018-10-31 | 2018-10-27 | 2018-07-31 | 2018-07-28 | 2018-04-30 | 2018-01-27 | 2017-10-28 | 2017-07-29 | 2017-04-30 | 2017-01-28 | 2016-10-29 | 2016-07-30 | 2016-04-30 | 2016-01-30 | 2015-10-31 | 2015-08-01 | 2015-04-30 | 2015-01-31 | 2014-11-01 | 2014-08-02 | 2014-04-30 | 2014-01-25 | 2013-10-26 | 2013-07-27 | 2013-04-30 | 2013-01-26 | 2012-10-27 | 2012-07-28 | 2012-04-30 | 2012-01-28 | 2011-10-29 | 2011-07-30 | 2011-04-30 | 2011-01-29 | 2010-10-30 | 2010-07-31 | ||
|---|---|---|---|---|---|---|---|---|---|---|---|---|---|---|---|---|---|---|---|---|---|---|---|---|---|---|---|---|---|---|---|---|---|---|---|---|---|---|---|---|---|---|---|---|---|---|---|---|---|---|---|---|---|---|---|---|---|---|---|---|---|---|
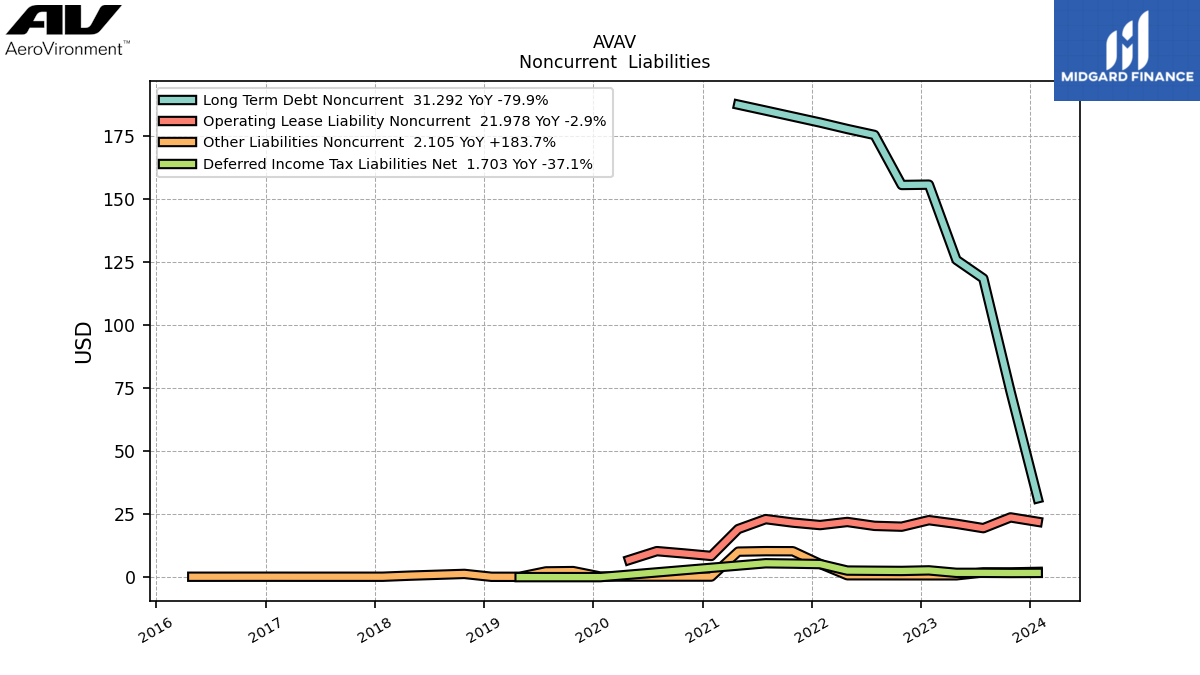
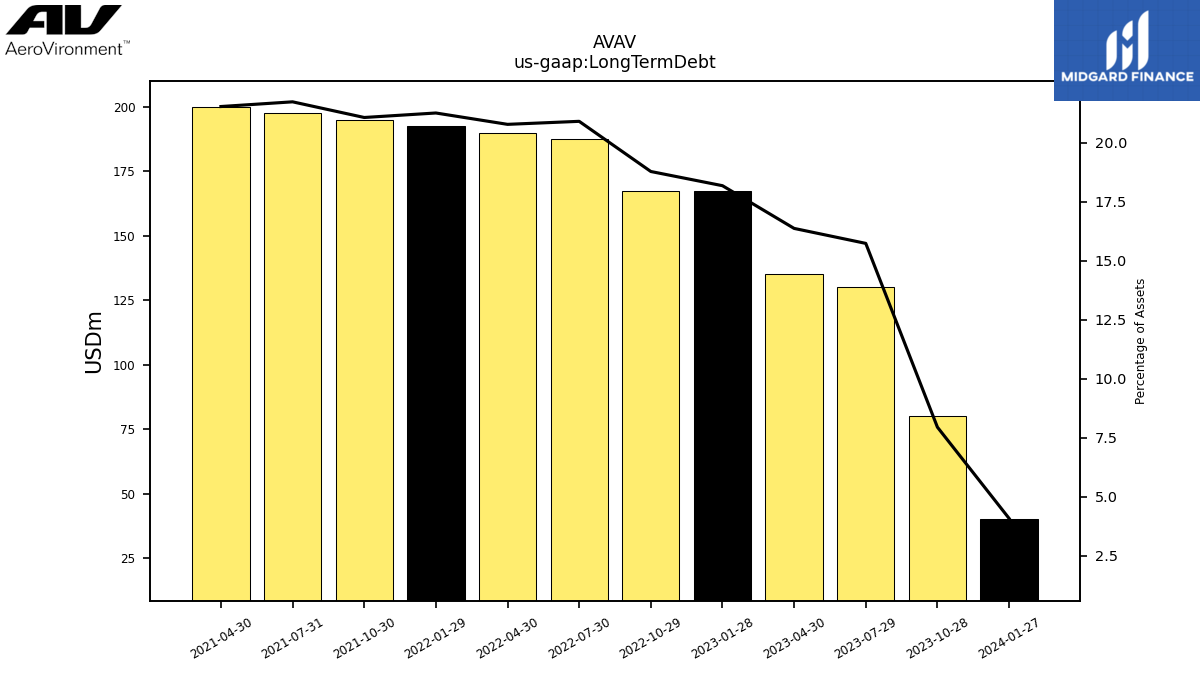
| Long Term Debt | 40.00 | 80.00 | 130.00 | 135.00 | 167.50 | 167.50 | 187.50 | 190.00 | 192.50 | 195.00 | 197.50 | 200.00 | NA | NA | NA | NA | NA | NA | NA | NA | NA | NA | NA | NA | NA | NA | NA | NA | NA | NA | NA | NA | NA | NA | NA | NA | NA | NA | NA | NA | NA | NA | NA | NA | NA | NA | NA | NA | NA | NA | NA | NA | NA | NA | NA | NA | NA | NA | NA | NA | NA | |
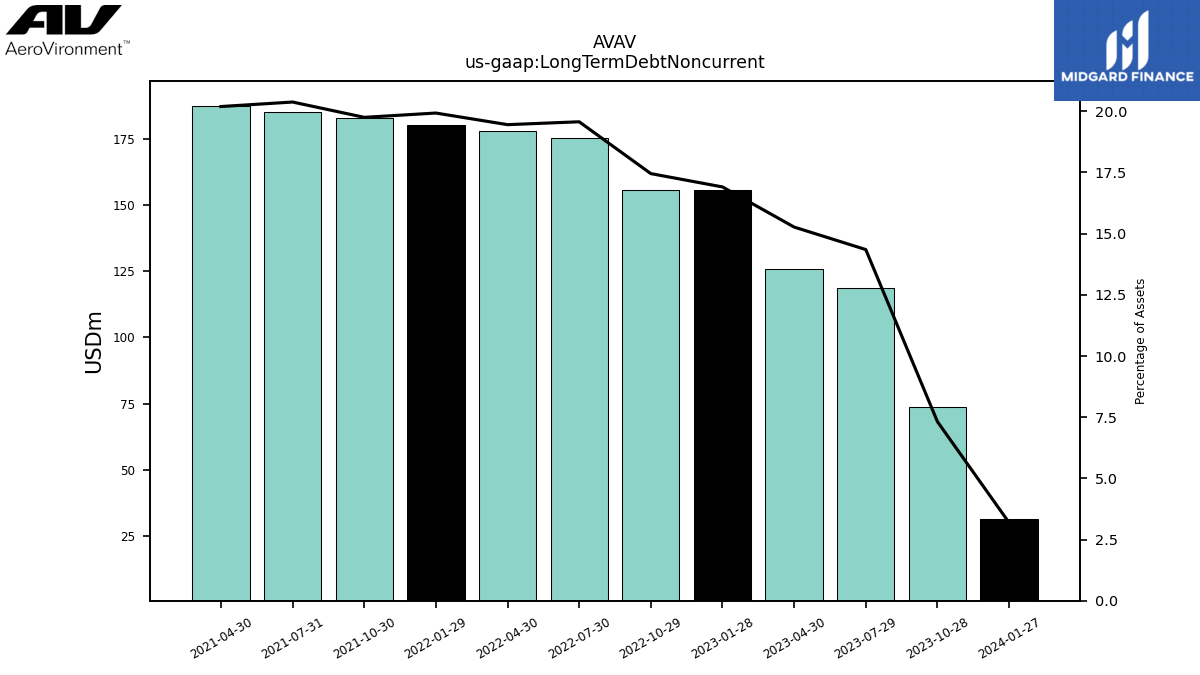
| Long Term Debt Noncurrent | 31.29 | 73.68 | 118.54 | 125.90 | 155.76 | 155.62 | 175.48 | 177.84 | 180.40 | 182.77 | 185.14 | 187.51 | NA | NA | NA | NA | NA | NA | NA | NA | NA | NA | NA | NA | NA | NA | NA | NA | NA | NA | NA | NA | NA | NA | NA | NA | NA | NA | NA | NA | NA | NA | NA | NA | NA | NA | NA | NA | NA | NA | NA | NA | NA | NA | NA | NA | NA | NA | NA | NA | NA | |
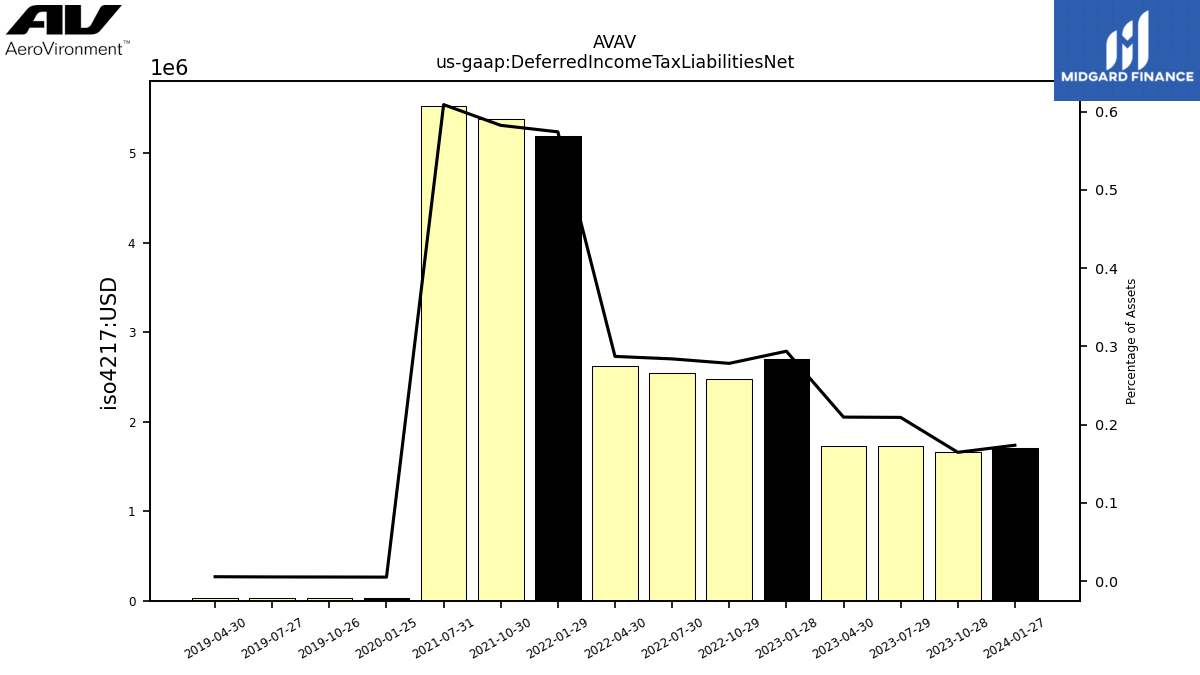
| Deferred Income Tax Liabilities Net | 1.70 | 1.66 | 1.73 | 1.73 | 2.71 | 2.48 | 2.55 | 2.63 | 5.20 | 5.39 | 5.53 | NA | NA | NA | NA | NA | NA | 0.03 | NA | 0.03 | NA | 0.03 | 0.03 | NA | NA | NA | NA | NA | NA | NA | NA | NA | NA | NA | NA | NA | NA | NA | NA | NA | NA | NA | NA | NA | NA | NA | NA | NA | NA | NA | NA | NA | NA | NA | NA | NA | NA | NA | NA | NA | NA | |
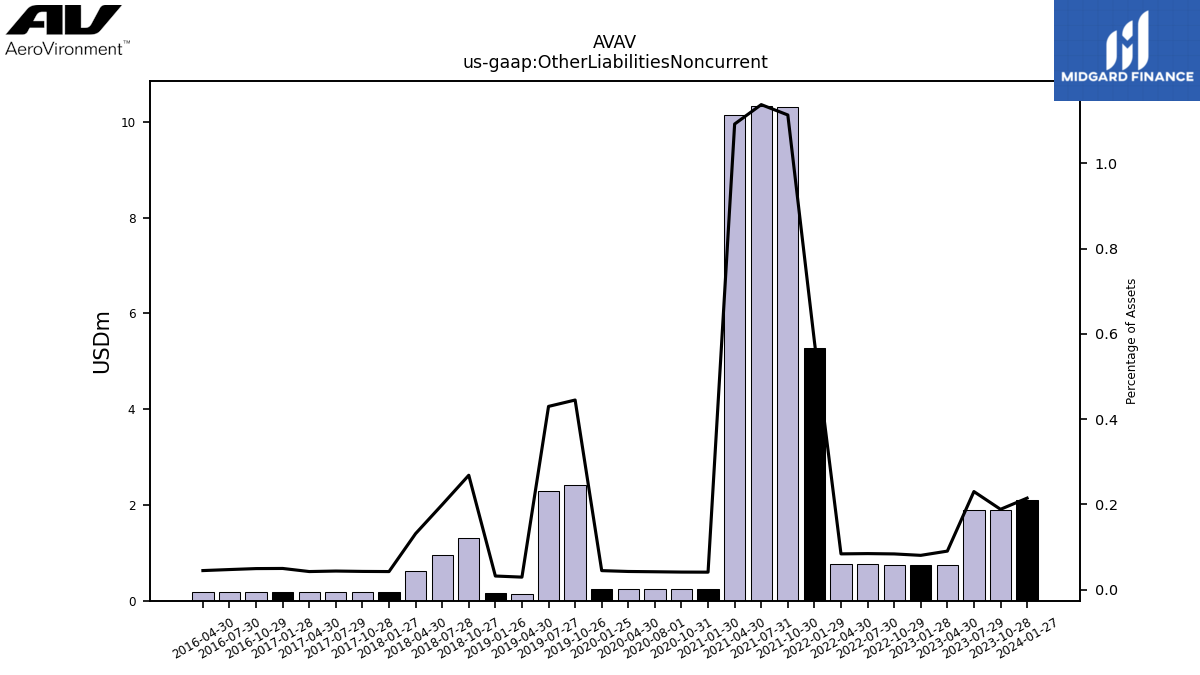
| Other Liabilities Noncurrent | 2.10 | 1.90 | 1.90 | 0.75 | 0.74 | 0.75 | 0.76 | 0.77 | 5.27 | 10.30 | 10.34 | 10.14 | 0.24 | 0.24 | 0.24 | 0.25 | NA | 0.25 | NA | 2.42 | NA | 2.30 | 0.15 | NA | 0.16 | NA | 1.31 | NA | 0.96 | 0.62 | 0.18 | 0.18 | 0.18 | 0.18 | 0.19 | 0.19 | 0.18 | 0.18 | NA | NA | NA | NA | NA | NA | NA | NA | NA | NA | NA | NA | NA | NA | NA | NA | NA | NA | NA | NA | NA | NA | NA | |
| Operating Lease Liability Noncurrent | 21.98 | 23.73 | 19.45 | 21.19 | 22.63 | 20.04 | 20.37 | 21.91 | 20.68 | 21.66 | 23.05 | 19.10 | 8.43 | 9.42 | 10.34 | 6.83 | NA | NA | NA | NA | NA | NA | NA | NA | NA | NA | NA | NA | NA | NA | NA | NA | NA | NA | NA | NA | NA | NA | NA | NA | NA | NA | NA | NA | NA | NA | NA | NA | NA | NA | NA | NA | NA | NA | NA | NA | NA | NA | NA | NA | NA |
| 2024-01-27 | 2023-10-28 | 2023-07-29 | 2023-04-30 | 2023-01-28 | 2022-10-29 | 2022-07-30 | 2022-04-30 | 2022-01-29 | 2021-10-30 | 2021-07-31 | 2021-04-30 | 2021-01-30 | 2020-10-31 | 2020-08-01 | 2020-04-30 | 2020-01-31 | 2020-01-25 | 2019-10-31 | 2019-10-26 | 2019-07-31 | 2019-07-27 | 2019-04-30 | 2019-01-31 | 2019-01-26 | 2018-10-31 | 2018-10-27 | 2018-07-31 | 2018-07-28 | 2018-04-30 | 2018-01-27 | 2017-10-28 | 2017-07-29 | 2017-04-30 | 2017-01-28 | 2016-10-29 | 2016-07-30 | 2016-04-30 | 2016-01-30 | 2015-10-31 | 2015-08-01 | 2015-04-30 | 2015-01-31 | 2014-11-01 | 2014-08-02 | 2014-04-30 | 2014-01-25 | 2013-10-26 | 2013-07-27 | 2013-04-30 | 2013-01-26 | 2012-10-27 | 2012-07-28 | 2012-04-30 | 2012-01-28 | 2011-10-29 | 2011-07-30 | 2011-04-30 | 2011-01-29 | 2010-10-30 | 2010-07-31 | ||
|---|---|---|---|---|---|---|---|---|---|---|---|---|---|---|---|---|---|---|---|---|---|---|---|---|---|---|---|---|---|---|---|---|---|---|---|---|---|---|---|---|---|---|---|---|---|---|---|---|---|---|---|---|---|---|---|---|---|---|---|---|---|---|
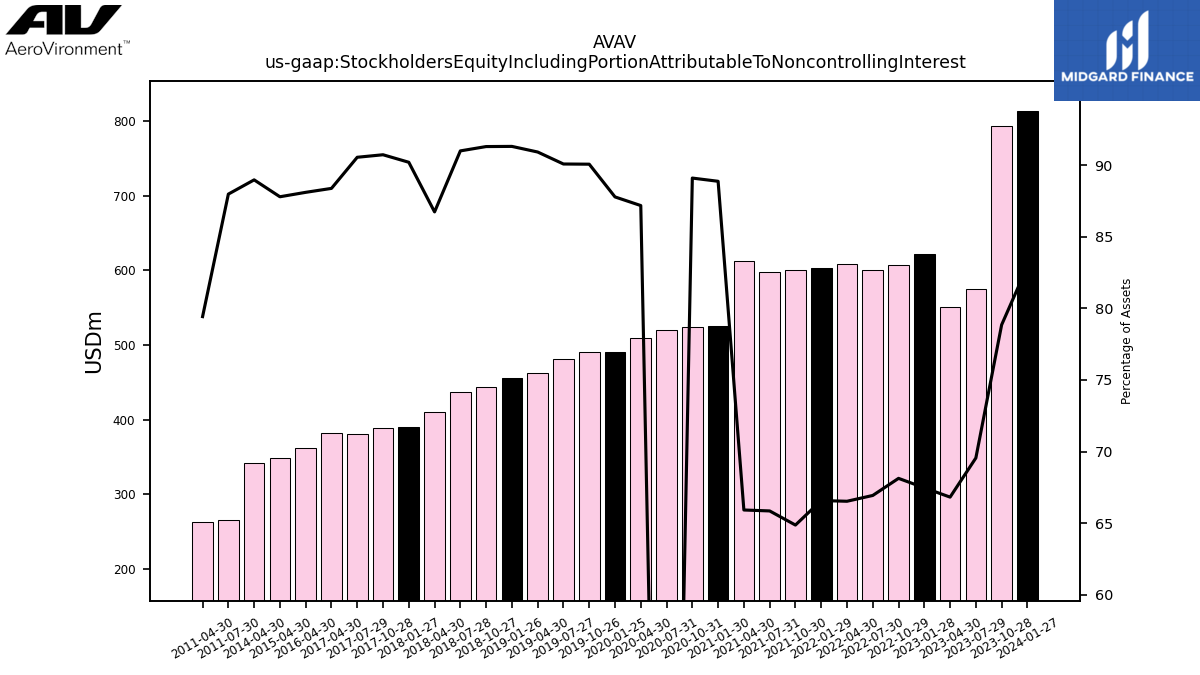
| Stockholders Equity Including Portion Attributable To Noncontrolling Interest | 812.99 | 793.73 | 574.54 | 550.97 | 621.51 | 607.48 | 600.17 | 608.21 | 602.72 | 600.23 | 598.32 | 612.11 | 525.18 | 523.85 | NA | 509.90 | NA | 490.72 | NA | 490.36 | NA | 481.50 | 462.57 | NA | 455.55 | NA | 444.18 | NA | 437.06 | 410.14 | 390.39 | 389.41 | 380.94 | 382.19 | NA | NA | NA | 361.52 | NA | NA | NA | 348.91 | NA | NA | NA | 342.47 | NA | NA | NA | NA | NA | NA | NA | NA | NA | NA | 265.20 | 263.47 | NA | NA | NA | |
| Common Stock Value | 0.00 | 0.00 | 0.00 | 0.00 | 0.00 | 0.00 | 0.00 | 0.00 | 0.00 | 0.00 | 0.00 | 0.00 | 0.00 | 0.00 | 0.00 | 0.00 | NA | 0.00 | NA | 0.00 | NA | 0.00 | 0.00 | NA | 0.00 | NA | 0.00 | NA | 0.00 | 0.00 | 0.00 | 0.00 | 0.00 | 0.00 | 0.00 | 0.00 | 0.00 | 0.00 | 0.00 | 0.00 | 0.00 | 0.00 | 0.00 | 0.00 | 0.00 | 0.00 | 0.00 | 0.00 | 0.00 | 0.00 | 0.00 | 0.00 | 0.00 | 0.00 | 0.00 | 0.00 | 0.00 | 0.00 | NA | NA | NA | |
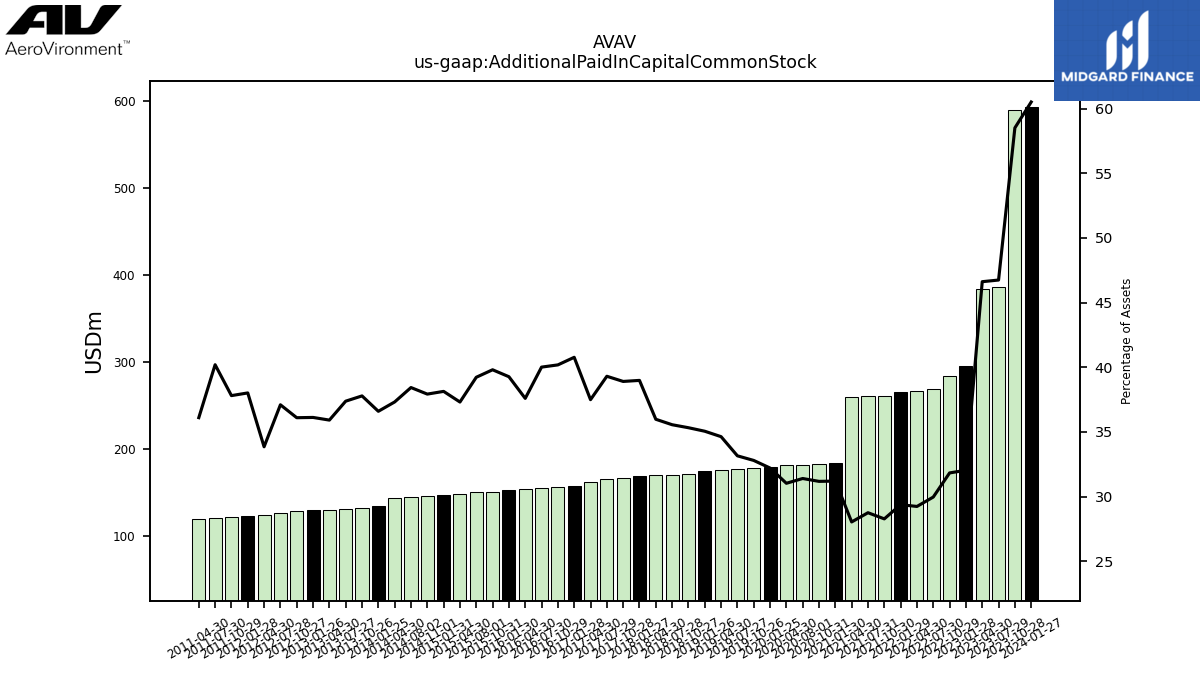
| Additional Paid In Capital Common Stock | 593.23 | 589.05 | 386.14 | 384.40 | 295.07 | 283.79 | 268.64 | 267.25 | 265.88 | 261.61 | 261.19 | 260.33 | 184.37 | 183.30 | 181.41 | 181.48 | NA | 180.05 | NA | 178.55 | NA | 177.21 | 176.22 | NA | 174.89 | NA | 171.87 | NA | 170.79 | 170.14 | 168.74 | 166.99 | 165.36 | 162.15 | 157.96 | 156.67 | 155.85 | 154.27 | 152.94 | 151.27 | 150.34 | 148.29 | 147.37 | 146.43 | 145.50 | 143.65 | 134.25 | 132.55 | 131.40 | 130.53 | 129.59 | 128.61 | 126.31 | 124.95 | 123.37 | 122.09 | 121.17 | 119.77 | NA | NA | NA | |
| Retained Earnings Accumulated Deficit | 224.64 | 210.76 | 192.92 | 171.02 | 331.49 | 332.17 | 338.84 | 347.23 | 339.98 | 339.96 | 337.44 | 351.42 | 340.48 | 340.26 | 338.17 | 328.09 | NA | 310.62 | NA | 311.63 | NA | 304.13 | 286.35 | NA | 280.67 | NA | 272.30 | NA | 266.24 | 240.00 | 221.68 | 222.50 | 215.49 | 219.93 | 189.45 | 191.64 | 195.81 | 207.19 | 201.82 | 195.66 | 194.99 | 201.97 | 194.90 | 192.57 | 195.47 | 199.08 | 191.02 | 179.81 | 178.15 | 185.36 | 186.16 | 182.29 | 173.55 | 174.94 | 157.14 | 151.40 | 144.81 | 144.49 | NA | NA | NA | |
| Accumulated Other Comprehensive Income Loss Net Of Tax | -4.89 | -6.08 | -4.51 | -4.45 | -5.05 | -8.48 | -7.56 | -6.51 | -3.43 | -1.68 | -0.39 | 0.34 | 0.35 | 0.34 | 0.35 | 0.33 | NA | 0.07 | NA | 0.18 | NA | 0.17 | 0.00 | NA | 0.00 | NA | 0.01 | NA | 0.02 | -0.02 | -0.03 | -0.10 | -0.12 | -0.13 | -0.17 | -0.16 | -0.18 | -0.20 | -0.19 | -0.20 | -0.23 | -1.36 | -1.44 | -0.86 | -0.21 | -0.26 | -0.62 | -0.68 | -0.75 | -0.70 | -0.65 | -0.67 | -0.66 | -0.69 | -0.70 | -0.74 | -0.78 | -0.78 | NA | NA | NA | |
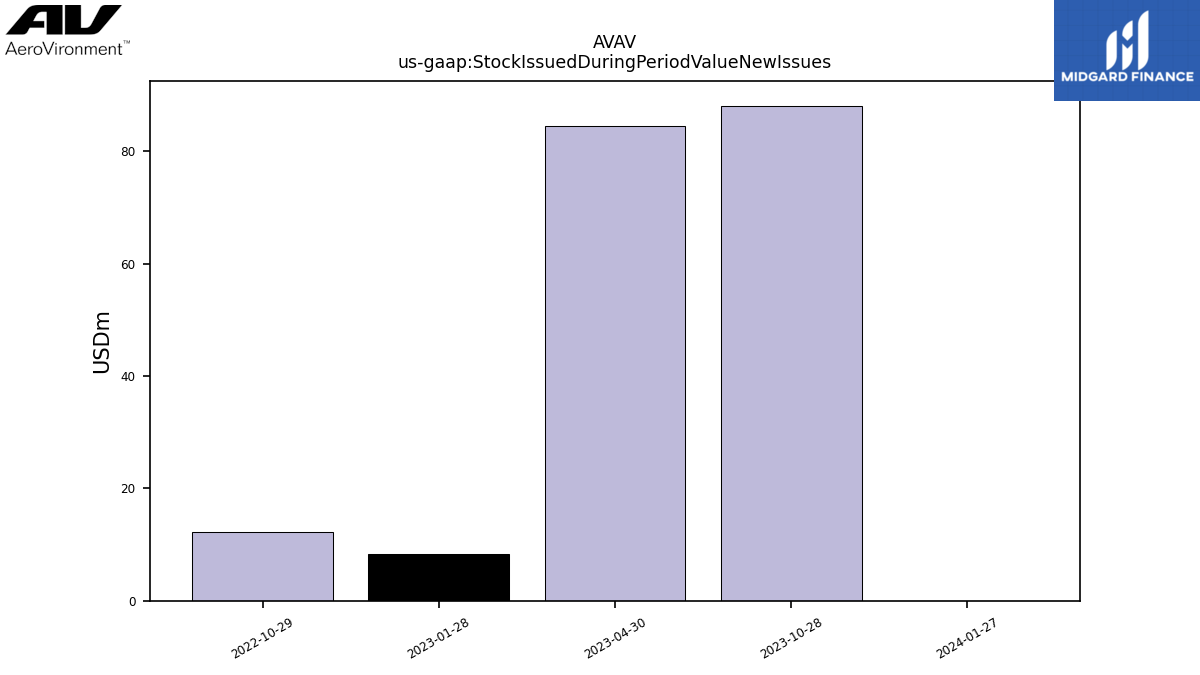
| Stock Issued During Period Value New Issues | 0.00 | 88.12 | NA | 84.47 | 8.39 | 12.31 | NA | NA | NA | NA | NA | NA | NA | NA | NA | NA | NA | NA | NA | NA | NA | NA | NA | NA | NA | NA | NA | NA | NA | NA | NA | NA | NA | NA | NA | NA | NA | NA | NA | NA | NA | NA | NA | NA | NA | NA | NA | NA | NA | NA | NA | NA | NA | NA | NA | NA | NA | NA | NA | NA | NA | |
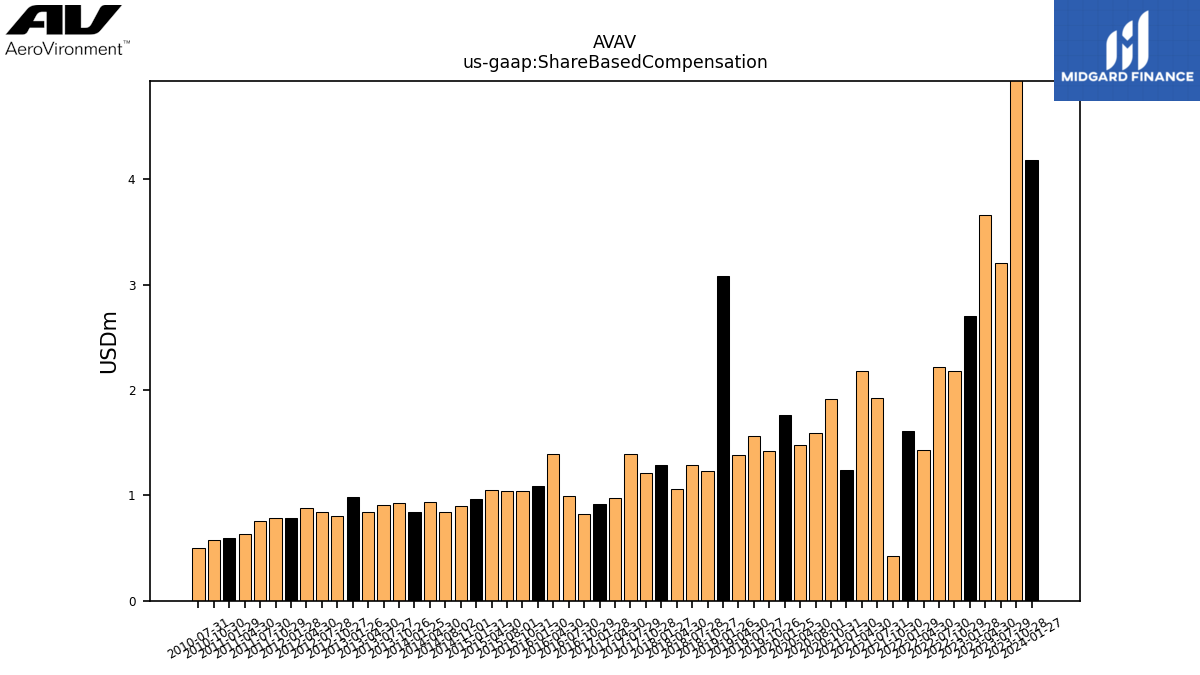
| Adjustments To Additional Paid In Capital Sharebased Compensation Requisite Service Period Recognition Value | 4.18 | 5.04 | 3.20 | 3.66 | 2.71 | 2.19 | 2.22 | 1.43 | 1.62 | 0.42 | 1.92 | 2.18 | 1.25 | 1.91 | 1.59 | 1.48 | NA | 1.77 | NA | 1.42 | NA | 1.57 | 1.39 | NA | 3.08 | NA | 1.23 | NA | 1.40 | NA | NA | NA | NA | NA | NA | NA | NA | NA | NA | NA | NA | NA | NA | NA | NA | NA | NA | NA | NA | NA | NA | NA | NA | NA | NA | NA | NA | NA | NA | NA | NA |
| 2024-01-27 | 2023-10-28 | 2023-07-29 | 2023-04-30 | 2023-01-28 | 2022-10-29 | 2022-07-30 | 2022-04-30 | 2022-01-29 | 2021-10-30 | 2021-07-31 | 2021-04-30 | 2021-01-30 | 2020-10-31 | 2020-08-01 | 2020-04-30 | 2020-01-31 | 2020-01-25 | 2019-10-31 | 2019-10-26 | 2019-07-31 | 2019-07-27 | 2019-04-30 | 2019-01-31 | 2019-01-26 | 2018-10-31 | 2018-10-27 | 2018-07-31 | 2018-07-28 | 2018-04-30 | 2018-01-27 | 2017-10-28 | 2017-07-29 | 2017-04-30 | 2017-01-28 | 2016-10-29 | 2016-07-30 | 2016-04-30 | 2016-01-30 | 2015-10-31 | 2015-08-01 | 2015-04-30 | 2015-01-31 | 2014-11-01 | 2014-08-02 | 2014-04-30 | 2014-01-25 | 2013-10-26 | 2013-07-27 | 2013-04-30 | 2013-01-26 | 2012-10-27 | 2012-07-28 | 2012-04-30 | 2012-01-28 | 2011-10-29 | 2011-07-30 | 2011-04-30 | 2011-01-29 | 2010-10-30 | 2010-07-31 | ||
|---|---|---|---|---|---|---|---|---|---|---|---|---|---|---|---|---|---|---|---|---|---|---|---|---|---|---|---|---|---|---|---|---|---|---|---|---|---|---|---|---|---|---|---|---|---|---|---|---|---|---|---|---|---|---|---|---|---|---|---|---|---|---|
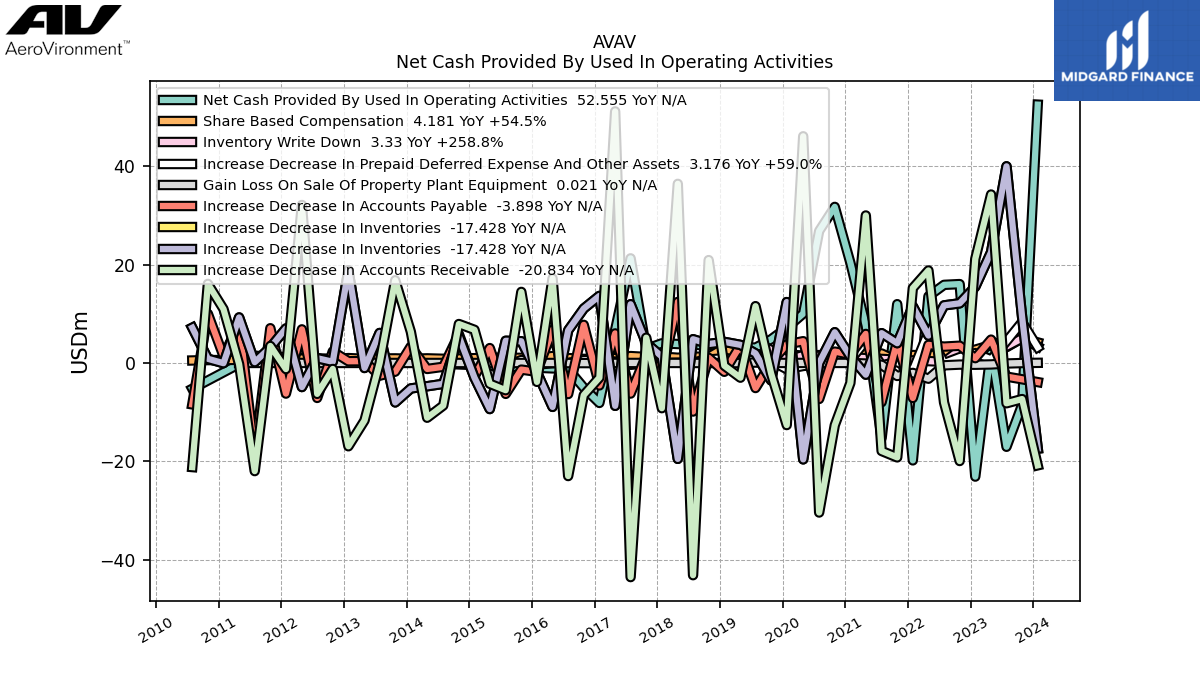
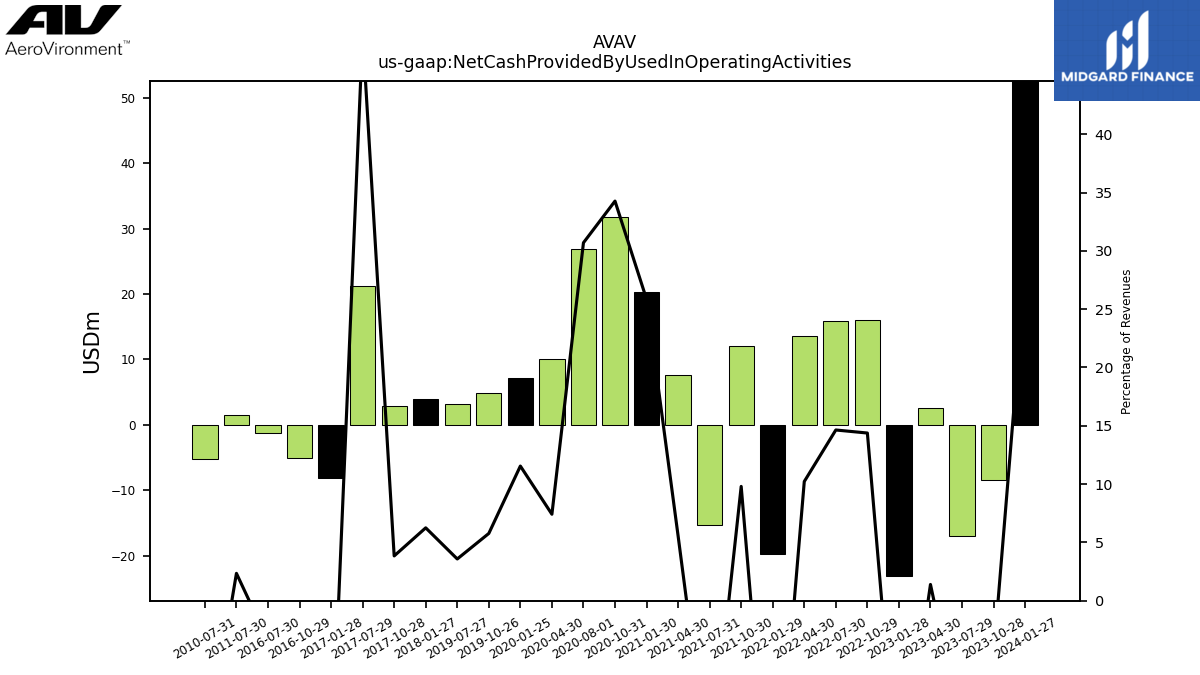
| Net Cash Provided By Used In Operating Activities | 52.55 | -8.53 | -17.06 | 2.60 | -23.13 | 16.05 | 15.89 | 13.56 | -19.83 | 11.96 | -15.30 | 7.57 | 20.37 | 31.75 | 26.84 | 10.03 | NA | 7.15 | NA | 4.81 | NA | 3.11 | NA | NA | NA | NA | NA | NA | NA | NA | 4.00 | 2.84 | 21.28 | NA | -8.14 | -5.04 | -1.24 | NA | NA | NA | NA | NA | NA | NA | NA | NA | NA | NA | NA | NA | NA | NA | NA | NA | NA | NA | 1.46 | NA | NA | NA | -5.25 | |
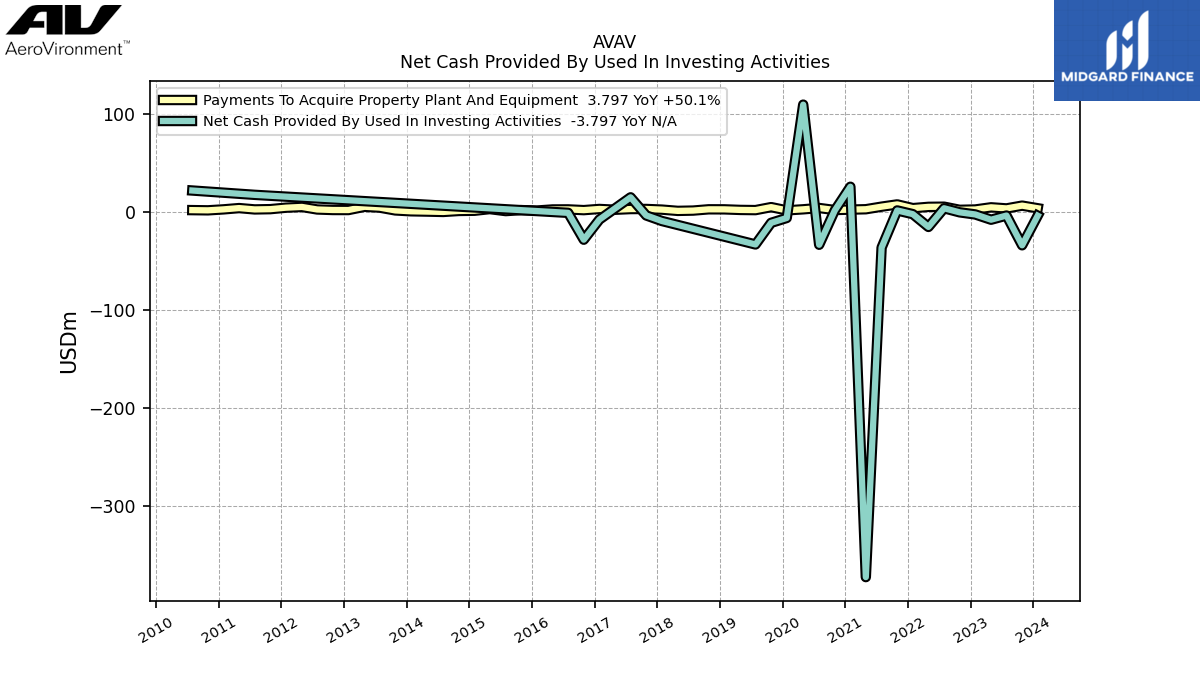
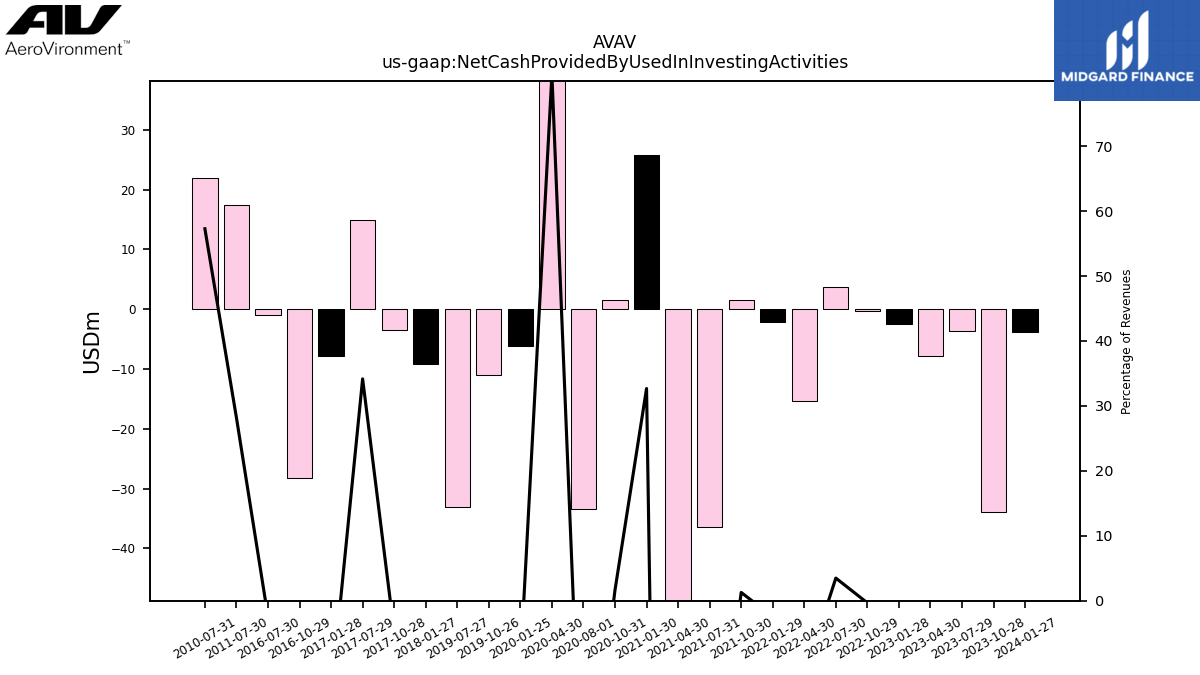
| Net Cash Provided By Used In Investing Activities | -3.80 | -34.00 | -3.63 | -7.89 | -2.53 | -0.37 | 3.79 | -15.28 | -2.22 | 1.56 | -36.34 | -372.57 | 25.74 | 1.53 | -33.47 | 109.53 | NA | -6.13 | NA | -11.08 | NA | -33.15 | NA | NA | NA | NA | NA | NA | NA | NA | -9.20 | -3.54 | 14.95 | NA | -7.75 | -28.30 | -0.89 | NA | NA | NA | NA | NA | NA | NA | NA | NA | NA | NA | NA | NA | NA | NA | NA | NA | NA | NA | 17.48 | NA | NA | NA | 21.90 | |
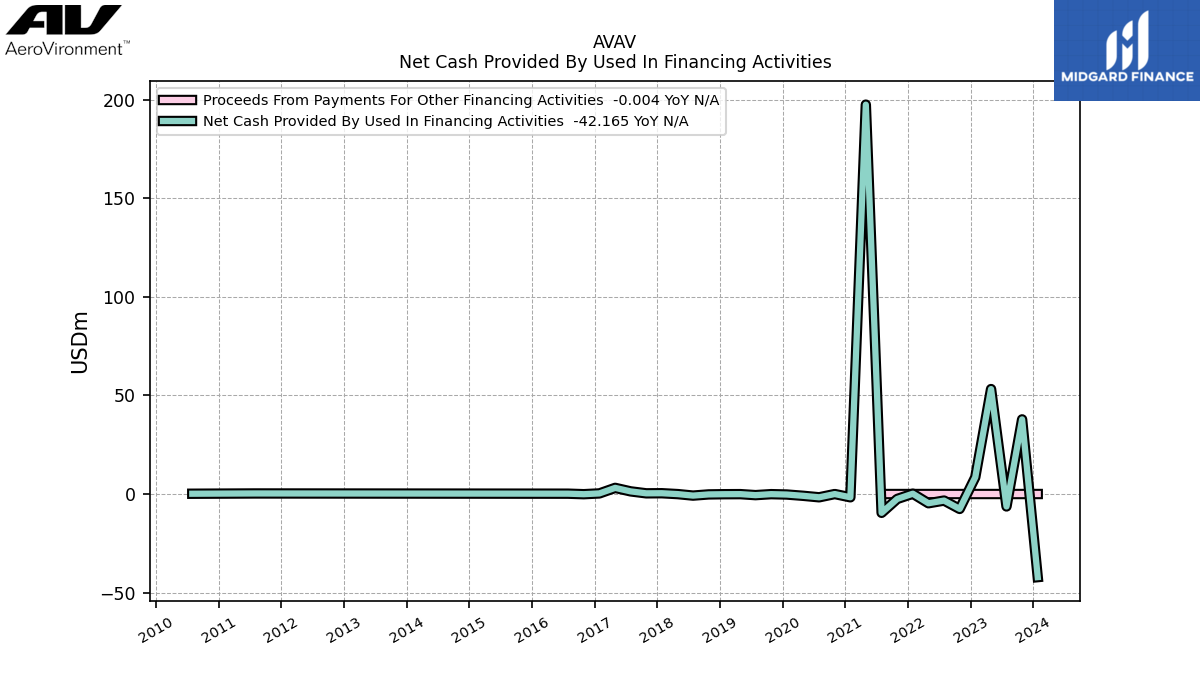
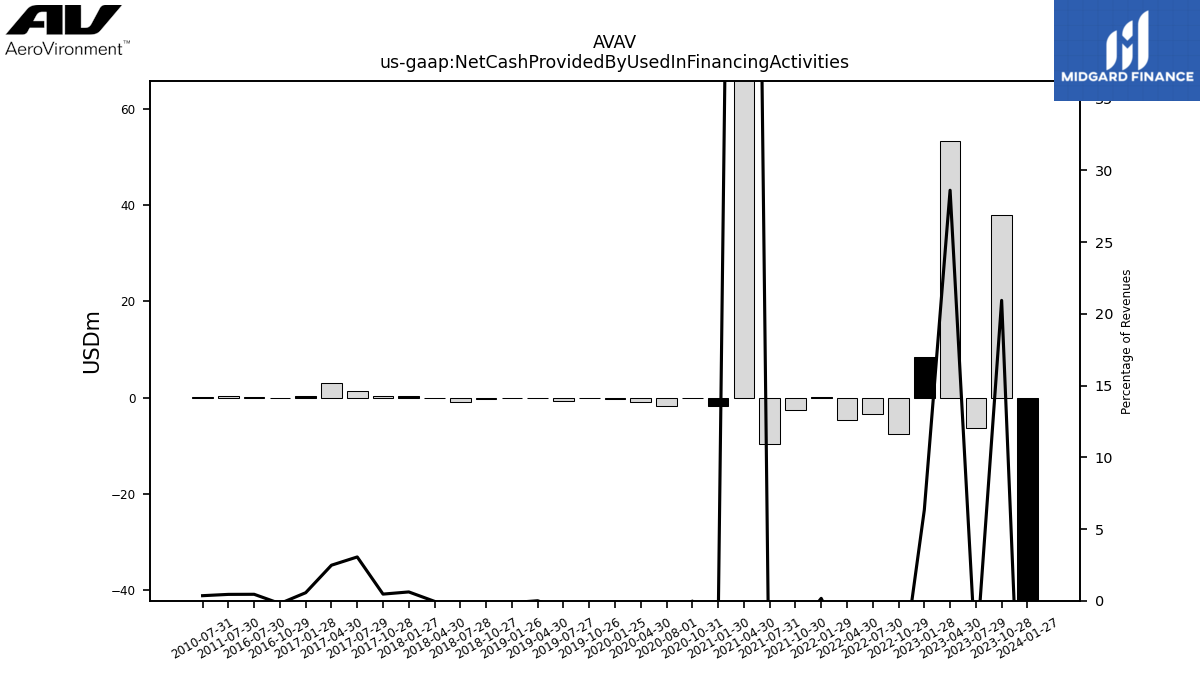
| Net Cash Provided By Used In Financing Activities | -42.16 | 37.86 | -6.32 | 53.24 | 8.51 | -7.58 | -3.33 | -4.69 | 0.15 | -2.51 | -9.56 | 197.52 | -1.67 | -0.02 | -1.67 | -0.91 | NA | -0.27 | NA | -0.07 | NA | -0.57 | -0.07 | NA | -0.10 | NA | -0.21 | NA | -0.81 | -0.05 | 0.39 | 0.34 | 1.34 | 3.11 | 0.30 | -0.10 | 0.16 | NA | NA | NA | NA | NA | NA | NA | NA | NA | NA | NA | NA | NA | NA | NA | NA | NA | NA | NA | 0.28 | NA | NA | NA | 0.14 |
| 2024-01-27 | 2023-10-28 | 2023-07-29 | 2023-04-30 | 2023-01-28 | 2022-10-29 | 2022-07-30 | 2022-04-30 | 2022-01-29 | 2021-10-30 | 2021-07-31 | 2021-04-30 | 2021-01-30 | 2020-10-31 | 2020-08-01 | 2020-04-30 | 2020-01-31 | 2020-01-25 | 2019-10-31 | 2019-10-26 | 2019-07-31 | 2019-07-27 | 2019-04-30 | 2019-01-31 | 2019-01-26 | 2018-10-31 | 2018-10-27 | 2018-07-31 | 2018-07-28 | 2018-04-30 | 2018-01-27 | 2017-10-28 | 2017-07-29 | 2017-04-30 | 2017-01-28 | 2016-10-29 | 2016-07-30 | 2016-04-30 | 2016-01-30 | 2015-10-31 | 2015-08-01 | 2015-04-30 | 2015-01-31 | 2014-11-01 | 2014-08-02 | 2014-04-30 | 2014-01-25 | 2013-10-26 | 2013-07-27 | 2013-04-30 | 2013-01-26 | 2012-10-27 | 2012-07-28 | 2012-04-30 | 2012-01-28 | 2011-10-29 | 2011-07-30 | 2011-04-30 | 2011-01-29 | 2010-10-30 | 2010-07-31 | ||
|---|---|---|---|---|---|---|---|---|---|---|---|---|---|---|---|---|---|---|---|---|---|---|---|---|---|---|---|---|---|---|---|---|---|---|---|---|---|---|---|---|---|---|---|---|---|---|---|---|---|---|---|---|---|---|---|---|---|---|---|---|---|---|
| Net Cash Provided By Used In Operating Activities | 52.55 | -8.53 | -17.06 | 2.60 | -23.13 | 16.05 | 15.89 | 13.56 | -19.83 | 11.96 | -15.30 | 7.57 | 20.37 | 31.75 | 26.84 | 10.03 | NA | 7.15 | NA | 4.81 | NA | 3.11 | NA | NA | NA | NA | NA | NA | NA | NA | 4.00 | 2.84 | 21.28 | NA | -8.14 | -5.04 | -1.24 | NA | NA | NA | NA | NA | NA | NA | NA | NA | NA | NA | NA | NA | NA | NA | NA | NA | NA | NA | 1.46 | NA | NA | NA | -5.25 | |
| Profit Loss | 13.88 | 17.84 | 21.89 | -160.47 | -0.68 | -6.63 | -8.39 | 7.21 | -0.04 | 2.56 | -13.92 | 10.97 | 0.26 | 2.07 | 10.04 | 17.49 | NA | -1.03 | NA | 7.50 | NA | 17.10 | 5.70 | NA | 8.35 | NA | 6.05 | NA | 27.32 | 18.34 | -0.84 | 6.81 | -4.47 | 30.45 | -2.18 | -4.17 | -11.64 | NA | NA | NA | NA | NA | NA | NA | NA | NA | NA | NA | NA | NA | NA | NA | NA | NA | NA | NA | 0.33 | NA | NA | NA | -3.44 | |
| Depreciation Depletion And Amortization | 9.58 | 8.44 | 6.95 | 51.89 | 15.83 | 18.27 | 14.00 | 13.39 | 17.42 | 16.36 | 13.65 | 10.61 | 2.96 | 2.91 | 2.78 | 2.78 | NA | 2.62 | NA | 2.41 | NA | 2.08 | 2.14 | NA | 1.95 | NA | 1.84 | NA | 1.75 | 0.38 | 1.91 | 1.83 | 1.86 | 1.87 | 1.79 | 1.75 | 1.65 | 1.53 | 1.78 | 1.36 | 1.40 | 2.00 | 2.06 | 2.11 | 2.19 | 2.36 | 2.29 | 2.32 | 2.19 | 2.60 | 2.40 | 3.00 | 2.93 | 2.56 | 2.28 | 2.17 | 1.97 | 2.49 | 2.61 | 2.81 | 2.68 | |
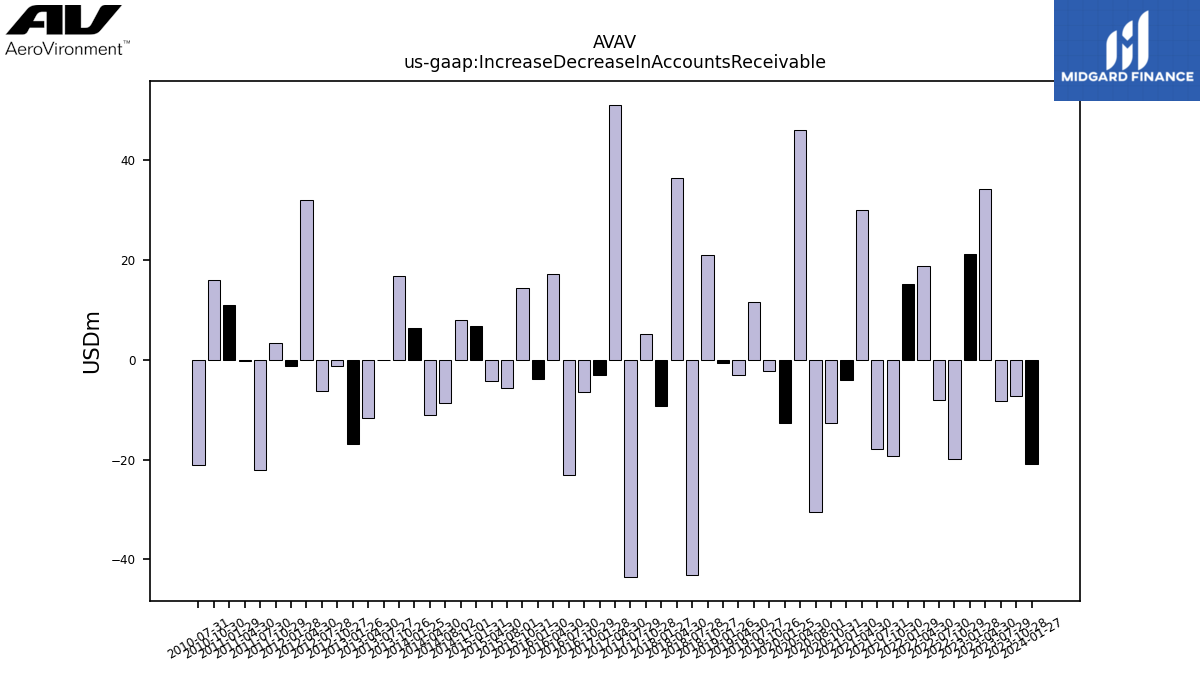
| Increase Decrease In Accounts Receivable | -20.83 | -7.35 | -8.21 | 34.27 | 21.16 | -19.96 | -8.05 | 18.82 | 15.23 | -19.22 | -17.91 | 30.01 | -4.07 | -12.68 | -30.44 | 46.11 | NA | -12.64 | NA | -2.16 | NA | 11.56 | -3.00 | NA | -0.56 | NA | 20.93 | NA | -43.19 | 36.44 | -9.21 | 5.14 | -43.58 | 51.18 | -2.99 | -6.54 | -23.02 | 17.21 | -3.86 | 14.46 | -5.55 | -4.23 | 6.74 | 7.92 | -8.67 | -11.15 | 6.34 | 16.82 | -0.04 | -11.71 | -16.96 | -1.22 | -6.30 | 32.14 | -1.25 | 3.45 | -22.01 | -0.24 | 10.96 | 16.09 | -21.19 | |
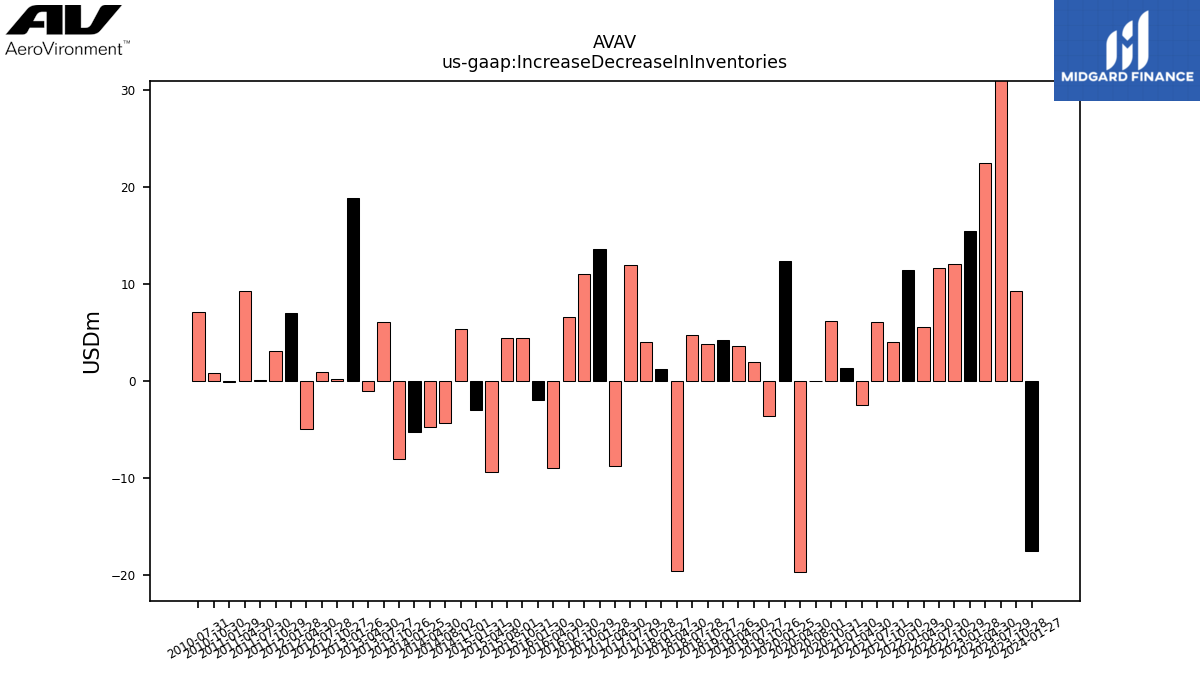
| Increase Decrease In Inventories | -17.43 | 9.32 | 40.00 | 22.52 | 15.49 | 12.13 | 11.71 | 5.57 | 11.52 | 4.02 | 6.06 | -2.39 | 1.32 | 6.25 | -0.01 | -19.62 | NA | 12.39 | NA | -3.57 | NA | 1.95 | 3.68 | NA | 4.28 | NA | 3.85 | NA | 4.82 | -19.52 | 1.29 | 4.02 | 11.94 | -8.73 | 13.64 | 11.06 | 6.62 | -8.95 | -1.90 | 4.42 | 4.51 | -9.38 | -3.00 | 5.36 | -4.26 | -4.74 | -5.19 | -8.03 | 6.10 | -1.04 | 18.85 | 0.24 | 0.97 | -4.91 | 7.01 | 3.14 | 0.16 | 9.26 | -0.05 | 0.84 | 7.16 | |
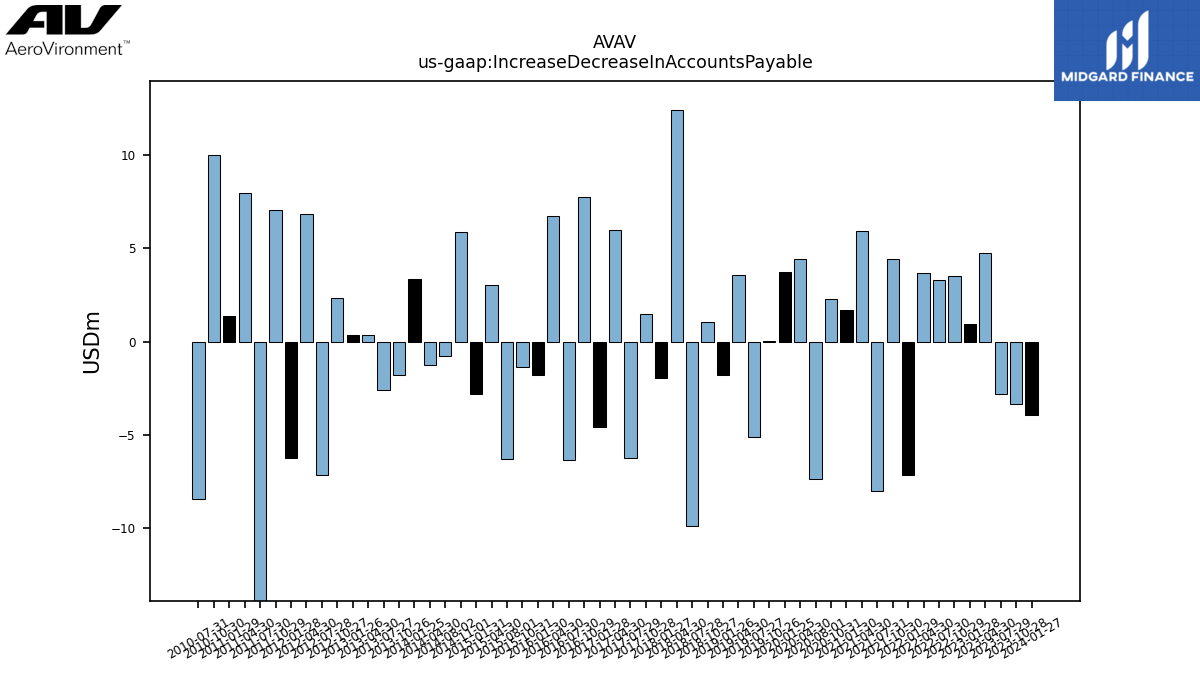
| Increase Decrease In Accounts Payable | -3.90 | -3.33 | -2.78 | 4.75 | 0.97 | 3.50 | 3.32 | 3.68 | -7.13 | 4.41 | -8.00 | 5.91 | 1.68 | 2.31 | -7.34 | 4.43 | NA | 3.75 | NA | 0.06 | NA | -5.11 | 3.59 | NA | -1.80 | NA | 1.05 | NA | -9.89 | 12.42 | -1.95 | 1.50 | -6.24 | 6.01 | -4.58 | 7.75 | -6.34 | 6.75 | -1.80 | -1.35 | -6.30 | 3.03 | -2.77 | 5.86 | -0.78 | -1.23 | 3.36 | -1.77 | -2.60 | 0.37 | 0.35 | 2.35 | -7.13 | 6.84 | -6.24 | 7.07 | -18.59 | 7.97 | 1.40 | 10.00 | -8.44 | |
| Share Based Compensation | 4.18 | 5.04 | 3.20 | 3.66 | 2.71 | 2.19 | 2.22 | 1.43 | 1.61 | 0.42 | 1.92 | 2.18 | 1.25 | 1.91 | 1.59 | 1.48 | NA | 1.77 | NA | 1.42 | NA | 1.57 | 1.39 | NA | 3.08 | NA | 1.23 | NA | 1.29 | 1.06 | 1.29 | 1.21 | 1.40 | 0.97 | 0.92 | 0.82 | 0.99 | 1.39 | 1.09 | 1.04 | 1.04 | 1.05 | 0.97 | 0.90 | 0.85 | 0.94 | 0.85 | 0.93 | 0.91 | 0.84 | 0.99 | 0.80 | 0.84 | 0.88 | 0.78 | 0.78 | 0.75 | 0.63 | 0.59 | 0.58 | 0.50 | |
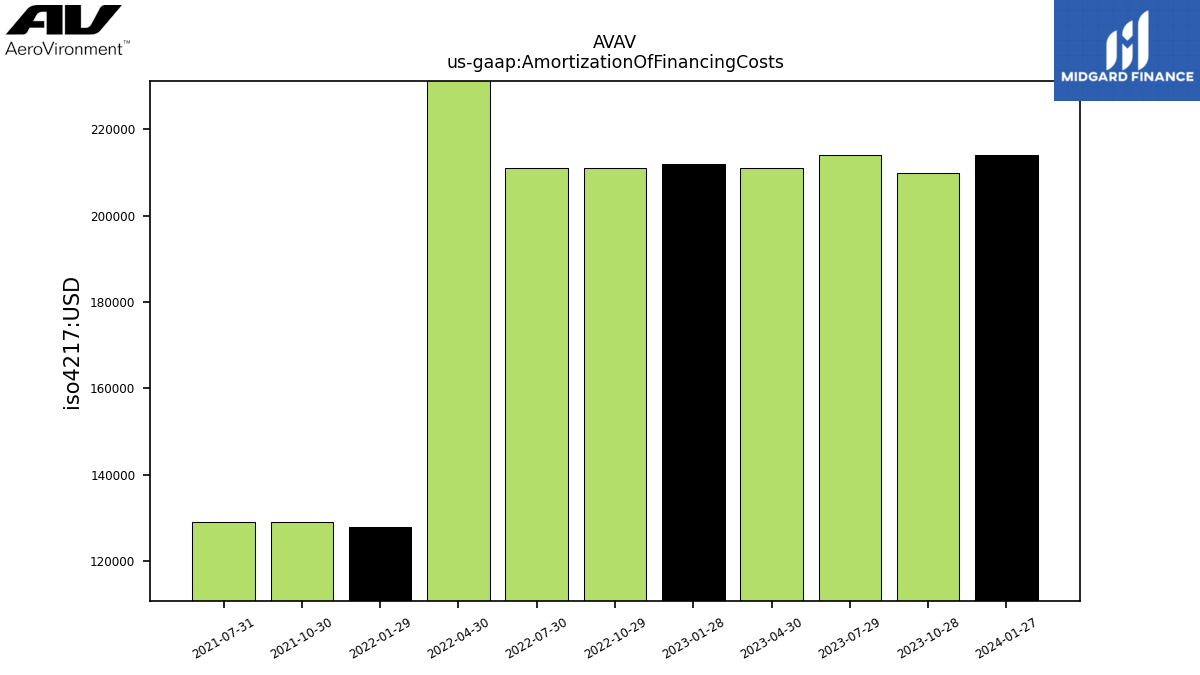
| Amortization Of Financing Costs | 0.21 | 0.21 | 0.21 | 0.21 | 0.21 | 0.21 | 0.21 | 0.40 | 0.13 | 0.13 | 0.13 | NA | NA | NA | NA | NA | NA | NA | NA | NA | NA | NA | NA | NA | NA | NA | NA | NA | NA | NA | NA | NA | NA | NA | NA | NA | NA | NA | NA | NA | NA | NA | NA | NA | NA | NA | NA | NA | NA | NA | NA | NA | NA | NA | NA | NA | NA | NA | NA | NA | NA |
| 2024-01-27 | 2023-10-28 | 2023-07-29 | 2023-04-30 | 2023-01-28 | 2022-10-29 | 2022-07-30 | 2022-04-30 | 2022-01-29 | 2021-10-30 | 2021-07-31 | 2021-04-30 | 2021-01-30 | 2020-10-31 | 2020-08-01 | 2020-04-30 | 2020-01-31 | 2020-01-25 | 2019-10-31 | 2019-10-26 | 2019-07-31 | 2019-07-27 | 2019-04-30 | 2019-01-31 | 2019-01-26 | 2018-10-31 | 2018-10-27 | 2018-07-31 | 2018-07-28 | 2018-04-30 | 2018-01-27 | 2017-10-28 | 2017-07-29 | 2017-04-30 | 2017-01-28 | 2016-10-29 | 2016-07-30 | 2016-04-30 | 2016-01-30 | 2015-10-31 | 2015-08-01 | 2015-04-30 | 2015-01-31 | 2014-11-01 | 2014-08-02 | 2014-04-30 | 2014-01-25 | 2013-10-26 | 2013-07-27 | 2013-04-30 | 2013-01-26 | 2012-10-27 | 2012-07-28 | 2012-04-30 | 2012-01-28 | 2011-10-29 | 2011-07-30 | 2011-04-30 | 2011-01-29 | 2010-10-30 | 2010-07-31 | ||
|---|---|---|---|---|---|---|---|---|---|---|---|---|---|---|---|---|---|---|---|---|---|---|---|---|---|---|---|---|---|---|---|---|---|---|---|---|---|---|---|---|---|---|---|---|---|---|---|---|---|---|---|---|---|---|---|---|---|---|---|---|---|---|
| Net Cash Provided By Used In Investing Activities | -3.80 | -34.00 | -3.63 | -7.89 | -2.53 | -0.37 | 3.79 | -15.28 | -2.22 | 1.56 | -36.34 | -372.57 | 25.74 | 1.53 | -33.47 | 109.53 | NA | -6.13 | NA | -11.08 | NA | -33.15 | NA | NA | NA | NA | NA | NA | NA | NA | -9.20 | -3.54 | 14.95 | NA | -7.75 | -28.30 | -0.89 | NA | NA | NA | NA | NA | NA | NA | NA | NA | NA | NA | NA | NA | NA | NA | NA | NA | NA | NA | 17.48 | NA | NA | NA | 21.90 | |
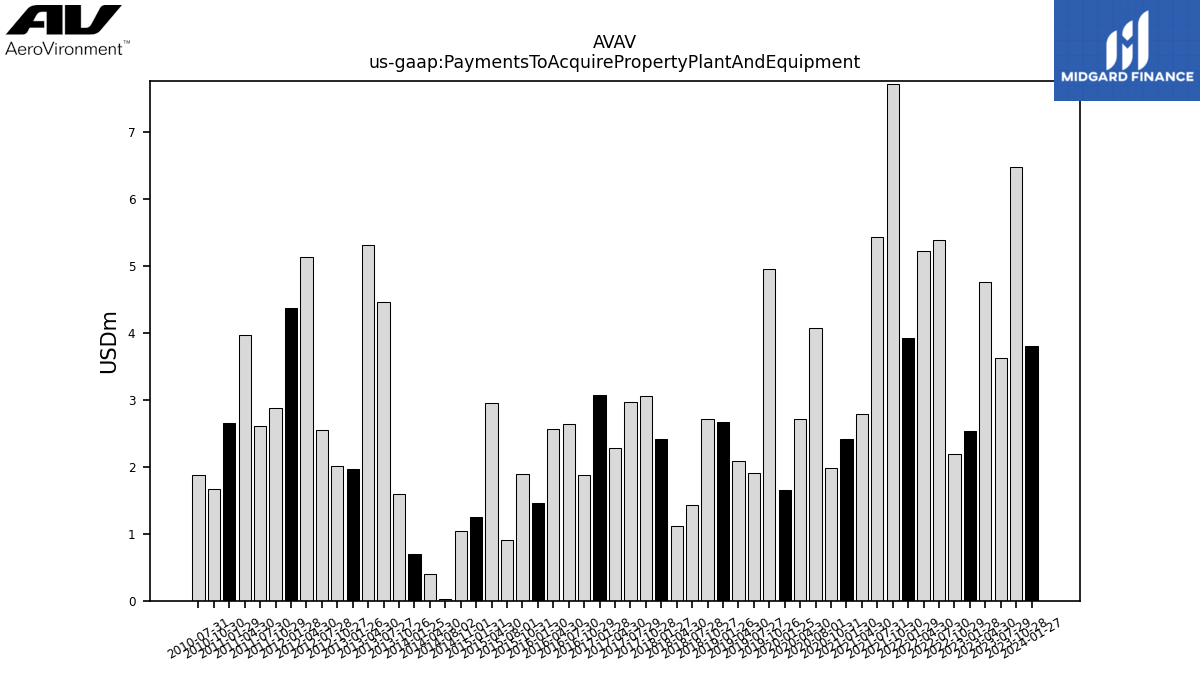
| Payments To Acquire Property Plant And Equipment | 3.80 | 6.47 | 3.63 | 4.75 | 2.53 | 2.19 | 5.39 | 5.22 | 3.92 | 7.72 | 5.43 | 2.79 | 2.42 | 1.99 | 4.07 | 2.72 | NA | 1.65 | NA | 4.95 | NA | 1.90 | 2.09 | NA | 2.67 | NA | 2.71 | NA | 1.42 | 1.11 | 2.41 | 3.06 | 2.97 | 2.28 | 3.07 | 1.88 | 2.63 | 2.57 | 1.46 | 1.90 | 0.91 | 2.95 | 1.26 | 1.04 | 0.03 | 0.39 | 0.70 | 1.59 | 4.46 | 5.31 | 1.97 | 2.01 | 2.55 | 5.14 | 4.37 | 2.88 | 2.61 | 3.97 | 2.65 | 1.67 | 1.88 |
| 2024-01-27 | 2023-10-28 | 2023-07-29 | 2023-04-30 | 2023-01-28 | 2022-10-29 | 2022-07-30 | 2022-04-30 | 2022-01-29 | 2021-10-30 | 2021-07-31 | 2021-04-30 | 2021-01-30 | 2020-10-31 | 2020-08-01 | 2020-04-30 | 2020-01-31 | 2020-01-25 | 2019-10-31 | 2019-10-26 | 2019-07-31 | 2019-07-27 | 2019-04-30 | 2019-01-31 | 2019-01-26 | 2018-10-31 | 2018-10-27 | 2018-07-31 | 2018-07-28 | 2018-04-30 | 2018-01-27 | 2017-10-28 | 2017-07-29 | 2017-04-30 | 2017-01-28 | 2016-10-29 | 2016-07-30 | 2016-04-30 | 2016-01-30 | 2015-10-31 | 2015-08-01 | 2015-04-30 | 2015-01-31 | 2014-11-01 | 2014-08-02 | 2014-04-30 | 2014-01-25 | 2013-10-26 | 2013-07-27 | 2013-04-30 | 2013-01-26 | 2012-10-27 | 2012-07-28 | 2012-04-30 | 2012-01-28 | 2011-10-29 | 2011-07-30 | 2011-04-30 | 2011-01-29 | 2010-10-30 | 2010-07-31 | ||
|---|---|---|---|---|---|---|---|---|---|---|---|---|---|---|---|---|---|---|---|---|---|---|---|---|---|---|---|---|---|---|---|---|---|---|---|---|---|---|---|---|---|---|---|---|---|---|---|---|---|---|---|---|---|---|---|---|---|---|---|---|---|---|
| Net Cash Provided By Used In Financing Activities | -42.16 | 37.86 | -6.32 | 53.24 | 8.51 | -7.58 | -3.33 | -4.69 | 0.15 | -2.51 | -9.56 | 197.52 | -1.67 | -0.02 | -1.67 | -0.91 | NA | -0.27 | NA | -0.07 | NA | -0.57 | -0.07 | NA | -0.10 | NA | -0.21 | NA | -0.81 | -0.05 | 0.39 | 0.34 | 1.34 | 3.11 | 0.30 | -0.10 | 0.16 | NA | NA | NA | NA | NA | NA | NA | NA | NA | NA | NA | NA | NA | NA | NA | NA | NA | NA | NA | 0.28 | NA | NA | NA | 0.14 |
| 2024-01-27 | 2023-10-28 | 2023-07-29 | 2023-04-30 | 2023-01-28 | 2022-10-29 | 2022-07-30 | 2022-04-30 | 2022-01-29 | 2021-10-30 | 2021-07-31 | 2021-04-30 | 2021-01-30 | 2020-10-31 | 2020-08-01 | 2020-04-30 | 2020-01-31 | 2020-01-25 | 2019-10-31 | 2019-10-26 | 2019-07-31 | 2019-07-27 | 2019-04-30 | 2019-01-31 | 2019-01-26 | 2018-10-31 | 2018-10-27 | 2018-07-31 | 2018-07-28 | 2018-04-30 | 2018-01-27 | 2017-10-28 | 2017-07-29 | 2017-04-30 | 2017-01-28 | 2016-10-29 | 2016-07-30 | 2016-04-30 | 2016-01-30 | 2015-10-31 | 2015-08-01 | 2015-04-30 | 2015-01-31 | 2014-11-01 | 2014-08-02 | 2014-04-30 | 2014-01-25 | 2013-10-26 | 2013-07-27 | 2013-04-30 | 2013-01-26 | 2012-10-27 | 2012-07-28 | 2012-04-30 | 2012-01-28 | 2011-10-29 | 2011-07-30 | 2011-04-30 | 2011-01-29 | 2010-10-30 | 2010-07-31 | ||
|---|---|---|---|---|---|---|---|---|---|---|---|---|---|---|---|---|---|---|---|---|---|---|---|---|---|---|---|---|---|---|---|---|---|---|---|---|---|---|---|---|---|---|---|---|---|---|---|---|---|---|---|---|---|---|---|---|---|---|---|---|---|---|
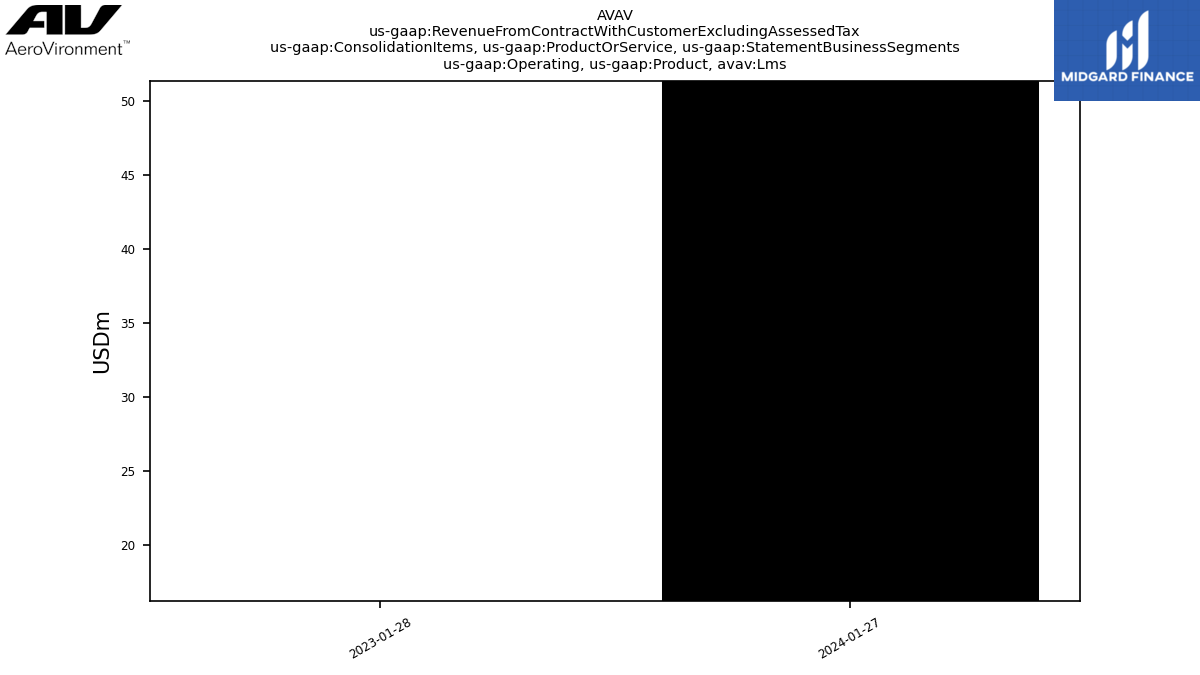
| Revenues | 186.58 | 180.82 | 152.35 | 186.04 | 134.40 | 111.58 | 108.52 | 132.62 | 90.09 | 122.01 | 101.01 | 136.01 | 78.78 | 92.67 | 87.45 | 135.22 | 61.89 | 61.89 | 83.27 | 83.27 | 86.91 | 86.91 | 87.93 | 75.32 | 75.32 | 72.98 | 72.98 | 78.04 | 78.04 | 117.38 | 63.94 | 73.83 | 43.76 | 125.38 | 53.16 | 50.12 | 36.22 | 84.76 | 67.56 | 64.73 | 47.05 | 86.47 | 68.40 | 52.66 | 51.87 | 73.50 | 69.22 | 64.87 | 44.12 | 54.11 | 47.09 | 80.28 | 58.68 | 110.67 | 71.96 | 80.37 | 62.00 | 106.06 | 84.43 | 63.78 | 38.23 | |
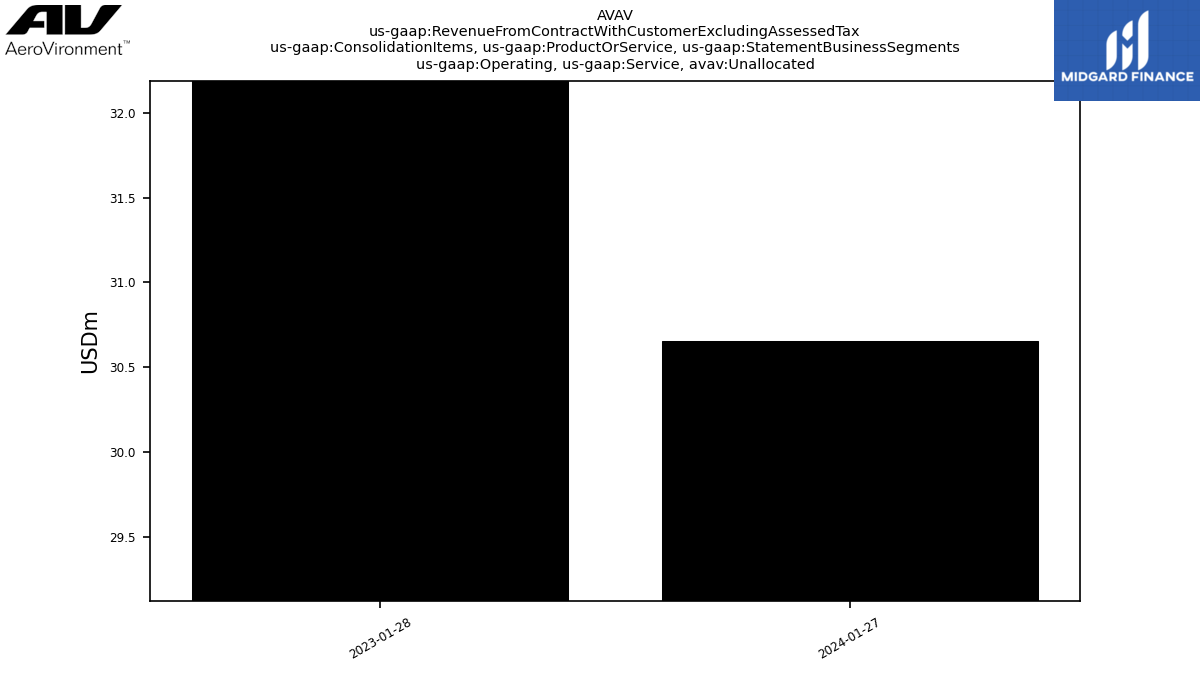
| Operating, Product, Lms | 51.34 | NA | NA | NA | 16.20 | NA | NA | NA | NA | NA | NA | NA | NA | NA | NA | NA | NA | NA | NA | NA | NA | NA | NA | NA | NA | NA | NA | NA | NA | NA | NA | NA | NA | NA | NA | NA | NA | NA | NA | NA | NA | NA | NA | NA | NA | NA | NA | NA | NA | NA | NA | NA | NA | NA | NA | NA | NA | NA | NA | NA | NA | |
| Operating, Product, Mw | 0.06 | NA | NA | NA | 0.05 | NA | NA | NA | NA | NA | NA | NA | NA | NA | NA | NA | NA | NA | NA | NA | NA | NA | NA | NA | NA | NA | NA | NA | NA | NA | NA | NA | NA | NA | NA | NA | NA | NA | NA | NA | NA | NA | NA | NA | NA | NA | NA | NA | NA | NA | NA | NA | NA | NA | NA | NA | NA | NA | NA | NA | NA | |
| Operating, Product, Ums | 104.52 | NA | NA | NA | 74.97 | NA | NA | NA | NA | NA | NA | NA | NA | NA | NA | NA | NA | NA | NA | NA | NA | NA | NA | NA | NA | NA | NA | NA | NA | NA | NA | NA | NA | NA | NA | NA | NA | NA | NA | NA | NA | NA | NA | NA | NA | NA | NA | NA | NA | NA | NA | NA | NA | NA | NA | NA | NA | NA | NA | NA | NA | |
| Operating, Product, Unallocated | 155.92 | NA | NA | NA | 91.22 | NA | NA | NA | NA | NA | NA | NA | NA | NA | NA | NA | NA | NA | NA | NA | NA | NA | NA | NA | NA | NA | NA | NA | NA | NA | NA | NA | NA | NA | NA | NA | NA | NA | NA | NA | NA | NA | NA | NA | NA | NA | NA | NA | NA | NA | NA | NA | NA | NA | NA | NA | NA | NA | NA | NA | NA | |
| Operating, Service, Lms | 6.32 | NA | NA | NA | 7.81 | NA | NA | NA | NA | NA | NA | NA | NA | NA | NA | NA | NA | NA | NA | NA | NA | NA | NA | NA | NA | NA | NA | NA | NA | NA | NA | NA | NA | NA | NA | NA | NA | NA | NA | NA | NA | NA | NA | NA | NA | NA | NA | NA | NA | NA | NA | NA | NA | NA | NA | NA | NA | NA | NA | NA | NA | |
| Operating, Service, Mw | 15.57 | NA | NA | NA | 18.00 | NA | NA | NA | NA | NA | NA | NA | NA | NA | NA | NA | NA | NA | NA | NA | NA | NA | NA | NA | NA | NA | NA | NA | NA | NA | NA | NA | NA | NA | NA | NA | NA | NA | NA | NA | NA | NA | NA | NA | NA | NA | NA | NA | NA | NA | NA | NA | NA | NA | NA | NA | NA | NA | NA | NA | NA | |
| Operating, Service, Ums | 8.77 | NA | NA | NA | 17.36 | NA | NA | NA | NA | NA | NA | NA | NA | NA | NA | NA | NA | NA | NA | NA | NA | NA | NA | NA | NA | NA | NA | NA | NA | NA | NA | NA | NA | NA | NA | NA | NA | NA | NA | NA | NA | NA | NA | NA | NA | NA | NA | NA | NA | NA | NA | NA | NA | NA | NA | NA | NA | NA | NA | NA | NA | |
| Operating, Service, Unallocated | 30.66 | NA | NA | NA | 43.18 | NA | NA | NA | NA | NA | NA | NA | NA | NA | NA | NA | NA | NA | NA | NA | NA | NA | NA | NA | NA | NA | NA | NA | NA | NA | NA | NA | NA | NA | NA | NA | NA | NA | NA | NA | NA | NA | NA | NA | NA | NA | NA | NA | NA | NA | NA | NA | NA | NA | NA | NA | NA | NA | NA | NA | NA | |
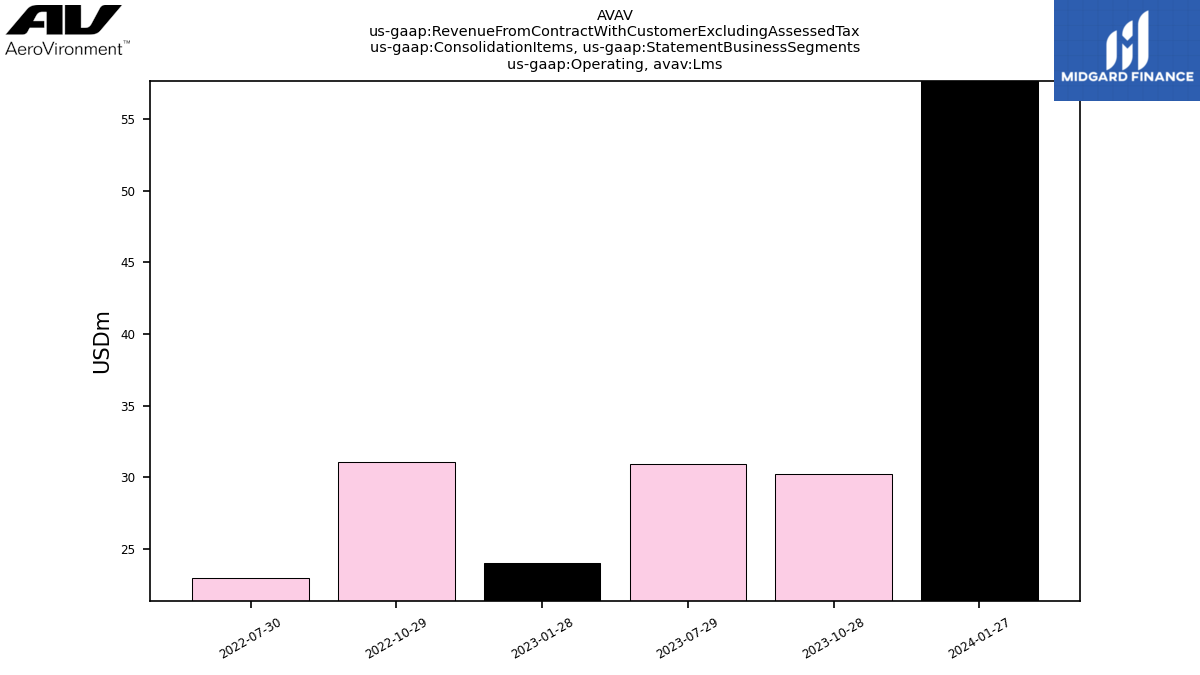
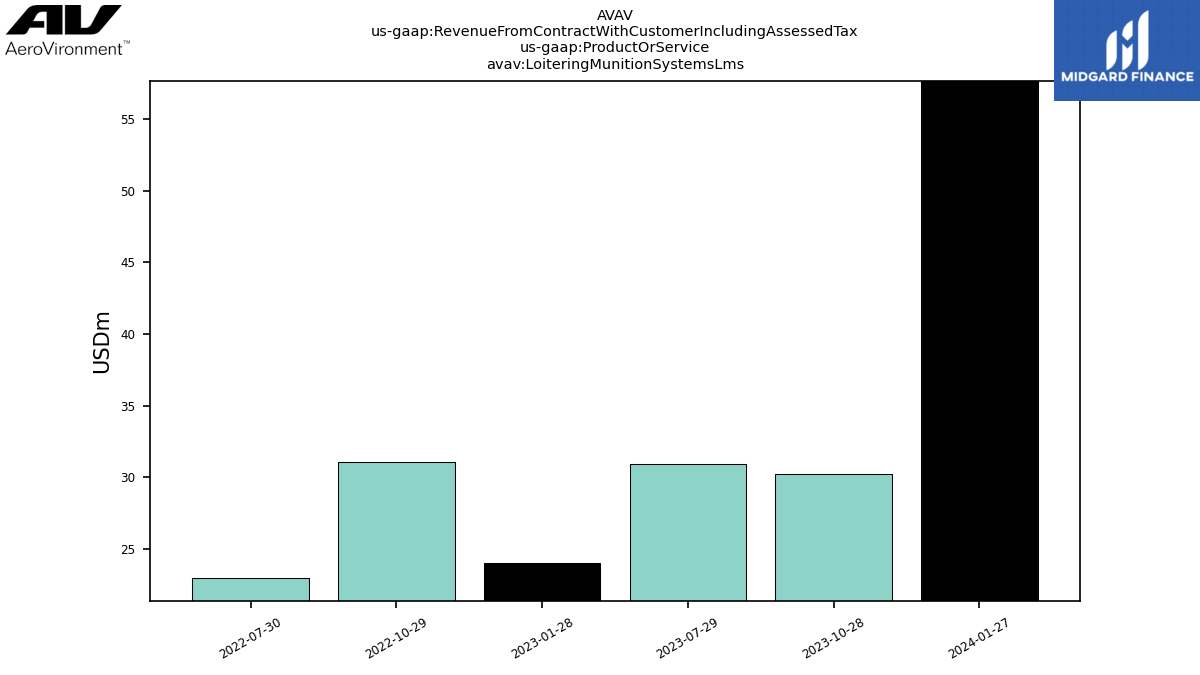
| Operating, Lms | 57.66 | 30.25 | 30.92 | NA | 24.02 | 31.10 | 23.01 | NA | NA | NA | NA | NA | NA | NA | NA | NA | NA | NA | NA | NA | NA | NA | NA | NA | NA | NA | NA | NA | NA | NA | NA | NA | NA | NA | NA | NA | NA | NA | NA | NA | NA | NA | NA | NA | NA | NA | NA | NA | NA | NA | NA | NA | NA | NA | NA | NA | NA | NA | NA | NA | NA | |
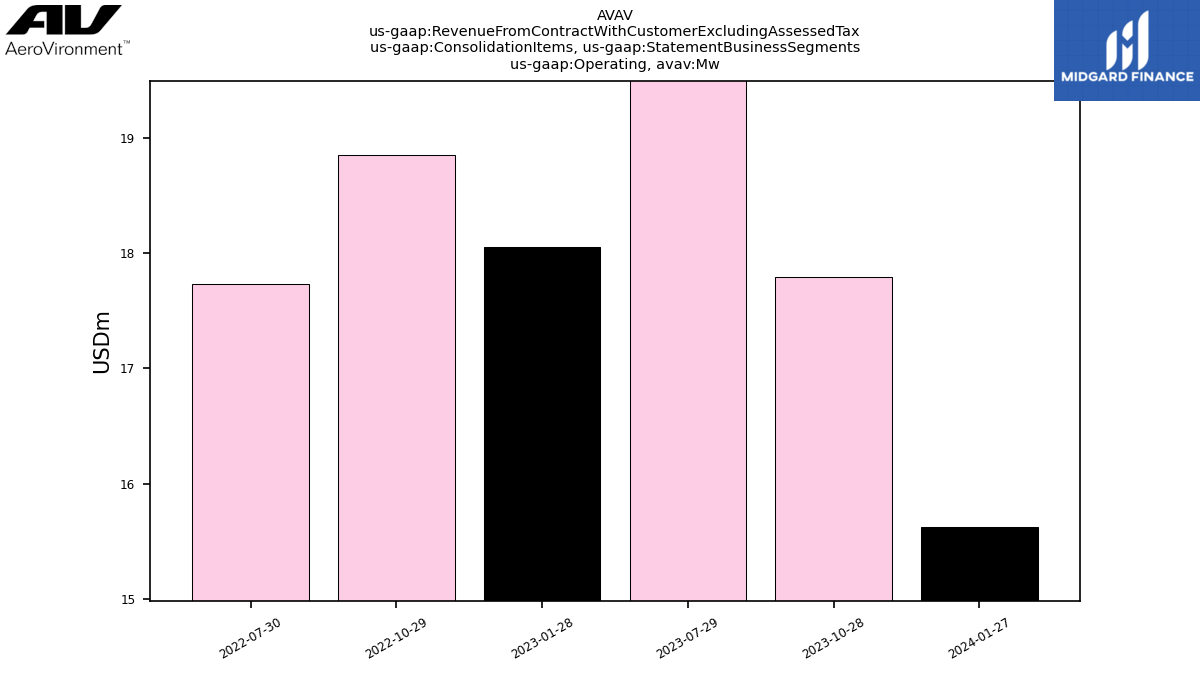
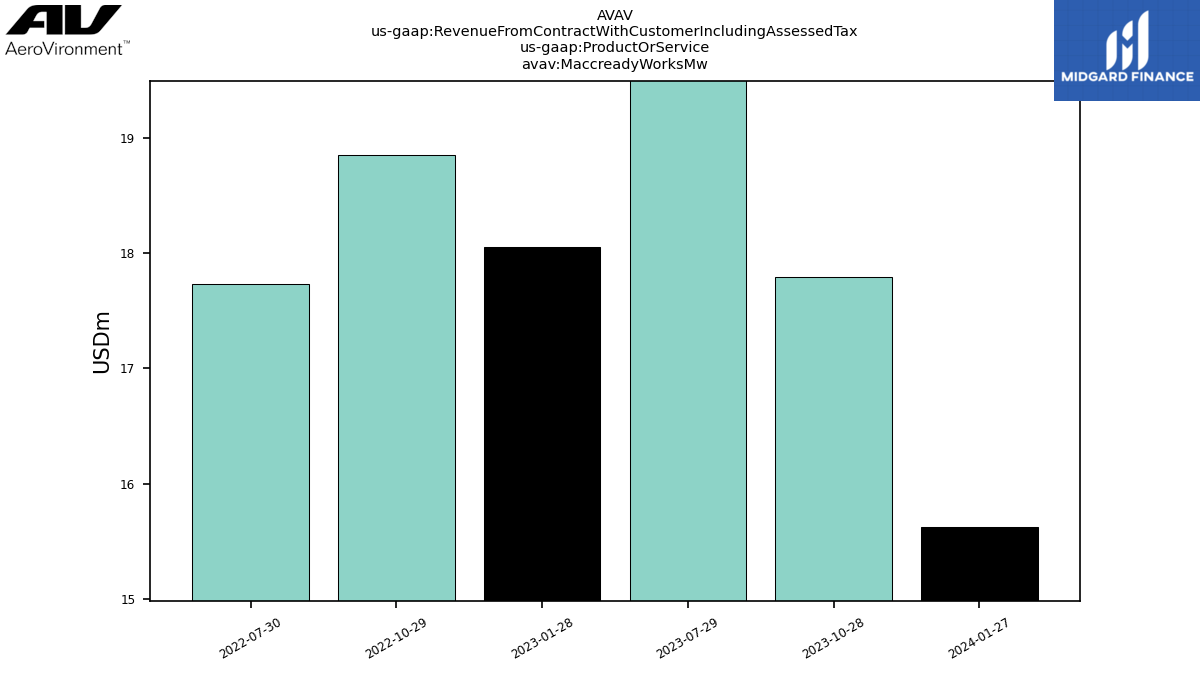
| Operating, Mw | 15.63 | 17.79 | 23.22 | NA | 18.05 | 18.85 | 17.73 | NA | NA | NA | NA | NA | NA | NA | NA | NA | NA | NA | NA | NA | NA | NA | NA | NA | NA | NA | NA | NA | NA | NA | NA | NA | NA | NA | NA | NA | NA | NA | NA | NA | NA | NA | NA | NA | NA | NA | NA | NA | NA | NA | NA | NA | NA | NA | NA | NA | NA | NA | NA | NA | NA | |
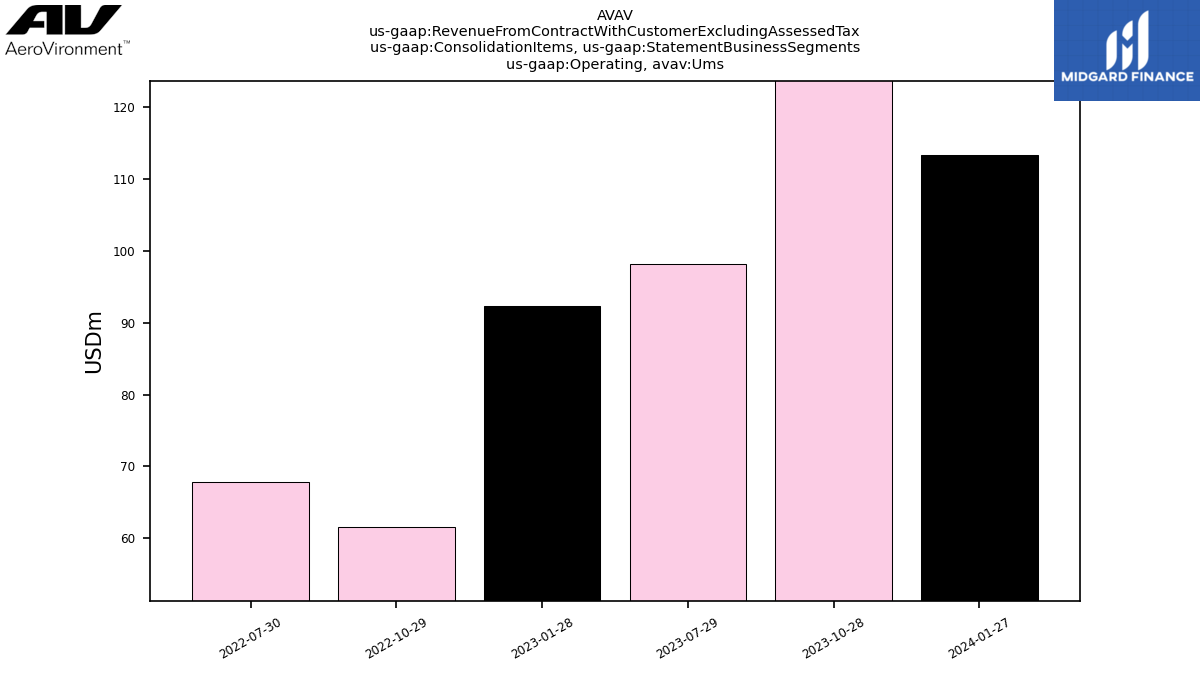
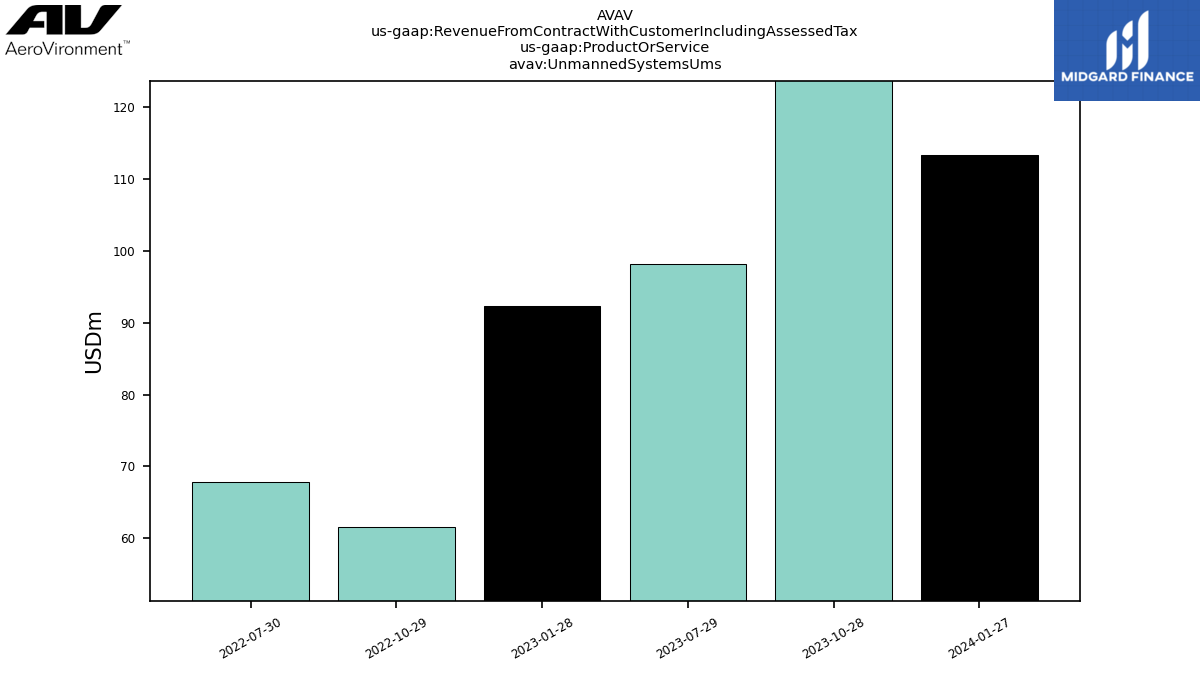
| Operating, Ums | 113.29 | 132.77 | 98.21 | NA | 92.33 | 61.63 | 67.78 | NA | NA | NA | NA | NA | NA | NA | NA | NA | NA | NA | NA | NA | NA | NA | NA | NA | NA | NA | NA | NA | NA | NA | NA | NA | NA | NA | NA | NA | NA | NA | NA | NA | NA | NA | NA | NA | NA | NA | NA | NA | NA | NA | NA | NA | NA | NA | NA | NA | NA | NA | NA | NA | NA | |
| Operating, Unallocated | 186.58 | NA | NA | NA | 134.40 | NA | NA | NA | NA | NA | NA | NA | NA | NA | NA | NA | NA | NA | NA | NA | NA | NA | NA | NA | NA | NA | NA | NA | NA | NA | NA | NA | NA | NA | NA | NA | NA | NA | NA | NA | NA | NA | NA | NA | NA | NA | NA | NA | NA | NA | NA | NA | NA | NA | NA | NA | NA | NA | NA | NA | NA | |
| Revenue From Contract With Customer Including Assessed Tax | 186.58 | 180.82 | 152.35 | 186.04 | 134.40 | 111.58 | 108.52 | 132.62 | 90.09 | 122.01 | 101.01 | 136.01 | 78.78 | 92.67 | 87.45 | 135.22 | 61.89 | 61.89 | 83.27 | 83.27 | 86.91 | 86.91 | 87.93 | 75.32 | 75.32 | 72.98 | 72.98 | 78.04 | 78.04 | 87.93 | 75.32 | 72.98 | 78.04 | 113.63 | 54.63 | 65.80 | 34.36 | 84.76 | 67.56 | 64.73 | 47.05 | 86.47 | 68.40 | 52.66 | 51.87 | 73.50 | 69.22 | 64.87 | 44.12 | 54.11 | 47.09 | 80.28 | 58.68 | 110.67 | 71.96 | 80.37 | 62.00 | 106.06 | 84.43 | 63.78 | 38.23 | |
| Contract Liability | 0.61 | 0.70 | 2.54 | -3370.59 | 369.00 | 1080.00 | 1.93 | 0.73 | 1.52 | 0.58 | 0.31 | 0.04 | 0.00 | 3.45 | 1.97 | 0.00 | NA | 0.01 | NA | 0.83 | NA | 0.83 | 0.00 | NA | 0.01 | NA | 0.01 | NA | 1.55 | 0.00 | 0.06 | 0.00 | NA | NA | NA | NA | NA | NA | NA | NA | NA | NA | NA | NA | NA | NA | NA | NA | NA | NA | NA | NA | NA | NA | NA | NA | NA | NA | NA | NA | NA | |
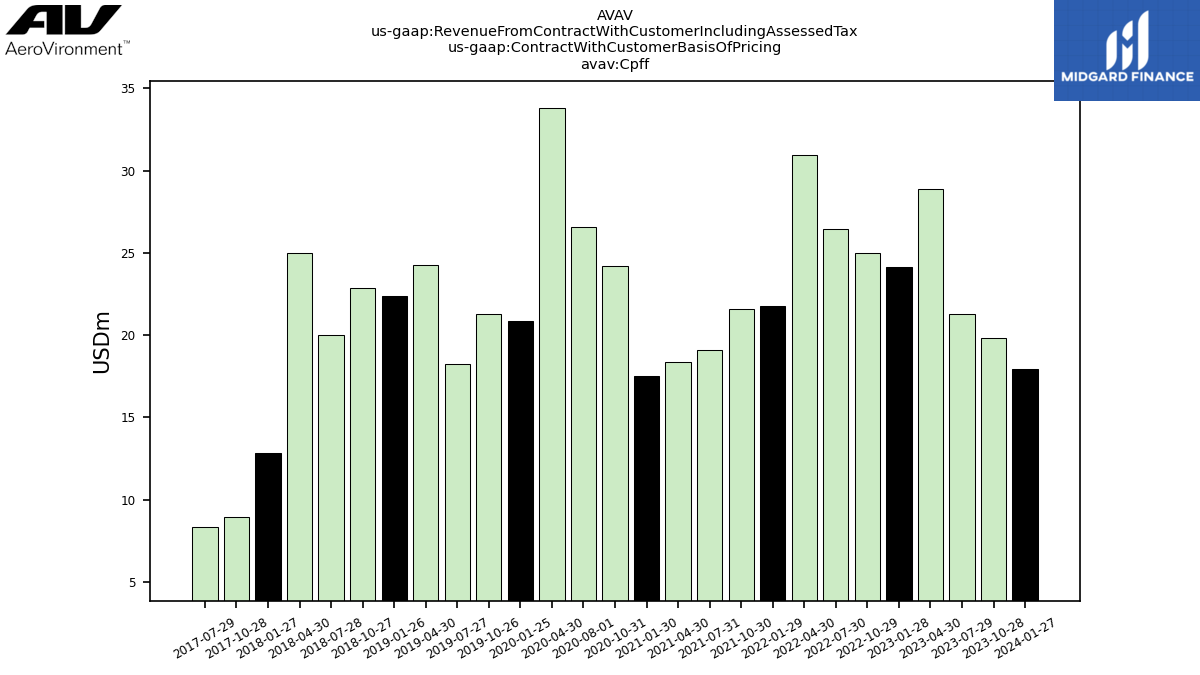
| Cpff | 17.93 | 19.80 | 21.29 | 28.86 | 24.11 | 25.01 | 26.46 | 30.93 | 21.79 | 21.59 | 19.12 | 18.39 | 17.53 | 24.23 | 26.57 | 33.79 | NA | 20.86 | NA | 21.26 | NA | 18.26 | 24.26 | NA | 22.37 | NA | 22.87 | NA | 19.98 | 25.02 | 12.86 | 8.95 | 8.37 | NA | NA | NA | NA | NA | NA | NA | NA | NA | NA | NA | NA | NA | NA | NA | NA | NA | NA | NA | NA | NA | NA | NA | NA | NA | NA | NA | NA | |
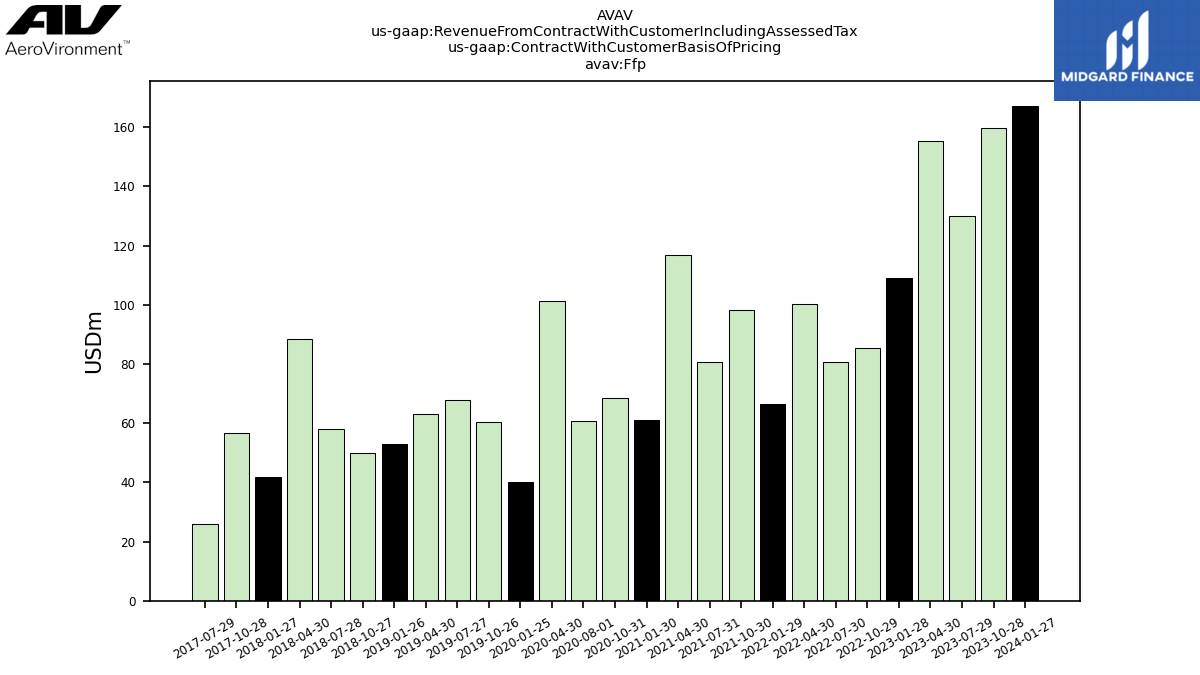
| Ffp | 167.26 | 159.88 | 129.94 | 155.36 | 109.12 | 85.24 | 80.83 | 100.29 | 66.64 | 98.39 | 80.77 | 116.88 | 61.23 | 68.42 | 60.88 | 101.31 | NA | 40.15 | NA | 60.52 | NA | 67.94 | 63.20 | NA | 52.83 | NA | 50.05 | NA | 58.00 | 88.60 | 41.76 | 56.76 | 25.85 | NA | NA | NA | NA | NA | NA | NA | NA | NA | NA | NA | NA | NA | NA | NA | NA | NA | NA | NA | NA | NA | NA | NA | NA | NA | NA | NA | NA | |
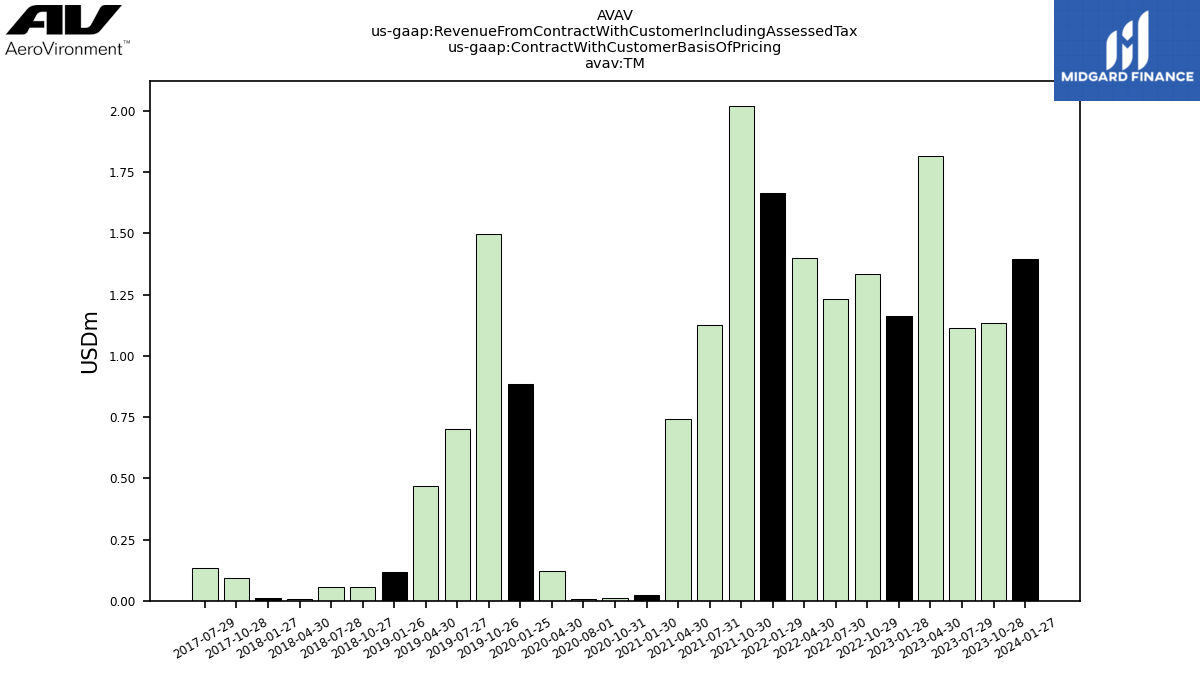
| TM | 1.40 | 1.14 | 1.11 | 1.82 | 1.16 | 1.33 | 1.23 | 1.40 | 1.67 | 2.02 | 1.13 | 0.74 | 0.02 | 0.01 | 0.01 | 0.12 | NA | 0.88 | NA | 1.50 | NA | 0.70 | 0.47 | NA | 0.12 | NA | 0.06 | NA | 0.06 | 0.01 | 0.01 | 0.09 | 0.13 | NA | NA | NA | NA | NA | NA | NA | NA | NA | NA | NA | NA | NA | NA | NA | NA | NA | NA | NA | NA | NA | NA | NA | NA | NA | NA | NA | NA | |
| Non U.s. Government | 52.82 | 30.86 | 51.00 | 45.34 | 51.00 | 27.42 | 41.22 | 41.79 | 29.14 | 49.93 | 29.93 | 34.77 | 18.15 | 37.07 | 33.65 | 34.85 | NA | 36.36 | NA | 32.97 | NA | 37.78 | 40.58 | NA | 22.94 | NA | 26.04 | NA | 42.13 | 51.12 | 23.61 | 25.22 | 11.47 | NA | NA | NA | NA | NA | NA | NA | NA | NA | NA | NA | NA | NA | NA | NA | NA | NA | NA | NA | NA | NA | NA | NA | NA | NA | NA | NA | NA | |
| U S Government | 133.76 | 149.96 | 101.35 | 140.70 | 83.40 | 84.17 | 67.30 | 90.83 | 60.96 | 72.08 | 71.08 | 101.25 | 60.63 | 55.59 | 53.80 | 100.37 | NA | 25.54 | NA | 50.30 | NA | 49.13 | 47.35 | NA | 52.38 | NA | 46.94 | NA | 35.91 | NA | NA | NA | NA | NA | NA | NA | NA | NA | NA | NA | NA | NA | NA | NA | NA | NA | NA | NA | NA | NA | NA | NA | NA | NA | NA | NA | NA | NA | NA | NA | NA | |
| Loitering Munition Systems Lms | 57.66 | 30.25 | 30.92 | NA | 24.02 | 31.10 | 23.01 | NA | NA | NA | NA | NA | NA | NA | NA | NA | NA | NA | NA | NA | NA | NA | NA | NA | NA | NA | NA | NA | NA | NA | NA | NA | NA | NA | NA | NA | NA | NA | NA | NA | NA | NA | NA | NA | NA | NA | NA | NA | NA | NA | NA | NA | NA | NA | NA | NA | NA | NA | NA | NA | NA | |
| Maccready Works Mw | 15.63 | 17.79 | 23.22 | NA | 18.05 | 18.85 | 17.73 | NA | NA | NA | NA | NA | NA | NA | NA | NA | NA | NA | NA | NA | NA | NA | NA | NA | NA | NA | NA | NA | NA | NA | NA | NA | NA | NA | NA | NA | NA | NA | NA | NA | NA | NA | NA | NA | NA | NA | NA | NA | NA | NA | NA | NA | NA | NA | NA | NA | NA | NA | NA | NA | NA | |
| Unmanned Systems Ums | 113.29 | 132.77 | 98.21 | NA | 92.33 | 61.63 | 67.78 | NA | NA | NA | NA | NA | NA | NA | NA | NA | NA | NA | NA | NA | NA | NA | NA | NA | NA | NA | NA | NA | NA | NA | NA | NA | NA | NA | NA | NA | NA | NA | NA | NA | NA | NA | NA | NA | NA | NA | NA | NA | NA | NA | NA | NA | NA | NA | NA | NA | NA | NA | NA | NA | NA | |
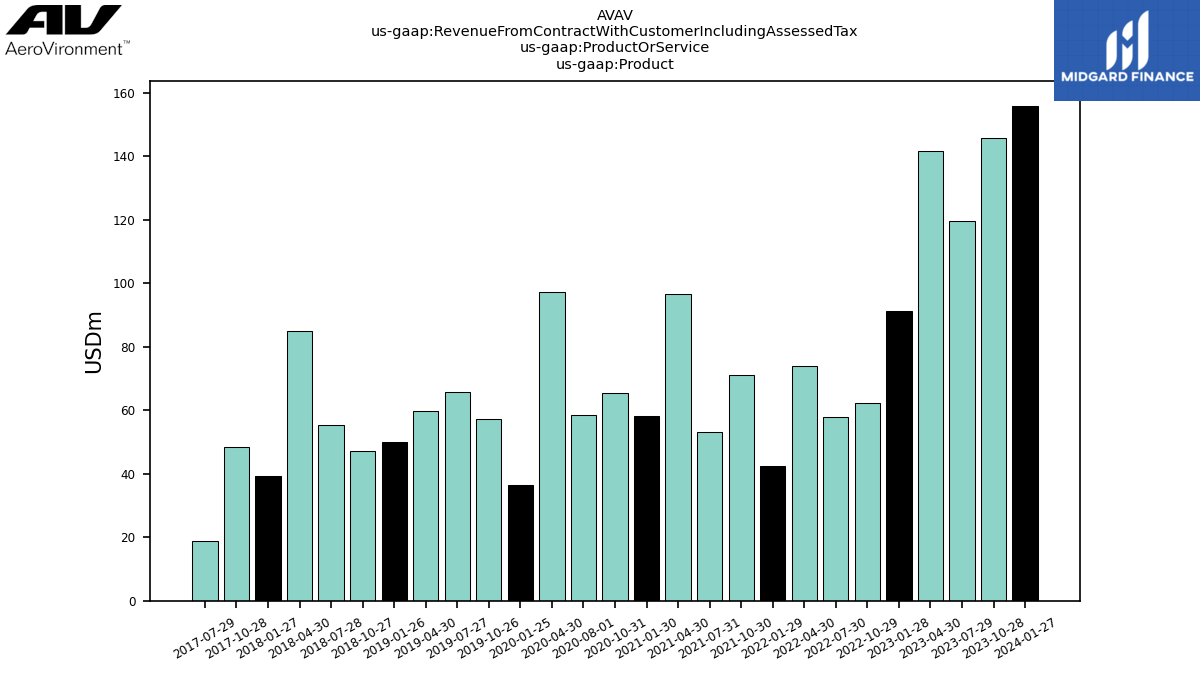
| Product | 155.92 | 145.78 | 119.47 | 141.53 | 91.22 | 62.34 | 57.97 | 73.97 | 42.60 | 71.00 | 53.12 | 96.66 | 58.35 | 65.53 | 58.36 | 97.10 | NA | 36.43 | NA | 57.39 | NA | 65.84 | 59.70 | NA | 50.02 | NA | 47.06 | NA | 55.31 | 85.06 | 39.45 | 48.42 | 18.78 | NA | NA | NA | NA | NA | NA | NA | NA | NA | NA | NA | NA | NA | NA | NA | NA | NA | NA | NA | NA | NA | NA | NA | NA | NA | NA | NA | NA | |
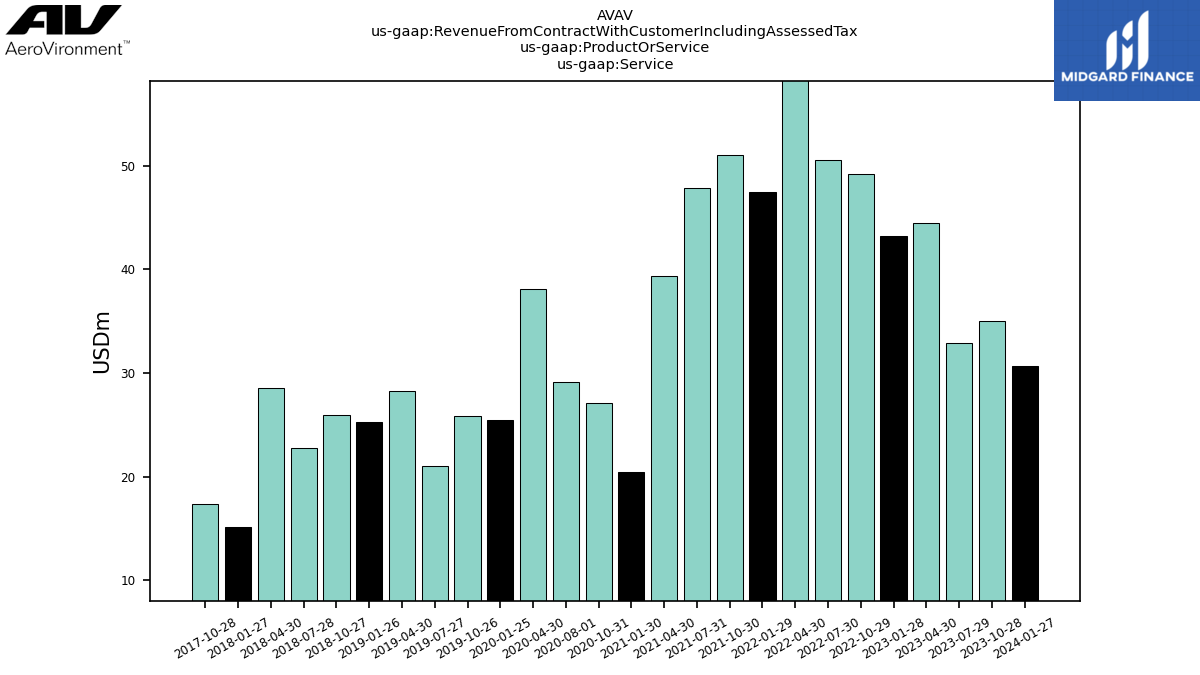
| Service | 30.66 | 35.04 | 32.88 | 44.51 | 43.18 | 49.24 | 50.54 | 58.65 | 47.49 | 51.01 | 47.89 | 39.36 | 20.43 | 27.14 | 29.09 | 38.12 | NA | 25.46 | NA | 25.89 | NA | 21.07 | 28.23 | NA | 25.30 | NA | 25.92 | NA | 22.73 | 28.56 | 15.19 | 17.38 | NA | NA | NA | NA | NA | NA | NA | NA | NA | NA | NA | NA | NA | NA | NA | NA | NA | NA | NA | NA | NA | NA | NA | NA | NA | NA | NA | NA | NA | |
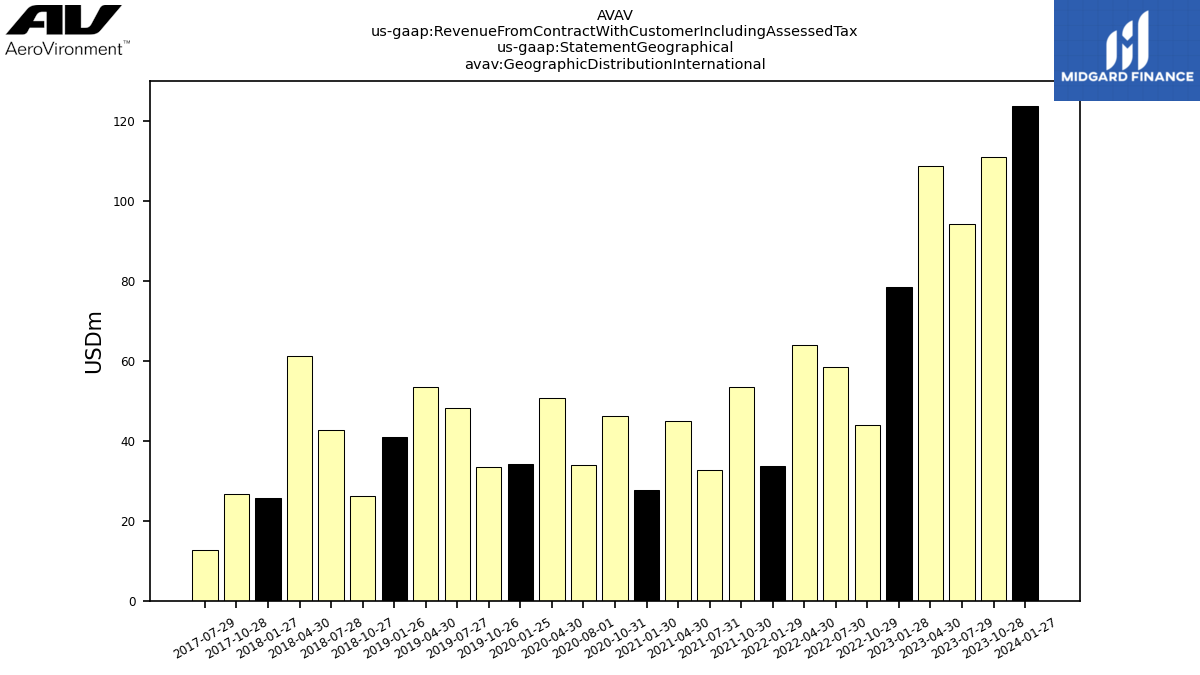
| Geographic Distribution International | 123.71 | 110.84 | 94.22 | 108.75 | 78.44 | 43.93 | 58.41 | 63.90 | 33.61 | 53.34 | 32.62 | 45.01 | 27.72 | 46.27 | 34.02 | 50.58 | NA | 34.27 | NA | 33.31 | NA | 48.10 | 53.32 | NA | 40.89 | NA | 26.25 | NA | 42.69 | 61.05 | 25.79 | 26.63 | 12.79 | NA | NA | NA | NA | NA | NA | NA | NA | NA | NA | NA | NA | NA | NA | NA | NA | NA | NA | NA | NA | NA | NA | NA | NA | NA | NA | NA | NA | |
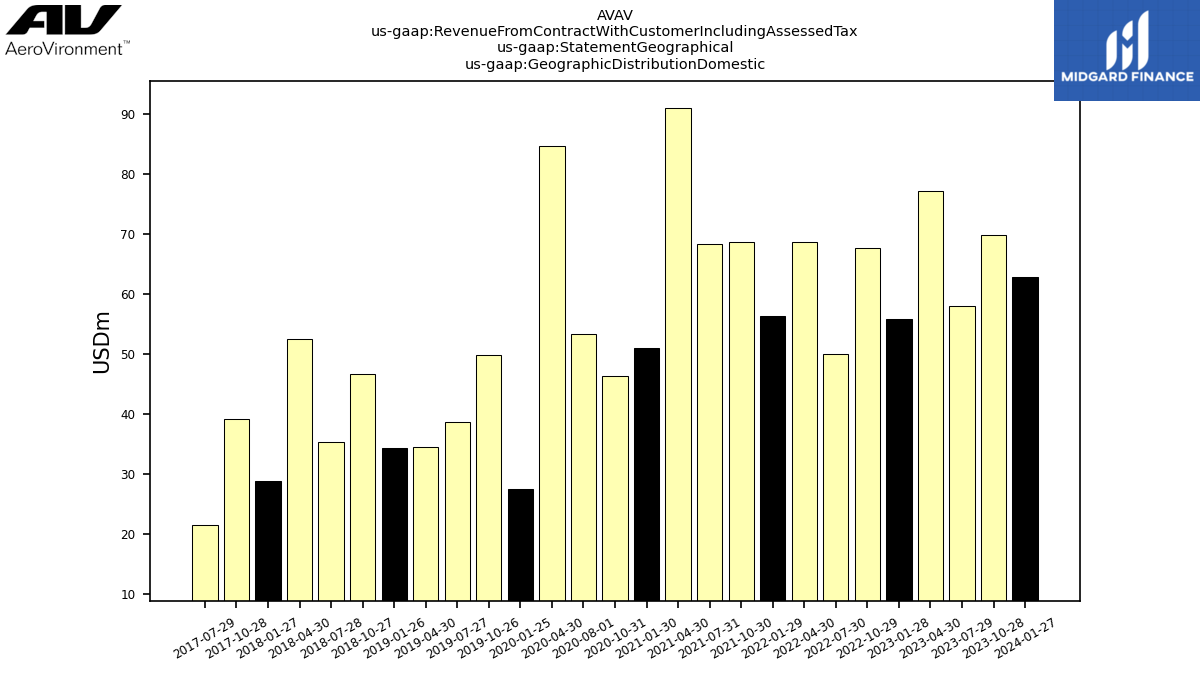
| Geographic Distribution Domestic | 62.87 | 69.97 | 58.13 | 77.29 | 55.95 | 67.66 | 50.10 | 68.73 | 56.48 | 68.66 | 68.39 | 91.01 | 51.06 | 46.40 | 53.43 | 84.65 | NA | 27.63 | NA | 49.97 | NA | 38.81 | 34.61 | NA | 34.44 | NA | 46.73 | NA | 35.35 | 52.58 | 28.84 | 39.17 | 21.57 | NA | NA | NA | NA | NA | NA | NA | NA | NA | NA | NA | NA | NA | NA | NA | NA | NA | NA | NA | NA | NA | NA | NA | NA | NA | NA | NA | NA |


