
| 2023-12-31 | 2023-09-30 | 2023-06-30 | 2023-03-31 | 2022-12-31 | 2022-09-30 | 2022-06-30 | 2022-03-31 | 2021-12-31 | 2021-09-30 | 2021-06-30 | 2021-03-31 | 2020-12-31 | 2020-09-30 | 2020-06-30 | 2020-03-31 | 2019-12-31 | 2019-09-30 | 2019-06-30 | 2019-03-31 | 2018-12-31 | 2018-09-30 | 2018-06-30 | 2018-03-31 | 2017-12-31 | 2017-09-30 | 2017-06-30 | 2017-03-31 | 2016-12-31 | 2016-09-30 | 2016-06-30 | 2016-03-31 | 2015-12-31 | 2015-09-30 | 2015-06-30 | 2015-03-31 | 2014-12-31 | 2014-09-30 | 2014-06-30 | 2014-03-31 | 2013-12-31 | 2013-09-30 | 2013-06-30 | 2013-03-31 | 2012-12-31 | 2012-09-30 | 2012-06-30 | 2012-03-31 | 2011-12-31 | 2011-09-30 | 2011-06-30 | 2011-03-31 | 2010-12-31 | 2010-09-30 | 2010-06-30 | 2010-03-31 | 2009-12-31 | 2009-09-30 | 2009-06-30 | 2009-03-31 | ||
|---|---|---|---|---|---|---|---|---|---|---|---|---|---|---|---|---|---|---|---|---|---|---|---|---|---|---|---|---|---|---|---|---|---|---|---|---|---|---|---|---|---|---|---|---|---|---|---|---|---|---|---|---|---|---|---|---|---|---|---|---|---|
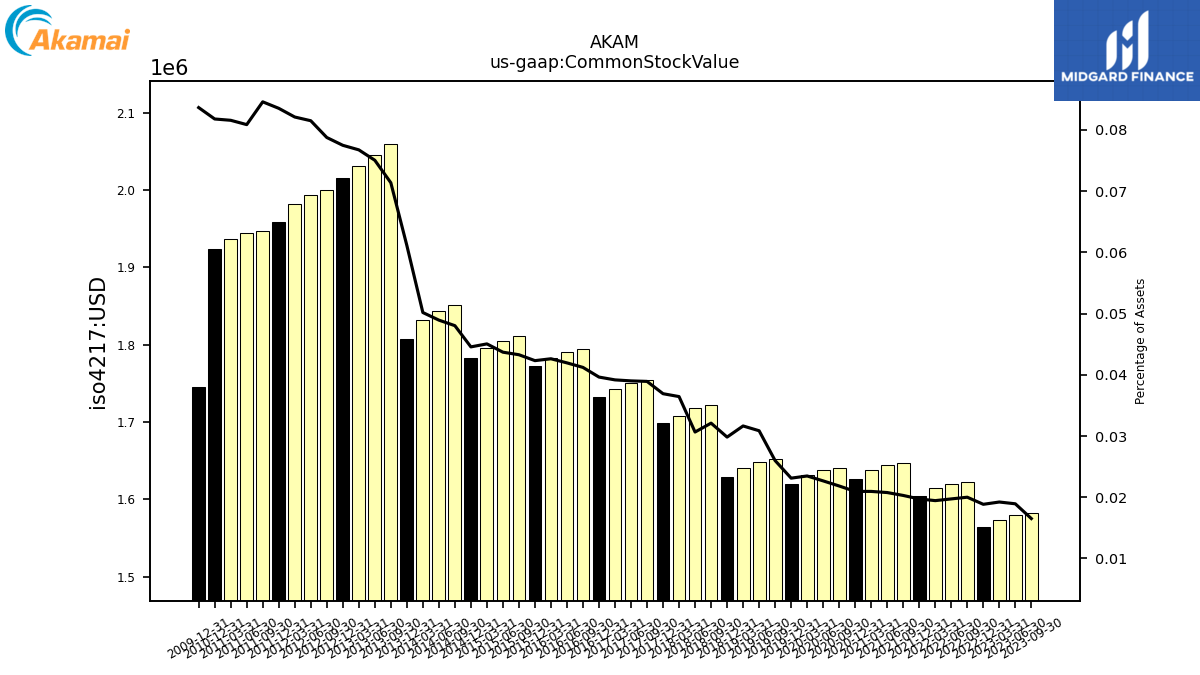
| Common Stock Value | 1.51 | 1.58 | 1.58 | 1.57 | 1.56 | 1.62 | 1.62 | 1.61 | 1.60 | 1.65 | 1.65 | 1.64 | 1.63 | 1.64 | 1.64 | 1.63 | 1.62 | 1.65 | 1.65 | 1.64 | 1.63 | 1.72 | 1.72 | 1.71 | 1.70 | 1.75 | 1.75 | 1.74 | 1.73 | 1.79 | 1.79 | 1.78 | 1.77 | 1.81 | 1.80 | 1.80 | 1.78 | 1.85 | 1.84 | 1.83 | 1.81 | 2.06 | 2.04 | 2.03 | 2.02 | 2.00 | 1.99 | 1.98 | 1.96 | 1.95 | 1.94 | 1.94 | 1.92 | NA | NA | NA | 1.75 | NA | NA | NA | |
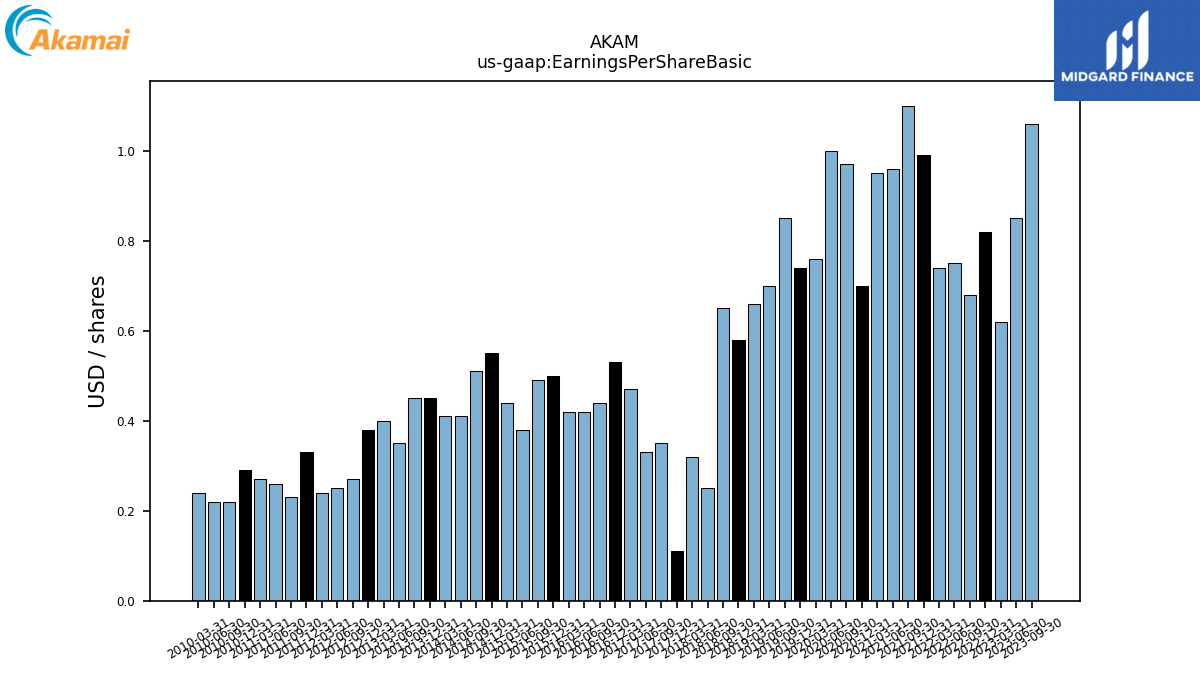
| Earnings Per Share Basic | 1.06 | 1.06 | 0.85 | 0.62 | 0.82 | 0.68 | 0.75 | 0.74 | 0.99 | 1.10 | 0.96 | 0.95 | 0.70 | 0.97 | 1.00 | 0.76 | 0.74 | 0.85 | 0.70 | 0.66 | 0.58 | 0.65 | 0.25 | 0.32 | 0.11 | 0.35 | 0.33 | 0.47 | 0.53 | 0.44 | 0.42 | 0.42 | 0.50 | 0.49 | 0.38 | 0.44 | 0.55 | 0.51 | 0.41 | 0.41 | 0.45 | 0.45 | 0.35 | 0.40 | 0.38 | 0.27 | 0.25 | 0.24 | 0.33 | 0.23 | 0.26 | 0.27 | 0.29 | 0.22 | 0.22 | 0.24 | NA | NA | NA | NA | |
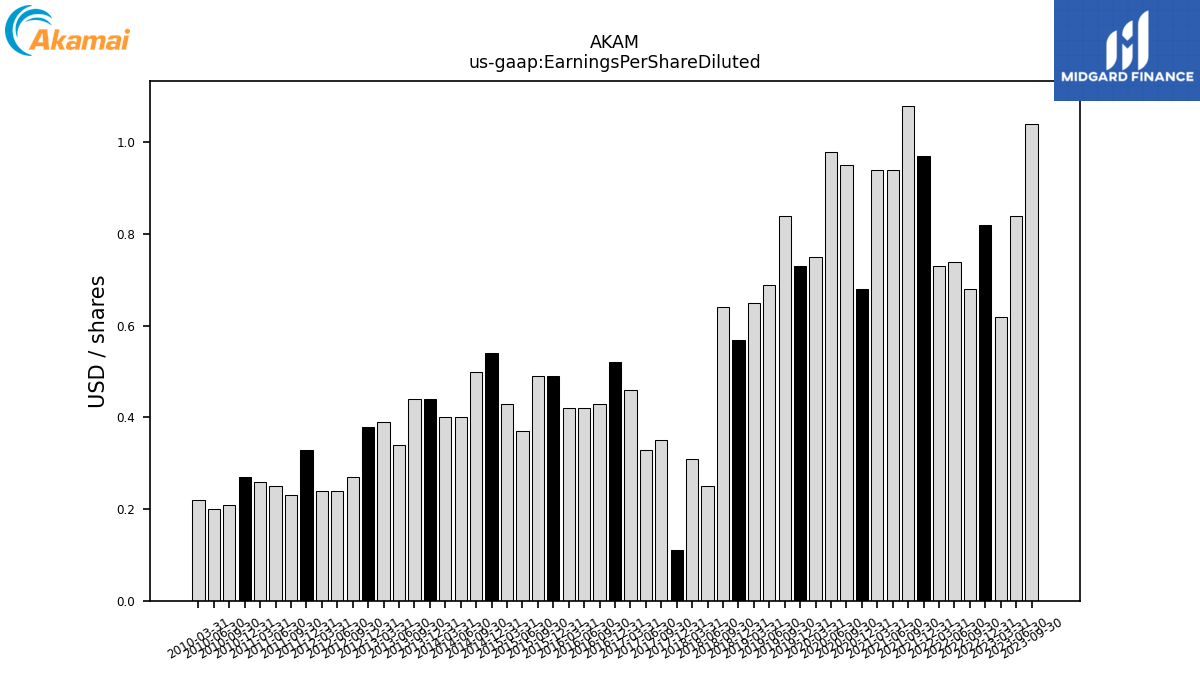
| Earnings Per Share Diluted | 1.02 | 1.04 | 0.84 | 0.62 | 0.82 | 0.68 | 0.74 | 0.73 | 0.97 | 1.08 | 0.94 | 0.94 | 0.68 | 0.95 | 0.98 | 0.75 | 0.73 | 0.84 | 0.69 | 0.65 | 0.57 | 0.64 | 0.25 | 0.31 | 0.11 | 0.35 | 0.33 | 0.46 | 0.52 | 0.43 | 0.42 | 0.42 | 0.49 | 0.49 | 0.37 | 0.43 | 0.54 | 0.50 | 0.40 | 0.40 | 0.44 | 0.44 | 0.34 | 0.39 | 0.38 | 0.27 | 0.24 | 0.24 | 0.33 | 0.23 | 0.25 | 0.26 | 0.27 | 0.21 | 0.20 | 0.22 | NA | NA | NA | NA |
| 2023-12-31 | 2023-09-30 | 2023-06-30 | 2023-03-31 | 2022-12-31 | 2022-09-30 | 2022-06-30 | 2022-03-31 | 2021-12-31 | 2021-09-30 | 2021-06-30 | 2021-03-31 | 2020-12-31 | 2020-09-30 | 2020-06-30 | 2020-03-31 | 2019-12-31 | 2019-09-30 | 2019-06-30 | 2019-03-31 | 2018-12-31 | 2018-09-30 | 2018-06-30 | 2018-03-31 | 2017-12-31 | 2017-09-30 | 2017-06-30 | 2017-03-31 | 2016-12-31 | 2016-09-30 | 2016-06-30 | 2016-03-31 | 2015-12-31 | 2015-09-30 | 2015-06-30 | 2015-03-31 | 2014-12-31 | 2014-09-30 | 2014-06-30 | 2014-03-31 | 2013-12-31 | 2013-09-30 | 2013-06-30 | 2013-03-31 | 2012-12-31 | 2012-09-30 | 2012-06-30 | 2012-03-31 | 2011-12-31 | 2011-09-30 | 2011-06-30 | 2011-03-31 | 2010-12-31 | 2010-09-30 | 2010-06-30 | 2010-03-31 | 2009-12-31 | 2009-09-30 | 2009-06-30 | 2009-03-31 | ||
|---|---|---|---|---|---|---|---|---|---|---|---|---|---|---|---|---|---|---|---|---|---|---|---|---|---|---|---|---|---|---|---|---|---|---|---|---|---|---|---|---|---|---|---|---|---|---|---|---|---|---|---|---|---|---|---|---|---|---|---|---|---|
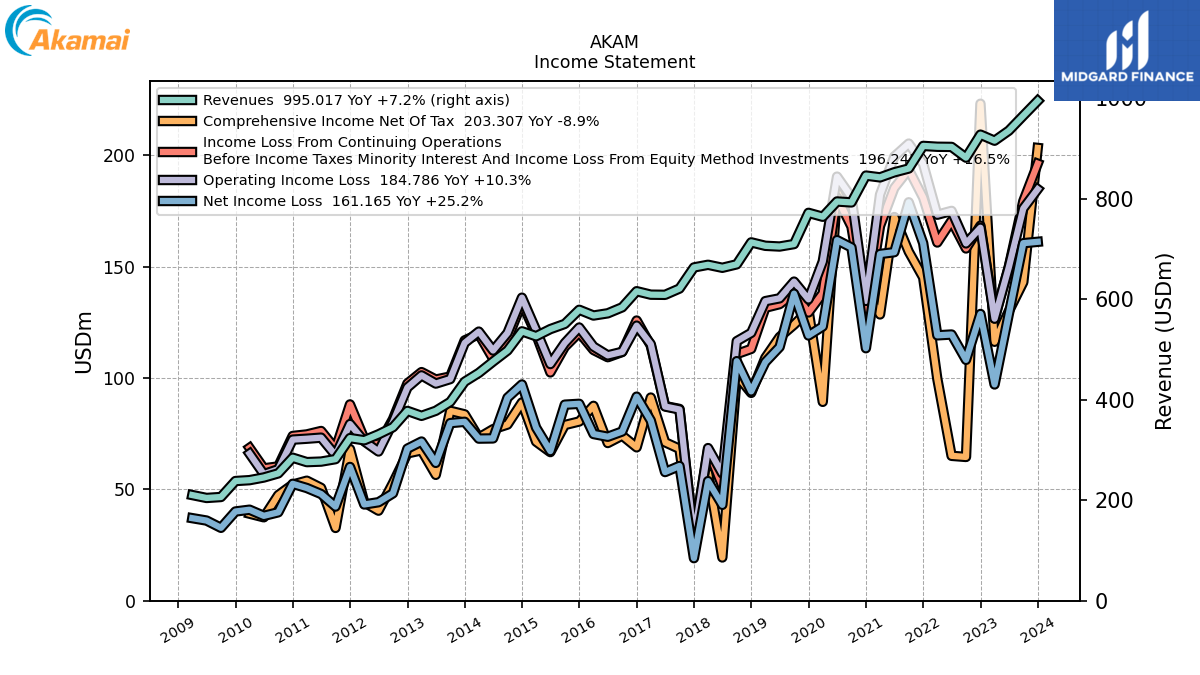
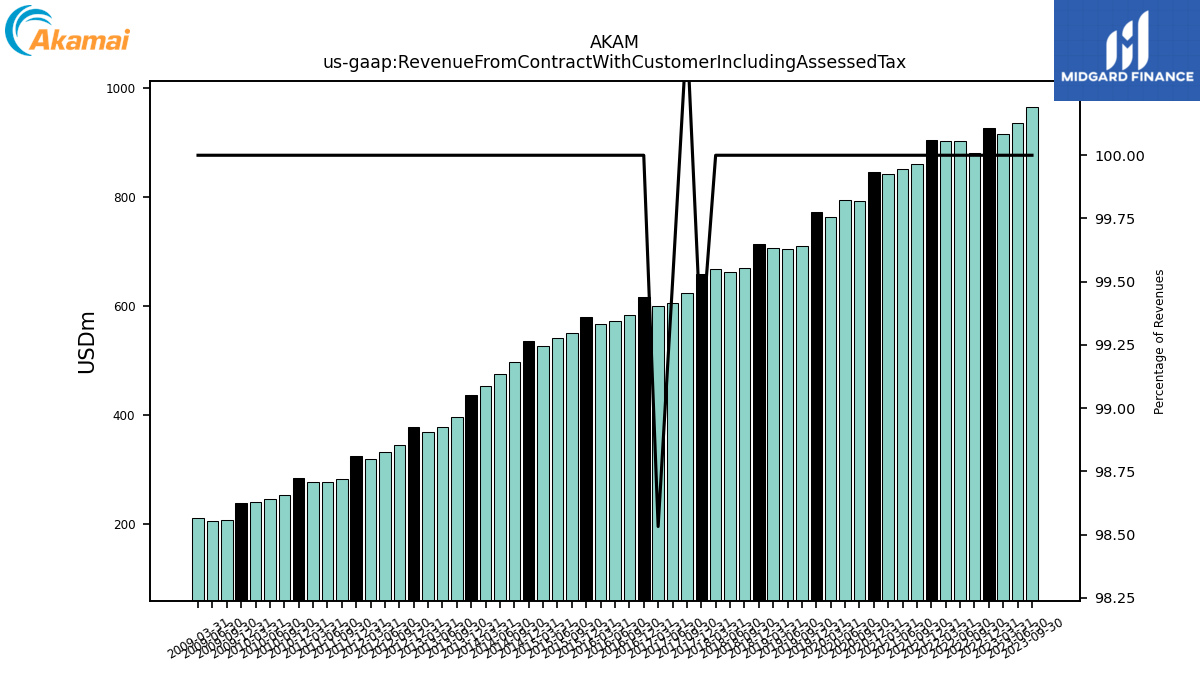
| Revenue From Contract With Customer Including Assessed Tax | 995.02 | 965.48 | 935.72 | 915.70 | 927.78 | 881.90 | 903.33 | 903.65 | 905.36 | 860.33 | 852.82 | 842.71 | 846.29 | 792.85 | 794.72 | 764.30 | 772.12 | 709.91 | 705.07 | 706.51 | 713.36 | 669.63 | 662.76 | 668.72 | 658.47 | 624.44 | 605.83 | 600.29 | 616.12 | 584.07 | 572.13 | 567.73 | 579.16 | 551.03 | 540.72 | 526.54 | 536.29 | 498.04 | 476.04 | 453.50 | 435.98 | 395.79 | 378.11 | 368.05 | 377.87 | 345.32 | 331.31 | 319.45 | 323.74 | 281.86 | 276.99 | 275.95 | 284.69 | 253.55 | 245.32 | 240.03 | 238.31 | 206.50 | 204.60 | 210.37 | |
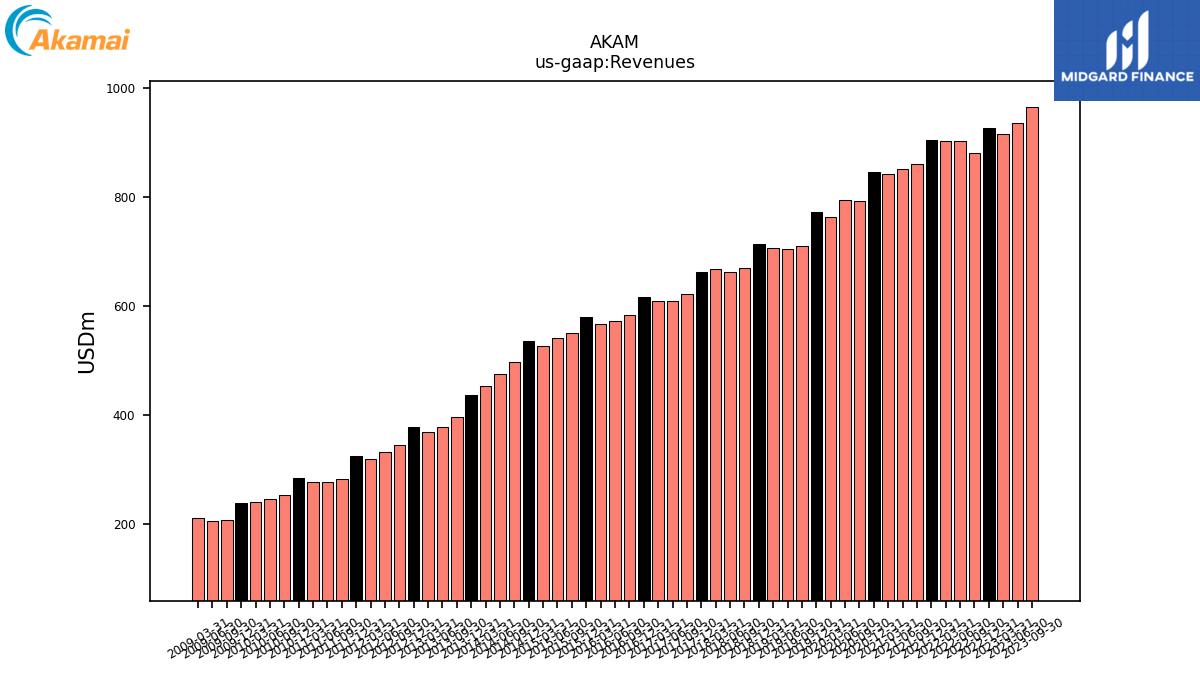
| Revenues | 995.02 | 965.48 | 935.72 | 915.70 | 927.78 | 881.90 | 903.33 | 903.65 | 905.36 | 860.33 | 852.82 | 842.71 | 846.29 | 792.85 | 794.72 | 764.30 | 772.12 | 709.91 | 705.07 | 706.51 | 713.36 | 669.63 | 662.76 | 668.72 | 663.45 | 621.40 | 608.91 | 609.24 | 616.12 | 584.07 | 572.13 | 567.73 | 579.16 | 551.03 | 540.72 | 526.54 | 536.29 | 498.04 | 476.04 | 453.50 | 435.98 | 395.79 | 378.11 | 368.05 | 377.87 | 345.32 | 331.31 | 319.45 | 323.74 | 281.86 | 276.99 | 275.95 | 284.69 | 253.55 | 245.32 | 240.03 | 238.31 | 206.50 | 204.60 | 210.37 | |
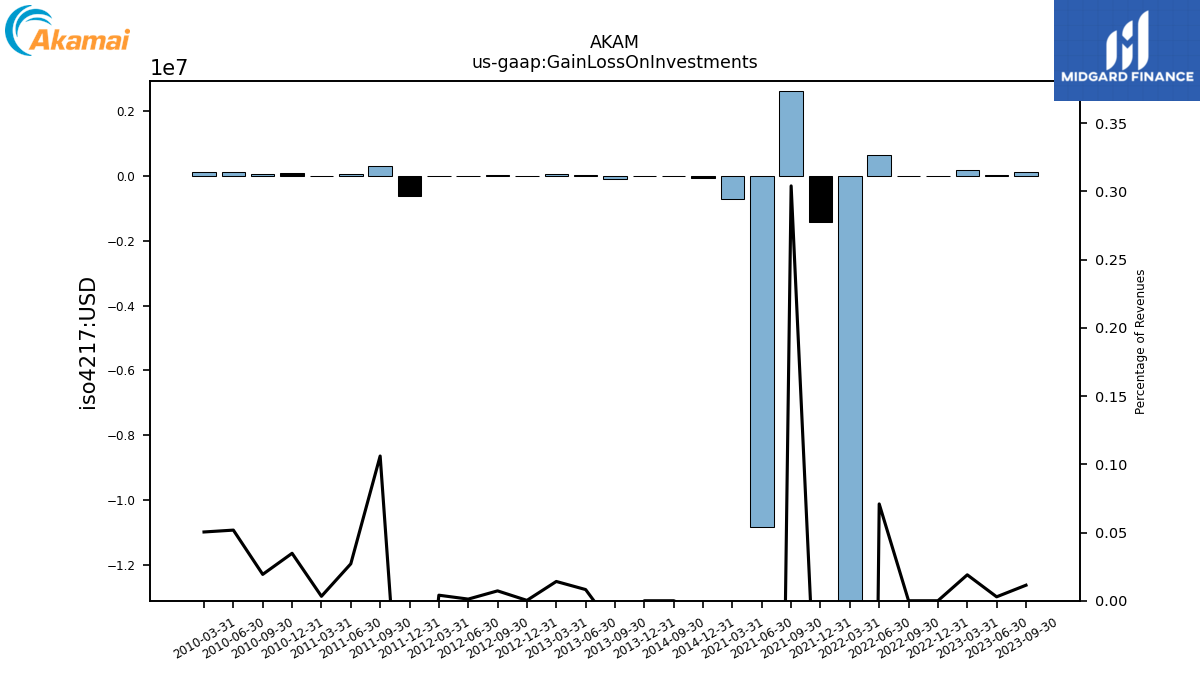
| Gain Loss On Investments | 0.00 | 0.11 | 0.03 | 0.17 | 0.00 | 0.00 | 0.64 | -16.54 | -1.43 | 2.62 | -10.82 | -0.70 | NA | NA | NA | NA | NA | NA | NA | NA | NA | NA | NA | NA | NA | NA | NA | NA | NA | NA | NA | NA | NA | NA | NA | NA | -0.05 | 0.00 | NA | NA | 0.00 | -0.08 | 0.03 | 0.05 | 0.00 | 0.03 | 0.00 | 0.01 | -0.63 | 0.30 | 0.07 | 0.01 | 0.10 | 0.05 | 0.13 | 0.12 | NA | NA | NA | NA | |
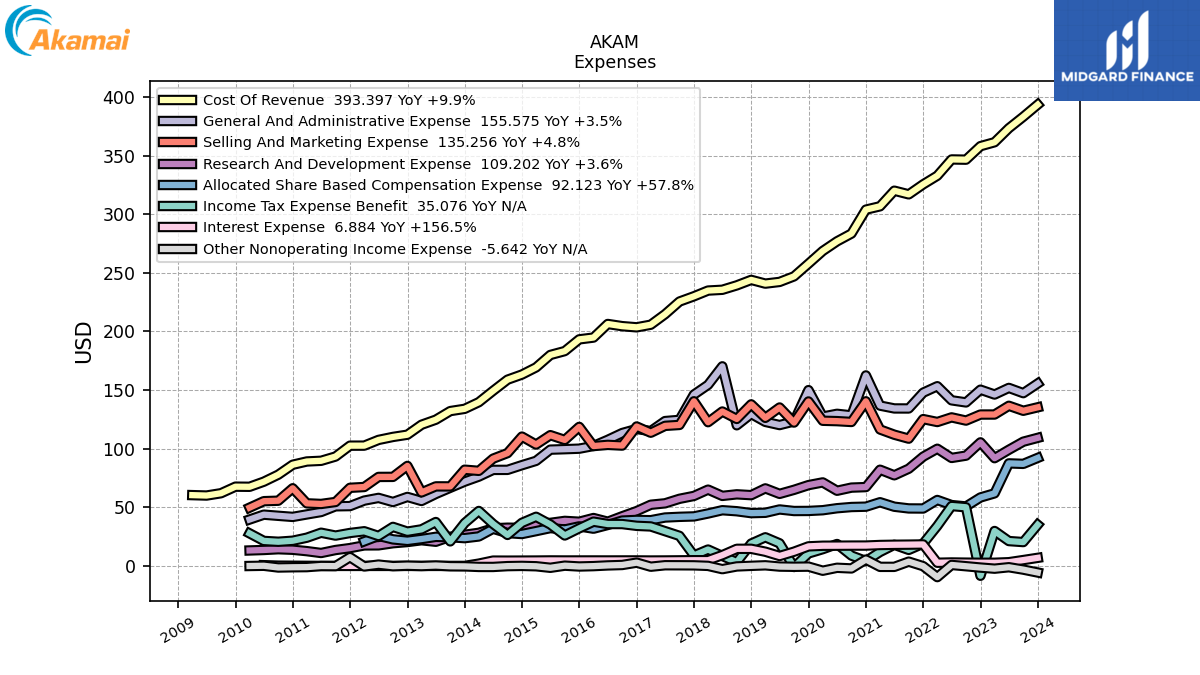
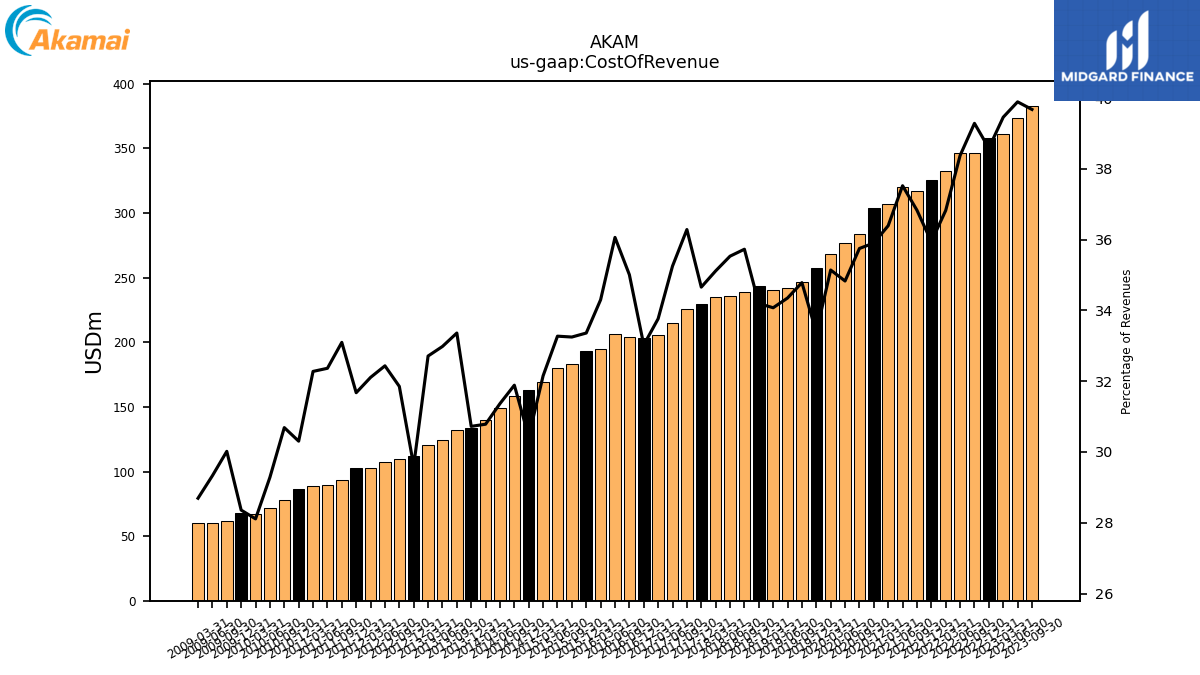
| Cost Of Revenue | 393.40 | 383.07 | 373.27 | 361.32 | 357.97 | 346.45 | 346.65 | 332.75 | 325.40 | 316.87 | 320.00 | 306.69 | 303.85 | 283.44 | 276.80 | 268.58 | 257.75 | 246.94 | 242.19 | 240.74 | 243.93 | 239.25 | 235.49 | 234.82 | 229.94 | 225.47 | 214.65 | 205.70 | 203.47 | 204.47 | 206.32 | 194.74 | 193.21 | 183.20 | 179.91 | 169.29 | 163.20 | 158.81 | 149.32 | 139.61 | 133.95 | 132.04 | 124.70 | 120.39 | 111.89 | 110.00 | 107.46 | 102.57 | 102.54 | 93.28 | 89.65 | 89.07 | 86.28 | 77.81 | 71.84 | 67.47 | 67.58 | 61.99 | 60.01 | 60.36 | |
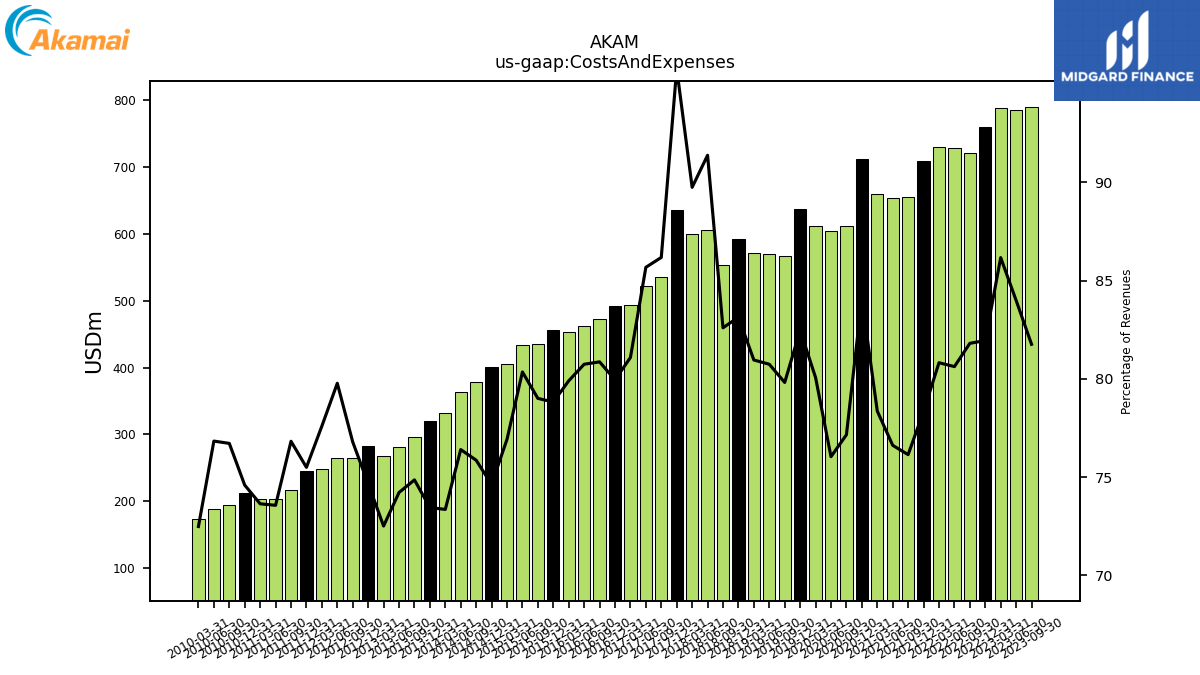
| Costs And Expenses | 810.23 | 789.36 | 785.94 | 789.06 | 760.30 | 721.46 | 728.29 | 730.33 | 709.27 | 655.07 | 653.39 | 660.34 | 711.67 | 611.69 | 604.29 | 611.97 | 636.80 | 566.62 | 569.29 | 571.98 | 593.08 | 553.09 | 605.64 | 600.17 | 635.55 | 535.52 | 521.70 | 494.01 | 492.59 | 472.30 | 461.95 | 453.61 | 456.48 | 435.34 | 434.46 | 405.01 | 400.21 | 377.80 | 363.68 | 332.65 | 320.22 | 296.27 | 280.60 | 266.86 | 282.13 | 265.16 | 264.30 | 247.87 | 244.40 | 216.52 | 203.76 | 203.21 | 212.34 | 194.51 | 188.48 | 173.98 | NA | NA | NA | NA | |
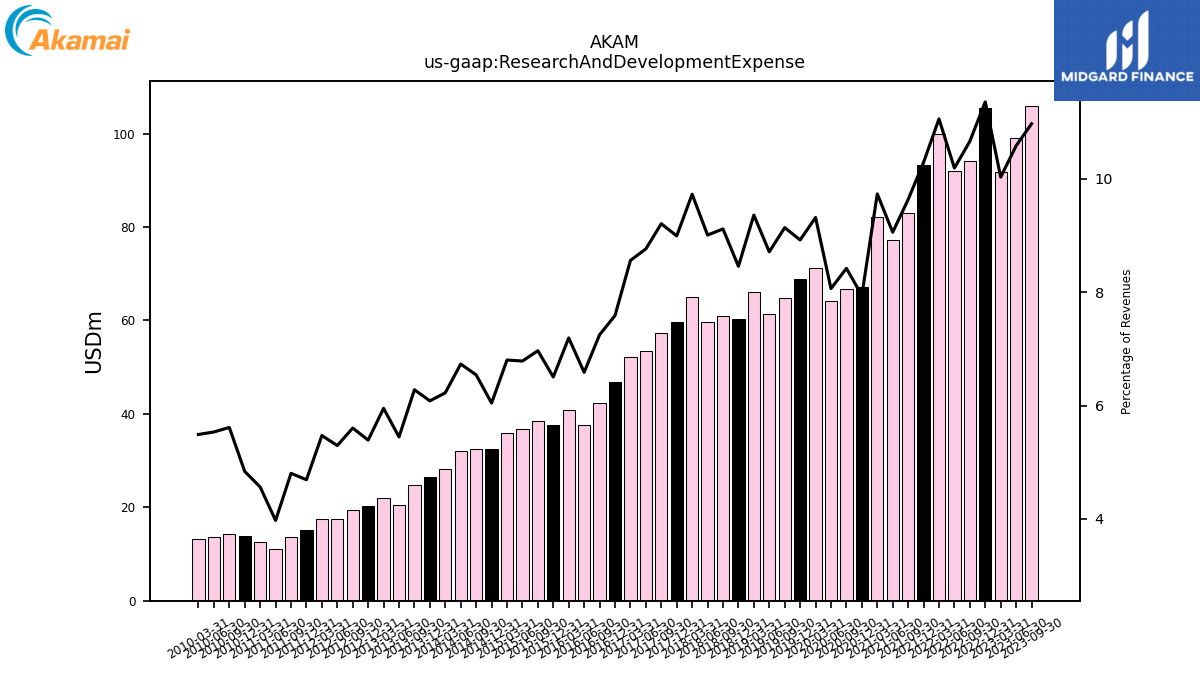
| Research And Development Expense | 109.20 | 105.94 | 99.04 | 91.86 | 105.38 | 94.05 | 92.07 | 99.94 | 93.17 | 82.90 | 77.25 | 82.05 | 67.23 | 66.77 | 64.09 | 71.22 | 68.90 | 64.89 | 61.44 | 66.14 | 60.34 | 61.05 | 59.71 | 65.06 | 59.67 | 57.23 | 53.37 | 52.16 | 46.76 | 42.34 | 37.69 | 40.84 | 37.67 | 38.40 | 36.69 | 35.83 | 32.42 | 32.58 | 32.05 | 28.23 | 26.52 | 24.86 | 20.60 | 21.91 | 20.37 | 19.35 | 17.54 | 17.48 | 15.19 | 13.54 | 11.01 | 12.59 | 13.78 | 14.23 | 13.58 | 13.18 | NA | NA | NA | NA | |
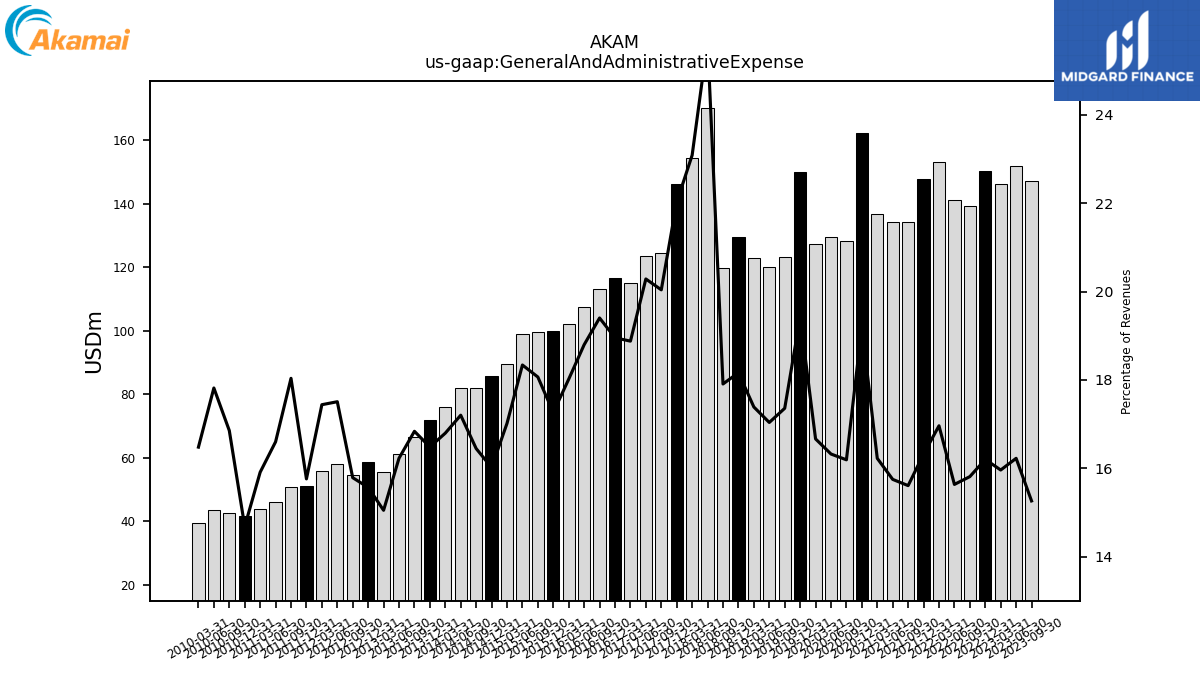
| General And Administrative Expense | 155.57 | 147.33 | 151.81 | 146.14 | 150.30 | 139.43 | 141.22 | 153.26 | 147.75 | 134.26 | 134.29 | 136.72 | 162.45 | 128.37 | 129.71 | 127.36 | 149.93 | 123.22 | 120.12 | 122.83 | 129.56 | 119.91 | 170.21 | 154.38 | 146.12 | 124.52 | 123.52 | 115.01 | 116.78 | 113.32 | 107.54 | 102.28 | 99.98 | 99.54 | 99.15 | 89.59 | 85.90 | 81.91 | 81.88 | 76.16 | 71.85 | 66.63 | 61.35 | 55.38 | 58.82 | 54.51 | 58.00 | 55.71 | 51.02 | 50.83 | 45.98 | 43.90 | 41.79 | 42.73 | 43.71 | 39.55 | NA | NA | NA | NA | |
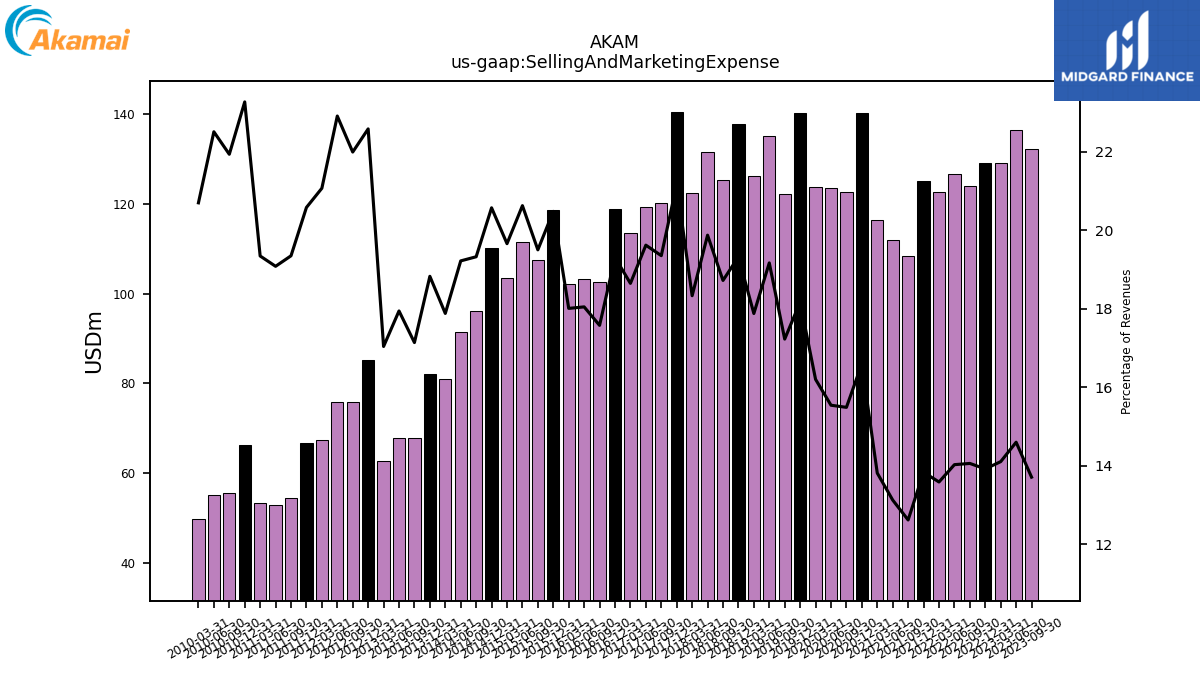
| Selling And Marketing Expense | 135.26 | 132.31 | 136.55 | 129.11 | 129.09 | 123.94 | 126.67 | 122.72 | 125.20 | 108.51 | 111.89 | 116.35 | 140.40 | 122.75 | 123.47 | 123.79 | 140.24 | 122.26 | 135.11 | 126.28 | 137.80 | 125.32 | 131.68 | 122.55 | 140.41 | 120.22 | 119.43 | 113.57 | 118.91 | 102.63 | 103.22 | 102.21 | 118.58 | 107.43 | 111.50 | 103.48 | 110.29 | 96.22 | 91.46 | 81.06 | 82.05 | 67.81 | 67.83 | 62.69 | 85.31 | 75.92 | 75.88 | 67.29 | 66.61 | 54.52 | 52.84 | 53.37 | 66.23 | 55.60 | 55.20 | 49.67 | NA | NA | NA | NA | |
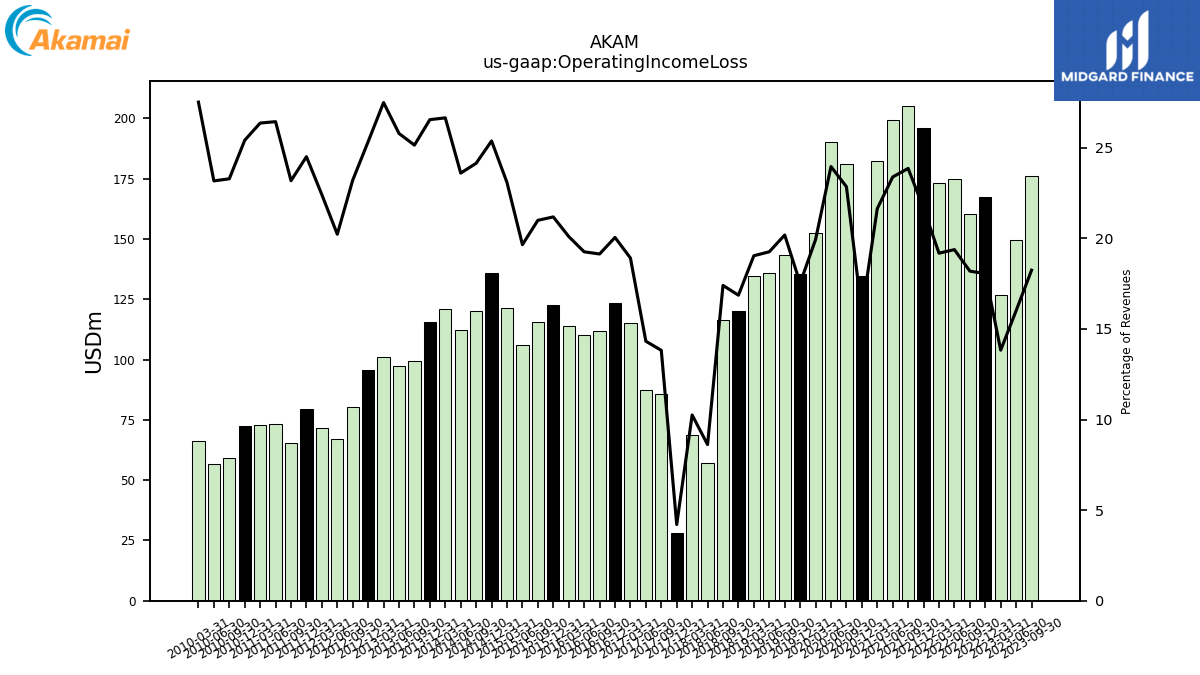
| Operating Income Loss | 184.79 | 176.13 | 149.78 | 126.64 | 167.47 | 160.44 | 175.04 | 173.32 | 196.09 | 205.26 | 199.43 | 182.36 | 134.62 | 181.16 | 190.43 | 152.33 | 135.32 | 143.29 | 135.78 | 134.53 | 120.29 | 116.54 | 57.12 | 68.56 | 27.90 | 85.88 | 87.21 | 115.23 | 123.53 | 111.77 | 110.18 | 114.12 | 122.68 | 115.69 | 106.26 | 121.52 | 136.08 | 120.24 | 112.35 | 120.85 | 115.76 | 99.52 | 97.50 | 101.19 | 95.74 | 80.16 | 67.01 | 71.58 | 79.34 | 65.33 | 73.23 | 72.75 | 72.35 | 59.04 | 56.84 | 66.05 | NA | NA | NA | NA | |
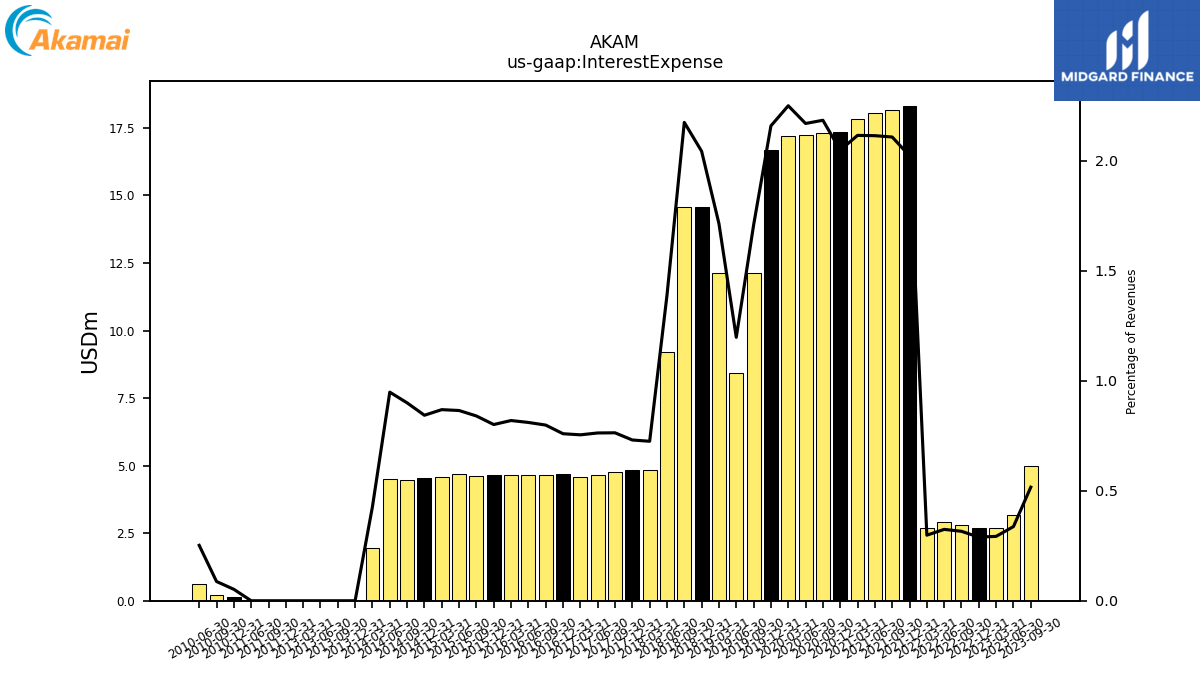
| Interest Expense | 6.88 | 4.99 | 3.16 | 2.68 | 2.68 | 2.79 | 2.93 | 2.69 | 18.32 | 18.14 | 18.04 | 17.83 | 17.34 | 17.32 | 17.25 | 17.20 | 16.68 | 12.13 | 8.45 | 12.12 | 14.58 | 14.57 | 9.20 | 4.85 | 4.85 | 4.75 | 4.65 | 4.60 | 4.68 | 4.67 | 4.64 | 4.65 | 4.64 | 4.63 | 4.68 | 4.58 | 4.52 | 4.48 | 4.52 | 1.94 | 0.00 | 0.00 | 0.00 | 0.00 | NA | NA | NA | NA | 0.00 | 0.00 | 0.00 | NA | 0.15 | 0.22 | 0.62 | NA | NA | NA | NA | NA | |
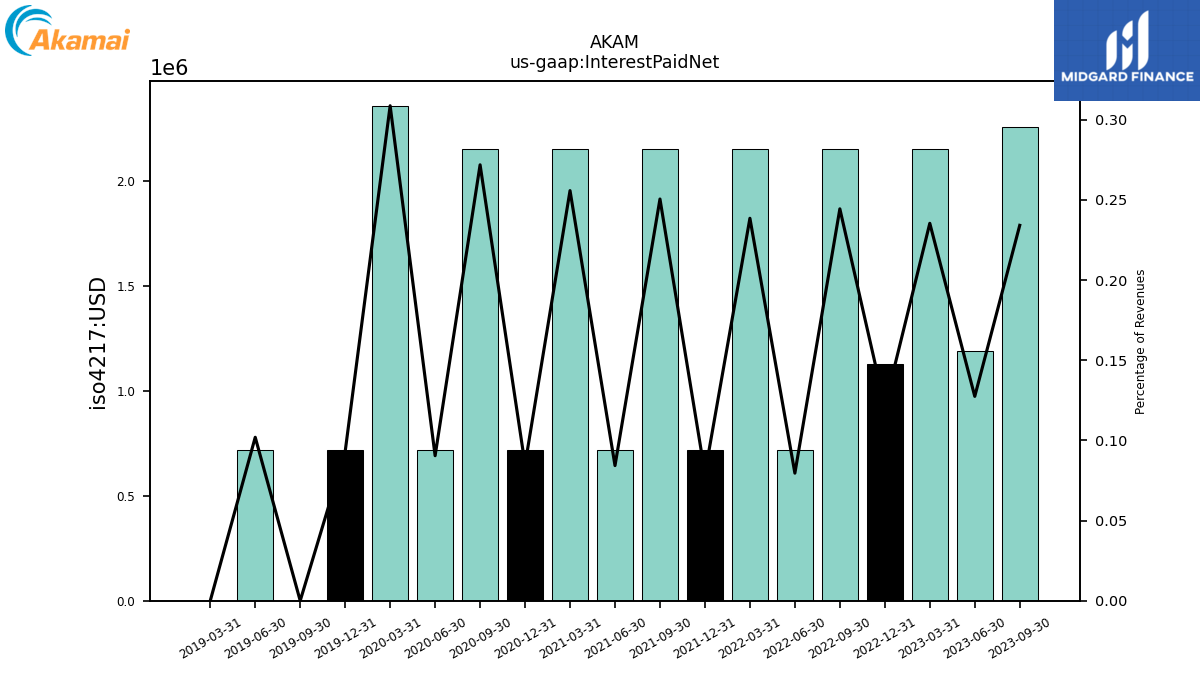
| Interest Paid Net | 0.72 | 2.26 | 1.19 | 2.16 | 1.13 | 2.16 | 0.72 | 2.16 | 0.72 | 2.16 | 0.72 | 2.16 | 0.72 | 2.16 | 0.72 | 2.36 | 0.72 | 0.00 | 0.72 | 0.00 | NA | NA | NA | NA | NA | NA | NA | NA | NA | NA | NA | NA | NA | NA | NA | NA | NA | NA | NA | NA | NA | NA | NA | NA | NA | NA | NA | NA | NA | NA | NA | NA | NA | NA | NA | NA | NA | NA | NA | NA | |
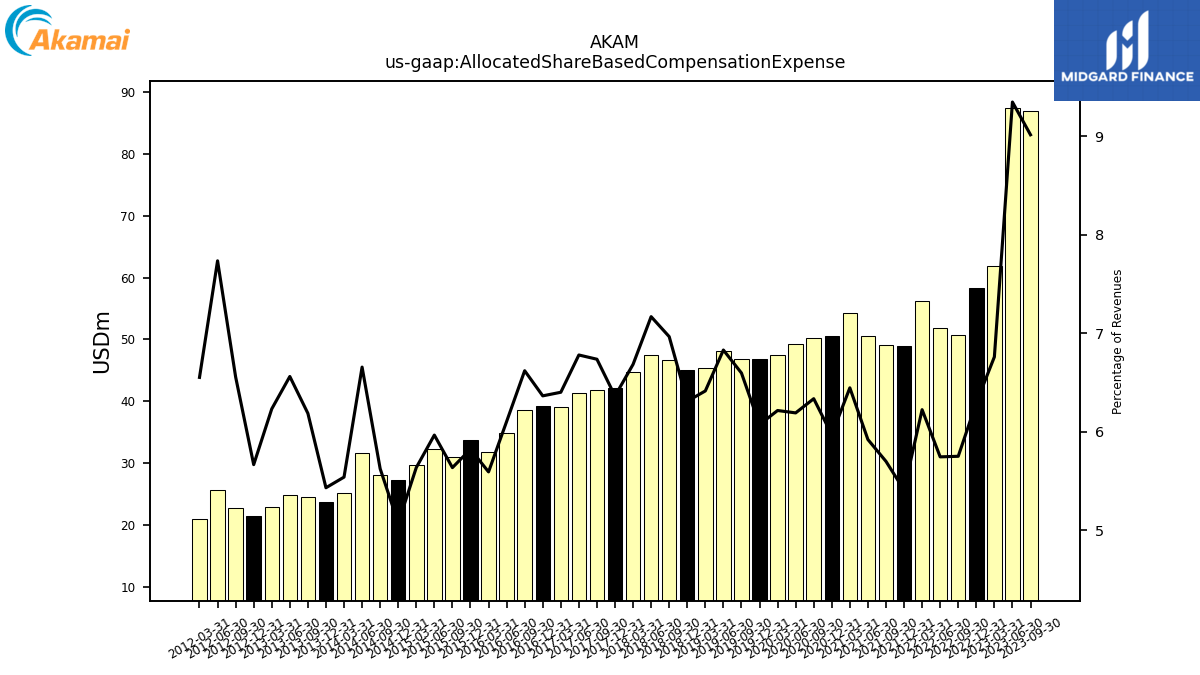
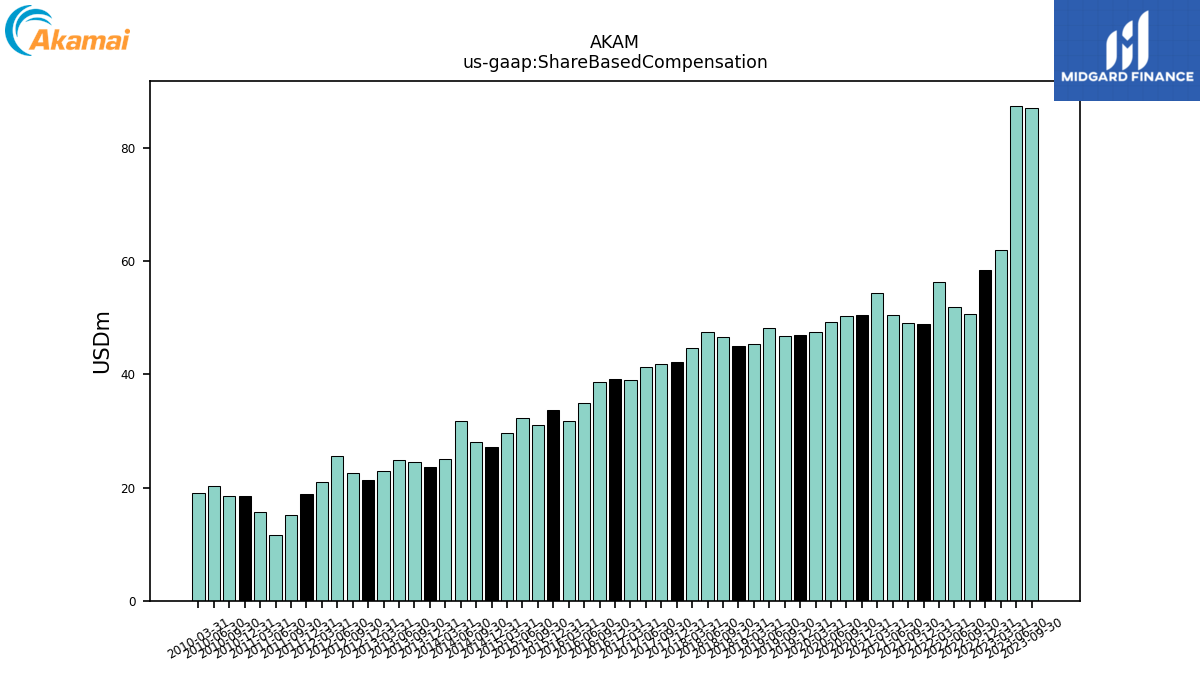
| Allocated Share Based Compensation Expense | 92.12 | 87.02 | 87.44 | 61.88 | 58.37 | 50.70 | 51.88 | 56.23 | 48.95 | 49.02 | 50.48 | 54.30 | 50.51 | 50.22 | 49.19 | 47.49 | 46.88 | 46.81 | 48.14 | 45.30 | 45.00 | 46.63 | 47.50 | 44.69 | 42.20 | 41.85 | 41.27 | 38.99 | 39.20 | 38.65 | 34.91 | 31.74 | 33.71 | 31.05 | 32.25 | 29.67 | 27.20 | 28.01 | 31.68 | 25.11 | 23.67 | 24.48 | 24.80 | 22.93 | 21.41 | 22.64 | 25.62 | 20.92 | NA | NA | NA | NA | NA | NA | NA | NA | NA | NA | NA | NA | |
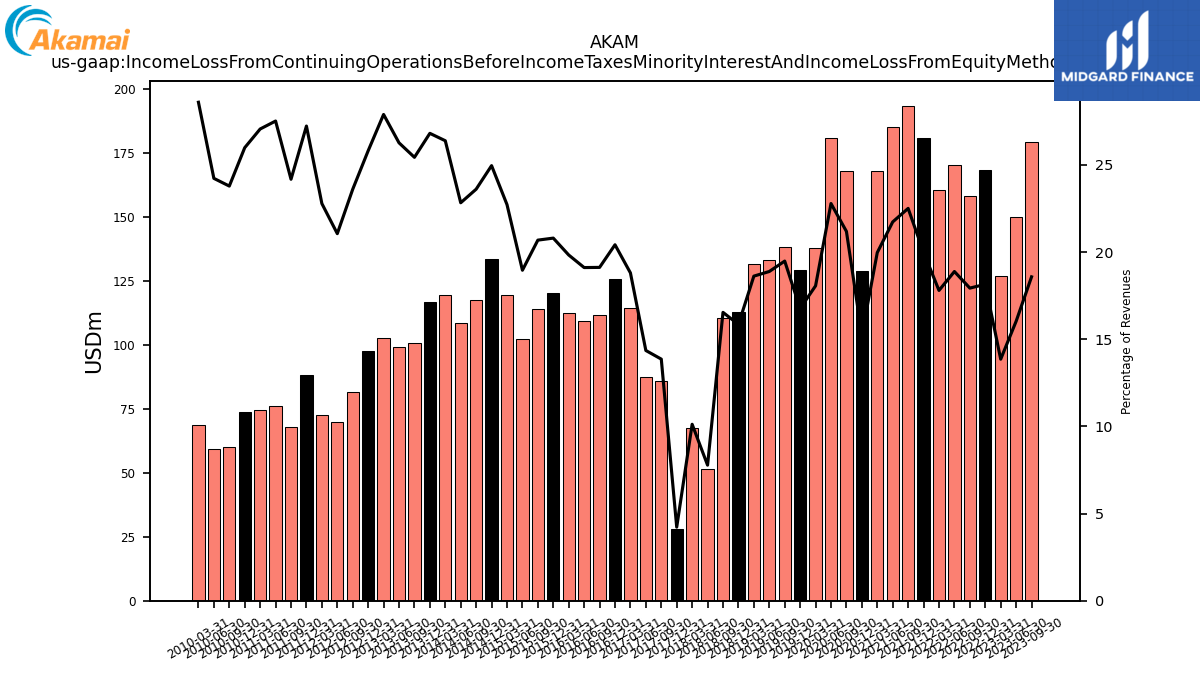
| Income Loss From Continuing Operations Before Income Taxes Minority Interest And Income Loss From Equity Method Investments | 196.24 | 179.39 | 150.01 | 126.89 | 168.40 | 158.16 | 170.59 | 160.85 | 180.98 | 193.63 | 185.32 | 168.29 | 128.96 | 167.98 | 181.08 | 138.06 | 129.44 | 138.32 | 133.17 | 131.56 | 113.07 | 110.77 | 51.55 | 67.69 | 28.01 | 86.13 | 87.41 | 114.57 | 125.81 | 111.69 | 109.35 | 112.60 | 120.47 | 113.99 | 102.52 | 119.64 | 133.86 | 117.58 | 108.68 | 119.66 | 116.89 | 100.67 | 99.32 | 102.66 | 97.53 | 81.51 | 69.77 | 72.78 | 88.15 | 68.15 | 76.22 | 74.67 | 73.98 | 60.31 | 59.44 | 68.64 | NA | NA | NA | NA | |
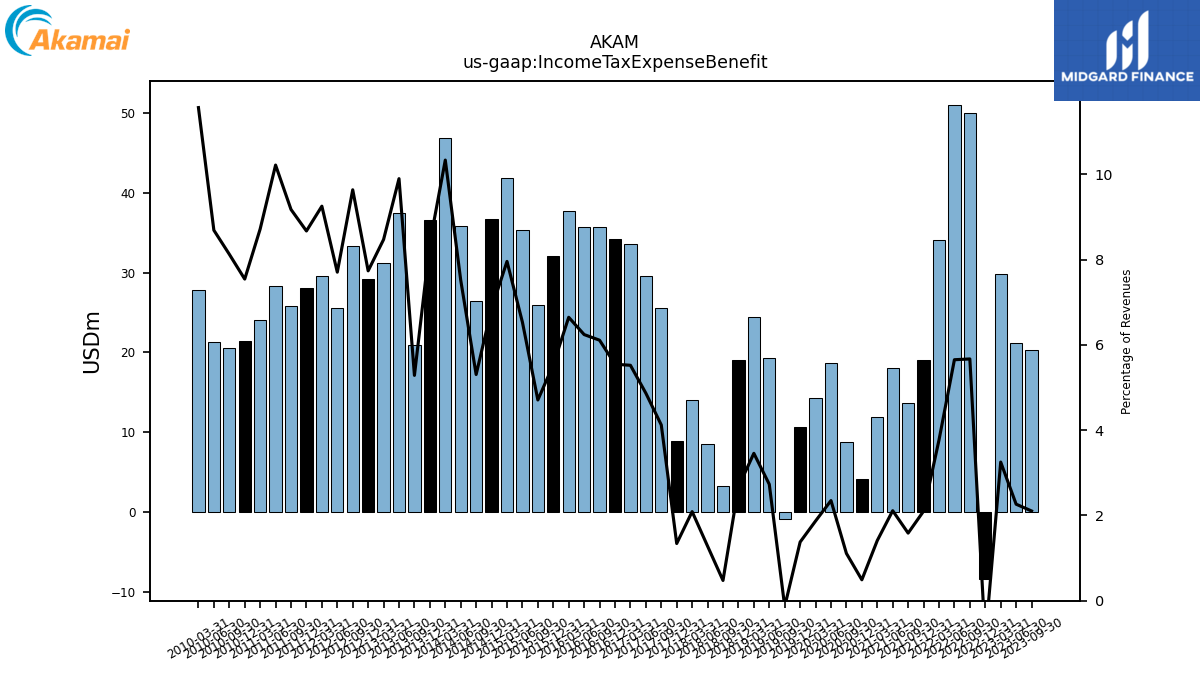
| Income Tax Expense Benefit | 35.08 | 20.33 | 21.19 | 29.78 | -8.42 | 50.01 | 51.06 | 34.05 | 19.02 | 13.65 | 18.01 | 11.90 | 4.16 | 8.80 | 18.67 | 14.29 | 10.63 | -0.96 | 19.25 | 24.43 | 19.06 | 3.19 | 8.49 | 13.98 | 8.91 | 25.62 | 29.64 | 33.64 | 34.17 | 35.69 | 35.71 | 37.74 | 32.05 | 25.95 | 35.32 | 41.90 | 36.75 | 26.42 | 35.79 | 46.86 | 36.55 | 20.92 | 37.43 | 31.18 | 29.24 | 33.28 | 25.53 | 29.56 | 28.07 | 25.86 | 28.30 | 24.06 | 21.48 | 20.60 | 21.32 | 27.76 | NA | NA | NA | NA | |
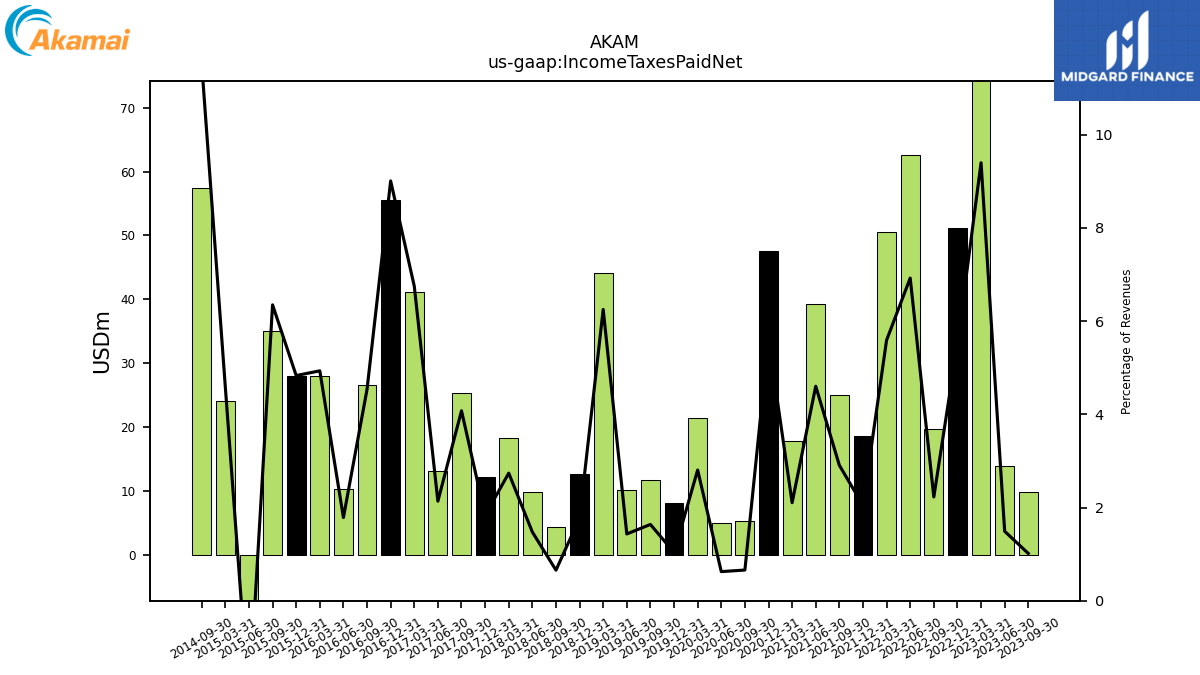
| Income Taxes Paid Net | 24.66 | 9.80 | 13.95 | 86.07 | 51.17 | 19.64 | 62.55 | 50.53 | 18.53 | 25.01 | 39.26 | 17.74 | 47.53 | 5.22 | 4.97 | 21.44 | 8.00 | 11.62 | 10.11 | 44.16 | 12.64 | 4.40 | 9.78 | 18.31 | 12.16 | 25.33 | 13.01 | 41.13 | 55.51 | 26.49 | 10.22 | 28.01 | 27.99 | 34.99 | -12.08 | 24.13 | NA | 57.36 | NA | NA | NA | NA | NA | NA | NA | NA | NA | NA | NA | NA | NA | NA | NA | NA | NA | NA | NA | NA | NA | NA | |
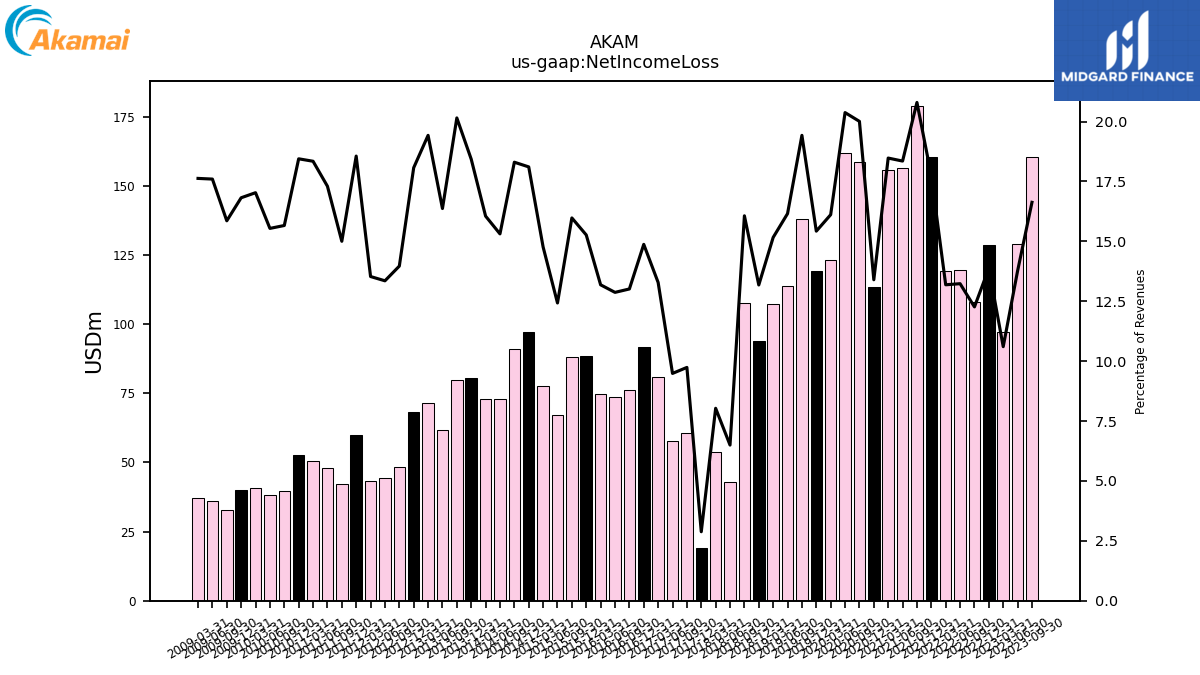
| Net Income Loss | 161.16 | 160.54 | 128.82 | 97.11 | 128.76 | 108.15 | 119.54 | 119.16 | 160.53 | 178.92 | 156.50 | 155.69 | 113.37 | 158.62 | 161.91 | 123.15 | 119.10 | 137.89 | 113.92 | 107.13 | 94.02 | 107.58 | 43.06 | 53.71 | 19.11 | 60.51 | 57.77 | 80.93 | 91.64 | 76.00 | 73.64 | 74.86 | 88.42 | 88.04 | 67.20 | 77.75 | 97.11 | 91.16 | 72.89 | 72.80 | 80.35 | 79.76 | 61.90 | 71.49 | 68.29 | 48.23 | 44.24 | 43.23 | 60.08 | 42.28 | 47.92 | 50.62 | 52.51 | 39.71 | 38.12 | 40.88 | 40.08 | 32.74 | 36.01 | 37.08 | |
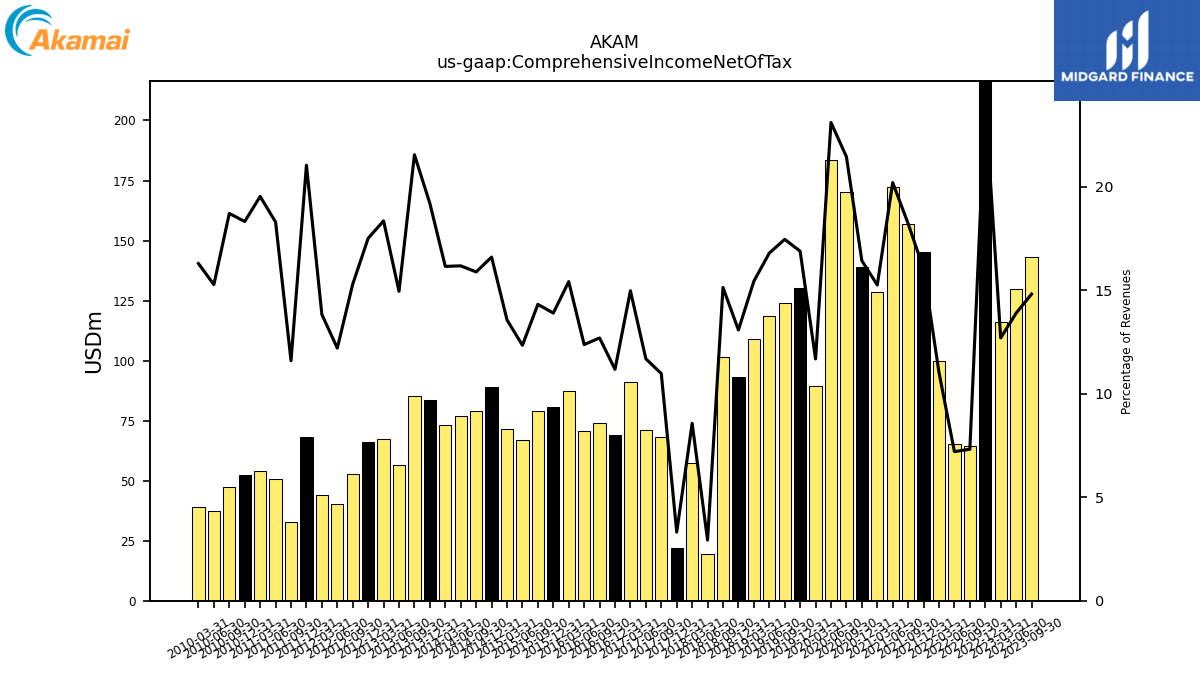
| Comprehensive Income Net Of Tax | 203.31 | 143.03 | 130.01 | 116.28 | 223.16 | 64.56 | 65.07 | 99.66 | 145.16 | 156.75 | 172.29 | 128.55 | 139.02 | 170.08 | 183.60 | 89.30 | 130.38 | 123.95 | 118.41 | 109.06 | 93.32 | 101.34 | 19.42 | 57.31 | 22.01 | 68.20 | 71.17 | 91.24 | 68.88 | 74.15 | 70.81 | 87.52 | 80.49 | 78.90 | 66.73 | 71.44 | 89.04 | 79.11 | 77.02 | 73.25 | 83.69 | 85.28 | 56.52 | 67.54 | 66.17 | 52.82 | 40.44 | 44.18 | 68.12 | 32.69 | 50.68 | 53.90 | 52.16 | 47.44 | 37.47 | 39.10 | NA | NA | NA | NA |
| 2023-12-31 | 2023-09-30 | 2023-06-30 | 2023-03-31 | 2022-12-31 | 2022-09-30 | 2022-06-30 | 2022-03-31 | 2021-12-31 | 2021-09-30 | 2021-06-30 | 2021-03-31 | 2020-12-31 | 2020-09-30 | 2020-06-30 | 2020-03-31 | 2019-12-31 | 2019-09-30 | 2019-06-30 | 2019-03-31 | 2018-12-31 | 2018-09-30 | 2018-06-30 | 2018-03-31 | 2017-12-31 | 2017-09-30 | 2017-06-30 | 2017-03-31 | 2016-12-31 | 2016-09-30 | 2016-06-30 | 2016-03-31 | 2015-12-31 | 2015-09-30 | 2015-06-30 | 2015-03-31 | 2014-12-31 | 2014-09-30 | 2014-06-30 | 2014-03-31 | 2013-12-31 | 2013-09-30 | 2013-06-30 | 2013-03-31 | 2012-12-31 | 2012-09-30 | 2012-06-30 | 2012-03-31 | 2011-12-31 | 2011-09-30 | 2011-06-30 | 2011-03-31 | 2010-12-31 | 2010-09-30 | 2010-06-30 | 2010-03-31 | 2009-12-31 | 2009-09-30 | 2009-06-30 | 2009-03-31 | ||
|---|---|---|---|---|---|---|---|---|---|---|---|---|---|---|---|---|---|---|---|---|---|---|---|---|---|---|---|---|---|---|---|---|---|---|---|---|---|---|---|---|---|---|---|---|---|---|---|---|---|---|---|---|---|---|---|---|---|---|---|---|---|
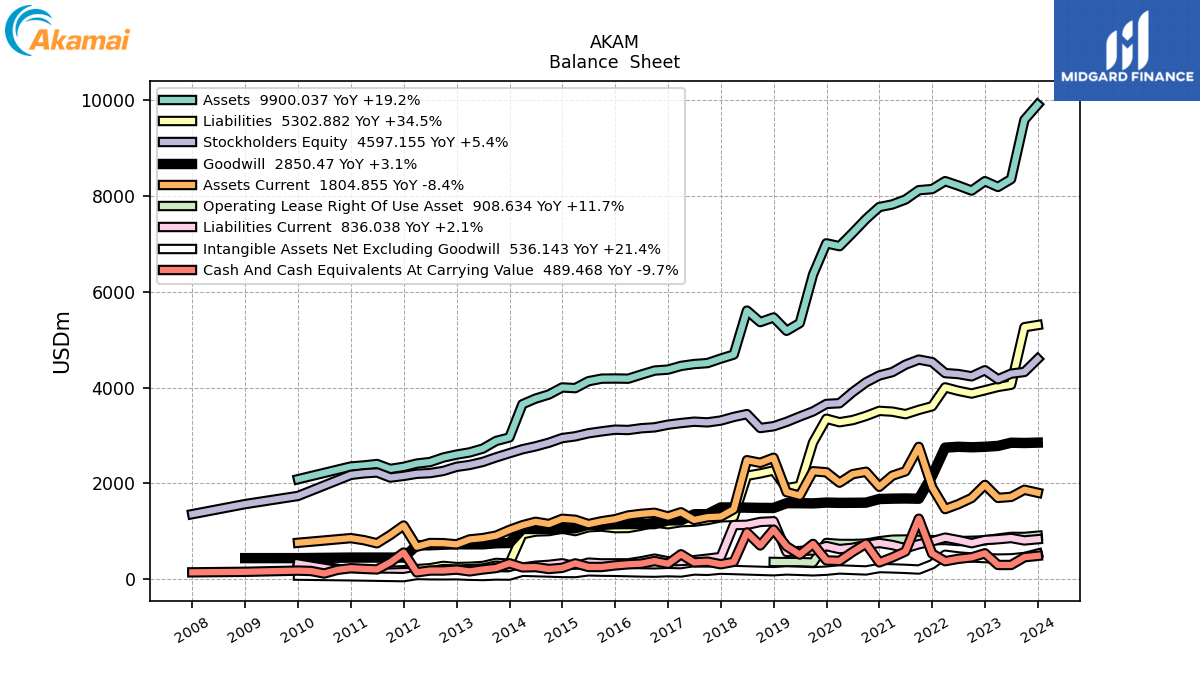
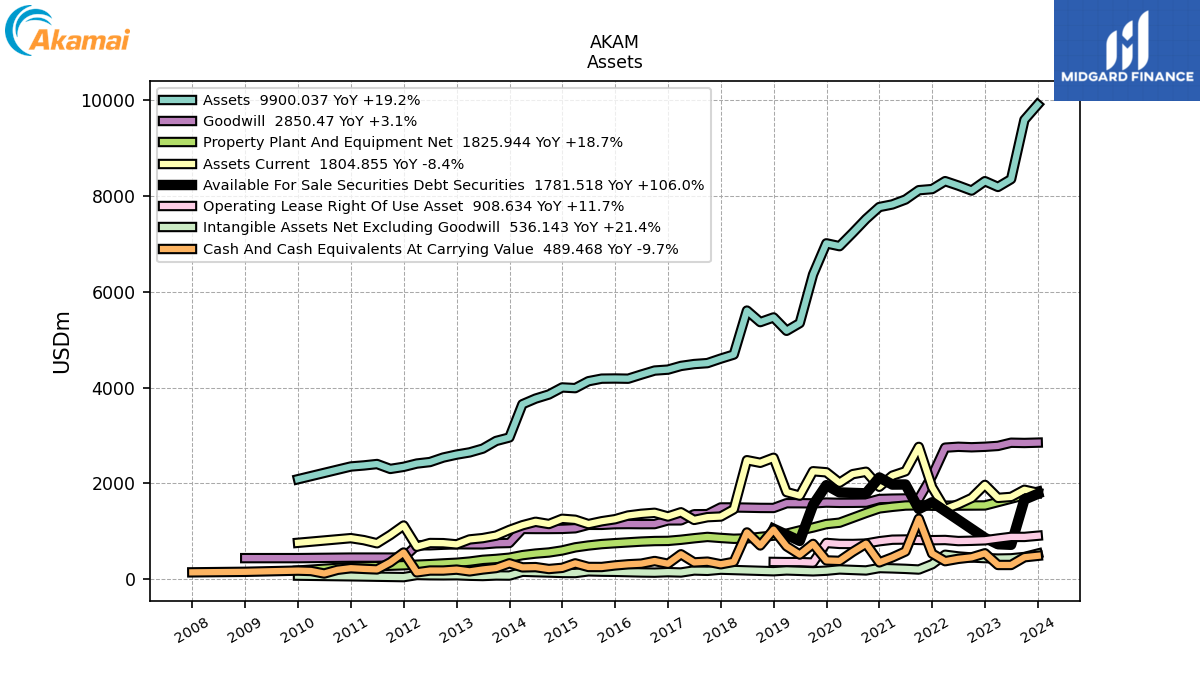
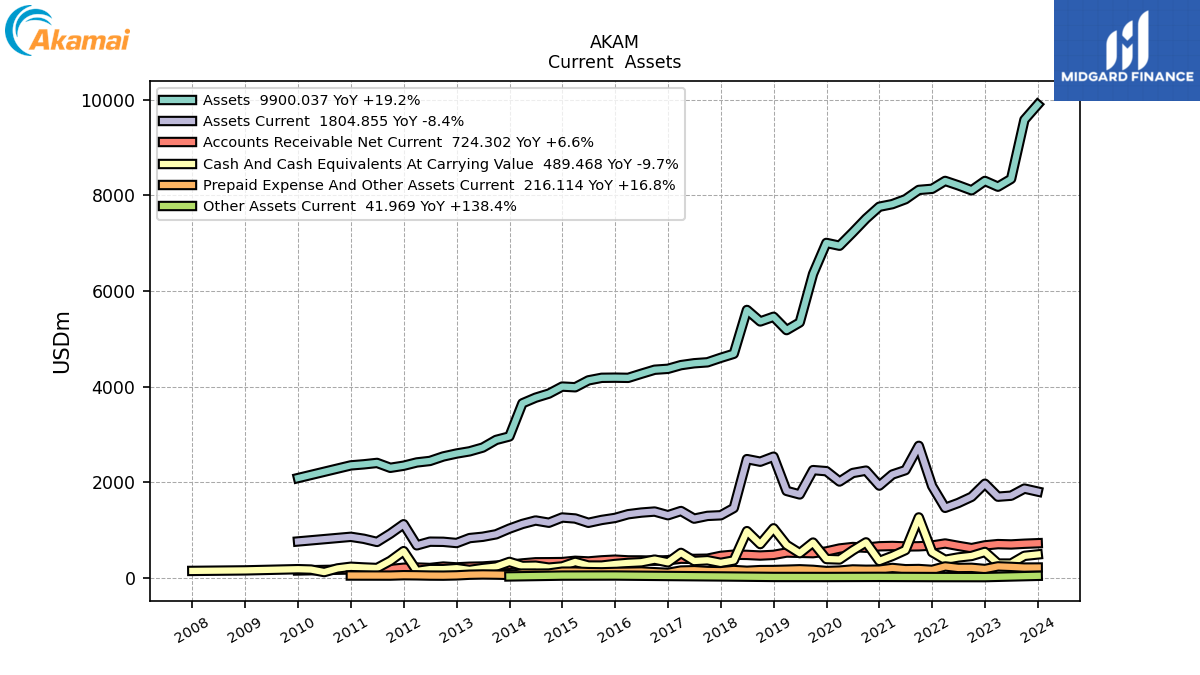
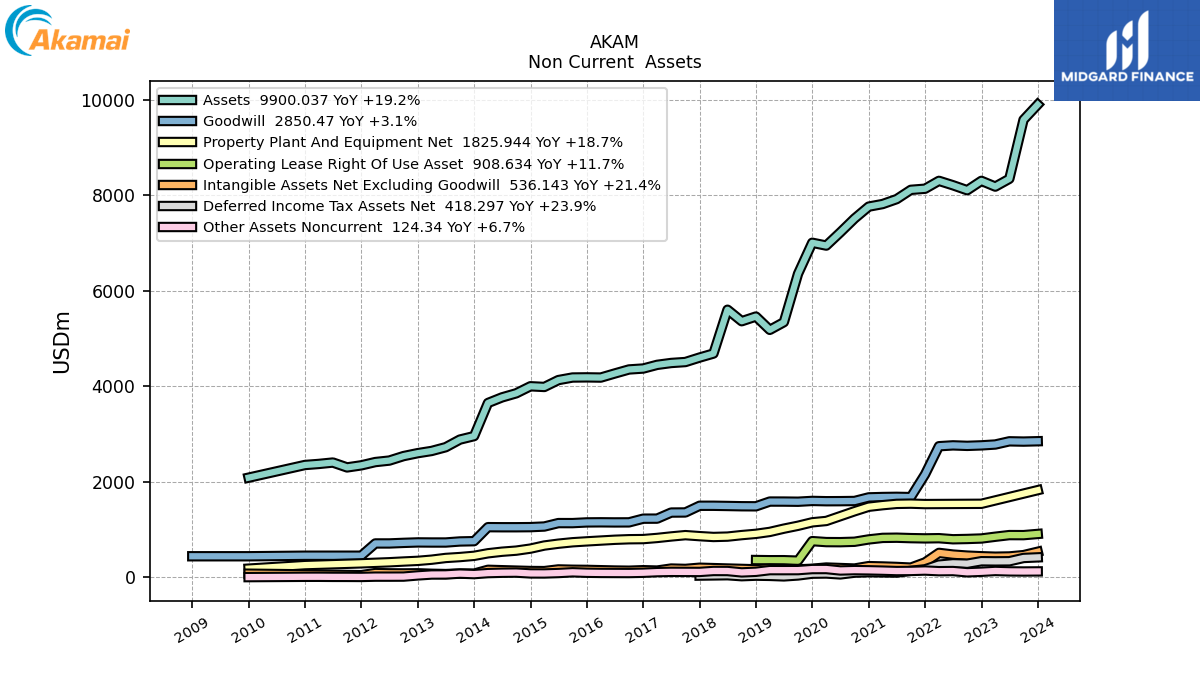
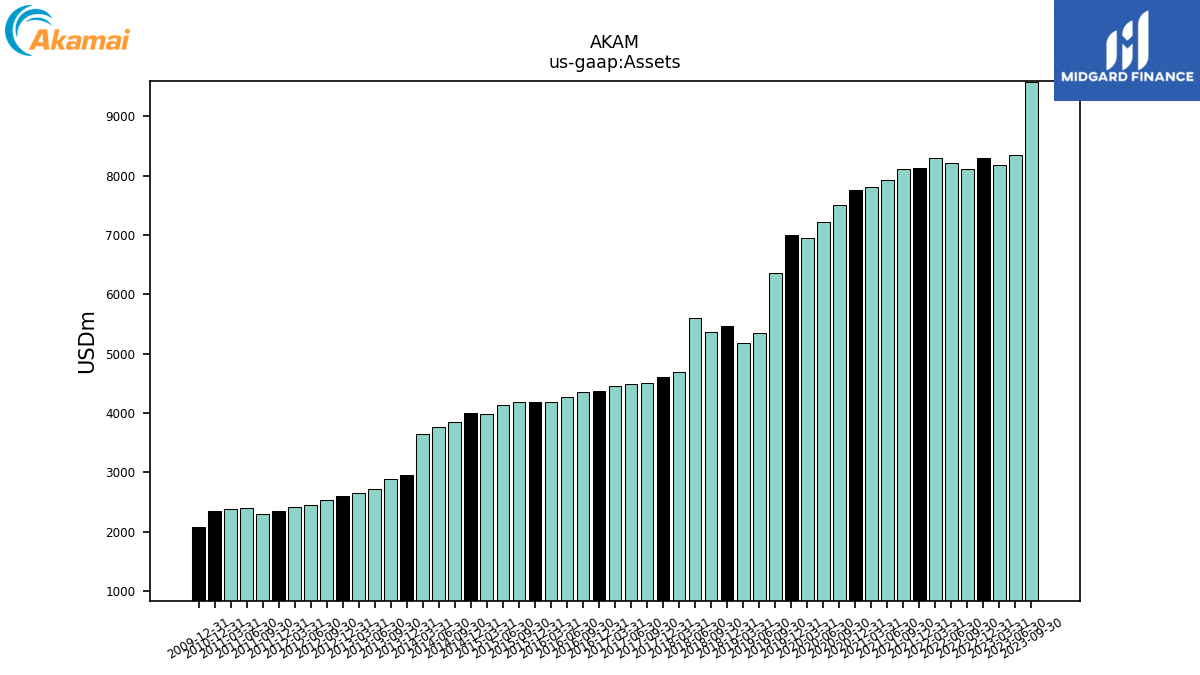
| Assets | 9900.04 | 9582.09 | 8345.97 | 8183.33 | 8303.40 | 8107.37 | 8211.05 | 8303.78 | 8138.67 | 8115.48 | 7920.94 | 7817.92 | 7764.13 | 7514.39 | 7224.80 | 6947.96 | 7006.89 | 6357.43 | 5343.24 | 5182.76 | 5461.77 | 5363.89 | 5604.70 | 4686.90 | 4602.84 | 4509.13 | 4489.04 | 4449.99 | 4373.15 | 4353.64 | 4269.72 | 4183.75 | 4187.93 | 4184.81 | 4131.10 | 3986.91 | 4001.55 | 3854.29 | 3768.66 | 3651.49 | 2957.68 | 2885.12 | 2725.27 | 2646.67 | 2600.63 | 2539.45 | 2445.58 | 2414.12 | 2345.50 | 2301.96 | 2404.15 | 2374.80 | 2352.68 | NA | NA | NA | 2087.51 | NA | NA | NA | |
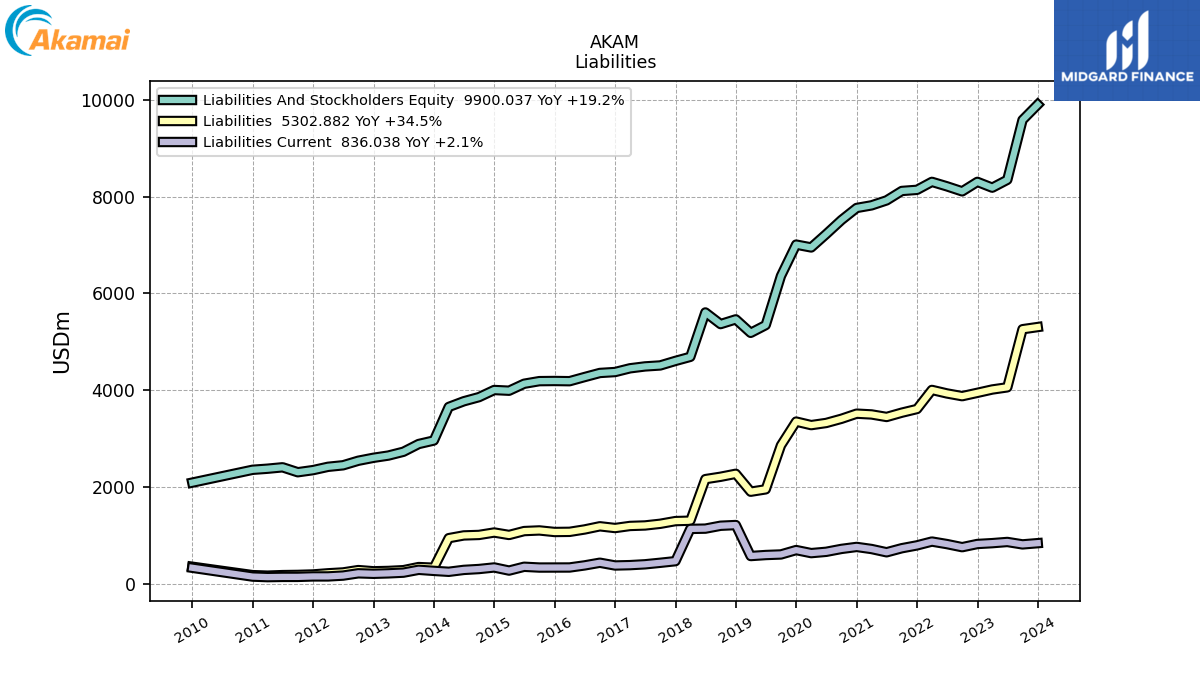
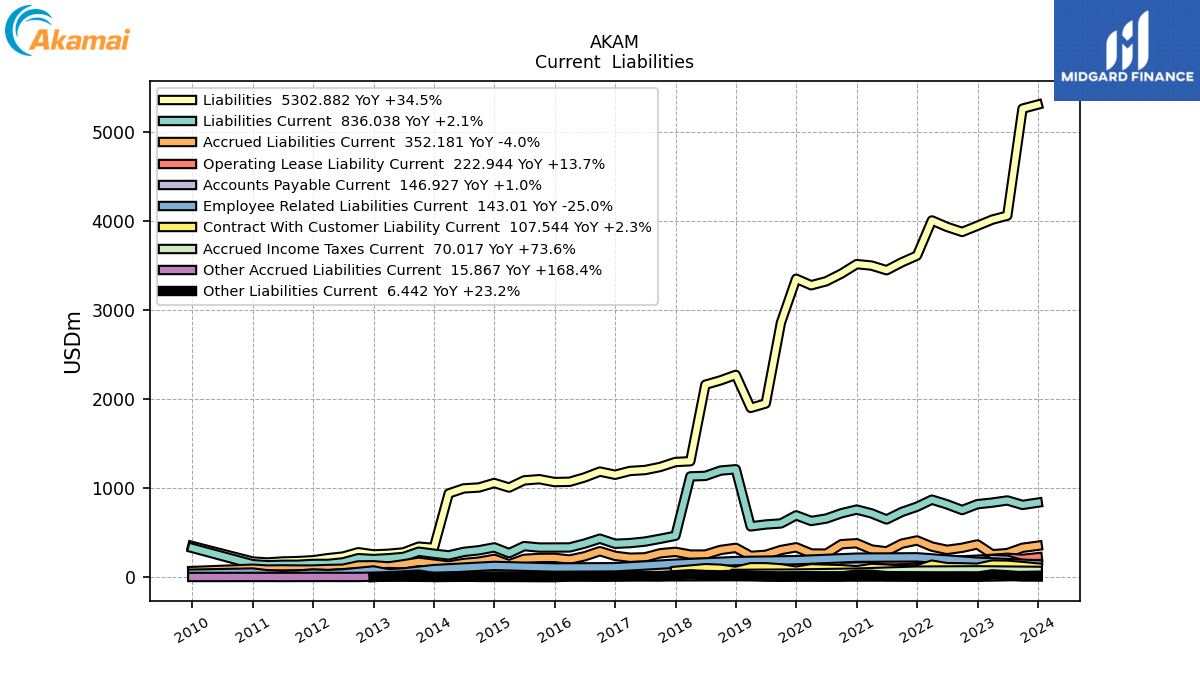
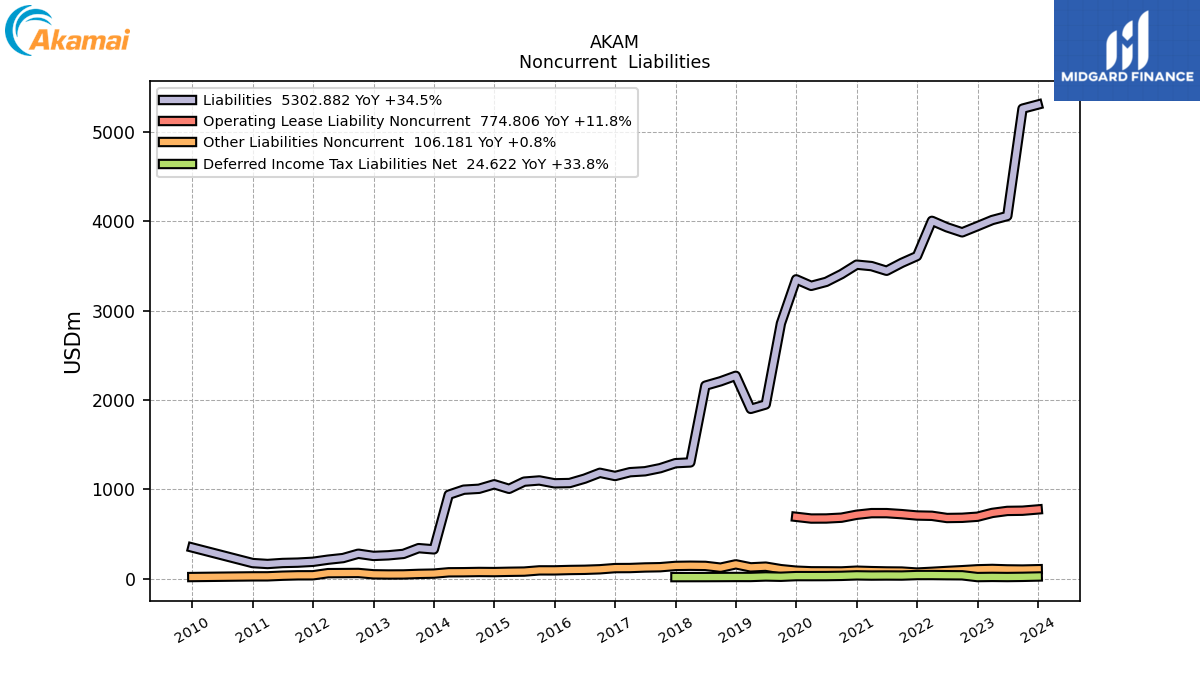
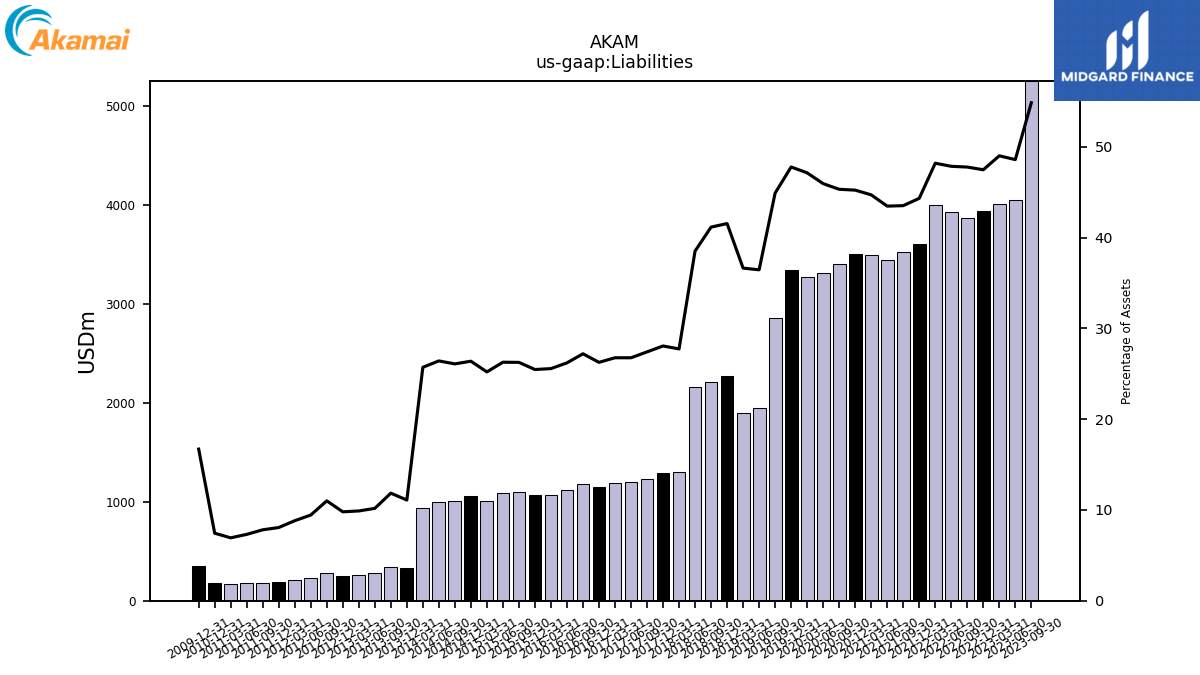
| Liabilities | 5302.88 | 5257.88 | 4056.80 | 4011.99 | 3943.21 | 3874.18 | 3930.58 | 4003.26 | 3608.66 | 3533.03 | 3444.28 | 3496.56 | 3512.83 | 3406.78 | 3320.50 | 3275.74 | 3348.93 | 2855.83 | 1948.47 | 1899.55 | 2269.91 | 2208.36 | 2159.43 | 1300.65 | 1292.12 | 1236.48 | 1201.87 | 1191.45 | 1148.78 | 1184.70 | 1119.25 | 1070.17 | 1067.05 | 1099.15 | 1085.79 | 1005.23 | 1056.21 | 1005.91 | 995.91 | 939.35 | 328.25 | 342.00 | 277.40 | 261.89 | 254.87 | 279.52 | 230.94 | 212.93 | 189.25 | 179.95 | 175.83 | 164.61 | 175.07 | NA | NA | NA | 348.79 | NA | NA | NA | |
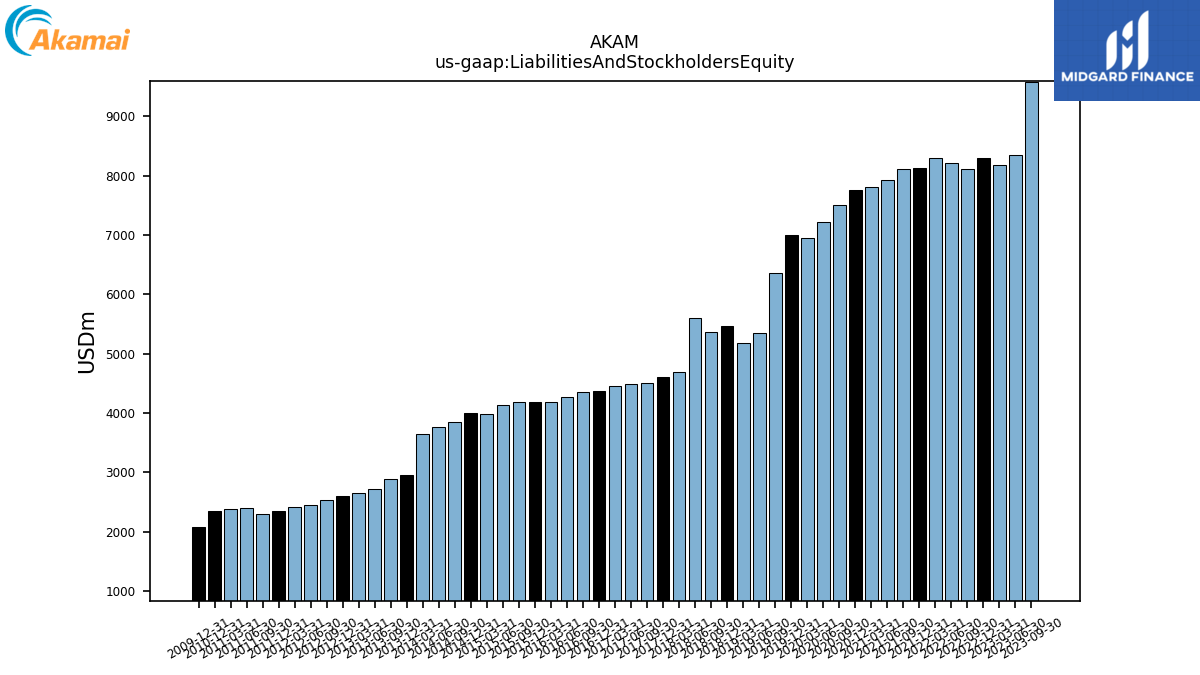
| Liabilities And Stockholders Equity | 9900.04 | 9582.09 | 8345.97 | 8183.33 | 8303.40 | 8107.37 | 8211.05 | 8303.78 | 8138.67 | 8115.48 | 7920.94 | 7817.92 | 7764.13 | 7514.39 | 7224.80 | 6947.96 | 7006.89 | 6357.43 | 5343.24 | 5182.76 | 5461.77 | 5363.89 | 5604.70 | 4686.90 | 4602.84 | 4509.13 | 4489.04 | 4449.99 | 4373.15 | 4353.64 | 4269.72 | 4183.75 | 4187.93 | 4184.81 | 4131.10 | 3986.91 | 4001.55 | 3854.29 | 3768.66 | 3651.49 | 2957.68 | 2885.12 | 2725.27 | 2646.67 | 2600.63 | 2539.45 | 2445.58 | 2414.12 | 2345.50 | 2301.96 | 2404.15 | 2374.80 | 2352.68 | NA | NA | NA | 2087.51 | NA | NA | NA | |
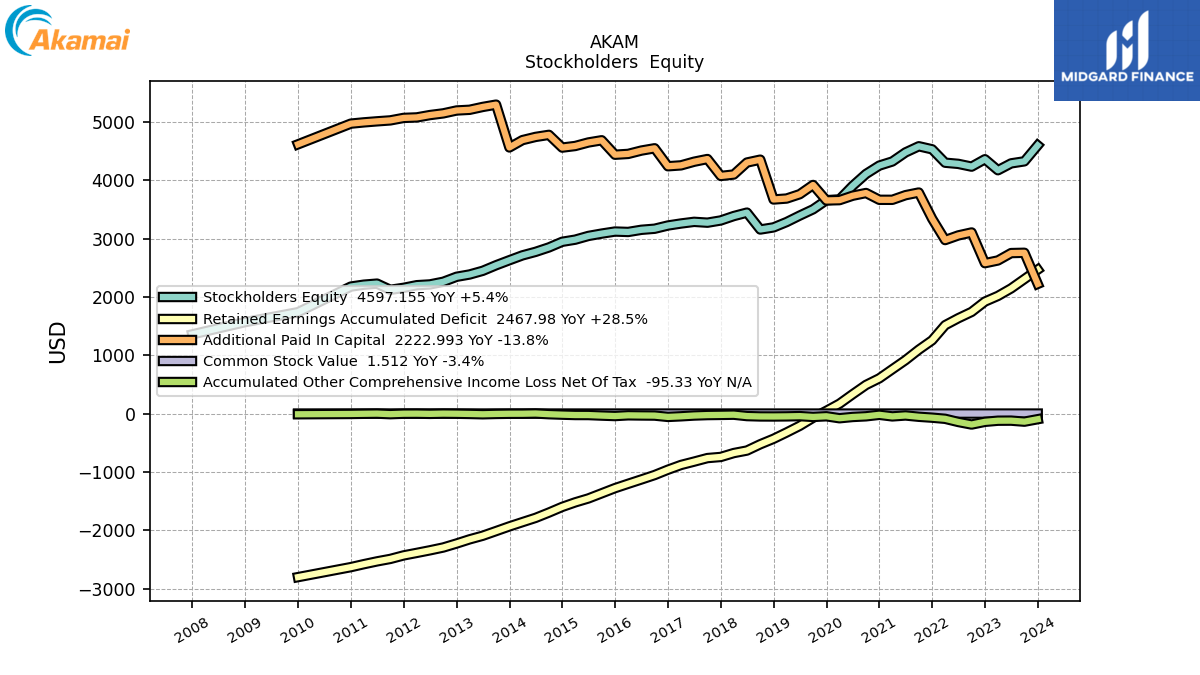
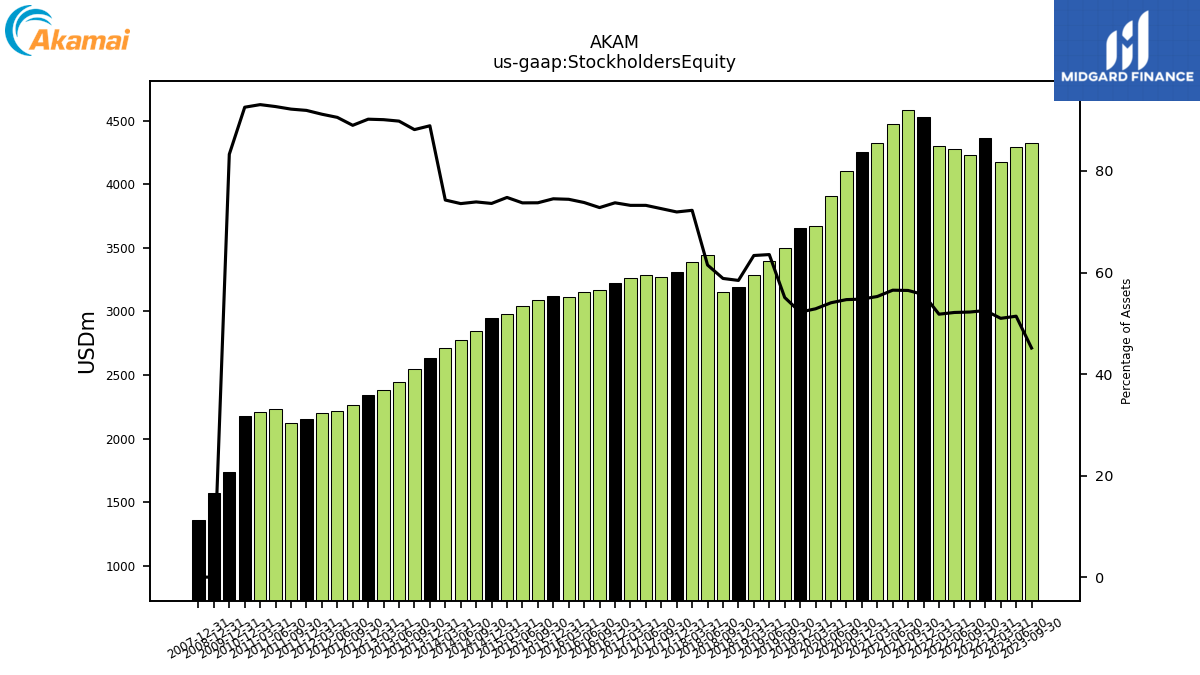
| Stockholders Equity | 4597.15 | 4324.20 | 4289.17 | 4171.34 | 4360.19 | 4233.18 | 4280.48 | 4300.52 | 4530.01 | 4582.44 | 4476.66 | 4321.36 | 4251.30 | 4107.62 | 3904.30 | 3672.22 | 3657.96 | 3501.60 | 3394.76 | 3283.22 | 3191.86 | 3155.53 | 3445.28 | 3386.26 | 3310.72 | 3272.66 | 3287.17 | 3258.55 | 3224.37 | 3168.93 | 3150.47 | 3113.58 | 3120.88 | 3085.66 | 3045.31 | 2981.68 | 2945.34 | 2848.38 | 2772.74 | 2712.14 | 2629.43 | 2543.13 | 2447.87 | 2384.78 | 2345.75 | 2259.94 | 2214.63 | 2201.19 | 2156.25 | 2122.01 | 2228.32 | 2210.19 | 2177.61 | NA | NA | NA | 1738.72 | NA | NA | NA |
| 2023-12-31 | 2023-09-30 | 2023-06-30 | 2023-03-31 | 2022-12-31 | 2022-09-30 | 2022-06-30 | 2022-03-31 | 2021-12-31 | 2021-09-30 | 2021-06-30 | 2021-03-31 | 2020-12-31 | 2020-09-30 | 2020-06-30 | 2020-03-31 | 2019-12-31 | 2019-09-30 | 2019-06-30 | 2019-03-31 | 2018-12-31 | 2018-09-30 | 2018-06-30 | 2018-03-31 | 2017-12-31 | 2017-09-30 | 2017-06-30 | 2017-03-31 | 2016-12-31 | 2016-09-30 | 2016-06-30 | 2016-03-31 | 2015-12-31 | 2015-09-30 | 2015-06-30 | 2015-03-31 | 2014-12-31 | 2014-09-30 | 2014-06-30 | 2014-03-31 | 2013-12-31 | 2013-09-30 | 2013-06-30 | 2013-03-31 | 2012-12-31 | 2012-09-30 | 2012-06-30 | 2012-03-31 | 2011-12-31 | 2011-09-30 | 2011-06-30 | 2011-03-31 | 2010-12-31 | 2010-09-30 | 2010-06-30 | 2010-03-31 | 2009-12-31 | 2009-09-30 | 2009-06-30 | 2009-03-31 | ||
|---|---|---|---|---|---|---|---|---|---|---|---|---|---|---|---|---|---|---|---|---|---|---|---|---|---|---|---|---|---|---|---|---|---|---|---|---|---|---|---|---|---|---|---|---|---|---|---|---|---|---|---|---|---|---|---|---|---|---|---|---|---|
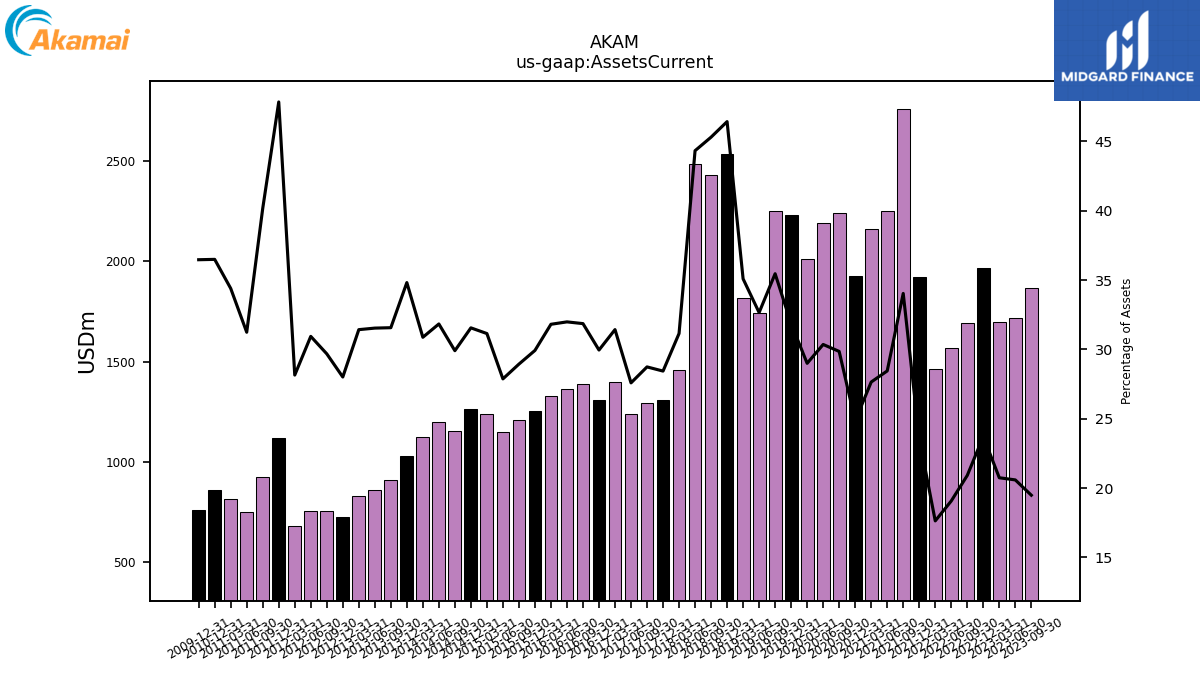
| Assets Current | 1804.86 | 1867.38 | 1718.47 | 1697.71 | 1969.56 | 1695.57 | 1566.16 | 1464.48 | 1920.43 | 2761.88 | 2253.25 | 2161.40 | 1929.53 | 2243.22 | 2193.00 | 2014.58 | 2231.61 | 2253.91 | 1744.79 | 1818.42 | 2535.35 | 2429.79 | 2484.16 | 1459.73 | 1308.87 | 1295.78 | 1238.36 | 1398.46 | 1309.92 | 1386.96 | 1365.58 | 1330.83 | 1253.19 | 1210.98 | 1151.48 | 1241.58 | 1262.56 | 1152.68 | 1199.67 | 1127.30 | 1029.71 | 910.64 | 859.38 | 831.65 | 728.38 | 753.69 | 756.61 | 679.54 | 1122.02 | 924.48 | 750.95 | 816.81 | 858.47 | NA | NA | NA | 761.17 | NA | NA | NA | |
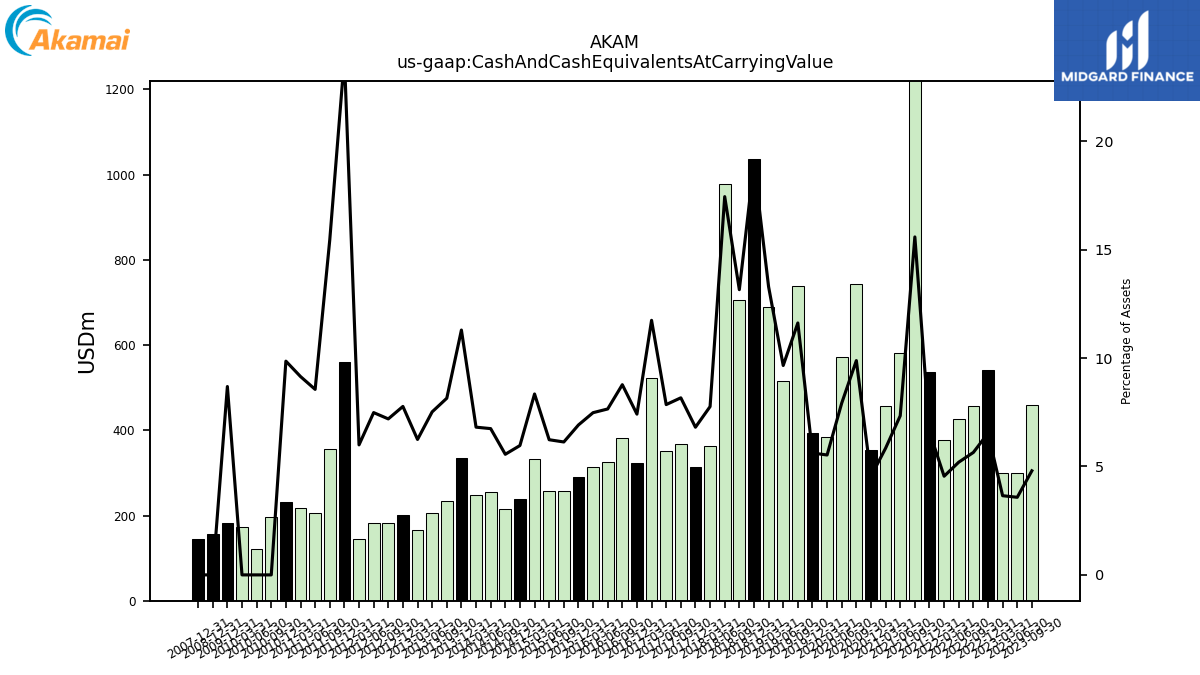
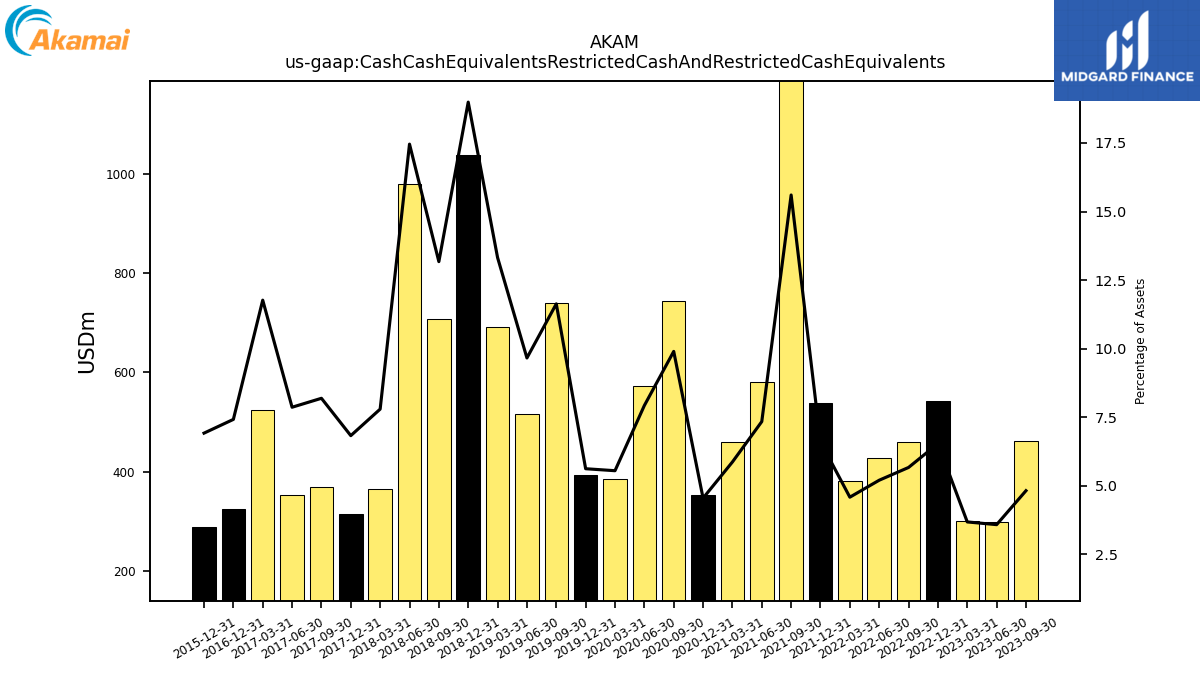
| Cash And Cash Equivalents At Carrying Value | 489.47 | 459.91 | 298.61 | 298.80 | 542.34 | 457.82 | 426.71 | 377.81 | 536.73 | 1264.59 | 581.07 | 456.80 | 352.92 | 742.52 | 572.29 | 384.10 | 393.75 | 738.46 | 515.90 | 688.70 | 1036.45 | 705.41 | 977.49 | 363.70 | 313.38 | 368.15 | 352.50 | 522.32 | 324.17 | 381.80 | 326.64 | 312.91 | 289.47 | 256.47 | 257.45 | 332.56 | 238.65 | 214.34 | 254.16 | 248.73 | 333.89 | 235.01 | 204.87 | 165.28 | 201.99 | 182.65 | 183.00 | 144.72 | 559.20 | 355.60 | 205.63 | 217.17 | 231.87 | 197.57 | 120.51 | 173.22 | 181.31 | NA | NA | NA | |
| Cash Cash Equivalents Restricted Cash And Restricted Cash Equivalents | 490.47 | 462.29 | 299.39 | 301.64 | 543.02 | 459.82 | 427.51 | 381.01 | 537.75 | 1266.18 | 581.70 | 459.02 | 353.47 | 743.98 | 572.87 | 385.83 | 394.15 | 739.63 | 516.27 | 690.38 | 1036.99 | 706.57 | 978.34 | 365.46 | 314.43 | 369.41 | 353.13 | 523.71 | 324.63 | NA | NA | NA | 289.91 | NA | NA | NA | NA | NA | NA | NA | NA | NA | NA | NA | NA | NA | NA | NA | NA | NA | NA | NA | NA | NA | NA | NA | NA | NA | NA | NA | |
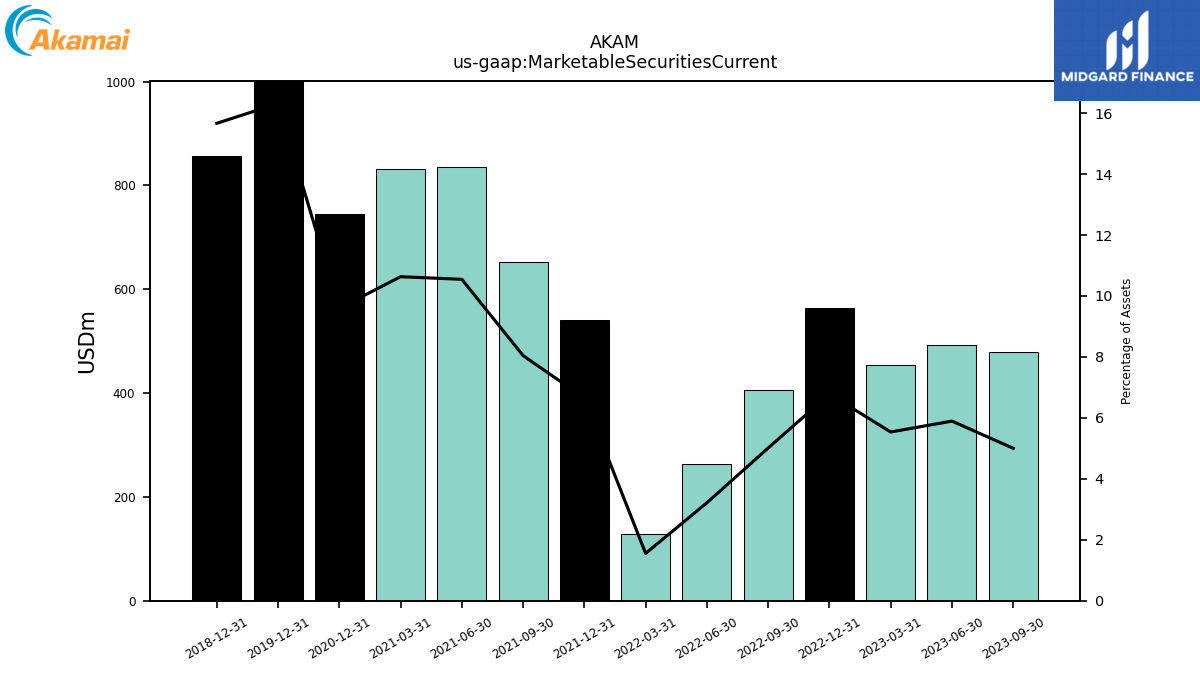
| Marketable Securities Current | 374.97 | 479.36 | 491.95 | 453.11 | 562.98 | 406.33 | 263.98 | 129.06 | 541.47 | 652.70 | 835.42 | 831.26 | 745.16 | NA | NA | NA | 1143.25 | NA | NA | NA | 855.65 | NA | NA | NA | NA | NA | NA | NA | NA | NA | NA | NA | NA | NA | NA | NA | NA | NA | NA | NA | NA | NA | NA | NA | NA | NA | NA | NA | NA | NA | NA | NA | NA | NA | NA | NA | NA | NA | NA | NA | |
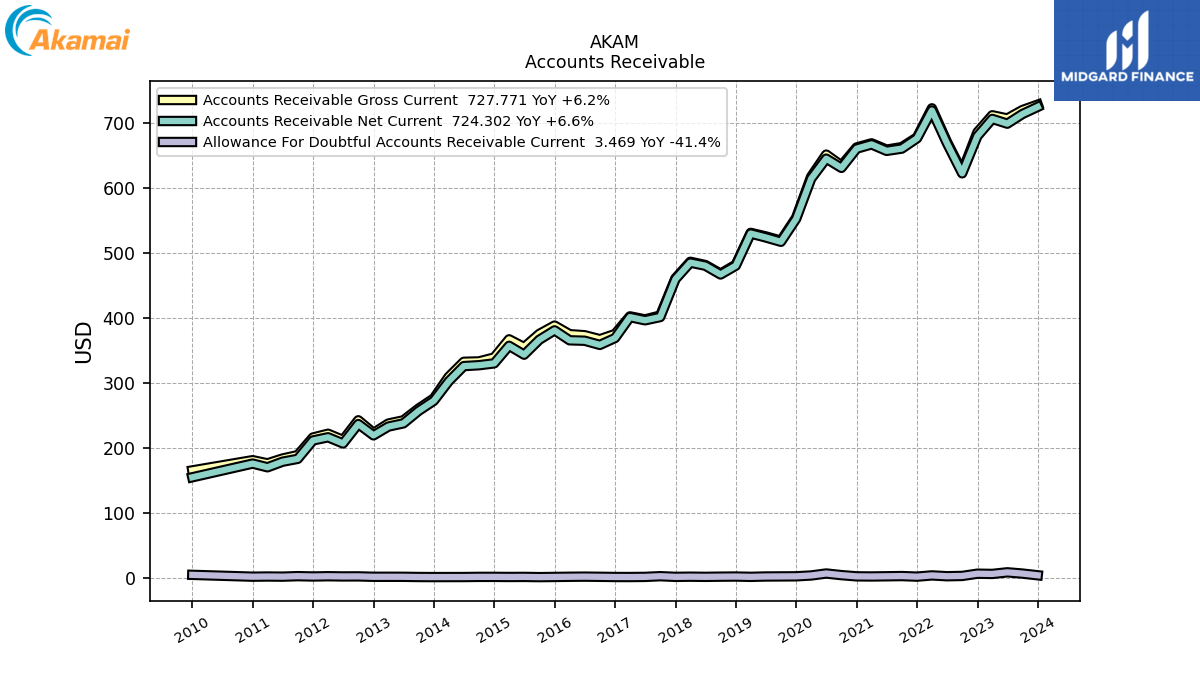
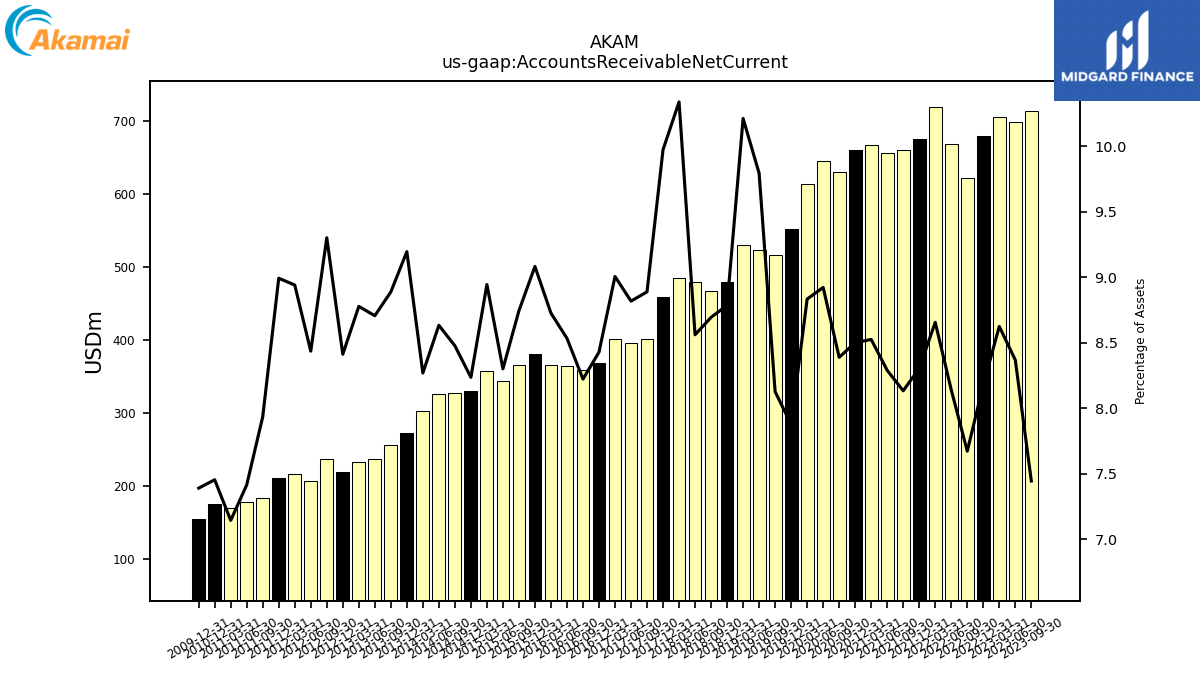
| Accounts Receivable Net Current | 724.30 | 713.38 | 698.45 | 705.82 | 679.21 | 622.03 | 668.42 | 718.79 | 675.93 | 660.09 | 656.61 | 666.54 | 660.05 | 630.41 | 644.66 | 613.81 | 551.94 | 516.66 | 523.38 | 529.35 | 479.89 | 466.36 | 479.87 | 484.62 | 459.13 | 400.84 | 395.87 | 400.79 | 368.60 | 358.00 | 364.40 | 365.10 | 380.40 | 365.96 | 342.93 | 356.63 | 329.58 | 326.75 | 325.38 | 301.95 | 271.99 | 256.45 | 237.29 | 232.33 | 218.78 | 236.23 | 206.32 | 215.85 | 210.94 | 182.66 | 178.26 | 169.66 | 175.37 | NA | NA | NA | 154.27 | NA | NA | NA | |
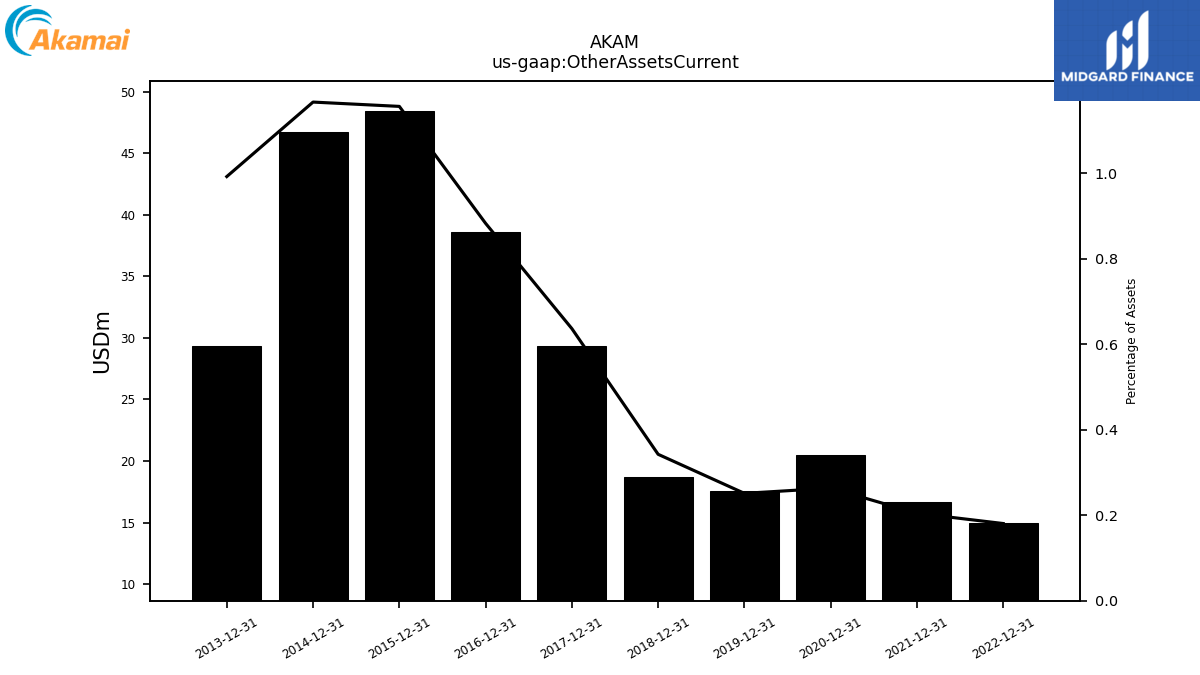
| Other Assets Current | 41.97 | NA | NA | NA | 15.00 | NA | NA | NA | 16.66 | NA | NA | NA | 20.46 | NA | NA | NA | 17.60 | NA | NA | NA | 18.71 | NA | NA | NA | 29.30 | NA | NA | NA | 38.61 | NA | NA | NA | 48.43 | NA | NA | NA | 46.68 | NA | NA | NA | 29.35 | NA | NA | NA | NA | NA | NA | NA | NA | NA | NA | NA | NA | NA | NA | NA | NA | NA | NA | NA | |
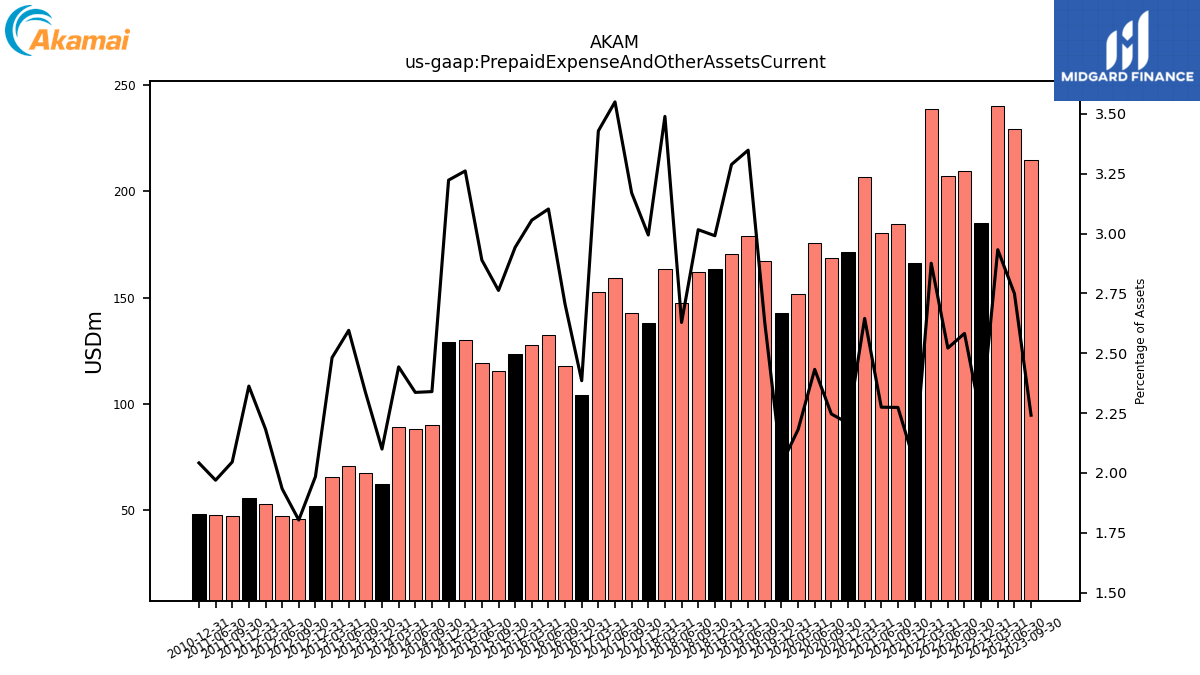
| Prepaid Expense And Other Assets Current | 216.11 | 214.74 | 229.47 | 239.98 | 185.04 | 209.40 | 207.04 | 238.82 | 166.31 | 184.50 | 180.16 | 206.81 | 171.41 | 168.78 | 175.73 | 151.50 | 142.68 | 167.04 | 178.92 | 170.44 | 163.36 | 161.78 | 147.32 | 163.56 | 137.81 | 142.94 | 159.37 | 152.60 | 104.30 | 117.75 | 132.48 | 127.86 | 123.23 | 115.60 | 119.36 | 130.04 | 128.98 | 90.17 | 88.05 | 89.20 | 62.10 | 67.45 | 70.73 | 65.68 | 51.60 | 45.78 | 47.28 | 52.70 | 55.41 | 47.09 | 47.35 | NA | 48.03 | NA | NA | NA | NA | NA | NA | NA | |
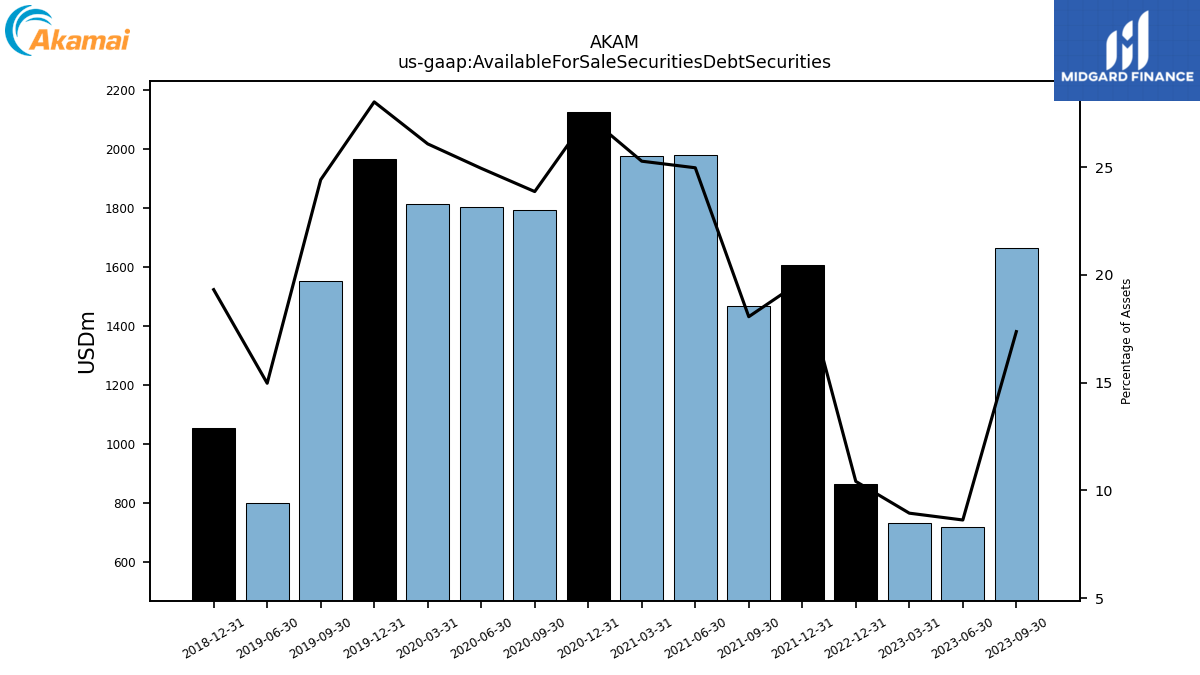
| Available For Sale Securities Debt Securities | 1781.52 | 1663.86 | 719.71 | 731.62 | 864.76 | NA | NA | NA | 1606.39 | 1465.34 | 1977.51 | 1975.67 | 2124.03 | 1793.07 | 1801.77 | 1811.64 | 1963.46 | 1551.84 | 799.82 | NA | 1054.76 | NA | NA | NA | NA | NA | NA | NA | NA | NA | NA | NA | NA | NA | NA | NA | NA | NA | NA | NA | NA | NA | NA | NA | NA | NA | NA | NA | NA | NA | NA | NA | NA | NA | NA | NA | NA | NA | NA | NA |
| 2023-12-31 | 2023-09-30 | 2023-06-30 | 2023-03-31 | 2022-12-31 | 2022-09-30 | 2022-06-30 | 2022-03-31 | 2021-12-31 | 2021-09-30 | 2021-06-30 | 2021-03-31 | 2020-12-31 | 2020-09-30 | 2020-06-30 | 2020-03-31 | 2019-12-31 | 2019-09-30 | 2019-06-30 | 2019-03-31 | 2018-12-31 | 2018-09-30 | 2018-06-30 | 2018-03-31 | 2017-12-31 | 2017-09-30 | 2017-06-30 | 2017-03-31 | 2016-12-31 | 2016-09-30 | 2016-06-30 | 2016-03-31 | 2015-12-31 | 2015-09-30 | 2015-06-30 | 2015-03-31 | 2014-12-31 | 2014-09-30 | 2014-06-30 | 2014-03-31 | 2013-12-31 | 2013-09-30 | 2013-06-30 | 2013-03-31 | 2012-12-31 | 2012-09-30 | 2012-06-30 | 2012-03-31 | 2011-12-31 | 2011-09-30 | 2011-06-30 | 2011-03-31 | 2010-12-31 | 2010-09-30 | 2010-06-30 | 2010-03-31 | 2009-12-31 | 2009-09-30 | 2009-06-30 | 2009-03-31 | ||
|---|---|---|---|---|---|---|---|---|---|---|---|---|---|---|---|---|---|---|---|---|---|---|---|---|---|---|---|---|---|---|---|---|---|---|---|---|---|---|---|---|---|---|---|---|---|---|---|---|---|---|---|---|---|---|---|---|---|---|---|---|---|
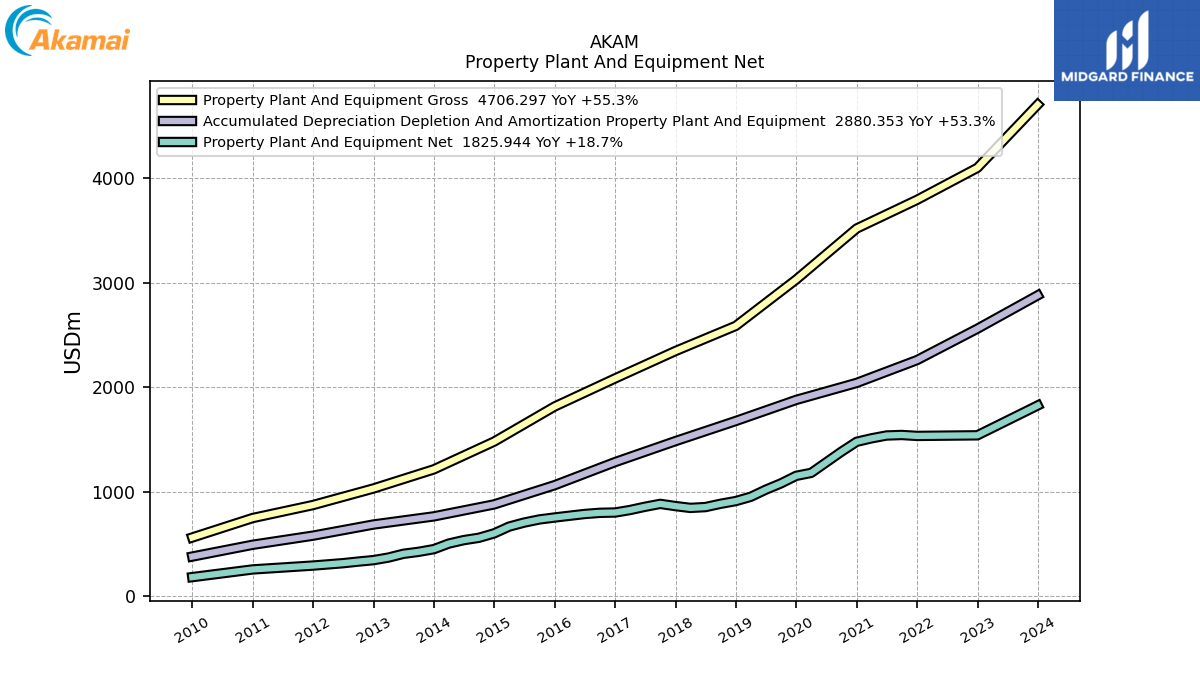
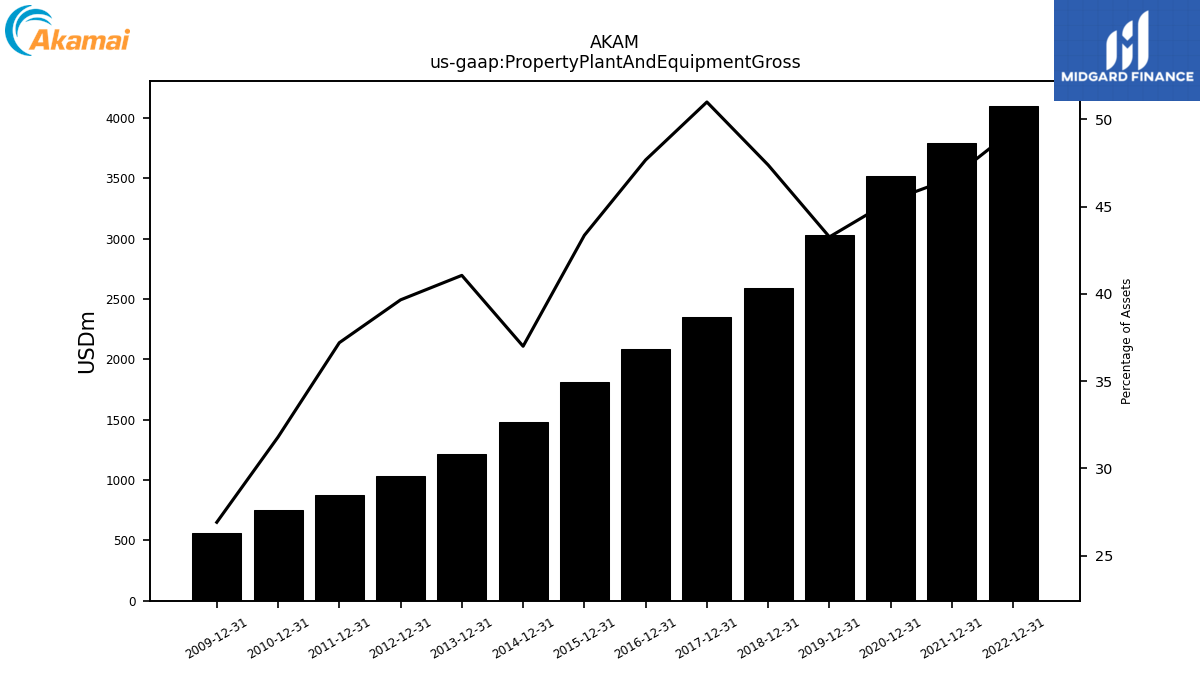
| Property Plant And Equipment Gross | 4706.30 | NA | NA | NA | 4100.81 | NA | NA | NA | 3794.58 | NA | NA | NA | 3520.09 | NA | NA | NA | 3031.06 | NA | NA | NA | 2587.84 | NA | NA | NA | 2346.98 | NA | NA | NA | 2084.71 | NA | NA | NA | 1815.55 | NA | NA | NA | 1480.35 | NA | NA | NA | 1214.28 | NA | NA | NA | 1031.22 | NA | NA | NA | 872.45 | NA | NA | NA | 747.96 | NA | NA | NA | 561.67 | NA | NA | NA | |
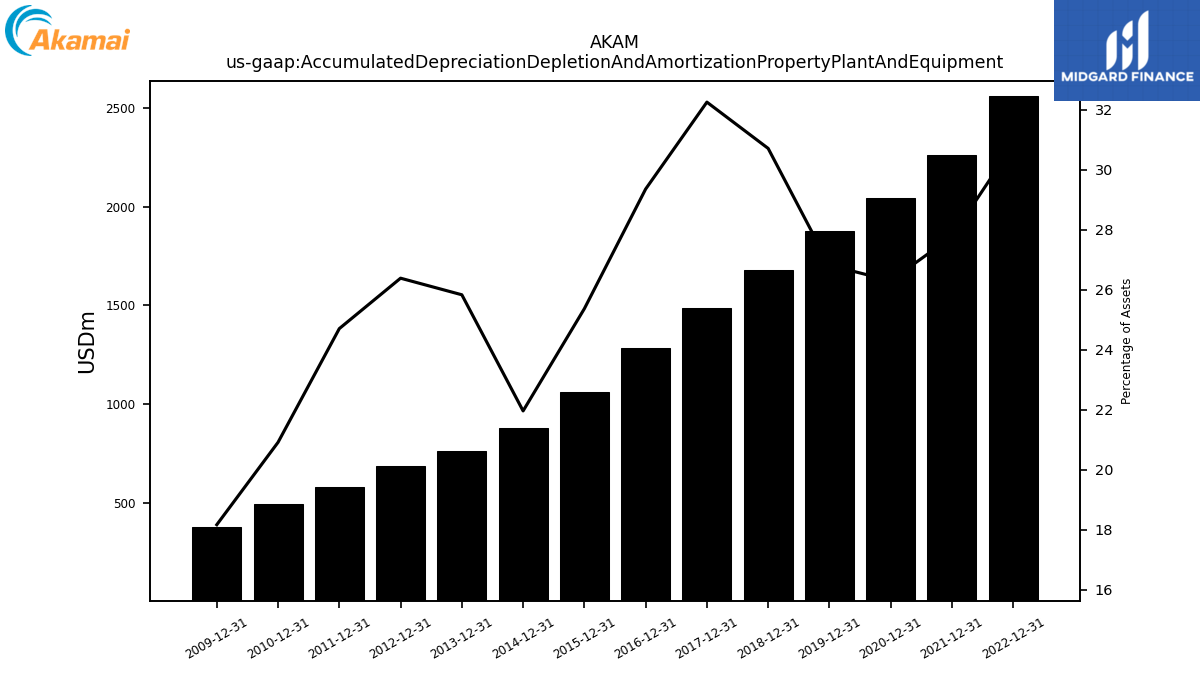
| Accumulated Depreciation Depletion And Amortization Property Plant And Equipment | 2880.35 | NA | NA | NA | 2560.62 | NA | NA | NA | 2260.25 | NA | NA | NA | 2041.82 | NA | NA | NA | 1878.91 | NA | NA | NA | 1677.22 | NA | NA | NA | 1484.45 | NA | NA | NA | 1283.69 | NA | NA | NA | 1062.37 | NA | NA | NA | 878.76 | NA | NA | NA | 763.99 | NA | NA | NA | 686.13 | NA | NA | NA | 579.41 | NA | NA | NA | 492.04 | NA | NA | NA | 379.26 | NA | NA | NA | |
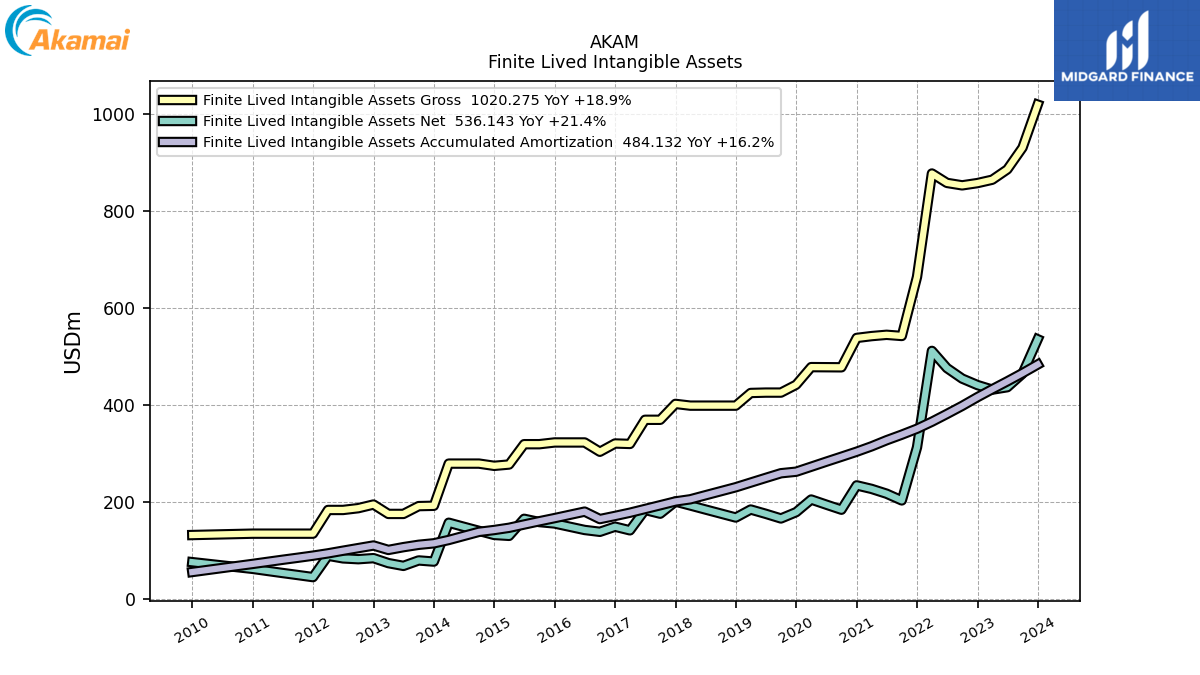
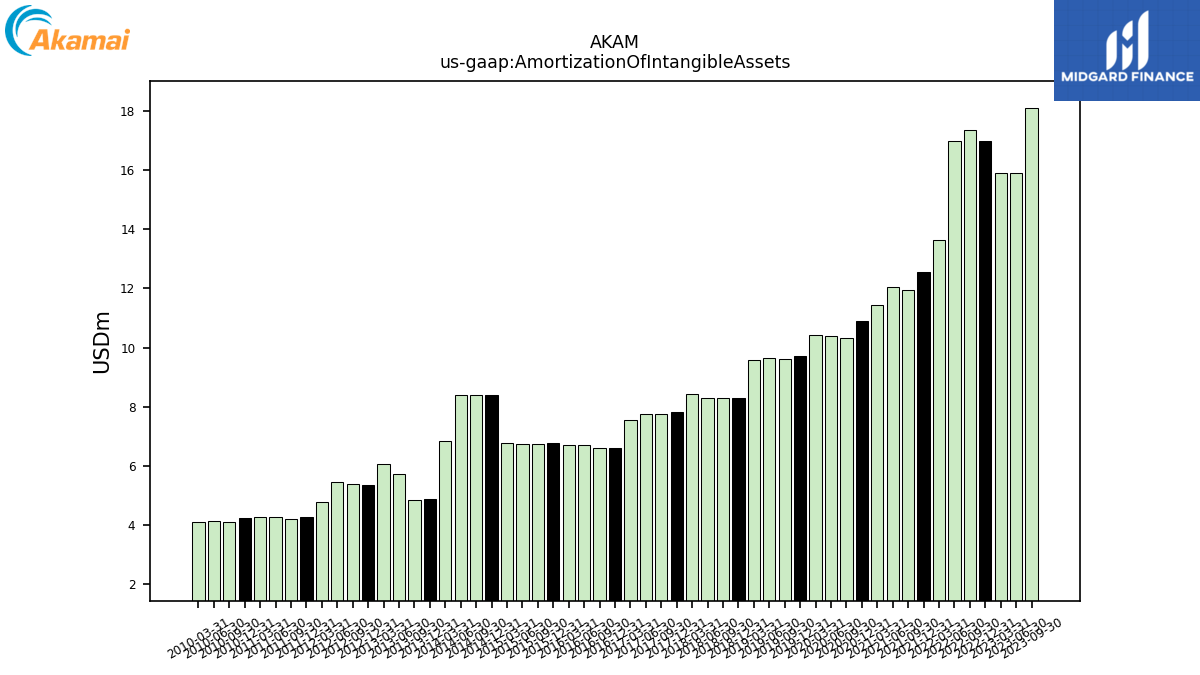
| Amortization Of Intangible Assets | 16.83 | 18.11 | 15.90 | 15.91 | 16.99 | 17.37 | 16.97 | 13.64 | 12.57 | 11.96 | 12.06 | 11.43 | 10.89 | 10.34 | 10.38 | 10.43 | 9.71 | 9.62 | 9.65 | 9.60 | 8.29 | 8.29 | 8.29 | 8.43 | 7.83 | 7.75 | 7.75 | 7.57 | 6.62 | 6.60 | 6.71 | 6.72 | 6.78 | 6.75 | 6.75 | 6.78 | 8.40 | 8.40 | 8.40 | 6.85 | 4.89 | 4.86 | 5.73 | 6.06 | 5.35 | 5.38 | 5.46 | 4.77 | 4.27 | 4.20 | 4.29 | 4.28 | 4.26 | 4.10 | 4.15 | 4.11 | NA | NA | NA | NA | |
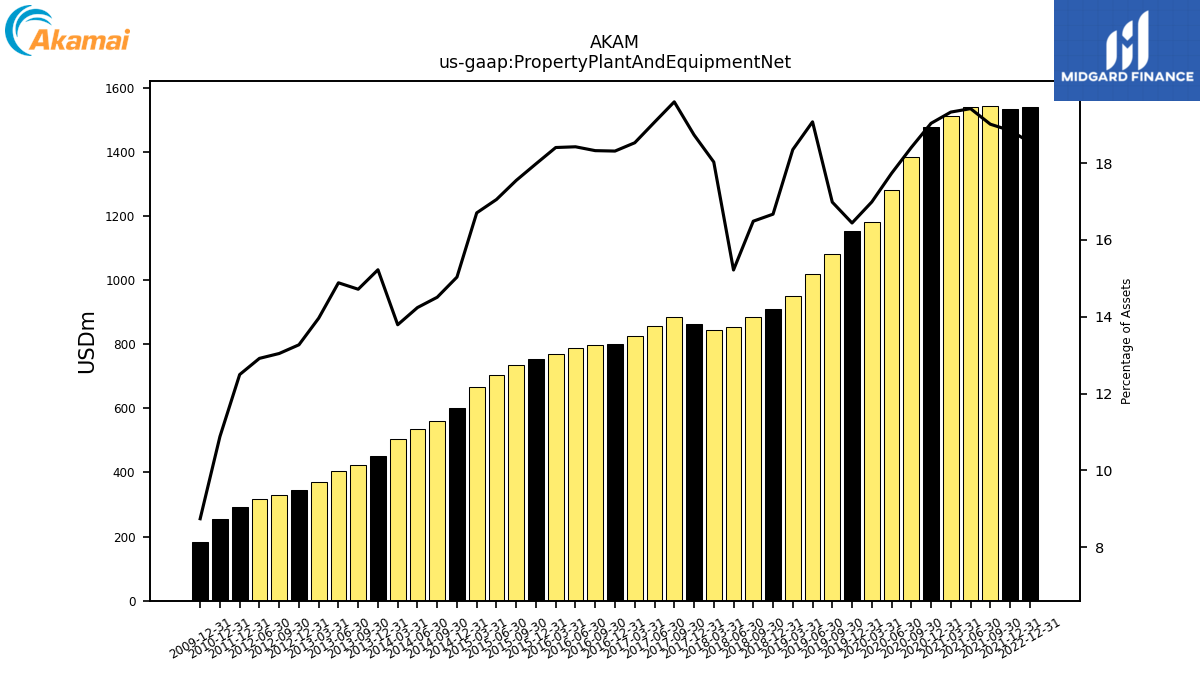
| Property Plant And Equipment Net | 1825.94 | NA | NA | NA | 1540.18 | NA | NA | NA | 1534.33 | 1543.30 | 1538.42 | 1511.39 | 1478.27 | 1383.48 | 1281.39 | 1180.55 | 1152.15 | 1079.91 | 1019.41 | 951.26 | 910.62 | 884.48 | 852.95 | 845.12 | 862.53 | 883.75 | 856.04 | 824.72 | 801.02 | 797.92 | 786.84 | 770.20 | 753.18 | 734.54 | 704.57 | 666.09 | 601.59 | 559.19 | 536.64 | 503.60 | 450.29 | 424.61 | 405.65 | 369.56 | 345.09 | 331.22 | 315.87 | NA | 293.04 | NA | NA | NA | 255.93 | NA | NA | NA | 182.40 | NA | NA | NA | |
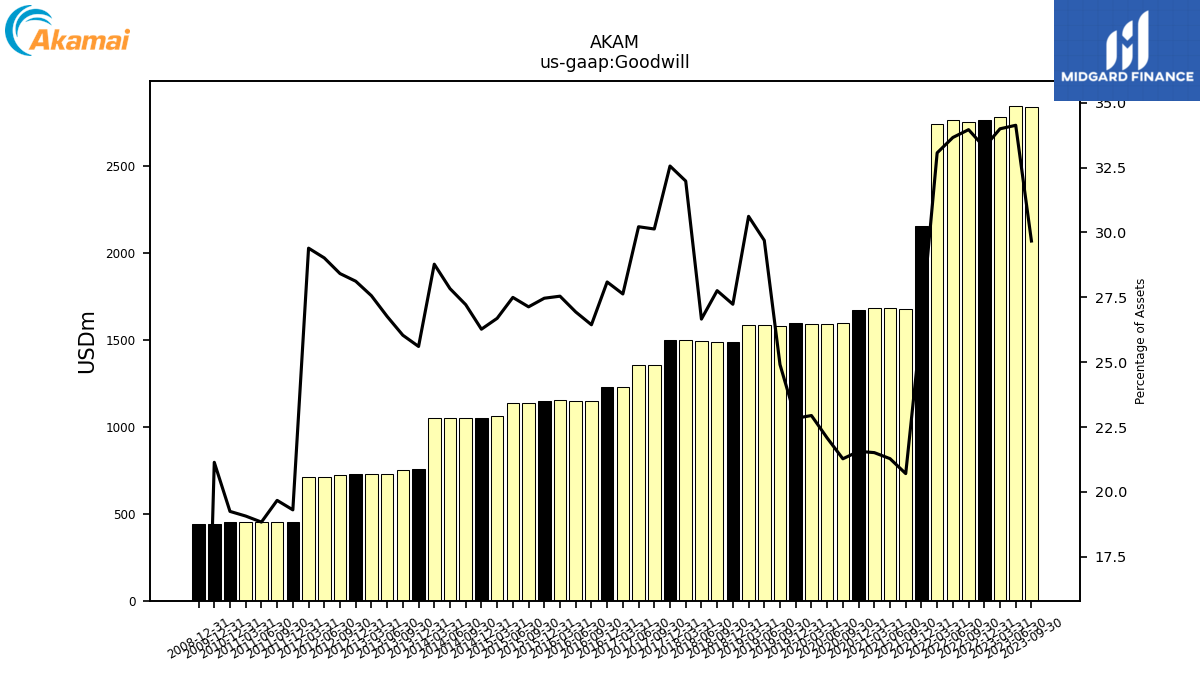
| Goodwill | 2850.47 | 2843.02 | 2848.47 | 2781.86 | 2763.84 | 2753.37 | 2763.83 | 2745.88 | 2156.25 | 1680.50 | 1685.86 | 1682.09 | 1674.37 | 1598.92 | 1595.30 | 1594.20 | 1600.27 | 1583.48 | 1586.64 | 1586.99 | 1487.40 | 1488.87 | 1494.31 | 1498.91 | 1498.69 | 1358.76 | 1356.62 | 1229.50 | 1228.50 | 1151.22 | 1150.14 | 1152.38 | 1150.24 | 1135.50 | 1135.95 | 1064.15 | 1051.29 | 1049.05 | 1049.05 | 1050.78 | 757.37 | 751.27 | 729.39 | 729.47 | 731.33 | 721.60 | 709.67 | 709.63 | 452.91 | 452.91 | 452.91 | 452.91 | 452.91 | NA | NA | NA | 441.35 | NA | NA | NA | |
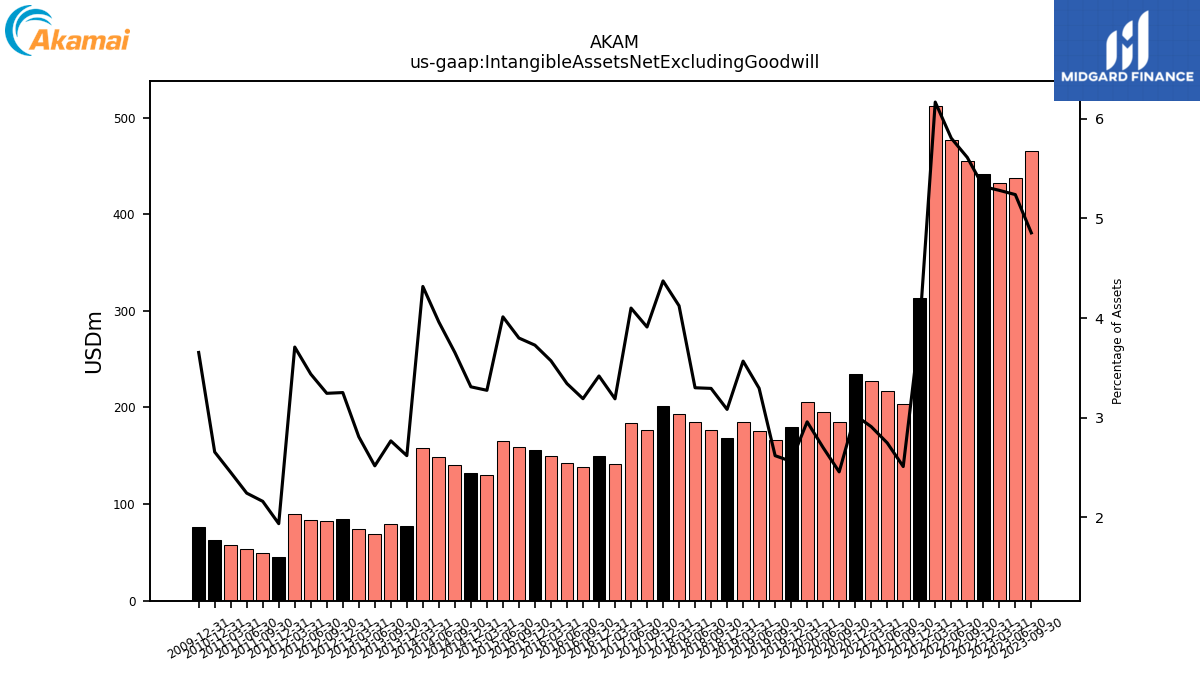
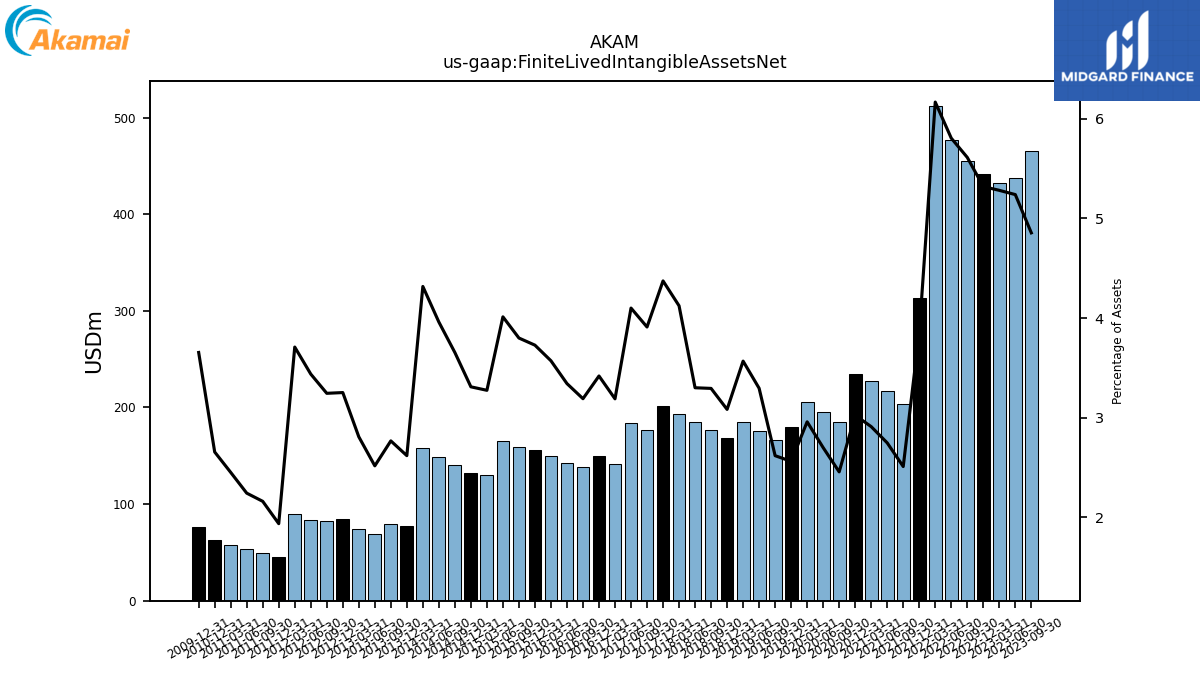
| Intangible Assets Net Excluding Goodwill | 536.14 | 465.20 | 437.26 | 432.23 | 441.72 | 455.03 | 476.71 | 512.19 | 313.23 | 203.60 | 217.52 | 227.44 | 234.72 | 184.48 | 194.95 | 205.49 | 179.43 | 166.41 | 176.03 | 184.88 | 168.35 | 176.64 | 184.93 | 193.23 | 201.26 | 176.29 | 184.04 | 141.89 | 149.46 | 138.87 | 142.67 | 149.38 | 156.09 | 158.98 | 165.73 | 130.53 | 132.41 | 140.81 | 149.22 | 157.62 | 77.43 | 79.80 | 68.56 | 74.30 | 84.55 | 82.38 | 84.06 | 89.52 | 45.39 | 49.70 | 53.89 | 58.18 | 62.46 | NA | NA | NA | 76.27 | NA | NA | NA | |
| Finite Lived Intangible Assets Net | 536.14 | 465.20 | 437.26 | 432.23 | 441.72 | 455.03 | 476.71 | 512.19 | 313.23 | 203.60 | 217.52 | 227.44 | 234.72 | 184.48 | 194.95 | 205.49 | 179.43 | 166.41 | 176.03 | 184.88 | 168.35 | 176.64 | 184.93 | 193.23 | 201.26 | 176.29 | 184.04 | 141.89 | 149.46 | 138.87 | 142.67 | 149.38 | 156.09 | 158.98 | 165.73 | 130.53 | 132.41 | 140.81 | 149.22 | 157.62 | 77.43 | 79.80 | 68.56 | 74.30 | 84.55 | 82.38 | 84.06 | 89.52 | 45.39 | 49.70 | 53.89 | 58.18 | 62.46 | NA | NA | NA | 76.27 | NA | NA | NA | |
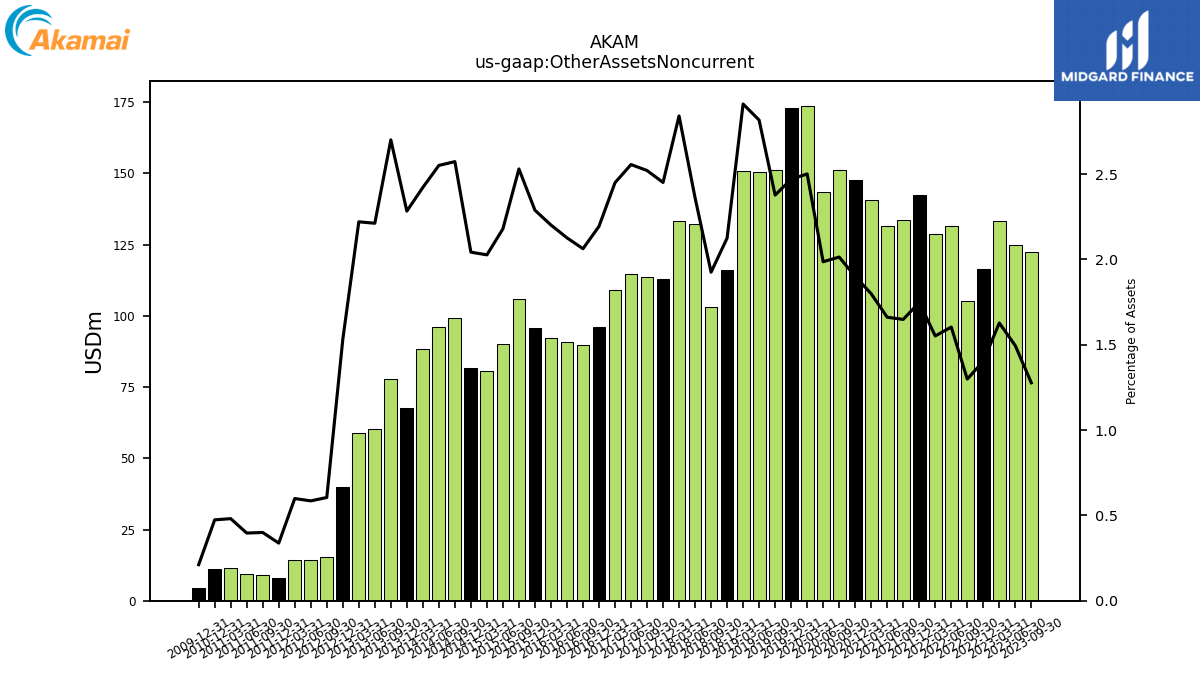
| Other Assets Noncurrent | 124.34 | 122.39 | 124.76 | 133.21 | 116.52 | 105.32 | 131.69 | 128.85 | 142.29 | 133.79 | 131.61 | 140.65 | 147.57 | 151.35 | 143.54 | 173.78 | 173.06 | 151.13 | 150.51 | 150.87 | 116.07 | 103.28 | 132.37 | 133.17 | 112.83 | 113.69 | 114.75 | 109.02 | 95.95 | 89.81 | 90.81 | 92.12 | 95.84 | 105.90 | 90.04 | 80.81 | 81.75 | 99.18 | 96.14 | 88.44 | 67.54 | 77.93 | 60.29 | 58.77 | 39.81 | 15.37 | 14.31 | 14.46 | 7.92 | 9.21 | 9.54 | 11.43 | 11.15 | NA | NA | NA | 4.42 | NA | NA | NA | |
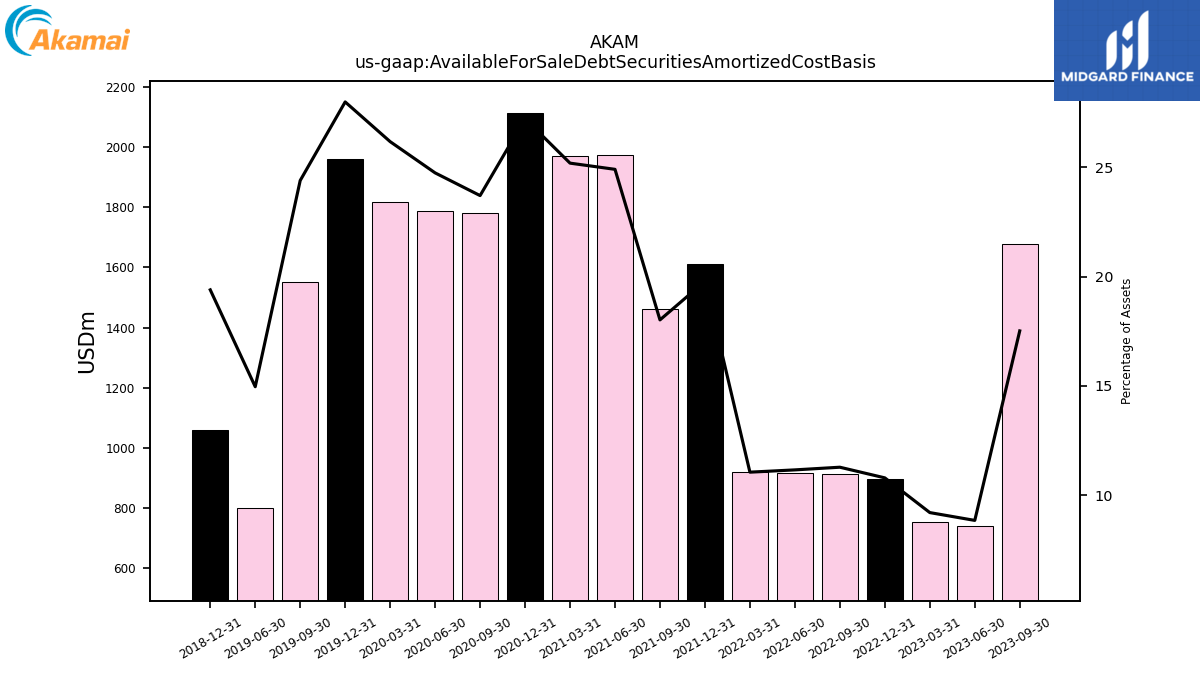
| Available For Sale Debt Securities Amortized Cost Basis | 1777.81 | 1678.80 | 738.28 | 753.18 | 896.18 | 914.54 | 916.22 | 917.89 | 1610.78 | 1462.70 | 1973.51 | 1970.00 | 2114.54 | 1781.92 | 1788.34 | 1819.19 | 1961.97 | 1551.42 | 799.61 | NA | 1059.53 | NA | NA | NA | NA | NA | NA | NA | NA | NA | NA | NA | NA | NA | NA | NA | NA | NA | NA | NA | NA | NA | NA | NA | NA | NA | NA | NA | NA | NA | NA | NA | NA | NA | NA | NA | NA | NA | NA | NA |
| 2023-12-31 | 2023-09-30 | 2023-06-30 | 2023-03-31 | 2022-12-31 | 2022-09-30 | 2022-06-30 | 2022-03-31 | 2021-12-31 | 2021-09-30 | 2021-06-30 | 2021-03-31 | 2020-12-31 | 2020-09-30 | 2020-06-30 | 2020-03-31 | 2019-12-31 | 2019-09-30 | 2019-06-30 | 2019-03-31 | 2018-12-31 | 2018-09-30 | 2018-06-30 | 2018-03-31 | 2017-12-31 | 2017-09-30 | 2017-06-30 | 2017-03-31 | 2016-12-31 | 2016-09-30 | 2016-06-30 | 2016-03-31 | 2015-12-31 | 2015-09-30 | 2015-06-30 | 2015-03-31 | 2014-12-31 | 2014-09-30 | 2014-06-30 | 2014-03-31 | 2013-12-31 | 2013-09-30 | 2013-06-30 | 2013-03-31 | 2012-12-31 | 2012-09-30 | 2012-06-30 | 2012-03-31 | 2011-12-31 | 2011-09-30 | 2011-06-30 | 2011-03-31 | 2010-12-31 | 2010-09-30 | 2010-06-30 | 2010-03-31 | 2009-12-31 | 2009-09-30 | 2009-06-30 | 2009-03-31 | ||
|---|---|---|---|---|---|---|---|---|---|---|---|---|---|---|---|---|---|---|---|---|---|---|---|---|---|---|---|---|---|---|---|---|---|---|---|---|---|---|---|---|---|---|---|---|---|---|---|---|---|---|---|---|---|---|---|---|---|---|---|---|---|
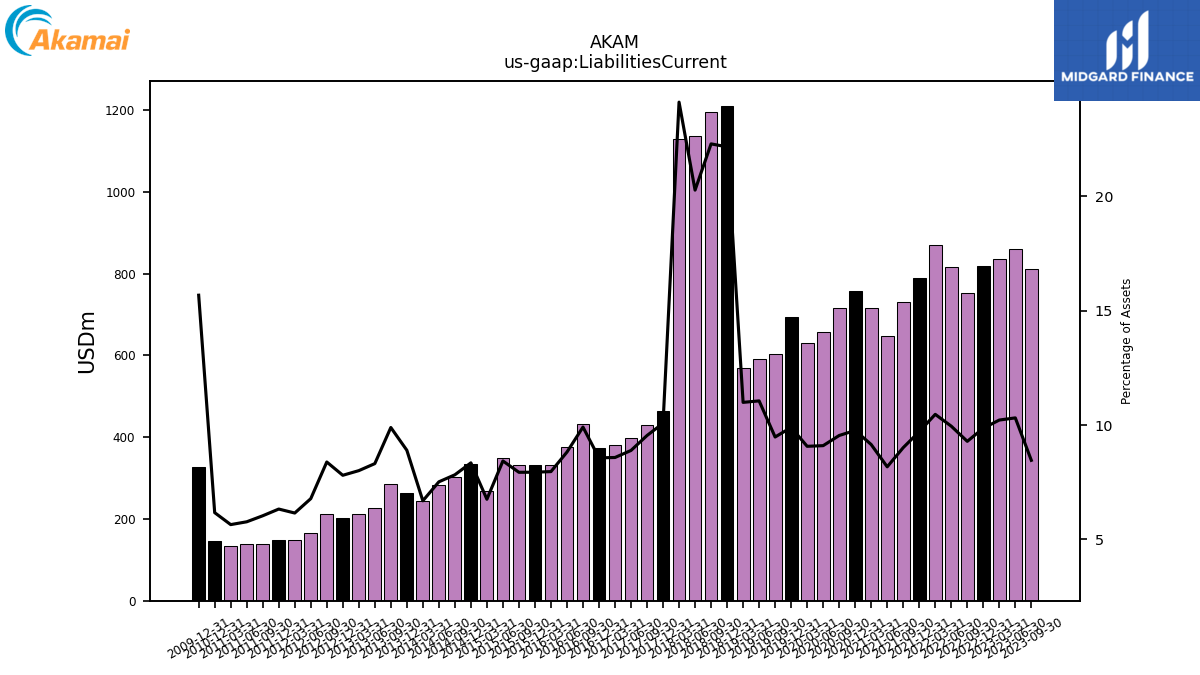
| Liabilities Current | 836.04 | 810.49 | 860.77 | 836.25 | 818.87 | 753.01 | 817.08 | 869.26 | 790.34 | 731.44 | 647.45 | 715.13 | 758.17 | 717.12 | 657.42 | 630.25 | 693.34 | 602.52 | 590.81 | 569.71 | 1210.71 | 1195.94 | 1136.33 | 1130.60 | 463.90 | 430.31 | 399.06 | 381.88 | 374.59 | 431.54 | 376.54 | 333.23 | 332.44 | 332.01 | 348.24 | 269.33 | 334.01 | 301.60 | 283.29 | 244.19 | 263.17 | 285.42 | 226.57 | 211.91 | 202.94 | 212.92 | 165.85 | 148.54 | 148.39 | 138.88 | 138.71 | 134.09 | 145.15 | NA | NA | NA | 327.29 | NA | NA | NA | |
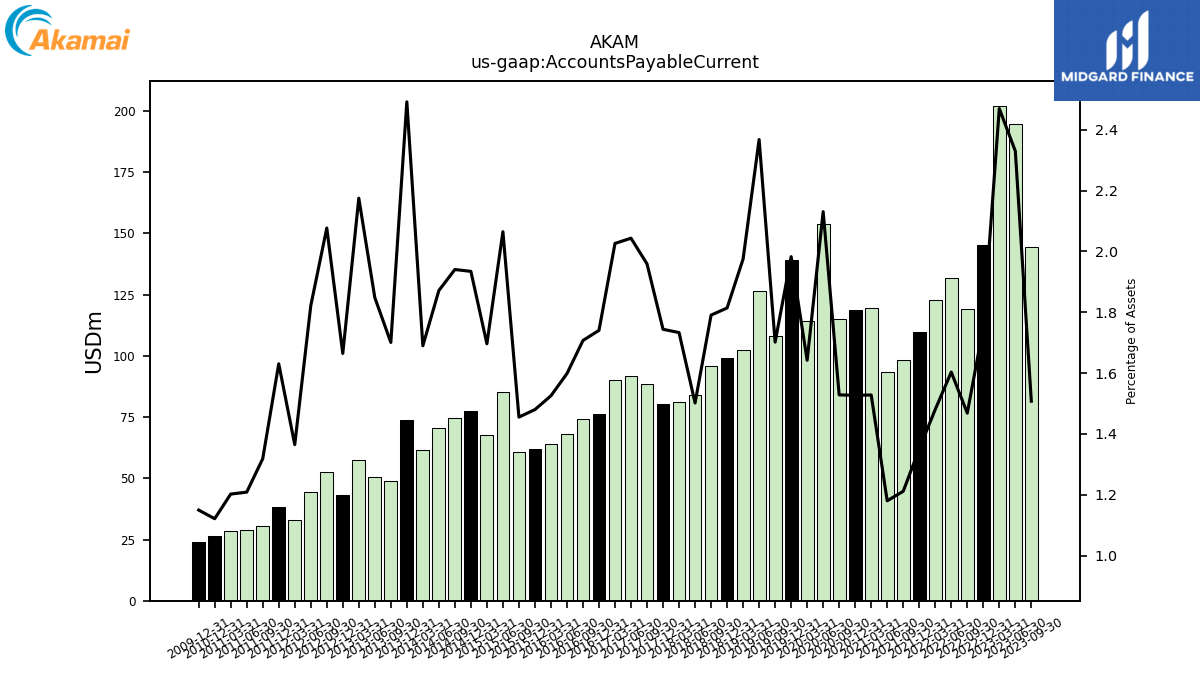
| Accounts Payable Current | 146.93 | 144.47 | 194.49 | 202.13 | 145.42 | 119.05 | 131.65 | 122.93 | 109.93 | 98.31 | 93.47 | 119.46 | 118.55 | 114.85 | 153.96 | 114.10 | 138.95 | 108.19 | 126.54 | 102.37 | 99.09 | 96.05 | 84.17 | 81.24 | 80.28 | 88.34 | 91.74 | 90.18 | 76.12 | 74.33 | 68.25 | 63.82 | 61.98 | 60.90 | 85.31 | 67.64 | 77.41 | 74.80 | 70.53 | 61.71 | 73.71 | 49.07 | 50.37 | 57.57 | 43.29 | 52.75 | 44.55 | 32.94 | 38.25 | 30.35 | 29.05 | 28.55 | 26.38 | NA | NA | NA | 24.00 | NA | NA | NA | |
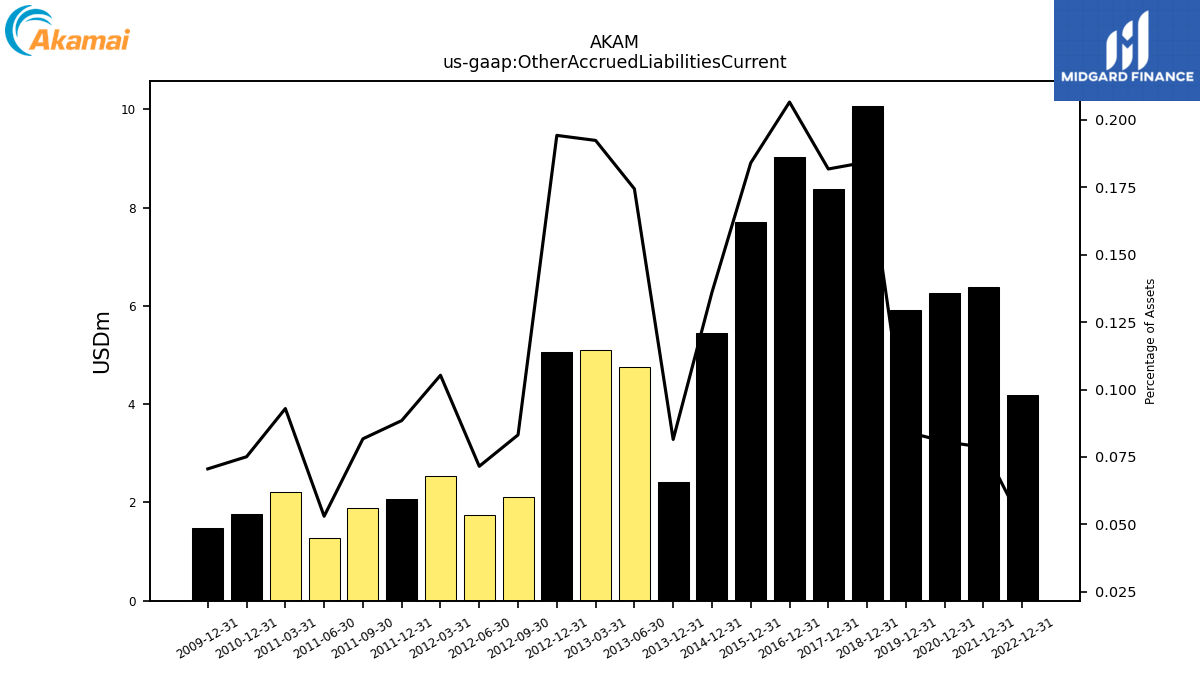
| Other Accrued Liabilities Current | 15.87 | NA | NA | NA | 4.19 | NA | NA | NA | 6.39 | NA | NA | NA | 6.26 | NA | NA | NA | 5.91 | NA | NA | NA | 10.07 | NA | NA | NA | 8.37 | NA | NA | NA | 9.04 | NA | NA | NA | 7.71 | NA | NA | NA | 5.44 | NA | NA | NA | 2.41 | NA | 4.75 | 5.09 | 5.05 | 2.11 | 1.75 | 2.54 | 2.08 | 1.88 | 1.27 | 2.21 | 1.77 | NA | NA | NA | 1.47 | NA | NA | NA | |
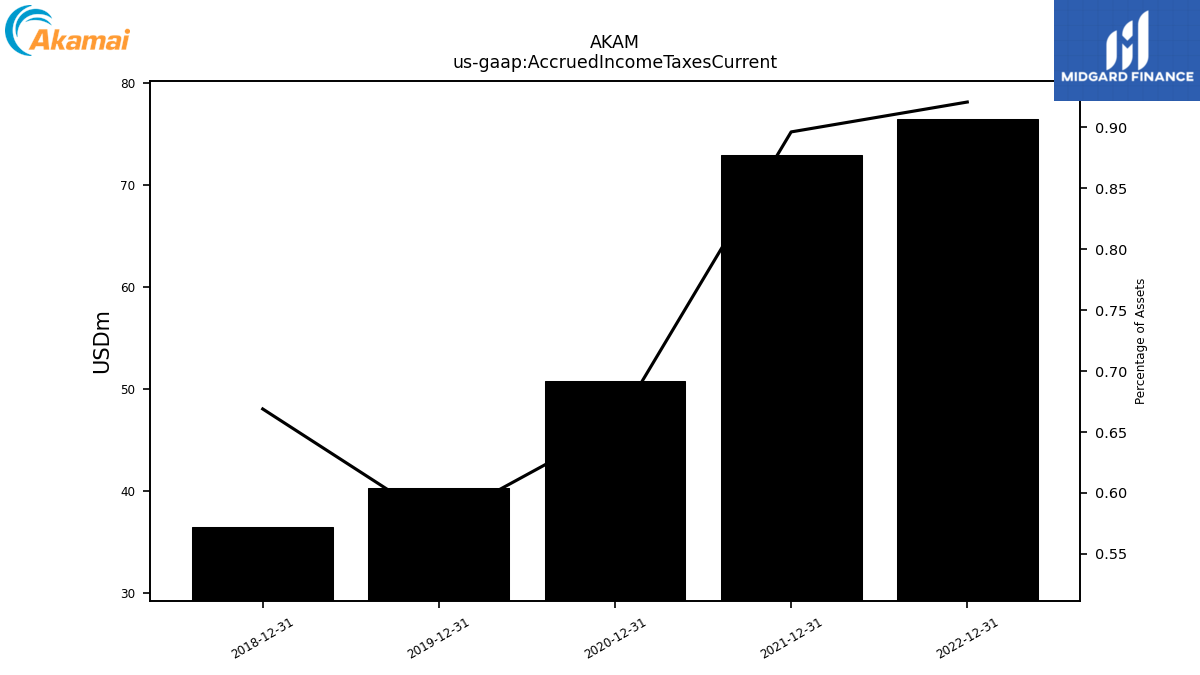
| Accrued Income Taxes Current | 70.02 | NA | NA | NA | 76.46 | NA | NA | NA | 72.95 | NA | NA | NA | 50.81 | NA | NA | NA | 40.34 | NA | NA | NA | 36.54 | NA | NA | NA | NA | NA | NA | NA | NA | NA | NA | NA | NA | NA | NA | NA | NA | NA | NA | NA | NA | NA | NA | NA | NA | NA | NA | NA | NA | NA | NA | NA | NA | NA | NA | NA | NA | NA | NA | NA | |
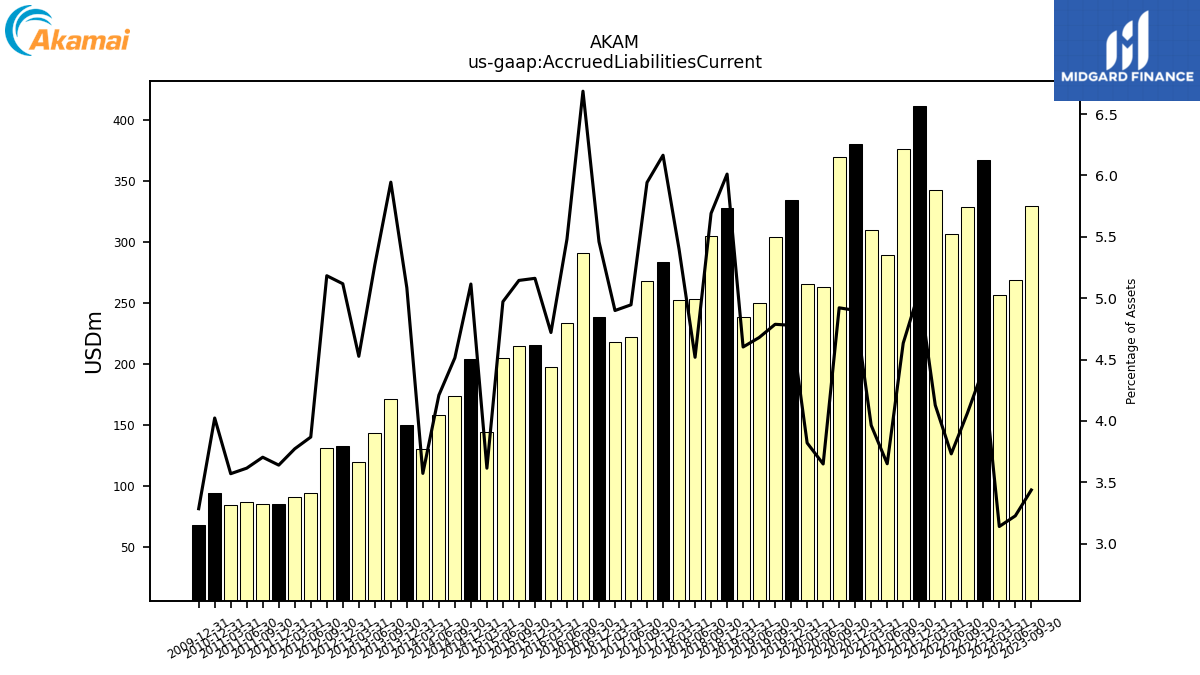
| Accrued Liabilities Current | 352.18 | 329.35 | 269.26 | 256.92 | 367.02 | 329.21 | 306.40 | 342.80 | 411.59 | 376.04 | 289.19 | 309.89 | 380.47 | 369.81 | 263.65 | 265.44 | 334.86 | 304.33 | 250.01 | 238.52 | 328.30 | 305.27 | 253.24 | 253.07 | 283.74 | 267.97 | 222.02 | 218.03 | 238.78 | 291.10 | 234.01 | 197.49 | 216.17 | 215.29 | 205.37 | 144.12 | 204.69 | 173.99 | 158.65 | 130.45 | 150.38 | 171.53 | 143.65 | 119.80 | 133.09 | 131.62 | 94.61 | 91.08 | 85.37 | 85.27 | 86.91 | 84.78 | 94.66 | NA | NA | NA | 68.57 | NA | NA | NA | |
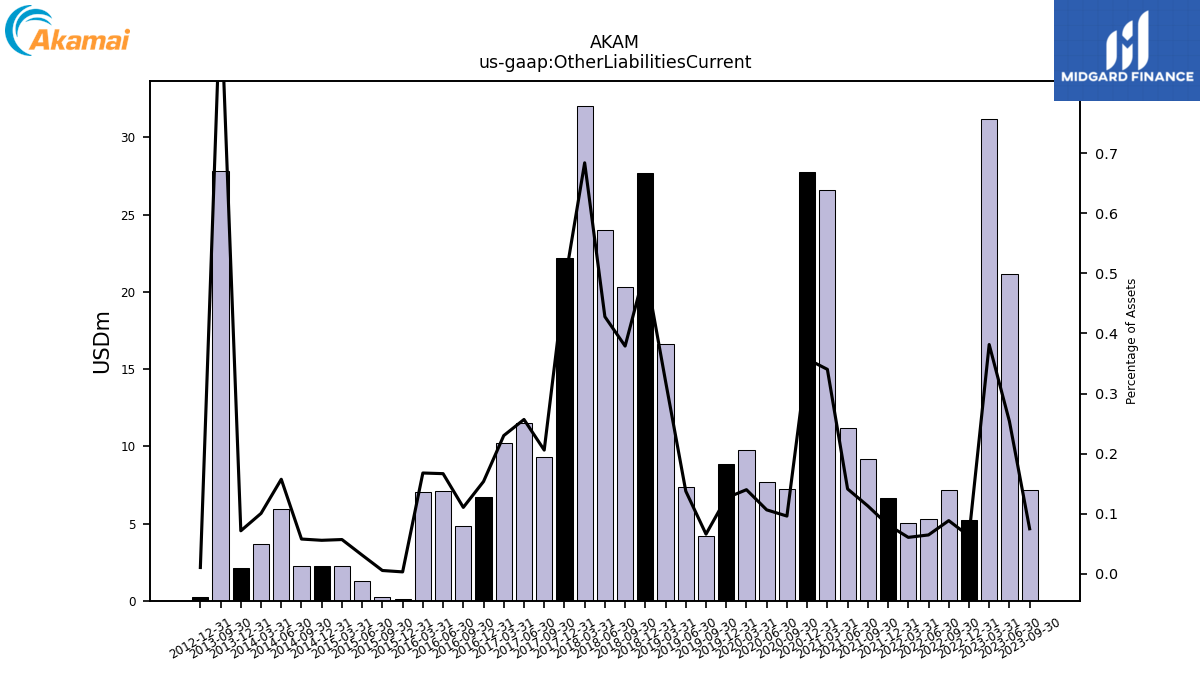
| Other Liabilities Current | 6.44 | 7.19 | 21.18 | 31.22 | 5.23 | 7.18 | 5.32 | 5.04 | 6.62 | 9.17 | 11.19 | 26.59 | 27.75 | 7.22 | 7.69 | 9.73 | 8.84 | 4.20 | 7.35 | 16.60 | 27.68 | 20.32 | 23.98 | 32.05 | 22.18 | 9.29 | 11.53 | 10.23 | 6.72 | 4.82 | 7.12 | 7.02 | 0.14 | 0.23 | 1.29 | 2.28 | 2.23 | 2.23 | 5.93 | 3.67 | 2.12 | 27.80 | NA | NA | 0.28 | NA | NA | NA | NA | NA | NA | NA | NA | NA | NA | NA | NA | NA | NA | NA | |
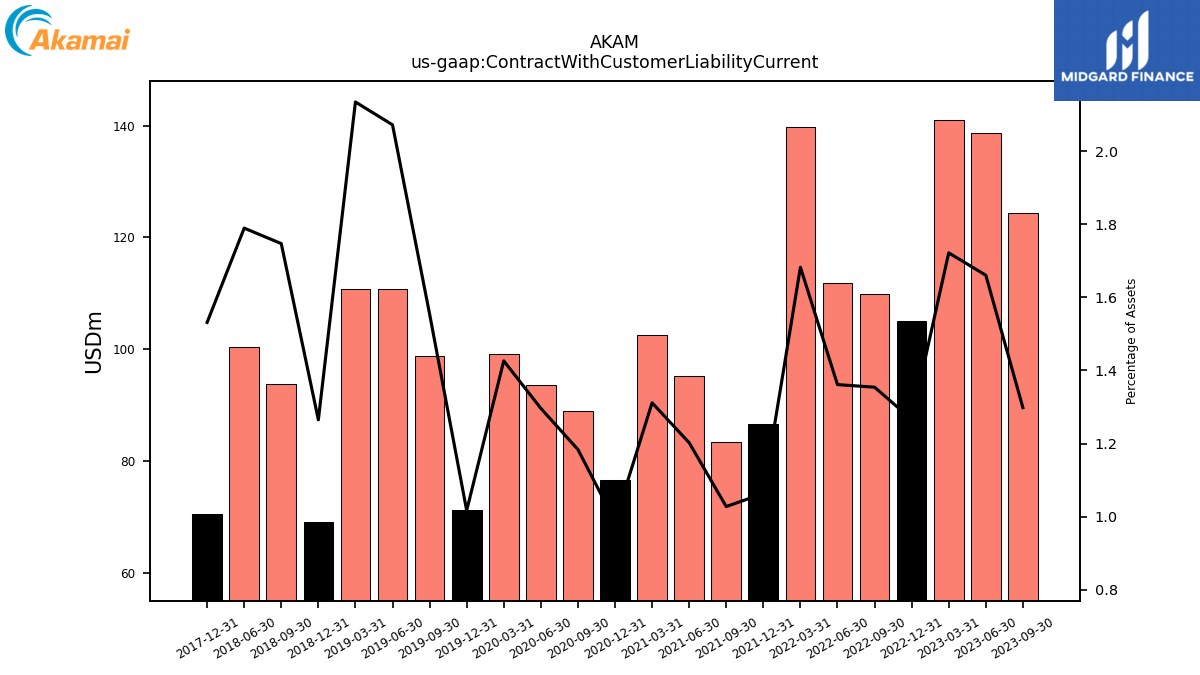
| Contract With Customer Liability Current | 107.54 | 124.39 | 138.61 | 140.93 | 105.11 | 109.79 | 111.77 | 139.72 | 86.52 | 83.37 | 95.22 | 102.53 | 76.60 | 88.94 | 93.65 | 99.10 | 71.22 | 98.84 | 110.75 | 110.67 | 69.08 | 93.73 | 100.31 | NA | 70.50 | NA | NA | NA | NA | NA | NA | NA | NA | NA | NA | NA | NA | NA | NA | NA | NA | NA | NA | NA | NA | NA | NA | NA | NA | NA | NA | NA | NA | NA | NA | NA | NA | NA | NA | NA |
| 2023-12-31 | 2023-09-30 | 2023-06-30 | 2023-03-31 | 2022-12-31 | 2022-09-30 | 2022-06-30 | 2022-03-31 | 2021-12-31 | 2021-09-30 | 2021-06-30 | 2021-03-31 | 2020-12-31 | 2020-09-30 | 2020-06-30 | 2020-03-31 | 2019-12-31 | 2019-09-30 | 2019-06-30 | 2019-03-31 | 2018-12-31 | 2018-09-30 | 2018-06-30 | 2018-03-31 | 2017-12-31 | 2017-09-30 | 2017-06-30 | 2017-03-31 | 2016-12-31 | 2016-09-30 | 2016-06-30 | 2016-03-31 | 2015-12-31 | 2015-09-30 | 2015-06-30 | 2015-03-31 | 2014-12-31 | 2014-09-30 | 2014-06-30 | 2014-03-31 | 2013-12-31 | 2013-09-30 | 2013-06-30 | 2013-03-31 | 2012-12-31 | 2012-09-30 | 2012-06-30 | 2012-03-31 | 2011-12-31 | 2011-09-30 | 2011-06-30 | 2011-03-31 | 2010-12-31 | 2010-09-30 | 2010-06-30 | 2010-03-31 | 2009-12-31 | 2009-09-30 | 2009-06-30 | 2009-03-31 | ||
|---|---|---|---|---|---|---|---|---|---|---|---|---|---|---|---|---|---|---|---|---|---|---|---|---|---|---|---|---|---|---|---|---|---|---|---|---|---|---|---|---|---|---|---|---|---|---|---|---|---|---|---|---|---|---|---|---|---|---|---|---|---|
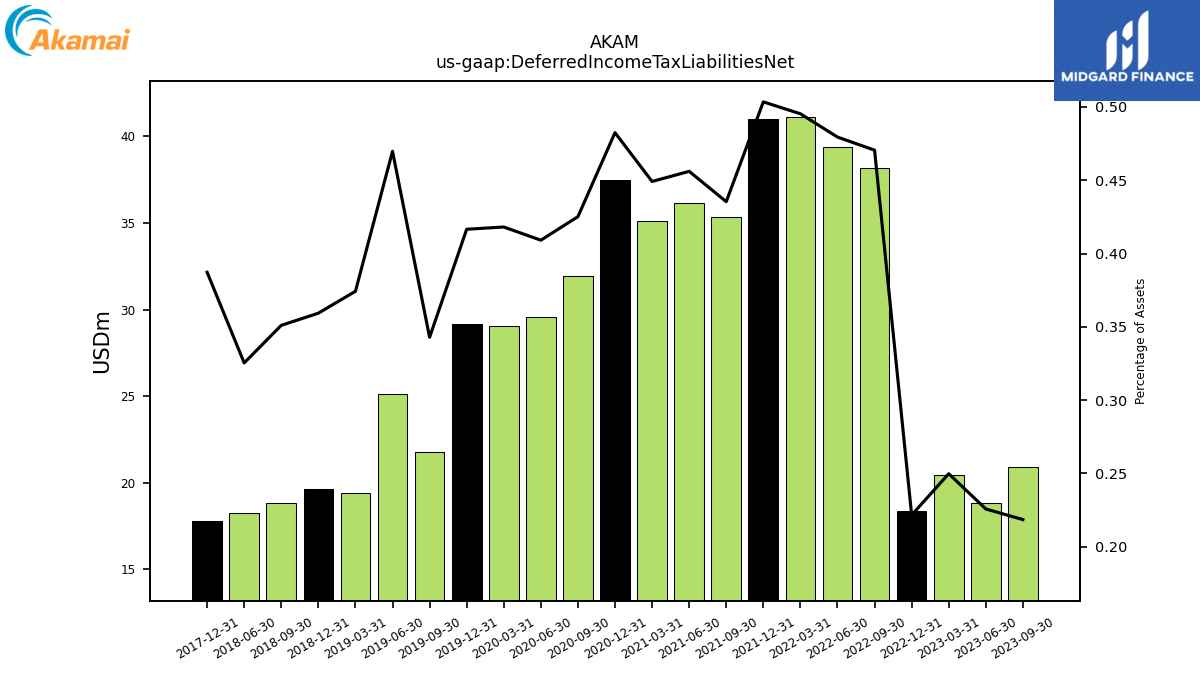
| Deferred Income Tax Liabilities Net | 24.62 | 20.93 | 18.84 | 20.44 | 18.40 | 38.15 | 39.37 | 41.13 | 40.97 | 35.33 | 36.12 | 35.12 | 37.46 | 31.95 | 29.56 | 29.05 | 29.19 | 21.80 | 25.10 | 19.40 | 19.62 | 18.83 | 18.24 | NA | 17.82 | NA | NA | NA | NA | NA | NA | NA | NA | NA | NA | NA | NA | NA | NA | NA | NA | NA | NA | NA | NA | NA | NA | NA | NA | NA | NA | NA | NA | NA | NA | NA | NA | NA | NA | NA | |
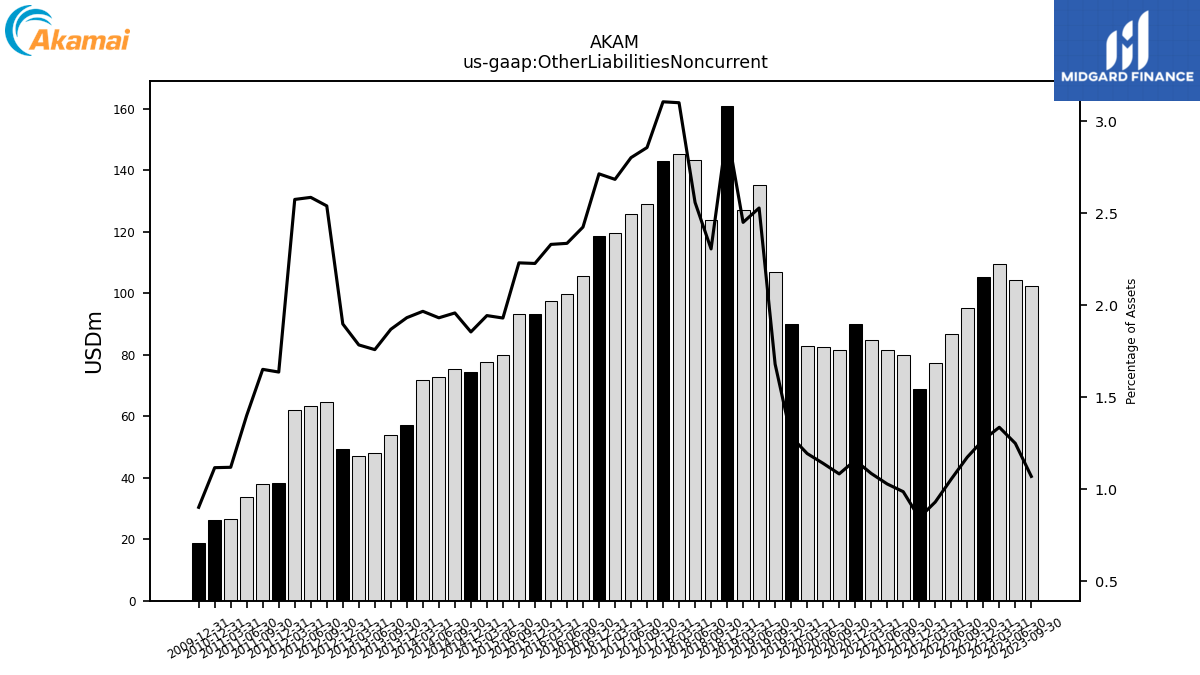
| Other Liabilities Noncurrent | 106.18 | 102.47 | 104.25 | 109.37 | 105.31 | 95.18 | 86.61 | 77.23 | 68.75 | 80.05 | 81.45 | 84.86 | 89.83 | 81.39 | 82.37 | 82.94 | 90.06 | 106.79 | 135.10 | 127.00 | 160.94 | 123.69 | 143.41 | 145.33 | 142.96 | 128.83 | 125.79 | 119.45 | 118.69 | 105.57 | 99.75 | 97.51 | 93.27 | 93.33 | 79.75 | 77.49 | 74.22 | 75.47 | 72.80 | 71.82 | 57.15 | 53.93 | 47.93 | 47.22 | 49.36 | 64.50 | 63.25 | 62.16 | 38.39 | 38.01 | 33.69 | 26.57 | 26.28 | NA | NA | NA | 18.82 | NA | NA | NA | |
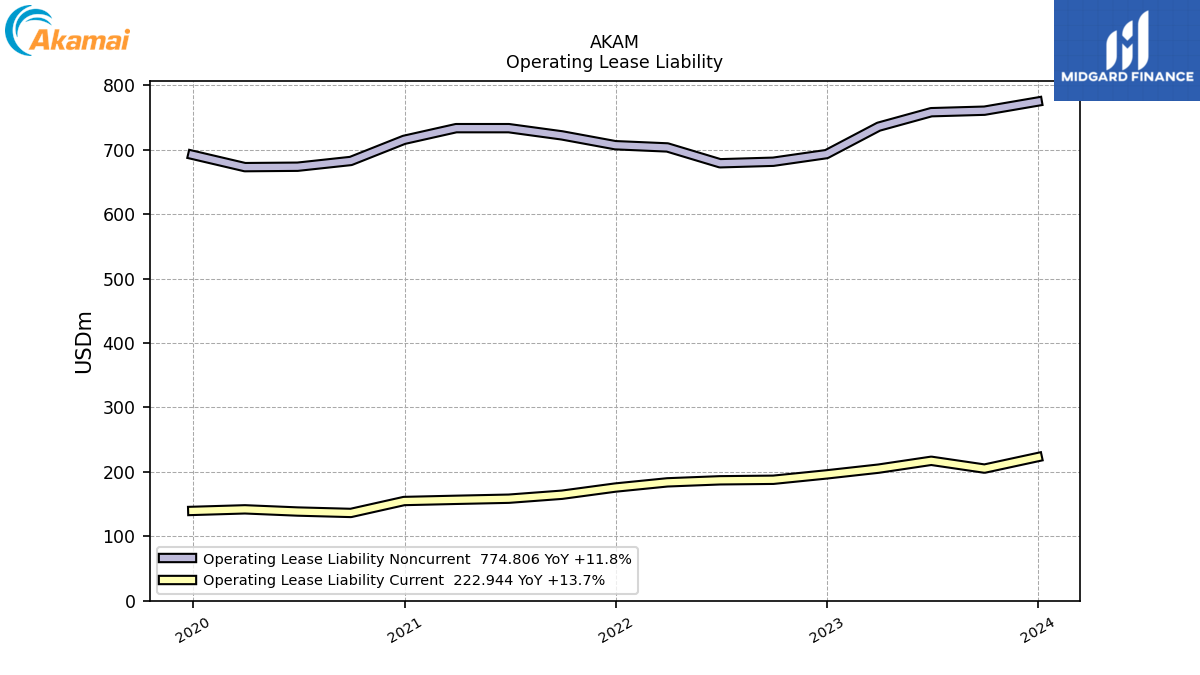
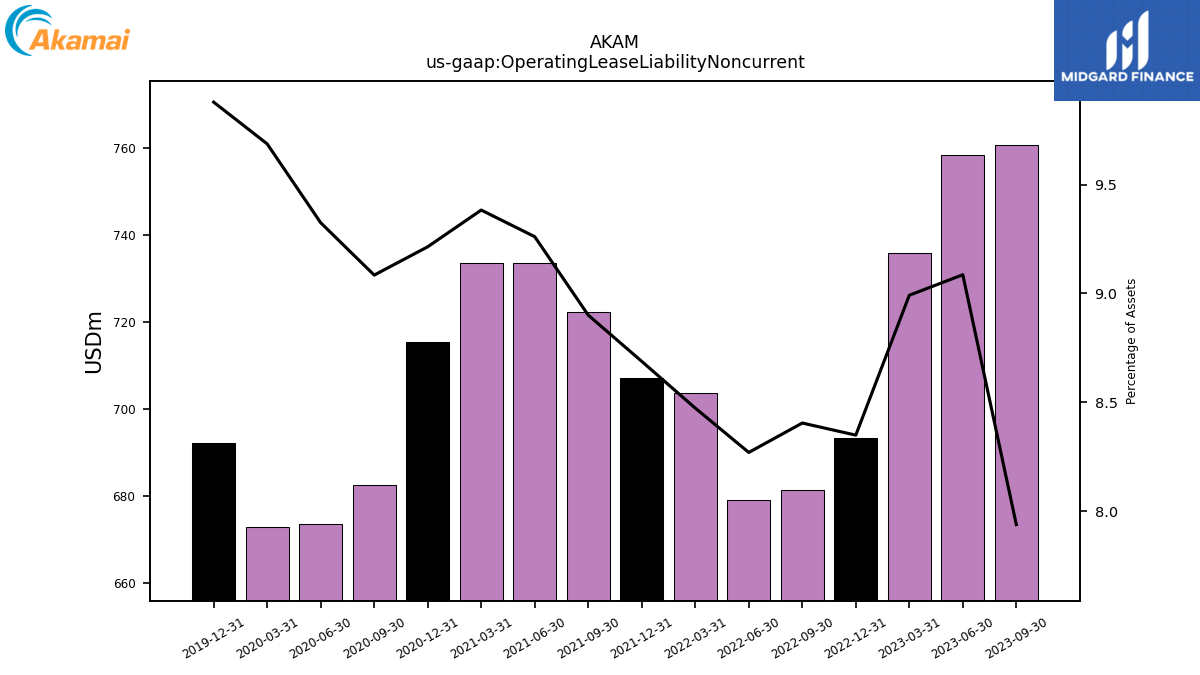
| Operating Lease Liability Noncurrent | 774.81 | 760.65 | 758.30 | 735.81 | 693.26 | 681.41 | 679.03 | 703.61 | 707.09 | 722.29 | 733.52 | 733.54 | 715.40 | 682.62 | 673.68 | 673.03 | 692.18 | NA | NA | NA | NA | NA | NA | NA | NA | NA | NA | NA | NA | NA | NA | NA | NA | NA | NA | NA | NA | NA | NA | NA | NA | NA | NA | NA | NA | NA | NA | NA | NA | NA | NA | NA | NA | NA | NA | NA | NA | NA | NA | NA |
| 2023-12-31 | 2023-09-30 | 2023-06-30 | 2023-03-31 | 2022-12-31 | 2022-09-30 | 2022-06-30 | 2022-03-31 | 2021-12-31 | 2021-09-30 | 2021-06-30 | 2021-03-31 | 2020-12-31 | 2020-09-30 | 2020-06-30 | 2020-03-31 | 2019-12-31 | 2019-09-30 | 2019-06-30 | 2019-03-31 | 2018-12-31 | 2018-09-30 | 2018-06-30 | 2018-03-31 | 2017-12-31 | 2017-09-30 | 2017-06-30 | 2017-03-31 | 2016-12-31 | 2016-09-30 | 2016-06-30 | 2016-03-31 | 2015-12-31 | 2015-09-30 | 2015-06-30 | 2015-03-31 | 2014-12-31 | 2014-09-30 | 2014-06-30 | 2014-03-31 | 2013-12-31 | 2013-09-30 | 2013-06-30 | 2013-03-31 | 2012-12-31 | 2012-09-30 | 2012-06-30 | 2012-03-31 | 2011-12-31 | 2011-09-30 | 2011-06-30 | 2011-03-31 | 2010-12-31 | 2010-09-30 | 2010-06-30 | 2010-03-31 | 2009-12-31 | 2009-09-30 | 2009-06-30 | 2009-03-31 | ||
|---|---|---|---|---|---|---|---|---|---|---|---|---|---|---|---|---|---|---|---|---|---|---|---|---|---|---|---|---|---|---|---|---|---|---|---|---|---|---|---|---|---|---|---|---|---|---|---|---|---|---|---|---|---|---|---|---|---|---|---|---|---|
| Stockholders Equity | 4597.15 | 4324.20 | 4289.17 | 4171.34 | 4360.19 | 4233.18 | 4280.48 | 4300.52 | 4530.01 | 4582.44 | 4476.66 | 4321.36 | 4251.30 | 4107.62 | 3904.30 | 3672.22 | 3657.96 | 3501.60 | 3394.76 | 3283.22 | 3191.86 | 3155.53 | 3445.28 | 3386.26 | 3310.72 | 3272.66 | 3287.17 | 3258.55 | 3224.37 | 3168.93 | 3150.47 | 3113.58 | 3120.88 | 3085.66 | 3045.31 | 2981.68 | 2945.34 | 2848.38 | 2772.74 | 2712.14 | 2629.43 | 2543.13 | 2447.87 | 2384.78 | 2345.75 | 2259.94 | 2214.63 | 2201.19 | 2156.25 | 2122.01 | 2228.32 | 2210.19 | 2177.61 | NA | NA | NA | 1738.72 | NA | NA | NA | |
| Common Stock Value | 1.51 | 1.58 | 1.58 | 1.57 | 1.56 | 1.62 | 1.62 | 1.61 | 1.60 | 1.65 | 1.65 | 1.64 | 1.63 | 1.64 | 1.64 | 1.63 | 1.62 | 1.65 | 1.65 | 1.64 | 1.63 | 1.72 | 1.72 | 1.71 | 1.70 | 1.75 | 1.75 | 1.74 | 1.73 | 1.79 | 1.79 | 1.78 | 1.77 | 1.81 | 1.80 | 1.80 | 1.78 | 1.85 | 1.84 | 1.83 | 1.81 | 2.06 | 2.04 | 2.03 | 2.02 | 2.00 | 1.99 | 1.98 | 1.96 | 1.95 | 1.94 | 1.94 | 1.92 | NA | NA | NA | 1.75 | NA | NA | NA | |
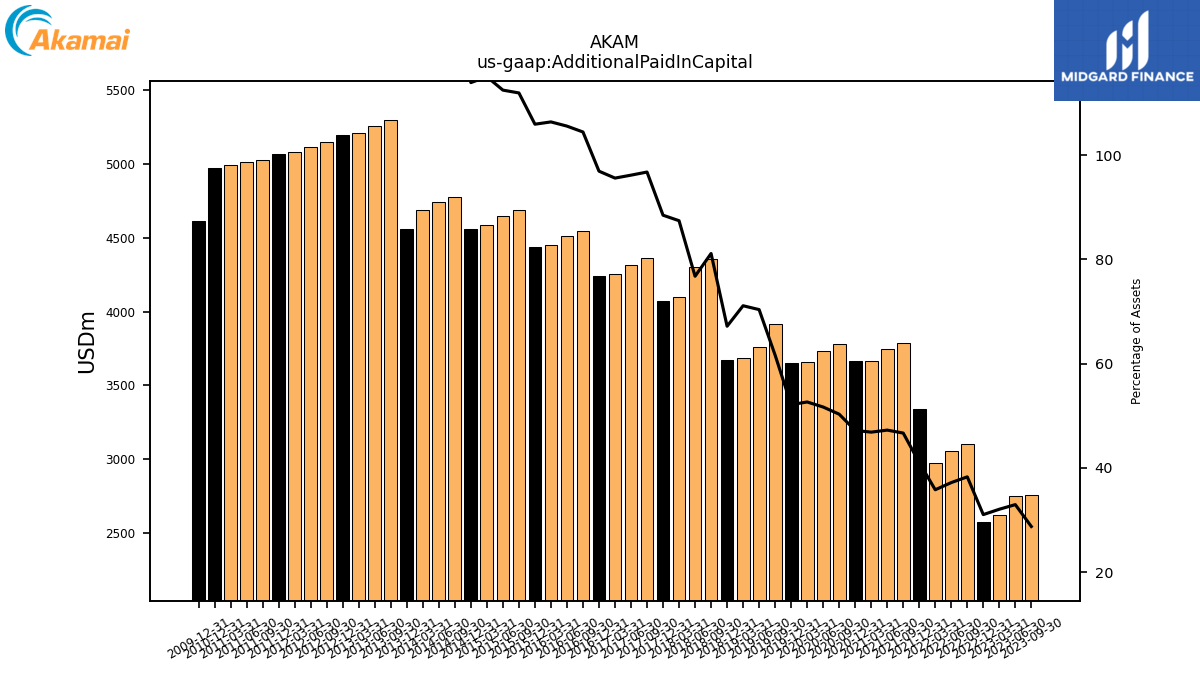
| Additional Paid In Capital | 2222.99 | 2756.91 | 2751.68 | 2625.24 | 2578.60 | 3104.97 | 3054.20 | 2974.53 | 3340.82 | 3789.62 | 3743.74 | 3664.57 | 3664.82 | 3781.23 | 3734.79 | 3658.99 | 3653.49 | 3919.26 | 3760.84 | 3686.34 | 3670.03 | 4352.86 | 4303.53 | 4098.22 | 4073.36 | 4363.88 | 4317.58 | 4254.98 | 4239.59 | 4547.83 | 4508.38 | 4451.32 | 4437.42 | 4685.08 | 4647.27 | 4587.00 | 4559.43 | 4777.96 | 4742.42 | 4687.51 | 4561.93 | 5295.94 | 5256.35 | 5207.28 | 5195.54 | 5146.09 | 5117.09 | 5076.89 | 5068.23 | 5025.80 | 5009.67 | 4991.76 | 4970.28 | NA | NA | NA | 4615.77 | NA | NA | NA | |
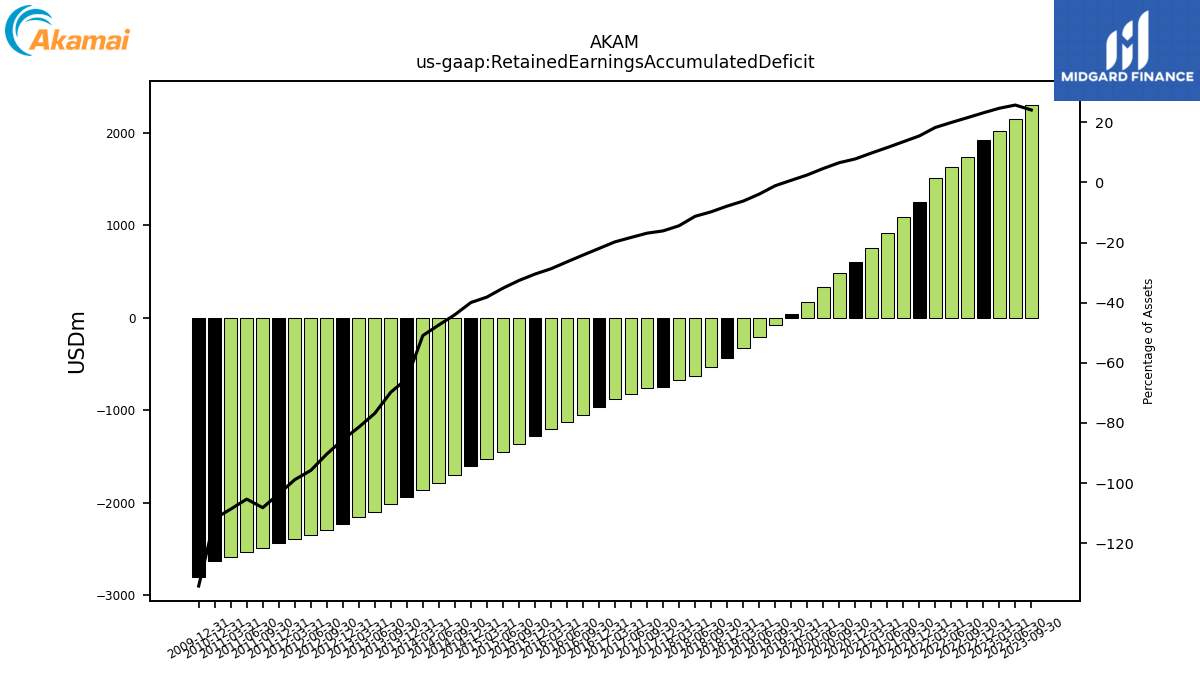
| Retained Earnings Accumulated Deficit | 2467.98 | 2306.82 | 2146.27 | 2017.46 | 1920.35 | 1743.53 | 1635.38 | 1515.84 | 1256.69 | 1096.16 | 917.24 | 760.75 | 605.05 | 491.68 | 333.06 | 171.14 | 48.00 | -71.10 | -208.99 | -322.91 | -430.89 | -524.91 | -632.49 | -675.55 | -742.41 | -761.51 | -822.03 | -879.80 | -960.73 | -1052.37 | -1128.37 | -1202.00 | -1276.86 | -1365.28 | -1453.32 | -1520.52 | -1598.27 | -1695.37 | -1786.53 | -1859.41 | -1932.21 | -2012.56 | -2092.32 | -2154.22 | -2225.70 | -2293.99 | -2342.22 | -2386.46 | -2429.69 | -2489.77 | -2532.06 | -2579.98 | -2630.59 | NA | NA | NA | -2801.82 | NA | NA | NA | |
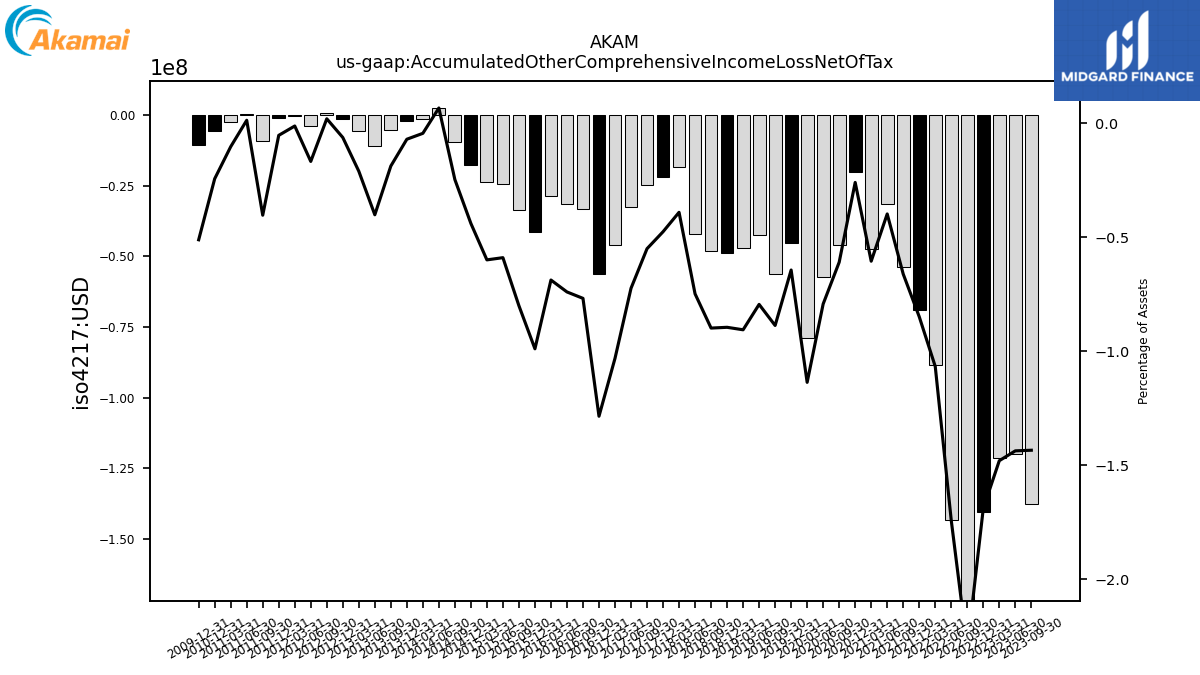
| Accumulated Other Comprehensive Income Loss Net Of Tax | -95.33 | -137.47 | -119.96 | -121.16 | -140.33 | -186.67 | -143.08 | -88.61 | -69.11 | -53.73 | -31.56 | -47.35 | -20.20 | -45.85 | -57.31 | -79.00 | -45.14 | -56.42 | -42.48 | -46.98 | -48.91 | -48.22 | -41.97 | -18.33 | -21.93 | -24.83 | -32.52 | -45.91 | -56.22 | -33.46 | -31.62 | -28.79 | -41.45 | -33.52 | -24.38 | -23.91 | -17.61 | -9.54 | 2.50 | -1.64 | -2.09 | -5.43 | -10.96 | -5.58 | -1.64 | 0.48 | -4.11 | -0.31 | -1.26 | -9.30 | 0.30 | -2.46 | -5.74 | NA | NA | NA | -10.68 | NA | NA | NA | |
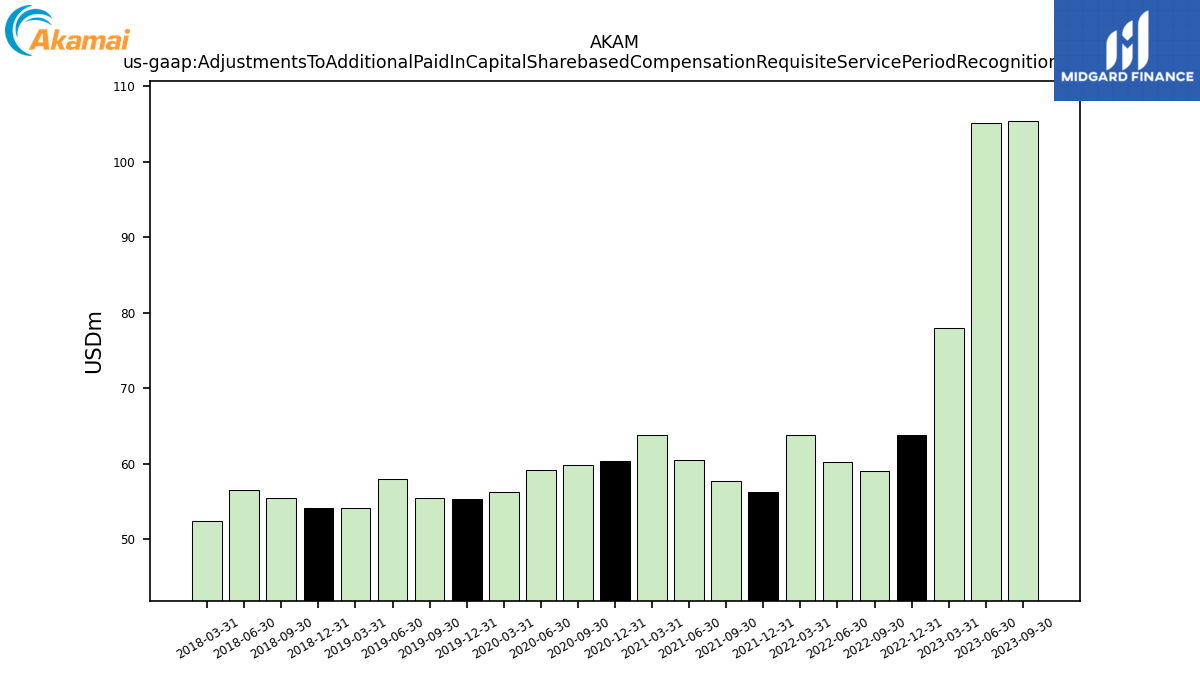
| Adjustments To Additional Paid In Capital Sharebased Compensation Requisite Service Period Recognition Value | 110.00 | 105.42 | 105.08 | 77.98 | 63.83 | 59.01 | 60.26 | 63.77 | 56.24 | 57.75 | 60.53 | 63.77 | 60.36 | 59.83 | 59.23 | 56.22 | 55.38 | 55.41 | 57.99 | 54.08 | 54.11 | 55.42 | 56.50 | 52.39 | NA | NA | NA | NA | NA | NA | NA | NA | NA | NA | NA | NA | NA | NA | NA | NA | NA | NA | NA | NA | NA | NA | NA | NA | NA | NA | NA | NA | NA | NA | NA | NA | NA | NA | NA | NA |
| 2023-12-31 | 2023-09-30 | 2023-06-30 | 2023-03-31 | 2022-12-31 | 2022-09-30 | 2022-06-30 | 2022-03-31 | 2021-12-31 | 2021-09-30 | 2021-06-30 | 2021-03-31 | 2020-12-31 | 2020-09-30 | 2020-06-30 | 2020-03-31 | 2019-12-31 | 2019-09-30 | 2019-06-30 | 2019-03-31 | 2018-12-31 | 2018-09-30 | 2018-06-30 | 2018-03-31 | 2017-12-31 | 2017-09-30 | 2017-06-30 | 2017-03-31 | 2016-12-31 | 2016-09-30 | 2016-06-30 | 2016-03-31 | 2015-12-31 | 2015-09-30 | 2015-06-30 | 2015-03-31 | 2014-12-31 | 2014-09-30 | 2014-06-30 | 2014-03-31 | 2013-12-31 | 2013-09-30 | 2013-06-30 | 2013-03-31 | 2012-12-31 | 2012-09-30 | 2012-06-30 | 2012-03-31 | 2011-12-31 | 2011-09-30 | 2011-06-30 | 2011-03-31 | 2010-12-31 | 2010-09-30 | 2010-06-30 | 2010-03-31 | 2009-12-31 | 2009-09-30 | 2009-06-30 | 2009-03-31 | ||
|---|---|---|---|---|---|---|---|---|---|---|---|---|---|---|---|---|---|---|---|---|---|---|---|---|---|---|---|---|---|---|---|---|---|---|---|---|---|---|---|---|---|---|---|---|---|---|---|---|---|---|---|---|---|---|---|---|---|---|---|---|---|
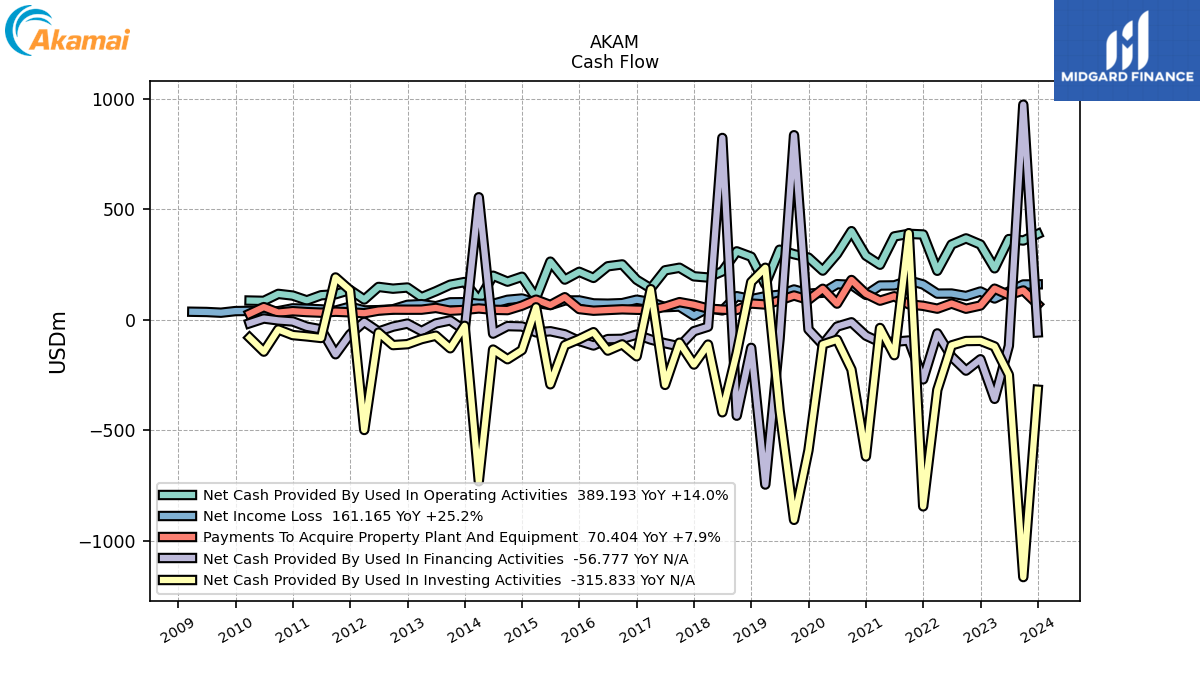
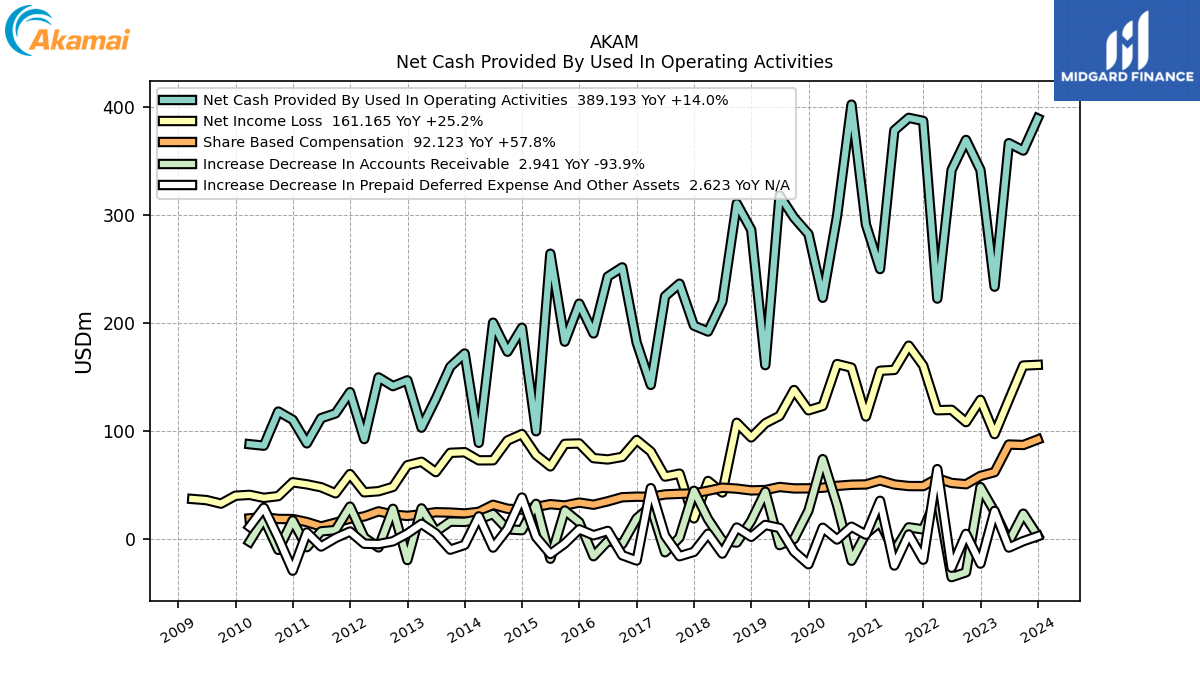
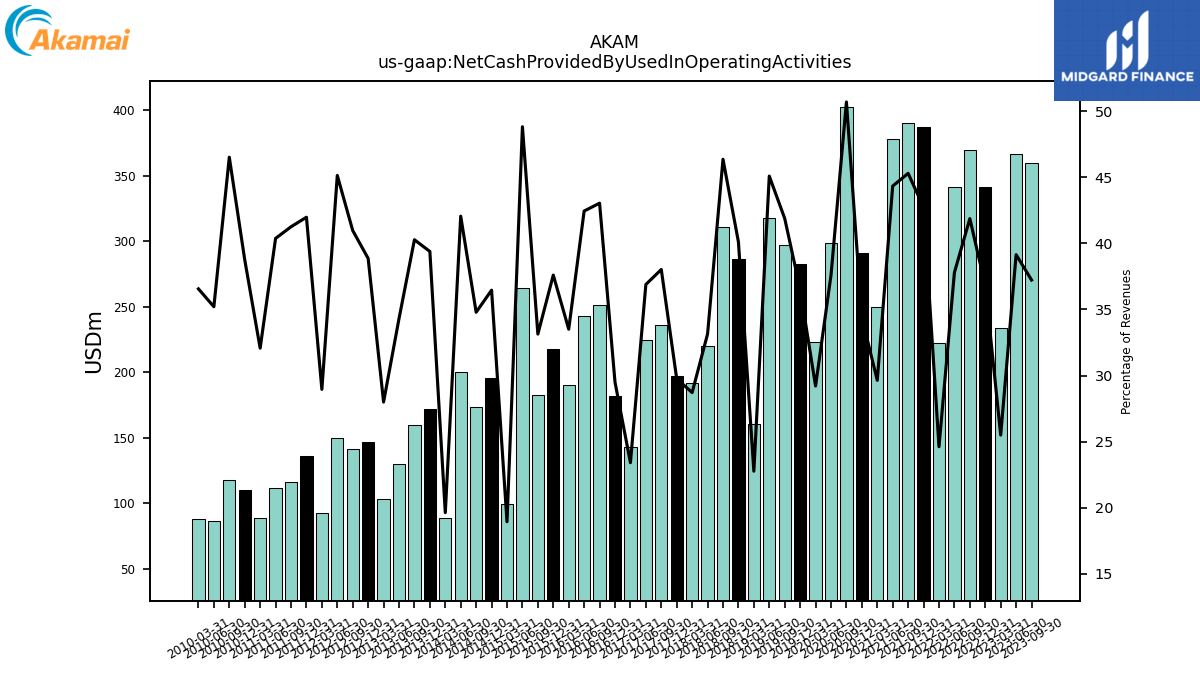
| Net Cash Provided By Used In Operating Activities | 389.19 | 359.44 | 366.31 | 233.50 | 341.50 | 369.30 | 341.43 | 222.45 | 386.90 | 389.74 | 378.13 | 249.79 | 291.09 | 401.97 | 298.69 | 223.24 | 282.14 | 297.38 | 317.93 | 160.85 | 286.15 | 310.48 | 219.68 | 192.01 | 197.44 | 236.29 | 224.63 | 142.62 | 181.79 | 251.40 | 242.87 | 190.24 | 217.79 | 182.61 | 264.02 | 99.73 | 195.54 | 173.28 | 200.22 | 89.02 | 171.73 | 159.41 | 129.72 | 103.04 | 146.85 | 141.50 | 149.55 | 92.50 | 135.91 | 116.29 | 111.85 | 88.51 | 110.36 | 117.96 | 86.38 | 87.75 | NA | NA | NA | NA | |
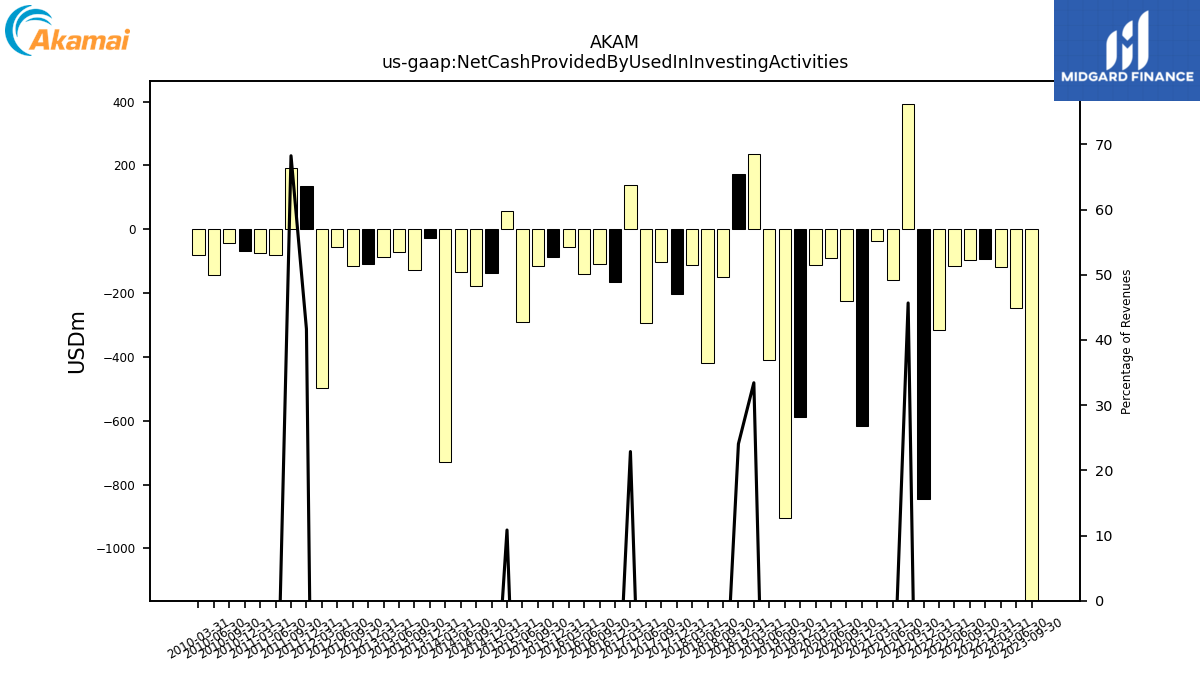
| Net Cash Provided By Used In Investing Activities | -315.83 | -1164.16 | -248.35 | -119.89 | -94.66 | -95.53 | -115.23 | -316.90 | -843.95 | 392.98 | -159.62 | -36.31 | -617.93 | -224.66 | -89.64 | -110.74 | -589.76 | -904.98 | -409.43 | 236.24 | 171.70 | -148.65 | -418.10 | -111.48 | -201.94 | -103.00 | -294.15 | 139.41 | -164.72 | -110.47 | -138.81 | -55.43 | -86.87 | -114.45 | -291.38 | 57.14 | -136.41 | -177.90 | -134.04 | -730.46 | -26.54 | -128.42 | -71.26 | -86.89 | -109.69 | -113.93 | -57.21 | -498.21 | 134.94 | 192.40 | -81.70 | -74.51 | -68.46 | -43.19 | -143.54 | -80.17 | NA | NA | NA | NA | |
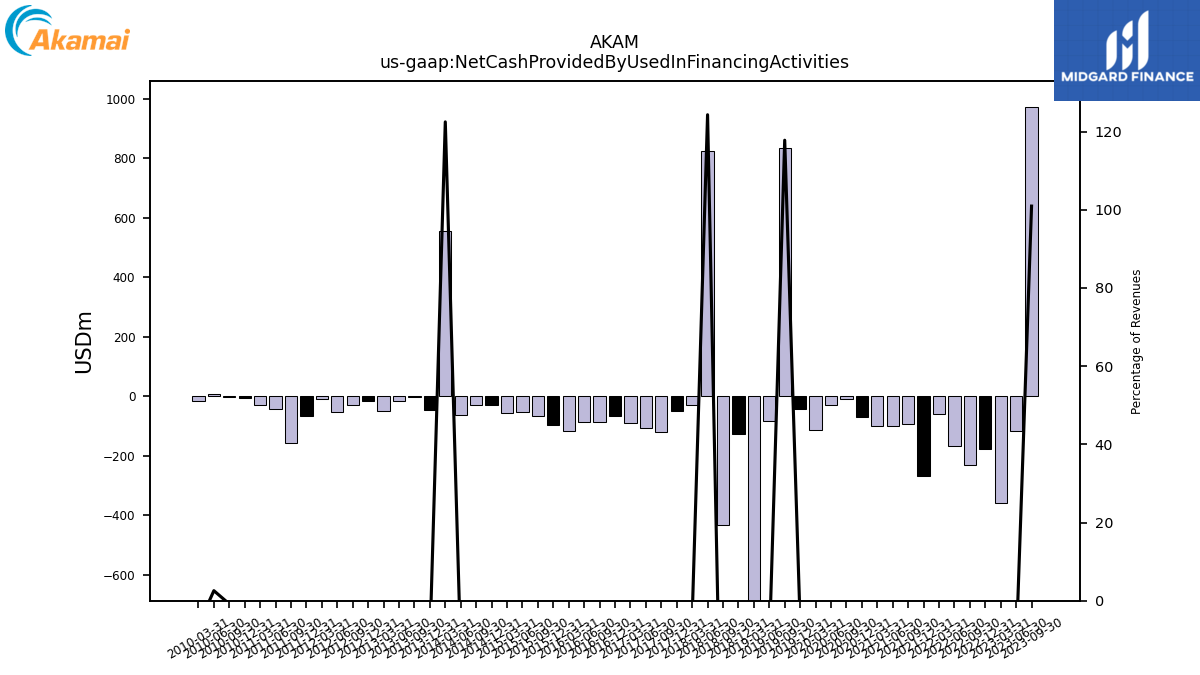
| Net Cash Provided By Used In Financing Activities | -56.78 | 974.64 | -117.20 | -357.29 | -177.96 | -229.47 | -165.91 | -60.84 | -269.23 | -93.16 | -98.84 | -100.78 | -71.08 | -10.56 | -30.17 | -111.84 | -42.97 | 836.28 | -83.69 | -745.29 | -126.12 | -433.53 | 823.93 | -30.66 | -50.90 | -119.74 | -105.51 | -88.86 | -66.26 | -85.61 | -86.66 | -115.74 | -95.22 | -65.08 | -51.21 | -56.21 | -29.55 | -27.89 | -62.04 | 555.51 | -46.85 | -2.16 | -15.96 | -50.28 | -16.49 | -30.29 | -52.63 | -9.08 | -65.44 | -155.50 | -42.44 | -30.71 | -6.88 | -2.10 | 6.32 | -15.03 | NA | NA | NA | NA |
| 2023-12-31 | 2023-09-30 | 2023-06-30 | 2023-03-31 | 2022-12-31 | 2022-09-30 | 2022-06-30 | 2022-03-31 | 2021-12-31 | 2021-09-30 | 2021-06-30 | 2021-03-31 | 2020-12-31 | 2020-09-30 | 2020-06-30 | 2020-03-31 | 2019-12-31 | 2019-09-30 | 2019-06-30 | 2019-03-31 | 2018-12-31 | 2018-09-30 | 2018-06-30 | 2018-03-31 | 2017-12-31 | 2017-09-30 | 2017-06-30 | 2017-03-31 | 2016-12-31 | 2016-09-30 | 2016-06-30 | 2016-03-31 | 2015-12-31 | 2015-09-30 | 2015-06-30 | 2015-03-31 | 2014-12-31 | 2014-09-30 | 2014-06-30 | 2014-03-31 | 2013-12-31 | 2013-09-30 | 2013-06-30 | 2013-03-31 | 2012-12-31 | 2012-09-30 | 2012-06-30 | 2012-03-31 | 2011-12-31 | 2011-09-30 | 2011-06-30 | 2011-03-31 | 2010-12-31 | 2010-09-30 | 2010-06-30 | 2010-03-31 | 2009-12-31 | 2009-09-30 | 2009-06-30 | 2009-03-31 | ||
|---|---|---|---|---|---|---|---|---|---|---|---|---|---|---|---|---|---|---|---|---|---|---|---|---|---|---|---|---|---|---|---|---|---|---|---|---|---|---|---|---|---|---|---|---|---|---|---|---|---|---|---|---|---|---|---|---|---|---|---|---|---|
| Net Cash Provided By Used In Operating Activities | 389.19 | 359.44 | 366.31 | 233.50 | 341.50 | 369.30 | 341.43 | 222.45 | 386.90 | 389.74 | 378.13 | 249.79 | 291.09 | 401.97 | 298.69 | 223.24 | 282.14 | 297.38 | 317.93 | 160.85 | 286.15 | 310.48 | 219.68 | 192.01 | 197.44 | 236.29 | 224.63 | 142.62 | 181.79 | 251.40 | 242.87 | 190.24 | 217.79 | 182.61 | 264.02 | 99.73 | 195.54 | 173.28 | 200.22 | 89.02 | 171.73 | 159.41 | 129.72 | 103.04 | 146.85 | 141.50 | 149.55 | 92.50 | 135.91 | 116.29 | 111.85 | 88.51 | 110.36 | 117.96 | 86.38 | 87.75 | NA | NA | NA | NA | |
| Net Income Loss | 161.16 | 160.54 | 128.82 | 97.11 | 128.76 | 108.15 | 119.54 | 119.16 | 160.53 | 178.92 | 156.50 | 155.69 | 113.37 | 158.62 | 161.91 | 123.15 | 119.10 | 137.89 | 113.92 | 107.13 | 94.02 | 107.58 | 43.06 | 53.71 | 19.11 | 60.51 | 57.77 | 80.93 | 91.64 | 76.00 | 73.64 | 74.86 | 88.42 | 88.04 | 67.20 | 77.75 | 97.11 | 91.16 | 72.89 | 72.80 | 80.35 | 79.76 | 61.90 | 71.49 | 68.29 | 48.23 | 44.24 | 43.23 | 60.08 | 42.28 | 47.92 | 50.62 | 52.51 | 39.71 | 38.12 | 40.88 | 40.08 | 32.74 | 36.01 | 37.08 | |
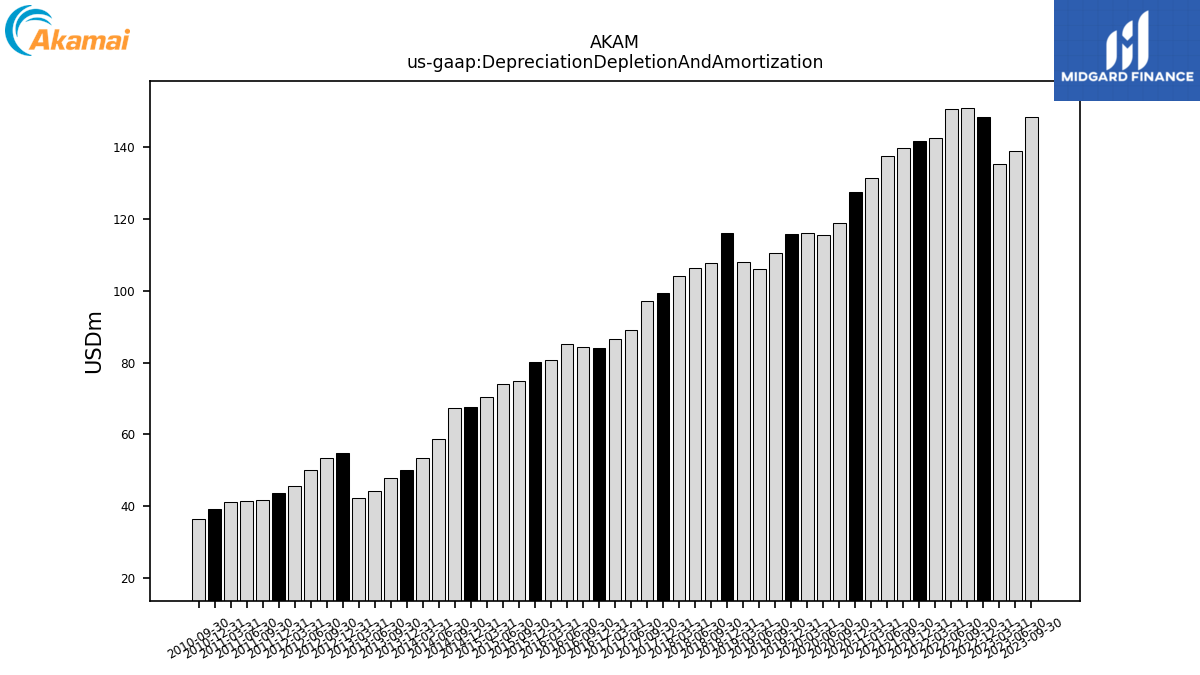
| Depreciation Depletion And Amortization | 147.63 | 148.56 | 139.12 | 135.46 | 148.57 | 150.99 | 150.60 | 142.59 | 141.70 | 139.75 | 137.72 | 131.47 | 127.71 | 118.89 | 115.58 | 116.21 | 115.80 | 110.60 | 106.06 | 108.20 | 116.29 | 107.83 | 106.30 | 104.09 | 99.40 | 97.18 | 89.21 | 86.53 | 84.01 | 84.51 | 85.11 | 80.67 | 80.33 | 74.78 | 73.99 | 70.46 | 67.76 | 67.42 | 58.71 | 53.52 | 49.98 | 47.95 | 44.13 | 42.38 | 54.96 | 53.46 | 50.11 | 45.63 | 43.65 | 41.76 | 41.33 | 41.13 | 39.13 | 36.48 | NA | NA | NA | NA | NA | NA | |
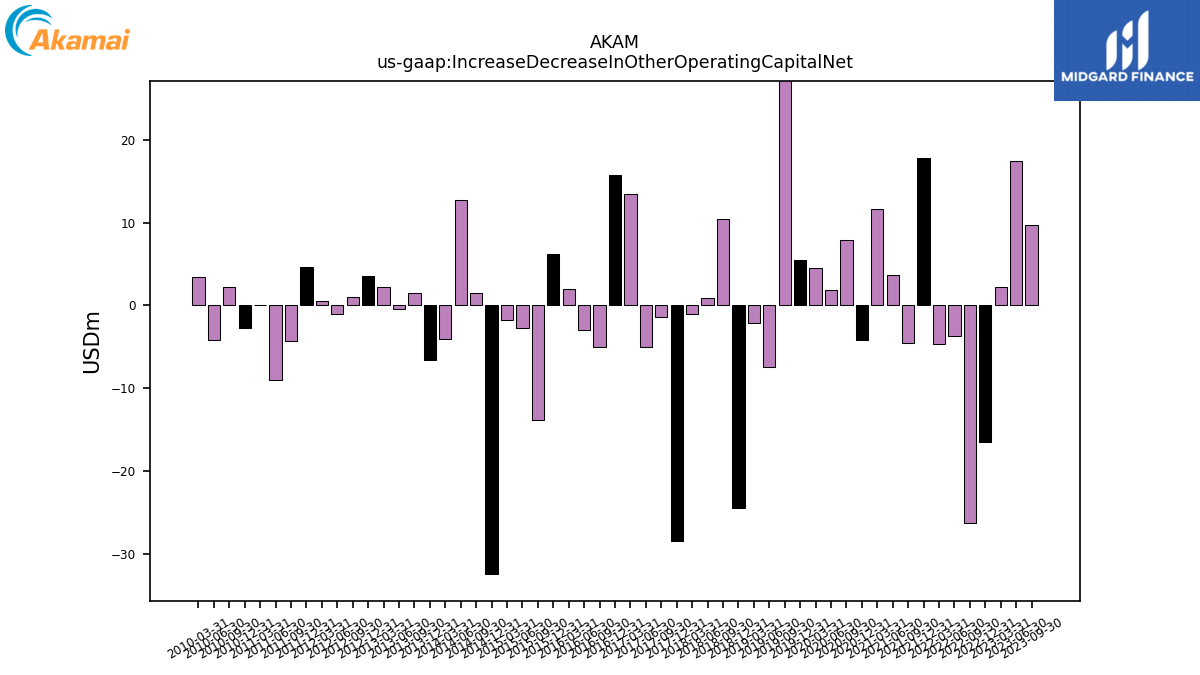
| Increase Decrease In Other Operating Capital Net | -4.83 | 9.72 | 17.46 | 2.16 | -16.48 | -26.28 | -3.70 | -4.67 | 17.85 | -4.52 | 3.69 | 11.69 | -4.21 | 7.91 | 1.89 | 4.51 | 5.43 | 32.21 | -7.49 | -2.08 | -24.48 | 10.40 | 0.94 | -1.00 | -28.46 | -1.41 | -5.06 | 13.51 | 15.74 | -5.04 | -3.01 | 1.95 | 6.26 | -13.82 | -2.68 | -1.74 | -32.47 | 1.53 | 12.70 | -4.03 | -6.66 | 1.48 | -0.41 | 2.26 | 3.53 | 1.03 | -1.06 | 0.57 | 4.65 | -4.30 | -9.07 | 0.02 | -2.71 | 2.16 | -4.23 | 3.47 | NA | NA | NA | NA | |
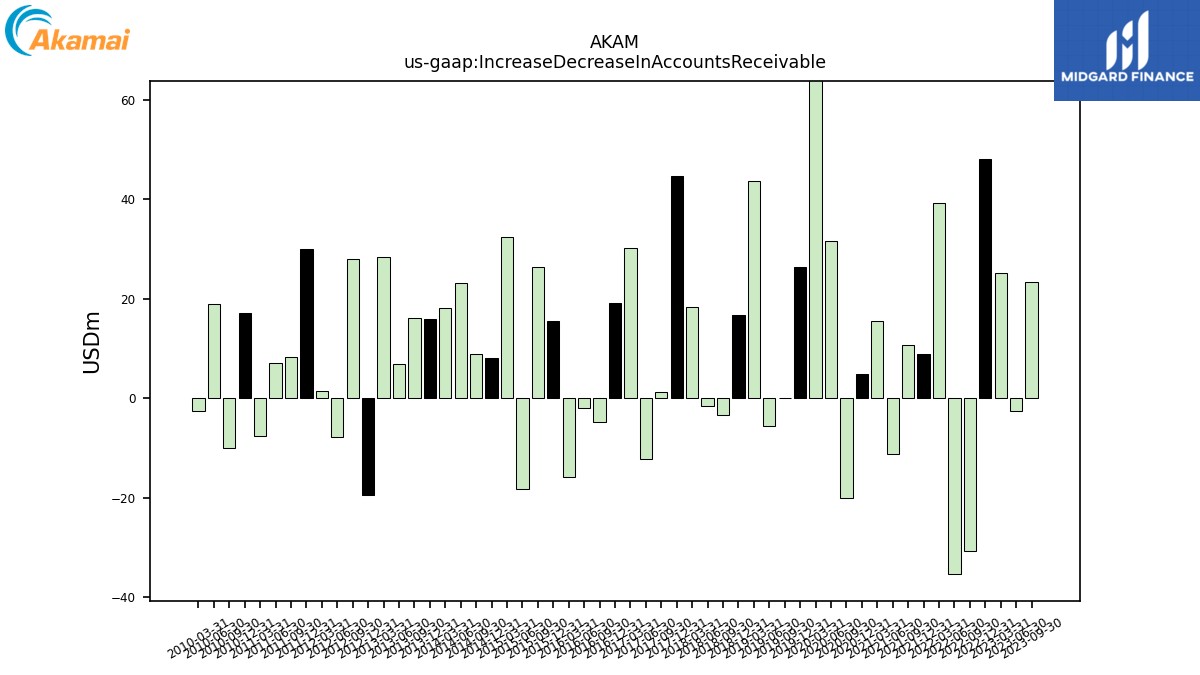
| Increase Decrease In Accounts Receivable | 2.94 | 23.48 | -2.47 | 25.25 | 48.06 | -30.80 | -35.25 | 39.20 | 8.87 | 10.82 | -11.18 | 15.58 | 4.94 | -20.11 | 31.63 | 73.91 | 26.33 | 0.02 | -5.64 | 43.77 | 16.83 | -3.28 | -1.53 | 18.42 | 44.63 | 1.33 | -12.27 | 30.15 | 19.12 | -4.69 | -1.88 | -15.91 | 15.54 | 26.41 | -18.26 | 32.55 | 8.18 | 8.96 | 23.12 | 18.14 | 15.86 | 16.12 | 6.85 | 28.36 | -19.48 | 27.97 | -7.80 | 1.42 | 30.02 | 8.28 | 7.10 | -7.56 | 17.22 | -10.06 | 18.99 | -2.58 | NA | NA | NA | NA | |
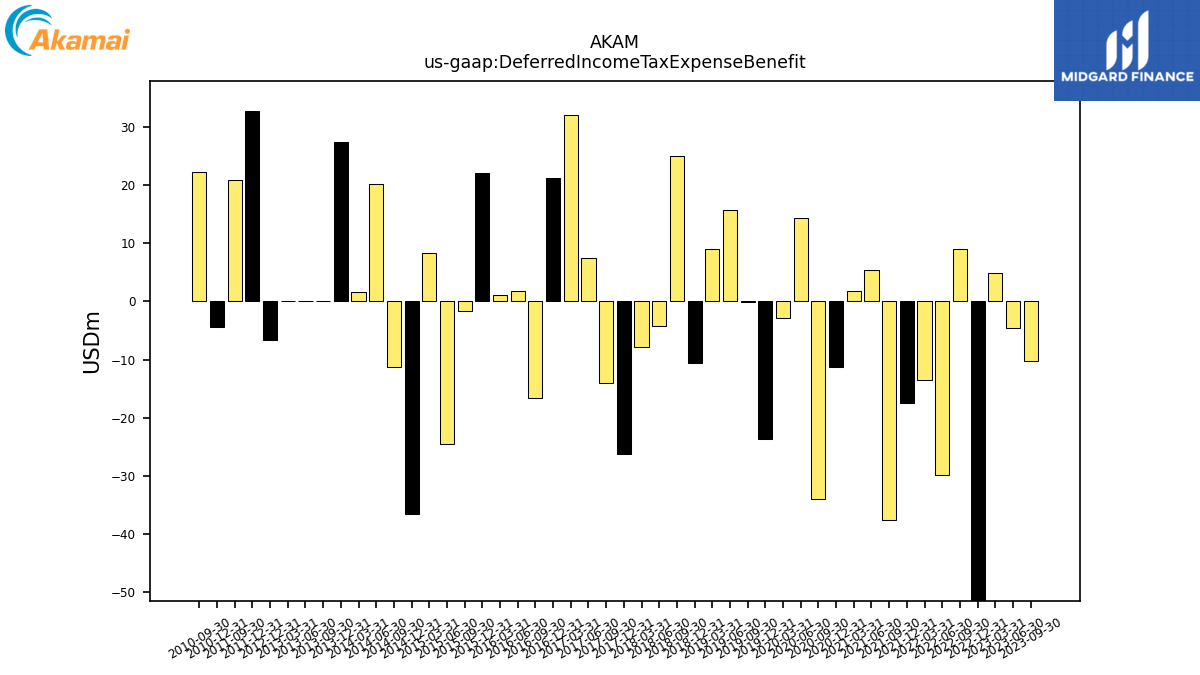
| Deferred Income Tax Expense Benefit | -13.22 | -10.17 | -4.52 | 4.92 | -70.42 | 8.92 | -29.89 | -13.58 | -17.46 | -37.56 | 5.46 | 1.76 | -11.27 | -33.94 | 14.28 | -2.89 | -23.65 | -0.03 | 15.63 | 8.98 | -10.57 | 25.02 | -4.30 | -7.81 | -26.17 | -14.07 | 7.40 | 31.97 | 21.17 | -16.65 | 1.71 | 1.07 | 22.04 | -1.67 | -24.58 | 8.30 | -36.50 | -11.22 | 20.18 | 1.66 | 27.34 | 0.00 | 0.00 | 0.00 | -6.64 | NA | NA | NA | 32.72 | 20.91 | NA | NA | -4.44 | 22.29 | NA | NA | NA | NA | NA | NA | |
| Share Based Compensation | 92.12 | 87.02 | 87.44 | 61.88 | 58.37 | 50.70 | 51.88 | 56.23 | 48.95 | 49.02 | 50.48 | 54.30 | 50.51 | 50.22 | 49.19 | 47.49 | 46.88 | 46.81 | 48.14 | 45.30 | 45.00 | 46.63 | 47.50 | 44.69 | 42.20 | 41.85 | 41.27 | 38.99 | 39.20 | 38.65 | 34.91 | 31.74 | 33.71 | 31.05 | 32.25 | 29.67 | 27.20 | 28.01 | 31.68 | 25.11 | 23.67 | 24.48 | 24.80 | 22.93 | 21.41 | 22.64 | 25.62 | 20.92 | 18.84 | 15.14 | 11.61 | 15.71 | 18.50 | 18.59 | 20.28 | 19.11 | NA | NA | NA | NA |
| 2023-12-31 | 2023-09-30 | 2023-06-30 | 2023-03-31 | 2022-12-31 | 2022-09-30 | 2022-06-30 | 2022-03-31 | 2021-12-31 | 2021-09-30 | 2021-06-30 | 2021-03-31 | 2020-12-31 | 2020-09-30 | 2020-06-30 | 2020-03-31 | 2019-12-31 | 2019-09-30 | 2019-06-30 | 2019-03-31 | 2018-12-31 | 2018-09-30 | 2018-06-30 | 2018-03-31 | 2017-12-31 | 2017-09-30 | 2017-06-30 | 2017-03-31 | 2016-12-31 | 2016-09-30 | 2016-06-30 | 2016-03-31 | 2015-12-31 | 2015-09-30 | 2015-06-30 | 2015-03-31 | 2014-12-31 | 2014-09-30 | 2014-06-30 | 2014-03-31 | 2013-12-31 | 2013-09-30 | 2013-06-30 | 2013-03-31 | 2012-12-31 | 2012-09-30 | 2012-06-30 | 2012-03-31 | 2011-12-31 | 2011-09-30 | 2011-06-30 | 2011-03-31 | 2010-12-31 | 2010-09-30 | 2010-06-30 | 2010-03-31 | 2009-12-31 | 2009-09-30 | 2009-06-30 | 2009-03-31 | ||
|---|---|---|---|---|---|---|---|---|---|---|---|---|---|---|---|---|---|---|---|---|---|---|---|---|---|---|---|---|---|---|---|---|---|---|---|---|---|---|---|---|---|---|---|---|---|---|---|---|---|---|---|---|---|---|---|---|---|---|---|---|---|
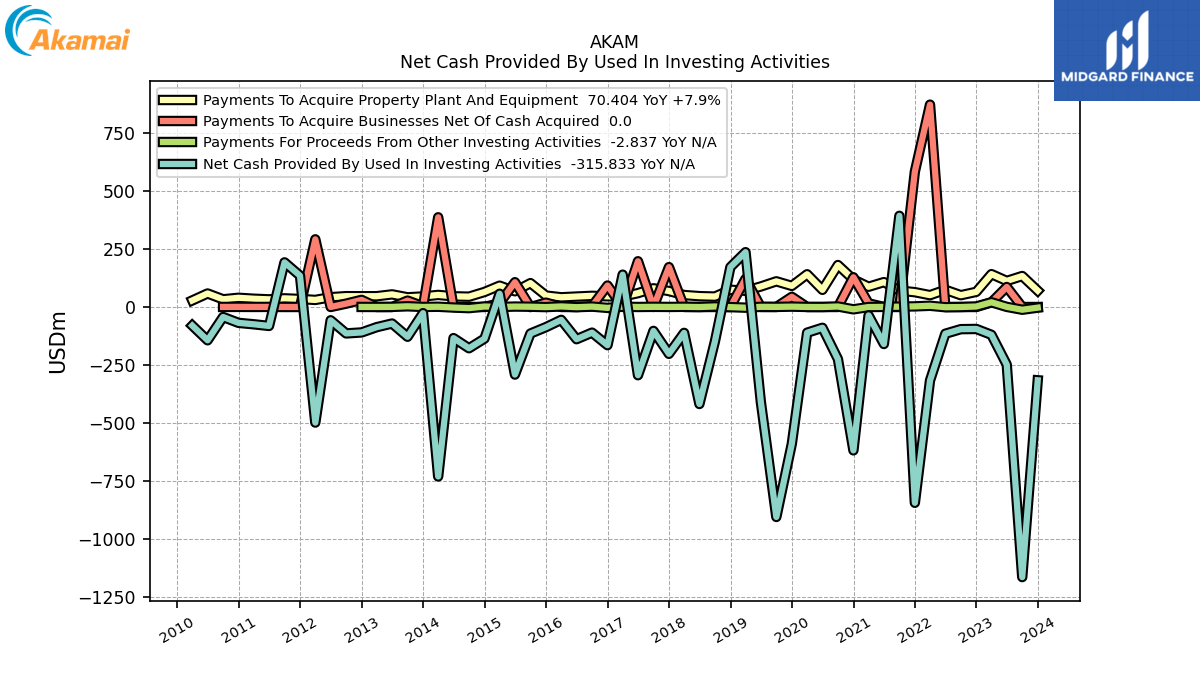
| Net Cash Provided By Used In Investing Activities | -315.83 | -1164.16 | -248.35 | -119.89 | -94.66 | -95.53 | -115.23 | -316.90 | -843.95 | 392.98 | -159.62 | -36.31 | -617.93 | -224.66 | -89.64 | -110.74 | -589.76 | -904.98 | -409.43 | 236.24 | 171.70 | -148.65 | -418.10 | -111.48 | -201.94 | -103.00 | -294.15 | 139.41 | -164.72 | -110.47 | -138.81 | -55.43 | -86.87 | -114.45 | -291.38 | 57.14 | -136.41 | -177.90 | -134.04 | -730.46 | -26.54 | -128.42 | -71.26 | -86.89 | -109.69 | -113.93 | -57.21 | -498.21 | 134.94 | 192.40 | -81.70 | -74.51 | -68.46 | -43.19 | -143.54 | -80.17 | NA | NA | NA | NA | |
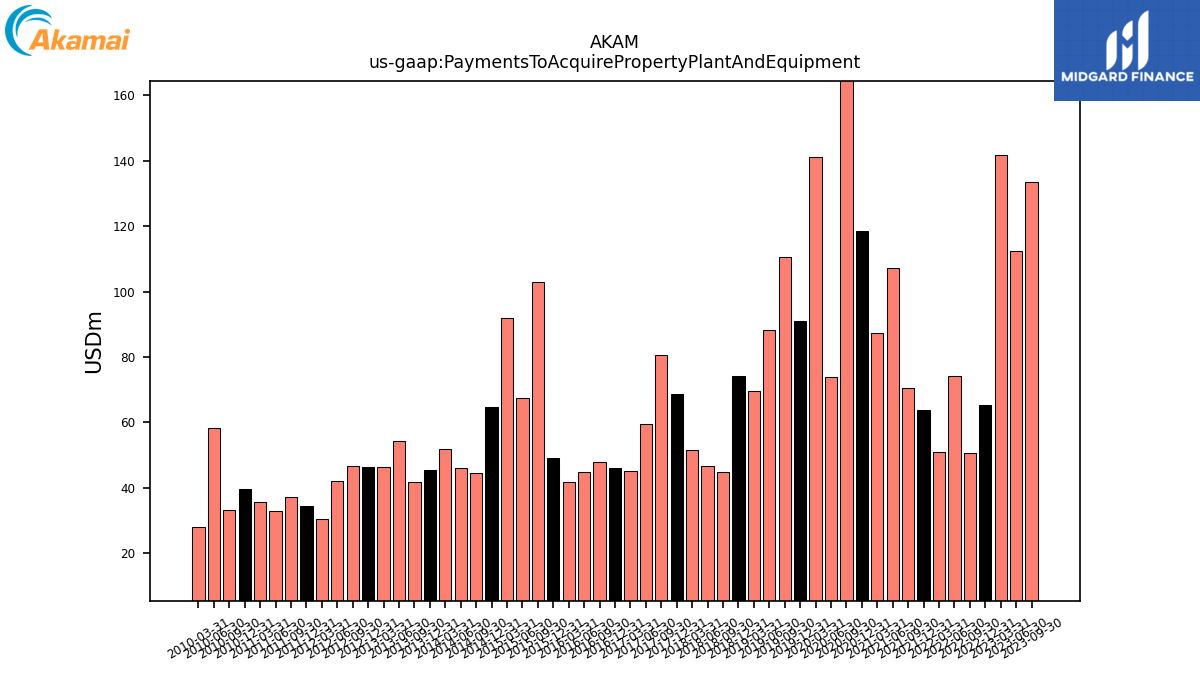
| Payments To Acquire Property Plant And Equipment | 70.40 | 133.50 | 112.31 | 141.70 | 65.25 | 50.80 | 74.22 | 51.01 | 63.84 | 70.68 | 107.23 | 87.22 | 118.52 | 180.84 | 73.86 | 141.09 | 90.90 | 110.61 | 88.41 | 69.75 | 74.32 | 44.98 | 46.72 | 51.58 | 68.68 | 80.58 | 59.66 | 45.22 | 46.08 | 48.05 | 45.01 | 41.81 | 49.27 | 102.91 | 67.57 | 91.92 | 64.69 | 44.47 | 45.98 | 52.01 | 45.40 | 41.72 | 54.37 | 46.48 | 46.39 | 46.64 | 42.19 | 30.43 | 34.45 | 37.24 | 32.92 | 35.60 | 39.69 | 33.15 | 58.24 | 28.20 | NA | NA | NA | NA |
| 2023-12-31 | 2023-09-30 | 2023-06-30 | 2023-03-31 | 2022-12-31 | 2022-09-30 | 2022-06-30 | 2022-03-31 | 2021-12-31 | 2021-09-30 | 2021-06-30 | 2021-03-31 | 2020-12-31 | 2020-09-30 | 2020-06-30 | 2020-03-31 | 2019-12-31 | 2019-09-30 | 2019-06-30 | 2019-03-31 | 2018-12-31 | 2018-09-30 | 2018-06-30 | 2018-03-31 | 2017-12-31 | 2017-09-30 | 2017-06-30 | 2017-03-31 | 2016-12-31 | 2016-09-30 | 2016-06-30 | 2016-03-31 | 2015-12-31 | 2015-09-30 | 2015-06-30 | 2015-03-31 | 2014-12-31 | 2014-09-30 | 2014-06-30 | 2014-03-31 | 2013-12-31 | 2013-09-30 | 2013-06-30 | 2013-03-31 | 2012-12-31 | 2012-09-30 | 2012-06-30 | 2012-03-31 | 2011-12-31 | 2011-09-30 | 2011-06-30 | 2011-03-31 | 2010-12-31 | 2010-09-30 | 2010-06-30 | 2010-03-31 | 2009-12-31 | 2009-09-30 | 2009-06-30 | 2009-03-31 | ||
|---|---|---|---|---|---|---|---|---|---|---|---|---|---|---|---|---|---|---|---|---|---|---|---|---|---|---|---|---|---|---|---|---|---|---|---|---|---|---|---|---|---|---|---|---|---|---|---|---|---|---|---|---|---|---|---|---|---|---|---|---|---|
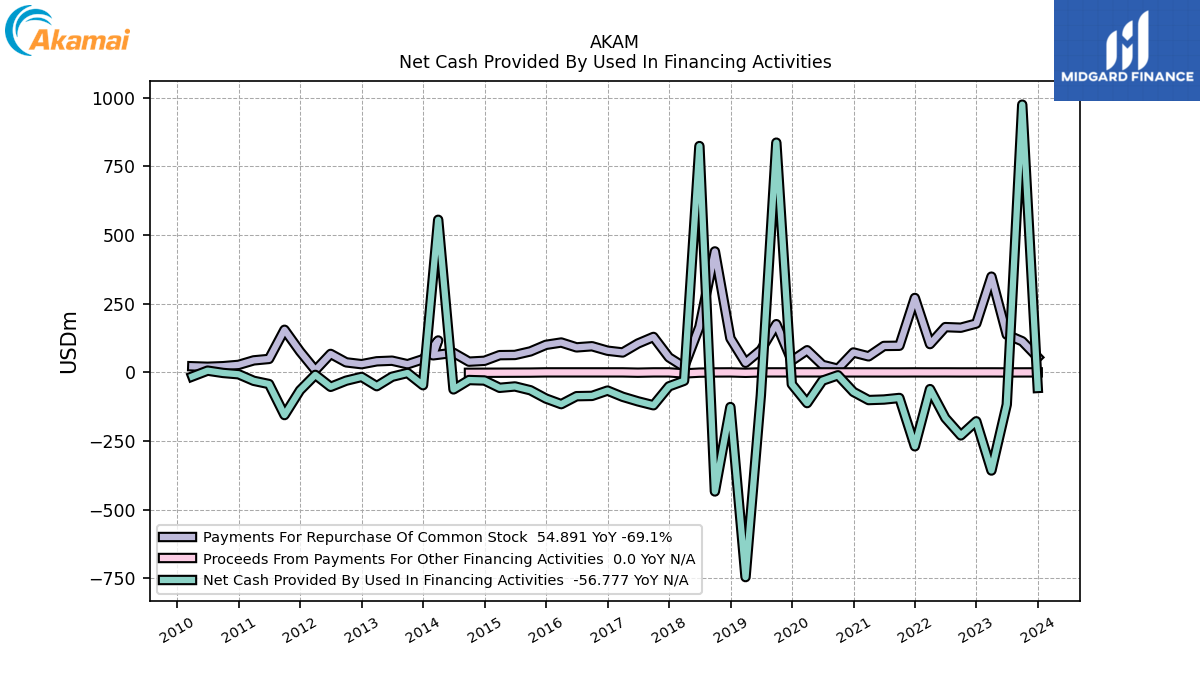
| Net Cash Provided By Used In Financing Activities | -56.78 | 974.64 | -117.20 | -357.29 | -177.96 | -229.47 | -165.91 | -60.84 | -269.23 | -93.16 | -98.84 | -100.78 | -71.08 | -10.56 | -30.17 | -111.84 | -42.97 | 836.28 | -83.69 | -745.29 | -126.12 | -433.53 | 823.93 | -30.66 | -50.90 | -119.74 | -105.51 | -88.86 | -66.26 | -85.61 | -86.66 | -115.74 | -95.22 | -65.08 | -51.21 | -56.21 | -29.55 | -27.89 | -62.04 | 555.51 | -46.85 | -2.16 | -15.96 | -50.28 | -16.49 | -30.29 | -52.63 | -9.08 | -65.44 | -155.50 | -42.44 | -30.71 | -6.88 | -2.10 | 6.32 | -15.03 | NA | NA | NA | NA | |
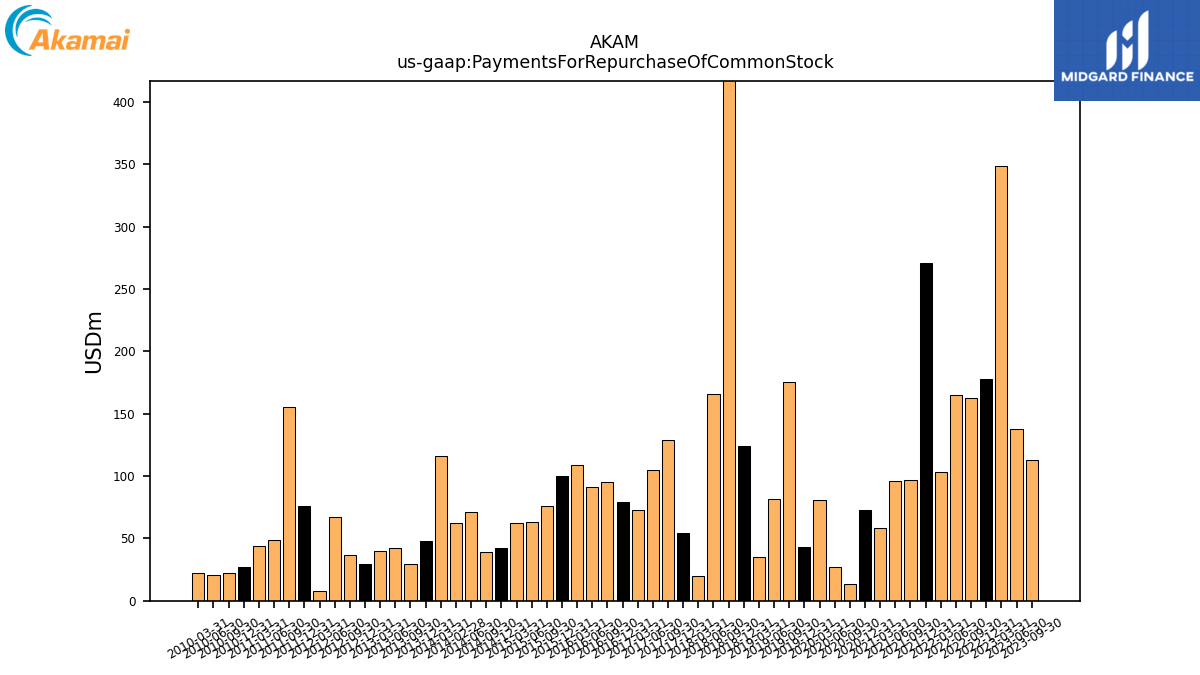
| Payments For Repurchase Of Common Stock | 54.89 | 113.20 | 137.36 | 348.60 | 177.74 | 162.63 | 164.79 | 102.85 | 271.00 | 96.84 | 96.17 | 58.24 | 72.51 | 13.20 | 27.30 | 80.55 | 42.73 | 175.50 | 81.40 | 34.87 | 124.08 | 440.40 | 165.73 | 19.79 | 54.56 | 129.01 | 105.15 | 72.47 | 78.93 | 95.16 | 90.98 | 108.72 | 100.18 | 76.36 | 63.39 | 62.68 | 42.13 | 39.02 | 71.34 | 116.15 | 48.01 | 29.63 | 42.50 | 40.28 | 29.82 | 36.52 | 67.21 | 7.91 | 76.33 | 155.12 | 48.94 | 43.68 | 27.30 | 22.50 | 20.38 | 22.25 | NA | NA | NA | NA |
| 2023-12-31 | 2023-09-30 | 2023-06-30 | 2023-03-31 | 2022-12-31 | 2022-09-30 | 2022-06-30 | 2022-03-31 | 2021-12-31 | 2021-09-30 | 2021-06-30 | 2021-03-31 | 2020-12-31 | 2020-09-30 | 2020-06-30 | 2020-03-31 | 2019-12-31 | 2019-09-30 | 2019-06-30 | 2019-03-31 | 2018-12-31 | 2018-09-30 | 2018-06-30 | 2018-03-31 | 2017-12-31 | 2017-09-30 | 2017-06-30 | 2017-03-31 | 2016-12-31 | 2016-09-30 | 2016-06-30 | 2016-03-31 | 2015-12-31 | 2015-09-30 | 2015-06-30 | 2015-03-31 | 2014-12-31 | 2014-09-30 | 2014-06-30 | 2014-03-31 | 2013-12-31 | 2013-09-30 | 2013-06-30 | 2013-03-31 | 2012-12-31 | 2012-09-30 | 2012-06-30 | 2012-03-31 | 2011-12-31 | 2011-09-30 | 2011-06-30 | 2011-03-31 | 2010-12-31 | 2010-09-30 | 2010-06-30 | 2010-03-31 | 2009-12-31 | 2009-09-30 | 2009-06-30 | 2009-03-31 | ||
|---|---|---|---|---|---|---|---|---|---|---|---|---|---|---|---|---|---|---|---|---|---|---|---|---|---|---|---|---|---|---|---|---|---|---|---|---|---|---|---|---|---|---|---|---|---|---|---|---|---|---|---|---|---|---|---|---|---|---|---|---|---|
| Revenues | 995.02 | 965.48 | 935.72 | 915.70 | 927.78 | 881.90 | 903.33 | 903.65 | 905.36 | 860.33 | 852.82 | 842.71 | 846.29 | 792.85 | 794.72 | 764.30 | 772.12 | 709.91 | 705.07 | 706.51 | 713.36 | 669.63 | 662.76 | 668.72 | 663.45 | 621.40 | 608.91 | 609.24 | 616.12 | 584.07 | 572.13 | 567.73 | 579.16 | 551.03 | 540.72 | 526.54 | 536.29 | 498.04 | 476.04 | 453.50 | 435.98 | 395.79 | 378.11 | 368.05 | 377.87 | 345.32 | 331.31 | 319.45 | 323.74 | 281.86 | 276.99 | 275.95 | 284.69 | 253.55 | 245.32 | 240.03 | 238.31 | 206.50 | 204.60 | 210.37 | |
| Revenue From Contract With Customer Including Assessed Tax | 995.02 | 965.48 | 935.72 | 915.70 | 927.78 | 881.90 | 903.33 | 903.65 | 905.36 | 860.33 | 852.82 | 842.71 | 846.29 | 792.85 | 794.72 | 764.30 | 772.12 | 709.91 | 705.07 | 706.51 | 713.36 | 669.63 | 662.76 | 668.72 | 658.47 | 624.44 | 605.83 | 600.29 | 616.12 | 584.07 | 572.13 | 567.73 | 579.16 | 551.03 | 540.72 | 526.54 | 536.29 | 498.04 | 476.04 | 453.50 | 435.98 | 395.79 | 378.11 | 368.05 | 377.87 | 345.32 | 331.31 | 319.45 | 323.74 | 281.86 | 276.99 | 275.95 | 284.69 | 253.55 | 245.32 | 240.03 | 238.31 | 206.50 | 204.60 | 210.37 | |
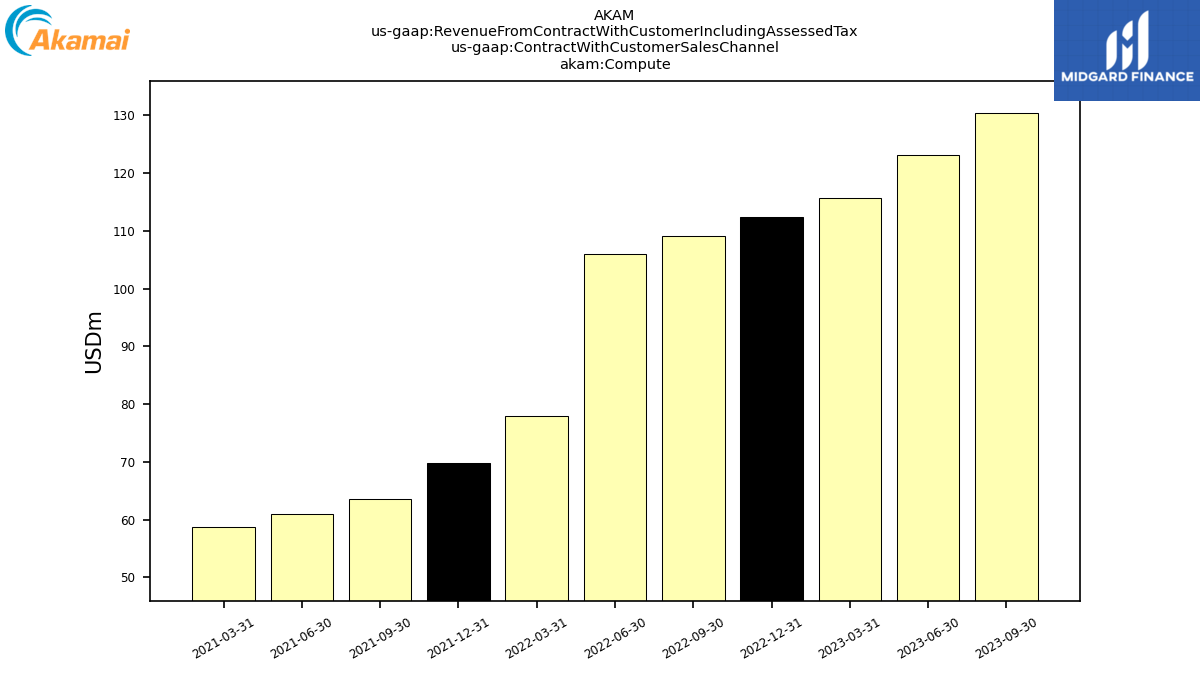
| Compute | 134.99 | 130.39 | 123.08 | 115.76 | 112.39 | 109.14 | 105.99 | 77.93 | 69.75 | 63.62 | 60.96 | 58.82 | NA | NA | NA | NA | NA | NA | NA | NA | NA | NA | NA | NA | NA | NA | NA | NA | NA | NA | NA | NA | NA | NA | NA | NA | NA | NA | NA | NA | NA | NA | NA | NA | NA | NA | NA | NA | NA | NA | NA | NA | NA | NA | NA | NA | NA | NA | NA | NA | |
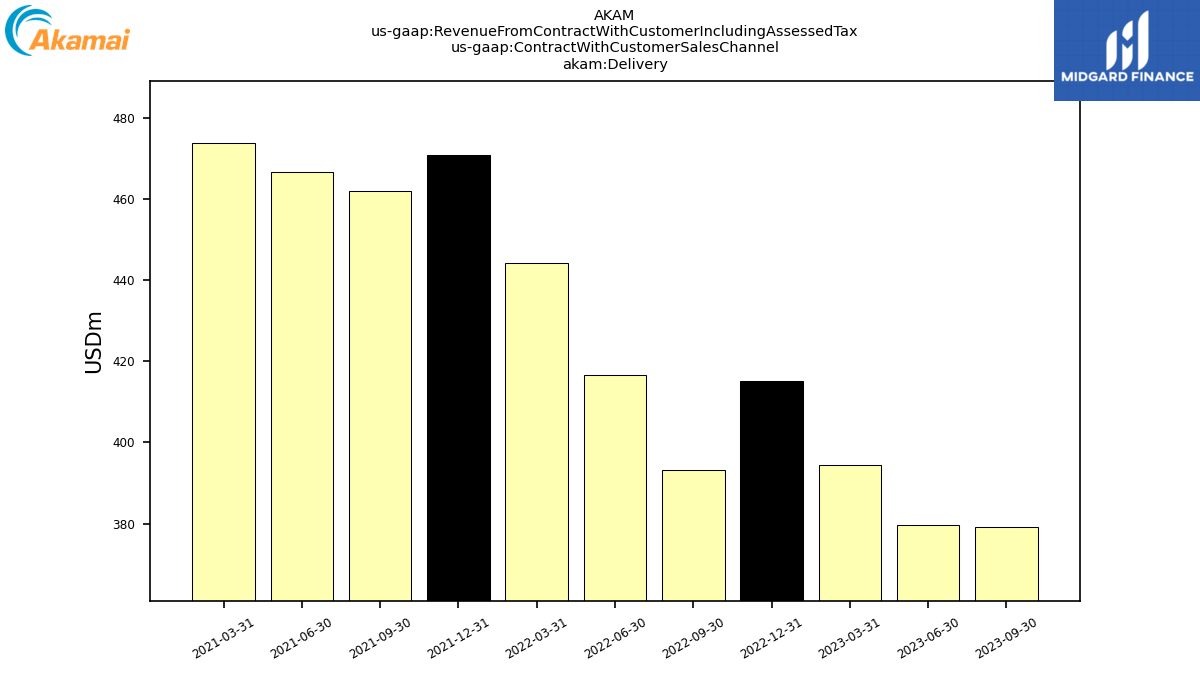
| Delivery | 389.05 | 379.30 | 379.70 | 394.38 | 415.18 | 393.25 | 416.68 | 444.15 | 470.77 | 462.07 | 466.74 | 473.67 | NA | NA | NA | NA | NA | NA | NA | NA | NA | NA | NA | NA | NA | NA | NA | NA | NA | NA | NA | NA | NA | NA | NA | NA | NA | NA | NA | NA | NA | NA | NA | NA | NA | NA | NA | NA | NA | NA | NA | NA | NA | NA | NA | NA | NA | NA | NA | NA | |
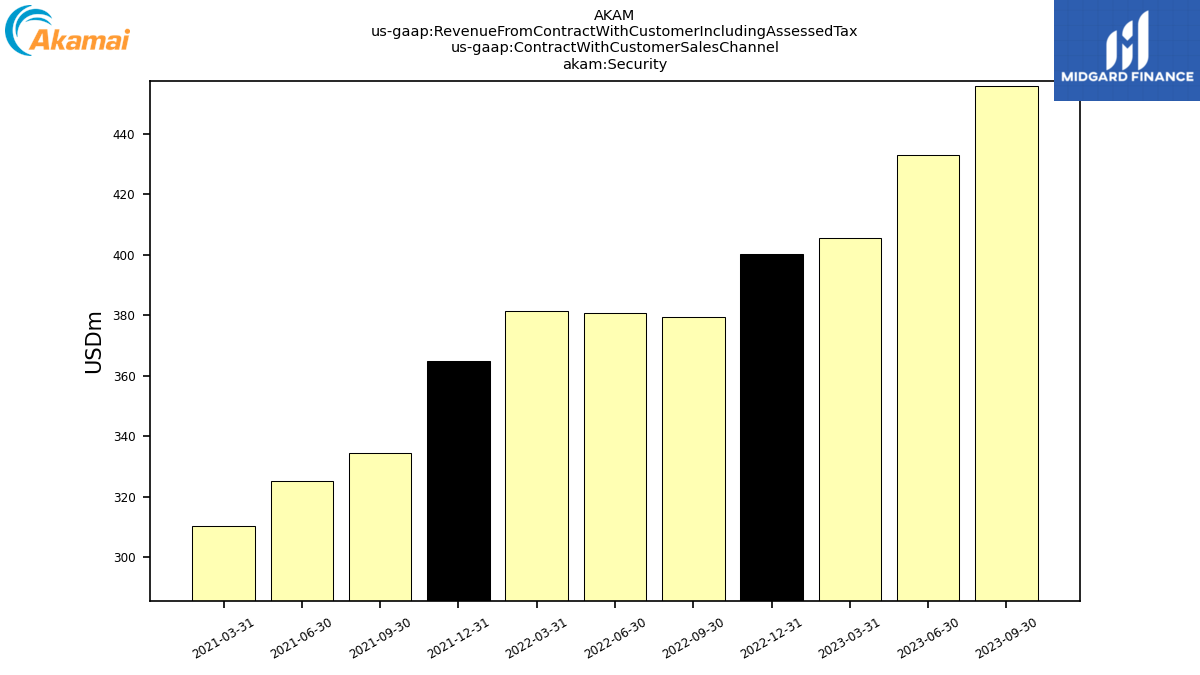
| Security | 470.98 | 455.79 | 432.95 | 405.55 | 400.20 | 379.51 | 380.66 | 381.57 | 364.84 | 334.65 | 325.13 | 310.22 | NA | NA | NA | NA | NA | NA | NA | NA | NA | NA | NA | NA | NA | NA | NA | NA | NA | NA | NA | NA | NA | NA | NA | NA | NA | NA | NA | NA | NA | NA | NA | NA | NA | NA | NA | NA | NA | NA | NA | NA | NA | NA | NA | NA | NA | NA | NA | NA | |
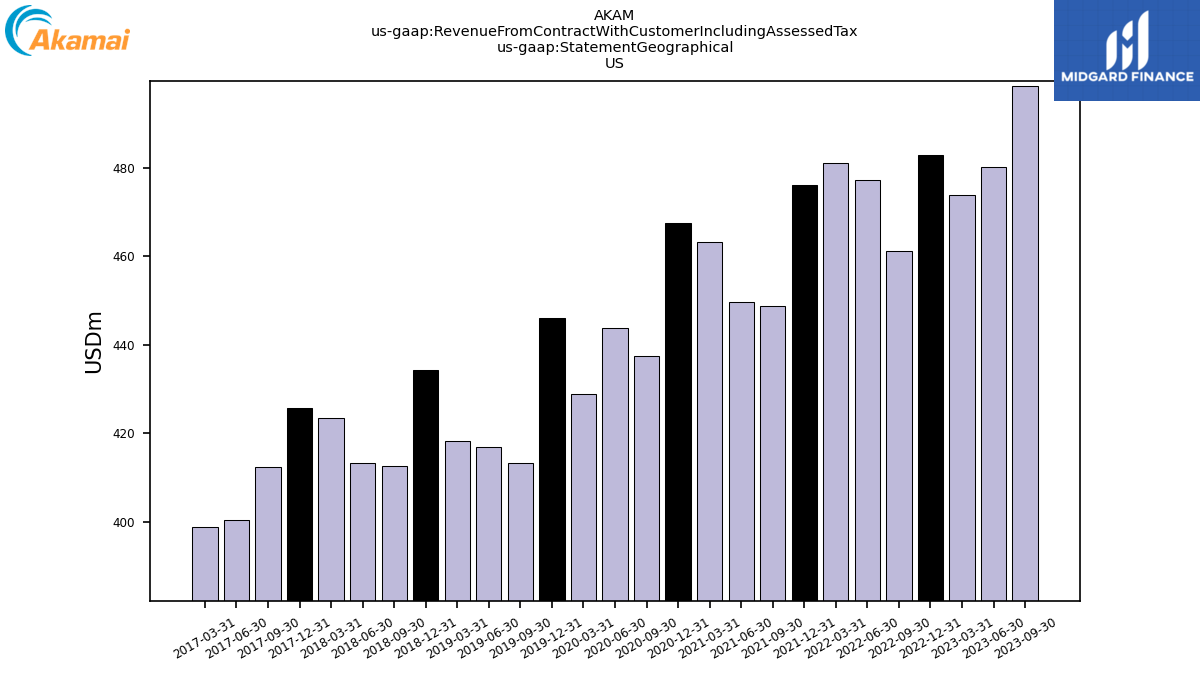
| US | 516.35 | 498.54 | 480.06 | 473.83 | 482.80 | 461.09 | 477.15 | 481.01 | 475.98 | 448.79 | 449.55 | 463.18 | 467.46 | 437.38 | 443.67 | 428.93 | 446.04 | 413.12 | 416.86 | 418.20 | 434.23 | 412.57 | 413.13 | 423.34 | 425.74 | 412.35 | 400.24 | 398.87 | NA | NA | NA | NA | NA | NA | NA | NA | NA | NA | NA | NA | NA | NA | NA | NA | NA | NA | NA | NA | NA | NA | NA | NA | NA | NA | NA | NA | NA | NA | NA | NA | |
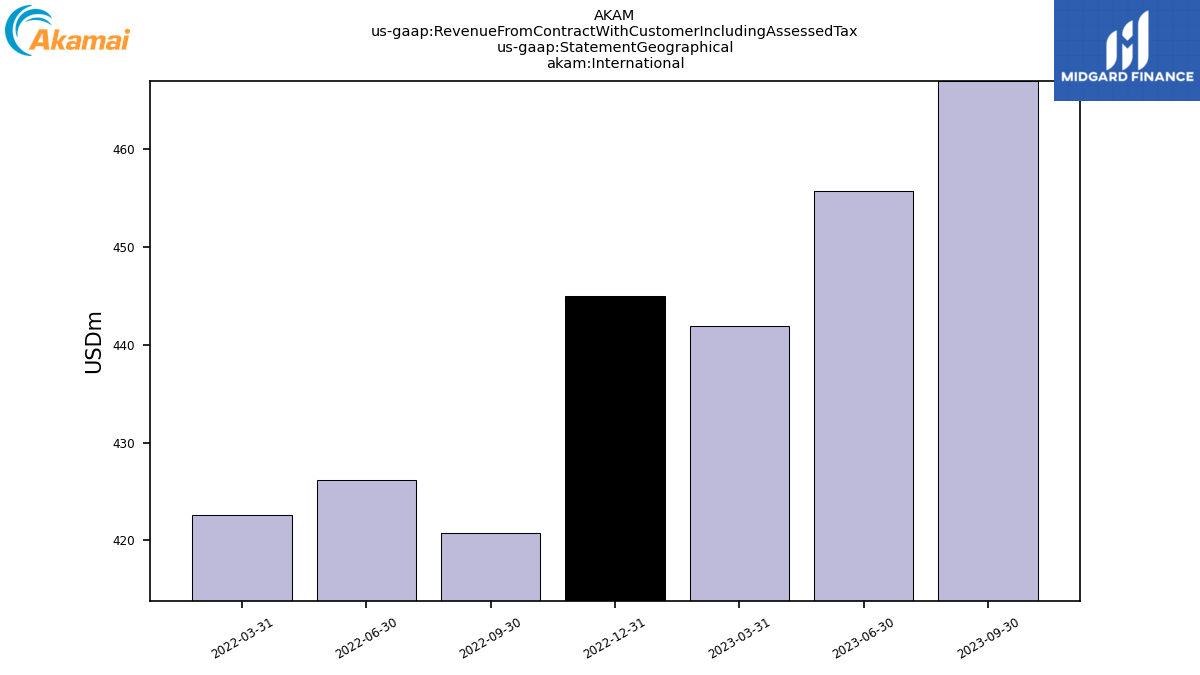
| International | 478.67 | 466.95 | 455.66 | 441.87 | 444.98 | 420.81 | 426.18 | 422.64 | NA | NA | NA | NA | NA | NA | NA | NA | NA | NA | NA | NA | NA | NA | NA | NA | NA | NA | NA | NA | NA | NA | NA | NA | NA | NA | NA | NA | NA | NA | NA | NA | NA | NA | NA | NA | NA | NA | NA | NA | NA | NA | NA | NA | NA | NA | NA | NA | NA | NA | NA | NA |